Exhibit (C) (2)
| Private & Confidential Valuation Research Corporation Leveraged Finance & Financial Sponsors Group Strong Values.Katy Industries, Inc. Fairness Opinion Analysis September 19, 2008ENGAGEMENT #: 50005483 NEW YORK — PRINCETON — BOSTON — CHICAGO — CINCINNATI — MILWAUKEE — SAN FRANCISCO — TAMPA |
| Disclaimer The accompanying material was compiled on a confidential basis for use solely by the Board of Directors of Katy Industries, Inc. (“Katy“ or the “Company”) in evaluating the proposed transaction described herein. This material is not intended to provide the sole basis for evaluating any transaction or event, does not purport to contain all information that may be required and should not be considered a recommendation with respect to any transaction or event. This material was prepared for a specific use by specific persons as of a specific date and was not prepared with a view to public disclosure or to conform with any disclosure standards under securities laws or otherwise. Neither Valuation Research Corporation (“VRC”) nor any of its officers, directors, employees, affiliates, advisors, agents or representatives warrants the accuracy or completeness of any of the material set forth herein. Nothing contained in the accompanying material is, or shall be relied upon as, a promise or representation as to the past, the present or the future. This material must not be copied, reproduced, distributed or passed to others at any time without the prior written consent of VRC. It should be understood that any estimates, valuations, forecasts or projections contained in the accompanying material were prepared or derived from information supplied by the Company and public sources without the assumption by VRC of responsibility for any independent verification thereof. Accordingly, no representation or warranty can be or is made by VRC as to the accuracy or achievability of any such valuations, estimates, forecasts or projections and VRC expressly disclaims any and all liability relating to or resulting from the use of this material. Actual results may vary from such estimates, valuations, forecasts or projections and such variations may be material. Subsequent events may impact the analyses and conclusions set forth in the accompanying material and VRC does not assume any responsibility to update or revise the accompanying material for any actions or events subsequent to the specific date set forth herein. VRC makes no representation as to the legal sufficiency for any purpose of any capitalized terms and associated definitions set forth in the accompanying material. Such definitions are used solely for setting forth the scope of the assignment.Strong Values. |
| Table of Contents Section I:Overview of VRC?Section II:Executive Summary?Section III:Industry & Economic Trends?Section IV:Company Overview?Section V:Valuation AnalysisStrong Values. |
| SECTION I OVERVIEW OF VRCStrong Values. |

| Overview of VRC Established in 1975, VRC is an independent, international financial advisory firm.??Eight domestic offices: New York, Princeton, Boston, Chicago, Cincinnati, Milwaukee, Tampa and San Francisco??Nine global affiliates: Argentina, Australia, Brazil, Chile, Hong Kong, Mexico, Spain, United Kingdom and Venezuela?Core services include financial opinions with respect to valuation, solvency, capital adequacy and fairness in connection with mergers, acquisitions, divestitures, leveraged buyouts, recapitalizations, financings and financial and tax reporting matters.??VRC’s core services provide its clients with strategic advisory, enhanced due diligence and sophisticated financial modeling??Transactional: Valuation, Fairness, Solvency and Capital Adequacy Opinions ??Financial Reporting: Fair Value Reporting; Allocation of Purchase Price (SFAS 141R); Goodwill Impairment (SFAS 142); Stock Based Compensation (SFAS 123-R)??Tax Reporting: Fair Market Value Reporting; Deferred Compensation (IRC Sec 409A); Allocation of Purchase Cost (IRC Sec 1060/338); Valuation of Legal Entities?Full-service, in-house valuation capabilities include businesses, equity and debt securities, loans, derivative instruments, structured products, intangible assets, fixed assets and real estate. ?Significant experience with respect to M&A, leveraged finance and complex capital structures results from producing over 1,000 solvency, capital adequacy and fairness opinions in connection with a variety of transactions of all sizes covering all major industry groups. |
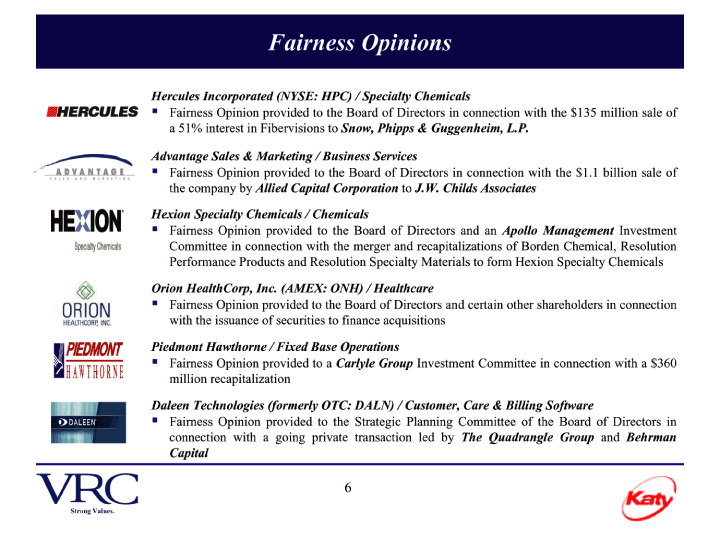
| Fairness Opinions Hercules Incorporated (NYSE: HPC) / Specialty Chemicals?Fairness Opinion provided to the Board of Directors in connection with the $135 million sale of a 51% interest in Fibervisions toSnow, Phipps & Guggenheim, L.P. Advantage Sales & Marketing / Business Services?Fairness Opinion provided to the Board of Directors in connection with the $1.1 billion sale of the company byAllied Capital CorporationtoJ.W. Childs Associates Hexion Specialty Chemicals / Chemicals?Fairness Opinion provided to the Board of Directors and anApollo ManagementInvestment Committee in connection with the merger and recapitalizations of Borden Chemical, Resolution Performance Products and Resolution Specialty Materials to form Hexion Specialty ChemicalsOrion HealthCorp, Inc. (AMEX: ONH) / Healthcare?Fairness Opinion provided to the Board of Directors and certain other shareholders in connection with the issuance of securities to finance acquisitionsPiedmont Hawthorne / Fixed Base Operations?Fairness Opinion provided to aCarlyle GroupInvestment Committee in connection with a $360 million recapitalizationDaleen Technologies (formerly OTC: DALN) / Customer, Care & Billing Software?Fairness Opinion provided to the Strategic Planning Committee of the Board of Directors in connection with a going private transaction led byThe Quadrangle GroupandBehrman Capital |
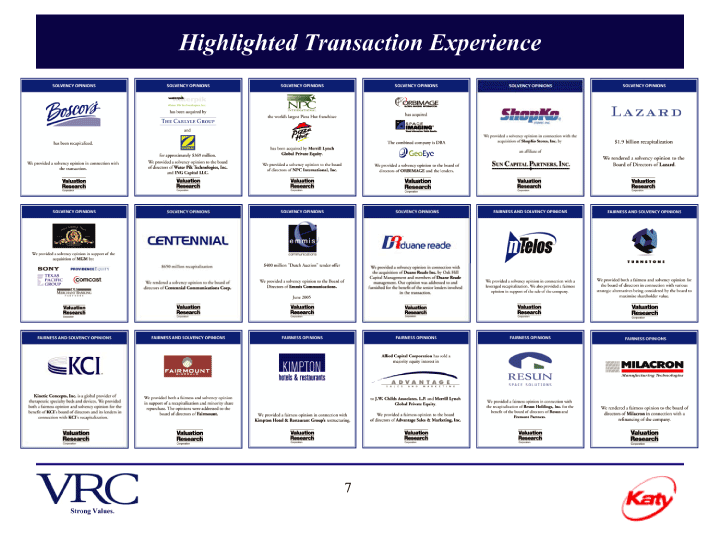
| Highlighted Transaction Experience |

| SECTION II EXECUTIVE SUMMARY |
| Situation Overview Valuation Research Corporation (“VRC”) understands that the Board of Directors (the “Board”) of Katy Industries, Inc. (“Katy” or the “Company”) is considering a transaction (the “Transaction”) that is tentatively expected to be voted on by the Board on or about September 25, 2008.?The Transaction involves Katy (i) declaring a 500 for 1 reverse stock split of its common stock, par value $1.00 per share, and (ii) repurchasing fractional shares of Company common stock resulting from the stock split for $2.00 per share on a pre-split basis (the “Purchase Price”). As a result of the Transaction, the Company expects to be removed from quotation on the OTC Bulletin Board.Fairness Opinion Overview |
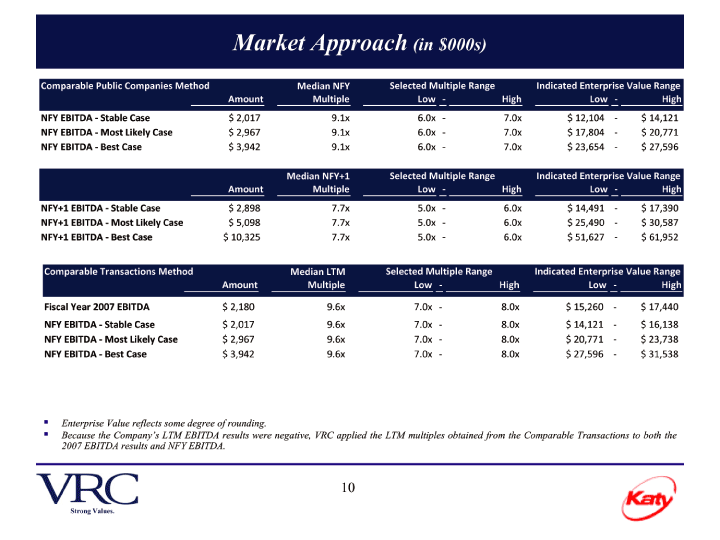
| Market Approach (in $000s)Comparable Public Companies MethodMedian NFYSelected Multiple RangeIndicated Enterprise Value Range AmountMultipleLow -HighLow -High NFY EBITDA Stable — Case$ 2,0179.1x6.0x7.0x$ 12,104 — $ 14,121NFY EBITDA Most — Likely Case$ 2,9679.1x6.0x7.0x$ 17,804 — $ 20,771NFY EBITDA Best — Case$ 3,9429.1x6.0x7.0x$ 23,654 — $ 27,596 |
| Median NFY+1Selected Multiple RangeIndicated Enterprise Value Range AmountMultipleLow -HighLow -High |
| NFY+1 EBITDA Stable — Case$ 2,8987.7x5.0x6.0x$ 14,491 — $ 17,390NFY+1 EBITDA Most - Likely Case$ 5,0987.7x5.0x6.0x$ 25,490 — $ 30,587NFY+1 EBITDA Best — Case$ 10,3257.7x5.0x6.0x$ 51,627 — $ 61,952Comparable Transactions MethodMedian LTMSelected Multiple RangeIndicated Enterprise Value Range AmountMultipleLow -HighLow -High Fiscal Year 2007 EBITDA$ 2,1809.6x7.0x8.0x$ 15,260 — $ 17,440NFY EBITDA Stable — Case$ 2,0179.6x7.0x8.0x$ 14,121 — $ 16,138NFY EBITDA Most — Likely Case$ 2,9679.6x7.0x8.0x$ 20,771 — $ 23,738NFY EBITDA Best — Case$ 3,9429.6x7.0x8.0x$ 27,596 — $ 31,538 |
| ??Enterprise Value reflects some degree of rounding. ??Because the Company’s LTM EBITDA results were negative, VRC applied the LTM multiples obtained from the Comparable Transactions to both the 2007 EBITDA results and NFY EBITDA. |

| Discounted Cash Flow Analysis – Stable Case (in $000s)FYEProjectionsTerminal Fiscal YearDec 2007 Dec 2008 Dec 2009 Dec 2010 Dec 2011 Dec 2012Year Net Sales $ 187,772 $ 181,329 $ 179,391 $ 180,037 $ 181,077 $ 182,417 $ 184,241 EBITDA$ 41$ 2,017$ 2,898$ 3,821$ 4,807$ 4,855 Depreciation & Amortization$ 8,038$ 8,036$ 7,723$ 7,288$ 6,854$ 3,685EBIT$ (7,997) $ (6,019) $ (4,825) $ (3,467) $ (2,046)$ 1,171EBIT Margin(4.4)%(3.4)%(2.7)%(1.9)%(1.1)%0.6% Taxes$ (3,199) $ (2,408) $ (1,930) $ (1,387)$ (819)$ 468Debt Free Net Income$ (4,798) $ (3,611) $ (2,895) $ (2,080) $ (1,228)$ 702 Add: Depreciation & Amortization$ 8,038$ 8,036$ 7,723$ 7,288$ 6,854$ 3,685 Less: Capex$ 8,354$ 4,854$ 3,500$ 3,500$ 3,500$ 3,685 Less: Change in NWC $ (6,885)$ (244)$ 81$ 131$ 169$ 230Free Cash Flows$ 1,771$ (185)$ 1,247$ 1,577$ 1,957$ 472 Partial Period Adjustment0.2821.0001.0001.0001.000 Mid- Year Convention0.1410.7821.7822.7823.782 Present Value Factor0.9800.8960.7800.6780.589Present Value of Free Cash Flows$ 489$ (166)$ 973$ 1,069 $ 1,153 AssumptionsFYEFYEFYEFYEFYEFYETerminal Dec 2007 Dec 2008 Dec 2009 Dec 2010 Dec 2011 Dec 2012Year Net Sales $ 187,772 $ 181,329 $ 179,391 $ 180,037 $ 181,077 $ 182,417 $ 184,241growth %(3.4)%(1.1)%0.4%0.6%0.7%1.0% EBITDA margin0.0%1.1%1.6%2.1%2.6%2.6% Depreciation & Amortization4.4%4.5%4.3%4.0%3.8%2.0% CapEx4.6%2.7%1.9%1.9%1.9%2.0% Working Capital15.8%12.6%12.6%12.6%12.6%12.6%12.6% Long term growth rate 1.0% Income Taxes 40.0% Discount Rate [1]15.0%[1] Based on growth expectations that were lower than the Most Likely Case and modest margin improvements, it was VRC’s opinion that the Stable Case was less risky than the Most Likely Case and accordingly adjusted the discount rate below the industry Weighted Average Cost of Capital (WACC).Residual Value Calculations Exit — Multiple Terminal Year EBITDA$ 4,855 Exit Multiple Selected7.0x Terminal Value $ 33,987 Present Value Factor0.550Present Value of Terminal Value $ 18,693 Present Value Calculation Exit — Multiple Sum of PV Cash Flows $ 3,518 Present Value of Residual $ 18,693 Operating Business Present Value $ 22,211Total Business Enterprise Value (Rounded) $ 22,200 Sensitivity Analysis $ 22,2006.5x7.0x7.5x 15.5%$20,500$21,800$23,10015.0% $20,900$22,200$23,50014.5%$21,200$22,600$23,900 |

| Discounted Cash Flow Analysis – Most Likely Case (in $000s)FYEProjectionsTerminal Fiscal YearDec 2007 Dec 2008 Dec 2009 Dec 2010 Dec 2011 Dec 2012Year Net Sales $ 187,772 $ 181,329 $ 179,391 $ 184,681 $ 190,274 $ 196,086 $ 200,007 EBITDA$ 41$ 2,967$ 5,098$ 7,609 $ 10,785$ 11,001 Depreciation & Amortization$ 8,038$ 8,036$ 7,810$ 7,568$ 7,309$ 5,000EBIT$ (7,997) $ (5,069) $ (2,712)$ 41$ 3,476$ 6,000EBIT Margin(4.4)%(2.8)%(1.5)%0.0%1.8%3. Taxes$ (3,199) $ (2,028) $ (1,085)$ 16$ 1,390$ 2,400Debt Free Net Income$ (4,798) $ (3,041) $ (1,627)$ 25$ 2,086$ 3,600 Add: Depreciation & Amortization$ 8,038$ 8,036$ 7,810$ 7,568$ 7,309$ 5,000 Less: Capex$ 8,354$ 5,673$ 5,493$ 5,300$ 5,095$ 5,000 Less: Change in NWC $ (6,885)$ (244)$ 667$ 705$ 733$ 495Free Cash Flows$ 1,771$ (434)$ 22$ 1,587$ 3,567$ 3,106 Partial Period Adjustment0.2821.0001.0001.0001.000 Mid- Year Convention0.1410.7821.7822.7823.782 Present Value Factor0.9770.8790.7450.6310.535Present Value of Free Cash Flows$ 488$ (381)$ 17$ 1,001 $ 1,908 AssumptionsFYEFYEFYEFYEFYEFYETerminal Dec 2007 Dec 2008 Dec 2009 Dec 2010 Dec 2011 Dec 2012Year Net Sales $ 187,772 $ 181,329 $ 179,391 $ 184,681 $ 190,274 $ 196,086 $ 200,007growth %(3.4)%(1.1)%2.9%3.0%3.1%2.0% EBITDA margin0.0%1.7%2.8%4.0%5.5%5.5% Depreciation & Amortization4.4%4.5%4.2%4.0%3.7%2.5% CapEx4.6%3.2%3.0%2.8%2.6%2.5% Working Capital15.8%12.6%12.6%12.6%12.6%12.6%12.6% Long term growth rate2.0% Income Taxes 40.0% Discount Rate [1]18.0%[1] VRC noted longer-term sales growth rate expectations over the forecasted period are comparable to historical GDP growth and selected the discount rate at industry Weighted Average Cost of Capital (WACC).Residual Value Calculations Exit — Multiple Terminal Year EBITDA $ 11,001 Exit Multiple Selected7.0x Terminal Value $ 77,004 Present Value Factor0.492Present Value of Terminal Value $ 37,886 Present Value Calculation Exit — Multiple Sum of PV Cash Flows $ 3,032 Present Value of Residual $ 37,886 Operating Business Present Value $ 40,919Total Business Enterprise Value (Rounded) $ 40,900 |
| Sensitivity Analysis $ 40,9006.5x7.0x7.5x 18.5%$37,500$40,200$42,80018.0% $38,200$40,900$43,60017.5%$38,900$41,700$44,400 |
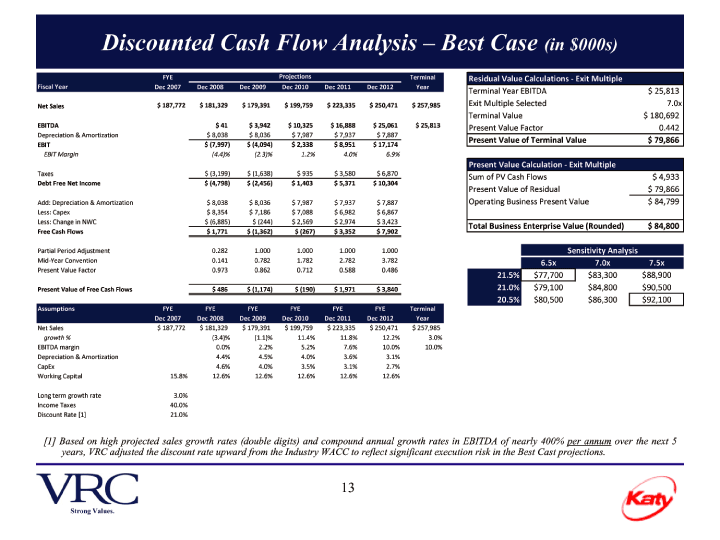
| Discounted Cash Flow Analysis – Best Case (in $000s)FYEProjectionsTerminal Fiscal YearDec 2007 Dec 2008 Dec 2009 Dec 2010 Dec 2011 Dec 2012Year Net Sales $ 187,772 $ 181,329 $ 179,391 $ 199,759 $ 223,335 $ 250,471 $ 257,985 EBITDA$ 41$ 3,942 $ 10,325 $ 16,888 $ 25,061 $ 25,813 Depreciation & Amortization$ 8,038$ 8,036$ 7,987$ 7,937$ 7,887$ 6,450EBIT$ (7,997) $ (4,094)$ 2,338$ 8,951 $ 17,174 $ 19,363EBIT Margin(4.4)%(2.3)%1.2%4.0%6.9%7.5% Taxes$ (3,199) $ (1,638)$ 935$ 3,580$ 6,870$ 7,745Debt Free Net Income$ (4,798) $ (2,456)$ 1,403$ 5,371 $ 10,304 $ 11,618 Add: Depreciation & Amortization$ 8,038$ 8,036$ 7,987$ 7,937$ 7,887$ 6,450 Less: Capex$ 8,354$ 7,186$ 7,088$ 6,982$ 6,867$ 6,450 Less: Change in NWC $ (6,885)$ (244)$ 2,569$ 2,974$ 3,423$ 948Free Cash Flows$ 1,771 $ (1,362)$ (267)$ 3,352$ 7,902 $ 10,670 Partial Period Adjustment0.2821.0001.0001.0001.000 Mid- Year Convention0.1410.7821.7822.7823.782 Present Value Factor0.9730.8620.7120.5880.486Present Value of Free Cash Flows$ 486 $ (1,174)$ (190)$ 1,971 $ 3,840 AssumptionsFYEFYEFYEFYEFYEFYETerminal Dec 2007 Dec 2008 Dec 2009 Dec 2010 Dec 2011 Dec 2012Year Net Sales $ 187,772 $ 181,329 $ 179,391 $ 199,759 $ 223,335 $ 250,471 $ 257,985growth %(3.4)%(1.1)%11.4%11.8%12.2%3.0% EBITDA margin0.0%2.2%5.2%7.6%10.0%10.0% Depreciation & Amortization4.4%4.5%4.0%3.6%3.1%2.5% CapEx4.6%4.0%3.5%3.1%2.7%2.5% Working Capital15.8%12.6%12.6%12.6%12.6%12.6%12.6% Long term growth rate3.0% Income Taxes 40.0% Discount Rate [1]21.0%[1] Based on high projected sales growth rates (double digits) and compound annual growth rates in EBITDA of nearly 400% per annum over the next 5 years, VRC adjusted the discount rate upward from the Industry WACC to reflect significant execution risk in the Best Cast projections.Residual Value Calculations Exit — Multiple Terminal Year EBITDA $ 25,813 Exit Multiple Selected7.0x Terminal Value $ 180,692 Present Value Factor0.442Present Value of Terminal Value $ 79,866 Present Value Calculation Exit — Multiple Sum of PV Cash Flows $ 4,933 Present Value of Residual $ 79,866 Operating Business Present Value $ 84,799Total Business Enterprise Value (Rounded) $ 84,800 Sensitivity Analysis $ 84,8006.5x7.0x7.5x 21.5%$77,700$83,300$88,90021.0% $79,100$84,800$90,50020.5%$80,500$86,300$92,100 |
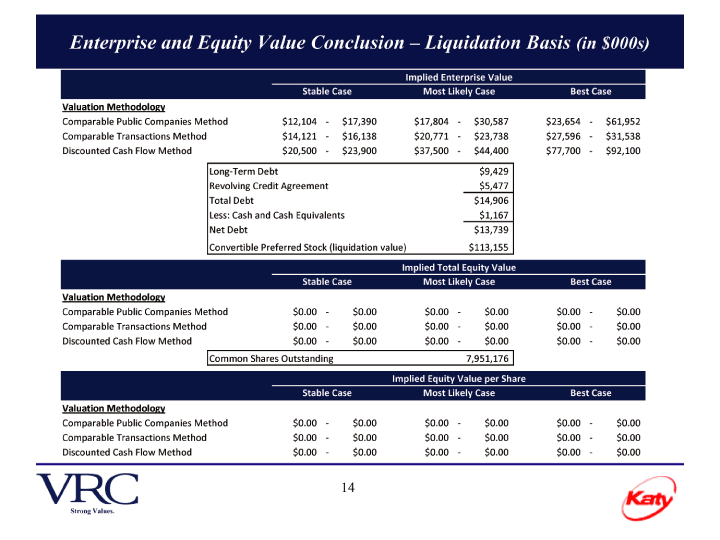
| Enterprise and Equity Value Conclusion – Liquidation Basis (in $000s) |
| Implied Enterprise Value Stable CaseMost Likely CaseBest Case Valuation Methodology |
| Comparable Public Companies Method$12,104 — $17,390$17,804 — $30,587$23,654 — $61,952 Comparable Transactions Method$14,121 — $16,138$20,771 — $23,738$27,596 — $31,538 Discounted Cash Flow Method$20,500 — $23,900$37,500 — $44,400$77,700 — $92,100 Long- Term Debt$9,429 Revolving Credit Agreement$5,477 Total Debt$14,906 Less: Cash and Cash Equivalents$1,167 Net Debt$13,739 Convertible Preferred Stock (liquidation value)$113,155Implied Total Equity Value |
| Stable CaseMost Likely CaseBest Case Valuation Methodology Comparable Public Companies Method$0.00 — $0.00$0.00 — $0.00$0.00 — $0.00 Comparable Transactions Method$0.00 — $0.00$0.00 — $0.00$0.00 — $0.00 Discounted Cash Flow Method$0.00 — $0.00$0.00 - $0.00$0.00 — $0.00 Common Shares Outstanding7,951,176Implied Equity Value per Share Stable CaseMost Likely CaseBest Case Valuation Methodology Comparable Public Companies Method$0.00 — $0.00$0.00 — $0.00$0.00 — $0.00 Comparable Transactions Method$0.00 — $0.00$0.00 — $0.00$0.00 — $0.00 Discounted Cash Flow Method$0.00 — $0.00$0.00 - $0.00$0.00 — $0.00 |

| Convertible, Preferred Stock |
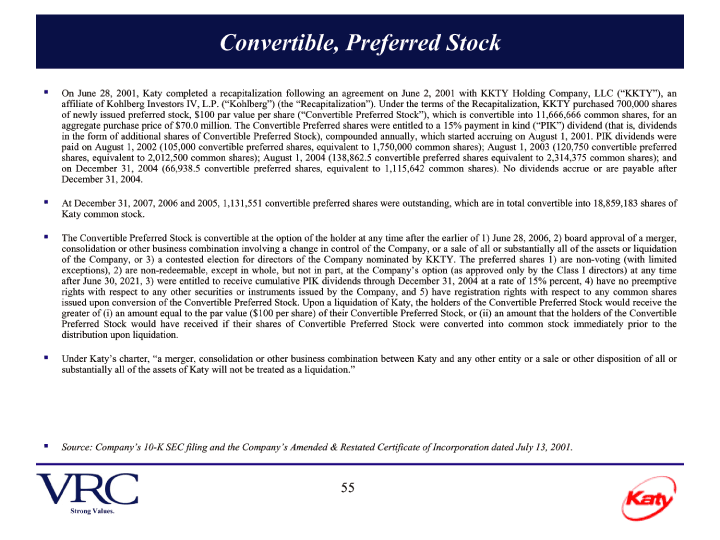
| On June 28, 2001, Katy completed a recapitalization following an agreement on June 2, 2001 with KKTY Holding Company, LLC (“KKTY”), an affiliate of Kohlberg Investors IV, L.P. (“Kohlberg”) (the “Recapitalization”). Under the terms of the Recapitalization, KKTY purchased 700,000 shares of newly issued preferred stock, $100 par value per share (“Convertible Preferred Stock”), which is convertible into 11,666,666 common shares, for an aggregate purchase price of $70.0 million. The Convertible Preferred shares were entitled to a 15% payment in kind (“PIK”) dividend (that is, dividends in the form of additional shares of Convertible Preferred Stock), compounded annually, which started accruing on August 1, 2001. PIK dividends were paid on August 1, 2002 (105,000 convertible preferred shares, equivalent to 1,750,000 common shares); August 1, 2003 (120,750 convertible preferred shares, equivalent to 2,012,500 common shares); August 1, 2004 (138,862.5 convertible preferred shares equivalent to 2,314,375 common shares); and on December 31, 2004 (66,938.5 convertible preferred shares, equivalent to 1,115,642 common shares). No dividends accrue or are payable after December 31, 2004. |
| At December 31, 2007, 2006 and 2005, 1,131,551 convertible preferred shares were outstanding, which are in total convertible into 18,859,183 shares of Katy common stock. |
| The Convertible Preferred Stock is convertible at the option of the holder at any time after the earlier of 1) June 28, 2006, 2) board approval of a merger, consolidation or other business combination involving a change in control of the Company, or a sale of all or substantially all of the assets or liquidation of the Company, or 3) a contested election for directors of the Company nominated by KKTY. The preferred shares 1) are non-voting (with limited exceptions), 2) are non-redeemable, except in whole, but not in part, at the Company’s option (as approved only by the Class I directors) at any time after June 30, 2021, 3) were entitled to receive cumulative PIK dividends through December 31, 2004 at a rate of 15% percent, 4) have no preemptive rights with respect to any other securities or instruments issued by the Company, and 5) have registration rights with respect to any common shares issued upon conversion of the Convertible Preferred Stock. Upon a liquidation of Katy, the holders of the Convertible Preferred Stock would receive the greater of (i) an amount equal to the par value ($100 per share) of their Convertible Preferred Stock, or (ii) an amount that the holders of the Convertible Preferred Stock would have received if their shares of Convertible Preferred Stock were converted into common stock immediately prior to the distribution upon liquidation. |
| Under Katy’s charter, “a merger, consolidation or other business combination between Katy and any other entity or a sale or other disposition of all or substantially all of the assets of Katy will not be treated as a liquidation.” |
| Source: Company’s 10-K SEC filing and the Company’s Amended & Restated Certificate of Incorporation dated July 13, 2001. |
| 15Strong Values. |

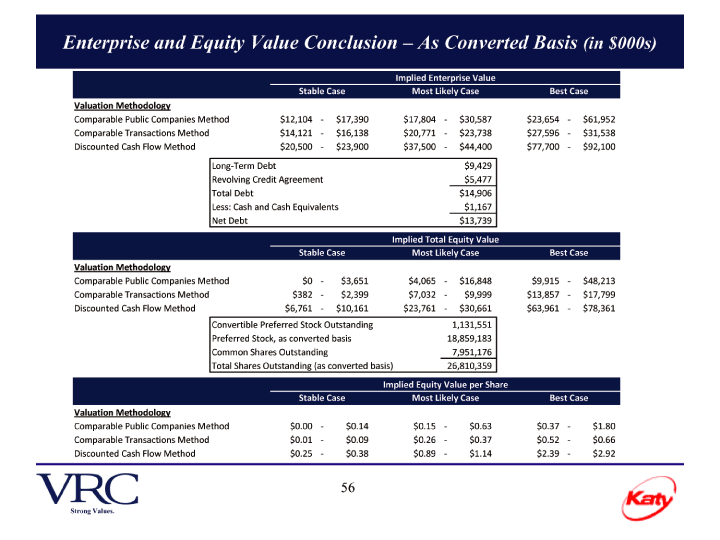
| Enterprise and Equity Value Conclusion – As Converted Basis (in $000s)Implied Enterprise Value Stable CaseMost Likely CaseBest Case Valuation Methodology Comparable Public Companies Method$12,104 — $17,390$17,804 — $30,587$23,654 — $61,952 Comparable Transactions Method$14,121 — $16,138$20,771 — $23,738$27,596 — $31,538 Discounted Cash Flow Method$20,500 — $23,900$37,500 — $44,400$77,700 — $92,100 Long- Term Debt$9,429 Revolving Credit Agreement$5,477 Total Debt$14,906 Less: Cash and Cash Equivalents$1,167 Net Debt$13,739Implied Total Equity Value Stable CaseMost Likely CaseBest Case Valuation Methodology Comparable Public Companies Method$0 — $3,651$4,065 — $16,848$9,915 — $48,213 Comparable Transactions Method$382 — $2,399$7,032 — $9,999$13,857 — $17,799 Discounted Cash Flow Method$6,761 - - $10,161$23,761 — $30,661$63,961 — $78,361 Convertible Preferred Stock Outstanding1,131,551 Preferred Stock, as converted basis18,859,183 Common Shares Outstanding7,951,176 Total Shares Outstanding (as converted basis)26,810,359Implied Equity Value per Share Stable CaseMost Likely CaseBest Case Valuation Methodology Comparable Public Companies Method$0.00 — $0.14$0.15 — $0.63$0.37 — $1.80 Comparable Transactions Method$0.01 — $0.09$0.26 — $0.37$0.52 — $0.66 Discounted Cash Flow Method$0.25 — $0.38$0.89 - $1.14$2.39 — $2.92 16Strong Values. |

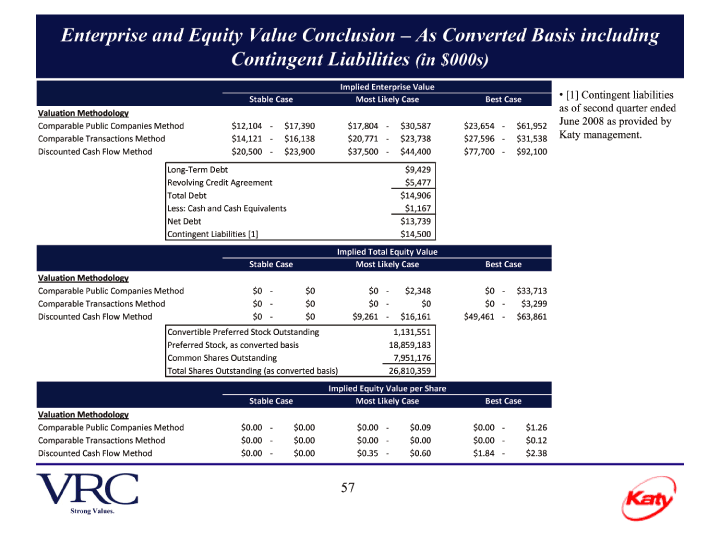
| Enterprise and Equity Value Conclusion – As Converted Basis including Contingent Liabilities (in $000s)Implied Enterprise Value ·[1] Contingent liabilitiesStable CaseMost Likely CaseBest Caseas of second quarter endedValuation Methodology June 2008 as provided by Comparable Public Companies Method$12,104 — $17,390$17,804 — $30,587$23,654 — $61,952 Katy management. Comparable Transactions Method$14,121 — $16,138$20,771 — $23,738$27,596 — $31,538 Discounted Cash Flow Method$20,500 — $23,900$37,500 — $44,400$77,700 — $92,100 Long- Term Debt$9,429 Revolving Credit Agreement$5,477 Total Debt$14,906 Less: Cash and Cash Equivalents$1,167 Net Debt$13,739 Contingent Liabilities [1]$14,500Implied Total Equity Value Stable CaseMost Likely CaseBest Case Valuation Methodology Comparable Public Companies Method$0 -$0$0 — $2,348$0 — $33,713 Comparable Transactions Method$0 - -$0$0 -$0$0 — $3,299 Discounted Cash Flow Method$0 -$0$9,261 — $16,161$49,461 — $63,861 Convertible Preferred Stock Outstanding1,131,551 Preferred Stock, as converted basis18,859,183 Common Shares Outstanding7,951,176 Total Shares Outstanding (as converted basis)26,810,359Implied Equity Value per Share Stable CaseMost Likely CaseBest Case Valuation Methodology Comparable Public Companies Method$0.00 — $0.00$0.00 — $0.09$0.00 — $1.26 Comparable Transactions Method$0.00 — $0.00$0.00 — $0.00$0.00 — $0.12 Discounted Cash Flow Method$0.00 — $0.00$0.35 - $0.60$1.84 — $2.38 17Strong Values. |
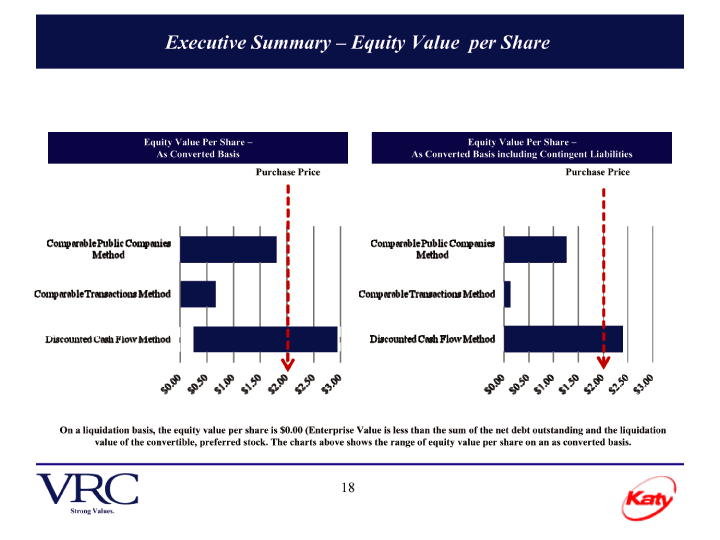
| Executive Summary – Equity Value per ShareEquity Value Per Share –Equity Value Per Share – As Converted BasisAs Converted Basis including Contingent Liabilities Purchase PricePurchase Price On a liquidation basis, the equity value per share is $0.00 (Enterprise Value is less than the sum of the net debt outstanding and the liquidation value of the convertible, preferred stock. The charts above shows the range of equity value per share on an as converted basis. 18Strong Values. |
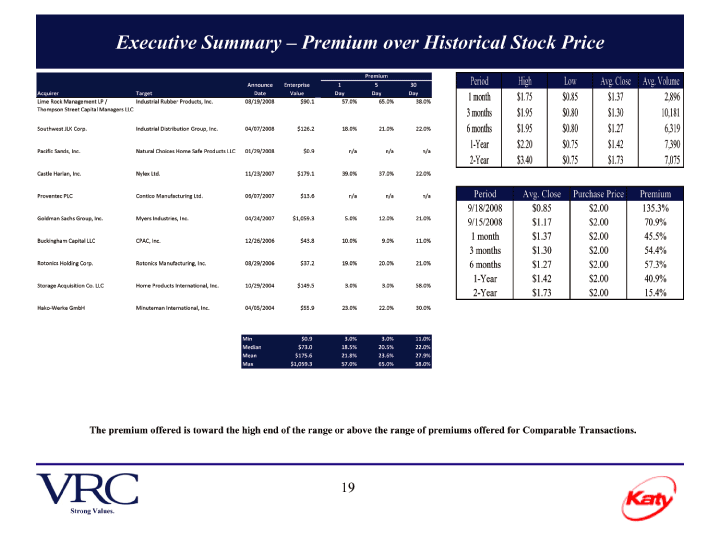
| Executive Summary – Premium over Historical Stock PricePremiumPeriodHighLowAvg. Close Avg. VolumeAnnounce Enterprise 1 5 30 Acquirer Target Date Value Day Day Day1 month$1.75$0.85$1.372,896 Lime Rock Management LP / Industrial Rubber Products, Inc.08/19/2008$90.1 57.0%65.0%38.0% Thompson Street Capital Managers LLC3 months$1.95$0.80$1.3010,181 Southwest JLK Corp.Industrial Distribution Group, Inc.04/07/2008$126.2 18.0%21.0%22.0%6 months$1.95$0.80$1.276,319 1-Year$2.20$0.75$1.427,390 Pacific Sands, Inc.Natural Choices Home Safe Products LLC 01/29/2008$0.9 n/an/an/a 2-Year$3.40$0.75$1.737,075 Castle Harlan, Inc.Nylex Ltd.11/23/2007$179.1 39.0%37.0%22.0% Proventec PLCContico Manufacturing Ltd.06/07/2007$13.6 n/an/an/aPeriodAvg. Close Purchase Price Premium 9/18/2008$0.85$2.00135.3% Goldman Sachs Group, Inc.Myers Industries, Inc.04/24/2007$1,059.3 5.0%12.0%21.0%9/15/2008$1.17$2.0070.9% 1 month$1.37$2.0045.5% Buckingham Capital LLCCPAC, Inc.12/26/2006$43.8 10.0%9.0%11.0% 3 months$1.30$2.0054.4% Rotonics Holding Corp.Rotonics Manufacturing, Inc.08/29/2006$37.2 19.0%20.0%21.0%6 months$1.27$2.0057.3% 1-Year$1.42$2.0040.9% Storage Acquisition Co. LLCHome Products International, Inc.10/29/2004$149.5 3.0%3.0%58.0% 2-Year$1.73$2.0015.4% Hako- Werke GmbHMinuteman International, Inc.04/05/2004$55.9 23.0%22.0%30.0%Min $0.9 3.0% 3.0% 11.0% Median $73.0 18.5% 20.5% 22.0% Mean $175.6 21.8% 23.6% 27.9% Max $1,059.3 57.0% 65.0% 58.0% The premium offered is toward the high end of the range or above the range of premiums offered for Comparable Transactions. 19Strong Values. |
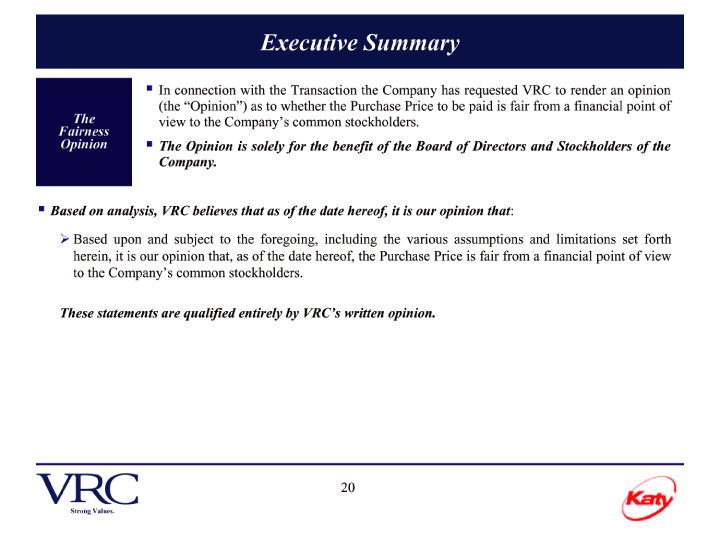
| Executive Summary |
| In connection with the Transaction the Company has requested VRC to render an opinion |
| (the “Opinion”) as to whether the Purchase Price to be paid is fair from a financial point ofThe view to the Company’s common stockholders.Fairness OpinionThe Opinion is solely for the benefit of the Board of Directors and Stockholders of the Company. |
| Based on analysis, VRC believes that as of the date hereof, it is our opinion that: |
| Based upon and subject to the foregoing, including the various assumptions and limitations set forth herein, it is our opinion that, as of the date hereof, the Purchase Price is fair from a financial point of view to the Company’s common stockholders. |
| These statements are qualified entirely by VRC’s written opinion. 20Strong Values. |
| Due Diligence In rendering the Opinion, VRC conducted such reviews, analyses and inquiries deemed necessary and appropriate under the circumstance. Among other things, VRC: |
| Reviewed publicly available information concerning Katy, including its Forms 10-K for the fiscal years ended December 31, 2004 through 2007 and its Forms 10-Q for the first and second quarters of fiscal years 2007 and 2008;Reviewed various internal monthly financial statement reports of Katy since December 2007 including the most recent report for July 2008;Reviewed Katy’s financial projections for fiscal years 2008 through 2012 (“Katy’s Forecast”) and the material assumptions associated therewith for each of the Best Case Plan, the Most Likely Case Plan and the Stable Case Plan (as such plans have been labeled in the materials provided to VRC);Reviewed the confidential information memorandum for Continental Commercial Products dated June 2007;Reviewed the restated certificate of incorporation of the Company which was filed with the SEC on July 13, 2001;Reviewed the industry in which Katy operates, which included a review of (i) certain publicly traded companies deemed comparable to Katy and (ii) certain mergers and acquisitions involving businesses deemed comparable to Katy’s;Had discussions with certain members of Katy’s management team with respect to the past, present, and future operating and financial conditions of Katy, among other subjects;Performed discounted cash flow analyses based on Katy’s Forecast;Reviewed historical stock prices for Katy;Reviewed the internally prepared monthly orders, broken down by each division, of Katy for fiscal year 2007;Reviewed publicly available information regarding the financial terms of certain transactions that are comparable, in whole or in part, to the Transaction;Developed indications of value for Katy using generally accepted valuation methodology; andConducted such other reviews, analyses and inquiries and considered such other economic, industry, market, financial and other information and data deemed appropriate by VRC. 21Strong Values. |
| SECTION III INDUSTRY & ECONOMIC TRENDSStrong Values. |
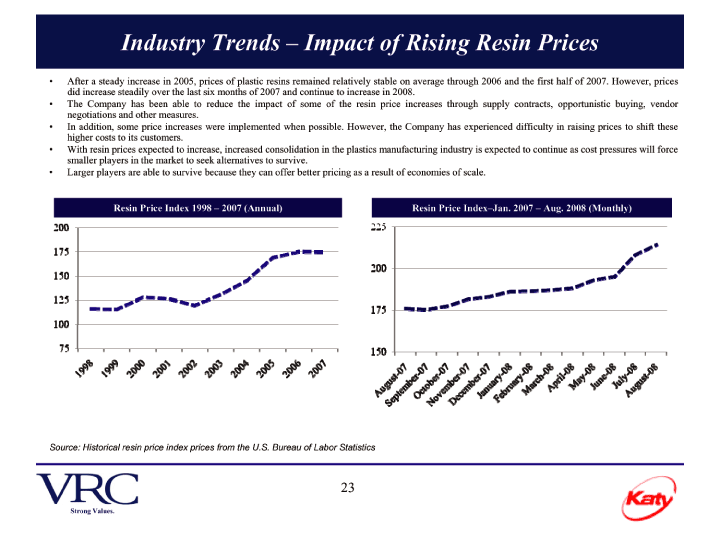
| Industry Trends – Impact of Rising Resin Prices ·After a steady increase in 2005, prices of plastic resins remained relatively stable on average through 2006 and the first half of 2007. However, prices did increase steadily over the last six months of 2007 and continue to increase in 2008. ·The Company has been able to reduce the impact of some of the resin price increases through supply contracts, opportunistic buying, vendor negotiations and other measures. ·In addition, some price increases were implemented when possible. However, the Company has experienced difficulty in raising prices to shift these higher costs to its customers. ·With resin prices expected to increase, increased consolidation in the plastics manufacturing industry is expected to continue as cost pressures will force smaller players in the market to seek alternatives to survive. ·Larger players are able to survive because they can offer better pricing as a result of economies of scale.Resin Price Index 1998 – 2007 (Annual)Resin Price Index–Jan. 2007 – Aug. 2008 (Monthly)Source: Historical resin price index prices from the U.S. Bureau of Labor Statistics 23Strong Values. |
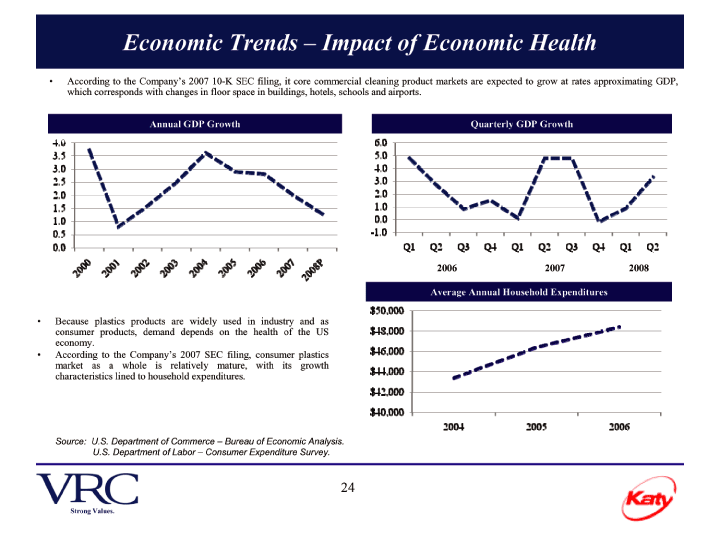
| Economic Trends – Impact of Economic Health ·According to the Company’s 2007 10-K SEC filing, it core commercial cleaning product markets are expected to grow at rates approximating GDP, which corresponds with changes in floor space in buildings, hotels, schools and airports.Annual GDP GrowthQuarterly GDP Growth 200620072008 Average Annual Household Expenditures ·Because plastics products are widely used in industry and as consumer products, demand depends on the health of the US economy. ·According to the Company’s 2007 SEC filing, consumer plastics market as a whole is relatively mature, with its growth characteristics lined to household expenditures.Source: U.S. Department of Commerce – Bureau of Economic Analysis. U.S. Department of Labor – Consumer Expenditure Survey. 24Strong Values. |
| SECTION IV OVERVIEW OF KATY INDUSTRIES, INC. |
| Company Profile |
| ·Founded in 1967, Katy Industries, Inc. manufactures and distributes commercial cleaning products and storage products. Commercial cleaning products are distributed primarily to janitorial/sanitary and foodservice distributors that supply end users such as restaurants, hotels, healthcare facilities and schools and storage products are sold to consumers through whole home improvement and mass market retailers. The Company operates through Continental, Contico, Contico Container, CCP Canada, Disco, Gemtex, Glit and Wilen business units. ·Continental and CCP Canada ·Manufactures and distributes broad array of plastic and cleaning products to janitorial/sanitary and foodservice distributors ·The business unit operates as Continental Manufacturing Company in United States which is based in Bridgeton, Missouri and as Continental Commercial Products Canada in Canada which is based in Toronto. ·Contico and Contico Containers ·The Contico business units manufactures and distribute plastic products for storage and packaging. ·Contico (Consumer) is focused in consumer market whereas Contico Containers is focused in commercial market for plastic storage and packaging products. ·The company plans to discontinue Contico (Consumer) business in fiscal year 2009. ·The Gemtex business unit manufactures and distributes resin fiber disks and other coated abrasives to the original equipment manufacturers (OEMs), automotive, industrial, and home improvement markets. The products are sold under the brand name Trim-Kut. ·The Glit business unit manufactures and distributes non-woven abrasive products for commercial and industrial use and also supplies materials to various OEMs. The Glit unit’s products include floor maintenance pads, hand pads, scouring pads, specialty abrasives for cleaning and finishing and roof ventilation products. The products are sold under the Glit, Kleenfast, Glit/Microtron, Fiber Naturals, Big Boss II, Blue Ice, Brillo, BAB-O, Old Dutch and Twister brand names. ·The Wilen business unit manufactures and distributes professional cleaning products that include mops, brooms, brushes, and plastic cleaning accessories. Wilen products are sold through commercial sanitary maintenance and food service markets, with some products sold through consumer retail outlets. Products are sold under the Wilen, Wax-o-matic and Rototech brand names. ·Disco business unit manufactures and distributes cleaning and specialty products to the restaurant and food service industries including fryer filters. |
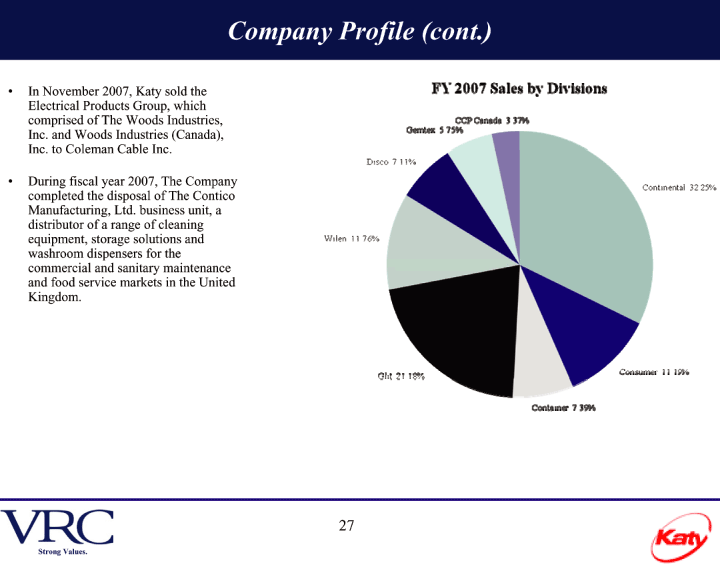
| Company Profile (cont.) 27 In November 2007, Katy sold the Electrical Products Group, which comprised of The Woods Industries, Inc. and Woods Industries (Canada), Inc. to Coleman Cable Inc. During fiscal year 2007, The Company completed the disposal of The Contico Manufacturing, Ltd. business unit, a distributor of a range of cleaning equipment, storage solutions and washroom dispensers for the commercial and sanitary maintenance and food service markets in the United Kingdom. |

| Historical Balance Sheets (in $000s)FYE FYE FYE FYE FQEFYEFYEFYEFYEFQE Fiscal Dec 2004 Dec 2005 Dec 2006 Dec 2007 Jun 2008Dec 2004 Dec 2005 Dec 2006 Dec 2007 Jul 2008 ASSETS Cash and cash equivalents$ 8,525$ 8,421$ 7,392$ 2,015 $ 1,1673.8%4.0%4.0%2.0%1.3% Accounts receivable, net $ 66,689 $ 63,612 $ 55,014 $ 18,077 $ 21,73629.7%30.0%30.1%18.3%24.0% Inventories, net $ 65,674 $ 62,593 $ 54,980 $ 26,160 $ 25,49029.3%29.5%30.1%26.5%28.2% Receivable from disposition$ #]$ #]$ #] $ 6,799$ 2940.0%0.0%0.0%6.9%0.3% Other current assets$ 4,233$ 3,600$ 2,991$ 2,520 $ 2,0021.9%1.7%1.6%2.6%2.2% Asset held for sale $ #] $ #] $ 4,483 $ #] $ #] 0.0% 0.0% 2.5% 0.0% 0.0% Total Current Assets $ 145,121 $ 138,226 $ 124,860 $ 55,571 $ 50,68964.7%65.2%68.3%56.4%56.0% PPE, net $ 59,730 $ 57,997 $ 41,744 $ 34,005 $ 32,25226.6%27.3%22.8%34.5%35.6% Goodwill$ 2,239$ 665$ 665$ 665$ 6651.0%0.3%0.4%0.7%0.7% Intangibles, net$ 7,428$ 6,946$ 6,435$ 4,853 $ 4,6593.3%3.3%3.5%4.9%5.1% Other $ 9,946 $ 8,260 $ 8,990 $ 3,470 $ 2,2044.4%3.9%4.9%3.5%2.4% TOTAL ASSETS $ 224,464 $ 212,094 $ 182,694 $ 98,564 $ 90,469 100.0% 100.0% 100.0% 100.0% 100.0% LIABILITIES Accounts payable $ 39,079 $ 47,449 $ 33,684 $ 14,995 $ 15,73917.4%22.4%18.4%15.2%17.4% Accrued compensation$ 5,269$ 4,071$ 3,518$ 2,629 $ 3,1852.3%1.9%1.9%2.7%3.5% Accrued expenses $ 39,939 $ 37,713 $ 38,187 $ 22,325 $ 21,50917.8%17.8%20.9%22.7%23.8% Current maturities of long#] term debt$ 2,857$ 2,857$ 1,125$ 1,500 $ 1,5001.3%1.3%0.6%1.5%1.7% Revolving credit agreement $ 40,166 $ 41,946 $ 43,879 $ 2,853 $ 5,47717.9%19.8%24.0%2.9%6.1% Total Current Liabilities $ 127,310 $ 134,036 $ 120,393 $ 44,302 $ 47,41056.7%63.2%65.9%44.9%52.4% Long#] term Debt, less Current maturities $ 15,714 $ 12,857 $ 11,867$ 9,100 $ 7,9297.0%6.1%6.5%9.2%8.8% Other liabilities $ 12,855 $ 10,497 $ 8,402 $ 8,706 $ 6,713 5.7% 4.9% 4.6% 8.8% 7.4% TOTAL LIABILITIES $ 155,879 $ 157,390 $ 140,662 $ 62,108 $ 62,05269.4%74.2%77.0%63.0%68.6% SHAREHOLDERS’ EQUITY Convertible Preferred Stock $ 108,256 $ 108,256 $ 108,256 $ 108,256 $ 108,25648.2%51.0%59.3%109.8%119.7% Common Stock$ 9,822$ 9,822$ 9,822$ 9,822 $ 9,8224.4%4.6%5.4%10.0%10.9% Additional Paid in Capital $ 25,111 $ 27,067 $ 27,120 $ 27,338 $ 27,04111.2%12.8%14.8%27.7%29.9% Accumulated Other Comprehensive (Loss) Income$ 4,564$ 3,158$ 2,242$ (1,112) $ (1,244)2.0%1.5%1.2%(1.1)%(1.4)% Accumulated deficit $ (57,258) $ (71,055) $ (83,434) $ (85,915) $ (93,564)(25.5)%(33.5)%(45.7)%(87.2)% (103.4)% Treasury stock $ (21,910) $ (22,544) $ (21,974) $ (21,933) $ (21,894) (9.8)% (10.6)% (12.0)% (22.3)% (24.2)% TOTAL SHAREHOLDERS’ EQUITY $ 68,585 $ 54,704 $ 42,032 $ 36,456 $ 28,41730.6%25.8%23.0%37.0%31.4% TOTAL LIABILITIES & SHAREHOLDERS’ EQUITY $ 224,464 $ 212,094 $ 182,694 $ 98,564 $ 90,469 100.0% 100.0% 100.0% 100.0% 100.0% |
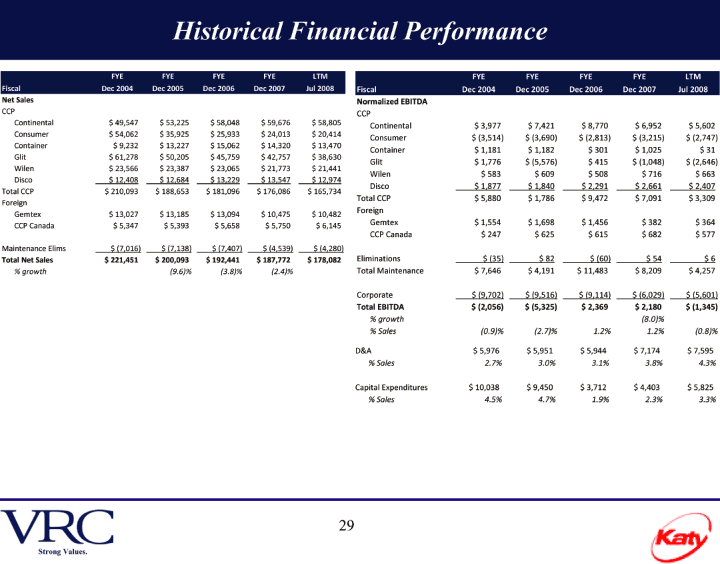
| Historical Financial Performance 29 |

| Forecasted Financial Performance - Stable Case (in $000s) 30 |
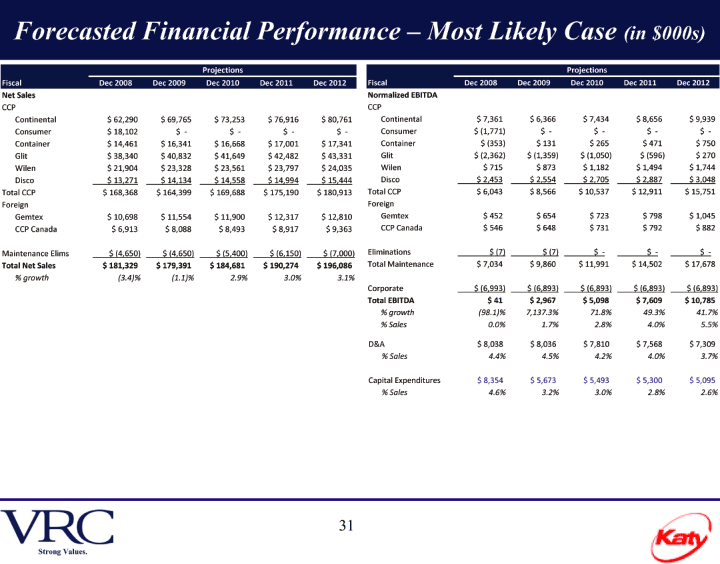
| Forecasted Financial Performance - Most Likely Case (in $000s) 31 |
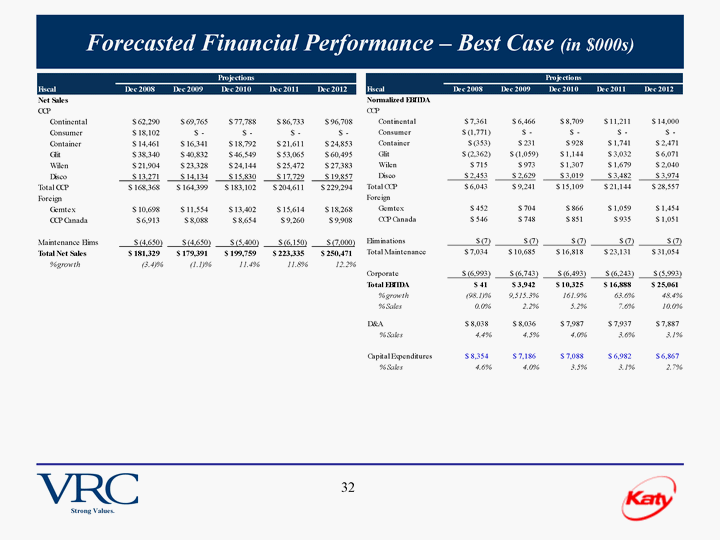
| Forecasted Financial Performance - Best Case (in $000s) 32 |
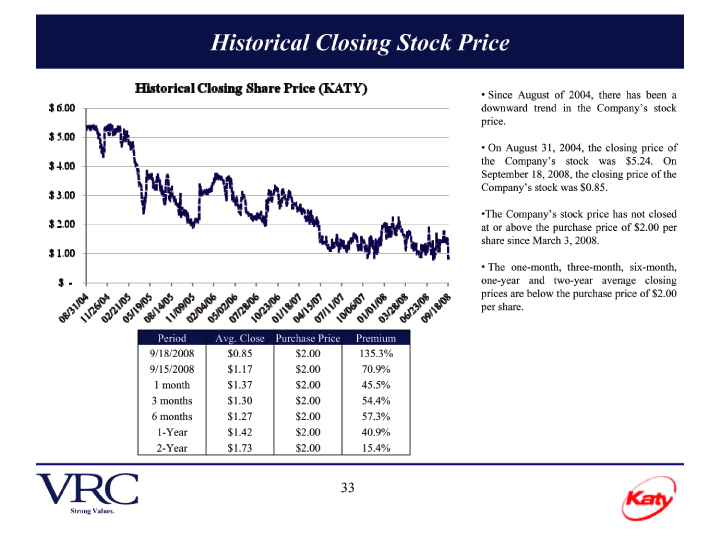
| Historical Closing Stock Price · Since August of 2004, there has been a downward trend in the Company’s stock price. · On August 31, 2004, the closing price of the Company’s stock was $5.24. On September 18, 2008, the closing price of the Company’s stock was $0.85. ·The Company’s stock price has not closed at or above the purchase price of $2.00 per share since March 3, 2008. · The one-month, three-month, six-month, one-year and two-year average closing prices are below the purchase price of $2.00 per share. PeriodAvg. Close Purchase Price Premium 9/18/2008$0.85$2.00135.3% 9/15/2008$1.17$2.0070.9% 1 month$1.37$2.0045.5% 3 months$1.30$2.0054.4% 6 months$1.27$2.0057.3% 1-Year$1.42$2.0040.9% 2-Year$1.73$2.0015.4% |
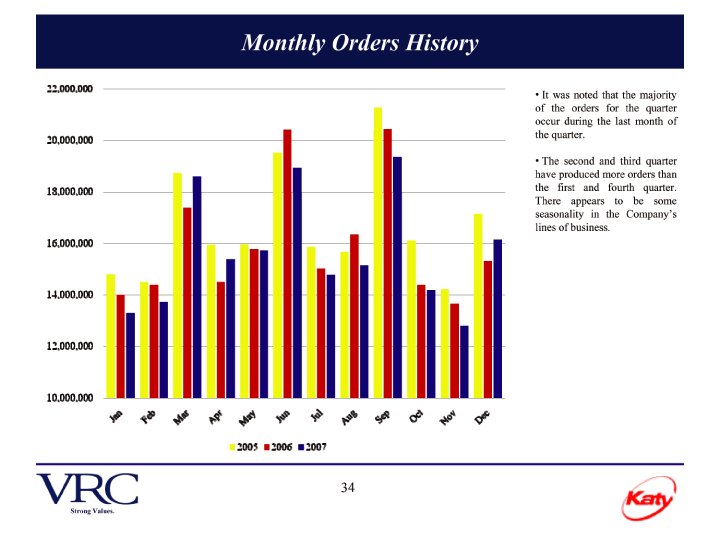
| · It was noted that the majority of the orders for the quarter occur during the last month of the quarter. · The second and third quarter have produced more orders than the first and fourth quarter. There appears to be some seasonality in the Company’s lines of business. |

| Cumulative Monthly Order 35 Continental and Glit product lines consistently account for approximately half of all of the Company's orders. There has been very little growth in the number of orders between 2005 through 2007. In fact the number of orders has shown a slight decline over this period. |
| SECTION V VALUATION ANALYSIS Strong Values. |
| Valuation Methodology DISCOUNTED CASH FLOW METHOD:Indications of value are derived from expected future cash flows discounted to present value using a rate that is judged to be commensurate with the risk associated with the subject cash flows.For purposes of this analysis, VRC directly derived enterprise value indications using forecasted cash flows obtained from management estimates.COMPARABLE PUBLIC COMPANIES METHOD:Indications of value are derived from discounted relative valuation metrics observed for comparable publicly traded companies of comparable businesses.VRC derived indications of enterprise value for Katy under the Comparable Public Companies Method by applying a multiple to forecasted EBITDAs under different scenarios (stable, most likely & best scenarios).VRC believes that EBITDA is an appropriate metric for purposes of valuing Katy under the Comparable Public Company Method as this metric is widely used for purposes of valuing stock of a public company.The downturn in US economy and softness in food services and building industries have led to Katy generating negative EBITDA during the latest twelve months (LTM). Negative EBITDA provides meaningless results on a market multiple basis. In addition, Katy plans to discontinue its consumer business line in fiscal 2009. For these reasons, VRC considered only indications of enterprise value using NFY EBITDA (fiscal 2009) and NFY +1 EBITDA (fiscal 2010). 37Strong Values. |
| Valuation Methodology (continued) COMPARABLE TRANSACTION METHOD:Indications of value are derived from discounted relative valuation metrics observed for acquisitions of comparable businesses.VRC derived indications of enterprise value for Katy under the Comparable Transaction Method by applying a multiple to forecasted EBITDAs under different scenarios (stable, most likely & best scenarios).VRC believes that EBITDA is an appropriate metric for purposes of valuing Katy under the Comparable Transactions Method as this metric is widely used for purposes of valuing stock of a public company. The downturn in US economy and softness in food services and building industries have led to Katy generating negative EBITDA during the latest twelve months (LTM). Negative EBITDA provides meaningless results on a market multiple basis. In addition, Katy plans to discontinue its consumer business line in fiscal 2009. For these reasons, VRC considered only indications of enterprise value using NFY EBITDA.VRC’s valuation is not purely the result of a mathematical process as it necessarily involves numerous complex qualitative considerations and judgments with respect the relative investment characteristics of Katy Industries, Inc., among other factors. 38Strong Values. |
| COMPARABLE PUBLIC COMPANIES METHOD Strong Values. |
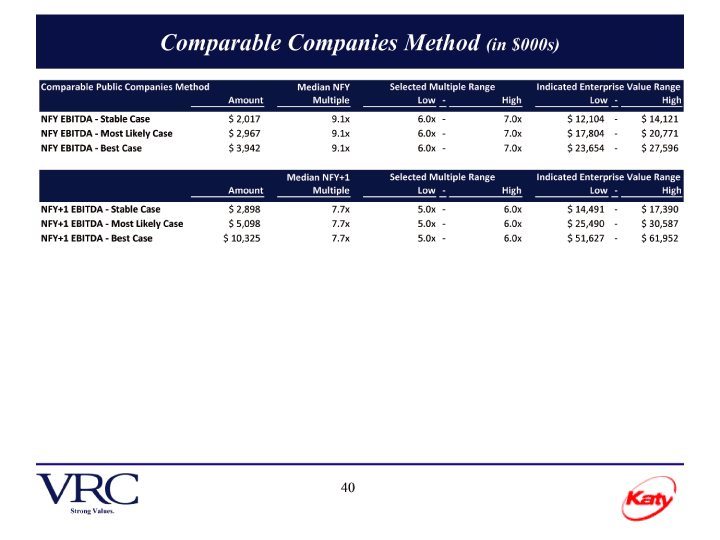
| Comparable Companies Method (in $000s)Comparable Public Companies Method Median NFY Selected Multiple Range Indicated Enterprise Value Range Amount Multiple Low — High Low — High NFY EBITDA Stable — Case$ 2,017 9.1x 6.0x 7.0x $ 12,104 — $ 14,121NFY EBITDA Most - Likely Case$ 2,967 9.1x 6.0x 7.0x $ 17,804 — $ 20,771NFY EBITDA Best — Case$ 3,942 9.1x 6.0x 7.0x $ 23,654 — $ 27,596Median NFY+1 Selected Multiple Range Indicated Enterprise Value Range Amount Multiple Low — High Low — High NFY+1 EBITDA Stable — Case$ 2,898 7.7x 5.0x 6.0x $ 14,491 — $ 17,390NFY+1 EBITDA Most - Likely Case$ 5,098 7.7x 5.0x 6.0x $ 25,490 — $ 30,587NFY+1 EBITDA Best — Case $ 10,325 7.7x 5.0x 6.0x $ 51,627 — $ 61,952 40Strong Values. |
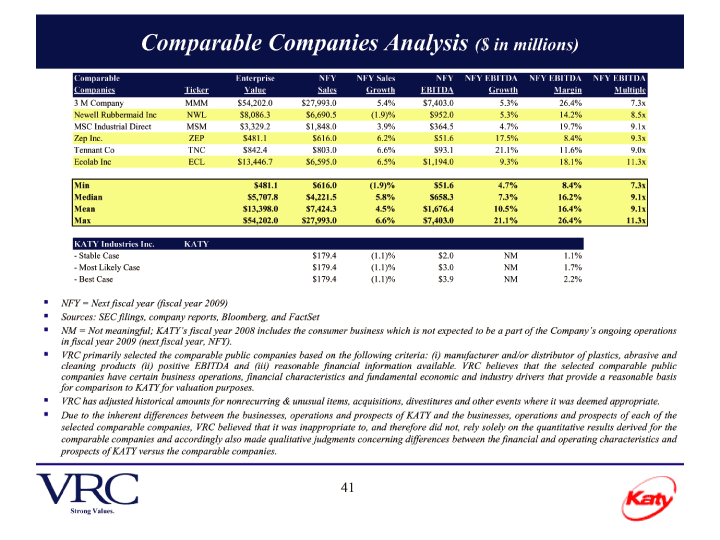
| Comparable Companies Analysis ($ in millions)Comparable Enterprise NFY NFY Sales NFY NFY EBITDA NFY EBITDA NFY EBITDA Companies Ticker Value Sales Growth EBITDA Growth Margin Multiple 3 M Company MMM $54,202.0 $27,993.0 5.4% $7,403.0 5.3% 26.4% 7.3x Newell Rubbermaid Inc NWL $8,086.3 $6,690.5 (1.9)% $952.0 5.3% 14.2% 8.5x MSC Industrial Direct MSM $3,329.2 $1,848.0 3.9% $364.5 4.7% 19.7% 9.1x Zep Inc. ZEP $481.1 $616.0 6.2% $51.6 17.5% 8.4% 9.3x Tennant Co TNC $842.4 $803.0 6.6% $93.1 21.1% 11.6% 9.0x Ecolab Inc ECL $13,446.7 $6,595.0 6.5% $1,194.0 9.3% 18.1% 11.3xMin $481.1 $616.0 (1.9)% $51.6 4.7% 8.4% 7.3x Median $5,707.8 $4,221.5 5.8% $658.3 7.3% 16.2% 9.1x Mean $13,398.0 $7,424.3 4.5% $1,676.4 10.5% 16.4% 9.1x Max $54,202.0 $27,993.0 6.6% $7,403.0 21.1% 26.4% 11.3x KATY Industries Inc. KATY - - Stable Case $179.4 (1.1)% $2.0 NM 1.1% — Most Likely Case $179.4 (1.1)% $3.0 NM 1.7% — Best Case $179.4 (1.1)% $3.9 NM 2.2%NFY = Next fiscal year (fiscal year 2009) Sources: SEC filings, company reports, Bloomberg, and FactSetNM = Not meaningful; KATY’s fiscal year 2008 includes the consumer business which is not expected to be a part of the Company’s ongoing operations in fiscal year 2009 (next fiscal year, NFY).VRC primarily selected the comparable public companies based on the following criteria: (i) manufacturer and/or distributor of plastics, abrasive and cleaning products (ii) positive EBITDA and (iii) reasonable financial information available. VRC believes that the selected comparable public companies have certain business operations, financial characteristics and fundamental economic and industry drivers that provide a reasonable basis for comparison to KATY for valuation purposes.VRC has adjusted historical amounts for nonrecurring & unusual items, acquisitions, divestitures and other events where it was deemed appropriate.Due to the inherent differences between the businesses, operations and prospects of KATY and the businesses, operations and prospects of each of the selected comparable companies, VRC believed that it was inappropriate to, and therefore did not, rely solely on the quantitative results derived for the comparable companies and accordingly also made qualitative judgments concerning differences between the financial and operating characteristics and prospects of KATY versus the comparable companies. 41 Strong Values. |
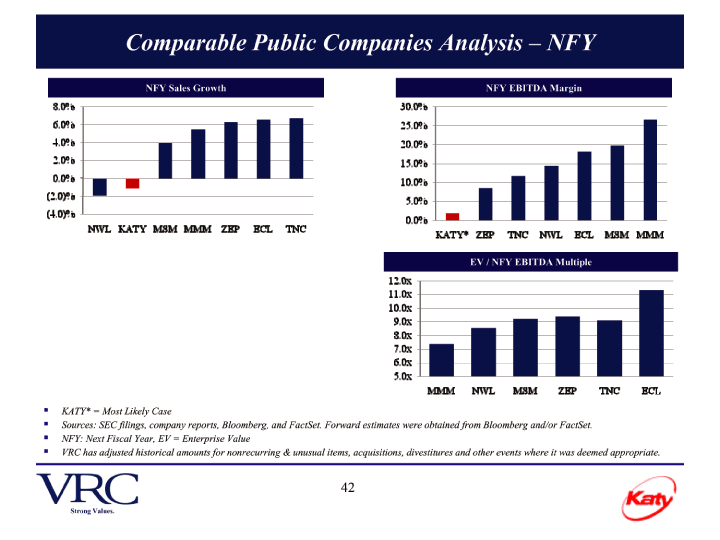
| Comparable Public Companies Analysis – NFYNFY Sales Growth NFY EBITDA Margin EV / NFY EBITDA MultipleKATY* = Most Likely CaseSources: SEC filings, company reports, Bloomberg, and FactSet. Forward estimates were obtained from Bloomberg and/or FactSet.NFY: Next Fiscal Year, EV = Enterprise ValueVRC has adjusted historical amounts for nonrecurring & unusual items, acquisitions, divestitures and other events where it was deemed appropriate. 42 Strong Values. |
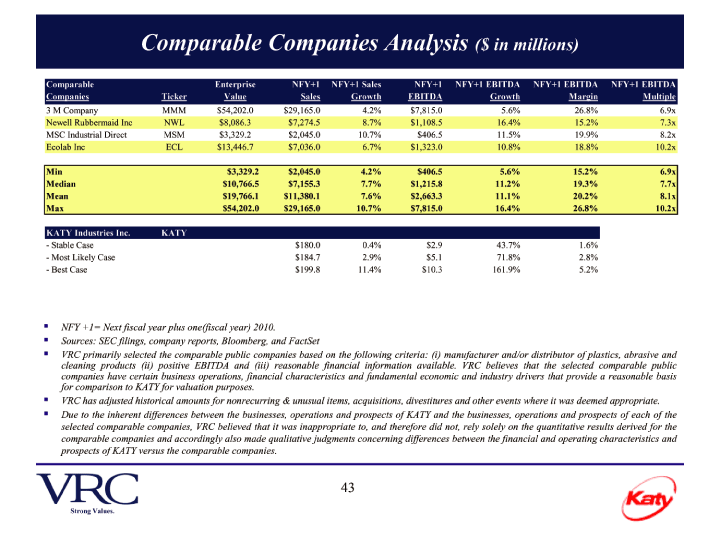
| Comparable Companies Analysis ($ in millions)Comparable Enterprise NFY+1 NFY+1 Sales NFY+1 NFY+1 EBITDA NFY+1 EBITDA NFY+1 EBITDA Companies Ticker Value Sales Growth EBITDA Growth Margin Multiple 3 M Company MMM $54,202.0 $29,165.0 4.2% $7,815.0 5.6% 26.8% 6.9x Newell Rubbermaid Inc NWL $8,086.3 $7,274.5 8.7% $1,108.5 16.4% 15.2% 7.3x MSC Industrial Direct MSM $3,329.2 $2,045.0 10.7% $406.5 11.5% 19.9% 8.2x Ecolab Inc ECL $13,446.7 $7,036.0 6.7% $1,323.0 10.8% 18.8% 10.2xMin $3,329.2 $2,045.0 4.2% $406.5 5.6% 15.2% 6.9x Median $10,766.5 $7,155.3 7.7% $1,215.8 11.2% 19.3% 7.7x Mean $19,766.1 $11,380.1 7.6% $2,663.3 11.1% 20.2% 8.1x Max $54,202.0 $29,165.0 10.7% $7,815.0 16.4% 26.8% 10.2x KATY Industries Inc. KATY - - Stable Case $180.0 0.4% $2.9 43.7% 1.6% — Most Likely Case $184.7 2.9% $5.1 71.8% 2.8% — Best Case $199.8 11.4% $10.3 161.9% 5.2%NFY +1= Next fiscal year plus one(fiscal year) 2010. Sources: SEC filings, company reports, Bloomberg, and FactSetVRC primarily selected the comparable public companies based on the following criteria: (i) manufacturer and/or distributor of plastics, abrasive and cleaning products (ii) positive EBITDA and (iii) reasonable financial information available. VRC believes that the selected comparable public companies have certain business operations, financial characteristics and fundamental economic and industry drivers that provide a reasonable basis for comparison to KATY for valuation purposes.VRC has adjusted historical amounts for nonrecurring & unusual items, acquisitions, divestitures and other events where it was deemed appropriate.Due to the inherent differences between the businesses, operations and prospects of KATY and the businesses, operations and prospects of each of the selected comparable companies, VRC believed that it was inappropriate to, and therefore did not, rely solely on the quantitative results derived for the comparable companies and accordingly also made qualitative judgments concerning differences between the financial and operating characteristics and prospects of KATY versus the comparable companies. 43 Strong Values. |
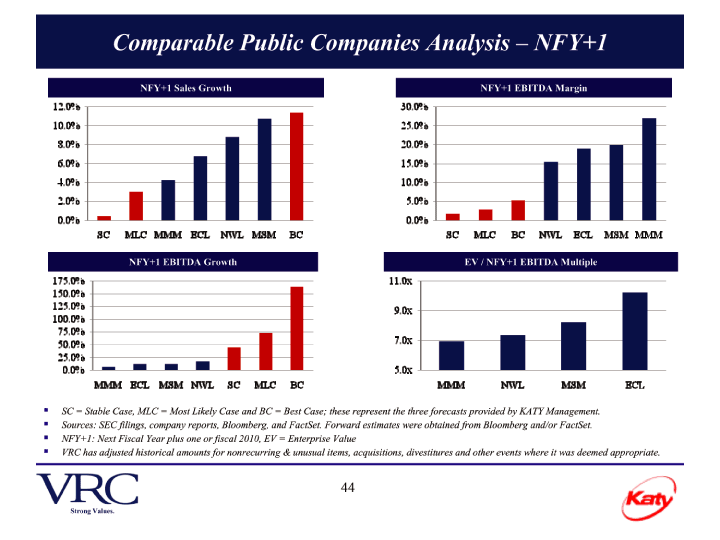
| Comparable Public Companies Analysis – NFY+1NFY+1 Sales Growth NFY+1 EBITDA Margin NFY+1 EBITDA Growth EV / NFY+1 EBITDA MultipleSC = Stable Case, MLC = Most Likely Case and BC = Best Case; these represent the three forecasts provided by KATY Management.Sources: SEC filings, company reports, Bloomberg, and FactSet. Forward estimates were obtained from Bloomberg and/or FactSet.NFY+1: Next Fiscal Year plus one or fiscal 2010, EV = Enterprise ValueVRC has adjusted historical amounts for nonrecurring & unusual items, acquisitions, divestitures and other events where it was deemed appropriate. 44 Strong Values. |

| COMPARABLE TRANSACTIONS METHOD Strong Values. |
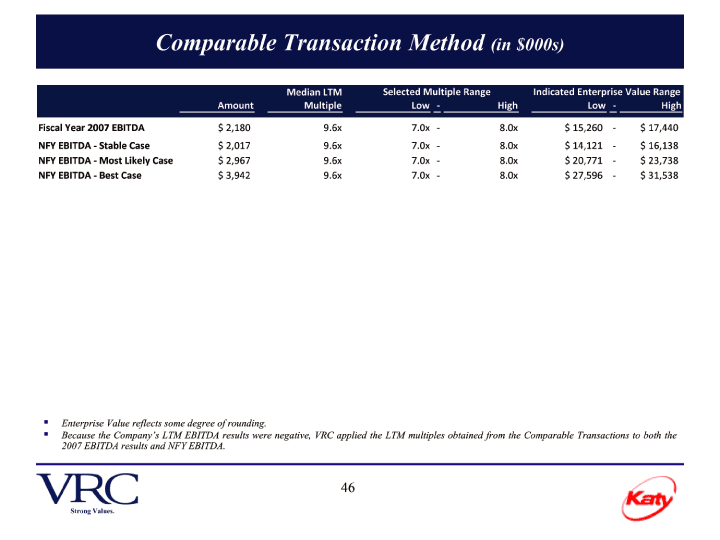
| Comparable Transaction Method (in $000s)Median LTM Selected Multiple Range Indicated Enterprise Value Range Amount Multiple Low — High Low - - High Fiscal Year 2007 EBITDA$ 2,180 9.6x 7.0x 8.0x $ 15,260 — $ 17,440NFY EBITDA Stable - Case$ 2,017 9.6x 7.0x 8.0x $ 14,121 — $ 16,138NFY EBITDA Most — Likely Case$ 2,967 9.6x 7.0x 8.0x $ 20,771 — $ 23,738NFY EBITDA Best — Case$ 3,942 9.6x 7.0x 8.0x $ 27,596 — $ 31,538Enterprise Value reflects some degree of rounding.Because the Company’s LTM EBITDA results were negative, VRC applied the LTM multiples obtained from the Comparable Transactions to both the 2007 EBITDA results and NFY EBITDA. 46 Strong Values. |
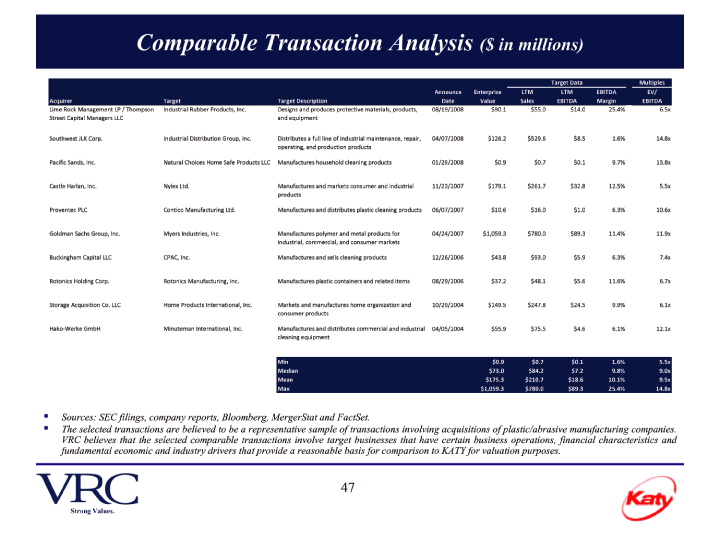
| Comparable Transaction Analysis ($ in millions)Target DataMultiples Announce EnterpriseLTMLTMEBITDAEV/ AcquirerTargetTarget DescriptionDateValueSalesEBITDAMarginEBITDA Lime Rock Management LP / Thompson Industrial Rubber Products, Inc.Designs and produces protective materials, products, 08/19/2008$90.1 $55.0 $14.0 25.4%6.5x Street Capital Managers LLCand equipment Southwest JLK Corp.Industrial Distribution Group, Inc.Distributes a full line of industrial maintenance, repair, 04/07/2008$126.2 $529.6 $8.5 1.6%14.8x operating, and production products Pacific Sands, Inc.Natural Choices Home Safe Products LLC Manufactures household cleaning products01/29/2008$0.9 $0.7 $0.1 9.7%13.8x Castle Harlan, Inc.Nylex Ltd.Manufactures and markets consumer and industrial 11/23/2007$179.1 $261.7 $32.8 12.5%5.5x products Proventec PLCContico Manufacturing Ltd.Manufactures and distributes plastic cleaning products 06/07/2007$10.6 $16.0 $1.0 6.3%10.6x Goldman Sachs Group, Inc.Myers Industries, Inc.Manufactures polymer and metal products for 04/24/2007$1,059.3 $780.0 $89.3 11.4%11.9x industrial, commercial, and consumer markets Buckingham Capital LLCCPAC, Inc.Manufactures and sells cleaning products12/26/2006$43.8 $93.0 $5.9 6.3%7.4x Rotonics Holding Corp.Rotonics Manufacturing, Inc.Manufactures plastic containers and related items08/29/2006$37.2 $48.1 $5.6 11.6%6.7x Storage Acquisition Co. LLCHome Products International, Inc.Markets and manufactures home organization and 10/29/2004$149.5 $247.8 $24.5 9.9%6.1x consumer products Hako- Werke GmbHMinuteman International, Inc.Manufactures and distributes commercial and industrial 04/05/2004$55.9 $75.5 $4.6 6.1%12.1x cleaning equipmentMin$0.9$0.7$0.11.6%5.5x Median$73.0$84.2$7.29.8%9.0x Mean$175.3$210.7$18.610.1%9.5x Max$1,059.3$780.0$89.325.4%14.8x |
| Sources: SEC filings, company reports, Bloomberg, MergerStat and FactSet. |
| The selected transactions are believed to be a representative sample of transactions involving acquisitions of plastic/abrasive manufacturing companies. VRC believes that the selected comparable transactions involve target businesses that have certain business operations, financial characteristics and fundamental economic and industry drivers that provide a reasonable basis for comparison to KATY for valuation purposes. |
| 47 Strong Values. |
| DISCOUNTED CASH FLOW METHOD Strong Values. |

| Discounted Cash Flow Analysis – Stable Case (in $000s)FYEProjectionsTerminalResidual Value Calculations Exit — Multiple Fiscal YearDec 2007 Dec 2008 Dec 2009 Dec 2010 Dec 2011 Dec 2012Year Terminal Year EBITDA$ 4,855$ 187,772 $ 181,329 $ 179,391 $ 180,037 $ 181,077 $ 182,417 $ 184,241Exit Multiple Selected7.0xNet Sales Terminal Value $ 33,987EBITDA$ 41$ 2,017$ 2,898$ 3,821$ 4,807 $ 4,855Present Value Factor0.550 Depreciation & Amortization$ 8,038$ 8,036$ 7,723$ 7,288$ 6,854 $ 3,685Present Value of Terminal Value $ 18,693 EBIT$ (7,997) $ (6,019) $ (4,825) $ (3,467) $ (2,046) $ 1,171EBIT Margin(4.4)%(3.4)%(2.7)%(1.9)%(1.1)% 0.6%Present Value Calculation Exit — Multiple Taxes$ (3,199) $ (2,408) $ (1,930) $ (1,387)$ (819)$ 468Sum of PV Cash Flows$ 3,518Debt Free Net Income$ (4,798) $ (3,611) $ (2,895) $ (2,080) $ (1,228) $ 702 Present Value of Residual $ 18,693 Operating Business Present Value $ 22,211 Add: Depreciation & Amortization$ 8,038$ 8,036$ 7,723$ 7,288$ 6,854 $ 3,685 Less: Capex$ 8,354$ 4,854$ 3,500$ 3,500$ 3,500 $ 3,685 Less: Change in NWC $ (6,885)$ (244)$ 81$ 131$ 169$ 230Total Business Enterprise Value (Rounded) $ 22,200 Free Cash Flows$ 1,771$ (185)$ 1,247$ 1,577$ 1,957 $ 472 Sensitivity Analysis Partial Period Adjustment0.2821.0001.0001.0001.000 Mid- Year Convention0.1410.7821.7822.7823.782$ 22,2006.5x7.0x7.5xPresent Value Factor0.9800.8960.7800.6780.58915.5%$20,500$21,800$23,10015.0%$20,900$22,200$23,500Present Value of Free Cash Flows$ 489$ (166)$ 973$ 1,069 $ 1,153 14.5%$21,200$22,600$23,900AssumptionsFYEFYEFYEFYEFYEFYETerminal Dec 2007 Dec 2008 Dec 2009 Dec 2010 Dec 2011 Dec 2012Year Net Sales $ 187,772 $ 181,329 $ 179,391 $ 180,037 $ 181,077 $ 182,417 $ 184,241growth %(3.4)%(1.1)%0.4%0.6%0.7% 1.0% EBITDA margin0.0%1.1%1.6%2.1%2.6% 2.6% Depreciation & Amortization4.4%4.5%4.3%4.0%3.8% 2.0% CapEx4.6%2.7%1.9%1.9%1.9% 2.0% Working Capital15.8%12.6%12.6%12.6%12.6%12.6% 12.6% Long term growth rate 1.0% Income Taxes 40.0% Discount Rate [1]15.0%[1] Based on growth expectations that were lower than the Most Likely Case and modest margin improvements, it was VRC’s opinion that the Stable Case was less risky than the Most Likely Case and accordingly adjusted the discount rate below the industry Weighted Average Cost of Capital (WACC). 49Strong Values. |
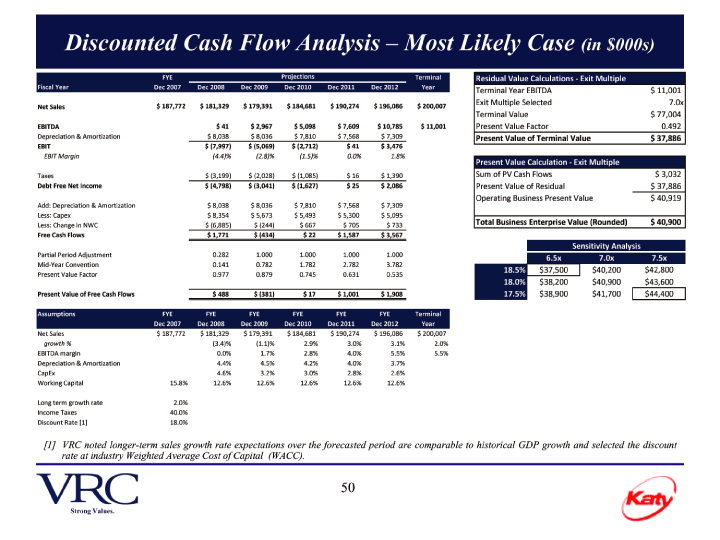
| Discounted Cash Flow Analysis – Most Likely Case (in $000s)FYEProjectionsTerminalResidual Value Calculations Exit — Multiple Fiscal YearDec 2007 Dec 2008 Dec 2009 Dec 2010 Dec 2011 Dec 2012Year Terminal Year EBITDA $ 11,001 Exit Multiple Selected7.0xNet Sales $ 187,772 $ 181,329 $ 179,391 $ 184,681 $ 190,274 $ 196,086 $ 200,007 Terminal Value $ 77,004EBITDA$ 41$ 2,967$ 5,098$ 7,609 $ 10,785 $ 11,001Present Value Factor0.492 Depreciation & Amortization$ 8,038$ 8,036$ 7,810$ 7,568$ 7,309 $ 5,000Present Value of Terminal Value $ 37,886 EBIT$ (7,997) $ (5,069) $ (2,712)$ 41$ 3,476 $ 6,000EBIT Margin(4.4)%(2.8)%(1.5)%0.0%1.8% 3.0%Present Value Calculation Exit — Multiple Taxes$ (3,199) $ (2,028) $ (1,085)$ 16$ 1,390 $ 2,400Sum of PV Cash Flows$ 3,032Debt Free Net Income$ (4,798) $ (3,041) $ (1,627)$ 25$ 2,086 $ 3,600Present Value of Residual $ 37,886 Operating Business Present Value $ 40,919 Add: Depreciation & Amortization$ 8,038$ 8,036$ 7,810$ 7,568$ 7,309 $ 5,000 Less: Capex$ 8,354$ 5,673$ 5,493$ 5,300$ 5,095 $ 5,000Total Business Enterprise Value (Rounded) $ 40,900 Less: Change in NWC $ (6,885)$ (244)$ 667$ 705$ 733 $ 495Free Cash Flows$ 1,771$ (434)$ 22$ 1,587$ 3,567 $ 3,106 Sensitivity Analysis Partial Period Adjustment0.2821.0001.0001.0001.000$ 40,9006.5x7.0x7.5xMid- Year Convention0.1410.7821.7822.7823.78218.5%$37,500$40,200$42,800 Present Value Factor0.9770.8790.7450.6310.53518.0%$38,200$40,900$43,600Present Value of Free Cash Flows$ 488$ (381)$ 17$ 1,001 $ 1,90817.5% $38,900$41,700$44,400AssumptionsFYEFYEFYEFYEFYEFYETerminal Dec 2007 Dec 2008 Dec 2009 Dec 2010 Dec 2011 Dec 2012Year Net Sales $ 187,772 $ 181,329 $ 179,391 $ 184,681 $ 190,274 $ 196,086 $ 200,007growth %(3.4)%(1.1)%2.9%3.0%3.1% 2.0% EBITDA margin0.0%1.7%2.8%4.0%5.5% 5.5% Depreciation & Amortization4.4%4.5%4.2%4.0%3.7% 2.5% CapEx4.6%3.2%3.0%2.8%2.6% 2.5% Working Capital15.8%12.6%12.6%12.6%12.6%12.6% 12.6% Long term growth rate2.0% Income Taxes 40.0% Discount Rate [1]18.0%[1] VRC noted longer-term sales growth rate expectations over the forecasted period are comparable to historical GDP growth and selected the discount rate at industry Weighted Average Cost of Capital (WACC). 50Strong Values. |

| Discounted Cash Flow Analysis – Best Case (in $000s)FYEProjectionsTerminalResidual Value Calculations Exit — Multiple Fiscal YearDec 2007 Dec 2008 Dec 2009 Dec 2010 Dec 2011 Dec 2012Year Terminal Year EBITDA $ 25,813Net Sales $ 187,772 $ 181,329 $ 179,391 $ 199,759 $ 223,335 $ 250,471 $ 257,985Exit Multiple Selected7.0x Terminal Value $ 180,692EBITDA$ 41$ 3,942 $ 10,325 $ 16,888 $ 25,061 $ 25,813Present Value Factor0.442 Depreciation & Amortization$ 8,038$ 8,036$ 7,987$ 7,937$ 7,887 $ 6,450Present Value of Terminal Value $ 79,866 EBIT$ (7,997) $ (4,094)$ 2,338$ 8,951 $ 17,174 $ 19,363EBIT Margin(4.4)%(2.3)%1.2%4.0%6.9% 7.5%Present Value Calculation Exit — Multiple Taxes$ (3,199) $ (1,638)$ 935$ 3,580$ 6,870 $ 7,745Sum of PV Cash Flows$ 4,933Debt Free Net Income$ (4,798) $ (2,456)$ 1,403$ 5,371 $ 10,304 $ 11,618 Present Value of Residual $ 79,866 Add: Depreciation & Amortization$ 8,038$ 8,036$ 7,987$ 7,937$ 7,887 $ 6,450Operating Business Present Value $ 84,799 Less: Capex$ 8,354$ 7,186$ 7,088$ 6,982$ 6,867 $ 6,450 Less: Change in NWC $ (6,885)$ (244)$ 2,569$ 2,974$ 3,423 $ 948Total Business Enterprise Value (Rounded) $ 84,800 Free Cash Flows$ 1,771 $ (1,362)$ (267)$ 3,352$ 7,902 $ 10,670 Partial Period Adjustment0.2821.0001.0001.0001.000Sensitivity Analysis Mid- Year Convention0.1410.7821.7822.7823.782$ 84,8006.5x7.0x7.5xPresent Value Factor0.9730.8620.7120.5880.48621.5%$77,700$83,300$88,900Present Value of Free Cash Flows$ 486 $ (1,174)$ (190)$ 1,971 $ 3,84021.0% $79,100$84,800$90,50020.5%$80,500$86,300$92,100AssumptionsFYEFYEFYEFYEFYEFYETerminal Dec 2007 Dec 2008 Dec 2009 Dec 2010 Dec 2011 Dec 2012Year Net Sales $ 187,772 $ 181,329 $ 179,391 $ 199,759 $ 223,335 $ 250,471 $ 257,985growth %(3.4)%(1.1)%11.4%11.8%12.2% 3.0% EBITDA margin0.0%2.2%5.2%7.6%10.0% 10.0% Depreciation & Amortization4.4%4.5%4.0%3.6%3.1% 2.5% CapEx4.6%4.0%3.5%3.1%2.7% 2.5% Working Capital15.8%12.6%12.6%12.6%12.6%12.6% 12.6% Long term growth rate3.0% Income Taxes 40.0% Discount Rate [1]21.0%[1] Based on high projected sales growth rates (double digits) and compound annual growth rates in EBITDA of nearly 400% per annum over the next 5 years, VRC adjusted the discount rate upward from the Industry WACC to reflect significant execution risk in the Best Cast projections. 51Strong Values. |
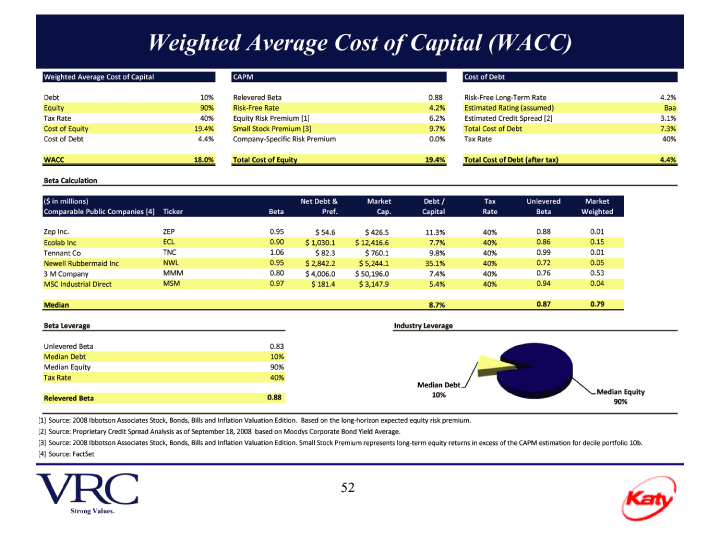
| Weighted Average Cost of Capital (WACC)Weighted Average Cost of CapitalCAPMCost of Debt Debt 10% Relevered Beta0.88Risk- Free Long- Term Rate4.2% Equity90%Risk- Free Rate4.2%Estimated Rating (assumed)Baa Tax Rate40%Equity Risk Premium [1]6.2%Estimated Credit Spread [2]3.1% Cost of Equity19.4%Small Stock Premium [3]9.7%Total Cost of Debt7.3% Cost of Debt4.4%Company- Specific Risk Premium0.0%Tax Rate40%WACC18.0%Total Cost of Equity19.4%Total Cost of Debt (after tax)4.4% Beta Calculation ($ in millions)Net Debt &MarketDebt /TaxUnleveredMarketImplied Comparable Public Companies [4] TickerBetaPref.Cap.CapitalRateBetaWeightedWACC Zep Inc.ZEP0.95$ 54.6$ 426.511.3%40%0.880.0112.1% Ecolab IncECL0.90$ 1,030.1 $ 12,416.67.7%40%0.860.159.6% Tennant CoTNC1.06$ 82.3$ 760.19.8%40%0.990.0111.3% Newell Rubbermaid IncNWL0.95$ 2,842.2 $ 5,244.135.1%40%0.720.059.9% 3 M CompanyMMM0.80$ 4,006.0 $ 50,196.07.4%40%0.760.539.4% MSC Industrial DirectMSM0.97$ 181.4 $ 3,147.95.4%40%0.940.0410.1%Median8.7%0.870.79 Beta LeverageIndustry Leverage Unlevered Beta0.83 Median Debt10% Median Equity90% Tax Rate40%Median Debt Median Equity 0.8810% Relevered Beta 90% [1] Source: 2008 Ibbotson Associates Stock, Bonds, Bills and Inflation Valuation Edition. Based on the long- horizon expected equity risk premium. [2] Source: Proprietary Credit Spread Analysis as of September 18, 2008 based on Moodys Corporate Bond Yield Average. [3] Source: 2008 Ibbotson Associates Stock, Bonds, Bills and Inflation Valuation Edition. Small Stock Premium represents long- term equity returns in excess of the CAPM estimation for decile portfolio 10b. [4] Source: FactSet 52Strong Values. |

| VALUATION CONCLUSION Strong Values. |

| Enterprise and Equity Value Conclusion – Liquidation Basis (in $000s)Implied Enterprise Value Stable CaseMost Likely CaseBest Case Valuation Methodology Comparable Public Companies Method$12,104 — $17,390$17,804 — $30,587$23,654 — $61,952 Comparable Transactions Method$14,121 — $16,138$20,771 — $23,738$27,596 — $31,538 Discounted Cash Flow Method$20,500 — $23,900$37,500 — $44,400$77,700 — $92,100 Long- Term Debt$9,429 Revolving Credit Agreement$5,477 Total Debt$14,906 Less: Cash and Cash Equivalents$1,167 Net Debt$13,739 Convertible Preferred Stock (liquidation value)$113,155Implied Total Equity Value Stable CaseMost Likely CaseBest Case Valuation Methodology Comparable Public Companies Method$0.00 — $0.00$0.00 — $0.00$0.00 — $0.00 Comparable Transactions Method$0.00 — $0.00$0.00 — $0.00$0.00 — $0.00 Discounted Cash Flow Method$0.00 — $0.00$0.00 - $0.00$0.00 — $0.00 Common Shares Outstanding7,951,176Implied Equity Value per Share Stable CaseMost Likely CaseBest Case Valuation Methodology Comparable Public Companies Method$0.00 — $0.00$0.00 — $0.00$0.00 — $0.00 Comparable Transactions Method$0.00 — $0.00$0.00 — $0.00$0.00 — $0.00 Discounted Cash Flow Method$0.00 — $0.00$0.00 - $0.00$0.00 — $0.00 54Strong Values. |
| Convertible, Preferred StockOn June 28, 2001, Katy completed a recapitalization following an agreement on June 2, 2001 with KKTY Holding Company, LLC (“KKTY”), an affiliate of Kohlberg Investors IV, L.P. (“Kohlberg”) (the “Recapitalization”). Under the terms of the Recapitalization, KKTY purchased 700,000 shares of newly issued preferred stock, $100 par value per share (“Convertible Preferred Stock”), which is convertible into 11,666,666 common shares, for an aggregate purchase price of $70.0 million. The Convertible Preferred shares were entitled to a 15% payment in kind (“PIK”) dividend (that is, dividends in the form of additional shares of Convertible Preferred Stock), compounded annually, which started accruing on August 1, 2001. PIK dividends were paid on August 1, 2002 (105,000 convertible preferred shares, equivalent to 1,750,000 common shares); August 1, 2003 (120,750 convertible preferred shares, equivalent to 2,012,500 common shares); August 1, 2004 (138,862.5 convertible preferred shares equivalent to 2,314,375 common shares); and on December 31, 2004 (66,938.5 convertible preferred shares, equivalent to 1,115,642 common shares). No dividends accrue or are payable after December 31, 2004.At December 31, 2007, 2006 and 2005, 1,131,551 convertible preferred shares were outstanding, which are in total convertible into 18,859,183 shares of Katy common stock.The Convertible Preferred Stock is convertible at the option of the holder at any time after the earlier of 1) June 28, 2006, 2) board approval of a merger, consolidation or other business combination involving a change in control of the Company, or a sale of all or substantially all of the assets or liquidation of the Company, or 3) a contested election for directors of the Company nominated by KKTY. The preferred shares 1) are non-voting (with limited exceptions), 2) are non-redeemable, except in whole, but not in part, at the Company’s option (as approved only by the Class I directors) at any time after June 30, 2021, 3) were entitled to receive cumulative PIK dividends through December 31, 2004 at a rate of 15% percent, 4) have no preemptive rights with respect to any other securities or instruments issued by the Company, and 5) have registration rights with respect to any common shares issued upon conversion of the Convertible Preferred Stock. Upon a liquidation of Katy, the holders of the Convertible Preferred Stock would receive the greater of (i) an amount equal to the par value ($100 per share) of their Convertible Preferred Stock, or (ii) an amount that the holders of the Convertible Preferred Stock would have received if their shares of Convertible Preferred Stock were converted into common stock immediately prior to the distribution upon liquidation.Under Katy’s charter, “a merger, consolidation or other business combination between Katy and any other entity or a sale or other disposition of all or substantially all of the assets of Katy will not be treated as a liquidation.”Source: Company’s 10-K SEC filing and the Company’s Amended & Restated Certificate of Incorporation dated July 13, 2001. 55 Strong Values. |
| Enterprise and Equity Value Conclusion – As Converted Basis (in $000s)Implied Enterprise Value Stable CaseMost Likely CaseBest Case Valuation Methodology Comparable Public Companies Method$12,104 — $17,390$17,804 — $30,587$23,654 — $61,952 Comparable Transactions Method$14,121 — $16,138$20,771 — $23,738$27,596 — $31,538 Discounted Cash Flow Method$20,500 — $23,900$37,500 — $44,400$77,700 — $92,100 Long- Term Debt$9,429 Revolving Credit Agreement$5,477 Total Debt$14,906 Less: Cash and Cash Equivalents$1,167 Net Debt$13,739Implied Total Equity Value Stable CaseMost Likely CaseBest Case Valuation Methodology Comparable Public Companies Method$0 — $3,651$4,065 — $16,848$9,915 — $48,213 Comparable Transactions Method$382 — $2,399$7,032 — $9,999$13,857 — $17,799 Discounted Cash Flow Method$6,761 - - $10,161$23,761 — $30,661$63,961 — $78,361 Convertible Preferred Stock Outstanding1,131,551 Preferred Stock, as converted basis18,859,183 Common Shares Outstanding7,951,176 Total Shares Outstanding (as converted basis)26,810,359Implied Equity Value per Share Stable CaseMost Likely CaseBest Case Valuation Methodology Comparable Public Companies Method$0.00 — $0.14$0.15 — $0.63$0.37 — $1.80 Comparable Transactions Method$0.01 — $0.09$0.26 — $0.37$0.52 — $0.66 Discounted Cash Flow Method$0.25 — $0.38$0.89 - $1.14$2.39 — $2.92 56Strong Values. |
| Enterprise and Equity Value Conclusion – As Converted Basis including Contingent Liabilities (in $000s)Implied Enterprise Value ·[1] Contingent liabilitiesStable CaseMost Likely CaseBest Caseas of second quarter endedValuation Methodology June 2008 as provided by Comparable Public Companies Method$12,104 — $17,390$17,804 — $30,587$23,654 — $61,952 Katy management. Comparable Transactions Method$14,121 — $16,138$20,771 — $23,738$27,596 — $31,538 Discounted Cash Flow Method$20,500 — $23,900$37,500 — $44,400$77,700 — $92,100 Long- Term Debt$9,429 Revolving Credit Agreement$5,477 Total Debt$14,906 Less: Cash and Cash Equivalents$1,167 Net Debt$13,739 Contingent Liabilities [1]$14,500Implied Total Equity Value Stable CaseMost Likely CaseBest Case Valuation Methodology Comparable Public Companies Method$0 -$0$0 — $2,348$0 — $33,713 Comparable Transactions Method$0 - -$0$0 -$0$0 — $3,299 Discounted Cash Flow Method$0 -$0$9,261 — $16,161$49,461 — $63,861 Convertible Preferred Stock Outstanding1,131,551 Preferred Stock, as converted basis18,859,183 Common Shares Outstanding7,951,176 Total Shares Outstanding (as converted basis)26,810,359Implied Equity Value per Share Stable CaseMost Likely CaseBest Case Valuation Methodology Comparable Public Companies Method$0.00 — $0.00$0.00 — $0.09$0.00 — $1.26 Comparable Transactions Method$0.00 — $0.00$0.00 — $0.00$0.00 — $0.12 Discounted Cash Flow Method$0.00 — $0.00$0.35 - $0.60$1.84 — $2.38 57Strong Values. |