UNITED STATES
SECURITIES AND EXCHANGE COMMISSION
Washington, D.C. 20549
FORM N-CSR
Certified Shareholder Report of
Registered Management Investment Companies
Investment Company Act File Number: 811-00572
American Mutual Fund
(Exact Name of Registrant as Specified in Charter)
333 South Hope Street
Los Angeles, California 90071
(Address of Principal Executive Offices)
Registrant's telephone number, including area code: (213) 486-9200
Date of fiscal year end: October 31
Date of reporting period: April 30, 2014
Michael W. Stockton
American Mutual Fund
333 South Hope Street
Los Angeles, California 90071
(Name and Address of Agent for Service)
Copies to:
Eric A. S. Richards
O’Melveny & Myers LLP
400 South Hope Street, 10th Floor
Los Angeles, California 90071
(Counsel for the Registrant)
ITEM 1 – Reports to Stockholders

 | American Mutual Fund® Semi-annual report
for the six months ended
April 30, 2014 |
American Mutual Fund strives for the balanced accomplishment of three objectives — current income, growth of capital and conservation of principal — through investments in companies that participate in the growth of the American economy.
This fund is one of more than 40 offered by one of the nation’s largest mutual fund families, American Funds, from Capital Group. For more than 80 years, Capital has invested with a long-term focus based on thorough research and attention to risk.
Fund results shown in this report, unless otherwise indicated, are for Class A shares at net asset value. If a sales charge (maximum 5.75%) had been deducted, the results would have been lower. Results are for past periods and are not predictive of results for future periods. Current and future results may be lower or higher than those shown. Share prices and returns will vary, so investors may lose money. Investing for short periods makes losses more likely. Investments are not FDIC-insured, nor are they deposits of or guaranteed by a bank or any other entity, so they may lose value. For current information and month-end results, visit americanfunds.com.
Here are the average annual total returns on a $1,000 investment with all distributions reinvested for periods ended March 31, 2014 (the most recent calendar quarter-end):
| Class A shares | | 1 year | | 5 years | | 10 years |
| | | | | | | |
| Reflecting 5.75% maximum sales charge | | 11.15% | | 17.34% | | 6.96% |
For other share class results, visit americanfunds.com and americanfundsretirement.com.
The total annual fund operating expense ratio was 0.61% for Class A shares as of the prospectus dated January 1, 2014.
Investment results assume all distributions are reinvested and reflect applicable fees and expenses. When applicable, investment results reflect fee waivers, without which results would have been lower. Visit americanfunds.com for more information.
The fund’s 30-day yield for Class A shares as of May 31, 2014, calculated in accordance with the U.S. Securities and Exchange Commission (SEC) formula, was 1.89%. The fund’s 12-month distribution rate for Class A shares as of that date was 1.75%. Both reflect the 5.75% maximum sales charge. The SEC yield reflects the rate at which the fund is earning income on its current portfolio of securities while the distribution rate reflects the fund’s past dividends paid to shareholders. Accordingly, the fund’s SEC yield and distribution rate may differ.
Refer to the fund prospectus and the Risk Factors section of this report for more information on risks associated with investing in the fund.

Fellow investors:
U.S. equities posted strong gains for the six-month period ended April 30, 2014, supported by solid fundamental growth in corporate earnings and rising investor optimism about the continued economic expansion. Several market indexes touched a succession of all-time highs, including the Standard & Poor’s 500 Composite Index and the Dow Jones Industrial Average. While there has been much focus on the Federal Reserve this year, ranging from concern over the slowing of quantitative easing to worries about inflation and deflation, markets seem to be adapting to the gradual reduction of central bank stimulus.
With the stock market rising sharply during the period, American Mutual Fund posted a total return of 6.98%. This trailed the 8.35% return for the unmanaged S&P 500, a broad measure of the U.S. stock market. It is not uncommon for AMF to lag the S&P 500 in a market environment of strong rising returns. The fund is managed conservatively and tends to do better in declining markets because dividend-paying holdings are typically less volatile than the overall market.
Over longer periods of time, AMF has done slightly better than the S&P 500. For the past 10 years, the fund had an average annual total return of 7.77% compared with the index’s 7.66% return. For its 64-year lifetime, AMF has had an average annual total return of 11.76% compared with 11.30% for the S&P 500. The index is unmanaged and, therefore, has no expenses. Investors cannot invest directly in an index.
Portfolio review
Holdings in the industrials, materials and utilities sectors made strong contributions to the fund’s results. Industrials continued to be the fund’s largest area of investment, making up 15% of its total assets. Several firms have benefited from the ongoing increase in corporate spending and global economic growth, including aerospace and defense companies General Dynamics and Lockheed Martin. Railroad operator Union Pacific also contributed to the fund’s results during the period, as did materials company Dow Chemical and electric utility Exelon.
Investments in the health care sector were mixed: AbbVie and Merck posted strong gains, while Amgen and Bristol-Myers Squibb were among the biggest detractors. After rising sharply in 2013 and during the first quarter of 2014 amid strong financial results and encouraging clinical trials, shares of Amgen declined late in the six-month period during a selloff in biotechnology stocks due in part to valuation concerns. However, we remain optimistic about the company’s future and its strong pipeline of drugs in key areas such as cancer.
Consumer discretionary companies also had mixed results. Toymaker Mattel and media conglomerate Time Warner declined, while retailer Williams-Sonoma and cable provider Comcast advanced. During the period, Comcast made a $45 billion bid to acquire Time Warner Cable, which is separate from Time Warner and also a holding in the fund. Shares of both companies increased on news of the proposed deal, which would create a powerhouse in an industry that’s already seen prices steadily increase; it would also control large portions of the broadband Internet market, along with vast amounts of content through Comcast’s ownership of NBCUniversal.
Overall, the fund’s significant investments in companies with higher dividend yields helped it participate in the market rally. While some sectors that traditionally have been sources of dividends have seen valuations increase quite a bit, we believe there are still plenty of attractively valued companies to be found for investment. AMF’s portfolio managers also have been finding more investment opportunities in new areas such as industrials and information technology; a number of companies in those sectors have been using their growing stockpiles of cash to reward shareholders with higher dividends. We believe that our robust research operation allows us to identify those firms most likely to increase dividends rapidly, and to invest in them at attractive valuation levels.
Looking ahead
The Fed has indicated that it will keep reducing its asset-purchase program as long as the U.S. economy continues to shows signs of improvement. Given these circumstances, we expect interest rates to gradually rise over time; however, the exact timing of any increase is uncertain. In normal recoveries, interest rates typically rise as the economy rebounds, and we would expect this pattern to recur as the Fed becomes less active in the market. With this in mind, we remain sensitive to valuation levels.
In such an environment, AMF’s portfolio managers are primarily focused on companies that are increasing dividends as well as earnings. We are careful to avoid those with high dividend yields and no earnings growth, which tend not to do as well when interest rates are rising. Dividend growth also sends a positive message about a company’s earnings and management’s willingness to share profits with investors instead of spending capital on acquisitions or share repurchases, which have a less impressive track record of benefiting shareholders.
We would like to remind our investors of the fund’s three objectives: current income, growth of capital and conservation of principal, which is especially important during a period of rising interest rates and higher valuations. We are pleased to report that the number of shareholder accounts in AMF has grown 5.8% from a year ago. We would like to welcome our new shareholders and thank our long-term investors for their continued support.
Cordially,

Joyce E. Gordon
Vice Chairman

William L. Robbins
President
June 11, 2014
For current information about the fund, visit americanfunds.com.
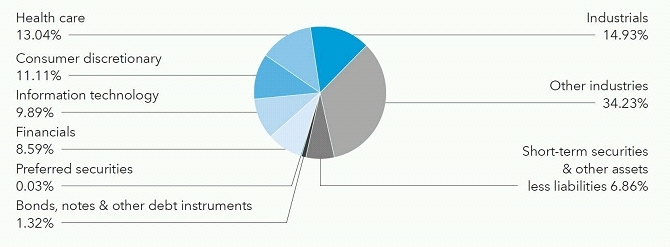
| Summary investment portfolio April 30, 2014 | unaudited |
| Industry sector diversification | Percent of net assets |
| Common stocks 91.79% | | Shares | | | Value
(000) | | | Percent of
net assets | |
| Energy 6.78% | | | | | | | | | |
| Chevron Corp. | | | 4,839,411 | | | $ | 607,443 | | | | 1.85 | % |
| ConocoPhillips | | | 3,274,900 | | | | 243,358 | | | | .74 | |
| Royal Dutch Shell PLC, Class A (ADR) | | | 4,635,907 | | | | 365,031 | | | | 1.11 | |
| Other securities | | | | | | | 1,015,826 | | | | 3.08 | |
| | | | | | | | 2,231,658 | | | | 6.78 | |
| | | | | | | | | | | | | |
| Materials 5.06% | | | | | | | | | | | | |
| Dow Chemical Co. | | | 9,316,690 | | | | 464,903 | | | | 1.41 | |
| Praxair, Inc. | | | 3,323,624 | | | | 433,899 | | | | 1.32 | |
| Other securities | | | | | | | 768,898 | | | | 2.33 | |
| | | | | | | | 1,667,700 | | | | 5.06 | |
| | | | | | | | | | | | | |
| Industrials 14.93% | | | | | | | | | | | | |
| CSX Corp. | | | 10,454,193 | | | | 295,017 | | | | .90 | |
| Emerson Electric Co. | | | 3,946,850 | | | | 269,096 | | | | .82 | |
| General Dynamics Corp. | | | 4,583,000 | | | | 501,609 | | | | 1.52 | |
| General Electric Co. | | | 13,860,000 | | | | 372,695 | | | | 1.13 | |
| Lockheed Martin Corp. | | | 2,192,860 | | | | 359,936 | | | | 1.09 | |
| Union Pacific Corp. | | | 1,879,300 | | | | 357,875 | | | | 1.09 | |
| United Parcel Service, Inc., Class B | | | 4,692,300 | | | | 462,192 | | | | 1.40 | |
| United Technologies Corp. | | | 2,823,174 | | | | 334,066 | | | | 1.01 | |
| Waste Management, Inc. | | | 10,202,900 | | | | 453,519 | | | | 1.38 | |
| Other securities | | | | | | | 1,511,591 | | | | 4.59 | |
| | | | | | | | 4,917,596 | | | | 14.93 | |
| | | Shares | | | Value
(000) | | | Percent of
net assets | |
| Consumer discretionary 11.11% | | | | | | | | | |
| Carnival Corp., units | | | 6,244,100 | | | $ | 245,455 | | | | .75 | % |
| Comcast Corp., Class A | | | 6,919,900 | | | | 358,174 | | | | 1.41 | |
| Comcast Corp., Class A, special nonvoting shares | | | 2,090,000 | | | | 106,653 | | | | | |
| Darden Restaurants, Inc. | | | 5,597,097 | | | | 278,232 | | | | .85 | |
| Home Depot, Inc. | | | 8,376,552 | | | | 666,020 | | | | 2.02 | |
| Johnson Controls, Inc. | | | 7,039,380 | | | | 317,758 | | | | .97 | |
| Mattel, Inc. | | | 6,251,797 | | | | 245,164 | | | | .74 | |
| Time Warner Inc. | | | 3,272,103 | | | | 217,464 | | | | .66 | |
| Williams-Sonoma, Inc. | | | 4,163,000 | | | | 261,520 | | | | .79 | |
| Other securities | | | | | | | 962,036 | | | | 2.92 | |
| | | | | | | | 3,658,476 | | | | 11.11 | |
| | | | | | | | | | | | | |
| Consumer staples 6.63% | | | | | | | | | | | | |
| Coca-Cola Co. | | | 8,168,400 | | | | 333,189 | | | | 1.01 | |
| Kraft Foods Group, Inc. | | | 4,849,766 | | | | 275,758 | | | | .84 | |
| Mondelez International, Inc. | | | 11,278,300 | | | | 402,071 | | | | 1.22 | |
| Procter & Gamble Co. | | | 6,406,400 | | | | 528,848 | | | | 1.60 | |
| Other securities | | | | | | | 644,265 | | | | 1.96 | |
| | | | | | | | 2,184,131 | | | | 6.63 | |
| | | | | | | | | | | | | |
| Health care 13.04% | | | | | | | | | | | | |
| AbbVie Inc. | | | 19,992,000 | | | | 1,041,183 | | | | 3.16 | |
| Amgen Inc. | | | 8,475,748 | | | | 947,165 | | | | 2.87 | |
| Bristol-Myers Squibb Co. | | | 7,550,000 | | | | 378,179 | | | | 1.15 | |
| Johnson & Johnson | | | 2,745,000 | | | | 278,041 | | | | .84 | |
| Merck & Co., Inc. | | | 7,447,485 | | | | 436,125 | | | | 1.32 | |
| Novartis AG (ADR) | | | 3,014,000 | | | | 262,037 | | | | .80 | |
| Pfizer Inc. | | | 8,803,100 | | | | 275,361 | | | | .84 | |
| Other securities | | | | | | | 677,513 | | | | 2.06 | |
| | | | | | | | 4,295,604 | | | | 13.04 | |
| | | | | | | | | | | | | |
| Financials 8.59% | | | | | | | | | | | | |
| JPMorgan Chase & Co. | | | 4,048,700 | | | | 226,646 | | | | .69 | |
| Marsh & McLennan Companies, Inc. | | | 4,296,394 | | | | 211,855 | | | | .64 | |
| Principal Financial Group, Inc. | | | 7,567,000 | | | | 354,438 | | | | 1.08 | |
| Other securities | | | | | | | 2,035,230 | | | | 6.18 | |
| | | | | | | | 2,828,169 | | | | 8.59 | |
| | | | | | | | | | | | | |
| Information technology 9.89% | | | | | | | | | | | | |
| Apple Inc. | | | 880,000 | | | | 519,279 | | | | 1.58 | |
| Automatic Data Processing, Inc. | | | 3,356,300 | | | | 261,657 | | | | .79 | |
| Microsoft Corp. | | | 11,999,607 | | | | 484,784 | | | | 1.47 | |
| Oracle Corp. | | | 7,323,000 | | | | 299,364 | | | | .91 | |
| Texas Instruments Inc. | | | 19,256,322 | | | | 875,200 | | | | 2.66 | |
| Other securities | | | | | | | 817,940 | | | | 2.48 | |
| | | | | | | | 3,258,224 | | | | 9.89 | |
| Common stocks (continued) | | Shares | | | Value
(000) | | | Percent of
net assets | |
| Telecommunication services 4.16% | | | | | | | | | |
| Verizon Communications Inc. | | | 23,866,997 | | | $ | 1,115,305 | | | | 3.38 | % |
| Other securities | | | | | | | 255,884 | | | | .78 | |
| | | | | | | | 1,371,189 | | | | 4.16 | |
| | | | | | | | | | | | | |
| Utilities 7.40% | | | | | | | | | | | | |
| Duke Energy Corp. | | | 3,790,847 | | | | 282,380 | | | | .86 | |
| Exelon Corp. | | | 15,437,720 | | | | 540,783 | | | | 1.64 | |
| FirstEnergy Corp. | | | 7,373,000 | | | | 248,839 | | | | .76 | |
| PG&E Corp. | | | 10,590,000 | | | | 482,692 | | | | 1.46 | |
| Other securities | | | | | | | 882,531 | | | | 2.68 | |
| | | | | | | | 2,437,225 | | | | 7.40 | |
| | | | | | | | | | | | | |
| Miscellaneous 4.20% | | | | | | | | | | | | |
| Other common stocks in initial period of acquisition | | | | | | | 1,384,109 | | | | 4.20 | |
| | | | | | | | | | | | | |
| Total common stocks (cost: $20,957,033,000) | | | | | | | 30,234,081 | | | | 91.79 | |
| Preferred securities 0.03% | | | | | | | | | | | | |
| Other 0.03% | | | | | | | | | | | | |
| Other securities | | | | | | | 11,165 | | | | .03 | |
| | | | | | | | | | | | | |
| Total preferred securities (cost: $10,004,000) | | | | | | | 11,165 | | | | .03 | |
| Bonds, notes & other debt instruments 1.32% | | Principal amount
(000) | | | | | | | |
| Corporate bonds & notes 1.21% | | | | | | | | | |
| Financials 1.13% | | | | | | | | | | | | |
JPMorgan Chase & Co., Series I,
junior subordinated 7.90% (undated)1 | | $ | 123,654 | | | | 140,347 | | | | .43 | |
| Other securities | | | | | | | 232,291 | | | | .70 | |
| | | | | | | | 372,638 | | | | 1.13 | |
| | | | | | | | | | | | | |
| Other corporate bonds & notes 0.08% | | | | | | | | | | | | |
| Other securities | | | | | | | 27,432 | | | | .08 | |
| | | | | | | | | | | | | |
| Total corporate bonds & notes | | | | | | | 400,070 | | | | 1.21 | |
| | | | | | | | | | | | | |
| Other 0.11% | | | | | | | | | | | | |
| Other securities | | | | | | | 34,699 | | | | .11 | |
| | | | | | | | | | | | | |
Total bonds, notes & other debt instruments
(cost: $372,171,000) | | | | | | | 434,769 | | | | 1.32 | |
| Short-term securities 6.81% | | Principal amount
(000) | | | Value
(000) | | | Percent of
net assets | |
| Chevron Corp. 0.08%–0.09% due 5/13–6/11/20142 | | $ | 97,700 | | | $ | 97,688 | | | | .30 | % |
| Coca-Cola Co. 0.11%–0.15% due 5/19–7/17/20142 | | | 175,900 | | | | 175,877 | | | | .53 | |
| Fannie Mae 0.09%–0.14% due 6/2–9/15/2014 | | | 221,000 | | | | 220,982 | | | | .67 | |
| Federal Home Loan Bank 0.05%–0.16% due 5/9–10/17/2014 | | | 412,100 | | | | 412,075 | | | | 1.25 | |
| Freddie Mac 0.07%–0.19% due 5/6–10/29/2014 | | | 617,167 | | | | 617,096 | | | | 1.87 | |
| General Electric Capital Corp. 0.20% due 6/4/2014 | | | 25,000 | | | | 24,998 | | | | .08 | |
| Merck & Co. Inc. 0.08% due 5/22–6/3/20142 | | | 47,000 | | | | 46,998 | | | | .14 | |
| Procter & Gamble Co. 0.09%–0.10% due 5/20–7/21/20142 | | | 187,500 | | | | 187,479 | | | | .57 | |
| Other securities | | | | | | | 459,755 | | | | 1.40 | |
| | | | | | | | | | | | | |
| Total short-term securities (cost: $2,242,754,000) | | | | | | | 2,242,948 | | | | 6.81 | |
| Total investment securities (cost: $23,581,962,000) | | | | | | | 32,922,963 | | | | 99.95 | |
| Other assets less liabilities | | | | | | | 16,378 | | | | .05 | |
| | | | | | | | | | | | | |
| Net assets | | | | | | $ | 32,939,341 | | | | 100.00 | % |
This summary investment portfolio is designed to streamline the report and help investors better focus on the fund’s principal holdings. See the inside back cover for details on how to obtain a complete schedule of portfolio holdings.
As permitted by U.S. Securities and Exchange Commission regulations, “Miscellaneous” securities include holdings in their first year of acquisition that have not previously been publicly disclosed.
“Other securities” includes all issues that are not disclosed separately in the summary investment portfolio. The following footnotes apply to either the individual securities noted or one or more of the securities aggregated and listed as a single line item.
| 1 | | Coupon rate may change periodically. |
| 2 | | Acquired in a transaction exempt from registration under Rule 144A or section 4(2) of the Securities Act of 1933. May be resold in the U.S. in transactions exempt from registration, normally to qualified institutional buyers. The total value of all such securities, including those in “Other securities,” was $703,539,000, which represented 2.14% of the net assets of the fund. |
Key to abbreviation
ADR = American Depositary Receipts
See Notes to Financial Statements
Financial statements
Statement of assets and liabilities
at April 30, 2014 | unaudited
(dollars in thousands) |
| Assets: | | | | | | | | |
| Investment securities, at value (cost: $23,581,962) | | | | | | $ | 32,922,963 | |
| Cash | | | | | | | 2,318 | |
| Receivables for: | | | | | | | | |
| Sales of investments | | $ | 130,190 | | | | | |
| Sales of fund’s shares | | | 27,703 | | | | | |
| Dividends and interest | | | 59,096 | | | | 216,989 | |
| | | | | | | | 33,142,270 | |
| Liabilities: | | | | | | | | |
| Payables for: | | | | | | | | |
| Purchases of investments | | | 158,284 | | | | | |
| Repurchases of fund’s shares | | | 23,691 | | | | | |
| Investment advisory services | | | 6,523 | | | | | |
| Services provided by related parties | | | 11,580 | | | | | |
| Trustees’ deferred compensation | | | 2,778 | | | | | |
| Other | | | 73 | | | | 202,929 | |
| Net assets at April 30, 2014 | | | | | | $ | 32,939,341 | |
| | | | | | | | | |
| Net assets consist of: | | | | | | | | |
| Capital paid in on shares of beneficial interest | | | | | | $ | 22,652,762 | |
| Undistributed net investment income | | | | | | | 60,671 | |
| Undistributed net realized gain | | | | | | | 884,915 | |
| Net unrealized appreciation | | | | | | | 9,340,993 | |
| Net assets at April 30, 2014 | | | | | | $ | 32,939,341 | |
(dollars and shares in thousands, except per-share amounts)
Shares of beneficial interest issued and outstanding (no stated par value) —
unlimited shares authorized (927,126 total shares outstanding)
| | | Net assets | | | Shares
outstanding | | | Net asset
value per share | |
| Class A | | $ | 21,024,070 | | | | 591,202 | | | $ | 35.56 | |
| Class B | | | 125,415 | | | | 3,553 | | | | 35.29 | |
| Class C | | | 1,129,089 | | | | 32,128 | | | | 35.14 | |
| Class F-1 | | | 1,546,754 | | | | 43,652 | | | | 35.43 | |
| Class F-2 | | | 1,517,152 | | | | 42,666 | | | | 35.56 | |
| Class 529-A | | | 657,780 | | | | 18,532 | | | | 35.49 | |
| Class 529-B | | | 12,879 | | | | 364 | | | | 35.40 | |
| Class 529-C | | | 169,004 | | | | 4,785 | | | | 35.32 | |
| Class 529-E | | | 33,782 | | | | 955 | | | | 35.38 | |
| Class 529-F-1 | | | 49,192 | | | | 1,384 | | | | 35.54 | |
| Class R-1 | | | 68,916 | | | | 1,955 | | | | 35.25 | |
| Class R-2 | | | 244,152 | | | | 6,931 | | | | 35.22 | |
| Class R-3 | | | 685,140 | | | | 19,392 | | | | 35.33 | |
| Class R-4 | | | 792,856 | | | | 22,357 | | | | 35.46 | |
| Class R-5 | | | 399,189 | | | | 11,224 | | | | 35.57 | |
| Class R-6 | | | 4,483,971 | | | | 126,046 | | | | 35.57 | |
See Notes to Financial Statements
Statement of operations
for the six months ended April 30, 2014 | unaudited
(dollars in thousands) |
| Investment income: | | | | | | | | |
| Income: | | | | | | | | |
| Dividends (net of non-U.S. taxes of $4,318) | | $ | 396,255 | | | | | |
| Interest | | | 17,160 | | | $ | 413,415 | |
| | | | | | | | | |
| Fees and expenses*: | | | | | | | | |
| Investment advisory services | | | 38,434 | | | | | |
| Distribution services | | | 37,012 | | | | | |
| Transfer agent services | | | 13,850 | | | | | |
| Administrative services | | | 3,795 | | | | | |
| Reports to shareholders | | | 655 | | | | | |
| Registration statement and prospectus | | | 745 | | | | | |
| Trustees’ compensation | | | 443 | | | | | |
| Auditing and legal | | | 20 | | | | | |
| Custodian | | | 116 | | | | | |
| State and local taxes | | | 1 | | | | | |
| Other | | | 536 | | | | 95,607 | |
| Net investment income | | | | | | | 317,808 | |
| | | | | | | | | |
| Net realized gain and unrealized appreciation on investments and currency: | | | | | | | | |
| Net realized gain (loss) on: | | | | | | | | |
| Investments | | | 825,725 | | | | | |
| Currency transactions | | | (117 | ) | | | 825,608 | |
| Net unrealized appreciation (depreciation) on: | | | | | | | | |
| Investments | | | 1,005,783 | | | | | |
| Currency translations | | | (8 | ) | | | 1,005,775 | |
| Net realized gain and unrealized appreciation on investments and currency | | | | | | | 1,831,383 | |
| | | | | | | | | |
| Net increase in net assets resulting from operations | | | | | | $ | 2,149,191 | |
| * | Additional information related to class-specific fees and expenses is included in the Notes to Financial Statements. |
See Notes to Financial Statements
Statements of changes in net assets
(dollars in thousands)
| | | Six months ended
April 30, 2014* | | | Year ended
October 31, 2013 | |
| Operations: | | | | | | | | |
| Net investment income | | $ | 317,808 | | | $ | 593,806 | |
| Net realized gain on investments and currency transactions | | | 825,608 | | | | 803,802 | |
| Net unrealized appreciation on investments and currency translations | | | 1,005,775 | | | | 4,327,852 | |
| Net increase in net assets resulting from operations | | | 2,149,191 | | | | 5,725,460 | |
| | | | | | | | | |
| Dividends and distributions paid to shareholders: | | | | | | | | |
| Dividends from net investment income | | | (316,414 | ) | | | (594,864 | ) |
| Distributions from net realized gain on investments | | | (635,402 | ) | | | — | |
| Total dividends and distributions paid to shareholders | | | (951,816 | ) | | | (594,864 | ) |
| | | | | | | | | |
| Net capital share transactions | | | 1,084,397 | | | | 2,832,912 | |
| | | | | | | | | |
| Total increase in net assets | | | 2,281,772 | | | | 7,963,508 | |
| | | | | | | | | |
| Net assets: | | | | | | | | |
| Beginning of period | | | 30,657,569 | | | | 22,694,061 | |
| End of period (including undistributed net investment income: $60,671 and $59,277, respectively) | | $ | 32,939,341 | | | $ | 30,657,569 | |
See Notes to Financial Statements
| Notes to financial statements | unaudited |
1. Organization
American Mutual Fund (the “fund”) is registered under the Investment Company Act of 1940 as an open-end, diversified management investment company. The fund strives for the balanced accomplishment of three objectives — current income, growth of capital and conservation of principal — through investments in companies that participate in the growth of the American economy.
The fund has 16 share classes consisting of five retail share classes (Classes A, B and C, as well as two F share classes, F-1 and F-2), five 529 college savings plan share classes (Classes 529-A, 529-B, 529-C, 529-E and 529-F-1) and six retirement plan share classes (Classes R-1, R-2, R-3, R-4, R-5 and R-6). The 529 college savings plan share classes can be used to save for college education. The retirement plan share classes are generally offered only through eligible employer-sponsored retirement plans. The fund’s share classes are described further in the following table:
| Share class | | Initial sales charge | | Contingent deferred sales
charge upon redemption | | Conversion feature |
| Classes A and 529-A | | Up to 5.75% | | None (except 1% for certain redemptions within one year of purchase without an initial sales charge) | | None |
| Classes B and 529-B* | | None | | Declines from 5% to 0% for redemptions within six years of purchase | | Classes B and 529-B convert to Classes A and 529-A, respectively, after eight years |
| Class C | | None | | 1% for redemptions within one year of purchase | | Class C converts to Class F-1 after 10 years |
| Class 529-C | | None | | 1% for redemptions within one year of purchase | | None |
| Class 529-E | | None | | None | | None |
| Classes F-1, F-2 and 529-F-1 | | None | | None | | None |
| Classes R-1, R-2, R-3, R-4, R-5 and R-6 | | None | | None | | None |
| * | Class B and 529-B shares of the fund are not available for purchase. |
Holders of all share classes have equal pro rata rights to assets, dividends and liquidation proceeds. Each share class has identical voting rights, except for the exclusive right to vote on matters affecting only its class. Share classes have different fees and expenses (“class-specific fees and expenses”), primarily due to different arrangements for distribution, administrative and shareholder services. Differences in class-specific fees and expenses will result in differences in net investment income and, therefore, the payment of different per-share dividends by each share class.
2. Significant accounting policies
The financial statements have been prepared to comply with accounting principles generally accepted in the United States of America. These principles require management to make estimates and assumptions that affect reported amounts and disclosures. Actual results could differ from those estimates. The fund follows the significant accounting policies described in this section, as well as the valuation policies described in the next section on valuation.
Security transactions and related investment income — Security transactions are recorded by the fund as of the date the trades are executed with brokers. Realized gains and losses from security transactions are determined based on the specific identified cost of the securities. In the event a security is purchased with a delayed payment date, the fund will segregate liquid assets sufficient to meet its payment obligations. Dividend income is recognized on the ex-dividend date and interest income is recognized on an accrual basis. Market discounts, premiums and original issue discounts on fixed-income securities are amortized daily over the expected life of the security.
Class allocations — Income, fees and expenses (other than class-specific fees and expenses) and realized and unrealized gains and losses are allocated daily among the various share classes based on their relative net assets. Class-specific fees and expenses, such as distribution, administrative and shareholder services, are charged directly to the respective share class.
Dividends and distributions to shareholders — Dividends and distributions to shareholders are recorded on the ex-dividend date.
Currency translation — Assets and liabilities, including investment securities, denominated in currencies other than U.S. dollars are translated into U.S. dollars at the exchange rates supplied by one or more pricing vendors on the valuation date. Purchases and sales of investment securities and income and expenses are translated into U.S. dollars at the exchange rates on the dates of such transactions. The effects of changes in exchange rates on investment securities are included with the net realized gain or loss and net unrealized appreciation or depreciation on investments in the fund’s statement of operations. The realized gain or loss and unrealized appreciation or depreciation resulting from all other transactions denominated in currencies other than U.S. dollars are disclosed separately.
3. Valuation
Capital Research and Management Company (“CRMC”), the fund’s investment adviser, values the fund’s investments at fair value as defined by accounting principles generally accepted in the United States of America. The net asset value of each share class of the fund is generally determined as of approximately 4:00 p.m. New York time each day the New York Stock Exchange is open.
Methods and inputs — The fund’s investment adviser uses the following methods and inputs to establish the fair value of the fund’s assets and liabilities. Use of particular methods and inputs may vary over time based on availability and relevance as market and economic conditions evolve.
Equity securities are generally valued at the official closing price of, or the last reported sale price on, the exchange or market on which such securities are traded, as of the close of business on the day the securities are being valued or, lacking any sales, at the last available bid price. Prices for each security are taken from the principal exchange or market on which the security trades.
Fixed-income securities, including short-term securities purchased with more than 60 days left to maturity, are generally valued at prices obtained from one or more pricing vendors. Vendors value such securities based on one or more of the inputs described in the following table. The table provides examples of inputs that are commonly relevant for valuing particular classes of fixed-income securities in which the fund is authorized to invest. However, these classifications are not exclusive, and any of the inputs may be used to value any other class of fixed-income security.
| Fixed-income class | | Examples of standard inputs |
| All | | Benchmark yields, transactions, bids, offers, quotations from dealers and trading systems, new issues, spreads and other relationships observed in the markets among comparable securities; and proprietary pricing models such as yield measures calculated using factors such as cash flows, financial or collateral performance and other reference data (collectively referred to as “standard inputs”) |
| Corporate bonds & notes; convertible securities | | Standard inputs and underlying equity of the issuer |
| Bonds & notes of governments & government agencies | | Standard inputs and interest rate volatilities |
| Mortgage-backed; asset-backed obligations | | Standard inputs and cash flows, prepayment information, default rates, delinquency and loss assumptions, collateral characteristics, credit enhancements and specific deal information |
When the fund’s investment adviser deems it appropriate to do so (such as when vendor prices are unavailable or not deemed to be representative), fixed-income securities will be valued in good faith at the mean quoted bid and ask prices that are reasonably and timely available (or bid prices, if ask prices are not available) or at prices for securities of comparable maturity, quality and type.
Securities with both fixed-income and equity characteristics, or equity securities traded principally among fixed-income dealers, are generally valued in the manner described for either equity or fixed-income securities, depending on which method is deemed most appropriate by the fund’s investment adviser. Short-term securities
purchased within 60 days to maturity are valued at amortized cost, which approximates fair value. The value of short-term securities originally purchased with maturities greater than 60 days is determined based on an amortized value to par when they reach 60 days.
Securities and other assets for which representative market quotations are not readily available or are considered unreliable by the fund’s investment adviser are fair valued as determined in good faith under fair valuation guidelines adopted by authority of the fund’s board of trustees as further described. The investment adviser follows fair valuation guidelines, consistent with U.S. Securities and Exchange Commission rules and guidance, to consider relevant principles and factors when making fair value determinations. The investment adviser considers relevant indications of value that are reasonably and timely available to it in determining the fair value to be assigned to a particular security, such as the type and cost of the security; contractual or legal restrictions on resale of the security; relevant financial or business developments of the issuer; actively traded similar or related securities; conversion or exchange rights on the security; related corporate actions; significant events occurring after the close of trading in the security; and changes in overall market conditions. Fair valuations and valuations of investments that are not actively trading involve judgment and may differ materially from valuations that would have been used had greater market activity occurred.
Processes and structure — The fund’s board of trustees has delegated authority to the fund’s investment adviser to make fair value determinations, subject to board oversight. The investment adviser has established a Joint Fair Valuation Committee (the “Fair Valuation Committee”) to administer, implement and oversee the fair valuation process, and to make fair value decisions. The Fair Valuation Committee regularly reviews its own fair value decisions, as well as decisions made under its standing instructions to the investment adviser’s valuation teams. The Fair Valuation Committee reviews changes in fair value measurements from period to period and may, as deemed appropriate, update the fair valuation guidelines to better reflect the results of back testing and address new or evolving issues. The Fair Valuation Committee reports any changes to the fair valuation guidelines to the board of trustees with supplemental information to support the changes. The fund’s board and audit committee also regularly review reports that describe fair value determinations and methods.
The fund’s investment adviser has also established a Fixed-Income Pricing Review Group to administer and oversee the fixed-income valuation process, including the use of fixed-income pricing vendors. This group regularly reviews pricing vendor information and market data. Pricing decisions, processes and controls over security valuation are also subject to additional internal reviews, including an annual control self-evaluation program facilitated by the investment adviser’s compliance group.
Classifications — The fund’s investment adviser classifies the fund’s assets and liabilities into three levels based on the inputs used to value the assets or liabilities. Level 1 values are based on quoted prices in active markets for identical securities. Level 2 values are based on significant observable market inputs, such as quoted prices for
similar securities and quoted prices in inactive markets. Level 3 values are based on significant unobservable inputs that reflect the investment adviser’s determination of assumptions that market participants might reasonably use in valuing the securities. The valuation levels are not necessarily an indication of the risk or liquidity associated with the underlying investment. For example, U.S. government securities are reflected as Level 2 because the inputs used to determine fair value may not always be quoted prices in an active market. The following table presents the fund’s valuation levels as of April 30, 2014 (dollars in thousands):
| | | Investment securities | |
| | | Level 1 | | | Level 2 | | | Level 3 | | | Total | |
| Assets: | | | | | | | | | | | | | | | | |
| Common stocks: | | | | | | | | | | | | | | | | |
| Energy | | $ | 2,231,658 | | | $ | — | | | $ | — | | | $ | 2,231,658 | |
| Materials | | | 1,667,700 | | | | — | | | | — | | | | 1,667,700 | |
| Industrials | | | 4,917,596 | | | | — | | | | — | | | | 4,917,596 | |
| Consumer discretionary | | | 3,658,476 | | | | — | | | | — | | | | 3,658,476 | |
| Consumer staples | | | 2,184,131 | | | | — | | | | — | | | | 2,184,131 | |
| Health care | | | 4,295,604 | | | | — | | | | — | | | | 4,295,604 | |
| Financials | | | 2,828,169 | | | | — | | | | — | | | | 2,828,169 | |
| Information technology | | | 3,258,224 | | | | — | | | | — | | | | 3,258,224 | |
| Telecommunication services | | | 1,371,189 | | | | — | | | | — | | | | 1,371,189 | |
| Utilities | | | 2,437,225 | | | | — | | | | — | | | | 2,437,225 | |
| Miscellaneous | | | 1,384,109 | | | | — | | | | — | | | | 1,384,109 | |
| Preferred securities | | | 11,165 | | | | — | | | | — | | | | 11,165 | |
| Bonds, notes & other debt instruments | | | — | | | | 434,769 | | | | — | | | | 434,769 | |
| Short-term securities | | | — | | | | 2,242,948 | | | | — | | | | 2,242,948 | |
| Total | | $ | 30,245,246 | | | $ | 2,677,717 | | | $ | — | | | $ | 32,922,963 | |
4. Risk factors
Investing in the fund may involve certain risks including, but not limited to, those described below.
Market conditions — The prices of, and the income generated by, the common stocks and other securities held by the fund may decline due to market conditions and other factors, including those directly involving the issuers of securities held by the fund.
Investing in growth-oriented stocks — Growth-oriented stocks may involve larger price swings and greater potential for loss than other types of investments.
Investing in income-oriented stocks — Income provided by the fund may be reduced by changes in the dividend policies of, and the capital resources available at, the companies in which the fund invests.
Investing in bonds — Rising interest rates will generally cause the prices of bonds and other debt securities to fall. Longer maturity debt securities may be subject to greater
price fluctuations than shorter maturity debt securities. In addition, falling interest rates may cause an issuer to redeem, call or refinance a debt security before its stated maturity, which may result in the fund having to reinvest the proceeds in lower yielding securities.
Bonds and other debt securities are subject to credit risk, which is the possibility that the credit strength of an issuer will weaken and/or an issuer of a debt security will fail to make timely payments of principal or interest and the security will go into default. Lower quality debt securities generally have higher rates of interest and may be subject to greater price fluctuations than higher quality debt securities. Credit risk is gauged, in part, by the credit ratings of the debt securities in which the fund invests. However, ratings are only the opinions of the rating agencies issuing them and are not guarantees as to credit quality or an evaluation of market risk. The fund’s investment adviser relies on its own credit analysts to research issuers and issues in seeking to mitigate various credit and default risks.
Management — The investment adviser to the fund actively manages the fund’s investments. Consequently, the fund is subject to the risk that the methods and analyses employed by the investment adviser in this process may not produce the desired results. This could cause the fund to lose value or its investment results to lag relevant benchmarks or other funds with similar objectives.
5. Taxation and distributions
Federal income taxation — The fund complies with the requirements under Subchapter M of the Internal Revenue Code applicable to mutual funds and intends to distribute substantially all of its net taxable income and net capital gains each year. The fund is not subject to income taxes to the extent such distributions are made. Therefore, no federal income tax provision is required.
As of and during the period ended April 30, 2014, the fund did not have a liability for any unrecognized tax benefits. The fund recognizes interest and penalties, if any, related to unrecognized tax benefits as income tax expense in the statement of operations. During the period, the fund did not incur any interest or penalties.
The fund is not subject to examination by U.S. federal tax authorities for tax years before 2009 and by state tax authorities for tax years before 2008.
Non-U.S. taxation — Dividend and interest income are recorded net of non-U.S. taxes paid.
Distributions — Distributions paid to shareholders are based on net investment income and net realized gains determined on a tax basis, which may differ from net investment income and net realized gains for financial reporting purposes. These differences are due primarily to different treatment for items such as currency gains and losses; short-term capital gains and losses; capital losses related to sales of certain securities within 30 days of purchase; cost of investments sold; and income on certain investments.
The fiscal year in which amounts are distributed may differ from the year in which the net investment income and net realized gains are recorded by the fund for financial reporting purposes.
The components of distributable earnings on a tax basis are reported as of the fund’s most recent year-end. As of October 31, 2013, the fund had tax basis undistributed ordinary income of $63,133,000, and undistributed long-term capital gains of $635,053,000.
As of April 30, 2014, the tax basis unrealized appreciation (depreciation) and cost of investment securities were as follows (dollars in thousands):
| Gross unrealized appreciation on investment securities | | $ | 9,560,236 | |
| Gross unrealized depreciation on investment securities | | | (176,839 | ) |
| Net unrealized appreciation on investment securities | | | 9,383,397 | |
| Cost of investment securities | | | 23,539,566 | |
The tax character of distributions paid to shareholders was as follows (dollars in thousands):
| | | Six months ended April 30, 2014 | | | Year ended October 31, 2013 | |
| Share class | | Ordinary
income | | | Long-term
capital
gains | | | Total
distributions
paid | | | Ordinary
income | | | Long-term
capital
gains | | | Total
distributions
paid | |
| Class A | | $ | 203,674 | | | $ | 407,841 | | | $ | 611,515 | | | $ | 392,941 | | | $ | — | | | $ | 392,941 | |
| Class B | | | 846 | | | | 3,006 | | | | 3,852 | | | | 2,540 | | | | — | | | | 2,540 | |
| Class C | | | 6,753 | | | | 22,339 | | | | 29,092 | | | | 14,036 | | | | — | | | | 14,036 | |
| Class F-1 | | | 14,284 | | | | 29,231 | | | | 43,515 | | | | 26,052 | | | | — | | | | 26,052 | |
| Class F-2 | | | 15,640 | | | | 28,597 | | | | 44,237 | | | | 30,086 | | | | — | | | | 30,086 | |
| Class 529-A | | | 6,030 | | | | 12,676 | | | | 18,706 | | | | 11,614 | | | | — | | | | 11,614 | |
| Class 529-B | | | 74 | | | | 301 | | | | 375 | | | | 231 | | | | — | | | | 231 | |
| Class 529-C | | | 935 | | | | 3,299 | | | | 4,234 | | | | 1,989 | | | | — | | | | 1,989 | |
| Class 529-E | | | 275 | | | | 671 | | | | 946 | | | | 550 | | | | — | | | | 550 | |
| Class 529-F-1 | | | 499 | | | | 954 | | | | 1,453 | | | | 909 | | | | — | | | | 909 | |
| Class R-1 | | | 415 | | | | 1,414 | | | | 1,829 | | | | 892 | | | | — | | | | 892 | |
| Class R-2 | | | 1,450 | | | | 4,861 | | | | 6,311 | | | | 3,236 | | | | — | | | | 3,236 | |
| Class R-3 | | | 5,559 | | | | 13,544 | | | | 19,103 | | | | 11,263 | | | | — | | | | 11,263 | |
| Class R-4 | | | 7,409 | | | | 15,209 | | | | 22,618 | | | | 13,447 | | | | — | | | | 13,447 | |
| Class R-5 | | | 4,288 | | | | 7,665 | | | | 11,953 | | | | 9,364 | | | | — | | | | 9,364 | |
| Class R-6 | | | 48,283 | | | | 83,794 | | | | 132,077 | | | | 75,714 | | | | — | | | | 75,714 | |
| Total | | $ | 316,414 | | | $ | 635,402 | | | $ | 951,816 | | | $ | 594,864 | | | $ | — | | | $ | 594,864 | |
6. Fees and transactions with related parties
CRMC, the fund’s investment adviser, is the parent company of American Funds Distributors,® Inc. (“AFD”), the principal underwriter of the fund’s shares, and American Funds Service Company® (“AFS”), the fund’s transfer agent. CRMC, AFD and AFS are considered related parties to the fund.
Investment advisory services — The fund has an investment advisory and service agreement with CRMC that provides for monthly fees accrued daily. These fees are based on a series of decreasing annual rates beginning with 0.384% on the first $1 billion of daily net assets and decreasing to 0.225% on such assets in excess of $21 billion. For the six months ended April 30, 2014, the investment advisory services fee was $38,434,000, which was equivalent to an annualized rate of 0.245% of average daily net assets.
Class-specific fees and expenses — Expenses that are specific to individual share classes are accrued directly to the respective share class. The principal class-specific fees and expenses are further described below:
Distribution services — The fund has plans of distribution for all share classes, except Class F-2, R-5 and R-6 shares. Under the plans, the board of trustees approves certain categories of expenses that are used to finance activities primarily intended to sell fund shares and service existing accounts. The plans provide for payments, based on an annualized percentage of average daily net assets, ranging from 0.25% to 1.00% as noted in this section. In some cases, the board of trustees has limited the amounts that may be paid to less than the maximum allowed by the plans. All share classes with a plan may use up to 0.25% of average daily net assets to pay service fees, or to compensate AFD for paying service fees, to firms that have entered into agreements with AFD to provide certain shareholder services. The remaining amounts available to be paid under each plan are paid to dealers to compensate them for their sales activities.
For Class A and 529-A shares, distribution-related expenses include the reimbursement of dealer and wholesaler commissions paid by AFD for certain shares sold without a sales charge. These share classes reimburse AFD for amounts billed within the prior 15 months but only to the extent that the overall annual expense limit of 0.25% is not exceeded. As of April 30, 2014, there were no unreimbursed expenses subject to reimbursement for Class A or 529-A shares.
| Share class | | Currently approved limits | | Plan limits |
| Class A | | | 0.25 | % | | | 0.25 | % |
| Class 529-A | | | 0.25 | | | | 0.50 | |
| Classes B and 529-B | | | 1.00 | | | | 1.00 | |
| Classes C, 529-C and R-1 | | | 1.00 | | | | 1.00 | |
| Class R-2 | | | 0.75 | | | | 1.00 | |
| Classes 529-E and R-3 | | | 0.50 | | | | 0.75 | |
| Classes F-1, 529-F-1 and R-4 | | | 0.25 | | | | 0.50 | |
Transfer agent services — The fund has a shareholder services agreement with AFS under which the fund compensates AFS for providing transfer agent services to each of the fund’s share classes. These services include recordkeeping, shareholder communications and transaction processing. In addition, the fund reimburses AFS for amounts paid to third parties for performing transfer agent services on behalf of fund shareholders.
Administrative services — The fund has an administrative services agreement with CRMC under which the fund compensates CRMC for providing administrative services to Class A, C, F, 529 and R shares. These services include, but are not limited to, coordinating, monitoring, assisting and overseeing third parties that provide services to fund shareholders. Under the agreement, Class A shares pay an annual fee of 0.01% and Class C, F, 529 and R shares pay an annual fee of 0.05% of their respective average daily net assets.
529 plan services — Each 529 share class is subject to service fees to compensate the Commonwealth of Virginia for the maintenance of the 529 college savings plan. During the period November 1, 2013, to March 31, 2014, the quarterly fee was based on a series of decreasing annual rates beginning with 0.10% on the first $30 billion of the net assets invested in Class 529 shares of the American Funds and decreasing to 0.06% on such assets between $120 billion and $150 billion. Effective April 1, 2014, the quarterly fee was amended to provide for reduced annual rates of 0.07%, 0.06% and 0.05% over $30 billion, $50 billion and $70 billion, respectively, of the net assets invested in Class 529 shares of the American Funds. The fee for any given calendar quarter is accrued and calculated on the basis of the average net assets of Class 529 shares of the American Funds for the last month of the prior calendar quarter. The fee is included in other expenses in the fund’s statement of operations. The Commonwealth of Virginia is not considered a related party.
For the six months ended April 30, 2014, class-specific expenses under the agreements were as follows (dollars in thousands):
| Share class | | Distribution
services | | Transfer agent
services | | Administrative
services | | 529 plan
services |
| Class A | | | $23,613 | | | | $9,722 | | | | $1,007 | | | | Not applicable |
| Class B | | | 695 | | | | 73 | | | | Not applicable | | | | Not applicable |
| Class C | | | 5,441 | | | | 538 | | | | 273 | | | | Not applicable |
| Class F-1 | | | 1,810 | | | | 828 | | | | 363 | | | | Not applicable |
| Class F-2 | | | Not applicable | | | | 858 | | | | 355 | | | | Not applicable |
| Class 529-A | | | 688 | | | | 244 | | | | 157 | | | | $300 |
| Class 529-B | | | 69 | | | | 7 | | | | 4 | | | | 7 |
| Class 529-C | | | 804 | | | | 68 | | | | 40 | | | | 78 |
| Class 529-E | | | 82 | | | | 8 | | | | 8 | | | | 16 |
| Class 529-F-1 | | | — | | | | 18 | | | | 12 | | | | 22 |
| Class R-1 | | | 339 | | | | 42 | | | | 17 | | | | Not applicable |
| Class R-2 | | | 878 | | | | 432 | | | | 59 | | | | Not applicable |
| Class R-3 | | | 1,653 | | | | 511 | | | | 165 | | | | Not applicable |
| Class R-4 | | | 940 | | | | 388 | | | | 189 | | | | Not applicable |
| Class R-5 | | | Not applicable | | | | 107 | | | | 97 | | | | Not applicable |
| Class R-6 | | | Not applicable | | | | 6 | | | | 1,049 | | | | Not applicable |
| Total class-specific expenses | | | $37,012 | | | | $13,850 | | | | $3,795 | | | | $423 |
Trustees’ deferred compensation — Trustees who are unaffiliated with CRMC may elect to defer the cash payment of part or all of their compensation. These deferred amounts, which remain as liabilities of the fund, are treated as if invested in shares of the fund or other American Funds. These amounts represent general, unsecured liabilities of the fund and vary according to the total returns of the selected funds. Trustees’ compensation of $443,000 in the fund’s statement of operations includes $219,000 in current fees (either paid in cash or deferred) and a net increase of $224,000 in the value of the deferred amounts.
Affiliated officers and trustees — Officers and certain trustees of the fund are or may be considered to be affiliated with CRMC, AFD and AFS. No affiliated officers or trustees received any compensation directly from the fund.
7. Capital share transactions
Capital share transactions in the fund were as follows (dollars and shares in thousands):
| | | Sales* | | | Reinvestments
of dividends
and distributions | | | Repurchases* | | | Net increase
(decrease) | |
| Share class | | Amount | | | Shares | | | Amount | | | Shares | | | Amount | | | Shares | | | Amount | | | Shares | |
| | | | | | | | |
| Six months ended April 30, 2014 | | | | | | | |
| | | | | | | | |
| Class A | | $ | 1,040,037 | | | | 30,041 | | | $ | 595,087 | | | | 17,346 | | | $ | (1,100,398 | ) | | | (31,772 | ) | | $ | 534,726 | | | | 15,615 | |
| Class B | | | 3,016 | | | | 88 | | | | 3,824 | | | | 112 | | | | (39,926 | ) | | | (1,162 | ) | | | (33,086 | ) | | | (962 | ) |
| Class C | | | 110,007 | | | | 3,215 | | | | 28,679 | | | | 846 | | | | (126,962 | ) | | | (3,708 | ) | | | 11,724 | | | | 353 | |
| Class F-1 | | | 198,418 | | | | 5,749 | | | | 42,791 | | | | 1,252 | | | | (146,700 | ) | | | (4,248 | ) | | | 94,509 | | | | 2,753 | |
| Class F-2 | | | 210,010 | | | | 6,060 | | | | 42,962 | | | | 1,253 | | | | (139,456 | ) | | | (4,029 | ) | | | 113,516 | | | | 3,284 | |
| Class 529-A | | | 43,064 | | | | 1,247 | | | | 18,696 | | | | 546 | | | | (38,455 | ) | | | (1,113 | ) | | | 23,305 | | | | 680 | |
| Class 529-B | | | 298 | | | | 9 | | | | 375 | | | | 11 | | | | (4,039 | ) | | | (117 | ) | | | (3,366 | ) | | | (97 | ) |
| Class 529-C | | | 11,236 | | | | 327 | | | | 4,232 | | | | 124 | | | | (11,158 | ) | | | (324 | ) | | | 4,310 | | | | 127 | |
| Class 529-E | | | 2,344 | | | | 68 | | | | 944 | | | | 28 | | | | (3,115 | ) | | | (91 | ) | | | 173 | | | | 5 | |
| Class 529-F-1 | | | 6,749 | | | | 195 | | | | 1,428 | | | | 41 | | | | (6,318 | ) | | | (183 | ) | | | 1,859 | | | | 53 | |
| Class R-1 | | | 9,370 | | | | 272 | | | | 1,822 | | | | 54 | | | | (12,300 | ) | | | (358 | ) | | | (1,108 | ) | | | (32 | ) |
| Class R-2 | | | 28,246 | | | | 823 | | | | 6,307 | | | | 185 | | | | (34,474 | ) | | | (1,004 | ) | | | 79 | | | | 4 | |
| Class R-3 | | | 80,783 | | | | 2,346 | | | | 19,083 | | | | 560 | | | | (90,174 | ) | | | (2,614 | ) | | | 9,692 | | | | 292 | |
| Class R-4 | | | 75,252 | | | | 2,179 | | | | 22,570 | | | | 660 | | | | (65,904 | ) | | | (1,907 | ) | | | 31,918 | | | | 932 | |
| Class R-5 | | | 34,880 | | | | 1,005 | | | | 11,952 | | | | 349 | | | | (77,285 | ) | | | (2,237 | ) | | | (30,453 | ) | | | (883 | ) |
| Class R-6 | | | 416,846 | | | | 12,051 | | | | 131,537 | | | | 3,833 | | | | (221,784 | ) | | | (6,356 | ) | | | 326,599 | | | | 9,528 | |
| Total net increase (decrease) | | $ | 2,270,556 | | | | 65,675 | | | $ | 932,289 | | | | 27,200 | | | $ | (2,118,448 | ) | | | (61,223 | ) | | $ | 1,084,397 | | | | 31,652 | |
| | | Sales* | | | Reinvestments
of dividends | | | Repurchases* | | | Net increase
(decrease) | |
| Share class | | Amount | | | Shares | | | Amount | | | Shares | | | Amount | | | Shares | | | Amount | | | Shares | |
| | | | | | | | | | | | | | | | | | | |
| Year ended October 31, 2013 | | | | | | | | | | | | | | | | | | |
| | | | | | | | | | | | | | | | | | | |
| Class A | | $ | 2,419,804 | | | | 77,415 | | | $ | 378,269 | | | | 12,246 | | | $ | (2,114,231 | ) | | | (68,599 | ) | | $ | 683,842 | | | | 21,062 | |
| Class B | | | 9,697 | | | | 314 | | | | 2,521 | | | | 83 | | | | (87,603 | ) | | | (2,866 | ) | | | (75,385 | ) | | | (2,469 | ) |
| Class C | | | 230,803 | | | | 7,435 | | | | 13,753 | | | | 451 | | | | (203,258 | ) | | | (6,619 | ) | | | 41,298 | | | | 1,267 | |
| Class F-1 | | | 444,684 | | | | 14,342 | | | | 25,320 | | | | 821 | | | | (301,307 | ) | | | (9,749 | ) | | | 168,697 | | | | 5,414 | |
| Class F-2 | | | 502,255 | | | | 16,443 | | | | 28,299 | | | | 920 | | | | (625,453 | ) | | | (20,341 | ) | | | (94,899 | ) | | | (2,978 | ) |
| Class 529-A | | | 92,459 | | | | 2,993 | | | | 11,611 | | | | 377 | | | | (69,923 | ) | | | (2,268 | ) | | | 34,147 | | | | 1,102 | |
| Class 529-B | | | 754 | | | | 24 | | | | 231 | | | | 8 | | | | (7,938 | ) | | | (260 | ) | | | (6,953 | ) | | | (228 | ) |
| Class 529-C | | | 24,802 | | | | 807 | | | | 1,989 | | | | 65 | | | | (21,946 | ) | | | (712 | ) | | | 4,845 | | | | 160 | |
| Class 529-E | | | 5,104 | | | | 166 | | | | 550 | | | | 18 | | | | (4,305 | ) | | | (141 | ) | | | 1,349 | | | | 43 | |
| Class 529-F-1 | | | 11,230 | | | | 364 | | | | 909 | | | | 30 | | | | (5,807 | ) | | | (191 | ) | | | 6,332 | | | | 203 | |
| Class R-1 | | | 17,446 | | | | 562 | | | | 889 | | | | 29 | | | | (20,138 | ) | | | (661 | ) | | | (1,803 | ) | | | (70 | ) |
| Class R-2 | | | 63,877 | | | | 2,079 | | | | 3,230 | | | | 106 | | | | (68,568 | ) | | | (2,229 | ) | | | (1,461 | ) | | | (44 | ) |
| Class R-3 | | | 172,669 | | | | 5,630 | | | | 11,234 | | | | 366 | | | | (163,563 | ) | | | (5,338 | ) | | | 20,340 | | | | 658 | |
| Class R-4 | | | 262,750 | | | | 8,515 | | | | 13,437 | | | | 435 | | | | (149,223 | ) | | | (4,806 | ) | | | 126,964 | | | | 4,144 | |
| Class R-5 | | | 119,918 | | | | 3,931 | | | | 9,364 | | | | 303 | | | | (97,182 | ) | | | (3,127 | ) | | | 32,100 | | | | 1,107 | |
| Class R-6 | | | 2,014,074 | | | | 66,359 | | | | 75,328 | | | | 2,412 | | | | (195,903 | ) | | | (6,192 | ) | | | 1,893,499 | | | | 62,579 | |
| Total net increase (decrease) | | $ | 6,392,326 | | | | 207,379 | | | $ | 576,934 | | | | 18,670 | | | $ | (4,136,348 | ) | | | (134,099 | ) | | $ | 2,832,912 | | | | 91,950 | |
| * | Includes exchanges between share classes of the fund. |
8. Investment transactions
The fund made purchases and sales of investment securities, excluding short-term securities and U.S. government obligations, if any, of $3,678,968,000 and $3,156,191,000, respectively, during the six months ended April 30, 2014.
Financial highlights
| | | | | | | | Income from investment operations1 | |
| | | | | Net asset
value,
beginning
of period | | | Net
Investment
income | | | Net gains
on securities
(both realized
and unrealized) | | | Total from
Investment
operations | |
| Class A: | | Six months ended 4/30/20144,5 | | $ | 34.27 | | | $ | .35 | | | $ | 2.00 | | | $ | 2.35 | |
| | | Year ended 10/31/2013 | | | 28.27 | | | | .70 | | | | 6.00 | | | | 6.70 | |
| | | Year ended 10/31/2012 | | | 25.41 | | | | .66 | | | | 2.87 | | | | 3.53 | |
| | | Year ended 10/31/2011 | | | 24.38 | | | | .66 | | | | 1.00 | | | | 1.66 | |
| | | Year ended 10/31/2010 | | | 21.57 | | | | .62 | | | | 2.86 | | | | 3.48 | |
| | | Year ended 10/31/2009 | | | 20.20 | | | | .59 | | | | 1.56 | | | | 2.15 | |
| Class B: | | Six months ended 4/30/20144,5 | | | 34.01 | | | | .22 | | | | 1.98 | | | | 2.20 | |
| | | Year ended 10/31/2013 | | | 28.05 | | | | .47 | | | | 5.94 | | | | 6.41 | |
| | | Year ended 10/31/2012 | | | 25.21 | | | | .46 | | | | 2.83 | | | | 3.29 | |
| | | Year ended 10/31/2011 | | | 24.19 | | | | .46 | | | | .99 | | | | 1.45 | |
| | | Year ended 10/31/2010 | | | 21.41 | | | | .44 | | | | 2.83 | | | | 3.27 | |
| | | Year ended 10/31/2009 | | | 20.05 | | | | .44 | | | | 1.56 | | | | 2.00 | |
| Class C: | | Six months ended 4/30/20144,5 | | | 33.88 | | | | .21 | | | | 1.97 | | | | 2.18 | |
| | | Year ended 10/31/2013 | | | 27.96 | | | | .44 | | | | 5.94 | | | | 6.38 | |
| | | Year ended 10/31/2012 | | | 25.14 | | | | .44 | | | | 2.84 | | | | 3.28 | |
| | | Year ended 10/31/2011 | | | 24.13 | | | | .44 | | | | 1.00 | | | | 1.44 | |
| | | Year ended 10/31/2010 | | | 21.36 | | | | .43 | | | | 2.82 | | | | 3.25 | |
| | | Year ended 10/31/2009 | | | 20.01 | | | | .43 | | | | 1.55 | | | | 1.98 | |
| Class F-1: | | Six months ended 4/30/20144,5 | | | 34.15 | | | | .34 | | | | 1.99 | | | | 2.33 | |
| | | Year ended 10/31/2013 | | | 28.18 | | | | .68 | | | | 5.98 | | | | 6.66 | |
| | | Year ended 10/31/2012 | | | 25.33 | | | | .65 | | | | 2.86 | | | | 3.51 | |
| | | Year ended 10/31/2011 | | | 24.31 | | | | .64 | | | | 1.00 | | | | 1.64 | |
| | | Year ended 10/31/2010 | | | 21.51 | | | | .61 | | | | 2.85 | | | | 3.46 | |
| | | Year ended 10/31/2009 | | | 20.14 | | | | .59 | | | | 1.56 | | | | 2.15 | |
| Class F-2: | | Six months ended 4/30/20144,5 | | | 34.27 | | | | .38 | | | | 2.00 | | | | 2.38 | |
| | | Year ended 10/31/2013 | | | 28.27 | | | | .76 | | | | 6.00 | | | | 6.76 | |
| | | Year ended 10/31/2012 | | | 25.41 | | | | .70 | | | | 2.88 | | | | 3.58 | |
| | | Year ended 10/31/2011 | | | 24.38 | | | | .70 | | | | 1.01 | | | | 1.71 | |
| | | Year ended 10/31/2010 | | | 21.57 | | | | .65 | | | | 2.88 | | | | 3.53 | |
| | | Year ended 10/31/2009 | | | 20.20 | | | | .58 | | | | 1.63 | | | | 2.21 | |
| Dividends and distributions | | | | | | | | | | | | | | | | | | | |
Dividends
(from net
investment
income) | | | Distributions
(from capital
gains) | | | Total
dividends
and
distributions | | | Net asset
value, end
of period | | | Total
return2,3 | | | Net assets,
end of period
(in millions) | | | Ratio of
expenses to
average net
assets before
waivers | | | Ratio of
expenses to
average net
assets after
waivers3 | | | Ratio of
net income
to average
net assets3 | |
| $ | (.35 | ) | | $ | (.71 | ) | | $ | (1.06 | ) | | $ | 35.56 | | | | 6.98 | % | | $ | 21,024 | | | | .60 | %6 | | | .60 | %6 | | | 2.03 | %6 |
| | (.70 | ) | | | — | | | | (.70 | ) | | | 34.27 | | | | 24.01 | | | | 19,724 | | | | .61 | | | | .61 | | | | 2.25 | |
| | (.67 | ) | | | — | | | | (.67 | ) | | | 28.27 | | | | 14.02 | | | | 15,677 | | | | .63 | | | | .63 | | | | 2.44 | |
| | (.63 | ) | | | — | | | | (.63 | ) | | | 25.41 | | | | 6.85 | | | | 13,549 | | | | .62 | | | | .62 | | | | 2.57 | |
| | (.67 | ) | | | — | | | | (.67 | ) | | | 24.38 | | | | 16.31 | | | | 13,051 | | | | .63 | | | | .63 | | | | 2.69 | |
| | (.72 | ) | | | (.06 | ) | | | (.78 | ) | | | 21.57 | | | | 11.27 | | | | 11,862 | | | | .67 | | | | .66 | | | | 3.05 | |
| | (.21 | ) | | | (.71 | ) | | | (.92 | ) | | | 35.29 | | | | 6.58 | | | | 125 | | | | 1.36 | 6 | | | 1.36 | 6 | | | 1.29 | 6 |
| | (.45 | ) | | | — | | | | (.45 | ) | | | 34.01 | | | | 23.06 | | | | 154 | | | | 1.38 | | | | 1.38 | | | | 1.52 | |
| | (.45 | ) | | | — | | | | (.45 | ) | | | 28.05 | | | | 13.16 | | | | 196 | | | | 1.39 | | | | 1.39 | | | | 1.71 | |
| | (.43 | ) | | | — | | | | (.43 | ) | | | 25.21 | | | | 6.01 | | | | 275 | | | | 1.39 | | | | 1.39 | | | | 1.81 | |
| | (.49 | ) | | | — | | | | (.49 | ) | | | 24.19 | | | | 15.40 | | | | 369 | | | | 1.40 | | | | 1.40 | | | | 1.93 | |
| | (.58 | ) | | | (.06 | ) | | | (.64 | ) | | | 21.41 | | | | 10.45 | | | | 426 | | | | 1.45 | | | | 1.44 | | | | 2.29 | |
| | (.21 | ) | | | (.71 | ) | | | (.92 | ) | | | 35.14 | | | | 6.54 | | | | 1,129 | | | | 1.40 | 6 | | | 1.40 | 6 | | | 1.23 | 6 |
| | (.46 | ) | | | — | | | | (.46 | ) | | | 33.88 | | | | 23.01 | | | | 1,076 | | | | 1.42 | | | | 1.42 | | | | 1.44 | |
| | (.46 | ) | | | — | | | | (.46 | ) | | | 27.96 | | | | 13.13 | | | | 853 | | | | 1.43 | | | | 1.43 | | | | 1.63 | |
| | (.43 | ) | | | — | | | | (.43 | ) | | | 25.14 | | | | 5.97 | | | | 737 | | | | 1.43 | | | | 1.43 | | | | 1.75 | |
| | (.48 | ) | | | — | | | | (.48 | ) | | | 24.13 | | | | 15.34 | | | | 691 | | | | 1.46 | | | | 1.46 | | | | 1.86 | |
| | (.57 | ) | | | (.06 | ) | | | (.63 | ) | | | 21.36 | | | | 10.39 | | | | 610 | | | | 1.48 | | | | 1.47 | | | | 2.24 | |
| | (.34 | ) | | | (.71 | ) | | | (1.05 | ) | | | 35.43 | | | | 6.94 | | | | 1,547 | | | | .67 | 6 | | | .67 | 6 | | | 1.96 | 6 |
| | (.69 | ) | | | — | | | | (.69 | ) | | | 34.15 | | | | 23.91 | | | | 1,397 | | | | .68 | | | | .68 | | | | 2.18 | |
| | (.66 | ) | | | — | | | | (.66 | ) | | | 28.18 | | | | 14.00 | | | | 1,000 | | | | .67 | | | | .67 | | | | 2.39 | |
| | (.62 | ) | | | — | | | | (.62 | ) | | | 25.33 | | | | 6.79 | | | | 744 | | | | .66 | | | | .66 | | | | 2.52 | |
| | (.66 | ) | | | — | | | | (.66 | ) | | | 24.31 | | | | 16.28 | | | | 569 | | | | .67 | | | | .67 | | | | 2.63 | |
| | (.72 | ) | | | (.06 | ) | | | (.78 | ) | | | 21.51 | | | | 11.31 | | | | 403 | | | | .67 | | | | .67 | | | | 3.03 | |
| | (.38 | ) | | | (.71 | ) | | | (1.09 | ) | | | 35.56 | | | | 7.07 | | | | 1,517 | | | | .43 | 6 | | | .43 | 6 | | | 2.20 | 6 |
| | (.76 | ) | | | — | | | | (.76 | ) | | | 34.27 | | | | 24.22 | | | | 1,349 | | | | .43 | | | | .43 | | | | 2.46 | |
| | (.72 | ) | | | — | | | | (.72 | ) | | | 28.27 | | | | 14.26 | | | | 1,197 | | | | .43 | | | | .43 | | | | 2.59 | |
| | (.68 | ) | | | — | | | | (.68 | ) | | | 25.41 | | | | 7.07 | | | | 542 | | | | .42 | | | | .42 | | | | 2.75 | |
| | (.72 | ) | | | — | | | | (.72 | ) | | | 24.38 | | | | 16.57 | | | | 340 | | | | .41 | | | | .41 | | | | 2.81 | |
| | (.78 | ) | | | (.06 | ) | | | (.84 | ) | | | 21.57 | | | | 11.58 | | | | 130 | | | | .43 | | | | .43 | | | | 2.86 | |
See page 27 for footnotes.
Financial highlights (continued)
| | | | | | | | Income from investment operations1 | |
| | | | | Net asset
value,
beginning
of period | | | Net
investment
income | | | Net gains
on securities
(both realized
and unrealized) | | | Total from
investment
operations | |
| Class 529-A: | | Six months ended 4/30/20144,5 | | $ | 34.21 | | | $ | .33 | | | $ | 1.99 | | | $ | 2.32 | |
| | | Year ended 10/31/2013 | | | 28.22 | | | | .67 | | | | 5.99 | | | | 6.66 | |
| | | Year ended 10/31/2012 | | | 25.37 | | | | .63 | | | | 2.86 | | | | 3.49 | |
| | | Year ended 10/31/2011 | | | 24.34 | | | | .63 | | | | 1.01 | | | | 1.64 | |
| | | Year ended 10/31/2010 | | | 21.54 | | | | .60 | | | | 2.85 | | | | 3.45 | |
| | | Year ended 10/31/2009 | | | 20.17 | | | | .57 | | | | 1.57 | | | | 2.14 | |
| Class 529-B: | | Six months ended 4/30/20144,5 | | | 34.10 | | | | .20 | | | | 1.99 | | | | 2.19 | |
| | | Year ended 10/31/2013 | | | 28.13 | | | | .43 | | | | 5.96 | | | | 6.39 | |
| | | Year ended 10/31/2012 | | | 25.28 | | | | .42 | | | | 2.85 | | | | 3.27 | |
| | | Year ended 10/31/2011 | | | 24.25 | | | | .43 | | | | 1.00 | | | | 1.43 | |
| | | Year ended 10/31/2010 | | | 21.46 | | | | .42 | | | | 2.84 | | | | 3.26 | |
| | | Year ended 10/31/2009 | | | 20.10 | | | | .42 | | | | 1.56 | | | | 1.98 | |
| Class 529-C: | | Six months ended 4/30/20144,5 | | | 34.04 | | | | .20 | | | | 1.99 | | | | 2.19 | |
| | | Year ended 10/31/2013 | | | 28.09 | | | | .42 | | | | 5.96 | | | | 6.38 | |
| | | Year ended 10/31/2012 | | | 25.26 | | | | .42 | | | | 2.84 | | | | 3.26 | |
| | | Year ended 10/31/2011 | | | 24.24 | | | | .43 | | | | 1.00 | | | | 1.43 | |
| | | Year ended 10/31/2010 | | | 21.46 | | | | .41 | | | | 2.84 | | | | 3.25 | |
| | | Year ended 10/31/2009 | | | 20.10 | | | | .42 | | | | 1.56 | | | | 1.98 | |
| Class 529-E: | | Six months ended 4/30/20144,5 | | | 34.09 | | | | .29 | | | | 2.00 | | | | 2.29 | |
| | | Year ended 10/31/2013 | | | 28.13 | | | | .59 | | | | 5.97 | | | | 6.56 | |
| | | Year ended 10/31/2012 | | | 25.29 | | | | .56 | | | | 2.85 | | | | 3.41 | |
| | | Year ended 10/31/2011 | | | 24.27 | | | | .56 | | | | 1.00 | | | | 1.56 | |
| | | Year ended 10/31/2010 | | | 21.48 | | | | .53 | | | | 2.85 | | | | 3.38 | |
| | | Year ended 10/31/2009 | | | 20.12 | | | | .51 | | | | 1.57 | | | | 2.08 | |
| Class 529-F-1: | | Six months ended 4/30/20144,5 | | | 34.25 | | | | .37 | | | | 2.00 | | | | 2.37 | |
| | | Year ended 10/31/2013 | | | 28.26 | | | | .74 | | | | 5.99 | | | | 6.73 | |
| | | Year ended 10/31/2012 | | | 25.39 | | | | .69 | | | | 2.88 | | | | 3.57 | |
| | | Year ended 10/31/2011 | | | 24.37 | | | | .68 | | | | 1.01 | | | | 1.69 | |
| | | Year ended 10/31/2010 | | | 21.56 | | | | .65 | | | | 2.86 | | | | 3.51 | |
| | | Year ended 10/31/2009 | | | 20.19 | | | | .61 | | | | 1.57 | | | | 2.18 | |
| Dividends and distributions | | | | | | | | | | | | | | | | | | | | |
Dividends
(from net
investment
income) | | | Distributions
(from capital
gains) | | Total
dividends
and
distributions | | Net asset
value, end
of period | | | Total
return2,3 | | Net assets,
end of period
(in millions) | | Ratio of
expenses to
average net
assets before
waivers | | Ratio of
expenses to
average net
assets after
waivers3 | | Ratio of
net income
to average
net assets3 |
| $ | (.33 | ) | | $ | (.71 | ) | | $ | (1.04 | ) | | $ | 35.49 | | | | 6.91 | % | | | $ | 658 | | | | .70 | %6 | | | .70 | %6 | | | 1.93 | %6 |
| | (.67 | ) | | | — | | | | (.67 | ) | | | 34.21 | | | | 23.90 | | | | | 611 | | | | .71 | | | | .71 | | | | 2.15 | |
| | (.64 | ) | | | — | | | | (.64 | ) | | | 28.22 | | | | 13.91 | | | | | 473 | | | | .72 | | | | .72 | | | | 2.34 | |
| | (.61 | ) | | | — | | | | (.61 | ) | | | 25.37 | | | | 6.77 | | | | | 373 | | | | .70 | | | | .70 | | | | 2.48 | |
| | (.65 | ) | | | — | | | | (.65 | ) | | | 24.34 | | | | 16.20 | | | | | 303 | | | | .71 | | | | .71 | | | | 2.59 | |
| | (.71 | ) | | | (.06 | ) | | | (.77 | ) | | | 21.54 | | | | 11.22 | | | | | 228 | | | | .74 | | | | .74 | | | | 2.95 | |
| | (.18 | ) | | | (.71 | ) | | | (.89 | ) | | | 35.40 | | | | 6.54 | | | | | 13 | | | | 1.49 | 6 | | | 1.49 | 6 | | | 1.16 | 6 |
| | (.42 | ) | | | — | | | | (.42 | ) | | | 34.10 | | | | 22.88 | | | | | 16 | | | | 1.50 | | | | 1.50 | | | | 1.40 | |
| | (.42 | ) | | | — | | | | (.42 | ) | | | 28.13 | | | | 13.05 | | | | | 19 | | | | 1.52 | | | | 1.52 | | | | 1.58 | |
| | (.40 | ) | | | — | | | | (.40 | ) | | | 25.28 | | | | 5.87 | | | | | 25 | | | | 1.50 | | | | 1.50 | | | | 1.70 | |
| | (.47 | ) | | | — | | | | (.47 | ) | | | 24.25 | | | | 15.29 | | | | | 33 | | | | 1.51 | | | | 1.51 | | | | 1.82 | |
| | (.56 | ) | | | (.06 | ) | | | (.62 | ) | | | 21.46 | | | | 10.31 | | | | | 34 | | | | 1.55 | | | | 1.55 | | | | 2.16 | |
| | (.20 | ) | | | (.71 | ) | | | (.91 | ) | | | 35.32 | | | | 6.53 | | | | | 169 | | | | 1.48 | 6 | | | 1.48 | 6 | | | 1.15 | 6 |
| | (.43 | ) | | | — | | | | (.43 | ) | | | 34.04 | | | | 22.92 | | | | | 159 | | | | 1.50 | | | | 1.50 | | | | 1.37 | |
| | (.43 | ) | | | — | | | | (.43 | ) | | | 28.09 | | | | 13.01 | | | | | 126 | | | | 1.51 | | | | 1.51 | | | | 1.55 | |
| | (.41 | ) | | | — | | | | (.41 | ) | | | 25.26 | | | | 5.92 | | | | | 102 | | | | 1.50 | | | | 1.50 | | | | 1.68 | |
| | (.47 | ) | | | — | | | | (.47 | ) | | | 24.24 | | | | 15.27 | | | | | 85 | | | | 1.50 | | | | 1.50 | | | | 1.80 | |
| | (.56 | ) | | | (.06 | ) | | | (.62 | ) | | | 21.46 | | | | 10.33 | | | | | 65 | | | | 1.54 | | | | 1.54 | | | | 2.15 | |
| | (.29 | ) | | | (.71 | ) | | | (1.00 | ) | | | 35.38 | | | | 6.83 | | | | | 34 | | | | .95 | 6 | | | .95 | 6 | | | 1.68 | 6 |
| | (.60 | ) | | | — | | | | (.60 | ) | | | 34.09 | | | | 23.56 | | | | | 32 | | | | .96 | | | | .96 | | | | 1.90 | |
| | (.57 | ) | | | — | | | | (.57 | ) | | | 28.13 | | | | 13.62 | | | | | 26 | | | | .98 | | | | .98 | | | | 2.08 | |
| | (.54 | ) | | | — | | | | (.54 | ) | | | 25.29 | | | | 6.45 | | | | | 20 | | | | .98 | | | | .98 | | | | 2.20 | |
| | (.59 | ) | | | — | | | | (.59 | ) | | | 24.27 | | | | 15.87 | | | | | 16 | | | | 1.00 | | | | 1.00 | | | | 2.30 | |
| | (.66 | ) | | | (.06 | ) | | | (.72 | ) | | | 21.48 | | | | 10.88 | | | | | 12 | | | | 1.04 | | | | 1.03 | | | | 2.66 | |
| | (.37 | ) | | | (.71 | ) | | | (1.08 | ) | | | 35.54 | | | | 7.05 | | | | | 49 | | | | .48 | 6 | | | .48 | 6 | | | 2.15 | 6 |
| | (.74 | ) | | | — | | | | (.74 | ) | | | 34.25 | | | | 24.14 | | | | | 46 | | | | .49 | | | | .49 | | | | 2.36 | |
| | (.70 | ) | | | — | | | | (.70 | ) | | | 28.26 | | | | 14.21 | | | | | 32 | | | | .51 | | | | .51 | | | | 2.54 | |
| | (.67 | ) | | | — | | | | (.67 | ) | | | 25.39 | | | | 6.96 | | | | | 22 | | | | .49 | | | | .49 | | | | 2.67 | |
| | (.70 | ) | | | — | | | | (.70 | ) | | | 24.37 | | | | 16.47 | | | | | 13 | | | | .50 | | | | .50 | | | | 2.79 | |
| | (.75 | ) | | | (.06 | ) | | | (.81 | ) | | | 21.56 | | | | 11.44 | | | | | 9 | | | | .54 | | | | .53 | | | | 3.14 | |
See page 27 for footnotes.
Financial highlights (continued)
| | | | | | | | Income from investment operations1 | |
| | | | | Net asset
value,
beginning
of period | | | Net
investment
income | | | Net gains
on securities
(both realized
and unrealized) | | | Total from
investment
operations | |
| Class R-1: | | Six months ended 4/30/20144,5 | | $ | 33.98 | | | $ | .20 | | | $ | 1.99 | | | $ | 2.19 | |
| | | Year ended 10/31/2013 | | | 28.04 | | | | .44 | | | | 5.95 | | | | 6.39 | |
| | | Year ended 10/31/2012 | | | 25.22 | | | | .43 | | | | 2.86 | | | | 3.29 | |
| | | Year ended 10/31/2011 | | | 24.21 | | | | .44 | | | | 1.00 | | | | 1.44 | |
| | | Year ended 10/31/2010 | | | 21.43 | | | | .42 | | | | 2.85 | | | | 3.27 | |
| | | Year ended 10/31/2009 | | | 20.07 | | | | .43 | | | | 1.57 | | | | 2.00 | |
| Class R-2: | | Six months ended 4/30/20144,5 | | | 33.95 | | | | .21 | | | | 1.98 | | | | 2.19 | |
| | | Year ended 10/31/2013 | | | 28.02 | | | | .45 | | | | 5.94 | | | | 6.39 | |
| | | Year ended 10/31/2012 | | | 25.19 | | | | .44 | | | | 2.84 | | | | 3.28 | |
| | | Year ended 10/31/2011 | | | 24.18 | | | | .44 | | | | .99 | | | | 1.43 | |
| | | Year ended 10/31/2010 | | | 21.40 | | | | .42 | | | | 2.83 | | | | 3.25 | |
| | | Year ended 10/31/2009 | | | 20.05 | | | | .40 | | | | 1.56 | | | | 1.96 | |
| Class R-3: | | Six months ended 4/30/20144,5 | | | 34.05 | | | | .28 | | | | 2.00 | | | | 2.28 | |
| | | Year ended 10/31/2013 | | | 28.10 | | | | .59 | | | | 5.96 | | | | 6.55 | |
| | | Year ended 10/31/2012 | | | 25.26 | | | | .56 | | | | 2.86 | | | | 3.42 | |
| | | Year ended 10/31/2011 | | | 24.25 | | | | .56 | | | | 1.00 | | | | 1.56 | |
| | | Year ended 10/31/2010 | | | 21.46 | | | | .53 | | | | 2.85 | | | | 3.38 | |
| | | Year ended 10/31/2009 | | | 20.10 | | | | .51 | | | | 1.57 | | | | 2.08 | |
| Class R-4: | | Six months ended 4/30/20144,5 | | | 34.18 | | | | .34 | | | | 1.99 | | | | 2.33 | |
| | | Year ended 10/31/2013 | | | 28.20 | | | | .68 | | | | 5.99 | | | | 6.67 | |
| | | Year ended 10/31/2012 | | | 25.35 | | | | .64 | | | | 2.87 | | | | 3.51 | |
| | | Year ended 10/31/2011 | | | 24.32 | | | | .64 | | | | 1.01 | | | | 1.65 | |
| | | Year ended 10/31/2010 | | | 21.53 | | | | .60 | | | | 2.85 | | | | 3.45 | |
| | | Year ended 10/31/2009 | | | 20.16 | | | | .57 | | | | 1.58 | | | | 2.15 | |
| Class R-5: | | Six months ended 4/30/20144,5 | | | 34.27 | | | | .39 | | | | 2.01 | | | | 2.40 | |
| | | Year ended 10/31/2013 | | | 28.27 | | | | .78 | | | | 6.00 | | | | 6.78 | |
| | | Year ended 10/31/2012 | | | 25.41 | | | | .73 | | | | 2.87 | | | | 3.60 | |
| | | Year ended 10/31/2011 | | | 24.38 | | | | .72 | | | | 1.00 | | | | 1.72 | |
| | | Year ended 10/31/2010 | | | 21.57 | | | | .67 | | | | 2.87 | | | | 3.54 | |
| | | Year ended 10/31/2009 | | | 20.20 | | | | .65 | | | | 1.55 | | | | 2.20 | |
| Class R-6: | | Six months ended 4/30/20144,5 | | | 34.28 | | | | .40 | | | | 2.00 | | | | 2.40 | |
| | | Year ended 10/31/2013 | | | 28.28 | | | | .79 | | | | 6.01 | | | | 6.80 | |
| | | Year ended 10/31/2012 | | | 25.41 | | | | .74 | | | | 2.88 | | | | 3.62 | |
| | | Year ended 10/31/2011 | | | 24.39 | | | | .73 | | | | 1.00 | | | | 1.73 | |
| | | Year ended 10/31/2010 | | | 21.58 | | | | .68 | | | | 2.87 | | | | 3.55 | |
| | | Six months ended 10/31/20094,7 | | | 18.74 | | | | .31 | | | | 2.86 | | | | 3.17 | |
| | | Six months ended | | Year ended October 31 |
| | | April 30, 20144,5 | | 2013 | | 2012 | | 2011 | | 2010 | | 2009 |
| Portfolio turnover rate for all share classes | | | 11 | % | | | 18 | % | | | 22 | % | | | 23 | % | | | 20 | % | | | 27 | % |
| Dividends and distributions | | | | | | | | | | | | | | | | | | | |
| Dividends (from net investment income) | | | Distributions
(from capital
gains) | | | Total
dividends
and
distributions | | | Net asset
value, end
of period | | | Total
return2,3 | | | Net assets,
end of period
(in millions) | | | Ratio of
expenses to
average net
assets before
waivers | | | Ratio of
expenses to
average net
assets after
waivers3 | | | Ratio of
net income
to average
net assets3 | |
| $ | (.21 | ) | | $ | (.71 | ) | | $ | (.92 | ) | | $ | 35.25 | | | | 6.54 | % | | $ | 69 | | | | 1.43 | %6 | | | 1.43 | %6 | | | 1.20 | %6 |
| | (.45 | ) | | | — | | | | (.45 | ) | | | 33.98 | | | | 22.98 | | | | 68 | | | | 1.44 | | | | 1.44 | | | | 1.43 | |
| | (.47 | ) | | | — | | | | (.47 | ) | | | 28.04 | | | | 13.12 | | | | 58 | | | | 1.43 | | | | 1.43 | | | | 1.61 | |
| | (.43 | ) | | | — | | | | (.43 | ) | | | 25.22 | | | | 5.96 | | | | 35 | | | | 1.43 | | | | 1.43 | | | | 1.75 | |
| | (.49 | ) | | | — | | | | (.49 | ) | | | 24.21 | | | | 15.38 | | | | 29 | | | | 1.45 | | | | 1.45 | | | | 1.84 | |
| | (.58 | ) | | | (.06 | ) | | | (.64 | ) | | | 21.43 | | | | 10.43 | | | | 17 | | | | 1.48 | | | | 1.47 | | | | 2.22 | |
| | (.21 | ) | | | (.71 | ) | | | (.92 | ) | | | 35.22 | | | | 6.55 | | | | 244 | | | | 1.41 | 6 | | | 1.41 | 6 | | | 1.22 | 6 |
| | (.46 | ) | | | — | | | | (.46 | ) | | | 33.95 | | | | 23.02 | | | | 235 | | | | 1.40 | | | | 1.40 | | | | 1.47 | |
| | (.45 | ) | | | — | | | | (.45 | ) | | | 28.02 | | | | 13.13 | | | | 195 | | | | 1.43 | | | | 1.43 | | | | 1.63 | |
| | (.42 | ) | | | — | | | | (.42 | ) | | | 25.19 | | | | 5.94 | | | | 167 | | | | 1.45 | | | | 1.45 | | | | 1.73 | |
| | (.47 | ) | | | — | | | | (.47 | ) | | | 24.18 | | | | 15.32 | | | | 153 | | | | 1.48 | | | | 1.48 | | | | 1.83 | |
| | (.55 | ) | | | (.06 | ) | | | (.61 | ) | | | 21.40 | | | | 10.22 | | | | 132 | | | | 1.62 | | | | 1.62 | | | | 2.08 | |
| | (.29 | ) | | | (.71 | ) | | | (1.00 | ) | | | 35.33 | | | | 6.80 | | | | 685 | | | | .96 | 6 | | | .96 | 6 | | | 1.67 | 6 |
| | (.60 | ) | | | — | | | | (.60 | ) | | | 34.05 | | | | 23.55 | | | | 650 | | | | .96 | | | | .96 | | | | 1.90 | |
| | (.58 | ) | | | — | | | | (.58 | ) | | | 28.10 | | | | 13.64 | | | | 518 | | | | .97 | | | | .97 | | | | 2.09 | |
| | (.55 | ) | | | — | | | | (.55 | ) | | | 25.26 | | | | 6.43 | | | | 410 | | | | .97 | | | | .97 | | | | 2.21 | |
| | (.59 | ) | | | — | | | | (.59 | ) | | | 24.25 | | | | 15.90 | | | | 307 | | | | .99 | | | | .99 | | | | 2.29 | |
| | (.66 | ) | | | (.06 | ) | | | (.72 | ) | | | 21.46 | | | | 10.89 | | | | 181 | | | | 1.03 | | | | 1.03 | | | | 2.66 | |
| | (.34 | ) | | | (.71 | ) | | | (1.05 | ) | | | 35.46 | | | | 6.94 | | | | 793 | | | | .66 | 6 | | | .66 | 6 | | | 1.97 | 6 |
| | (.69 | ) | | | — | | | | (.69 | ) | | | 34.18 | | | | 23.95 | | | | 732 | | | | .66 | | | | .66 | | | | 2.18 | |
| | (.66 | ) | | | — | | | | (.66 | ) | | | 28.20 | | | | 13.98 | | | | 487 | | | | .66 | | | | .66 | | | | 2.37 | |
| | (.62 | ) | | | — | | | | (.62 | ) | | | 25.35 | | | | 6.81 | | | | 272 | | | | .67 | | | | .67 | | | | 2.50 | |
| | (.66 | ) | | | — | | | | (.66 | ) | | | 24.32 | | | | 16.21 | | | | 189 | | | | .68 | | | | .68 | | | | 2.58 | |
| | (.72 | ) | | | (.06 | ) | | | (.78 | ) | | | 21.53 | | | | 11.26 | | | | 75 | | | | .71 | | | | .71 | | | | 2.96 | |
| | (.39 | ) | | | (.71 | ) | | | (1.10 | ) | | | 35.57 | | | | 7.13 | | | | 399 | | | | .36 | 6 | | | .36 | 6 | | | 2.28 | 6 |
| | (.78 | ) | | | — | | | | (.78 | ) | | | 34.27 | | | | 24.32 | | | | 415 | | | | .36 | | | | .36 | | | | 2.50 | |
| | (.74 | ) | | | — | | | | (.74 | ) | | | 28.27 | | | | 14.31 | | | | 311 | | | | .37 | | | | .37 | | | | 2.69 | |
| | (.69 | ) | | | — | | | | (.69 | ) | | | 25.41 | | | | 7.11 | | | | 255 | | | | .37 | | | | .37 | | | | 2.81 | |
| | (.73 | ) | | | — | | | | (.73 | ) | | | 24.38 | | | | 16.59 | | | | 195 | | | | .38 | | | | .38 | | | | 2.90 | |
| | (.77 | ) | | | (.06 | ) | | | (.83 | ) | | | 21.57 | | | | 11.55 | | | | 108 | | | | .40 | | | | .39 | | | | 3.47 | |
| | (.40 | ) | | | (.71 | ) | | | (1.11 | ) | | | 35.57 | | | | 7.14 | | | | 4,484 | | | | .31 | 6 | | | .31 | 6 | | | 2.32 | 6 |
| | (.80 | ) | | | — | | | | (.80 | ) | | | 34.28 | | | | 24.38 | | | | 3,994 | | | | .31 | | | | .31 | | | | 2.50 | |
| | (.75 | ) | | | — | | | | (.75 | ) | | | 28.28 | | | | 14.40 | | | | 1,526 | | | | .32 | | | | .32 | | | | 2.73 | |
| | (.71 | ) | | | — | | | | (.71 | ) | | | 25.41 | | | | 7.12 | | | | 1,038 | | | | .32 | | | | .32 | | | | 2.86 | |
| | (.74 | ) | | | — | | | | (.74 | ) | | | 24.39 | | | | 16.64 | | | | 784 | | | | .33 | | | | .33 | | | | 2.92 | |
| | (.33 | ) | | | — | | | | (.33 | ) | | | 21.58 | | | | 16.99 | | | | 358 | | | | .36 | 6 | | | .36 | 6 | | | 3.036 | 6 |
| 1 | Based on average shares outstanding. |
| 2 | Total returns exclude any applicable sales charges, including contingent deferred sales charges. |
| 3 | This column reflects the impact, if any, of certain waivers from CRMC. During one of the periods shown, CRMC reduced fees for investment advisory services. |
| 4 | Based on operations for the period shown and, accordingly, is not representative of a full year. |
| 5 | Unaudited. |
| 6 | Annualized. |
| 7 | Class R-6 shares were offered beginning May 1, 2009. |
See Notes to Financial Statements
As a fund shareholder, you incur two types of costs: (1) transaction costs, such as initial sales charges on purchase payments and contingent deferred sales charges on redemptions (loads), and (2) ongoing costs, including management fees, distribution and service (12b-1) fees, and other expenses. This example is intended to help you understand your ongoing costs (in dollars) of investing in the fund so you can compare these costs with the ongoing costs of investing in other mutual funds. The example is based on an investment of $1,000 invested at the beginning of the period and held for the entire six-month period (November 1, 2013, through April 30, 2014).
Actual expenses:
The first line of each share class in the table on the following page provides information about actual account values and actual expenses. You may use the information in this line, together with the amount you invested, to estimate the expenses that you paid over the period. Simply divide your account value by $1,000 (for example, an $8,600 account value divided by $1,000=8.6),then multiply the result by the number in the first line under the heading entitled “Expenses paid during period” to estimate the expenses you paid on your account during this period.
Hypothetical example for comparison purposes:
The second line of each share class in the table on the following page provides information about hypothetical account values and hypothetical expenses based on the actual expense ratio for the share class and an assumed rate of return of 5.00% per year before expenses, which is not the actual return of the share class. The hypothetical account values and expenses may not be used to estimate the actual ending account balance or expenses you paid for the period. You may use this information to compare the ongoing costs of investing in the fund and other funds. To do so, compare this 5.00% hypothetical example with the 5.00% hypothetical examples that appear in the shareholder reports of the other funds.
Notes:
There are some account fees that are charged to certain types of accounts, such as individual retirement accounts and 529 college savings plan accounts (generally, a $10 fee is charged to set up the account and an additional $10 fee is charged to the account annually), that would increase the amount of expenses paid on your account. In addition, retirement plan participants may be subject to certain fees charged by the plan sponsor, and Class F-1, F-2 and 529-F-1 shareholders may be subject to fees charged by financial intermediaries, typically ranging from 0.75% to 1.50% of assets annually depending on services offered. You can estimate the impact of these fees by adding the amount of the fees to the total estimated expenses you paid on your account during the period as calculated above. In addition, your ending account value would be lower by the amount of these fees.
Note that the expenses shown in the table on the following page are meant to highlight your ongoing costs only and do not reflect any transactional costs, such as sales charges (loads). Therefore, the second line of each share class in the table is useful in comparing ongoing costs only and will not help you determine the relative total costs of owning different funds. In addition, if these transactional costs were included, your costs would have been higher.
| | | Beginning
account value
11/1/2013 | | | Ending
account value
4/30/2014 | | | Expenses paid during period* | | | Annualized
expense Ratio | |
| Class A — actual return | | $ | 1,000.00 | | | $ | 1,069.82 | | | $ | 3.08 | | | | .60 | % |
| Class A — assumed 5% return | | | 1,000.00 | | | | 1,021.82 | | | | 3.01 | | | | .60 | |
| Class B — actual return | | | 1,000.00 | | | | 1,065.76 | | | | 6.97 | | | | 1.36 | |
| Class B — assumed 5% return | | | 1,000.00 | | | | 1,018.05 | | | | 6.80 | | | | 1.36 | |
| Class C — actual return | | | 1,000.00 | | | | 1,065.41 | | | | 7.17 | | | | 1.40 | |
| Class C — assumed 5% return | | | 1,000.00 | | | | 1,017.85 | | | | 7.00 | | | | 1.40 | |
| Class F-1 — actual return | | | 1,000.00 | | | | 1,069.42 | | | | 3.44 | | | | .67 | |
| Class F-1 — assumed 5% return | | | 1,000.00 | | | | 1,021.47 | | | | 3.36 | | | | .67 | |
| Class F-2 — actual return | | | 1,000.00 | | | | 1,070.75 | | | | 2.21 | | | | .43 | |
| Class F-2 — assumed 5% return | | | 1,000.00 | | | | 1,022.66 | | | | 2.16 | | | | .43 | |
| Class 529-A — actual return | | | 1,000.00 | | | | 1,069.07 | | | | 3.59 | | | | .70 | |
| Class 529-A — assumed 5% return | | | 1,000.00 | | | | 1,021.32 | | | | 3.51 | | | | .70 | |
| Class 529-B — actual return | | | 1,000.00 | | | | 1,065.36 | | | | 7.63 | | | | 1.49 | |
| Class 529-B — assumed 5% return | | | 1,000.00 | | | | 1,017.41 | | | | 7.45 | | | | 1.49 | |
| Class 529-C — actual return | | | 1,000.00 | | | | 1,065.25 | | | | 7.58 | | | | 1.48 | |
| Class 529-C — assumed 5% return | | | 1,000.00 | | | | 1,017.46 | | | | 7.40 | | | | 1.48 | |
| Class 529-E — actual return | | | 1,000.00 | | | | 1,068.30 | | | | 4.87 | | | | .95 | |
| Class 529-E — assumed 5% return | | | 1,000.00 | | | | 1,020.08 | | | | 4.76 | | | | .95 | |
| Class 529-F-1 — actual return | | | 1,000.00 | | | | 1,070.46 | | | | 2.46 | | | | .48 | |
| Class 529-F-1 — assumed 5% return | | | 1,000.00 | | | | 1,022.41 | | | | 2.41 | | | | .48 | |
| Class R-1 — actual return | | | 1,000.00 | | | | 1,065.43 | | | | 7.32 | | | | 1.43 | |
| Class R-1 — assumed 5% return | | | 1,000.00 | | | | 1,017.70 | | | | 7.15 | | | | 1.43 | |
| Class R-2 — actual return | | | 1,000.00 | | | | 1,065.55 | | | | 7.22 | | | | 1.41 | |
| Class R-2 — assumed 5% return | | | 1,000.00 | | | | 1,017.80 | | | | 7.05 | | | | 1.41 | |
| Class R-3 — actual return | | | 1,000.00 | | | | 1,068.03 | | | | 4.92 | | | | .96 | |
| Class R-3 — assumed 5% return | | | 1,000.00 | | | | 1,020.03 | | | | 4.81 | | | | .96 | |
| Class R-4 — actual return | | | 1,000.00 | | | | 1,069.40 | | | | 3.39 | | | | .66 | |
| Class R-4 — assumed 5% return | | | 1,000.00 | | | | 1,021.52 | | | | 3.31 | | | | .66 | |
| Class R-5 — actual return | | | 1,000.00 | | | | 1,071.33 | | | | 1.85 | | | | .36 | |
| Class R-5 — assumed 5% return | | | 1,000.00 | | | | 1,023.01 | | | | 1.81 | | | | .36 | |
| Class R-6 — actual return | | | 1,000.00 | | | | 1,071.37 | | | | 1.59 | | | | .31 | |
| Class R-6 — assumed 5% return | | | 1,000.00 | | | | 1,023.26 | | | | 1.56 | | | | .31 | |
| * | The “expenses paid during period” are equal to the “annualized expense ratio,” multiplied by the average account value over the period, multiplied by the number of days in the period, and divided by 365 (to reflect the one-half year period). |
Approval of Investment Advisory and Service Agreement
The American Mutual Fund’s board has approved the fund’s Investment Advisory and Service Agreement (the “agreement”) with Capital Research and Management Company (“CRMC”) for an additional one-year term through March 31, 2015. The board approved the agreement following the recommendation of the fund’s Contracts Committee (the “committee”), which is composed of all of the fund’s independent board members. The board and the committee determined that the fund’s advisory fee structure was fair and reasonable in relation to the services provided and that approving the agreement was in the best interests of the fund and its shareholders.
In reaching this decision, the board and the committee took into account information furnished to them throughout the year and otherwise provided to them, as well as information prepared specifically in connection with their review of the agreement, and were advised by their independent counsel. They considered the following factors, among others, but did not identify any single issue or particular piece of information that, in isolation, was the controlling factor, and each board and committee member did not necessarily attribute the same weight to each factor.
1. Nature, extent and quality of services
The board and the committee considered the depth and quality of CRMC’s investment management process, including its global research capabilities; the experience, capability and integrity of its senior management and other personnel; the low turnover rates of its key personnel; the overall financial strength and stability of it and the Capital organization; and the ongoing evolution of CRMC’s organizational structure designed to maintain and strengthen these qualities. The board and the committee also considered the nature, extent and quality of administrative, compliance and shareholder services provided by CRMC to the fund under the agreement and other agreements, as well as the benefits to fund shareholders from investing in a fund that is part of a large family of funds. The board and the committee concluded that the nature, extent and quality of the services provided by CRMC have benefited and should continue to benefit the fund and its shareholders.
2. Investment results
The board and the committee considered the investment results of the fund in light of its three objectives: current income, growth of capital and conservation of principal. They compared the fund’s investment results with those of other relevant funds (including funds that form the basis of the Lipper index for the category in which the fund is included), and data such as relevant market and fund indexes, over various periods through September 30, 2013. This report, including the letter to shareholders and related disclosures, contains certain information about the fund’s investment results. The board and the committee reviewed the fund’s investment results measured against various indexes, including the Lipper Growth and Income Funds Index, the Lipper Large-Cap Value Funds Index and the S&P 500 Index. They noted that the investment results of the fund generally compared favorably to those
of the Lipper indexes for the 20-year, 10-year and five-year periods, and were mixed for these periods compared to the S&P 500 Index. The board and the committee concluded that the fund’s investment results have been satisfactory for renewal of the agreement and that CRMC’s record in managing the fund indicated that its continued management should benefit the fund and its shareholders.
3. Advisory fees and total expenses
The board and the committee compared the advisory fees and total expense levels of the fund to those of other relevant funds. They observed that the fund’s advisory fees and expenses generally compared favorably to those of other similar funds included in the Lipper Growth and Income Funds category. The board and the committee also considered the breakpoint discounts in the fund’s advisory fee structure that reduce the level of fees charged by CRMC to the fund as fund assets increase. In addition, they reviewed information regarding the effective advisory fees charged to non-mutual fund clients by CRMC and its affiliates. They noted that, to the extent there were differences between the advisory fees paid by the fund and the advisory fees paid by those clients, the differences appropriately reflected the investment, operational and regulatory differences between advising the fund and the other clients. The board and the committee concluded that the fund’s cost structure was fair and reasonable in relation to the services provided, and that the fund’s shareholders receive reasonable value in return for the advisory fees and other amounts paid to CRMC by the fund.
4. Ancillary benefits
The board and the committee considered a variety of other benefits that CRMC and its affiliates receive as a result of CRMC’s relationship with the fund and the other American Funds, including fees for administrative services provided to certain share classes; fees paid to CRMC’s affiliated transfer agent; sales charges and distribution fees received and retained by the fund’s principal underwriter, an affiliate of CRMC; and possible ancillary benefits to CRMC and its institutional management affiliates in managing other investment vehicles. The board and the committee reviewed CRMC’s portfolio trading practices, noting that while CRMC receives the benefit of research provided by broker-dealers executing portfolio transactions on behalf of the fund, it does not obtain third-party research or other services in return for allocating brokerage to such broker-dealers. The board and the committee took these ancillary benefits into account in evaluating the reasonableness of the advisory fees and other amounts paid to CRMC by the fund.
5. Adviser financial information
The board and the committee reviewed information regarding CRMC’s costs of providing services to the American Funds, including personnel, systems and resources of investment, compliance, trading, accounting and other administrative operations. They considered CRMC’s costs and willingness to invest in technology,
infrastructure and staff to maintain and expand services and capabilities, respond to industry and regulatory developments, and attract and retain qualified personnel. They noted information regarding the compensation structure for CRMC’s investment professionals. The board and the committee also compared CRMC’s profitability and compensation data to the reported results and data of several large, publicly held investment management companies. The board and the committee noted the competitiveness and cyclicality of both the mutual fund industry and the capital markets, and the importance in that environment of CRMC’s long-term profitability for maintaining its independence, company culture and management continuity. They further considered the breakpoint discounts in the fund’s advisory fee structure. The board and the committee concluded that the fund’s advisory fee structure reflected a reasonable sharing of benefits between CRMC and the fund’s shareholders.
This page was intentionally left blank.
This page was intentionally left blank.
This page was intentionally left blank.
Offices of the fund and of the investment adviser
Capital Research and Management Company
333 South Hope Street
Los Angeles, CA 90071-1406
6455 Irvine Center Drive
Irvine, CA 92618-4518
Transfer agent for shareholder accounts
American Funds Service Company
(Write to the address near you.)
P.O. Box 6007
Indianapolis, IN 46206-6007
P.O. Box 2280
Norfolk, VA 23501-2280
Custodian of assets
JPMorgan Chase Bank
270 Park Avenue
New York, NY 10017-2070
Counsel
O’Melveny & Myers LLP
400 South Hope Street
Los Angeles, CA 90071-2899
Independent registered public accounting firm
Deloitte & Touche LLP
695 Town Center Drive
Suite 1200
Costa Mesa, CA 92626-7188
Principal underwriter
American Funds Distributors, Inc.
333 South Hope Street
Los Angeles, CA 90071-1406
Investors should carefully consider investment objectives, risks, charges and expenses. This and other important information is contained in the fund prospectus and summary prospectus, which can be obtained from your financial professional and should be read carefully before investing. You may also call American Funds Service Company (AFS) at (800) 421-4225 or visit the American Funds website at americanfunds.com.
“American Funds Proxy Voting Procedures and Principles” — which describes how we vote proxies relating to portfolio securities — is available on the American Funds website or upon request by calling AFS. The fund files its proxy voting record with the U.S. Securities and Exchange Commission (SEC) for the 12 months ended June 30 by August 31. The proxy voting record is available free of charge on the SEC website at sec.gov and on the American Funds website.
A complete April 30, 2014, portfolio of American Mutual Fund’s investments is available free of charge by calling AFS or visiting the SEC website (where it is part of Form N-CSR).
American Mutual Fund files a complete list of its portfolio holdings with the SEC for the first and third quarters of each fiscal year on Form N-Q. This filing is available free of charge on the SEC website. You may also review or, for a fee, copy this filing at the SEC’s Public Reference Room in Washington, D.C. Additional information regarding the operation of the Public Reference Room may be obtained by calling the SEC’s Office of Investor Education and Advocacy at (800) SEC-0330. Additionally, the list of portfolio holdings is available by calling AFS.
This report is for the information of shareholders of American Mutual Fund, but it also may be used as sales literature when preceded or accompanied by the current prospectus or summary prospectus, which gives details about charges, expenses, investment objectives and operating policies of the fund. If used as sales material after June 30, 2014, this report must be accompanied by an American Funds statistical update for the most recently completed calendar quarter.
The American Funds Advantage
Since 1931, American Funds, part of Capital Group, has helped investors pursue long-term investment success. Our consistent approach — in combination with The Capital SystemSM — has resulted in a superior long-term track record.
| | Aligned with investor success |
| | We base our decisions on a long-term perspective, which we believe aligns our goals with the interests of our clients. Our portfolio managers average 26 years of investment experience, including 21 years at our company, reflecting a career commitment to our long-term approach.1 |
| | |
| | The Capital SystemSM |
| | Our investment process, The Capital System, combines individual accountability with teamwork. Each fund is divided into portions that are managed independently by investment professionals with diverse backgrounds, ages and investment approaches. An extensive global research effort is the backbone of our system. |
| | |
| | Superior long-term track record |
| | Our equity funds have beaten their Lipper peer indexes in 90% of 10-year periods and 96% of 20-year periods. Our fixed-income funds have beaten their Lipper indexes in 56% of 10-year periods and 57% of 20-year periods.2 Our fund management fees have been among the lowest in the industry.3 |
| | 1 | Portfolio manager experience as of December 31, 2013. |
| | 2 | Based on Class A share results for rolling periods through December 31, 2013. Periods covered are the shorter of the fund’s lifetime or since the comparable Lipper index inception date (except SMALLCAP World Fund, for which the Lipper average was used). |
| | 3 | Based on management fees for the 20-year period ended December 31, 2013, versus comparable Lipper categories, excluding funds of funds. |

ITEM 2 – Code of Ethics
Not applicable for filing of semi-annual reports to shareholders.
ITEM 3 – Audit Committee Financial Expert
Not applicable for filing of semi-annual reports to shareholders.
ITEM 4 – Principal Accountant Fees and Services
Not applicable for filing of semi-annual reports to shareholders.
ITEM 5 – Audit Committee of Listed Registrants
Not applicable to this Registrant, insofar as the Registrant is not a listed issuer as defined in Rule 10A-3 under the Securities Exchange Act of 1934.
ITEM 6 – Schedule of Investments
 | American Mutual Fund® Investment portfolio April 30, 2014 |
unaudited
| Common stocks 91.79% | | |
| | | Value |
| Energy 6.78% | Shares | (000) |
| | | |
| Apache Corp. | 1,123,400 | $ 97,511 |
| BP PLC (ADR) | 3,294,180 | 166,751 |
| Chevron Corp. | 4,839,411 | 607,443 |
| ConocoPhillips | 3,274,900 | 243,358 |
| Diamond Offshore Drilling, Inc. | 728,941 | 39,808 |
| Ensco PLC, Class A | 3,420,663 | 172,572 |
| EOG Resources, Inc. | 1,075,200 | 105,370 |
| Exxon Mobil Corp. | 1,450,000 | 148,495 |
| Halliburton Co. | 317,000 | 19,993 |
| Noble Energy, Inc. | 357,000 | 25,625 |
| Royal Dutch Shell PLC, Class A (ADR) | 4,635,907 | 365,031 |
| Schlumberger Ltd. | 1,410,000 | 143,186 |
| Spectra Energy Corp | 2,430,500 | 96,515 |
| | | 2,231,658 |
| Materials 5.06% | | |
| | | |
| Air Products and Chemicals, Inc. | 840,000 | 98,717 |
| Barrick Gold Corp. | 1,835,000 | 32,058 |
| CRH PLC (ADR) | 1,089,059 | 31,888 |
| Dow Chemical Co. | 9,316,690 | 464,903 |
| E.I. du Pont de Nemours and Co. | 690,000 | 46,451 |
| Freeport-McMoRan Copper & Gold Inc. | 1,157,700 | 39,790 |
| International Flavors & Fragrances Inc. | 760,000 | 74,875 |
| MeadWestvaco Corp. | 5,166,580 | 201,858 |
| Monsanto Co. | 300,000 | 33,210 |
| Mosaic Co. | 3,060,500 | 153,147 |
| Nucor Corp. | 1,099,600 | 56,904 |
| Praxair, Inc. | 3,323,624 | 433,899 |
| | | 1,667,700 |
| Industrials 14.93% | | |
| | | |
| 3M Co. | 1,515,000 | 210,721 |
| Caterpillar Inc. | 1,219,100 | 128,493 |
| CSX Corp. | 10,454,193 | 295,017 |
| Dover Corp. | 1,402,000 | 121,133 |
| Eaton Corp. PLC | 1,265,000 | 91,890 |
| Emerson Electric Co. | 3,946,850 | 269,096 |
| General Dynamics Corp. | 4,583,000 | 501,609 |
| General Electric Co. | 13,860,000 | 372,695 |
| Illinois Tool Works Inc. | 850,000 | 72,446 |
| Lockheed Martin Corp. | 2,192,860 | 359,936 |
| Norfolk Southern Corp. | 2,060,400 | 194,770 |
| PACCAR Inc | 500,000 | 31,990 |
| Pitney Bowes Inc. | 2,000,000 | 53,600 |
| Precision Castparts Corp. | 314,000 | 79,470 |
| Common stocks | | |
| | | Value |
| Industrials (continued) | Shares | (000) |
| | | |
| Republic Services, Inc. | 2,836,300 | $ 99,526 |
| Rockwell Automation | 1,693,800 | 201,867 |
| Siemens AG (ADR) | 1,052,000 | 138,685 |
| Snap-on Inc. | 750,000 | 87,000 |
| Union Pacific Corp. | 1,879,300 | 357,875 |
| United Parcel Service, Inc., Class B | 4,692,300 | 462,192 |
| United Technologies Corp. | 2,823,174 | 334,066 |
| Waste Management, Inc. | 10,202,900 | 453,519 |
| | | 4,917,596 |
| Consumer discretionary 11.11% | | |
| | | |
| Carnival Corp., units | 6,244,100 | 245,455 |
| Coach, Inc. | 2,236,722 | 99,870 |
| Comcast Corp., Class A | 6,919,900 | 358,174 |
| Comcast Corp., Class A, special nonvoting shares | 2,090,000 | 106,653 |
| Darden Restaurants, Inc. | 5,597,097 | 278,232 |
| Harley-Davidson, Inc. | 898,900 | 66,465 |
| Hasbro, Inc. | 1,948,788 | 107,690 |
| Home Depot, Inc. | 8,376,552 | 666,020 |
| Honda Motor Co., Ltd. (ADR) | 1,047,800 | 34,892 |
| Johnson Controls, Inc. | 7,039,380 | 317,758 |
| Mattel, Inc. | 6,251,797 | 245,164 |
| McDonald’s Corp. | 634,200 | 64,295 |
| Newell Rubbermaid Inc. | 6,605,200 | 198,883 |
| Nordstrom, Inc. | 218,050 | 13,362 |
| Scripps Networks Interactive, Inc., Class A | 265,000 | 19,893 |
| Starbucks Corp. | 603,000 | 42,584 |
| Tiffany & Co. | 369,265 | 32,307 |
| Time Warner Cable Inc. | 775,200 | 109,660 |
| Time Warner Inc. | 3,272,103 | 217,464 |
| Viacom Inc., Class B | 580,000 | 49,288 |
| Whirlpool Corp. | 225,000 | 34,510 |
| Williams-Sonoma, Inc. | 4,163,000 | 261,520 |
| YUM! Brands, Inc. | 1,147,390 | 88,337 |
| | | 3,658,476 |
| Consumer staples 6.63% | | |
| | | |
| Avon Products, Inc. | 4,086,300 | 62,439 |
| Coca-Cola Co. | 8,168,400 | 333,189 |
| Colgate-Palmolive Co. | 1,130,000 | 76,049 |
| ConAgra Foods, Inc. | 950,000 | 28,985 |
| CVS/Caremark Corp. | 1,045,000 | 75,992 |
| General Mills, Inc. | 1,500,000 | 79,530 |
| Kellogg Co. | 1,539,423 | 102,880 |
| Kimberly-Clark Corp. | 1,000,000 | 112,250 |
| Kraft Foods Group, Inc. | 4,849,766 | 275,758 |
| Mondelez International, Inc. | 11,278,300 | 402,071 |
| PepsiCo, Inc. | 1,235,769 | 106,140 |
| Procter & Gamble Co. | 6,406,400 | 528,848 |
| | | 2,184,131 |
| Common stocks | | |
| | | Value |
| Health care 13.04% | Shares | (000) |
| | | |
| Abbott Laboratories | 1,863,000 | $ 72,173 |
| AbbVie Inc. | 19,992,000 | 1,041,183 |
| Aetna Inc. | 503,700 | 35,989 |
| Amgen Inc. | 8,475,748 | 947,165 |
| Bristol-Myers Squibb Co. | 7,550,000 | 378,179 |
| Cardinal Health, Inc. | 1,560,000 | 108,436 |
| Humana Inc. | 138,000 | 15,145 |
| Johnson & Johnson | 2,745,000 | 278,041 |
| Medtronic, Inc. | 1,100,000 | 64,702 |
| Merck & Co., Inc. | 7,447,485 | 436,125 |
| Novartis AG (ADR) | 3,014,000 | 262,037 |
| Pfizer Inc. | 8,803,100 | 275,361 |
| ResMed Inc. | 1,500,000 | 74,775 |
| St. Jude Medical, Inc. | 812,100 | 51,544 |
| Stryker Corp. | 2,154,435 | 167,507 |
| UnitedHealth Group Inc. | 1,162,600 | 87,242 |
| | | 4,295,604 |
| Financials 8.59% | | |
| | | |
| ACE Ltd. | 668,400 | 68,391 |
| Aon PLC, Class A | 1,852,000 | 157,198 |
| Arthur J. Gallagher & Co. | 4,490,548 | 202,164 |
| Bank of New York Mellon Corp. | 3,141,400 | 106,399 |
| Bank of Nova Scotia | 2,310,900 | 140,457 |
| BB&T Corp. | 1,046,000 | 39,047 |
| BlackRock, Inc. | 110,300 | 33,200 |
| CME Group Inc., Class A | 774,000 | 54,482 |
| HSBC Holdings PLC (ADR) | 1,700,000 | 87,244 |
| Hudson City Bancorp, Inc. | 1,696,000 | 16,892 |
| IntercontinentalExchange Group, Inc. | 664,918 | 135,936 |
| JPMorgan Chase & Co. | 4,048,700 | 226,646 |
| Marsh & McLennan Companies, Inc. | 4,296,394 | 211,855 |
| McGraw Hill Financial, Inc. | 321,643 | 23,779 |
| Old Republic International Corp. | 7,110,000 | 117,742 |
| PNC Financial Services Group, Inc. | 1,806,400 | 151,810 |
| Principal Financial Group, Inc. | 7,567,000 | 354,438 |
| Progressive Corp. | 2,000,000 | 48,500 |
| State Street Corp. | 1,479,700 | 95,529 |
| Sun Life Financial Inc. | 3,080,300 | 104,237 |
| Toronto-Dominion Bank | 1,745,600 | 83,946 |
| U.S. Bancorp | 3,906,079 | 159,290 |
| Wells Fargo & Co. | 3,343,000 | 165,947 |
| Willis Group Holdings PLC | 1,050,000 | 43,040 |
| | | 2,828,169 |
| Information technology 9.89% | | |
| | | |
| Accenture PLC, Class A | 414,000 | 33,211 |
| Analog Devices, Inc. | 1,329,640 | 68,197 |
| Apple Inc. | 880,000 | 519,279 |
| Automatic Data Processing, Inc. | 3,356,300 | 261,657 |
| Google Inc., Class A1 | 38,000 | 20,325 |
| Hewlett-Packard Co. | 2,577,065 | 85,198 |
| Intel Corp. | 2,800,000 | 74,732 |
| Common stocks | | |
| | | Value |
| Information technology (continued) | Shares | (000) |
| | | |
| International Business Machines Corp. | 550,000 | $ 108,059 |
| KLA-Tencor Corp. | 1,322,000 | 84,595 |
| Linear Technology Corp. | 1,863,700 | 82,935 |
| Maxim Integrated Products, Inc. | 4,700,000 | 152,468 |
| Microsoft Corp. | 11,999,607 | 484,784 |
| Oracle Corp. | 7,323,000 | 299,364 |
| Paychex, Inc. | 1,000,000 | 41,810 |
| QUALCOMM Inc. | 431,000 | 33,924 |
| Texas Instruments Inc. | 19,256,322 | 875,200 |
| Xilinx, Inc. | 688,400 | 32,486 |
| | | 3,258,224 |
| Telecommunication services 4.16% | | |
| | | |
| AT&T Inc. | 5,920,000 | 211,344 |
| BCE Inc. | 1,000,000 | 44,540 |
| Verizon Communications Inc. | 23,866,997 | 1,115,305 |
| | | 1,371,189 |
| Utilities 7.40% | | |
| | | |
| Ameren Corp. | 1,660,000 | 68,575 |
| American Electric Power Co., Inc. | 1,435,000 | 77,217 |
| Dominion Resources, Inc. | 2,860,000 | 207,465 |
| DTE Energy Co. | 750,000 | 58,605 |
| Duke Energy Corp. | 3,790,847 | 282,380 |
| Edison International | 1,420,000 | 80,315 |
| Exelon Corp. | 15,437,720 | 540,783 |
| FirstEnergy Corp. | 7,373,000 | 248,839 |
| National Grid PLC (ADR) | 1,412,599 | 100,379 |
| PG&E Corp. | 10,590,000 | 482,692 |
| PPL Corp. | 2,044,300 | 68,157 |
| Southern Co. | 2,500,000 | 114,575 |
| Xcel Energy Inc. | 3,365,000 | 107,243 |
| | | 2,437,225 |
| Miscellaneous 4.20% | | |
| | | |
| Other common stocks in initial period of acquisition | | 1,384,109 |
| Total common stocks (cost: $20,957,033,000) | | 30,234,081 |
| Preferred securities 0.03% | | |
| | | |
| Financials 0.03% | | |
| | | |
| U.S. Bancorp, Series F, 6.50% noncumulative depositary shares | 387,000 | 11,165 |
| Total preferred securities (cost: $10,004,000) | | 11,165 |
| Bonds, notes & other debt instruments 1.32% | | |
| Corporate bonds & notes 1.21% | Principal amount | |
| Energy 0.01% | (000) | |
| | | |
| Enbridge Energy Partners, LP 5.35% 2014 | $5,075 | 5,220 |
| Bonds, notes & other debt instruments | | |
| Corporate bonds & notes (continued) | Principal amount | Value |
| Financials 1.13% | (000) | (000) |
| | | |
| Bank of America Corp., Series K, junior subordinated 8.00% noncumulative (undated)2 | $ 1,665 | $ 1,895 |
| Bank of America Corp., Series M, junior subordinated 8.125% noncumulative (undated)2 | 1,665 | 1,900 |
| Citigroup Inc. 6.125% 2017 | 5,000 | 5,719 |
| ERP Operating LP 5.125% 2016 | 2,400 | 2,589 |
| ERP Operating LP 5.375% 2016 | 6,455 | 7,095 |
| ERP Operating LP 5.75% 2017 | 39,855 | 45,077 |
| ERP Operating LP 6.584% 2015 | 3,500 | 3,700 |
| ERP Operating LP 7.125% 2017 | 5,000 | 5,860 |
| JPMorgan Chase & Co., Series I, junior subordinated 7.90% (undated)2 | 123,654 | 140,347 |
| MetLife Global Funding I 5.125% 20143 | 3,000 | 3,014 |
| UDR, Inc., Series A, 5.25% 2015 | 5,000 | 5,160 |
| Wells Fargo & Co., Series K, junior subordinated 7.98% (undated)2 | 131,826 | 150,282 |
| | | 372,638 |
| Utilities 0.07% | | |
| | | |
| FPL Group Capital, Inc. 7.875% 2015 | 20,000 | 22,212 |
| Total corporate bonds & notes | | 400,070 |
| | | |
| Mortgage-backed obligations4 0.03% | | |
| | | |
| Fannie Mae 4.00% 2024 | 4,237 | 4,526 |
| Fannie Mae 4.50% 2024 | 4,080 | 4,374 |
| | | 8,900 |
| Federal agency bonds & notes 0.08% | | |
| | | |
| Fannie Mae 2.50% 2014 | 25,775 | 25,799 |
| Total bonds, notes & other debt instruments (cost: $372,171,000) | | 434,769 |
| | | |
| Short-term securities 6.81% | | |
| | | |
| 3M Co. 0.08% due 6/23/20143 | 17,000 | 16,996 |
| Abbott Laboratories 0.10% due 6/27/20143 | 35,000 | 34,997 |
| Chevron Corp. 0.08%–0.09% due 5/13–6/11/20143 | 97,700 | 97,688 |
| Coca-Cola Co. 0.11%–0.15% due 5/19–7/17/20143 | 175,900 | 175,877 |
| Fannie Mae 0.09%–0.14% due 6/2–9/15/2014 | 221,000 | 220,982 |
| Federal Farm Credit Banks 0.08%–0.16% due 5/28–11/21/2014 | 91,100 | 91,079 |
| Federal Home Loan Bank 0.05%–0.16% due 5/9–10/17/2014 | 412,100 | 412,075 |
| Freddie Mac 0.07%–0.19% due 5/6–10/29/2014 | 617,167 | 617,096 |
| General Electric Capital Corp. 0.20% due 6/4/2014 | 25,000 | 24,998 |
| Honeywell International Inc. 0.10% due 6/24/20143 | 30,000 | 29,995 |
| IBM Corp. 0.09% due 5/13/20143 | 27,800 | 27,799 |
| Merck & Co. Inc. 0.08% due 5/22–6/3/20143 | 47,000 | 46,998 |
| National Rural Utilities Cooperative Finance Corp. 0.09% due 5/12–6/3/2014 | 68,000 | 67,997 |
| Paccar Financial Corp. 0.07% due 5/12–6/6/2014 | 63,500 | 63,497 |
| PepsiCo Inc. 0.07%–0.08% due 6/3–6/5/20143 | 37,000 | 36,998 |
| Pfizer Inc 0.09% due 6/17/20143 | 45,700 | 45,698 |
| Procter & Gamble Co. 0.09%–0.10% due 5/20–7/21/20143 | 187,500 | 187,479 |
| U.S. Treasury Bills 0.095% due 5/15/2014 | 44,700 | 44,699 |
| Total short-term securities (cost: $2,242,754,000) | | 2,242,948 |
| Total investment securities (cost: $23,581,962,000) | | $32,922,963 |
| Other assets less liabilities | | 16,378 |
| Net assets | | $32,939,341 |
As permitted by U.S. Securities and Exchange Commission regulations, “Miscellaneous” securities include holdings in their first year of acquisition that have not previously been publicly disclosed.
1 Security did not produce income during the last 12 months.
2 Coupon rate may change periodically.
3 Acquired in a transaction exempt from registration under Rule 144A or section 4(2) of the Securities Act of 1933. May be resold in the U.S. in transactions exempt from registration, normally to qualified institutional buyers. The total value of all such securities was $703,539,000, which represented 2.14% of the net assets of the fund.
4 Principal payments may be made periodically. Therefore, the effective maturity date may be earlier than the stated maturity date.
Key to abbreviation
ADR = American Depositary Receipts
Investments are not FDIC-insured, nor are they deposits of or guaranteed by a bank or any other entity, so they may lose value.
Investors should carefully consider investment objectives, risks, charges and expenses. This and other important information is contained in the fund prospectus and summary prospectus, which can be obtained from your financial professional and should be read carefully before investing. You may also call American Funds Service Company (AFS) at (800) 421-4225 or visit the American Funds website at americanfunds.com.
MFGEFPX-003-0614O-S37659
ITEM 7 – Disclosure of Proxy Voting Policies and Procedures for Closed-End Management Investment Companies
Not applicable to this Registrant, insofar as the Registrant is not a closed-end management investment company.
ITEM 8 – Portfolio Managers of Closed-End Management Investment Companies
Not applicable to this Registrant, insofar as the Registrant is not a closed-end management investment company.
ITEM 9 – Purchases of Equity Securities by Closed-End Management Investment Company and Affiliated Purchasers
Not applicable to this Registrant, insofar as the Registrant is not a closed-end management investment company.
ITEM 10 – Submission of Matters to a Vote of Security Holders
There have been no material changes to the procedures by which shareholders may recommend nominees to the Registrant’s board of trustees since the Registrant last submitted a proxy statement to its shareholders. The procedures are as follows. The Registrant has a nominating and governance committee comprised solely of persons who are not considered ‘‘interested persons’’ of the Registrant within the meaning of the Investment Company Act of 1940, as amended. The committee periodically reviews such issues as the board’s composition, responsibilities, committees, compensation and other relevant issues, and recommends any appropriate changes to the full board of trustees. While the committee normally is able to identify from its own resources an ample number of qualified candidates, it will consider shareholder suggestions of persons to be considered as nominees to fill future vacancies on the board. Such suggestions must be sent in writing to the nominating and governance committee of the Registrant, c/o the Registrant’s Secretary, and must be accompanied by complete biographical and occupational data on the prospective nominee, along with a written consent of the prospective nominee for consideration of his or her name by the nominating and governance committee.
ITEM 11 – Controls and Procedures
| (a) | The Registrant’s Principal Executive Officer and Principal Financial Officer have concluded, based on their evaluation of the Registrant’s disclosure controls and procedures (as such term is defined in Rule 30a-3 under the Investment Company Act of 1940), that such controls and procedures are adequate and reasonably designed to achieve the purposes described in paragraph (c) of such rule. |
| | |
| (b) | There were no changes in the Registrant’s internal controls over financial reporting (as defined in Rule 30a-3(d) under the Investment Company Act of 1940) that occurred during the Registrant’s second fiscal quarter of the period covered by this report that has materially affected, or is reasonably likely to materially affect, the Registrant’s internal control over financial reporting. |
ITEM 12 – Exhibits
| (a)(1) | Not applicable for filing of semi-annual reports to shareholders. |
| | |
| (a)(2) | The certifications required by Rule 30a-2 of the Investment Company Act of 1940 and Sections 302 and 906 of the Sarbanes-Oxley Act of 2002 are attached as exhibits hereto. |
SIGNATURES
Pursuant to the requirements of the Securities Exchange Act of 1934 and the Investment Company Act of 1940, the Registrant has duly caused this report to be signed on its behalf by the undersigned, thereunto duly authorized.
| | AMERICAN MUTUAL FUND |
| | |
| | By /s/ Paul F. Roye |
| | Paul F. Roye, Executive Vice President and Principal Executive Officer |
| | |
| | Date: June 30, 2014 |
Pursuant to the requirements of the Securities Exchange Act of 1934 and the Investment Company Act of 1940, this report has been signed below by the following persons on behalf of the Registrant and in the capacities and on the dates indicated.
| By /s/ Paul F. Roye |
Paul F. Roye, Executive Vice President and Principal Executive Officer |
| |
| Date: June 30, 2014 |
| By /s/ Ari M. Vinocor |
Ari M. Vinocor, Treasurer and Principal Financial Officer |
| |
| Date: June 30, 2014 |