Exhibit 99.3
2005 Investor Meeting October 17, 2005
“Safe Harbor” Statement under the Private Securities Litigation Reform Act of 1995: Statements in this meeting regarding the business of UnumProvident Corporation which are not historical facts are “forward-looking statements” that involve risks and uncertainties. For a discussion of such risks and uncertainties, which could cause actual results to differ materially from those contained in the forward-looking statements, see the Company’s latest annual report on Form 10-K filed with the Securities and Exchange Commission and subsequently filed 10-Qs. The forward-looking statements are being made as of the presentation date and the Company expressly disclaims any obligation to update any forward-looking statement contained herein.
2

Welcome
3

Agenda
Welcome Tom White
New Reporting Format
CEO State of the Company Address Tom Watjen
The New Paradigm Joe Zubretsky
Financial Goals
Performance and Capital Management Investment and Interest Rate Management Regulatory Update
LUNCH
The Business Reviews
U.S. Brokerage Kevin McCarthy
Group Income Protection All Major Lines
Colonial Randy Horn
Unum Limited (UK) Susan Ring
Closed Disability Block Joe Zubretsky
Looking Forward - The Next Chapter Tom Watjen
4
The New Reporting Format
5
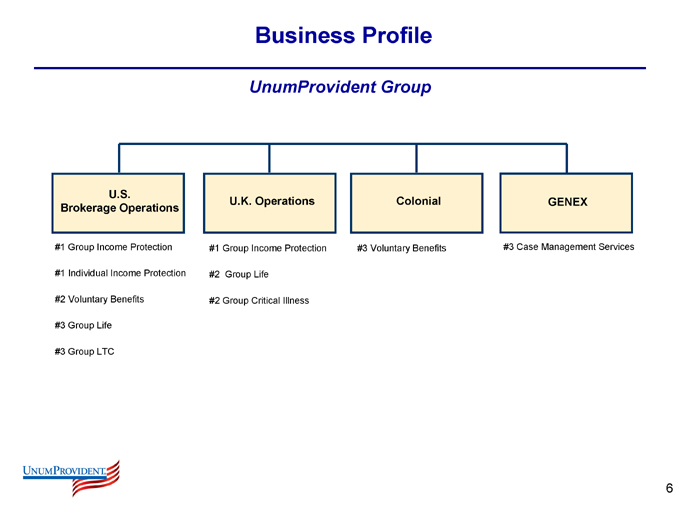
Business Profile
UnumProvident Group
U.S.
Brokerage Operations
U.K. Operations
Colonial
GENEX
#1 Group Income Protection #1 Individual Income Protection #2 Voluntary Benefits #3 Group Life #3 Group LTC
#1 Group Income Protection
#2 Group Life
#2 Group Critical Illness
#3 Voluntary Benefits
#3 Case Management Services
6
The New Reporting Format
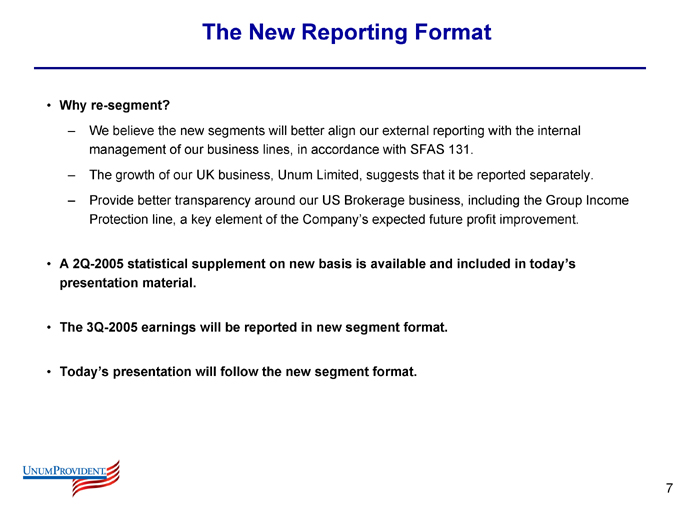
Why re-segment?
We believe the new segments will better align our external reporting with the internal management of our business lines, in accordance with SFAS 131.
The growth of our UK business, Unum Limited, suggests that it be reported separately. Provide better transparency around our US Brokerage business, including the Group Income Protection line, a key element of the Company’s expected future profit improvement.
A 2Q-2005 statistical supplement on new basis is available and included in today’s presentation material.
The 3Q-2005 earnings will be reported in new segment format.
Today’s presentation will follow the new segment format.
7
The New Reporting Format
The New Reporting Format
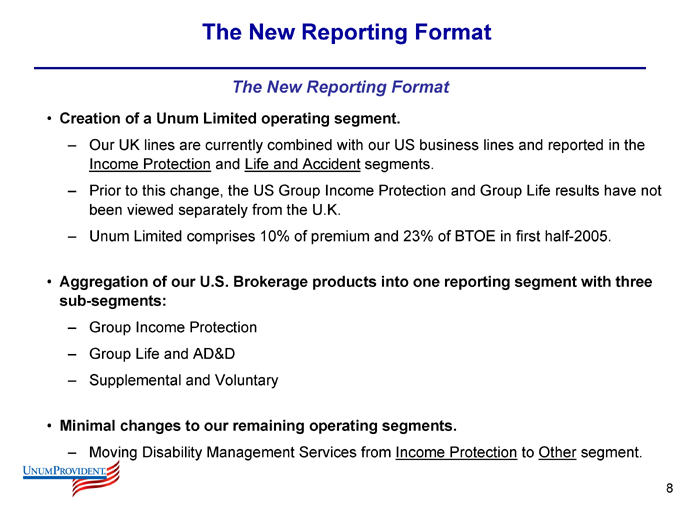
Creation of a Unum Limited operating segment.
Our UK lines are currently combined with our US business lines and reported in the Income Protection and Life and Accident segments.
Prior to this change, the US Group Income Protection and Group Life results have not been viewed separately from the U.K.
Unum Limited comprises 10% of premium and 23% of BTOE in first half-2005.
Aggregation of our U.S. Brokerage products into one reporting segment with three sub-segments:
Group Income Protection Group Life and AD&D Supplemental and Voluntary
Minimal changes to our remaining operating segments.
Moving Disability Management Services from Income Protection to Other segment.
8

The New Reporting Format
New Segments
U.S. Brokerage Unum Limited (UK) Colonial (No Change)
Closed Disability Block (No Change)
Other (Former Other segment plus Disability Management Services from Income Protection)
Corporate (No Change)
9
The New Reporting Format
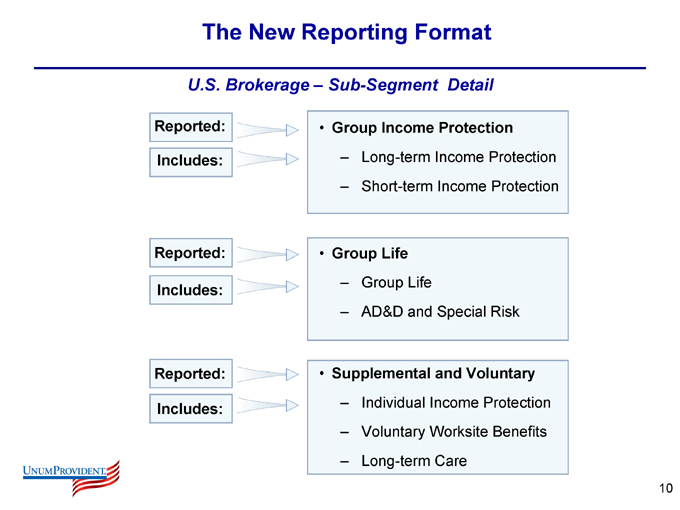
U.S. Brokerage – Sub-Segment Detail
Reported:
Includes:
Group Income Protection
Long-term Income Protection Short-term Income Protection
Reported:
Includes:
Group Life
Group Life
AD&D and Special Risk
Reported:
Includes:
Supplemental and Voluntary
Individual Income Protection Voluntary Worksite Benefits Long-term Care
10
The New Reporting Format
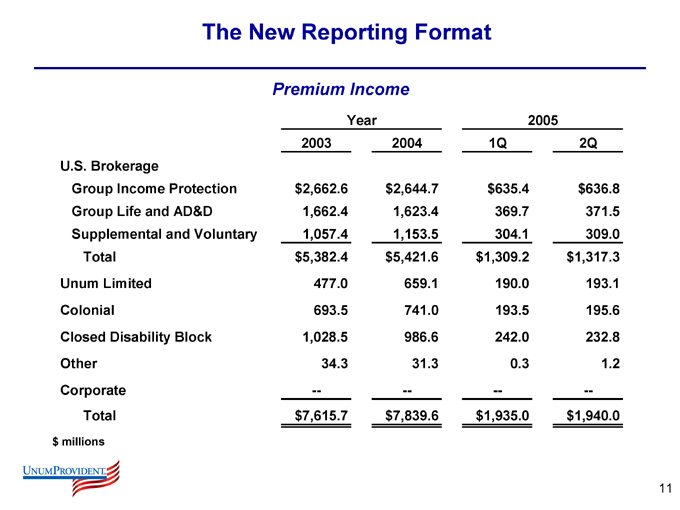
Premium Income
Year 2005
2003 2004 1Q 2Q
U.S. Brokerage
Group Income Protection $2,662.6 $2,644.7 $635.4 $636.8
Group Life and AD&D 1,662.4 1,623.4 369.7 371.5
Supplemental and Voluntary 1,057.4 1,153.5 304.1 309.0
Total $5,382.4 $5,421.6 $1,309.2 $1,317.3
Unum Limited 477.0 659.1 190.0 193.1
Colonial 693.5 741.0 193.5 195.6
Closed Disability Block 1,028.5 986.6 242.0 232.8
Other 34.3 31.3 0.3 1.2
Corporate — — — —
Total $7,615.7 $7,839.6 $1,935.0 $1,940.0
$millions
11
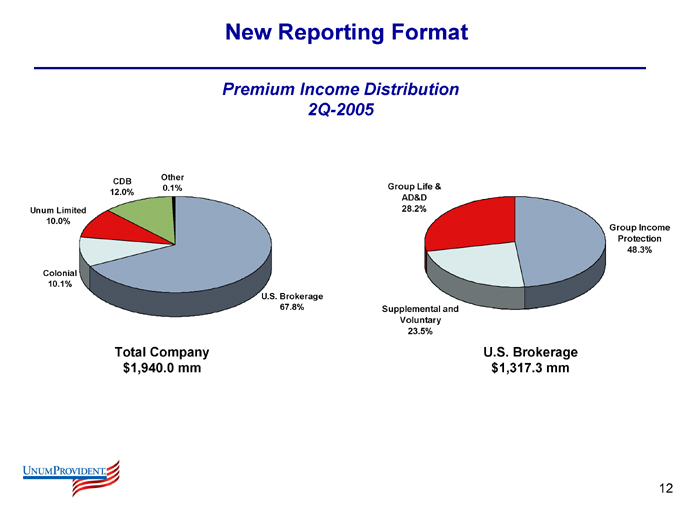
New Reporting Format
Premium Income Distribution 2Q-2005
Other 0.1%
CDB 12.0%
Unum Limited 10.0%
Colonial 10.1%
Total Company $1,940.0 mm
U.S. Brokerage 67.8%
Group Life & AD&D
28.2%
Supplemental and Voluntary 23.5%
U.S. Brokerage $1,317.3 mm
Group Income Protection 48.3%
12
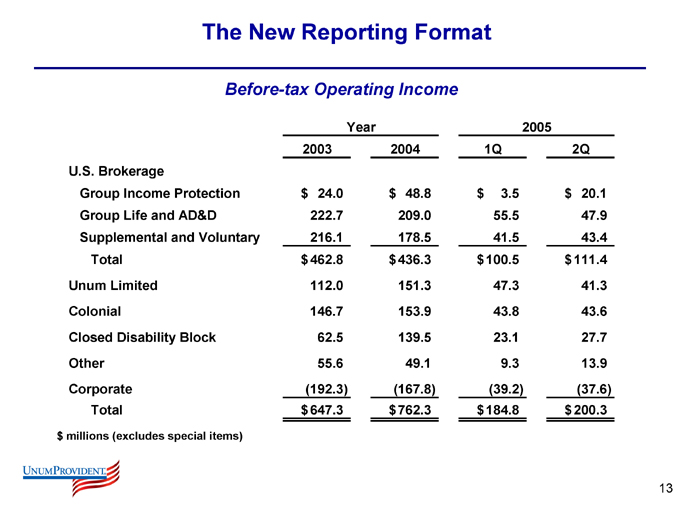
The New Reporting Format
Before-tax Operating Income
Year 2005
2003 2004 1Q 2Q
U.S. Brokerage
Group Income Protection $24.0 $48.8 $3.5 $20.1
Group Life and AD&D 222.7 209.0 55.5 47.9
Supplemental and Voluntary 216.1 178.5 41.5 43.4
Total $462.8 $436.3 $100.5 $111.4
Unum Limited 112.0 151.3 47.3 41.3
Colonial 146.7 153.9 43.8 43.6
Closed Disability Block 62.5 139.5 23.1 27.7
Other 55.6 49.1 9.3 13.9
Corporate (192.3) (167.8) (39.2) (37.6)
Total $647.3 $762.3 $184.8 $200.3
$millions (excludes special items)
13
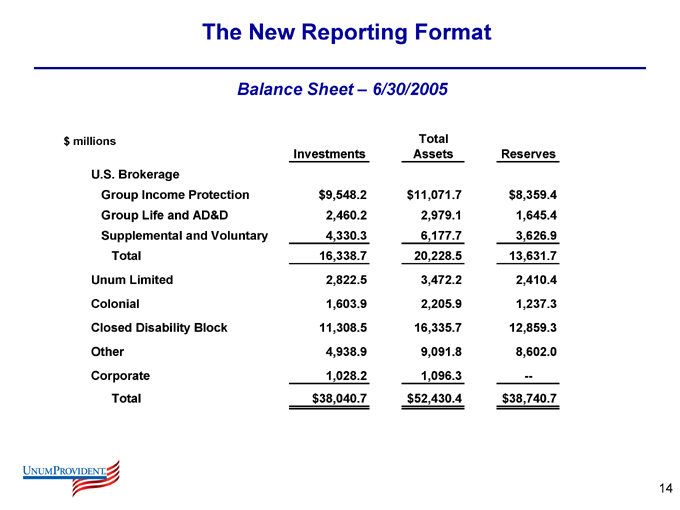
The New Reporting Format
Balance Sheet – 6/30/2005
$millions Total
Investments Assets Reserves
U.S. Brokerage
Group Income Protection $9,548.2 $11,071.7 $8,359.4
Group Life and AD&D 2,460.2 2,979.1 1,645.4
Supplemental and Voluntary 4,330.3 6,177.7 3,626.9
Total 16,338.7 20,228.5 13,631.7
Unum Limited 2,822.5 3,472.2 2,410.4
Colonial 1,603.9 2,205.9 1,237.3
Closed Disability Block 11,308.5 16,335.7 12,859.3
Other 4,938.9 9,091.8 8,602.0
Corporate 1,028.2 1,096.3 —
Total $38,040.7 $52,430.4 $38,740.7
14
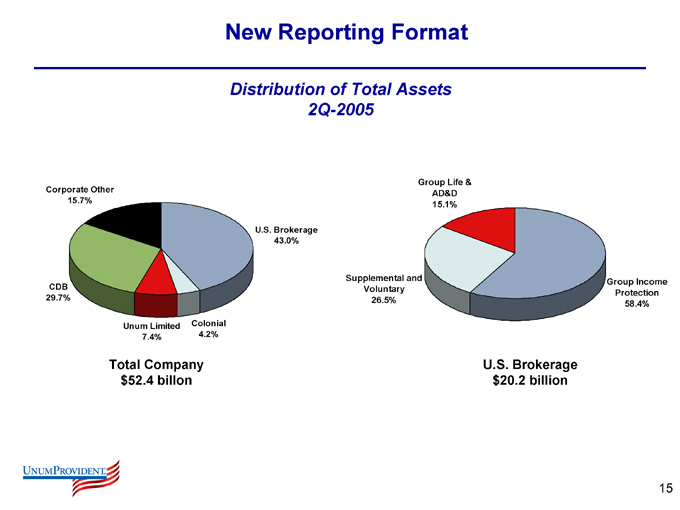
New Reporting Format
Distribution of Total Assets 2Q-2005
Corporate Other 15.7%
CDB 29.7%
Unum Limited Colonial 7.4% 4.2%
U.S. Brokerage 43.0%
Total Company $52.4 billon
Group Life & AD&D
15.1%
Supplemental and Voluntary 26.5%
U.S. Brokerage $20.2 billion
Group Income Protection 58.4%
15

2005 Investor Meeting October 17, 2005
State of the Company Address CEO Update
17
CEO Update
Rebuilding the Industry Leader Unfinished Business Outlook
18
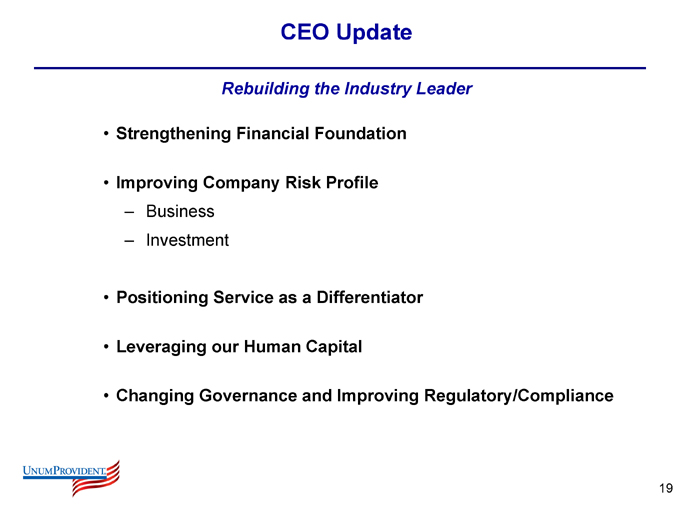
CEO Update
Rebuilding the Industry Leader
Strengthening Financial Foundation
Improving Company Risk Profile
Business Investment
Positioning Service as a Differentiator
Leveraging our Human Capital
Changing Governance and Improving Regulatory/Compliance
19
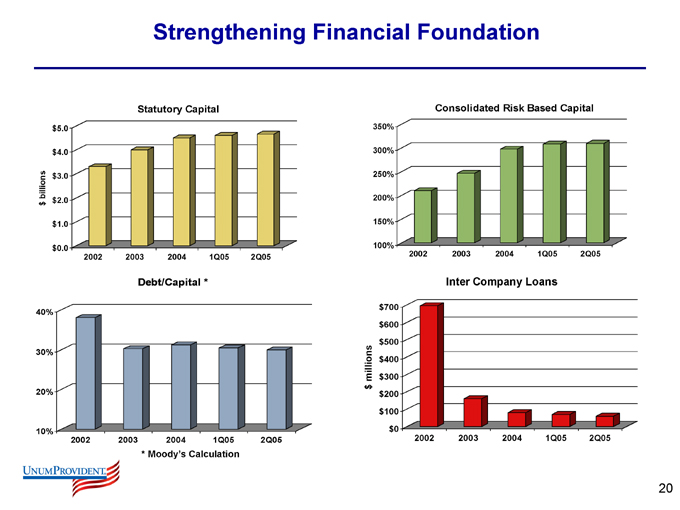
Strengthening Financial Foundation
Statutory Capital $5.0 $4.0 $3.0 $2.0 $1.0 $0.0 $billions
2002 2003 2004 1Q05 2Q05
Consolidated Risk Based Capital
350% 300% 250% 200% 150% 100%
2002 2003 2004 1Q05 2Q05
Debt/Capital *
40% 30% 20% 10%
2002 2003 2004 1Q05 2Q05
Inter Company Loans
* Moody’s Calculation $millions $700
$600 $500
$400
$300 $200
$100
$0
2002 2003 2004 1Q05 2Q05
20
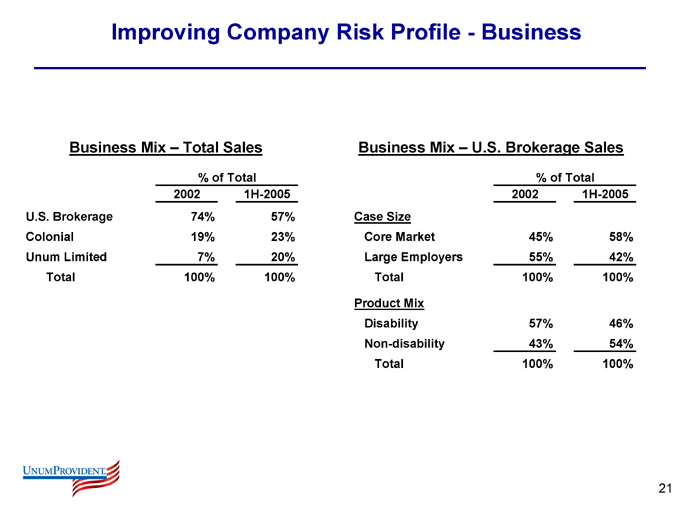
Improving Company Risk Profile - Business
Business Mix – Total Sales
% of Total
2002 1H-2005
U.S. Brokerage 74% 57%
Colonial 19% 23%
Unum Limited 7% 20%
Total 100% 100%
Business Mix – U.S. Brokerage Sales
% of Total
2002 1H-2005
Case Size
Core Market 45% 58%
Large Employers 55% 42%
Total 100% 100%
Product Mix
Disability 57% 46%
Non-disability 43% 54%
Total 100% 100%
21
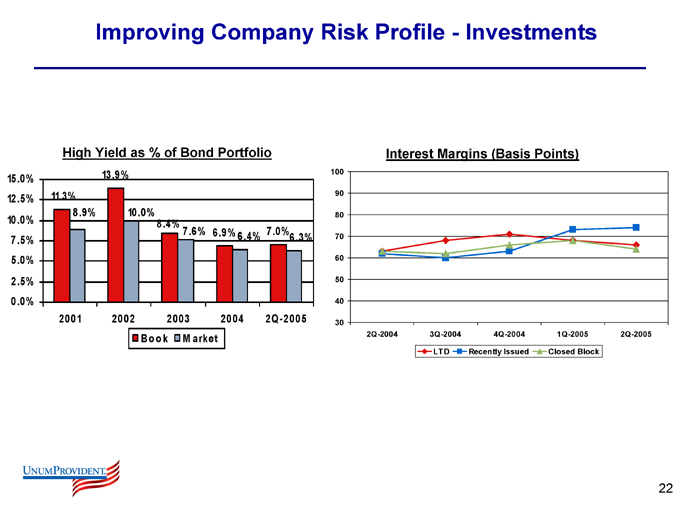
Improving Company Risk Profile - Investments
High Yield as % of Bond Portfolio
15.0% 12.5% 10.0% 7.5% 5.0% 2.5% 0.0%
11.3%
8.9%
13.9%
10.0%
8.4%
7.6%
6.9%
6.4%
7.0% 6.3%
2001 2002 2003 2004 2Q-2005
Book
Market
Interest Margins (Basis Points)
100 90 80 70 60 50 40 30
2Q-2004 3Q-2004 4Q-2004 1Q-2005 2Q-2005
LTD
Recently Issued
Closed Block
22
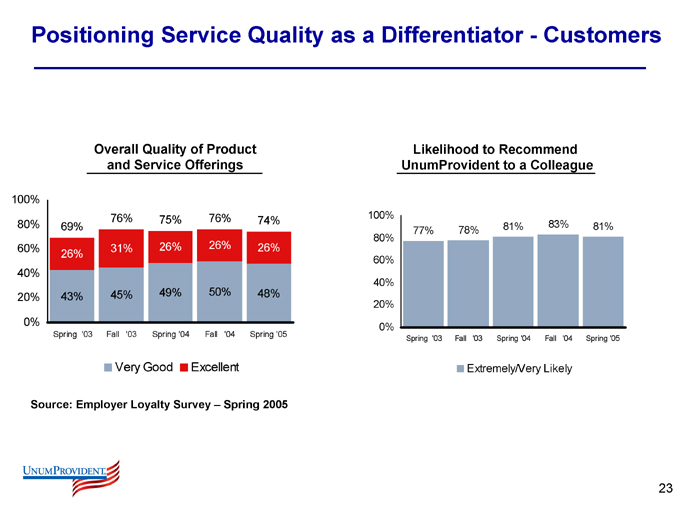
Positioning Service Quality as a Differentiator - Customers
Overall Quality of Product and Service Offerings
100% 80% 60% 40% 20% 0%
69%
26%
43%
76%
31%
45%
75%
26%
49%
76%
26%
50%
74%
26%
48%
Spring ‘03 Fall ‘03 Spring ‘04 Fall ‘04 Spring ‘05
Very Good
Excellent
Source: Employer Loyalty Survey – Spring 2005
Likelihood to Recommend UnumProvident to a Colleague
100% 80% 60% 40% 20% 0%
77%
78%
81%
83%
81%
Spring ‘03 Fall ‘03 Spring ‘04 Fall ‘04 Spring ‘05
Extremely/Very Likely
23
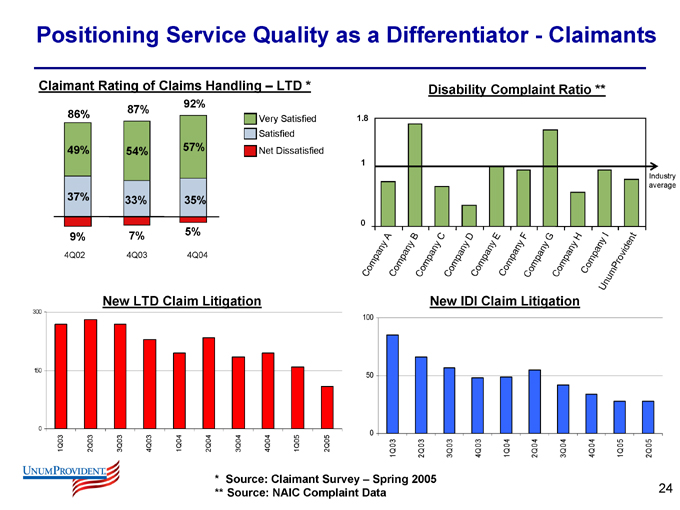
Positioning Service Quality as a Differentiator - Claimants
Claimant Rating of Claims Handling – LTD *
86%
49%
37%
9%
87%
54%
33%
7%
92%
57%
35%
5%
4Q02 4Q03 4Q04
Very Satisfied Satisfied Net Dissatisfied
New LTD Claim Litigation
300
150
0
1Q03 2Q03 3Q03 4Q03 1Q04 2Q04 3Q04 4Q04 1Q05 2Q05
Disability Complaint Ratio **
1.8
1
0
Industry average
Company A
Company B
Company C
Company D
Company E
Company F
Company G
Company H
Company I
UnumProvident
New IDI Claim Litigation
100
50
0
1Q 03 2Q 03 3Q 03 4Q 03 1Q 04 2Q 04 3Q 04 4Q 04 1Q 05 2Q 05
* Source: Claimant Survey – Spring 2005 ** Source: NAIC Complaint Data
24
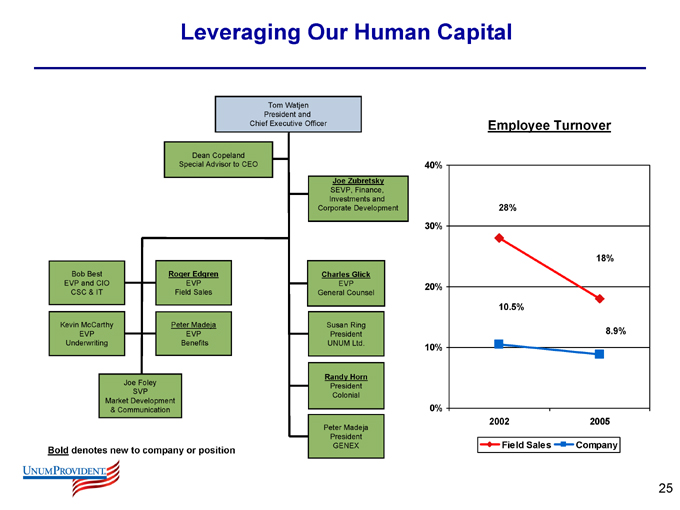
Leveraging Our Human Capital
Tom Watjen President and Chief Executive Officer
Dean Copeland Special Advisor to CEO
Joe Zubretsky
SEVP, Finance, Investments and Corporate Development
Bob Best EVP and CIO
CSC & IT
Roger Edgren
EVP Field Sales
Kevin McCarthy EVP
Underwriting
Peter Madeja EVP
Benefits
Joe Foley SVP
Market Development & Communication
Charles Glick
EVP General Counsel
Susan Ring President UNUM Ltd.
Randy Horn
President Colonial
Peter Madeja President GENEX
Bold denotes new to company or position
Employee Turnover
40% 30% 20% 10% 0%
28%
18%
10.5%
8.9%
2002 2005
Field Sales
Company
25
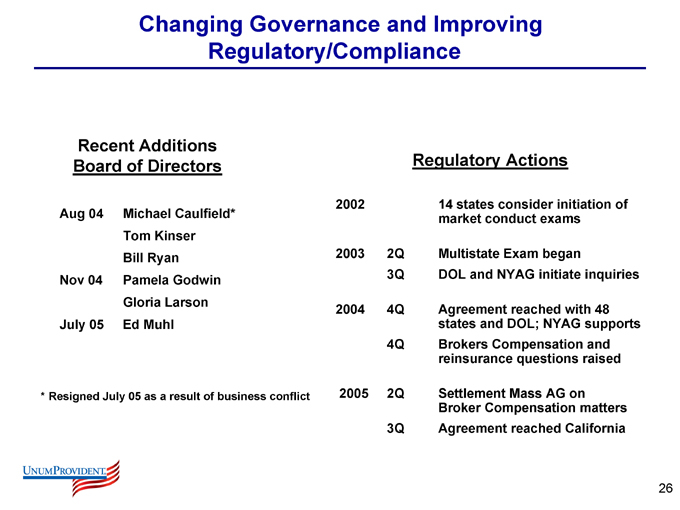
Changing Governance and Improving Regulatory/Compliance
Recent Additions Board of Directors
2002
Aug 04 Michael Caulfield*
Tom Kinser
Bill Ryan 2003
Nov 04 Pamela Godwin
Gloria Larson
2004
July 05 Ed Muhl
* Resigned July 05 as a result of business conflict 2005
Regulatory Actions
14 states consider initiation of
market conduct exams
2Q Multistate Exam began
3Q DOL and NYAG initiate inquiries
4Q Agreement reached with 48
states and DOL; NYAG supports
4Q Brokers Compensation and
reinsurance questions raised
2Q Settlement Mass AG on
Broker Compensation matters
3Q Agreement reached California
26
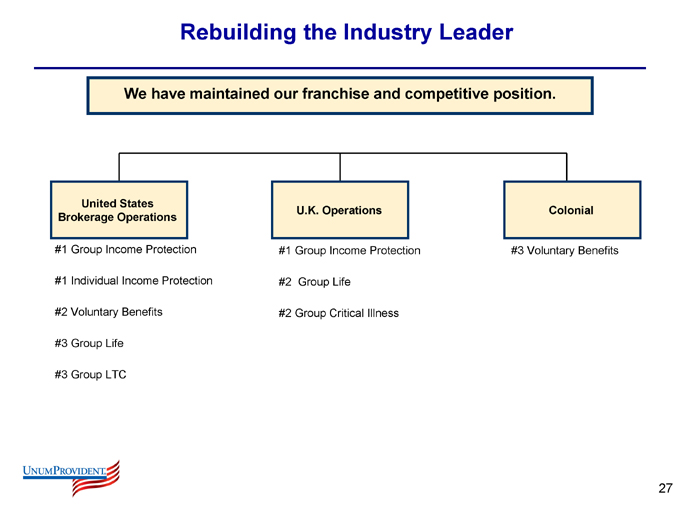
Rebuilding the Industry Leader
We have maintained our franchise and competitive position.
United States Brokerage Operations
U.K. Operations
Colonial
#1 Group Income Protection #1 Individual Income Protection #2 Voluntary Benefits #3 Group Life #3 Group LTC
#1 Group Income Protection
#2 Group Life
#2 Group Critical Illness
#3 Voluntary Benefits
27
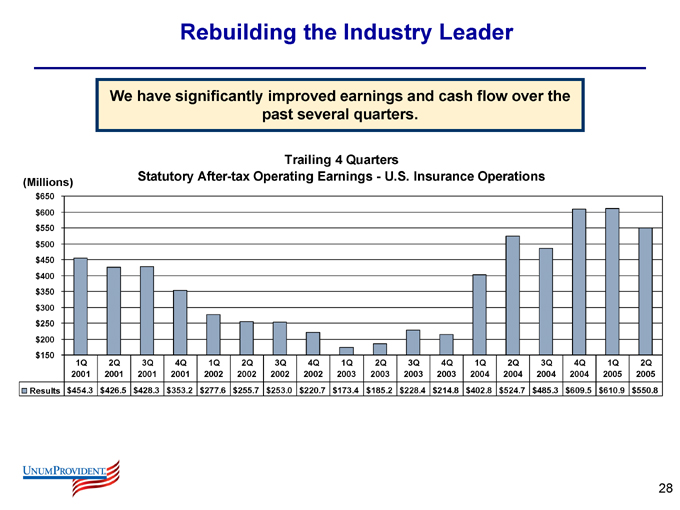
Rebuilding the Industry Leader
We have significantly improved earnings and cash flow over the past several quarters.
Trailing 4 Quarters
Statutory After-tax Operating Earnings—U.S. Insurance Operations
(Millions) $650 $600 $550 $500 $450 $400 $350 $300 $250 $200 $150
1Q 2Q 3Q 4Q 1Q 2Q 3Q 4Q 1Q 2Q 3Q 4Q 1Q 2Q 3Q 4Q 1Q 2Q
2001 2001 2001 2001 2002 2002 2002 2002 2003 2003 2003 2003 2004 2004 2004 2004 2005 2005 Results $454.3 $426.5 $428.3 $353.2 $277.6 $255.7 $253.0 $220.7 $173.4 $185.2 $228.4 $214.8 $402.8 $524.7 $485.3 $609.5 $610.9 $550.8
28

Rebuilding the Industry Leader
Our earnings are more predictable and stable.
Reported GAAP Results vs. Consensus $0.50 $0.45 $0.40 $0.35 $0.30 $0.25 $0.20
2Q- 3Q- 4Q- 1Q- 2Q- 3Q- 4Q- 1Q- 2Q-2003 2003 2003 2004 2004 2004 2004 2005 2005
Actual Operating EPS
Consensus EPS
29
Unfinished Business
Key Areas of Focus
Continued operating improvement
Particular focus on U.S. Brokerage Group Income Protection
Improve Ratings
Develop appropriate capital management plan
Improve perception of Company with regulators/media
Continue to reduce business volatility
Consistent execution of everything we do
30
Outlook
Financial Goals
Operational improvement expectations:
Double digit BTOE growth over the next three years, primarily driven by margin improvement in Group Income Protection line Stable performance in other major lines ROE expansion from current 8.7% to a range of 9%—11% over the next three years prior to capital management decisions
ROE and EPS growth improvement impacted by:
Continued de-leveraging Build up of excess capital
Dilution from ACEs equity conversion
31
Outlook
Financial Goals (cont.)
Deployment of excess capital offers opportunity to enhance ROE beyond that created by operational improvements
Potential for generation of $1 billion of excess capital over 3 year timeframe Deployment of capital could enhance ROE by 75 to 100 basis points
We are comfortable with the current consensus estimates
Substantial de-risking and improved capital position underlies this earnings improvement
32
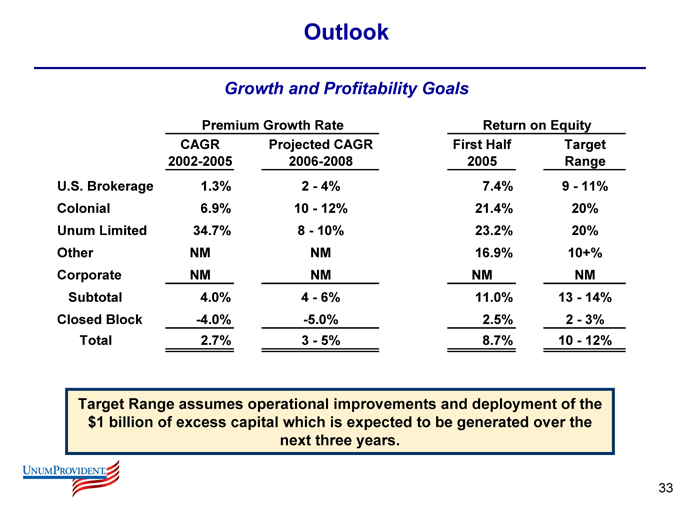
Outlook
Growth and Profitability Goals
Premium Growth Rate
CAGR Projected CAGR
2002-2005 2006-2008
U.S. Brokerage 1.3% 2 - 4%
Colonial 6.9% 10 - 12%
Unum Limited 34.7% 8 - 10%
Other NM NM
Corporate NM NM
Subtotal 4.0% 4 - 6%
Closed Block -4.0% -5.0%
Total 2.7% 3 - 5%
Return on Equity
First Half Target
2005 Range
7.4% 9 - 11%
21.4% 20%
23.2% 20%
16.9% 10+%
NM NM
11.0% 13 - 14%
2.5% 2 - 3%
8.7% 10 - 12%
Target Range assumes operational improvements and deployment of the $1 billion of excess capital which is expected to be generated over the next three years.
33
Outlook
Greatest Risks Facing Company
Claims performance during this period of transition Economic – interest rates and general economic strength Maintain disciplined plan and consistent execution
34
Outlook
Operating Segment Outlook
U.S. Brokerage
Strong franchise and market position retained VWB presents a profitable growth opportunity
Intense focus on improving profitability of Group Income Protection
Colonial
Solid VWB play – complementary distribution and customer base Objective is to reach “market” growth rate.
Predictable earnings and cash flow, and above average returns
Unum Limited (UK)
Significant leadership business in core product lines Modest growth with above average returns Strong cash flow and dividend capacity
35

The New Paradigm
36
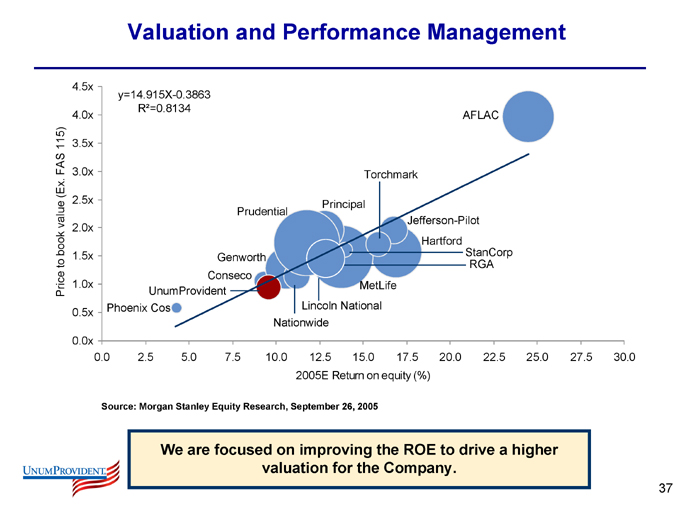
Valuation and Performance Management
Price to book value (Ex. FAS 115)
4.5x
4.0x
3.5x
3.0x
2.5x
2.0x
1.5x
1.0x
0.5x
0.0x
0.0
2.5
5.0
7.5
10.0
12.5
15.0
17.5
20.0
22.5
25.0
27.5
30.0 y=14.915X-0.3863 R²=0.8134
Phoenix Cos
UnumProvident
Conseco
Genworth
Prudential
Principal
Torchmark
AFLAC
Nationwide
Lincoln National
MetLife
StanCorp RGA
Hartford
Jefferson-Pilot
2005E Return on equity (%)
Source: Morgan Stanley Equity Research, September 26, 2005
We are focused on improving the ROE to drive a higher valuation for the Company.
37
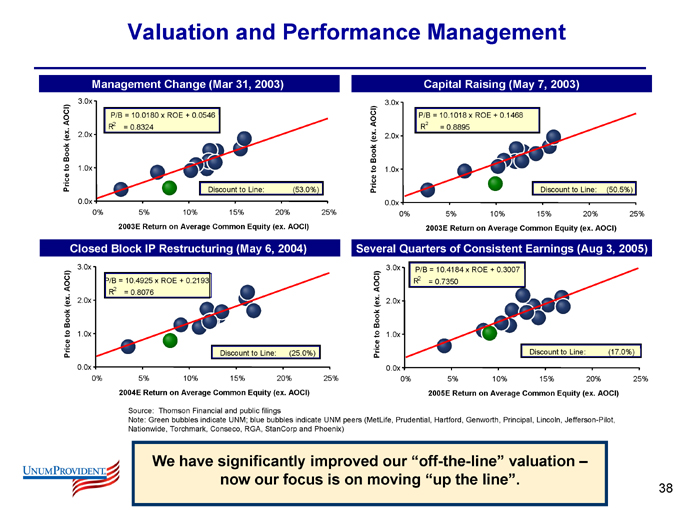
Valuation and Performance Management
Management Change (Mar 31, 2003)
Price to Book (ex. AOCI)
3.0x
2.0x
1.0x
0.0x
0%
5%
10%
15%
20%
25%
P/B = 10.0180 x ROE + 0.0546 R2 = 0.8324
Discount to Line: (53.0%)
2003E Return on Average Common Equity (ex. AOCI)
Price to Book (ex. AOCI)
3.0x
2.0x
1.0x
0.0x
0%
5%
10%
15%
20%
25%
P/B = 10.1018 x ROE + 0.1468 R2 = 0.8895
Discount to Line: (50.5%)
2003E Return on Average Common Equity (ex. AOCI)
Capital Raising (May 7, 2003)
Closed Block IP Restructuring (May 6, 2004)
Price to Book (ex. AOCI)
3.0x
2.0x
1.0x
0.0x
0%
5%
10%
15%
20%
25%
P/B = 10.4925 x ROE + 0.2193 R2 = 0.8076
Discount to Line: (25.0%)
2004E Return on Average Common Equity (ex. AOCI)
Several Quarters of Consistent Earnings (Aug 3, 2005)
Price to Book (ex. AOCI)
3.0x
2.0x
1.0x
0.0x
0%
5%
10%
15%
20%
25%
P/B = 10.4184 x ROE + 0.3007 R2 = 0.7350
Discount to Line: (17.0%)
2005E Return on Average Common Equity (ex. AOCI)
Source: Thomson Financial and public filings
Note: Green bubbles indicate UNM; blue bubbles indicate UNM peers (MetLife, Prudential, Hartford, Genworth, Principal, Lincoln, Jefferson-Pilot, Nationwide, Torchmark, Conseco, RGA, StanCorp and Phoenix)
We have significantly improved our “off-the-line” valuation – now our focus is on moving “up the line”.
38
Valuation and Performance Management
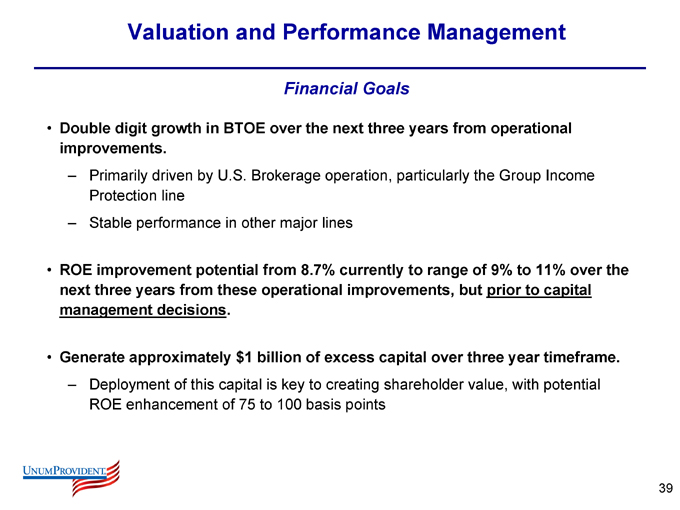
Financial Goals
Double digit growth in BTOE over the next three years from operational improvements.
Primarily driven by U.S. Brokerage operation, particularly the Group Income Protection line Stable performance in other major lines
ROE improvement potential from 8.7% currently to range of 9% to 11% over the next three years from these operational improvements, but prior to capital management decisions.
Generate approximately $1 billion of excess capital over three year timeframe.
Deployment of this capital is key to creating shareholder value, with potential ROE enhancement of 75 to 100 basis points
39
Valuation and Performance Management
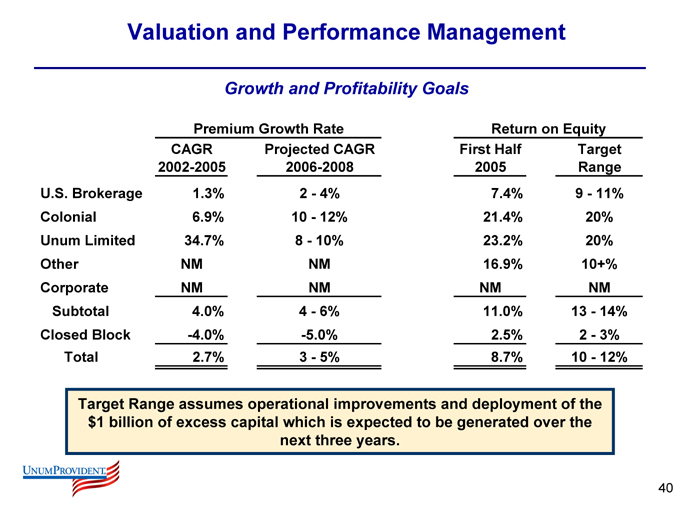
Growth and Profitability Goals
Premium Growth Rate Return on Equity
CAGR Projected CAGR First Half Target
2002-2005 2006-2008 2005 Range
U.S. Brokerage 1.3% 2 - 4% 7.4% 9 - 11%
Colonial 6.9% 10 - 12% 21.4% 20%
Unum Limited 34.7% 8 - 10% 23.2% 20%
Other NM NM 16.9% 10+%
Corporate NM NM NM NM
Subtotal 4.0% 4 - 6% 11.0% 13 - 14%
Closed Block -4.0% -5.0% 2.5% 2 - 3%
Total 2.7% 3 - 5% 8.7% 10 - 12%
Target Range assumes operational improvements and deployment of the $1 billion of excess capital which is expected to be generated over the next three years.
40
Performance Management
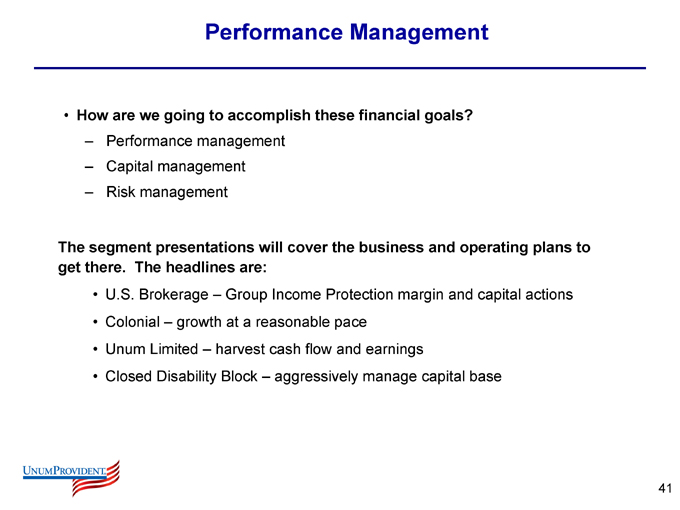
How are we going to accomplish these financial goals?
Performance management Capital management Risk management
The segment presentations will cover the business and operating plans to get there. The headlines are:
U.S. Brokerage – Group Income Protection margin and capital actions
Colonial – growth at a reasonable pace
Unum Limited – harvest cash flow and earnings
Closed Disability Block – aggressively manage capital base
41
Performance Management
42
Performance Management
Managing the Numerator
Our New Performance Management System
Focuses on the key business levers
Results in resource allocations to high ROE levers and initiatives Focuses and measures on revenue quality; Measures and manages volatility and cyclicality Action oriented: When off course… correct.
43
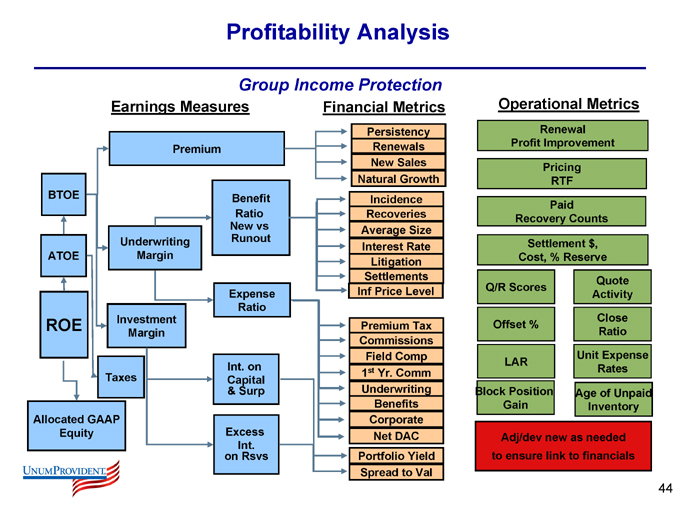
Profitability Analysis
Group Income Protection
Earnings Measures
Premium
BTOE
ATOE
ROE
Allocated GAAP
Equity
Underwriting Margin
Investment Margin
Taxes
Benefit Ratio New vs Runout
Expense Ratio
Int. on Capital & Surp
Excess Int. on Rsvs
Financial Metrics
Persistency Renewals New Sales Natural Growth
Incidence Recoveries Average Size Interest Rate Litigation Settlements Inf Price Level
Premium Tax Commissions Field Comp 1st Yr. Comm Underwriting Benefits Corporate Net DAC Portfolio Yield Spread to Val
Operational Metrics
Renewal Profit Improvement
Pricing RTF
Paid Recovery Counts
Settlement $, Cost, % Reserve
Q/R Scores
Offset %
LAR
Block Position Gain
Quote Activity
Close Ratio
Unit Expense Rates
Age of Unpaid Inventory
Adj/dev new as needed to ensure link to financials
44
Capital Management
45
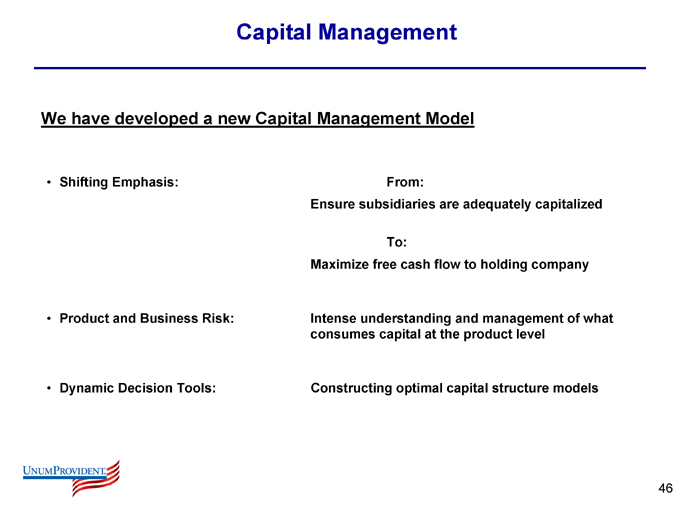
Capital Management
We have developed a new Capital Management Model
Shifting Emphasis: From:
Ensure subsidiaries are adequately capitalized
To:
Maximize free cash flow to holding company
Product and Business Risk: Intense understanding and management of what consumes capital at the product level
Dynamic Decision Tools: Constructing optimal capital structure models
46
Capital Management
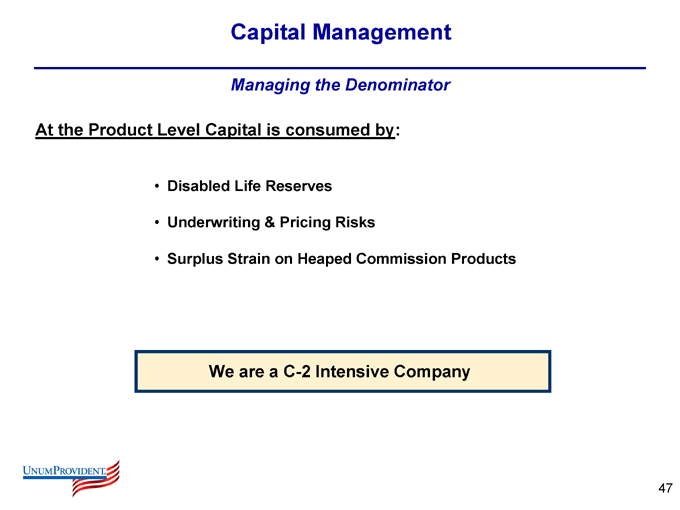
Managing the Denominator
At the Product Level Capital is consumed by:
Disabled Life Reserves
Underwriting & Pricing Risks
Surplus Strain on Heaped Commission Products
We are a C-2 Intensive Company
47
Capital Management
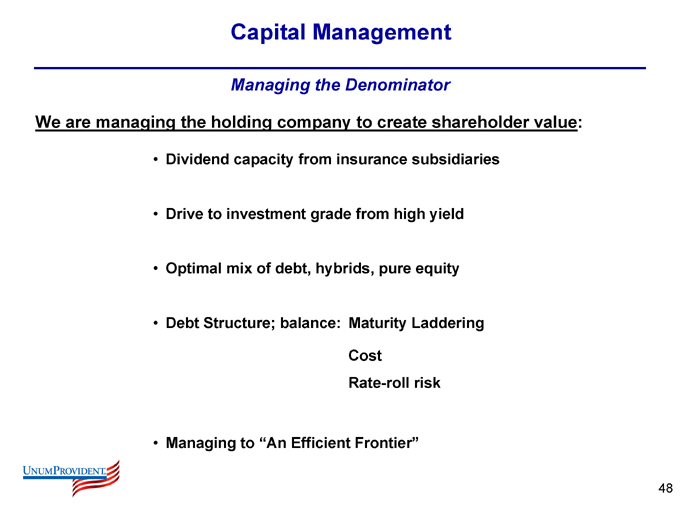
Managing the Denominator
We are managing the holding company to create shareholder value:
Dividend capacity from insurance subsidiaries Drive to investment grade from high yield Optimal mix of debt, hybrids, pure equity
Debt Structure; balance: Maturity Laddering
Cost Rate-roll risk
Managing to “An Efficient Frontier”
48
Capital Management
These capital events, together with the recurring cash flows, underpin the Company’s Capital Plan:
ACES Notes Remarketing
ACES Equity Conversion
49
Capital Management
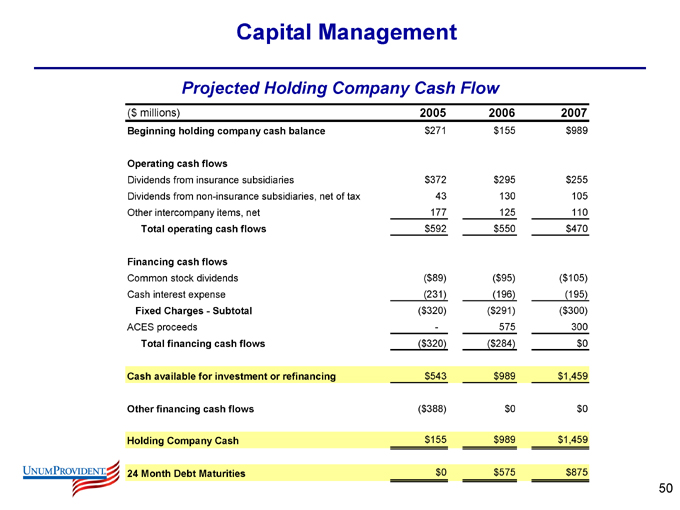
Projected Holding Company Cash Flow
($millions) 2005 2006 2007
Beginning holding company cash balance $271 $155 $989
Operating cash flows
Dividends from insurance subsidiaries $372 $295 $255
Dividends from non-insurance subsidiaries, net of tax 43 130 105
Other intercompany items, net 177 125 110
Total operating cash flows $592 $550 $470
Financing cash flows
Common stock dividends ( $89) ( $95) ($105)
Cash interest expense (231) (196) (195)
Fixed Charges - Subtotal ($320) ($291) ($300)
ACES proceeds — 575 300
Total financing cash flows ($320) ($284) $0
Cash available for investment or refinancing $543 $989 $1,459
Other financing cash flows ($388) $0 $0
Holding Company Cash $155 $989 $1,459
24 Month Debt Maturities $0 $575 $875
50
Capital Management
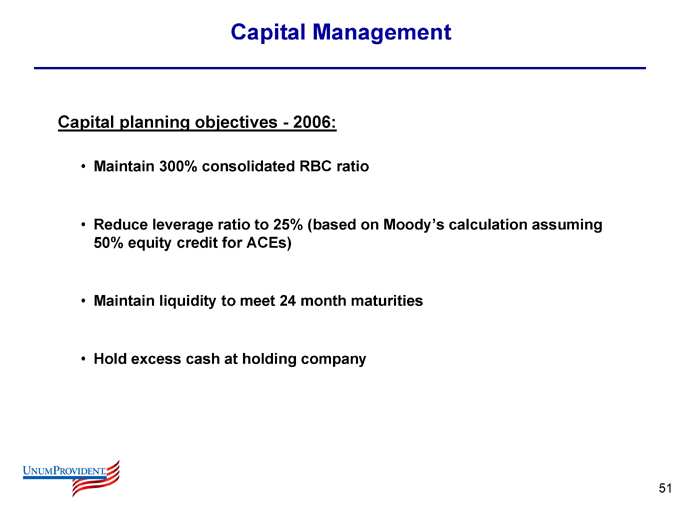
Capital planning objectives - 2006:
Maintain 300% consolidated RBC ratio
Reduce leverage ratio to 25% (based on Moody’s calculation assuming 50% equity credit for ACEs)
Maintain liquidity to meet 24 month maturities
Hold excess cash at holding company
51
Capital Management
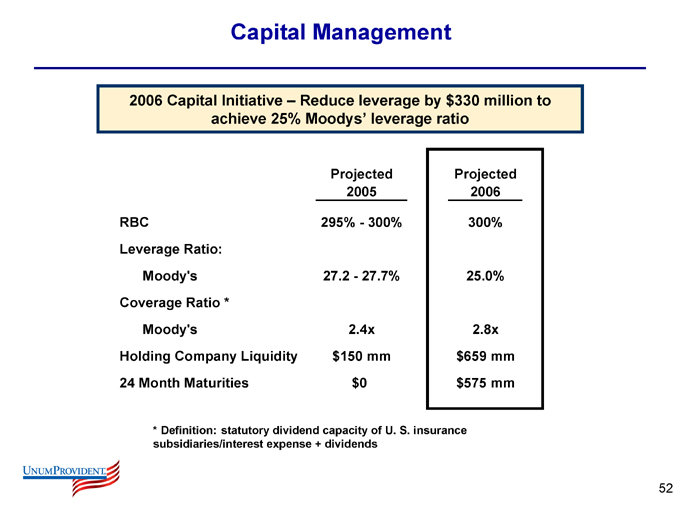
2006 Capital Initiative – Reduce leverage by $330 million to achieve 25% Moodys’ leverage ratio
Projected Projected
2005 2006
RBC 295% - 300% 300%
Leverage Ratio:
Moody’s 27.2 - 27.7% 25.0%
Coverage Ratio *
Moody’s 2.4x 2.8x
Holding Company Liquidity $150 mm $659 mm
24 Month Maturities $0 $575 mm
* Definition: statutory dividend capacity of U. S. insurance subsidiaries/interest expense + dividends
52
Capital Management
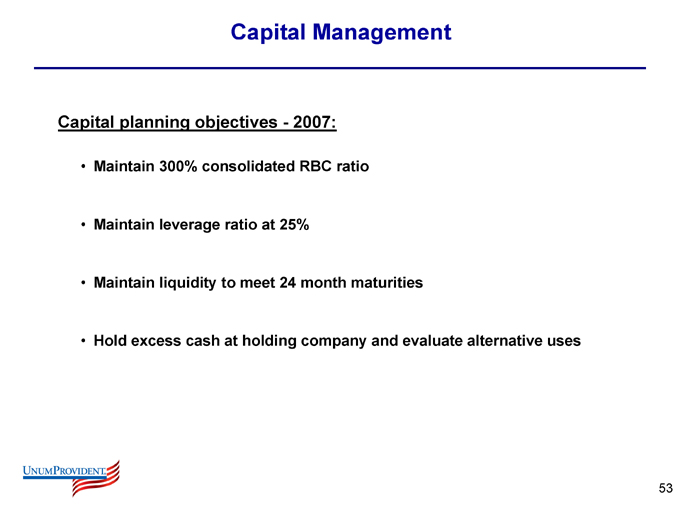
Capital planning objectives - 2007:
Maintain 300% consolidated RBC ratio Maintain leverage ratio at 25% Maintain liquidity to meet 24 month maturities
Hold excess cash at holding company and evaluate alternative uses
53
Capital Management
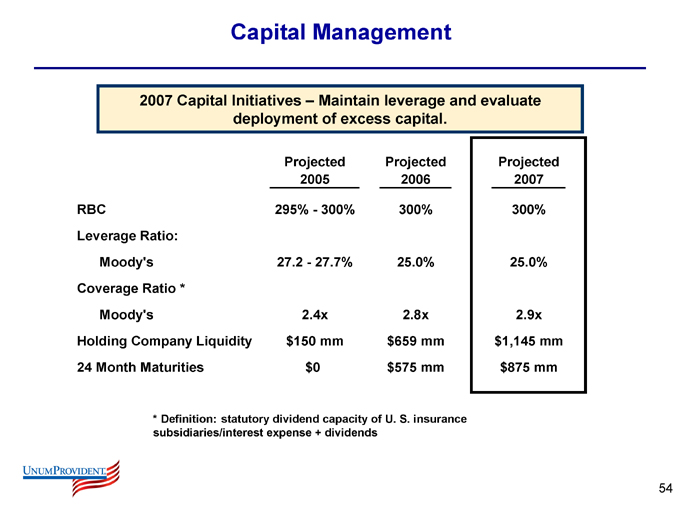
2007 Capital Initiatives – Maintain leverage and evaluate deployment of excess capital.
Projected Projected Projected
2005 2006 2007
RBC 295% - 300% 300% 300%
Leverage Ratio:
Moody’s 27.2 - 27.7% 25.0% 25.0%
Coverage Ratio *
Moody’s 2.4x 2.8x 2.9x
Holding Company Liquidity $150 mm $659 mm $1,145 mm
24 Month Maturities $0 $575 mm $875 mm
* Definition: statutory dividend capacity of U. S. insurance subsidiaries/interest expense + dividends
54
Capital Management
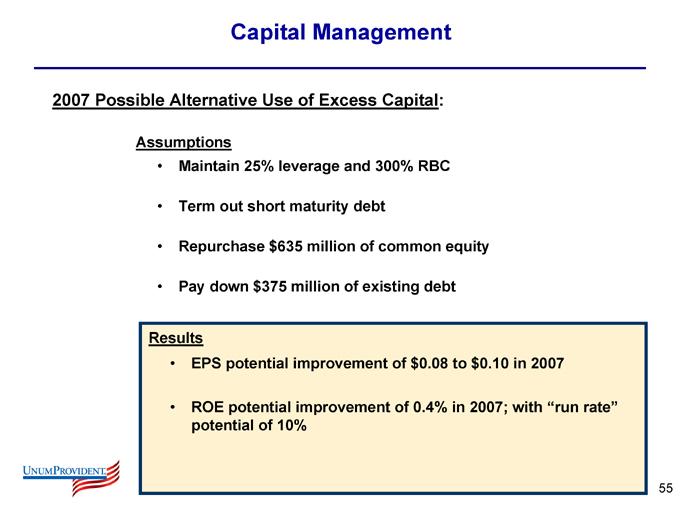
2007 Possible Alternative Use of Excess Capital:
Assumptions
Maintain 25% leverage and 300% RBC Term out short maturity debt Repurchase $635 million of common equity Pay down $375 million of existing debt
Results
EPS potential improvement of $0.08 to $0.10 in 2007
ROE potential improvement of 0.4% in 2007; with “run rate” potential of 10%
55
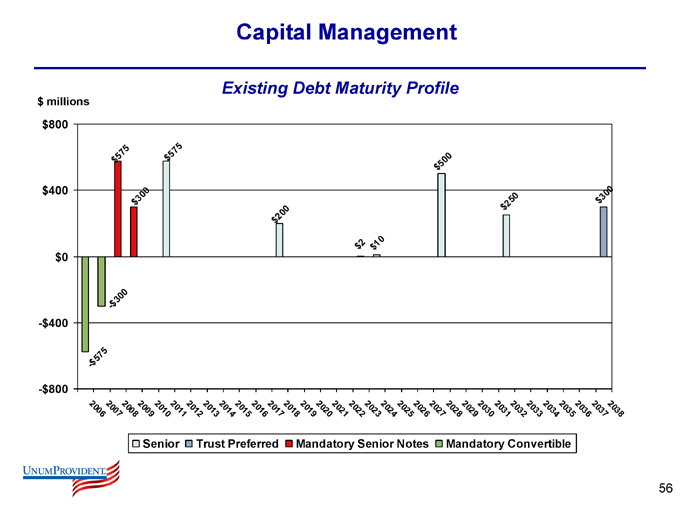
Capital Management
Existing Debt Maturity Profile $ millions $800 $400 $0
$ millions
$800 $400 $0
-$400
-$800
$575
$308
$575
$200
$2
$10 $500
$250
$300
-$575
-$300
2006
2007
2008
2009
2010
2011
2012
2013
2014
2015
2016
2017
2018
2019
2020
2021
2022
2023
2024
2025
2026
2027
2028
2029
2030
2031
2032
2033
2034
2035
2036
2037
2038
Senior
Trust Preferred
Mandatory Senior Notes
Mandatory Convertible
56
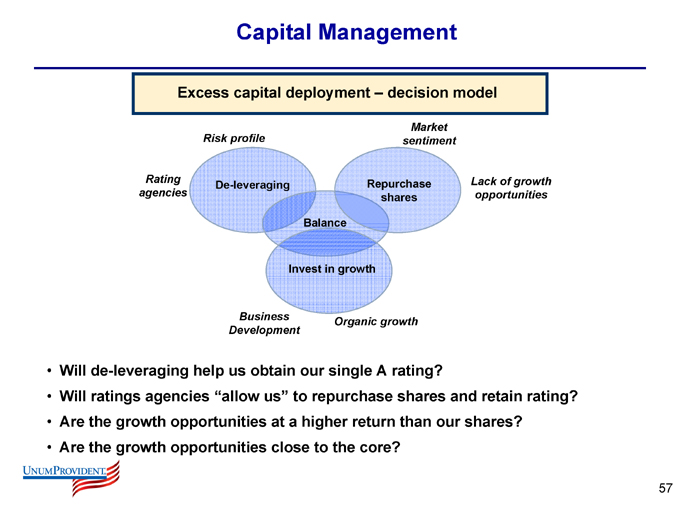
Capital Management
Excess capital deployment – decision model
Risk profile
Rating agencies
De-leveraging
Balance
Invest in growth
Repurchase shares
Market sentiment
Lack of growth opportunities
Business Development
Organic growth
Will de-leveraging help us obtain our single A rating?
Will ratings agencies “allow us” to repurchase shares and retain rating? Are the growth opportunities at a higher return than our shares? Are the growth opportunities close to the core?
57
Capital Management
Opportunities for Shareholder Value
Centre Re Recapture – completed
U.K. Dividend Repatriation – under consideration
Risk adjusted capital allocation to Closed Block – in development
Risk adjusted capital deployment to claim tail – in development
58
Capital Management
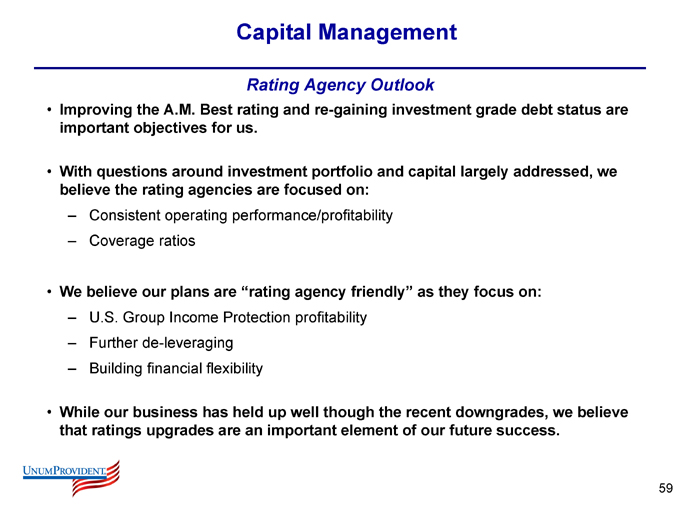
Rating Agency Outlook
Improving the A.M. Best rating and re-gaining investment grade debt status are important objectives for us.
With questions around investment portfolio and capital largely addressed, we believe the rating agencies are focused on:
Consistent operating performance/profitability Coverage ratios
We believe our plans are “rating agency friendly” as they focus on:
U.S. Group Income Protection profitability Further de-leveraging Building financial flexibility
While our business has held up well though the recent downgrades, we believe that ratings upgrades are an important element of our future success.
59
Investment and Interest Rate Management
60

Investment and Interest Rate Management
Economic Conditions
U.S. Government 2-Year and 10-Year Treasuries
Yield
7 6 5 4 3 2 1
2001 2002 2003 2004 2005
Source: LehmanLive.com
U.S. 2-Year
U.S. 10-Year
Dramatic flattening of Treasury yield curve. 10-Year Treasury remains low.
61
Investment and Interest Rate Management
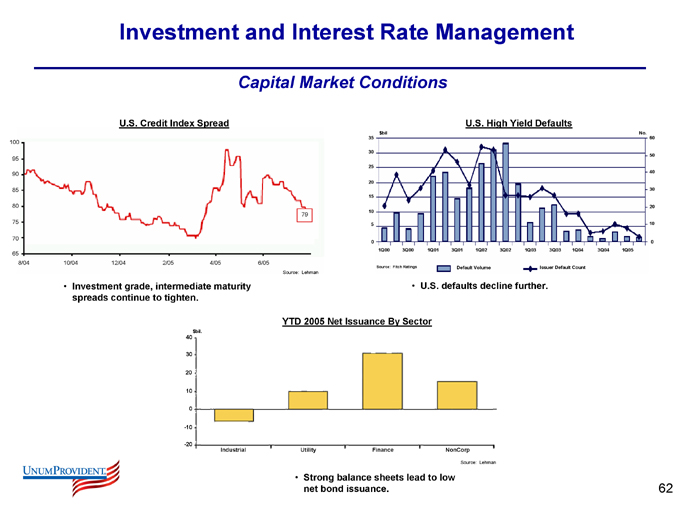
Capital Market Conditions
U.S. Credit Index Spread
100
95
90
85 80 75
70
65
8/04 10/04 12/04 2/05 4/05 6/05
79
Source: Lehman
Investment grade, intermediate maturity spreads continue to tighten.
U.S. High Yield Defaults $bil
35 30 25 20 15 10 5 0
1Q00 3Q00 1Q01 3Q01 1Q02 3Q02 1Q03 3Q03 1Q04 3Q04 1Q05
No.
60 50 40 30 20 10 0
Source: Fitch Ratings
Default Volume
Issuer Default Count
U.S. defaults decline further.
YTD 2005 Net Issuance By Sector $bil.
40 30 20 10 0 -10 -20
Industrial
Utility
Finance
NonCorp
Source: Lehman
Strong balance sheets lead to low net bond issuance.
62
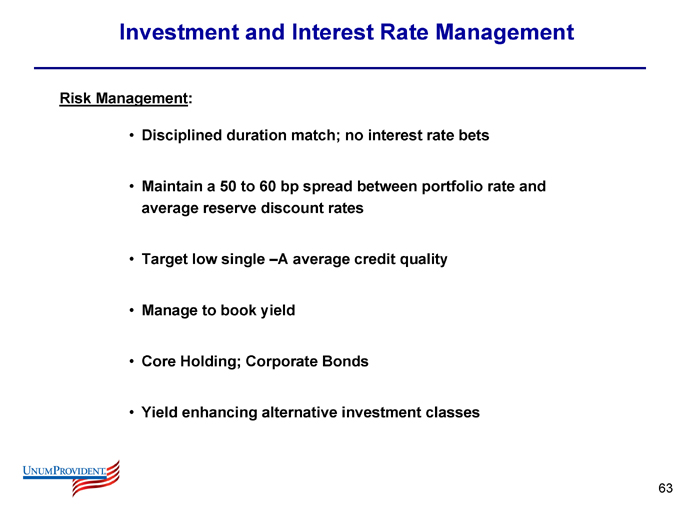
Investment and Interest Rate Management
Risk Management:
Disciplined duration match; no interest rate bets
Maintain a 50 to 60 bp spread between portfolio rate and average reserve discount rates
Target low single –A average credit quality Manage to book yield Core Holding; Corporate Bonds Yield enhancing alternative investment classes
63
Investment and Interest Rate Management
Duration Matching:
Core duration management tool; forward starting swaps Occasional swaption to protect downside Dynamic decision model: When to hedge?
Time Value Volatility Risk Appetite
Accounting Constraints
64
Investment and Interest Rate Management
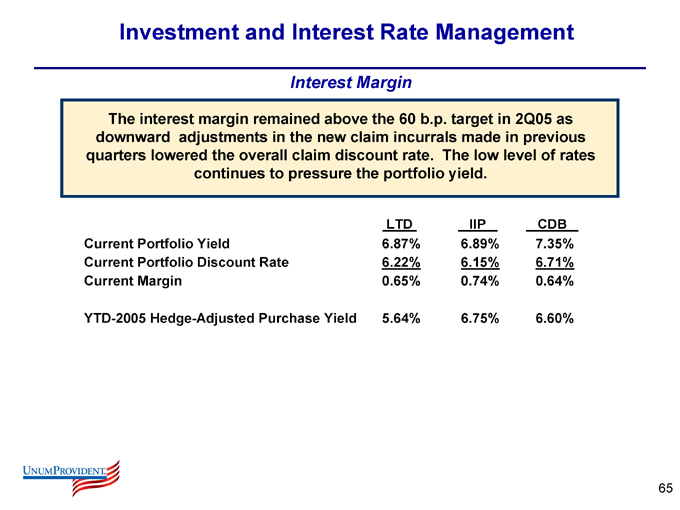
Interest Margin
The interest margin remained above the 60 b.p. target in 2Q05 as downward adjustments in the new claim incurrals made in previous quarters lowered the overall claim discount rate. The low level of rates continues to pressure the portfolio yield.
LTD IIP CDB
Current Portfolio Yield 6.87% 6.89% 7.35%
Current Portfolio Discount Rate 6.22% 6.15% 6.71%
Current Margin 0.65% 0.74% 0.64%
YTD-2005 Hedge-Adjusted Purchase Yield 5.64% 6.75% 6.60%
65
Investment and Interest Rate Management
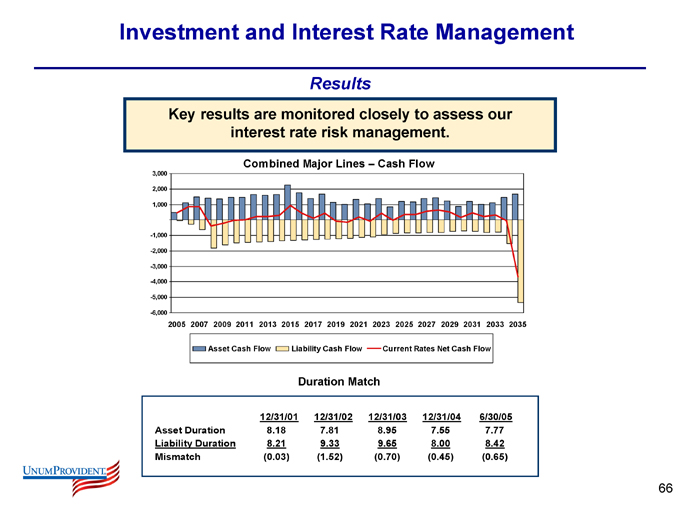
Results
Key results are monitored closely to assess our interest rate risk management.
Combined Major Lines – Cash Flow
3,000 2,000 1,000
-1,000 -2,000 -3,000 -4,000 -5,000 -6,000
2005 2007 2009 2011 2013 2015 2017 2019 2021 2023 2025 2027 2029 2031 2033 2035
Asset Cash Flow
Liability Cash Flow
Current Rates Net Cash Flow
Duration Match
12/31/01 12/31/02 12/31/03 12/31/04 6/30/05
Asset Duration 8.18 7.81 8.95 7.55 7.77
Liability Duration 8.21 9.33 9.65 8.00 8.42
Mismatch (0.03) (1.52) (0.70) (0.45) (0.65)
66
Investment and Interest Rate Management
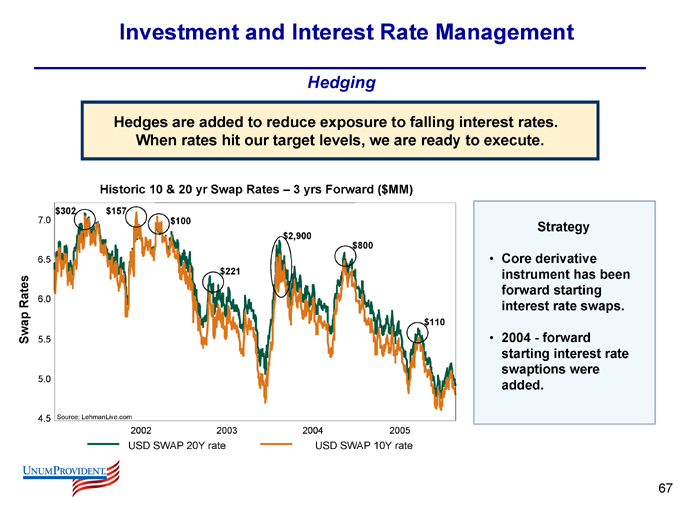
Hedging
Hedges are added to reduce exposure to falling interest rates.
When rates hit our target levels, we are ready to execute.
Historic 10 & 20 yr Swap Rates – 3 yrs Forward ($MM) $302 $157 $100 $221 $2,900 $800 $110
Swap Rates
7.0 6.5 6.0 5.5 5.0 4.5
Source: LehmanLive.com
2002
2003
2004
2005
USD SWAP 20Y rate
USD SWAP 10Y rate
Strategy
Core derivative instrument has been forward starting interest rate swaps.
2004 - forward starting interest rate swaptions were added.
67
Investment and Interest Rate Management
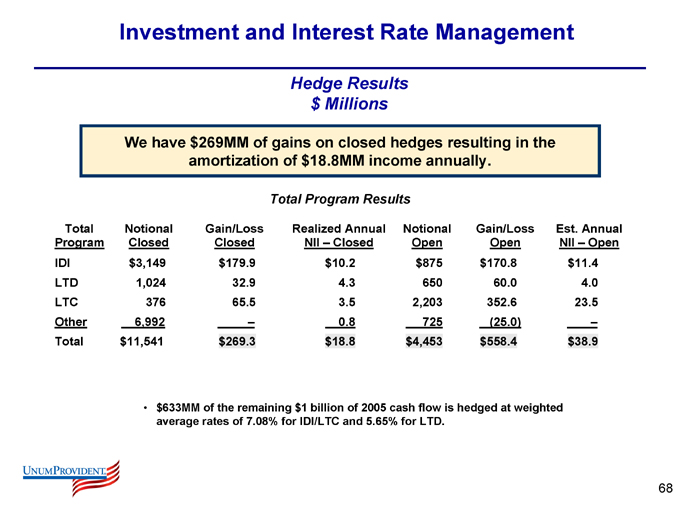
Hedge Results $ Millions
We have $269MM of gains on closed hedges resulting in the amortization of $18.8MM income annually.
Total Program Results
Total Notional Gain/Loss Realized Annual Notional Gain/Loss Est. Annual
Program Closed Closed NII – Closed Open Open NII – Open
IDI $3,149 $179.9 $10.2 $875 $170.8 $11.4
LTD 1,024 32.9 4.3 650 60.0 4.0
LTC 376 65.5 3.5 2,203 352.6 23.5
Other 6,992 – 0.8 725 (25.0) –
Total $11,541 $269.3 $18.8 $4,453 $558.4 $38.9
$633MM of the remaining $1 billion of 2005 cash flow is hedged at weighted average rates of 7.08% for IDI/LTC and 5.65% for LTD.
68
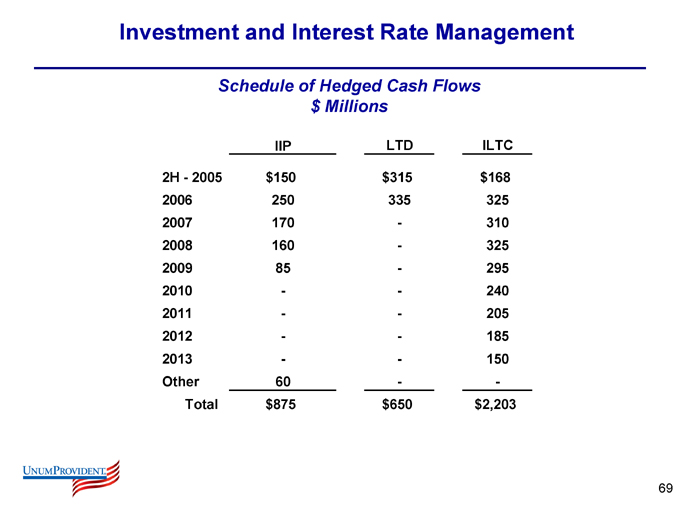
Investment and Interest Rate Management
Schedule of Hedged Cash Flows $ Millions
IIP LTD ILTC
2H - 2005 $150 $315 $168
2006 250 335 325
2007 170 — 310
2008 160 — 325
2009 85 — 295
2010 — — 240
2011 — — 205
2012 — — 185
2013 — — 150
Other 60 — —
Total $875 $650 $2,203
69
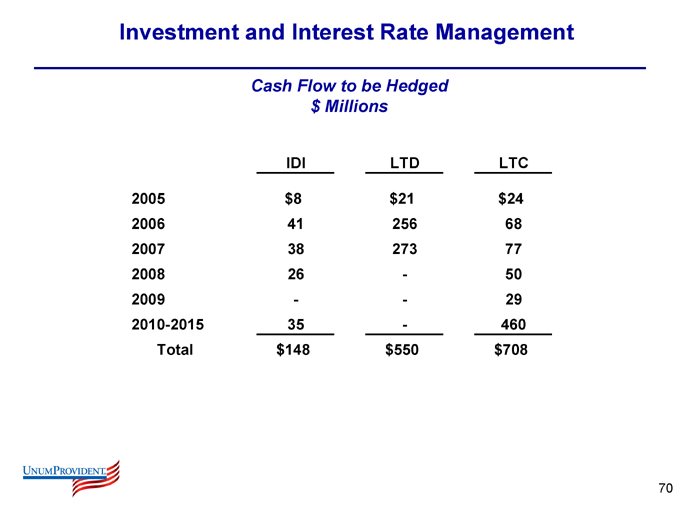
Investment and Interest Rate Management
Cash Flow to be Hedged $ Millions
IDI LTD LTC
2005 $8 $21 $24
2006 41 256 68
2007 38 273 77
2008 26 — 50
2009 — — 29
2010-2015 35 — 460
Total $148 $550 $708
70
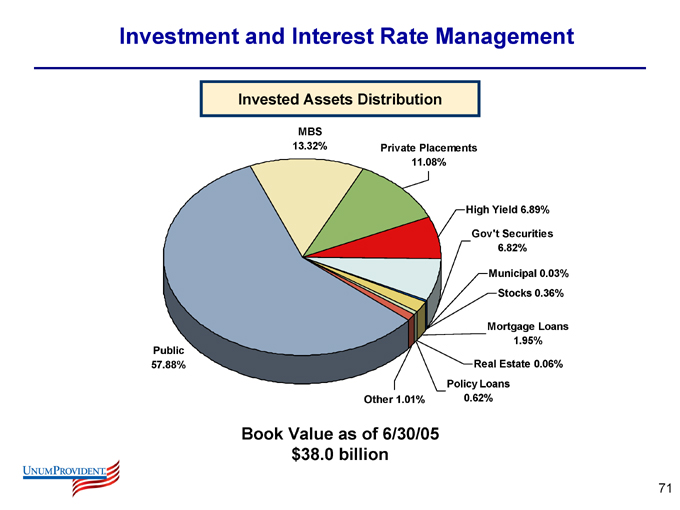
Investment and Interest Rate Management
Invested Assets Distribution
MBS 13.32%
Private Placements 11.08%
High Yield 6.89%
Gov’t Securities 6.82%
Municipal 0.03%
Stocks 0.36%
Mortgage Loans 1.95%
Real Estate 0.06%
Policy Loans 0.62%
Other 1.01%
Public 57.88%
Book Value as of 6/30/05 $38.0 billion
71
Investment and Interest Rate Management
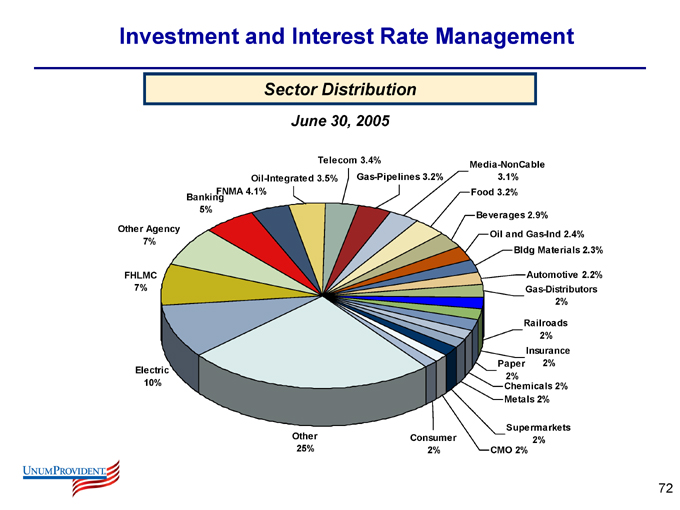
Sector Distribution
June 30, 2005
Electric 10%
FHLMC
7%
Other Agency 7%
FNMA 4.1% Banking 5%
Oil-Integrated 3.5%
Telecom 3.4%
Gas-Pipelines 3.2%
Media-NonCable 3.1%
Food 3.2%
Beverages 2.9%
Oil and Gas-Ind 2.4%
Bldg Materials 2.3%
Automotive 2.2% Gas-Distributors 2%
Railroads 2%
Insurance 2%
Paper 2%
Chemicals 2%
Metals 2%
Supermarkets 2%
CMO 2%
Consumer 2%
Other 25%
72
Investment and Interest Rate Management
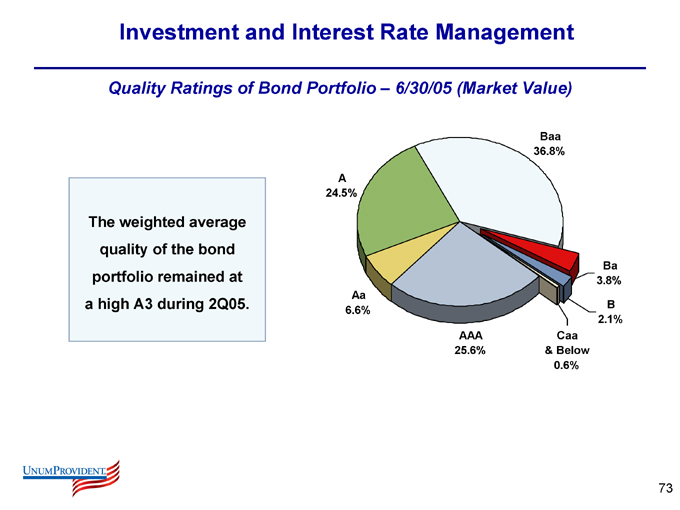
Quality Ratings of Bond Portfolio – 6/30/05 (Market Value)
The weighted average quality of the bond portfolio remained at a high A3 during 2Q05.
A 24.5%
Aa 6.6%
AAA 25.6%
Caa & Below 0.6%
B 2.1%
Ba 3.8%
Baa 36.8%
73

Regulatory Update
74
California Settlement
Summary
Key terms of settlement:
Fine
Reassessment of 1997-2005 and changed claim practices
New policy forms – Group LTD and IIP approved for use November 1, 2005
California Department of Insurance intention to apply same standards to entire insurance industry
Non-recurring charge of $51.6 million after-tax
California Specific
Expenses to administer the re-assessment (approximately 26,000 claims)
Additional benefits to be paid under new total disability guidelines and other policy interpretations on existing open claims Benefit costs and reserves reopened from the reassessment Disruption due to implementation Fine of $8 million
Multi-State Agreement
Amendments to the multi-state agreement to include notice to certain 1997-1999 claims (approximately 29,500 claims)
Additional Reassessments
Reassessment of reinsurance assumed and ASO business (approximately 24,000 claims)
75
California Settlement
Summary
(cont.)
On-going Impact:
New interpretations will pressure California based earnings for UNM and entire industry. New interpretations suggest price increases are needed on LTD.
Clients will either pay higher premium or buy a product with reduced benefits to offset increased costs.
We have built monitoring mechanisms for:
Claims activity: What claim outcomes are we experiencing Renewal activity: What rate levels are sticking Sales activity: bid/ask spread on quotes
Cost reductions are likely to help offset the expected profit pressure on California business.
76
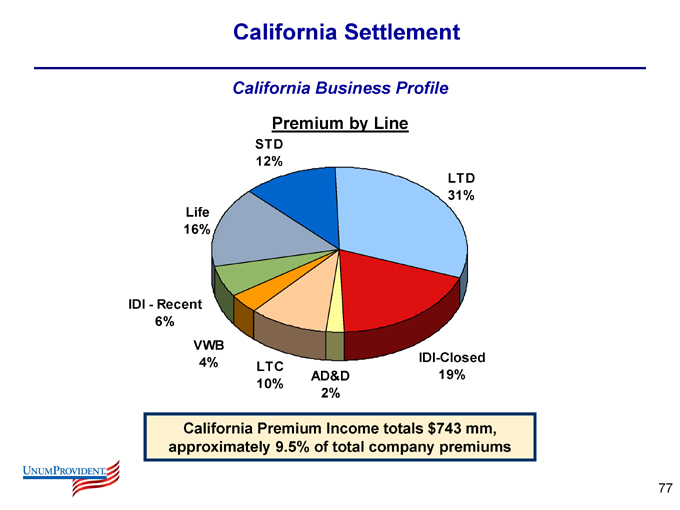
California Settlement
California Business Profile
Premium by Line
STD 12%
Life 16%
IDI - - Recent 6%
VWB 4%
LTC 10%
AD&D
2%
IDI-Closed 19%
LTD 31%
California Premium Income totals $743 mm, approximately 9.5% of total company premiums
77
Reassessment Update
The emerging performance is consistent with the original assumptions used to develop the $127 million charge. Reserves continue to be adequate.
Results as of September 30, 2005
232,483 notices mailed
27.4% opt-in rate
20.7% completion rate of reassessment information forms
87.2% uphold rate on reassessment decisions
78

Summary
79
Summary
Financial goals of double digit BTOE growth over the next three years from operational improvements while generating $1 billion of excess capital
Performance Manage U.S. Brokerage
Optimize capital allocations to various businesses Free Cash Flow First to Leverage Continue Disciplined Risk Management
80

Questions
81

2005 Investor Meeting October 17, 2005
The Business Reviews

Business Review - U.S. Brokerage
84
Business Review – U.S. Brokerage
Introduction
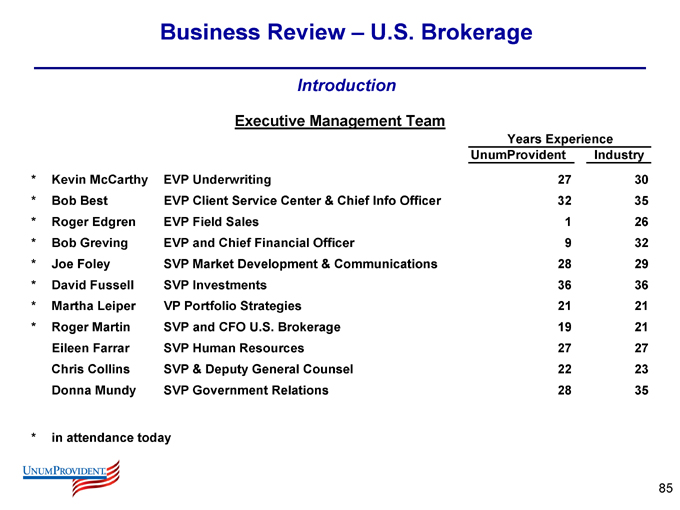
Executive Management Team
Years Experience
UnumProvident Industry
Kevin McCarthy EVP Underwriting 27 30
Bob Best EVP Client Service Center & Chief Info Officer 32 35
Roger Edgren EVP Field Sales 1 26
Bob Greving EVP and Chief Financial Officer 9 32
Joe Foley SVP Market Development & Communications 28 29
David Fussell SVP Investments 36 36
Martha Leiper VP Portfolio Strategies 21 21
Roger Martin SVP and CFO U.S. Brokerage 19 21
Eileen Farrar SVP Human Resources 27 27
Chris Collins SVP & Deputy General Counsel 22 23
Donna Mundy SVP Government Relations 28 35
in attendance today
85
Business Review – U.S. Brokerage
Introduction
Our U.S. Brokerage business is the largest part of UnumProvident, and its results are the largest potential driver of improvement in shareholder value.
The lynchpin of our U.S. Brokerage business is our Group Income Protection franchise.
The long-term characteristics of the Group Income Protection business are favorable:
Inforce premium growth potential of 2% to 4% more than GDP
Cyclical business that must be managed accordingly; profitable disciplined growth
Our position in the market remains outstanding.
Market share is down slightly but still a competitive strength
Customer surveys and business retention suggest our “franchise” is very much intact
86
Business Review – U.S. Brokerage
Introduction
Our immediate focus is on continuing to improve the profitability of the “core” Group Income Protection line.
Multi-year strategy launched in 2003 following corporate restructuring
Claims disruption from multi-state settlement has masked the improvement in 2005 While the core is being improved, the balance of U.S. Brokerage is performing at solid, but not target levels
Our bottom line objective is to improve the before tax margins of the U.S. Brokerage operations to 12%-13% over the next 2 years, with a corresponding target ROE range of 9%-11%.
Primary driver of this improvement must be our Group Income Protection line.
87
Business Review – U.S. Brokerage
Financial and Risk Profile
Price to book value (x)
2.75
2.50
2.25
2.00
1.75
1.50
1.25
1.00
0.75
0.50
0.25
0.00
0
5
10
15
20
25
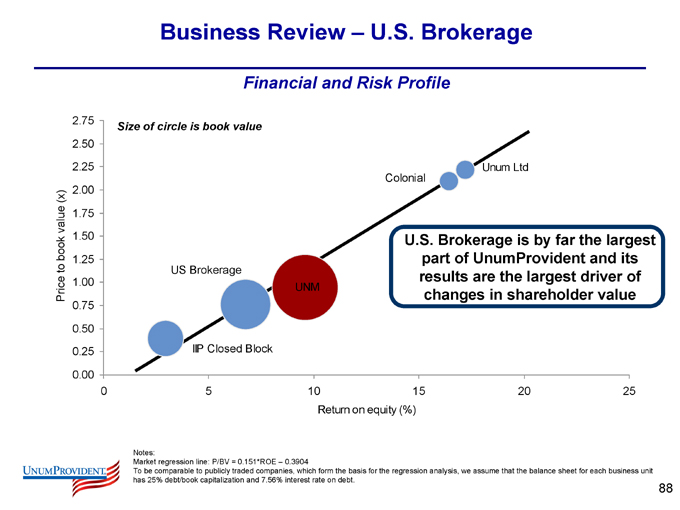
Size of circle is book value
US Brokerage
Colonial
Unum Ltd
UNM
IIP Closed Block
U.S. Brokerage is by far the largest part of UnumProvident and its results are the largest driver of changes in shareholder value
Return on equity (%)
Notes:
Market regression line: P/BV = 0.151*ROE – 0.3904
To be comparable to publicly traded companies, which form the basis for the regression analysis, we assume that the balance sheet for each business unit has 25% debt/book capitalization and 7.56% interest rate on debt.
88
Business Review – U.S. Brokerage
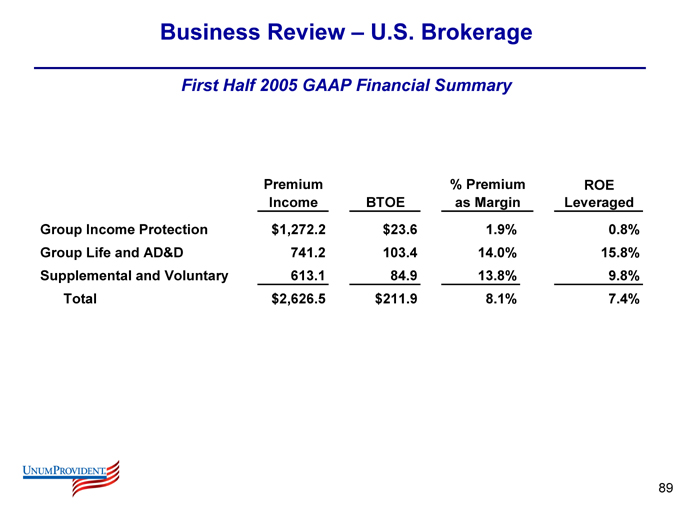
First Half 2005 GAAP Financial Summary
Premium Income
% Premium ROE
BTOE as Margin Leveraged
Group Income Protection $1,272.2 $23.6 1.9% 0.8%
Group Life and AD&D 741.2 103.4 14.0% 15.8%
Supplemental and Voluntary 613.1 84.9 13.8% 9.8%
Total $2,626.5 $211.9 8.1% 7.4%
89
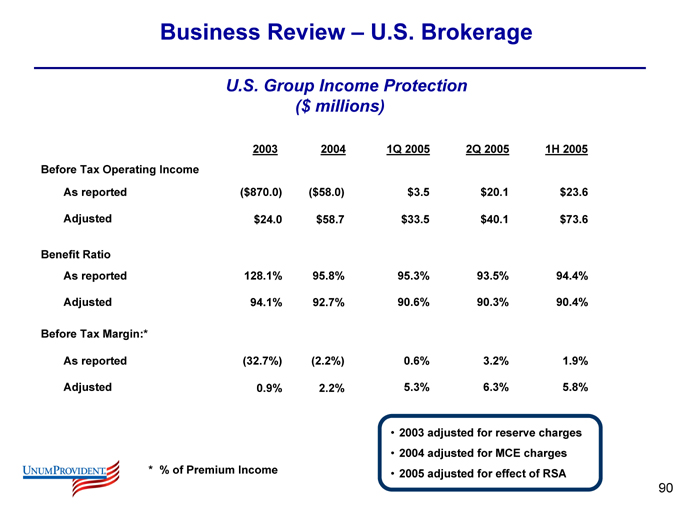
Business Review – U.S. Brokerage
U.S. Group Income Protection ($millions)
2003 2004 1Q 2005 2Q 2005 1H 2005
Before Tax Operating Income
As reported ($870.0) ($58.0) $3.5 $20.1 $23.6
Adjusted $24.0 $58.7 $33.5 $40.1 $73.6
Benefit Ratio
As reported 128.1% 95.8% 95.3% 93.5% 94.4%
Adjusted 94.1% 92.7% 90.6% 90.3% 90.4%
Before Tax Margin:*
As reported (32.7%) (2.2%) 0.6% 3.2% 1.9%
Adjusted 0.9% 2.2% 5.3% 6.3% 5.8%
% of Premium Income
2003 adjusted for reserve charges 2004 adjusted for MCE charges 2005 adjusted for effect of RSA
90
Operational Plans
91
Business Review – U.S. Brokerage
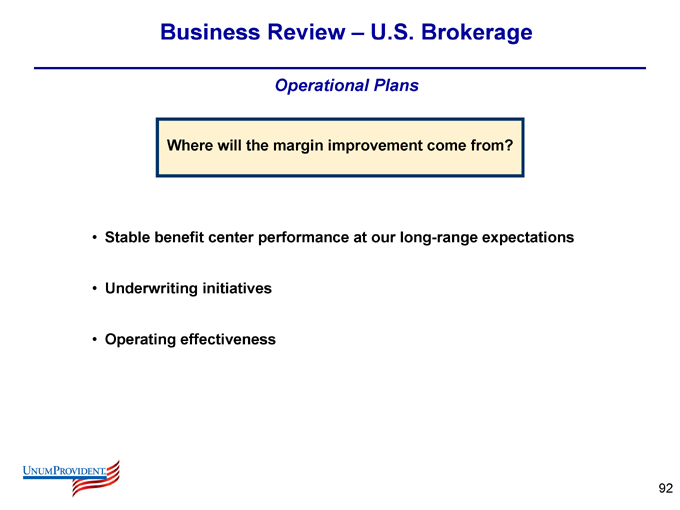
Operational Plans
Where will the margin improvement come from?
Stable benefit center performance at our long-range expectations Underwriting initiatives Operating effectiveness
92

Business Review – U.S. Brokerage
Operational Plans
Stable Benefit Center Performance at our long range expectations
Our immediate focus is on reducing the disruption associated with the implementation of the Regulatory Settlement Agreement.
Operating performance improved in 2Q compared to 1Q with monthly improvement in the quarter.
Disruption will continue in 2H-2005, but expected to continue to decline.
Our business plans to return to long-range performance include:
Improve inventory management and performance tracking.
Align resources with opportunity areas throughout the claims organization. Minimize process content within the Disability Benefit Specialist (DBS) role. Implement changes from California agreement.
93
Business Review – U.S. Brokerage
Operational Plans
Stable Benefit Center Performance at our long range expectations
Reassessment mailing and claims review continue to progress.
Early results consistent with expectations.
Continue efforts toward achieving quality and performance.
Reduce operating costs – NOT at the expense of quality and performance.
94
Business Review – U.S. Brokerage
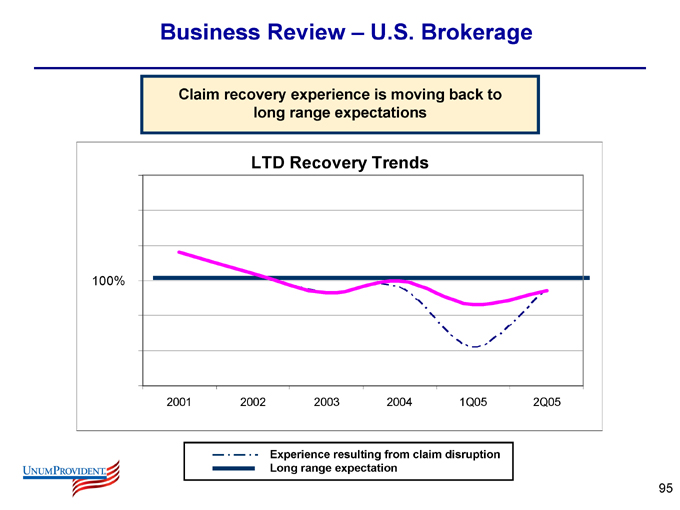
Claim recovery experience is moving back to long range expectations
LTD Recovery Trends
100%
2001
2002
2003
2004
1Q05
2Q05
Experience resulting from claim disruption Long range expectation
95
Business Review – U.S. Brokerage
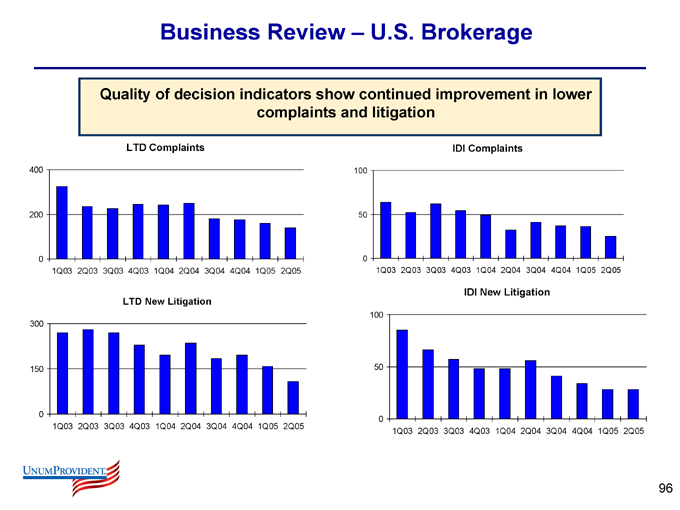
Quality of decision indicators show continued improvement in lower complaints and litigation
LTD Complaints
400
200
0
1Q03 2Q03 3Q03 4Q03 1Q04 2Q04 3Q04 4Q04 1Q05 2Q05
IDI Complaints
100
50
0
1Q03 2Q03 3Q03 4Q03 1Q04 2Q04 3Q04 4Q04 1Q05 2Q05
LTD New Litigation
300
150
0
1Q03 2Q03 3Q03 4Q03 1Q04 2Q04 3Q04 4Q04 1Q05 2Q05
IDI New Litigation
100
50
0
1Q03 2Q03 3Q03 4Q03 1Q04 2Q04 3Q04 4Q04 1Q05 2Q05
96
Business Review – U.S. Brokerage
Underwriting Initiatives
Our underwriting strategy: Continue to stay the course
Selectively increase new business pricing Execute renewal program Manage persistency Shift new sales toward desired segments Increased emphasis on segmentation
97
Business Review – U.S. Brokerage
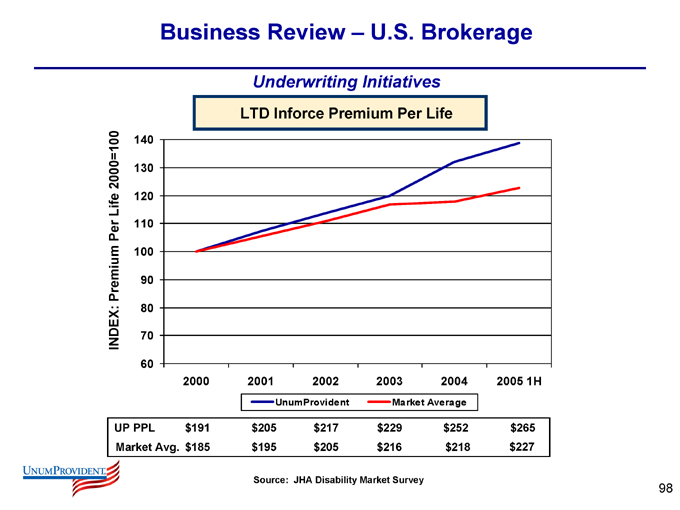
Underwriting Initiatives
LTD Inforce Premium Per Life
INDEX: Premium Per Life 2000=100
140
130
120
110
100
90
80
70
60
2000
2001
2002
2003
2004
2005 1H
UnumProvident
Market Average
UP PPL
$191 $205 $217 $229 $252 $265
Market Avg.
$185 $195 $205 $216 $218 $227
Source: JHA Disability Market Survey
98
Business Review – U.S. Brokerage
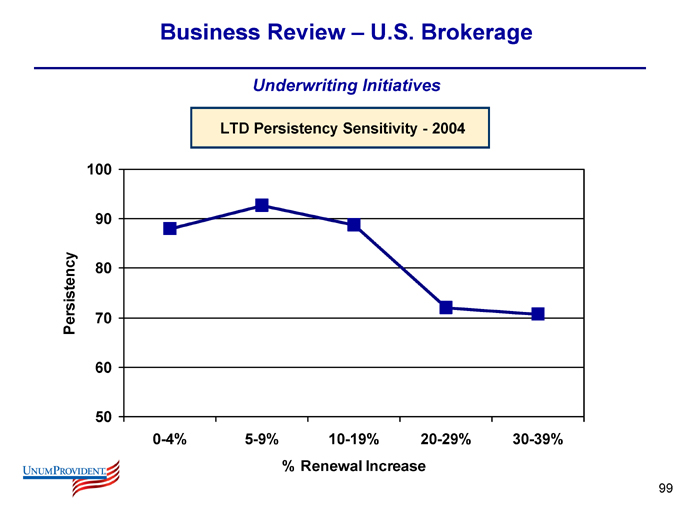
Underwriting Initiatives
LTD Persistency Sensitivity - 2004
Persistency
100
90
80
70
60
50
0-4%
5-9%
10-19%
20-29%
30-39%
% Renewal Increase
99
Business Review – U.S. Brokerage
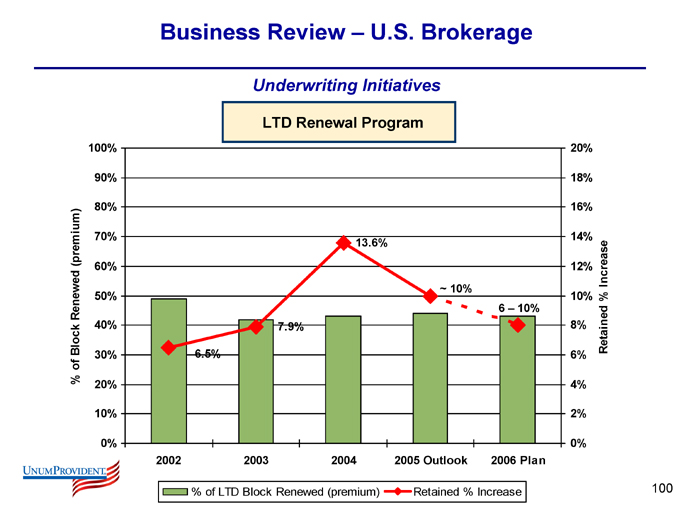
Underwriting Initiatives
LTD Renewal Program
% of Block Renewed (premium)
100%
90%
80%
70%
60%
50%
40%
30%
20%
10%
0%
6.5%
7.9%
13.6%
~ 10%
6 – 10%
20%
18%
16%
14%
12%
10%
8%
6%
4%
2%
0%
Retained % Increase
2002
2003
2004
2005 Outlook
2006 Plan
% of LTD Block Renewed (premium)
Retained % Increase
100
Business Review – U.S. Brokerage
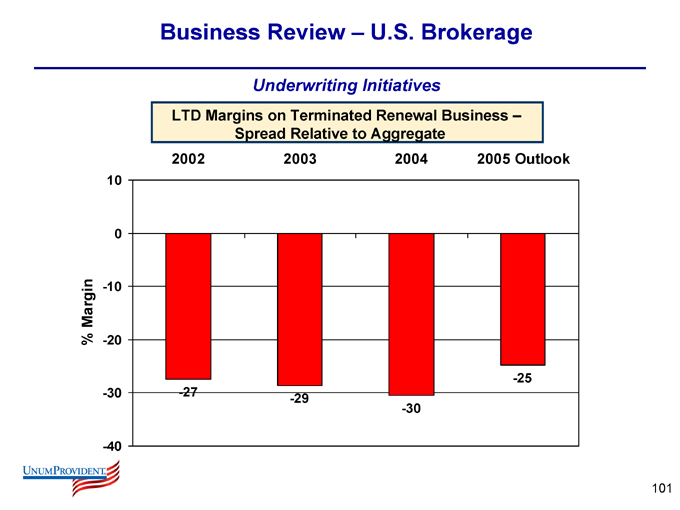
Underwriting Initiatives
LTD Margins on Terminated Renewal Business – Spread Relative to Aggregate
2002 2003 2004 2005 Outlook
% Margin
10 0 -10 -20 -30 -40
-27
-29
-30
-25
101
Business Review – U.S. Brokerage
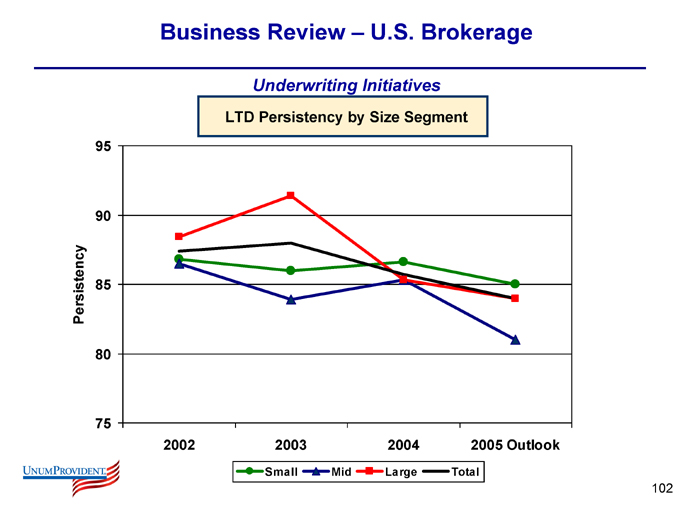
Underwriting Initiatives
LTD Persistency by Size Segment
Persistency
95 90 85 80 75
2002
2003
2004
2005 Outlook
Small
Mid
Large
Total
102
Business Review – U.S. Brokerage
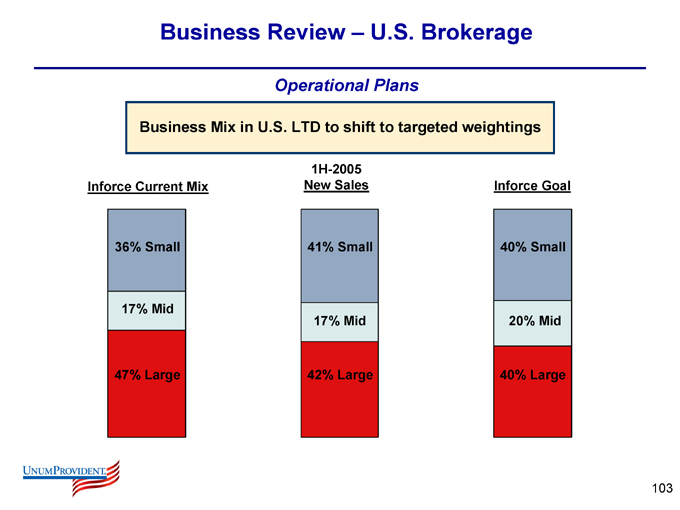
Operational Plans
Business Mix in U.S. LTD to shift to targeted weightings
Inforce Current Mix
36% Small
17% Mid
47% Large
1H-2005 New Sales
41% Small
17% Mid
42% Large
Inforce Goal
40% Small
20% Mid
40% Large
103
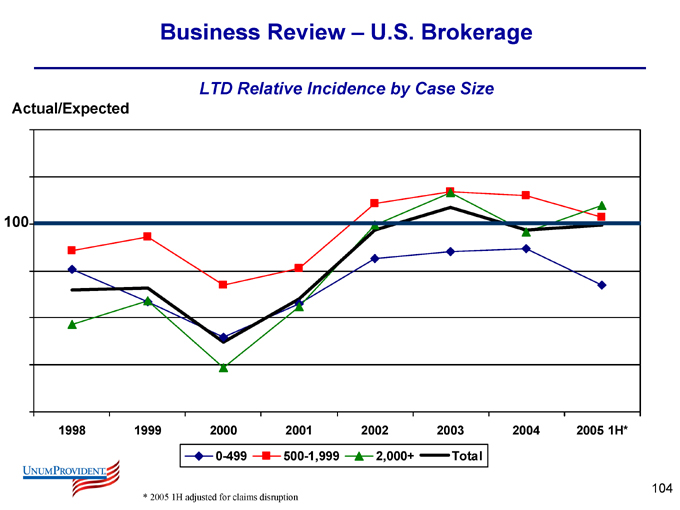
Business Review – U.S. Brokerage
LTD Relative Incidence by Case Size
Actual/Expected
100
1998
1999
2000
2001
2002
2003
2004
2005 1H*
0-499
500-1,999
2,000+
Total
* 2005 1H adjusted for claims disruption
104
Business Review – U.S. Brokerage
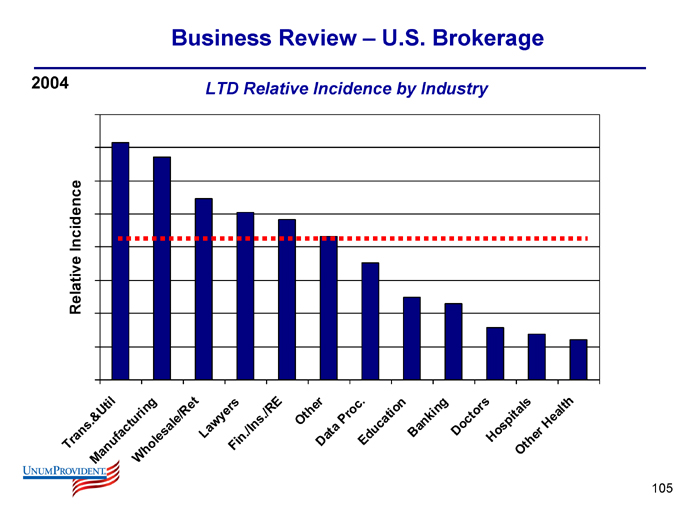
2004
LTD Relative Incidence by Industry
Relative Incidence
Trans. &Util
Manuf acturing
Wholesale/Ret
Lawyers
Fin.
/Ins.
/RE
Other
Data
Proc.
Education
Banking Doctors
Hospitals
Other
Health
105
Business Review – U.S. Brokerage
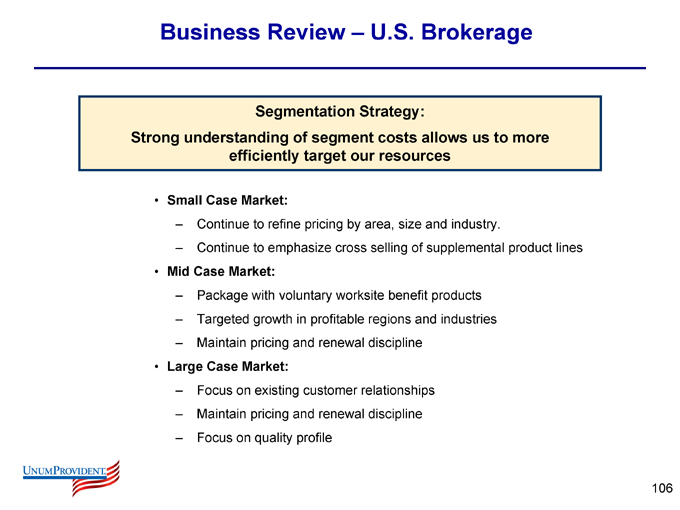
Segmentation Strategy:
Strong understanding of segment costs allows us to more efficiently target our resources
Small Case Market:
Continue to refine pricing by area, size and industry.
Continue to emphasize cross selling of supplemental product lines
Mid Case Market:
Package with voluntary worksite benefit products
Targeted growth in profitable regions and industries
Maintain pricing and renewal discipline
Large Case Market:
Focus on existing customer relationships
Maintain pricing and renewal discipline
Focus on quality profile
106
Operating Effectiveness
107
Business Review – U.S. Brokerage
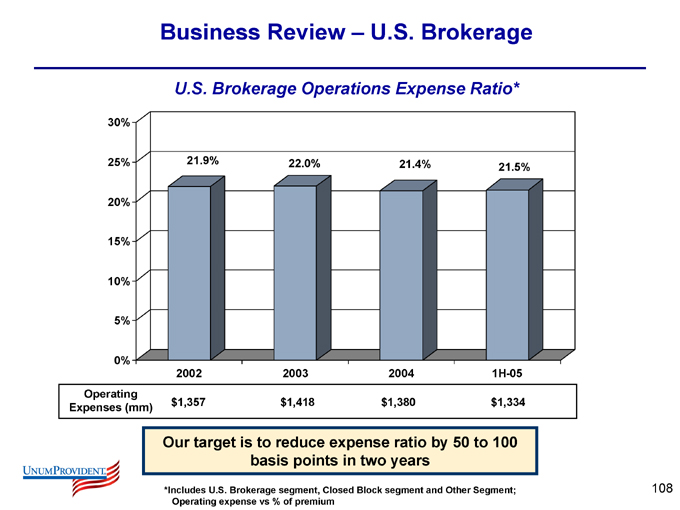
U.S. Brokerage Operations Expense Ratio*
30% 25% 20% 15% 10% 5% 0%
21.9%
22.0%
21.4%
21.5%
2002
2003
2004
1H-05
Operating Expenses (mm) $1,357 $1,418 $1,380 $1,334
Our target is to reduce expense ratio by 50 to 100 basis points in two years
*Includes U.S. Brokerage segment, Closed Block segment and Other Segment; Operating expense vs % of premium
108
Business Review – U.S. Brokerage
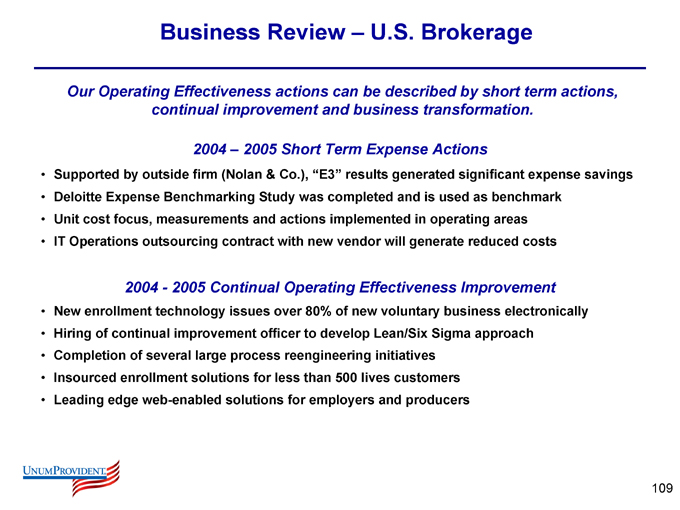
Our Operating Effectiveness actions can be described by short term actions, continual improvement and business transformation.
2004 – 2005 Short Term Expense Actions
Supported by outside firm (Nolan & Co.), “E3” results generated significant expense savings
Deloitte Expense Benchmarking Study was completed and is used as benchmark
Unit cost focus, measurements and actions implemented in operating areas
IT Operations outsourcing contract with new vendor will generate reduced costs
2004—2005 Continual Operating Effectiveness Improvement
New enrollment technology issues over 80% of new voluntary business electronically
Hiring of continual improvement officer to develop Lean/Six Sigma approach
Completion of several large process reengineering initiatives
Insourced enrollment solutions for less than 500 lives customers
Leading edge web-enabled solutions for employers and producers
109
Business Review – U.S. Brokerage
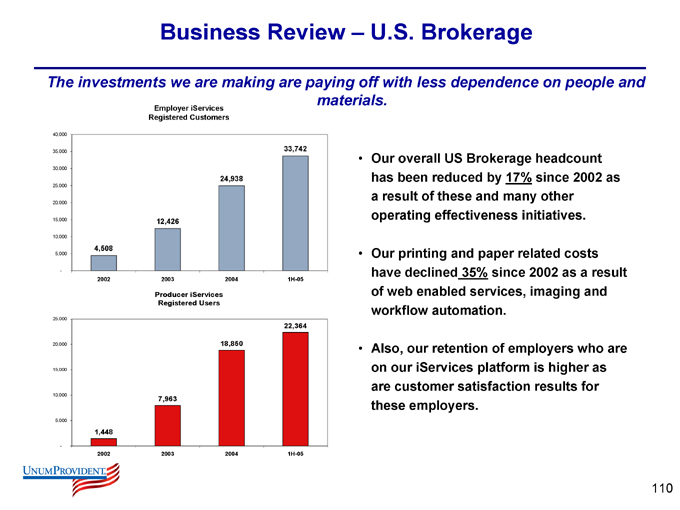
The investments we are making are paying off with less dependence on people and materials.
Employer iServices Registered Customers
40,000 35,000 30,000 25,000 20,000 15,000 10,000 5,000 -
4,508
12,426
24,938
33,742
2002
2003
2004
1H-05
Producer iServices Registered Users
25,000 20,000 15,000 10,000 5,000 -
1,448
7,963
18,850
22,364
2002
2003
2004
1H-05
Our overall US Brokerage headcount has been reduced by 17% since 2002 as a result of these and many other operating effectiveness initiatives.
Our printing and paper related costs have declined 35% since 2002 as a result of web enabled services, imaging and workflow automation.
Also, our retention of employers who are on our iServices platform is higher as are customer satisfaction results for these employers.
110
Business Review – U.S. Brokerage
Earlier this year we began an initiative that will transform our small and mid size group and supplemental market (approximately 30% of expense base):
The following solutions are being undertaken to begin a transformation of our operations:
A single integrated customer administration technology platform for group, voluntary and multi life products
Simplified and integrated product solutions
Customer-oriented processes vs. product, function or line of business
Broadened use of web-enabled self service solutions including CRM solutions
Centralized account management and best in class contact center technology
Provide local enrollment utilizing our new Plane.biz enrollment technology
We expect this transformation to enable us to be the lowest unit cost provider in this market and we have benchmarked ourselves against our competitors accordingly.
We also expect gains in the areas of employer customer retention, participation levels, speed to market while maintaining our leading customer satisfaction.
111

Other U.S. Brokerage Product Lines
112
Business Review – U.S. Brokerage
Other U.S. Brokerage Product Lines
Group Life and AD&D
Supplemental and Voluntary
Individual Income Protection
Long-term Care
Voluntary Worksite Benefits
Whole life
ISTD
Critical Illness
Accident
MedSupport
113
Business Review – Other U.S. Brokerage Product Lines
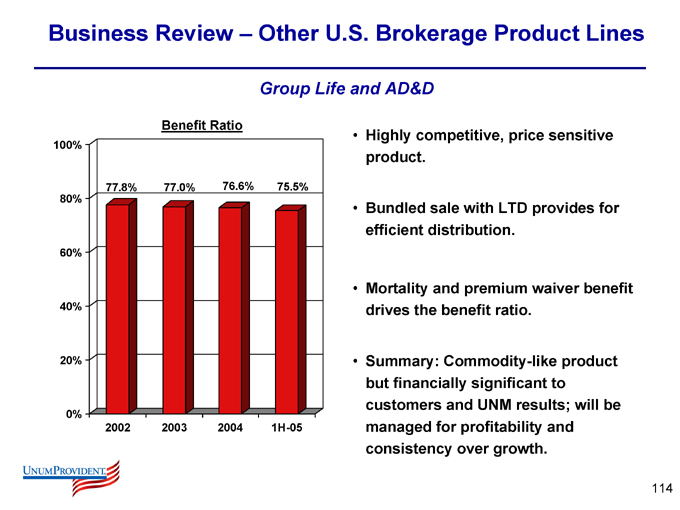
Group Life and AD&D
Benefit Ratio
100% 80% 60% 40% 20% 0%
77.8%
77.0%
76.6%
75.5%
2002
2003
2004
1H-05
Highly competitive, price sensitive product.
Bundled sale with LTD provides for efficient distribution.
Mortality and premium waiver benefit drives the benefit ratio.
Summary: Commodity-like product but financially significant to customers and UNM results; will be managed for profitability and consistency over growth.
114
Business Review – Other U.S. Brokerage Product Lines
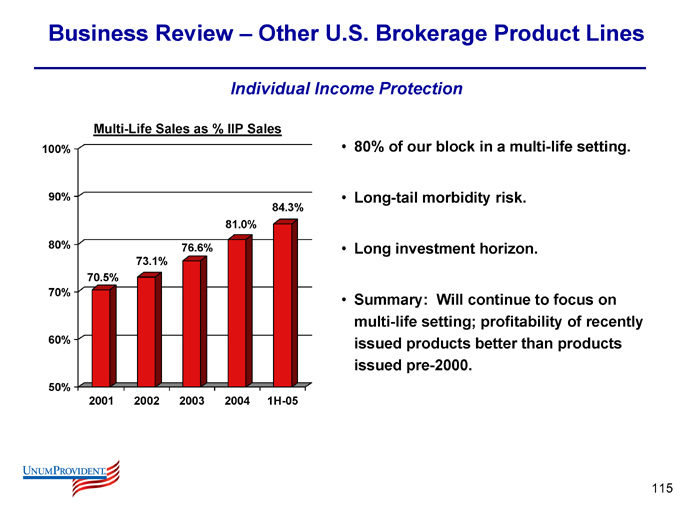
Individual Income Protection
Multi-Life Sales as % IIP Sales
100% 90% 80% 70% 60% 50%
70.5%
73.1%
76.6%
81.0%
84.3%
2001
2002
2003
2004
1H-05
80% of our block in a multi-life setting.
Long-tail morbidity risk.
Long investment horizon.
Summary: Will continue to focus on multi-life setting; profitability of recently issued products better than products issued pre-2000.
115
Business Review – Other U.S. Brokerage Product Lines
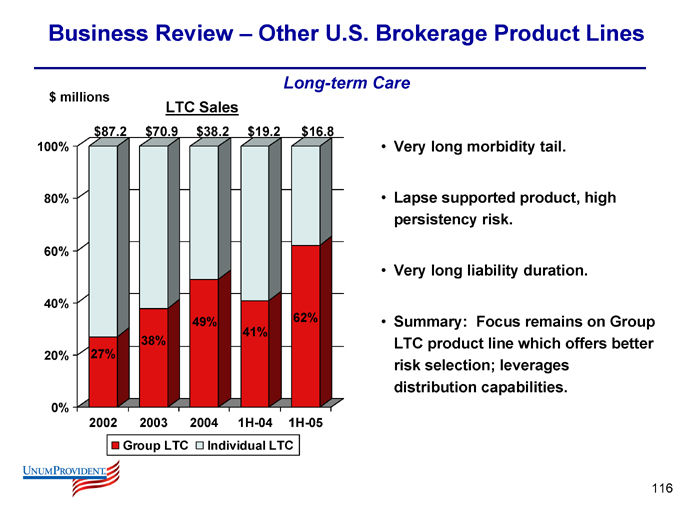
Long-term Care $ millions
LTC Sales
100% 80% 60% 40% 20% 0% $87.2 $70.9 $38.2 $19.2 $16.8
27%
38%
49%
41%
62%
2002
2003
2004
1H-04
1H-05
Group LTC
Individual LTC
Very long morbidity tail.
Lapse supported product, high persistency risk.
Very long liability duration.
Summary: Focus remains on Group LTC product line which offers better risk selection; leverages distribution capabilities.
116
Business Review – Other U.S. Brokerage Product Lines
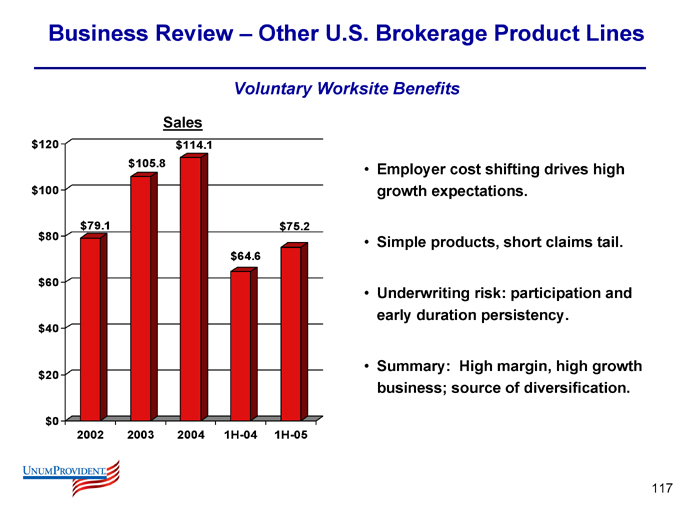
Voluntary Worksite Benefits
Sales $120 $100 $80 $60 $40
$20
$0 $79.1 $105.8 $114.1 $64.6 $75.2
2002
2003
2004
1H-04
1H-05
Employer cost shifting drives high growth expectations.
Simple products, short claims tail.
Underwriting risk: participation and early duration persistency.
Summary: High margin, high growth business; source of diversification.
117

Competitive Position
118
Top Carriers by Inforce Premium
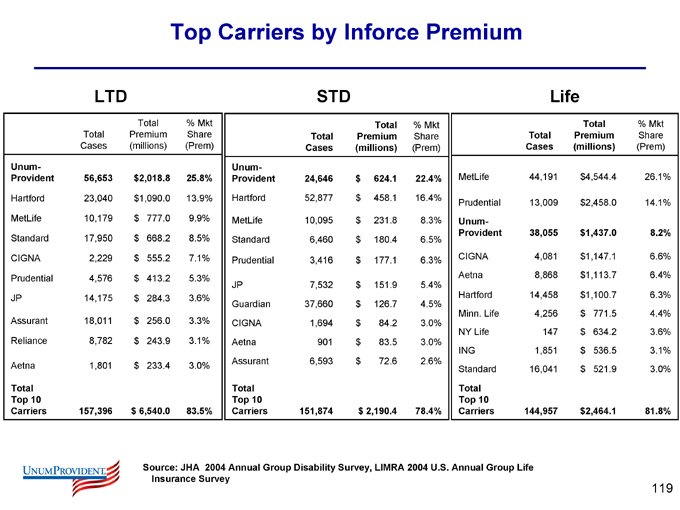
LTD
Total Cases Total Premium (millions) % Mkt Share (Prem)
Unum- Provident 56,653 $2,018.8 25.8%
Hartford 23,040 $1,090.0 13.9%
MetLife 10,179 $777.0 9.9%
Standard 17,950 $668.2 8.5%
CIGNA 2,229 $555.2 7.1%
Prudential 4,576 $413.2 5.3%
JP 14,175 $284.3 3.6%
Assurant 18,011 $256.0 3.3%
Reliance 8,782 $243.9 3.1%
Aetna 1,801 $233.4 3.0%
Total Top 10 Carriers 157,396 $6,540.0 83.5%
STD
Total Cases Total Premium (millions) % Mkt Share (Prem)
Unum- Provident 24,646 $624.1 22.4%
Hartford 52,877 $458.1 16.4%
MetLife 10,095 $231.8 8.3%
Standard 6,460 $180.4 6.5%
Prudential 3,416 $177.1 6.3%
JP 7,532 $151.9 5.4%
Guardian 37,660 $126.7 4.5%
CIGNA 1,694 $84.2 3.0%
Aetna 901 $83.5 3.0%
Assurant 6,593 $72.6 2.6%
Total Top 10 Carriers 151,874 $2,190.4 78.4%
Life
Total Cases Total Premium (millions) % Mkt Share (Prem)
MetLife 44,191 $4,544.4 26.1%
Prudential 13,009 $2,458.0 14.1%
Unum-
Provident 38,055 $1,437.0 8.2%
CIGNA 4,081 $1,147.1 6.6%
Aetna 8,868 $1,113.7 6.4%
Hartford 14,458 $1,100.7 6.3%
Minn. Life 4,256 $771.5 4.4%
NY Life 147 $634.2 3.6%
ING 1,851 $536.5 3.1%
Standard 16,041 $521.9 3.0%
Total Top 10 Carriers 144,957 $2,464.1 81.8%
Source: JHA 2004 Annual Group Disability Survey, LIMRA 2004 U.S. Annual Group Life
Insurance Survey
119
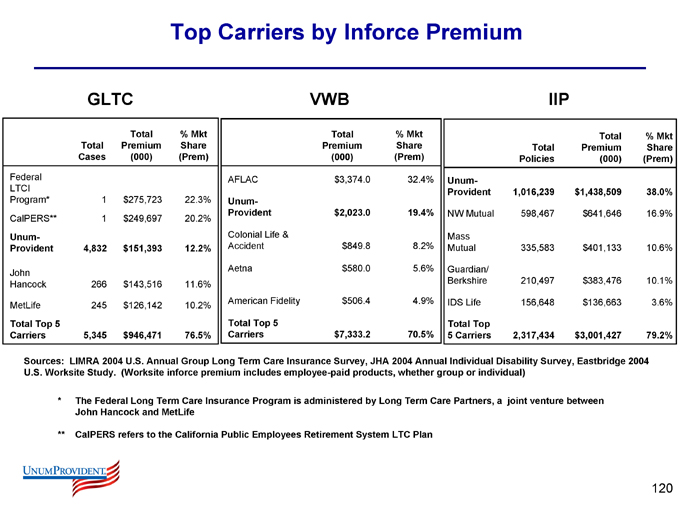
Top Carriers by Inforce Premium
GLTC
Total Cases Total Premium (000) % Mkt Share (Prem)
Federal LTCI Program* 1 $275,723 22.3%
CalPERS** 1 $249,697 20.2%
Unum-
Provident 4,832 $151,393 12.2%
John
Hancock 266 $143,516 11.6%
MetLife 245 $126,142 10.2%
Total Top 5 Carriers 5,345 $946,471 76.5%
VWB
Total Premium (000) % Mkt Share (Prem)
AFLAC $3,374.0 32.4%
Unum- Provident $2,023.0 19.4%
Colonial Life &
Accident $849.8 8.2%
Aetna $580.0 5.6%
American Fidelity $506.4 4.9%
Total Top 5 Carriers $7,333.2 70.5%
IIP
Total Policies Total Premium (000) % Mkt Share (Prem)
Unum- Provident 1,016,239 $1,438,509 38.0%
NW Mutual 598,467 $641,646 16.9%
Mass
Mutual 335,583 $401,133 10.6%
Guardian/
Berkshire 210,497 $383,476 10.1%
IDS Life 156,648 $136,663 3.6%
Total Top 5 Carriers 2,317,434 $3,001,427 79.2%
Sources: LIMRA 2004 U.S. Annual Group Long Term Care Insurance Survey, JHA 2004 Annual Individual Disability Survey, Eastbridge 2004 U.S. Worksite Study. (Worksite inforce premium includes employee-paid products, whether group or individual)
* The Federal Long Term Care Insurance Program is administered by Long Term Care Partners, a joint venture between John Hancock and MetLife
** CalPERS refers to the California Public Employees Retirement System LTC Plan
120
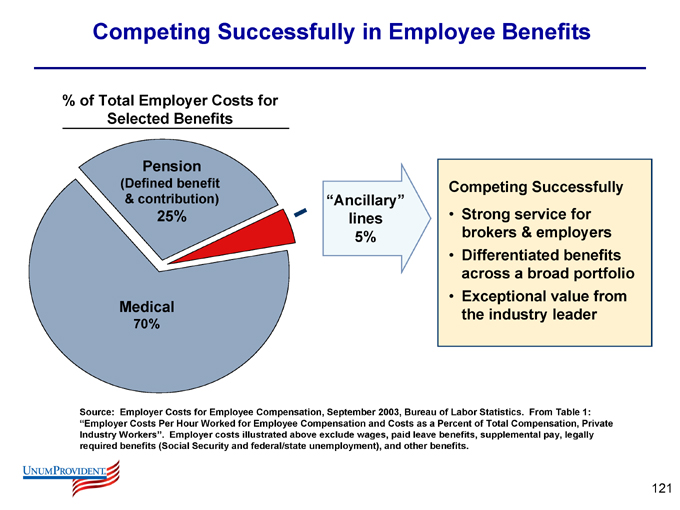
Competing Successfully in Employee Benefits
% of Total Employer Costs for Selected Benefits
Pension
(Defined benefit & contribution)
25%
Medical
70%
“Ancillary” lines 5%
Competing Successfully
Strong service for brokers & employers
Differentiated benefits across a broad portfolio
Exceptional value from the industry leader
Source: Employer Costs for Employee Compensation, September 2003, Bureau of Labor Statistics. From Table 1: “Employer Costs Per Hour Worked for Employee Compensation and Costs as a Percent of Total Compensation, Private Industry Workers”. Employer costs illustrated above exclude wages, paid leave benefits, supplemental pay, legally required benefits (Social Security and federal/state unemployment), and other benefits.
121
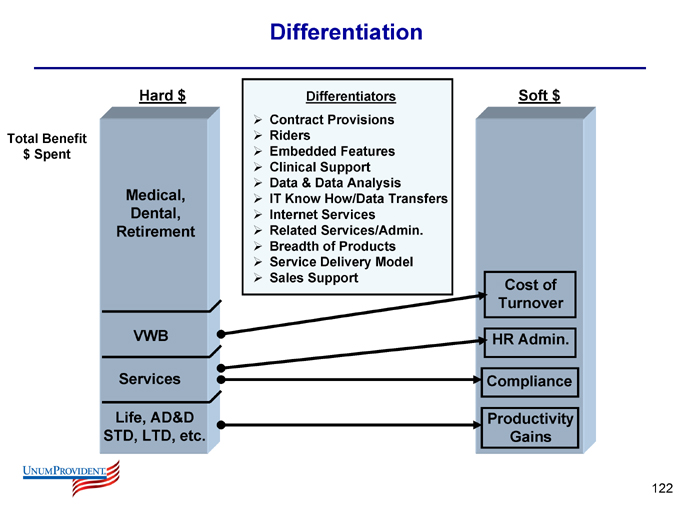
Differentiation
Hard $
Total Benefit $ Spent
Medical, Dental, Retirement
VWB
Services
Life, AD&D STD, LTD, etc.
Differentiators
Contract Provisions
Riders
Embedded Features
Clinical Support
Data & Data Analysis
IT Know How/Data Transfers
Internet Services
Related Services/Admin.
Breadth of Products
Service Delivery Model
Sales Support
Soft $
Cost of Turnover
HR Admin.
Compliance
Productivity Gains
122
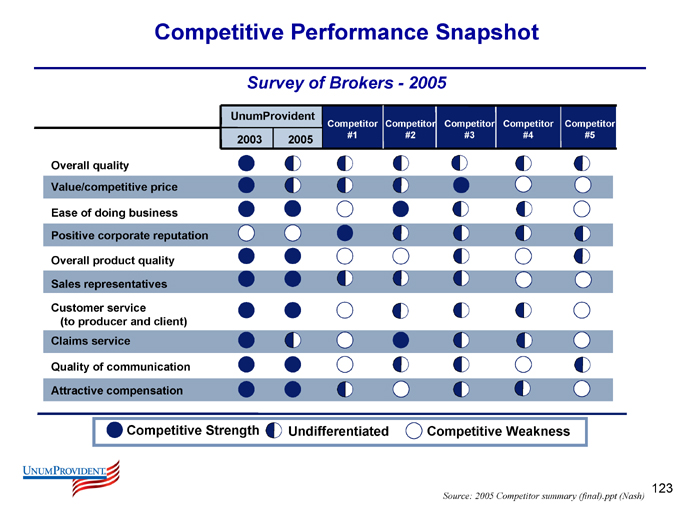
Competitive Performance Snapshot
Survey of Brokers - 2005
UnumProvident
Competitor Competitor Competitor Competitor Competitor 2003 2005 #1 #2 #3 #4 #5
Overall quality
Value/competitive price
Ease of doing business Positive corporate reputation
Overall product quality
Sales representatives
Customer service (to producer and client) Claims service
Quality of communication
Attractive compensation
Competitive Strength
Undifferentiated
Competitive Weakness
Source: 2005 Competitor summary (final).ppt (Nash)
123
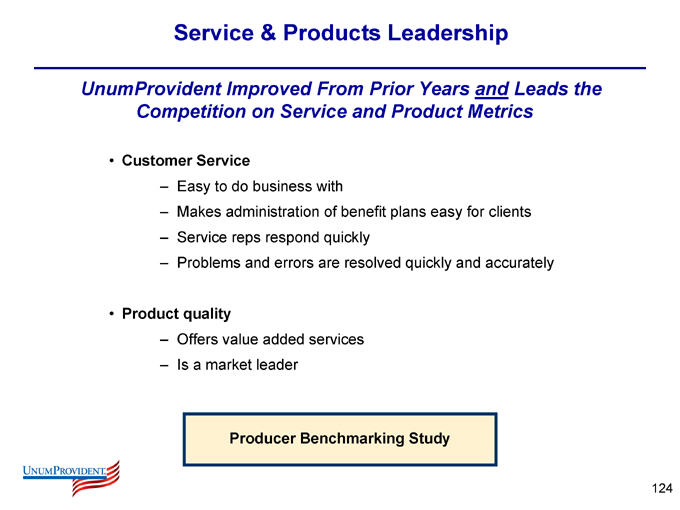
Service & Products Leadership
UnumProvident Improved From Prior Years and Leads the Competition on Service and Product Metrics
Customer Service
Easy to do business with
Makes administration of benefit plans easy for clients
Service reps respond quickly
Problems and errors are resolved quickly and accurately
Product quality
Offers value added services
Is a market leader
Producer Benchmarking Study
124
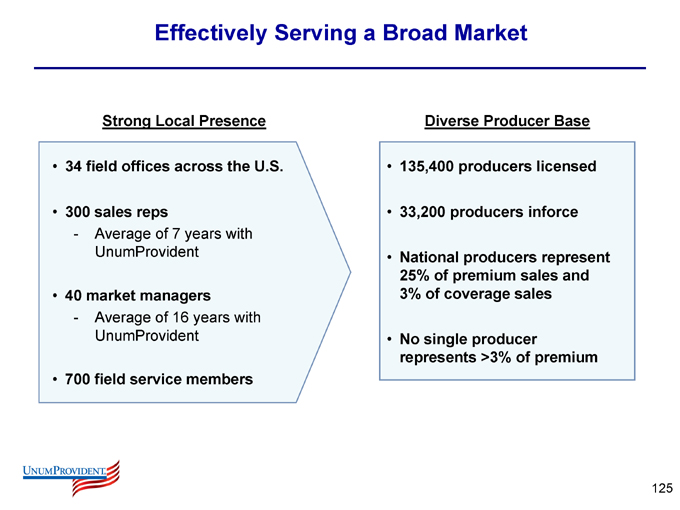
Effectively Serving a Broad Market
Strong Local Presence
34 field offices across the U.S.
300 sales reps
Average of 7 years with UnumProvident
40 market managers
Average of 16 years with UnumProvident
700 field service members
Diverse Producer Base
135,400 producers licensed
33,200 producers inforce
National producers represent 25% of premium sales and 3% of coverage sales
No single producer represents >3% of premium
125

Strength of Sales Team is Critical
UnumProvident Improved From Prior Years and Leads the Competition on Sales Support to Brokers
Sales Rep Relationship
Overall quality of services and support from sales rep
Sales rep is very knowledgeable and well-trained
Sales rep follows through on commitments
Sales rep was proactive
Average Sales Rep Tenure
Years with UP
5.43
5.97
6.78
7.11
2Q02
2Q03
2Q04
2Q05
126
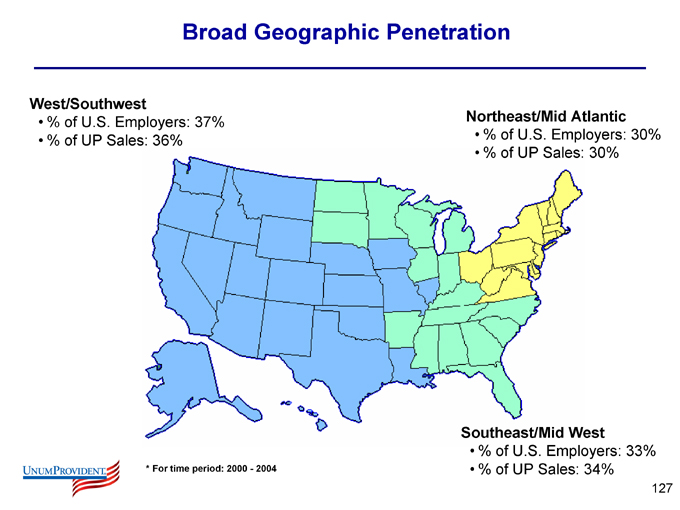
Broad Geographic Penetration
West/Southwest
% of U.S. Employers: 37%
% of UP Sales: 36%
Northeast/Mid Atlantic
% of U.S. Employers: 30%
% of UP Sales: 30%
Southeast/Mid West
% of U.S. Employers: 33%
% of UP Sales: 34%
* For time period: 2000 - 2004
127
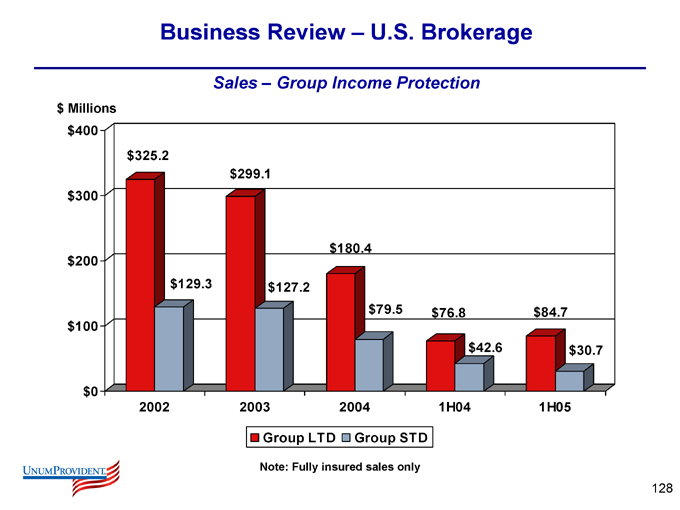
Business Review – U.S. Brokerage
Sales – Group Income Protection $ Millions $400 $300 $200 $100 $0 $325.2 $129.3 $299.1 $127.2 $180.4 $79.5 $76.8 $42.6 $84.7 $30.7
2002
2003
2004
1H04
1H05
Group LTD
Group STD
Note: Fully insured sales only
128
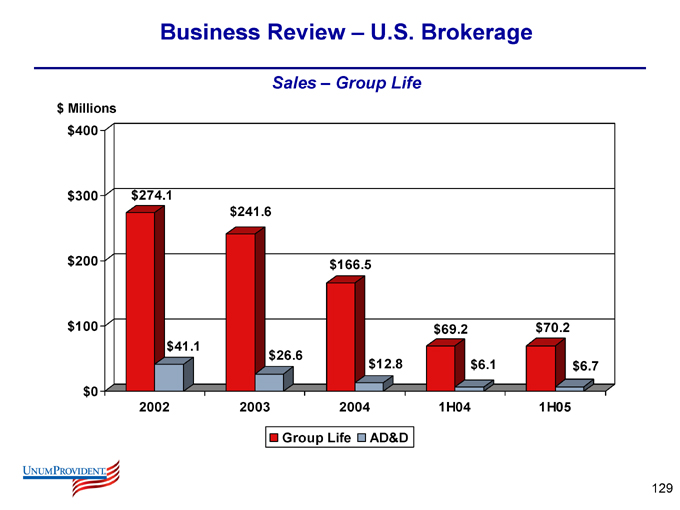
Business Review – U.S. Brokerage
Sales – Group Life $ Millions $400 $300 $200 $100 $0 $274.1 $41.1 $241.6 $26.6 $166.5 $12.8 $69.2 $6.1 $70.2 $6.7
2002
2003
2004
1H04
1H05
Group Life
AD&D
129
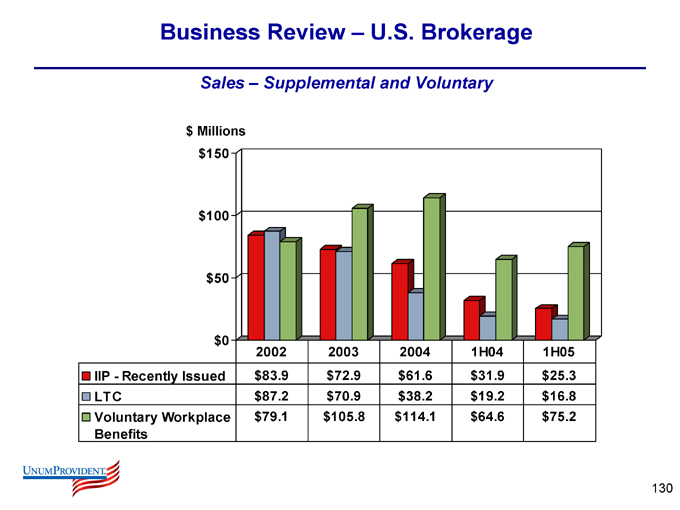
Business Review – U.S. Brokerage
Sales – Supplemental and Voluntary $ Millions $150 $100 $50 $0
2002 2003 2004 1H04 1H05
IIP - Recently Issued $83.9 $72.9 $61.6 $31.9 $25.3
LTC $87.2 $70.9 $38.2 $19.2 $16.8
Voluntary Workplace Benefits $79.1 $105.8 $114.1 $64.6 $75.2
130
Summary
131
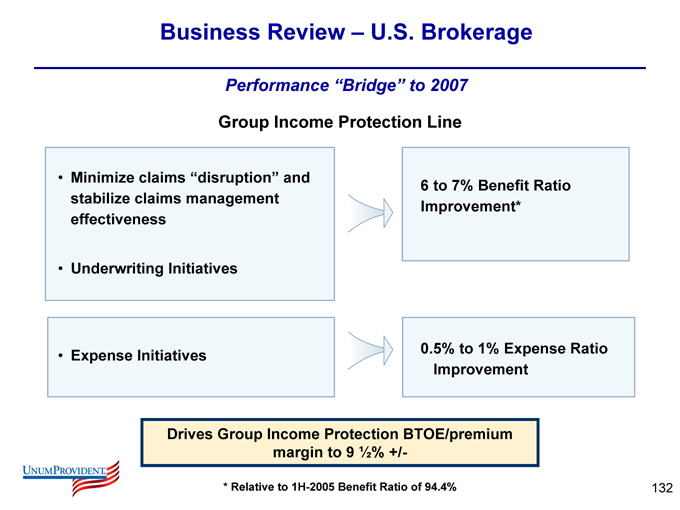
Business Review – U.S. Brokerage
Performance “Bridge” to 2007
Group Income Protection Line
Minimize claims “disruption” and stabilize claims management effectiveness
Underwriting Initiatives
Expense Initiatives
6 to 7% Benefit Ratio Improvement*
0.5% to 1% Expense Ratio Improvement
Drives Group Income Protection BTOE/premium margin to 9 1/2% +/-
* Relative to 1H-2005 Benefit Ratio of 94.4%
132
Business Review – U.S. Brokerage
Summary
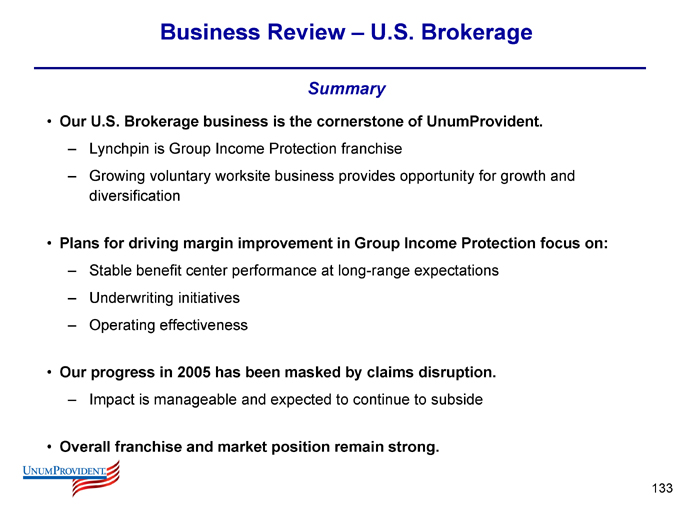
Our U.S. Brokerage business is the cornerstone of UnumProvident.
Lynchpin is Group Income Protection franchise
Growing voluntary worksite business provides opportunity for growth and diversification
Plans for driving margin improvement in Group Income Protection focus on:
Stable benefit center performance at long-range expectations
Underwriting initiatives
Operating effectiveness
Our progress in 2005 has been masked by claims disruption.
Impact is manageable and expected to continue to subside
Overall franchise and market position remain strong.
133

Questions
134
Business Review - Colonial
135
Business Review –Colonial
Introduction
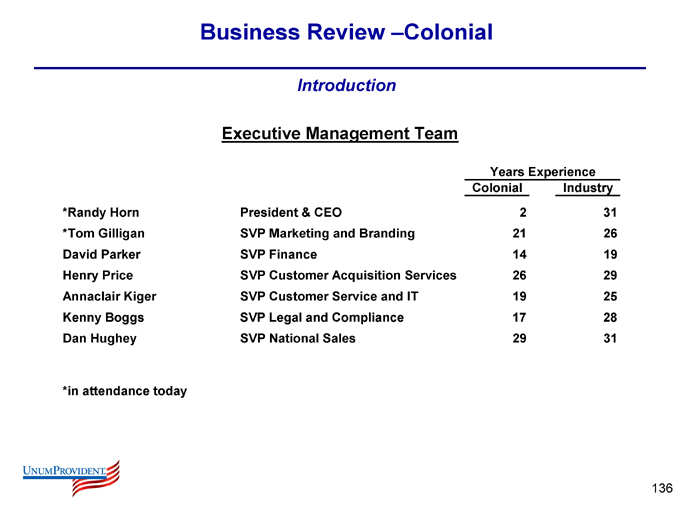
Executive Management Team
Years Experience Colonial Industry
*Randy Horn President & CEO 2 31
*Tom Gilligan SVP Marketing and Branding 21 26
David Parker SVP Finance 14 19
Henry Price SVP Customer Acquisition Services 26 29
Annaclair Kiger SVP Customer Service and IT 19 25
Kenny Boggs SVP Legal and Compliance 17 28
Dan Hughey SVP National Sales 29 31
*in attendance today
136
Colonial
Introduction
Founded in 1939 with more than 50 years of worksite marketing expertise
Payroll deduction pioneer
6,000-member nationwide career independent contractor sales organization sells direct and through 12,000 contracted brokers
1,000 home office employees based in Columbia, S.C.
50,000 accounts and 2 million policies in force
Focus on small and mid-sized commercial and public sector employers
National enrollment and benefits communication specialists
Products: short-term disability, accident, supplemental health, life, cancer, critical illness
137
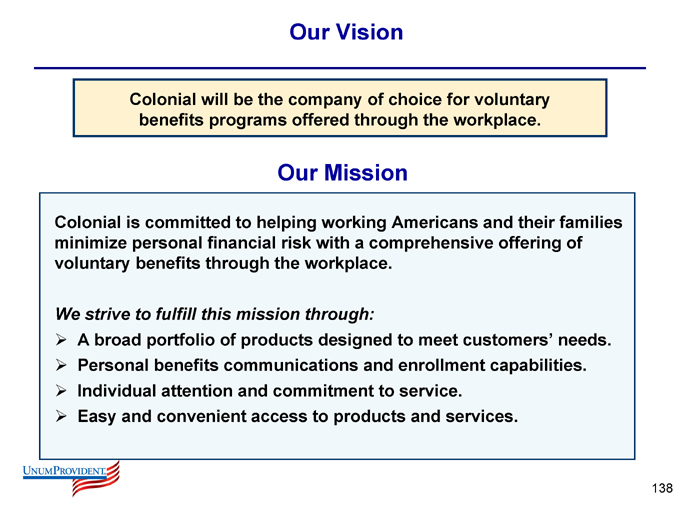
Our Vision
Colonial will be the company of choice for voluntary benefits programs offered through the workplace.
Our Mission
Colonial is committed to helping working Americans and their families minimize personal financial risk with a comprehensive offering of voluntary benefits through the workplace.
We strive to fulfill this mission through:
A broad portfolio of products designed to meet customers’ needs.
Personal benefits communications and enrollment capabilities.
Individual attention and commitment to service.
Easy and convenient access to products and services.
138
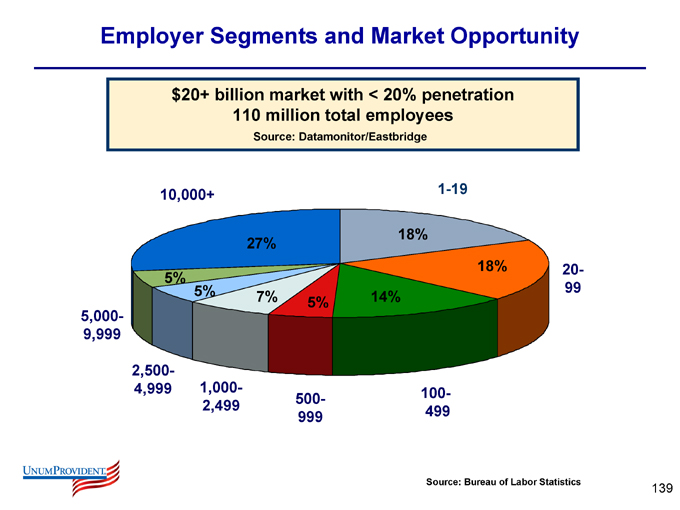
Employer Segments and Market Opportunity $20+ billion market with < 20% penetration 110 million total employees
Source: Datamonitor/Eastbridge
1-19
20-99
100-499
500-999
1,000-2,499
2,500-4,999
5,000-9,999
10,000+
18%
18%
14%
5%
7%
5%
5%
27%
Source: Bureau of Labor Statistics
139
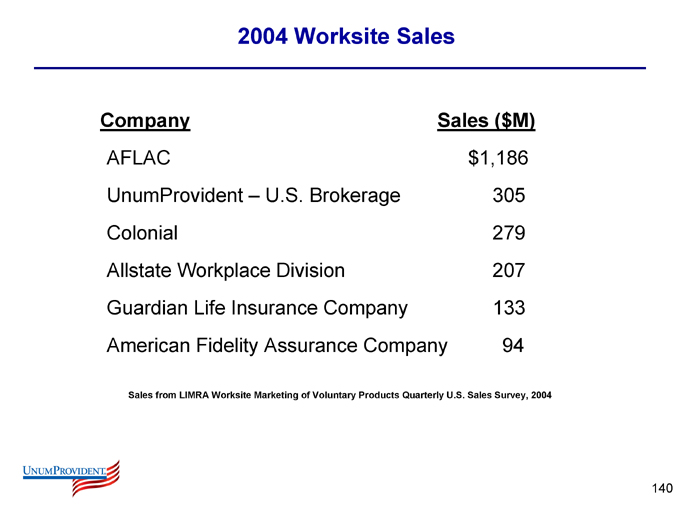
2004 Worksite Sales
Company Sales ($M)
AFLAC $1,186
UnumProvident – U.S. Brokerage 305
Colonial 279
Allstate Workplace Division 207
Guardian Life Insurance Company 133
American Fidelity Assurance Company 94
Sales from LIMRA Worksite Marketing of Voluntary Products Quarterly U.S. Sales Survey, 2004
140
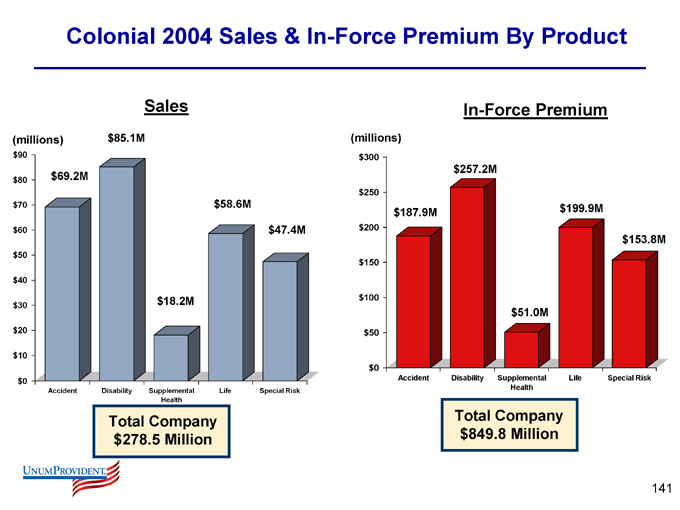
Colonial 2004 Sales & In-Force Premium By Product
Sales
(millions) $90 $80 $70 $60 $50 $40 $30 $20 $10 $0 $69.2M $85.1M $18.2M $58.6M $47.4M
Accident
Disability
Supplemental Health
Life
Special Risk
Total Company $278.5 Million
In-Force Premium
(millions) $300 $250 $200 $150 $100 $50 $0 $187.9M $257.2M $51.0M $199.9M $153.8M
Accident
Disability
Supplemental Health
Life
Special Risk
Total Company $849.8 Million
141
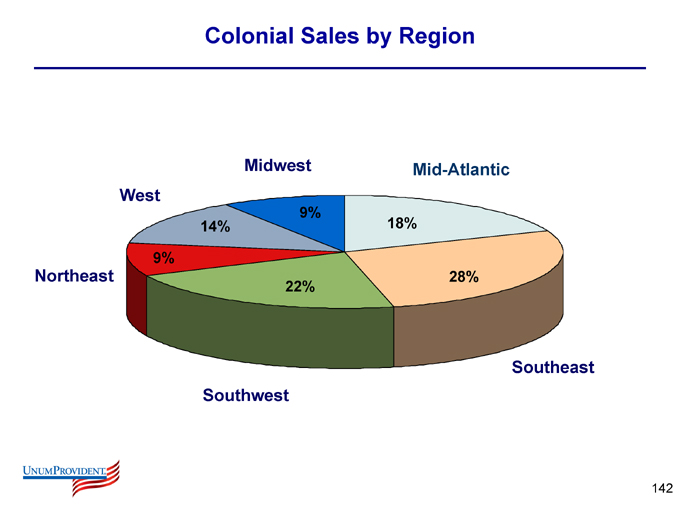
Colonial Sales by Region
Mid-Atlantic
Southeast
Southwest
Northeast
West
Midwest
18%
28%
22%
9%
14%
9%
142
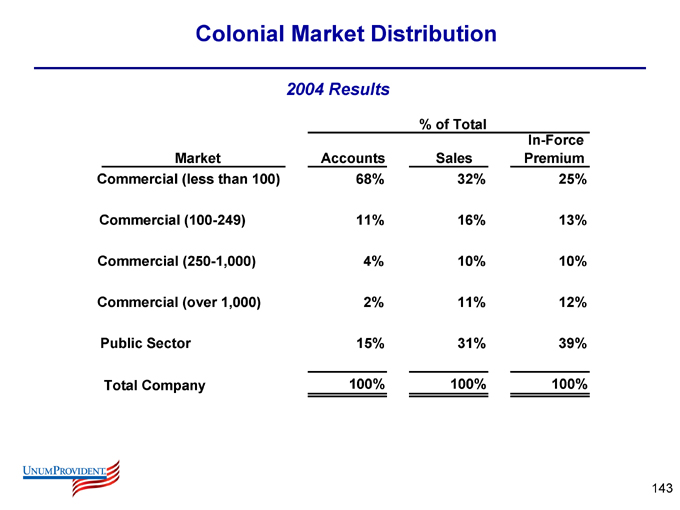
Colonial Market Distribution
2004 Results
% of Total
Market Accounts Sales In-Force Premium
Commercial (less than 100) 68% 32% 25%
Commercial (100-249) 11% 16% 13%
Commercial (250-1,000) 4% 10% 10%
Commercial (over 1,000) 2% 11% 12%
Public Sector 15% 31% 39%
Total Company 100% 100% 100%
143
Growth Initiatives
Implement Agency Growth System across the field organization
144
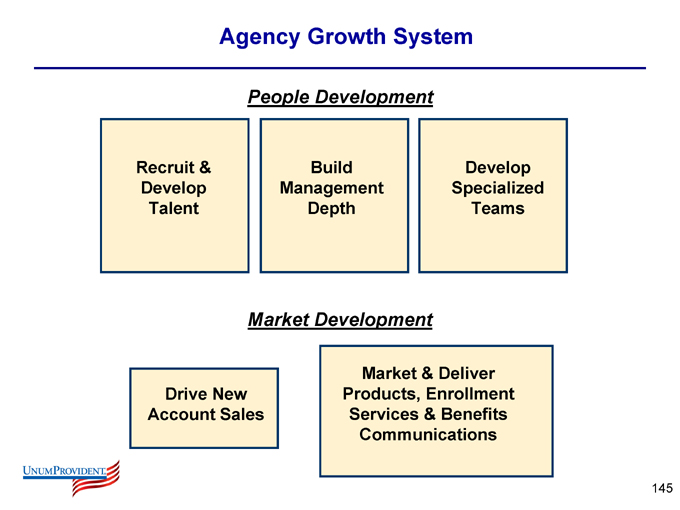
Agency Growth System
People Development
Recruit & Develop Talent
Build Management Depth
Develop Specialized Teams
Market Development
Drive New Account Sales
Market & Deliver Products, Enrollment Services & Benefits Communications
145
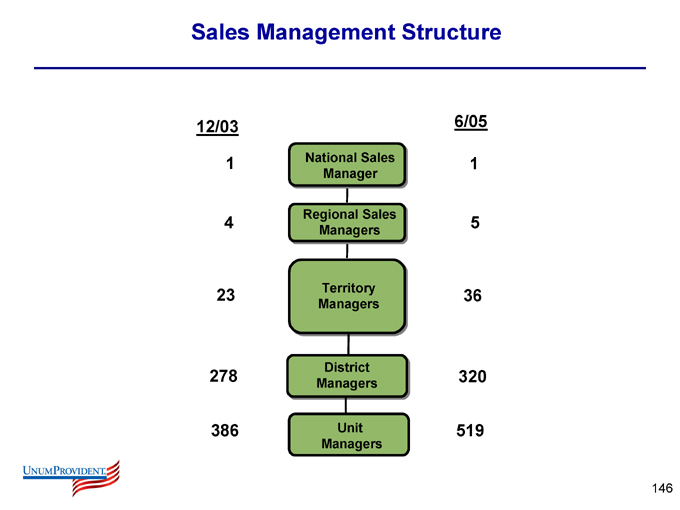
Sales Management Structure
12/03
1
4
23
278
386
National Sales Manager
Regional Sales Managers
Territory Managers
District Managers
Unit Managers
6/05
1
5
36
320
519
146
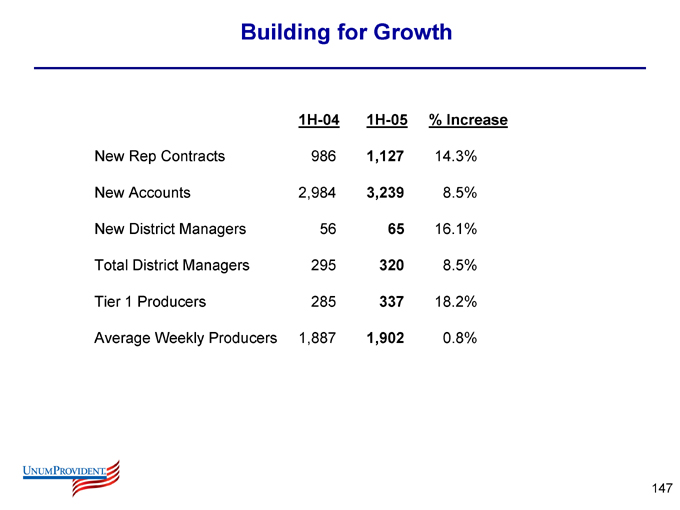
Building for Growth
1H-04 1H-05 % Increase
New Rep Contracts 986 1,127 14.3%
New Accounts 2,984 3,239 8.5%
New District Managers 56 65 16.1%
Total District Managers 295 320 8.5%
Tier 1 Producers 285 337 18.2%
Average Weekly Producers 1,887 1,902 0.8%
147
Growth Initiatives
Implement Agency Growth System across the field organization
Focus on small to medium-sized employer markets
Leverage position in the Public Sector market
Expand and refresh product platform
Leverage enrollment and benefits communication capabilities
148
Industry-Leading Service
E-Services for plan administrators: paperless billing, electronic reconciliation, online bill view and payment
Flexible billing cycles
Claims filing by phone, fax, Internet and mail
Proactive phone notification of claim receipt and payment
90% of claims resolved in 10 days or less
Bilingual service specialists
24-hour access to automated information
LIMRA customer satisfaction survey of plan administrators and policyholders
Overall 87% satisfied or very satisfied
92% of claimants satisfied or very satisfied
149
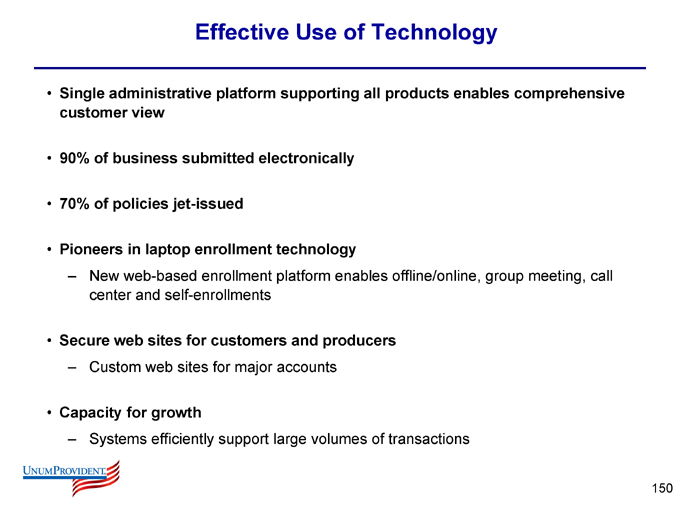
Effective Use of Technology
Single administrative platform supporting all products enables comprehensive customer view
90% of business submitted electronically
70% of policies jet-issued
Pioneers in laptop enrollment technology
New web-based enrollment platform enables offline/online, group meeting, call center and self-enrollments
Secure web sites for customers and producers
Custom web sites for major accounts
Capacity for growth
Systems efficiently support large volumes of transactions
150
The Colonial Advantage
Benefits communication solutions
Competitive supplemental insurance products
Enrollment services
151
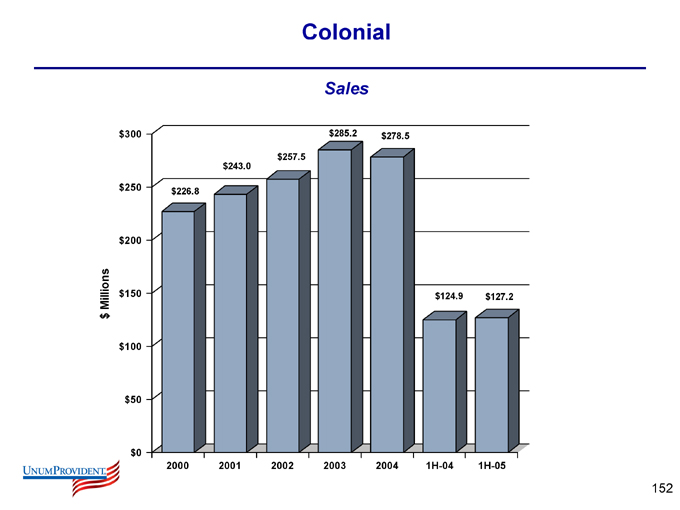
Colonial
Sales $ Millions $300 $250 $200 $150 $100 $50 $0 $226.8 $243.0 $257.5 $285.2 $278.5 $124.9 $127.2
2000
2001
2002
2003
2004
1H-04
1H-05
152
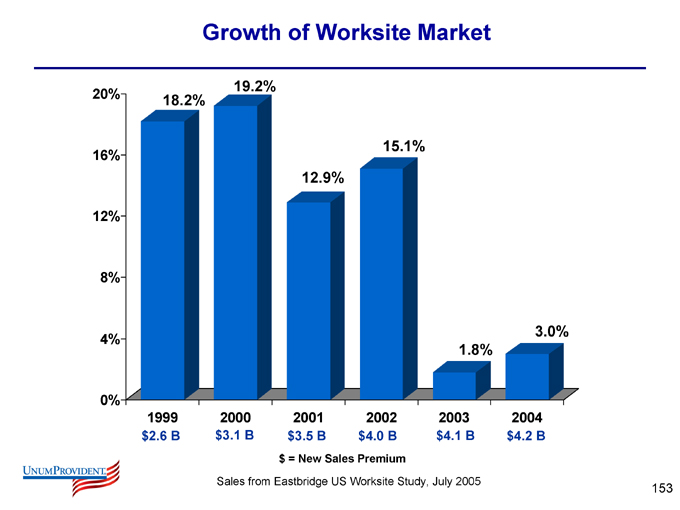
Growth of Worksite Market
20% 16% 12% 8% 4% 0%
18.2%
19.2%
12.9%
15.1%
1.8%
3.0%
1999 $2.6 B
2000 $3.1 B
2001 $3.5 B
2002 $4.0 B
2003 $4.1 B
2004 $4.2 B $ = New Sales Premium
Sales from Eastbridge US Worksite Study, July 2005
153
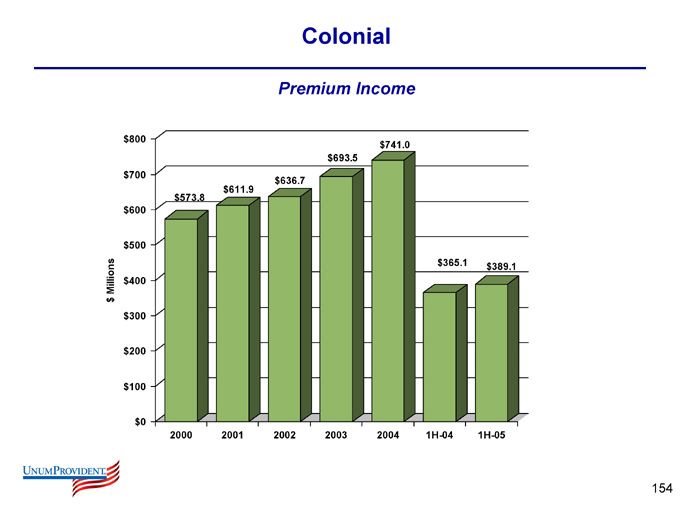
Colonial
Premium Income $ Millions $800 $700 $600 $500 $400 $300 $200 $100 $0 $573.8 $611.9 $636.7 $693.5 $741.0 $365.1 $389.1
2000
2001
2002
2003
2004
1H-04
1H-05
154
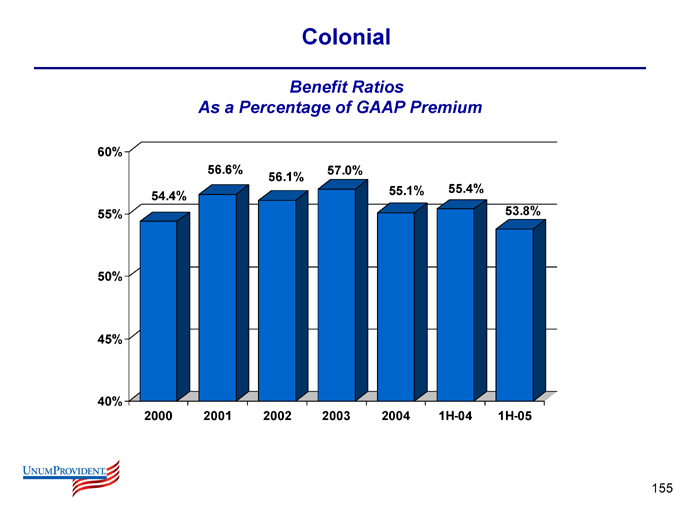
Colonial
Benefit Ratios
As a Percentage of GAAP Premium
60% 55% 50% 45% 40%
54.4%
56.6%
56.1%
57.0%
55.1%
55.4%
53.8%
2000
2001
2002
2003
2004
1H-04
1H-05
155
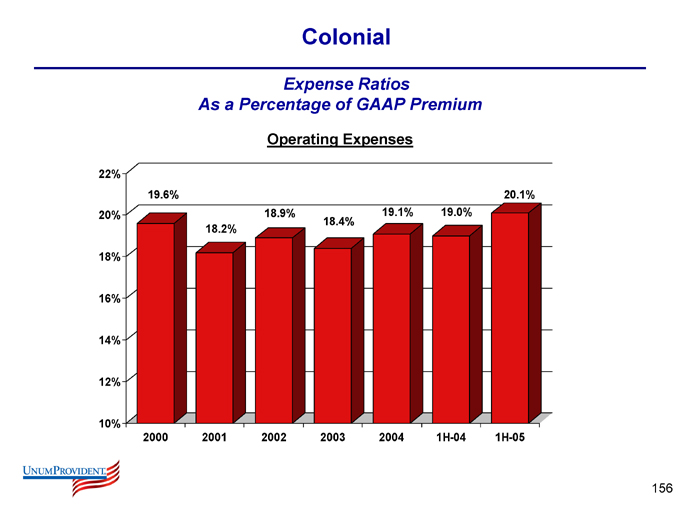
Colonial
Expense Ratios
As a Percentage of GAAP Premium
Operating Expenses
22% 20% 18% 16% 14% 12% 10%
19.6%
18.2%
18.9%
18.4%
19.1%
19.0%
20.1%
2000
2001
2002
2003
2004
1H-04
1H-05
156
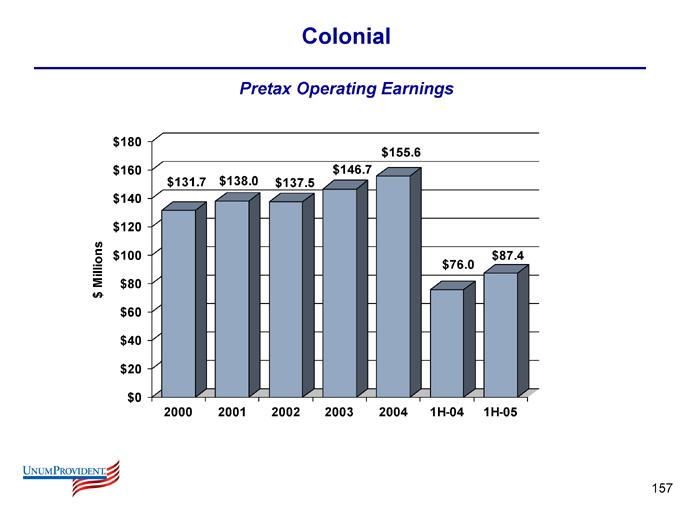
Colonial
Pretax Operating Earnings $ Millions $180 $160 $140 $120 $100 $80 $60 $40 $20 $0 $131.7 $138.0 $137.5 $146.7 $155.6 $76.0 $87.4
2000
2001
2002
2003
2004
1H-04
1H-05
157
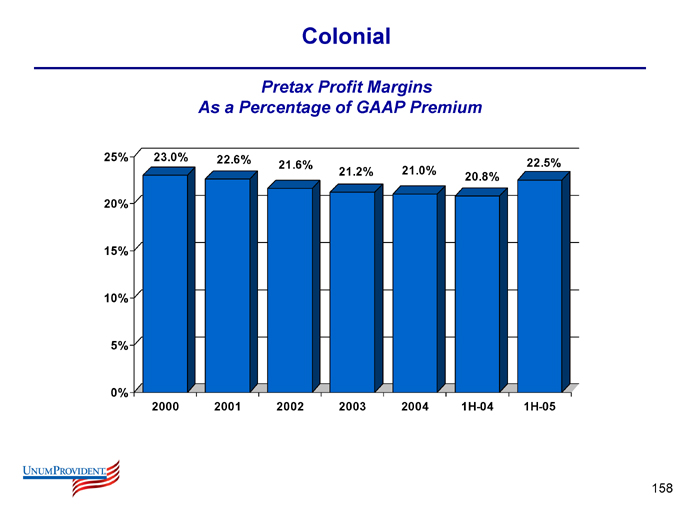
Colonial
Pretax Profit Margins As a Percentage of GAAP Premium
25% 20% 15% 10% 5% 0%
23.0%
22.6%
21.6%
21.2%
21.0%
20.8%
22.5%
2000
2001
2002
2003
2004
1H-04
1H-05
158
Colonial
Market Opportunities
Highly under-penetrated market
Consumer-driven benefits trend
Demand for effective enrollment and benefits communication services
Expectation of excellent customer service and administration
Challenges
Developing a strong growth culture in the sales organization
Responding to increased competition
Potential drop in discretionary income
159
Colonial
Summary
Strong market position and business model.
Well positioned to capitalize on growth opportunities.
Focused on maintaining financial stability while growing the business.
Providing diversification and predictable cash flows for parent company.
160

Questions
161
Business Review – Unum Limited (UK)
162

Business Review – Unum Limited
Introduction
Executive Management Team
Years Experience
Unum Industry
*Susan Ring Chairman & Managing Director 10 23
*Andrew Stacy Chief Operating Officer 5 25
Paul Davies Marketing & Business Development Director 2 20
Peter Dewis Customer Care Director 5 21
Joanne Hindle Corporate Services Director 4 20
Graham Hockings Chief Actuary 33 33
Jonathan Plumtree Finance Director 8 16
Cheryl Brewer Customer Solutions Director 29 29
Nick Gleeson Director of Corporate Development 5 18
Andy Cross Director of Human Resources 4 12
Phil Evans Director of Management Services 1 22
Paul Restall Director of Customer Services 1 25
*in attendance today
163
Unum Limited
Introduction
Unum Corporation (UNM) acquired Unum Limited in 1990.
840 employees in 3 operational centers; 7 regional offices.
Unum Limited is well positioned as the leader in the group risks market in the UK, with significant market positions in the Group Income Protection and Group Life markets.
Unum Limited has produced a strong record of sustained profitable growth over the past several years with solid underlying growth strongly enhanced by acquisitions.
We believe we are well positioned to continue to deliver sustainable profitable growth.
164
Unum Limited
The Market
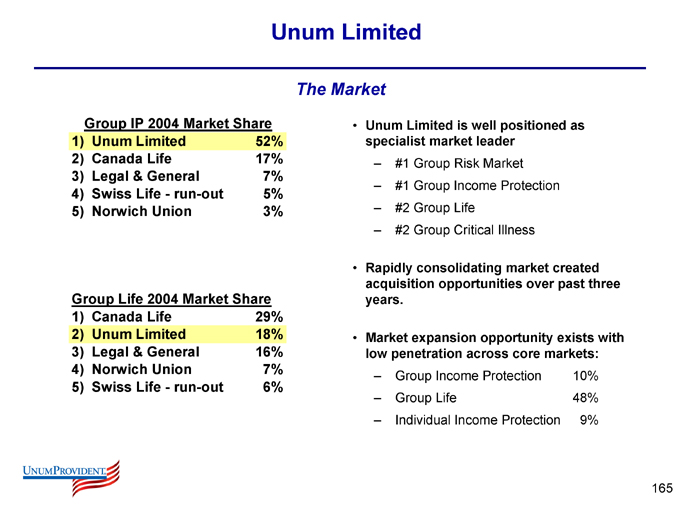
Group IP 2004 Market Share
1) Unum Limited 52%
2) Canada Life 17%
3) Legal & General 7%
4) Swiss Life - run-out 5%
5) Norwich Union 3%
Group Life 2004 Market Share
1) Canada Life 29%
2) Unum Limited 18%
3) Legal & General 16%
4) Norwich Union 7%
5) Swiss Life - run-out 6%
Unum Limited is well positioned as specialist market leader
#1 Group Risk Market
#1 Group Income Protection
#2 Group Life
#2 Group Critical Illness
Rapidly consolidating market created acquisition opportunities over past three years.
Market expansion opportunity exists with low penetration across core markets:
Group Income Protection 10%
Group Life 48%
Individual Income Protection 9%
165
Unum Limited - Strategy
Our Vision is to “keep dreams and ambitions alive even when accident or illness strikes”
Corporate position specialist niche player in chosen markets primary focus on UK protection and adjacent markets look to be a category winner then market leader in chosen segments – outperformance will generate leadership strategic differentiation leading on risk selection and management, and customer service
Produce sustainable, profitable growth
Balanced approach to delivery of strategy by being a value driven high performing company
Strategic focus centred around differentiation, growth and distribution
166
Unum Limited – Strategic Focus
Corporate differentiation
Continue to develop a clearly understood, valued and unique corporate proposition/position around
Pricing for risk
Risk selection
Claims management
Customer service
Business growth
Growing the group and individual markets and our share of market both organically and non-organically
Moving into profitable adjacent markets
Securing distribution
Strengthen our ability to reach and access new and existing customers
Retaining our existing customers
Developing a balanced distribution strategy
167
Our Principal Brokers
Mercer Human Resource Consulting
168
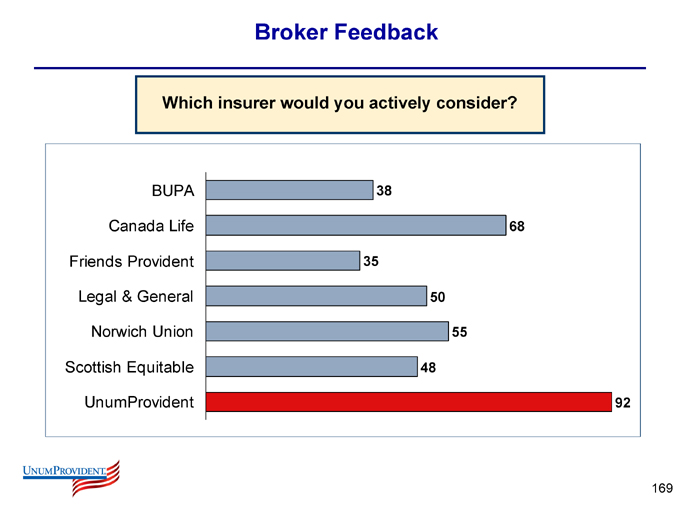
Broker Feedback
Which insurer would you actively consider?
BUPA
Canada Life
Friends Provident
Legal & General
Norwich Union
Scottish Equitable
UnumProvident
38
68
35
50
55
48
92
169
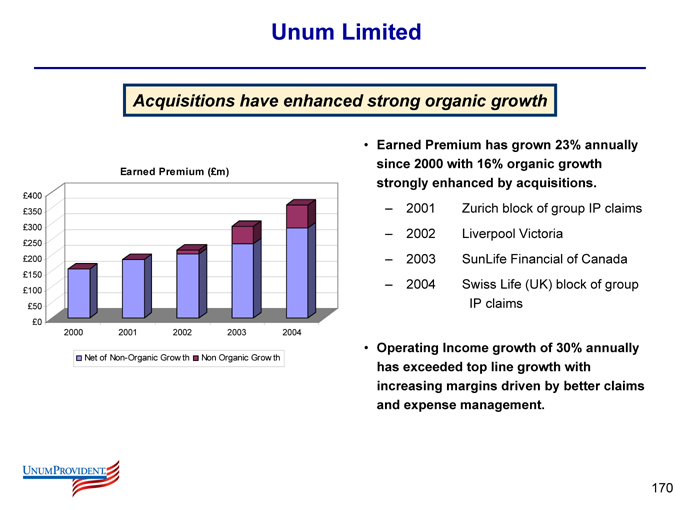
Unum Limited
Acquisitions have enhanced strong organic growth
Earned Premium (£m)
£400 £350 £300 £250 £200 £150 £100 £50 £0
2000
2001
2002
2003
2004
Net of Non-Organic Growth
Non Organic Growth
Earned Premium has grown 23% annually since 2000 with 16% organic growth strongly enhanced by acquisitions.
2001 Zurich block of group IP claims
2002 Liverpool Victoria
2003 SunLife Financial of Canada
2004 Swiss Life (UK) block of group
IP claims
Operating Income growth of 30% annually has exceeded top line growth with increasing margins driven by better claims and expense management.
170
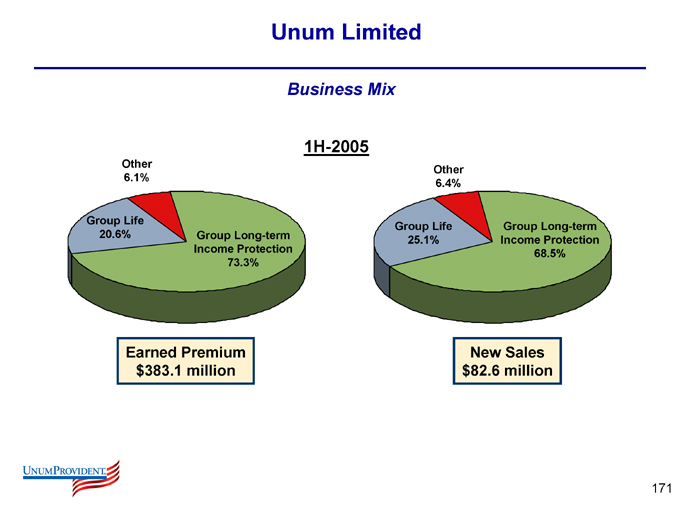
Unum Limited
Business Mix
1H-2005
Other 6.1%
Group Life 20.6%
Group Long-term Income Protection 73.3%
Earned Premium $383.1 million
Other 6.4%
Group Life 25.1%
Group Long-term Income Protection 68.5%
New Sales $82.6 million
171
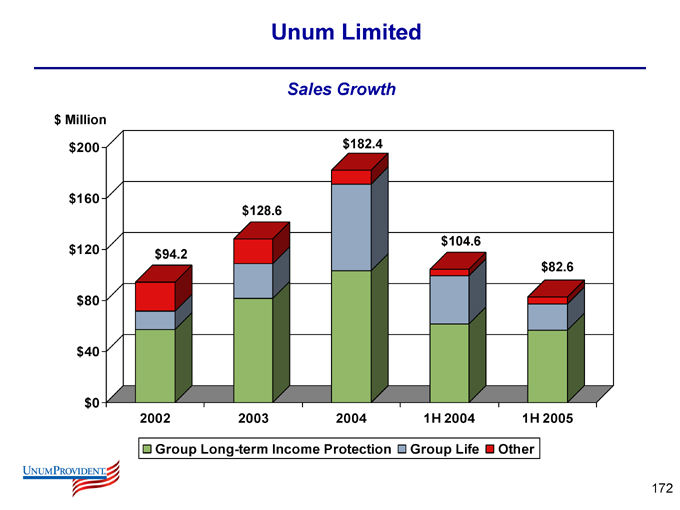
Unum Limited
Sales Growth $ Million $200 $160 $120 $80 $40 $0 $94.2 $128.6 $182.4 $104.6 $82.6
2002
2003
2004
1H 2004
1H 2005
Group Long-term Income Protection
Group Life
Other
172
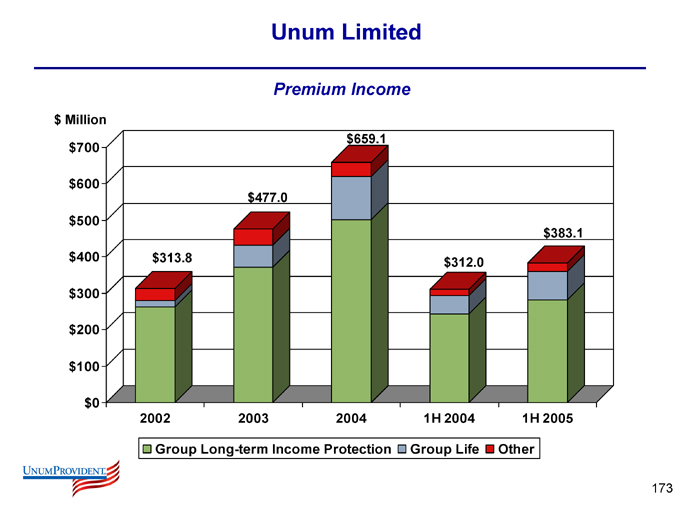
Unum Limited
Premium Income $ Million $700
$600
$500
$400
$300
$200
$100
$0 $313.8 $477.0 $659.1 $312.0 $383.1
2002
2003
2004
1H 2004
1H 2005
Group Long-term Income Protection
Group Life
Other
173
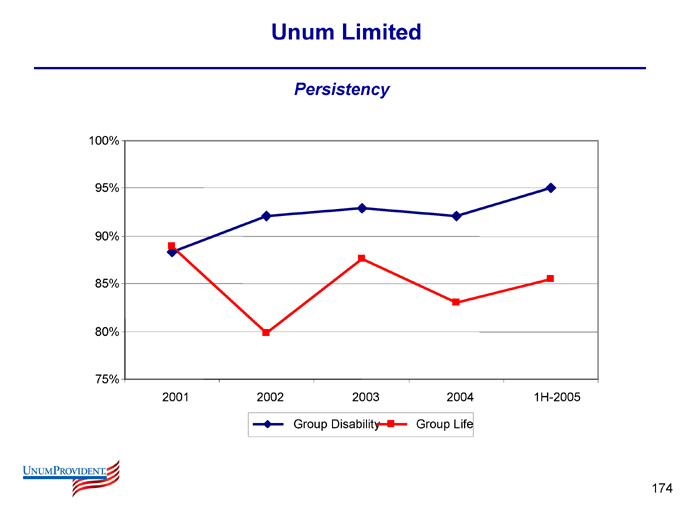
Unum Limited
Persistency
100% 95% 90% 85% 80% 75%
2001
2002
2003
2004
1H-2005
Group Disability
Group Life
174
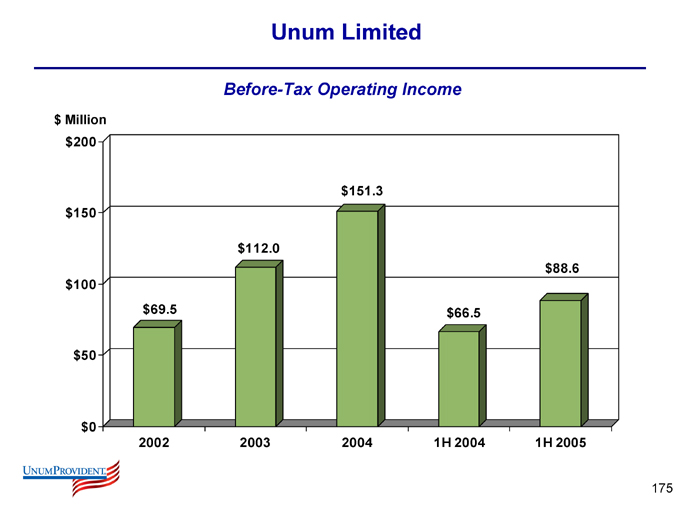
Unum Limited
Before-Tax Operating Income $ Million $200 $150 $100 $50 $0 $69.5 $112.0 $151.3 $66.5 $88.6
2002
2003
2004
1H 2004
1H 2005
175
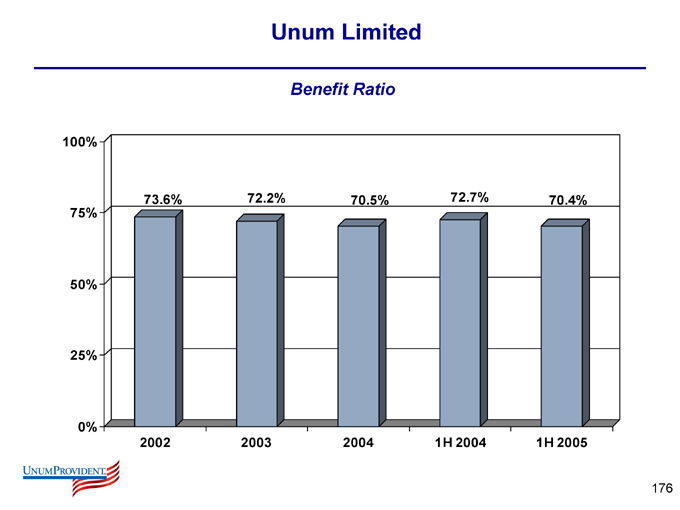
Unum Limited
Benefit Ratio
100% 75% 50% 25% 0%
73.6%
72.2%
70.5%
72.7%
70.4%
2002
2003
2004
1H 2004
1H 2005
176
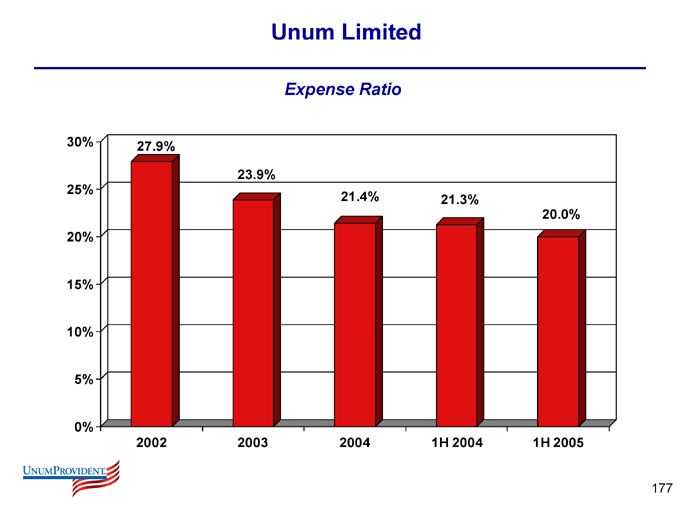
Unum Limited
Expense Ratio
30% 25% 20% 15% 10% 5% 0%
27.9%
23.9%
21.4%
21.3%
20.0%
2002
2003
2004
1H 2004
1H 2005
177
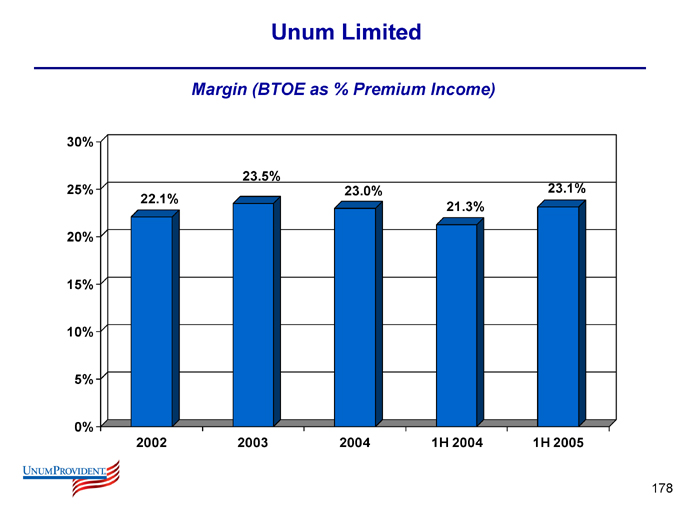
Unum Limited
Margin (BTOE as % Premium Income)
30% 25% 20% 15% 10% 5% 0%
22.1%
23.5%
23.0%
21.3%
23.1%
2002
2003
2004
1H 2004
1H 2005
178
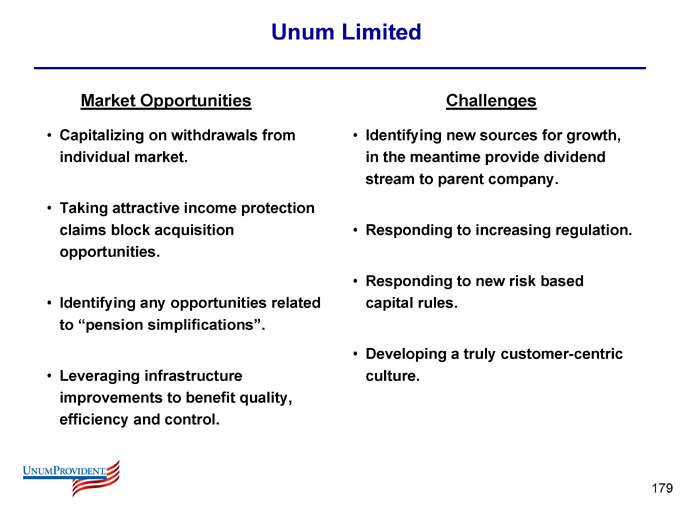
Unum Limited
Market Opportunities
Capitalizing on withdrawals from individual market.
Taking attractive income protection claims block acquisition opportunities.
Identifying any opportunities related to “pension simplifications”.
Leveraging infrastructure improvements to benefit quality, efficiency and control.
Challenges
Identifying new sources for growth, in the meantime provide dividend stream to parent company.
Responding to increasing regulation.
Responding to new risk based capital rules.
Developing a truly customer-centric culture.
179
Unum Limited
Summary
Uniquely positioned within the U.K. market.
Continue to develop ways to share U.K./U.S. best practices.
Strong management team-best in U.K. market.
Set to continue to deliver sustainable profitable growth and dividend stream to parent company.
180

Questions
181

Business Review - Individual Income Protection Closed Block
182
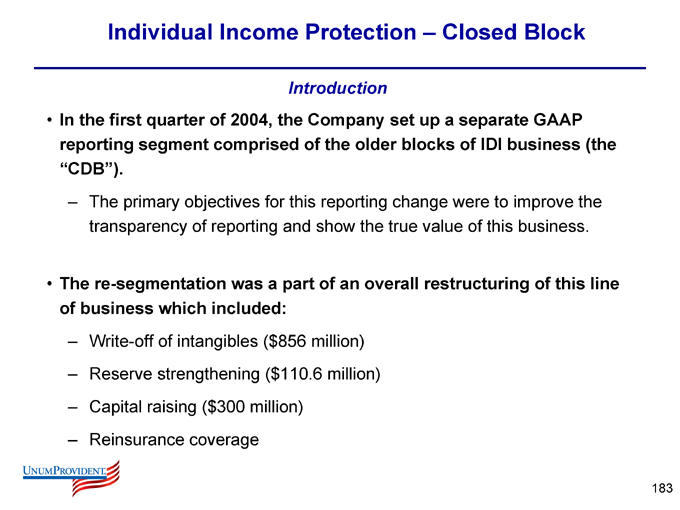
Individual Income Protection – Closed Block
Introduction
In the first quarter of 2004, the Company set up a separate GAAP reporting segment comprised of the older blocks of IDI business (the “CDB”).
The primary objectives for this reporting change were to improve the transparency of reporting and show the true value of this business.
The re-segmentation was a part of an overall restructuring of this line of business which included:
Write-off of intangibles ($856 million)
Reserve strengthening ($110.6 million)
Capital raising ($300 million)
Reinsurance coverage
183
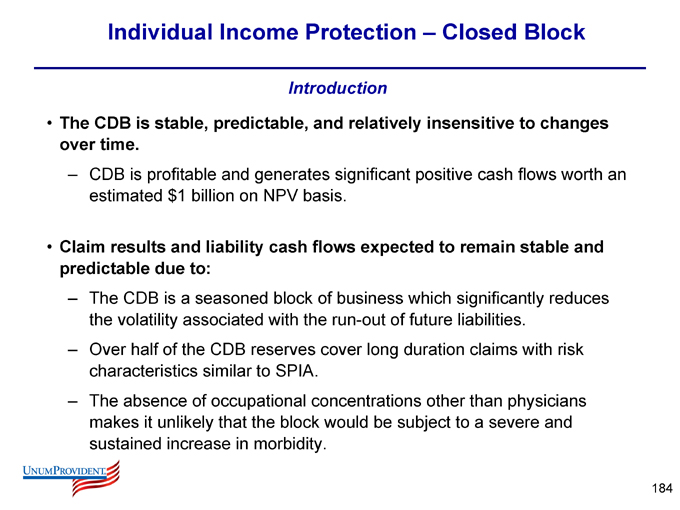
Individual Income Protection – Closed Block
Introduction
The CDB is stable, predictable, and relatively insensitive to changes over time.
CDB is profitable and generates significant positive cash flows worth an estimated $1 billion on NPV basis.
Claim results and liability cash flows expected to remain stable and predictable due to:
The CDB is a seasoned block of business which significantly reduces the volatility associated with the run-out of future liabilities.
Over half of the CDB reserves cover long duration claims with risk characteristics similar to SPIA.
The absence of occupational concentrations other than physicians makes it unlikely that the block would be subject to a severe and sustained increase in morbidity.
184
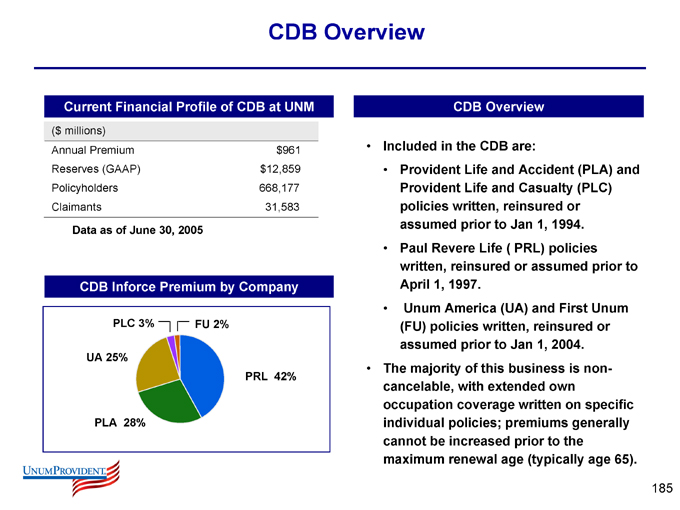
CDB Overview
Current Financial Profile of CDB at UNM
($ millions)
Annual Premium $961
Reserves (GAAP) $12,859
Policyholders 668,177
Claimants 31,583
Data as of June 30, 2005
CDB Inforce Premium by Company
FU 2%
PRL 42%
PLA 28%
UA 25%
PLC 3%
CDB Overview
Included in the CDB are:
Provident Life and Accident (PLA) and Provident Life and Casualty (PLC) policies written, reinsured or assumed prior to Jan 1, 1994.
Paul Revere Life ( PRL) policies written, reinsured or assumed prior to April 1, 1997.
Unum America (UA) and First Unum (FU) policies written, reinsured or assumed prior to Jan 1, 2004.
The majority of this business is non-cancelable, with extended own occupation coverage written on specific individual policies; premiums generally cannot be increased prior to the maximum renewal age (typically age 65).
185
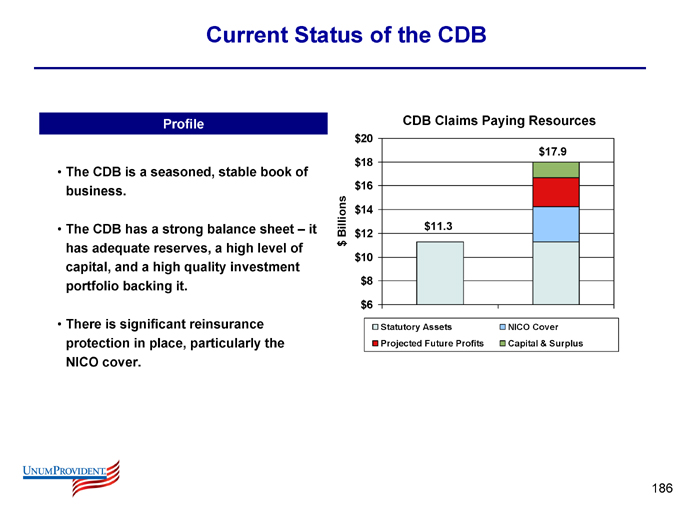
Current Status of the CDB
Profile
The CDB is a seasoned, stable book of business.
The CDB has a strong balance sheet – it has adequate reserves, a high level of capital, and a high quality investment portfolio backing it.
There is significant reinsurance protection in place, particularly the NICO cover.
CDB Claims Paying Resources $ Billions $20 $18 $16 $14 $12 $10 $8 $6 $11.3 $17.9
Statutory Assets
Projected Future Profits
NICO Cover
Capital & Surplus
186
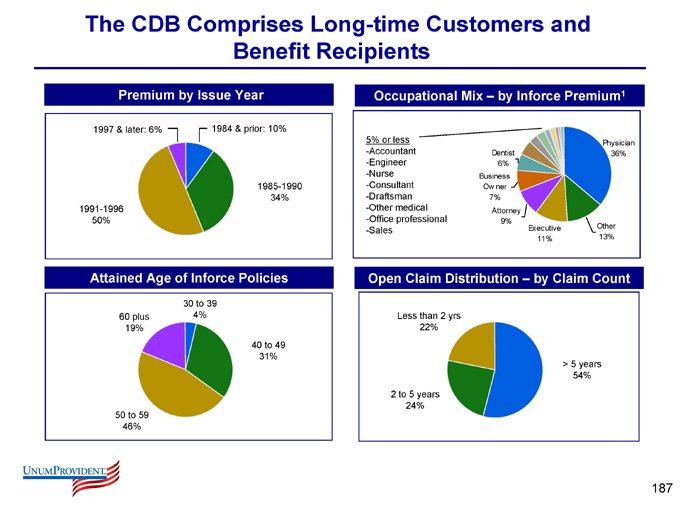
The CDB Comprises Long-time Customers and Benefit Recipients
Premium by Issue Year
1984 & prior: 10%
1985-1990 34%
1991-1996 50%
1997 & later: 6%
Attained Age of Inforce Policies
30 to 39 4%
40 to 49 31%
50 to 59 46%
60 plus 19%
Occupational Mix – by Inforce Premium1
5% or less
Accountant Engineer Nurse Consultant Draftsman Other medical Office professional Sales
Physician 36%
Other 13%
Executive 11%
Attorney 9%
Business Owner 7%
Dentist 6%
Open Claim Distribution – by Claim Count
> 5 years 54%
2 to 5 years 24%
Less than 2 yrs 22%
187
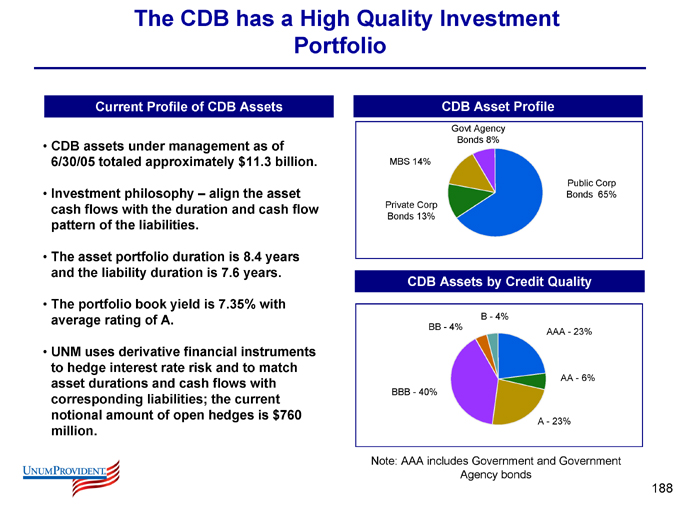
The CDB has a High Quality Investment Portfolio
Current Profile of CDB Assets
CDB assets under management as of 6/30/05 totaled approximately $11.3 billion.
Investment philosophy – align the asset cash flows with the duration and cash flow pattern of the liabilities.
The asset portfolio duration is 8.4 years and the liability duration is 7.6 years.
The portfolio book yield is 7.35% with average rating of A.
UNM uses derivative financial instruments to hedge interest rate risk and to match asset durations and cash flows with corresponding liabilities; the current notional amount of open hedges is $760 million.
CDB Asset Profile
Public Corp Bonds 65%
Private Corp Bonds 13%
MBS 14%
Govt Agency Bonds 8%
CDB Assets by Credit Quality
AAA - 23%
AA - 6%
A - 23%
BBB - - 40%
BB - 4%
B - 4%
Note: AAA includes Government and Government Agency bonds
188
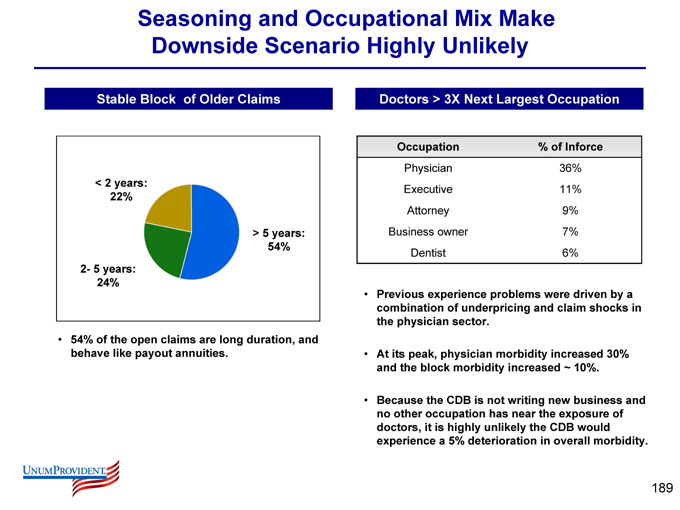
Seasoning and Occupational Mix Make Downside Scenario Highly Unlikely
Stable Block of Older Claims
> 5 years: 54%
2-5 years: 24%
< 2 years: 22%
54% of the open claims are long duration, and behave like payout annuities.
Doctors > 3X Next Largest Occupation
Occupation % of Inforce
Physician 36%
Executive 11%
Attorney 9%
Business owner 7%
Dentist 6%
Previous experience problems were driven by a combination of underpricing and claim shocks in the physician sector.
At its peak, physician morbidity increased 30% and the block morbidity increased ~ 10%.
Because the CDB is not writing new business and no other occupation has near the exposure of doctors, it is highly unlikely the CDB would experience a 5% deterioration in overall morbidity.
189
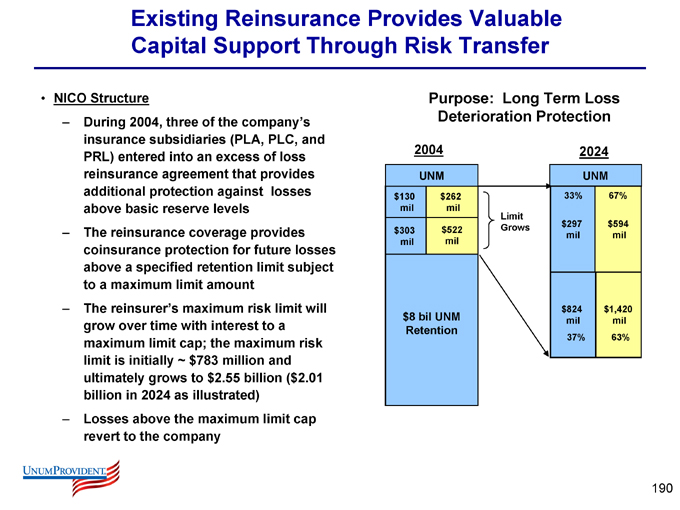
Existing Reinsurance Provides Valuable Capital Support Through Risk Transfer
NICO Structure
During 2004, three of the company’s insurance subsidiaries (PLA, PLC, and PRL) entered into an excess of loss reinsurance agreement that provides additional protection against losses above basic reserve levels
The reinsurance coverage provides coinsurance protection for future losses above a specified retention limit subject to a maximum limit amount
The reinsurer’s maximum risk limit will grow over time with interest to a maximum limit cap; the maximum risk limit is initially ~ $783 million and ultimately grows to $2.55 billion ($2.01 billion in 2024 as illustrated)
Losses above the maximum limit cap revert to the company
Purpose: Long Term Loss Deterioration Protection
2004
UNM
$130 $262
mil mil
$303 $522
mil mil
$8 bil UNM Retention
Limit Grows
2024
UNM
33% 67%
$297 $594
mil mil
$824 $1,420
mil mil
37% 63%
190
Centre Re Recapture
The Company announced its intention to the Centre Re block effective prior to December 31, 2005.
With our RBC ratio currently above our 300% target level and the benefits of the agreement largely discounted, we felt it was the appropriate time to execute the recapture.
Recapture was effective August 8, 2005 and will begin to be reflected in 3Q Closed Disability Block segment.
This block is stable and performs reasonably well, producing a small statutory gain and roughly break-even on a GAAP basis.
The RBC impact of 14 points will be split over 2005 and 2006 as the invested assets, reserves and premiums come back to our books.
Year-end 2005 RBC expected in-line with year-end 2004 levels.
191
Summary
The CDB is a relatively stable, mature block of business which represents real value to the Company.
The block ties up a significant amount of capital and its low ROE produces a drag on the corporate ROE.
There is significant effort underway at the Company to better realize the value we believe is embedded in the block but not recognized in the Company’s valuation.
192

Questions
193

Looking Forward – The Next Chapter
194
Looking Forward – The Next Chapter
UnumProvident’s Core Assets
Position in employee benefit market
Including worksite distribution and enrollment capability
Broker and customer relationships
Disability expertise and operating capability
195

Looking Forward – The Next Chapter
Immediate
Improve U.S. Group Disability Performance
Pricing discipline
Expense management
Stabilize claims performance
Continue to diversify business exposure
Restoration of growth at Colonial
Maintain strong performance in U.K.
Continue to de-risk U.S. Brokerage business
Continued emphasis on consistency and improved operating performance throughout the Company
Longer-term
Product, service and market expansion
Better leverage customer relationships and continue to diversify revenue base
Capital Management
Priority remains improving ratings but an emerging issue will be utilization of excess capital as it emerges
Restoration of valuation for a “franchise” business
Corporate image and reputation a key driver
196
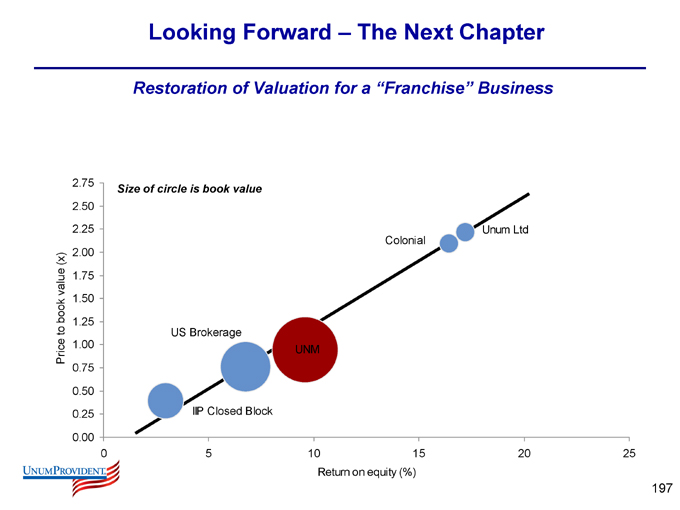
Looking Forward – The Next Chapter
Restoration of Valuation for a “Franchise” Business
Price to book value (x)
2.75
2.50 2.25
2.00
1.75 1.50
1.25 1.00
0.75
0.50 0.25
0.00
Size of circle is book value
US Brokerage
IIP Closed Block
Colonial
Unum Ltd
0
5
10
15
20
25
Return on equity (%)
197
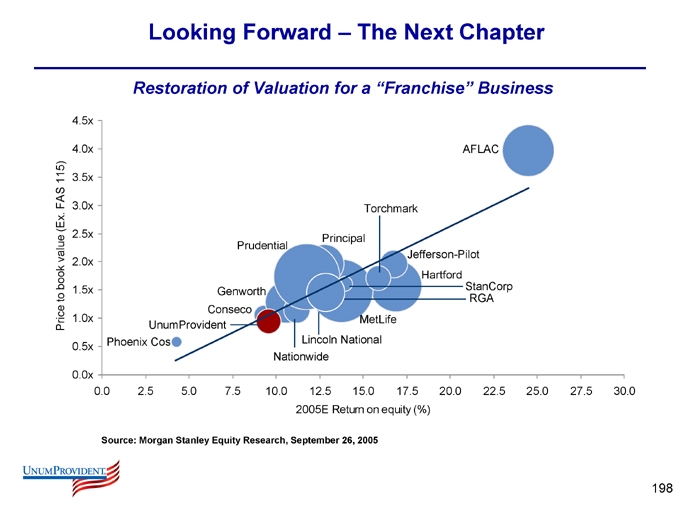
Looking Forward – The Next Chapter
Restoration of Valuation for a “Franchise” Business
Price to book value (Ex. FAS 115)
4.5x 4.0x 3.5x 3.0x 2.5x 2.0x 1.5x 1.0x 0.5x 0.0x
0.0
2.5
5.0
7.5
10.0
12.5
15.0
17.5
20.0
22.5
25.0
27.5
30.0
Phoenix Cos
UnumProvident
Conseco
Genworth
Prudential
Nationwide
Lincoln National
MetLife
Principal
Torchmark
Jefferson-Pilot
Hartford
StanCor
p RGA
AFLAC
2005E Return on equity (%)
Source: Morgan Stanley Equity Research, September 26, 2005
198

Questions
199