
2017 Outlook Meeting December 15, 2016 | New York Exhibit 99.1
Safe Harbor Statement and Non-GAAP Financial Measures Certain information in this presentation constitutes "forward-looking statements" within the meaning of the Private Securities Litigation Reform Act of 1995. Forward-looking statements are those not based on historical information, but rather relate to our outlook, future operations, strategies, financial results, or other developments and speak only as of the date made. These forward-looking statements, including statements about our 2017 outlook for sales, premium income, operating earnings, and operating return on equity, under current market conditions, as well as about weighted average risk-based capital ratios, holding company cash and marketable securities and share repurchases are subject to numerous assumptions, risks, and uncertainties, many of which are beyond our control. The following factors, in addition to other factors mentioned from time to time, may cause actual results to differ materially from those contemplated by the forward-looking statements: (1) sustained periods of low interest rates; (2) fluctuation in insurance reserve liabilities and claim payments due to changes in claim incidence, recovery rates, mortality and morbidity rates, and policy benefit offsets due to, among other factors, the rate of unemployment and consumer confidence, the emergence of new diseases, epidemics, or pandemics, new trends and developments in medical treatments, the effectiveness of our claims operational processes, and changes in government programs; (3) unfavorable economic or business conditions, both domestic and foreign; (4) legislative, regulatory, or tax changes, both domestic and foreign, including the effect of potential legislation and increased regulation in the current political environment; (5) investment results, including, but not limited to, changes in interest rates, defaults, changes in credit spreads, impairments, and the lack of appropriate investments in the market which can be acquired to match our liabilities; (6) a cyber attack or other security breach could result in the unauthorized acquisition of confidential data; (7) the failure of our business recovery and incident management processes to resume our business operations in the event of a natural catastrophe, cyber attack, or other event; (8) increased competition from other insurers and financial services companies due to industry consolidation, new entrants to our markets, or other factors; (9) execution risk related to our technology needs: (10) changes in our financial strength and credit ratings; (11) damage to our reputation due to, among other factors, regulatory investigations, legal proceedings, external events, and/or inadequate or failed internal controls and procedures; (12) actual experience that deviates from our assumptions used in pricing, underwriting, and reserving; (13) actual persistency and/or sales growth that is higher or lower than projected; (14) changes in demand for our products due to, among other factors, changes in societal attitudes, the rate of unemployment, consumer confidence, and/or legislative and regulatory changes, including healthcare reform; (15) effectiveness of our risk management program; (16) contingencies and the level and results of litigation; (17) availability of reinsurance in the market and the ability of our reinsurers to meet their obligations to us; (18) ineffectiveness of our derivatives hedging programs due to changes in the economic environment, counterparty risk, ratings downgrades, capital market volatility, changes in interest rates, and/or regulation; (19) changes in accounting standards, practices, or policies; (20) fluctuation in foreign currency exchange rates; (21) ability to generate sufficient internal liquidity and/or obtain external financing; (22) recoverability and/or realization of the carrying value of our intangible assets, long-lived assets, and deferred tax assets; and (23) terrorism, both within the U.S. and abroad, ongoing military actions, and heightened security measures in response to these types of threats. For further discussion of risks and uncertainties which could cause actual results to differ from those contained in the forward-looking statements, see Part I, Item 1A “Risk Factors” of our annual report on Form 10-K for the year ended December 31, 2015 and, to the extent applicable, our subsequently filed quarterly reports on Form 10-Q.The forward-looking statements in this presentation are being made as of the date of this presentation release, and the Company expressly disclaims any obligation to update or revise any forward-looking statement contained herein, even if made available on our website or otherwise. In analyzing performance, Unum sometimes uses non-GAAP financial measures that differ from what is reported under GAAP. This presentation contains non-GAAP financial measures, including after-tax operating earnings, after-tax operating earnings per share, operating return on equity, and book value per share (excluding accumulated other comprehensive income, or AOCI). Refer to the Appendix for a reconciliation of the non-GAAP financial measures used in this presentation to the most directly comparable GAAP measures.
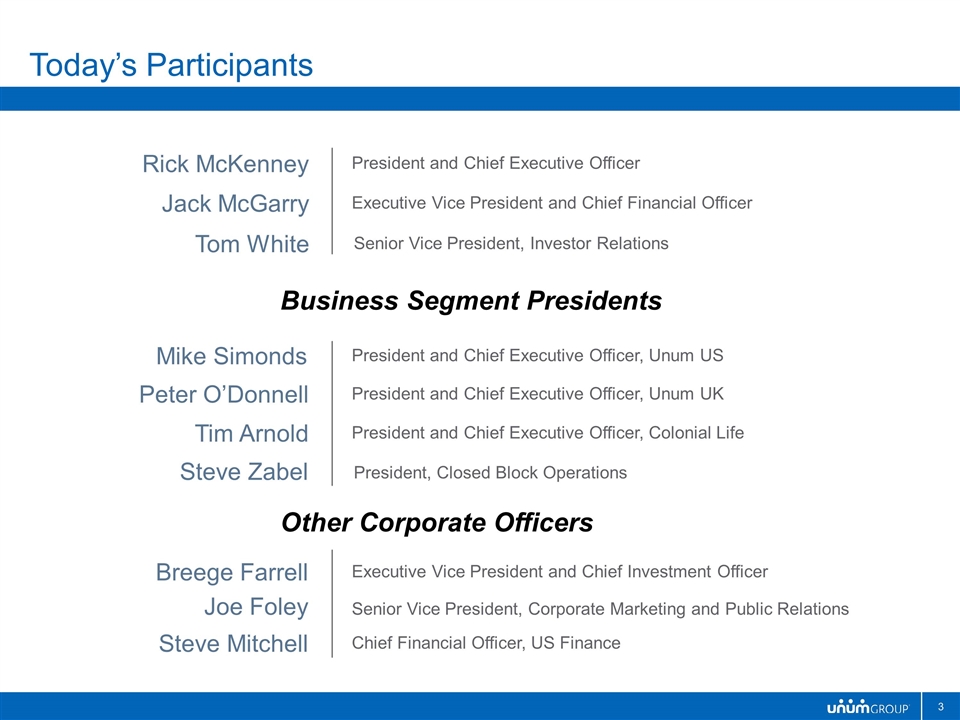
Mike Simonds President and Chief Executive Officer, Unum US Peter O’Donnell President and Chief Executive Officer, Unum UK Tim Arnold President and Chief Executive Officer, Colonial Life Today’s Participants Business Segment Presidents Jack McGarry President and Chief Executive Officer Rick McKenney Executive Vice President and Chief Financial Officer Tom White Senior Vice President, Investor Relations Steve Zabel President, Closed Block Operations Joe Foley Senior Vice President, Corporate Marketing and Public Relations Breege Farrell Executive Vice President and Chief Investment Officer Steve Mitchell Chief Financial Officer, US Finance Other Corporate Officers
Agenda Introduction State of the Business Financial Performance Unum US Unum UK Colonial Life Closed Block 2017 Outlook Closing Comments Questions and Answers Appendix
Introduction
Introduction Today’s messages Leading provider of ancillary employee benefits at the worksite in the US and UK Strong brand and reputation in our markets Operating trends are very strong Consistent capital generation and deployment Making investments to fuel growth in our core businesses Successfully managing in today’s environment
Introduction 2016 Update From Original 2016 Outlook Top end of expected earnings range In-line with sales and premium expectations (+5%) Stable Closed Block results Executed dental transaction Share repurchases of approximately $400 million Increased dividend 8% Capital position strong at 400% RBC
Introduction 2017 Outlook Consistent earnings growth High-single-digit sales growth; Mid-single-digit premium growth Strong margins despite interest rate headwinds UK operations solid – Foreign exchange impact Continued capital deployment – Share repurchases and dividends Uncertainty with positive bias
Introduction 2017 Current Topics Rising interest rates / inflation Employee / wage growth Discount rate Surplus earnings LTC margins No disintermediation risk Tax reform Current tax rate today ~32% UK rate currently 17% Regulatory reform Little impact
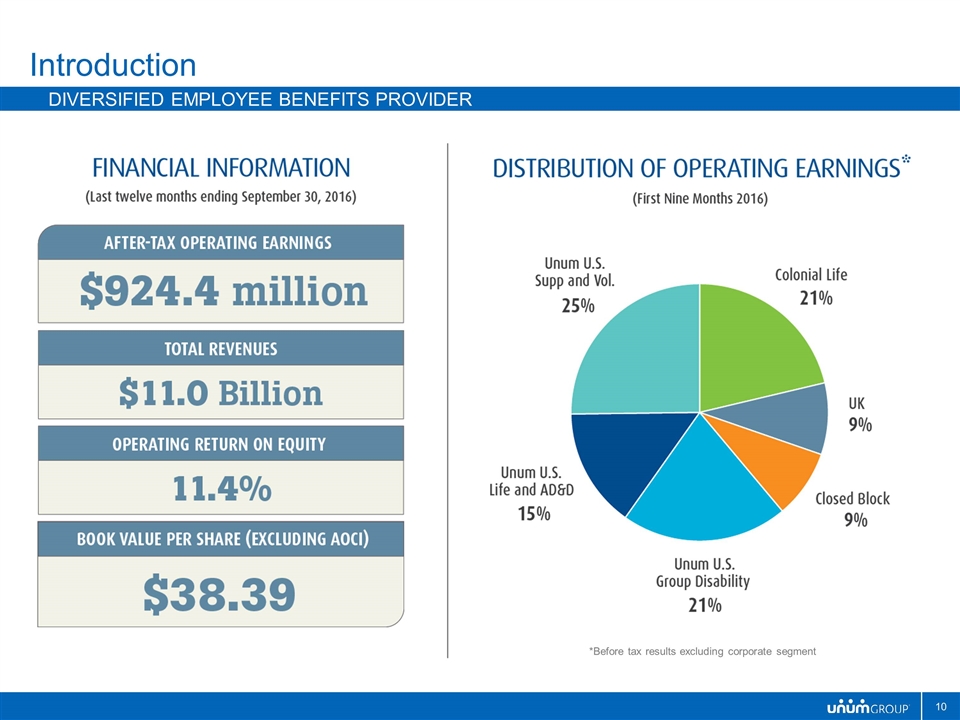
Introduction Diversified Employee Benefits Provider *Before tax results excluding corporate segment
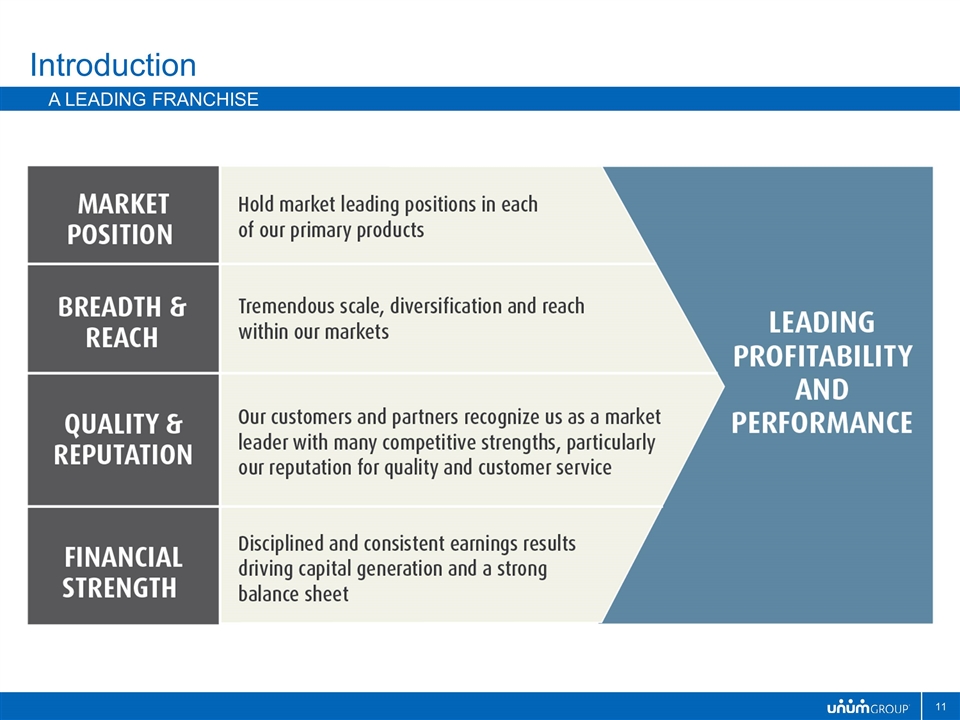
Introduction A leading franchise
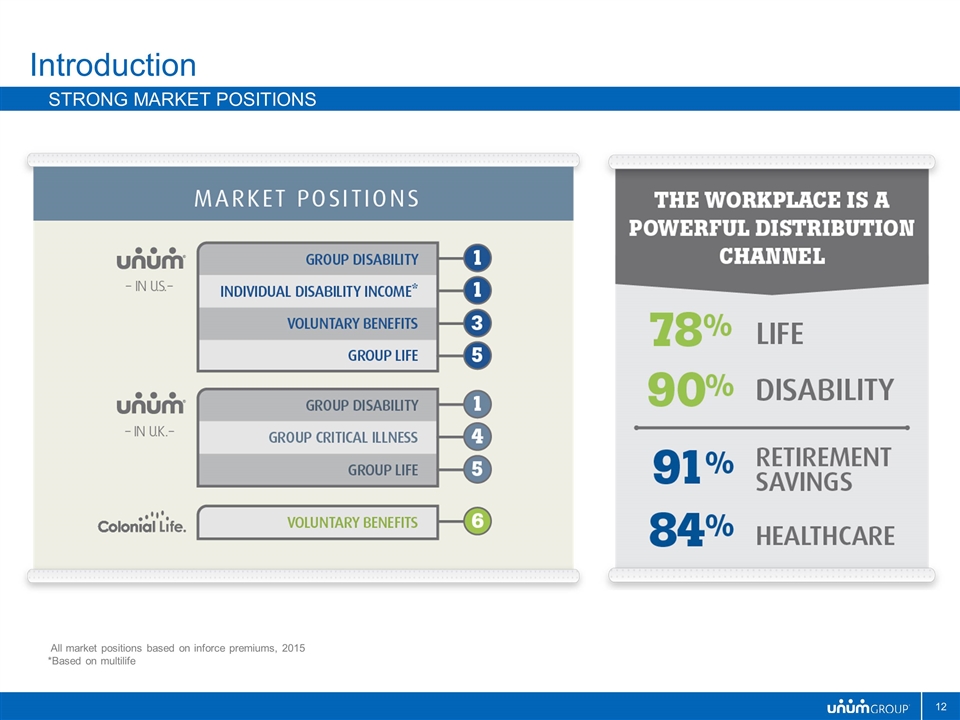
Introduction strong market positions All market positions based on inforce premiums, 2015 *Based on multilife
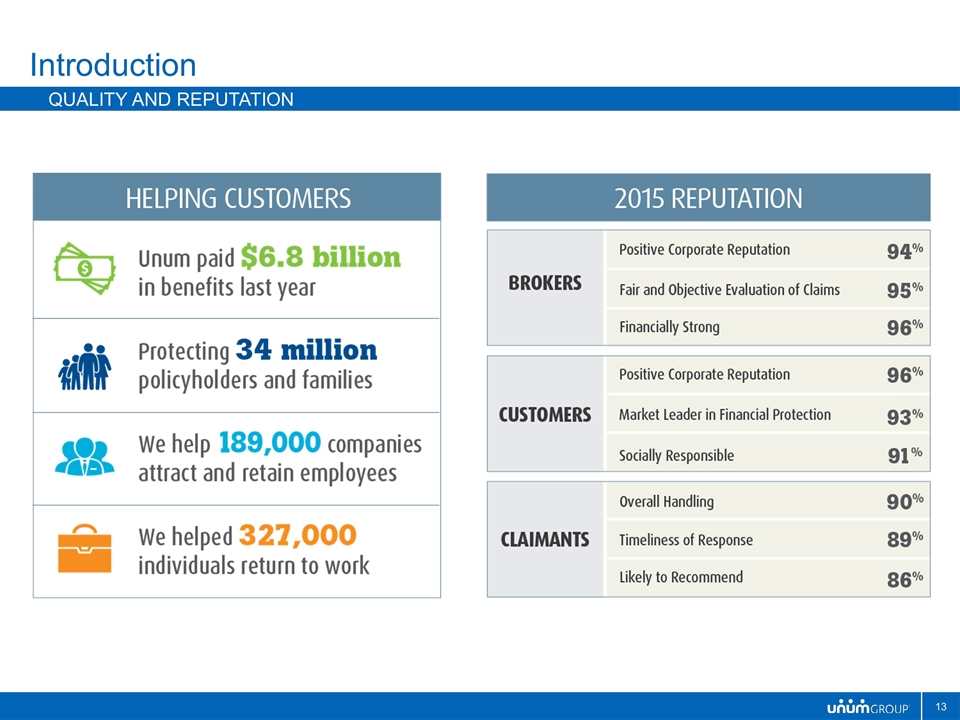
Introduction Quality and Reputation
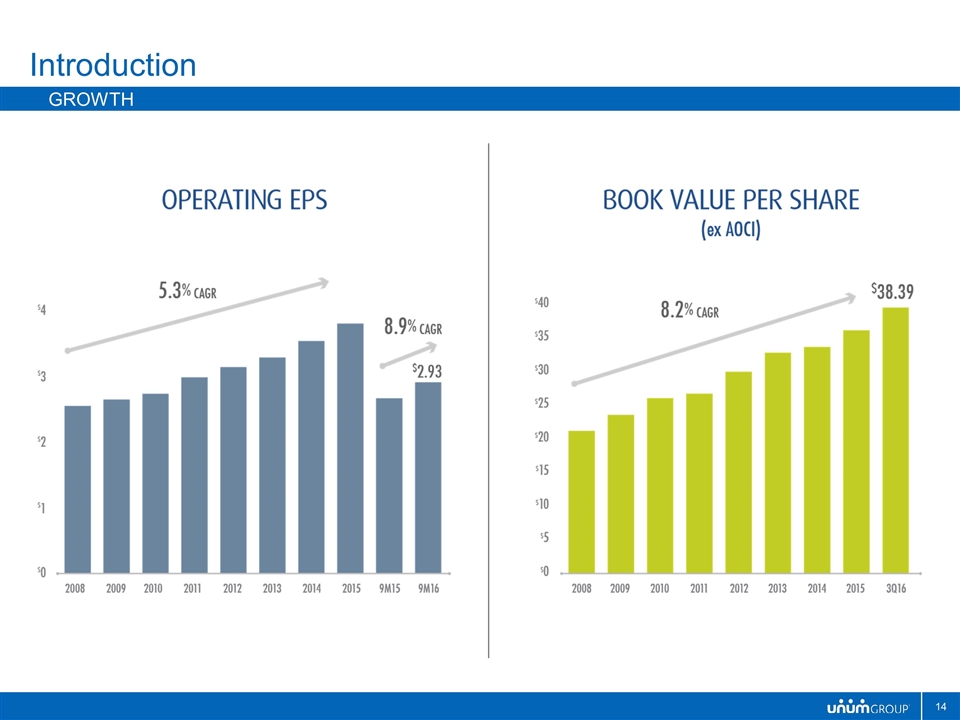
Introduction Growth
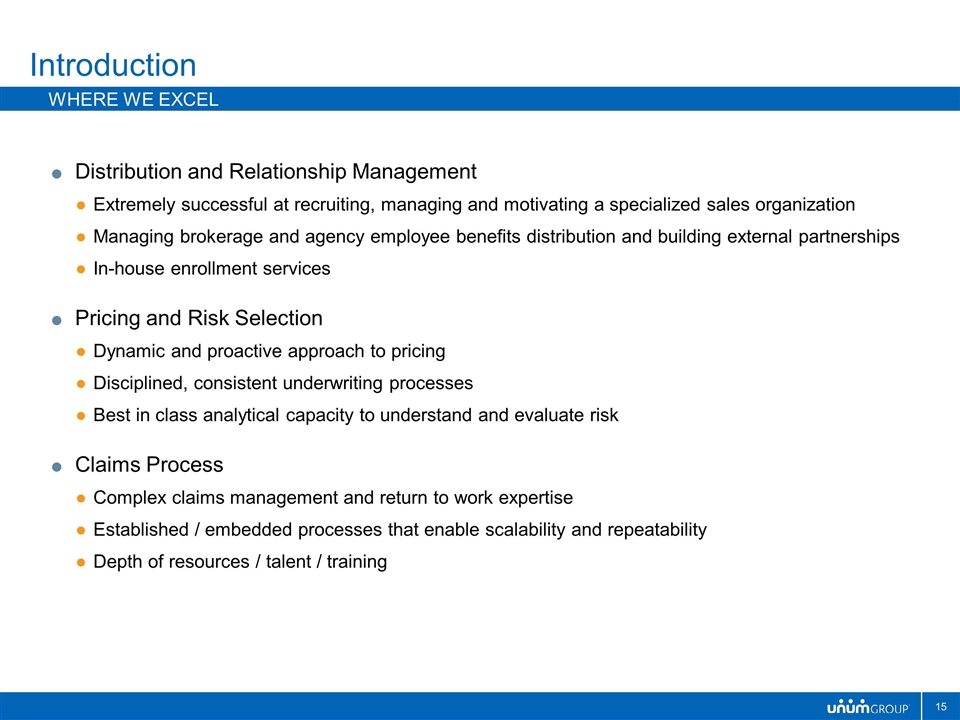
Distribution and Relationship Management Extremely successful at recruiting, managing and motivating a specialized sales organization Managing brokerage and agency employee benefits distribution and building external partnerships In-house enrollment services Pricing and Risk Selection Dynamic and proactive approach to pricing Disciplined, consistent underwriting processes Best in class analytical capacity to understand and evaluate risk Claims Process Complex claims management and return to work expertise Established / embedded processes that enable scalability and repeatability Depth of resources / talent / training Introduction Where we excel
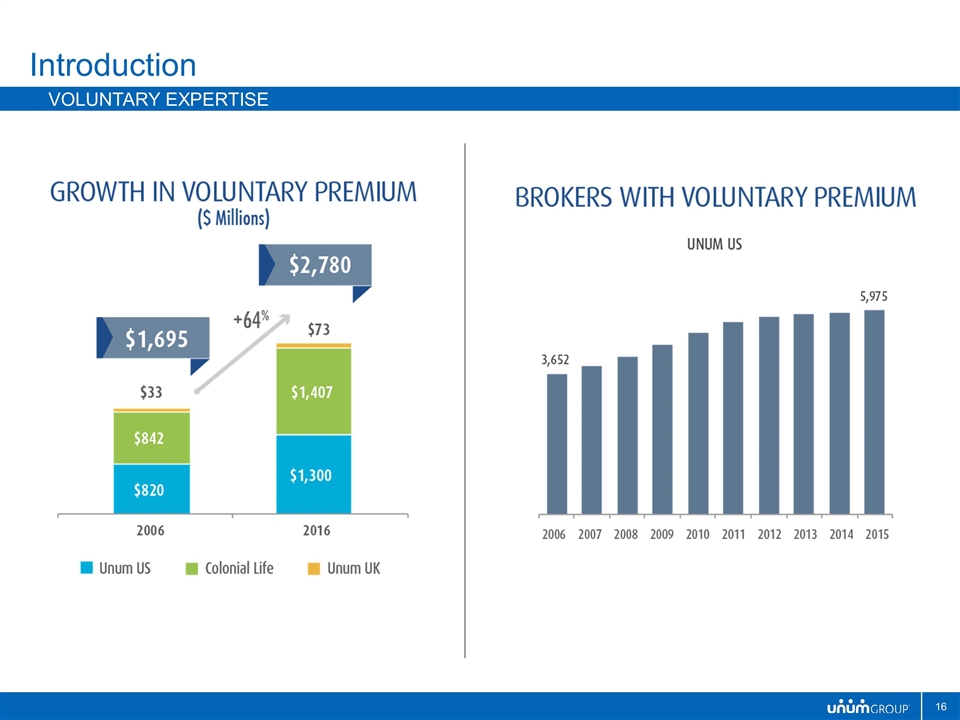
Introduction Voluntary expertise
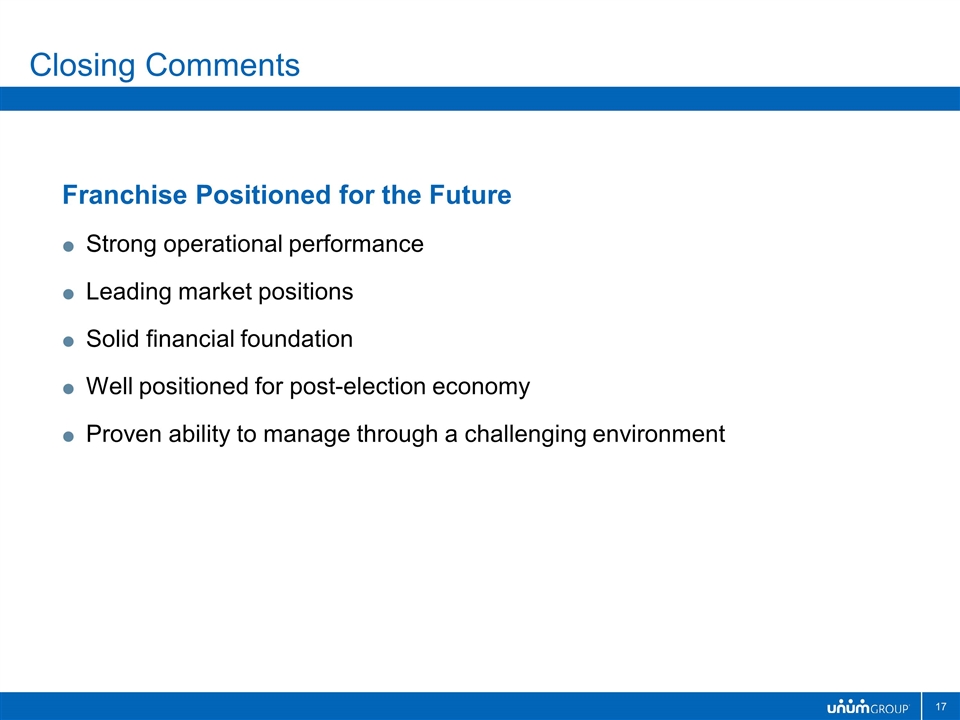
Closing Comments Franchise Positioned for the Future Strong operational performance Leading market positions Solid financial foundation Well positioned for post-election economy Proven ability to manage through a challenging environment
State of the Business
Financial Performance
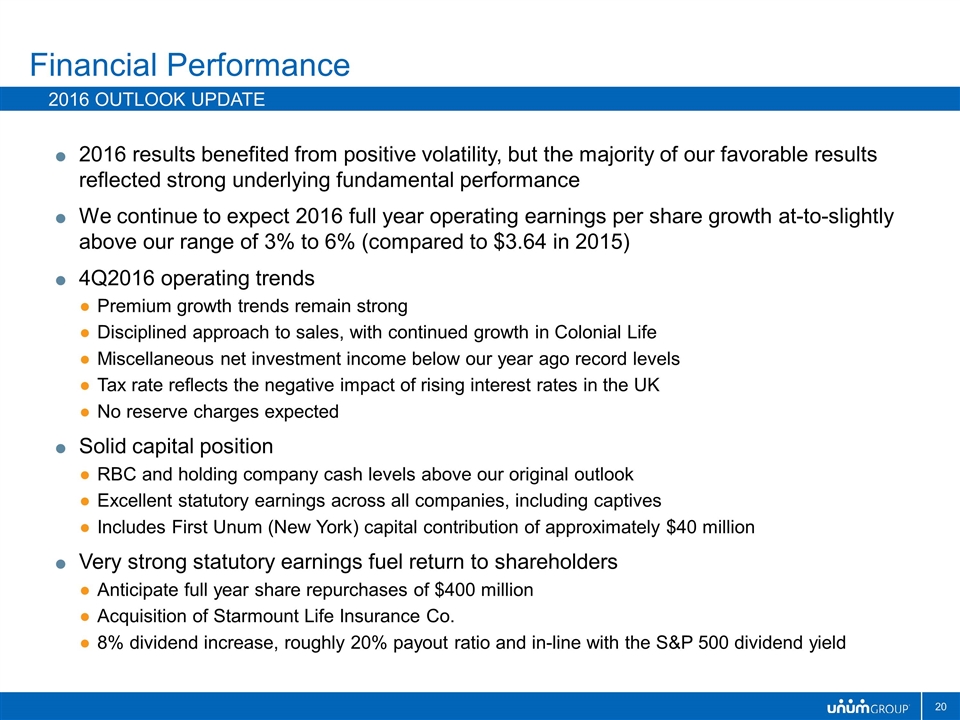
Financial Performance 2016 Outlook update 2016 results benefited from positive volatility, but the majority of our favorable results reflected strong underlying fundamental performance We continue to expect 2016 full year operating earnings per share growth at-to-slightly above our range of 3% to 6% (compared to $3.64 in 2015) 4Q2016 operating trends Premium growth trends remain strong Disciplined approach to sales, with continued growth in Colonial Life Miscellaneous net investment income below our year ago record levels Tax rate reflects the negative impact of rising interest rates in the UK No reserve charges expected Solid capital position RBC and holding company cash levels above our original outlook Excellent statutory earnings across all companies, including captives Includes First Unum (New York) capital contribution of approximately $40 million Very strong statutory earnings fuel return to shareholders Anticipate full year share repurchases of $400 million Acquisition of Starmount Life Insurance Co. 8% dividend increase, roughly 20% payout ratio and in-line with the S&P 500 dividend yield
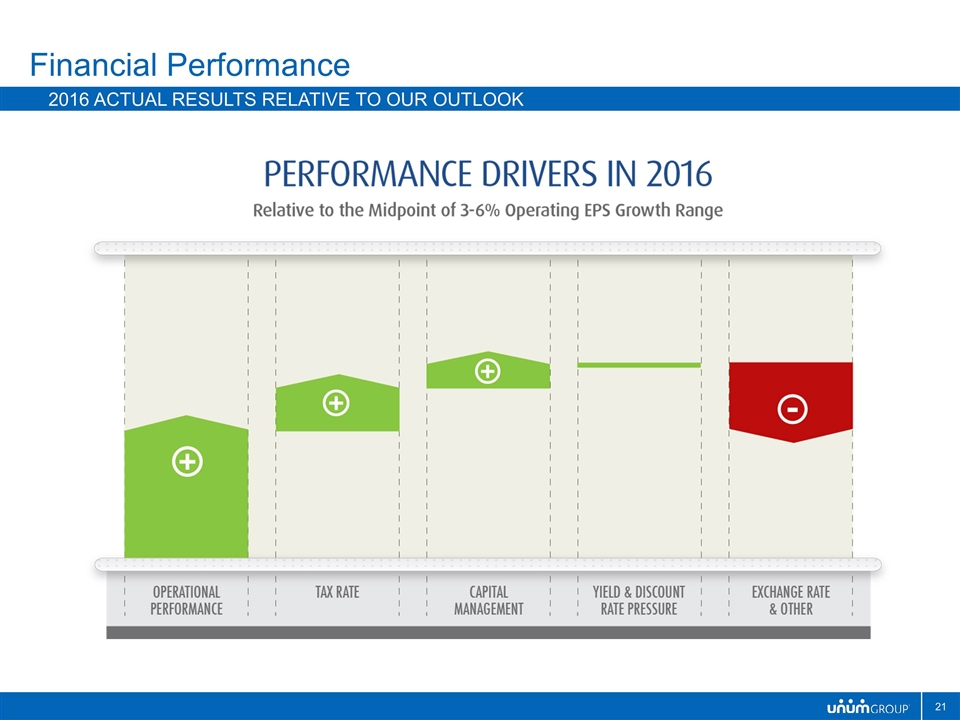
Financial Performance 2016 actual results relative to our outlook
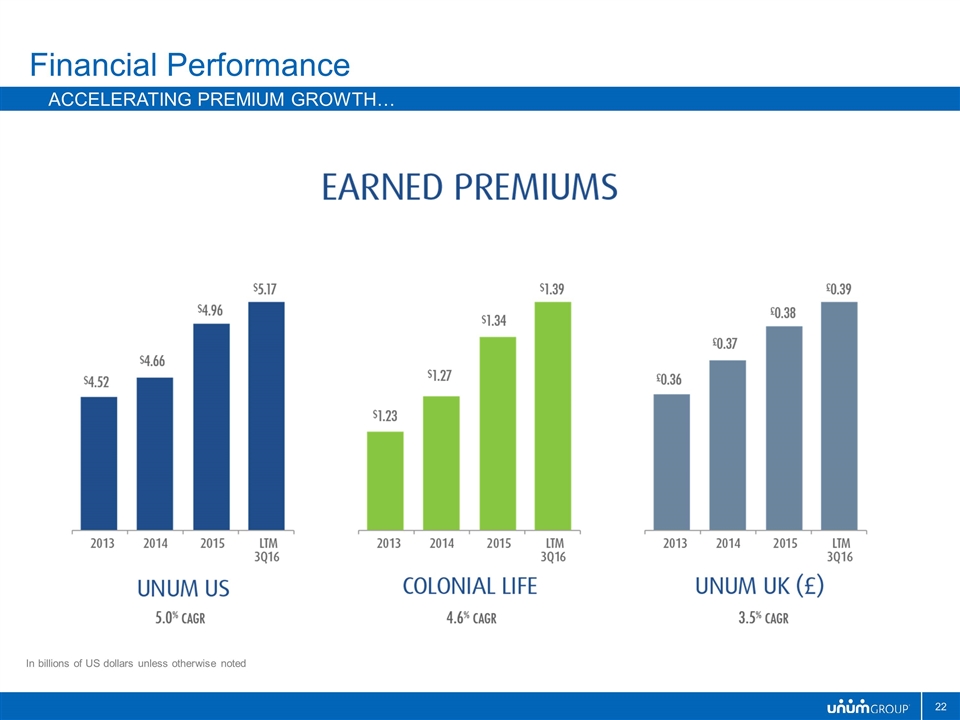
Financial Performance Accelerating premium Growth… In billions of US dollars unless otherwise noted
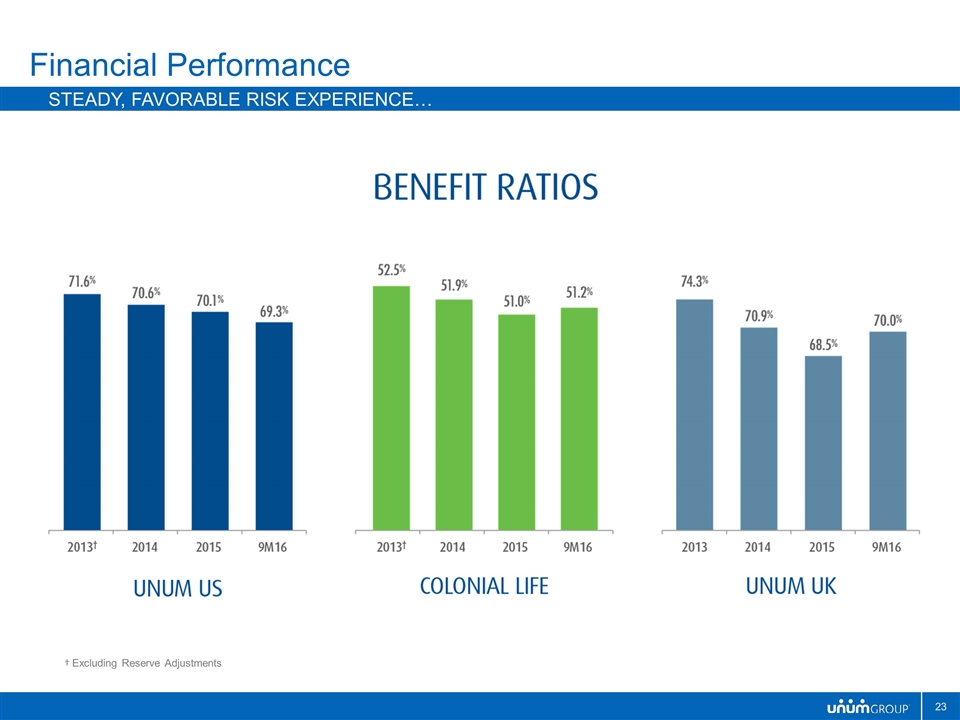
Financial Performance Steady, favorable risk experience… † Excluding Reserve Adjustments
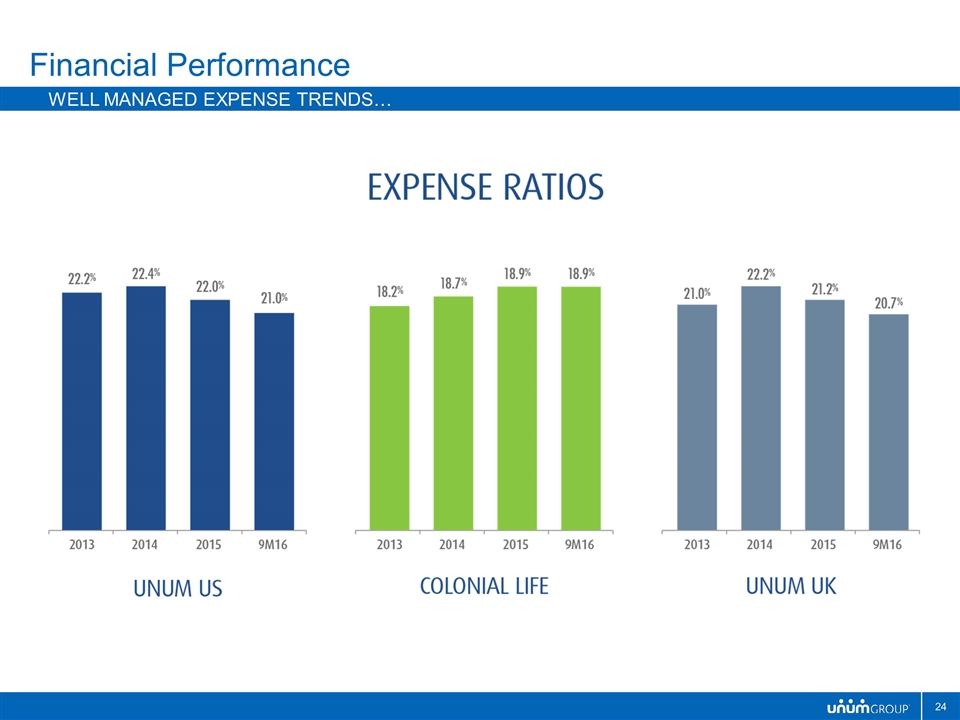
Financial Performance Well managed expense trends…
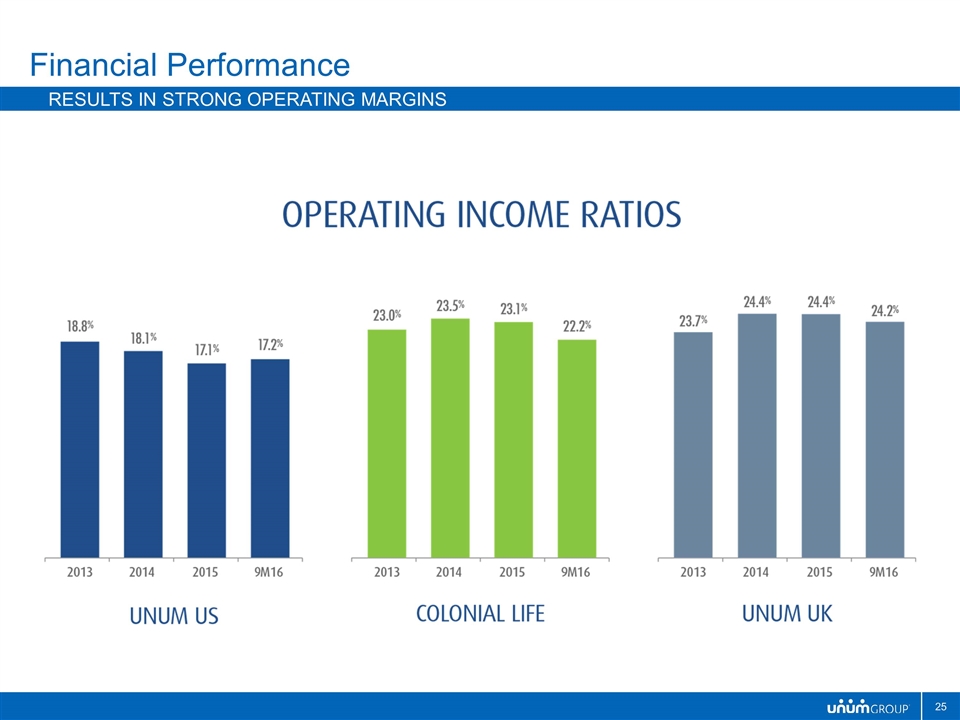
Financial Performance Results in Strong operating margins
Interest Rates Tax Rates Foreign Exchange Rates Share Price Financial Performance 2017 issues and strategies
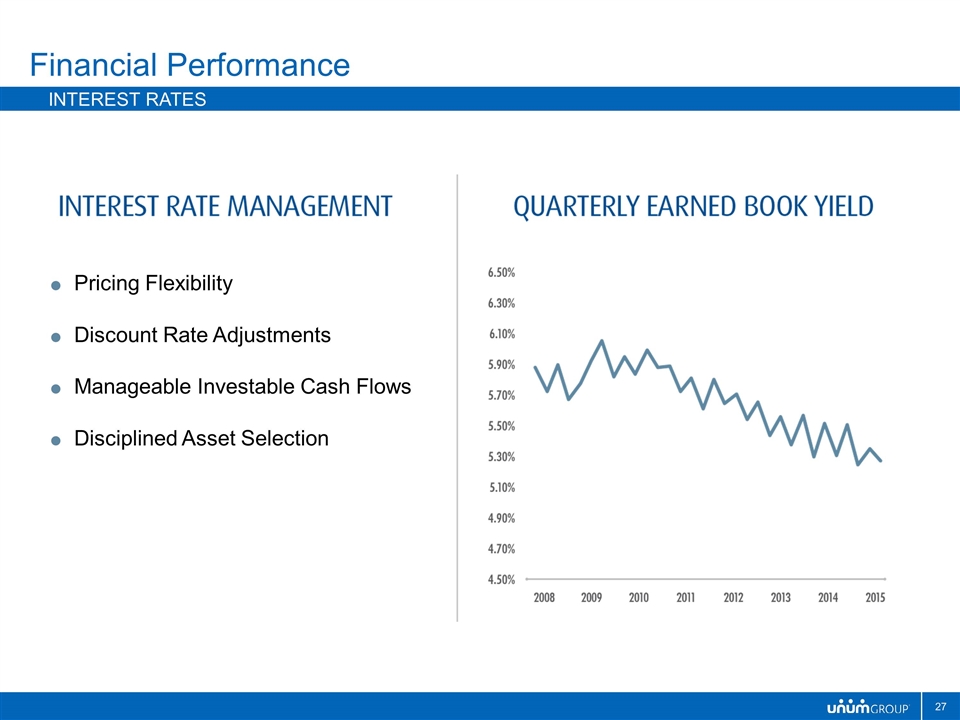
Financial Performance interest rates Pricing Flexibility Discount Rate Adjustments Manageable Investable Cash Flows Disciplined Asset Selection
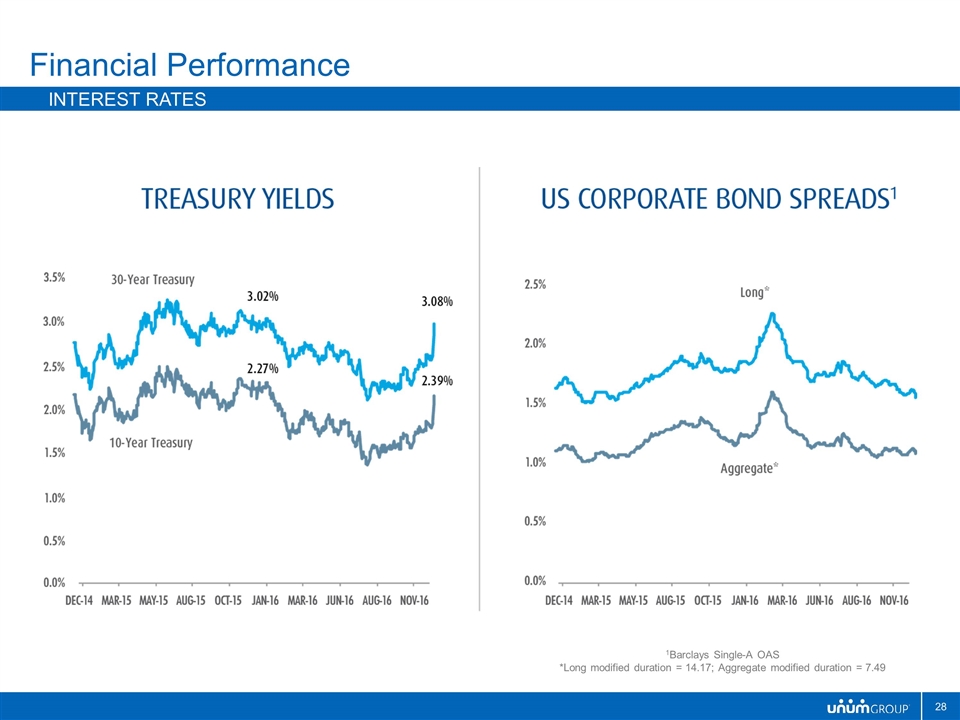
Financial Performance interest rates 1Barclays Single-A OAS *Long modified duration = 14.17; Aggregate modified duration = 7.49
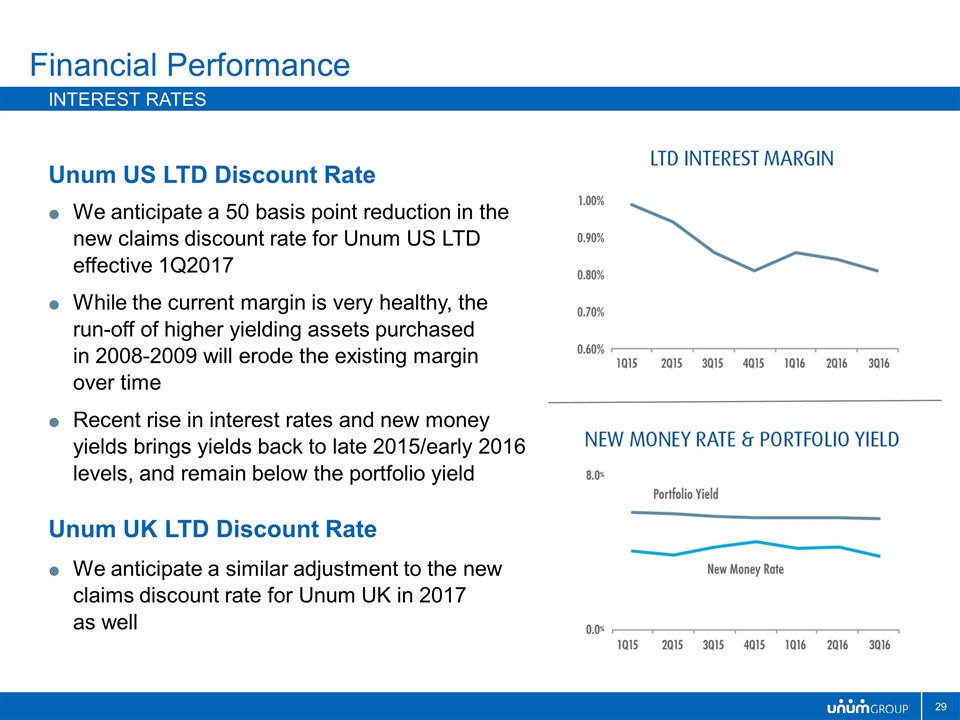
Unum US LTD Discount Rate We anticipate a 50 basis point reduction in the new claims discount rate for Unum US LTD effective 1Q2017 While the current margin is very healthy, the run-off of higher yielding assets purchased in 2008-2009 will erode the existing margin over time Recent rise in interest rates and new money yields brings yields back to late 2015/early 2016 levels, and remain below the portfolio yield Unum UK LTD Discount Rate We anticipate a similar adjustment to the new claims discount rate for Unum UK in 2017 as well Financial Performance interest rates
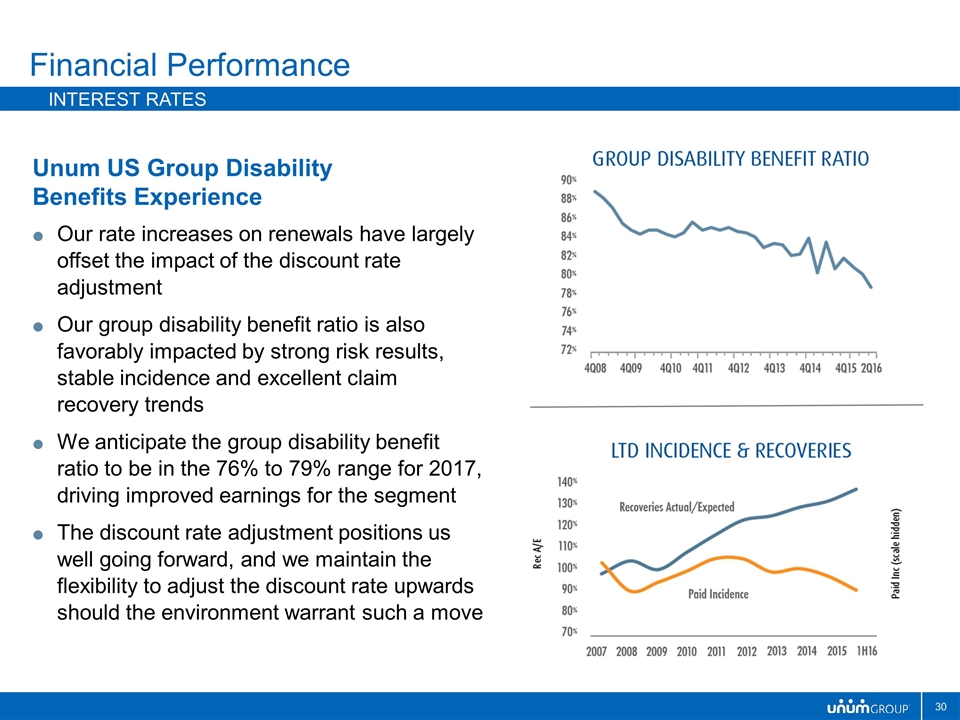
Unum US Group Disability Benefits Experience Our rate increases on renewals have largely offset the impact of the discount rate adjustment Our group disability benefit ratio is also favorably impacted by strong risk results, stable incidence and excellent claim recovery trends We anticipate the group disability benefit ratio to be in the 76% to 79% range for 2017, driving improved earnings for the segment The discount rate adjustment positions us well going forward, and we maintain the flexibility to adjust the discount rate upwards should the environment warrant such a move Financial Performance interest rates
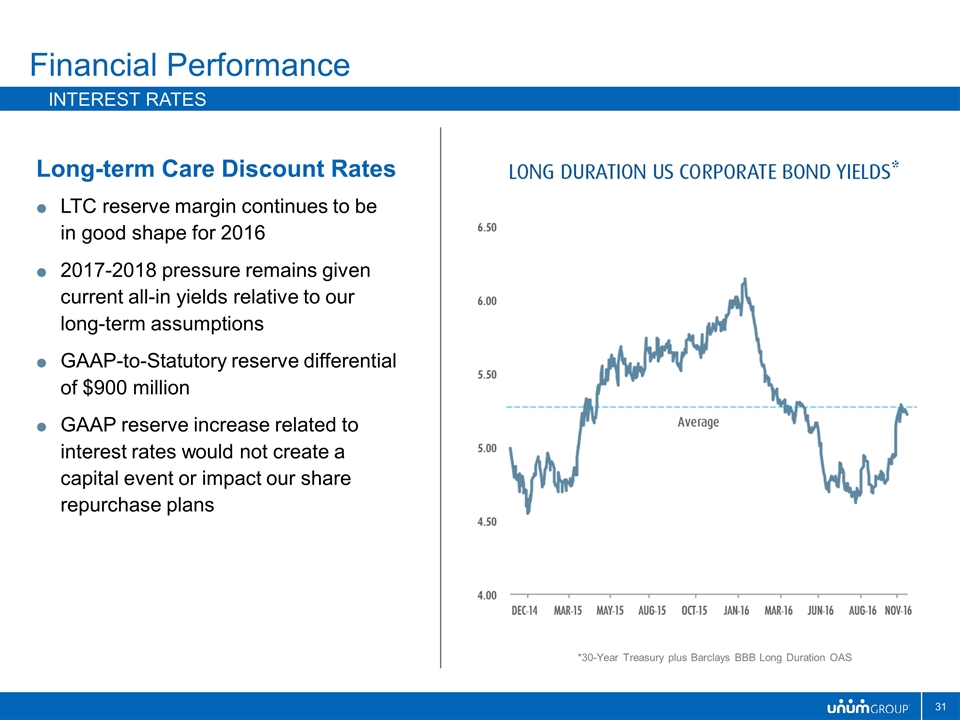
Long-term Care Discount Rates LTC reserve margin continues to be in good shape for 2016 2017-2018 pressure remains given current all-in yields relative to our long-term assumptions GAAP-to-Statutory reserve differential of $900 million GAAP reserve increase related to interest rates would not create a capital event or impact our share repurchase plans Financial Performance interest rates *30-Year Treasury plus Barclays BBB Long Duration OAS
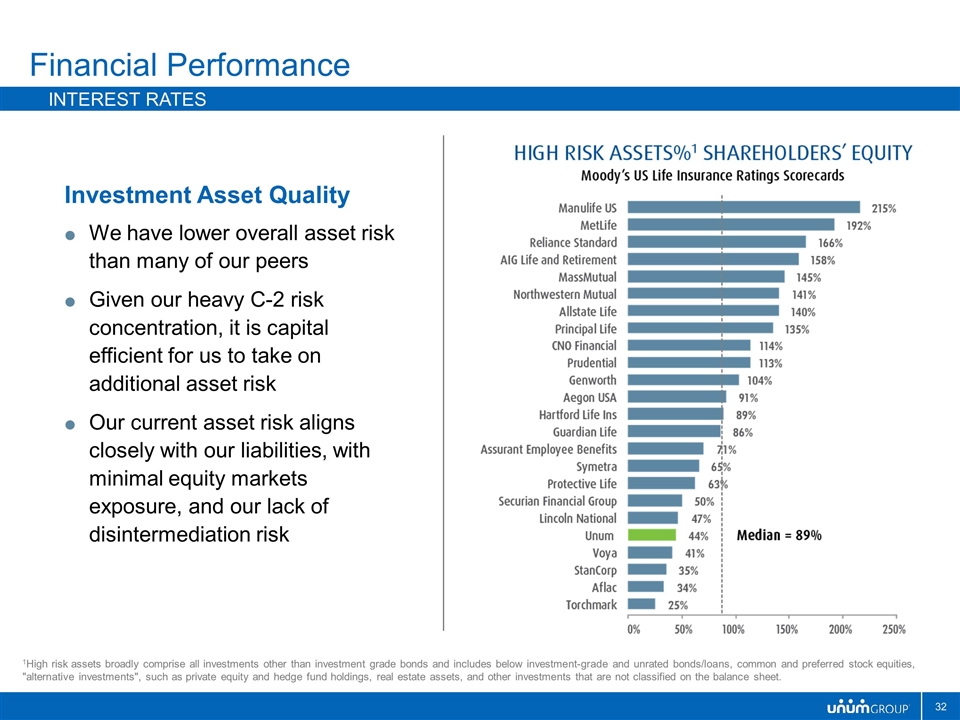
Financial Performance Interest rates 1High risk assets broadly comprise all investments other than investment grade bonds and includes below investment-grade and unrated bonds/loans, common and preferred stock equities, "alternative investments", such as private equity and hedge fund holdings, real estate assets, and other investments that are not classified on the balance sheet. Investment Asset Quality We have lower overall asset risk than many of our peers Given our heavy C-2 risk concentration, it is capital efficient for us to take on additional asset risk Our current asset risk aligns closely with our liabilities, with minimal equity markets exposure, and our lack of disintermediation risk
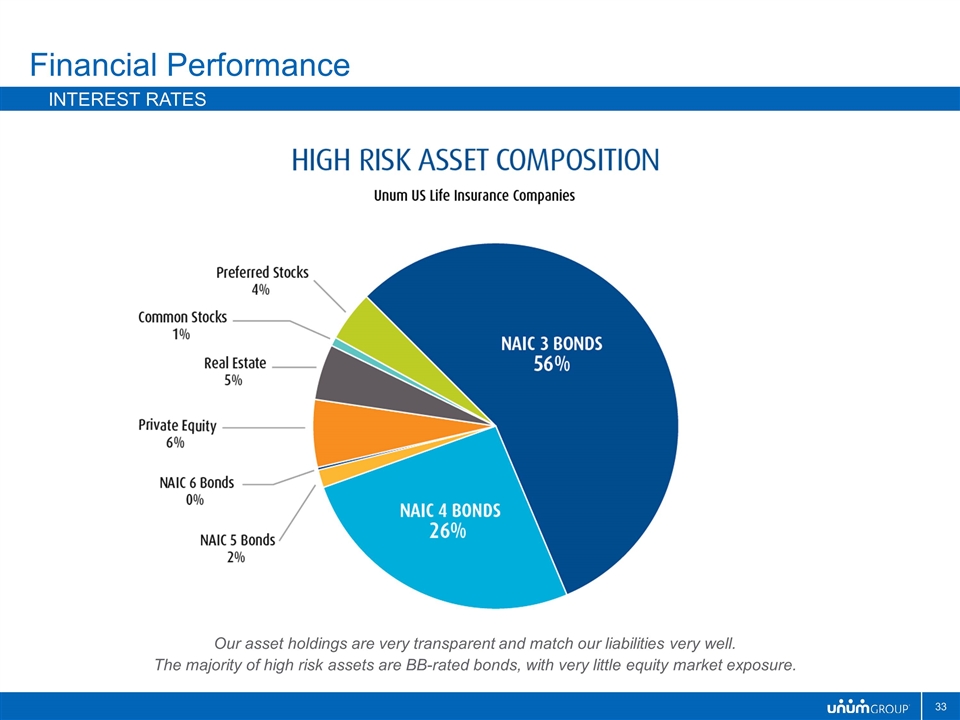
Financial Performance Interest rates Our asset holdings are very transparent and match our liabilities very well. The majority of high risk assets are BB-rated bonds, with very little equity market exposure.
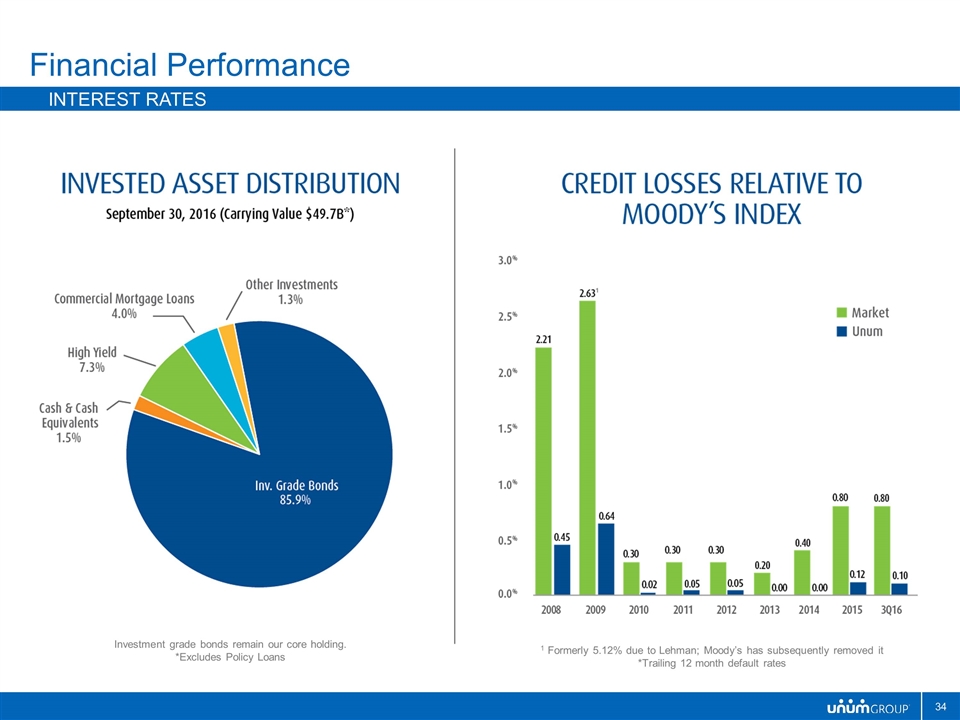
Financial Performance Interest rates Investment grade bonds remain our core holding. *Excludes Policy Loans 1 Formerly 5.12% due to Lehman; Moody’s has subsequently removed it *Trailing 12 month default rates
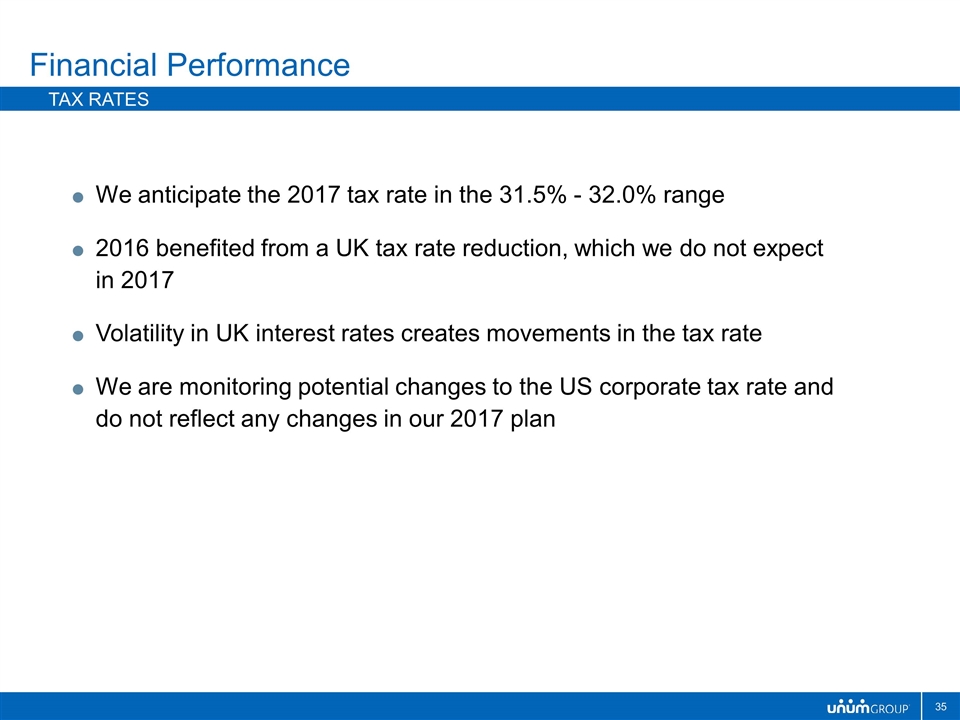
We anticipate the 2017 tax rate in the 31.5% - 32.0% range 2016 benefited from a UK tax rate reduction, which we do not expect in 2017 Volatility in UK interest rates creates movements in the tax rate We are monitoring potential changes to the US corporate tax rate and do not reflect any changes in our 2017 plan Financial Performance Tax Rates
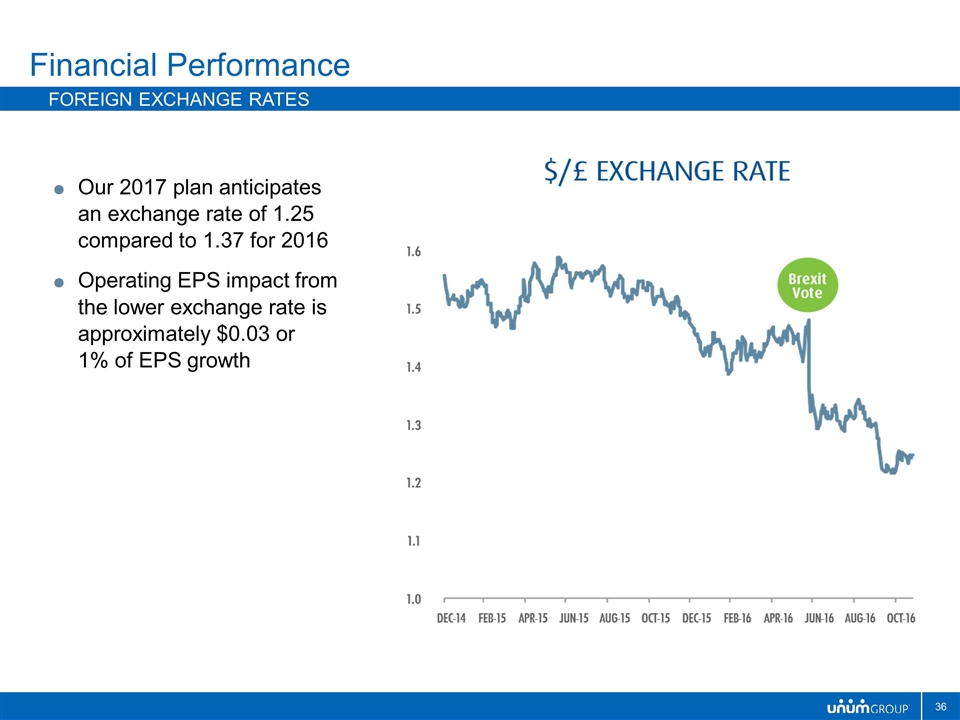
Our 2017 plan anticipates an exchange rate of 1.25 compared to 1.37 for 2016 Operating EPS impact from the lower exchange rate is approximately $0.03 or 1% of EPS growth Financial Performance Foreign exchange rates
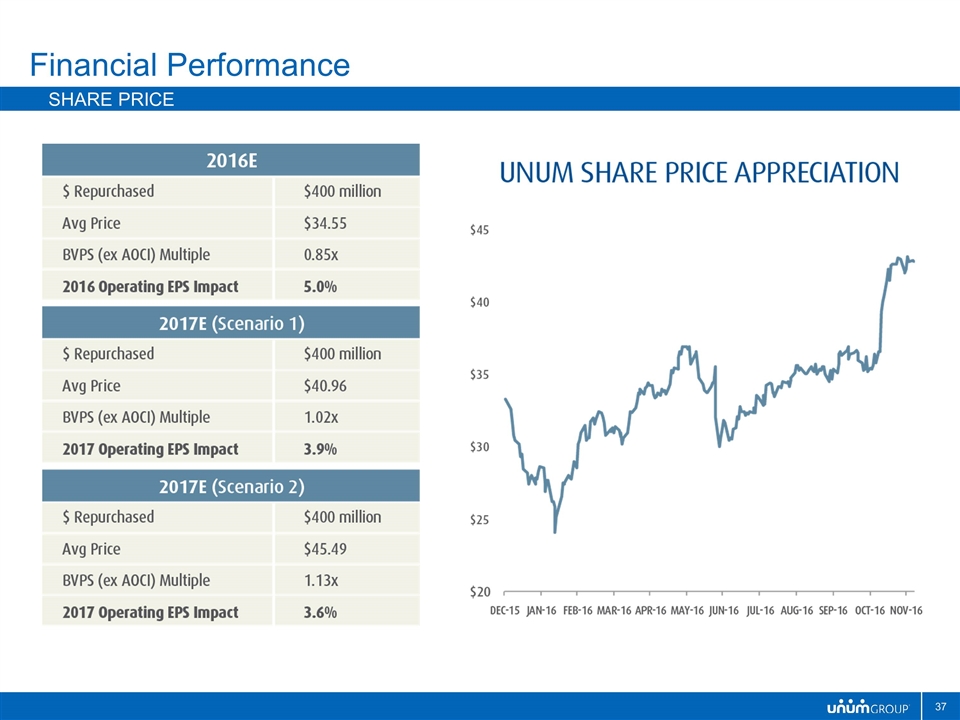
Financial Performance Share Price
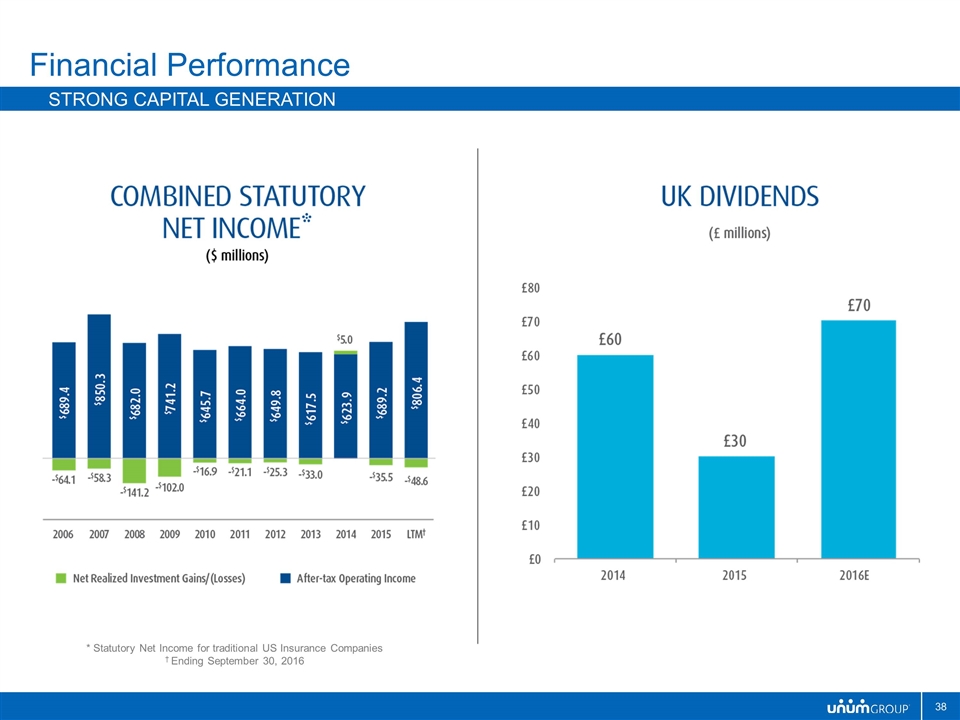
Financial Performance Strong Capital Generation * Statutory Net Income for traditional US Insurance Companies † Ending September 30, 2016
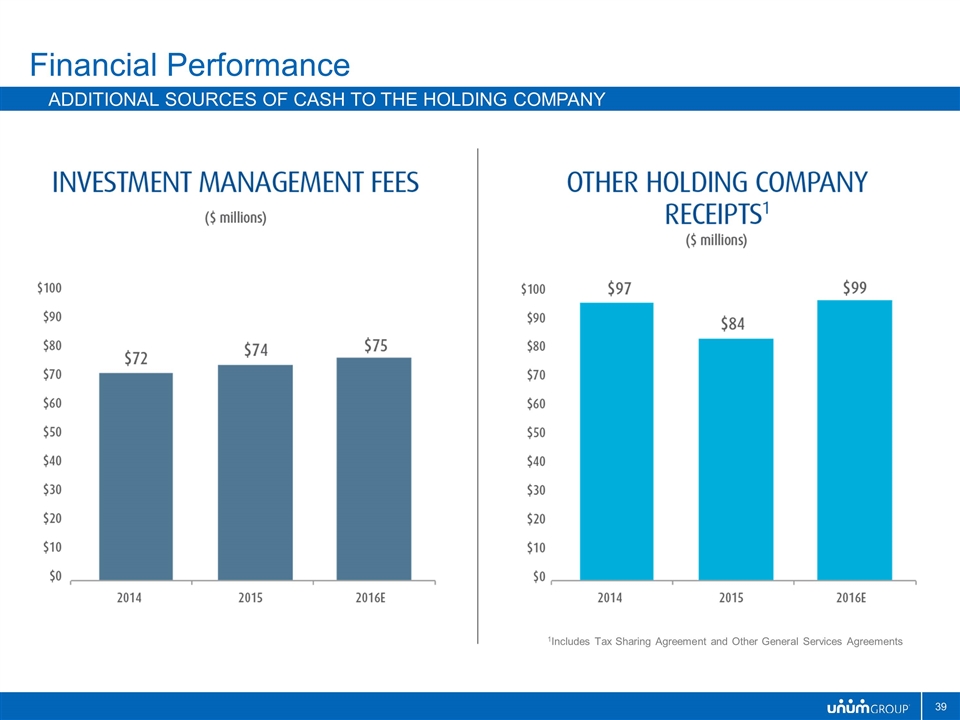
Financial Performance Additional sources of cash to the holding company 1Includes Tax Sharing Agreement and Other General Services Agreements
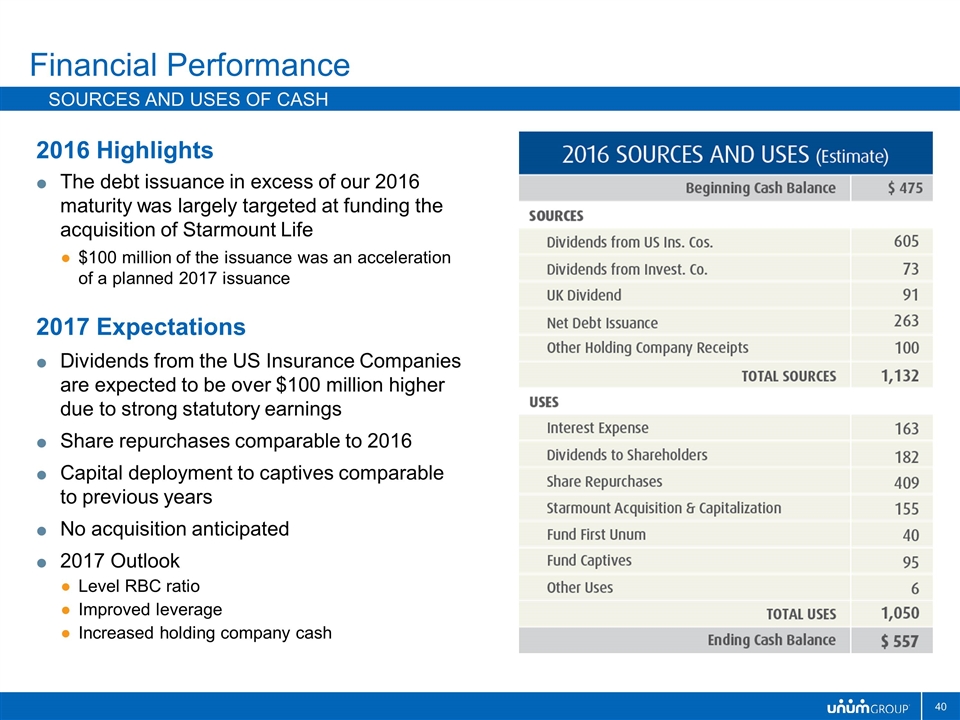
2016 Highlights The debt issuance in excess of our 2016 maturity was largely targeted at funding the acquisition of Starmount Life $100 million of the issuance was an acceleration of a planned 2017 issuance 2017 Expectations Dividends from the US Insurance Companies are expected to be over $100 million higher due to strong statutory earnings Share repurchases comparable to 2016 Capital deployment to captives comparable to previous years No acquisition anticipated 2017 Outlook Level RBC ratio Improved leverage Increased holding company cash Financial Performance Sources and uses of cash
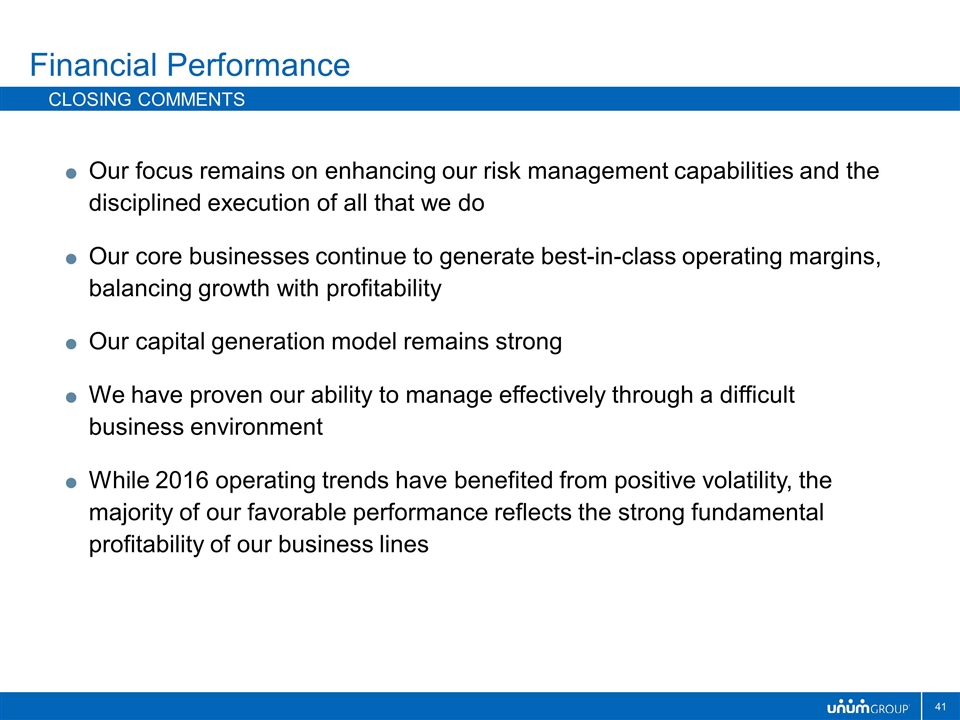
Our focus remains on enhancing our risk management capabilities and the disciplined execution of all that we do Our core businesses continue to generate best-in-class operating margins, balancing growth with profitability Our capital generation model remains strong We have proven our ability to manage effectively through a difficult business environment While 2016 operating trends have benefited from positive volatility, the majority of our favorable performance reflects the strong fundamental profitability of our business lines Financial Performance Closing Comments
Unum US
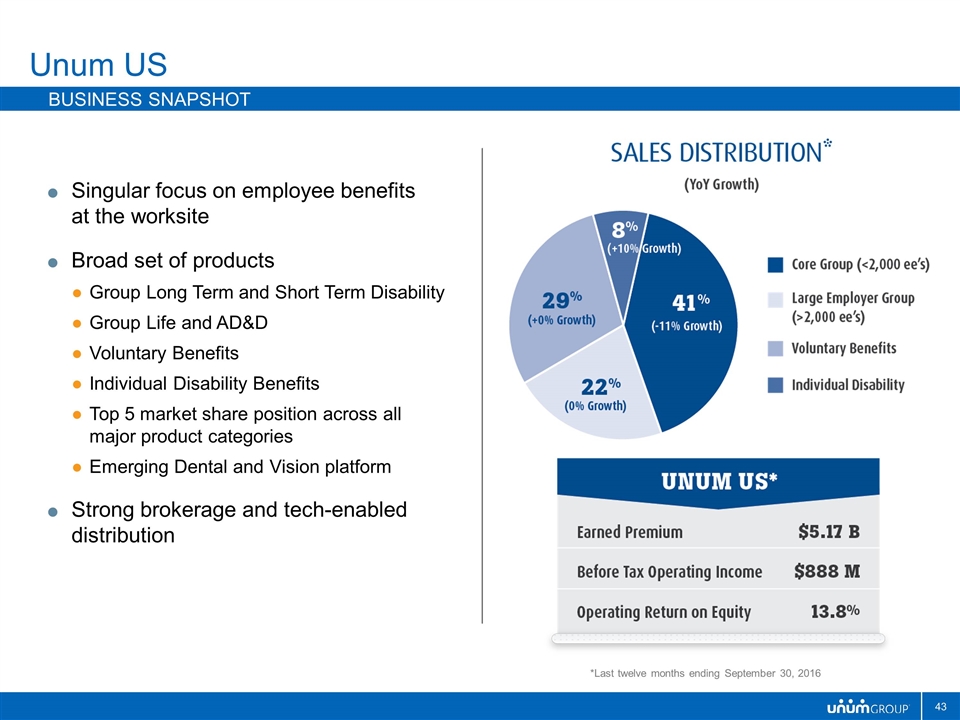
Unum US Business Snapshot Singular focus on employee benefits at the worksite Broad set of products Group Long Term and Short Term Disability Group Life and AD&D Voluntary Benefits Individual Disability Benefits Top 5 market share position across all major product categories Emerging Dental and Vision platform Strong brokerage and tech-enabled distribution *Last twelve months ending September 30, 2016
Employers remain committed to benefits, but …need help with cost, administration, and employee engagement Consumer need for financial protection is growing, but …they don’t understand our products well Technology enabling new distribution, but …insurance is highly regulated and complex Interest rates remain a pressure point, but …disciplined re-pricing can offset over time Competition increasing with new carriers filing benefits products, but …building delivery capabilities takes time and scale Unum US Market Trends
Unum US Strategy
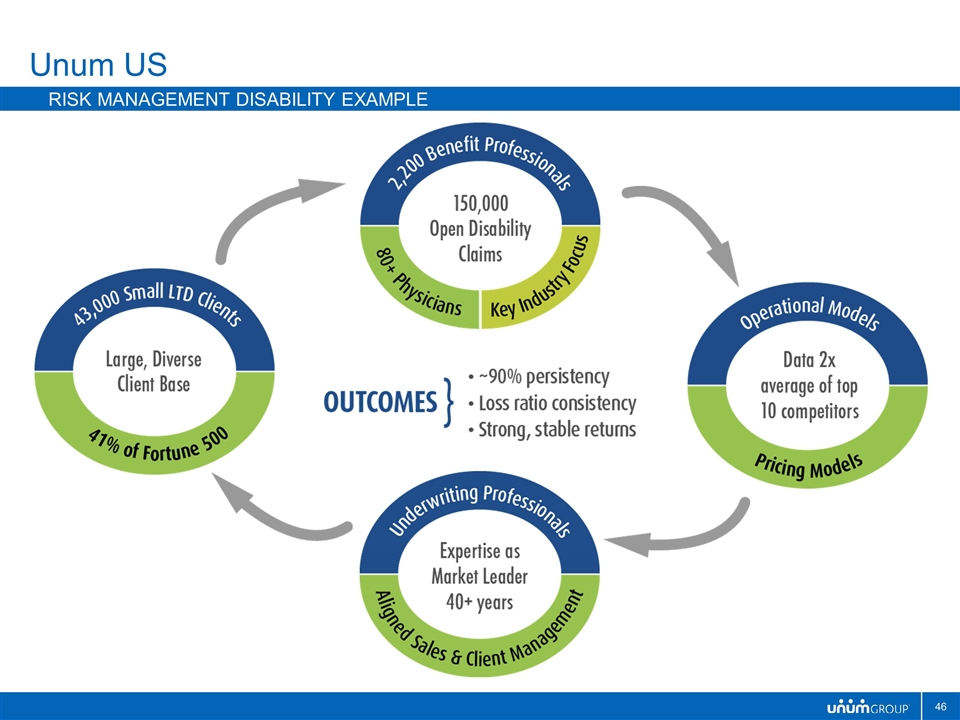
Unum US Risk management disability example
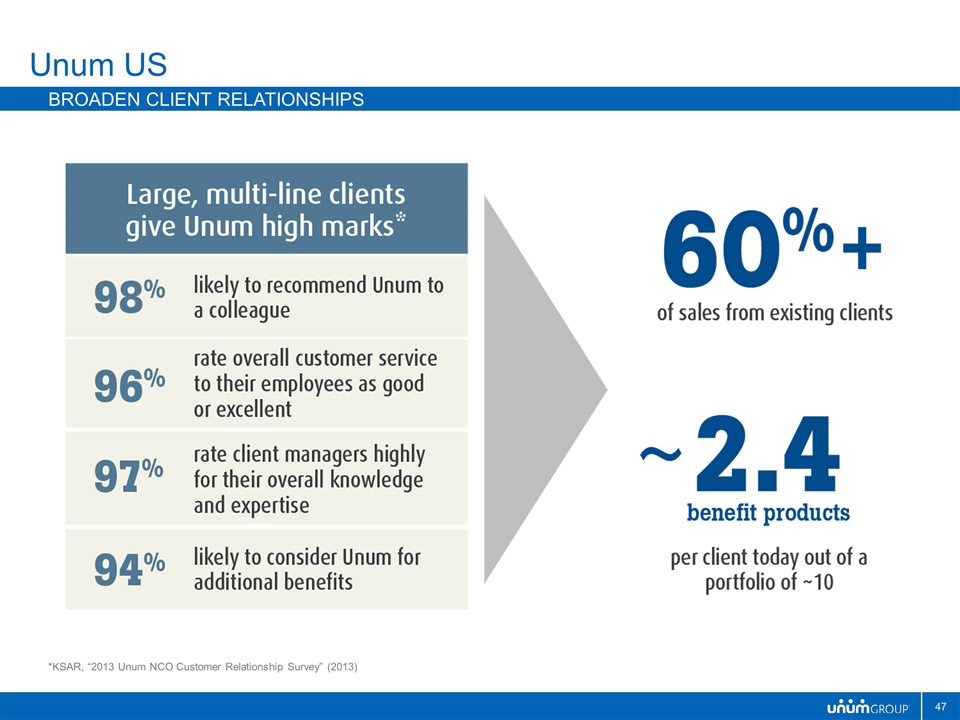
Unum US Broaden client Relationships *KSAR, “2013 Unum NCO Customer Relationship Survey” (2013)
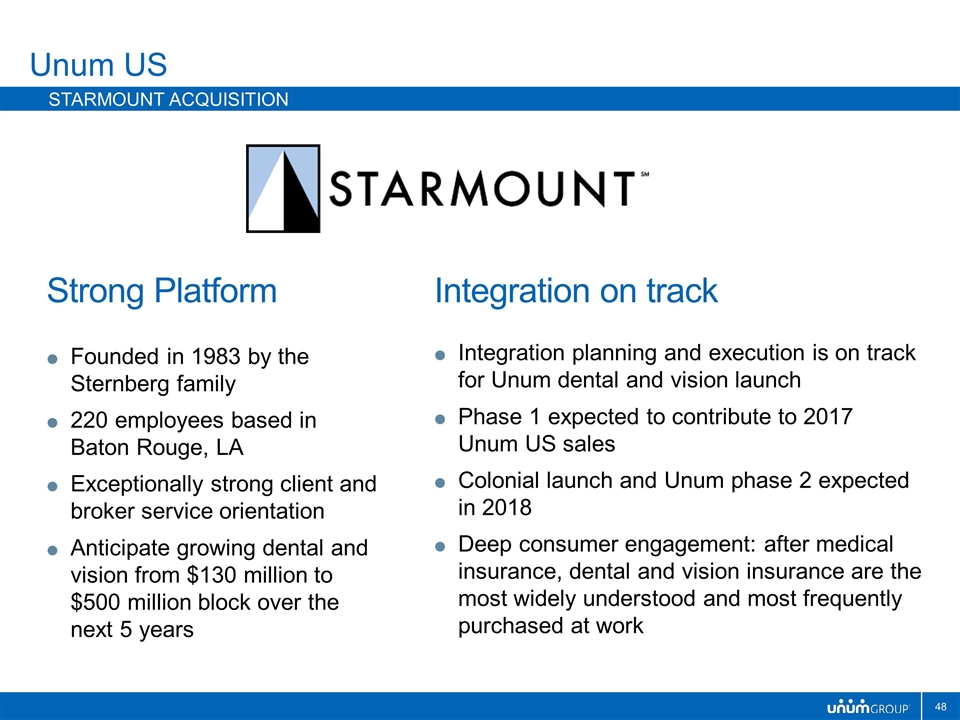
Unum US Starmount acquisition Strong Platform Founded in 1983 by the Sternberg family 220 employees based in Baton Rouge, LA Exceptionally strong client and broker service orientation Anticipate growing dental and vision from $130 million to $500 million block over the next 5 years Integration on track Integration planning and execution is on track for Unum dental and vision launch Phase 1 expected to contribute to 2017 Unum US sales Colonial launch and Unum phase 2 expected in 2018 Deep consumer engagement: after medical insurance, dental and vision insurance are the most widely understood and most frequently purchased at work
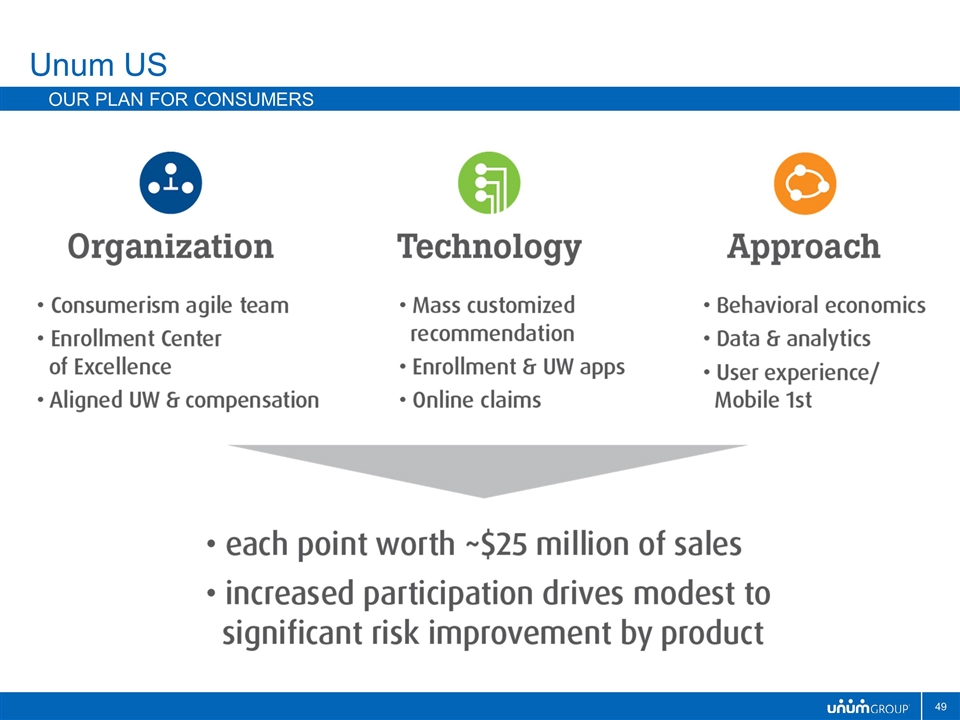
Unum US Our plan for consumers
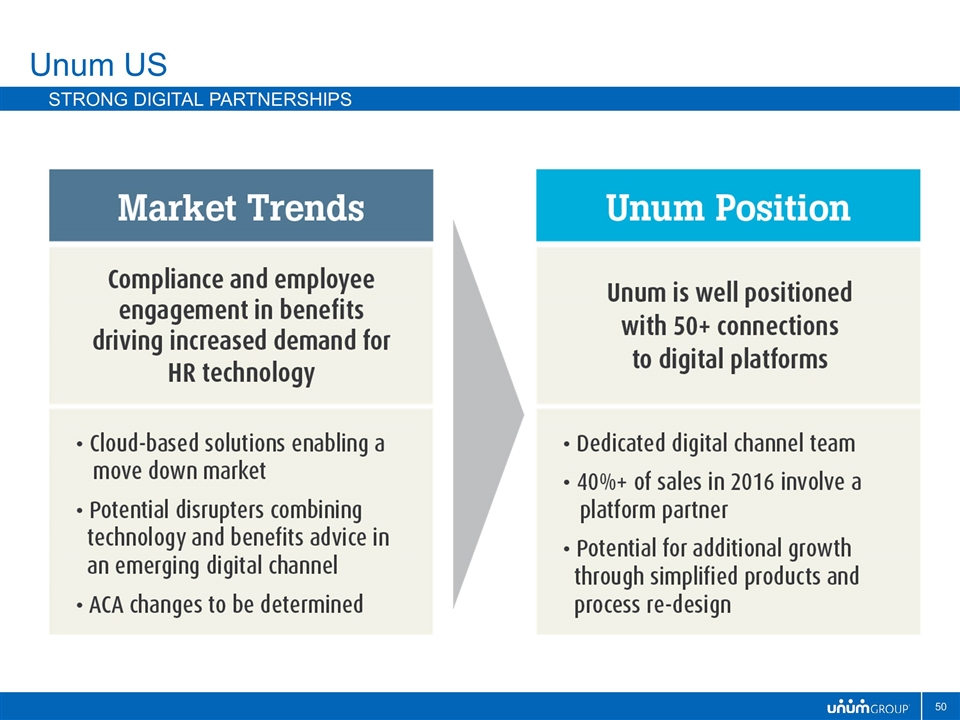
Unum US Strong Digital Partnerships
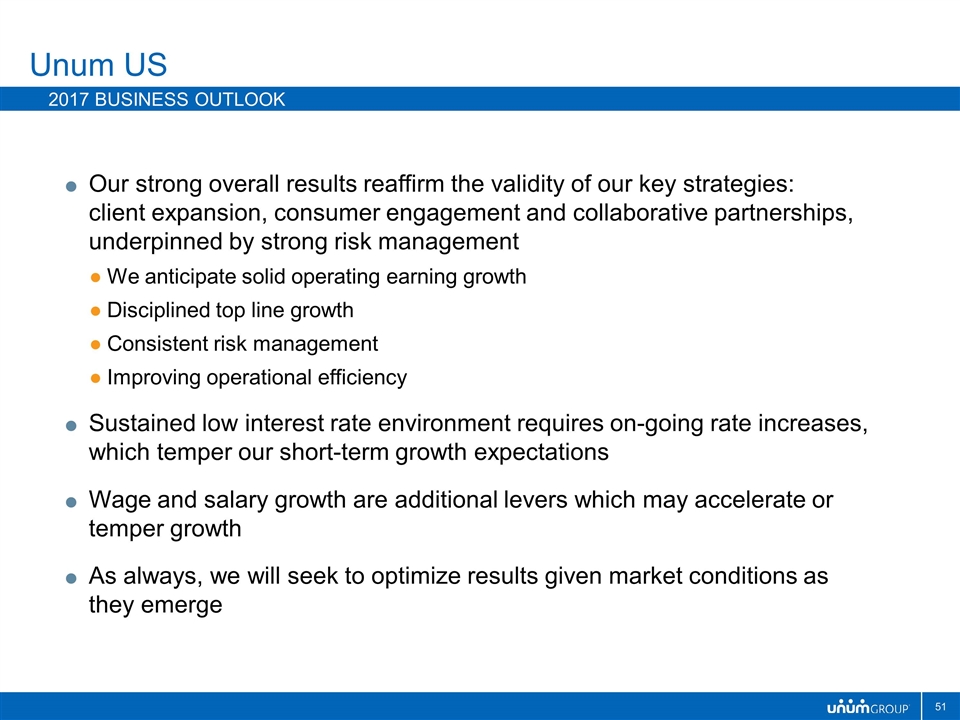
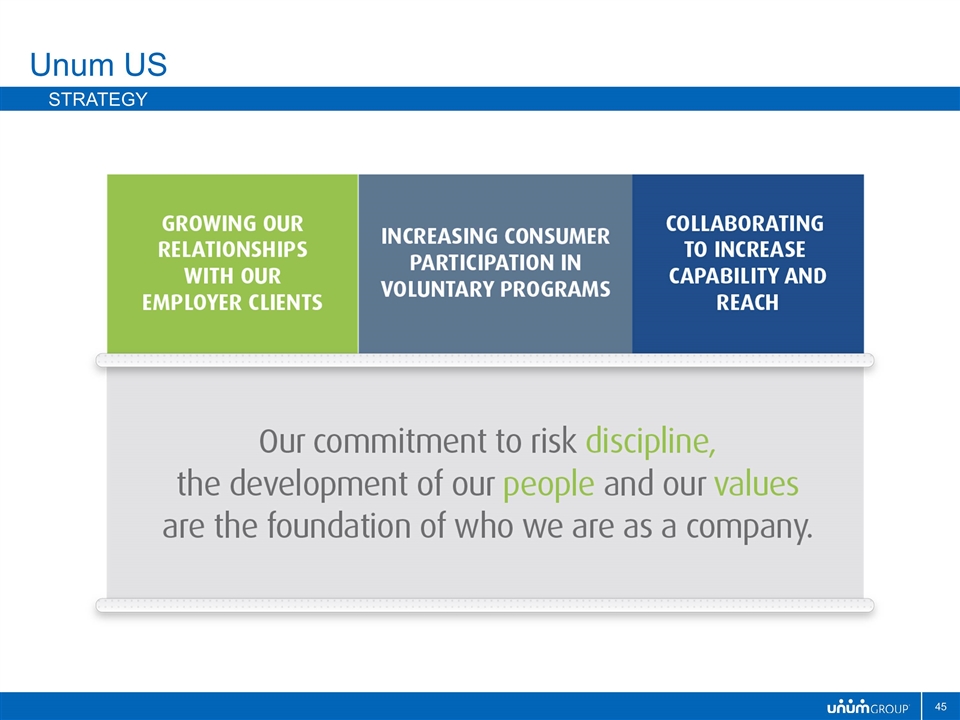
Our strong overall results reaffirm the validity of our key strategies: client expansion, consumer engagement and collaborative partnerships, underpinned by strong risk management We anticipate solid operating earning growth Disciplined top line growth Consistent risk management Improving operational efficiency Sustained low interest rate environment requires on-going rate increases, which temper our short-term growth expectations Wage and salary growth are additional levers which may accelerate or temper growth As always, we will seek to optimize results given market conditions as they emerge Unum US 2017 Business outlook
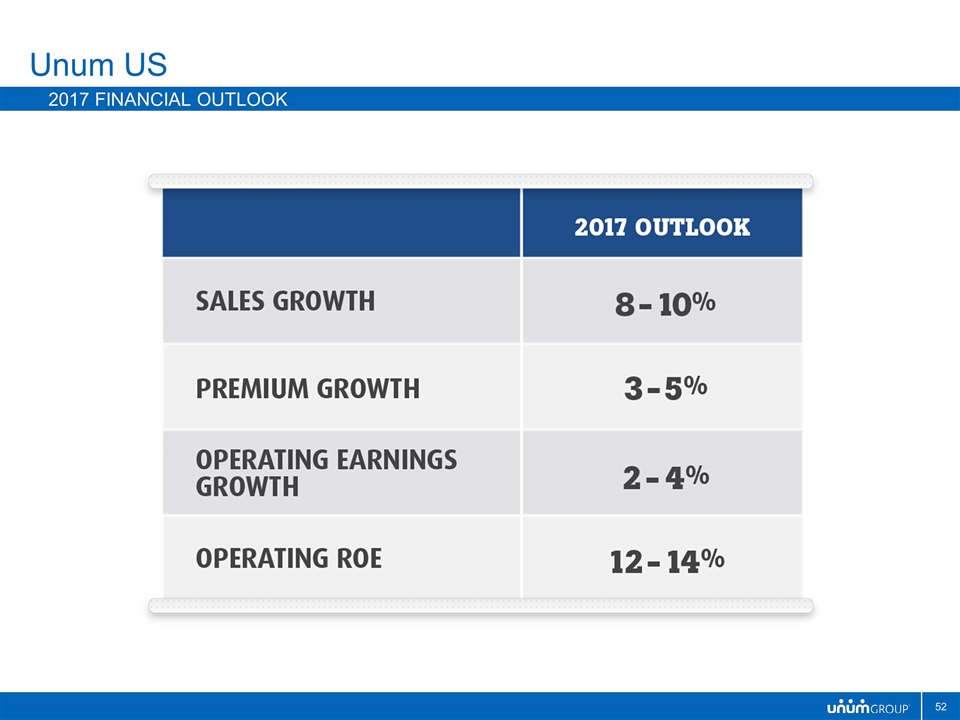
Unum US 2017 Financial Outlook
Unum UK
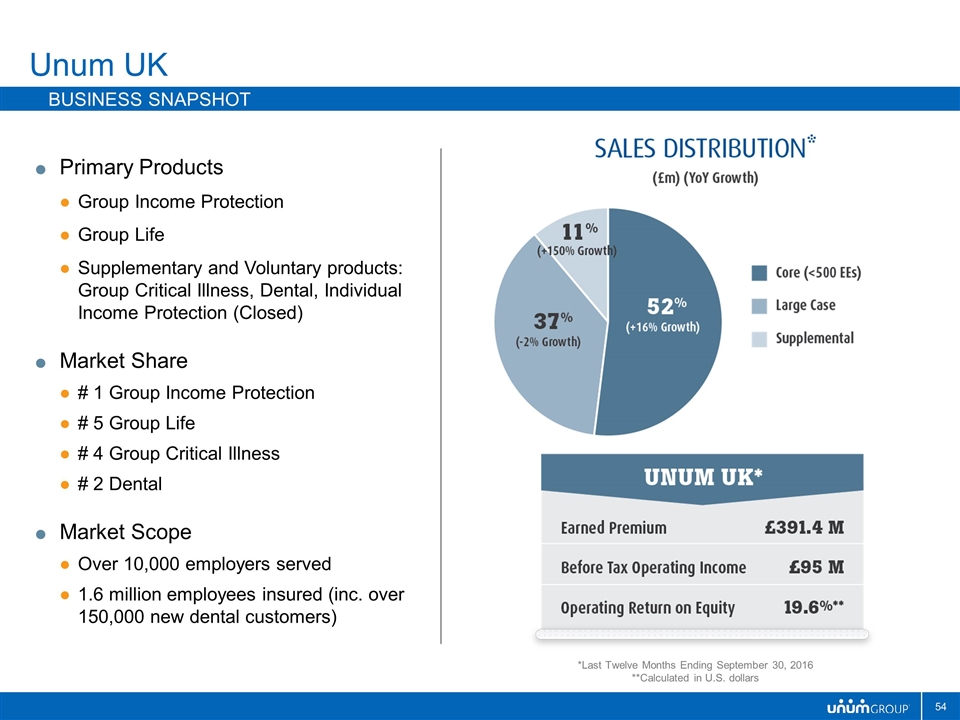
Primary Products Group Income Protection Group Life Supplementary and Voluntary products: Group Critical Illness, Dental, Individual Income Protection (Closed) Market Share # 1 Group Income Protection # 5 Group Life # 4 Group Critical Illness # 2 Dental Market Scope Over 10,000 employers served 1.6 million employees insured (inc. over 150,000 new dental customers) Unum UK Business Snapshot *Last Twelve Months Ending September 30, 2016 **Calculated in U.S. dollars
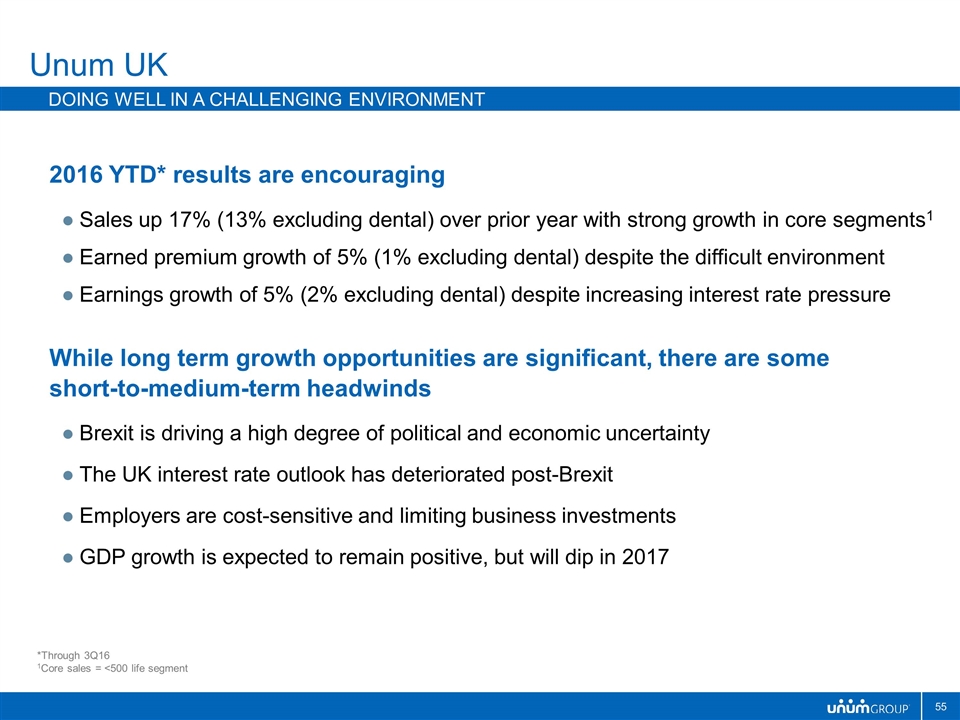
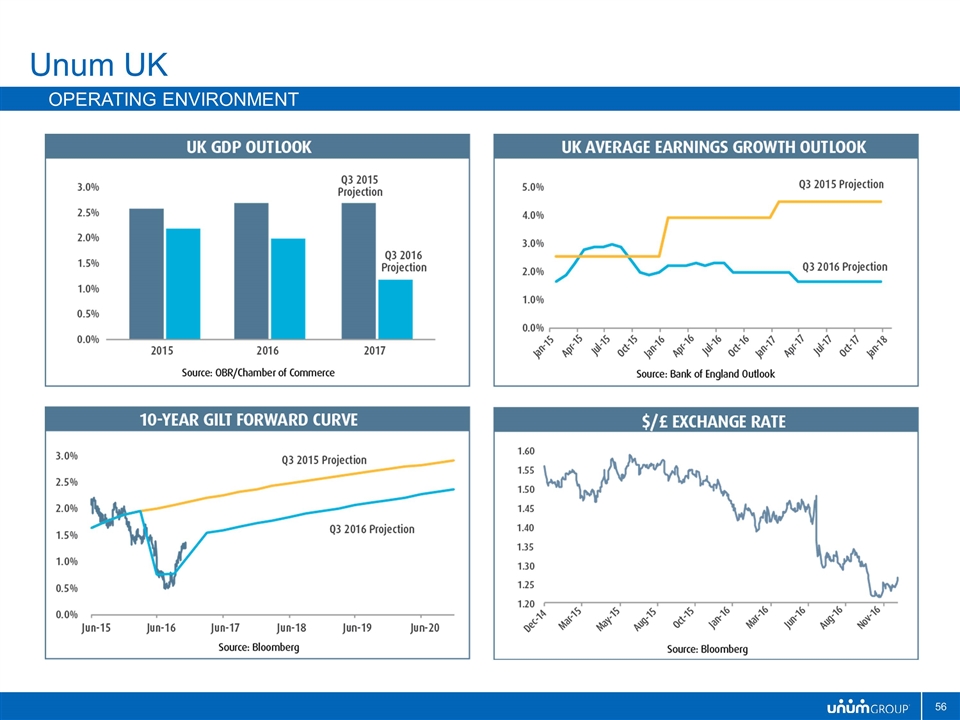
2016 YTD* results are encouraging Sales up 17% (13% excluding dental) over prior year with strong growth in core segments1 Earned premium growth of 5% (1% excluding dental) despite the difficult environment Earnings growth of 5% (2% excluding dental) despite increasing interest rate pressure While long term growth opportunities are significant, there are some short-to-medium-term headwinds Brexit is driving a high degree of political and economic uncertainty The UK interest rate outlook has deteriorated post-Brexit Employers are cost-sensitive and limiting business investments GDP growth is expected to remain positive, but will dip in 2017 Unum UK Doing well in a challenging environment *Through 3Q16 1Core sales = <500 life segment
Unum UK Operating environment
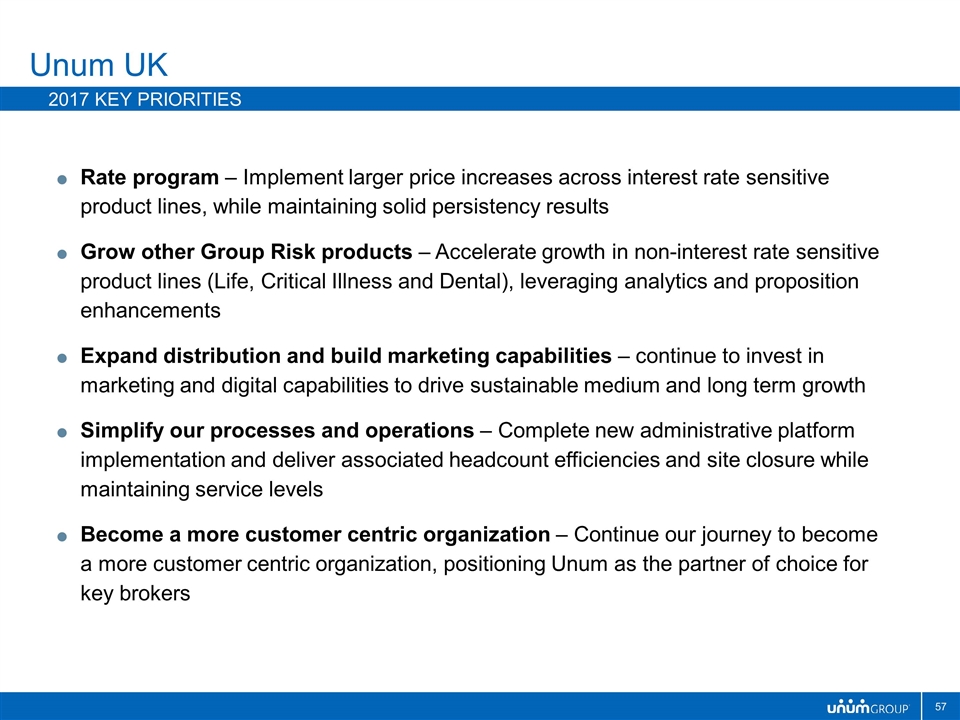
Rate program – Implement larger price increases across interest rate sensitive product lines, while maintaining solid persistency results Grow other Group Risk products – Accelerate growth in non-interest rate sensitive product lines (Life, Critical Illness and Dental), leveraging analytics and proposition enhancements Expand distribution and build marketing capabilities – continue to invest in marketing and digital capabilities to drive sustainable medium and long term growth Simplify our processes and operations – Complete new administrative platform implementation and deliver associated headcount efficiencies and site closure while maintaining service levels Become a more customer centric organization – Continue our journey to become a more customer centric organization, positioning Unum as the partner of choice for key brokers Unum UK 2017 Key Priorities
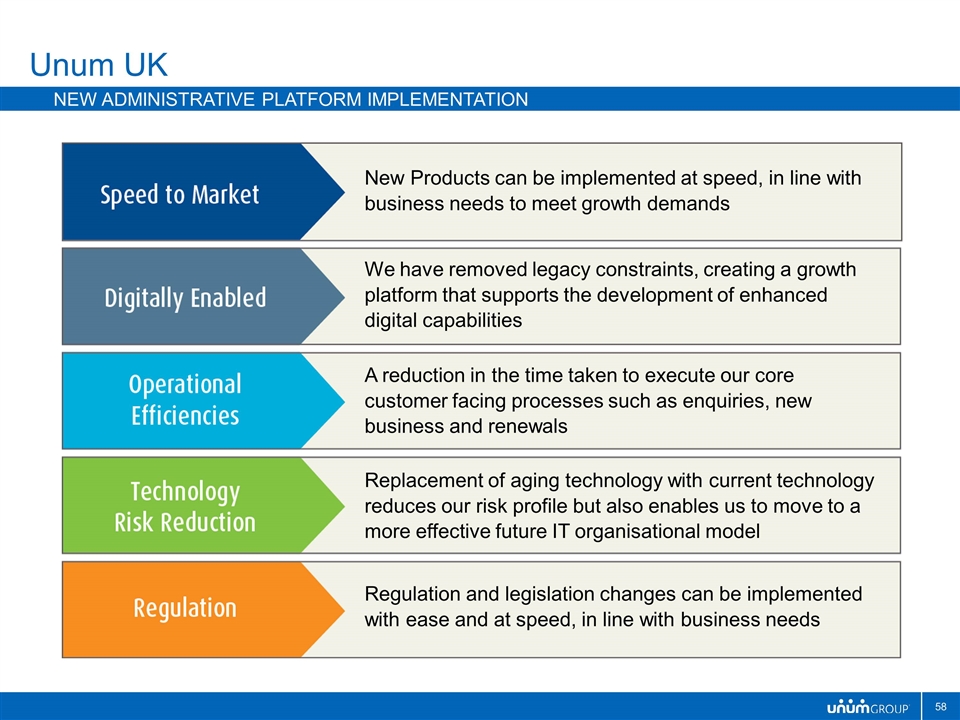
Unum UK New Administrative Platform Implementation New Products can be implemented at speed, in line with business needs to meet growth demands We have removed legacy constraints, creating a growth platform that supports the development of enhanced digital capabilities A reduction in the time taken to execute our core customer facing processes such as enquiries, new business and renewals Replacement of aging technology with current technology reduces our risk profile but also enables us to move to a more effective future IT organisational model Regulation and legislation changes can be implemented with ease and at speed, in line with business needs
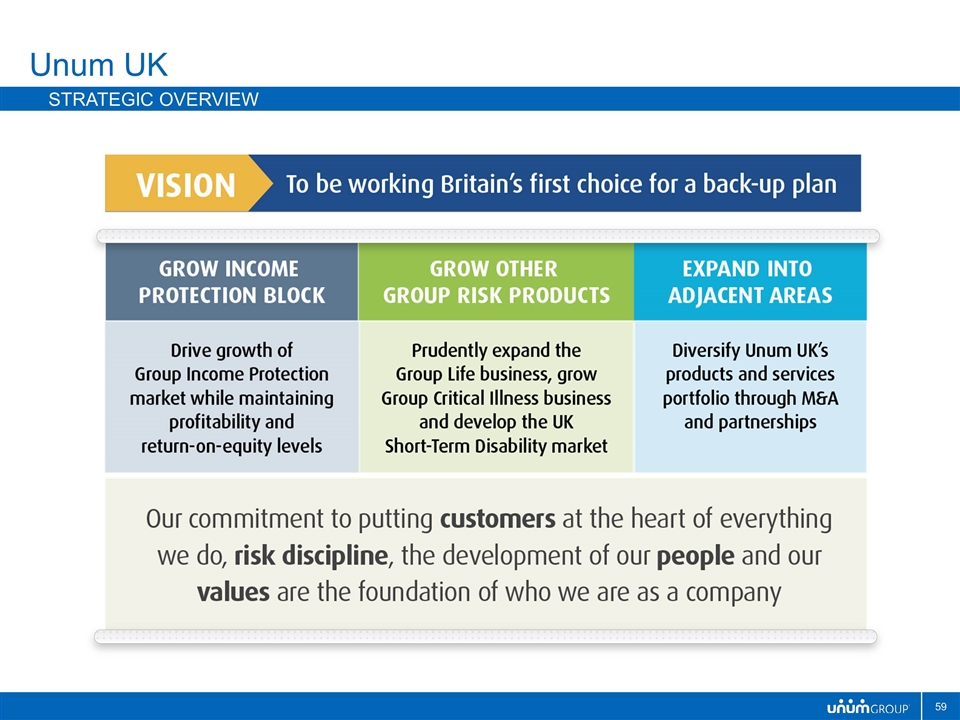
Unum UK Strategic Overview
The UK’s decision to leave the EU creates significant uncertainty in our operating environment Lower economic growth and the lower interest rate outlook will have a negative impact on our growth expectations in the short to medium term However, we have moved quickly to adjust our plans to deal with these challenges by increasing our pricing targets and reducing our cost base Our investment portfolio is defensively positioned, our operational performance is good, and we continue to invest in technology and proposition enhancements The workplace remains an attractive place to distribute insurance products in the UK and the non-interest rate sensitive product markets are showing significant growth We are well positioned to capitalise on future growth opportunities as Brexit negotiations are resolved and the operating environment improves Unum UK Well placed to deal with uncertainty
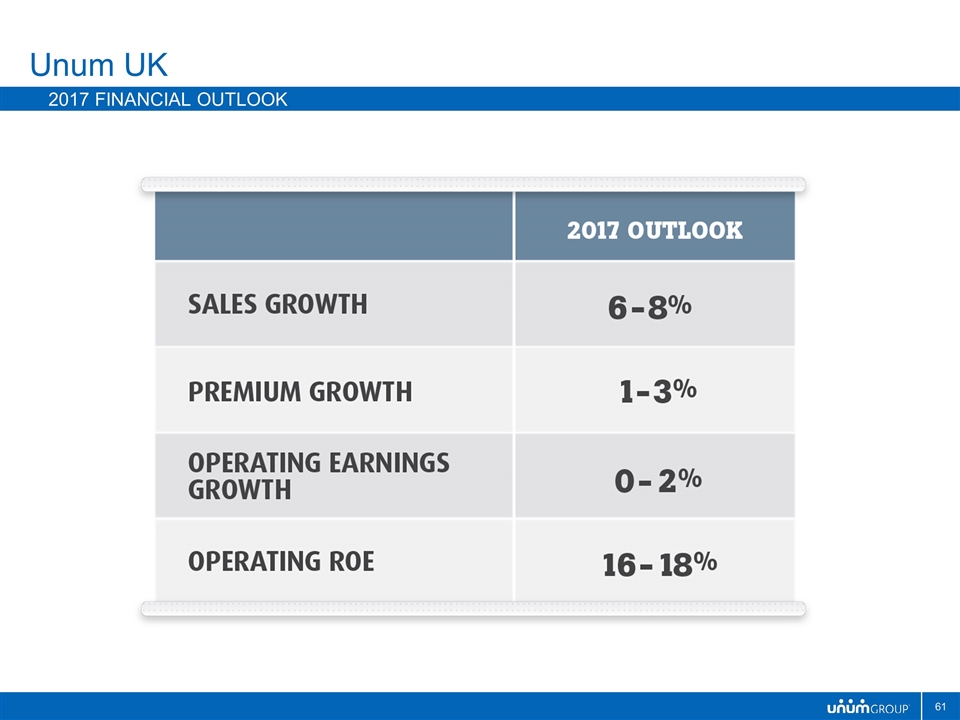
Unum UK 2017 Financial Outlook
Colonial Life
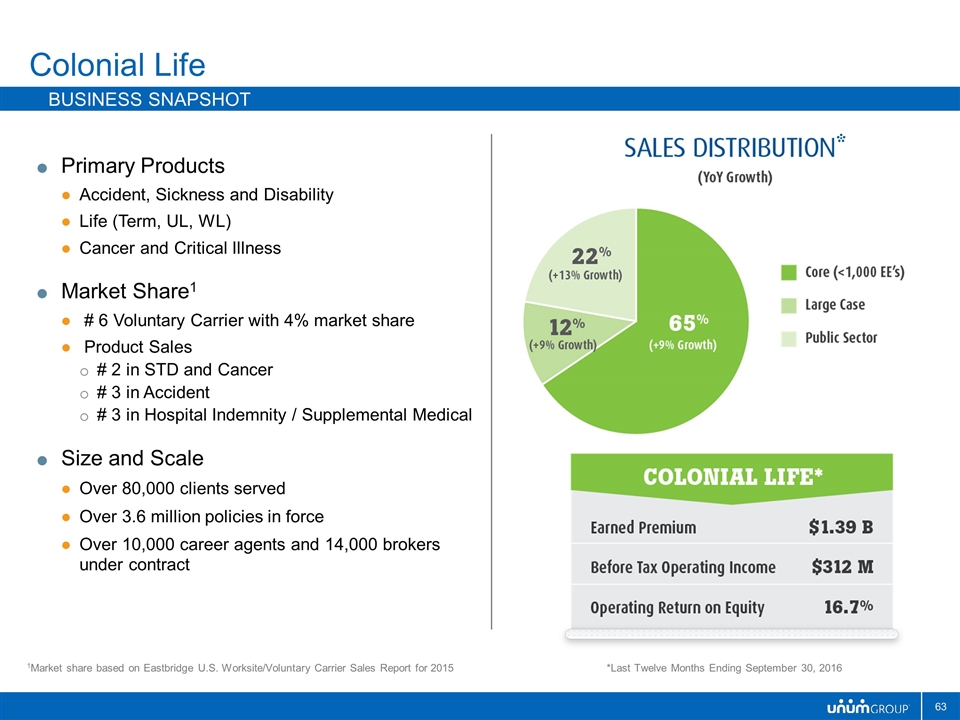
Primary Products Accident, Sickness and Disability Life (Term, UL, WL) Cancer and Critical Illness Market Share1 # 6 Voluntary Carrier with 4% market share Product Sales # 2 in STD and Cancer # 3 in Accident # 3 in Hospital Indemnity / Supplemental Medical Size and Scale Over 80,000 clients served Over 3.6 million policies in force Over 10,000 career agents and 14,000 brokers under contract Colonial Life Business snapshot *Last Twelve Months Ending September 30, 2016 1Market share based on Eastbridge U.S. Worksite/Voluntary Carrier Sales Report for 2015
Colonial Life Market Potential and opportunities The total market opportunity within the US benefits market is significant and growing Increase employer penetration, especially below 100 lives Increase employee penetration in offered products Cross-sell additional products to employees Part-time workers and contractors
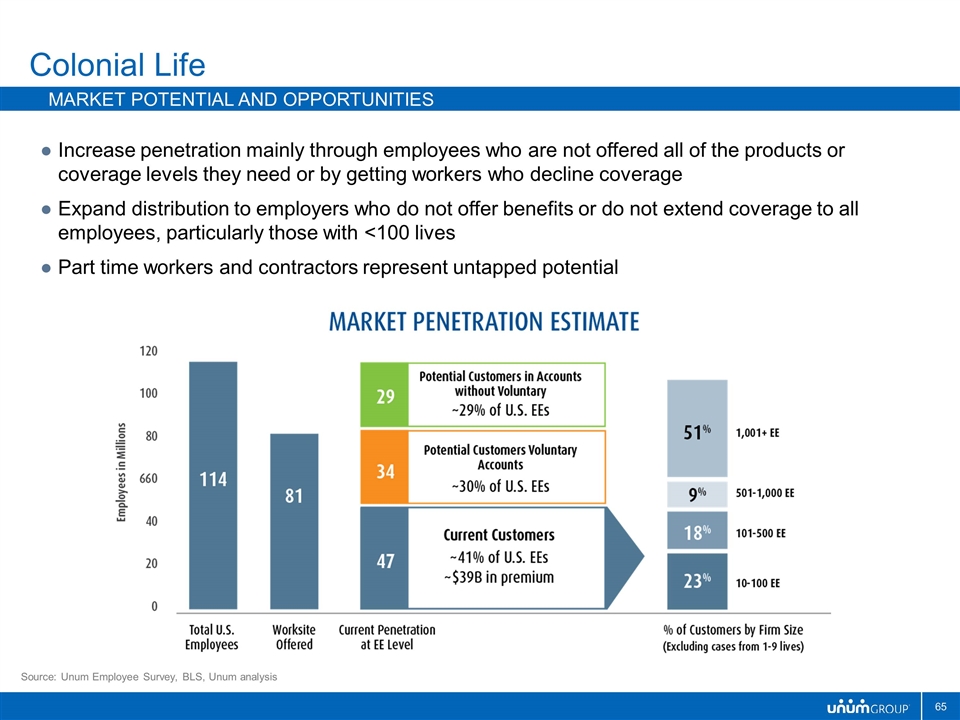
Colonial Life Market Potential and opportunities Increase penetration mainly through employees who are not offered all of the products or coverage levels they need or by getting workers who decline coverage Expand distribution to employers who do not offer benefits or do not extend coverage to all employees, particularly those with <100 lives Part time workers and contractors represent untapped potential Source: Unum Employee Survey, BLS, Unum analysis
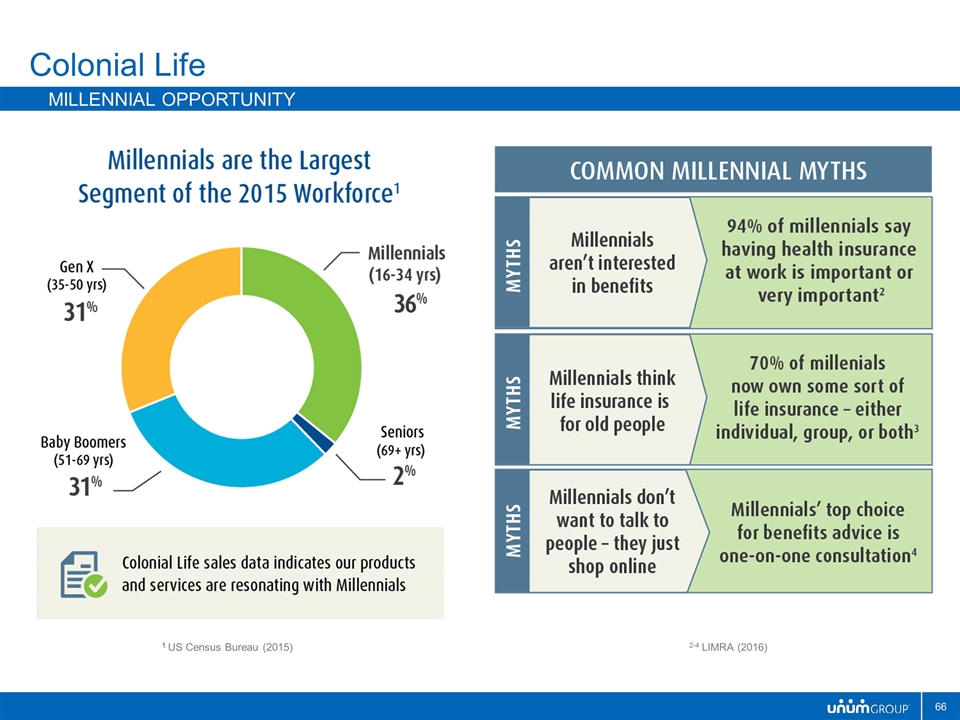
Colonial Life Millennial Opportunity 1 US Census Bureau (2015) 2-4 LIMRA (2016)
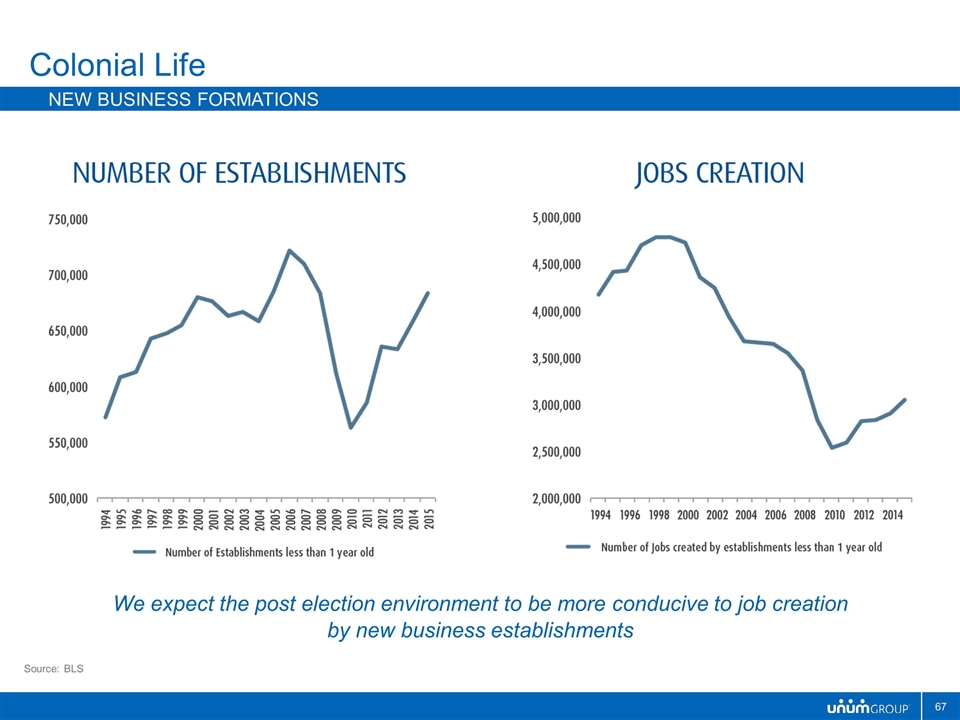
Colonial Life New business formations Source: BLS We expect the post election environment to be more conducive to job creation by new business establishments
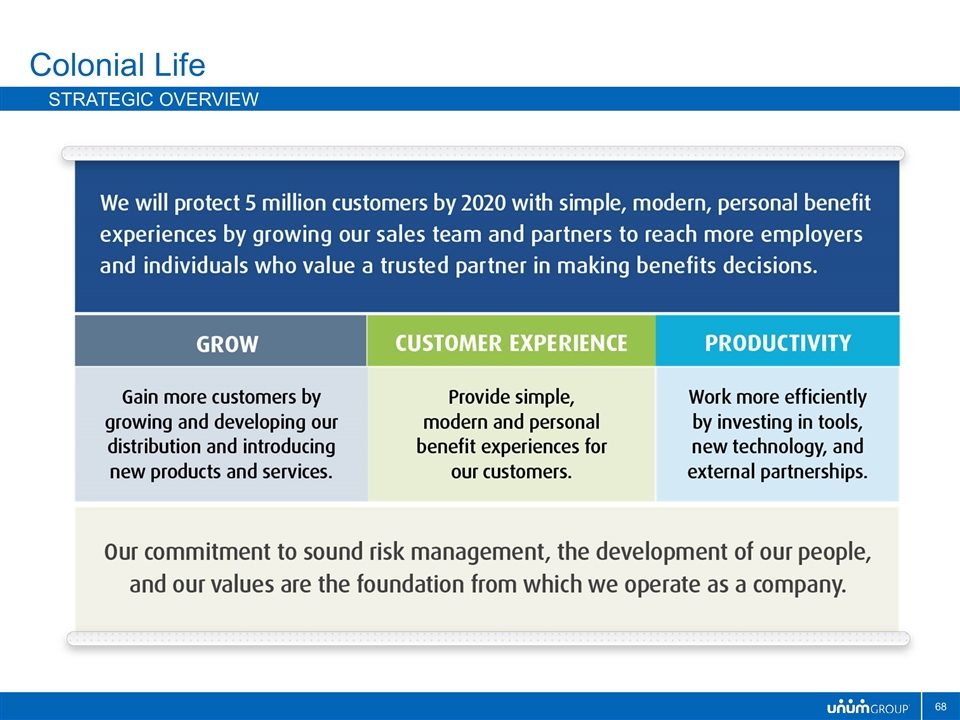
Colonial Life Strategic Overview
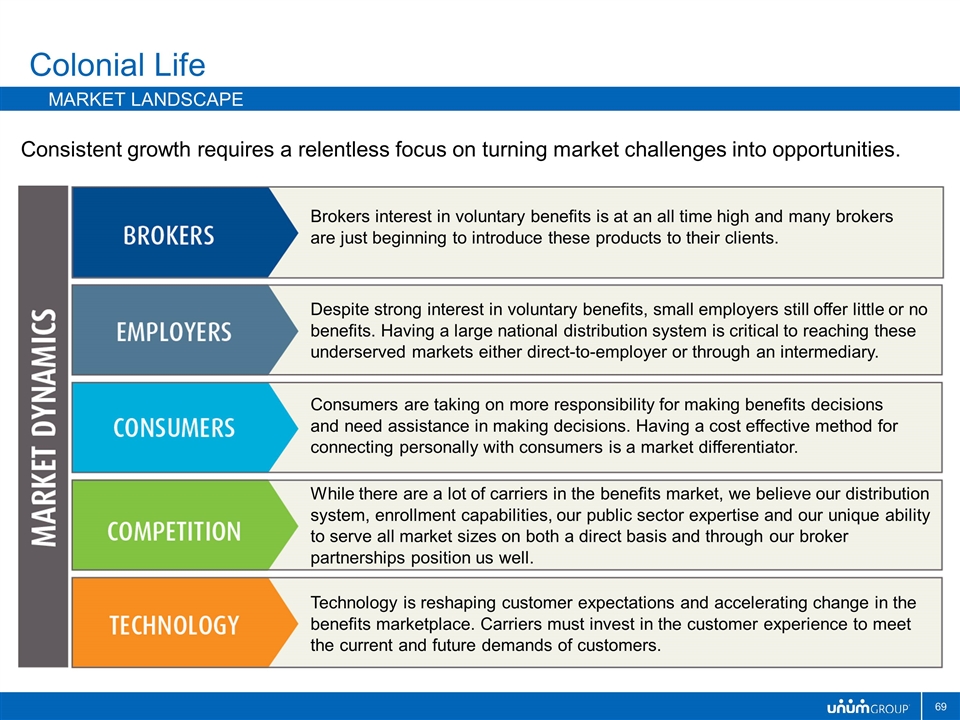
Colonial Life Market landscape Consistent growth requires a relentless focus on turning market challenges into opportunities. Brokers interest in voluntary benefits is at an all time high and many brokers are just beginning to introduce these products to their clients. Despite strong interest in voluntary benefits, small employers still offer little or no benefits. Having a large national distribution system is critical to reaching these underserved markets either direct-to-employer or through an intermediary. Consumers are taking on more responsibility for making benefits decisions and need assistance in making decisions. Having a cost effective method for connecting personally with consumers is a market differentiator. While there are a lot of carriers in the benefits market, we believe our distribution system, enrollment capabilities, our public sector expertise and our unique ability to serve all market sizes on both a direct basis and through our broker partnerships position us well. Technology is reshaping customer expectations and accelerating change in the benefits marketplace. Carriers must invest in the customer experience to meet the current and future demands of customers.
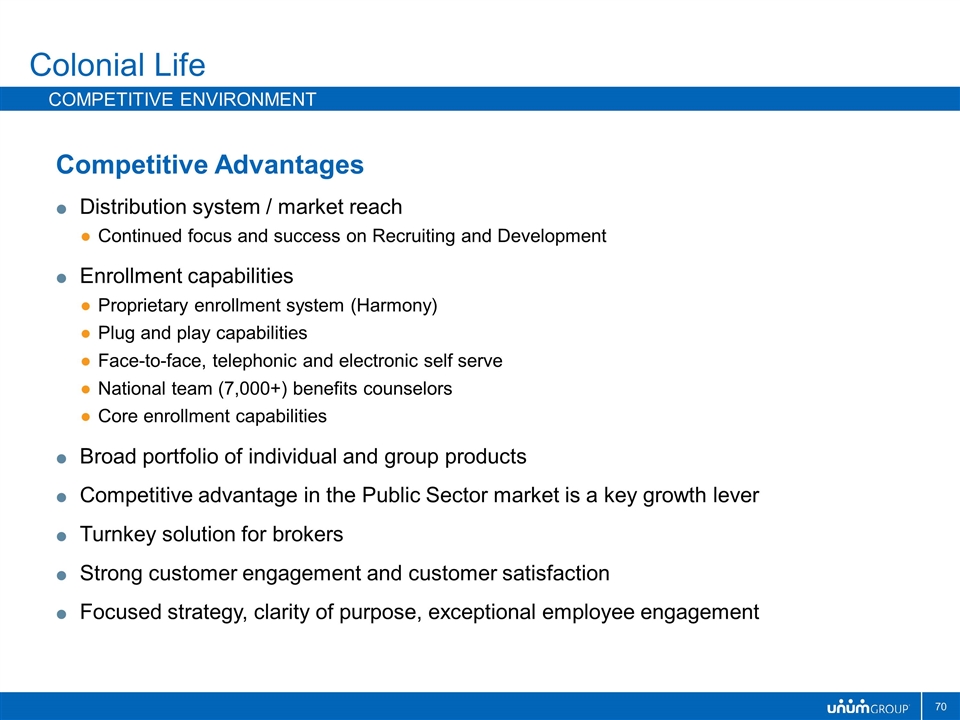
Colonial Life Competitive environment Competitive Advantages Distribution system / market reach Continued focus and success on Recruiting and Development Enrollment capabilities Proprietary enrollment system (Harmony) Plug and play capabilities Face-to-face, telephonic and electronic self serve National team (7,000+) benefits counselors Core enrollment capabilities Broad portfolio of individual and group products Competitive advantage in the Public Sector market is a key growth lever Turnkey solution for brokers Strong customer engagement and customer satisfaction Focused strategy, clarity of purpose, exceptional employee engagement
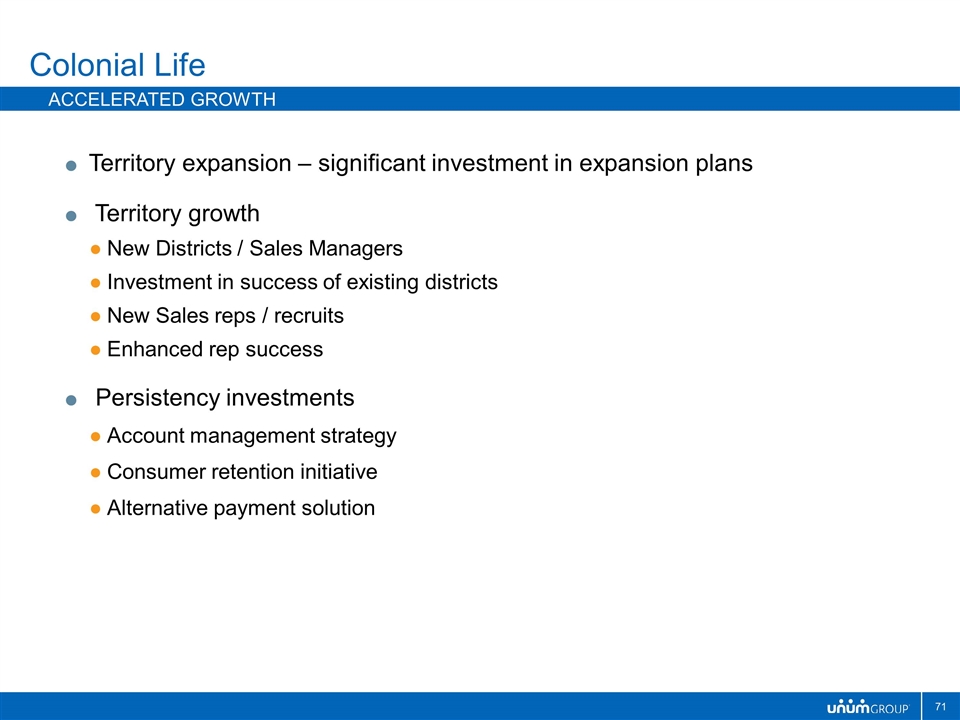
Colonial Life Accelerated Growth Territory expansion – significant investment in expansion plans Territory growth New Districts / Sales Managers Investment in success of existing districts New Sales reps / recruits Enhanced rep success Persistency investments Account management strategy Consumer retention initiative Alternative payment solution
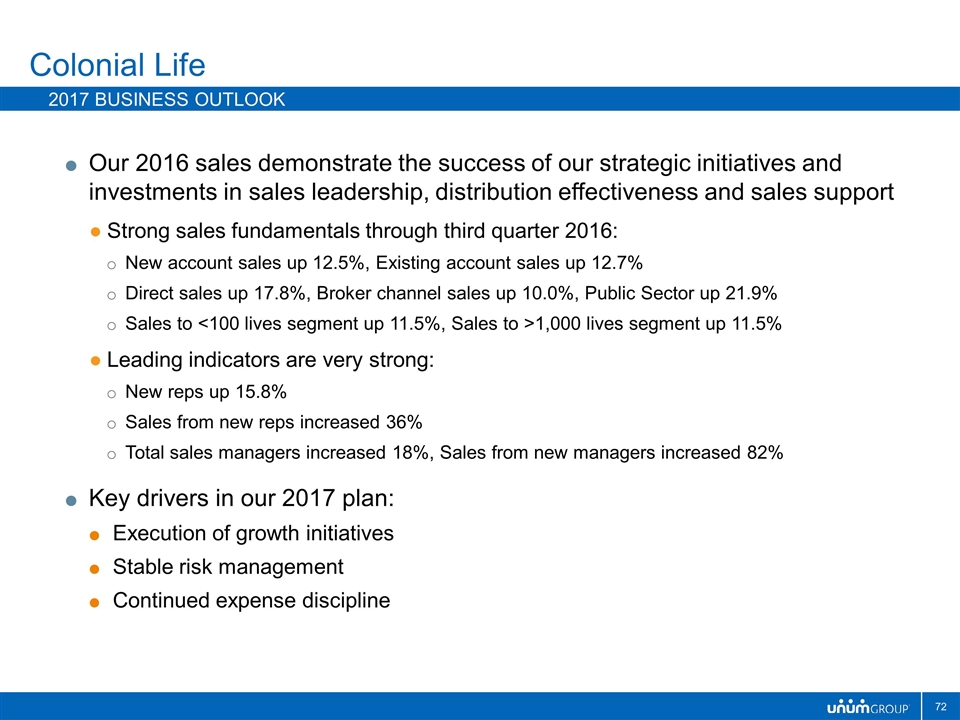
Colonial Life 2017 business outlook Our 2016 sales demonstrate the success of our strategic initiatives and investments in sales leadership, distribution effectiveness and sales support Strong sales fundamentals through third quarter 2016: New account sales up 12.5%, Existing account sales up 12.7% Direct sales up 17.8%, Broker channel sales up 10.0%, Public Sector up 21.9% Sales to <100 lives segment up 11.5%, Sales to >1,000 lives segment up 11.5% Leading indicators are very strong: New reps up 15.8% Sales from new reps increased 36% Total sales managers increased 18%, Sales from new managers increased 82% Key drivers in our 2017 plan: Execution of growth initiatives Stable risk management Continued expense discipline
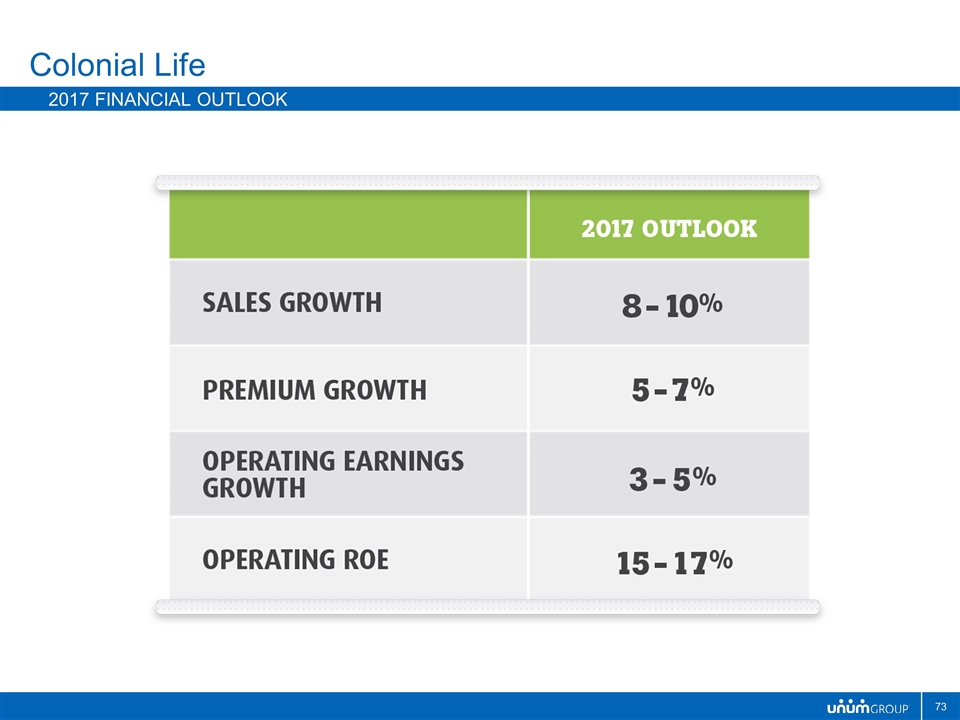
Colonial Life 2017 financial outlook
Closed Block
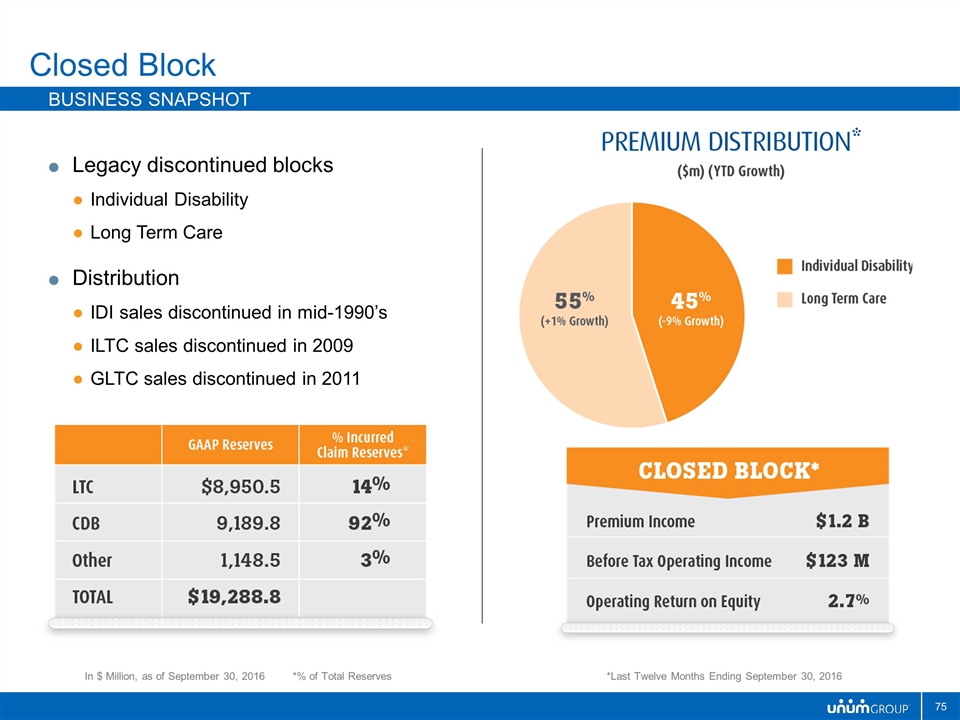
Closed Block Business snapshot Legacy discontinued blocks Individual Disability Long Term Care Distribution IDI sales discontinued in mid-1990’s ILTC sales discontinued in 2009 GLTC sales discontinued in 2011 *Last Twelve Months Ending September 30, 2016 In $ Million, as of September 30, 2016 *% of Total Reserves
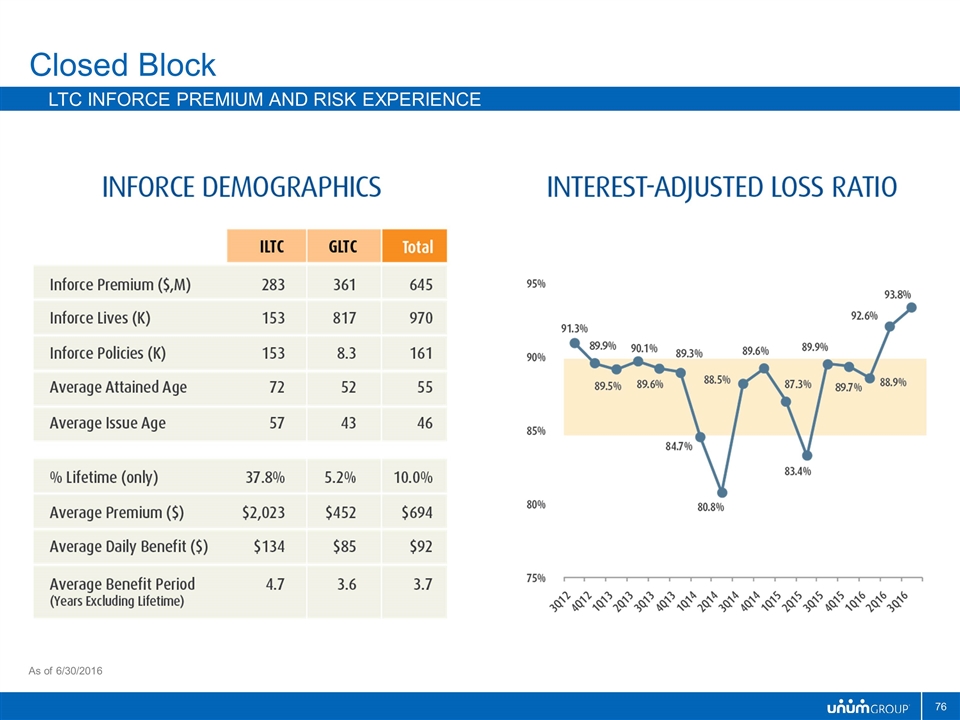
Closed Block LTC Inforce Premium and Risk Experience As of 6/30/2016
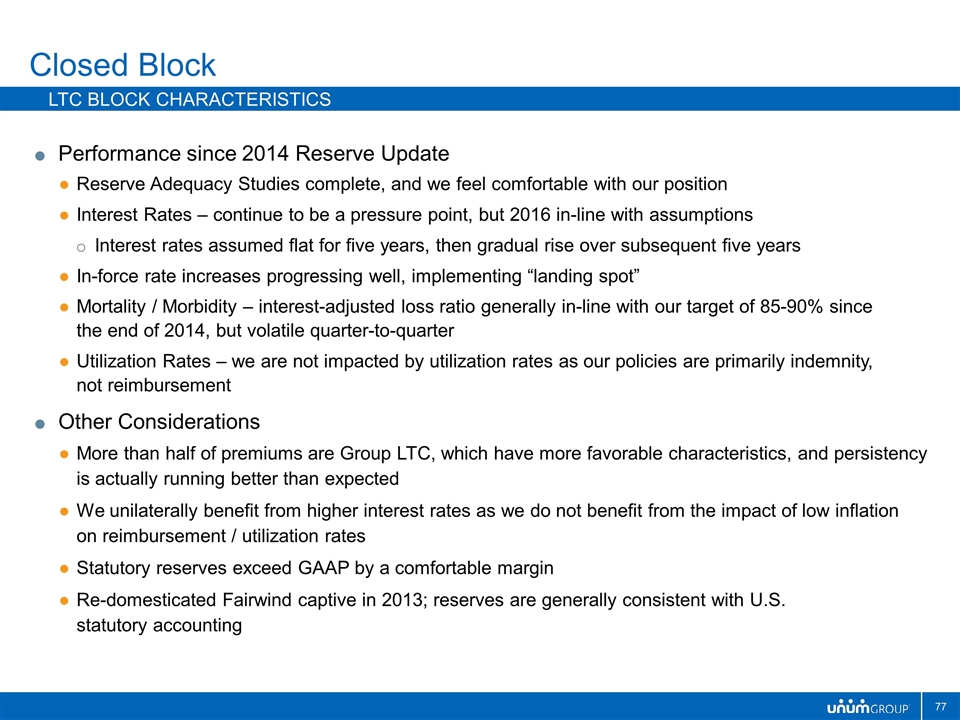
Closed Block LTC Block Characteristics Performance since 2014 Reserve Update Reserve Adequacy Studies complete, and we feel comfortable with our position Interest Rates – continue to be a pressure point, but 2016 in-line with assumptions Interest rates assumed flat for five years, then gradual rise over subsequent five years In-force rate increases progressing well, implementing “landing spot” Mortality / Morbidity – interest-adjusted loss ratio generally in-line with our target of 85-90% since the end of 2014, but volatile quarter-to-quarter Utilization Rates – we are not impacted by utilization rates as our policies are primarily indemnity, not reimbursement Other Considerations More than half of premiums are Group LTC, which have more favorable characteristics, and persistency is actually running better than expected We unilaterally benefit from higher interest rates as we do not benefit from the impact of low inflation on reimbursement / utilization rates Statutory reserves exceed GAAP by a comfortable margin Re-domesticated Fairwind captive in 2013; reserves are generally consistent with U.S. statutory accounting
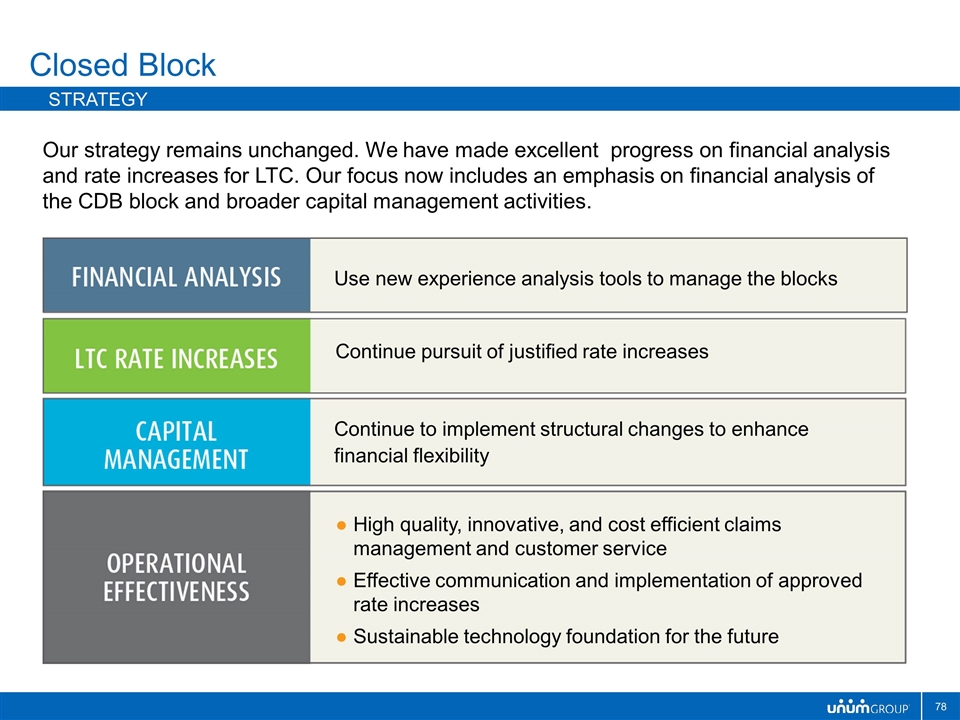
Our strategy remains unchanged. We have made excellent progress on financial analysis and rate increases for LTC. Our focus now includes an emphasis on financial analysis of the CDB block and broader capital management activities. Closed Block strategy Continue to implement structural changes to enhance financial flexibility Continue pursuit of justified rate increases Use new experience analysis tools to manage the blocks High quality, innovative, and cost efficient claims management and customer service Effective communication and implementation of approved rate increases Sustainable technology foundation for the future
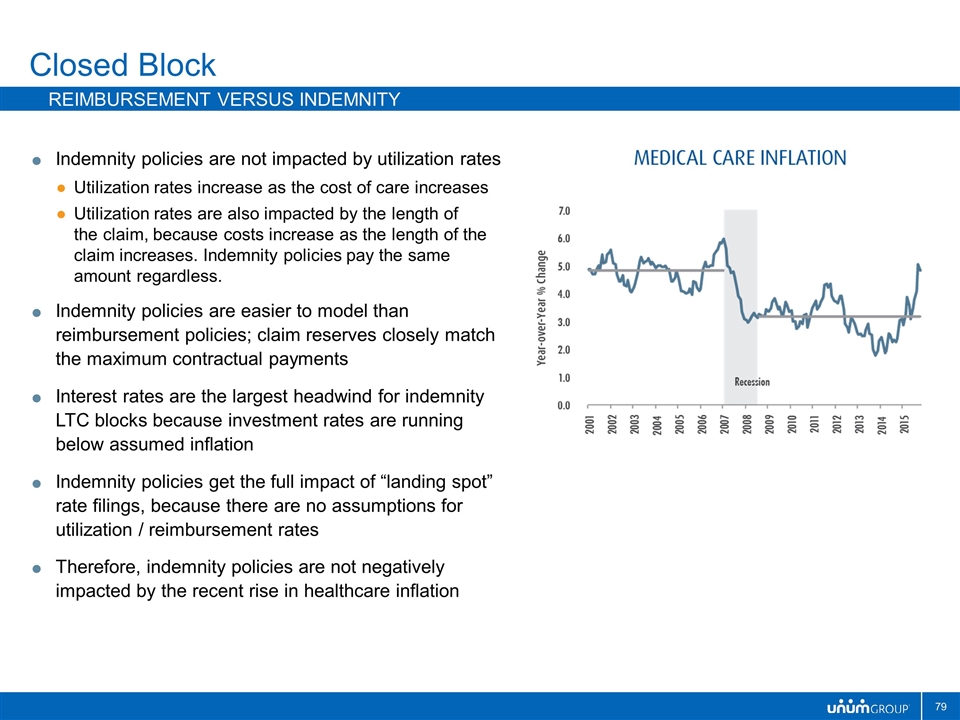
Indemnity policies are not impacted by utilization rates Utilization rates increase as the cost of care increases Utilization rates are also impacted by the length of the claim, because costs increase as the length of the claim increases. Indemnity policies pay the same amount regardless. Indemnity policies are easier to model than reimbursement policies; claim reserves closely match the maximum contractual payments Interest rates are the largest headwind for indemnity LTC blocks because investment rates are running below assumed inflation Indemnity policies get the full impact of “landing spot” rate filings, because there are no assumptions for utilization / reimbursement rates Therefore, indemnity policies are not negatively impacted by the recent rise in healthcare inflation Closed Block Reimbursement versus indemnity
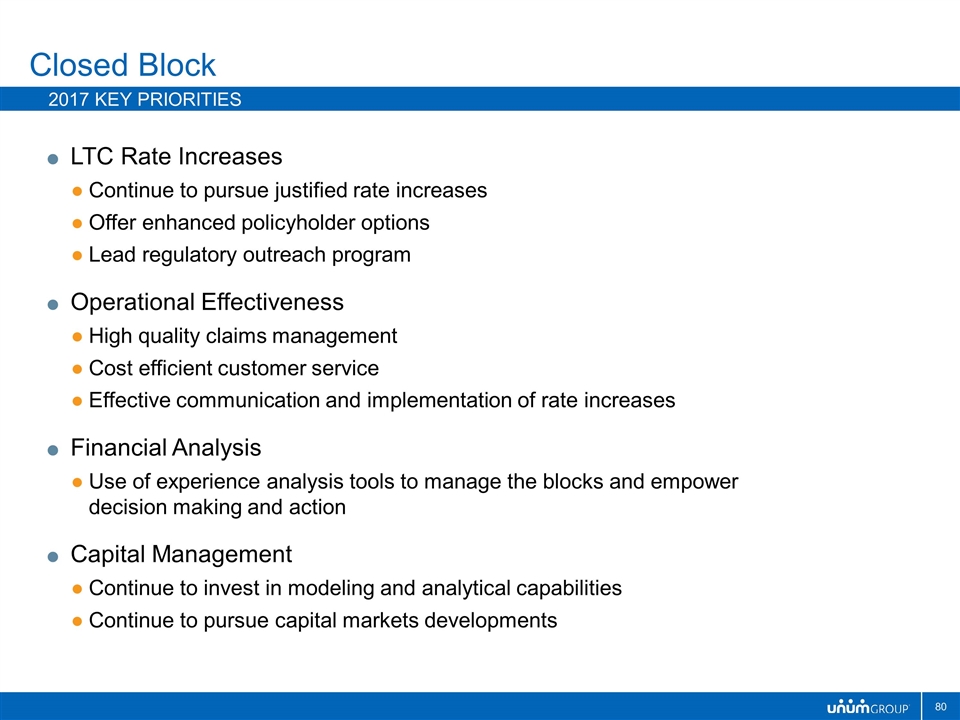
LTC Rate Increases Continue to pursue justified rate increases Offer enhanced policyholder options Lead regulatory outreach program Operational Effectiveness High quality claims management Cost efficient customer service Effective communication and implementation of rate increases Financial Analysis Use of experience analysis tools to manage the blocks and empower decision making and action Capital Management Continue to invest in modeling and analytical capabilities Continue to pursue capital markets developments Closed Block 2017 key priorities
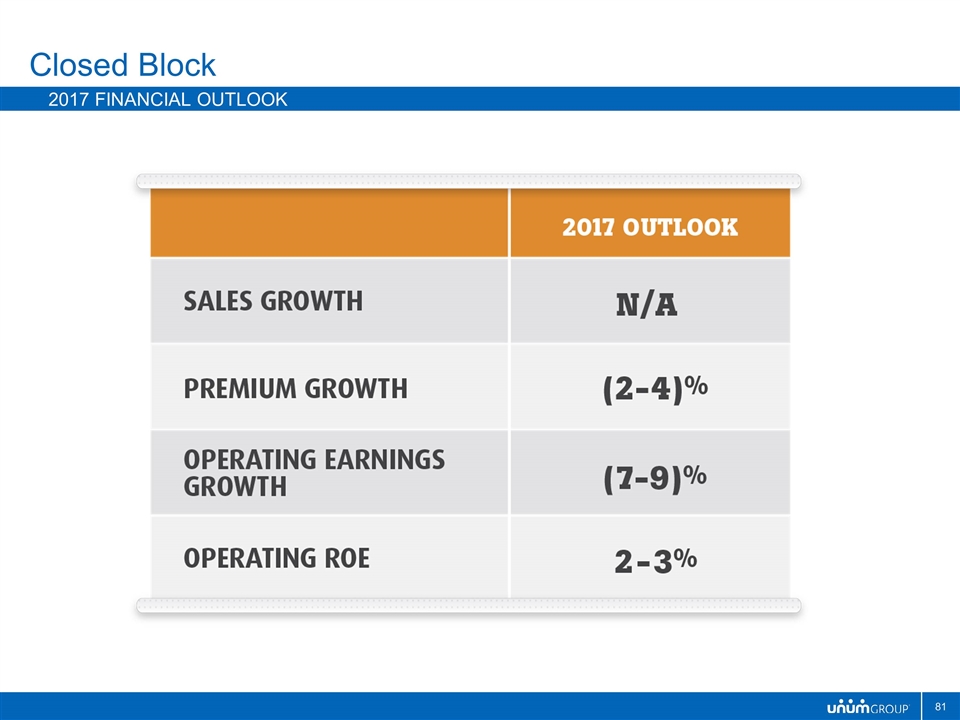
Closed Block 2017 Financial Outlook

2017 Outlook
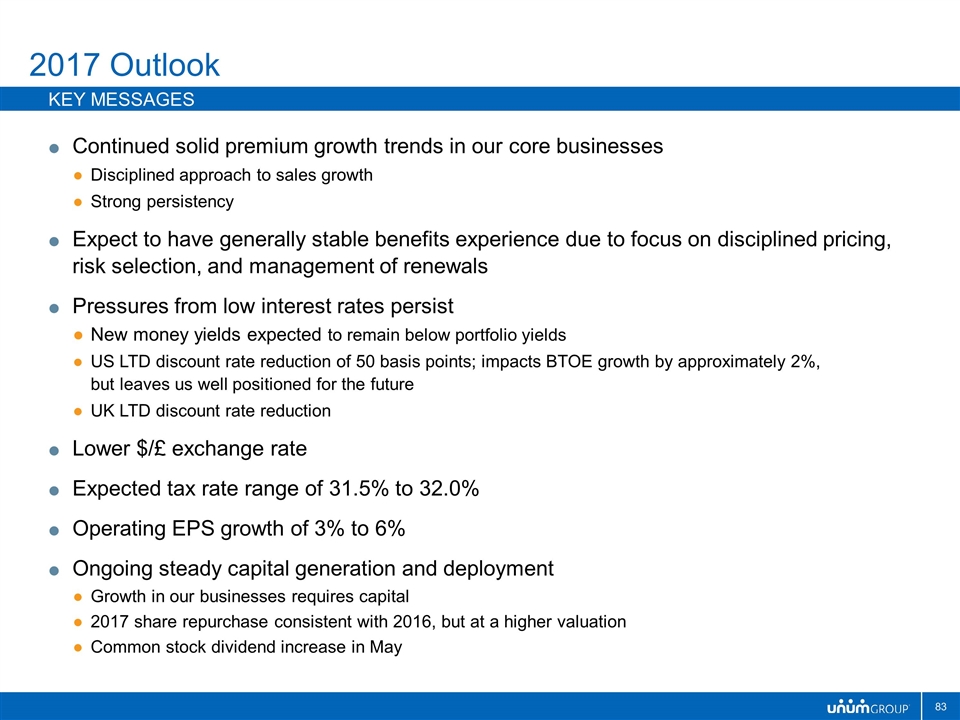
2017 Outlook Key Messages Continued solid premium growth trends in our core businesses Disciplined approach to sales growth Strong persistency Expect to have generally stable benefits experience due to focus on disciplined pricing, risk selection, and management of renewals Pressures from low interest rates persist New money yields expected to remain below portfolio yields US LTD discount rate reduction of 50 basis points; impacts BTOE growth by approximately 2%, but leaves us well positioned for the future UK LTD discount rate reduction Lower $/£ exchange rate Expected tax rate range of 31.5% to 32.0% Operating EPS growth of 3% to 6% Ongoing steady capital generation and deployment Growth in our businesses requires capital 2017 share repurchase consistent with 2016, but at a higher valuation Common stock dividend increase in May
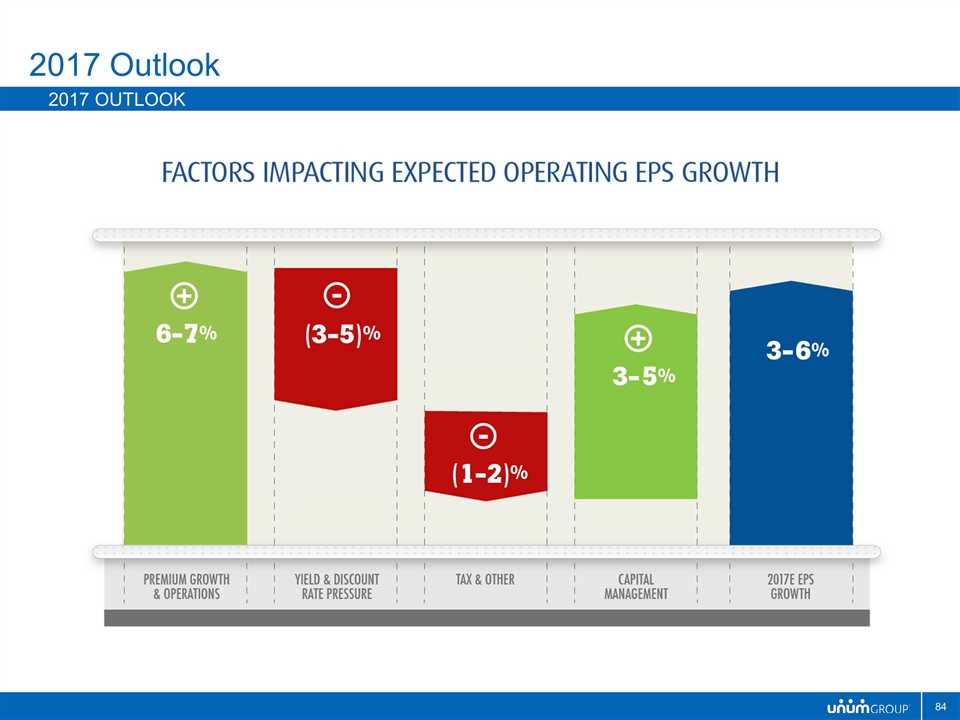
2017 Outlook 2017 Outlook
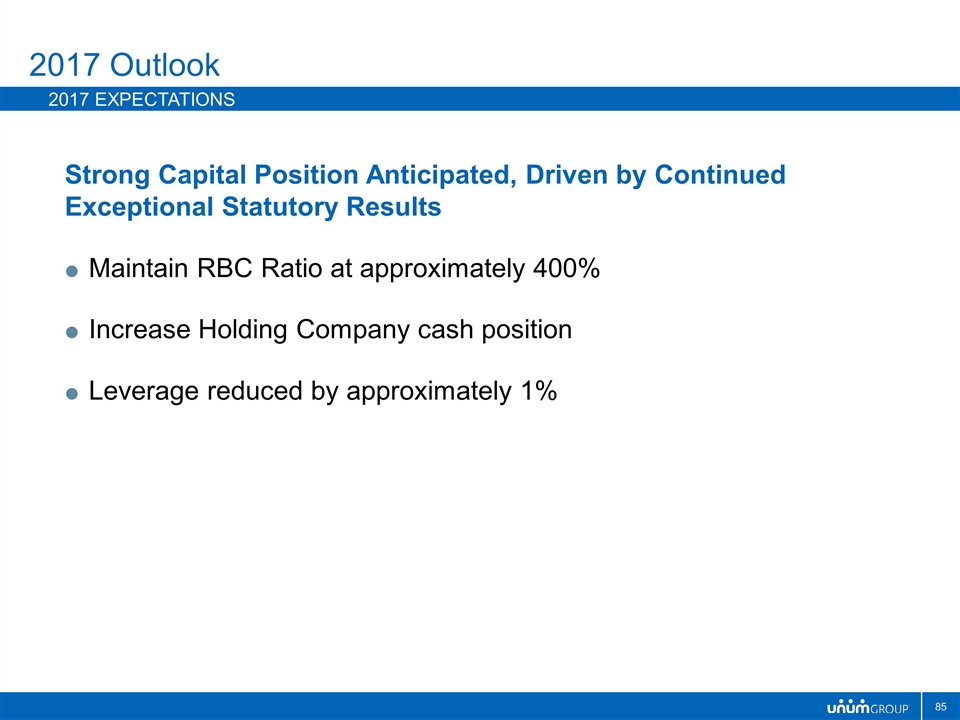
Strong Capital Position Anticipated, Driven by Continued Exceptional Statutory Results Maintain RBC Ratio at approximately 400% Increase Holding Company cash position Leverage reduced by approximately 1% 2017 Outlook 2017 Expectations
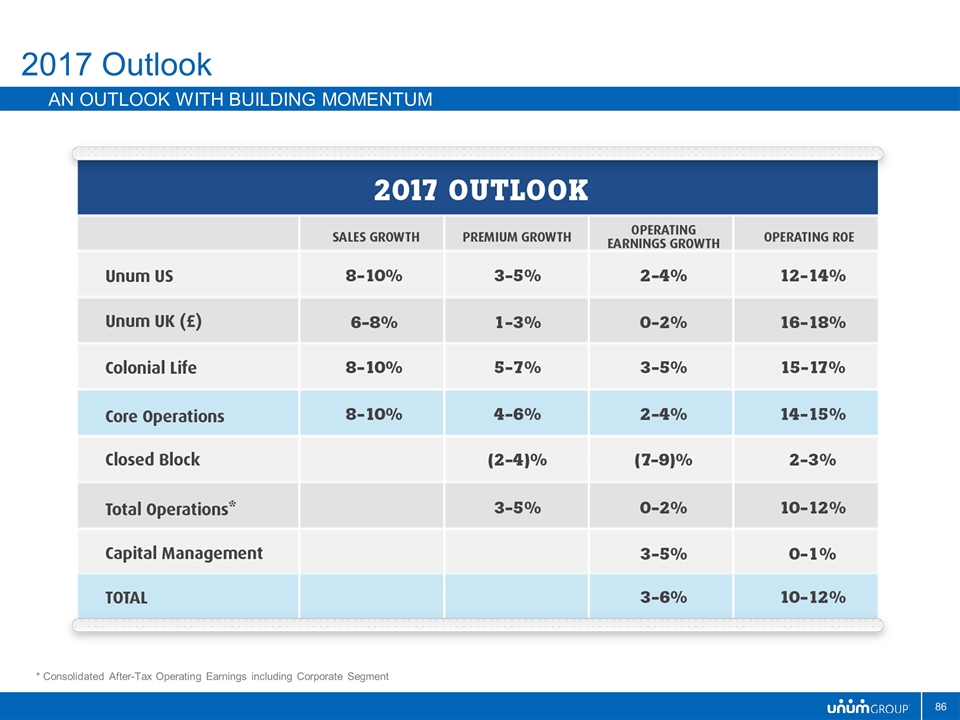
2017 Outlook An outlook with building momentum * Consolidated After-Tax Operating Earnings including Corporate Segment
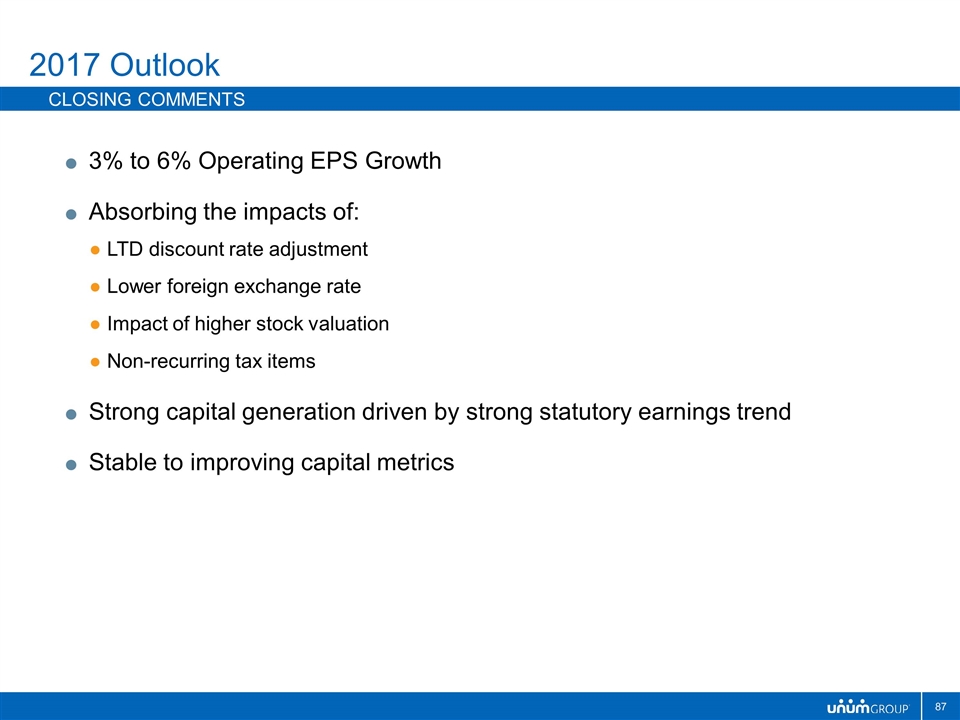
3% to 6% Operating EPS Growth Absorbing the impacts of: LTD discount rate adjustment Lower foreign exchange rate Impact of higher stock valuation Non-recurring tax items Strong capital generation driven by strong statutory earnings trend Stable to improving capital metrics 2017 Outlook Closing Comments
Closing Comments
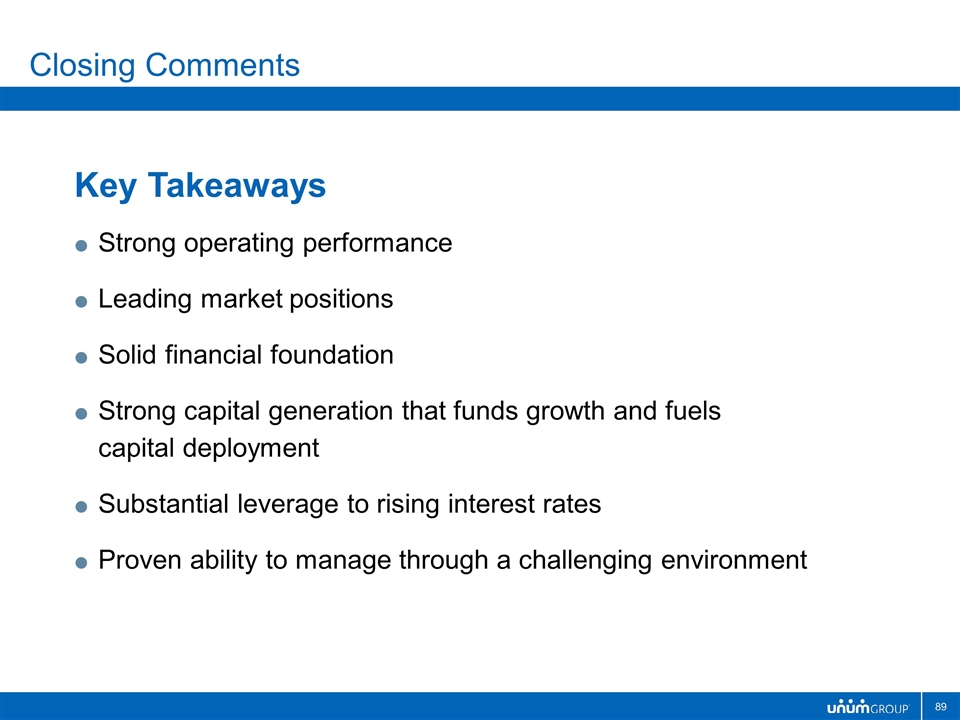
Closing Comments Key Takeaways Strong operating performance Leading market positions Solid financial foundation Strong capital generation that funds growth and fuels capital deployment Substantial leverage to rising interest rates Proven ability to manage through a challenging environment

Questions and Answers
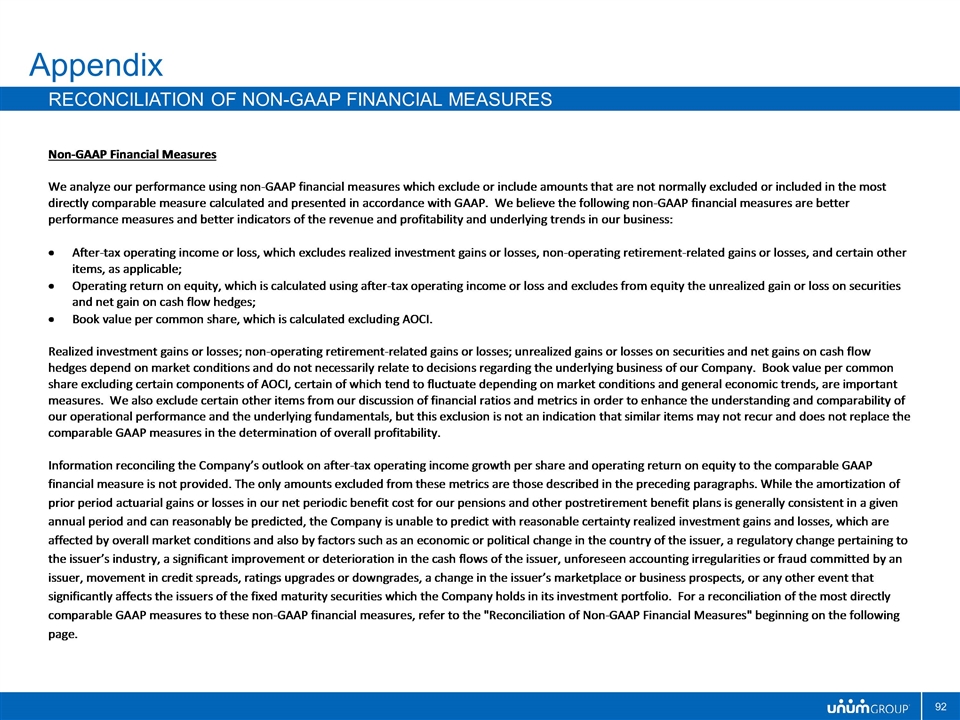
Appendix Reconciliation of Non-GAAP Financial Measures
Appendix Reconciliation of Non-GAAP Financial Measures
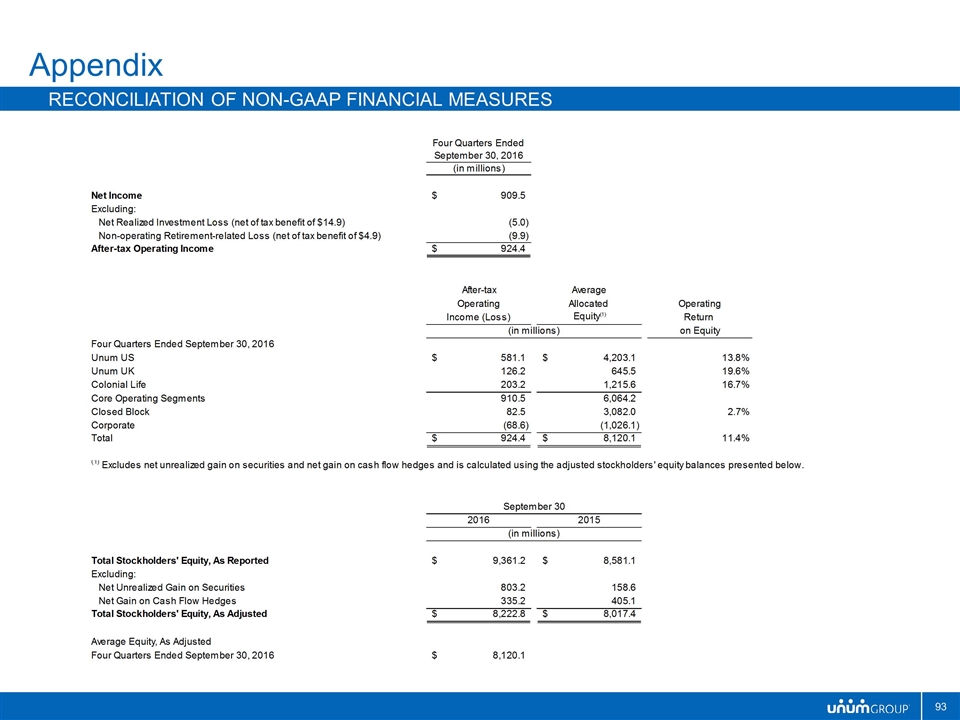
Appendix Reconciliation of Non-GAAP Financial Measures
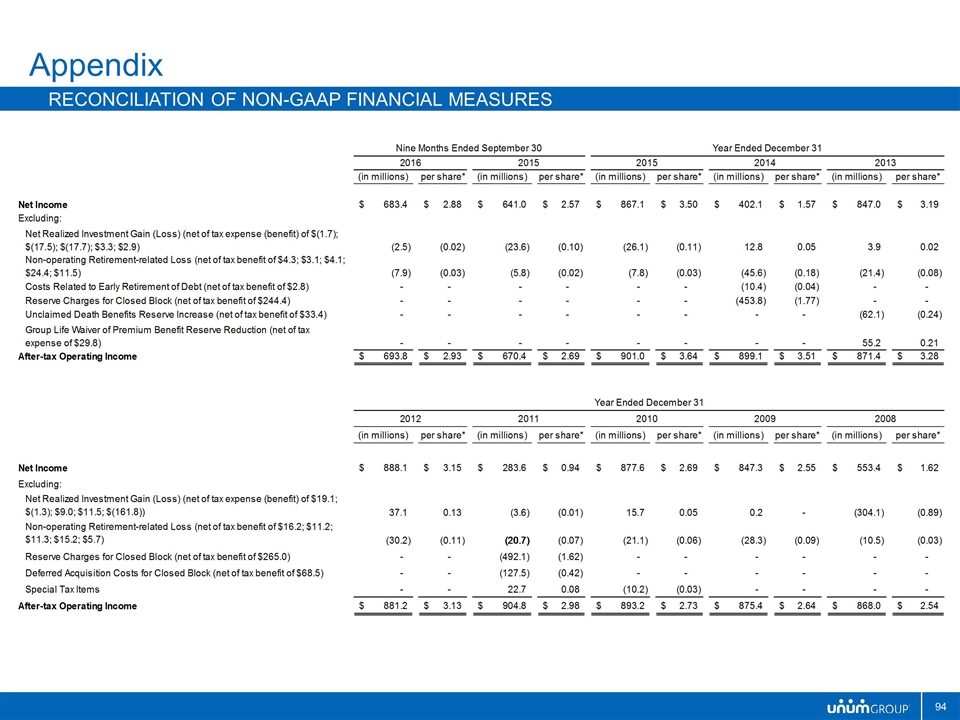
Appendix Reconciliation of Non-GAAP Financial Measures
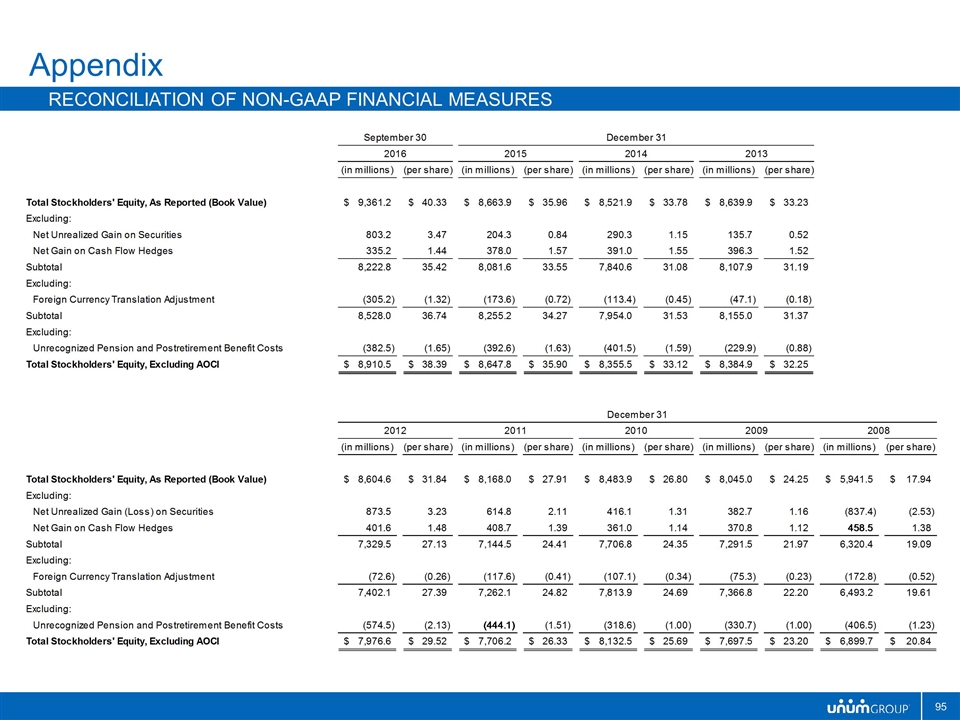
Appendix Reconciliation of Non-GAAP Financial Measures
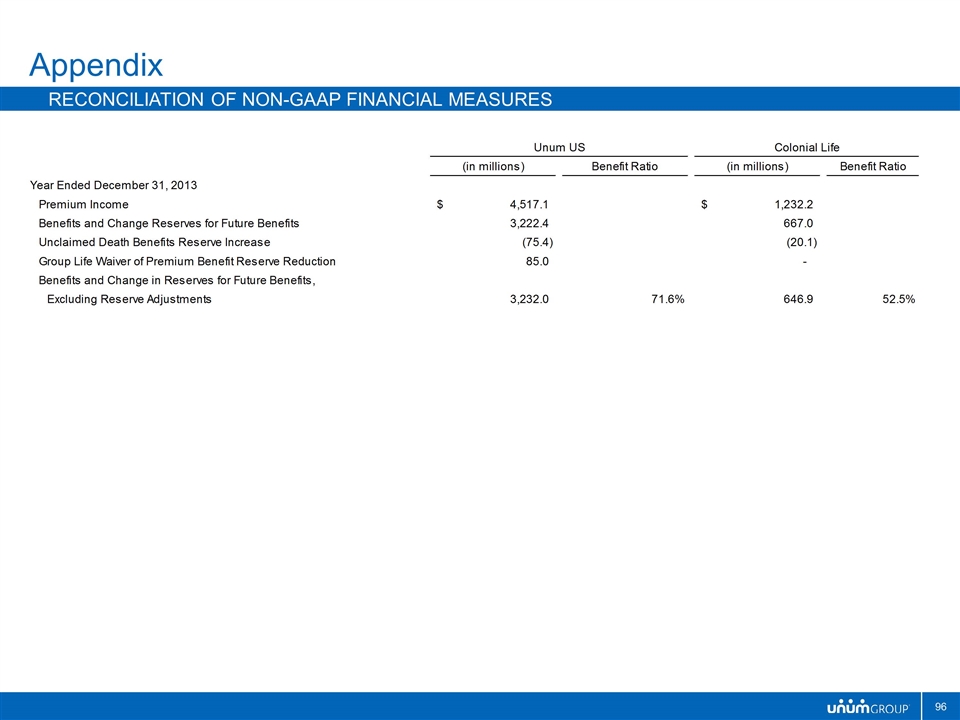
Appendix Reconciliation of Non-GAAP Financial Measures


