
THIRD QUARTER 2021 November 10, 2021 Exhibit 99.2

NON-GAAP MEASURES | 2 Management believes that the non-GAAP (Generally Accepted Accounting Principles) information excluding the 2021 and 2020 gains and losses on the investment in Persol Holdings, the 2020 loss on sale of assets, the 2020 customer dispute and the 2021 and 2020 restructuring accrual adjustments, are useful to understand the Company's fiscal 2021 financial performance and increases comparability. Specifically, Management believes that removing the impact of these items allows for a meaningful comparison of current period operating performance with the operating results of prior periods. Management also believes that such measures are used by those analyzing performance of companies in the staffing industry to compare current performance to prior periods and to assess future performance. Management uses Adjusted EBITDA (adjusted earnings before interest, taxes, depreciation and amortization) and Adjusted EBITDA Margin (percent of total GAAP revenue) which Management believes is useful to compare operating performance compared to prior periods and uses it in conjunction with GAAP measures to assess performance. Our calculation of Adjusted EBITDA may not be consistent with similarly titled measures of other companies and should be used in conjunction with GAAP measurements. These non-GAAP measures may have limitations as analytical tools because they exclude items which can have a material impact on cash flow and earnings per share. As a result, Management considers these measures, along with reported results, when it reviews and evaluates the Company's financial performance. Management believes that these measures provide greater transparency to investors and provide insight into how Management is evaluating the Company's financial performance. Non-GAAP measures should not be considered a substitute for, or superior to, measures of financial performance prepared in accordance with GAAP.
SAFE HARBOR STATEMENT | 3 This release contains statements that are forward looking in nature and, accordingly, are subject to risks and uncertainties. The principal important risk factors that could cause our actual performance and future events and actions to differ materially from such forward-looking statements include, but are not limited to, changing market and economic conditions, the recent novel coronavirus (COVID-19) outbreak, competitive market pressures including pricing and technology introductions and disruptions, disruption in the labor market and weakened demand for human capital resulting from technological advances, competition law risks, the impact of changes in laws and regulations (including federal, state and international tax laws), unexpected changes in claim trends on workers’ compensation, unemployment, disability and medical benefit plans, or the risk of additional tax liabilities in excess of our estimates, our ability to achieve our business strategy, our ability to successfully develop new service offerings, material changes in demand from or loss of large corporate customers as well as changes in their buying practices, risks particular to doing business with government or government contractors, the risk of damage to our brand, our exposure to risks associated with services outside traditional staffing, including business process outsourcing, services of licensed professionals and services connecting talent to independent work, our increasing dependency on third parties for the execution of critical functions, our ability to effectively implement and manage our information technology strategy, the risks associated with past and future acquisitions, including risk of related impairment of goodwill and intangible assets, exposure to risks associated with investments in equity affiliates including PersolKelly Pte. Ltd., risks associated with conducting business in foreign countries, including foreign currency fluctuations, the exposure to potential market and currency exchange risks relating to our investment in Persol Holdings, risks associated with violations of anticorruption, trade protection and other laws and regulations, availability of qualified full-time employees, availability of temporary workers with appropriate skills required by customers, liabilities for employment-related claims and losses, including class action lawsuits and collective actions, our ability to sustain critical business applications through our key data centers, risks arising from failure to preserve the privacy of information entrusted to us or to meet our obligations under global privacy laws, the risk of cyberattacks or other breaches of network or information technology security, our ability to realize value from our tax credit and net operating loss carryforwards, our ability to maintain specified financial covenants in our bank facilities to continue to access credit markets, and other risks, uncertainties and factors discussed in this report and in our other filings with the Securities and Exchange Commission. Actual results may differ materially from any forward-looking statements contained herein, and we undertake no duty to update any forward-looking statement to conform the statement to actual results or changes in the Company’s expectations.
THIRD QUARTER 2021 TAKEAWAYS | 4 Economic recovery continues but moderates on impact of Delta variant • Q3 revenue up 15.1% on a reported basis, up 14.5% in constant currency(1) ‒ Includes 320 bps impact from the acquisition of Softworld, Inc. (“Softworld”) on April 5, 2021 • For the second consecutive quarter, all operating segments have returned to year-over-year revenue growth and total Company revenue recovery ratio(2) is up 200 bps to 91% Near-term steps to capitalize on improving demand • Continuing robust return to workplace protocols and addressing masking and vaccine mandates by regulators and customers • Addressing talent supply in Education and talent supply and fulfillment challenges in Professional & Industrial to meet customer demand and accelerate revenue growth • Executing cost management actions expected to result in structural cost savings beginning in Q1 2022 while continuing with organic investment in our selected specialties Continued focus on our future • Using Helix UX technology to enable customers to better understand and manage their global workforce and deepen their relationship with Kelly • Addressing the structural skills mismatch with Equity@Work to tackle systemic barriers that prevent people from connecting with work, including Kelly 33, a program to connect talented job seekers who have non- violent, non-relevant criminal background with customers in need of their skills (1)Constant Currency represents year-over-year changes resulting from translating 2021 financial data into USD using 2020 exchange rates. (2)Recovery ratio is defined as 2021 organic revenue on a 2019 constant currency basis divided by 2019 revenue.

THIRD QUARTER 2021 FINANCIAL SUMMARY | 5 (1)See reconciliation of Non-GAAP Measures included in Form 8-K dated November 10, 2021. (2)Constant Currency ("CC") represents year-over-year changes resulting from translating 2021 financial data into USD using 2020 exchange rates. Actual Results $1.2B 15.1% 15.1% 14.5% CC(2) 14.5% CC(2) 19.2% 80 bps 80 bps $9.0M NM 25.9% NM CC(2) 22.2% CC(2) Adjusted EBITDA(1) $17.3M 29.9% Adjusted EBITDA Margin(1) 1.4% 10 bps Change Increase/(Decrease) As Adjusted(1) Earnings from Operations Revenue Gross Profit % As Reported
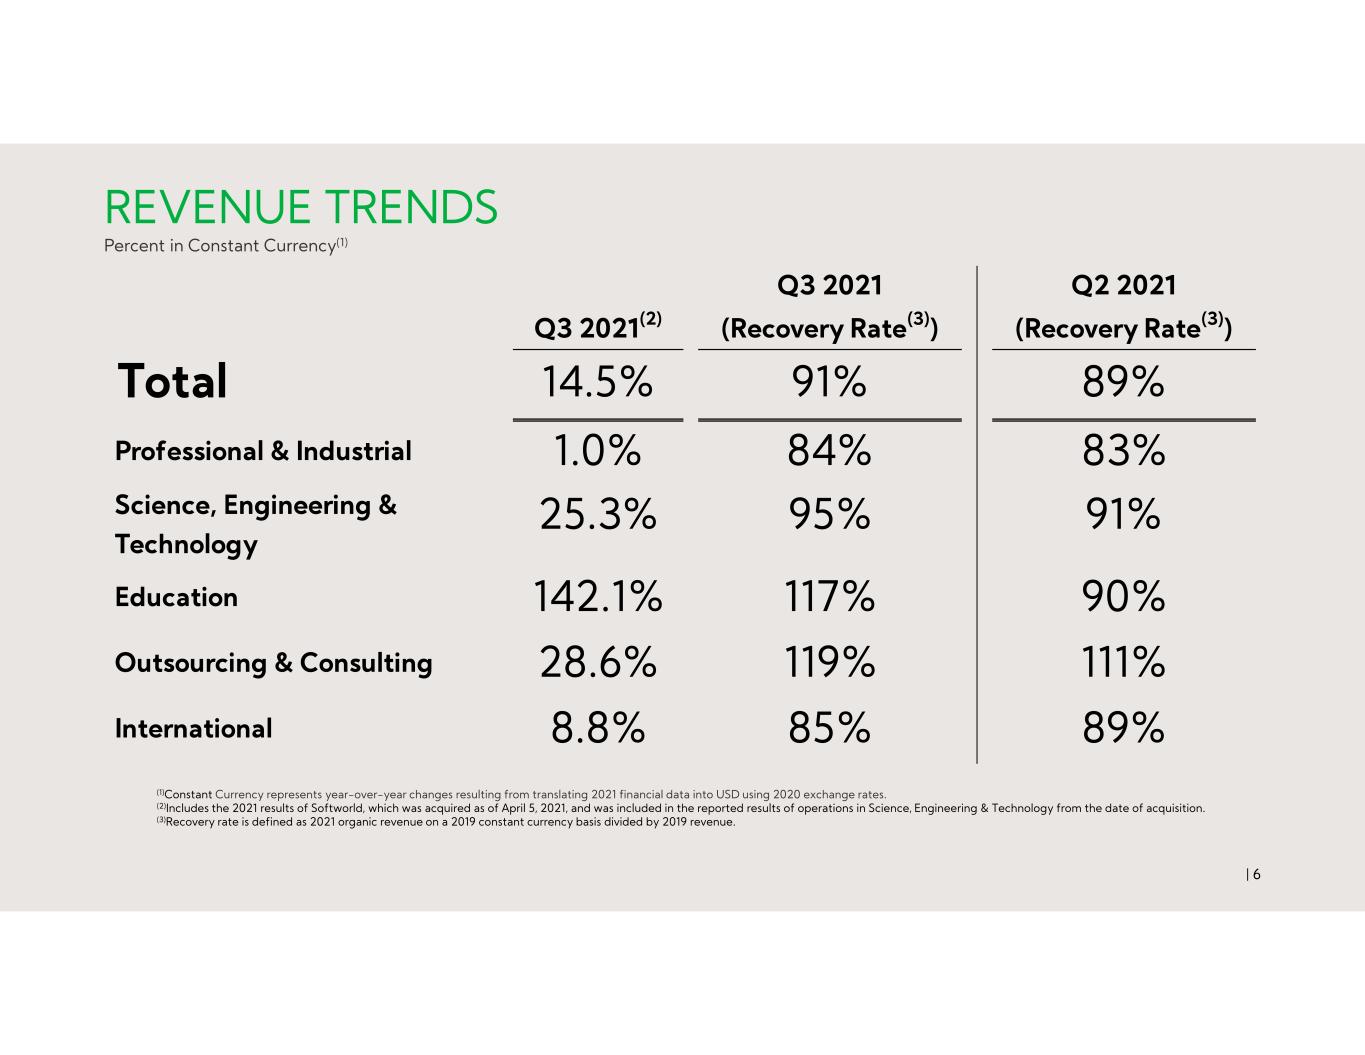
| 6 REVENUE TRENDS Percent in Constant Currency(1) (1)Constant Currency represents year-over-year changes resulting from translating 2021 financial data into USD using 2020 exchange rates. (2)Includes the 2021 results of Softworld, which was acquired as of April 5, 2021, and was included in the reported results of operations in Science, Engineering & Technology from the date of acquisition. (3)Recovery rate is defined as 2021 organic revenue on a 2019 constant currency basis divided by 2019 revenue. Q3 2021(2) Q3 2021 (Recovery Rate(3)) Q2 2021 (Recovery Rate(3)) Total 14.5% 91% 89% Professional & Industrial 1.0% 84% 83% Science, Engineering & Technology 25.3% 95% 91% Education 142.1% 117% 90% Outsourcing & Consulting 28.6% 119% 111% International 8.8% 85% 89%
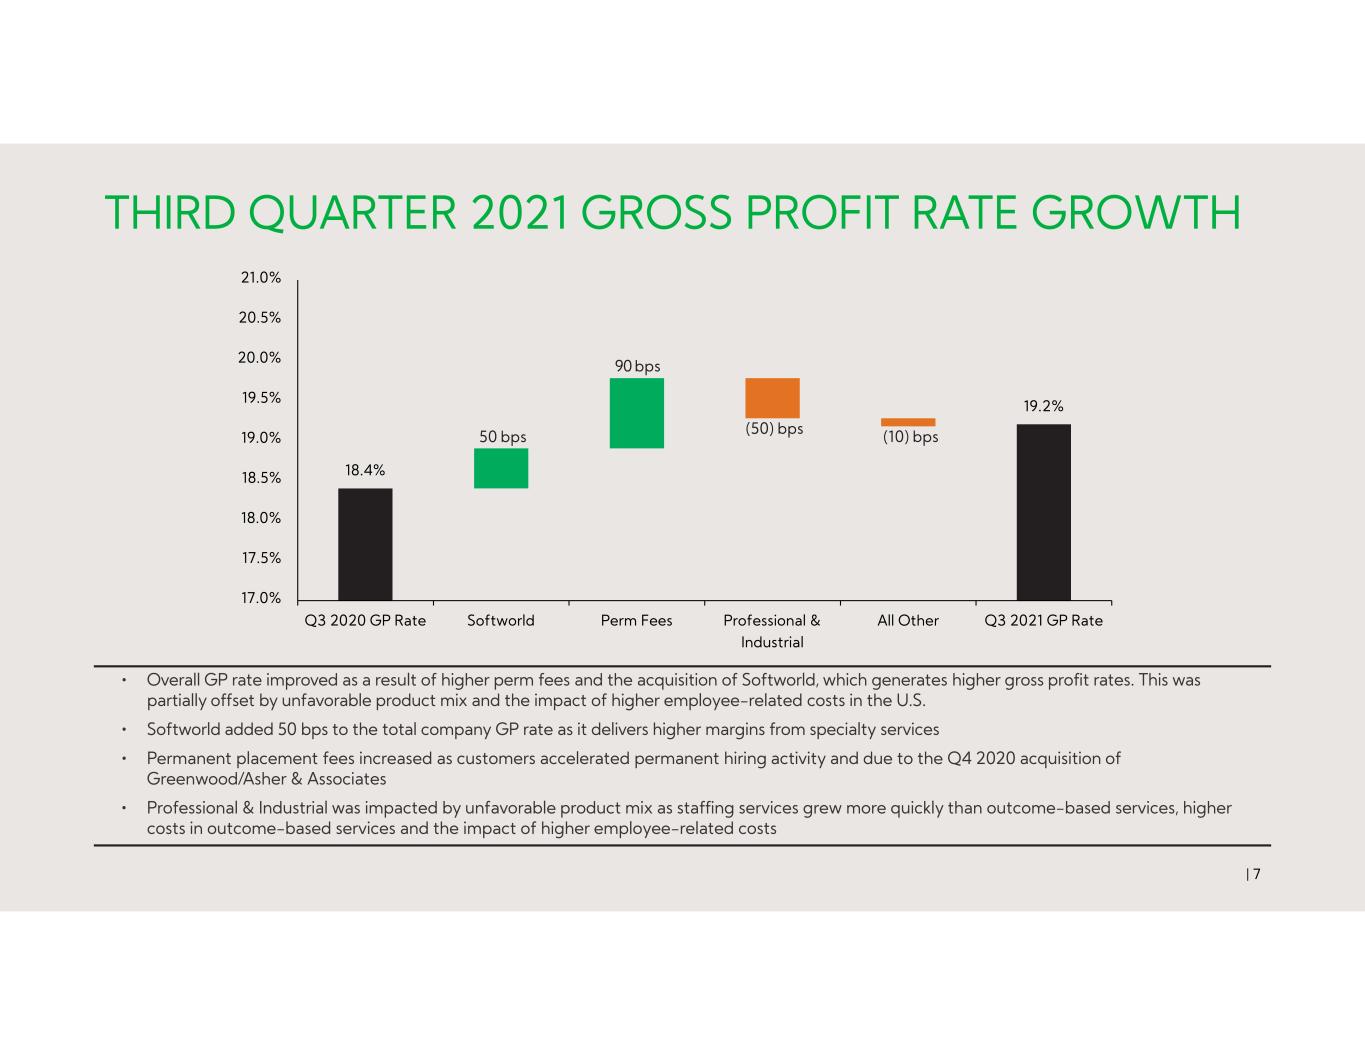
18.4% 19.2% 17.0% 17.5% 18.0% 18.5% 19.0% 19.5% 20.0% 20.5% 21.0% Q3 2020 GP Rate Softworld Perm Fees Professional & Industrial All Other Q3 2021 GP Rate THIRD QUARTER 2021 GROSS PROFIT RATE GROWTH | 7 (50) bps50 bps 90 bps (10) bps • Overall GP rate improved as a result of higher perm fees and the acquisition of Softworld, which generates higher gross profit rates. This was partially offset by unfavorable product mix and the impact of higher employee-related costs in the U.S. • Softworld added 50 bps to the total company GP rate as it delivers higher margins from specialty services • Permanent placement fees increased as customers accelerated permanent hiring activity and due to the Q4 2020 acquisition of Greenwood/Asher & Associates • Professional & Industrial was impacted by unfavorable product mix as staffing services grew more quickly than outcome-based services, higher costs in outcome-based services and the impact of higher employee-related costs
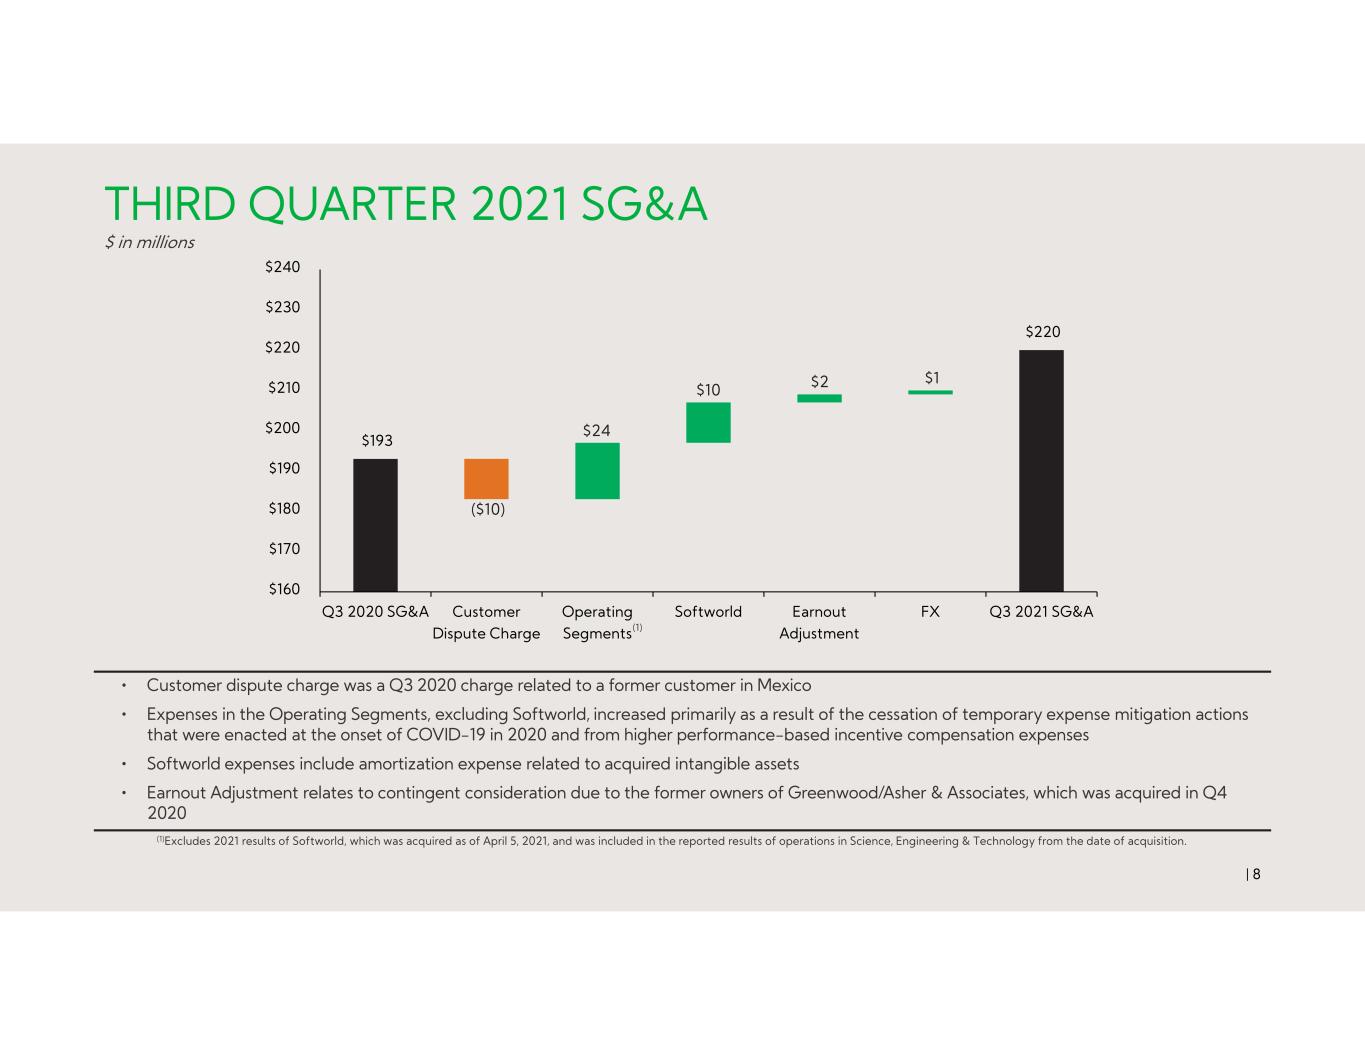
$193 $220 $160 $170 $180 $190 $200 $210 $220 $230 $240 Q3 2020 SG&A Customer Dispute Charge Operating Segments Softworld Earnout Adjustment FX Q3 2021 SG&A THIRD QUARTER 2021 SG&A $ in millions | 8 • Customer dispute charge was a Q3 2020 charge related to a former customer in Mexico • Expenses in the Operating Segments, excluding Softworld, increased primarily as a result of the cessation of temporary expense mitigation actions that were enacted at the onset of COVID-19 in 2020 and from higher performance-based incentive compensation expenses • Softworld expenses include amortization expense related to acquired intangible assets • Earnout Adjustment relates to contingent consideration due to the former owners of Greenwood/Asher & Associates, which was acquired in Q4 2020 (1)Excludes 2021 results of Softworld, which was acquired as of April 5, 2021, and was included in the reported results of operations in Science, Engineering & Technology from the date of acquisition. $10 $24 $1$2 (1) ($10)

THIRD QUARTER 2021 REVENUE & GROSS PROFIT MIX | 9 GROSS PROFIT MIX BY SEGMENTREVENUE MIX BY SEGMENT Professional & Industrial Science, Engineering & Technology Education Outsourcing & Consulting International 38% 26% 6% 9% 21% 34% 30% 4% 16% 16%
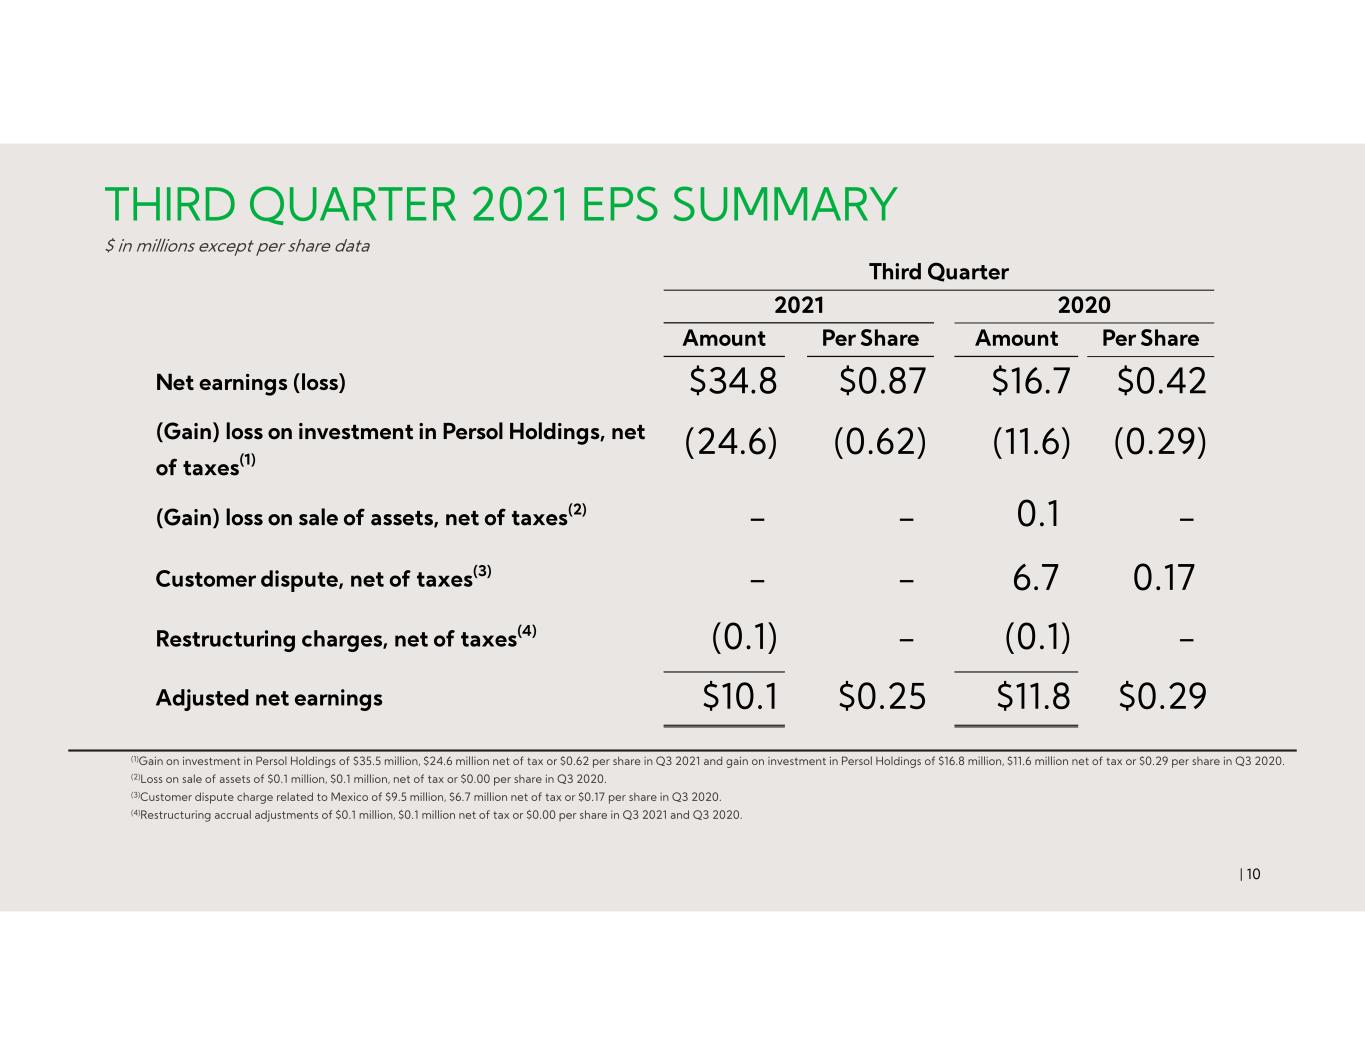
THIRD QUARTER 2021 EPS SUMMARY $ in millions except per share data | 10 (1)Gain on investment in Persol Holdings of $35.5 million, $24.6 million net of tax or $0.62 per share in Q3 2021 and gain on investment in Persol Holdings of $16.8 million, $11.6 million net of tax or $0.29 per share in Q3 2020. (2)Loss on sale of assets of $0.1 million, $0.1 million, net of tax or $0.00 per share in Q3 2020. (3)Customer dispute charge related to Mexico of $9.5 million, $6.7 million net of tax or $0.17 per share in Q3 2020. (4)Restructuring accrual adjustments of $0.1 million, $0.1 million net of tax or $0.00 per share in Q3 2021 and Q3 2020. Amount Per Share Amount Per Share Net earnings (loss) $34.8 $0.87 $16.7 $0.42 (Gain) loss on investment in Persol Holdings, net of taxes(1) (24.6) (0.62) (11.6) (0.29) (Gain) loss on sale of assets, net of taxes(2) - - 0.1 - Customer dispute, net of taxes(3) - - 6.7 0.17 Restructuring charges, net of taxes(4) (0.1) - (0.1) - Adjusted net earnings $10.1 $0.25 $11.8 $0.29 Third Quarter 2021 2020
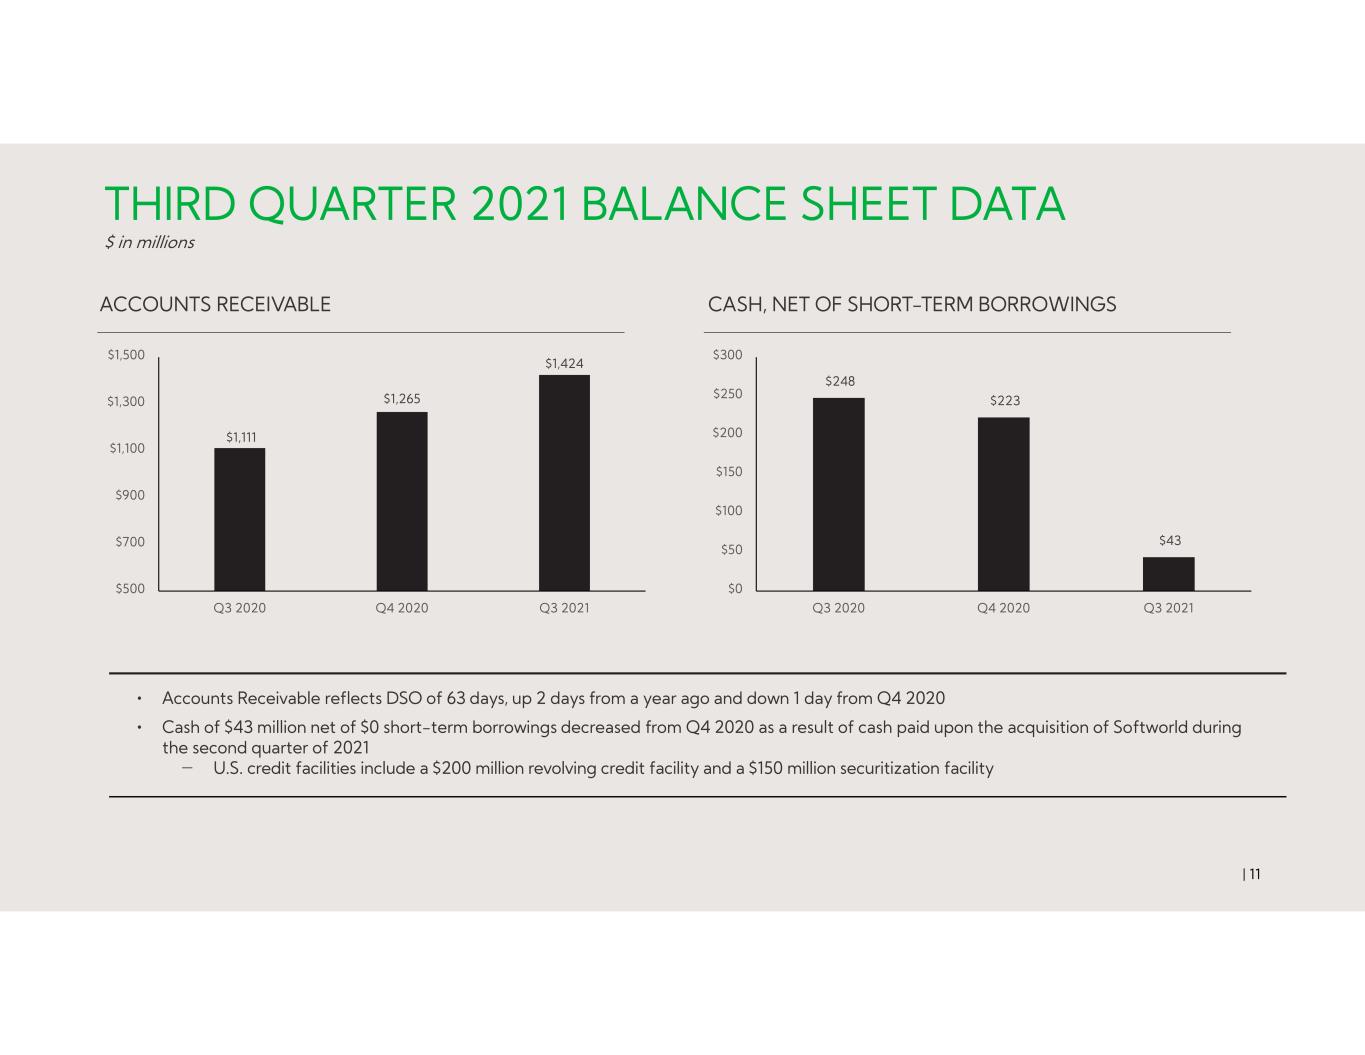
THIRD QUARTER 2021 BALANCE SHEET DATA $ in millions | 11 • Accounts Receivable reflects DSO of 63 days, up 2 days from a year ago and down 1 day from Q4 2020 • Cash of $43 million net of $0 short-term borrowings decreased from Q4 2020 as a result of cash paid upon the acquisition of Softworld during the second quarter of 2021 ‒ U.S. credit facilities include a $200 million revolving credit facility and a $150 million securitization facility ACCOUNTS RECEIVABLE CASH, NET OF SHORT-TERM BORROWINGS $248 $223 $43 $0 $50 $100 $150 $200 $250 $300 Q3 2020 Q4 2020 Q3 2021 $1,111 $1,265 $1,424 $500 $700 $900 $1,100 $1,300 $1,500 Q3 2020 Q4 2020 Q3 2021
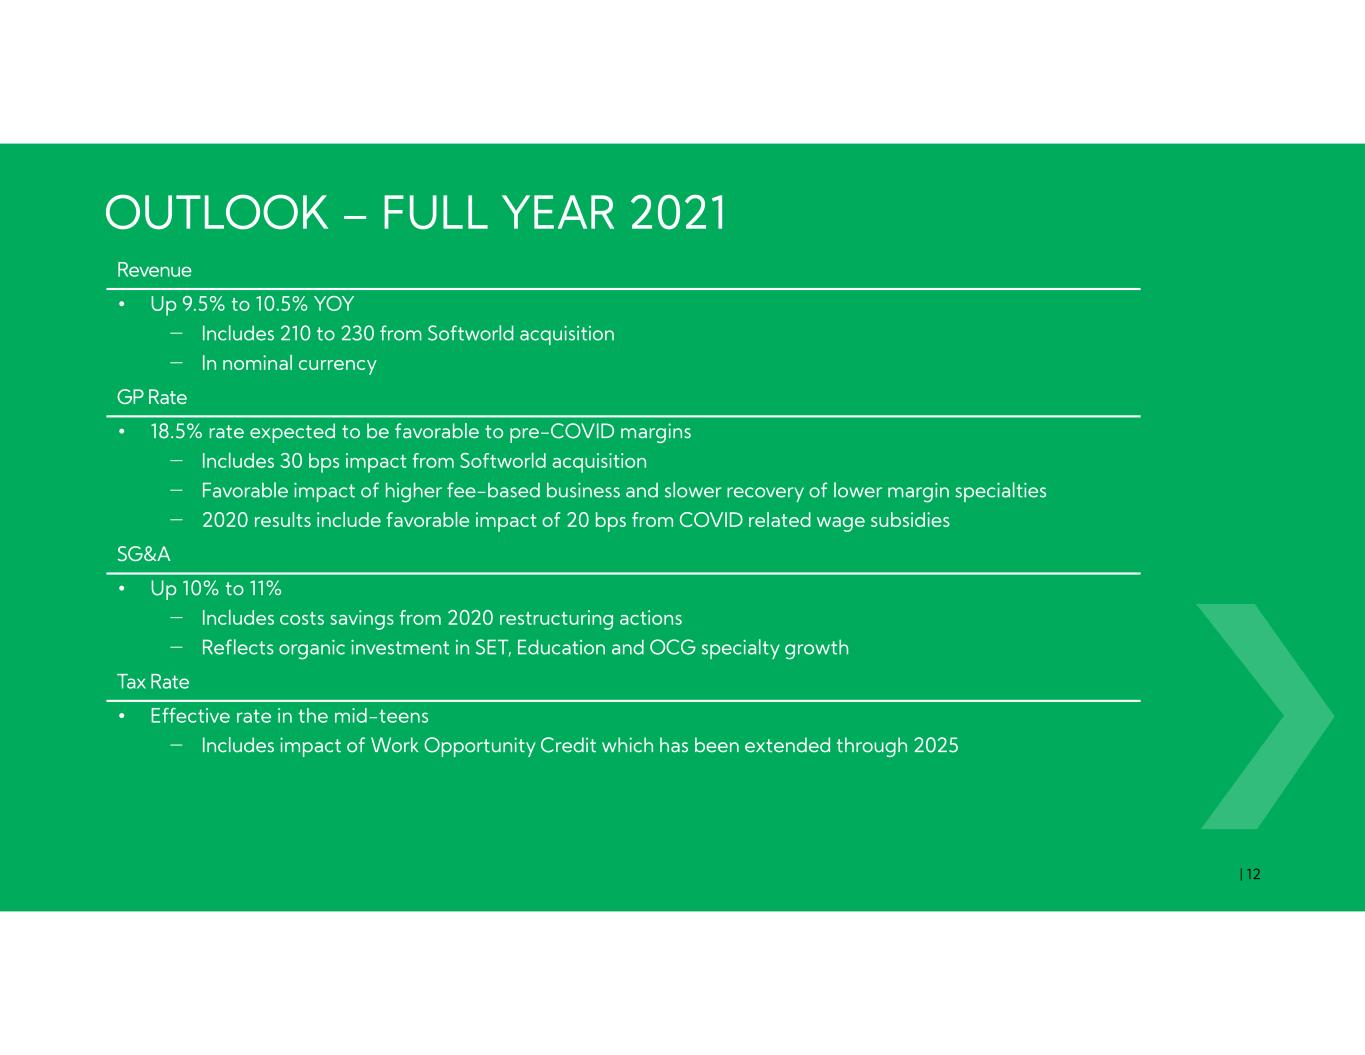
OUTLOOK – FULL YEAR 2021 | 12 Revenue • Up 9.5% to 10.5% YOY ‒ Includes 210 to 230 from Softworld acquisition ‒ In nominal currency GP Rate • 18.5% rate expected to be favorable to pre-COVID margins ‒ Includes 30 bps impact from Softworld acquisition ‒ Favorable impact of higher fee-based business and slower recovery of lower margin specialties ‒ 2020 results include favorable impact of 20 bps from COVID related wage subsidies SG&A • Up 10% to 11% ‒ Includes costs savings from 2020 restructuring actions ‒ Reflects organic investment in SET, Education and OCG specialty growth Tax Rate • Effective rate in the mid-teens ‒ Includes impact of Work Opportunity Credit which has been extended through 2025
RECENT ACQUISITIONS | 13 • Softworld is a leading technology staffing and workforce solutions firm that serves clients across several end-markets, including financial services, life sciences, aerospace, defense, insurance, retail, and IT consulting ‒ Softworld has been included on Staffing Industry Analysts’ list of the fastest growing staffing firms in the United States for each of the past five years • In 2021, the market for temporary information technology staffing in the U.S. is projected to reach $34.0 billion, making it the largest professional staffing segment(1) (1)Staffing Industry Analysts U.S. Staffing Industry Forecast | September 7, 2021
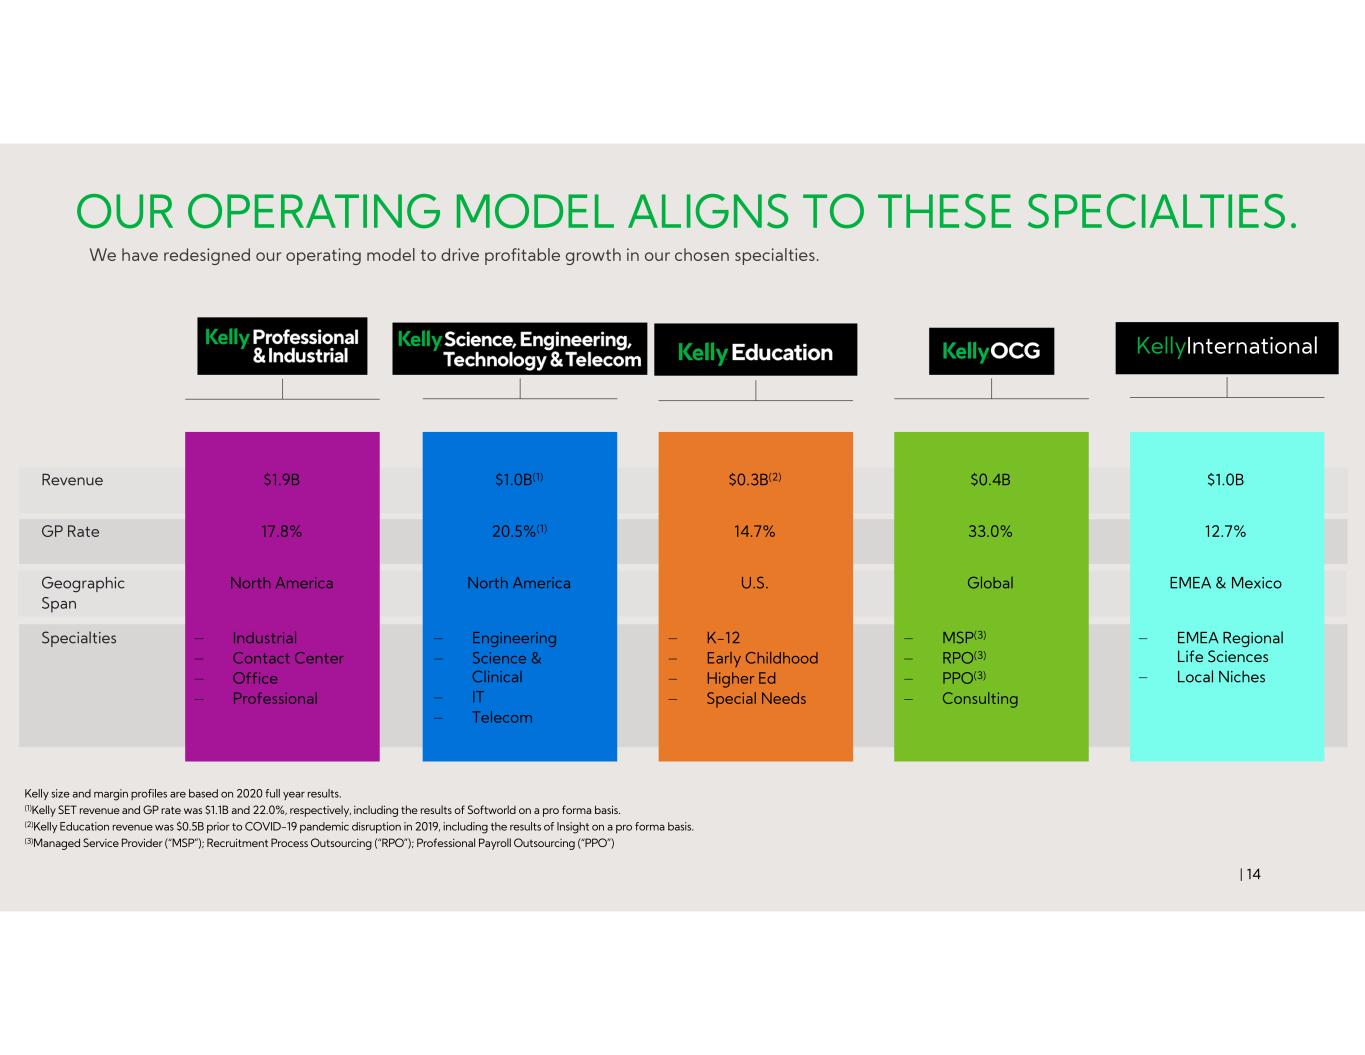
| 14 OUR OPERATING MODEL ALIGNS TO THESE SPECIALTIES. We have redesigned our operating model to drive profitable growth in our chosen specialties. Revenue $1.9B $1.0B(1) $0.3B(2) $0.4B $1.0B GP Rate 17.8% 20.5%(1) 14.7% 33.0% 12.7% Geographic Span North America North America U.S. Global EMEA & Mexico Specialties ‒ Industrial ‒ Contact Center ‒ Office ‒ Professional ‒ Engineering ‒ Science & Clinical ‒ IT ‒ Telecom ‒ K-12 ‒ Early Childhood ‒ Higher Ed ‒ Special Needs ‒ MSP(3) ‒ RPO(3) ‒ PPO(3) ‒ Consulting ‒ EMEA Regional Life Sciences ‒ Local Niches Kelly size and margin profiles are based on 2020 full year results. (1)Kelly SET revenue and GP rate was $1.1B and 22.0%, respectively, including the results of Softworld on a pro forma basis. (2)Kelly Education revenue was $0.5B prior to COVID-19 pandemic disruption in 2019, including the results of Insight on a pro forma basis. (3)Managed Service Provider (“MSP”); Recruitment Process Outsourcing (“RPO”); Professional Payroll Outsourcing (“PPO”) KellyInternational
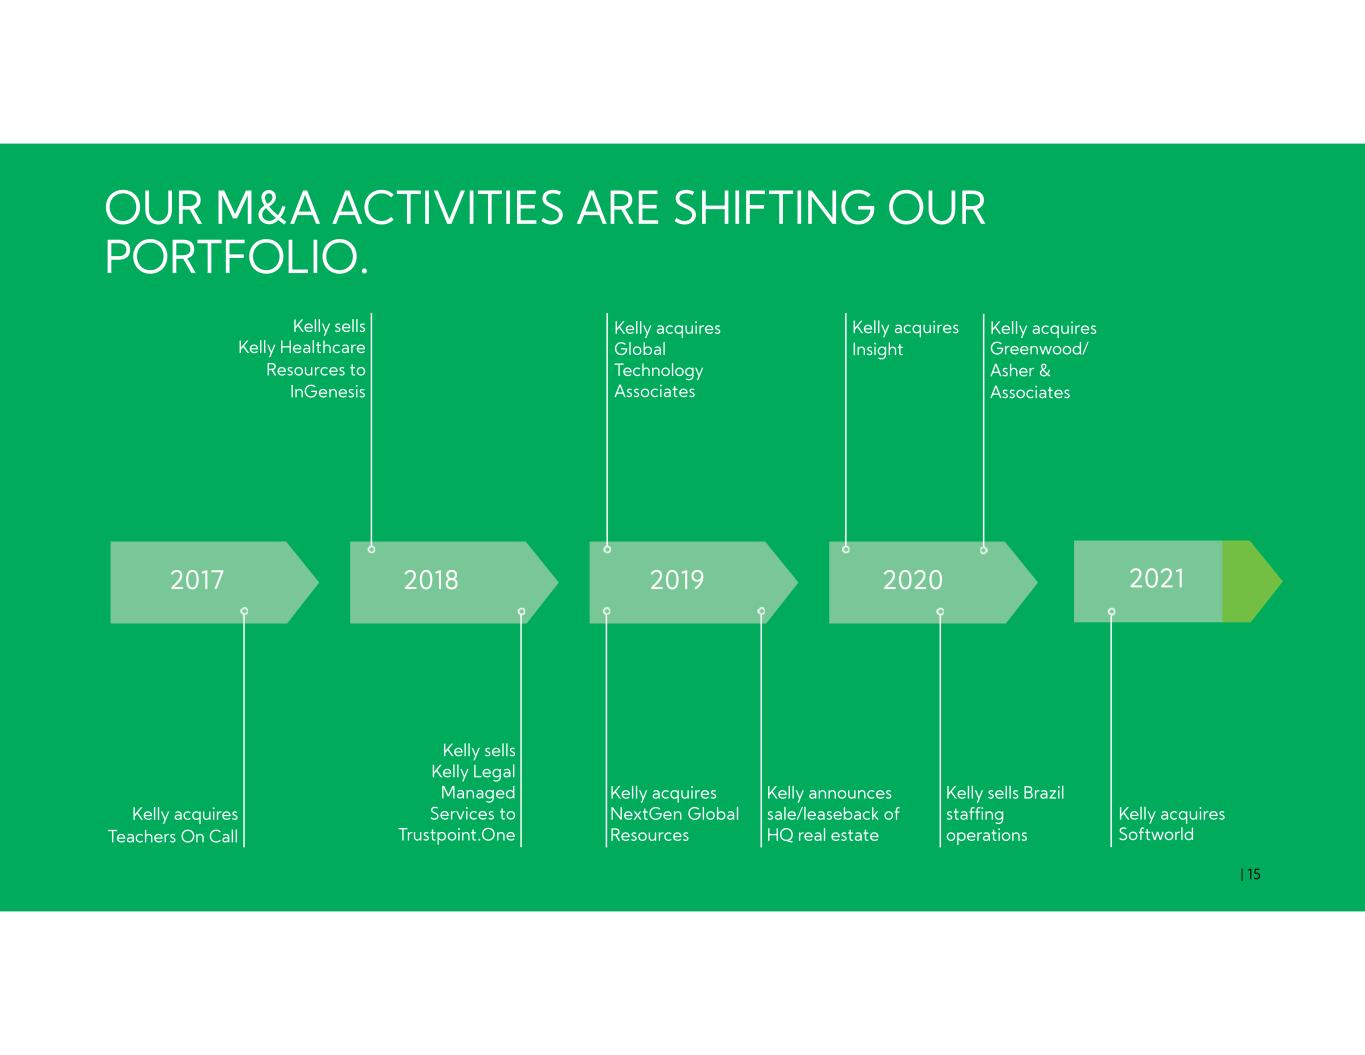
OUR M&A ACTIVITIES ARE SHIFTING OUR PORTFOLIO. 2017 Kelly acquires Teachers On Call 2018 Kelly sells Kelly Healthcare Resources to InGenesis Kelly sells Kelly Legal Managed Services to Trustpoint.One 2019 Kelly acquires NextGen Global Resources Kelly announces sale/leaseback of HQ real estate Kelly acquires Global Technology Associates Kelly acquires Insight 2020 Kelly sells Brazil staffing operations Kelly acquires Greenwood/ Asher & Associates Kelly acquires Softworld 2021 | 15


