WASHINGTON, D. C. 20549
January 31, 2014
Semiannual Report
to Shareholders
DWS Money Market Prime Series
Contents
13 Statement of Assets and Liabilities 15 Statement of Operations 16 Statement of Changes in Net Assets 22 Notes to Financial Statements 30 Information About Your Fund's Expenses 33 Advisory Agreement Board Considerations and Fee Evaluation 38 Account Management Resources |
This report must be preceded or accompanied by a prospectus. To obtain a summary prospectus, if available, or prospectus for any of our funds, refer to the Account Management Resources information provided in the back of this booklet. We advise you to consider the fund's objectives, risks, charges and expenses carefully before investing. The summary prospectus and prospectus contain this and other important information about the fund. Please read the prospectus carefully before you invest.
An investment in this fund is not insured or guaranteed by the Federal Deposit Insurance Corporation (FDIC) or by any other government agency. Although the fund seeks to preserve the value of your investment at $1.00 per share, it is possible to lose money by investing in the fund. The share price of money market funds can fall below the $1.00 share price. You should not rely on or expect the Advisor to enter into support agreements or take other actions to maintain the fund's $1.00 share price. The credit quality of the fund's holdings can change rapidly in certain markets, and the default of a single holding could have an adverse impact on the fund's share price. The fund's share price can also be negatively affected during periods of high redemption pressures and/or illiquid markets. The actions of a few large investors in one class of shares of the fund may have a significant adverse effect on the share prices of all classes of shares of the fund. See the prospectus for specific details regarding the fund's risk profile.
Deutsche Asset & Wealth Management represents the asset management and wealth management activities conducted by Deutsche Bank AG or any of its subsidiaries, including the Advisor and DWS Investments Distributors, Inc.
NOT FDIC/NCUA INSURED NO BANK GUARANTEE MAY LOSE VALUE NOT A DEPOSIT NOT INSURED BY ANY FEDERAL GOVERNMENT AGENCY
Dear Shareholder:
Having recently joined Deutsche Asset & Wealth Management as president of the DWS funds and head of Fund Administration, I'd like to take this opportunity to introduce myself. I come with 20 years of experience in asset management and the mutual fund industry. My job is to work closely with your fund board to ensure optimal oversight of the DWS funds' management and operations. I look forward to serving in this role on your behalf.
As for the economy, experts seem to agree that both the U.S. and global economies are recovering. Interest rates, while destined to rise to a level more in line with historical "normal" at some point, will likely remain relatively low for the foreseeable future. The stock markets continue to demonstrate strength as housing rebounds, American manufacturing strengthens, the U.S. budget deficit improves and unemployment continues to move lower. However, uncertainty persists regarding the pace of the recovery, the eventual tapering of government bond purchases, the potential for further political gridlock around the fiscal impasse and lingering effects of the financial crisis. All this uncertainty may well contribute to volatility in both the bond and stock markets.
It may help to remember that market fluctuations are not unusual. However, significant market swings may also reflect behavior that is driven more by investor emotion than any fundamental factors relating to the securities in question. If volatility is making you nervous, it may be time to review your investments. A trusted financial advisor can help you determine if a strategy change is appropriate and identify risk management strategies that serve your specific goals and situation.
Best regards,
Brian Binder
President, DWS Funds
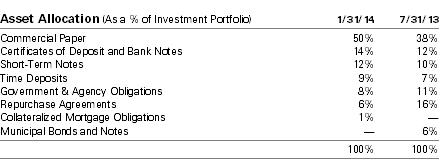
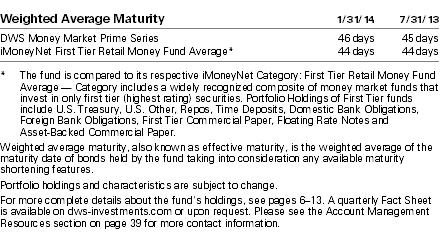
Portfolio Summary (Unaudited)
Investment Portfolio as of January 31, 2014 (Unaudited) | | | Principal Amount ($) | | | Value ($) | |
| | | | |
| Certificates of Deposit and Bank Notes 13.6% | |
| Banco del Estado de Chile, 0.26%, 5/14/2014 | | | 16,000,000 | | | | 16,000,000 | |
| Bank of America NA, 0.19%, 5/1/2014 | | | 10,000,000 | | | | 10,000,000 | |
| Bank of Tokyo-Mitsubishi UFJ Ltd., 0.2%, 2/7/2014 | | | 10,000,000 | | | | 10,000,000 | |
| Credit Suisse, 0.26%, 3/18/2014 | | | 16,000,000 | | | | 16,001,996 | |
| DNB Bank ASA, 0.17%, 4/4/2014 | | | 20,000,000 | | | | 20,000,000 | |
| DZ Bank AG, 0.25%, 3/17/2014 | | | 10,000,000 | | | | 10,000,000 | |
| Fortis Bank SA, 0.175%, 4/1/2014 | | | 15,250,000 | | | | 15,250,125 | |
| International Business Machines Corp., 1.25%, 5/12/2014 | | | 5,225,000 | | | | 5,238,969 | |
| Kreditanstalt Fuer Wiederaufbau, 0.22%, 4/11/2014 | | | 10,000,000 | | | | 9,999,298 | |
| Mitsubishi UFJ Trust & Banking Corp., 0.2%, 5/2/2014 | | | 5,000,000 | | | | 5,000,000 | |
| Mizuho Corporate Bank Ltd.: | |
| 0.21%, 4/15/2014 | | | 8,000,000 | | | | 8,000,000 | |
| 0.22%, 2/26/2014 | | | 12,000,000 | | | | 12,000,000 | |
| Nordea Bank Finland PLC, 0.21%, 7/7/2014 | | | 12,500,000 | | | | 12,500,000 | |
| Norinchukin Bank: | |
| 0.22%, 2/14/2014 | | | 5,000,000 | | | | 5,000,000 | |
| 0.22%, 4/22/2014 | | | 10,000,000 | | | | 10,000,000 | |
| Rabobank Nederland NV, 0.245%, 6/12/2014 | | | 5,000,000 | | | | 5,000,000 | |
| Sumitomo Mitsui Banking Corp.: | |
| 0.12%, 2/10/2014 | | | 17,000,000 | | | | 17,000,000 | |
| 0.21%, 2/18/2014 | | | 15,000,000 | | | | 15,000,000 | |
| 0.21%, 4/7/2014 | | | 9,000,000 | | | | 9,000,000 | |
| Wells Fargo Bank NA, 0.2%, 5/27/2014 | | | 8,000,000 | | | | 8,000,000 | |
Total Certificates of Deposit and Bank Notes (Cost $218,990,388) | | | | 218,990,388 | |
| | |
| Collateralized Mortgage Obligation 0.6% | |
| Resimac MBS Trust, "A1B", Series 2012-1, 0.445%*, 6/7/2014 (Cost $10,000,000) | | | 10,000,000 | | | | 10,000,000 | |
| | |
| Commercial Paper 50.5% | |
| Issued at Discount** 43.3% | |
| Albion Capital Corp. SA: | |
| 0.16%, 2/26/2014 | | | 15,000,000 | | | | 14,998,333 | |
| 0.21%, 2/21/2014 | | | 11,200,000 | | | | 11,198,693 | |
| Antalis U.S. Funding Corp., 144A, 0.1%, 2/4/2014 | | | 15,000,000 | | | | 14,999,875 | |
| ASB Finance Ltd., 0.22%, 4/3/2014 | | | 14,200,000 | | | | 14,194,707 | |
| Bank Nederlandse Gemeenten, 0.22%, 6/17/2014 | | | 12,000,000 | | | | 11,990,027 | |
| Barclays Bank PLC, 0.14%, 2/10/2014 | | | 16,500,000 | | | | 16,499,422 | |
| Bedford Row Funding Corp.: | |
| 144A, 0.3%, 4/22/2014 | | | 4,000,000 | | | | 3,997,333 | |
| 144A, 0.31%, 10/27/2014 | | | 4,750,000 | | | | 4,739,038 | |
| 144A, 0.32%, 12/17/2014 | | | 12,500,000 | | | | 12,464,556 | |
| BNZ International Funding Ltd., 144A, 0.17%, 3/5/2014 | | | 10,000,000 | | | | 9,998,489 | |
| Caisse Centrale Desjardins du Quebec, 0.175%, 2/19/2014 | | | 16,500,000 | | | | 16,498,556 | |
| Caisse des Depots et Consignations, 144A, 0.2%, 3/24/2014 | | | 10,000,000 | | | | 9,997,167 | |
| Collateralized Commercial Paper Co., LLC: | |
| 0.22%, 3/17/2014 | | | 10,000,000 | | | | 9,997,311 | |
| 0.22%, 4/15/2014 | | | 15,500,000 | | | | 15,493,085 | |
| Collateralized Commercial Paper II Co., LLC: | |
| 144A, 0.219%, 5/29/2014 | | | 10,000,000 | | | | 9,992,850 | |
| 144A, 0.22%, 2/5/2014 | | | 10,500,000 | | | | 10,499,743 | |
| 144A, 0.22%, 3/18/2014 | | | 6,000,000 | | | | 5,998,350 | |
| CPPIB Capital, Inc., 0.3%, 2/11/2015 | | | 5,000,000 | | | | 4,984,375 | |
| DBS Bank Ltd., 144A, 0.235%, 3/11/2014 | | | 7,500,000 | | | | 7,498,140 | |
| Dexia Credit Local, 0.33%, 8/18/2014 | | | 8,688,000 | | | | 8,672,231 | |
| DNB Bank ASA, 0.17%, 4/9/2014 | | | 25,000,000 | | | | 24,992,090 | |
| Erste Abwicklungsanstalt: | |
| 144A, 0.15%, 4/7/2014 | | | 10,000,000 | | | | 9,997,292 | |
| 144A, 0.17%, 4/24/2014 | | | 10,000,000 | | | | 9,996,128 | |
| General Electric Capital Corp., 0.05%, 2/3/2014 | | | 19,000,000 | | | | 18,999,947 | |
| Hannover Funding Co., LLC, 0.165%, 2/24/2014 | | | 10,000,000 | | | | 9,998,946 | |
| Kells Funding LLC: | |
| 144A, 0.17%, 4/2/2014 | | | 5,000,000 | | | | 4,998,583 | |
| 144A, 0.23%, 2/19/2014 | | | 7,500,000 | | | | 7,499,137 | |
| 144A, 0.235%, 2/19/2014 | | | 5,000,000 | | | | 4,999,413 | |
| Kreditanstalt Fuer Wiederaufbau, 144A, 0.12%, 4/4/2014 | | | 10,000,000 | | | | 9,997,933 | |
| LMA Americas LLC: | |
| 144A, 0.16%, 2/24/2014 | | | 35,000,000 | | | | 34,996,422 | |
| 144A, 0.17%, 2/10/2014 | | | 22,000,000 | | | | 21,999,065 | |
| Macquarie Bank Ltd., 144A, 0.215%, 3/4/2014 | | | 3,000,000 | | | | 2,999,445 | |
| Manhattan Asset Funding Co., LLC, 144A, 0.16%, 2/11/2014 | | | 12,000,000 | | | | 11,999,467 | |
| Matchpoint Master Trust, 0.08%, 2/3/2014 | | | 15,613,000 | | | | 15,612,931 | |
| MetLife Short Term Funding LLC, 144A, 0.25%, 2/3/2014 | | | 5,000,000 | | | | 4,999,931 | |
| Natixis U.S. Finance Co., LLC, 0.1%, 2/3/2014 | | | 47,000,000 | | | | 46,999,739 | |
| Nordea Bank AB, 0.205%, 6/9/2014 | | | 12,000,000 | | | | 11,991,253 | |
| NRW.Bank, 0.069%, 2/5/2014 | | | 49,000,000 | | | | 48,999,619 | |
| PepsiCo, Inc., 0.07%, 2/4/2014 | | | 16,000,000 | | | | 15,999,907 | |
| Philip Morris International, Inc., 144A, 0.15%, 5/2/2014 | | | 10,574,000 | | | | 10,570,035 | |
| Prudential Funding LLC, 0.04%, 2/3/2014 | | | 21,000,000 | | | | 20,999,953 | |
| Skandinaviska Enskilda Banken AB, 0.28%, 5/8/2014 | | | 10,000,000 | | | | 9,992,533 | |
| Standard Chartered Bank: | |
| 0.27%, 5/19/2014 | | | 19,000,000 | | | | 18,984,752 | |
| 0.29%, 5/1/2014 | | | 12,000,000 | | | | 11,991,397 | |
| Swedbank AB: | |
| 0.24%, 5/8/2014 | | | 10,000,000 | | | | 9,993,600 | |
| 0.255%, 5/7/2014 | | | 17,700,000 | | | | 17,688,089 | |
| Sydney Capital Corp., 144A, 0.19%, 4/24/2014 | | | 12,000,000 | | | | 11,994,807 | |
| The Army & Air Force Exchange Service, 0.13%, 5/21/2014 | | | 12,500,000 | | | | 12,495,080 | |
| UOB Funding LLC, 0.24%, 4/10/2014 | | | 10,150,000 | | | | 10,145,399 | |
| Victory Receivables Corp., 144A, 0.18%, 2/3/2014 | | | 20,000,000 | | | | 19,999,800 | |
| Working Capital Management Co., 144A, 0.2%, 3/11/2014 | | | 6,800,000 | | | | 6,798,564 | |
| | | | | 694,443,538 | |
| Issued at Par* 7.2% | |
| ASB Finance Ltd.: | |
| 144A, 0.25%, 6/11/2014 | | | 5,000,000 | | | | 5,000,000 | |
| 144A, 0.277%, 10/9/2014 | | | 9,000,000 | | | | 8,999,564 | |
| Atlantic Asset Securitization LLC: | |
| 144A, 0.181%, 7/9/2014 | | | 9,000,000 | | | | 8,999,607 | |
| 144A, 0.188%, 2/27/2014 | | | 4,000,000 | | | | 4,000,000 | |
| Australia & New Zealand Banking Group Ltd., 144A, 0.154%, 4/7/2014 | | | 12,000,000 | | | | 11,998,925 | |
| Bank of Montreal, 0.238%, 9/5/2014 | | | 10,000,000 | | | | 10,001,636 | |
| Bank of Nova Scotia, 0.25%, 1/13/2015 | | | 7,000,000 | | | | 7,000,000 | |
| BNZ International Funding Ltd., 144A, 0.257%, 1/20/2015 | | | 5,000,000 | | | | 5,000,000 | |
| Caisse Centrale Desjardins, 144A, 0.238%, 1/26/2015 | | | 5,450,000 | | | | 5,449,463 | |
| Kells Funding LLC: | |
| 144A, 0.197%, 2/3/2014 | | | 12,500,000 | | | | 12,500,000 | |
| 144A, 0.235%, 10/10/2014 | | | 5,000,000 | | | | 5,000,000 | |
| 144A, 0.238%, 10/28/2014 | | | 15,300,000 | | | | 15,300,000 | |
| Nederlandse Waterschapsbank NV, 144A, 0.278%, 8/15/2014 | | | 6,000,000 | | | | 6,000,000 | |
| PNC Bank NA, 0.25%, 4/23/2014 | | | 10,000,000 | | | | 10,000,000 | |
| | | | | 115,249,195 | |
Total Commercial Paper (Cost $809,692,733) | | | | 809,692,733 | |
| | |
| Short-Term Notes* 12.4% | |
| Australia & New Zealand Banking Group Ltd., 144A, 0.296%, 1/16/2015 | | | 8,000,000 | | | | 8,000,000 | |
| Bank of Nova Scotia: | |
| 0.25%, 9/3/2014 | | | 10,000,000 | | | | 10,000,000 | |
| 0.298%, 7/24/2014 | | | 8,000,000 | | | | 8,000,000 | |
| Canadian Imperial Bank of Commerce, 0.27%, 5/16/2014 | | | 12,150,000 | | | | 12,150,000 | |
| Commonwealth Bank of Australia: | |
| 144A, 0.23%, 6/11/2014 | | | 11,500,000 | | | | 11,500,000 | |
| 144A, 0.516%, 1/29/2015 | | | 5,000,000 | | | | 5,013,540 | |
| DNB Bank ASA, 0.462%, 4/4/2014 | | | 18,000,000 | | | | 18,009,157 | |
| JPMorgan Chase Bank NA, 0.317%, 4/22/2019 | | | 10,000,000 | | | | 10,000,000 | |
| Kommunalbanken AS, 144A, 0.14%, 2/26/2014 | | | 8,000,000 | | | | 8,000,000 | |
| Rabobank Nederland NV: | |
| 0.23%, 6/12/2014 | | | 8,500,000 | | | | 8,500,000 | |
| 0.273%, 5/8/2014 | | | 5,500,000 | | | | 5,500,000 | |
| 0.276%, 7/23/2014 | | | 10,000,000 | | | | 10,000,000 | |
| 0.328%, 12/1/2014 | | | 14,000,000 | | | | 14,000,000 | |
| 144A, 0.518%, 8/16/2014 | | | 12,000,000 | | | | 12,000,000 | |
| Royal Bank of Canada: | |
| 0.24%, 12/11/2014 | | | 14,000,000 | | | | 14,000,000 | |
| 0.29%, 2/28/2014 | | | 9,000,000 | | | | 9,000,000 | |
| Svensk Exportkredit AB, 144A, 0.16%, 6/17/2014 | | | 8,400,000 | | | | 8,400,000 | |
| Svenska Handelsbanken AB, 144A, 0.326%, 10/3/2014 | | | 15,000,000 | | | | 15,000,000 | |
| Wells Fargo Bank NA, 0.24%, 12/10/2014 | | | 5,000,000 | | | | 5,000,000 | |
| Westpac Banking Corp., 0.251%, 5/9/2014 | | | 7,000,000 | | | | 7,000,000 | |
Total Short-Term Notes (Cost $199,072,697) | | | | 199,072,697 | |
| | |
| Government & Agency Obligations 8.3% | |
| Other Government Related (a) 0.3% | |
| European Investment Bank, 3.0%, 4/8/2014 | | | 5,000,000 | | | | 5,024,635 | |
| U.S. Government Sponsored Agencies 5.1% | |
| Federal Farm Credit Bank: | |
| 0.137%*, 10/20/2014 | | | 9,500,000 | | | | 9,500,387 | |
| 0.144%*, 10/29/2014 | | | 4,000,000 | | | | 4,000,454 | |
| Federal Home Loan Bank: | |
| 0.125%, 3/27/2014 | | | 6,250,000 | | | | 6,249,473 | |
| 0.142%**, 2/18/2014 | | | 7,000,000 | | | | 6,999,504 | |
| 0.143%**, 4/9/2014 | | | 10,000,000 | | | | 9,997,301 | |
| 0.18%, 3/7/2014 | | | 5,500,000 | | | | 5,499,975 | |
| Federal Home Loan Mortgage Corp.: | |
| 0.108%**, 3/19/2014 | | | 9,000,000 | | | | 8,998,735 | |
| 0.109%**, 5/22/2014 | | | 12,500,000 | | | | 12,495,799 | |
| Federal National Mortgage Association: | |
| 0.116%**, 2/24/2014 | | | 10,000,000 | | | | 9,999,233 | |
| 0.139%**, 6/2/2014 | | | 7,200,000 | | | | 7,196,612 | |
| | | | | 80,937,473 | |
| U.S. Treasury Obligations 2.9% | |
| U.S. Treasury Notes: | |
| 0.1%, 1/31/2016 | | | 14,000,000 | | | | 14,000,000 | |
| 0.5%, 8/15/2014 | | | 17,000,000 | | | | 17,031,798 | |
| 2.625%, 7/31/2014 | | | 8,500,000 | | | | 8,603,434 | |
| 4.0%, 2/15/2014 | | | 7,000,000 | | | | 7,010,238 | |
| | | | | 46,645,470 | |
Total Government & Agency Obligations (Cost $132,607,578) | | | | 132,607,578 | |
| | |
| Time Deposits 8.7% | |
| Credit Agricole Corporate & Investment Bank, 0.09%, 2/3/2014 | | | 50,213,196 | | | | 50,213,196 | |
| Fortis Bank SA, 0.05%, 2/3/2014 | | | 40,000,000 | | | | 40,000,000 | |
| National Australia Bank Ltd., 0.03%, 2/3/2014 | | | 50,000,000 | | | | 50,000,000 | |
Total Time Deposits (Cost $140,213,196) | | | | 140,213,196 | |
| Repurchase Agreements 6.1% | |
| BNP Paribas, 0.22%, dated 12/23/2013, to be repurchased at $12,530,097 on 1/21/2015 (b) | | | 12,500,000 | | | | 12,500,000 | |
| JPMorgan Securities, Inc., 0.403%, dated 3/18/2013, to be repurchased at $25,102,200 on 3/18/2014 (c) | | | 25,000,000 | | | | 25,000,000 | |
| Nomura Securities International, 0.03%, dated 1/31/2014, to be repurchased at $50,000,125 on 2/3/2014 (d) | | | 50,000,000 | | | | 50,000,000 | |
| The Toronto-Dominion Bank, 0.08%, dated 1/31/2014, to be repurchased at $10,000,067 on 2/3/2014 (e) | | | 10,000,000 | | | | 10,000,000 | |
Total Repurchase Agreements (Cost $97,500,000) | | | | 97,500,000 | |
| | | % of Net Assets | | | Value ($) | |
| | | | |
Total Investment Portfolio (Cost $1,608,076,592)† | | | 100.2 | | | | 1,608,076,592 | |
| Other Assets and Liabilities, Net | | | (0.2 | ) | | | (3,542,321 | ) |
| Net Assets | | | 100.0 | | | | 1,604,534,271 | |
* Floating rate securities' yields vary with a designated market index or market rate, such as the coupon-equivalent of the U.S. Treasury Bill rate. These securities are shown at their current rate as of January 31, 2014.
** Annualized yield at time of purchase; not a coupon rate.
† The cost for federal income tax purposes was $1,608,076,592.
(a) Government-backed debt issued by financial companies or government sponsored enterprises.
(b) Collateralized by:
| Principal Amount ($) | | Security | | Rate (%) | | Maturity Date | | Collateral Value ($) | |
| | 9,999,021 | | Berkshire Hathaway Finance Corp. | | | 4.85 | | 1/15/2015 | | | 10,445,633 | |
| | 13,494 | | Medtronic, Inc. | | | 4.75 | | 9/15/2015 | | | 14,663 | |
| | 2,380,614 | | State Street Corp. | | | 3.7 | | 11/20/2023 | | | 2,414,704 | |
| Total Collateral Value | | | 12,875,000 | |
(c) Collateralized by:
| Principal Amount ($) | | Security | | Rate (%) | | Maturity Date | | Collateral Value ($) | |
| | 26,032,619 | | CWHEQ Revolving Home Equity Loan Trust | | | 0.3 | | 1/15/2037 | | | 23,002,710 | |
| | 2,968,555 | | Master Asset Backed Securities Trust | | | 0.458 | | 5/25/2037 | | | 2,603,777 | |
| | 469,000 | | Soundview Home Loan Trust | | | 7.0 | | 2/25/2038 | | | 393,792 | |
| Total Collateral Value | | | 26,000,279 | |
(d) Collateralized by:
| Principal Amount ($) | | Security | | Rate (%) | | Maturity Date | | Collateral Value ($) | |
| | 3,273,043 | | Federal National Mortgage Association | | | 4.0–5.5 | | 4/1/2040–
2/1/2044 | | | 3,445,722 | |
| | 44,633,459 | | Government National Mortgage Association | | | 3.0–7.0 | | 2/15/2027–
12/20/2043 | | | 47,554,278 | |
| Total Collateral Value | | | 51,000,000 | |
(e) Collateralized by:
| Principal Amount ($) | | Security | | Rate (%) | | Maturity Date | | Collateral Value ($) | |
| | 565,000 | | Bank of Nova Scotia | | | 1.25 | | 11/7/2014 | | | 570,852 | |
| | 599,543 | | Bottling Group LLC | | | 6.95 | | 3/15/2014 | | | 619,805 | |
| | 575,000 | | Caisse Centrale Desjardins | | | 2.55 | | 3/24/2016 | | | 602,874 | |
| | 5,000,000 | | The Goldman Sachs Group, Inc. | | | 1.838 | | 11/29/2023 | | | 5,088,379 | |
| | 729,627 | | John Deere Capital Corp. | | | 0.363 | | 6/15/2015 | | | 730,695 | |
| | 540,901 | | Pfizer, Inc. | | | 5.35 | | 3/15/2015 | | | 581,047 | |
| | 315,038 | | Rogers Communications, Inc. | | | 3.0 | | 3/15/2023 | | | 300,620 | |
| | 503,393 | | Royal Bank of Canada | | | 3.125 | | 4/14/2015 | | | 524,233 | |
| | 667,164 | | Siemens Financieringsmaatschappij NV | | | 6.125 | | 8/17/2026 | | | 816,010 | |
| | 303,313 | | Vodafone Group PLC | | | 5.625 | | 2/27/2017 | | | 348,892 | |
| | 214,380 | | Westpac Banking Corp. | | | 2.45 | | 11/28/2016 | | | 225,887 | |
| Total Collateral Value | | | 10,409,294 | |
144A: Security exempt from registration under Rule 144A of the Securities Act of 1933. These securities may be resold in transactions exempt from registration, normally to qualified institutional buyers.
Fair Value Measurements
Various inputs are used in determining the value of the Fund's investments. These inputs are summarized in three broad levels. Level 1 includes quoted prices in active markets for identical securities. Level 2 includes other significant observable inputs (including quoted prices for similar securities, interest rates, prepayment speeds and credit risk). Level 3 includes significant unobservable inputs (including the Fund's own assumptions in determining the fair value of investments). The level assigned to the securities valuations may not be an indication of the risk or liquidity associated with investing in those securities. Securities held by the Fund are reflected as Level 2 because the securities are valued at amortized cost (which approximates fair value) and, accordingly, the inputs used to determine value are not quoted prices in an active market.
The following is a summary of the inputs used as of January 31, 2014 in valuing the Fund's investments. For information on the Fund's policy regarding the valuation of investments, please refer to the Security Valuation section of Note A in the accompanying Notes to Financial Statements.
| Assets | | Level 1 | | | Level 2 | | | Level 3 | | | Total | |
| | |
| Investments in Securities (f) | | $ | — | | | $ | 1,510,576,592 | | | $ | — | | | $ | 1,510,576,592 | |
| Repurchase Agreements | | | — | | | | 97,500,000 | | | | — | | | | 97,500,000 | |
| Total | | $ | — | | | $ | 1,608,076,592 | | | $ | — | | | $ | 1,608,076,592 | |
There have been no transfers between fair value measurement levels during the period ended January 31, 2014.
(f) See Investment Portfolio for additional detailed categorizations.
The accompanying notes are an integral part of the financial statements.
Statement of Assets and Liabilities | as of January 31, 2014 (Unaudited) | |
| Assets | |
Investments: Investments in securities, valued at amortized cost | | $ | 1,510,576,592 | |
| Repurchase agreements, valued at amortized cost | | | 97,500,000 | |
| Total investments, valued at amortized cost | | | 1,608,076,592 | |
| Cash | | | 6 | |
| Receivable for Fund shares sold | | | 2,619,592 | |
| Interest receivable | | | 425,950 | |
| Due from Advisor | | | 4,174 | |
| Other assets | | | 81,835 | |
| Total assets | | | 1,611,208,149 | |
| Liabilities | |
| Payable for Fund shares redeemed | | | 6,247,928 | |
| Distributions payable | | | 7,926 | |
| Accrued management fee | | | 35,054 | |
| Accrued Trustees' fees | | | 10,027 | |
| Other accrued expenses and payables | | | 372,943 | |
| Total liabilities | | | 6,673,878 | |
| Net assets, at value | | $ | 1,604,534,271 | |
| Net Assets Consist of | |
| Undistributed net investment income | | | 20,579 | |
| Accumulated net realized gain (loss) | | | 8,657 | |
| Paid-in capital | | | 1,604,505,035 | |
| Net assets, at value | | $ | 1,604,534,271 | |
The accompanying notes are an integral part of the financial statements.
Statement of Assets and Liabilities as of January 31, 2014 (Unaudited) (continued) | |
| Net Asset Value | |
DWS Cash Investment Trust Class A Net Asset Value, offering and redemption price per share ($188,881,970 ÷ 188,870,944 outstanding shares of beneficial interest, no par value, unlimited number of shares authorized) | | $ | 1.00 | |
DWS Cash Investment Trust Class B Net Asset Value, offering and redemption price per share ($1,320,335 ÷ 1,320,258 outstanding shares of beneficial interest, no par value, unlimited number of shares authorized) | | $ | 1.00 | |
DWS Cash Investment Trust Class C Net Asset Value, offering and redemption price per share ($29,092,305 ÷ 29,090,616 outstanding shares of beneficial interest, no par value, unlimited number of shares authorized) | | $ | 1.00 | |
DWS Cash Investment Trust Class S Net Asset Value, offering and redemption price per share ($346,780,684 ÷ 346,760,237 outstanding shares of beneficial interest, no par value, unlimited number of shares authorized) | | $ | 1.00 | |
DWS Money Market Fund Net Asset Value, offering and redemption price per share ($1,038,458,977 ÷ 1,038,398,411 outstanding shares of beneficial interest, no par value, unlimited number of shares authorized) | | $ | 1.00 | |
The accompanying notes are an integral part of the financial statements.
| for the six months ended January 31, 2014 (Unaudited) | |
| Investment Income | |
Income: Interest | | $ | 1,635,278 | |
Expenses: Management fee | | | 1,813,107 | |
| Administration fee | | | 848,129 | |
| Services to shareholders | | | 1,372,150 | |
| Distribution and service fees | | | 418,910 | |
| Custodian fee | | | 24,632 | |
| Professional fees | | | 48,866 | |
| Reports to shareholders | | | 65,202 | |
| Registration fees | | | 48,954 | |
| Trustees' fees and expenses | | | 31,862 | |
| Other | | | 29,862 | |
| Total expenses before expense reductions | | | 4,701,674 | |
| Expense reductions | | | (3,145,647 | ) |
| Total expenses after expense reductions | | | 1,556,027 | |
| Net investment income | | | 79,251 | |
| Net realized gain (loss) from investments | | | 8,657 | |
| Net increase (decrease) in net assets resulting from operations | | $ | 87,908 | |
The accompanying notes are an integral part of the financial statements.
Statement of Changes in Net Assets | Increase (Decrease) in Net Assets | | Six Months Ended January 31, 2014 (Unaudited) | | | Year Ended July 31, 2013 | |
Operations: Net investment income | | $ | 79,251 | | | $ | 170,426 | |
Operations: Net investment income | | $ | 79,251 | | | $ | 170,426 | |
| Net realized gain (loss) | | | 8,657 | | | | 6,161 | |
| Net increase (decrease) in net assets resulting from operations | | | 87,908 | | | | 176,587 | |
Distributions to shareholders from: Net investment income: DWS Cash Investment Trust Class A | | | (10,111 | ) | | | (22,031 | ) |
| DWS Cash Investment Trust Class B | | | (59 | ) | | | (192 | ) |
| DWS Cash Investment Trust Class C | | | (1,484 | ) | | | (2,681 | ) |
| DWS Cash Investment Trust Class S | | | (16,902 | ) | | | (33,680 | ) |
| DWS Money Market Fund | | | (50,693 | ) | | | (111,691 | ) |
| Total distributions | | | (79,249 | ) | | | (170,275 | ) |
Fund share transactions: Proceeds from shares sold | | | 350,816,864 | | | | 813,238,507 | |
| Reinvestment of distributions | | | 73,495 | | | | 169,139 | |
| Payments for shares redeemed | | | (469,963,795 | ) | | | (1,040,778,573 | ) |
| Net increase (decrease) in net assets from Fund share transactions | | | (119,073,436 | ) | | | (227,370,927 | ) |
| Increase (decrease) in net assets | | | (119,064,777 | ) | | | (227,364,615 | ) |
| Net assets at beginning of period | | | 1,723,599,048 | | | | 1,950,963,663 | |
| Net assets at end of period (including undistributed net investment income of $20,579 and $20,577, respectively) | | $ | 1,604,534,271 | | | $ | 1,723,599,048 | |
The accompanying notes are an integral part of the financial statements.
| DWS Cash Investment Trust Class A | |
| | | Six Months Ended 1/31/14 (Unaudited) | | | Years Ended July 31, | |
| | 2013 | | | 2012 | | | 2011 | | | 2010 | | | 2009 | |
| Selected Per Share Data | |
| Net asset value, beginning of period | | $ | 1.00 | | | $ | 1.00 | | | $ | 1.00 | | | $ | 1.00 | | | $ | 1.00 | | | $ | 1.00 | |
Income (loss) from investment operations: Net investment income | | | .000 | *** | | | .000 | *** | | | .000 | *** | | | .000 | *** | | | .000 | *** | | | .009 | |
| Net realized gain (loss) | | | .000 | *** | | | .000 | *** | | | .000 | *** | | | .000 | *** | | | .000 | *** | | | .000 | *** |
| Total from investment operations | | | .000 | *** | | | .000 | *** | | | .000 | *** | | | .000 | *** | | | .000 | *** | | | .009 | |
Less distributions from: Net investment income | | | (.000 | )*** | | | (.000 | )*** | | | (.000 | )*** | | | (.000 | )*** | | | (.000 | )*** | | | (.009 | ) |
| Net realized gains | | | — | | | | — | | | | — | | | | — | | | | (.000 | )*** | | | — | |
| Total distributions | | | (.000 | )*** | | | (.000 | )*** | | | (.000 | )*** | | | (.000 | )*** | | | (.000 | )*** | | | (.009 | ) |
| Net asset value, end of period | | $ | 1.00 | | | $ | 1.00 | | | $ | 1.00 | | | $ | 1.00 | | | $ | 1.00 | | | $ | 1.00 | |
Total Return (%)a | | | .01 | ** | | | .01 | | | | .01 | | | | .02 | | | | .03 | | | | .91 | |
| Ratios to Average Net Assets and Supplemental Data | |
| Net assets, end of period ($ millions) | | | 189 | | | | 211 | | | | 237 | | | | 230 | | | | 223 | | | | 218 | |
| Ratio of expenses before expense reductions (%) | | | .85 | * | | | .86 | | | | .83 | | | | .83 | | | | .86 | | | | .81 | |
| Ratio of expenses after expense reductions (%) | | | .18 | * | | | .26 | | | | .28 | | | | .32 | | | | .35 | | | | .77 | |
| Ratio of net investment income (%) | | | .01 | * | | | .01 | | | | .01 | | | | .01 | | | | .01 | | | | .96 | |
a Total return would have been lower had certain expenses not been reduced. * Annualized ** Not annualized *** Amount is less than $.0005. | |
| DWS Cash Investment Trust Class B | |
| | | Six Months Ended 1/31/14 (Unaudited) | | | Years Ended July 31, | |
| | 2013 | | | 2012 | | | 2011 | | | 2010 | | | 2009 | |
| Selected Per Share Data | |
| Net asset value, beginning of period | | $ | 1.00 | | | $ | 1.00 | | | $ | 1.00 | | | $ | 1.00 | | | $ | 1.00 | | | $ | 1.00 | |
Income (loss) from investment operations: Net investment income | | | .000 | *** | | | .000 | *** | | | .000 | *** | | | .000 | *** | | | .000 | *** | | | .004 | |
| Net realized gain (loss) | | | .000 | *** | | | .000 | *** | | | .000 | *** | | | .000 | *** | | | .000 | *** | | | .000 | *** |
| Total from investment operations | | | .000 | *** | | | .000 | *** | | | .000 | *** | | | .000 | *** | | | .000 | *** | | | (.004 | ) |
Less distributions from: Net investment income | | | (.000 | )*** | | | (.000 | )*** | | | (.000 | )*** | | | (.000 | )*** | | | (.000 | )*** | | | (.000 | )*** |
| Net realized gains | | | — | | | | — | | | | — | | | | — | | | | (.000 | )*** | | | — | |
| Total distributions | | | (.000 | )*** | | | (.000 | )*** | | | (.000 | )*** | | | (.000 | )*** | | | (.000 | )*** | | | (.004 | ) |
| Net asset value, end of period | | $ | 1.00 | | | $ | 1.00 | | | $ | 1.00 | | | $ | 1.00 | | | $ | 1.00 | | | $ | 1.00 | |
Total Return (%)a | | | .01 | ** | | | .01 | | | | .01 | | | | .02 | | | | .03 | | | | .45 | |
| Ratios to Average Net Assets and Supplemental Data | |
| Net assets, end of period ($ millions) | | | 1 | | | | 2 | | | | 3 | | | | 6 | | | | 11 | | | | 23 | |
| Ratio of expenses before expense reductions (%) | | | 1.67 | * | | | 1.60 | | | | 1.56 | | | | 1.58 | | | | 1.68 | | | | 1.56 | |
| Ratio of expenses after expense reductions (%) | | | .18 | * | | | .26 | | | | .28 | | | | .33 | | | | .37 | | | | 1.28 | |
| Ratio of net investment income (%) | | | .01 | * | | | .01 | | | | .01 | | | | .01 | | | | .01 | | | | .45 | |
a Total return would have been lower had certain expenses not been reduced. * Annualized ** Not annualized *** Amount is less than $.0005. | |
| DWS Cash Investment Trust Class C | |
| | | Six Months Ended 1/31/14 (Unaudited) | | | Years Ended July 31, | |
| | 2013 | | | 2012 | | | 2011 | | | 2010 | | | 2009 | |
| Selected Per Share Data | |
| Net asset value, beginning of period | | $ | 1.00 | | | $ | 1.00 | | | $ | 1.00 | | | $ | 1.00 | | | $ | 1.00 | | | $ | 1.00 | |
Income (loss) from investment operations: Net investment income | | | .000 | *** | | | .000 | *** | | | .000 | *** | | | .000 | *** | | | .000 | *** | | | .005 | |
| Net realized gain (loss) | | | .000 | *** | | | .000 | *** | | | .000 | *** | | | .000 | *** | | | .000 | *** | | | .000 | *** |
| Total from investment operations | | | .000 | *** | | | .000 | *** | | | .000 | *** | | | .000 | *** | | | .000 | *** | | | .005 | |
Less distributions from: Net investment income | | | (.000 | )*** | | | (.000 | )*** | | | (.000 | )*** | | | (.000 | )*** | | | (.000 | )*** | | | (.005 | ) |
| Net realized gains | | | — | | | | — | | | | — | | | | — | | | | (.000 | )*** | | | — | |
| Total distributions | | | (.000 | )*** | | | (.000 | )*** | | | (.000 | )*** | | | (.000 | )*** | | | (.000 | )*** | | | (.005 | ) |
| Net asset value, end of period | | $ | 1.00 | | | $ | 1.00 | | | $ | 1.00 | | | $ | 1.00 | | | $ | 1.00 | | | $ | 1.00 | |
Total Return (%)a | | | .01 | ** | | | .01 | | | | .01 | | | | .02 | | | | .03 | | | | .48 | |
| Ratios to Average Net Assets and Supplemental Data | |
| Net assets, end of period ($ millions) | | | 29 | | | | 30 | | | | 35 | | | | 26 | | | | 31 | | | | 42 | |
| Ratio of expenses before expense reductions (%) | | | 1.49 | * | | | 1.53 | | | | 1.50 | | | | 1.53 | | | | 1.59 | | | | 1.52 | |
| Ratio of expenses after expense reductions (%) | | | .18 | * | | | .26 | | | | .29 | | | | .32 | | | | .36 | | | | .22 | |
| Ratio of net investment income (%) | | | .01 | * | | | .01 | | | | .01 | | | | .01 | | | | .01 | | | | .51 | |
a Total return would have been lower had certain expenses not been reduced. * Annualized ** Not annualized *** Amount is less than $.0005. | |
| DWS Cash Investment Trust Class S | |
| | | Six Months Ended 1/31/14 (Unaudited) | | | Years Ended July 31, | |
| | 2013 | | | 2012 | | | 2011 | | | 2010 | | | 2009 | |
| Selected Per Share Data | |
| Net asset value, beginning of period | | $ | 1.00 | | | $ | 1.00 | | | $ | 1.00 | | | $ | 1.00 | | | $ | 1.00 | | | $ | 1.00 | |
Income (loss) from investment operations: Net investment income | | | .000 | *** | | | .000 | *** | | | .000 | *** | | | .000 | *** | | | .000 | *** | | | .012 | |
| Net realized gain (loss) | | | .000 | *** | | | .000 | *** | | | .000 | *** | | | .000 | *** | | | .000 | *** | | | .000 | *** |
| Total from investment operations | | | .000 | *** | | | .000 | *** | | | .000 | *** | | | .000 | *** | | | .000 | *** | | | .012 | |
Less distributions from: Net investment income | | | (.000 | )*** | | | (.000 | )*** | | | (.000 | )*** | | | (.000 | )*** | | | (.000 | )*** | | | (.012 | ) |
| Net realized gains | | | — | | | | — | | | | — | | | | — | | | | (.000 | )*** | | | — | |
| Total distributions | | | (.000 | )*** | | | (.000 | )*** | | | (.000 | )*** | | | (.000 | )*** | | | (.000 | )*** | | | (.012 | ) |
| Net asset value, end of period | | $ | 1.00 | | | $ | 1.00 | | | $ | 1.00 | | | $ | 1.00 | | | $ | 1.00 | | | $ | 1.00 | |
| Total Return (%) | | | .01 | a** | | | .01 | a | | | .01 | a | | | .02 | a | | | .03 | a | | | 1.20 | |
| Ratios to Average Net Assets and Supplemental Data | |
| Net assets, end of period ($ millions) | | | 347 | | | | 368 | | | | 392 | | | | 430 | | | | 464 | | | | 541 | |
| Ratio of expenses before expense reductions (%) | | | .54 | * | | | .53 | | | | .52 | | | | .51 | | | | .52 | | | | .49 | |
| Ratio of expenses after expense reductions (%) | | | .18 | * | | | .26 | | | | .28 | | | | .32 | | | | .36 | | | | .49 | |
| Ratio of net investment income (%) | | | .01 | * | | | .01 | | | | .01 | | | | .01 | | | | .01 | | | | 1.24 | |
a Total return would have been lower had certain expenses not been reduced. * Annualized ** Not annualized *** Amount is less than $.0005. | |
| DWS Money Market Fund | |
| | | Six Months Ended 1/31/14 (Unaudited) | | | Years Ended July 31, | |
| | 2013 | | | 2012 | | | 2011 | | | 2010 | | | 2009 | |
| Selected Per Share Data | |
| Net asset value, beginning of period | | $ | 1.00 | | | $ | 1.00 | | | $ | 1.00 | | | $ | 1.00 | | | $ | 1.00 | | | $ | 1.00 | |
Income (loss) from investment operations: Net investment income | | | .000 | *** | | | .000 | *** | | | .000 | *** | | | .000 | *** | | | .000 | *** | | | .013 | |
| Net realized gain (loss) | | | .000 | *** | | | .000 | *** | | | .000 | *** | | | .000 | *** | | | .000 | *** | | | .000 | *** |
| Total from investment operations | | | .000 | *** | | | .000 | *** | | | .000 | *** | | | .000 | *** | | | .000 | *** | | | .013 | |
Less distributions from: Net investment income | | | (.000 | )*** | | | (.000 | )*** | | | (.000 | )*** | | | (.000 | )*** | | | (.000 | )*** | | | (.013 | ) |
| Net realized gains | | | — | | | | — | | | | — | | | | — | | | | (.000 | )*** | | | — | |
| Total distributions | | | (.000 | )*** | | | (.000 | )*** | | | (.000 | )*** | | | (.000 | )*** | | | (.000 | )*** | | | (.013 | ) |
| Net asset value, end of period | | $ | 1.00 | | | $ | 1.00 | | | $ | 1.00 | | | $ | 1.00 | | | $ | 1.00 | | | $ | 1.00 | |
| Total Return (%) | | | .01 | a** | | | .01 | a | | | .01 | a | | | .02 | a | | | .03 | a | | | 1.26 | |
| Ratios to Average Net Assets and Supplemental Data | |
| Net assets, end of period ($ millions) | | | 1,038 | | | | 1,113 | | | | 1,284 | | | | 1,449 | | | | 1,821 | | | | 2,591 | |
| Ratio of expenses before expense reductions (%) | | | .48 | * | | | .46 | | | | .45 | | | | .45 | | | | .45 | | | | .44 | |
| Ratio of expenses after expense reductions (%) | | | .18 | * | | | .26 | | | | .28 | | | | .32 | | | | .36 | | | | .44 | |
| Ratio of net investment income (%) | | | .01 | * | | | .01 | | | | .01 | | | | .01 | | | | .01 | | | | 1.29 | |
a Total return would have been lower had certain expenses not been reduced. * Annualized ** Not annualized *** Amount is less than $.0005. | |
Notes to Financial Statements (Unaudited)
A. Organization and Significant Accounting Policies
DWS Money Market Prime Series (the "Fund") is a diversified series of DWS Money Funds (the "Trust"), which is registered under the Investment Company Act of 1940, as amended (the "1940 Act"), as an open-end management investment company organized as a Massachusetts business trust.
The Fund offers multiple classes of shares which provide investors with different purchase options: DWS Cash Investment Trust Class A shares are offered to investors without an initial sales charge but are subject to the applicable sales charge if exchanged into Class A shares of another DWS Investments Fund. DWS Cash Investment Trust Class B shares of the Fund are closed to new purchases, except exchanges or the reinvestment of dividends or other distributions. DWS Cash Investment Trust Class B shares were offered to investors without an initial sales charge and are subject to higher ongoing expenses than DWS Cash Investment Trust Class A shares and a contingent deferred sales charge payable upon certain redemptions. DWS Cash Investment Trust Class B shares automatically convert to DWS Cash Investment Trust Class A shares six years after issuance. DWS Cash Investment Trust Class C shares are offered to investors without an initial sales charge but are subject to higher ongoing expenses than DWS Cash Investment Trust Class A shares and a contingent deferred sales charge payable upon certain redemptions within one year of purchase. DWS Cash Investment Trust Class C shares do not automatically convert into another class. DWS Money Market Fund and DWS Cash Investment Trust Class S shares are not subject to initial or contingent deferred sales charges. DWS Cash Investment Trust Class S shares are only available to a limited group of investors.
Investment income, realized gains and losses, and certain fund-level expenses and expense reductions, if any, are borne pro rata on the basis of relative net assets by the holders of all classes of shares, except that each class bears certain expenses unique to that class such as distribution and service fees, services to shareholders and certain other class-specific expenses. Differences in class-level expenses may result in payment of different per share dividends by class. All shares of the Fund have equal rights with respect to voting subject to class-specific arrangements.
The Fund's financial statements are prepared in accordance with accounting principles generally accepted in the United States of America, which require the use of management estimates. Actual results could differ from those estimates. The policies described below are followed consistently by the Fund in the preparation of their financial statements.
Security Valuation. Various inputs are used in determining the value of the Fund's investments. These inputs are summarized in three broad levels. Level 1 includes quoted prices in active markets for identical securities. Level 2 includes other significant observable inputs (including quoted prices for similar securities, interest rates, prepayment speeds and credit risk). Level 3 includes significant unobservable inputs (including the Fund's own assumptions in determining the fair value of investments). The level assigned to the securities valuations may not be an indication of the risk or liquidity associated with investing in those securities.
The Fund values all securities utilizing the amortized cost method permitted in accordance with Rule 2a-7 under the 1940 Act and certain conditions therein. Under this method, which does not take into account unrealized capital gains or losses on securities, an instrument is initially valued at its cost and thereafter assumes a constant accretion/ amortization rate to maturity of any discount or premium. Securities held by the Fund are reflected as Level 2 because the securities are valued at amortized cost (which approximates fair value) and, accordingly, the inputs used to determine value are not quoted prices in an active market.
Disclosure about the classification of fair value measurements is included in a table following the Fund's Investment Portfolio.
Repurchase Agreements. The Fund may enter into repurchase agreements, under the terms of a Master Repurchase Agreement, with certain banks and broker/dealers whereby the Fund, through its custodian or a sub-custodian bank, receives delivery of the underlying securities, the amount of which at the time of purchase and each subsequent business day is required to be maintained at such a level that the market value is equal to at least the principal amount of the repurchase price plus accrued interest. The custodian or another designated sub-custodian bank holds the collateral in a separate account until the agreement matures. If the value of the securities falls below the principal amount of the repurchase agreement plus accrued interest, the financial institution deposits additional collateral by the following business day. If the financial institution either fails to deposit the required additional collateral or fails to repurchase the securities as agreed, the Fund has the right to sell the securities and recover any resulting loss from the financial institution. If the financial institution enters into bankruptcy, the Fund's claims on the collateral may be subject to legal proceedings.
As of January 31, 2014, the Fund had investments in repurchase agreements with a gross value of $97,500,000. The value of the related collateral exceeded the value of the repurchase agreements at period end. The detail of the related collateral is included in the footnotes following the Fund's Investment Portfolio.
Federal Income Taxes. The Fund's policy is to comply with the requirements of the Internal Revenue Code, as amended, which are applicable to regulated investment companies, and to distribute all of its taxable income to its shareholders.
The Fund has reviewed the tax positions for the open tax years as of July 31, 2013 and has determined that no provision for income tax is required in the Fund's financial statements. The Fund's federal tax returns for the prior three fiscal years remain open subject to examination by the Internal Revenue Service.
Distribution of Income and Gains. Net investment income of the Fund is declared as a daily dividend and is distributed to shareholders monthly. The Fund may take into account capital gains and losses in its daily dividend declarations. The Fund may also make additional distributions for tax purposes if necessary.
Permanent book and tax basis differences relating to shareholder distributions will result in reclassifications to paid in capital. Temporary book and tax basis differences will reverse in a subsequent period. There were no significant book-to-tax differences for the Fund.
The tax character of current year distributions will be determined at the end of the current fiscal year.
Contingencies. In the normal course of business, the Fund may enter into contracts with service providers that contain general indemnification clauses. The Fund's maximum exposure under these arrangements is unknown as this would involve future claims that may be made against the Fund that have not yet been made. However, based on experience, the Fund expects the risk of loss to be remote.
Other. Investment transactions are accounted for on trade date. Interest income is recorded on the accrual basis. Realized gains and losses from investment transactions are recorded on an identified cost basis. All discounts and premiums are accreted/amortized for both tax and financial reporting purposes.
B. Related Parties
Management Agreement. Under the Investment Management Agreement with Deutsche Investment Management Americas Inc. ("DIMA" or the "Advisor"), an indirect, wholly owned subsidiary of Deutsche Bank AG, the Advisor directs the investments of the Fund in accordance with their investment objectives, policies and restrictions. The Advisor determines the securities, instruments and other contracts relating to investments to be purchased, sold or entered into by the Fund.
Under the Investment Management Agreement with the Advisor, the Fund pays a monthly management fee based on the Fund's average daily net assets, computed and accrued daily and payable monthly, at the following annual rates:
| First $215 million of the Fund's average daily net assets | | | .400 | % |
| Next $335 million of such net assets | | | .275 | % |
| Next $250 million of such net assets | | | .200 | % |
| Next $800 million of such net assets | | | .150 | % |
| Next $800 million of such net assets | | | .140 | % |
| Next $800 million of such net assets | | | .130 | % |
| Over $3.2 billion of such net assets | | | .120 | % |
For the period from August 1, 2013 through September 30, 2014 (through November 30, 2014 for DWS Cash Investment Trust Class A), the Advisor has contractually agreed to waive its fees and/or reimburse certain operating expenses of the Fund to the extent necessary to maintain the operating expenses (excluding certain expenses such as extraordinary expenses, taxes, brokerage and interest) of each class as follows:
| DWS Cash Investment Trust Class A | .85% |
| DWS Cash Investment Trust Class B | 1.60% |
| DWS Cash Investment Trust Class C | 1.60% |
| DWS Cash Investment Trust Class S | .57% |
| DWS Money Market Fund | .57% |
In addition, the Advisor has agreed to voluntarily waive additional expenses. This waiver may be changed or terminated at any time without notice. Under this arrangement, the Advisor waived certain expenses on DWS Cash Investment Trust Class A, DWS Cash Investment Trust Class B, DWS Cash Investment Trust Class C, DWS Cash Investment Trust Class S and DWS Money Market Fund shares of the Fund.
For the six months ended January 31, 2014, the Advisor waived a portion of its management fee pursuant to the Investment Management Agreement aggregating $1,593,385, and the amount charged aggregated $219,722, which was equivalent to an annualized effective rate of 0.03% of the Fund's average daily net assets.
Administration Fee. Pursuant to an Administrative Services Agreement, DIMA provides most administrative services to the Fund. For all services provided under the Administrative Services Agreement, the Fund pays the Advisor an annual fee ("Administration Fee") of 0.10% of the Fund's average daily net assets, computed and accrued daily and payable monthly. For the six months ended January 31, 2014, the Administration Fee was $848,129, of which $138,101 is unpaid.
Service Provider Fees. DWS Investments Service Company ("DISC"), an affiliate of the Advisor, is the transfer agent, dividend-paying agent and shareholder service agent for the Fund. Pursuant to a sub-transfer agency agreement among DISC and DST Systems, Inc. ("DST"), DISC has delegated certain transfer agent, dividend-paying agent and shareholder service agent functions to DST. DISC compensates DST out of the shareholder servicing fee it receives from the Fund. For the six months ended January 31, 2014, the amounts charged to the Fund by DISC were as follows:
| Services to Shareholders | | Total Aggregated | | | Waived | |
| DWS Cash Investment Trust Class A | | $ | 232,383 | | | $ | 232,383 | |
| DWS Cash Investment Trust Class B | | | 1,816 | | | | 1,816 | |
| DWS Cash Investment Trust Class C | | | 16,265 | | | | 16,265 | |
| DWS Cash Investment Trust Class S | | | 299,835 | | | | 299,835 | |
| DWS Money Market Fund | | | 557,515 | | | | 557,515 | |
| | | $ | 1,107,814 | | | $ | 1,107,814 | |
In addition, for the six months ended January 31, 2014, the Advisor agreed to reimburse the Fund $13,163, $8,175, $433, $2,505 and $1,262 of sub-recordkeeping expenses for DWS Money Market Fund, DWS Cash Investment Trust Class A, DWS Cash Investment Trust Class B, DWS Cash Investment Trust Class C and DWS Cash Investment Trust Class S, respectively.
Distribution and Service Fees. Under the Fund's DWS Cash Investment Trust Class B and DWS Cash Investment Trust Class C 12b-1 Plans, DWS Investments Distributors, Inc. ("DIDI"), an affiliate of the Advisor, receives a fee ("Distribution Fee") of 0.75% of average daily net assets of each of DWS Cash Investment Trust Class B and DWS Cash Investment Trust Class C shares. In accordance with the Fund's Underwriting and Distribution Services Agreement, DIDI enters into related selling group agreements with various firms at various rates for sales of DWS Cash Investment Trust Class B and DWS Cash Investment Trust Class C shares. For the six months ended January 31, 2014, the Distribution Fee was as follows:
| Distribution Fee | | Total Aggregated | | | Waived | |
| DWS Cash Investment Trust Class B | | $ | 5,731 | | | $ | 5,731 | |
| DWS Cash Investment Trust Class C | | | 114,957 | | | | 114,957 | |
| | | $ | 120,688 | | | $ | 120,688 | |
In addition, DIDI provides information and administrative services for a fee ("Service Fee") to DWS Cash Investment Trust Class A, DWS Cash Investment Trust Class B, and DWS Cash Investment Trust Class C shareholders at an annual rate of up to 0.25% of average daily net assets for each such class. DIDI in turn has various agreements with financial services firms that provide these services and pays these fees based upon the assets of shareholder accounts the firms service. For the six months ended January 31, 2014, the Service Fee was as follows:
| Service Fee | | Total Aggregated | | | Waived | | | Annualized Effective Rate | |
| DWS Cash Investment Trust Class A | | $ | 257,997 | | | $ | 257,997 | | | | .00 | % |
| DWS Cash Investment Trust Class B | | | 1,906 | | | | 1,906 | | | | .00 | % |
| DWS Cash Investment Trust Class C | | | 38,319 | | | | 38,319 | | | | .00 | % |
| | | $ | 298,222 | | | $ | 298,222 | | | | | |
Contingent Deferred Sales Charge. DIDI receives any contingent deferred sales charge ("CDSC") from DWS Cash Investment Trust Class B share redemptions occurring within six years of purchase and DWS Cash Investment Trust Class C share redemptions occurring within one year of purchase. There is no such charge upon redemption of any share appreciation or reinvested dividends. The CDSC is based on declining rates ranging from 4% to 1% for DWS Cash Investment Trust Class B and 1% for DWS Cash Investment Trust Class C, of the value of the shares redeemed. For the six months ended January 31, 2014, the CDSC for DWS Cash Investment Trust Class B and DWS Cash Investment Trust Class C shares aggregated $2,952 and $1,110, respectively. A deferred sales charge of up to 0.85% is assessed on certain redemptions of DWS Cash Investment Trust Class A shares. For the six months ended January 31, 2014, DIDI received $1,643 for Class A shares.
Typesetting and Filing Service Fees. Under an agreement with DIMA, DIMA is compensated for providing typesetting and certain regulatory filing services to the Fund. For the six months ended January 31, 2014, the amount charged to the Fund by DIMA included in the Statement of Operations under "reports to shareholders" aggregated $11,290, of which $718 is unpaid.
Trustees' Fees and Expenses. The Fund paid retainer fees to each Trustee not affiliated with the Advisor, plus specified amounts to the Board Chairperson and Vice Chairperson and to each committee Chairperson.
C. Line of Credit
The Fund and other affiliated funds (the "Participants") share in a $375 million revolving credit facility provided by a syndication of banks. The Fund may borrow for temporary or emergency purposes, including the meeting of redemption requests that otherwise might require the untimely disposition of securities. The Participants are charged an annual commitment fee which is allocated based on net assets, among each of the Participants. Interest is calculated at a rate per annum equal to the sum of the Federal Funds Rate plus 1.25 percent plus if LIBOR exceeds the Federal Funds Rate the amount of such excess. The Fund may borrow up to a maximum of 33 percent of its net assets under the agreement. The Fund had no outstanding loans at January 31, 2014.
D. Share Transactions
The following table summarizes share and dollar activity in the Fund:
| | | Six Months Ended January 31, 2014 | | | Year Ended July 31, 2013 | |
| | | Shares | | | Dollars | | | Shares | | | Dollars | |
| Shares sold | |
| DWS Cash Investment Trust Class A | | | 64,120,308 | | | $ | 64,120,308 | | | | 147,735,671 | | | $ | 147,735,671 | |
| DWS Cash Investment Trust Class B | | | 365,410 | | | | 365,410 | | | | 343,703 | | | | 343,703 | |
| DWS Cash Investment Trust Class C | | | 14,233,809 | | | | 14,233,809 | | | | 38,087,028 | | | | 38,087,028 | |
| DWS Cash Investment Trust Class S | | | 65,436,482 | | | | 65,436,482 | | | | 146,368,458 | | | | 146,368,458 | |
| DWS Money Market Fund | | | 206,247,177 | | | | 206,247,177 | | | | 480,703,647 | | | | 480,703,647 | |
| Account Maintenance Fees | | | — | | | | 413,678 | | | | — | | | | — | |
| | | | | | | $ | 350,816,864 | | | | | | | $ | 813,238,507 | |
| Shares issued to shareholders in reinvestment of distributions | |
| DWS Cash Investment Trust Class A | | | 10,109 | | | $ | 10,109 | | | | 21,935 | | | $ | 21,935 | |
| DWS Cash Investment Trust Class B | | | 451 | | | | 451 | | | | 192 | | | | 192 | |
| DWS Cash Investment Trust Class C | | | 1,452 | | | | 1,452 | | | | 2,509 | | | | 2,509 | |
| DWS Cash Investment Trust Class S | | | 10,875 | | | | 10,875 | | | | 33,474 | | | | 33,474 | |
| DWS Money Market Fund | | | 50,608 | | | | 50,608 | | | | 111,029 | | | | 111,029 | |
| | | | | | | $ | 73,495 | | | | | | | $ | 169,139 | |
| Shares redeemed | |
| DWS Cash Investment Trust Class A | | | (86,228,573 | ) | | $ | (86,228,573 | ) | | | (174,038,128 | ) | | $ | (174,038,128 | ) |
| DWS Cash Investment Trust Class B | | | (721,498 | ) | | | (721,498 | ) | | | (1,946,423 | ) | | | (1,946,423 | ) |
| DWS Cash Investment Trust Class C | | | (15,235,847 | ) | | | (15,235,847 | ) | | | (43,164,392 | ) | | | (43,164,392 | ) |
| DWS Cash Investment Trust Class S | | | (86,487,016 | ) | | | (86,487,016 | ) | | | (170,353,899 | ) | | | (170,353,899 | ) |
| DWS Money Market Fund | | | (281,290,861 | ) | | | (281,290,861 | ) | | | (651,275,731 | ) | | | (651,275,731 | ) |
| | | | | | | $ | (469,963,795 | ) | | | | | | $ | (1,040,778,573 | ) |
| Net increase (decrease) | |
| DWS Cash Investment Trust Class A | | | (22,098,156 | ) | | $ | (22,098,156 | ) | | | (26,280,522 | ) | | $ | (26,280,522 | ) |
| DWS Cash Investment Trust Class B | | | (355,637 | ) | | | (355,637 | ) | | | (1,602,528 | ) | | | (1,602,528 | ) |
| DWS Cash Investment Trust Class C | | | (1,000,586 | ) | | | (1,000,586 | ) | | | (5,074,855 | ) | | | (5,074,855 | ) |
| DWS Cash Investment Trust Class S | | | (21,039,659 | ) | | | (21,039,659 | ) | | | (23,951,967 | ) | | | (23,951,967 | ) |
| DWS Money Market Fund | | | (74,993,076 | ) | | | (74,993,076 | ) | | | (170,461,055 | ) | | | (170,461,055 | ) |
| Account Maintenance Fees | | | — | | | | 413,678 | | | | — | | | | — | |
| | | | | | | $ | (119,073,436 | ) | | | | | | $ | (227,370,927 | ) |
Information About Your Fund's Expenses
As an investor, you incur two types of costs: ongoing expenses and transaction costs. Ongoing expenses include management fees, distribution and service (12b-1) fees and other Fund expenses. Examples of transaction costs include account maintenance fees, which are not shown in this section. The following tables are intended to help you understand your ongoing expenses (in dollars) of investing in the Fund and to help you compare these expenses with the ongoing expenses of investing in other mutual funds. In the most recent six-month period, the Fund limited these expenses; had it not done so, expenses would have been higher. The example in the table is based on an investment of $1,000 invested at the beginning of the six-month period and held for the entire period (August 1, 2013 to January 31, 2014).
The tables illustrate your Fund's expenses in two ways:
—Actual Fund Return. This helps you estimate the actual dollar amount of ongoing expenses (but not transaction costs) paid on a $1,000 investment in the Fund using the Fund's actual return during the period. To estimate the expenses you paid over the period, simply divide your account value by $1,000 (for example, an $8,600 account value divided by $1,000 = 8.6), then multiply the result by the number in the "Expenses Paid per $1,000" line under the share class you hold.
— Hypothetical 5% Fund Return. This helps you to compare your Fund's ongoing expenses (but not transaction costs) with those of other mutual funds using the Fund's actual expense ratio and a hypothetical rate of return of 5% per year before expenses. Examples using a 5% hypothetical fund return may be found in the shareholder reports of other mutual funds. The hypothetical account values and expenses may not be used to estimate the actual ending account balance or expenses you paid for the period.
Please note that the expenses shown in these tables are meant to highlight your ongoing expenses only and do not reflect any transaction costs. The "Expenses Paid per $1,000" line of the tables is useful in comparing ongoing expenses only and will not help you determine the relative total expense of owning different funds. Subject to certain exceptions, an account maintenance fee of $20.00 assessed once per calendar year for DWS Cash Investment Trust Class A, DWS Cash Investment Trust Class B, DWS Cash Investment Trust Class C and DWS Cash Investment Trust Class S shares may apply for accounts with balances less than $10,000. This fee is not included in these tables. If it was, the estimate of expenses paid for these shares during the period would be higher, and account value during the period would be lower, by this amount.
Expenses and Value of a $1,000 Investment for the six months ended January 31, 2014 (Unaudited) | |
| Actual Fund Return | | DWS Cash Investment Trust Class A | | | DWS Cash Investment Trust Class B | | | DWS Cash Investment Trust Class C | | | DWS Cash Investment Trust Class S | | | DWS Money Market Fund | |
| Beginning Account Value 8/1/13 | | $ | 1,000.00 | | | $ | 1,000.00 | | | $ | 1,000.00 | | | $ | 1,000.00 | | | $ | 1,000.00 | |
| Ending Account Value 1/31/14 | | $ | 1,000.05 | | | $ | 1,000.05 | | | $ | 1,000.05 | | | $ | 1,000.05 | | | $ | 1,000.05 | |
| Expenses Paid per $1,000* | | $ | .91 | | | $ | .91 | | | $ | .91 | | | $ | .91 | | | $ | .91 | |
| Hypothetical 5% Fund Return | | DWS Cash Investment Trust Class A | | | DWS Cash Investment Trust Class B | | | DWS Cash Investment Trust Class C | | | DWS Cash Investment Trust Class S | | | DWS Money Market Fund | |
| Beginning Account Value 8/1/13 | | $ | 1,000.00 | | | $ | 1,000.00 | | | $ | 1,000.00 | | | $ | 1,000.00 | | | $ | 1,000.00 | |
| Ending Account Value 1/31/14 | | $ | 1,024.30 | | | $ | 1,024.30 | | | $ | 1,024.30 | | | $ | 1,024.30 | | | $ | 1,024.30 | |
| Expenses Paid per $1,000* | | $ | .92 | | | $ | .92 | | | $ | .92 | | | $ | .92 | | | $ | .92 | |
* Expenses are equal to the Fund's annualized expense ratio for each share class, multiplied by the average account value over the period, multiplied by 184 (the number of days in the most recent six-month period), then divided by 365.
| Annualized Expense Ratios | DWS Cash Investment Trust Class A | DWS Cash Investment Trust Class B | DWS Cash Investment Trust Class C | DWS Cash Investment Trust Class S | DWS Money Market Fund |
| DWS Money Market Prime Series | .18% | .18% | .18% | .18% | .18% |
For more information, please refer to the Fund's prospectus.
For an analysis of the fees associated with an investment in the Fund or similar funds, please refer to http://apps.finra.org/fundanalyzer/1/fa.aspx.
Money Market Fund Reform
In June 2013, the SEC proposed money market fund reform intended to address perceived systemic risks associated with money market funds and to improve transparency for money market fund investors. The Financial Stability Oversight Council (FSOC), a board of U.S. regulators established by the Dodd-Frank Act, had also previously proposed similar recommendations for money market fund reform. If one or more of the SEC or FSOC proposals for money market fund reform were to be adopted in the future, such regulatory action may affect the fund's operations and/or return potential.
Advisory Agreement Board Considerations and Fee Evaluation
The Board of Trustees approved the renewal of DWS Money Market Prime Series' investment management agreement (the "Agreement") with Deutsche Investment Management Americas Inc. ("DIMA") in September 2013.
In terms of the process that the Board followed prior to approving the Agreement, shareholders should know that:
— In September 2013, all but one of the Fund's Trustees were independent of DIMA and its affiliates.
— The Trustees met frequently during the past year to discuss fund matters and dedicated a substantial amount of time to contract review matters. Over the course of several months, the Board's Contract Committee, in coordination with the Board's Fixed Income and Asset Allocation Oversight Committee, reviewed comprehensive materials received from DIMA, independent third parties and independent counsel. These materials included an analysis of the Fund's performance, fees and expenses, and profitability compiled by a fee consultant retained by the Fund's Independent Trustees (the "Fee Consultant"). The Board also received extensive information throughout the year regarding performance of the Fund.
— The Independent Trustees regularly meet privately with their independent counsel to discuss contract review and other matters. In addition, the Independent Trustees were also advised by the Fee Consultant in the course of their review of the Fund's contractual arrangements and considered a comprehensive report prepared by the Fee Consultant in connection with their deliberations.
— In connection with reviewing the Agreement, the Board also reviewed the terms of the Fund's Rule 12b-1 plan, distribution agreement, administrative services agreement, transfer agency agreement and other material service agreements.
— Based on its evaluation of the information provided, the Contract Committee presented its findings and recommendations to the Board. The Board then reviewed the Contract Committee's findings and recommendations.
In connection with the contract review process, the Contract Committee and the Board considered the factors discussed below, among others. The Board also considered that DIMA and its predecessors have managed the Fund since its inception, and the Board believes that a long-term relationship with a capable, conscientious advisor is in the best interests of the Fund. The Board considered, generally, that shareholders chose to invest or remain invested in the Fund knowing that DIMA managed the Fund, and that the Agreement was approved by the Fund's shareholders. DIMA is part of Deutsche Bank AG, a major global banking institution that is engaged in a wide range of financial services. The Board believes that there are advantages to being part of a global asset management business that offers a wide range of investing expertise and resources, including hundreds of portfolio managers and analysts with research capabilities in many countries throughout the world.
As part of the contract review process, the Board carefully considered the fees and expenses of each DWS fund overseen by the Board in light of the fund's performance. In many cases, this led to a negotiation with DIMA of lower expense caps as part of the 2012 and 2013 contract review processes than had previously been in place. As part of these negotiations, the Board indicated that it would consider relaxing these new lower caps in future years following sustained improvements in performance, among other considerations.
In June 2012, Deutsche Bank AG ("DB"), DIMA's parent company, announced that DB would combine its Asset Management (of which DIMA was a part) and Wealth Management divisions. DB has advised the Independent Trustees that the U.S. asset management business is a critical and integral part of DB, and that it has, and will continue to, reinvest a significant portion of the substantial savings it expects to realize by combining its Asset Management and Wealth Management divisions into the new Asset and Wealth Management ("AWM") division, including ongoing enhancements to its investment capabilities. DB also has confirmed its commitment to maintaining strong legal and compliance groups within the AWM division.
While shareholders may focus primarily on fund performance and fees, the Fund's Board considers these and many other factors, including the quality and integrity of DIMA's personnel and such other issues as back-office operations, fund valuations, and compliance policies and procedures.
Nature, Quality and Extent of Services. The Board considered the terms of the Agreement, including the scope of advisory services provided under the Agreement. The Board noted that, under the Agreement, DIMA provides portfolio management services to the Fund and that, pursuant to a separate administrative services agreement, DIMA provides administrative services to the Fund. The Board considered the experience and skills of senior management and investment personnel, the resources made available to such personnel, the ability of DIMA to attract and retain high-quality personnel, and the organizational depth and stability of DIMA. The Board reviewed the Fund's performance over short-term and long-term periods and compared those returns to various agreed-upon performance measures, including a peer universe compiled by the Fee Consultant using information supplied by iMoneyNet, an independent fund data service. The Board also noted that it has put into place a process of identifying "Focus Funds" (e.g., funds performing poorly relative to their benchmark or a peer universe compiled by an independent fund data service), and receives more frequent reporting and information from DIMA regarding such funds, along with DIMA's remedial plans to address underperformance. The Board believes this process is an effective manner of identifying and addressing underperforming funds. Based on the information provided, the Board noted that for the one- and three-year periods ended December 31, 2012, the Fund's gross performance (DWS Cash Investment Trust Class A shares) was in the 1st quartile of the applicable iMoneyNet universe (the 1st quartile being the best performers and the 4th quartile being the worst performers).
Fees and Expenses. The Board considered the Fund's investment management fee schedule, operating expenses and total expense ratios, and comparative information provided by Lipper Inc. ("Lipper") and the Fee Consultant regarding investment management fee rates paid to other investment advisors by similar funds (1st quartile being the most favorable and 4th quartile being the least favorable). With respect to management fees paid to other investment advisors by similar funds, the Board noted that the contractual fee rates paid by the Fund, which include a 0.10% fee paid to DIMA under the Fund's administrative services agreement, were lower than the median (1st quartile) of the applicable Lipper peer group (based on Lipper data provided as of December 31, 2012). Based on Lipper data provided as of December 31, 2012, the Board noted that the Fund's total (net) operating expenses were higher than the median of the applicable Lipper expense universe for the following share classes: DWS Cash Investment Trust Class A shares (4th quartile), DWS Cash Investment Trust Class B shares (4th quartile), DWS Cash Investment Trust Class C shares (4th quartile), DWS Cash Investment Trust Class S shares (4th quartile) and DWS Money Market Fund shares (4th quartile). The Board considered the Fund's management fee rate as compared to fees charged by DIMA to comparable funds and considered differences between the Fund and the comparable funds. The Board also considered how the Fund's total (net) operating expenses compared to the total (net) operating expenses of a more customized peer group selected by Lipper (based on such factors as asset size). The Board noted the expense limitations agreed to by DIMA. The Board also noted the significant voluntary fee waivers implemented by DIMA to ensure the Fund maintained a positive yield.
The information considered by the Board as part of its review of management fees included information regarding fees charged by DIMA and its affiliates to similar institutional accounts and to similar funds offered primarily to European investors ("DWS Europe funds"), in each case as applicable. The Board observed that advisory fee rates for institutional accounts generally were lower than the management fees charged by similarly managed DWS U.S. mutual funds ("DWS Funds"), but also took note of the differences in services provided to DWS Funds as compared to institutional accounts. In the case of DWS Europe funds, the Board observed that fee rates for DWS Europe funds generally were higher than for similarly managed DWS Funds, but noted that differences in the types of services provided to DWS Funds relative to DWS Europe funds made it difficult to compare such fees.
On the basis of the information provided, the Board concluded that management fees were reasonable and appropriate in light of the nature, quality and extent of services provided by DIMA.
Profitability. The Board reviewed detailed information regarding revenues received by DIMA under the Agreement. The Board considered the estimated costs and pre-tax profits realized by DIMA from advising the DWS Funds, as well as estimates of the pre-tax profits attributable to managing the Fund in particular. The Board also received information regarding the estimated enterprise-wide profitability of DWS and its affiliates with respect to all fund services in totality and by fund. The Board and the Fee Consultant reviewed DIMA's methodology in allocating its costs to the management of the Fund. Based on the information provided, the Board concluded that the pre-tax profits realized by DIMA in connection with the management of the Fund were not unreasonable. The Board also reviewed information regarding the profitability of certain similar investment management firms. The Board noted that while information regarding the profitability of such firms is limited (and in some cases is not necessarily prepared on a comparable basis), DIMA and its affiliates' overall profitability with respect to the DWS fund complex (after taking into account distribution and other services provided to the funds by DIMA and its affiliates) was lower than the overall profitability levels of many comparable firms for which such data was available.
Economies of Scale. The Board considered whether there are economies of scale with respect to the management of the Fund and whether the Fund benefits from any economies of scale. The Board noted that the Fund's management fee schedule includes fee breakpoints. The Board concluded that the Fund's fee schedule represents an appropriate sharing between the Fund and DIMA of such economies of scale as may exist in the management of the Fund at current asset levels.
Other Benefits to DIMA and Its Affiliates. The Board also considered the character and amount of other incidental benefits received by DIMA and its affiliates, including any fees received by DIMA for administrative services provided to the Fund and any fees received by an affiliate of DIMA for distribution services. The Board also considered benefits to DIMA related to brokerage and soft-dollar allocations, including allocating brokerage to pay for research generated by parties other than the executing broker dealers, which pertain primarily to funds investing in equity securities, along with the incidental public relations benefits to DIMA related to DWS Funds advertising and cross-selling opportunities among DIMA products and services. The Board concluded that management fees were reasonable in light of these fallout benefits.
Compliance. The Board considered the significant attention and resources dedicated by DIMA to documenting and enhancing its compliance processes in recent years. The Board noted in particular (i) the experience and seniority of both DIMA's chief compliance officer and the Fund's chief compliance officer; (ii) the large number of DIMA compliance personnel; and (iii) the substantial commitment of resources by DIMA and its affiliates to compliance matters.
Based on all of the information considered and the conclusions reached, the Board unanimously determined that the continuation of the Agreement is in the best interests of the Fund. In making this determination, the Board did not give particular weight to any single factor identified above. The Board considered these factors over the course of numerous meetings, certain of which were in executive session with only the Independent Trustees and their independent counsel present. It is possible that individual Trustees may have weighed these factors differently in reaching their individual decisions to approve the continuation of the Agreement.
Account Management Resources | |
| For More Information | | The automated telephone system allows you to access personalized account information and obtain information on other DWS funds using either your voice or your telephone keypad. Certain account types within DWS Cash Investment Trust Class A, DWS Cash Investment Trust Class B, DWS Cash Investment Trust Class C and DWS Cash Investment Trust Class S also have the ability to purchase, exchange or redeem shares using this system. For more information, contact your financial advisor. You may also access our automated telephone system or speak with a Shareholder Service representative by calling: (800) 728-3337 |
| Web Site | | dws-investments.com View your account transactions and balances, trade shares, monitor your asset allocation, subscribe to fund and account updates by e-mail, and change your address, 24 hours a day. Obtain prospectuses and applications, blank forms, interactive worksheets, news about DWS funds, retirement planning information, and more. |
| Written Correspondence | | Deutsche Asset & Wealth Management PO Box 219151 Kansas City, MO 64121-9151 |
| Proxy Voting | | The fund's policies and procedures for voting proxies for portfolio securities and information about how the fund voted proxies related to its portfolio securities during the 12-month period ended June 30 are available on our Web site — dws-investments.com (click on "proxy voting"at the bottom of the page) — or on the SEC's Web site — sec.gov. To obtain a written copy of the fund's policies and procedures without charge, upon request, call us toll free at (800) 728-3337. |
| Portfolio Holdings | | Following the fund's fiscal first and third quarter-end, a complete portfolio holdings listing is filed with the SEC on Form N-Q. In addition, each month, information about the fund and its portfolio holdings is filed with the SEC on Form N-MFP. The SEC delays the public availability of the information filed on Form N-MFP for 60 days after the end of the reporting period included in the filing. These forms will be available on the SEC's Web site at sec.gov, and they may also be reviewed and copied at the SEC's Public Reference Room in Washington, D.C. Information on the operation of the SEC's Public Reference Room may be obtained by calling (800) SEC-0330. The fund's portfolio holdings are also posted on dws-investments.com from time to time. Please see the fund's current prospectus for more information. |
| Principal Underwriter | | If you have questions, comments or complaints, contact: DWS Investments Distributors, Inc. 222 South Riverside Plaza Chicago, IL 60606-5808 (800) 621-1148 |
| Investment Management | | Deutsche Investment Management Americas Inc. ("DIMA" or the "Advisor"), which is part of Deutsche Asset & Wealth Management, is the investment advisor for the fund. DIMA and its predecessors have more than 80 years of experience managing mutual funds and DIMA provides a full range of investment advisory services to both institutional and retail clients. DIMA is an indirect, wholly owned subsidiary of Deutsche Bank AG. Deutsche Bank AG is a major global banking institution engaged in a wide variety of financial services, including investment management, retail, private and commercial banking, investment banking and insurance. Deutsche Asset & Wealth Management is the retail brand name in the U.S. for the wealth management and asset management activities of Deutsche Bank AG and DIMA. Deutsche Asset & Wealth Management is committed to delivering the investing expertise, insight and resources of this global investment platform to American investors. |
| | Nasdaq Symbol | CUSIP Number | Fund Number |
| DWS Money Market Fund | KMMXX | 23339A 101 | 6 |
| DWS Cash Investment Trust Class A | DOAXX | 23339A 408 | 421 |
| DWS Cash Investment Trust Class B | DOBXX | 23339A 507 | 621 |
| DWS Cash Investment Trust Class C | DOCXX | 23339A 606 | 721 |
| DWS Cash Investment Trust Class S | DOSXX | 23339A 705 | 2021 |
| FACTS | | What Does Deutsche Asset & Wealth Management Do With Your Personal Information? |
| Why? | | Financial companies choose how they share your personal information. Federal law gives consumers the right to limit some but not all sharing. Federal law also requires us to tell you how we collect, share and protect your personal information. Please read this notice carefully to understand what we do. |
| What? | | The types of personal information we collect and share can include: — Social Security number — Account balances — Purchase and transaction history — Bank account information — Contact information such as mailing address, e-mail address and telephone number |
| How? | | All financial companies need to share customers' personal information to run their everyday business. In the section below, we list the reasons financial companies can share their customers' personal information, the reasons Deutsche Asset & Wealth Management chooses to share and whether you can limit this sharing. |
| Reasons we can share your personal information | | Does Deutsche Asset & Wealth Management share? | Can you limit this sharing? |
For our everyday business purposes — such as to process your transactions, maintain your account(s), respond to court orders or legal investigations | | Yes | No |
For our marketing purposes — to offer our products and services to you | | Yes | No |
| For joint marketing with other financial companies | | No | We do not share |
For our affiliates' everyday business purposes — information about your transactions and experiences | | No | We do not share |
For our affiliates' everyday business purposes — information about your creditworthiness | | No | We do not share |
| For non-affiliates to market to you | | No | We do not share |
| Questions? | | Call (800) 728-3337 or e-mail us at service@dws.com | |
| | | | | |
| Who we are |
| Who is providing this notice? | | DWS Investments Distributors, Inc.; Deutsche Investment Management Americas Inc.; DeAM Investor Services, Inc.; DWS Trust Company; the DWS Funds |
| What we do |
| How does Deutsche Asset & Wealth Management protect my personal information? | | To protect your personal information from unauthorized access and use, we use security measures that comply with federal law. These measures include computer safeguards and secured files and buildings. |
| How does Deutsche Asset & Wealth Management collect my personal information? | | We collect your personal information, for example. When you: — open an account — give us your contact information — provide bank account information for ACH or wire transactions — tell us where to send money — seek advice about your investments |
| Why can't I limit all sharing? | | Federal law gives you the right to limit only — sharing for affiliates' everyday business purposes — information about your creditworthiness — affiliates from using your information to market to you — sharing for non-affiliates to market to you State laws and individual companies may give you additional rights to limit sharing. |
| Definitions |
| Affiliates | | Companies related by common ownership or control. They can be financial or non-financial companies. Our affiliates include financial companies with the DWS or Deutsche Bank ("DB") name, such as DB AG Frankfurt and DB Alex Brown. |
| Non-affiliates | | Companies not related by common ownership or control. They can be financial and non-financial companies. Non-affiliates we share with include account service providers, service quality monitoring services, mailing service providers and verification services to help in the fight against money laundering and fraud. |
| Joint marketing | | A formal agreement between non-affiliated financial companies that together market financial products or services to you. Deutsche Asset & Wealth Management does not jointly market. |
| | | | Rev. 09/2013 |

Pursuant to the requirements of the Securities Exchange Act of 1934 and the Investment Company Act of 1940, the registrant has duly caused this report to be signed on its behalf by the undersigned, thereunto duly authorized.
Pursuant to the requirements of the Securities Exchange Act of 1934 and the Investment Company Act of 1940, this report has been signed below by the following persons on behalf of the registrant and in the capacities and on the dates indicated.