SECURITIES AND EXCHANGE COMMISSION
Washington, D.C. 20549
FORM 10-K
S ANNUAL REPORT PURSUANT TO SECTION 13 OR 15(d) OF THE SECURITIES EXCHANGE ACT OF 1934 - For the fiscal year ended December 31, 2006
Commission file number 1-3919
Keystone Consolidated Industries, Inc. |
| (Exact name of Registrant as specified in its charter) |
Delaware | | 37-0364250 |
(State or other jurisdiction of Incorporation or organization) | | (IRS Employer Identification No.) |
5430 LBJ Freeway, Suite 1740, Three Lincoln Centre, Dallas, Texas | | 75240-2697 |
| (Address of principal executive offices) | | (Zip Code) |
Registrant’s telephone number, including area code: | (972) 458-0028 |
| | |
Securities registered pursuant to Section 12(b) of the Act: | None. |
Securities registered pursuant to Section 12(g) of the Act: | Title of each class |
| | Common Stock, $.01 par value |
Indicate by check mark:
If the Registrant is a well-known seasoned issuer, as defined in Rule 405 of the Securities Act. Yes £ No S
If the Registrant is not required to file reports pursuant to Section 13 or Section 15(d) of the Act. Yes £ No S
Whether the Registrant (1) has filed all reports required to be filed by Section 13 or 15(d) of the Securities Exchange Act of 1934 during the preceding 12 months and (2) has been subject to such filing requirements for the past 90 days. Yes S No £
If disclosure of delinquent filers pursuant to Item 405 of Regulation S-K is not contained herein, and will not be contained, to the best of registrant’s knowledge, in definitive proxy or information statements incorporated by reference in Part III of this Form 10-K or any amendment to this Form 10-K. S
Whether the Registrant is a large accelerated filer, an accelerated filer or a non-accelerated filer (as defined in Rule 12b-2 of the Act).
Large accelerated filer £ Accelerated filer £ Non-accelerated filer S.
Whether the Registrant is a shell company (as defined in Rule 12b-2 of the Exchange Act). Yes £ No S
The aggregate market value of the 4,900,000 shares of voting stock held by nonaffiliates of the Registrant, as of June 30, 2006 (the last business day of the Registrant’s most-recently completed second fiscal quarter), was approximately $11,025,000.
Whether the Registrant has filed all documents and reports required to be filed by Section 12, 13 or 15(d) of the Securities Exchange Act of 1934 subsequent to the distribution of securities under a plan confirmed by a court. Yes S No £
As of March 28, 2007, 10,000,000 shares of common stock were outstanding.
Documents incorporated by reference
The information required by Part III is incorporated by reference from the Registrant’s definitive proxy statement to be filed with the Commission pursuant to Regulation 14A not later than 120 days after the end of the fiscal year covered by this report.
PART I
This Annual Report contains forward-looking statements within the meaning of the Private Securities Litigation Reform Act of 1995. Statements in this Annual Report on Form 10-K that are not historical in nature are forward-looking and are not statements of fact. Statements found in this report including, but not limited to, statements found in Item 1 - "Business," Item 1A - "Risk Factors," Item 3 - "Legal Proceedings," Item 7 - "Management’s Discussion and Analysis of Financial Condition and Results of Operations" and Item 7A - "Quantitative and Qualitative Disclosures About Market Risk," are forward-looking statements that represent our beliefs and assumptions based on currently available information. In some cases you can identify these forward-looking statements by the use of words such as "believes," "intends," "may," "should," "could," "anticipates," "expected" or comparable terminology, or by discussions of strategies or trends. Although we believe the expectations reflected in such forward-looking statements are reasonable, we do not know if these expectations will be correct. Forward-looking statements by their nature involve substantial risks and uncertainties that could significantly impact expected results. Actual future results could differ materially from those predicted. While it is not possible to identify all factors, we continue to face many risks and uncertainties. Among the factors that could cause our actual future results to differ materially from those described herein are the risks and uncertainties discussed in this Annual Report and those described from time to time in our other filings with the Securities and Exchange Commission (“SEC”) including, but not limited to, the following:
| · | Future supply and demand for our products (including cyclicality thereof), |
| · | Customer inventory levels, |
| · | Changes in raw material and other operating costs (such as ferrous scrap and energy), |
| · | The possibility of labor disruptions, |
| · | General global economic and political conditions, |
| · | Competitive products and substitute products, |
| · | Customer and competitor strategies, |
| · | The impact of pricing and production decisions, |
| · | Environmental matters (such as those requiring emission and discharge standards for existing and new facilities), |
| · | Government regulations and possible changes therein, |
| · | Significant increases in the cost of providing medical coverage to employees, |
| · | The ultimate resolution of pending litigation, |
| · | International trade policies of the United States and certain foreign countries, |
| · | Operating interruptions (including, but not limited to, labor disputes, fires, explosions, unscheduled or unplanned downtime and transportation interruptions), |
| · | Our ability to renew or refinance credit facilities, and |
| · | Any possible future litigation. |
Should one or more of these risks materialize, if the consequences worsen, or if the underlying assumptions prove incorrect, actual results could differ materially from those currently forecasted or expected. We disclaim any intention or obligation to update or revise any forward-looking statement whether as a result of changes in information, future events or otherwise.
ITEM 1. BUSINESS.
Keystone Consolidated Industries, Inc. (“KCI”) is a leading manufacturer of steel fabricated wire products, welded wire reinforcement, coiled rebar, industrial wire and wire rod for the agricultural, industrial, construction, original equipment manufacturer and retail consumer markets, and we are one of the largest manufacturers of fabricated wire products in the United States based on tons shipped (112,000 tons in 2006). We are vertically integrated, converting substantially all of our fabricated wire products, welded wire reinforcement, coiled rebar and industrial wire from wire rod produced in our steel mini-mill. Our vertical integration has historically allowed us to benefit from the higher and more stable margins associated with fabricated wire products and welded wire reinforcement, as compared to wire rod, as well as from lower production costs of wire rod as compared to fabricators that purchase wire rod in the open market. Moreover, we believe our downstream fabricated wire products, welded wire reinforcement, coiled rebar and industrial wire businesses better insulate us from the effects of wire rod imports as compared to non-integrated wire rod producers.
Our operating segments are organized by our manufacturing facilities and include three reportable segments:
| · | Keystone Steel and Wire (“KSW”), located in Peoria, Illinois, operates an electric arc furnace mini-mill and manufactures and sells wire rod, industrial wire, nails, coiled rebar and fabricated wire products for agricultural, industrial, construction, commercial, original equipment manufacturers and retail consumer markets; |
| · | Engineered Wire Products (“EWP”), located in Upper Sandusky, Ohio, manufactures and sells welded wire reinforcement in both roll and sheet form that is utilized in concrete construction products including pipe, pre-cast boxes and applications for use in roadways, buildings and bridges; and |
| · | Keystone Wire Products (“KWP”), located in Sherman, Texas, manufactures and sells industrial wire and fabricated wire products for agricultural, industrial, construction, commercial, original equipment manufacturers and retail consumer markets. |
During the third quarter of 2006, we decided to relocate KWP’s industrial wire manufacturing process to KSW in order to eliminate duplicative costs. Additionally, we decided to discontinue our nail operations during the third quarter of 2006 as a result of lower cost foreign competition driving down selling prices, which eliminated the profitability of our nail business. By the end of the second quarter of 2007, all nail production should be phased out and the relocation of KWP’s industrial wire manufacturing operations should be complete.
For additional information about our segments see “Part II - Item 7. Management’s Discussion and Analysis of Financial Condition and Results of Operations” and Note 3 to our Consolidated Financial Statements.
We are the successor to Keystone Steel & Wire Company, which was founded in 1889. Contran Corporation owns 51.0% of our outstanding common stock at December 31, 2006. Substantially all of Contran's outstanding voting stock is held by trusts established for the benefit of certain children and grandchildren of Harold C. Simmons (for which Mr. Simmons is the sole trustee) or is held directly by Mr. Simmons or other persons or companies related to Mr. Simmons. Consequently, Mr. Simmons may be deemed to control Contran and us.
Unless otherwise indicated, references in this report to "we", "us" or "our" refer to KCI and its subsidiaries, taken as a whole.
Manufacturing
Overview
Our manufacturing operations consist of an electric arc furnace mini-mill, a rod mill and three wire and wire product fabrication facilities as outlined in our segment discussion above. The manufacturing process commences at KSW where ferrous scrap is loaded into an electric arc furnace, converted into molten steel and then transferred to a ladle refining furnace where chemistries and temperatures are monitored and adjusted to specifications prior to casting. The molten steel is transferred from the ladle refining furnace into a six-strand continuous casting machine which produces five-inch square strands referred to as billets that are cut to predetermined lengths. These billets, along with any billets purchased from outside suppliers, are then transferred to the adjoining rod mill.
Upon entering the rod mill, the billets are brought to rolling temperature in a reheat furnace and are fed to the rolling mill, where they are finished to a variety of diameters and specifications. After rolling, the wire rod is coiled and cooled. After cooling, the coiled wire rod passes through inspection stations for metallurgical, surface and diameter checks. Finished coils are compacted and tied, and either further processed into industrial wire, welded wire reinforcement, nails, coiled rebar and fabricated wire products at our wire and wire product fabrication facilities or shipped to wire rod customers.
While we do not maintain a significant "shelf" inventory of finished wire rod, we generally have on hand approximately a one-month supply of industrial wire, welded wire reinforcement, coiled rebar and fabricated wire products inventory which enables us to fill customer orders and respond to shifts in product demand.
Raw Materials and Energy
The primary raw material used in our operations is ferrous scrap. Our steel mill is located close to numerous sources of high density automobile, industrial and railroad ferrous scrap, all of which are currently readily available. We believe we are one of the largest recyclers of ferrous scrap in Illinois. The purchase of ferrous scrap is highly competitive and its price volatility is influenced by periodic shortages, export activity, freight costs, weather, and other conditions beyond our control. The cost of ferrous scrap can fluctuate significantly and product selling prices cannot always be adjusted, especially in the short-term, to recover the costs of increases in ferrous scrap prices. We have not entered into any long-term contracts for the purchase or supply of ferrous scrap; therefore, we are subject to the price fluctuation of ferrous scrap.
Our manufacturing processes consume large amounts of energy in the form of electricity and natural gas. During 2004, 2005 and 2006, we purchased electrical energy for KSW from a utility under an interruptible service contract which provided for more economical electricity rates but allowed the utility to refuse or interrupt power to KSW. During the past three years, the utility exercised their rights under the contract and periodically interrupted our power, which resulted in decreased production and increased costs associated with the related downtime. This agreement expired on December 31, 2006.
Deregulation of electricity in Illinois occurred on January 1, 2007. For 2007 and 2008, we have a firm uninterruptible contract for delivery of power. Under this new contract, on a daily basis, we are required to notify the utility of the amount of electricity we expect to consume on the next day, and the price we pay for this electricity is determined when we provide such notification based on the forecasted hourly energy market rate for the next day. Any difference between our forecasted consumption and actual consumption will be settled based on the actual hourly market rate. However, to allow us to avoid pricing fluctuations, the contract allows us to purchase blocks of power in the forward markets at our discretion at prices negotiated at the time of purchase. Overall, we expect these changes will result in higher energy costs for us in the future.
Employment
As of December 31, 2006, we employed approximately 1,100 people, some of whom are covered under collective bargaining agreements as follows:
| · | 800 are represented by the Independent Steel Workers’ Alliance at KSW under an agreement expiring in May 2009, |
| · | 30 are represented by the International Association of Machinists and Aerospace Workers (Local 1570) at KWP under an agreement expiring in October 2008, and |
| · | 60 are represented by Local Union #40, an Affiliate to the International Brotherhood of Teamsters' Chauffeurs Warehousemen and Helpers of America, AFL-CIO at EWP under an agreement expiring in November 2009. |
Products, Markets and Distribution
The following table sets forth certain information with respect to our product mix in each of the last three years.
| | | Year Ended December 31, | |
| | | 2004 | | 2005 | | 2006 | |
Product | | Percent of Tons Shipped | | Percent Of Sales | | Percent of Tons Shipped | | Percent of Sales | | Percent of Tons Shipped | | Percent of Sales | |
| | | | | | | | | | | | | | |
| Fabricated wire products | | | 22.6 | % | | 31.4 | % | | 19.2 | % | | 30.1 | % | | 16.5 | % | | 26.6 | % |
| Welded wire reinforcement | | | 13.8 | | | 16.3 | | | 13.6 | | | 17.2 | | | 10.0 | | | 13.5 | |
| Nails | | | 5.4 | | | 5.8 | | | 3.2 | | | 3.4 | | | 2.6 | | | 2.8 | |
| Industrial wire | | | 16.0 | | | 16.1 | | | 13.7 | | | 14.4 | | | 11.2 | | | 12.6 | |
| Coiled rebar | | | - | | | - | | | - | | | - | | | 0.2 | | | 0.1 | |
| Wire rod | | | 38.9 | | | 29.6 | | | 44.9 | | | 32.4 | | | 51.6 | | | 40.1 | |
| Billets | | | 3.3 | | | .8 | | | 5.4 | | | 2.5 | | | 7.9 | | | 4.3 | |
| | | | 100.0 | % | | 100.0 | % | | 100.0 | % | | 100.0 | % | | 100.0 | % | | 100.0 | % |
| | | | | | | | | | | | | | | | | | | | |
Fabricated Wire Products. We are one of the leading manufacturers in the United States of agricultural fencing, barbed wire, stockade panels and a variety of woven wire mesh, fabric and netting for agricultural, construction and industrial applications. These products are sold to agricultural, construction, industrial, consumer do-it-yourself and other end-user markets which in our opinion are typically less cyclical than many steel consuming end-use markets such as the automotive, construction, appliance and machinery manufacturing industries. We serve these markets through distributors, agricultural retailers, building supply centers and consumer do-it-yourself chains such as Tractor Supply Co., Lowe's Companies, Inc., and Ace Hardware Corporation. We believe our ability to service these customers with a wide range of fabricated wire products through multiple distribution locations provides a competitive advantage in accessing these growing and less cyclical markets. As part of our marketing strategy, we design merchandise packaging, and supportive product literature for marketing many of these products to the retail consumer market.
We also manufacture products for residential and commercial construction, including rebar ty wire and stucco netting. The primary customers for these products are construction contractors and building materials manufacturers and distributors.
We believe our fabricated wire products are less susceptible to the cyclical nature of the steel business than nails, industrial wire, coiled rebar or wire rod because the commodity-priced raw materials used in such products, such as ferrous scrap, represent a lower percentage of the total cost of such value-added products.
Welded Wire Reinforcement. We manufacture a wide variety of wire mesh rolls and sheets used to form wire reinforcement in concrete construction projects such as pipe, precast boxes and other applications, including use in roadways, buildings, and bridges. Our welded wire reinforcement customers include pipe manufacturers, culvert manufacturers, rebar fabricators, and steel reinforcing distributors. Like our fabricated wire products, we believe our welded wire reinforcement products are also less susceptible to the cyclical nature of the steel business than nails, industrial wire, coiled rebar or wire rod because the commodity-priced raw materials used in such products, such as ferrous scrap, represent a lower percentage of the total cost of such value-added products when compared to wire rod or other less value-added products.
Nails. We manufacture bulk and packaged nails and sell these nails primarily to construction contractors, building manufacturers and distributors and do-it-yourself retailers. During 2006, we sold approximately 17% of our nails through PrimeSource, Inc., one of the largest nail distributors in the United States, under PrimesSource’s Grip-Rite® label.
During 2006, we decided to discontinue our nail operations and we anticipate all nail production will be phased out by the end of the second quarter of 2007, after which we plan to sell our nail production equipment. The results of operations of our nail business is not material.
Industrial Wire. We are one of the largest manufacturers of industrial wire in the United States. We produce custom-drawn industrial wire in a variety of gauges, finishes and packages for further consumption by our fabricated wire products operations or for sale to industrial fabrication and original equipment manufacturer customers, who are generally not our competitors. Our industrial wire is used by customers in the production of a broad range of finished goods, including nails, coat hangers, barbecue grills, air conditioners, tools, containers, refrigerators and other appliances.
Coiled rebar. Several sizes of coiled rebar are produced at KSW’s rod mill. The coils are typically used by fabricators who will process the material as straightened and cut to length bars or fabricated shapes for specific reinforcement applications such as building and road construction.
Wire Rod. We produce primarily low carbon steel wire rod at KSW’s rod mill. Low carbon steel wire rod, with carbon content of up to 0.38%, is more easily shaped and formed than higher carbon wire rod and is suitable for a variety of applications where ease of forming is a consideration. High carbon steel wire rod, with carbon content of up to 0.65%, is used for high tensile wire applications as well as for furniture and bedding springs. During 2006, approximately 42% of the wire rod that we manufactured was used internally to produce industrial wire, nails, welded wire reinforcement and fabricated wire products. The remainder of our wire rod production was sold directly to producers of construction products, fabricated wire products and industrial wire, including products similar to those manufactured by us.
Billets. KSW’s annual permitted billet production capacity is 820,000 tons. However, since KSW’s rod production is constrained by the 750,000 ton capacity of its rod mill, we sell excess billets to producers of products manufactured from low carbon steel.
Trademarks
Many of our fencing and related wire products are marketed under our RED BRAND label, a widely recognized brand name in the agricultural fencing and construction marketplaces for more than 80 years. RED BRAND sales represented approximately 85% of fabricated wire products net sales in 2006. We also maintain other trademarks for various products that have been promoted in their respective markets.
Customers
Our customers are primarily in the Midwestern, Southwestern and Southeastern regions of the United States. Customers vary considerably by product and we believe our ability to offer a broad range of products represents a competitive advantage in servicing the diverse needs of our customers.
Our fabricated wire products, welded wire reinforcement, industrial wire and wire rod business is not dependent upon a single customer or a few customers, the loss of any one, or a few, would not have a material adverse effect on our business. The percentage of sales related to our ten largest customers and the percentage of sales related to the only customer that accounted for more than 10% of our net sales during 2004, 2005 and 2006 is set forth in the following table. The customer that accounted for more than 10% of our net sales during 2005 and 2006 was a different customer from the customer that accounted for more than 10% of our net sales during 2004.
| | 2004 | | 2005 | | 2006 |
| | % of Sales |
| | | | | | |
Ten largest customers | 48% | | 43% | | 44% |
| | | | | |
Single customer | 12% | | 11% | | 14% |
Seasonality
Historically, we have experienced greater sales and profits during the first half of the year due to the seasonality of sales in principal wire products markets, including the agricultural and construction markets.
Backlog
Our backlog of unfilled cancelable fabricated wire products, welded wire reinforcement, nails, industrial wire, coiled rebar and wire rod purchase orders, for delivery generally within three months, approximated $52.9 million and $25.8 million at December 31, 2005 and 2006, respectively. We do not believe backlog is a significant factor in our business, and we expect all of the backlog at December 31, 2006 will be shipped during 2007.
Industry and Competition
The fabricated wire products, welded wire reinforcement, industrial wire, coiled rebar and wire rod businesses in the United States are highly competitive and are comprised primarily of several large mini-mill wire rod producers, many small independent wire companies and a few large diversified wire producers. We also face significant foreign competition. Lower wage rates and other costs in foreign countries have resulted in market prices that significantly reduce and sometimes eliminate the profitability of certain products, which resulted in our recent decision to exit the nail business.
We believe we are well positioned to compete effectively due to:
| · | the breadth of our fabricated wire products, welded wire reinforcement and industrial wire offerings; |
| · | our ability to service diverse geographic and product markets; and |
| · | the relatively low cost of our internal supply of wire rod. |
We believe our facilities are well located to serve markets throughout the continental United States, with principal markets located in the Midwestern, Southwestern and Southeastern regions. Close proximity to our customer base provides us with certain advantages over foreign and certain domestic competition including reduced shipping costs, improved customer service and shortened delivery times.
Fabricated Wire Products and Industrial Wire. Our principal competitors in the fabricated wire products and industrial wire markets are Leggett and Platt, Deacero, Oklahoma Steel and Wire and Davis Wire Corporation. Competition in the fabricated wire products and industrial wire markets is based on a variety of factors, including channels of distribution, price, delivery performance, product quality, service, and brand name preference. Our RED BRAND label has been a widely recognized brand name in the agricultural fencing and construction marketplaces for more than 80 years. Additionally, we believe higher transportation costs and the lack of local distribution centers tend to limit foreign producers' penetration of our principal fabricated wire products and industrial wire markets, but there can be no assurance this will continue to be the case.
Welded Wire Reinforcement. Our principal competitors in our welded wire reinforcement markets are Insteel Wire Products, Inc., of Mount Airy, NC and MMI Products, Inc., of Houston Texas. We also face competition from smaller regional manufacturers and wholesalers of welded wire reinforcement products. We believe EWP’s superior products, renowned customer service and industry leading sales force distinguish EWP from its competitors. In addition, we believe our vertical integration enhances EWP’s ability to compete more effectively in the market as EWP can rely on a more stable supply of wire rod. Competitors of EWP have at times faced raw material shortages that have negatively impacted their daily production capability and delivery reliability.
Coiled Rebar. The principal competitors for our assortment of coiled rebar include Gerdau Ameristeel, Rocky Mountain Steel, and Nucor Connecticut. The primary competitive factors of the coiled rebar business are delivered price, coil size and product quality. Due to our location, we believe we can effectively serve fabricators in the Midwestern region of the United States.
Wire Rod and Billets. Since wire rod and billets are commodity steel products, we believe the domestic market for these items is more competitive than the fabricated wire products and industrial wire markets, and price is the primary competitive factor. Among our principal domestic competitors in these markets are Gerdau Ameristeel and Rocky Mountain Steel. We also face significant foreign competition. The domestic steel industry continues to experience consolidation. During the last seven years, we and the majority of our major domestic competitors have either filed for protection under Federal bankruptcy laws and discontinued operations, were acquired, or reduced or completely shut-down their operations. We believe these shut-downs or production curtailments represent a significant decrease in estimated domestic annual capacity. However, worldwide overcapacity in the steel industry continues to exist and imports of wire rod in recent years have increased significantly.
Environmental Matters
Our production facilities are affected by a variety of environmental laws and regulations, including laws governing the discharge of water pollutants and air contaminants, the generation, transportation, storage, treatment and disposal of solid wastes and hazardous substances and the handling of toxic substances, including certain substances used in, or generated by, our manufacturing operations. Many of these laws and regulations require permits to operate the facilities to which they pertain. Denial, revocation, suspension or expiration of such permits could impair the ability of the affected facility to continue operations.
We record liabilities related to environmental issues at such time as information becomes available and is sufficient to support a reasonable estimate of a range of probable loss. If we are unable to determine that a single amount in an estimated range is more likely, the minimum amount of the range is recorded. Costs of future expenditures for environmental remediation obligations are not discounted to their present value due to the uncertain timeframe of payout. Recoveries of environmental remediation costs from other parties are recorded as assets when their receipt is deemed probable.
We believe our current operating facilities are in material compliance with all presently applicable Federal, State and local laws regulating the discharge of materials into the environment, or otherwise relating to the protection of the environment. Environmental legislation and regulations have changed rapidly in recent years and we may be subject to increasingly stringent environmental standards in the future.
Information in Note 9 to our Consolidated Financial Statements is incorporated herein by reference.
Acquisition and Restructuring Activities
We routinely compare our liquidity requirements against our estimated future cash flows. As a result of this process, we have in the past and may in the future seek to raise additional capital, refinance or restructure indebtedness, consider the sale of interests in subsidiaries, business units or other assets, or take a combination of such steps or other steps, to increase liquidity, reduce indebtedness and fund future activities. Such activities have in the past and may in the future involve related companies. From time to time, we and related entities also evaluate the restructuring of ownership interests among our subsidiaries and related companies and expect to continue this activity in the future and may in connection with such activities, consider issuing additional equity securities and increasing our indebtedness.
Acquisition and Amendment of Credit Facility in 2007
During the first quarter of 2007, we formed Calumet, which acquired substantially all of the real estate, equipment, and inventory of CaluMetals, Inc. CaluMetals, located in Chicago Heights, Illinois, is a manufacturer of merchant and special bar quality products and special sections in carbon and alloy steel grades, offering a broad range of value added products for use in agricultural, cold drawn, construction, industrial chain, service centers, and transportation applications. CaluMetals’ product mix consists primarily of angles, flats, channels, rounds and squares. CaluMetals’ sold approximately 17,000 tons of product during 2006 for $10.9 million. Calumetals’ primary raw material is billets. We expect to provide the majority of the acquired operations billet requirements from KSW, which has sufficient capacity to supply the needed billets. This acquisition will allow us to further enhance our vertical integration strategy by converting more of our current billet production into higher-margin products. We will report the results of the acquired operations in a new segment.
We also completed an amendment to our current credit facility during the first quarter of 2007, increasing the total committed facility amount from $80.0 million to $100.0 million, in part to finance the CaluMetals acquisition.
Restructuring
In an effort to reduce costs, in September 2006 we decided to relocate KWP’s industrial wire operations to KSW and to discontinue the production of nails at KSW. By the end of the second quarter of 2007, all nail production should be phased out and the relocation of KWP’s industrial wire manufacturing operations should be completed. We will continue to analyze the profitability of our operations and make operating decisions accordingly.
Bankruptcy
On February 26, 2004, we and five of our then direct and indirect subsidiaries filed for voluntary protection under Chapter 11 of the Federal Bankruptcy Code. We attributed the need to reorganize to weaknesses in product selling prices over the preceding several years, unprecedented increases in ferrous scrap costs, our primary raw material, and significant liquidity needs to service retiree medical costs. These problems substantially limited our liquidity and undermined our ability to obtain sufficient debt or equity capital to operate as a going concern.
We emerged from bankruptcy protection on August 31, 2005. Significant provisions of our plan of reorganization included greater employee participation in healthcare costs and a permanent reduction in healthcare related payments to retirees. Before the bankruptcy can be completely closed, all claims must be adjudicated. As of December 31, 2006, only two significant claims had not been adjudicated: (i) an environmental claim against Sherman Wire Company (“SWC”), one of our pre-petition wholly-owned subsidiaries, and (ii) an employment related claim against KCI.
Upon emergence from Chapter 11, certain operating assets and existing operations of SWC were sold at fair market value (fair market value and book value both approximated $2.0 million) to us, which were then used to form and operate KWP. SWC was also reorganized and the proceeds of the operating assets sold to us, liquidation of SWC’s remaining real estate assets (book value approximates $1.6 million), and other funds (including $4.0 million of proceeds from a settlement agreement with a former insurer received in the second quarter of 2006, as discussed in Notes 2 and 10 of our Consolidated Financial Statements) will be distributed, on a pro rata basis, to SWC’s pre-petition unsecured creditors when all claims have been finally adjudicated. The total amount ultimately distributed to SWC’s pre-petition unsecured creditors will be limited to the lesser of (i) the total of the claims granted by the U.S. Bankruptcy Court for the Eastern District of Wisconsin in Milwaukee (the “Court”) and (ii) the total funds available to be distributed.
Availability of Company Reports Filed with the SEC
Our fiscal year is 52 or 53 weeks and ends on the last Sunday in December. We will provide without charge copies of this Annual Report on Form 10-K for the year ended December 31, 2006, any copies of our Quarterly Reports on Form 10-Q for 2006 and any Current Reports on Form 8-K for 2005 and 2006, and any amendments thereto, upon written request. Such requests should be directed to the attention of the Corporate Secretary at our address on the cover page of this Form 10-K.
The general public may read and copy any materials we file with the SEC at the SEC’s Public Reference Room at 100 F Street, NE, Washington, DC 20549, and may obtain information on the operation of the Public Reference Room by calling the SEC at 1-800-SEC-0330. We are an electronic filer, and the SEC maintains an Internet website at www.sec.gov that contains reports, proxy and information statements, and other information regarding issuers that file electronically with the SEC, including us.
ITEM 1A. RISK FACTORS.
Listed below are certain risk factors associated with our businesses. In addition to the potential effect of these risk factors discussed below, any risk factor which could result in reduced earnings or operating losses, or reduced liquidity, could in turn adversely affect our ability to service our liabilities or adversely affect the quoted market prices for our publicly-traded securities.
Our leverage may impair our financial condition or limit our ability to operate our businesses. We currently have a significant amount of debt. As of December 31, 2006, our total consolidated debt was approximately $76.4 million. Our level of debt could have important consequences to our stockholders and creditors, including:
| · | making it more difficult for us to satisfy our obligations with respect to our liabilities; |
| · | increasing our vulnerability to adverse general economic and industry conditions; |
| · | requiring a portion of our cash flow from operations be used for the payment of interest on our debt, therefore reducing our ability to use our cash flow to fund working capital, capital expenditures, acquisitions and general corporate requirements; |
| · | limiting our ability to obtain additional financing to fund future working capital, capital expenditures, acquisitions and general corporate requirements; |
| · | limiting our flexibility in planning for, or reacting to, changes in our business and the industry in which we operate; and |
| · | placing us at a competitive disadvantage relative to other less-leveraged competitors. |
We are vulnerable to business downturns. We incur significant ongoing costs for plant and equipment and pay substantial benefits for both current and retired employees. As such, we remain vulnerable to business downturns and increases in costs.
Demand for, and prices of, certain of our products are cyclical and we may experience prolonged depressed market conditions for our products, which may result in reduced earnings or operating losses. A significant portion of our revenues are attributable to sales of products into the agricultural and construction industries. These two industries themselves are cyclical and changes in those industries’ economic conditions can significantly impact our earnings and operating cash flows. This may result in reduced earnings or operating losses. Events that could adversely affect the agricultural and construction industries include, among other things, short and long-term weather patterns, interest rates and embargos placed by foreign countries on U.S. agricultural products. Such events could significantly decrease our operating results and our business and financial condition could significantly decline.
We sell the majority of our products in mature and highly competitive industries and face price pressures in the markets in which we operate, which may result in reduced earnings or operating losses. The markets in which we operate our businesses are highly competitive. Competition is based on a number of factors, such as price, product quality and service. Some of our competitors may be able to drive down prices for our products because the competitors’ costs are lower than our costs. In addition, some of our competitors’ financial, technological and other resources may be greater than our resources, and such competitors may be better able to withstand changes in market conditions. Our competitors may be able to respond more quickly than we can to new or emerging technologies and changes in customer requirements. Further, consolidation of our competitors or customers in any of the industries in which we compete may result in reduced demand for our products. In addition, in some of our businesses new competitors could emerge by modifying their existing production facilities so they could manufacture products that compete with our products. The occurrence of any of these events could result in reduced earnings or operating losses.
Many of EWP’s products are ultimately used in infrastructure projects by local, State or Federal governments. Such projects are impacted by the availability of governmental funding for such projects. A decline in the availability of governmental funds for such projects could ultimately result in a decline in demand or selling prices of EWP’s products. Such a decline could result in reduced earnings or operating losses.
Wire rod imported into the U.S. continues at high levels. Global producers of wire rod are able to import their products into the U.S. with minimal tariffs and duties. Many of these global wire rod producers are able to produce wire rod at costs lower than us. As such, these wire rod imports are often able to be priced at lower levels than similar products manufactured by us. In addition, we believe certain foreign governments subsidize local wire rod producers. These events can adversely impact our shipment levels and pricing decisions and, as such, could result in reduced earnings or operating losses.
Higher costs or limited availability of ferrous scrap may decrease our liquidity. The number of sources for, and availability of, ferrous scrap, our primary raw material, is generally limited to the particular geographical region in which a facility is located. Should our suppliers not be able to meet their contractual obligations or should we be otherwise unable to obtain necessary ferrous scrap quantities, we may incur higher costs for ferrous scrap or may be required to reduce production levels, either of which may decrease our liquidity as we may be unable to offset such higher costs with increased selling prices for our products.
Our relationships with our union employees could deteriorate. At December 31, 2006, we employed approximately 1,100 persons in our various businesses of which approximately 78% are subject to collective bargaining or similar arrangements. A significant portion of these collective bargaining agreements are set to expire within the next three years. We may not be able to negotiate labor agreements with respect to these employees on satisfactory terms or at all. If our employees were to engage in a strike, work stoppage or other slowdown, we could experience a significant disruption of our operations or higher ongoing labor costs.
Our forecasted operating results for Calumet may not come to fruition. We believe a steady supply of billets, an upgrade of production equipment and a more intense selling initiative will result in operating income at Calumet. Although we believe the expectations used in our forecasts for Calumet are reasonable, forecasts by their nature involve substantial uncertainties that could significantly impact results. Actual results could differ materially from forecast resulting in operating losses at Calumet.
ITEM 1B. UNRESOLVED STAFF COMMENTS.
None.
ITEM 2. PROPERTIES.
Our principal executive offices are located in approximately 1,200 square feet of leased space at 5430 LBJ Freeway, Suite 1740, Dallas, Texas 75240-2697.
Our fabricated wire products, welded wire reinforcement, industrial wire, coiled rebar and wire rod production facilities utilize approximately 2.4 million square feet for manufacturing and office space, approximately 84% of which is located at our Peoria, Illinois facility.
The following table sets forth the location, size and general product types produced for each of our operating facilities, as of December 31, 2006, all of which are owned by us.
Facility Name | | Location | | Approximate Size (Square Feet) | | Products Produced | |
| | | | | | | | |
| Keystone Steel & Wire | | | Peoria, IL | | | 2,012,000 | | | Fabricated wire products, nails, industrial wire, coiled rebar and wire rod (1) | |
| Keystone Wire Products | | | Sherman, TX | | | 299,000 | | | Fabricated wire products and industrial wire (2) | |
| Engineered Wire Products | | | Upper Sandusky, OH | | | 79,000 | (3) | | Welded wire reinforcement | |
| | | | | | | | | | | |
| | | | | | | 2,390,000 | | | | |
(1) All nail production is expected to be phased out by the end of the second quarter of 2007.
(2) By the end of the second quarter of 2007, the relocation of KWP’s industrial wire manufacturing processes to KSW should be complete.
(3) During 2006, an expansion project at EWP commenced that will add 50,000 square feet of production facilities. The expansion project is expected to be completed during the second quarter of 2007.
We believe all of our facilities are well maintained and satisfactory for their intended purposes.
ITEM 3. LEGAL PROCEEDINGS.
On February 26, 2004, we and five of our then direct and indirect subsidiaries filed for voluntary protection under Chapter 11 of the Federal Bankruptcy Code. We filed our petitions in the U.S. Bankruptcy Court for the Eastern District of Wisconsin in Milwaukee. The Chapter 11 cases were consolidated for procedural purposes only and were jointly administered under the name FV Steel and Wire Company - Case No. 04-22421-SVK. Each of the filing companies continued to operate its business and manage its property as a debtor-in-possession. As a result of the Chapter 11 filings, litigation relating to pre-petition claims against the filing companies was stayed during the Chapter 11 proceedings. We emerged from Chapter 11 on August 31, 2005. Before the bankruptcy can be completely closed, all claims must be adjudicated. As of December 31, 2006, only two significant claims had not been adjudicated: (i) an environmental claim against SWC and (ii) an employment related claim against KCI.
We are also involved in various legal proceedings. Information required by this Item is included in Notes 2, 9 and 10 to our Consolidated Financial Statements, which information is incorporated herein by reference.
ITEM 4. SUBMISSION OF MATTERS TO A VOTE OF SECURITY HOLDERS.
None.
PART II
ITEM 5. MARKET FOR REGISTRANT'S COMMON EQUITY AND RELATED STOCKHOLDER MATTERS.
In connection with our emergence from Chapter 11, all of our outstanding common stock at August 31, 2005 was cancelled and we issued 10 million shares of a new issue of common stock. See Note 2 to our Consolidated Financial Statements. Prior to our emergence, our common stock was traded on the OTC Bulletin Board (Symbol: KESNQ.PK). Our common stock was not publicly traded from August 31, 2005 to June 23, 2006, on which date our common stock began trading again on the OTC Bulletin Board (Symbol: KYCN). As of March 27, 2007, we had approximately 1,146 holders of record of our common stock at a closing price of $17.50 according to Bloomberg. The following table sets forth the high and low closing per share sales prices for our common stock for the periods indicated, according to Bloomberg.
| | | High | | Low | |
| | | | | | |
Year ended December 31, 2006 | | | | | | | |
| | | | | | | | |
| First quarter | | | N/A | | | N/A | |
| Second quarter (April 1 to June 22) | | | N/A | | | N/A | |
| Second quarter (June 23 to June 30) | | $ | 2.25 | | $ | 2.00 | |
| Third quarter | | $ | 14.00 | | $ | 2.55 | |
| Fourth quarter | | $ | 18.50 | | $ | 11.70 | |
| | | | | | | | |
Year ended December 31, 2005 | | | | | | | |
| | | | | | | | |
| First quarter | | $ | .23 | | $ | .09 | |
| Second quarter | | $ | .17 | | $ | .08 | |
| Third quarter (July 1 to August 31) | | $ | .08 | | $ | .01 | |
| Third quarter (September 1 to September 30) | | | N/A | | | N/A | |
| Fourth quarter | | | N/A | | | N/A | |
| | | | | | | | |
We have not paid cash dividends on our common stock since 1977. Our current intention is to retain all earnings to fund working capital requirements, capital expenditures and scheduled debt repayments, and we do not anticipate paying divends on our common stock in the foreseeable future. In addition, we are subject to certain covenants under our primary credit facilities that restrict our ability to pay dividends, including a prohibition against the payment of cash dividends on our common stock without lender consent.
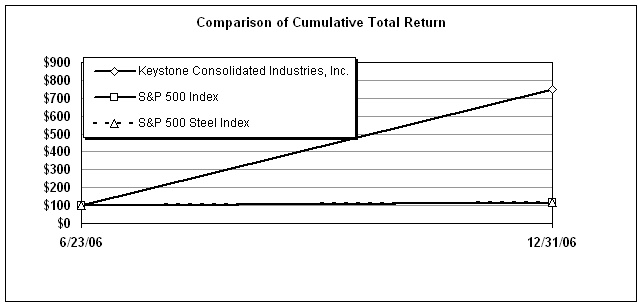
Performance Graph - Set forth below is a line graph comparing the change in our cumulative total stockholder return on our common stock against the cumulative total return of the S&P 500 Composite Stock Price Index and the S&P 500 Industrial Conglomerates Index for the period from June 23, 2006 through December 31, 2006. The graph shows the value at the December 31, 2006 assuming an original investment of $100 at June 23, 2006 and the reinvestment of dividends.
| | |
| | | June 23, 2006 | | December 31, 2006 | |
| | | | | | |
| Keystone common stock | | $ | 100 | | $ | 750 | |
| S&P 500 Index | | | 100 | | | 115 | |
| S&P Steel Index | | | 100 | | | 117 | |
ITEM 6. SELECTED FINANCIAL DATA.
The following selected consolidated financial data should be read in conjunction with our Consolidated Financial Statements and Item 7. "Management's Discussion And Analysis Of Financial Condition And Results Of Operations."
| | | Years ended December 31, | |
| | | 2002 | | 2003 | | 2004 | | 2005 | | 2006 | |
| | | (In thousands, except per share and per ton amounts) | |
| Statement of Operations Data: | | | | | | | | | | | | | | | | |
| Net sales | | $ | 334,835 | | $ | 306,671 | | $ | 364,335 | | $ | 367,545 | | $ | 440,540 | |
| Operating income (loss) | | | (7,699 | ) | | (31,446 | ) | | 26,641 | | | 22,718 | | | 80,963 | |
| | | | | | | | | | | | | | | | | |
| Defined benefit pension expense (credit) | | | (1,604 | ) | | 6,898 | | | (6,752 | ) | | (11,710 | ) | | (55,978 | ) |
| Other postretirement benefit expense (credit) | | | 14,260 | | | 17,503 | | | 20,909 | | | 8,885 | | | (8,297 | ) |
| Gain on cancellation of debt | | | - | | | - | | | - | | | 32,510 | | | - | |
| Gain on early extinguishment of debt | | | 54,739 | | | - | | | - | | | - | | | - | |
| Gain on legal settlement | | | - | | | - | | | 5,284 | | | - | | | - | |
| Reorganization costs | | | - | | | - | | | 11,158 | | | 10,308 | | | 679 | |
| Provision for income taxes | | | 21,622 | | | - | | | 1,379 | | | 430 | | | 17,055 | |
Cumulative effect of change in accounting principle (4) | | | 19,998 | | | - | | | - | | | - | | | - | |
| | | | | | | | | | | | | | | | | |
| Net income (loss) | | $ | 38,420 | | $ | (37,517 | ) | $ | 16,060 | | $ | 39,232 | | $ | 57,732 | |
Net income (loss) available for common shares (1) | | $ | 33,737 | | $ | (43,457 | ) | $ | 14,837 | | $ | 39,232 | | $ | 57,732 | |
| | | | | | | | | | | | | | | | | |
| Basic net income (loss) available for common shares per share | | $ | 3.35 | | $ | (4.32 | ) | $ | 1.47 | | $ | 4.12 | | $ | 5.77 | |
| Diluted net income (loss) available for common shares per share | | $ | 1.76 | | $ | (4.32 | ) | $ | .57 | | $ | 1.88 | | $ | 5.77 | |
Weighted average common and common equivalent shares outstanding (3): | | | | | | | | | | | | | | | | |
| Basic | | | 10,067 | | | 10,068 | | | 10,068 | | | 10,046 | | | 10,000 | |
| Diluted | | | 21,823 | | | 10,068 | | | 28,043 | | | 22,029 | | | 10,000 | |
Other Steel and Wire Products operating data: | | | | | | | | | | | | | | | | |
| Shipments (000 tons): | | | | | | | | | | | | | | | | |
| Fabricated wire products | | | 146 | | | 135 | | | 116 | | | 101 | | | 112 | |
| Welded wire reinforcement | | | 63 | | | 66 | | | 71 | | | 71 | | | 67 | |
| Nails | | | 74 | | | 53 | | | 28 | | | 17 | | | 18 | |
| Industrial wire | | | 96 | | | 91 | | | 82 | | | 72 | | | 75 | |
| Coiled rebar | | | - | | | - | | | - | | | - | | | 1 | |
| Wire rod | | | 287 | | | 252 | | | 200 | | | 236 | | | 349 | |
| Billets | | | 5 | | | 17 | | | 17 | | | 29 | | | 53 | |
| Total | | | 671 | | | 614 | | | 514 | | | 526 | | | 675 | |
Per-ton selling prices: | | | | | | | | | | | | | | | | |
| Fabricated wire products | | $ | 791 | | $ | 783 | | $ | 984 | | $ | 1,090 | | $ | 1,037 | |
| Welded wire reinforcement | | | 526 | | | 539 | | | 829 | | | 881 | | | 870 | |
| Nails | | | 592 | | | 558 | | | 759 | | | 742 | | | 692 | |
| Industrial wire | | | 448 | | | 452 | | | 709 | | | 731 | | | 726 | |
| Coiled rebar | | | - | | | - | | | - | | | - | | | 529 | |
| Wire rod | | | 304 | | | 314 | | | 539 | | | 503 | | | 500 | |
| Billets | | | 156 | | | 192 | | | 176 | | | 321 | | | 354 | |
| Steel and wire products in total | | | 482 | | | 479 | | | 707 | | | 696 | | | 645 | |
| | | | | | | | | | | | | | | | | |
| Average per-ton ferrous scrap purchase cost | | $ | 94 | | $ | 115 | | $ | 205 | | $ | 220 | | $ | 210 | |
| | | | | | | | | | | | | | | | | |
| Other Financial Data: | | | | | | | | | | | | | | | | |
Capital expenditures | | $ | 7,973 | | $ | 2,683 | | $ | 5,080 | | $ | 9,772 | | $ | 18,739 | |
| Depreciation and amortization | | | 17,396 | | | 16,461 | | | 15,812 | | | 15,745 | | | 15,222 | |
| | | As of December 31, | |
| | | 2002 | | 2003 | | 2004 | | 2005 | | 2006 | |
| | | (In thousands) | |
| Balance Sheet Data: | | | | | | | | | | | | | | | | |
Working capital (deficit) (2) | | $ | (41,790 | ) | $ | (90,210 | ) | $ | 11,910 | | $ | 36,373 | | $ | 31,776 | |
| Property, plant and equipment, net | | | 119,984 | | | 105,316 | | | 94,033 | | | 86,773 | | | 88,695 | |
Total assets(5) | | | 215,495 | | | 282,194 | | | 323,282 | | | 358,364 | | | 763,936 | |
| Total debt | | | 98,684 | | | 88,897 | | | 65,985 | | | 99,895 | | | 76,448 | |
Redeemable preferred stock (3) | | | 2,112 | | | 2,112 | | | 2,112 | | | - | | | - | |
Stockholders’ equity (deficit)(5) | | | (136,900 | ) | | (10,050 | ) | | 4,787 | | | 67,531 | | | 403,662 | |
| | (1) | Includes the effect of dividends on preferred stock of $4,683,000, $5,940,000 and $1,223,000 in 2002, 2003 and 2004, respectively. We discontinued accruing dividends on our preferred stock upon filing for Chapter 11 on February 26, 2004. |
| | (2) | Working capital (deficit) represents current assets minus current liabilities. |
| | (3) | All of our outstanding common and preferred stock at August 31, 2005 was cancelled in connection with our emergence from Chapter 11 on August 31, 2005, and at that time, we issued 10 million shares of a new issue of common stock. |
| | (4) | Upon adoption of Statement of Financial Accounting Standards (“SFAS”) No. 142, effective January 1, 2002, negative goodwill with a net book value of $20.0 million was eliminated as a cumulative effect of change in accounting principle. |
| | (5) | We adopted SFAS No. 158 effective December 31, 2006. See Note 14 to our Consolidated Financial Statements. |
ITEM 7. MANAGEMENT’S DISCUSSION AND ANALYSIS OF FINANCIAL CONDITION AND RESULTS OF OPERATIONS.
RESULTS OF OPERATIONS
Business Overview
We are a leading domestic manufacturer of steel fabricated wire products, welded wire reinforcement, coiled rebar, industrial wire and wire rod for the agricultural, industrial, construction, original equipment manufacturer and retail consumer markets and we are one of the largest manufacturers of fabricated wire products in the United States based on tons shipped (112,000 tons in 2006). We are vertically integrated, converting substantially all of our fabricated wire products, welded wire reinforcement, coiled rebar and industrial wire from wire rod produced in our steel mini-mill. Our vertical integration has historically allowed us to benefit from the higher and more stable margins associated with fabricated wire products and welded wire reinforcement as compared to wire rod, as well as from lower production costs of wire rod as compared to wire fabricators that purchase wire rod in the open market. Moreover, we believe our downstream fabricated wire products, welded wire reinforcement, coiled rebar and industrial wire businesses better insulate us from the effects of wire rod imports as compared to non-integrated wire rod producers.
The domestic wire rod industry continues to experience consolidation. During the last seven years, the majority of our major domestic competitors have either filed for protection under Federal bankruptcy laws and discontinued operations, were acquired, or reduced or completely shut-down their operations. We believe these shut-downs or production curtailments represent a significant decrease in domestic annual capacity. However, worldwide overcapacity in the steel industry continues to exist and imports of wire rod, certain fabricated wire products and nails in recent years have increased significantly.
On February 26, 2004, we and five of our direct and indirect subsidiaries filed for voluntary protection under Chapter 11 of the Federal Bankruptcy Code. We attributed the need to reorganize to weaknesses in product selling prices over the preceding several years, unprecedented increases in ferrous scrap costs, our primary raw material, and significant liquidity needs to service retiree medical costs. These problems substantially limited our liquidity and undermined our ability to obtain sufficient debt or equity capital to operate as a going concern. We emerged from bankruptcy protection on August 31, 2005. Significant provisions of our plan of reorganization included greater employee participation in healthcare costs and a permanent reduction in healthcare related payments to retirees. We continue to incur substantial employee benefits for both current and retired employees and significant ongoing costs for plant and equipment. As such, we are vulnerable to business downturns and increases in costs, and accordingly, routinely compare our liquidity requirements and capital needs against our estimated future operating cash flows.
Our profitability is primarily dependent on sales volume, per-ton selling prices, per-ton ferrous scrap cost, and energy costs. Additionally, because pension and OPEB expense or credits are unrelated to the operating activities of our business, we measure our overall performance using operating income before pension and OPEB credit or expense. Operating income before pension and OPEB credit or expense is a non-GAAP measure of profitability that is not in accordance with accounting principles generally accepted in the United States of America (“GAAP”) and it shall not be considered in isolation or as a substitute for a measure prepared in accordance with GAAP. A reconciliation of operating income as reported to operating income adjusted for pension and OPEB expense or credit is set forth in the following table.
| | | Years ended December 31, | |
| | | 2004 | | 2005 | | 2006 | |
| | | (In thousands) | |
| Operating income as reported | | $ | 26,641 | | $ | 22,718 | | $ | 80,963 | |
| Defined benefit pension credit | | | (6,752 | ) | | (11,710 | ) | | (55,978 | ) |
| OPEB expense (credit) | | | 20,909 | | | 8,885 | | | (8,297 | ) |
| Operating income before pension/OPEB | | $ | 40,798 | | $ | 19,893 | | $ | 16,688 | |
The decrease in operating income before pension and OPEB from 2004 to 2005 was primarily due to the following factors:
| · | increased costs for ferrous scrap; |
| · | increased costs for natural gas; and |
| · | increased advertising and marketing expenses resulting from our efforts to recapture the portion of the market that we lost during bankruptcy. |
The decrease in operating income before pension and OPEB from 2005 to 2006 was primarily due to the net effect of the following factors:
| · | lower overall per-ton selling prices in 2006; |
| · | increased conversion costs in 2006 resulting from production interruptions due to operating issues with our wire rod mill reheat furnace; |
| · | an extra week of operations as 2006 was a 53-week year as compared to a 52-week year in 2005; |
| · | lower costs for ferrous scrap in 2006; and |
| · | lower costs for natural gas in 2006. |
Outlook for 2007
We currently believe 2007 operating income before pension and OPEB will be higher than 2006 due primarily to the net effect of the following factors:
| · | lower shipment volume due to a 52-week year in 2007 as compared to a 53-week year in 2006, the decision to discontinue our nail business and the use of a higher percentage of our billets and wire rod in our downstream businesses, partially offset by increased shipment volumes of fabricated wire products and welded wire reinforcement (resulting from an expansion project at EWP); |
| · | increased overall per-ton selling price; |
| · | lower ferrous scrap costs; |
| · | increased energy costs as a result of the deregulation of electricity in Illinois; |
| · | lower conversion costs as a result of the rod mill reheat furnace overhaul during the fourth quarter of 2006; |
| · | slightly higher depreciation expense related to the expansion project at EWP and the new reheat furnace at KSW; and |
| · | lower costs as a result of the relocation of KWP’s industrial wire manufacturing operations to KSW and the discontinuance of nail operations. |
Expected trends in 2007 non-operating costs as compared to 2006 are as follows:
| · | higher defined benefit pension credit in 2007; |
| · | increased interest expense in 2007 due, in part, to the additional financing obtained for the CaluMetals acquisition; and |
| · | a provision for income taxes that more approximates the statutory rate in 2007. |
See Note 14 to our Consolidated Financial Statements for the projected impact of recent accounting pronouncements on our financial position and results of operations.
During the first quarter of 2007, we formed Calumet, which acquired substantially all of the real estate, equipment, and inventory of CaluMetals, Inc. CaluMetals, located in Chicago Heights, Illinois, is a manufacturer of merchant and special bar quality products and special sections in carbon and alloy steel grades, offering a broad range of value added products for use in agricultural, cold drawn, construction, industrial chain, service centers, and transportation applications. CaluMetals’ product mix consists primarily of angles, flats, channels, rounds and squares. CaluMetals’ sold approximately 17,000 tons of product during 2006 for $10.9 million. Calumetals’ primary raw material is billets. We expect to provide the majority of the acquired operations billet requirements from KSW, which has sufficient capacity to supply the needed billets. This acquisition will allow us to further enhance our vertical integration strategy by converting more of our current billet production into higher-margin products. We will report the results of the acquired operations in a new segment.
Segment Operating Results
Our operating segments are organized by our manufacturing facilities and include three reportable segments:
| · | Keystone Steel and Wire (“KSW”), located in Peoria, Illinois, operates an electric arc furnace mini-mill and manufactures and sells wire rod, industrial wire, nails, coiled rebar and fabricated wire products for agricultural, industrial, construction, commercial, original equipment manufacturers and retail consumer markets; |
| · | Engineered Wire Products (“EWP”), located in Upper Sandusky, Ohio, manufactures and sells welded wire reinforcement in both roll and sheet form that is utilized in concrete construction products including pipe, pre-cast boxes and applications for use in roadways, buildings and bridges; and |
| · | Keystone Wire Products (“KWP”), located in Sherman, Texas, manufactures and sells industrial wire and fabricated wire products for agricultural, industrial, construction, commercial, original equipment manufacturers and retail consumer markets. |
In connection with our emergence from Chapter 11 on August 31, 2005, certain operating assets and existing operations of SWC were sold to us at fair market value. We then used these assets to form and operate KWP. As such, operating results of this segment prior to our emergence from Chapter 11 were operating results of Sherman. Operating results of this segment after our emergence from Chapter 11, were operating results of KWP. In accordance with our plan of reorganization, the remaining assets of SWC will eventually be liquidated.
During 2006, we decided to relocate KWP’s industrial wire manufacturing process to KSW. Certain of KWP’s industrial wire production equipment will be transferred to KSW. KWP recorded an impairment charge of $172,000 to write down the carrying value of the industrial wire production equipment to be sold to an estimated fair value of $130,000.
We also decided to discontinue our nail operations during 2006 and we anticipate all nail production will be phased out by the end of the second quarter of 2007, after which we plan to sell our nail production equipment. KSW recorded an impairment charge of $357,000 to write down the carrying value of the nail production equipment to be sold to an estimated fair value of $500,000. The sales and operating income or loss of our nail operations is not material to our operating results.
During 2006, because pension and OPEB expense or credits are unrelated to the operating activities of our business, we began measuring our segments’ profitability based on operating income before pension and OPEB. See Note 3 to our Consolidated Financial Statements for adjustments to the previously reported operating income by segment.
Our consolidated net sales, cost of goods sold, operating costs and operating income before pension and OPEB by segment are set forth in the following table.
| | | KSW | | EWP | | Sherman/ KWP | | Allocation differences/ eliminations(1) | | Total | |
| | | (In thousands) | |
| | | | | | | | | | | | |
| For the year ended December 31, 2004: | | | | | | | | | |
| | | | | | | | | | | | | | | | | |
| Net sales | | $ | 346,703 | | $ | 58,982 | | $ | 16,193 | | $ | (57,543 | ) | $ | 364,335 | |
| Cost of goods sold | | | 302,827 | | | 43,821 | | | 15,020 | | | (53,582 | ) | | 308,086 | |
| Gross margin | | | 43,876 | | | 15,161 | | | 1,173 | | | (3,961 | ) | | 56,249 | |
| | | | | | | | | | | | | | | | | |
| Selling and administrative expense | | | 9,877 | | | 4,345 | | | 878 | | | 351 | | | 15,451 | |
| Operating income (loss) before pension/OPEB | | $ | 33,999 | | $ | 10,816 | | $ | 295 | | $ | (4,312 | ) | $ | 40,798 | |
| | | | | | | | | | | | | | | | | |
| For the year ended December 31, 2005: | | | | | | | | | |
| | | | | | | | | | | | | | | | | |
| Net sales | | $ | 342,139 | | $ | 62,777 | | $ | 18,024 | | $ | (55,395 | ) | $ | 367,545 | |
| Cost of goods sold | | | 319,578 | | | 48,801 | | | 18,726 | | | (57,516 | ) | | 329,589 | |
| Gross margin | | | 22,561 | | | 13,976 | | | (702 | ) | | 2,121 | | | 37,956 | |
| | | | | | | | | | | | | | | | | |
| Selling and administrative expense | | | 12,440 | | | 4,277 | | | 1,135 | | | 211 | | | 18,063 | |
| Operating income (loss) before pension/OPEB | | $ | 10,121 | | $ | 9,699 | | $ | (1,837 | ) | $ | 1,910 | | $ | 19,893 | |
| | | | | | | | | | | | | | | | | |
For the year ended December 31, 2006: | | | | | | | | | |
| | | | | | | | | | | | | | | | | |
Net sales | | $ | 414,927 | | $ | 58,748 | | $ | 17,664 | | $ | (50,799 | ) | $ | 440,540 | |
Cost of goods sold | | | 393,871 | | | 45,397 | | | 17,937 | | | (51,486 | ) | | 405,719 | |
Gross margin | | | 21,056 | | | 13,351 | | | (273 | ) | | 687 | | | 34,821 | |
| | | | | | | | | | | | | | | | | |
Selling and administrative expense | | | 13,551 | | | 3,887 | | | 674 | | | 21 | | | 18,133 | |
Operating income (loss) before pension/OPEB | | $ | 7,505 | | $ | 9,464 | | $ | (947 | ) | $ | 666 | | $ | 16,688 | |
| | | | | | | | | | | | | | | | | |
(1)Allocation differences related to net sales and cost of goods sold are the elimination of intercompany profit or loss on ending inventory balances. Cost of goods sold allocation differences also include LIFO inventory reserve adjustments.
Keystone Steel & Wire
| | | | |
| | | 2004 | | % of sales | | 2005 | | % of sales | | 2006 | | % of sales | |
| | | ($ in thousands) | |
| | | | |
| Net sales | | $ | 346,703 | | | 100.0 | % | $ | 342,139 | | | 100.0 | % | $ | 414,927 | | | 100.0 | % |
| Cost of goods sold | | | 302,827 | | | 87.3 | | | 319,578 | | | 93.4 | | | 393,871 | | | 94.9 | |
| Gross margin | | | 43,876 | | | 12.7 | | | 22,561 | | | 6.6 | | | 21,056 | | | 5.1 | |
| | | | | | | | | | | | | | | | | | | | |
| Selling and administrative | | | 9,877 | | | 2.8 | | | 12,440 | | | 3.6 | | | 13,551 | | | 3.3 | |
| Operating income before pension/OPEB | | $ | 33,999 | | | 9.9 | % | $ | 10,121 | | | 3.0 | % | $ | 7,505 | | | 1.8 | % |
| | | | | | | | | | | | | | | | | | | | |
The primary drivers of sales, cost of goods sold, and the resulting gross margin are as follows:
| | | 2004 | | 2005 | | 2006 | |
| Sales volume(000 tons): | | | | | | | | | | |
| Fabricated wire products | | | 116 | | | 101 | | | 112 | |
| Nails | | | 28 | | | 17 | | | 18 | |
| Industrial wire | | | 75 | | | 64 | | | 69 | |
| Coiled rebar | | | - | | | - | | | 1 | |
| Wire rod | | | 295 | | | 325 | | | 422 | |
| Billets | | | 23 | | | 29 | | | 62 | |
| Total | | | 537 | | | 536 | | | 684 | |
| | | | | | | | | | | |
| | | | | | | | | | | |
| Per-ton selling prices: | | | | | | | | | | |
| Fabricated wire products | | $ | 984 | | $ | 1,090 | | $ | 1,037 | |
| Nails | | | 759 | | | 742 | | | 692 | |
| Industrial wire | | | 709 | | | 735 | | | 729 | |
| Coiled rebar | | | - | | | - | | | 529 | |
| Wire rod | | | 517 | | | 497 | | | 494 | |
| Billets | | | 236 | | | 321 | | | 359 | |
| All products | | | 645 | | | 635 | | | 599 | |
| | | | | | | | | | | |
| Average per-ton ferrous scrap purchase cost | | $ | 205 | | $ | 220 | | $ | 210 | |
| | | | | | | | | | | |
| Average electricity cost per kilowatt hour | | $ | 0.04 | | $ | 0.04 | | $ | 0.04 | |
| | | | | | | | | | | |
| Average natural gas cost per therm | | $ | 0.65 | | $ | 0.89 | | $ | 0.77 | |
The decrease in operating income before pension and OPEB from 2004 to 2005 was primarily due to higher shipment volumes of lower margin products, an increase in the cost of ferrous scrap and natural gas, an increase in wages and an increase in selling and administrative expenses. Net sales remained relatively constant from 2004 to 2005 as lower shipment volumes of higher-priced products offset increased shipment volumes of lower-priced products. The decrease in operating income before pension and OPEB from 2005 to 2006 was primarily due to higher shipment volumes of lower margin products and increased conversion costs caused by production interruptions related to operating issues of our rod mill reheat furnace, partially offset by a decrease in the cost of ferrous scrap and natural gas. The reheat furnace was overhauled during the fourth quarter of 2006 to avoid future production inefficiencies.
We believe lower shipment volumes of fabricated wire products, nails, and industrial wire in 2005 as compared to 2004 were primarily due to high customer inventory levels at the end of 2004. The higher shipment volumes of wire rod (in 2005 and 2006) and billets (in 2006) as compared to the respective prior year were primarily due to competitor production problems that are not expected to continue in 2007. In addition, due to the increased cost associated with exporting rod, foreign rod prices approximated domestic rod prices on a delivered basis in 2006 resulting in increased demand for domestic wire rod. The higher shipment volumes of all other products in 2006 as compared to 2005 was partially due to an extra week of operations as 2006 was a 53-week year.
The decrease in the overall per-ton selling price from 2004 to 2005 was primarily due to reduced demand for value-added finished products due to high customer inventory levels at the end of 2004. The lower per-ton selling prices on all products except billets during 2006 as compared to 2005 were due primarily to significantly lower ferrous scrap costs, as the price we sell our products is influenced in part by the market cost of ferrous scrap.
Our efforts to recapture the portion of the market that we lost during bankruptcy resulted in higher selling and administrative cost in 2005 as compared to 2004 primarily due to higher advertising and marketing expenses and in 2006 as compared to 2005 primarily due to an increased sales force. Additionally, personnel related costs were higher in 2006 as compared to 2005 due to annual compensation increases.
Engineered Wire Products
| | | 2004 | | % of sales | | 2005 | | % of sales | | 2006 | | % of sales | |
| | | ($ in thousands) | |
| | | | | | | | | | | | | | |
| Net sales | | $ | 58,982 | | | 100.0 | % | $ | 62,777 | | | 100.0 | % | $ | 58,748 | | | 100.0 | % |
| Cost of goods sold | | | 43,821 | | | 74.3 | | | 48,801 | | | 77.7 | | | 45,397 | | | 77.3 | |
| Gross margin | | | 15,161 | | | 25.7 | | | 13,976 | | | 22.3 | | | 13,351 | | | 22.7 | |
| | | | | | | | | | | | | | | | | | | | |
| Selling and administrative | | | 4,345 | | | 7.4 | | | 4,277 | | | 6.8 | | | 3,887 | | | 6.6 | |
Operating income before pension/OPEB | | $ | 10,816 | | | 18.3 | % | $ | 9,699 | | | 15.5 | % | $ | 9,464 | | | 16.1 | % |
| | | | | | | | | | | | | | | | | | | | |
The primary drivers of sales, cost of goods sold, and the resulting gross margin are as follows:
| | | 2004 | | 2005 | | 2006 | |
| Sales volume (000 tons) - | | | | | | | | | | |
| Welded wire reinforcement | | | 71 | | | 71 | | | 67 | |
| | | | | | | | | | | |
| Per-ton selling prices - | | | | | | | | | | |
| Welded wire reinforcement | | $ | 829 | | $ | 881 | | $ | 870 | |
| | | | | | | | | | | |
| Average per-ton wire rod purchase cost | | $ | 516 | | $ | 536 | | $ | 504 | |
| | | | | | | | | | | |
The decrease in operating income before pension and OPEB from 2004 to 2005 was primarily due to an increase in the cost of wire rod, EWP’s primary raw material, partially offset by an increase in sales due to an increase in selling price. The decrease in operating income before pension and OPEB from 2005 to 2006 was primarily due to a decrease in shipment volumes and selling price, partially offset by a decrease in the cost of wire rod and selling and administrative expenses.
We believe the lower shipment volume during 2006 as compared to 2005 was due to a decline in the construction of new homes which results in a decline of related infrastructure projects and consequently, in a decrease in the sales of welded wire reinforcement.
The higher per-ton selling prices for 2005 as compared to 2004 were due primarily to higher cost for wire rod, EWP’s primary raw material. Conversely, the lower per-ton selling prices for 2006 as compared to 2005 were due primarily to significantly lower cost for wire rod during 2006. EWP sources substantially all of its wire rod requirements from KSW at prices that we believe approximate market.
Selling and administrative expenses were lower in 2006 as compared to 2004 and 2005 primarily due to a decline in 2006 bonuses.
Sherman/KWP
| | | 2004 | | % of sales | | 2005 | | % of sales | | 2006 | | % of sales | |
| | | ($ in thousands) | |
| | | | | | | | | | | | | | |
| Net sales | | $ | 16,193 | | | 100.0 | % | $ | 18,024 | | | 100.0 | % | $ | 17,664 | | | 100.0 | % |
| Cost of goods sold | | | 15,020 | | | 92.8 | | | 18,726 | | | 103.9 | | | 17,937 | | | 101.5 | |
| Gross margin | | | 1,173 | | | 7.2 | | | (702 | ) | | (3.9 | ) | | (273 | ) | | (1.5 | ) |
| | | | | | | | | | | | | | | | | | | | |
| Selling and administrative | | | 878 | | | 5.4 | | | 1,135 | | | 6.3 | | | 674 | | | 3.8 | |
| Operating income (loss) before pension/OPEB | | $ | 295 | | | 1.8 | % | $ | (1,837 | ) | | (10.2 | )% | $ | (947 | ) | | (5.3 | )% |
| | | | | | | | | | | | | | | | | | | | |
The primary drivers of sales, cost of goods sold, and the resulting gross margin are as follows:
| | | 2004 | | 2005 | | 2006 | |
| Sales volume(000 tons): | | | | | | | | | | |
| Fabricated wire products | | | 10 | | | 11 | | | 12 | |
| Industrial wire | | | 8 | | | 9 | | | 8 | |
| Total | | | 18 | | | 20 | | | 20 | |
| | | | | | | | | | | |
| Per-ton selling prices: | | | | | | | | | | |
| Fabricated wire products | | $ | 942 | | $ | 1,003 | | $ | 968 | |
| Industrial wire | | | 708 | | | 698 | | | 678 | |
| | | | | | | | | | | |
| Average per-ton wire rod purchase cost | | $ | 331 | | $ | 439 | | $ | 443 | |
| | | | | | | | | | | |
The decrease in operating income (loss) before pension and OPEB from 2004 to 2005 was primarily due to an increase in the cost of wire rod, KWP’s primary raw material, higher costs for utilities and repairs and maintenance, and an increase in selling and administrative expenses, partially offset by an increase in shipment volumes and selling prices. The decrease in operating loss before pension and OPEB from 2005 to 2006 was primarily due to lower costs for utilities and repairs and maintenance, lower depreciation and employment related expenses in part due to our decision to relocate KWP’s industrial wire manufacturing process to KSW, and a decrease in selling and administrative expenses, partially offset by a decrease in selling prices and the $172,000 impairment charge related to the industrial wire production equipment that we plan to sell.
The higher per-ton selling prices of fabricated wire products in 2005 as compared to 2004 were primarily due to higher cost for wire rod while the decrease in per-ton selling prices of industrial wire in 2005 as compared to 2004 was primarily due to reduced demand as a result of high customer inventory levels at the end of 2004. The lower per-ton selling prices in 2006 as compared to 2005 were primarily due to lower cost for wire rod throughout most of 2006. KWP sources substantially all of its wire rod requirements from KSW at prices that we believe approximate market.
Selling and administrative expenses were higher in 2005 as compared to 2004 primarily due to an increase in 2005 personnel related costs. Selling and administrative expenses were lower in 2006 as compared to 2005 primarily due to a reduction in employment related expenses due in part to our decision to relocate KWP’s industrial wire manufacturing process to KSW.
Pension and Postretirement Benefit Expense or Credits, Interest Expense, Provision for Income Taxes, and Other Items
During 2004, 2005, and 2006, we recorded a defined benefit pension credit of $6.8 million, $11.7 million and $56.0 million, respectively. The increases in the pension credit were primarily the result of the component of the pension credit related to the expected rate of return on plan assets, as our plan assets increased by $52 million during 2004 and by an additional $277 million during 2005. See Note 8 to our Consolidated Financial Statements.
During 2004 and 2005, we recorded a postretirement benefit expense of approximately $20.9 million and $8.9 million, respectively, as compared to a $8.3 million postretirement benefit credit recorded during 2006. Our postretirement benefit costs are significantly lower following our emergence from Chapter 11 in August 2005. See Note 8 to our Consolidated Financial Statements.
We recorded general corporate expense of $439,000, $2.5 million, and $1.2 million during 2004, 2005, and 2006, respectively. The increase from 2004 to 2005 was primarily due to higher state franchise taxes, general insurance expense, and legal fees. The decrease from 2005 to 2006 was primarily due to lower state franchise taxes and general insurance expense partially offset by an increase in professional fees.
Interest expense was $3.7 million, $4.0 million, and $4.7 million during 2004, 2005, and 2006, respectively. The primary drivers of interest expense are as follows:
| | | 2004 | | 2005 | | 2006 | |
| | | ($ in thousands) | |
| | | | | | | | |
| Average debt balance | | $ | 99,612 | | $ | 91,582 | | $ | 89,375 | |
| | | | | | | | | | | |
| Weighted average interest rate | | | 2.2 | % | | 4.2 | % | | 5.0 | % |
The overall weighted average interest rate during 2004 and 2005 was impacted by the fact that we discontinued accruing interest on pre-petition unsecured debt upon filing for Chapter 11 on February 26, 2004.
In connection with our Chapter 11 proceedings during 2004, we entered into a settlement agreement with our former primary ferrous scrap supplier relative to certain disputed ferrous scrap inventories located at KSW on February 26, 2004, the date of our Chapter 11 filing. As we consumed these disputed inventories during 2004, we deposited funds equal to the cost of these disputed inventories into an escrow account and charged cost of goods sold. However, under the terms of the settlement agreement, during December 2004, approximately $5.3 million of the escrowed funds were refunded to us. We recorded the receipt of this refund as a gain on legal settlement in 2004.
During 2004, 2005, and 2006, we incurred $11.2 million, $10.3 million, and $679,000, respectively, in legal and professional fees relative to our Chapter 11 proceedings and related reorganization activities. In addition, upon our emergence from Chapter 11 on August 31, 2005, pre-petition unsecured creditors, a debtor-in-possession secured lender and certain post-petition creditors with allowed claims against us in the amount of approximately $63.9 million received, on a pro rata basis, in the aggregate, $5.2 million in cash, a $4.8 million secured promissory note and 100% of our new common stock (valued at $21.4 million). As a result, we recorded a $32.5 million gain from cancellation of debt during 2005.
A tabular reconciliation of the difference between the U.S. Federal statutory income tax rate and our effective income tax rates is included in Note 7 to our Consolidated Financial Statements. During 2004, 2005 and prior to the second quarter of 2006, considering all factors believed to be relevant, we believed our gross deferred tax assets (including net operating loss carryforwards) did not meet the “more-likely-than-not” realizability test. As such, we had provided a deferred tax asset valuation allowance to offset our net deferred income tax asset (before valuation allowance) of approximately $30.3 million and $10.7 million at December 31, 2004 and 2005, respectively. Primarily as a result of the deferred tax asset valuation allowance, our provisions for income taxes during those periods were not significant. However, during the first six months of 2006, we recorded taxable income in excess of our available net operating loss carryforwards. As such, the valuation allowance related to those deferred tax assets was completely reversed during the first six months of 2006. After such reversal, we have a net deferred tax liability. Due in part to our continued profitability, we believe the realization of our remaining deferred tax assets (including an alternative minimum tax credit carryforward) meet the “more-likely-than-not” realizability test. Accordingly, we recorded a provision for income taxes that approximated the statutory rate for the remainder of 2006.
LIQUIDITY AND CAPITAL RESOURCES
Working Capital and Borrowing Availability
| | | December 31, | |
| | | 2005 | | 2006 | |
| | | (In thousands) | |
| | | | | | |
| Working Capital | | $ | 36,373 | | $ | 31,776 | |
| Revolver | | | 36,174 | | | 17,734 | |
| Current maturities of long-term debt | | | 5,466 | | | 25,965 | |
| | | | | | | | |
| Borrowing availability | | | 21,573 | | | 23,697 | |
The amount of available borrowings under our revolving credit facility is based on formula-determined amounts of trade receivables and inventories, less the amount of outstanding letters of credit ($5.5 million at December 31, 2006). The revolving credit facility requires daily cash receipts be used to reduce outstanding borrowings, which results in us maintaining zero cash balances when there are balances outstanding under this credit facility. Accordingly, any outstanding balances under this facility are always classified as a current liability regardless of the maturity date of the facility.
Our primary credit facility requires compliance with certain financial covenants related to performance measures. We were in compliance with all financial covenants at December 31, 2006.
Historical Cash Flows
Operating Activities
During 2005, net cash used in operations totaled $30.7 million as compared to net cash provided by operations of $11.9 million during 2004. The decrease of operating cash flows in 2005 was due primarily to the net effects of:
| · | lower operating income before pension/OPEB in 2005; |
| · | higher reorganization costs of $1.9 million paid in 2005; |
| · | higher OPEB payments made in 2005 of $3.1 million; |
| · | relative changes in our accounts receivable and inventory balances primarily due to decreased demand during the fourth quarter of 2004 and increased demand during the third and fourth quarters of 2005; |
| · | less cash generated from accounts payable in 2005 as the increase in accounts payable from 2003 to 2004 was primarily related to the non-payment of certain items as a result of us operating under bankruptcy protection during 2004; and |
| · | more cash used in operations in 2005 due to the $5.2 million payment to our creditors upon emergence from bankruptcy on August 31, 2005, higher environmental costs of $2.8 million paid in 2005, higher income tax payments of $1.0 million in 2005 and relative changes in our self-insurance and workers compensation accruals. |
During 2006, net cash provided by operations totaled $43.5 million as compared to net cash used in operations of $30.7 million during 2005. The improvement in operating cash flows was due primarily to the net effects of:
| · | lower operating income before pension/OPEB in 2006; |
| · | lower reorganization costs of $6.4 million paid in 2006; |
| · | lower OPEB payments made in 2006 of $4.4 million as a result of our emergence from bankruptcy; |
| · | higher net cash generated from relative changes in our accounts receivable in 2006 of $34.1 million primarily due to an abnormally low accounts receivable balance at December 31, 2004 as a result of decreased demand during the fourth quarter of 2004 and an abnormally high accounts receivable balance at December 31, 2005 as a result of increased demand during the third and fourth quarters of 2005; |
| · | higher net cash generated from relative changes in our inventory in 2006 of $25.1 million due to the net effects of operating issues with our wire rod mill reheat furnace during 2006, a more significant shutdown for planned major maintenance during the fourth quarter of 2006 than in 2005 and weaker than anticipated sales during 2005 due in part to our customers’ concerns about our financial stability while we were operating under Chapter 11 protection; |
| · | less cash generated from accounts payable in 2006 as the increase in accounts payable from 2004 to 2005 was the result of obtaining credit terms from vendors subsequent to our emergence from bankruptcy; and |
| · | less cash used in operations in 2006 due to lower environmental costs of $1.2 million paid in 2006, lower income tax payments in 2006, $4.0 million received related to an insurance settlement during 2006 that was recorded as a liability subject to compromise (see Notes 2 and 10) and the $5.2 million payment to our creditors upon emergence from bankruptcy on August 31, 2005. |
Investing Activities
During 2004, 2005 and 2006, we had capital expenditures of approximately $5.1 million, $9.8 million and $18.7 million, respectively. The increase in capital expenditures from 2004 to 2005 was the result of post-emergence upgrades and repairs of equipment that were postponed throughout our bankruptcy. The increase in capital expenditures from 2005 to 2006 was primarily related to a plant expansion at EWP and an overhaul of the rod mill reheat furnace at KSW. Capital expenditures for 2007 are expected to be approximately $15 million and are related primarily to upgrades of production equipment at KSW, completion of the EWP plant expansion, and improvements of the acquired assets of CaluMetals, Inc. We expect to fund capital expenditures using cash flows from operations and borrowing availability under our credit facilities.
During 2004, restricted investments increased primarily as a result of escrowed funds of $5.3 million related to the settlement agreement with our former primary ferrous scrap supplier discussed above.
During 2005, restricted investments decreased due primarily to the refund of the $5.3 million scrap settlement agreement and $1.6 million of reimbursements received from our environmental trust funds (see Note 9 to our Consolidated Financial Statements).
During 2006, restricted investments increased due to the $4.0 million received related to an insurance settlement (see Notes 2 and 10 to our Consolidated Financial Statements) partially offset by $2.9 million of reimbursements received from our environmental trust funds.
Financing Activities
As a result of increased profitability, we decreased our borrowings on our revolving credit facilities by $14.2 million and $18.4 million during 2004 and 2006, respectively, as compared to increasing our borrowings on our revolving credit facilities during 2005.
During 2004, we obtained the $6.8 million EWP Term Loan and $9.0 million of DIP facilities and made regularly scheduled payments on these facilities.
During 2005, we retired $17.6 million of DIP and other financing and obtained a five-year $80.0 million secured credit facility from Wachovia Capital Finance (Central) (“Wachovia”). The Wachovia credit facility includes a term loan in the amount of up to $25.0 million, subject to a borrowing base calculation based on the market value of our real property and equipment. To the extent there is sufficient borrowing base, the term loan portion of the Wachovia Facility can be reloaded in the amount of $10.0 million. During 2005, we drew $23.1 million on the Wachovia term loan.
During 2006, we made principal payments of $5.5 million on our various credit facilities.
Summary of Debt and Other Contractual Commitments
As more fully described in the Notes to our Consolidated Financial Statements, we are a party to various debt, lease and other agreements which contractually and unconditionally commit us to pay certain amounts in the future. See Notes 2, 5, 9 and 10 to our Consolidated Financial Statements. The following table summarizes such contractual commitments that are unconditional both in terms of timing and amount by the type and date of payment:
| | | Payment due date | |
Contractual commitment | | 2007 | | 2008/2009 | | 2010/2011 | | 2012 and after | | Total | |
| | | (In thousands) | |
| | | | | | | | | | | | |
| Indebtedness: | | | | | | | | | | | | | | | | |
| Principal | | $ | 25,964 | | $ | 29,130 | | $ | 21,354 | | $ | - | | $ | 76,448 | |
| Interest | | | 3,858 | | | 6,123 | | | 1,625 | | | - | | | 11,606 | |
| | | | | | | | | | | | | | | | | |
| Operating leases | | | 497 | | | 815 | | | 132 | | | - | | | 1,444 | |
| | | | | | | | | | | | | | | | | |
| Product supply agreements | | | 1,200 | | | 2,400 | | | 2,400 | | | 300 | | | 6,300 | |
| | | | | | | | | | | | | | | | | |
| | | $ | 31,519 | | $ | 38,468 | | $ | 25,511 | | $ | 300 | | $ | 95,798 | |
The timing and amounts shown in the above table related to indebtedness (both principal and interest), operating leases and product supply agreements are based upon the contractual payment amount and the contractual payment or maturity date for such commitments, including the outstanding balance under our revolving credit facility which we classify as a current liability at December 31, 2006 because the facility requires our daily net cash receipts to be used to reduce the outstanding borrowings. See Note 5 to our Consolidated Financial Statements.
In addition, we are party to an agreement that requires quarterly contributions of $75,000 to an environmental trust fund. Monies in the trust fund are made available to us as the related environmental site is remediated.
The above table does not reflect any amounts that we might pay to fund our defined benefit pension plans and OPEB plans, as the timing and amount of any such future fundings are unknown and dependent on, among other things, the future performance of defined benefit pension plan assets, interest rate assumptions and actual future census data.
Off-balance Sheet Financing
We do not have any off-balance sheet financing agreements other than the operating leases discussed in Note 10 to our Consolidated Financial Statements.
Environmental Obligations
At December 31, 2006, our financial statements reflected accrued liabilities of $13.3 million ($8.5 million of which is included in liabilities subject to compromise) for estimated remediation costs for those environmental matters which we believe are probable and reasonably estimable. Although we have established an accrual for estimated future required environmental remediation costs, we do not know the ultimate cost of remedial measures that might eventually be required by environmental authorities or that additional environmental hazards, requiring further remedial expenditures, might not be asserted by such authorities or private parties. Accordingly, the costs of remedial measures may exceed the amounts accrued. We believe it is not possible to estimate the range of costs for certain sites. The upper end of the range of reasonably possible costs to us for sites for which we believe it is possible to estimate costs is approximately $14.0 million, including the $13.3 million currently accrued. See Notes 9 and 10 to our Consolidated Financial Statements for discussions of our environmental liabilities and current litigation.
Pension and Other Postretirement Obligations
We were not required to make any cash contributions for defined benefit pension plan fundings during 2004, 2005 or 2006 and we do not expect to be required to make contributions to our defined benefit pension plans during 2007. However, we contributed $5.3 million, $8.3 million and $3.9 million to our other postretirement benefit plans during 2004, 2005 and 2006, respectively, and anticipate contributing $4.2 million during 2007. Future variances from assumed actuarial rates, including the rate of return on plan assets, may result in increases or decreases to pension and postretirement benefit expense or credit and funding requirements in future periods.
Income Taxes
As a result of a decrease in state income tax rates and a refund received in 2006 for taxes paid in prior years, we paid less cash income taxes in 2006 than in 2005. We anticipate paying an increased amount of taxes in future periods with expected positive taxable income.
Acquisition and Amendment to Credit Facility in 2007
During the first quarter of 2007, we formed Calumet, which in turn, acquired substantially all of the real estate, equipment, and inventory of CaluMetals. We also completed an amendment to our current credit facility during the first quarter of 2007, increasing the total committed facility amount from $80.0 million to $100.0 million, in part to finance the CaluMetals acquisition.
Liquidity Outlook
We incur significant ongoing costs for plant and equipment and substantial employee benefits for both current and retired employees. As such, we are vulnerable to business downturns and increases in costs, and accordingly, routinely compare our liquidity requirements and capital needs against our estimated future operating cash flows. We have significant cash commitments over the next six months including:
| · | scheduled payment of the $10.0 million term loan from the County of Peoria, Illinois; |
| · | scheduled principal payment of $8.3 million on our 8% Notes, |
| · | scheduled principal and interest payments of $2.1 million on our UC Note; |
| · | scheduled monthly payments amounting to $2.9 million on our Wachovia Term Loan; and |
| · | approximately $6.0 million in capital expenditures related to the EWP plant expansion. |
We may attempt to renegotiate certain of these credit facilities, including extending the dates of scheduled principal payments. We continue efforts to recapture a portion of the market we lost during the last two years resulting from our Chapter 11 filings. Additionally, in an effort to reduce costs, we have decided to relocate KWP’s industrial wire manufacturing operations to KSW and to discontinue the production of nails at KSW. We will continue to analyze the profitability of our operations and make operating decisions accordingly. Overall, we believe our cash flows from operating activities combined with availability under our credit agreement will be sufficient to enable us to meet our cash flow needs for the next twelve months including the cash requirements identified above.
CRITICAL ACCOUNTING POLICIES AND ESTIMATES
The accompanying "Management's Discussion and Analysis of Financial Condition and Results of Operations" are based upon our Consolidated Financial Statements, which have been prepared in accordance with GAAP. The preparation of these financial statements requires us to make estimates and judgments that affect the reported amounts of assets and liabilities and disclosure of contingent assets and liabilities at the date of the financial statements, and the reported amount of revenues and expenses during the reported period. On an on-going basis, we evaluate our estimates. We base our estimates on historical experience and on various other assumptions that we believe to be reasonable under the circumstances, the results of which form the basis for making judgments about the reported amounts of assets, liabilities, revenues and expenses. Actual results may differ from previously-estimated amounts under different assumptions or conditions.
We believe the following critical accounting policies affect our more significant judgments and estimates used in the preparation of our Consolidated Financial Statements.
Impairment of long-lived assets. We recognize an impairment charge associated with our long-lived assets, primarily property and equipment, whenever we determine that recovery of such long-lived asset is not probable. Such determination is made in accordance with the applicable GAAP requirements associated with the long-lived asset, and is based upon, among other things, estimates of the amount of future net cash flows to be generated by the long-lived asset and estimates of the current fair value of the asset. Adverse changes in such estimates of future net cash flows or estimates of fair value could result in an inability to recover the carrying value of the long-lived asset, thereby possibly requiring an impairment charge to be recognized in the future.
Under applicable GAAP (SFAS No. 144, Accounting for the Impairment or Disposal of Long-Lived Assets), property and equipment is not assessed for impairment unless certain impairment indicators, as defined, are present. As we decided to no longer use certain manufacturing equipment during 2006, certain assets were assessed for impairment which resulted in the assets being marked down to their estimated sales value. No other impairment indicators were present during 2006.
Deferred income tax valuation allowance. We record a valuation allowance to reduce our deferred income tax assets to the amount that is believed to be realized under the "more-likely-than-not" recognition criteria. While we have considered future taxable income and ongoing prudent and feasible tax planning strategies in assessing the need for a valuation allowance, it is possible that in the future we may change our estimate of the amount of the deferred income tax assets that would "more-likely-than-not" be realized in the future, resulting in an adjustment to the deferred income tax asset valuation allowance that would either increase or decrease, as applicable, reported net income or loss in the period such change in estimate was made. Prior to 2006, considering all factors believed to be relevant, we believed our gross deferred tax assets did not meet the “more-likely-than-not” realizability test. As such, we had provided a deferred tax asset valuation allowance to fully offset our net deferred income tax asset. During the first six months of 2006, we recorded taxable income in excess of our available net operating loss carryforwards. As such, the valuation allowance related to those deferred tax assets was completely reversed during the first six months of 2006. Due in part to our continued profitability, we believe the realization of our remaining gross deferred income tax assets (including an alternative minimum tax credit carryforward) meet the “more-likely-than-not” realizability test.
Contingencies. We record accruals for environmental, legal, income tax and other contingencies when estimated future expenditures associated with such contingencies become probable, and the amounts can be reasonably estimated. However, new information may become available, or circumstances (such as applicable laws and regulations) may change, thereby resulting in an increase or decrease in the amount required to be accrued for such matters (and therefore a decrease or increase in reported net income in the period of such change).
Assumptions on defined benefit pension plans. We account for our defined benefit pension plans using SFAS No. 87, Employer’s Accounting for Pensions, as amended by SFAS No. 158 effective December 31, 2006. See Note 14. Under SFAS No. 87, we recognize defined benefit pension plan expense or credit and pension assets or liabilities based on certain actuarial assumptions, principally the assumed discount rate, the assumed long-term rate of return on plan assets and the assumed increase in future compensation levels. Prior to December 31, 2006, in accordance with SFAS No. 87, we did not recognize the full funded status of our plans in our Consolidated Balance Sheet; instead, certain gains and losses resulting primarily from differences between our actuarial assumptions and actual results were deferred and recognized as a component of defined benefit pension plan expense or credit and prepaid or accrued pension costs in future periods. Upon adoption of SFAS No. 158 effective December 31, 2006, we now recognize the full funded status of our defined benefit pension plans as either an asset (for overfunded plans) or a liability (for underfunded plans) in our Consolidated Balance Sheet.
We recognized a consolidated defined benefit pension plan credit of $6.8 million in 2004, $11.7 million in 2005 and $56.0 million in 2006. The amount of funding requirements for our defined benefit pension plans is based upon applicable regulations, and will generally differ from pension expense or credit recognized under SFAS No. 87 for financial reporting purposes. No contributions were required to be made to our defined benefit pension plans during the past three years.
The discount rates we utilize for determining defined benefit pension expense or credit and the related pension obligations are based, in part, on current interest rates earned on long-term bonds that receive one of the two highest ratings given by recognized rating agencies. In addition, we receive advice about appropriate discount rates from our third-party actuaries, who may in some cases utilize their own market indices. The discount rates are adjusted as of each valuation date (December 31st) to reflect then-current interest rates on such long-term bonds. Such discount rates are used to determine the actuarial present value of the pension obligations as of December 31st of that year, and such discount rates are also used to determine the interest component of defined benefit pension expense or credit for the following year.
We used the following discount rates for our defined benefit pension plans during the last three years:
Discount rates used for: |
Obligations at December 31, 2004 and expense in 2005 | Obligations at December 31, 2005 and expense in 2006 | Obligations at December 31, 2006 and expense in 2007 |
| | | |
| 5.7% | 5.5% | 5.8% |
The assumed long-term rate of return on plan assets represents the estimated average rate of earnings expected to be earned on the funds invested or to be invested in the plans’ assets provided to fund the benefit payments inherent in the projected benefit obligations. Unlike the discount rate, which is adjusted each year based on changes in current long-term interest rates, the assumed long-term rate of return on plan assets will not necessarily change based upon the actual, short-term performance of the plan assets in any given year. Defined benefit pension expense or credit each year is based upon the assumed long-term rate of return on plan assets for the plan and the actual fair value of the plan assets as of the beginning of the year. Differences between the expected return on plan assets for a given year and the actual return are deferred and amortized over future periods based upon the expected average remaining service life of the active plan participants.
In determining the expected long-term rate of return on plan asset assumptions, we consider the long-term asset mix (e.g. equity vs. fixed income) for the assets of our plans and the expected long-term rates of return for such asset components. In addition, we receive advice about appropriate long-term rates of return from our third-party actuaries. Substantially all of our plan assets are invested in the Combined Master Retirement Trust (“CMRT”), a collective investment trust sponsored by Contran, to permit the collective investment by certain master trusts that fund certain employee benefit plans sponsored by Contran and certain of its affiliates. Harold C. Simmons is the sole trustee of the CMRT. Mr. Simmons, a former member of our board of directors, a current member of our board of directors and the Master Trust Investment Committee comprise the Trust Investment Committee for the CMRT. The CMRT’s long-term investment objective is to provide a rate of return exceeding a composite of broad market equity and fixed income indices (including the S&P 500 and certain Russell indicies) utilizing both third-party investment managers as well as investments directed by Mr. Simmons. During the 19-year history of the CMRT through December 31, 2006, the average annual rate of return has been 14.2%. For 2004, 2005 and 2006, the assumed long-term rate of return utilized for plan assets invested in the CMRT was 10%. We currently expect to utilize the same long-term rate of return on plan assets assumption in 2007. In determining the appropriateness of such long-term rate of return assumption, we considered, among other things, the historical rate of return for the CMRT, the current and projected asset mix of the CMRT, the investment objectives of the CMRT’s managers and the advice of our third-party actuaries. At December 31, 2006, the asset mix of the CMRT was 92% in U.S. equity securities, 5% in international equity securities and 3% in U.S. fixed income securities.
We regularly review our actual asset allocation for our defined benefit pension plans, and will periodically rebalance the investments in the plans to more accurately reflect the targeted allocation when considered appropriate.
To the extent the defined benefit pension plans’ particular pension benefit formula calculates the pension benefit in whole or in part based upon future compensation levels, the projected benefit obligations and the pension expense will be based in part upon expected increases in future compensation levels. For pension benefits that are so calculated, we generally base the assumed expected increase in future compensation levels upon average long-term inflation rates.
Assumed discount rates and rate of return on plan assets are re-evaluated annually. A reduction in the assumed discount rate generally results in an actuarial loss, as the actuarially-determined present value of estimated future benefit payments will increase. Conversely, an increase in the assumed discount rate generally results in an actuarial gain. In addition, an actual return on plan assets for a given year that is greater than the assumed return on plan assets results in an actuarial gain, while an actual return on plan assets that is less than the assumed return results in an actuarial loss. Other actual outcomes that differ from previous assumptions, such as individuals living longer or shorter than assumed in mortality tables that are also used to determine the actuarially-determined present value of estimated future benefit payments, changes in such mortality tables themselves or plan amendments, will also result in actuarial losses or gains. Under GAAP, all of such actuarial gains and losses are not recognized in earnings currently, but instead are deferred and amortized into income in the future as part of net periodic defined benefit pension cost. However, any actuarial gains generated in future periods would reduce the negative amortization effect of any cumulative unamortized actuarial losses, while any actuarial losses generated in future periods would reduce the favorable amortization effect of any cumulative unamortized actuarial gains.
Defined benefit pension expense or credit and the amounts recognized as pension assets or liabilities are based upon the actuarial assumptions discussed above. We currently expect our 2007 defined benefit pension credit will approximate $64.2 million and that no cash contributions will be required during 2007. We believe all of the actuarial assumptions used are reasonable and appropriate. If we had lowered the assumed discount rate by 25 basis points as of December 31, 2006, our projected and accumulated benefit obligations would have increased by approximately $10.0 million and $9.7 million, respectively at that date, and the defined benefit pension credit would be expected to decrease by approximately $539,000 during 2007. Similarly, if we lowered the assumed long-term rate of return on plan assets by 25 basis points, the defined benefit pension credit would be expected to decrease by approximately $1.8 million during 2007.
Assumptions on other postretirement benefit plans. We account for our OPEB plans under SFAS No. 106, Employers Accounting for Postretirement Benefits other than Pensions, as amended by SFAS No. 158. See Note 14. Under SFAS No. 106, OPEB expense and accrued OPEB costs are based on certain actuarial assumptions, including the assumed discount rate. Prior to December 31, 2006, we did not recognize the full unfunded status of our plans in our Consolidated Balance Sheet; instead, certain gains and losses resulting primarily from differences between our actuarial assumptions and actual results were deferred and recognized as a component of OPEB expense and accrued OPEB costs in future periods. Upon adoption of SFAS No. 158 effective December 31, 2006, we now recognize the full unfunded status of our OPEB plans as a liability.
We recognized consolidated OPEB expense of $20.9 million in 2004 and $8.9 million in 2005 and a $8.3 million credit in 2006. Similar to defined benefit pension benefits, the amount of funding will differ from the expense recognized for financial reporting purposes. Contributions to the plans to cover benefit payments aggregated $5.3 million in 2004, $8.3 million in 2005, and $3.9 million in 2006. Our OPEB payments were lower in 2006 due primarily to the 1114 Agreement entered into in connection with our emergence from bankruptcy. See Note 8 to our Consolidated Financial Statements.
The assumed discount rates we utilize for determining OPEB expense and the related accrued OPEB obligations are generally based on the same discount rates we utilize for our defined benefit pension plans. Our OPEB plans do not provide for medical benefits to participants. Accordingly, changes in the healthcare cost trend rate do not impact our future OPEB expense or obligations.
Assumed discount rates are re-evaluated annually. A reduction in the assumed discount rate generally results in an actuarial loss, as the actuarially-determined present value of estimated future benefit payments will increase. Conversely, an increase in the assumed discount rate generally results in an actuarial gain. Other actual outcomes that differ from previous assumptions, such as individuals living longer or shorter than assumed in mortality tables which are also used to determine the actuarially-determined present value of estimated future benefit payments, changes in such mortality tables themselves or plan amendments, will also result in actuarial losses or gains. Under GAAP, all of such actuarial gains and losses are not recognized in earnings currently, but instead are deferred and amortized into income in the future as part of net periodic OPEB cost. However, any actuarial gains generated in future periods would reduce the negative amortization effect of any cumulative unamortized actuarial losses, while any actuarial losses generated in future periods would reduce the favorable amortization effect of any cumulative unamortized actuarial gains.
Based on the actuarial assumptions described above and changes to our postretirement benefit plans during 2004 and in connection with our Chapter 11 filings, we expect to record a consolidated $7.9 million OPEB credit in 2007. In comparison, we expect to make $4.2 million of contributions to such plans during 2007.
OPEB expense and the amount recognized as accrued OPEB costs are based upon the actuarial assumptions discussed above. We believe all of the actuarial assumptions used are reasonable and appropriate. If we had lowered the assumed discount rate by 25 basis points for all of our OPEB plans as of December 31, 2006, our aggregate accumulated OPEB obligations would have increased by approximately $814,000 at that date, and our OPEB credit would be expected to decrease by $8,000 during 2007.
Related Party Transactions
As further discussed in Note 13 to our Consolidated Financial Statements, we are party to certain transactions with related parties. It is our policy to engage in transactions with related parties on terms, no less favorable than could be obtained from unrelated parties.
ITEM 7A. QUANTITATIVE AND QUALITATIVE DISCLOSURES ABOUT MARKET RISK.
Our exposure to market risk relates primarily to changes in interest rates on long-term debt obligations. At December 31, 2006, approximately 70% of our long-term debt was comprised of fixed rate instruments, which minimize earnings volatility related to interest expense. We do not currently participate in interest rate-related derivative financial instruments.
The table below presents principal amounts and related weighted-average interest rates by maturity date for our long-term debt obligations.
| | | Contracted Maturity Date | | Estimated Fair Value | |
| | | 2007 | | 2008 | | 2009 | | 2010 | | Thereafter | | Total | | December 31, 2006 | |
| | | ($ In thousands) | |
| Fixed-rate debt - | | | | | | | | | | | | | | | | | | | | | | |
| Principal amount | | $ | 21,372 | | $ | 9,660 | | $ | 10,290 | | $ | - | | $ | - | | $ | 41,322 | | $ | 33,821 | |
| | | | | | | | | | | | | | | | | | | | | | | |
Weighted-average interest rate | | | 1.0 | % | | 1.3 | % | | .9 | % | | - | % | | - | % | | 1.1 | % | | | |
| | | | | | | | | | | | | | | | | | | | | | | |
| Variable-rate debt- | | | | | | | | | | | | | | | | | | | | | | |
| Principal amount | | $ | 4,592 | | $ | 4,590 | | $ | 4,590 | | $ | 21,354 | | $ | - | | $ | 35,126 | | $ | 35,126 | |
| | | | | | | | | | | | | | | | | | | | | | | |
Weighted-average interest rate | | | 8.5 | % | | 8.5 | % | | 8.5 | % | | 8.5 | % | | - | % | | 8.5 | % | | | |
At December 31, 2005, our fixed rate indebtedness aggregated $42.2 million (fair value - $31.4 million) with a weighted-average interest rate of 1.6%; our variable rate indebtedness aggregated $58.2 million, which approximated fair value, with a weighted-average interest rate of 7.3%.
ITEM 8. FINANCIAL STATEMENTS AND SUPPLEMENTARY DATA.
The information called for by this Item is contained in a separate section of this Annual Report. See “Index of Financial Statements” (page F-1).
ITEM 9. CHANGES IN AND DISAGREEMENTS WITH ACCOUNTANTS ON ACCOUNTING AND FINANCIAL DISCLOSURE.
None.
ITEM 9A. CONTROLS AND PROCEDURES.
Evaluation of Disclosure Controls and Procedures
We maintain disclosure controls and procedures. The term "disclosure controls and procedures," as defined by Rule 13a-15(e) of the Securities and Exchange Act of 1934, as amended (the “Act”), means controls and other procedures that are designed to ensure that information required to be disclosed in the reports that we file or submit to the SEC, is recorded, processed, summarized and reported, within the time periods specified in the SEC's rules and forms. Disclosure controls and procedures include, without limitation, controls and procedures designed to ensure that information required to be disclosed in the reports that we file or submit to the SEC under the Act is accumulated and communicated to management, including our principal executive officer and our principal financial officer, or persons performing similar functions, as appropriate to allow timely decisions to be made regarding required disclosure. Each of David L. Cheek, our President and Chief Executive Officer, and Bert E. Downing, Jr., our Vice President, Chief Financial Officer, Corporate Controller and Treasurer, have evaluated our disclosure controls and procedures as of December 31, 2006. Based upon their evaluation, these executive officers have concluded that our disclosure controls and procedures were effective as of December 31, 2006.
Internal Control Over Financial Reporting
Beginning with our Annual Report on Form 10-K for the year ending December 31, 2007, we will be required to annually assess the effectiveness of our internal control over financial reporting. Our independent registered public accounting firm will also be required to annually attest to the effectiveness of our internal control over financial reporting. While we are currently not an accelerated filer under the rules of the SEC, we believe it is very likely we will become an accelerated filer during 2007, which would require our independent registered public accounting firm to also begin providing their attestation with our 2007 Form 10-K.
Changes in Internal Control Over Financial Reporting
There have been no changes in our internal control over financial reporting during the quarter ended December 31, 2006 that has materially affected, or is reasonably likely to materially affect, our internal control over financial reporting.
ITEM 9B. OTHER INFORMATION.
As disclosed in Items 1 and 7 and Notes 5 and 16 to our Consolidated Financial Statements, our primary credit facility was increased by $20.0 million during the first quarter of 2007. See exhibit 4.8.
PART III
ITEM 10. DIRECTORS, EXECUTIVE OFFICERS AND CORPORATE GOVERNANCE.
The information required by this Item is incorporated by reference to our definitive Proxy Statement we will file with the SEC pursuant to Regulation 14A within 120 days after the end of the fiscal year covered by this report (the “Keystone Proxy Statement”).
ITEM 11. EXECUTIVE COMPENSATION.
The information required by this Item is incorporated by reference to the Keystone Proxy Statement.
ITEM 12. SECURITY OWNERSHIP OF CERTAIN BENEFICIAL OWNERS AND MANAGEMENT AND RELATED STOCKHOLDER MATTERS.
The information required by this Item is incorporated by reference to the Keystone Proxy Statement.
ITEM 13. CERTAIN RELATIONSHIPS AND RELATED TRANSACTIONS AND DIRECTOR INDEPENDENCE.
The information required by this Item is incorporated by reference to the Keystone Proxy Statement. See also Note 13 to our Consolidated Financial Statements.
ITEM 14. PRINCIPAL ACCOUNTING FEES AND SERVICES.
The information required by this Item is incorporated by reference to the Keystone Proxy Statement.
PART IV
ITEM 15. EXHIBITS AND FINANCIAL STATEMENT SCHEDULES.
(a) and (c) Financial Statements and Schedules
The Registrant
Our Consolidated Financial Statements listed on the accompanying Index of Financial Statements (see page F-1) are filed as part of this Annual Report. All financial statement schedules have been omitted either because they are not applicable or required, or the information that would be required to be included is disclosed in the notes to our Consolidated Financial Statements.
(b) Exhibits
Included as exhibits are the items listed in the Exhibit Index. We have retained a signed original of any of these exhibits that contain signatures, and we will provide such exhibit to the Commission or its staff upon request. We will furnish a copy of any of the exhibits listed below upon request and payment of $4.00 per exhibit to cover our costs of furnishing the exhibits. Such requests should be directed to the attention of our Corporate Secretary at our corporate offices located at 5430 LBJ Freeway, Suite 1740, Dallas, Texas 75240. Pursuant to Item 601(b)(4)(iii) of Regulation S-K, we will furnish to the Commission upon request any instrument defining the rights of holders of long-term debt issues and other agreements related to indebtedness which do not exceed 10% of our consolidated total assets as of December 31, 2006.
Exhibit No. | Exhibit Item |
| 3.1 | Amended and Restated Certificate of Incorporation of the Registrant dated August 31, 2005, as filed with the Secretary of State of Delaware. (Incorporated by reference to Exhibit 3.3 to the Registrant's Annual Report on Form 10-K for the year ended December 31, 2003). |
| | |
| 3.2 | Amended and Restated Bylaws of the Registrant dated August 31, 2005. (Incorporated by reference to Exhibit 3.6 to the Registrant's Annual Report on Form 10-K for the year ended December 31, 2003). |
| | |
| 4.1 | Loan Agreement dated as of March 13, 2002 between Registrant and the County of Peoria, Illinois. (Incorporated by reference to Exhibit 4.17 to the Registrant's Annual Report on Form 10-K for the year ended December 31, 2001). |
| | |
| 4.2 | Subordinate Security Agreement dated as of March 13, 2002 made by Registrant in favor of the County of Peoria, Illinois. (Incorporated by reference to Exhibit 4.18 to the Registrant's Annual Report on Form 10-K for the year ended December 31, 2001). |
| | |
| 4.3 | Form of Registrant’s 8% Subordinated Secured Note dated as of March 15, 2002. (Incorporated by reference to Exhibit 4.23 to the Registrant's Annual Report on Form 10-K for the year ended December 31, 2001). |
Exhibit No. | Exhibit Item |
| 4.4 | Indenture Dated as of March 15, 2002, related to Registrant’s 8% Subordinated Secured Notes Between Registrant as Issuer, and U.S. Bank National Association, as Trustee. (Incorporated by reference to Exhibit 4.24 to the Registrant's Annual Report on Form 10-K for the year ended December 31, 2001). |
| | |
| 4.5 | Supplemental Indenture No. 1 dated as of August 31, 2005, related to Registrant’s 8% Subordinated Secured Notes between Registrant as issuer, and U.S. Bank National Association as Trustee. (Incorporated by reference to Exhibit 4.42 to the Registrant’s Annual Report on Form 10-K for the year ended December 31, 2005). |
| | |
| 4.6 | Loan and Security Agreement dated August 31, 2005 by and between the Registrant and Wachovia Capital Finance Corporation (Central). (Incorporated by reference to Exhibit 4.51 to the Registrant’s Annual Report on Form 10-K for the year ended December 31, 2003). |
| | |
| 4.7 | First Amendment to Loan and Security Agreement dated as of June 30, 2006 by and between the Registrant and Wachovia Capital Finance Corporation (Central). |
| | |
| 4.8 | Amendment No. 2 to Loan and Security Agreement dated as of March 23, 2007 by and between the Registrant and Wachovia Capital Finance Corporation (Central). |
| | |
| 4.9 | Promissory Note dated August 31, 2005, from Registrant to Jack B. Fishman Esq. as trustee for holders of Class A6 claims. (Incorporated by reference to Exhibit 4.54 to the Registrant’s Annual Report on Form 10-K for the year ended December 31, 2005). |
| | |
| 4.10 | Securities Pledge Agreement dated August 31, 2005, by and between Registrant and Jack B. Fishman Esq. as trustee for holders of Class A6 claims. (Incorporated by reference to Exhibit 4.55 to the Registrant’s Annual Report on Form 10-K for the year ended December 31, 2005). |
| | |
| 10.1 | Agreement Regarding Shared Insurance between Registrant, CompX International, Inc., Contran Corporation, Kronos Worldwide, Inc., NL Industries, Inc., Titanium Metals Corp. and Valhi, Inc. dated as of October 30, 2003. (Incorporated by reference to Exhibit 10.1 to the Registrant’s Annual Report on Form 10-K for the year ended December 31, 2003). |
| | |
| 10.2 | The Combined Master Retirement Trust between Contran Corporation and Harold C. Simmons as amended and restated effective September 30, 2005. |
| | |
| 10.3 | Keystone Consolidated Industries, Inc. Master Retirement Trust I between the Registrant and U.S. Bank National Association as amended and restated effective January 1, 2006. |
| | |
| 10.4 | Keystone Consolidated Industries, Inc. Master Retirement Trust II between the Registrant and U.S. Bank National Association as amended and restated effective January 1, 2006. |
| | |
| 10.5* | Form of Deferred Compensation Agreement between the Registrant and certain executive officers. (Incorporated by reference to Exhibit 10.1 to the Registrant's Quarterly Report on Form 10-Q (File No. 1-3919) for the quarter ended March 31, 1999). |
Exhibit No. | Exhibit Item |
| 10.6 | Intercorporate Services Agreement dated as of September 1, 2005 by and between Registrant and Contran Corporation. (Incorporated by reference to Exhibit 10.10 to the Registrant's Annual Report on Form 10-K for the year ended December 31, 2005). |
| | |
| 21.1 | Subsidiaries of the Company |
| | |
| 31.1 | Certification |
| | |
| 31.2 | Certification |
| | |
| 32.1 | Certification |
*Management contract, compensatory plan or agreement.
SIGNATURES
Pursuant to the requirements of Section 13 or 15(d) of the Securities Exchange Act of 1934, the registrant has duly caused this report to be signed on its behalf by the undersigned and dated March 28, 2007, thereunto duly authorized.
KEYSTONE CONSOLIDATED INDUSTRIES, INC. (Registrant) /s/ GLENN R. SIMMONS Glenn R. Simmons Chairman of the Board |
Pursuant to the requirements of the Securities Exchange Act of 1934, this report has been signed below and dated as of March 28, 2007 by the following persons on behalf of the registrant and in the capacities indicated:
/s/ GLENN R. SIMMONS Glenn R. Simmons Chairman of the Board | /s/ STEVEN L. WATSON Steven L. Watson Director |
/s/ PAUL M. BASS, JR. Paul M. Bass, Jr. Director | /s/ DONALD P. ZIMA Donald P. Zima Director |
/s/ RICHARD R. BURKHART Richard R. Burkhart Director | /s/ DAVID L. CHEEK David L. Cheek President and Chief Executive Officer |
/s/ JOHN R. PARKER John R. Parker Director | /s/ BERT E. DOWNING, JR. Bert E. Downing, Jr. Vice President, Chief Financial Officer, Corporate Controller and Treasurer (Principal Accounting and Financial Officer) |
/s/ TROY T. TAYLOR Troy T. Taylor Director | |
KEYSTONE CONSOLIDATED INDUSTRIES, INC. AND SUBSIDIARIES
ANNUAL REPORT ON FORM 10-K
Items 8, 15(a) and 15(c)
Index of Consolidated Financial Statements
| | |
| | Page |
| | |
Report of Independent Registered Public Accounting Firm | F-2 |
| | |
Consolidated Balance Sheets - December 31, 2005 and 2006 | F-3 |
| | |
Consolidated Statements of Operations - Years ended December 31, 2004, 2005 and 2006 | F-5 |
| | |
Consolidated Statements of Stockholders' Equity (Deficit) - Years ended December 31, 2004, 2005 and 2006 | F-7 |
| | |
Consolidated Statements of Cash Flows - Years ended December 31, 2004, 2005 and 2006 | F-8 |
| | |
| Notes to Consolidated Financial Statements | F-10 |
| | |
| | |
| | |
Report of Independent Registered Public Accounting Firm
To the Stockholders and Board of Directors of Keystone Consolidated Industries, Inc.:
In our opinion, the accompanying consolidated balance sheets and the related consolidated statements of operations, of changes in stockholders' equity (deficit) and of cash flows present fairly, in all material respects, the financial position of Keystone Consolidated Industries, Inc. and its subsidiaries at December 31, 2005 and 2006, and the results of their operations and their cash flows for each of the three years in the period ended December 31, 2006 in conformity with accounting principles generally accepted in the United States of America. These financial statements are the responsibility of the Company's management. Our responsibility is to express an opinion on these financial statements based on our audits. We conducted our audits of these statements in accordance with the standards of the Public Company Accounting Oversight Board (United States). Those standards require that we plan and perform the audit to obtain reasonable assurance about whether the financial statements are free of material misstatement. An audit includes examining, on a test basis, evidence supporting the amounts and disclosures in the financial statements, assessing the accounting principles used and significant estimates made by management, and evaluating the overall financial statement presentation. We believe that our audits provide a reasonable basis for our opinion.
As discussed in Note 14 to the consolidated financial statements, the Company changed the manner in which it accounts for pension and other postretirement benefit obligations in 2006.
PricewaterhouseCoopers LLP
Dallas, Texas
March 28, 2007
KEYSTONE CONSOLIDATED INDUSTRIES, INC.
AND SUBSIDIARIES
CONSOLIDATED BALANCE SHEETS
December 31, 2005 and 2006
(In thousands, except share data)
ASSETS | | 2005 | | 2006 | |
| | | | | | |
| | | | | | |
| Current assets: | | | | | | | |
| Accounts receivable, net of allowances of $451 and $304 | | $ | 46,199 | | $ | 31,661 | |
| Inventories | | | 69,691 | | | 61,343 | |
| Restricted investments | | | 1,040 | | | 1,067 | |
| Deferred income taxes | | | - | | | 12,571 | |
| Prepaid expenses and other | | | 2,760 | | | 3,516 | |
| | | | | | | | |
| Total current assets | | | 119,690 | | | 110,158 | |
| | | | | | | | |
| Property, plant and equipment: | | | | | | | |
| Land | | | 1,193 | | | 1,193 | |
| Buildings and improvements | | | 54,189 | | | 56,953 | |
| Machinery and equipment | | | 310,446 | | | 300,301 | |
| Construction in progress | | | 3,949 | | | 12,563 | |
| | | | 369,777 | | | 371,010 | |
| Less accumulated depreciation | | | 283,004 | | | 282,315 | |
| | | | | | | | |
| Net property, plant and equipment | | | 86,773 | | | 88,695 | |
| | | | | | | | |
| Other assets: | | | | | | | |
| Restricted investments | | | 4,758 | | | 6,079 | |
| Pension asset | | | 145,152 | | | 557,279 | |
| Other, net | | | 1,991 | | | 1,725 | |
| | | | | | | | |
| Total other assets | | | 151,901 | | | 565,083 | |
| | | | | | | | |
| | | | | | | | |
| Total assets | | $ | 358,364 | | $ | 763,936 | |
| | | | | | | | |
KEYSTONE CONSOLIDATED INDUSTRIES, INC.
AND SUBSIDIARIES
CONSOLIDATED BALANCE SHEETS (CONTINUED)
December 31, 2005 and 2006
(In thousands, except share data)
LIABILITIES AND STOCKHOLDERS' EQUITY | | | | | |
| | | 2005 | | 2006 | |
| | | | | | |
| | | | | | |
| Current liabilities: | | | | | | | |
| Notes payable and current maturities of long-term debt | | $ | 41,640 | | $ | 43,699 | |
| Accounts payable | | | 9,797 | | | 9,947 | |
| Accrued OPEB cost | | | 4,256 | | | 4,157 | |
| Other accrued liabilities | | | 27,624 | | | 20,579 | |
| | | | | | | | |
| Total current liabilities | | | 83,317 | | | 78,382 | |
| | | | | | | | |
| Noncurrent liabilities: | | | | | | | |
| Long-term debt | | | 58,255 | | | 32,749 | |
| Accrued OPEB cost | | | 133,208 | | | 31,005 | |
| Deferred income taxes | | | - | | | 197,712 | |
| Other | | | 5,577 | | | 6,414 | |
| | | | | | | | |
| Total noncurrent liabilities | | | 197,040 | | | 267,880 | |
| | | | | | | | |
| Liabilities subject to compromise | | | 10,476 | | | 14,012 | |
| | | | | | | | |
| | | | | | | | |
| Stockholders' equity: | | | | | | | |
Common stock $.01 par value, 11,000,000 shares authorized and 10,000,000 shares issued and outstanding at December 31, 2005 and 2006 | | | 100 | | | 100 | |
| Additional paid-in capital | | | 75,423 | | | 75,423 | |
| Accumulated other comprehensive income | | | - | | | 278,399 | |
| Retained earnings (accumulated deficit) | | | (7,992 | ) | | 49,740 | |
| | | | | | | | |
| Total stockholders' equity | | | 67,531 | | | 403,662 | |
| | | | | | | | |
| Total liabilities and stockholders’ equity | | $ | 358,364 | | $ | 763,936 | |
| | | | | | | | |
Commitments and contingencies (Notes 9 and 10).
See accompanying Notes to Consolidated Financial Statements.
KEYSTONE CONSOLIDATED INDUSTRIES, INC.
AND SUBSIDIARIES
CONSOLIDATED STATEMENTS OF OPERATIONS
Years ended December 31, 2004, 2005 and 2006
(In thousands, except per share data)
| | | 2004 | | 2005 | | 2006 | |
| | | | | | | | |
| Net sales | | $ | 364,335 | | $ | 367,545 | | $ | 440,540 | |
| Cost of goods sold | | | 308,086 | | | 329,589 | | | 405,719 | |
| | | | | | | | | | | |
| Gross margin | | | 56,249 | | | 37,956 | | | 34,821 | |
| | | | | | | | | | | |
| Selling expense | | | 5,336 | | | 6,247 | | | 6,864 | |
| General and administrative expense | | | 10,115 | | | 11,816 | | | 11,269 | |
| Defined benefit pension credit | | | (6,752 | ) | | (11,710 | ) | | (55,978 | ) |
| Other postretirement benefit expense (credit) | | | 20,909 | | | 8,885 | | | (8,297 | ) |
| | | | | | | | | | | |
| Total operating costs | | | 29,608 | | | 15,238 | | | (46,142 | ) |
| | | | | | | | | | | |
| | | | | | | | | | | |
| Operating income | | | 26,641 | | | 22,718 | | | 80,963 | |
| | | | | | | | | | | |
| Nonoperating income (expense): | | | | | | | | | | |
| Corporate expense | | | (439 | ) | | (2,525 | ) | | (1,213 | ) |
| Interest expense | | | (3,705 | ) | | (3,992 | ) | | (4,720 | ) |
| Interest income | | | 132 | | | 266 | | | 361 | |
| Gain on legal settlement | | | 5,284 | | | - | | | - | |
| Other income, net | | | 684 | | | 993 | | | 75 | |
| | | | | | | | | | | |
| Total nonoperating income (expense) | | | 1,956 | | | (5,258 | ) | | (5,497 | ) |
| | | | | | | | | |
| Income before income taxes and reorganization items | | | 28,597 | | | 17,460 | | 75,466 |
| | | | | | | | | | | |
| Reorganization items: | | | | | | | | | | |
| Reorganization costs | | | (11,158 | ) | | (10,308 | ) | | (679 | ) |
| Gain on cancellation of debt | | | - | | | 32,510 | | | - | |
| Total reorganization items | | | (11,158 | ) | | 22,202 | | | (679 | ) |
| | | | | | | | | | | |
| Income before income taxes | | | 17,439 | | | 39,662 | | | 74,787 | |
| | | | | | | | | | | |
| Provision for income taxes | | | 1,379 | | | 430 | | | 17,055 | |
| | | | | | | | | | | |
| Net income | | | 16,060 | | | 39,232 | | | 57,732 | |
| | | | | | | | | | | |
| Dividends on preferred stock | | | 1,223 | | | - | | | - | |
| | | | | | | | | | | |
| Net income available for common shares | | $ | 14,837 | | $ | 39,232 | | $ | 57,732 | |
KEYSTONE CONSOLIDATED INDUSTRIES, INC.
AND SUBSIDIARIES
CONSOLIDATED STATEMENTS OF OPERATIONS (CONTINUED)
Years ended December 31, 2004, 2005 and 2006
(In thousands, except per share data)
| | | 2004 | | 2005 | | 2006 | |
| | | | | | | | |
| Basic earnings per share available for common shares | | $ | 1.47 | | $ | 4.12 | | $ | 5.77 | |
| | | | | | | | | | | |
| Basic shares outstanding | | | 10,068 | | | 10,046 | | | 10,000 | |
| | | | | | | | | | | |
| Diluted earnings per share available for common shares | | $ | .57 | | $ | 1.88 | | $ | 5.77 | |
| | | | | | | | | | | |
| Diluted shares outstanding | | | 28,043 | | | 22,029 | | | 10,000 | |
| | | | | | | | | | | |
| | | | | | | | | | | |
See accompanying Notes to Consolidated Financial Statements.
KEYSTONE CONSOLIDATED INDUSTRIES, INC.
AND SUBSIDIARIES
CONSOLIDATED STATEMENTS OF STOCKHOLDERS' EQUITY (DEFICIT)
Years ended December 31, 2004, 2005 and 2006
(In thousands)
| | | Common stock | | Additional paid-in | | Accumulated other comprehensive | | Accumulated other comprehensive | | Retained earnings | | Treasury | | | |
| | | Shares | | Amount | | capital | | income - Pension | | income - OPEB | | (accumulated deficit) | | stock | | Total | |
| | | | | | | | | | | | | | | | | | |
| Balance - December 31, 2003 | | | 10,068 | | $ | 10,798 | | $ | 42,448 | | $ | - | | $ | - | | $ | (63,284 | ) | $ | (12 | ) | $ | (10,050 | ) |
| | | | | | | | | | | | | | | | | | | | | | | | | | |
| Net income | | | - | | | - | | | - | | | - | | | - | | | 16,060 | | | - | | | 16,060 | |
| | | | | | | | | | | | | | | | | | | | | | | | | | |
| Preferred stock dividends | | | - | | | - | | | (1,223 | ) | | - | | | - | | | - | | | - | | | (1,223 | ) |
| | | | | | | | | | | | | | | | | | | | | | | | | | |
| Balance - December 31, 2004 | | | 10,068 | | | 10,798 | | | 41,225 | | | - | | | - | | | (47,224 | ) | | (12 | ) | | 4,787 | |
| | | | | | | | | | | | | | | | | | | | | | | | | | |
| Net income | | | - | | | - | | | - | | | - | | | - | | | 39,232 | | | - | | | 39,232 | |
| | | | | | | | | | | | | | | | | | | | | | | | | | |
| Cancellation of common stock | | | (10,068 | ) | | (10,798 | ) | | 10,786 | | | - | | | - | | | - | | | 12 | | | - | |
| | | | | | | | | | | | | | | | | | | | | | | | | | |
| Cancellation of Series A Preferred Stock | | | - | | | - | | | 2,112 | | | - | | | - | | | - | | | - | | | 2,112 | |
| | | | | | | | | | | | | | | | | | | | | | | | | | |
| Issuance of common stock | | | 10,000 | | | 100 | | | 21,300 | | | - | | | - | | | - | | | - | | | 21,400 | |
| | | | | | | | | | | | | | | | | | | | | | | | | | |
| Balance - December 31, 2005 | | | 10,000 | | | 100 | | | 75,423 | | | - | | | - | | | (7,992 | ) | | - | | | 67,531 | |
| | | | | | | | | | | | | | | | | | | | | | | | | | |
| Net income | | | - | | | - | | | - | | | - | | | - | | | 57,732 | | | - | | | 57,732 | |
| | | | | | | | | | | | | | | | | | | | | | | | | | |
| Adoption of SFAS No. 158 | | | - | | | - | | | - | | | 222,202 | | | 56,197 | | | - | | | - | | | 278,399 | |
| | | | | | | | | | | | | | | | | | | | | | | | | | |
| Balance - December 31, 2006 | | | 10,000 | | $ | 100 | | $ | 75,423 | | $ | 222,202 | | $ | 56,197 | | $ | 49,740 | | $ | - | | $ | 403,662 | |
| | | | | | | | | | | | | | | | | | | | | | | | | | |
See accompanying Notes to Consolidated Financial Statements.
KEYSTONE CONSOLIDATED INDUSTRIES, INC.
AND SUBSIDIARIES
CONSOLIDATED STATEMENTS OF CASH FLOWS
Years ended December 31, 2004, 2005 and 2006
(In thousands)
| | | 2004 | | 2005 | | 2006 | |
| | | | | | | | |
| Cash flows from operating activities: | | | | | | | | | | |
| Net income | | $ | 16,060 | | $ | 39,232 | | $ | 57,732 | |
| Depreciation and amortization | | | 15,812 | | | 15,745 | | | 15,222 | |
| Amortization of deferred financing costs | | | 1,108 | | | 694 | | | 273 | |
| Deferred income taxes | | | - | | | - | | | 17,317 | |
| Non-cash defined benefit pension credit | | | (6,752 | ) | | (11,710 | ) | | (55,978 | ) |
| OPEB expense (credit) | | | 20,909 | | | 8,885 | | | (8,297 | ) |
| OPEB payments | | | (5,254 | ) | | (8,324 | ) | | (3,931 | ) |
| Reorganization costs accrued | | | 11,158 | | | 10,308 | | | 679 | |
| Reorganization costs paid | | | (8,275 | ) | | (10,133 | ) | | (3,722 | ) |
| Impairment of long-lived assets | | | - | | | - | | | 529 | |
| Gain on cancellation of debt | | | - | | | (32,510 | ) | | - | |
| Gain on legal settlement | | | (5,284 | ) | | - | | | - | |
| Other, net | | | 576 | | | 29 | | | 838 | |
| Change in assets and liabilities: | | | | | | | | | | |
| Accounts receivable | | | (11,049 | ) | | (19,473 | ) | | 14,610 | |
| Inventories | | | (29,012 | ) | | (16,674 | ) | | 8,348 | |
| Accounts payable | | | 8,155 | | | 4,252 | | | 94 | |
| Other, net | | | 3,702 | | | (11,006 | ) | | (257 | ) |
| | | | | | | | | | | |
| Net cash provided by (used in) operating activities | | | 11,854 | | | (30,685 | ) | | 43,457 | |
| | | | | | | | | | | |
| Cash flows from investing activities: | | | | | | | | | | |
| Capital expenditures | | | (5,080 | ) | | (9,772 | ) | | (18,739 | ) |
| Restricted investments, net | | | (5,467 | ) | | 5,540 | | | (1,348 | ) |
| Other, net | | | 151 | | | 1,336 | | | 108 | |
| | | | | | | | | | | |
| Net cash used in investing activities | | | (10,396 | ) | | (2,896 | ) | | (19,979 | ) |
| | | | | | | | | | | |
| Cash flows from financing activities: | | | | | | | | | | |
| Revolving credit facilities, net | | | (14,222 | ) | | 28,314 | | | (18,439 | ) |
| Other notes payable and long-term debt: | | | | | | | | | | |
| Additions | | | 16,028 | | | 23,372 | | | 468 | |
| Principal payments | | | (2,537 | ) | | (17,575 | ) | | (5,477 | ) |
| Deferred financing costs paid | | | (727 | ) | | (530 | ) | | (30 | ) |
| | | | | | | | | | | |
| Net cash provided by (used in) financing activities | | | (1,458 | ) | | 33,581 | | | (23,478 | ) |
| | | | | | | | | | | |
KEYSTONE CONSOLIDATED INDUSTRIES, INC.
AND SUBSIDIARIES
CONSOLIDATED STATEMENTS OF CASH FLOWS (CONTINUED)
Years ended December 31, 2004, 2005 and 2006
(In thousands)
| | | 2004 | | 2005 | | 2006 | |
| | | | | | | | |
| Cash and cash equivalents: | | | | | | | | | | |
| Net change from operations, investing and financing activities | | | - | | | - | | | - | |
| | | | | | | | | | | |
| Balance at beginning of year | | | - | | | - | | | - | |
| | | | | | | | | | | |
| Balance at end of year | | $ | - | | $ | - | | $ | - | |
| | | | | | | | | | | |
| | | | | | | | | | | |
| Supplemental disclosures: | | | | | | | | | | |
| Cash paid for: | | | | | | | | | | |
| Interest, net of amounts capitalized | | $ | 2,306 | | $ | 3,195 | | $ | 3,950 | |
| Income taxes, net | | | (27 | ) | | 985 | | | 179 | |
| Common stock issued in exchange for extinguishment of certain pre-petition unsecured and DIP claims | | | - | | | 21,400 | | | - | |
| Note issued in exchange for extinguishment of certain pre-petition unsecured claims | | | - | | | 4,800 | | | - | |
| | | | | | | | | | | |
See accompanying Notes to Consolidated Financial Statements.
KEYSTONE CONSOLIDATED INDUSTRIES, INC.
AND SUBSIDIARIES
NOTES TO CONSOLIDATED FINANCIAL STATEMENTS
December 31, 2006
Note 1 - Summary of significant accounting policies:
Organization. Keystone Consolidated Industries, Inc. (“KCI” or “Keystone”) (OTCBB: KYCN) is majority owned by Contran Corporation, which owns approximately 51.0% of our outstanding common stock at December 31, 2006. Substantially all of Contran's outstanding voting stock is held by trusts established for the benefit of certain children and grandchildren of Harold C. Simmons (for which Mr. Simmons is the sole trustee) or is held directly by Mr. Simmons or other persons or related companies to Mr. Simmons. Consequently, Mr. Simmons may be deemed to control Contran and us.
Basis of Presentation. Our Consolidated Financial Statements include the accounts of Keystone and our majority-owned subsidiaries. All material intercompany accounts and balances have been eliminated.
Our fiscal year is 52 or 53 weeks and ends on the last Sunday in December. Each of 2004 and 2005 were 52-week years while 2006 was a 53-week year.
On February 26, 2004, we and five of our direct and indirect subsidiaries filed for voluntary protection under Chapter 11 of the Federal Bankruptcy Code. We emerged from bankruptcy protection on August 31, 2005. Prior to our emergence from Chapter 11 on August 31, 2005, Contran and other entities related to Mr. Simmons, beneficially owned approximately 50% of our outstanding common stock. In connection with our emergence from Chapter 11, one of our Debtor-In-Possession (“DIP”) lenders, EWP Financial, LLC (an affiliate of Contran) converted $5 million of its DIP credit facility, certain of its pre-petition unsecured claims and all of its administrative claims against us into 51% of our new common stock. As such, Contran, or one of its affiliates, may be deemed to control us both prior, and subsequent to, our emergence from Chapter 11. Because our emergence from Chapter 11 did not result in a change of control, we did not qualify to use Fresh Start Accounting upon our emergence from Chapter 11. As such, pre-petition claims of our entities that have not closed their bankruptcy cases are classified as liabilities subject to compromise on our Consolidated Balance Sheets.
Unless otherwise indicated, references in this report to “we,” “us” or “our” refer to Keystone Consolidated Industries, Inc. and its subsidiaries, taken as a whole.
Reclassifications. Because OPEB expense or credits are unrelated to the operating activities of our business, as of December 31, 2006, we began reporting our OPEB expense or credit on a separate line item in our Consolidated Statement of Operations. Previously, the OPEB expense or credit was allocated among cost of goods sold, selling expense, general and administrative expense, and corporate expense. The impact of this reclassification on statement of operations line items is included in the following table.
| | | Years ended December 31, | |
| | | 2004 | | 2005 | |
| | | (In thousands) | |
| | | As Previously Reported | | OPEB Reclass Increase/ (Decrease) | | As Currently Reported | | As Previously Reported | | OPEB Reclass Increase/ (Decrease) | | As Currently Reported | |
| | | | | | | | | | | | | | |
| Cost of goods sold | | $ | 322,232 | | $ | (14,146 | ) | $ | 308,086 | | $ | 337,541 | | $ | (7,952 | ) | $ | 329,589 | |
| Gross margin | | | 42,103 | | | 14,146 | | | 56,249 | | | 30,004 | | | 7,952 | | | 37,956 | |
| | | | | | | | | | | | | | | | | | | | |
| Selling Expense | | | 5,634 | | | (298 | ) | | 5,336 | | | 6,251 | | | (4 | ) | | 6,247 | |
| General and administrative expense | | | 10,766 | | | (651 | ) | | 10,115 | | | 11,804 | | | 12 | | | 11,816 | |
| Other postretirement benefit expense | | | - | | | 20,909 | | | 20,909 | | | - | | | 8,885 | | | 8,885 | |
| Total operating costs | | | 9,648 | | | 19,960 | | | 29,608 | | | 6,345 | | | 8,893 | | | 15,238 | |
| | | | | | | | | | | | | | | | | | | | |
| Operating income | | | 32,455 | | | (5,814 | ) | | 26,641 | | | 23,659 | | | (941 | ) | | 22,718 | |
| | | | | | | | | | | | | | | | | | | | |
| Corporate expense | | | 6,253 | | | (5,814 | ) | | 439 | | | 3,466 | | | (941 | ) | | 2,525 | |
| Total nonoperating expense | | | 3,858 | | | (5,814 | ) | | (1,956 | ) | | 6,199 | | | (941 | ) | | 5,258 | |
Certain other prior year amounts in our Consolidated Financial Statements have also been reclassified to conform with the fiscal 2006 presentation.
Management's Estimates. The preparation of financial statements in conformity with GAAP requires us to make estimates and assumptions that affect the reported amounts of assets and liabilities and disclosure of contingent assets and liabilities at the date of the financial statements, and the reported amount of revenues and expenses during the reporting period. Actual results may differ from previously estimated amounts under different assumptions or conditions.
Accounts receivable. We provide an allowance for doubtful accounts for known and estimated potential losses arising from our sales to customers based on a periodic review of these accounts.
Inventories and cost of sales. Inventories are stated at the lower of cost or market net of allowance for obsolete and slow-moving inventories. The last-in, first-out ("LIFO") method is used to determine the cost of approximately 81% and 77% of the inventories held at December 31, 2005 and 2006, respectively. The first-in, first-out or average cost methods are used to determine the cost of all other inventories. Cost of sales include costs for materials, packing and finishing, utilities, salaries and benefits, maintenance, shipping and handling costs and depreciation.
Property, plant and equipment and depreciation expense. Property, plant and equipment are stated at cost. Depreciation for financial reporting purposes is computed using principally the straight-line method over the estimated useful lives of 10 to 30 years for buildings and improvements and three to 12 years for machinery and equipment. Accelerated depreciation methods are used for income tax purposes, as permitted. Depreciation expense for financial reporting purposes was $15.8 million, $15.7 million and $15.2 million during 2004, 2005 and 2006, respectively. Upon sale or retirement of an asset, the related cost and accumulated depreciation are removed from the accounts and any gain or loss is recognized in income currently.
We expense expenditures for maintenance, repairs and minor renewals as incurred, including planned major maintenance. See Note 14. We capitalize expenditures for major improvements. We capitalize interest costs related to major long-term capital projects and renewals as a component of construction costs. We did not capitalize any material interest costs in 2004, 2005 or 2006.
When events or changes in circumstances indicate assets may be impaired, an evaluation is performed to determine if an impairment exists. Such events or changes in circumstances include, among other things, (i) significant current and prior periods or current and projected periods with operating losses, (ii) a significant decrease in the market value of an asset or (iii) a significant change in the extent or manner in which an asset is used. All relevant factors are considered. The test for impairment is performed by comparing the estimated future undiscounted cash flows (exclusive of interest expense) associated with the asset to the asset's net carrying value to determine if a write-down to market value or discounted cash flow value is required. We assess impairment of other long-lived assets (such as property and equipment) in accordance with Statement of Financial Accounting Standards ("SFAS") No. 144, Accounting for the Impairment or Disposal of Long-Lived Assets. As we decided to no longer use certain manufacturing equipment during 2006, certain assets were assessed for impairment which resulted in the assets being marked down to their estimated sales value. See Note 3.
Long-term debt and deferred financing costs. We state long-term debt net of any unamortized original issue premium or discount. We classify amortization of deferred financing costs and any premium or discount associated with the issuance of indebtedness in interest expense, and compute such amortization by the interest method over the term of the applicable issue.
Pension plans and other postretirement benefits. Accounting and funding policies for our pension plans and other postretirement benefits are described in Note 8.
Environmental liabilities. We record liabilities related to environmental remediation when estimated future expenditures are probable and reasonably estimable. If we are unable to determine that a single amount in an estimated range is more likely, we record the minimum amount of the range. Such accruals are adjusted as further information becomes available or circumstances change. Estimated future expenditures are not discounted to their present value. Recoveries of environmental remediation costs from other parties are recorded as assets when their receipt is deemed probable. We did not have any such assets recorded at December 31, 2005 or 2006. See Note 9.
Income taxes. Deferred income tax assets and liabilities are recognized for the expected future tax consequences of temporary differences between the income tax and financial reporting carrying amounts of assets and liabilities. We periodically evaluate our deferred tax assets and adjust any related valuation allowance based on the estimate of the amount of such deferred tax assets which we believe does not meet the “more-likely-than-not” recognition criteria.
Net sales. Sales are recorded when products are shipped because title and other risks and rewards of ownership have passed to the customer. Shipping terms of products shipped are generally FOB shipping point, although in some instances shipping terms are FOB destination point (for which sales are not recognized until the product is received by the customer). Amounts charged to customers for shipping and handling are included in net sales. Sales are stated net of price, early payment and distributor discounts and volume rebates.
Selling, general and administrative expenses. Selling, general and administrative expenses include costs related to marketing, sales, distribution, and administrative functions such as accounting, treasury and finance, and includes costs for salaries and benefits, travel and entertainment, promotional materials and professional fees. Advertising costs, expensed as incurred, were $1.0 million in both 2005 and 2006.
Corporate expenses. Corporate expenses include expenses related to the maintenance of our corporate office and environmental expenses related to facilities that we no longer own. Corporate expenses are not included in total operating income or loss.
Chapter 11. Legal and professional fees incurred in connection with our Chapter 11 filing have been expensed as incurred. These fees relate primarily to fees paid to lawyers and financial advisors representing us as well as the other impacted constituencies.
We determined there was insufficient collateral to cover the interest portion of scheduled payments on our pre-petition unsecured debt. As such, we discontinued accruing interest on our unsecured 6% Notes and unsecured 9 5/8% Notes as of February 26, 2004, the filing date. Contractual interest on those obligations subsequent to February 26, 2004 and through the date of our emergence from Chapter 11 (August 31, 2005), was approximately $1.0 million in 2004 and $841,000 in 2005, and as such, contractual interest expense during 2004 and 2005 exceeded recorded interest expense by those respective amounts. In addition, we also discontinued accruing dividends on our preferred stock at the filing date.
Earnings per share. Basic and diluted earnings per share is based upon the weighted average number of common shares actually outstanding during each year. Diluted earnings per share includes the diluted impact, if any, of our convertible preferred stock. The impact of outstanding stock options was antidilutive for all periods presented. The weighted average number of outstanding stock options which were excluded from the calculation of diluted earnings per share because their impact would have been antidilutive approximated 374,000 and 244,000 in 2004 and 2005, respectively. No stock options were outstanding during 2006.
Note 2 - Bankruptcy:
On February 26, 2004, we and five of our direct and indirect subsidiaries filed for voluntary protection under Chapter 11 of the Federal Bankruptcy Code. We attributed the need to reorganize to weaknesses in product selling prices over the preceding several years, unprecedented increases in ferrous scrap costs, our primary raw material, and significant liquidity needs to service retiree medical costs. These problems substantially limited our liquidity and undermined our ability to obtain sufficient debt or equity capital to operate as a going concern.
We emerged from bankruptcy protection on August 31, 2005 and obtained a five-year $80 million secured credit facility from Wachovia Capital Finance (Central) (“Wachovia”). Significant provisions of our plan of reorganization included:
| · | greater employee participation in healthcare costs; |
| · | a permanent reduction in healthcare related payments to retirees; |
| · | cancellation of all shares of our common and preferred stock outstanding at the petition date; |
| · | full reinstatement of obligations due to our pre-petition secured lenders other than our DIP lenders; and |
| · | pre-petition unsecured creditors, a debtor-in-possession secured lender and certain post-petition creditors with allowed claims against us in the amount of approximately $63.9 million received, on a pro rata basis, in the aggregate, $5.2 million in cash, a $4.8 million secured promissory note and 100% of our new common stock (valued at $21.4 million). As a result, we recorded a $32.5 million gain from cancellation of debt during 2005. The following table summarizes the significant components of compromised liabilities and the related gain from cancellation of debt. |
| | | Unsecured claims other than Contran | | Contran claims | | Total | |
| | | (In thousands) | |
| | | | | | | | |
| Liabilities compromised: | | | | | | | | | | |
| 6% Notes | | $ | 16,031 | | $ | - | | $ | 16,031 | |
| Accrued Series A Preferred Stock dividends | | | 1,098 | | | 10,748 | | | 11,846 | |
| Accounts payable - pre-petition | | | 7,576 | | | 3,279 | | | 10,855 | |
| Accounts payable - post-petition | | | - | | | 1,179 | | | 1,179 | |
| Deferred vendor payments | | | 10,518 | | | - | | | 10,518 | |
| 9 5/8% Notes | | | 6,150 | | | - | | | 6,150 | |
| DIP loan | | | - | | | 5,000 | | | 5,000 | |
| Accrued interest | | | 1,236 | | | - | | | 1,236 | |
| Accrued environmental | | | 868 | | | - | | | 868 | |
| Other, net | | | 227 | | | - | | | 227 | |
| Total liabilities compromised | | | 43,704 | | | 20,206 | | | 63,910 | |
| | | | | | | | | | | |
| Consideration provided: | | | | | | | | | | |
| Cash | | | 5,200 | | | - | | | 5,200 | |
| Secured Note | | | 4,800 | | | - | | | 4,800 | |
| Common stock | | | 10,486 | | | 10,914 | | | 21,400 | |
| Total consideration provided | | | 20,486 | | | 10,914 | | | 31,400 | |
| | | | | | | | | | | |
| Gain on cancellation of debt | | $ | 23,218 | | $ | 9,292 | | $ | 32,510 | |
Liabilities subject to compromise. Before the bankruptcy can be completely closed, all claims must be adjudicated. As of December 31, 2006, only two significant claims had not been adjudicated: (i) an environmental claim against Sherman Wire Company (“SWC”), one of our pre-petition wholly-owned subsidiaries, and (ii) an employment related claim against KCI.
Upon emergence from Chapter 11, certain operating assets and existing operations of SWC were sold at fair market value (fair market value and book value both approximated $2.0 million) to us, which were then used to form and operate KWP. SWC was also reorganized and the proceeds of the operating assets sold to us, liquidation of SWC’s remaining real estate assets (book value approximates $1.6 million), and other funds (including $4.0 million of proceeds from a settlement agreement with a former insurer received in the second quarter of 2006, as discussed below and in Note 10) will be distributed, on a pro rata basis, to SWC’s pre-petition unsecured creditors when all claims have been finally adjudicated. The total amount that will ultimately be distributed to SWC’s pre-petition unsecured creditors will be limited to the lesser of (i) the total of the claims granted by the bankruptcy court and (ii) the total funds available to be distributed. Because all of the claims of SWC’s pre-petition unsecured creditors have not yet been finally adjudicated, all of SWC’s liabilities are still classified as liabilities subject to compromise on our Consolidated Balance Sheets and are as follows:
| | | December 31, | |
| | | 2005 | | 2006 | |
| | | (In thousands) | |
| | | | |
| Environmental | | $ | 8,491 | | $ | 8,481 | |
| Accounts payable | | | 850 | | | 789 | |
| Disposition of former facilities | | | 684 | | | 442 | |
| Legal and professional | | | 244 | | | 80 | |
| Other | | | 207 | | | 4,220 | |
| | | | | | | | |
| | | $ | 10,476 | | $ | 14,012 | |
During 2006, SWC received $4.0 million from a former insurer under a Court approved settlement agreement. Under the terms of that settlement agreement, the insurer withdrew certain claims it had filed against SWC in SWC’s bankruptcy proceedings, in exchange for which SWC released that insurer from their liability to insure SWC for environmental coverage. SWC currently anticipates a significant portion of the ultimate payment of its pre-petition unsecured liabilities will be funded with this $4.0 million. The settlement agreement limits SWC’s use of the proceeds to payment of SWC’s pre-petition unsecured claims, which we have classified as noncurrent liabilities at December 31, 2006. Accordingly, we have classified the $4.0 million we received as a noncurrent asset included in restricted investments. Because of the restriction, we have also classified the $4.0 million as a liability subject to compromise on our December 31, 2006 Consolidated Balance Sheet.
Note 3 - Business Segment Information:
Our operating segments are defined as components of consolidated operations about which separate financial information is available that is regularly evaluated by the chief operating decision maker in determining how to allocate resources and in assessing performance. Our chief operating decision maker is our President and Chief Executive Officer. Each operating segment is separately managed, and each operating segment represents a strategic business unit offering different products.
Our operating segments are organized by our manufacturing facilities and include three reportable segments:
| · | Keystone Steel and Wire (“KSW”), located in Peoria, Illinois, operates an electric arc furnace mini-mill and manufactures and sells wire rod, industrial wire, nails, coiled rebar and fabricated wire products for agricultural, industrial, construction, commercial, original equipment manufacturers and retail consumer markets; |
| · | Engineered Wire Products (“EWP”), located in Upper Sandusky, Ohio, manufactures and sells welded wire reinforcement in both roll and sheet form that is utilized in concrete construction products including pipe, pre-cast boxes and applications for use in roadways, buildings and bridges; and |
| · | Keystone Wire Products (“KWP”), located in Sherman, Texas, manufactures and sells industrial wire and fabricated wire products for agricultural, industrial, construction, commercial, original equipment manufacturers and retail consumer markets. |
In connection with our emergence from Chapter 11 on August 31, 2005, certain operating assets and existing operations of SWC were sold to us at fair market value. We then used these assets to form and operate KWP. As such, operating results of this segment prior to our emergence from Chapter 11 were operating results of Sherman. Operating results of this segment after our emergence from Chapter 11, are operating results of KWP. In accordance with our plan of reorganization, the remaining assets of SWC will eventually be liquidated.
During 2006, we decided to relocate KWP’s industrial wire manufacturing process to KSW. Certain of KWP’s industrial wire production equipment will be transferred to KSW. KWP recorded an impairment charge of $172,000 to write down the carrying value of the industrial wire production equipment to be sold to an estimated fair value of $130,000 (included in other current assets on our December 31, 2006 Consolidated Balance Sheet).
We also decided to discontinue our nail operations during 2006. We anticipate all nail production will be phased out by the second quarter of 2007, after which we plan to sell our nail production equipment. KSW recorded an impairment charge of $357,000 to write down the carrying value of the nail production equipment to be sold to an estimated fair value of $500,000 (included in machinery and equipment on our December 31, 2006 Consolidated Balance Sheet). The sales and operating income (loss) of our nail operations is not material to our operating results.
During 2006, because pension and OPEB expense or credits are unrelated to the operating activities of our business, we began measuring our segments’ profitability based on operating income before pension and OPEB. Accordingly, we have made adjustments to the previously reported operating income by segment as set forth in the following table.
| | | Years ended December 31, | |
| | | 2004 | | 2005 | |
| | | (In thousands) | |
| | | Operating income/(loss) Previously Reported | | Elimination of Pension/OPEB | | Operating income Currently Reported | | Operating income/(loss) Previously Reported | | Elimination of Pension/OPEB | | Operating income/(loss) Currently Reported | |
| | | | | | | | | | | | | | |
| KSW | | $ | 10,126 | | $ | 23,873 | | $ | 33,999 | | $ | (6,091 | ) | $ | 16,212 | | $ | 10,121 | |
| EWP | | | 10,598 | | | 218 | | | 10,816 | | | 9,481 | | | 218 | | | 9,699 | |
| KWP | | | (422 | ) | | 717 | | | 295 | | | (1,674 | ) | | (163 | ) | | (1,837 | ) |
| Corporate items | | | 12,153 | | | (30,622 | ) | | (18,469 | ) | | 21,943 | | | (17,208 | ) | | 4,735 | |
| Total | | $ | 32,455 | | $ | (5,814 | ) | $ | 26,641 | | $ | 23,659 | | $ | (941 | ) | $ | 22,718 | |
The accounting policies of our segments are the same as those described in the summary of significant accounting policies except that (i) no defined benefit pension or OPEB expense or credits are recognized (ii) elimination of intercompany profit or loss on ending inventory balances is not allocated to each segment, and (iii) LIFO inventory reserve adjustments are not allocated to each segment. Intercompany sales between reportable segments are generally recorded at prices that approximate market prices to third-party customers.
| | | Years ended December 31, | |
| | | 2004 | | 2005 | | 2006 | |
| | | (In thousands) | |
| | | | | | | | |
| Net sales: | | | | | | | | | | |
| KSW | | $ | 346,703 | | $ | 342,139 | | $ | 414,927 | |
| EWP | | | 58,982 | | | 62,777 | | | 58,748 | |
| Sherman/KWP | | | 16,193 | | | 18,024 | | | 17,664 | |
| Elimination of intersegment sales: | | | | | | | | | | |
| KSW | | | (47,586 | ) | | (44,048 | ) | | (39,131 | ) |
| EWP | | | - | | | - | | | - | |
| Sherman/KWP | | | (10,006 | ) | | (11,347 | ) | | (11,668 | ) |
| Other | | | 49 | | | - | | | - | |
| | | | | | | | | | | |
| Total net sales | | $ | 364,335 | | $ | 367,545 | | $ | 440,540 | |
| | | | | | | | | | | |
| Operating income (loss): | | | | | | | | | | |
| KSW | | $ | 33,999 | | $ | 10,121 | | $ | 7,505 | |
| EWP | | | 10,816 | | | 9,699 | | | 9,464 | |
| Sherman/KWP | | | 295 | | | (1,837 | ) | | (947 | ) |
| Pension credit | | | 6,752 | | | 11,710 | | | 55,978 | |
| OPEB credit (expense) | | | (20,909 | ) | | (8,885 | ) | | 8,297 | |
Allocation differences(1) | | | (4,312 | ) | | 1,910 | | | 666 | |
| | | | | | | | | | | |
| Total operating income | | | 26,641 | | | 22,718 | | | 80,963 | |
| | | | | | | | | | | |
| Nonoperating income (expense): | | | | | | | | | | |
| Corporate expense | | | (439 | ) | | (2,525 | ) | | (1,213 | ) |
| Interest expense | | | (3,705 | ) | | (3,992 | ) | | (4,720 | ) |
| Interest income | | | 132 | | | 266 | | | 361 | |
| Gain on legal settlement | | | 5,284 | | | - | | | - | |
| Other income, net | | | 684 | | | 993 | | | 75 | |
| | | | | | | | | | | |
| Income before income taxes and reorganization items | | $ | 28,597 | | $ | 17,460 | | $ | 75,466 | |
(1)Allocation differences are the elimination of intercompany profit or loss on ending inventory balances and LIFO inventory reserve adjustments.
Substantially all of our assets are located in the United States. Segment assets are comprised of all assets attributable to each reportable operating segment. Corporate assets consist principally of the pension asset, restricted investments, deferred tax assets and corporate property, plant and equipment.
| | | December 31, | |
| | | 2004 | | 2005 | | 2006 | |
| | | (In thousands) | |
| Total assets: | | | | | | | | | | |
| KSW | | $ | 146,869 | | $ | 178,697 | | $ | 160,364 | |
| EWP | | | 26,708 | | | 22,750 | | | 19,381 | |
| Sherman/KWP | | | 7,891 | | | 5,260 | | | 2,075 | |
| Corporate | | | 141,814 | | | 151,657 | | | 582,116 | |
| | | | | | | | | | | |
| Total | | $ | 323,282 | | $ | 358,364 | | $ | 763,936 | |
| | | | | | | | | | | |
| | | | |
| | | Years ended December 31, | |
| | | 2004 | | 2005 | | 2006 | |
| | | (In thousands) | |
| Depreciation and amortization: | | | | | | | | | | |
| KSW | | $ | 13,418 | | $ | 13,486 | | $ | 13,221 | |
| EWP | | | 1,037 | | | 1,034 | | | 1,040 | |
| Sherman/KWP | | | 1,171 | | | 1,133 | | | 676 | |
| Corporate | | | 186 | | | 92 | | | 285 | |
| | | | | | | | | | | |
| Total | | $ | 15,812 | | $ | 15,745 | | $ | 15,222 | |
| | | | | | | | | | | |
| Capital expenditures: | | | | | | | | | | |
| KSW | | $ | 4,727 | | $ | 9,450 | | $ | 12,242 | |
| EWP | | | 274 | | | 201 | | | 6,388 | |
| Sherman/KWP | | | 77 | | | 121 | | | 48 | |
| Corporate | | | 2 | | | - | | | 61 | |
| | | | | | | | | | | |
| Total | | $ | 5,080 | | $ | 9,772 | | $ | 18,739 | |
| | | | | | | | | | | |
Most of our products are distributed in the Midwestern, Southwestern, and Southeastern United States. Information concerning geographic concentration of net sales based on location of customer is as follows:
| | | Years ended December 31, | |
| | | 2004 | | 2005 | | 2006 | |
| | | (In thousands) | |
| | | | | | | | |
| United States | | $ | 359,575 | | $ | 360,282 | | $ | 431,122 | |
| Canada | | | 4,437 | | | 6,329 | | | 8,036 | |
| Great Britain | | | 180 | | | 657 | | | 1,156 | |
| Australia | | | 63 | | | 277 | | | 226 | |
| Ireland | | | 80 | | | - | | | - | |
| | | | | | | | | | | |
| | | $ | 364,335 | | $ | 367,545 | | $ | 440,540 | |
Note 4 - Inventories, net:
| | | December 31, | |
| | | 2005 | | 2006 | |
| | | (In thousands) | |
| | | | | | |
| Raw materials | | $ | 10,914 | | $ | 9,735 | |
| Work in process | | | 29,550 | | | 25,391 | |
| Finished products | | | 28,018 | | | 26,513 | |
| Supplies | | | 16,421 | | | 18,283 | |
| | | | | | | | |
| Inventory at FIFO | | | 84,903 | | | 79,922 | |
| Less LIFO reserve | | | 15,212 | | | 18,579 | |
| | | | | | | | |
| Total | | $ | 69,691 | | $ | 61,343 | |
| | | | | | | | |
Note 5 - Notes payable and long-term debt:
| | | December 31, | |
| | | 2005 | | 2006 | |
| | | (In thousands) | |
| | | | | | |
| Wachovia revolving credit facility | | $ | 36,174 | | $ | 17,734 | |
| 8% Notes | | | 26,532 | | | 25,740 | |
| UC Note | | | 4,997 | | | 5,465 | |
| Term loans: | | | | | | | |
| Wachovia | | | 21,980 | | | 17,390 | |
| County | | | 10,000 | | | 10,000 | |
| Other | | | 212 | | | 119 | |
| | | | | | | | |
| Total debt | | | 99,895 | | | 76,448 | |
| Less current maturities | | | 41,640 | | | 43,699 | |
| | | | | | | | |
| Total long-term debt | | $ | 58,255 | | $ | 32,749 | |
Wachovia Facility. We obtained an $80 million secured credit facility from Wachovia in connection with our emergence from Chapter 11 (the “Wachovia Facility”). Proceeds from the Wachovia Facility were used to extinguish our DIP credit facilities, the EWP Term Loan and the EWP Revolver that were then outstanding and to provide working capital for our reorganized company. The Wachovia Facility includes a term loan in the amount of up to $25.0 million, subject to a borrowing base calculation based on the market value of our real property and equipment. To the extent there is sufficient borrowing base, the term loan portion of the Wachovia Facility can be reloaded in the amount of $10.0 million. The portion of the credit facility in excess of the term loan balance and outstanding letters of credit is available as a revolving credit facility subject to a borrowing base calculation based on eligible receivables and inventory balances. At December 31, 2006, $5.5 million of letters of credit were outstanding and unused credit available for borrowing under the Wachovia facility was $23.7 million. During the first quarter of 2007, the Wachovia Facility was amended, increasing the total committed facility amount from $80.0 million to $100.0 million, in part to finance the CaluMetals acquisition.
Interest rates on the credit facility range from the prime rate to the prime rate plus .5% depending on our excess availability, as defined in the credit agreement (8.5% at December 31, 2006). The Wacovia Facility also provides for a LIBOR interest rate option.
The Wachovia Facility requires our daily net cash receipts to be used to reduce the outstanding borrowings, which results in us maintaining zero cash balances so long as there is an outstanding balance under this facility. Accordingly, any outstanding balances under the revolving credit portion of the Wachovia Facility are always classified as a current liability, regardless of the maturity date of the facility. We are also required to annually pay down the term loan portion of the facility in the amount of 25% of excess cash flow, as defined in the agreement, subject to a $2.0 million annual and a $5.0 million aggregate limit. Otherwise, the principal portion of the term notes are amortized over either 60 or 84 months depending on the underlying collateral. All unpaid term note principal and interest is due upon maturity of the Wachovia Facility in August 2010.
The Wachovia Facility also includes performance covenants related to minimum levels of cash flow and a fixed charge coverage ratio as well as a covenant prohibiting the payment of cash dividends on our common stock. We are currently in compliance with the financial covenant requirements of the Wachovia Facility. The facility also provides the lender with the ability to declare a default under the credit facility in the event of, among other things, a material adverse change in our business.
We paid the lender approximately $400,000 of diligence, commitment and closing fees in connection with this facility.
8% Notes. During 2002, we retired the majority of our then outstanding 9 5/8% Notes in a voluntary exchange for, among other things, $19.8 million principal amount of 8% Notes. We accounted for this exchange in accordance with SFAS No. 15, Accounting by Debtors and Creditors for troubled Debt Restructurings. In accordance with SFAS No. 15, the 8% Notes were recorded at their aggregate undiscounted future cash flows (both principal and interest), and thereafter both principal and interest payments are accounted for as a reduction of the carrying amount of the debt. Therefore, we do not recognize any interest expense on the 8% Notes. The 8% Notes bear simple interest at 8% per annum, one-half of which will be paid in cash on a semi-annual basis and one-half will be deferred and be paid together with the principal in three installments, one-third in each of March 2007, 2008 and 2009.
We may redeem the 8% Notes, at our option, in whole or in part at any time with no prepayment penalty. Additionally, the indenture governing our 8% Notes provides the holders of such Notes with the right to accelerate the maturity of the Notes in the event of our default resulting in an acceleration of the maturity of any of our other secured debt. The 8% Notes are collateralized by a second-priority lien on substantially all of our fixed and intangible assets, other than the real property and other fixed assets comprising our steel mill in Peoria, Illinois, on which there is a third-priority lien. The 8% Notes are subordinated to all of our senior indebtedness, including, without limitation, the Wachovia Facility and, to the extent of our steel mill in Peoria, Illinois, the County Term Loan (as defined below). The 8% Notes rank senior to any of our expressly subordinated indebtedness.
In October 2002, Contran purchased $18.3 million of the total $19.8 million principal amount at maturity of the 8% Notes. As such, approximately $24.5 million and $23.8 million of the recorded liability for the 8% Notes at December 31, 2005 and 2006, respectively, was payable to Contran.
UC Note. In connection with our emergence from Chapter 11, we provided a $4.8 million note to our pre-petition unsecured creditors (the “UC Note”). The UC Note accrued interest until October 2006 at 12% per annum, compounded on the first business day of each calendar quarter. Such interest was deferred and converted to principal. In October 2006, the UC Note began accruing interest at 8% per annum and interest payments are due on the first day of each calendar quarter beginning in January 2007. The first principal payment on the UC Note is due on January 1, 2007 in the amount of $1,542,235. Thereafter, quarterly principal payments of $391,603 are due on the first day of each calendar quarter until the UC Note is paid in full. The UC Note is collateralized by a lien on our equity interests in EWP and any proceeds thereof. The UC Note contains the same financial covenants as the Wachovia Facility.
County Term Loan. In April 2002, we received a $10 million term loan from the County of Peoria, Illinois (the “County Term Loan”). The County Term Loan does not bear interest, requires no amortization of principal, is due in April 2007 and is collateralized by a second priority lien on the real property and other fixed assets comprising KSW’s steel mill in Peoria, Illinois. Proceeds from the County Term Loan were used to reduce the outstanding balance of our revolving credit facility.
At December 31, 2005 and 2006, the aggregate fair value of our fixed rate notes, based on our estimate of fair value, approximated $31.4 million and $33.8 million, respectively, as compared to a book value of $42.2 million and $41.3 million, respectively. As the Wachovia Facility reprices with changes in interest rates, the book value of all other indebtedness at December 31, 2005 and 2006 is deemed to approximate market value.
We have significant cash commitments in 2007. We may attempt to renegotiate certain credit facilities, including extending the dates of scheduled principal payments. Overall, we believe our cash flows from operating activities combined with availability under our credit agreement will be sufficient to enable us to meet our cash flow needs. The aggregate future maturities of notes payable and long-term debt at December 31, 2006 are shown in the following table.
Year ending December 31, | | Amount | |
| | | (In thousands) | |
| | | | |
| 2007 | | $ | 25,964 | |
| 2008 | | | 14,250 | |
| 2009 | | | 14,880 | |
| 2010 | | | 21,354 | |
| | | $ | 76,448 | |
| | | | | |
Cancellation of debt upon emergence from bankruptcy. In connection with our emergence from Chapter 11 on August 31, 2005, pre-petition unsecured creditors, a DIP secured lender and certain post-petition creditors with allowed claims against us in the amount of approximately $63.9 million (including $6.2 million related to the 9 5/8% Notes, $16.0 million related to the 6% Notes, and $5.0 million related to the EWPFLLC DIP Facility; all of which are further described below) received, on a pro rata basis, in the aggregate, $5.2 million in cash, a $4.8 million secured promissory note (the UC Note mentioned above) and 100% of our new common stock (valued at $21.4 million). As a result, we recorded a $32.5 million gain from cancellation of debt during 2005. See Note 2.
Pre-emergence debt. We obtained two DIP financing facilities on March 15, 2004. The first DIP financing facility consisted of an Assumption Agreement whereby the pre-petition lender on the Keystone Revolver and Keystone Term Loan agreed to convert those credit facilities to a DIP facility (collectively, the “Congress DIP Facility”). The Keystone Revolver provided for revolving borrowings of up to $45 million based upon formula-determined amounts of trade receivables and inventories, bore interest at the prime rate plus 1.0%, and required that our daily net cash receipts be used to reduce the outstanding borrowings. The Keystone Term Loan was amended in November 2003 resulting in a balance of $6.5 million that bore interest at prime plus 1.0% and was due in 48 monthly installments through December 2007. The terms of the respective facilities comprising the Congress DIP Facility were relatively unchanged from the respective pre-petition facilities. Upon emergence from bankruptcy in August 2005, the Wachovia Facility was used to extinguish the Congress DIP facility.
The second debtor-in-possession financing facility was a $5 million revolving credit facility with EWP Financial, LLC (“EWPFLLC”), (the “EWPFLLC DIP Facility”). Advances under the EWPFLLC DIP Facility bore interest at the prime rate plus 3.0% per annum. In addition, the EWPFLLC DIP Facility required EWPFLLC to fund up to an additional $2 million through a participation in the Congress DIP Facility upon realization of certain milestones. We met such milestones and in April 2004, this additional funding was made. Upon our emergence from Chapter 11 on August 31, 2005, EWPFLLC assigned its $5 million DIP credit facility to Contran and Contran converted the DIP facility, certain of its pre-petition unsecured claims and all of its administrative claims into 51% of our new common stock.
Borrowings under EWP's $7 million revolving credit facility (the "EWP Revolver") bore interest at LIBOR plus 2.45%. The EWP Revolver was retired with the proceeds of the Wachovia Facility on August 31, 2005.
In January 2004, EWP received a $6.75 million term loan (“the EWP Term Loan”) from the same lender providing the EWP Revolver. The EWP Term Loan bore interest at LIBOR plus 2.5%, was due in monthly installments of $112,500 plus accrued interest and a balloon payment upon the maturity date, as amended, on March 31, 2005. The EWP Term Note was retired with the proceeds of the Wachovia Facility on August 31, 2005.
The 6% Notes we also originally issued in connection with the Exchange Offer, as well as the remaining 9 5/8% Notes were both compromised as part of our confirmed plan of reorganization. In addition, we ceased to accrue interest on such indebtedness upon filing for Chapter 11 on February 26, 2004. In connection with the Exchange Offer and in accordance with SFAS No. 15, the 6% Notes were recorded at the $16.0 million carrying amount of the associated 9 5/8% Notes (both principal and interest), and interest expense on such debt was recognized on the effective interest method at a rate of 3.8%. The 9 5/8% Notes accrued interest at a rate of 9.625%.
Note 6 - Series A Preferred Stock:
All of our Series A Preferred Stock (the "Series A Preferred Stock") was cancelled in connection with our emergence from Chapter 11 on August 31, 2005. See Note 12 for the impact of the Series A Preferred Stock and related dividends on earnings per share. The Series A Preferred Stock had a stated value of $1,000 per share and had a liquidation preference of $1,000 per share plus accrued and unpaid dividends. The Series A Preferred Stock had an annual dividend commencing in December 2002 of $100 per share, and such dividends could have been paid in cash or, at our option, in whole or in part in new Series A Preferred Stock based on their stated value. We discontinued accruing dividends on our Series A Preferred Stock upon filing for Chapter 11 on February 26, 2004. The $11.8 million of dividends accrued at February 26, 2004 were determined based on the assumption such dividends would be paid in cash rather than in the form of additional shares of Series A Preferred Stock.
In connection with our restructuring activities in December 2003, we issued 12,500 additional Shares of Series A Preferred Stock to the employees of KSW’s primary labor union. Based on our financial position at the issuance date and subsequent Chapter 11 filing, we believe the fair value of the 12,500 additional shares issued in December 2003 was deminimis and as such, did not assign a value to the newly issued shares.
Note 7 - Income taxes:
Summarized below are (i) the differences between the provision (benefit) for income taxes and the amounts that would be expected using the U. S. federal statutory income tax rate of 35%, and (ii) the components of the comprehensive provision (benefit) for income taxes.
| | | Years ended December 31, | |
| | | 2004 | | 2005 | | 2006 | |
| | | (In thousands) | |
| | | | | | | | |
| | | | | | | | |
| Expected tax provision (benefit), at statutory rate | | $ | 6,104 | | $ | 13,882 | | $ | 26,175 | |
| U.S. state income taxes (benefit), net | | | 559 | | | 2,265 | | | 2,432 | |
| Deferred tax asset valuation allowance | | | (8,808 | ) | | (19,651 | ) | | (10,675 | ) |
| Capitalize reorganization costs | | | 3,840 | | | 3,608 | | | 237 | |
| Release of contingency reserve | | | - | | | - | | | (1,011 | ) |
| Other, net | | | (316 | ) | | 326 | | | (103 | ) |
| | | | | | | | | | | |
| Provision for income taxes | | $ | 1,379 | | $ | 430 | | $ | 17,055 | |
| | | | | | | | | | | |
| Provision (benefit) for income taxes: | | | | | | | | | | |
| Currently payable (refundable): | | | | | | | | | | |
| U.S. federal | | $ | 914 | | $ | 75 | | $ | 273 | |
| U.S. state | | | 465 | | | 355 | | | (535 | ) |
| | | | | | | | | | | |
| Net currently payable | | | 1,379 | | | 430 | | | (262 | ) |
| Deferred income taxes, net | | | - | | | - | | | 17,317 | |
| | | | | | | | | | | |
| | | $ | 1,379 | | $ | 430 | | $ | 17,055 | |
| | | | | | | | | | | |
| | | | | | | | | | | |
| Comprehensive provision for income taxes allocable to: | | | | | | | | | | |
| Net income | | $ | 1,379 | | $ | 430 | | $ | 17,055 | |
| Adoption of SFAS 158: | | | | | | | | | | |
| Pension plans | | | - | | | - | | | 133,947 | |
| OPEB plans | | | - | | | - | | | 33,877 | |
| | | | | | | | | | | |
| | $ | - | | $ | - | | $ | 184,879 | |
The components of the net deferred tax asset/(liability) are summarized below.
| | | December 31, | |
| | | 2005 | | 2006 | |
| | | Assets | | Liabilities | | Assets | | Liabilities | |
| | | (In thousands) | |
| | | | | | | | | | |
| Tax effect of temporary differences relating to: | | | | | | | | | | | | | |
| Inventories | | $ | 4,697 | | $ | - | | $ | 4,919 | | $ | - | |
| Property and equipment | | | - | | | (14,960 | ) | | - | | | (12,654 | ) |
| Pension asset | | | - | | | (56,610 | ) | | - | | | (209,593 | ) |
| Accrued OPEB cost | | | 53,611 | | | - | | | 12,869 | | | - | |
| Accrued liabilities | | | 11,334 | | | - | | | 9,256 | | | - | |
| Other deductible differences | | | 3,954 | | | - | | | 4,211 | | | - | |
| Other taxable differences | | | - | | | (3,026 | ) | | - | | | - | |
| Net operating loss carryforwards | | | 4,372 | | | - | | | 333 | | | - | |
| Alternative minimum tax and other credit carryforwards | | | 7,303 | | | - | | | 5,518 | | | - | |
| Deferred tax asset valuation allowance | | | (10,675 | ) | | - | | | - | | | - | |
| | | | | | | | | | | | | | |
| Gross deferred tax assets / (liabilities) | | | 74,596 | | | (74,596 | ) | | 37,106 | | | (222,247 | ) |
| Reclassification, principally netting by tax jurisdiction | | | (74,596 | ) | | 74,596 | | | (37,106 | ) | | 37,106 | |
| | | | | | | | | | | | | | |
| Net deferred tax asset / (liability) | | | - | | | - | | | - | | | (185,141 | ) |
Less current deferred tax asset, net of pro rata allocation of deferred tax asset valuation allowance | | | - | | | - | | | - | | | 12,571 | |
| | | | | | | | | | | | | | |
| Noncurrent net deferred tax asset / (liability) | | $ | - | | $ | - | | $ | - | | $ | (197,712 | ) |
| | | Years ended December 31, | |
| | | 2004 | | 2005 | | 2006 | |
| | | (In thousands) | |
| | | | | | | | |
| Increase (decrease) in valuation allowance: | | | | | | | | | | |
Increase in certain deductible temporary differences which the Company believes do not meet the "more-likely-than-not" recognition criteria: | | | | | | | | | | |
| Recognized in net income (loss) | | $ | (8,808 | ) | $ | (19,651 | ) | $ | (10,675 | ) |
| | | | | | | | | | | |
| | | $ | (8,808 | ) | $ | (19,651 | ) | $ | (10,675 | ) |
Prior to June 30, 2006, considering all factors believed to be relevant, we believed our gross deferred tax assets (including net operating loss carryforwards) did not meet the “more-likely-than-not” realizability test. As such, we had provided a deferred tax asset valuation allowance to offset our net deferred income tax asset (before valuation allowance) of approximately $30.3 million and $10.7 million at December 31, 2004 and 2005, respectively. During the first six months of 2006, we recorded taxable income in excess of our available net operating loss carryforwards. As such, the valuation allowance related to those deferred tax assets was completely reversed during the first six months of 2006. Due in part to our continued profitability, we believe the realization of our remaining gross deferred income tax assets (including an alternative minimum tax credit carryforward) meet the “more-likely-than-not” realizability test.
At December 31, 2006, we had approximately $5.5 million of alternative minimum tax credit carryforwards that have no expiration date.
The Internal Revenue Service concluded their examination of our 2004 U.S tax return during the first quarter of 2007 with no proposed tax deficiencies.
Our emergence from Chapter 11 on August 31, 2005 did not result in an ownership change within the meaning of Section 382 of the Internal Revenue Code.
Note 8 - Pensions and other postretirement benefits:
We sponsor several pension plans and other postretirement benefit plans for our employees and certain retirees. Under plans currently in effect, certain active employees would be entitled to receive OPEB upon retirement. We use a December 31st measurement date for our defined benefit pension and OPEB plans. The following tables provide a reconciliation of the changes in the plans' projected benefit obligations and fair value of assets for the years ended December 31, 2005 and 2006:
| | | Pension Benefits | | Other Benefits | |
| | | 2005 | | 2006 | | 2005 | | 2006 | |
| | | (In thousands) | |
| | | | | | | | | | |
| Change in projected benefit obligations ("PBO"): | | | | | | | | | | | | | |
| Benefit obligations at beginning of year | | $ | 384,701 | | $ | 392,216 | | $ | 206,309 | | $ | 38,705 | |
| Service cost | | | 3,798 | | | 3,569 | | | 2,056 | | | 247 | |
| Interest cost | | | 21,499 | | | 21,041 | | | 8,785 | | | 1,972 | |
| Plan amendment | | | 876 | | | 4,790 | | | (191,657 | ) | | - | |
| Actuarial loss (gain) | | | 8,655 | | | (17,174 | ) | | 21,536 | | | (1,830 | ) |
| Benefits paid | | | (27,313 | ) | | (27,558 | ) | | (8,324 | ) | | (3,931 | ) |
| | | | | | | | | | | | | | |
| Benefit obligations at end of year | | $ | 392,216 | | $ | 376,884 | | $ | 38,705 | | $ | 35,163 | |
| | | | | | | | | | | | | | |
| Change in plan assets: | | | | | | | | | | | | | |
| Fair value of plan assets at beginning of year | | $ | 424,380 | | $ | 701,221 | | $ | - | | $ | - | |
| Actual return on plan assets | | | 304,154 | | | 260,500 | | | - | | | - | |
| Employer contributions | | | - | | | - | | | 8,324 | | | 3,931 | |
| Benefits paid | | | (27,313 | ) | | (27,558 | ) | | (8,324 | ) | | (3,931 | ) |
| | | | | | | | | | | | | | |
| Fair value of plan assets at end of year | | $ | 701,221 | | $ | 934,163 | | $ | - | | $ | - | |
| | | | | | | | | | | | | | |
| Funded status at end of the year: | | | | | | | | | | | | | |
| Plan assets greater (less) than PBO | | $ | 309,005 | | $ | 557,279 | | $ | (38,705 | ) | $ | (35,163 | ) |
| Unamortized actuarial losses (gains) | | | (173,892 | ) | | (369,853 | ) | | 122,978 | | | 114,020 | |
| Unamortized prior service cost (credit) | | | 10,039 | | | 13,704 | | | (221,737 | ) | | (204,092 | ) |
| | | | | | | | | | | | | | |
| | | $ | 145,152 | | $ | 201,130 | | $ | (137,464 | ) | $ | (125,235 | ) |
| | | | | | | | | | | | | | |
| Amounts recognized in the balance sheet: | | | | | | | | | | | | | |
| Pension asset | | $ | 145,152 | | $ | 557,279 | | $ | - | | $ | - | |
| Accrued OPEB cost: | | | | | | | | | | | | | |
| Current | | | - | | | - | | | (4,256 | ) | | (4,157 | ) |
| Noncurrent | | | - | | | - | | | (133,208 | ) | | (31,005 | ) |
| Accumulated other comprehensive income | | | - | | | (356,149 | ) | | - | | | (90,073 | ) |
| | | | | | | | | | | | | | |
| | | $ | 145,152 | | $ | 201,130 | | $ | (137,464 | ) | $ | (125,235 | ) |
The amounts shown in the table above for unamortized actuarial gains and losses and prior service credits and costs at December 31, 2005 and 2006 have not yet been recognized as components of our periodic defined benefit cost as of those dates. These amounts will be recognized as components of our periodic defined benefit cost in future years. However, upon adoption of SFAS No. 158, the unamortized amounts at December 31, 2006, net of deferred income taxes, are recognized in our accumulated other comprehensive income. Of the amount included in accumulated other comprehensive income at December 31, 2006, we expect $15.6 million and $1.2 million of the unamortized actuarial gains and prior service cost, respectively, will be recognized as components of our periodic defined benefit pension credit in 2007 and that $6.7 million and $17.6 million of the unamortized actuarial losses and prior service credits, respectively, will be recognized as components of our other postretirement benefit credit in 2007. Adoption of SFAS No. 158 had the following effects on our Consolidated Financial Statements as of December 31, 2006:
| | | Before application of SFAS No. 158 | | Adjustments | | After application of SFAS No. 158 | |
| | | (In thousands) | |
| | | | | | | | |
| Pension asset | | $ | 201,130 | | $ | 356,149 | | $ | 557,279 | |
| Total other assets | | | 208,934 | | | 356,149 | | | 565,083 | |
| Total assets | | | 407,787 | | | 356,149 | | | 763,936 | |
| | | | | | | | | | | |
| Noncurrent accrued OPEB cost | | | 121,078 | | | (90,073 | ) | | 31,005 | |
| Noncurrent deferred income taxes | | | 29,889 | | | 167,823 | | | 197,712 | |
| Total noncurrent liabilities | | | 190,130 | | | 77,750 | | | 267,880 | |
| | | | | | | | | | | |
| Accumulated other comprehensive income: | | | | | | | | | | |
| Pension plans | | | - | | | 222,202 | | | 222,202 | |
| OPEB plans | | | - | | | 56,197 | | | 56,197 | |
| Total accumulated other comprehensive income | | | - | | | 278,399 | | | 278,399 | |
| Total stockholders’ equity | | | 125,263 | | | 278,399 | | | 403,662 | |
| | | | | | | | | | | |
| Total liabilities and stockholders’ equity | | | 407,787 | | | 356,149 | | | 763,936 | |
At December 31, 2005 and 2006, the accumulated benefit obligation for our pension plan was approximately $385.8 million and $372.2 million, respectively.
The assumptions used in determining the actuarial present value of benefit obligations as of December 31, 2005 and 2006 are shown in the following table:
| | | Pension Benefits | | Other Benefits | |
| | | 2005 | | 2006 | | 2005 | | 2006 | |
| | | | | | | | | | |
| Discount rate | | | 5.5 | % | | 5.8 | % | | 5.5 | % | | 5.8 | % |
| Rate of compensation increase | | | 3.0 | % | | 3.0 | % | | - | | | - | |
The assumptions used in determining the net periodic pension and other retiree benefit credit or expense during 2004, 2005 and 2006 are shown in the following table:
| | | Pension Benefits | | Other Benefits | |
| | | 2004 | | 2005 | | 2006 | | 2004 | | 2005 | | 2006 | |
| | | | | | | | | | | | | | |
| Discount rate | | | 6.0 | % | | 5.7 | % | | 6.0 | % | | 6.0 | % | | 5.5 | % | | 5.5 | % |
| Expected return on plan assets | | | 10.0 | % | | 10.0 | % | | 10.0 | % | | - | | | - | | | - | |
| Rate of compensation increase | | | 3.0 | % | | 3.0 | % | | 3.0 | % | | - | | | - | | | - | |
The following table provides the components of net periodic benefit cost or credit for the plans for the years ended December 31, 2004, 2005 and 2006:
| | | Pension Benefits | | Other Benefits | |
| | | 2004 | | 2005 | | 2006 | | 2004 | | 2005 | | 2006 | |
| | | (In thousands) | |
| | | | | | | | | | | | | | |
| Service cost | | $ | 3,335 | | $ | 3,798 | | $ | 3,569 | | $ | 2,866 | | $ | 2,056 | | $ | 247 | |
| Interest cost | | | 20,902 | | | 21,499 | | | 21,041 | | | 11,033 | | | 8,785 | | | 1,972 | |
| Expected return on plan assets | | | (35,860 | ) | | (41,037 | ) | | (73,152 | ) | | - | | | - | | | - | |
| Amortization of: | | | | | | | | | | | | | | | | | | | |
| Prior service cost (credit) | | | 882 | | | 926 | | | 1,126 | | | (3,024 | ) | | (8,003 | ) | | (17,645 | ) |
| Actuarial losses (gains) | | | 3,989 | | | 3,104 | | | (8,562 | ) | | 4,879 | | | 6,047 | | | 7,129 | |
| | | | | | | | | | | | | | | | | | | | |
| Net periodic benefit cost (credit) | | | (6,752 | ) | | (11,710 | ) | | (55,978 | ) | | 15,754 | | | 8,885 | | | (8,297 | ) |
| Settlement loss | | | - | | | - | | | - | | | 5,155 | | | - | | | - | |
| | | | | | | | | | | | | | | | | | | | |
| Total benefit cost (credit) | | $ | (6,752 | ) | $ | (11,710 | ) | $ | (55,978 | ) | $ | 20,909 | | $ | 8,885 | | $ | (8,297 | ) |
| | | | | | | | | | | | | | | | | | | | |
During 2004, 2005 and 2006, substantially all of the defined benefit pension plans’ (the “Plan”) net assets were invested in the Combined Master Retirement Trust (“CMRT”), a collective investment trust sponsored by Contran, to permit the collective investment by certain master trusts which fund certain employee benefit plans maintained by Contran, Valhi and related companies, including us. Harold C. Simmons is the sole trustee of the CMRT. Mr. Simmons, a former member of our board of directors, a current member of our board of directors and the Master Trust Investment Committee comprise the Trust Investment Committee for the CMRT.
The CMRT’s long-term investment objective is to provide a rate of return exceeding a composite of broad market equity and fixed income indices (including the S&P 500 and certain Russell indicies) utilizing both third-party investment managers as well as investments directed by Mr. Simmons. The trustee of the CMRT and the CMRT’s Trust Investment Committee actively manage the investments of the CMRT. Such parties have in the past, and may in the future, change the asset mix of the CMRT based upon, among other factors, advice they receive from third-party advisors and their expectations as to what asset mix will generate the greatest overall long-term rate of return. For 2004, 2005 and 2006, the assumed long-term rate of return for plan assets invested in the CMRT was 10%. In determining the appropriateness of such long-term rate of return assumption, we considered, among other things, the historical rate of return for the CMRT, the current and projected asset mix of the CMRT, the investment objectives of the CMRT’s managers and advice from our third-party actuaries. During the 19-year history of the CMRT through December 31, 2006, the average annual rate of return has been 14.2%. At December 31, 2006, the asset mix of the CMRT was 92% in U.S. equity securities, 5% in international equity securities and 3% in U.S. fixed income securities (2005 - 91%, 5%, 3%, respectively, and 1% in cash and other investments).
In general, prior to February 1, 2004, our postretirement benefit plans provided certain life insurance, Medicare Part B and medical benefits to eligible retirees. Effective February 1, 2004, our OPEB plans were amended to permanently and unilaterally terminate all future medical benefits to retirees that were not covered under a union contract or an otherwise court ordered plan. However, these current and future retirees will retain their existing postretirement life insurance and Medicare Part B reimbursement benefits (as only the medical and prescription drug benefits were terminated). For the groups that did not have Medicare Part B reimbursement, this change resulted in a settlement of liabilities from the plan. The net loss of $5.2 million due to this settlement is reflected in the 2004 OPEB expense.
Also during 2004, we entered into an agreement (the “1114 Agreement”) with retirees who were covered either under a union contract or an otherwise court ordered plan (the “Protected Groups”) that substantially reduced the OPEB benefits that will be paid to the Protected Groups in the future. Under the terms of the 1114 Agreement, the existing medical and prescription drug coverage for the Protected Groups was terminated (life insurance and Medicare Part B reimbursement benefits were unchanged) and replaced with a $3.0 million lump sum payment to the Protected Groups upon our emergence from Chapter 11 and future minimum monthly fixed payments to all participants (retirees and dependents) in the Protected Groups. The 1114 Agreement also provided that the future minimum monthly fixed payments could increase in certain years based on the prior year’s free cash flow, as defined in the 1114 Agreement. Because these future payments are not based on health care costs, changes in the health care cost trend rate do not impact future OPEB expense or obligations.
We do not anticipate being required to fund any contributions to our defined benefit pension plans during 2007. However, we anticipate contributing approximately $4.2 million to our other postretirement benefit plans during 2007.
The following benefit payments, which reflect expected future service, as appropriate, are expected to be paid during the years ending December 31,:
| | | Pension Benefits | | Other Benefits | |
| | | (In thousands) | |
| | | | | | |
| 2007 | | $ | 27,350 | | $ | 4,157 | |
| 2008 | | | 27,340 | | | 4,382 | |
| 2009 | | | 27,180 | | | 2,577 | |
| 2010 | | | 27,130 | | | 2,529 | |
| 2011 | | | 27,120 | | | 2,487 | |
| 2012 - 2016 | | | 137,770 | | | 11,896 | |
We also maintain several defined contribution pension plans. Expense related to these plans was $1.3 million in 2004, $2.3 million in 2005 and $2.0 million in 2006.
Note 9 - Environmental matters:
We have been named as a defendant, potentially responsible party (“PRP”), or both, pursuant to the Comprehensive Environmental Response, Compensation and Liability Act (“CERCLA”) or similar state laws in approximately 13 governmental and private actions associated with environmental matters, including waste disposal sites and facilities currently or previously owned, operated or used by us, certain of which are on the United States Environmental Protection Agency’s (the “U.S. EPA”) Superfund National Priorities List or similar state lists. These proceedings seek cleanup costs, damages for personal injury or property damage and/or damages for injury to natural resources. Certain of these proceedings involve claims for substantial amounts. Although we may be jointly and severally liable for such costs, in most cases, we are only one of a number of PRPs who may also be jointly and severally liable.
On a quarterly basis, we evaluate the potential range of our liability at sites where we have been named as a PRP or defendant by analyzing and estimating the range of reasonably possible costs to us. Such costs include, among other things, expenditures for remedial investigations, monitoring, managing, studies, certain legal fees, clean-up, removal and remediation. The extent of CERCLA liability cannot be determined until the Remedial Investigation/Feasibility Study (“RI/FS”) is complete, the U.S. EPA issues a Record of Decision (“ROD”) and costs are allocated among PRPs. The extent of liability under analogous state cleanup statutes and for common law equivalents is subject to similar uncertainties. The upper end of the range of reasonably possible costs to us for sites for which it is possible to estimate costs (13 sites) is approximately $14.0 million. Our estimate of such costs has not been discounted to present value, and other than certain previously-reported settlements with respect to certain of our former insurance carriers, we have not recognized any material insurance recoveries. We have provided accruals ($13.3 million at December 31, 2006, $8.5 million of which is reflected in liabilities subject to compromise on our December 31, 2006 Balance Sheet) for 9 sites which we believe our liability is probable and reasonably estimable. However, our ultimate liability may be affected by a number of factors, including the imposition of more stringent standards or requirements under environmental laws or regulations, new developments or changes in remedial alternatives and costs, the allocation of such costs among PRPs, the solvency of other PRPs or a determination that we are potentially responsible for the release of hazardous substances at other sites. In addition, the actual timeframe for payments by us for these matters may be substantially in the future. It is possible our actual costs could differ from the amounts we have accrued or the upper end of the range for sites for which estimates have been made.
The exact time frame over which we make payments with respect to our accrued environmental costs is unknown and is dependent upon, among other things, the timing of the actual remediation process which in part depends on factors outside our control. At each balance sheet date, we make an estimate of the amount of our accrued environmental costs which will be paid out over the subsequent 12 months, and we classify such amount as a current liability. The remainder of the accrued environmental costs is classified as a noncurrent liability.
Although we believe our comprehensive general liability insurance policies provide indemnification for certain costs that we incur with respect to our environmental remediation obligations, we do not currently have receivables recorded for such recoveries.
More detailed descriptions of certain legal proceedings relating to environmental matters are set forth below. A summary of activity in our environmental accruals for the three years ended December 31, 2006 is as follows:
| | | Years ended December 31, | |
| | | 2004 | | 2005 | | 2006 | |
| | | (In thousands) | |
| | | | | | | | |
| Balance at beginning of period | | $ | 19,766 | | $ | 19,432 | | $ | 15,412 | |
| Expense | | | - | | | - | | | - | |
| Payments, net | | | (334 | ) | | (3,152 | ) | | (2,160 | ) |
| Cancellation of debt | | | - | | | (868 | ) | | - | |
| | | | | | | | | | | |
| Balance at end of period | | $ | 19,432 | | $ | 15,412 | | $ | 13,252 | |
Our environmental accruals were included in the following line items of our Consolidated Balance Sheets.
| | | Years ended December 31, | |
| | | 2005 | | 2006 | |
| | | (In thousands) | |
| | | | | | |
| Other accrued liabilities - current | | $ | 3,000 | | $ | 250 | |
| Other accrued liabilities - noncurrent | | | 3,921 | | | 4,521 | |
| Liabilities subject to compromise | | | 8,491 | | | 8,481 | |
| | | | | | | | |
| | | $ | 15,412 | | $ | 13,252 | |
As a result of the Chapter 11 filings on February 26, 2004, litigation relating to pre-petition claims was stayed. In 2005, certain environmental liabilities related to non-owned sites ($868,000) were discharged in connection with the Chapter 11 proceedings. All of the recorded environmental liability included in liabilities subject to compromise on our December 31, 2005 and 2006 Consolidated Balance Sheets relates to sites involving SWC or one of its predecessors as SWC’s environmental liabilities continue to be negotiated and adjudicated subsequent to our emergence from Chapter 11. As of December 31, 2006, only one alleged environmental claim awaits adjudication.
In general, as a result of our Chapter 11 reorganization and discharge, any future government or third-party private actions against us arising from our alleged pre-petition responsibility for hazardous contamination at environmental sites that we did not own at the filing date have been barred. Our Chapter 11 discharge does not affect our liability for hazardous contamination of property that was owned by us as of the petition date; therefore, any associated clean up costs remains our responsibility.
Open sites at December 31, 2006 that are no longer subject to compromise
We are currently involved in the closure of inactive waste disposal units at KSW pursuant to a closure plan approved by the Illinois Environmental Protection Agency (“IEPA”) in September 1992 (“the Closure Plan”). The original closure plan provided for the in-place treatment of seven hazardous waste surface impoundments and two waste piles to be disposed of as special wastes. We recorded an estimated liability for remediation of the impoundments and waste piles based on a six-phase remediation plan. We adjusted the recorded liability for each Phase as actual remediation costs became known. Pursuant to agreements with the IEPA and Illinois Attorney General's office (“IAG”), we are depositing $75,000 per quarter into a trust fund. Prior to 2005, we were required to continue these quarterly deposits and could not withdraw funds from the trust fund until the fund balance exceeded the sum of the estimated remaining remediation costs at KSW plus $2.0 million. During 2005, this agreement was modified such that the IEPA and IAG now permit us to withdraw funds from the trust fund as the KSW sites are remediated. However, the requirement for us to make quarterly deposits of $75,000 into the trust fund remains until such time as the sites are completely remediated in accordance with the Closure Plan. During 2005 and 2006, we paid approximately $3.5 million and $2.2 million, respectively, in remediation costs for these sites and received approximately $1.6 million and $2.9 million, respectively, in funds from the trust fund. At December 31, 2005 and December 31, 2006, the trust fund had a balance of $4.5 million and $2.1 million, respectively, which were included in other noncurrent assets. We believe we have completed the remediation required by the Closure Plan (as amended). However, as of December 31, 2006, the IEPA has not approved the work.
In February 2000, we received a notice from the U.S. EPA giving formal notice of the U.S. EPA's intent to issue a unilateral administrative order to us pursuant to section 3008(h) of the Resource Conservation and Recovery Act ("RCRA"). The draft order enclosed with this notice would require us to: (1) investigate the nature and extent of hazardous constituents present at and released from five alleged solid waste management units at KSW; (2) investigate hazardous constituent releases from "any other past or present locations at KSW where past waste treatment, storage or disposal may pose an unacceptable risk to human health and the environment"; (3) complete by June 30, 2001 an "environmental indicators report" demonstrating the containment of hazardous substances that could pose a risk to "human receptors" and further demonstrating that we "have stabilized the migration of contaminated groundwater at or from the facility”; (4) submit by January 30, 2002 proposed "final corrective measures necessary to protect human health and the environment from all current and future unacceptable risks of releases of hazardous waste or hazardous constituents at or from KSW”; and (5) complete by June 30, 2001 the closure of the sites discussed in the preceding paragraph now undergoing RCRA closure under the supervision of the IEPA. We have complied with deadlines in the draft order. During the fourth quarter of 2000, we entered into a modified Administrative Order on Consent which may require us to conduct cleanup activities at certain solid waste management units at KSW depending on the results of soil and groundwater sampling and risk assessment to be conducted by us during future periods pursuant to the order.
In March 2000, the IAG filed and served a seven-count complaint against us for alleged violations of the Illinois Environmental Protection Act, 415 ILCS 5/31, and regulations implementing RCRA at KSW. The complaint alleges that we violated RCRA in failing to prevent spills of an alleged hazardous waste on four separate occasions during the period from June 1995 through January 1999. The complaint also alleges that we illegally “stored”, “disposed of” and manifested the same allegedly hazardous waste on some or all of those occasions. In addition, the complaint alleges these hazardous waste spills resulted in groundwater pollution in violation of the Illinois Environmental Protection Act. The complaint further alleges that we improperly disposed of hazardous waste on two occasions at a landfill not permitted to receive such wastes. The complaint seeks the maximum statutory penalties allowed which ranges up to $50,000 for each violation and additional amounts up to $25,000 for each day of violation. We have answered the complaint and proceedings in the case have been stayed pending the outcome of settlement negotiations between us and the IAG’s office.
In December 2005, we received a Notice of Violation from the U.S. EPA regarding air permit issues at KSW. The U.S. EPA alleges that we failed to perform stack testing and conduct a review of best available emission control technology in connection with the implementation of plant construction modifications made pursuant to a 2001 air permit issued under the Clean Air Act and the Illinois Environmental Protection Act. During January 2006, we reached a preliminary agreement with the U.S. EPA on a plan for addressing the U.S. EPA’s concerns without referring the matter for any enforcement action.
Prior to SWC’s 1996 acquisition of DeSoto, Inc. (“DeSoto”), DeSoto was notified by the Texas Natural Resource Conservation Commission ("TNRCC") that there were certain deficiencies in prior reports to TNRCC relative to one of its non-operating facilities located in Gainesville, Texas. During 1999, SWC entered into TNRCC's Voluntary Cleanup Program. Remediation costs are presently estimated to be between $826,000 and $2.0 million. Investigation activities are on-going including additional soil and groundwater sampling.
Environmental liabilities subject to compromise at December 31, 2006
All of the recorded environmental liability included in liabilities subject to compromise on our December 31, 2005 and 2006 Consolidated Balance Sheets relates to sites involving SWC or one of its predecessors as SWC’s environmental liabilities continue to be negotiated and adjudicated subsequent to our emergence from Chapter 11. As of December 31, 2006, only one claim awaits adjudication.
Awaiting adjudication. Prior to SWC’s acquisition of DeSoto, DeSoto was notified by the U.S. EPA that it is one of approximately 50 PRPs at the Chemical Recyclers, Inc. site in Wylie, Texas. Under a consent order with the U.S. EPA, the PRP group has performed a removal action and an investigation of soil and groundwater contamination. Such investigation revealed certain environmental contamination. It is anticipated the U.S. EPA will order further remedial action, the exact extent of which is not currently known.
SWC-related sites discharged in the Chapter 11 proceedings. In 1984, the U.S. EPA filed suit against DeSoto by amending a complaint against Midwest Solvent Recovery, Inc. et al ("Midco"). DeSoto was a defendant based upon alleged shipments to an industrial waste recycling storage and disposal operation site located in Gary, Indiana. The amended complaint sought relief under CERCLA to force the defendants to clean up the site, pay non-compliance penalties and reimburse the government for past clean up costs. In June 1992, DeSoto settled its portion of the case by entering into a partial consent decree, and all but one of the eight remaining primary defendants and 93 third party defendants entered into a main consent decree. Under the terms of the partial consent decree, DeSoto agreed to pay its pro rata share (13.47%) of all costs under the main consent decree. SWC has certain funds available in trust funds due it under the partial consent decree. These credits can be used by SWC (with certain limitations) to fund its future liabilities under the partial consent decree. The U.S. EPA was granted a $1.1 million claim in the Chapter 11 proceedings. Any further liability of SWC related to this site was discharged in the Chapter 11 proceedings.
In December 1991, DeSoto and approximately 600 other PRPs were named in a complaint alleging DeSoto and the PRPs generated wastes that were disposed of at a Pennsauken, New Jersey municipal landfill. The plaintiffs in the complaint were ordered by a court to show in what manner the defendants were connected to the site. The plaintiffs provided an alleged nexus indicating garbage and construction materials from DeSoto’s former Pennsauken facility were disposed of at the site and such waste allegedly contained hazardous material to which DeSoto objected. The claim was dismissed without prejudice in August 1993. In 1996, DeSoto received an amended complaint containing the same allegations. The plaintiffs were granted a $750,000 claim in the Chapter 11 proceedings. Any further liability of SWC related to this site was discharged in the Chapter 11 proceedings.
SWC has received notification from the TNRCC stating that DeSoto is a PRP at the Material Recovery Enterprises Site near Ovalo, Texas, with approximately 3% of the total liability. The matter has been tendered to the Valspar Corporation (“Valspar”) pursuant to a 1990 agreement whereby Valspar purchased certain assets of DeSoto. Valspar has been handling the matter under reservation of rights. At the request of Valspar, SWC has signed a participation agreement which would require SWC to pay no less than 3% of the remediation costs. Valspar continues to pay for legal fees in this matter and has reimbursed SWC for all assessments. The TNRCC was granted a $15,000 claim in the Chapter 11 proceedings. Any further liability of SWC related to this site was discharged in the Chapter 11 proceedings.
Note 10 - Other commitments and contingencies:
Current litigation
We are engaged in various legal proceedings incidental to our normal business activities. In our opinion, none of such proceedings is material in relation to our consolidated financial position, results of operations or liquidity.
Pre-petition claims against SWC continue to be stayed while one final environmental claim is adjudicated. See Note 9.
Settled litigation
In July 2001, SWC received a letter from a law firm advising them that Sears Roebuck & Co. (“Sears”) had been named as a defendant in a lead paint personal injury case. Sears claimed contractual indemnity against SWC and demanded that SWC defend and indemnify Sears with regard to any losses or damages Sears may sustain in the case. Sears was named as an additional insured on insurance policies, in which DeSoto (now SWC), the manufacturer of the paint, was the named insured. Additional demands were made by Sears in 2002 with regard to additional lead paint cases. DeSoto’s insurance carriers were notified of the action and asked to indemnify SWC with respect to the complaint.
In May 2002, SWC was notified by an insurance company of a declaratory complaint filed in Cook County Illinois by Sears against the insurance company and a second insurance company (collectively the “Insurance Companies”) relative to certain lead paint personal injury litigation against Sears. It is our understanding that the declaratory complaint has since been amended to include all lead paint cases where Sears has been named as a defendant as a result of paint sold by Sears that was manufactured by DeSoto. Sears demanded indemnification from the Insurance Companies. One of the Insurance Companies demanded indemnification and defense from SWC.
On March 27, 2006, the bankruptcy court approved a settlement agreement with one of DeSoto’s former insurers, Allstate Insurance Company (“AIC”) and Northbrook Property and Casualty Insurance Company (“NP&CIC”), whereby SWC entered into a policy buy-back arrangement with the insurers and the insurers agree to withdraw their claims for retrospective premiums under the policies in SWC’s bankruptcy with prejudice after the Bankruptcy Court’s order approving the agreement becomes final and non-appealable (which occurred during the second quarter of 2006). As a result of this agreement, SWC received approximately $4.0 million from the insurers in exchange for a release of the insurers from the policies. The $4.0 million may be used by SWC to satisfy its pre-petition allowed unsecured claims, including environmental related claims against SWC in its bankruptcy proceedings. Any portion of the $4.0 million not used to satisfy SWC’s allowed unsecured claims will revert back to the bankruptcy estate of SWC and be distributed in accordance with its plan of reorganization. The settlement agreement does not apply to any worker’s compensation policies that AIC or NP&CIC underwrote for SWC. The settlement agreement also does not apply to Sears, but Sears is barred from bringing a claim against SWC’s bankruptcy estate. Sears filed a notice with the Bankruptcy Court indicating it is consenting to the Allstate Settlement and withdrew its claims with prejudice with respect to this matter.
Lease commitments
At December 31, 2006, we are obligated under certain operating leases through 2011. Future commitments under these leases are summarized below.
| | | Lease commitment | |
| | | (In thousands) | |
| | | | | |
| 2007 | | $ | 497 | |
| 2008 | | | 453 | |
| 2009 | | | 362 | |
| 2010 | | | 86 | |
| 2011 | | | 46 | |
| | | $ | 1,444 | |
Product supply agreement
In 1996, we entered into a fifteen-year product supply agreement (the "Supply Agreement") with a vendor. The Supply Agreement provides, among other things, that the vendor will construct a plant at our Peoria facility and, after completion of the plant, provide us with all, subject to certain limitations, of our gaseous oxygen and nitrogen needs for a 15-year period ending in 2011. In addition to specifying rates to be paid by us, including a minimum facility fee of approximately $1.2 million per year, the Supply Agreement also specifies provisions for adjustments to the rates and term of the Supply Agreement. Purchases made pursuant to the Supply Agreement during 2004, 2005 and 2006 amounted to $1.9 million, $2.7 million and $3.1 million, respectively.
Concentration of credit risk
All of our segments perform ongoing credit evaluations of their customers’ financial condition and, generally, require no collateral from their customers.
The percentage of sales and accounts receivable related to each of our segments’ ten largest external customers and all intercompany customers as well as the percentage of sales related to the one external customer at each of our segments that accounted for more than 10% of each segment’s net sales during 2004, 2005 and 2006 is set forth in the following table.
| | | 2004 | | 2005 | | 2006 | |
| Ten largest external customers (% of segment’s sales): | | | | | | | |
| KSW | | | 47 | % | | 45 | % | | 47 | % |
| EWP | | | 49 | % | | 54 | % | | 56 | % |
| Sherman/KWP | | | 28 | % | | 25 | % | | 26 | % |
| | | | | | | | | | | |
Ten largest external customers (% of segment’s AR): | | | | | | | | | | |
| KSW | | | 51 | % | | 66 | % | | 51 | % |
| EWP | | | 40 | % | | 48 | % | | 37 | % |
| Sherman/KWP | | | 85 | % | | 75 | % | | 95 | % |
| | | | | | | | | | | |
Intersegment sales (% of segment’s sales): | | | | | | | | | | |
| KSW | | | 14 | % | | 13 | % | | 9 | % |
| EWP | | | - | | | - | | | - | |
| Sherman/KWP | | | 62 | % | | 69 | % | | 66 | % |
| | | | | | | | | | | |
Intersegment accounts receivable (% of segment’s AR): | | | | | | | | | | |
| KSW | | | 4 | % | | 5 | % | | 7 | % |
| EWP | | | - | | | - | | | - | |
| Sherman/KWP | | | 6 | % | | 5 | % | | - | |
| | | | | | | | | | | |
| | | | | | | | | | | |
Single external customer (% of segment’s sales): | | | | | | | | | | |
| KSW | | | - | | | 11 | % | | 14 | % |
| EWP | | | - | | | 13 | % | | 11 | % |
| Sherman/KWP | | | 19 | % | | 16 | % | | 12 | % |
Note 11 - Other accrued liabilities:
| | | December 31, | |
| | | 2005 | | 2006 | |
| | | (In thousands) | |
| Current: | | | | | | | |
| Employee benefits | | $ | 12,085 | | $ | 12,220 | |
| Self insurance | | | 4,455 | | | 3,986 | |
| Pre-petition unsecured creditor settlement | | | 1,061 | | | 985 | |
| Legal and professional | | | 247 | | | 309 | |
| Environmental | | | 3,000 | | | 250 | |
| Income taxes | | | 939 | | | 139 | |
| Reorganization costs | | | 3,057 | | | 14 | |
| Other | | | 2,780 | | | 2,676 | |
| | | | | | | | |
| | | $ | 27,624 | | $ | 20,579 | |
| Noncurrent: | | | | | | | |
| Environmental | | $ | 3,921 | | $ | 4,521 | |
| Workers compensation payments | | | 1,595 | | | 1,785 | |
| Other | | | 61 | | | 108 | |
| | | | | | | | |
| | | $ | 5,577 | | $ | 6,414 | |
In connection with our emergence from Chapter 11 on August 31, 2005, our pre-petition unsecured creditors with allowed claims received, among other things, a $5.2 million cash payment. As of December 31, 2005 and 2006, approximately 80% of this amount had been distributed to the pre-petition unsecured creditors. As such, we have recorded a $1.1 million and $985,000 liability to the pre-petition unsecured creditors at December 31, 2005 and 2006, respectively.
Note 12 - Earnings per share:
Net income per share is based upon the weighted average number of common shares and dilutive securities outstanding during the periods. Options to purchase our common stock that were outstanding during 2004 and 2005 were omitted from the calculation of diluted earnings per share because they were anti-dilutive. No stock options were outstanding during 2006. Additionally, we discontinued accruing dividends on our preferred stock upon filing for Chapter 11 on February 26, 2004. A reconciliation of the numerators and denominators used in the calculations of basic and diluted earnings per share computations of income is presented below.
| | | Years ended December 31, | |
| | | 2004 | | 2005 | | 2006 | |
| | | (In thousands) | |
| | | | | | | | |
| Numerator: | | | | | | | | | | |
| Net income | | $ | 16,060 | | $ | 39,232 | | $ | 57,732 | |
| | | | | | | | | | | |
| Cancellation of Series A Preferred Stock | | | - | | | 2,112 | | | - | |
| Less Series A Preferred Stock | | | | | | | | | | |
| dividends | | | (1,223 | ) | | - | | | - | |
| Basic net income | | | 14,837 | | | 41,344 | | | 57,732 | |
| Series A Preferred Stock dividends | | | 1,223 | | | - | | | - | |
| | | | | | | | | | | |
| Diluted net income | | $ | 16,060 | | $ | 41,344 | | $ | 57,732 | |
| | | | | | | | | | | |
| Denominator: | | | | | | | | | | |
| Average common shares outstanding | | | 10,068 | | | 10,046 | | | 10,000 | |
Dilutive effect of Series A Preferred Stock | | | 17,975 | | | 11,983 | | | - | |
| | | | | | | | | | | |
| Diluted shares | | | 28,043 | | | 22,029 | | | 10,000 | |
Note 13 - Related party transactions:
We may be deemed to be controlled by Harold C. Simmons. See Note 1. Corporations that may be deemed to be controlled by or affiliated with Mr. Simmons sometimes engage in (a) intercorporate transactions such as guarantees, management and expense sharing arrangements, shared fee arrangements, joint ventures, partnerships, loans, options, advances of funds on open account, and sales, leases and exchanges of assets, including securities issued by both related and unrelated parties, and (b) common investment and acquisition strategies, business combinations, reorganizations, recapitalizations, securities repurchases, and purchases and sales (and other acquisitions and dispositions) of subsidiaries, divisions or other business units, which transactions have involved both related and unrelated parties and have included transactions which resulted in the acquisition by one related party of a publicly-held minority equity interest in another related party. We continuously consider, review and evaluate, and understand that Contran and related entities consider, review and evaluate such transactions. Depending upon the business, tax and other objectives then relevant, it is possible that we might be a party to one or more such transactions in the future.
Under the terms of an intercorporate services agreement ("ISA") entered into between us and Contran, employees of Contran provide certain management, tax planning, financial and administrative services on a fee basis. Such charges are based upon estimates of the time devoted by the employees of Contran to our affairs and the compensation of such persons. Because of the large number of companies affiliated with Contran, we believe we benefit from cost savings and economies of scale gained by not having certain management, financial and administrative staffs duplicated at each entity, thus allowing certain individuals to provide services to multiple companies but only be compensated by one entity. During both 2005 and 2006, the ISA fees charged by Contran aggregated approximately $1.0 million.
Tall Pines Insurance Company and EWI RE, Inc. provide for or broker certain insurance policies for Contran and certain of its subsidiaries and affiliates, including us. Tall Pines and EWI are subsidiaries of Valhi, Inc., a majority-owned subsidiary of Contran. Consistent with insurance industry practices, Tall Pines and EWI receive commissions from the insurance and reinsurance underwriters and/or assess fees for the policies they provide or broker. The aggregate premiums paid to Tall Pines and EWI were $2.1 million in 2004, $2.9 million in 2005 and $3.7 million in 2006. These amounts principally included payments for insurance and reinsurance premiums paid to third parties, but also included commissions paid to Tall Pines and EWI. Tall Pines purchases reinsurance for substantially all of the risks it underwrites. We expect these relationships with Tall Pines and EWI will continue in 2007.
Contran and certain of its subsidiaries and affiliates, including us, purchase certain of our insurance policies as a group, with the costs of the jointly-owned policies being apportioned among the participating companies. With respect to certain of such policies, it is possible that unusually large losses incurred by one or more insureds during a given policy period could leave the other participating companies without adequate coverage under that policy for the balance of the policy period. As a result, Contran and certain of its subsidiaries and affiliates, including us, have entered into a loss sharing agreement under which any uninsured loss is shared by those entities who have submitted claims under the relevant policy. We believe the benefits in the form of reduced premiums and broader coverage associated with the group coverage for such policies justifies the risk associated with the potential for any uninsured loss.
Dallas Compressor Company, a subsidiary of Contran, sells compressors and related services to us. During 2004, 2005 and 2006 we purchased products and services from Dallas Compressor Company in the amount of $20,000, $33,000, and $21,000, respectively.
EWPFLLC agreed to loan us up to an aggregate of $6 million through February 29, 2004. Borrowings would have accrued interest at the prime rate plus 3%, and would have been collateralized by the stock of EWP. In addition, we paid a commitment fee of .375% on the unutilized portion of the facility. The terms of this loan were approved by our independent directors. The loan matured in February 2004. In addition, during 2004, we paid EWPFLLC a $100,000 facility fee in connection with the EWP DIP Facility and during 2004 and 2005, we also paid EWPFLLC $305,000 and $362,000, respectively, in interest on the EWP DIP facility.
In July 1999, we formed Alter Recycling Company, LLC (“ARC”), a joint venture with Alter Trading Corporation (“ATC”), to operate a ferrous scrap recycling operation at KSW. During 2004, we entered into a scrap supply agreement with ATC. We source the majority of our ferrous scrap supply from ATC under this agreement. During 2004, 2005, and 2006, we purchased approximately $99.9 million, $132.4 million and $151.2 million, respectively, of ferrous scrap from ATC and approximately $4.3 million, $834,000 and $490,000, respectively, of ferrous scrap from ARC.
Note 14 - Recent Accounting Pronouncements:
Inventory Costs. SFAS No. 151, Inventory Costs, an amendment of ARB No. 43, Chapter 4, became effective for us for inventory costs incurred on or after January 1, 2006. SFAS No. 151 requires that the allocation of fixed production overhead costs to inventory be based on normal capacity of the production facilities, as defined by SFAS No. 151. SFAS No. 151 also clarifies the accounting for abnormal amounts of idle facility expense, freight handling costs and wasted material, requiring those items be recognized as current-period charges. Our existing production cost policies complied with the requirements of SFAS No. 151, therefore the adoption of SFAS No. 151 did not affect our Consolidated Financial Statements.
Planned Major Maintenance Activities. In September 2006, the FASB issued FASB Staff Position (“FSP”) No. AUG AIR-1, Accounting for Planned Major Maintenance Activities. Under FSP No. AUG AIR-1, accruing in advance for major maintenance is no longer permitted. Upon adoption of this standard, companies that previously accrued in advance for major maintenance activities are required to retroactively restate their financial statements to reflect a permitted method of expense for all periods presented. In the past, we have accrued in advance during the year for our planned major maintenance activities expected to be undertaken within that year. We retroactively restated our interim consolidated financial statements in the fourth quarter of 2006 to reflect the direct expense method of accounting. See Note 15. Adoption of the FSP did not have any impact on our previously reported Consolidated Balance Sheets or Consolidated Statements of Operations for any calendar year.
Pension and Other Postretirement Plans. In September 2006, the FASB issued SFAS No. 158, Employers’ Accounting for Defined Benefit Pension and Other Postretirement Plans. SFAS No. 158 requires us to recognize an asset or liability for the over or under funded status of each of our individual defined benefit pension and postretirement benefit plans on our Consolidated Balance Sheets. This standard does not change the existing recognition and measurement requirements that determine the amount of periodic benefit cost we recognize in net income. We adopted the asset and liability recognition and disclosure requirements of this standard effective December 31, 2006 on a prospective basis, in which we recognized through other comprehensive income all of our prior unrecognized gains and losses and prior service costs or credits, net of tax, as of December 31, 2006. We will recognize all future changes in the funded status of these plans through comprehensive income, net of tax. These future changes will be recognized either in net income, to the extent they are reflected in periodic benefit cost, or through other comprehensive income. In addition, this standard requires the measurement date of all plans to be December 31, which is currently the measurement date of all our pension and postretirement benefit plans. See Note 8 for the impact to our Consolidated Financial Statements of adopting this new standard.
Quantifying Financial Statement Misstatements. In the third quarter of 2006 the SEC issued Staff Accounting Bulletin (“SAB”) No. 108 expressing their views regarding the process of quantifying financial statement misstatements. The SAB is effective for us as of December 31, 2006. According to SAB 108 both the “rollover” and “iron curtain” approaches must be considered when evaluating a misstatement for materiality. This is referred to as the “dual approach.” For companies that have previously evaluated misstatements under one, but not both, of these methods, SAB 108 provides companies with a one-time option to record the cumulative effect of their prior unadjusted misstatements in a manner similar to a change in accounting principle in their 2006 annual financial statements if (i) the cumulative amount of the unadjusted misstatements as of January 1, 2006 would have been material under the dual approach to their annual financial statements for 2005 or (ii) the effect of correcting the unadjusted misstatements during 2006 would cause those annual financial statements to be materially misstated under the dual approach. The adoption of SAB 108 did not have a material effect on our previously reported consolidated financial position or results of operations.
Fair Value Measurements. In September 2006, the FASB issued SFAS No. 157, Fair Value Measurements, which will become effective for us on January 1, 2008. SFAS No. 157 generally provides a consistent, single fair value definition and measurement techniques for GAAP pronouncements. SFAS No. 157 also establishes a fair value hierarchy for different measurement techniques based on the objective nature of the inputs in various valuation methods. We will be required to ensure all of our fair value measurements are in compliance with SFAS No. 157 on a prospective basis beginning in the first quarter of 2008. In addition, we will be required to expand our disclosures regarding the valuation methods and level of inputs we utilize in the first quarter of 2008. The adoption of this standard will not have a material effect on our Consolidated Financial Statements.
Uncertain Tax Positions. In the second quarter of 2006 the Financial Accounting Standards Board (“FASB”) issued FASB Interpretation No. (“FIN”) 48, Accounting for Uncertain Tax Positions, which will become effective for us on January 1, 2007. FIN 48 clarifies when and how much of a benefit we can recognize in our Consolidated Financial Statements for certain positions taken in our income tax returns under SFAS No. 109, Accounting for Income Taxes, and enhances the disclosure requirements for our income tax policies and reserves. Among other things, FIN 48 will prohibit us from recognizing the benefit of a tax position unless we believe it is more-likely-than-not our position will prevail with the applicable tax authorities and limits the amount of the benefit to the largest amount for which we believe the likelihood of realization is greater than 50%. FIN 48 also requires companies to accrue penalties and interest on the difference between tax positions taken on their tax returns and the amount of benefit recognized for financial reporting purposes under the new standard. Our current income tax accounting policies comply with this aspect of the new standard. We will also be required to reclassify any reserves we have for uncertain tax positions from deferred income tax liabilities, where they are currently recognized, to a separate current or noncurrent liability, depending on the nature of the tax position. In January 2007, the FASB indicated that they will issue clarifying guidance regarding certain aspects of the new standard by the end of March 2007. We are still in the process of evaluating the impact FIN 48 will have on our consolidated financial position and results of operations, and do not expect we will complete that evaluation until the FASB issues their clarifying guidance.
Fair Value Option. In the first quarter of 2007 the FASB issued SFAS No. 159, The Fair Value Option for Financial Assets and Financial Liabilities. SFAS 159 permits companies to choose, at specified election dates, to measure eligible items at fair value, with unrealized gains and losses included in the determination of net income. The decision to elect the fair value option is generally applied on an instrument-by-instrument basis, is irrevocable unless a new election date occurs, and is applied to the entire instrument as opposed to only specified risks or cash flows or a portion of the instrument. Items eligible for the fair value option include recognized financial assets and liabilities other than an investment in a consolidated subsidiary, defined benefit pension plans, OPEB plans, leases and financial instruments classified in equity. An investment accounted for by the equity method is an eligible item. The specified election dates include the date the company first recognizes the eligible item, the date the company enters into an eligible commitment, the date an investment first becomes eligible to be accounted for by the equity method and the date SFAS No. 159 first becomes effective for the company. If we elect to measure eligible items at fair value under the standard, we would be required to present certain additional disclosures for each item we elect. SFAS No. 159 becomes effective for us on January 1, 2008, although we may apply the provisions earlier on January 1, 2007 if, among other things, we also adopt SFAS No. 157 on January 1, 2007 and elect to adopt SFAS No. 159 by April 30, 2007. We have not yet determined when we will choose to have SFAS No. 159 first become effective for us, nor have we determined which, if any, of our eligible items we will elect to be measured at fair value under the new standard. Therefore, we are currently unable to determine the impact, if any, this standard will have on our consolidated financial position or results of operations.
Note 15 - Quarterly financial data (unaudited):
| | | March 31, | | June 30, | | September 30, | | December 31, | |
| | | (In thousands, except per share data) | |
| | | | | | | | | | |
| Year ended December 31, 2005: | | | | | | | | | | | | | |
| Net sales | | $ | 89,537 | | $ | 88,992 | | $ | 84,770 | | $ | 104,246 | |
| Gross profit | | | 9,390 | | | 6,239 | | | 10,948 | | | 11,379 | |
| Reorganization costs | | | 3,294 | | | 2,687 | | | 4,342 | | | (15 | ) |
| Gain on cancellation of debt | | | - | | | - | | | 32,349 | | | 161 | |
| | | | | | | | | | | | | | |
| Net income (loss) | | $ | (852 | ) | $ | (3,289 | ) | $ | 34,152 | | $ | 9,221 | |
| | | | | | | | | | | | | | |
| Basic net income (loss) per share available for common shares | | $ | (.09 | ) | $ | (.33 | ) | $ | 3.61 | | $ | .92 | |
| | | | | | | | | | | | | | |
| Diluted net income (loss) per share available for common shares | | $ | (.09 | ) | $ | (.33 | ) | $ | 1.65 | | $ | .92 | |
| | | | | | | | | | | | | | |
| Year ended December 31, 2006: | | | | | | | | | | | | | |
| Net sales | | $ | 119,115 | | $ | 129,095 | | $ | 105,212 | | $ | 87,118 | |
| Gross profit | | | 14,083 | | | 8,791 | | | 8,337 | | | 3,610 | |
| Reorganization costs | | | 150 | | | 186 | | | 270 | | | 73 | |
| | | | | | | | | | | | | | |
| Net income | | $ | 22,236 | | $ | 13,417 | | $ | 9,456 | | $ | 12,623 | |
| | | | | | | | | | | | | | |
| Basic net income per share | | $ | 2.22 | | $ | 1.34 | | $ | .95 | | $ | 1.26 | |
| | | | | | | | | | | | | | |
| Diluted net income per share | | $ | 2.22 | | $ | 1.34 | | $ | .95 | | $ | 1.26 | |
During the fourth quarter of 2006, based on an actuarial valuation, we recorded an increase in our 2006 defined benefit pension credit and asset of approximately $6.4 million ($4.0 million, net of tax), which increased earnings per share by $.40. This adjustment resulted in a defined benefit pension credit for the year 2006 of $56.0 million. We had previously estimated a defined benefit pension credit for 2006 of $49.6 million.
As discussed in Note 14, effective December 31, 2006 we retroactively restated our Consolidated Financial Statements to reflect the direct expense method of accounting for planned major maintenance in accordance with FSP No. AUG AIR-1. Additionally, as discussed in Note 1, we began reporting our OPEB expense or credit on a separate line item in our Consolidated Statement of Operations. The adoption of the FSP and the reclassification of OPEB expense or credit had the following effect on our previously reported gross profit for the periods indicated:
| | | Previously Reported Gross Profit | | Adoption of FSP No. AUG AIR-1 | | OPEB Reclass | | Currently Reported Gross Profit | |
| | | (In thousands) | |
| | | | | | | | | | |
| 2005 Quarter Ended: | | | | | | | | | | | | | |
| | | | | | | | | | | | | | |
| March 31 | | $ | 5,055 | | $ | 424 | | $ | 3,911 | | $ | 9,390 | |
| June 30 | | | 1,958 | | | 370 | | | 3,911 | | | 6,239 | |
| September 30 | | | 8,916 | | | 48 | | | 1,984 | | | 10,948 | |
| December 31 | | | 14,075 | | | (842 | ) | | (1,854 | ) | | 11,379 | |
| | | | | | | | | | | | | | |
| 2006 Quarter Ended: | | | | | | | | | | | | | |
| | | | | | | | | | | | | | |
| March 31 | | $ | 15,026 | | $ | 507 | | $ | (1,450 | ) | $ | 14,083 | |
| June 30 | | | 9,287 | | | 954 | | | (1,450 | ) | | 8,791 | |
| September 30 | | | 9,195 | | | 592 | | | (1,450 | ) | | 8,337 | |
The adoption of the FSP had the following effect on our previously reported net income and basic earings per share for the periods indicated:
| | | Increase (decrease) in net income | | Increase (decrease) in net income per basic share | |
| | | 2005 | | 2006 | | 2005 | | 2006 | |
| | | (In thousands) | | | | | |
| | | | | | | | | | |
| Quarter Ended: | | | | | | | | | | | | | |
| | | | | | | | | | | | | | |
| March 31 | | $ | 424 | | $ | 507 | | $ | .04 | | $ | .05 | |
| June 30 | | | 370 | | | 387 | | | .04 | | | .04 | |
| September 30 | | | 48 | | | 362 | | | - | | | .04 | |
| December 31 | | | (842 | ) | | - | | | (.08 | ) | | - | |
| | | | | | | | | | | | | | |
Note 16 - Subsequent Events:
During the first quarter of 2007, we formed Calumet, which acquired substantially all of the real estate, equipment, and inventory of CaluMetals, Inc. CaluMetals, located in Chicago Heights, Illinois, is a manufacturer of merchant and special bar quality products and special sections in carbon and alloy steel grades, offering a broad range of value added products for use in agricultural, cold drawn, construction, industrial chain, service centers, and transportation applications. CaluMetals’ product mix consists primarily of angles, flats, channels, rounds and squares. CaluMetals’ sold approximately 17,000 tons of product during 2006 for $10.9 million. Calumetals’ primary raw material is billets. We expect to provide the majority of Calumet’s billet requirements from KSW, which has sufficient capacity to supply the needed billets. This acquisition will allow us to further enhance our vertical integration strategy by converting more of our current billet production into higher-margin products. We will report the results of the acquired operations in a new segment.
We also completed an amendment to our current credit facility during the first quarter of 2007, increasing the total committed facility amount from $80.0 million to $100.0 million, in part to finance the CaluMetals acquisition.