
176 0 0 137 132 126 237 23 23 46 46 46 51 132 156 252 202 59 October 2014 Investor Presentation Exhibit 99.2
176 0 0 137 132 126 237 23 23 46 46 46 51 132 156 252 202 59 Page 2 Safe Harbor Statement Certain statements contained within this presentation may be considered forward-looking under the Private Securities Litigation Reform Act of 1995 and are subject to risks and uncertainties including, but not limited to, our ability to successfully complete the proposed spin-off, our ability to fully realize the expected benefits of the proposed spin-off, the global economic conditions, significant volume reductions from key contract customers, significant reduction in customer order patterns, loss of key customers or suppliers within specific industries, financial stability of key customers and suppliers, availability or cost of raw materials, and increased competitive pricing pressures reflecting excess industry capacities. Additional cautionary statements regarding other risk factors that could have an effect on the future performance of Kimball International, Inc. (the “Company”) are contained in the Company’s Form 10-K filing for the fiscal year ended June 30, 2014 and other filings with the Securities and Exchange Commission.
176 0 0 137 132 126 237 23 23 46 46 46 51 132 156 252 202 59 Page 3 Agenda 1) Kimball International Overview (Pre-Spin) 2) Spin-off of Electronics 3) Kimball International Overview and Strategic Objectives (Post Spin) 4) Kimball International Financial Overview 5) Key Investment Highlights - Why Invest in Kimball International 6) Appendix
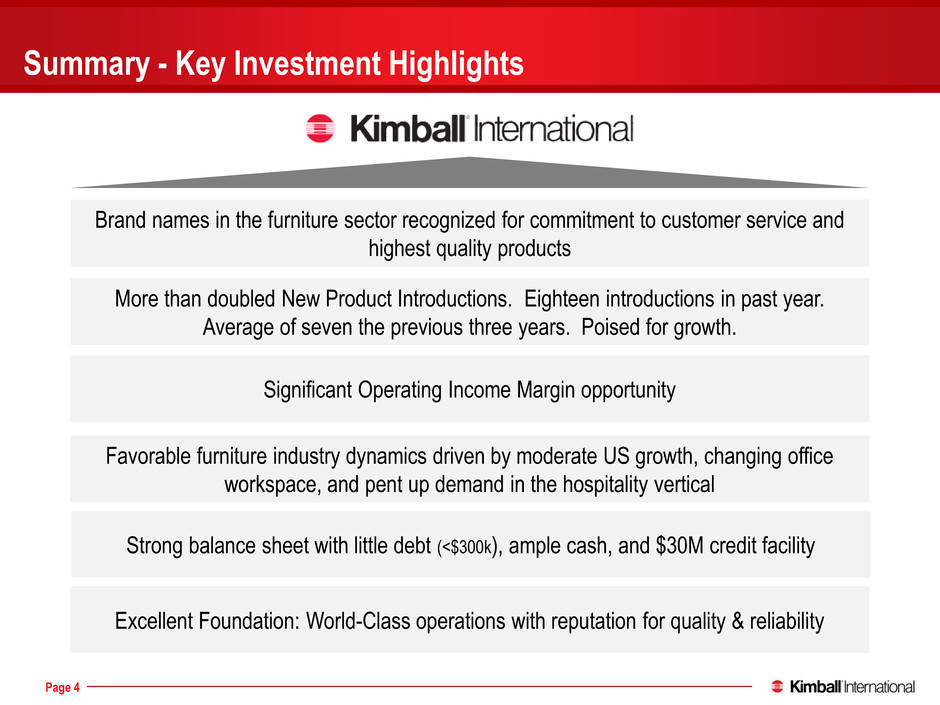
176 0 0 137 132 126 237 23 23 46 46 46 51 132 156 252 202 59 Page 4 Brand names in the furniture sector recognized for commitment to customer service and highest quality products Favorable furniture industry dynamics driven by moderate US growth, changing office workspace, and pent up demand in the hospitality vertical Strong balance sheet with little debt (<$300k), ample cash, and $30M credit facility Significant Operating Income Margin opportunity More than doubled New Product Introductions. Eighteen introductions in past year. Average of seven the previous three years. Poised for growth. Summary - Key Investment Highlights Excellent Foundation: World-Class operations with reputation for quality & reliability
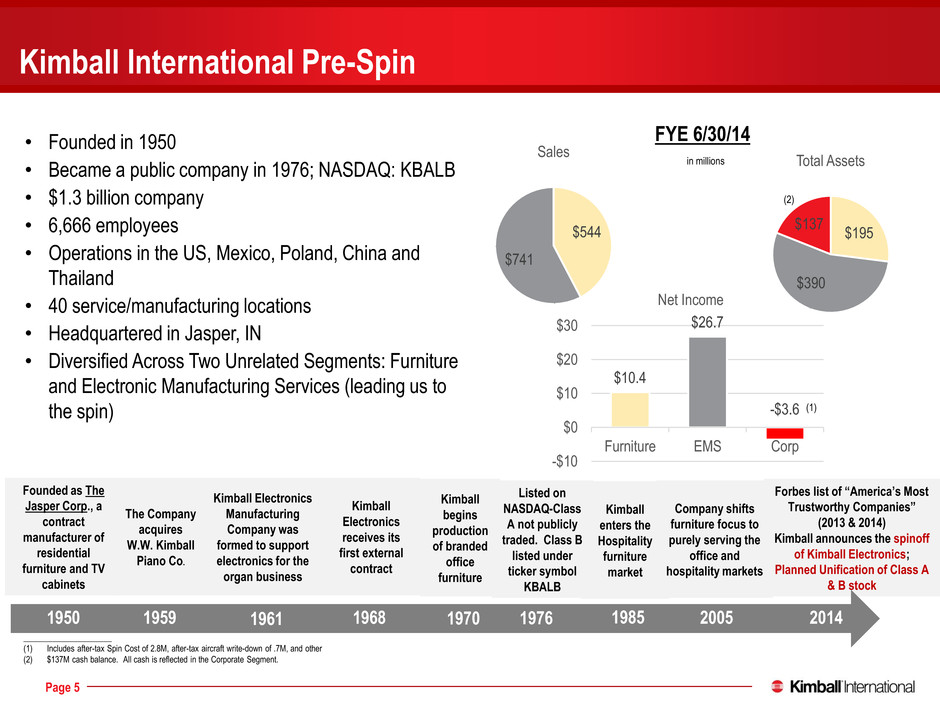
176 0 0 137 132 126 237 23 23 46 46 46 51 132 156 252 202 59 Page 5 Kimball International Pre-Spin • Founded in 1950 • Became a public company in 1976; NASDAQ: KBALB • $1.3 billion company • 6,666 employees • Operations in the US, Mexico, Poland, China and Thailand • 40 service/manufacturing locations • Headquartered in Jasper, IN • Diversified Across Two Unrelated Segments: Furniture and Electronic Manufacturing Services (leading us to the spin) Founded as The Jasper Corp., a contract manufacturer of residential furniture and TV cabinets Kimball Electronics Manufacturing Company was formed to support electronics for the organ business Kimball Electronics receives its first external contract Kimball begins production of branded office furniture Kimball enters the Hospitality furniture market Company shifts furniture focus to purely serving the office and hospitality markets Forbes list of “America’s Most Trustworthy Companies” (2013 & 2014) Kimball announces the spinoff of Kimball Electronics; Planned Unification of Class A & B stock 1950 1950 The Company acquires W.W. Kimball Piano Co. 1976 1985 $544 $741 Sales $195 $390 $137 Total Assets in millions (2) $10.4 $26.7 -$3.6 -$10 $0 $10 $20 $30 Furniture EMS Corp Net Income FYE 6/30/14 1970 1968 1961 1959 1950 2005 2014 Listed on NASDAQ-Class A not publicly traded. Class B listed under ticker symbol KBALB (1) _____________________ (1) Includes after-tax Spin Cost of 2.8M, after-tax aircraft write-down of .7M, and other (2) $137M cash balance. All cash is reflected in the Corporate Segment.
176 0 0 137 132 126 237 23 23 46 46 46 51 132 156 252 202 59 Page 6 Kimball International, Inc. Post-Spin Snapshot Kimball International, Inc. (NasdaqGS: KBAL post-spin; KBALB pre-spin) Designer and manufacturer of office, healthcare, education, and hospitality furniture through Kimball Office, National Office Furniture and Kimball Hospitality brands Headquartered in Jasper, Indiana Over 2,800 employees LTM 6/30/14 Revenue (1) – $544 million LTM 6/30/14 Pro Forma (1) EBITDA – $24.5 million Well Capitalized. Fiscal Years 2011, 2012, 2013 & 2014 Continuing Operations Are Not Reflective Of The Post-Spin Cost Structure. See appendix for Non-GAAP reconciliation. _____________________ (1) Unaudited. See Appendix for Non-GAAP reconciliation.
176 0 0 137 132 126 237 23 23 46 46 46 51 132 156 252 202 59 Spin-off of Electronics
176 0 0 137 132 126 237 23 23 46 46 46 51 132 156 252 202 59 Page 8 Spin-off Transaction Summary Kimball International, Inc. (“Kimball International”) has announced a stock spin-off of Kimball Electronics, Inc. (“Kimball Electronics “ or “KE”) Distributing Company: Kimball International, Inc. (NasdaqGS:[KBAL.B]) Distributed Company: Kimball Electronics, Inc. (NasdaqGS:KE) Distributed Securities: 100% of KE Common Stock Distribution Ratio: 3/4 common shares of KE for every share of Kimball International Kimball International Diluted Shares-Unification of Class A & B stock: 39.0 million (1) Efficient Tax-Free transaction Expect to complete spin on October 31, 2014 _____________________ (1) Average number shares outstanding as of 6/30/2014
176 0 0 137 132 126 237 23 23 46 46 46 51 132 156 252 202 59 Page 9 Spin-Off Rationale Enhance shareholder value with greater focus Enable investor valuation of different businesses Independent capital structures Planned conversion to single class of stock
176 0 0 137 132 126 237 23 23 46 46 46 51 132 156 252 202 59 Kimball International Overview and Strategic Objectives (Post Spin)
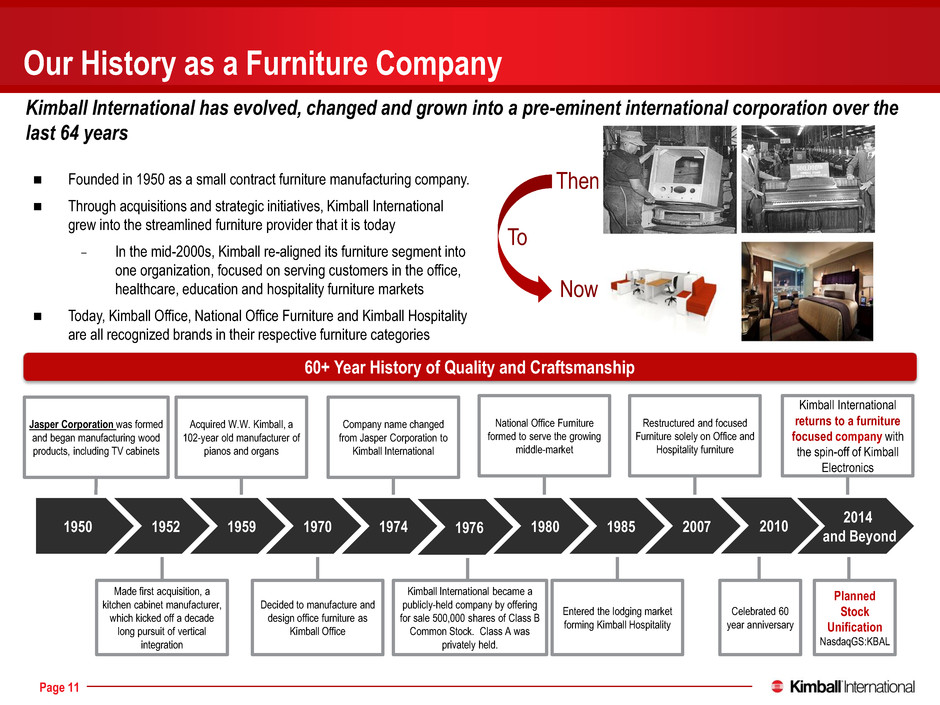
176 0 0 137 132 126 237 23 23 46 46 46 51 132 156 252 202 59 Page 11 Our History as a Furniture Company 60+ Year History of Quality and Craftsmanship Founded in 1950 as a small contract furniture manufacturing company. Through acquisitions and strategic initiatives, Kimball International grew into the streamlined furniture provider that it is today - In the mid-2000s, Kimball re-aligned its furniture segment into one organization, focused on serving customers in the office, healthcare, education and hospitality furniture markets Today, Kimball Office, National Office Furniture and Kimball Hospitality are all recognized brands in their respective furniture categories Celebrated 60 year anniversary Made first acquisition, a kitchen cabinet manufacturer, which kicked off a decade long pursuit of vertical integration Jasper Corporation was formed and began manufacturing wood products, including TV cabinets Acquired W.W. Kimball, a 102-year old manufacturer of pianos and organs Decided to manufacture and design office furniture as Kimball Office Company name changed from Jasper Corporation to Kimball International Kimball International became a publicly-held company by offering for sale 500,000 shares of Class B Common Stock. Class A was privately held. Restructured and focused Furniture solely on Office and Hospitality furniture National Office Furniture formed to serve the growing middle-market 1950 1952 1959 1974 1970 1985 1980 2007 2010 1976 Entered the lodging market forming Kimball Hospitality Kimball International returns to a furniture focused company with the spin-off of Kimball Electronics 2014 and Beyond Kimball International has evolved, changed and grown into a pre-eminent international corporation over the last 64 years Then Now To Planned Stock Unification NasdaqGS:KBAL
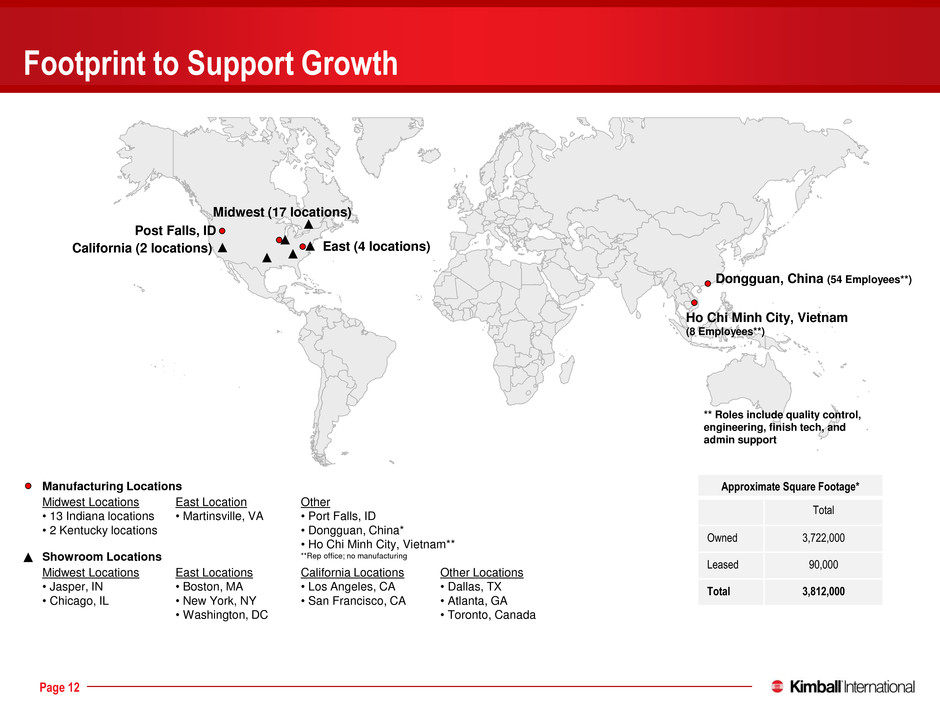
176 0 0 137 132 126 237 23 23 46 46 46 51 132 156 252 202 59 Page 12 Other Locations • Dallas, TX • Atlanta, GA • Toronto, Canada Post Falls, ID Dongguan, China (54 Employees**) Midwest Locations • 13 Indiana locations • 2 Kentucky locations Manufacturing Locations Showroom Locations Midwest Locations • Jasper, IN • Chicago, IL East (4 locations) East Locations • Boston, MA • New York, NY • Washington, DC East Location • Martinsville, VA California (2 locations) California Locations • Los Angeles, CA • San Francisco, CA Midwest (17 locations) Approximate Square Footage* Total Owned 3,722,000 Leased 90,000 Total 3,812,000 Other • Port Falls, ID • Dongguan, China* • Ho Chi Minh City, Vietnam** **Rep office; no manufacturing Ho Chi Minh City, Vietnam (8 Employees**) Footprint to Support Growth ** Roles include quality control, engineering, finish tech, and admin support
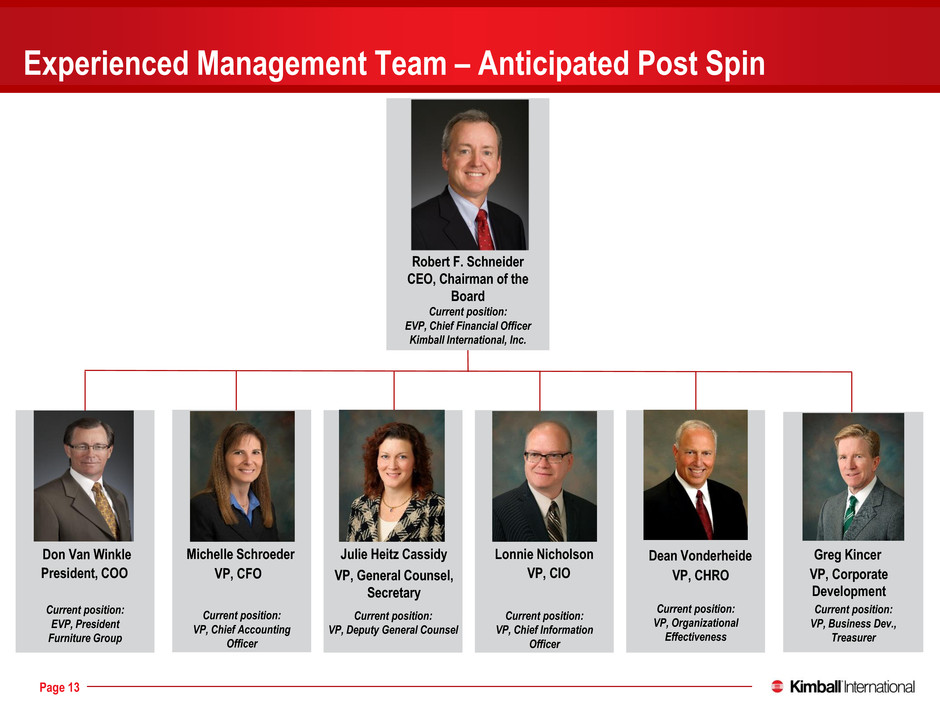
176 0 0 137 132 126 237 23 23 46 46 46 51 132 156 252 202 59 Page 13 Experienced Management Team – Anticipated Post Spin Robert F. Schneider CEO, Chairman of the Board Current position: EVP, Chief Financial Officer Kimball International, Inc. Current position: VP, Chief Accounting Officer Current position: VP, Organizational Effectiveness Current position: VP, Deputy General Counsel Current position: EVP, President Furniture Group Current position: VP, Chief Information Officer Don Van Winkle Michelle Schroeder Julie Heitz Cassidy Lonnie Nicholson Dean Vonderheide Greg Kincer President, COO VP, CFO VP, General Counsel, Secretary VP, CIO VP, CHRO VP, Corporate Development Current position: VP, Business Dev., Treasurer Greg Kincer VP, Corporate Development
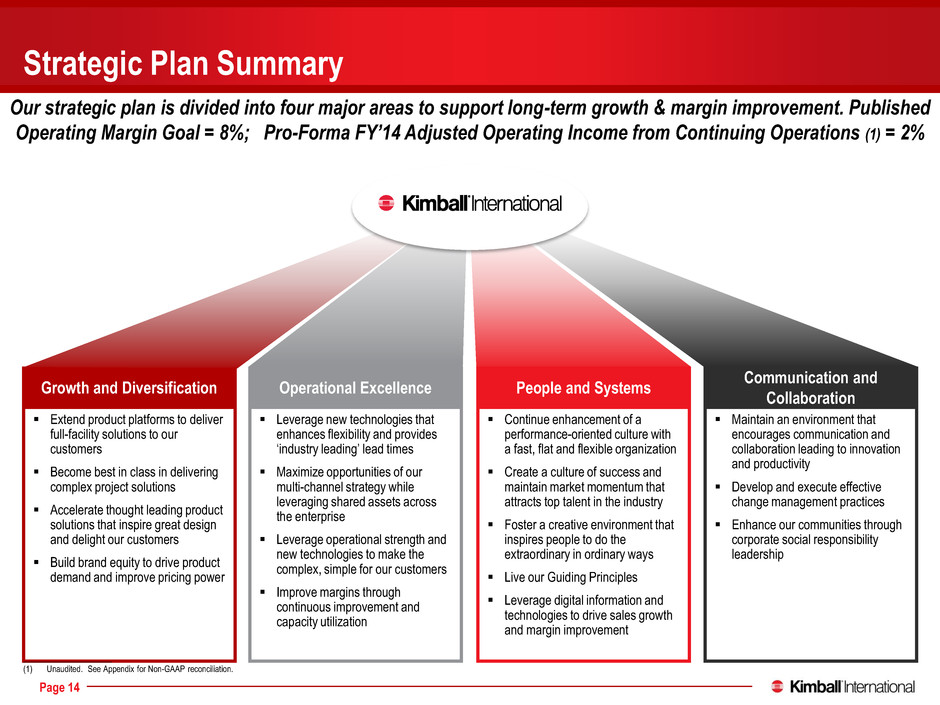
176 0 0 137 132 126 237 23 23 46 46 46 51 132 156 252 202 59 Page 14 Strategic Plan Summary Our strategic plan is divided into four major areas to support long-term growth & margin improvement. Published Operating Margin Goal = 8%; Pro-Forma FY’14 Adjusted Operating Income from Continuing Operations (1) = 2% Extend product platforms to deliver full-facility solutions to our customers Become best in class in delivering complex project solutions Accelerate thought leading product solutions that inspire great design and delight our customers Build brand equity to drive product demand and improve pricing power Leverage new technologies that enhances flexibility and provides ‘industry leading’ lead times Maximize opportunities of our multi-channel strategy while leveraging shared assets across the enterprise Leverage operational strength and new technologies to make the complex, simple for our customers Improve margins through continuous improvement and capacity utilization Continue enhancement of a performance-oriented culture with a fast, flat and flexible organization Create a culture of success and maintain market momentum that attracts top talent in the industry Foster a creative environment that inspires people to do the extraordinary in ordinary ways Live our Guiding Principles Leverage digital information and technologies to drive sales growth and margin improvement Maintain an environment that encourages communication and collaboration leading to innovation and productivity Develop and execute effective change management practices Enhance our communities through corporate social responsibility leadership Growth and Diversification Operational Excellence People and Systems Communication and Collaboration _____________________ (1) Unaudited. See Appendix for Non-GAAP reconciliation.
176 0 0 137 132 126 237 23 23 46 46 46 51 132 156 252 202 59 Page 15 Strategic Action Plan Tactics Provide product solutions enabling customers to attain new workplace strategies, collaboration, innovation, productivity and well being Increase domestic manufacturing to support the Hospitality market change to shorter lead times and less supply chain risk Increase new product offerings in the fast growing Healthcare vertical Expand the Hospitality focus beyond in-room furniture Increase sales outside the US Improve capacity utilization post-spin
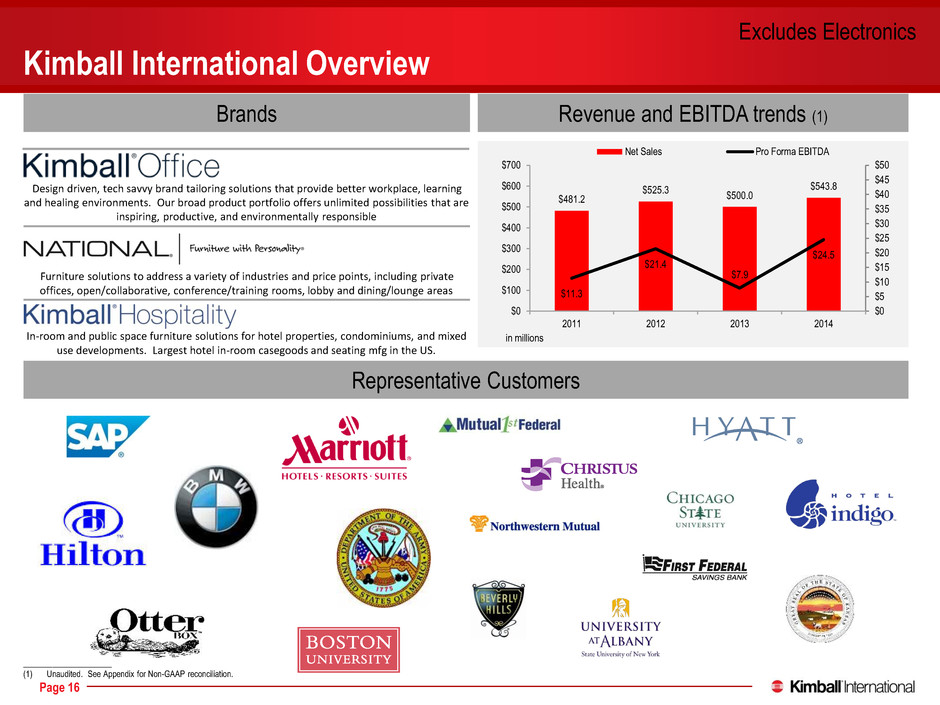
176 0 0 137 132 126 237 23 23 46 46 46 51 132 156 252 202 59 Page 16 Brands Representative Customers Revenue and EBITDA trends (1) Design driven, tech savvy brand tailoring solutions that provide better workplace, learning and healing environments. Our broad product portfolio offers unlimited possibilities that are inspiring, productive, and environmentally responsible In-room and public space furniture solutions for hotel properties, condominiums, and mixed use developments. Largest hotel in-room casegoods and seating mfg in the US. Furniture solutions to address a variety of industries and price points, including private offices, open/collaborative, conference/training rooms, lobby and dining/lounge areas $481.2 $525.3 $500.0 $543.8 $11.3 $21.4 $7.9 $24.5 $0 $5 $10 $15 $20 $25 $30 $35 $40 $45 $50 $0 $100 $200 $300 $400 $500 $600 $700 2011 2012 2013 2014 Net Sales Pro Forma EBITDA in millions Kimball International Overview _____________________ (1) Unaudited. See Appendix for Non-GAAP reconciliation. Excludes Electronics
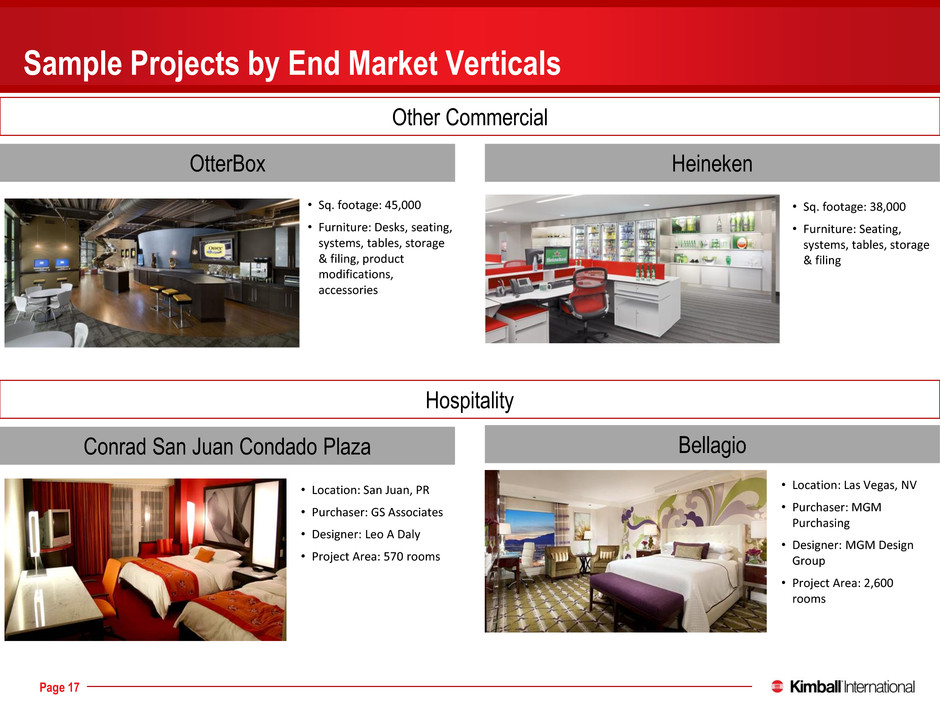
176 0 0 137 132 126 237 23 23 46 46 46 51 132 156 252 202 59 Page 17 Sample Projects by End Market Verticals Heineken • Sq. footage: 38,000 • Furniture: Seating, systems, tables, storage & filing Other Commercial Hospitality OtterBox • Sq. footage: 45,000 • Furniture: Desks, seating, systems, tables, storage & filing, product modifications, accessories Conrad San Juan Condado Plaza • Location: San Juan, PR • Purchaser: GS Associates • Designer: Leo A Daly • Project Area: 570 rooms Bellagio • Location: Las Vegas, NV • Purchaser: MGM Purchasing • Designer: MGM Design Group • Project Area: 2,600 rooms
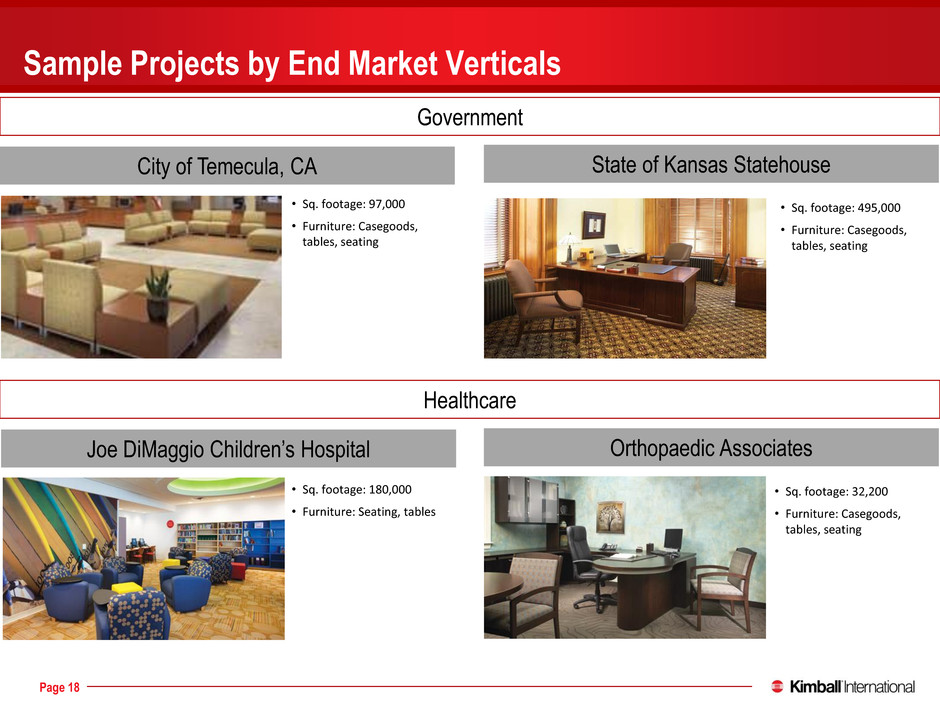
176 0 0 137 132 126 237 23 23 46 46 46 51 132 156 252 202 59 Page 18 Sample Projects by End Market Verticals Government Healthcare City of Temecula, CA • Sq. footage: 97,000 • Furniture: Casegoods, tables, seating State of Kansas Statehouse • Sq. footage: 495,000 • Furniture: Casegoods, tables, seating Joe DiMaggio Children’s Hospital • Sq. footage: 180,000 • Furniture: Seating, tables Orthopaedic Associates • Sq. footage: 32,200 • Furniture: Casegoods, tables, seating
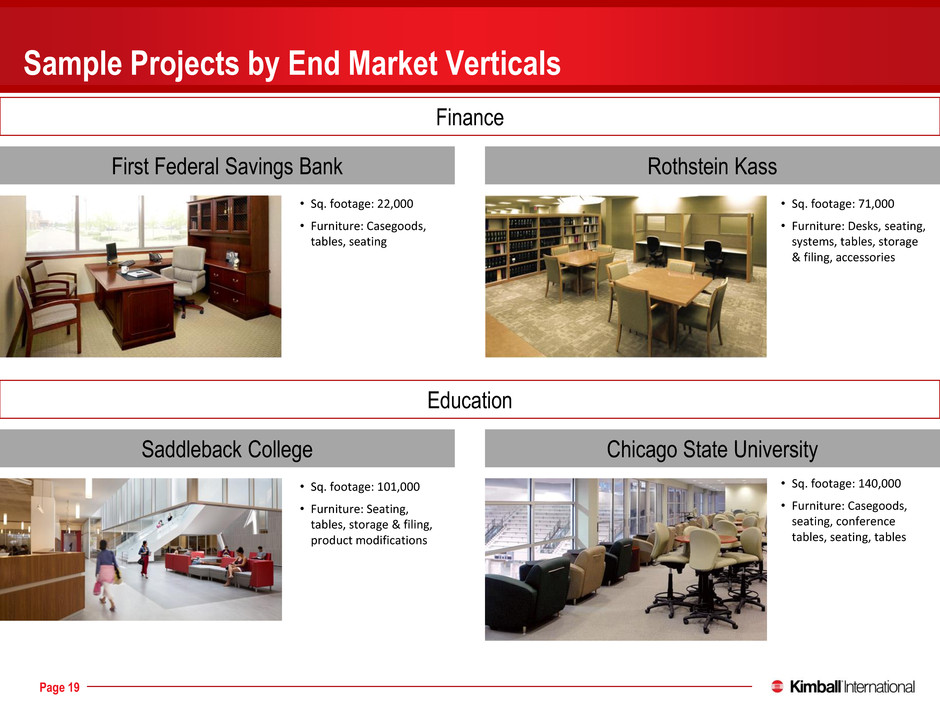
176 0 0 137 132 126 237 23 23 46 46 46 51 132 156 252 202 59 Page 19 Sample Projects by End Market Verticals Finance Education Saddleback College • Sq. footage: 101,000 • Furniture: Seating, tables, storage & filing, product modifications First Federal Savings Bank • Sq. footage: 22,000 • Furniture: Casegoods, tables, seating Rothstein Kass • Sq. footage: 71,000 • Furniture: Desks, seating, systems, tables, storage & filing, accessories Chicago State University • Sq. footage: 140,000 • Furniture: Casegoods, seating, conference tables, seating, tables
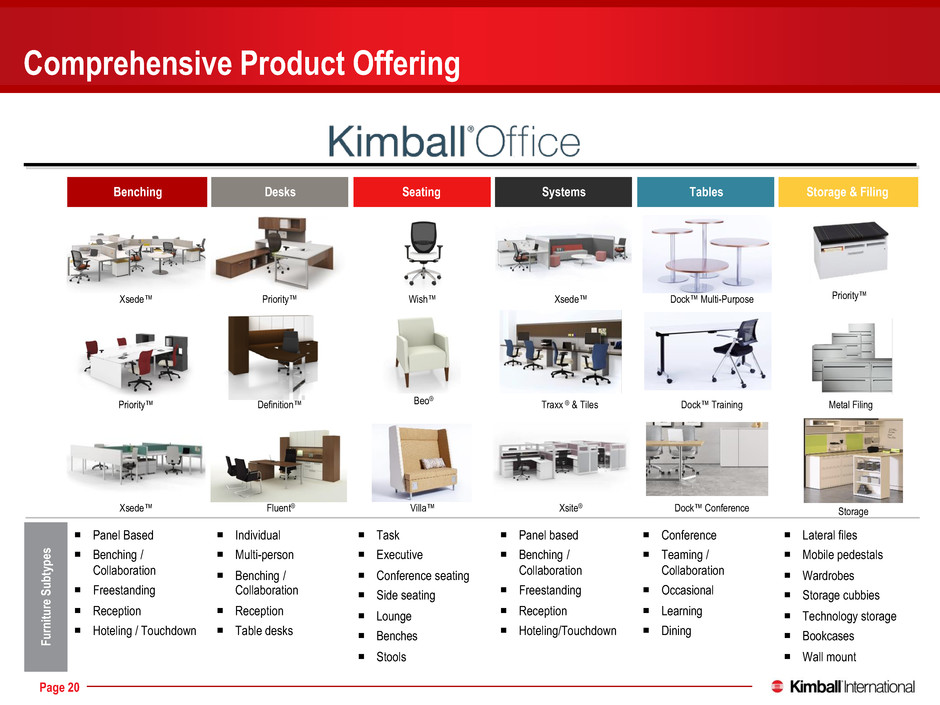
176 0 0 137 132 126 237 23 23 46 46 46 51 132 156 252 202 59 Page 20 Benching Desks Seating Systems Tables Storage & Filing Fu rni tur e S ub typ es ¡ Panel Based ¡ Benching / Collaboration ¡ Freestanding ¡ Reception ¡ Hoteling / Touchdown ¡ Individual ¡ Multi-person ¡ Benching / Collaboration ¡ Reception ¡ Table desks ¡ Task ¡ Executive ¡ Conference seating ¡ Side seating ¡ Lounge ¡ Benches ¡ Stools ¡ Panel based ¡ Benching / Collaboration ¡ Freestanding ¡ Reception ¡ Hoteling/Touchdown ¡ Conference ¡ Teaming / Collaboration ¡ Occasional ¡ Learning ¡ Dining ¡ Lateral files ¡ Mobile pedestals ¡ Wardrobes ¡ Storage cubbies ¡ Technology storage ¡ Bookcases ¡ Wall mount Comprehensive Product Offering Priority™ Definition™ Priority™ Xsede™ Fluent® Wish™ Beo® Villa™ Traxx ® & Tiles Xsite® Xsede™ Dock™ Multi-Purpose Dock™ Training Dock™ Conference Storage Metal Filing Priority™ Xsede™
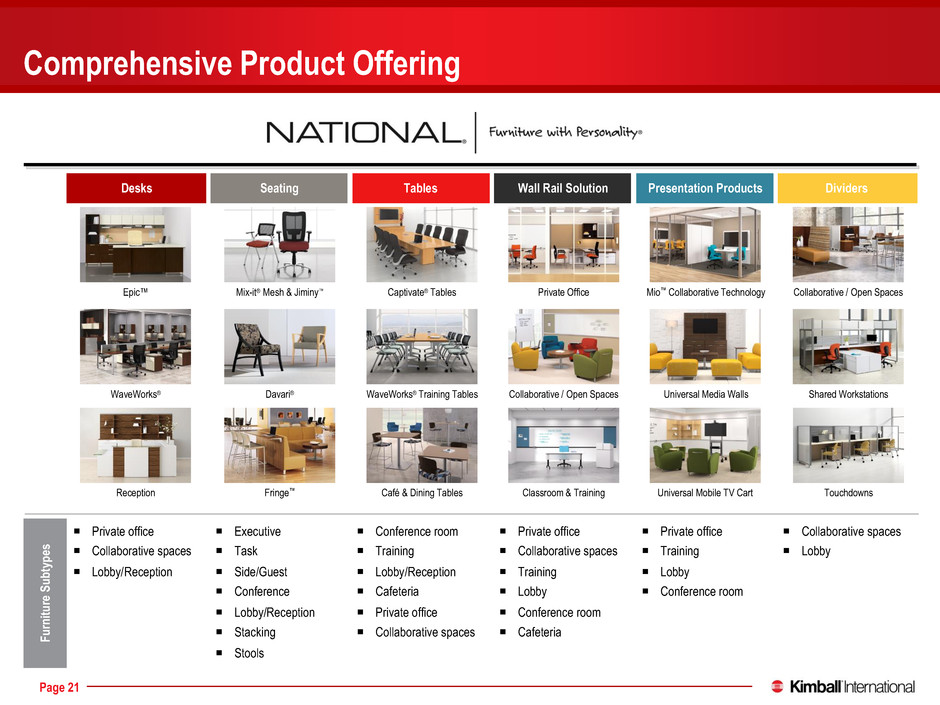
176 0 0 137 132 126 237 23 23 46 46 46 51 132 156 252 202 59 Page 21 Desks Seating Tables Wall Rail Solution Presentation Products Dividers Fu rni tur e S ub typ es ¡ Private office ¡ Collaborative spaces ¡ Lobby/Reception ¡ Executive ¡ Task ¡ Side/Guest ¡ Conference ¡ Lobby/Reception ¡ Stacking ¡ Stools ¡ Conference room ¡ Training ¡ Lobby/Reception ¡ Cafeteria ¡ Private office ¡ Collaborative spaces ¡ Private office ¡ Collaborative spaces ¡ Training ¡ Lobby ¡ Conference room ¡ Cafeteria ¡ Private office ¡ Training ¡ Lobby ¡ Conference room ¡ Collaborative spaces ¡ Lobby Comprehensive Product Offering Epic™ WaveWorks® Davari® Mix-it® Mesh & Jiminy™ Reception Fringe™ Captivate® Tables WaveWorks® Training Tables Café & Dining Tables Collaborative / Open Spaces Classroom & Training Private Office Mio™ Collaborative Technology Universal Media Walls Collaborative / Open Spaces Shared Workstations Touchdowns Universal Mobile TV Cart
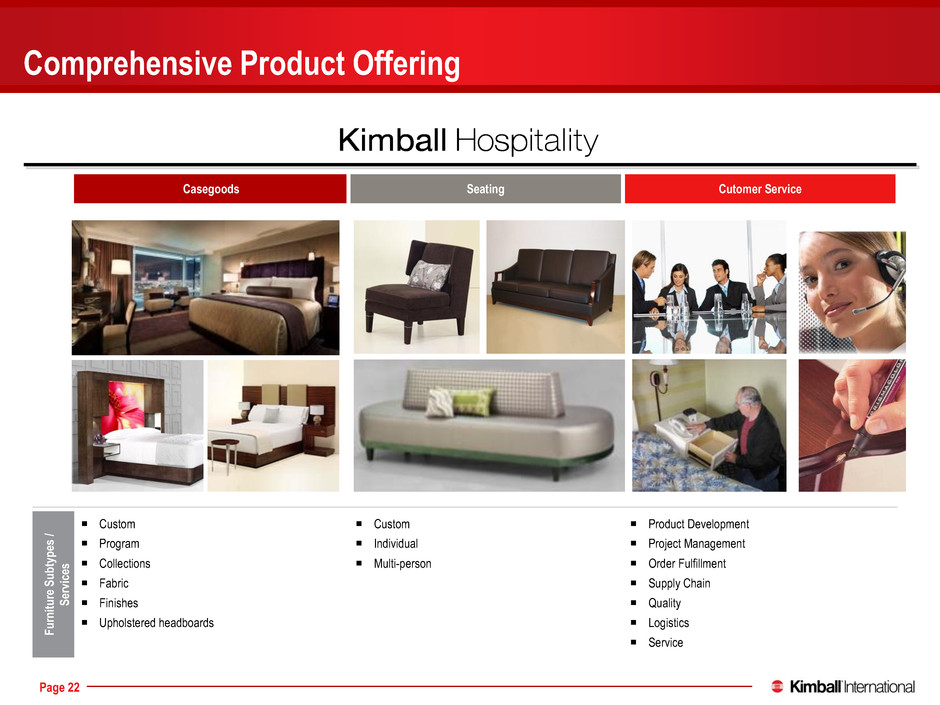
176 0 0 137 132 126 237 23 23 46 46 46 51 132 156 252 202 59 Page 22 Comprehensive Product Offering Casegoods Seating Cutomer Service Fu rni tur e Su bty pe s / Se rvi ce s Custom Program Collections Fabric Finishes Upholstered headboards Custom Individual Multi-person Product Development Project Management Order Fulfillment Supply Chain Quality Logistics Service
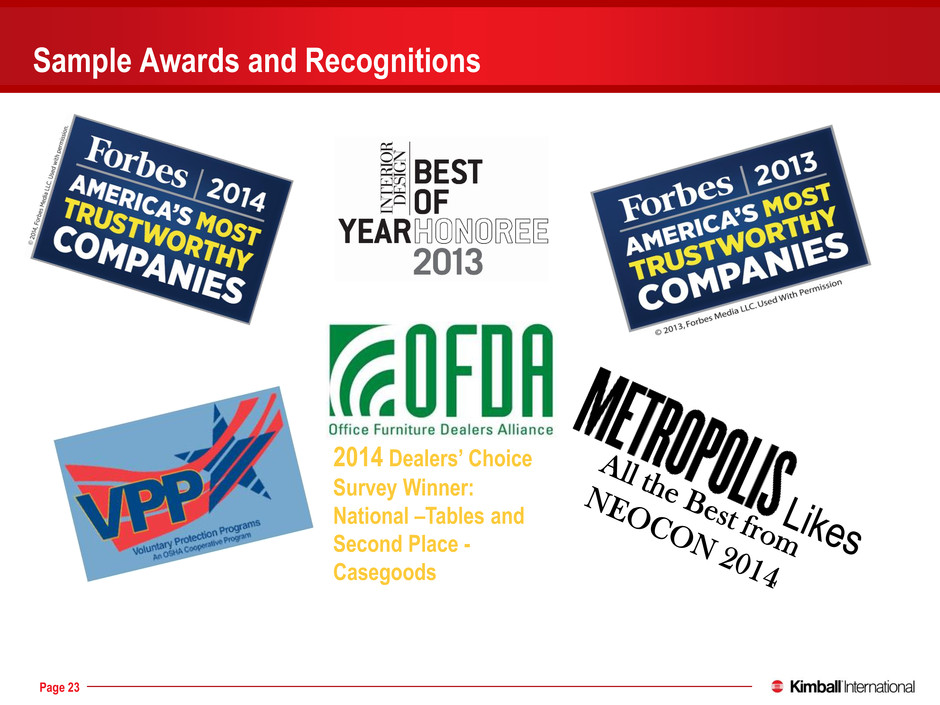
176 0 0 137 132 126 237 23 23 46 46 46 51 132 156 252 202 59 Page 23 2014 Dealers’ Choice Survey Winner: National –Tables and Second Place - Casegoods Sample Awards and Recognitions
176 0 0 137 132 126 237 23 23 46 46 46 51 132 156 252 202 59 Furniture Industry Overviews
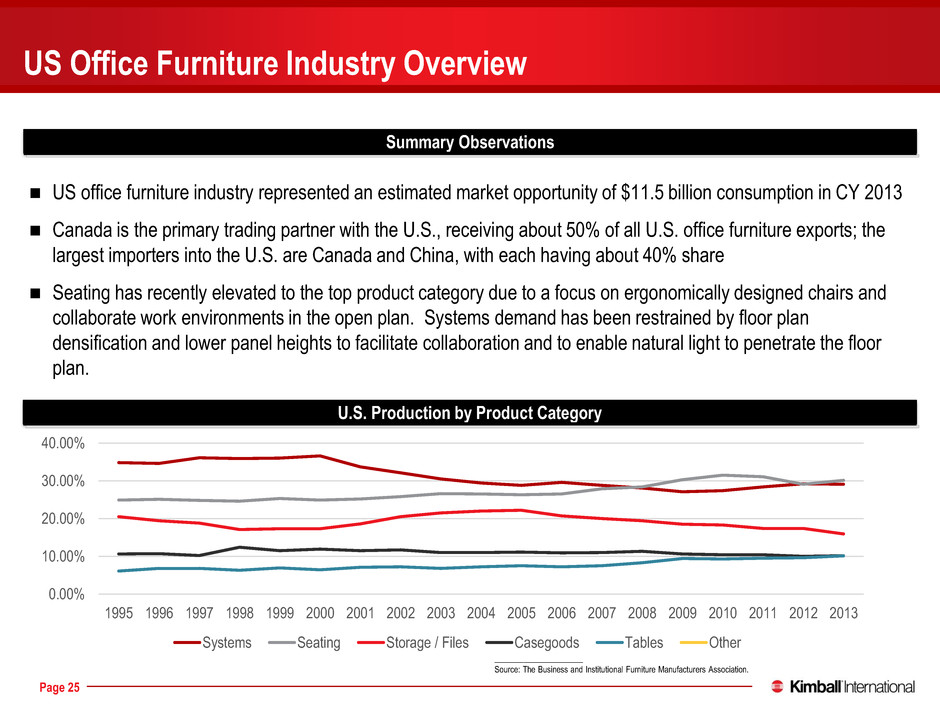
176 0 0 137 132 126 237 23 23 46 46 46 51 132 156 252 202 59 Page 25 Summary Observations US office furniture industry represented an estimated market opportunity of $11.5 billion consumption in CY 2013 Canada is the primary trading partner with the U.S., receiving about 50% of all U.S. office furniture exports; the largest importers into the U.S. are Canada and China, with each having about 40% share Seating has recently elevated to the top product category due to a focus on ergonomically designed chairs and collaborate work environments in the open plan. Systems demand has been restrained by floor plan densification and lower panel heights to facilitate collaboration and to enable natural light to penetrate the floor plan. US Office Furniture Industry Overview _____________________ Source: The Business and Institutional Furniture Manufacturers Association. U.S. Production by Product Category 0.00% 10.00% 20.00% 30.00% 40.00% 1995 1996 1997 1998 1999 2000 2001 2002 2003 2004 2005 2006 2007 2008 2009 2010 2011 2012 2013 Systems Seating Storage / Files Casegoods Tables Other
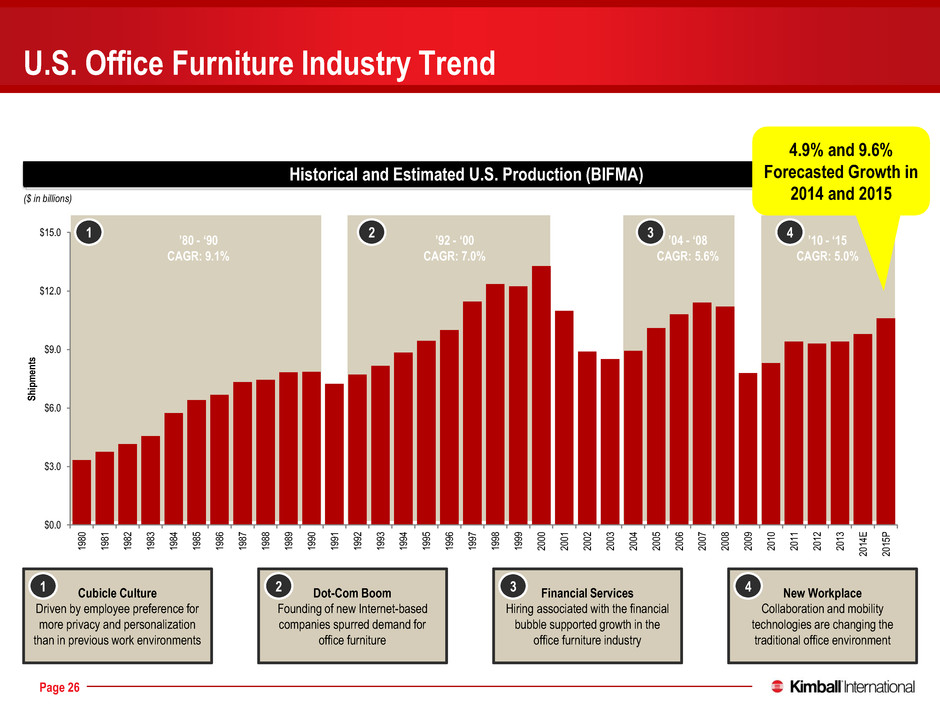
176 0 0 137 132 126 237 23 23 46 46 46 51 132 156 252 202 59 Page 26 Historical and Estimated U.S. Production (BIFMA) Cubicle Culture Driven by employee preference for more privacy and personalization than in previous work environments U.S. Office Furniture Industry Trend ($ in billions) Dot-Com Boom Founding of new Internet-based companies spurred demand for office furniture Financial Services Hiring associated with the financial bubble supported growth in the office furniture industry New Workplace Collaboration and mobility technologies are changing the traditional office environment ’80 - ‘90 CAGR: 9.1% ’92 - ‘00 CAGR: 7.0% ’04 - ‘08 CAGR: 5.6% ’10 - ‘15 CAGR: 5.0% 1 2 3 4 1 2 3 4 $0.0 $3.0 $6.0 $9.0 $12.0 $15.0 19 80 19 81 19 82 19 83 19 84 19 85 19 86 19 87 19 88 19 89 19 90 19 91 19 92 19 93 19 94 19 95 19 96 19 97 19 98 19 99 20 00 20 01 20 02 20 03 20 04 20 05 20 06 20 07 20 08 20 09 20 10 20 11 20 12 20 13 20 14 E 20 15 P S h ip m en ts 4.9% and 9.6% Forecasted Growth in 2014 and 2015
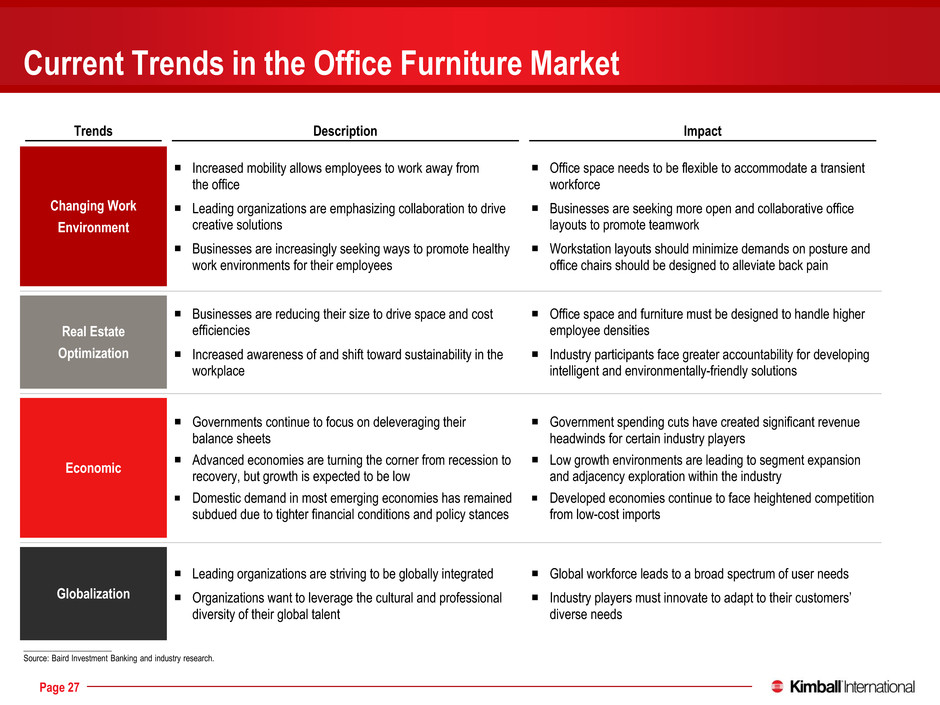
176 0 0 137 132 126 237 23 23 46 46 46 51 132 156 252 202 59 Page 27 Trends Description Impact Changing Work Environment Increased mobility allows employees to work away from the office Leading organizations are emphasizing collaboration to drive creative solutions Businesses are increasingly seeking ways to promote healthy work environments for their employees Office space needs to be flexible to accommodate a transient workforce Businesses are seeking more open and collaborative office layouts to promote teamwork Workstation layouts should minimize demands on posture and office chairs should be designed to alleviate back pain Real Estate Optimization Businesses are reducing their size to drive space and cost efficiencies Increased awareness of and shift toward sustainability in the workplace Office space and furniture must be designed to handle higher employee densities Industry participants face greater accountability for developing intelligent and environmentally-friendly solutions Economic Governments continue to focus on deleveraging their balance sheets Advanced economies are turning the corner from recession to recovery, but growth is expected to be low Domestic demand in most emerging economies has remained subdued due to tighter financial conditions and policy stances Government spending cuts have created significant revenue headwinds for certain industry players Low growth environments are leading to segment expansion and adjacency exploration within the industry Developed economies continue to face heightened competition from low-cost imports Globalization Leading organizations are striving to be globally integrated Organizations want to leverage the cultural and professional diversity of their global talent Global workforce leads to a broad spectrum of user needs Industry players must innovate to adapt to their customers’ diverse needs _____________________ Source: Baird Investment Banking and industry research. Current Trends in the Office Furniture Market
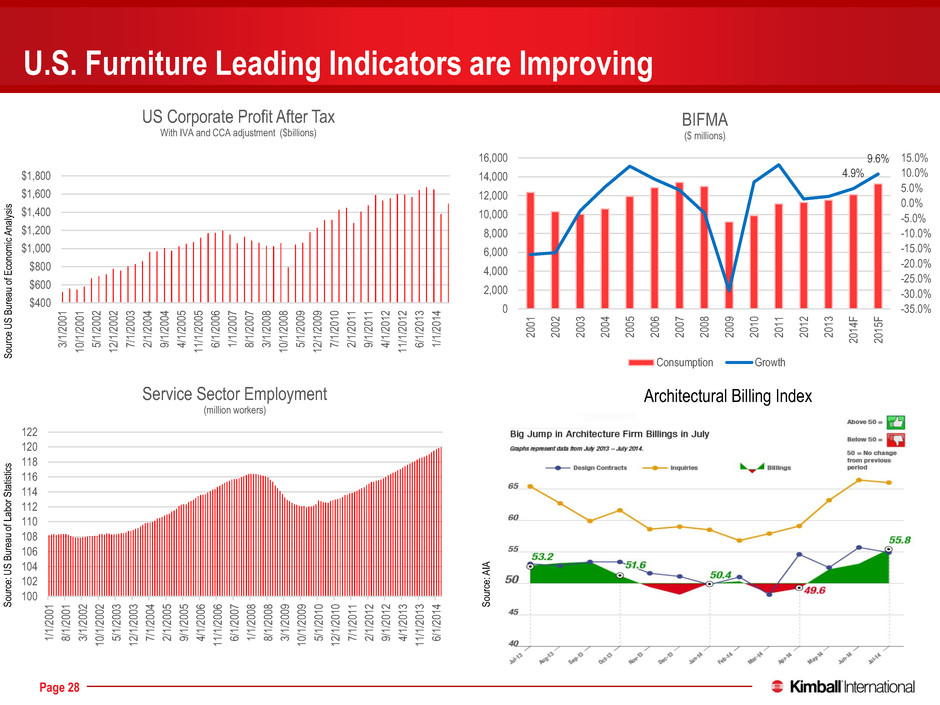
176 0 0 137 132 126 237 23 23 46 46 46 51 132 156 252 202 59 Page 28 Economic Landscape Office Furniture Demand Drivers U.S. Furniture Leading Indicators are Improving $400 $600 $800 $1,000 $1,200 $1,400 $1,600 $1,800 3/ 1/ 20 01 10 /1 /2 00 1 5/ 1/ 20 02 12 /1 /2 00 2 7/ 1/ 20 03 2/ 1/ 20 04 9/ 1/ 20 04 4/ 1/ 20 05 11 /1 /2 00 5 6/ 1/ 20 06 1/ 1/ 20 07 8/ 1/ 20 07 3/ 1/ 20 08 10 /1 /2 00 8 5/ 1/ 20 09 12 /1 /2 00 9 7/ 1/ 20 10 2/ 1/ 20 11 9/ 1/ 20 11 4/ 1/ 20 12 11 /1 /2 01 2 6/ 1/ 20 13 1/ 1/ 20 14 US Corporate Profit After Tax With IVA and CCA adjustment ($billions) 100 102 104 106 108 110 112 114 116 118 120 122 1/ 1/ 20 01 8/ 1/ 20 01 3/ 1/ 20 02 10 /1 /2 00 2 5/ 1/ 20 03 12 /1 /2 00 3 7/ 1/ 20 04 2/ 1/ 20 05 9/ 1/ 20 05 4/ 1/ 20 06 11 /1 /2 00 6 6/ 1/ 20 07 1/ 1/ 20 08 8/ 1/ 20 08 3/ 1/ 20 09 10 /1 /2 00 9 5/ 1/ 20 10 12 /1 /2 01 0 7/ 1/ 20 11 2/ 1/ 20 12 9/ 1/ 20 12 4/ 1/ 20 13 11 /1 /2 01 3 6/ 1/ 20 14 Service Sector Employment (million workers) S ou rc e U S B ur ea u of E co no m ic A na ly si s S ou rc e: U S B ur ea u of L ab or S ta tis tic s 4.9% 9.6% -35.0% -30.0% -25.0% -20.0% -15.0% -10.0% -5.0% 0.0% 5.0% 10.0% 15.0% 0 2,000 4,000 6,000 8,000 10,000 12,000 14,000 16,000 20 01 20 02 20 03 20 04 20 05 20 06 20 07 20 08 20 09 20 10 20 11 20 12 20 13 20 14 F 20 15 F BIFMA ($ millions) Consumption Growth S ou rc e: A IA Architectural Billing Index
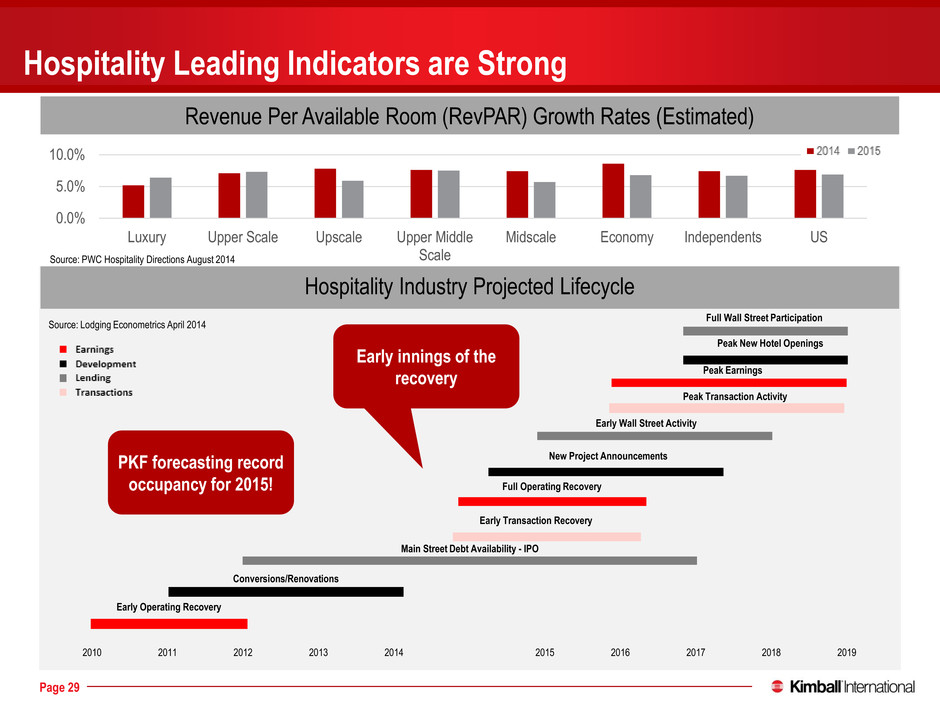
176 0 0 137 132 126 237 23 23 46 46 46 51 132 156 252 202 59 Page 29 US Economic Landscape Hospitality Metrics Hospitality Leading Indicators are Strong 0.0% 5.0% 10.0% Luxury Upper Scale Upscale Upper Middle Scale Midscale Economy Independents US 2014 2015 Source: PWC Hospitality Directions August 2014 Revenue Per Available Room (RevPAR) Growth Rates (Estimated) 2010 2011 2012 2013 2014 2015 2016 2017 2018 2019 Early Operating Recovery Conversions/Renovations Main Street Debt Availability - IPO Early Transaction Recovery Full Operating Recovery New Project Announcements Early Wall Street Activity Peak Transaction Activity Peak Earnings Peak New Hotel Openings Full Wall Street Participation Hospitality Industry Projected Lifecycle PKF forecasting record occupancy for 2015! Source: Lodging Econometrics April 2014 Early innings of the recovery
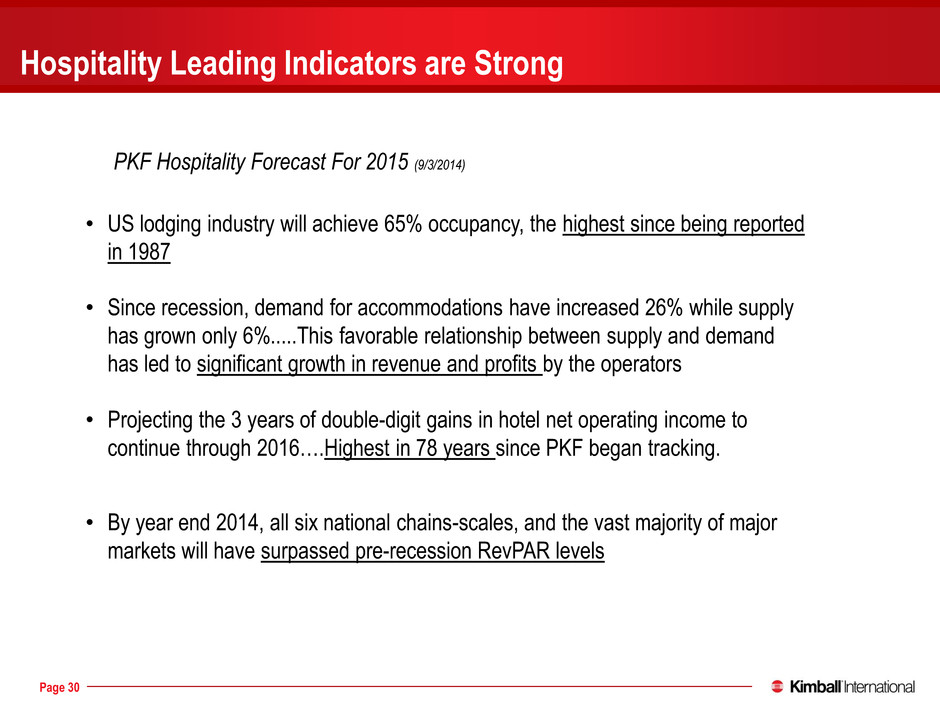
176 0 0 137 132 126 237 23 23 46 46 46 51 132 156 252 202 59 Page 30 PKF Hospitality Forecast For 2015 (9/3/2014) • US lodging industry will achieve 65% occupancy, the highest since being reported in 1987 • Since recession, demand for accommodations have increased 26% while supply has grown only 6%.....This favorable relationship between supply and demand has led to significant growth in revenue and profits by the operators • Projecting the 3 years of double-digit gains in hotel net operating income to continue through 2016….Highest in 78 years since PKF began tracking. • By year end 2014, all six national chains-scales, and the vast majority of major markets will have surpassed pre-recession RevPAR levels Hospitality Leading Indicators are Strong

176 0 0 137 132 126 237 23 23 46 46 46 51 132 156 252 202 59 Kimball International Financial Overview
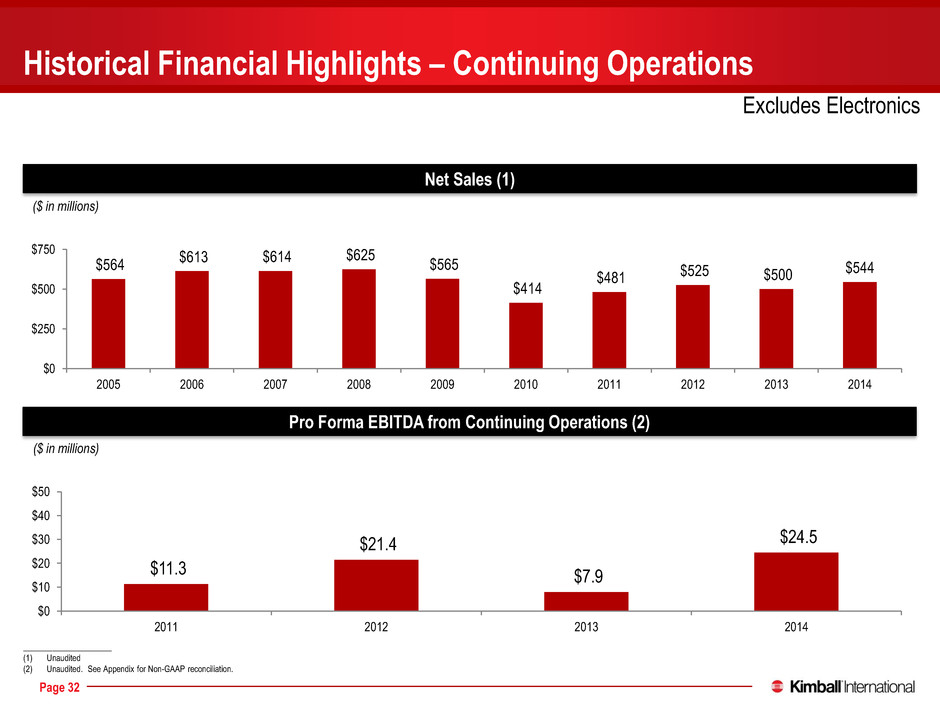
176 0 0 137 132 126 237 23 23 46 46 46 51 132 156 252 202 59 Page 32 Historical Financial Highlights – Continuing Operations Net Sales (1) ($ in millions) Pro Forma EBITDA from Continuing Operations (2) ($ in millions) $564 $613 $614 $625 $565 $414 $481 $525 $500 $544 $0 $250 $500 $750 2005 2006 2007 2008 2009 2010 2011 2012 2013 2014 $11.3 $21.4 $7.9 $24.5 $0 $10 $20 $30 $40 $50 2011 2012 2013 2014 Excludes Electronics _____________________ (1) Unaudited (2) Unaudited. See Appendix for Non-GAAP reconciliation.
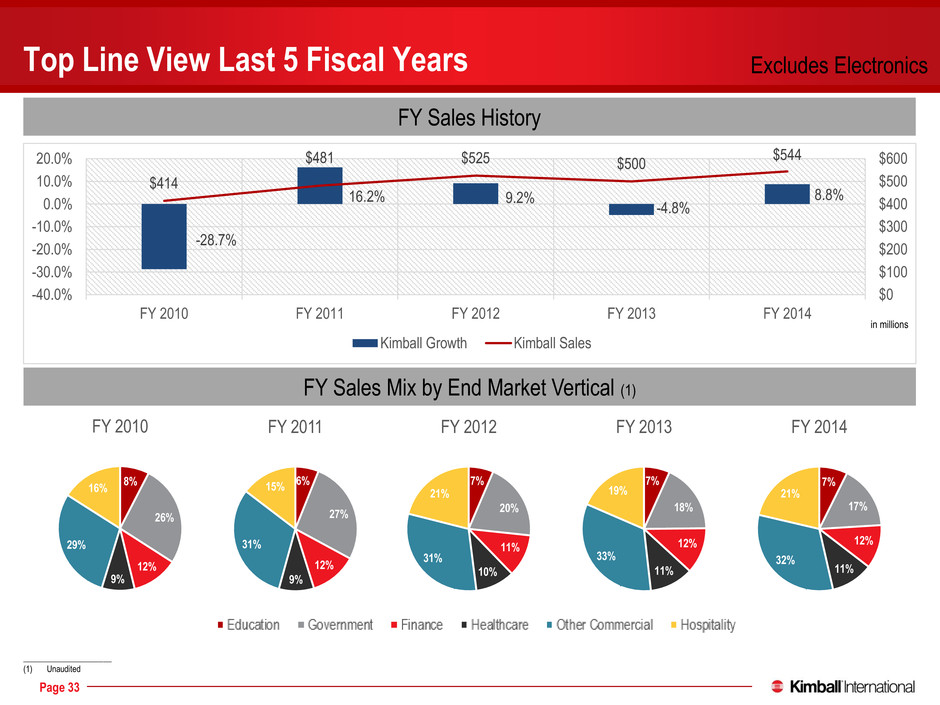
176 0 0 137 132 126 237 23 23 46 46 46 51 132 156 252 202 59 Page 33 Top Line View Last 5 Fiscal Years -28.7% 16.2% 9.2% -4.8% 8.8% $414 $481 $525 $500 $544 -40.0% -30.0% -20.0% -10.0% 0.0% 10.0% 20.0% FY 2010 FY 2011 FY 2012 FY 2013 FY 2014 $0 $100 $200 $300 $400 $500 $600 Kimball Growth Kimball Sales in millions FY Sales Mix by End Market Vertical (1) _____________________ (1) Unaudited 8% 26% 12% 9% 29% 16% FY 2010 6% 27% 12% 9% 31% 15% FY 2011 7% 20% 11% 10% 31% 21% FY 2012 7% 18% 12% 11% 33% 19% FY 2013 7% 17% 12% 11% 32% 21% FY 2014 FY Sales History Excludes Electronics
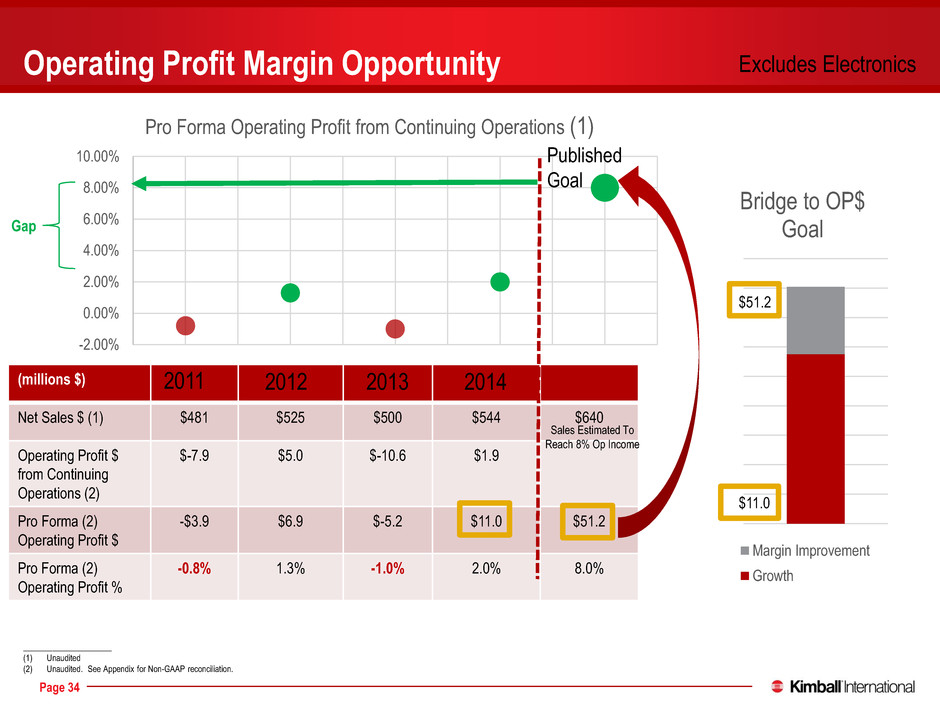
176 0 0 137 132 126 237 23 23 46 46 46 51 132 156 252 202 59 Page 34 -2.00% 0.00% 2.00% 4.00% 6.00% 8.00% 10.00% Pro Forma Operating Profit from Continuing Operations (1) Operating Profit Margin Opportunity (millions $) Net Sales $ (1) $481 $525 $500 $544 $640 Operating Profit $ from Continuing Operations (2) $-7.9 $5.0 $-10.6 $1.9 Pro Forma (2) Operating Profit $ -$3.9 $6.9 $-5.2 $11.0 $51.2 Pro Forma (2) Operating Profit % -0.8% 1.3% -1.0% 2.0% 8.0% 2011 2012 2013 2014 Published Goal Bridge to OP$ Goal Margin Improvement Growth $11.0 $51.2 Excludes Electronics _____________________ (1) Unaudited (2) Unaudited. See Appendix for Non-GAAP reconciliation. Sales Estimated To Reach 8% Op Income Gap

176 0 0 137 132 126 237 23 23 46 46 46 51 132 156 252 202 59 Page 35 FY 2014 Vs. FY 2013 $ % (1) $ % (1) Net Sales $543.8 8.8% $500.0 -4.8% Pro Forma Operating Profit from Continuing Operations $11.0 2.0% $-5.2 -1.0% Pro Forma EBITDA $24.5 $7.9 Debt $0.3k 2014 Highlights Hospitality led the growth in 2014 being up 27%. Growth driven by pent up demand from recession. All other verticals were up except Government which was flat with State & Local being up offset by Federal being down 10%. Federal Government appears to have stabilized. Total Government represented 17% of our sales in FY’14. 33% profit leverage on growth from FY 2013 to FY 2014. Profit improvement driven by price increase, higher margin projects, fixed cost leverage associated with higher sales, and benefits continuing to be realized from more effective project execution primarily in the Hospitality vertical. Well capitalized with very little debt. Positive leading indicators are encouraging for outlook. _____________________ (1) Revenue figures represent year over year growth. Operating Profit, Net Income and EBITDA figures represent margins. These results are unaudited.. See Appendix for Non-GAAP reconciliation. Excludes Electronics Unaudited
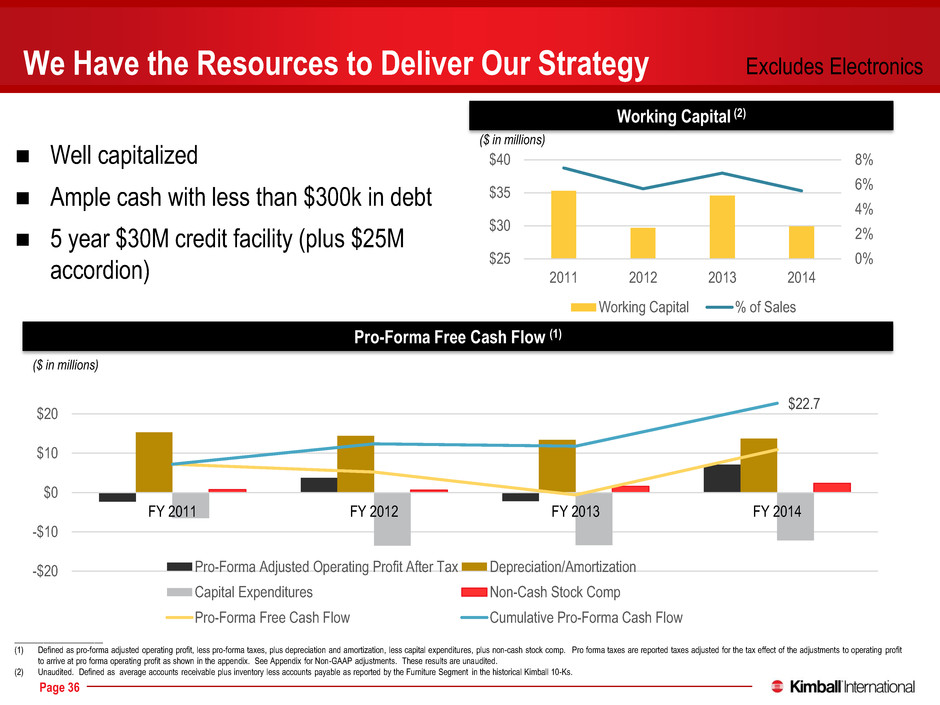
176 0 0 137 132 126 237 23 23 46 46 46 51 132 156 252 202 59 Page 36 0% 2% 4% 6% 8% $25 $30 $35 $40 2011 2012 2013 2014 Working Capital % of Sales Well capitalized Ample cash with less than $300k in debt 5 year $30M credit facility (plus $25M accordion) We Have the Resources to Deliver Our Strategy Working Capital (2) Pro-Forma Free Cash Flow (1) ($ in millions) _____________________ (1) Defined as pro-forma adjusted operating profit, less pro-forma taxes, plus depreciation and amortization, less capital expenditures, plus non-cash stock comp. Pro forma taxes are reported taxes adjusted for the tax effect of the adjustments to operating profit to arrive at pro forma operating profit as shown in the appendix. See Appendix for Non-GAAP adjustments. These results are unaudited. (2) Unaudited. Defined as average accounts receivable plus inventory less accounts payable as reported by the Furniture Segment in the historical Kimball 10-Ks. Excludes Electronics $22.7 FY 2011 FY 2012 FY 2013 FY 2014 -$20 -$10 $0 $10 $20 Pro-Forma Adjusted Operating Profit After Tax Depreciation/Amortization Capital Expenditures Non-Cash Stock Comp Pro-Forma Free Cash Flow Cumulative Pro-Forma Cash Flow ($ in millions)
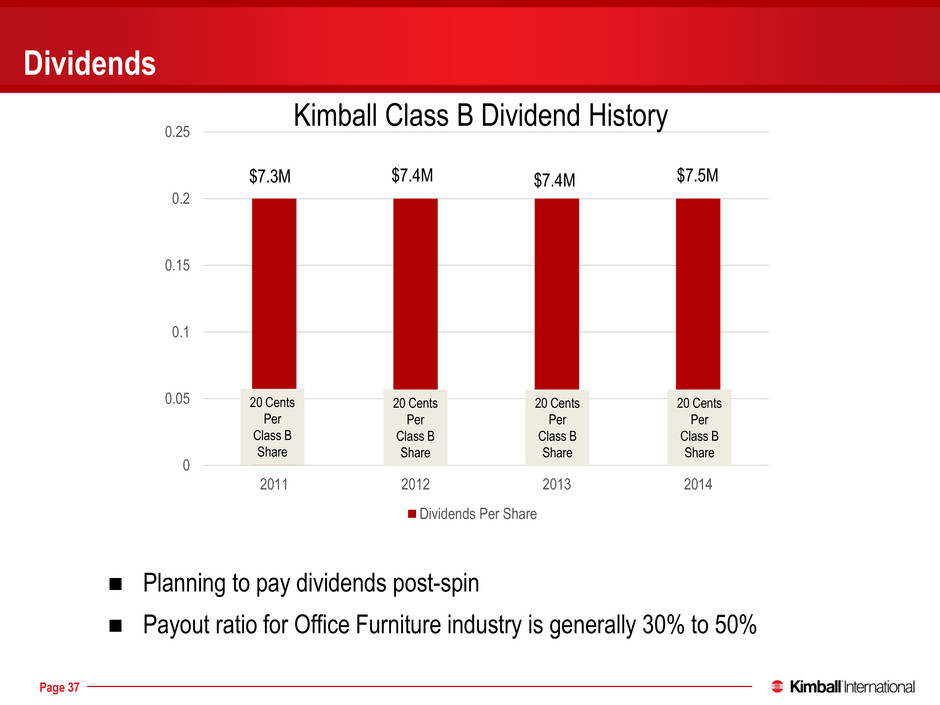
176 0 0 137 132 126 237 23 23 46 46 46 51 132 156 252 202 59 Page 37 Dividends Planning to pay dividends post-spin Payout ratio for Office Furniture industry is generally 30% to 50% 0 0.05 0.1 0.15 0.2 0.25 2011 2012 2013 2014 Dividends Per Share $7.5M $7.4M $7.4M $7.3M Kimball Class B Dividend History 20 Cents Per Class B Share 20 Cents Per Class B Share 20 Cents Per Class B Share 20 Cents Per Class B Share
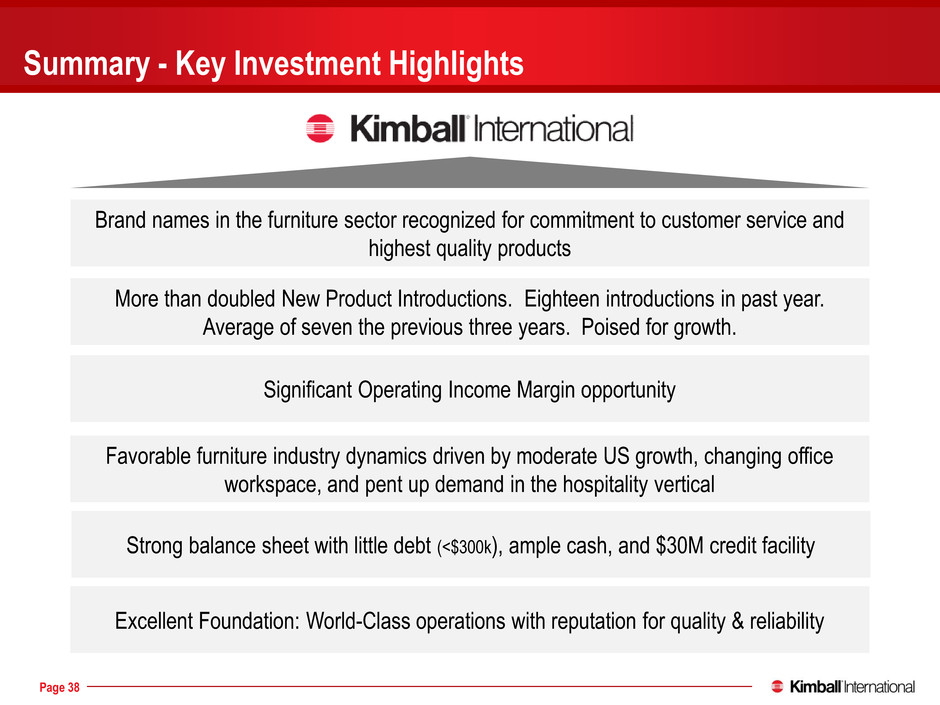
176 0 0 137 132 126 237 23 23 46 46 46 51 132 156 252 202 59 Page 38 Brand names in the furniture sector recognized for commitment to customer service and highest quality products Favorable furniture industry dynamics driven by moderate US growth, changing office workspace, and pent up demand in the hospitality vertical Strong balance sheet with little debt (<$300k), ample cash, and $30M credit facility Significant Operating Income Margin opportunity More than doubled New Product Introductions. Eighteen introductions in past year. Average of seven the previous three years. Poised for growth. Summary - Key Investment Highlights Excellent Foundation: World-Class operations with reputation for quality & reliability
176 0 0 137 132 126 237 23 23 46 46 46 51 132 156 252 202 59 Appendix
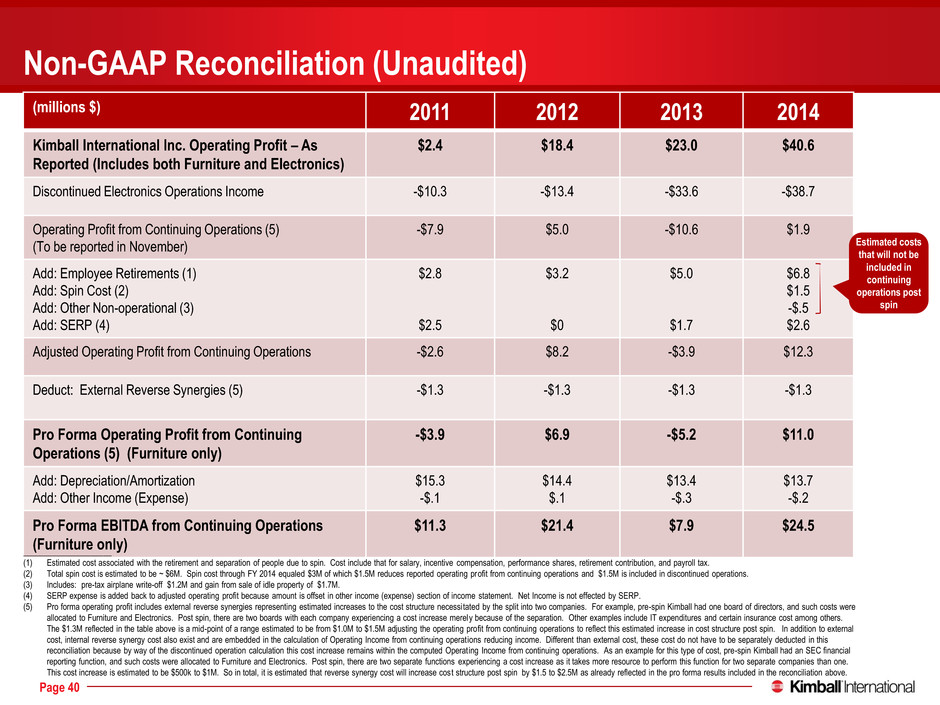
176 0 0 137 132 126 237 23 23 46 46 46 51 132 156 252 202 59 Page 40 Non-GAAP Reconciliation (Unaudited) (millions $) 2011 2012 2013 2014 Kimball International Inc. Operating Profit – As Reported (Includes both Furniture and Electronics) $2.4 $18.4 $23.0 $40.6 Discontinued Electronics Operations Income -$10.3 -$13.4 -$33.6 -$38.7 Operating Profit from Continuing Operations (5) (To be reported in November) -$7.9 $5.0 -$10.6 $1.9 Add: Employee Retirements (1) Add: Spin Cost (2) Add: Other Non-operational (3) Add: SERP (4) $2.8 $2.5 $3.2 $0 $5.0 $1.7 $6.8 $1.5 -$.5 $2.6 Adjusted Operating Profit from Continuing Operations -$2.6 $8.2 -$3.9 $12.3 Deduct: External Reverse Synergies (5) -$1.3 -$1.3 -$1.3 -$1.3 Pro Forma Operating Profit from Continuing Operations (5) (Furniture only) -$3.9 $6.9 -$5.2 $11.0 Add: Depreciation/Amortization Add: Other Income (Expense) $15.3 -$.1 $14.4 $.1 $13.4 -$.3 $13.7 -$.2 Pro Forma EBITDA from Continuing Operations (Furniture only) $11.3 $21.4 $7.9 $24.5 _____________________ (1) Estimated cost associated with the retirement and separation of people due to spin. Cost include that for salary, incentive compensation, performance shares, retirement contribution, and payroll tax. (2) Total spin cost is estimated to be ~ $6M. Spin cost through FY 2014 equaled $3M of which $1.5M reduces reported operating profit from continuing operations and $1.5M is included in discontinued operations. (3) Includes: pre-tax airplane write-off $1.2M and gain from sale of idle property of $1.7M. (4) SERP expense is added back to adjusted operating profit because amount is offset in other income (expense) section of income statement. Net Income is not effected by SERP. (5) Pro forma operating profit includes external reverse synergies representing estimated increases to the cost structure necessitated by the split into two companies. For example, pre-spin Kimball had one board of directors, and such costs were allocated to Furniture and Electronics. Post spin, there are two boards with each company experiencing a cost increase merely because of the separation. Other examples include IT expenditures and certain insurance cost among others. The $1.3M reflected in the table above is a mid-point of a range estimated to be from $1.0M to $1.5M adjusting the operating profit from continuing operations to reflect this estimated increase in cost structure post spin. In addition to external cost, internal reverse synergy cost also exist and are embedded in the calculation of Operating Income from continuing operations reducing income. Different than external cost, these cost do not have to be separately deducted in this reconciliation because by way of the discontinued operation calculation this cost increase remains within the computed Operating Income from continuing operations. As an example for this type of cost, pre-spin Kimball had an SEC financial reporting function, and such costs were allocated to Furniture and Electronics. Post spin, there are two separate functions experiencing a cost increase as it takes more resource to perform this function for two separate companies than one. This cost increase is estimated to be $500k to $1M. So in total, it is estimated that reverse synergy cost will increase cost structure post spin by $1.5 to $2.5M as already reflected in the pro forma results included in the reconciliation above. Estimated costs that will not be included in continuing operations post spin
End of Kimball International, Inc. Presentation Kimball Electronics, Inc. Presentation Follows

176 0 0 204 204 204 255 48 48 46 46 46 0 153 204 249 178 35 Investor Presentation October 2014
176 0 0 204 204 204 255 48 48 46 46 46 0 153 204 249 178 35 Page 43 Safe Harbor Statement Certain statements contained within this presentation may be considered forward-looking under the Private Securities Litigation Reform Act of 1995 and are subject to risks and uncertainties including, but not limited to, our ability to successfully complete the proposed spin-off, our ability to fully realize the expected benefits of the proposed spin-off, the global economic conditions, significant volume reductions from key contract customers, significant reduction in customer order patterns, loss of key customers or suppliers within specific industries, financial stability of key customers and suppliers, availability or cost of raw materials, and increased competitive pricing pressures reflecting excess industry capacities. Additional cautionary statements regarding other risk factors that could have an effect on the future performance of Kimball Electronics, Inc. (the “Company”) are contained in the Company’s Form 10 filing as amended and other filings with the Securities and Exchange Commission.
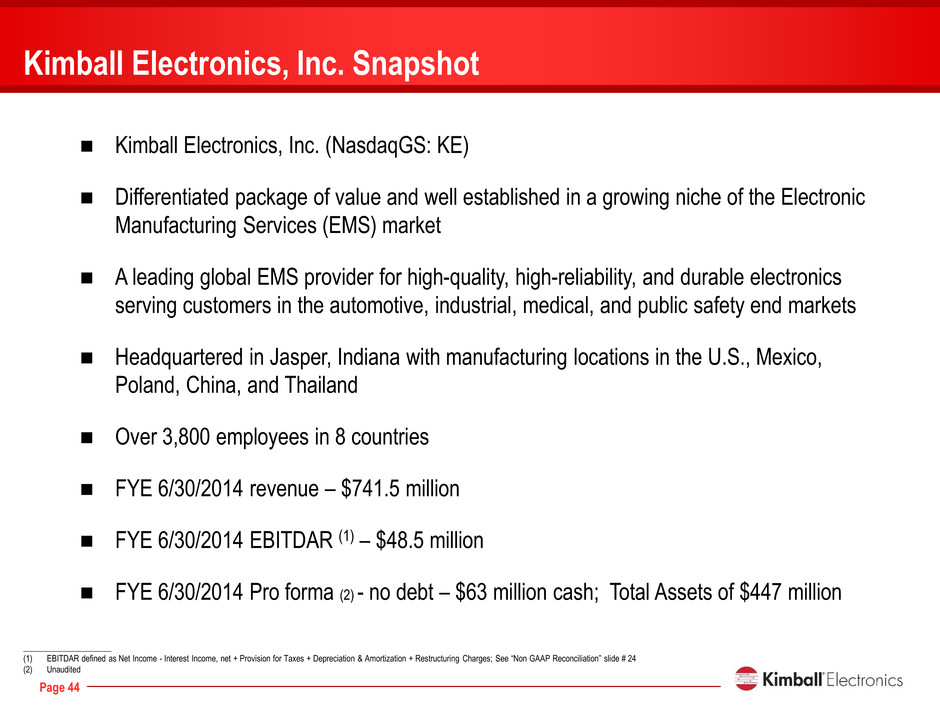
176 0 0 204 204 204 255 48 48 46 46 46 0 153 204 249 178 35 Page 44 Kimball Electronics, Inc. Snapshot Kimball Electronics, Inc. (NasdaqGS: KE) Differentiated package of value and well established in a growing niche of the Electronic Manufacturing Services (EMS) market A leading global EMS provider for high-quality, high-reliability, and durable electronics serving customers in the automotive, industrial, medical, and public safety end markets Headquartered in Jasper, Indiana with manufacturing locations in the U.S., Mexico, Poland, China, and Thailand Over 3,800 employees in 8 countries FYE 6/30/2014 revenue – $741.5 million FYE 6/30/2014 EBITDAR (1) – $48.5 million FYE 6/30/2014 Pro forma (2) - no debt – $63 million cash; Total Assets of $447 million _____________________ (1) EBITDAR defined as Net Income - Interest Income, net + Provision for Taxes + Depreciation & Amortization + Restructuring Charges; See “Non GAAP Reconciliation” slide # 24 (2) Unaudited
176 0 0 204 204 204 255 48 48 46 46 46 0 153 204 249 178 35 Page 45 Agenda 1) Transaction Summary and Rationale 2) Kimball Electronics Overview and Strategic Plan 3) Kimball Electronics Financial Overview 4) Appendix
176 0 0 204 204 204 255 48 48 46 46 46 0 153 204 249 178 35 Transaction Summary and Rationale
176 0 0 204 204 204 255 48 48 46 46 46 0 153 204 249 178 35 Page 47 Spin-Off Transaction Summary Kimball International, Inc. (“Kimball International”) has announced a stock spin-off of Kimball Electronics, Inc. (“Kimball Electronics”) Distributing Company: Kimball International, Inc. (NasdaqGS: KBAL.B) Distributed Company: Kimball Electronics, Inc. (NasdaqGS: KE) Distributed Securities: 100% of KE Common Stock Distribution Ratio: 3/4 common shares of KE for every share of KBAL.B Kimball Electronics Shares Outstanding: 29.1 million (1) Dividend Policy: No Dividend Anticipated _____________________ (1) Estimated Kimball Electronics shares outstanding at effective date.
176 0 0 204 204 204 255 48 48 46 46 46 0 153 204 249 178 35 Page 48 The spin-off satisfies important business objectives for Kimball Electronics – Allows Kimball Electronics to allocate and deploy resources in a more focused way, while executing strategies that will fulfill the different customer service requirements within their particular markets – Enables Kimball Electronics to optimize their independent capital structure to fund its growth, thereby adopting a debt and capital structure more suitable for a growth-oriented company – Kimball Electronics will become more nimble and be better able to capitalize on market opportunities that create sustainable growth and enhance shareholder value – Improving share owner value by promoting independent market recognition of Kimball Electronics as a separate publicly traded company, and provides shareholders the flexibility to enhance their investment in a sector focused company with distinct growth opportunities Spin-Off Rationale
176 0 0 204 204 204 255 48 48 46 46 46 0 153 204 249 178 35 Kimball Electronics Overview and Strategic Plan
176 0 0 204 204 204 255 48 48 46 46 46 0 153 204 249 178 35 Page 50 Differentiated package of value and well established in a growing niche of the EMS market Award winning service resulting in a loyal and diverse customer base with an average customer relationship of 8 years Significant opportunity to leverage existing cost structure for operating profit expansion Capital structure provides flexibility for growth and high return on capital deployed Experienced management team that is eager to get started as a stand-alone company Key Messages
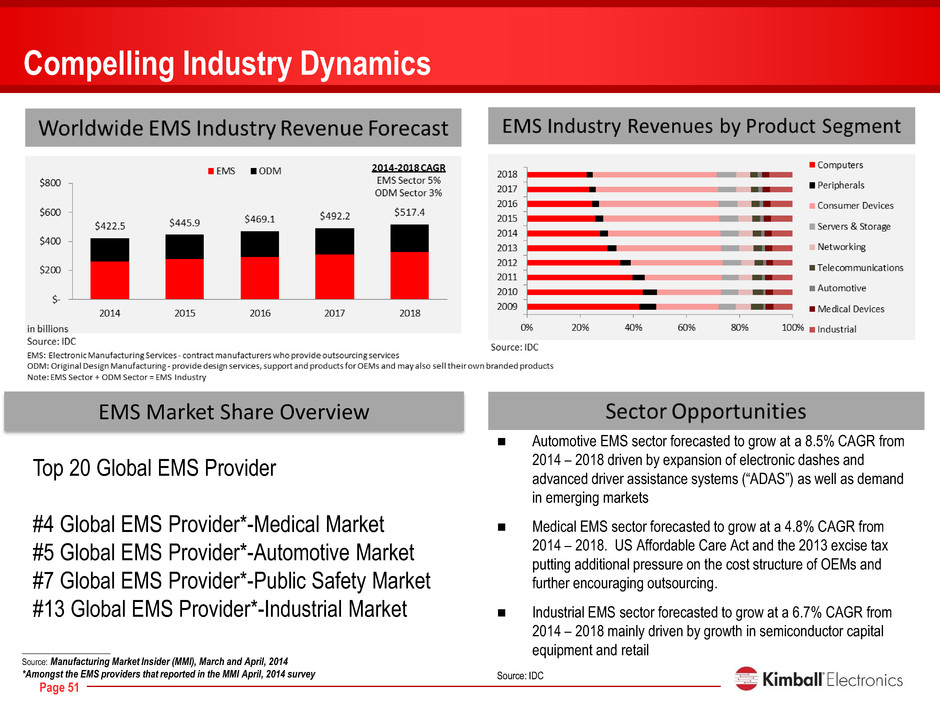
176 0 0 204 204 204 255 48 48 46 46 46 0 153 204 249 178 35 Page 51 Automotive EMS sector forecasted to grow at a 8.5% CAGR from 2014 – 2018 driven by expansion of electronic dashes and advanced driver assistance systems (“ADAS”) as well as demand in emerging markets Medical EMS sector forecasted to grow at a 4.8% CAGR from 2014 – 2018. US Affordable Care Act and the 2013 excise tax putting additional pressure on the cost structure of OEMs and further encouraging outsourcing. Industrial EMS sector forecasted to grow at a 6.7% CAGR from 2014 – 2018 mainly driven by growth in semiconductor capital equipment and retail Source: IDC Compelling Industry Dynamics EMS Market Share Overview _____________________ Source: Manufacturing Market Insider (MMI), March and April, 2014 *Amongst the EMS providers that reported in the MMI April, 2014 survey Top 20 Global EMS Provider #4 Global EMS Provider*-Medical Market #5 Global EMS Provider*-Automotive Market #7 Global EMS Provider*-Public Safety Market #13 Global EMS Provider*-Industrial Market

176 0 0 204 204 204 255 48 48 46 46 46 0 153 204 249 178 35 Page 52 Donald D. Charron Chairman and CEO Michael K. Sergesketter Vice President, Chief Financial Officer Janusz F. Kasprzyk Vice President, European Operations Roger Chang (Chang Shang Yu) Vice President, Asian Operations Christopher J. Thyen Vice President, Business Development Sandy A. Smith Vice President, Information Technology John H. Kahle Vice President, General Counsel and Secretary Julia A. Dutchess Vice President, Human Resources Steven T. Korn Vice President, North American Operations Experienced Management Team – Over 195 Years of Combined Service
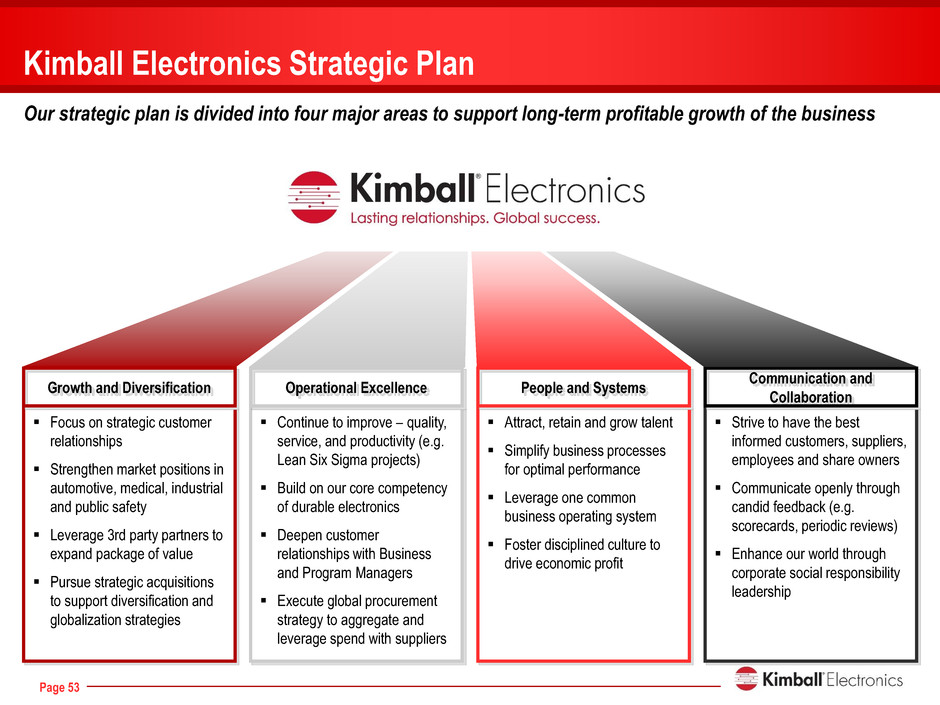
176 0 0 204 204 204 255 48 48 46 46 46 0 153 204 249 178 35 Page 53 Kimball Electronics Strategic Plan Our strategic plan is divided into four major areas to support long-term profitable growth of the business Focus on strategic customer relationships Strengthen market positions in automotive, medical, industrial and public safety Leverage 3rd party partners to expand package of value Pursue strategic acquisitions to support diversification and globalization strategies Continue to improve – quality, service, and productivity (e.g. Lean Six Sigma projects) Build on our core competency of durable electronics Deepen customer relationships with Business and Program Managers Execute global procurement strategy to aggregate and leverage spend with suppliers Attract, retain and grow talent Simplify business processes for optimal performance Leverage one common business operating system Foster disciplined culture to drive economic profit Strive to have the best informed customers, suppliers, employees and share owners Communicate openly through candid feedback (e.g. scorecards, periodic reviews) Enhance our world through corporate social responsibility leadership Growth and Diversification Operational Excellence People and Systems Communication and Collaboration
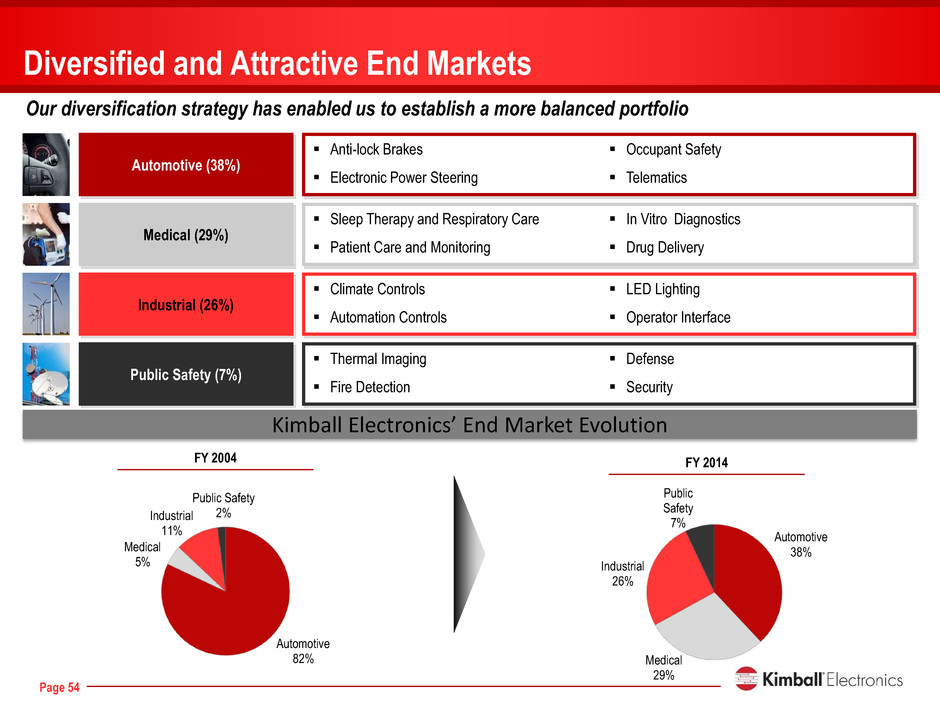
176 0 0 204 204 204 255 48 48 46 46 46 0 153 204 249 178 35 Page 54 Diversified and Attractive End Markets Our diversification strategy has enabled us to establish a more balanced portfolio Automotive (38%) Anti-lock Brakes Electronic Power Steering Occupant Safety Telematics Medical (29%) Sleep Therapy and Respiratory Care Patient Care and Monitoring In Vitro Diagnostics Drug Delivery Industrial (26%) Climate Controls Automation Controls LED Lighting Operator Interface Public Safety (7%) Thermal Imaging Fire Detection Defense Security Kimball Electronics’ End Market Evolution Automotive 82% Medical 5% Industrial 11% Public Safety 2% FY 2004 FY 2014 Automotive 38% Medical 29% Industrial 26% Public Safety 7%

176 0 0 204 204 204 255 48 48 46 46 46 0 153 204 249 178 35 Page 55 Ranked on Forbes America’s most trustworthy companies for 2013 and 2014 Recognized by Future Electronics with the "Global Customer of the Year 2013" award Awarded highest overall customer rating at the 2014 Service Excellence Awards Recipient of 10 Supplier Awards over past two years Awards and Recognitions
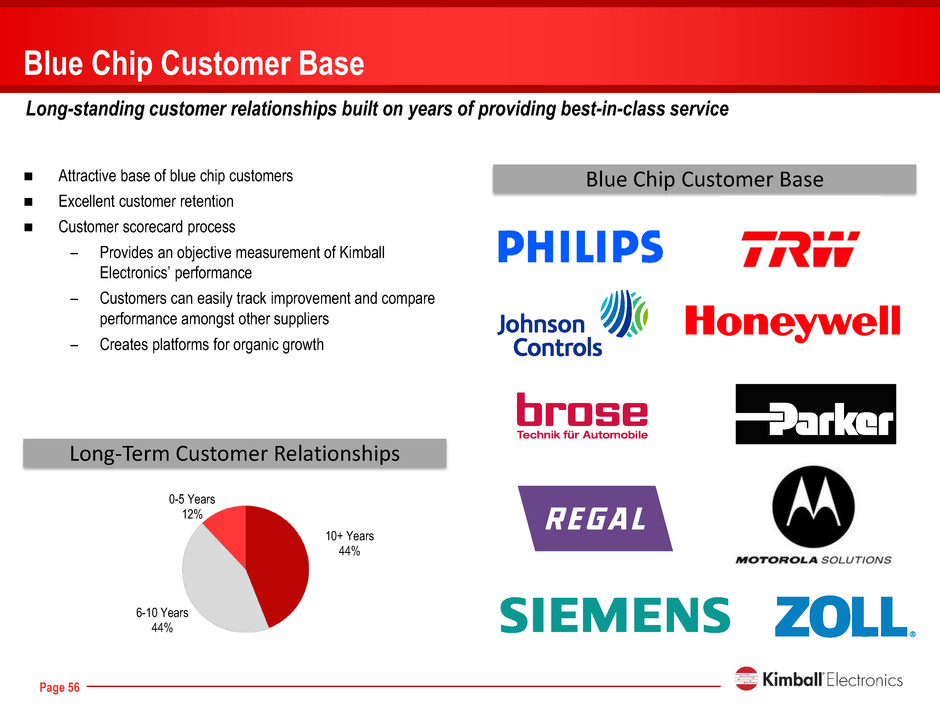
176 0 0 204 204 204 255 48 48 46 46 46 0 153 204 249 178 35 Page 56 Attractive base of blue chip customers Excellent customer retention Customer scorecard process – Provides an objective measurement of Kimball Electronics’ performance – Customers can easily track improvement and compare performance amongst other suppliers – Creates platforms for organic growth Blue Chip Customer Base Long-standing customer relationships built on years of providing best-in-class service Long-Term Customer Relationships Blue Chip Customer Base 10+ Years 44% 6-10 Years 44% 0-5 Years 12%
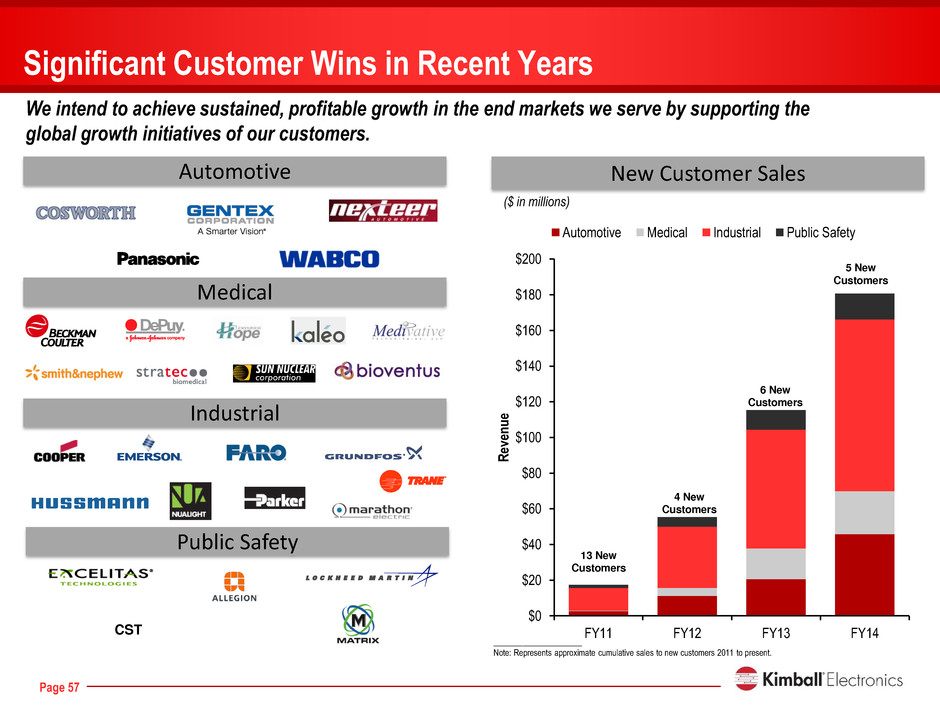
176 0 0 204 204 204 255 48 48 46 46 46 0 153 204 249 178 35 Page 57 Significant Customer Wins in Recent Years We intend to achieve sustained, profitable growth in the end markets we serve by supporting the global growth initiatives of our customers. Automotive Medical Industrial Public Safety New Customer Sales CST $0 $20 $40 $60 $80 $100 $120 $140 $160 $180 $200 FY11 FY12 FY13 FY14 R evenu e Automotive Medical Industrial Public Safety 4 New Customers 5 New Customers 6 New Customers 13 New Customers ($ in millions) _____________________ Note: Represents approximate cumulative sales to new customers 2011 to present.
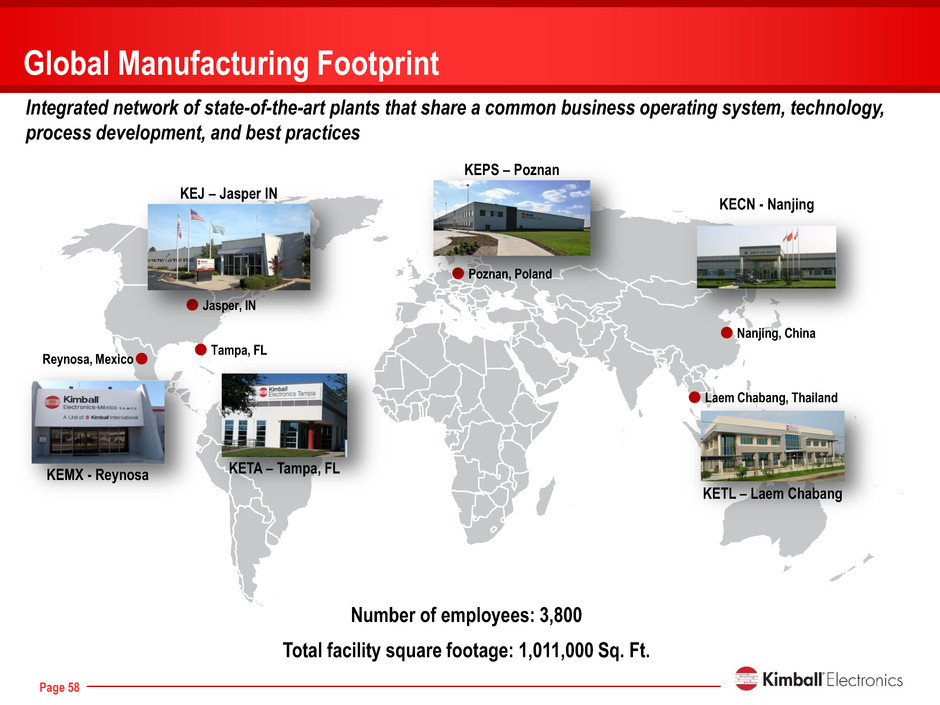
176 0 0 204 204 204 255 48 48 46 46 46 0 153 204 249 178 35 Page 58 Global Manufacturing Footprint Integrated network of state-of-the-art plants that share a common business operating system, technology, process development, and best practices Jasper, IN Tampa, FL Reynosa, Mexico Poznan, Poland Nanjing, China Laem Chabang, Thailand KECN - Nanjing KEPS – Poznan KEJ – Jasper IN KETL – Laem Chabang Number of employees: 3,800 Total facility square footage: 1,011,000 Sq. Ft. KEMX - Reynosa KETA – Tampa, FL
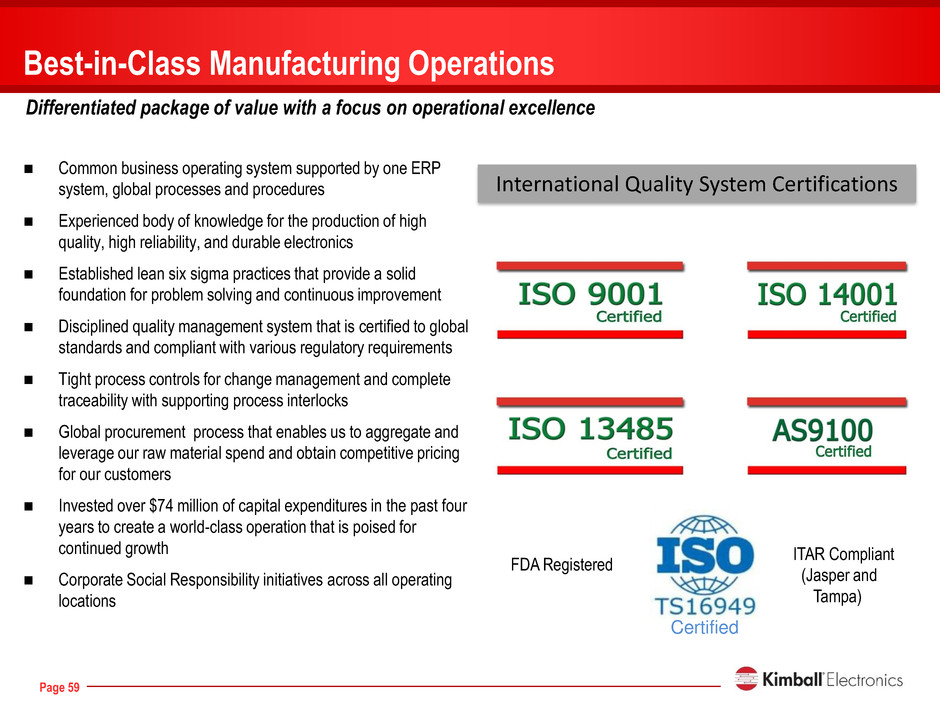
176 0 0 204 204 204 255 48 48 46 46 46 0 153 204 249 178 35 Page 59 Common business operating system supported by one ERP system, global processes and procedures Experienced body of knowledge for the production of high quality, high reliability, and durable electronics Established lean six sigma practices that provide a solid foundation for problem solving and continuous improvement Disciplined quality management system that is certified to global standards and compliant with various regulatory requirements Tight process controls for change management and complete traceability with supporting process interlocks Global procurement process that enables us to aggregate and leverage our raw material spend and obtain competitive pricing for our customers Invested over $74 million of capital expenditures in the past four years to create a world-class operation that is poised for continued growth Corporate Social Responsibility initiatives across all operating locations Best-in-Class Manufacturing Operations Differentiated package of value with a focus on operational excellence International Quality System Certifications FDA Registered ITAR Compliant (Jasper and Tampa) Certified
176 0 0 204 204 204 255 48 48 46 46 46 0 153 204 249 178 35 Kimball Electronics Financial Overview
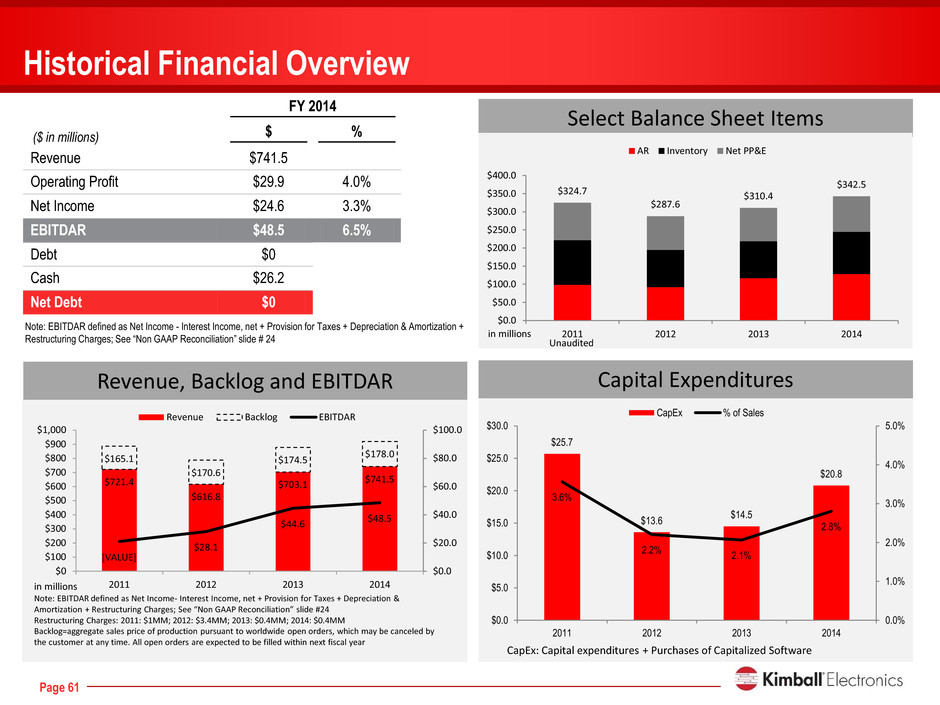
176 0 0 204 204 204 255 48 48 46 46 46 0 153 204 249 178 35 Page 61 FY 2014 $ % Revenue $741.5 Operating Profit $29.9 4.0% Net Income $24.6 3.3% EBITDAR $48.5 6.5% Debt $0 Cash $26.2 Net Debt $0 Historical Financial Overview ($ in millions) $25.7 $13.6 $14.5 $20.8 3.6% 2.2% 2.1% 2.8% 0.0% 1.0% 2.0% 3.0% 4.0% 5.0% $0.0 $5.0 $10.0 $15.0 $20.0 $25.0 $30.0 2011 2012 2013 2014 CapEx % of Sales CapEx: Capital expenditures + Purchases of Capitalized Software $721.4 $616.8 $703.1 $741.5 $165.1 $170.6 $174.5 $178.0 [VALUE] $28.1 $44.6 $48.5 $0.0 $20.0 $40.0 $60.0 $80.0 $100.0 $0 $100 $200 $300 $400 $500 $600 $700 $800 $900 $1,000 2011 2012 2013 2014 Revenue Backlog EBITDAR in millions Note: EBITDAR defined as Net Income- Interest Income, net + Provision for Taxes + Depreciation & Amortization + Restructuring Charges; See “Non GAAP Reconciliation” slide #24 Restructuring Charges: 2011: $1MM; 2012: $3.4MM; 2013: $0.4MM; 2014: $0.4MM Backlog=aggregate sales price of production pursuant to worldwide open orders, which may be canceled by the customer at any time. All open orders are expected to be filled within next fiscal year Select Balance Sheet Items $324.7 $287.6 $310.4 $342.5 $0.0 $50.0 $100.0 $150.0 $200.0 $250.0 $300.0 $350.0 $400.0 2011 2012 2013 2014 AR Inventory Net PP&E in millions Unaudited Note: EBITDAR defined as Net Income - Interest Income, net + Provision for Taxes + Depreciation & Amortization + Restructuring Charges; See “Non GAAP Reconciliation” slide # 24 Revenue, Backlog and EBITDAR Capital Expenditures
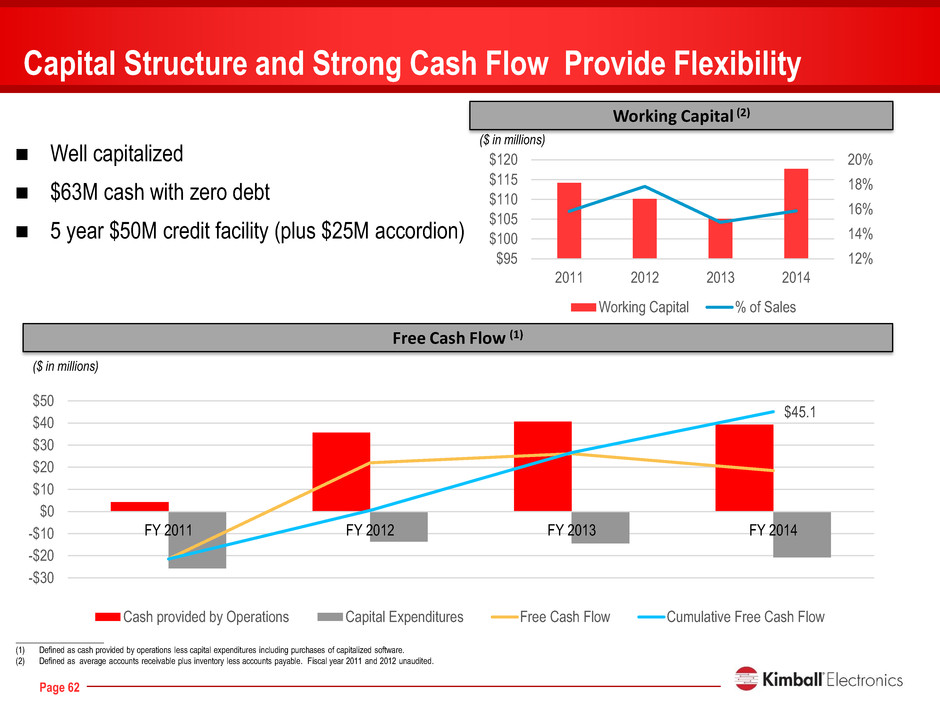
176 0 0 204 204 204 255 48 48 46 46 46 0 153 204 249 178 35 Page 62 12% 14% 16% 18% 20% $95 $100 $105 $110 $115 $120 2011 2012 2013 2014 Working Capital % of Sales Well capitalized $63M cash with zero debt 5 year $50M credit facility (plus $25M accordion) Capital Structure and Strong Cash Flow Provide Flexibility Working Capital (2) Free Cash Flow (1) ($ in millions) _____________________ (1) Defined as cash provided by operations less capital expenditures including purchases of capitalized software. (2) Defined as average accounts receivable plus inventory less accounts payable. Fiscal year 2011 and 2012 unaudited. $45.1 FY 2011 FY 2012 FY 2013 FY 2014 -$30 -$20 -$10 $0 $10 $20 $30 $40 $50 Cash provided by Operations Capital Expenditures Free Cash Flow Cumulative Free Cash Flow ($ in millions)
176 0 0 204 204 204 255 48 48 46 46 46 0 153 204 249 178 35 Page 63 Why Invest in Kimball Electronics? Differentiated package of value and well established in a growing niche of the EMS market Award winning service resulting in a loyal and diverse customer base with an average customer relationship of 8 years Significant opportunity to leverage existing cost structure for operating profit expansion Capital structure provides flexibility for growth and high return on capital deployed Experienced management team that is eager to get started as a stand-alone company
176 0 0 204 204 204 255 48 48 46 46 46 0 153 204 249 178 35 Appendix
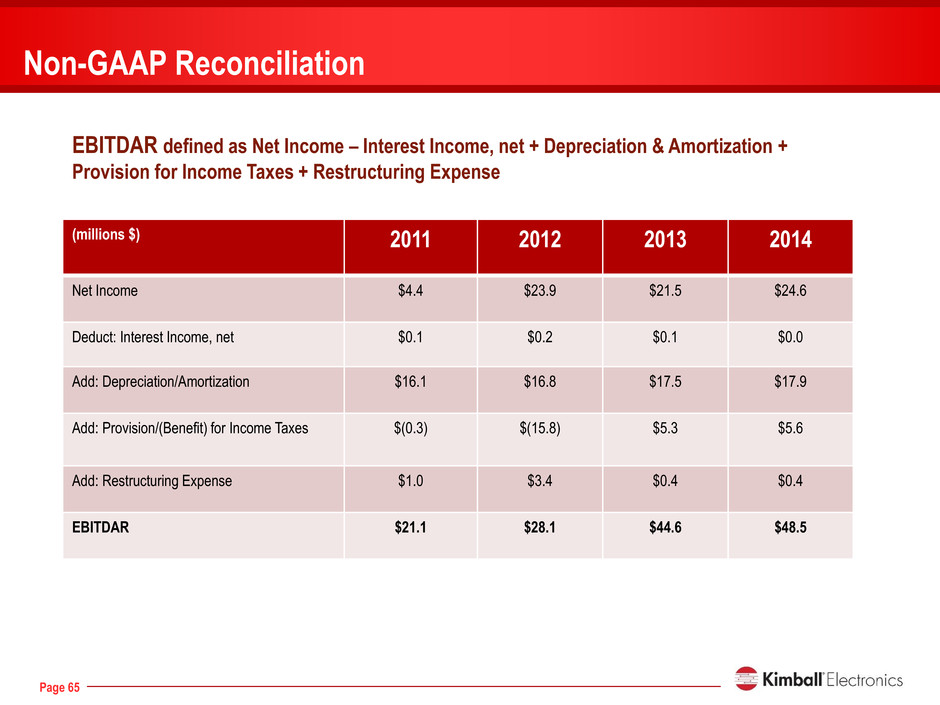
176 0 0 204 204 204 255 48 48 46 46 46 0 153 204 249 178 35 Page 65 Non-GAAP Reconciliation (millions $) 2011 2012 2013 2014 Net Income $4.4 $23.9 $21.5 $24.6 Deduct: Interest Income, net $0.1 $0.2 $0.1 $0.0 Add: Depreciation/Amortization $16.1 $16.8 $17.5 $17.9 Add: Provision/(Benefit) for Income Taxes $(0.3) $(15.8) $5.3 $5.6 Add: Restructuring Expense $1.0 $3.4 $0.4 $0.4 EBITDAR $21.1 $28.1 $44.6 $48.5 EBITDAR defined as Net Income – Interest Income, net + Depreciation & Amortization + Provision for Income Taxes + Restructuring Expense

176 0 0 204 204 204 255 48 48 46 46 46 0 153 204 249 178 35 Page 66 2014 Key Strategic Priorities Maintain Margin Improvement ■ Stay focused on Lean Six Sigma Improvement projects ■ Continue to drive material cost savings ■ Remain disciplined in new business development for high margin opportunities ■ Improve margin by expanding our package of value Inventory Reduction ■ Improve sales and operations planning processes ■ Better leverage distribution partnerships ■ Closely monitor NPI processes and product launch schedules ■ Pursue actions to eliminate excess and obsolete inventory ■ PDSOH is the average of the monthly gross inventory divided by an average day's cost of sales. [ ] [ ] $5.00 $15.00 $25.00 $35.00 $45.00 $55.00 $65.00 FY 2011 FY 2012 FY 2013 FY 2014 SG&A Gross Profit Oper. Inc 52 54 56 58 60 62 64 66 FY 2011 FY 2012 FY 2013 FY 2014 P D S O H D ay s PDSOH Long Term Target = 55 days Footprint and Machine Utilization ■ Capacity expansion in Europe ■ Expand our package of value to enhance utilization of available resources ■ Consider strategic acquisitions internationally to establish capacity in other emerging markets M ill io n s
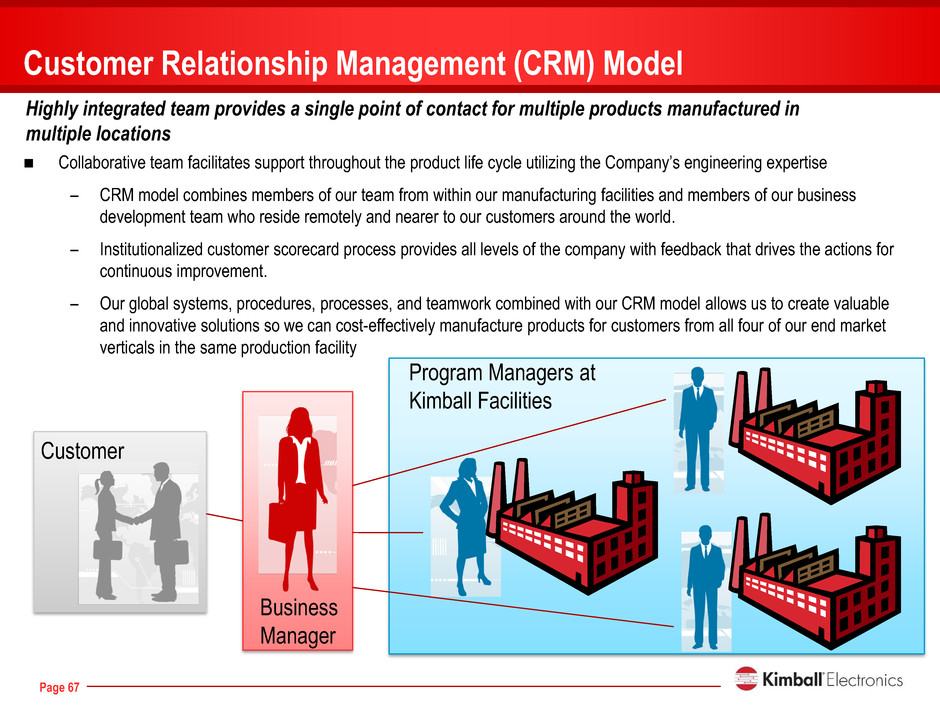
176 0 0 204 204 204 255 48 48 46 46 46 0 153 204 249 178 35 Page 67 Collaborative team facilitates support throughout the product life cycle utilizing the Company’s engineering expertise – CRM model combines members of our team from within our manufacturing facilities and members of our business development team who reside remotely and nearer to our customers around the world. – Institutionalized customer scorecard process provides all levels of the company with feedback that drives the actions for continuous improvement. – Our global systems, procedures, processes, and teamwork combined with our CRM model allows us to create valuable and innovative solutions so we can cost-effectively manufacture products for customers from all four of our end market verticals in the same production facility Customer Relationship Management (CRM) Model Highly integrated team provides a single point of contact for multiple products manufactured in multiple locations Customer Business Manager Program Managers at Kimball Facilities
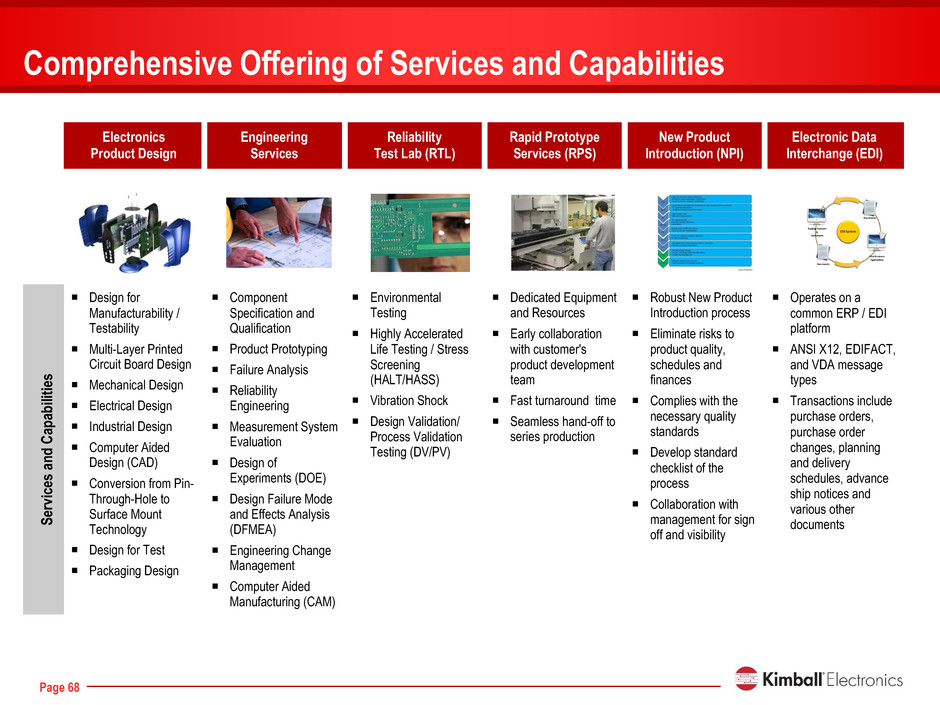
176 0 0 204 204 204 255 48 48 46 46 46 0 153 204 249 178 35 Page 68 Electronics Product Design Engineering Services Reliability Test Lab (RTL) Rapid Prototype Services (RPS) New Product Introduction (NPI) Electronic Data Interchange (EDI) Se rv ice s a nd C apab ilit ies Design for Manufacturability / Testability Multi-Layer Printed Circuit Board Design Mechanical Design Electrical Design Industrial Design Computer Aided Design (CAD) Conversion from Pin- Through-Hole to Surface Mount Technology Design for Test Packaging Design Component Specification and Qualification Product Prototyping Failure Analysis Reliability Engineering Measurement System Evaluation Design of Experiments (DOE) Design Failure Mode and Effects Analysis (DFMEA) Engineering Change Management Computer Aided Manufacturing (CAM) Environmental Testing Highly Accelerated Life Testing / Stress Screening (HALT/HASS) Vibration Shock Design Validation/ Process Validation Testing (DV/PV) Dedicated Equipment and Resources Early collaboration with customer's product development team Fast turnaround time Seamless hand-off to series production Robust New Product Introduction process Eliminate risks to product quality, schedules and finances Complies with the necessary quality standards Develop standard checklist of the process Collaboration with management for sign off and visibility Operates on a common ERP / EDI platform ANSI X12, EDIFACT, and VDA message types Transactions include purchase orders, purchase order changes, planning and delivery schedules, advance ship notices and various other documents Comprehensive Offering of Services and Capabilities [pic]
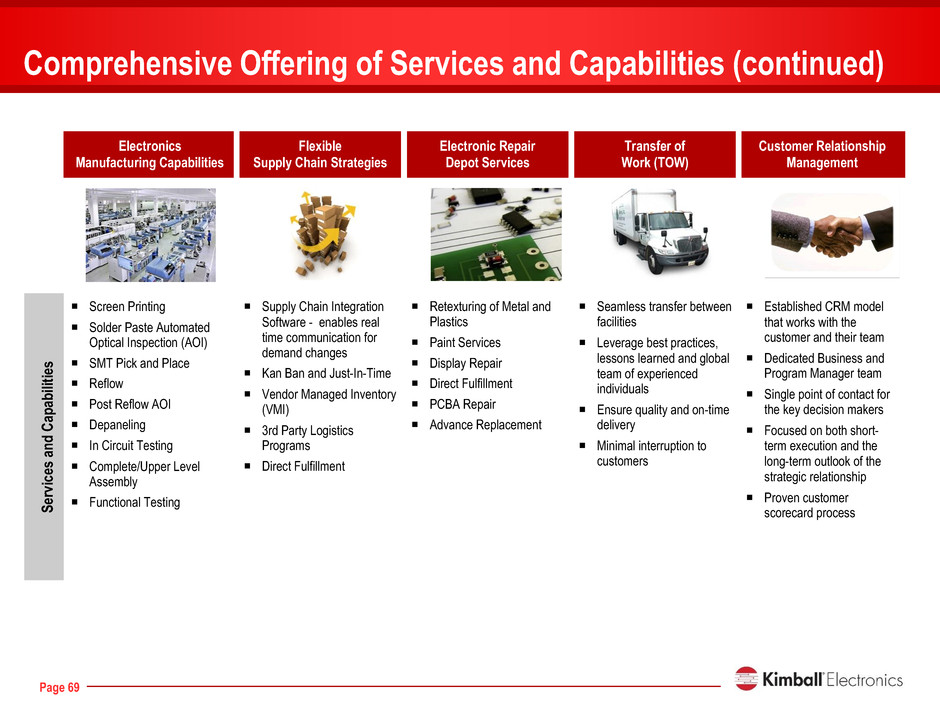
176 0 0 204 204 204 255 48 48 46 46 46 0 153 204 249 178 35 Page 69 Comprehensive Offering of Services and Capabilities (continued) Electronics Manufacturing Capabilities Flexible Supply Chain Strategies Electronic Repair Depot Services Transfer of Work (TOW) Customer Relationship Management [pic] [pic] [pic] [pic] [pic] Se rv ice s a nd C apab ilit ies Screen Printing Solder Paste Automated Optical Inspection (AOI) SMT Pick and Place Reflow Post Reflow AOI Depaneling In Circuit Testing Complete/Upper Level Assembly Functional Testing Supply Chain Integration Software - enables real time communication for demand changes Kan Ban and Just-In-Time Vendor Managed Inventory (VMI) 3rd Party Logistics Programs Direct Fulfillment Retexturing of Metal and Plastics Paint Services Display Repair Direct Fulfillment PCBA Repair Advance Replacement Seamless transfer between facilities Leverage best practices, lessons learned and global team of experienced individuals Ensure quality and on-time delivery Minimal interruption to customers Established CRM model that works with the customer and their team Dedicated Business and Program Manager team Single point of contact for the key decision makers Focused on both short- term execution and the long-term outlook of the strategic relationship Proven customer scorecard process
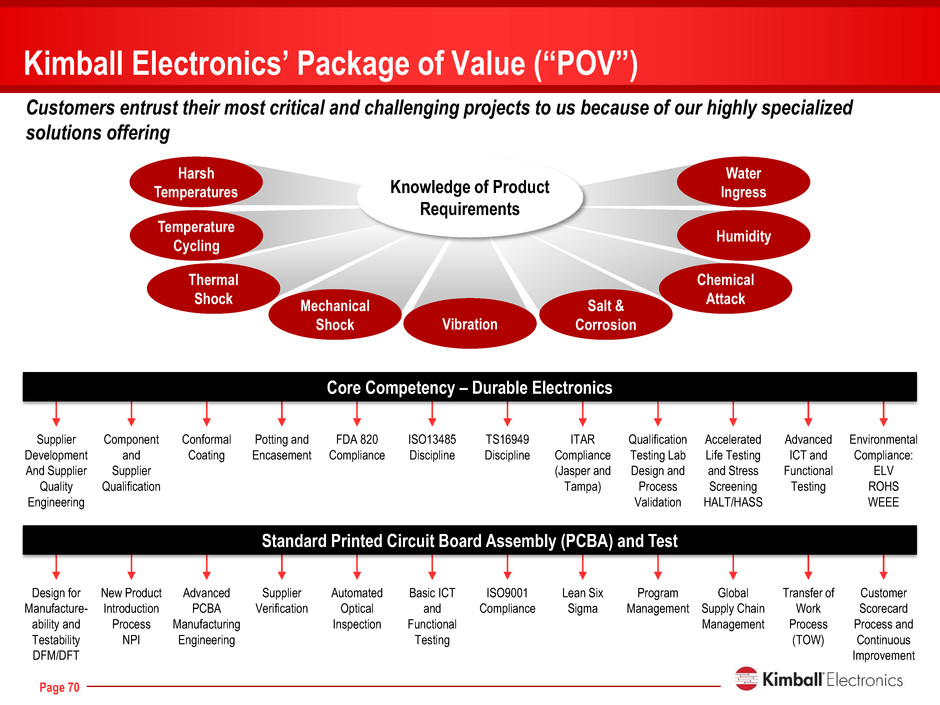
176 0 0 204 204 204 255 48 48 46 46 46 0 153 204 249 178 35 Page 70 Kimball Electronics’ Package of Value (“POV”) Humidity Temperature Cycling Chemical Attack Vibration Thermal Shock Mechanical Shock Salt & Corrosion Harsh Temperatures Water Ingress Knowledge of Product Requirements Supplier Development And Supplier Quality Engineering Component and Supplier Qualification Conformal Coating Potting and Encasement FDA 820 Compliance ISO13485 Discipline TS16949 Discipline ITAR Compliance (Jasper and Tampa) Qualification Testing Lab Design and Process Validation Accelerated Life Testing and Stress Screening HALT/HASS Advanced ICT and Functional Testing Environmental Compliance: ELV ROHS WEEE Core Competency – Durable Electronics Design for Manufacture- ability and Testability DFM/DFT New Product Introduction Process NPI Advanced PCBA Manufacturing Engineering Supplier Verification Automated Optical Inspection Basic ICT and Functional Testing ISO9001 Compliance Lean Six Sigma Program Management Global Supply Chain Management Transfer of Work Process (TOW) Customer Scorecard Process and Continuous Improvement Standard Printed Circuit Board Assembly (PCBA) and Test Customers entrust their most critical and challenging projects to us because of our highly specialized solutions offering
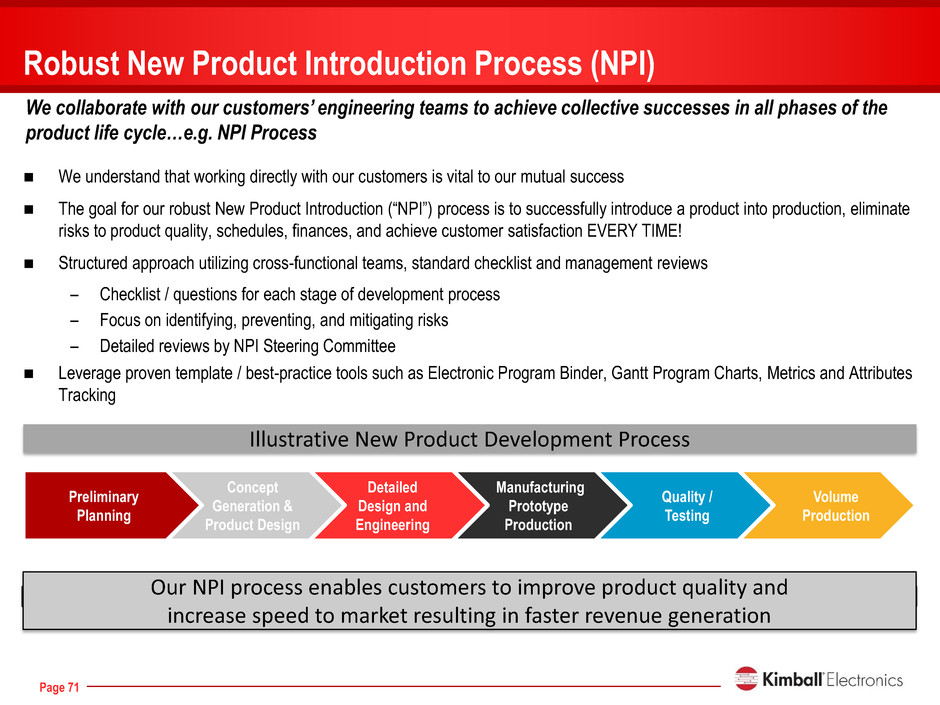
176 0 0 204 204 204 255 48 48 46 46 46 0 153 204 249 178 35 Page 71 Volume Production Quality / Testing Manufacturing Prototype Production Detailed Design and Engineering Concept Generation & Product Design Preliminary Planning We understand that working directly with our customers is vital to our mutual success The goal for our robust New Product Introduction (“NPI”) process is to successfully introduce a product into production, eliminate risks to product quality, schedules, finances, and achieve customer satisfaction EVERY TIME! Structured approach utilizing cross-functional teams, standard checklist and management reviews – Checklist / questions for each stage of development process – Focus on identifying, preventing, and mitigating risks – Detailed reviews by NPI Steering Committee Leverage proven template / best-practice tools such as Electronic Program Binder, Gantt Program Charts, Metrics and Attributes Tracking Robust New Product Introduction Process (NPI) We collaborate with our customers’ engineering teams to achieve collective successes in all phases of the product life cycle…e.g. NPI Process Illustrative New Product Development Process Our NPI process enables customers to improve product quality and increase speed to market resulting in faster revenue generation
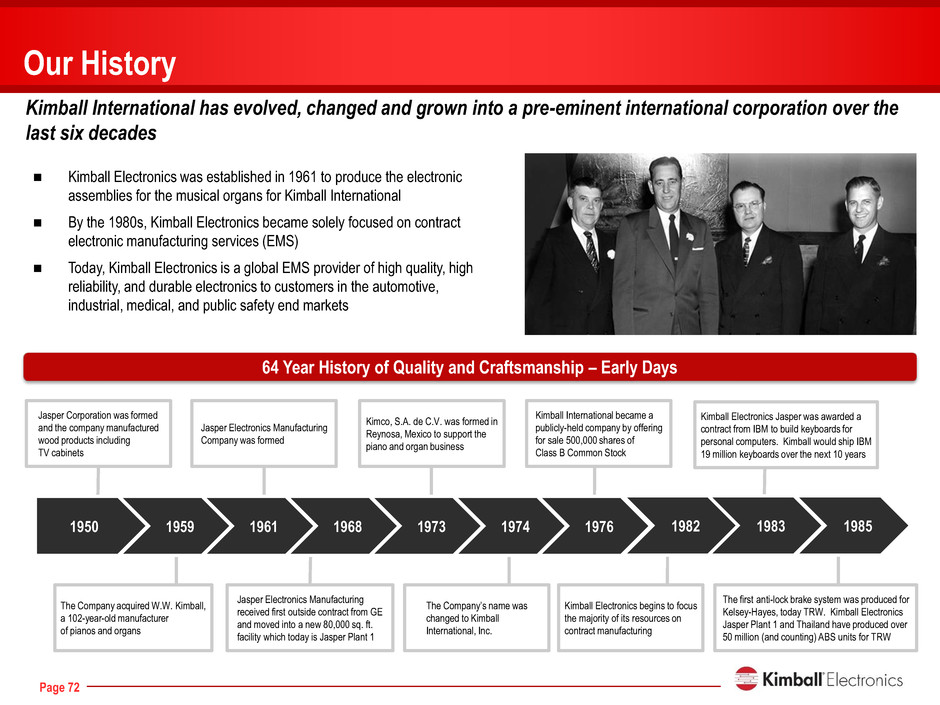
176 0 0 204 204 204 255 48 48 46 46 46 0 153 204 249 178 35 Page 72 Our History Kimball International has evolved, changed and grown into a pre-eminent international corporation over the last six decades Kimball Electronics begins to focus the majority of its resources on contract manufacturing The Company acquired W.W. Kimball, a 102-year-old manufacturer of pianos and organs Jasper Corporation was formed and the company manufactured wood products including TV cabinets Jasper Electronics Manufacturing Company was formed Jasper Electronics Manufacturing received first outside contract from GE and moved into a new 80,000 sq. ft. facility which today is Jasper Plant 1 Kimco, S.A. de C.V. was formed in Reynosa, Mexico to support the piano and organ business The Company’s name was changed to Kimball International, Inc. 1950 1959 1961 1968 1976 1974 1982 1973 Kimball International became a publicly-held company by offering for sale 500,000 shares of Class B Common Stock 64 Year History of Quality and Craftsmanship – Early Days Kimball Electronics was established in 1961 to produce the electronic assemblies for the musical organs for Kimball International By the 1980s, Kimball Electronics became solely focused on contract electronic manufacturing services (EMS) Today, Kimball Electronics is a global EMS provider of high quality, high reliability, and durable electronics to customers in the automotive, industrial, medical, and public safety end markets 1983 1985 The first anti-lock brake system was produced for Kelsey-Hayes, today TRW. Kimball Electronics Jasper Plant 1 and Thailand have produced over 50 million (and counting) ABS units for TRW Kimball Electronics Jasper was awarded a contract from IBM to build keyboards for personal computers. Kimball would ship IBM 19 million keyboards over the next 10 years
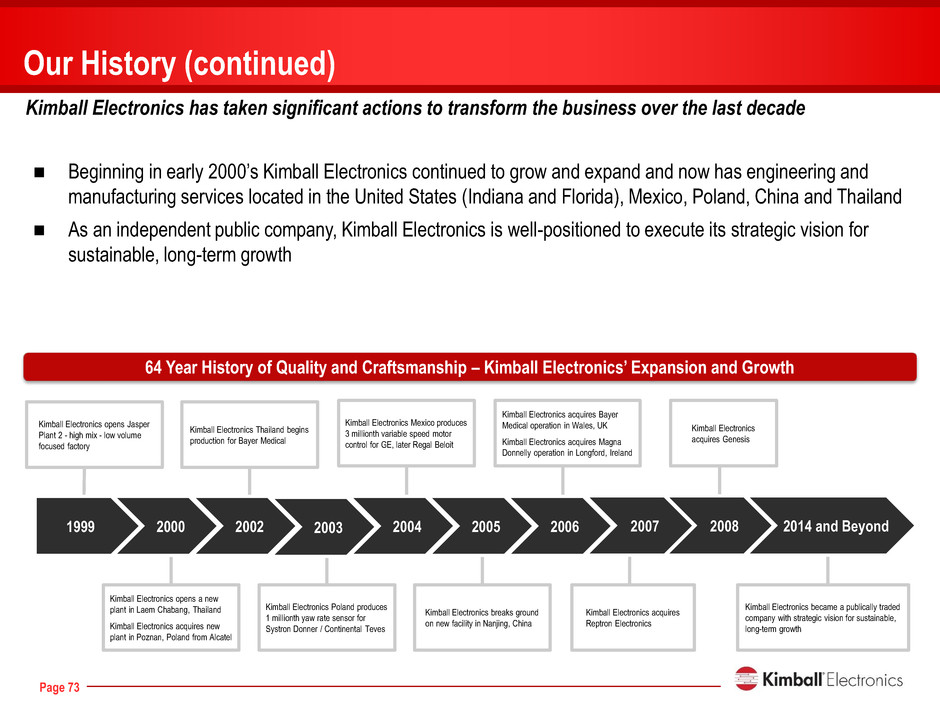
176 0 0 204 204 204 255 48 48 46 46 46 0 153 204 249 178 35 Page 73 Kimball Electronics acquires Genesis Kimball Electronics opens Jasper Plant 2 - high mix - low volume focused factory Kimball Electronics Thailand begins production for Bayer Medical Kimball Electronics acquires Bayer Medical operation in Wales, UK Kimball Electronics acquires Magna Donnelly operation in Longford, Ireland Kimball Electronics Mexico produces 3 millionth variable speed motor control for GE, later Regal Beloit 1999 2002 2000 2005 2004 2006 2007 2003 2008 Our History (continued) Kimball Electronics has taken significant actions to transform the business over the last decade 64 Year History of Quality and Craftsmanship – Kimball Electronics’ Expansion and Growth Beginning in early 2000’s Kimball Electronics continued to grow and expand and now has engineering and manufacturing services located in the United States (Indiana and Florida), Mexico, Poland, China and Thailand As an independent public company, Kimball Electronics is well-positioned to execute its strategic vision for sustainable, long-term growth 2014 and Beyond Kimball Electronics acquires Reptron Electronics Kimball Electronics opens a new plant in Laem Chabang, Thailand Kimball Electronics acquires new plant in Poznan, Poland from Alcatel Kimball Electronics Poland produces 1 millionth yaw rate sensor for Systron Donner / Continental Teves Kimball Electronics breaks ground on new facility in Nanjing, China Kimball Electronics became a publically traded company with strategic vision for sustainable, long-term growth
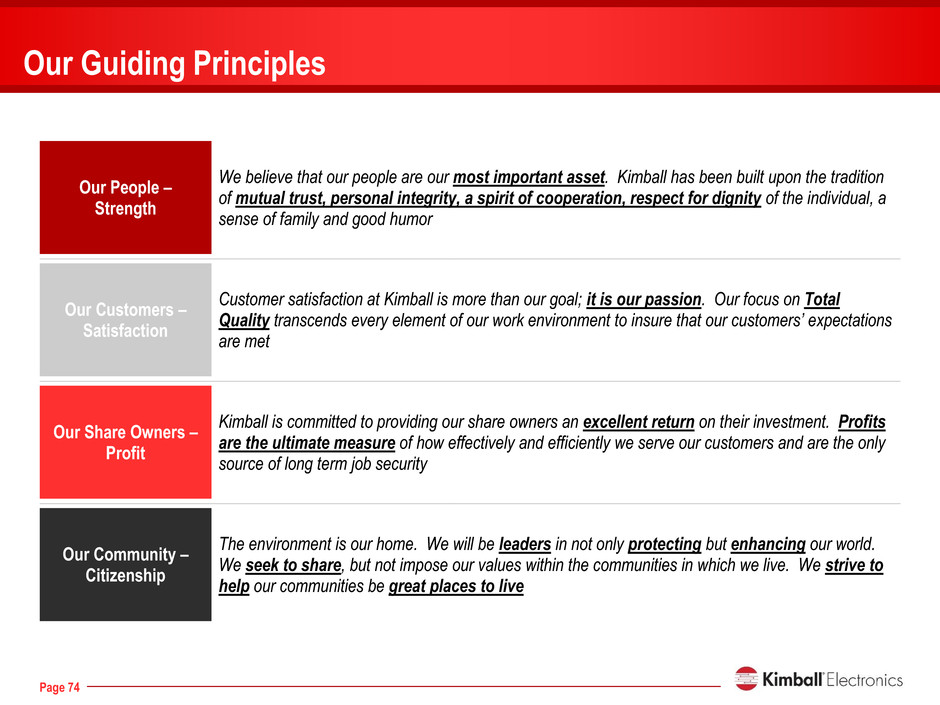
176 0 0 204 204 204 255 48 48 46 46 46 0 153 204 249 178 35 Page 74 Our Guiding Principles Our People – Strength We believe that our people are our most important asset. Kimball has been built upon the tradition of mutual trust, personal integrity, a spirit of cooperation, respect for dignity of the individual, a sense of family and good humor Our Customers – Satisfaction Customer satisfaction at Kimball is more than our goal; it is our passion. Our focus on Total Quality transcends every element of our work environment to insure that our customers’ expectations are met Our Share Owners – Profit Kimball is committed to providing our share owners an excellent return on their investment. Profits are the ultimate measure of how effectively and efficiently we serve our customers and are the only source of long term job security Our Community – Citizenship The environment is our home. We will be leaders in not only protecting but enhancing our world. We seek to share, but not impose our values within the communities in which we live. We strive to help our communities be great places to live


