to fuel to grow to build Q4 FY20 to inspire EARNINGS AND STRATEGY UPDATE to fuel August 3, 2020 to grow to build to inspire Exhibit 99.2 to fuel
Certain statements contained within this release are considered forward-looking under the Private Securities Litigation Reform Act of 1995. These statements SAFE HARBOR generally can be identified by the use of words or phrases, including, but not limited to, “intend,” “anticipate,” “believe,” “estimate,” “project,” “target,” “plan,” “expect,” STATEMENT “setting up,” “beginning to,” “will,” “should,” “would,” “resume” or similar statements. We caution that forward-looking statements are subject to known and unknown risks and uncertainties that may cause the Company’s actual future results and performance to differ materially from expected results including, but not limited to, the risk that any projections or guidance, including revenues, margins, earnings, or any other financial results are not realized, adverse changes in the global economic conditions, successful execution of restructuring plan, the impact of changes in tariffs, increased global competition, significant reduction in customer order patterns, loss of key suppliers, loss of or significant volume reductions from key contract customers, financial stability of key customers and suppliers, relationships with strategic customers and product distributors, availability or cost of raw materials and components, changes in the regulatory environment, global health concerns (including the impact of the COVID-19 outbreak), or similar unforeseen events. Additional cautionary statements regarding other risk factors that could have an effect on the future performance of the Company are contained in the Company’s Form 10- K filing for the fiscal year ended June 30, 2019 and other filings with the Securities and Exchange Commission. 2 2
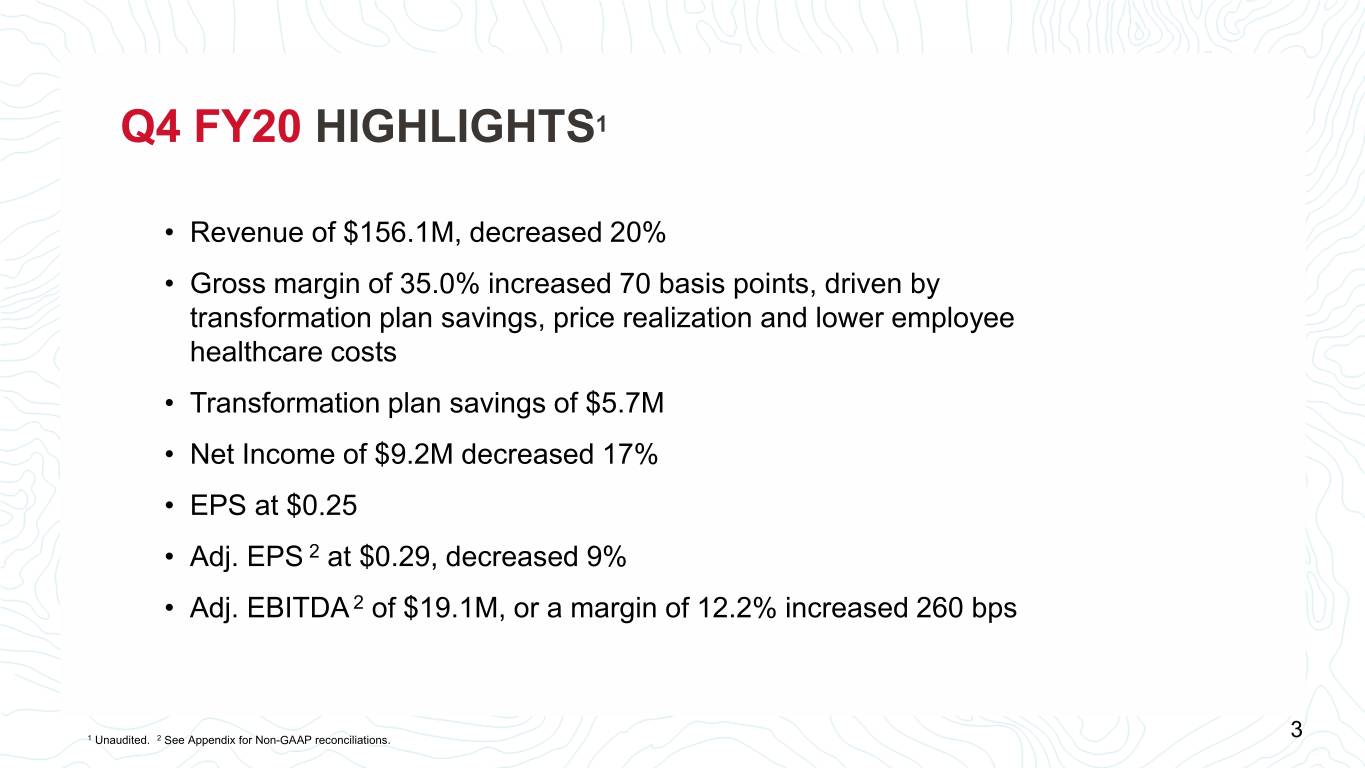
Q4 FY20 HIGHLIGHTS1 • Revenue of $156.1M, decreased 20% • Gross margin of 35.0% increased 70 basis points, driven by transformation plan savings, price realization and lower employee healthcare costs • Transformation plan savings of $5.7M • Net Income of $9.2M decreased 17% • EPS at $0.25 • Adj. EPS 2 at $0.29, decreased 9% • Adj. EBITDA 2 of $19.1M, or a margin of 12.2% increased 260 bps 1 Unaudited. 2 See Appendix for Non-GAAP reconciliations. 3 3
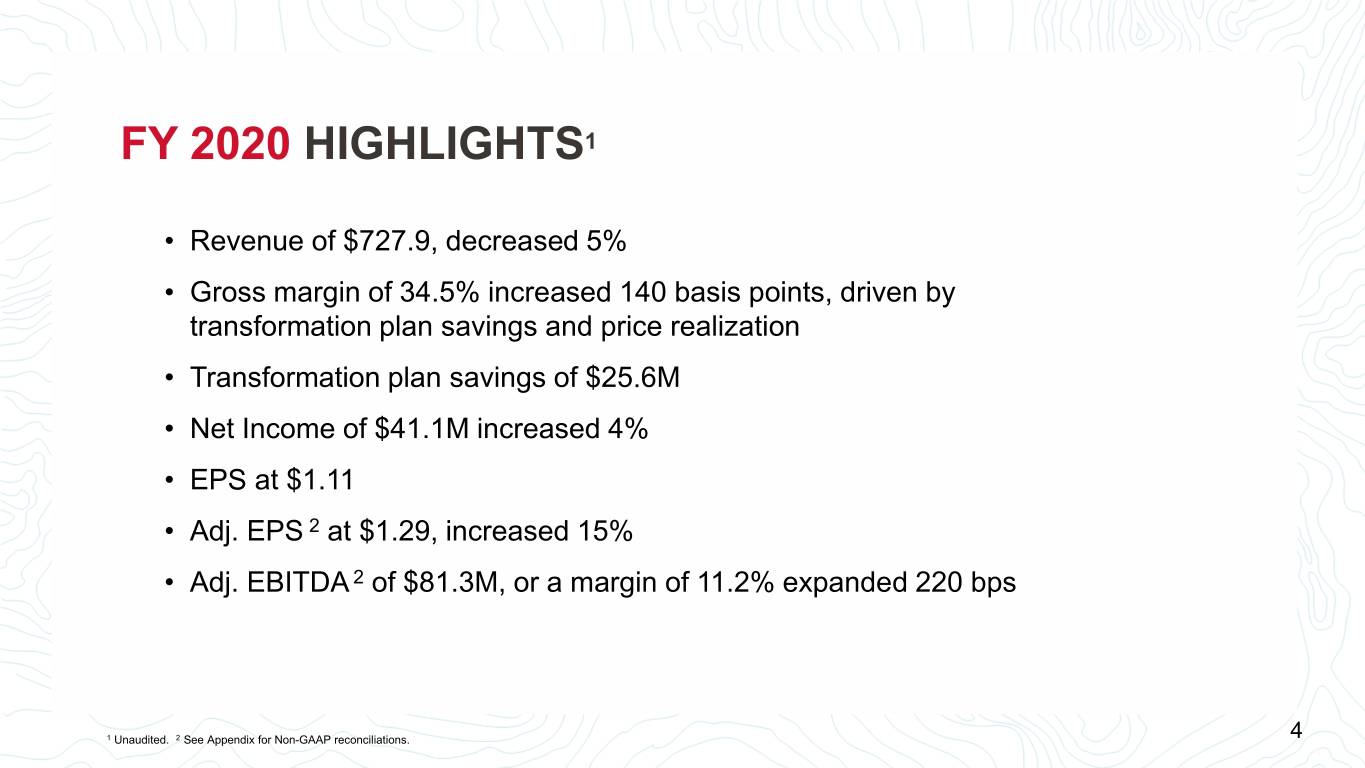
FY 2020 HIGHLIGHTS1 • Revenue of $727.9, decreased 5% • Gross margin of 34.5% increased 140 basis points, driven by transformation plan savings and price realization • Transformation plan savings of $25.6M • Net Income of $41.1M increased 4% • EPS at $1.11 • Adj. EPS 2 at $1.29, increased 15% • Adj. EBITDA 2 of $81.3M, or a margin of 11.2% expanded 220 bps 1 Unaudited. 2 See Appendix for Non-GAAP reconciliations. 4 4
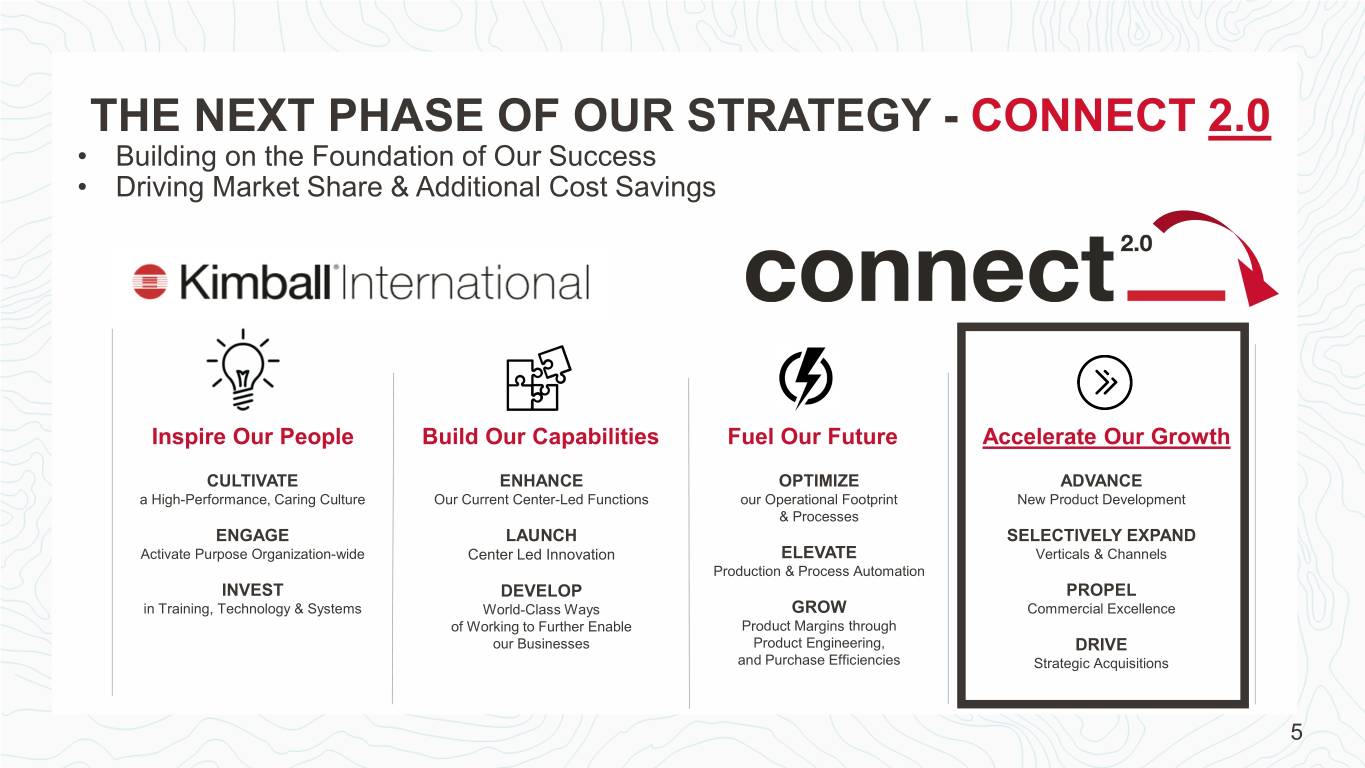
THE NEXT PHASE OF OUR STRATEGY - CONNECT 2.0 • Building on the Foundation of Our Success • Driving Market Share & Additional Cost Savings Inspire Our People Build Our Capabilities Fuel Our Future Accelerate Our Growth CULTIVATE ENHANCE OPTIMIZE ADVANCE a High-Performance, Caring Culture Our Current Center-Led Functions our Operational Footprint New Product Development & Processes ENGAGE LAUNCH SELECTIVELY EXPAND Activate Purpose Organization-wide Center Led Innovation ELEVATE Verticals & Channels Production & Process Automation INVEST DEVELOP PROPEL in Training, Technology & Systems World-Class Ways GROW Commercial Excellence of Working to Further Enable Product Margins through our Businesses Product Engineering, DRIVE and Purchase Efficiencies Strategic Acquisitions 5 5
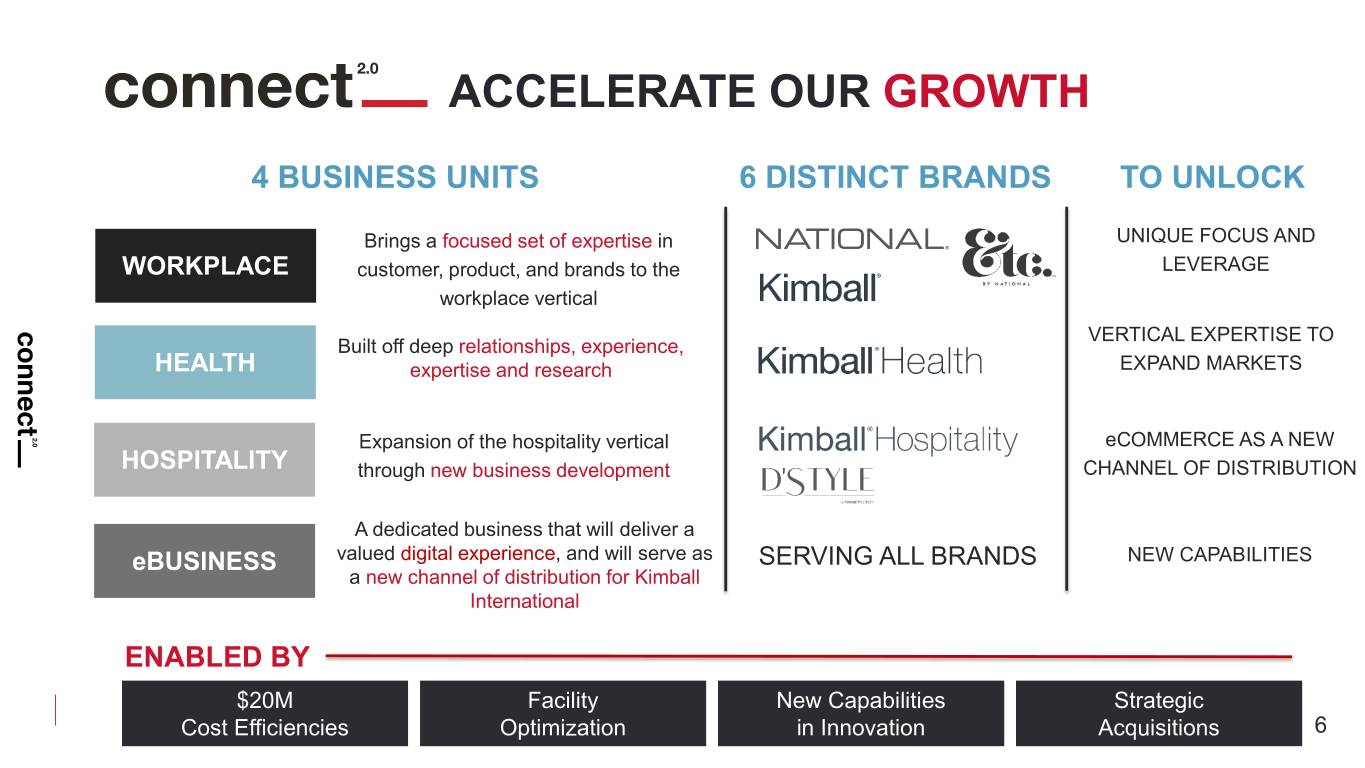
ACCELERATE OUR GROWTH 4 BUSINESS UNITS 6 DISTINCT BRANDS TO UNLOCK Brings a focused set of expertise in UNIQUE FOCUS AND WORKPLACE customer, product, and brands to the LEVERAGE workplace vertical VERTICAL EXPERTISE TO Built off deep relationships, experience, HEALTH expertise and research EXPAND MARKETS Expansion of the hospitality vertical eCOMMERCE AS A NEW HOSPITALITY through new business development CHANNEL OF DISTRIBUTION A dedicated business that will deliver a eBUSINESS valued digital experience, and will serve as SERVING ALL BRANDS NEW CAPABILITIES a new channel of distribution for Kimball International ENABLED BY $20M Facility New Capabilities Strategic Cost Efficiencies Optimization in Innovation Acquisitions 6
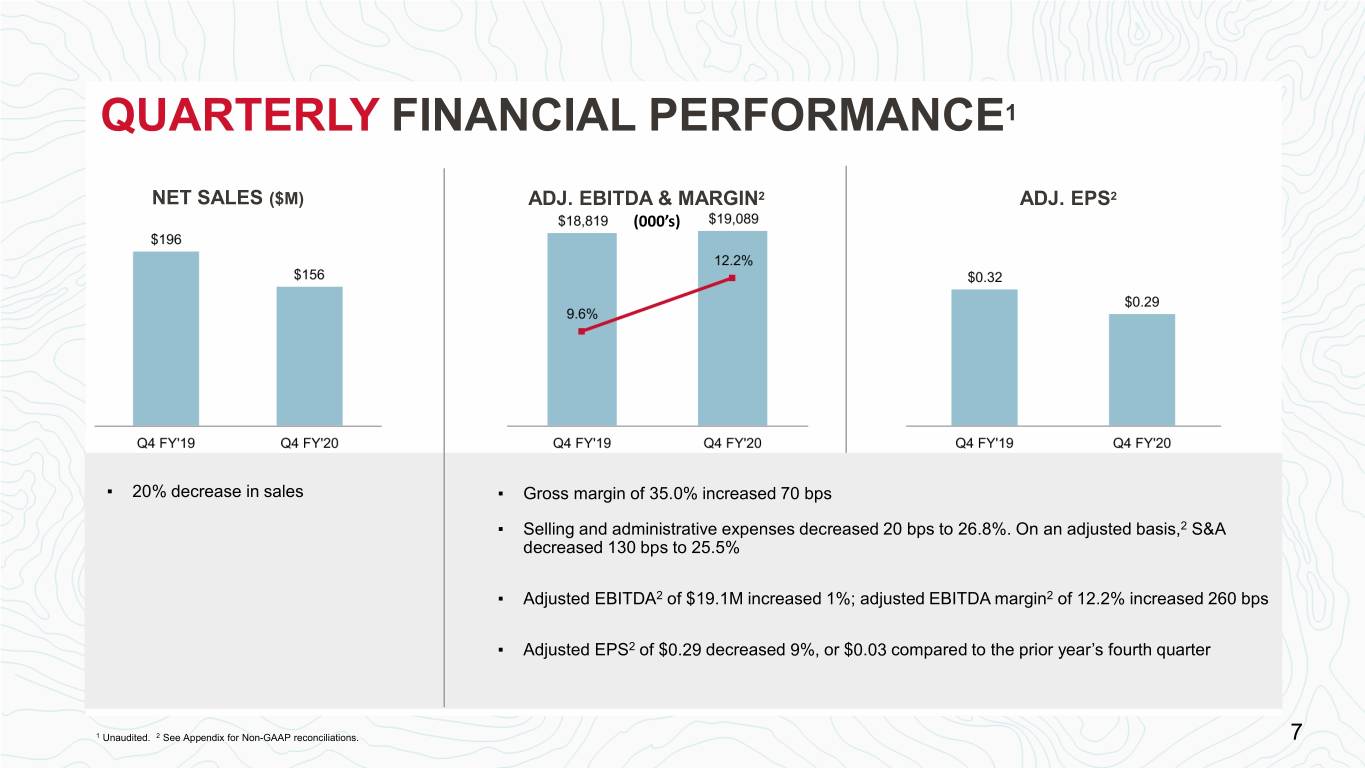
QUARTERLY FINANCIAL PERFORMANCE1 NET SALES ($M) ADJ. EBITDA & MARGIN2 ADJ. EPS2 (000’s) ▪ 20% decrease in sales ▪ Gross margin of 35.0% increased 70 bps ▪ Selling and administrative expenses decreased 20 bps to 26.8%. On an adjusted basis,2 S&A decreased 130 bps to 25.5% ▪ Adjusted EBITDA2 of $19.1M increased 1%; adjusted EBITDA margin2 of 12.2% increased 260 bps ▪ Adjusted EPS2 of $0.29 decreased 9%, or $0.03 compared to the prior year’s fourth quarter 1 Unaudited.1 Unaudited. 2 See 2 See Appendix Appendix for forNon Non-GAAP-GAAP reconciliations. reconciliations. 7 7
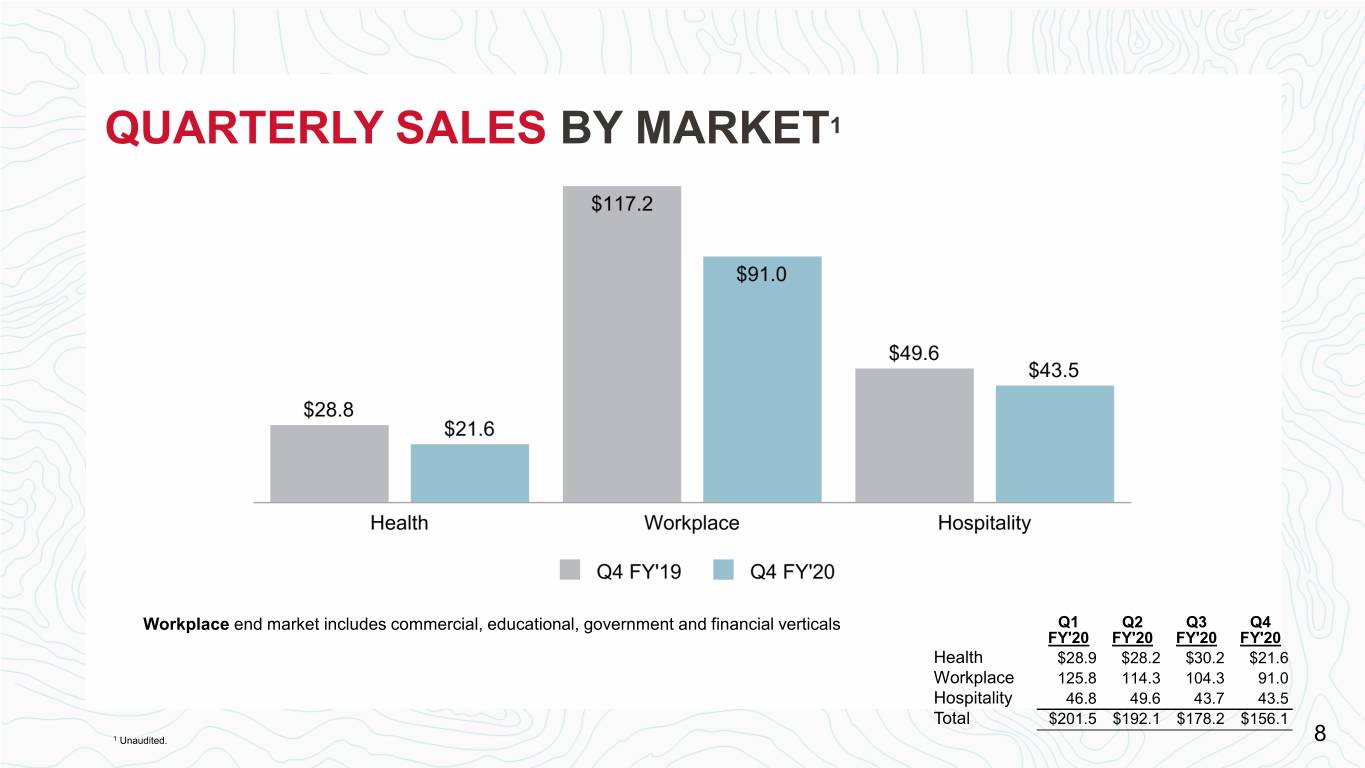
QUARTERLY SALES BY MARKET1 Workplace end market includes commercial, educational, government and financial verticals Q1 Q2 Q3 Q4 FY'20 FY'20 FY'20 FY'20 Health $28.9 $28.2 $30.2 $21.6 Workplace 125.8 114.3 104.3 91.0 Hospitality 46.8 49.6 43.7 43.5 Total $201.5 $192.1 $178.2 $156.1 1 1Unaudited.Unaudited. 8 8
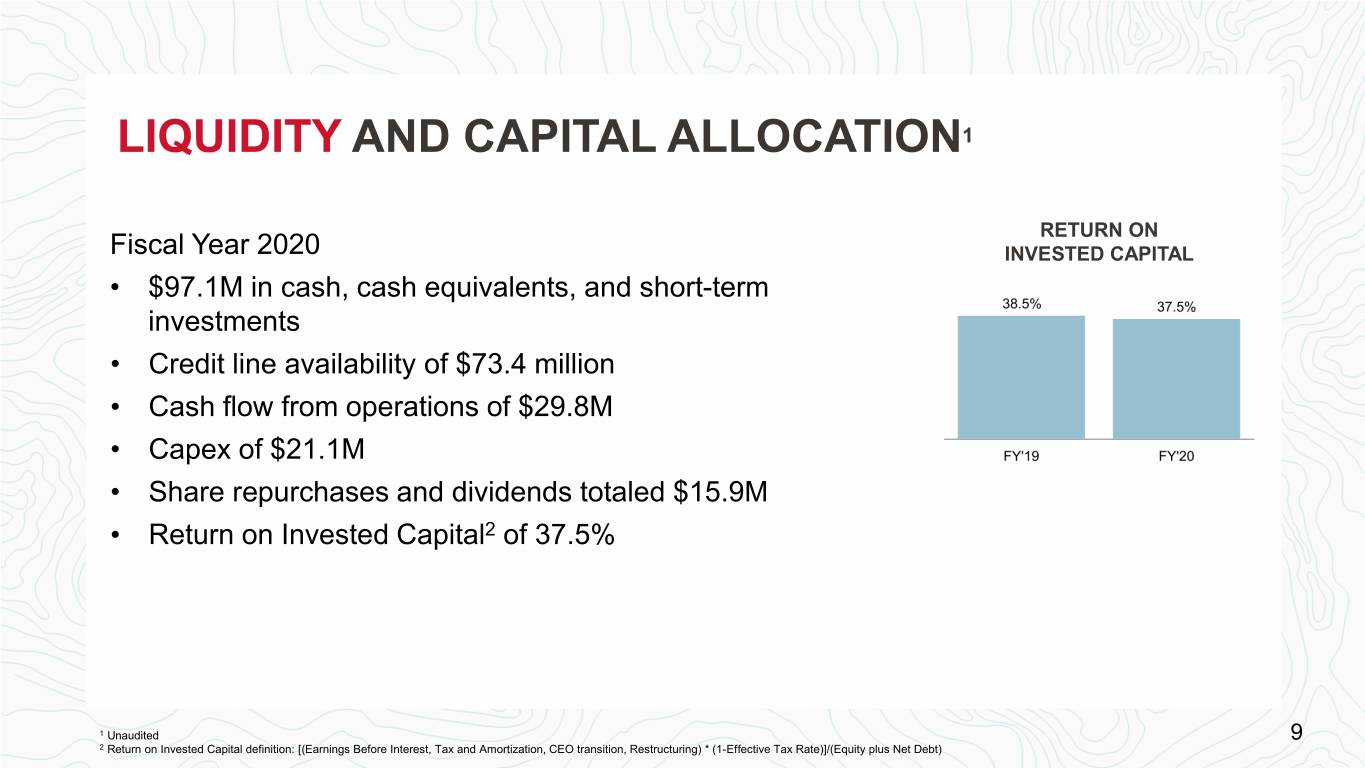
LIQUIDITY AND CAPITAL ALLOCATION1 RETURN ON Fiscal Year 2020 INVESTED CAPITAL • $97.1M in cash, cash equivalents, and short-term investments • Credit line availability of $73.4 million • Cash flow from operations of $29.8M • Capex of $21.1M • Share repurchases and dividends totaled $15.9M • Return on Invested Capital2 of 37.5% 1 Unaudited 9 2 Return on Invested Capital definition: [(Earnings Before Interest, Tax and Amortization, CEO transition, Restructuring) * (1-Effective Tax Rate)]/(Equity plus Net Debt) 9
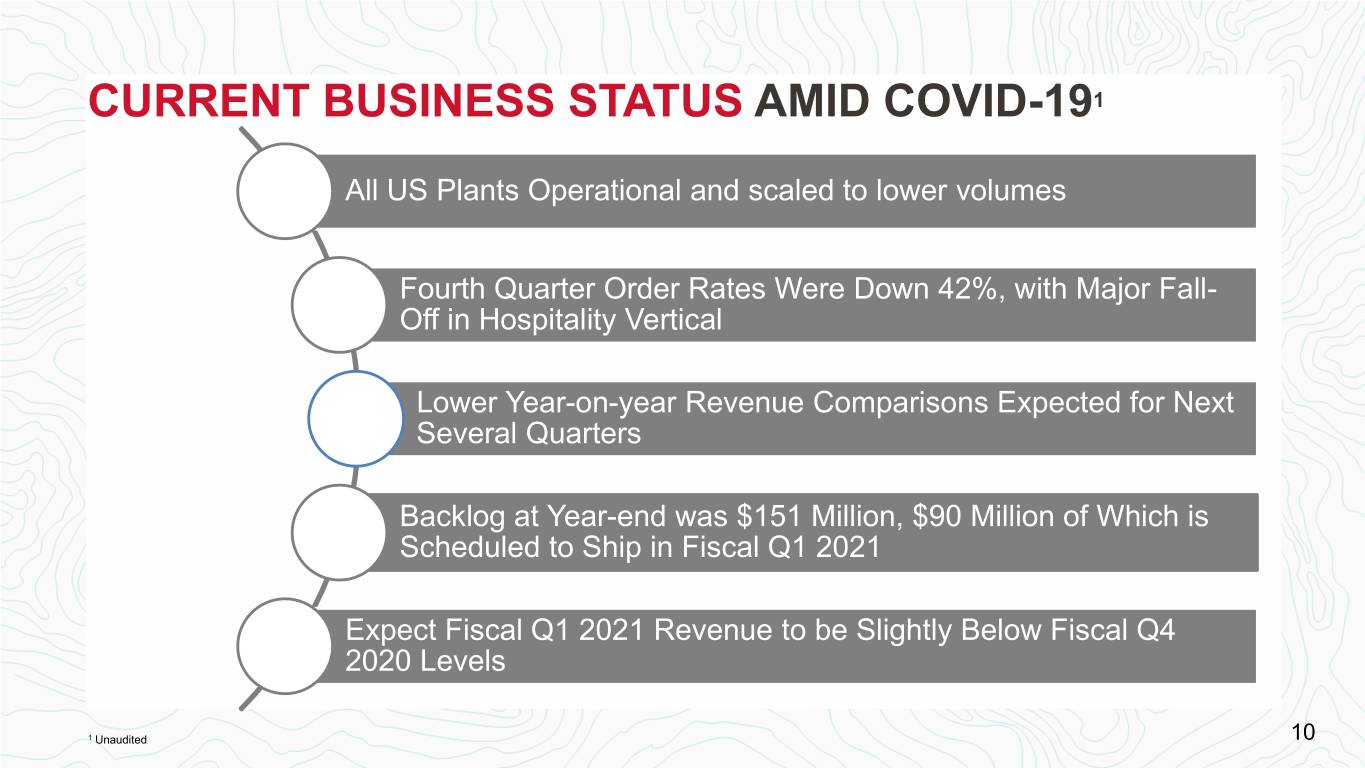
CURRENT BUSINESS STATUS AMID COVID-191 All US Plants Operational and scaled to lower volumes Fourth Quarter Order Rates Were Down 42%, with Major Fall- Off in Hospitality Vertical Lower Year-on-year Revenue Comparisons Expected for Next Several Quarters Backlog at Year-end was $151 Million, $90 Million of Which is Scheduled to Ship in Fiscal Q1 2021 Expect Fiscal Q1 2021 Revenue to be Slightly Below Fiscal Q4 2020 Levels 1 Unaudited 10 10
KEY TAKEAWAYS ▪ Strong financial position with additional cost savings underway ▪ Positioned in more resilient geographies ▪ Market share opportunities across targeted verticals ▪ Accelerated new product development ▪ Culturally-aligned organization 11

APPENDIX 12 12
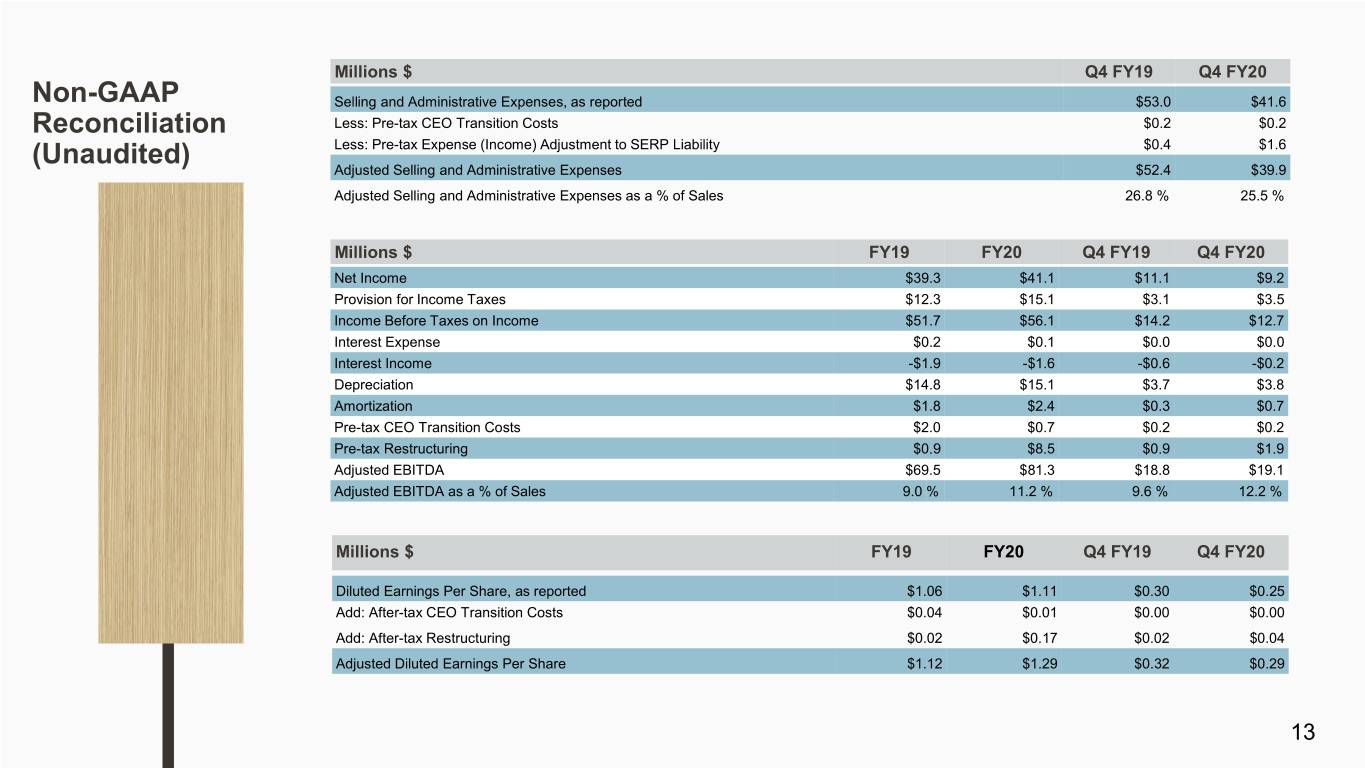
Millions $ Q4 FY19 Q4 FY20 Non-GAAP Selling and Administrative Expenses, as reported $53.0 $41.6 Reconciliation Less: Pre-tax CEO Transition Costs $0.2 $0.2 Less: Pre-tax Expense (Income) Adjustment to SERP Liability $0.4 $1.6 (Unaudited) Adjusted Selling and Administrative Expenses $52.4 $39.9 Adjusted Selling and Administrative Expenses as a % of Sales 26.8 % 25.5 % Millions $ FY19 FY20 Q4 FY19 Q4 FY20 Net Income $39.3 $41.1 $11.1 $9.2 Provision for Income Taxes $12.3 $15.1 $3.1 $3.5 Income Before Taxes on Income $51.7 $56.1 $14.2 $12.7 Interest Expense $0.2 $0.1 $0.0 $0.0 Interest Income -$1.9 -$1.6 -$0.6 -$0.2 Depreciation $14.8 $15.1 $3.7 $3.8 Amortization $1.8 $2.4 $0.3 $0.7 Pre-tax CEO Transition Costs $2.0 $0.7 $0.2 $0.2 Pre-tax Restructuring $0.9 $8.5 $0.9 $1.9 Adjusted EBITDA $69.5 $81.3 $18.8 $19.1 Adjusted EBITDA as a % of Sales 9.0 % 11.2 % 9.6 % 12.2 % Millions $ FY19 FY20 Q4 FY19 Q4 FY20 Diluted Earnings Per Share, as reported $1.06 $1.11 $0.30 $0.25 Add: After-tax CEO Transition Costs $0.04 $0.01 $0.00 $0.00 Add: After-tax Restructuring $0.02 $0.17 $0.02 $0.04 Adjusted Diluted Earnings Per Share $1.12 $1.29 $0.32 $0.29 13 13


