
2:00 – 2:05 | Welcome and Introductions |
2:05 – 2:30 | U.S. Inland Waterways |
2:30 – 3:00 | Kirby Overview |
3:00 – 3:15 | Kirby Inland Marine · Kirby and Industry Fleet Profile |
3:15 – 3:30 | Break 15 minutes |
3:30 – 3:50 | Kirby Engine Systems Overview |
3:50 – 4:35 | Outlook for the Petrochemical Industry · Chemical Market Associates, Inc. |
4:35 – 5:20 | Refined Products Supply & Demand Drivers · Purvin & Gertz, Inc. |
5:20 – 5:25 | Closing Remarks |
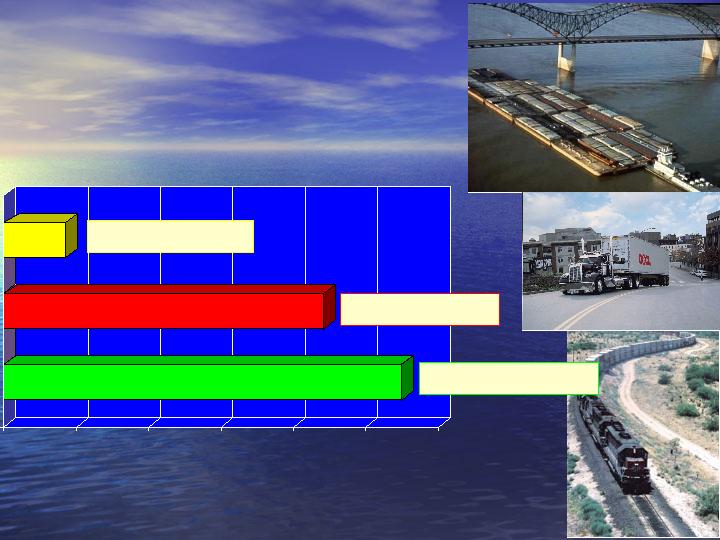
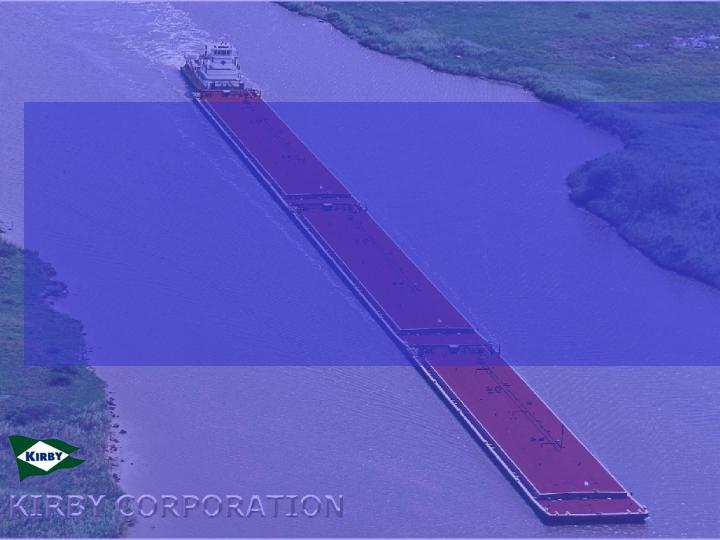
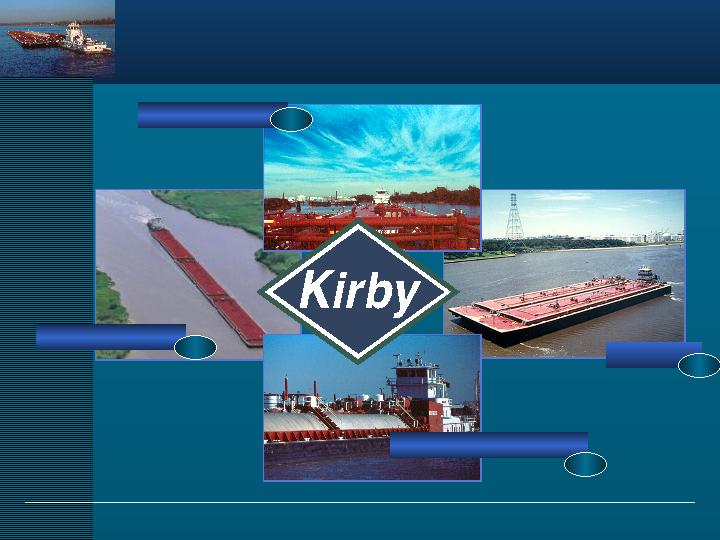
Agenda
Kirby Analyst/Investor Meeting

2:00 – 2:05 | Welcome and Introductions |
2:05 – 2:30 | U.S. Inland Waterways |
2:30 – 3:00 | Kirby Overview |
3:00 – 3:15 | Kirby Inland Marine · Kirby and Industry Fleet Profile |
3:15 – 3:30 | Break 15 minutes |
3:30 – 3:50 | Kirby Engine Systems Overview |
3:50 – 4:35 | Outlook for the Petrochemical Industry · Chemical Market Associates, Inc. |
4:35 – 5:20 | Refined Products Supply & Demand Drivers · Purvin & Gertz, Inc. |
5:20 – 5:25 | Closing Remarks |
Agenda
Kirby Analyst/Investor Meeting
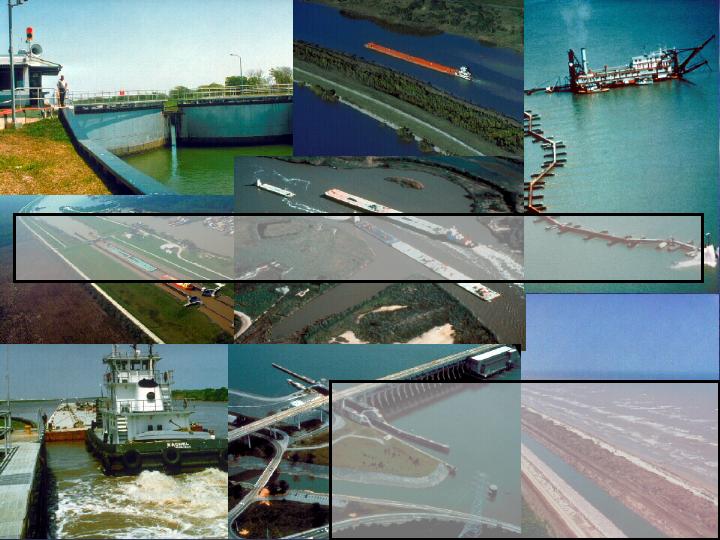
The State of the Waterways
Kirby Corporation Analysts’ Briefing
Berdon Lawrence, Chairman
Kirby Corporation
John Doyle, Vice President
Waterways Council, Inc. &
Special Counsel, Jones Walker LLP
The waterways are an
American success story:
American success story:
| • | They helped make America great |
| • | They create and maintain good agricultural and manufacturing jobs |
| • | But, our leaders in Washington began to take them for granted |
| • | So, industry and agriculture organized to defend and improve the waterways |
| • | We have been successful so far |
| • | The outlook is positive |
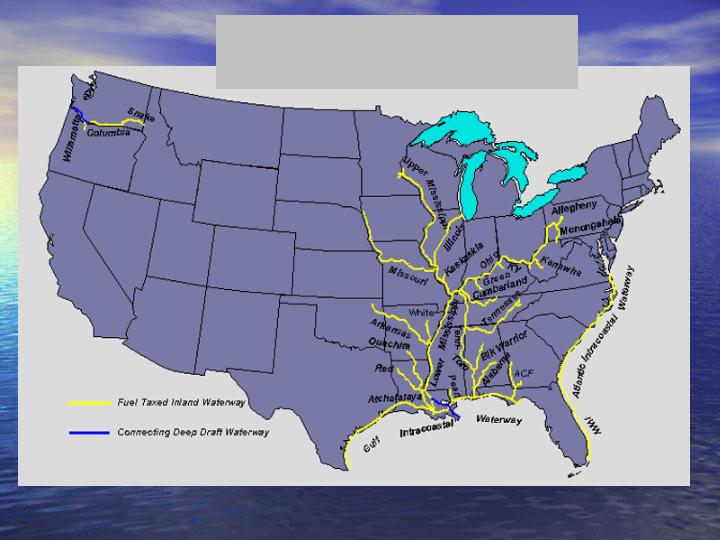
Canals
Dams
Locks
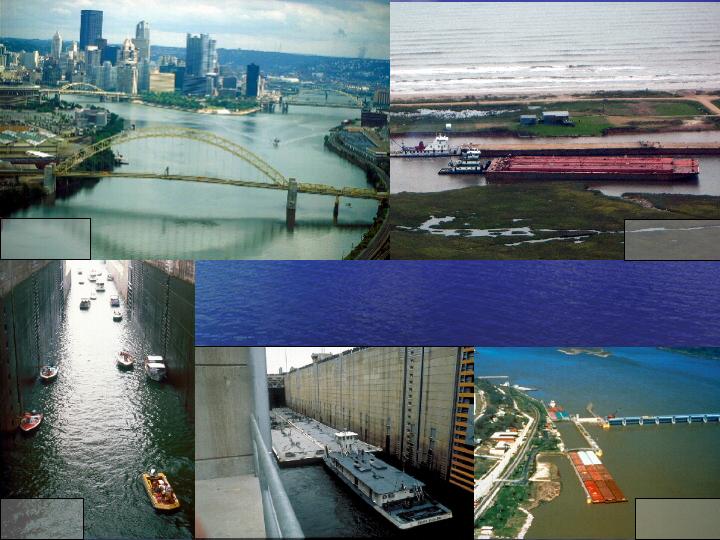
The System
Rivers
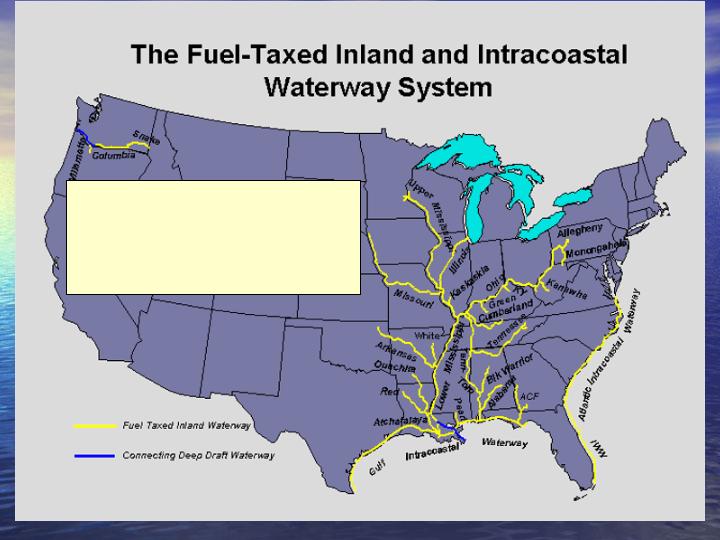
-Nearly 12,000 Miles 9 ft & Over
-192 Lock Sites / 238 Chambers
-About 2/3rds Cost of Rail and
1/10 Cost of Truck
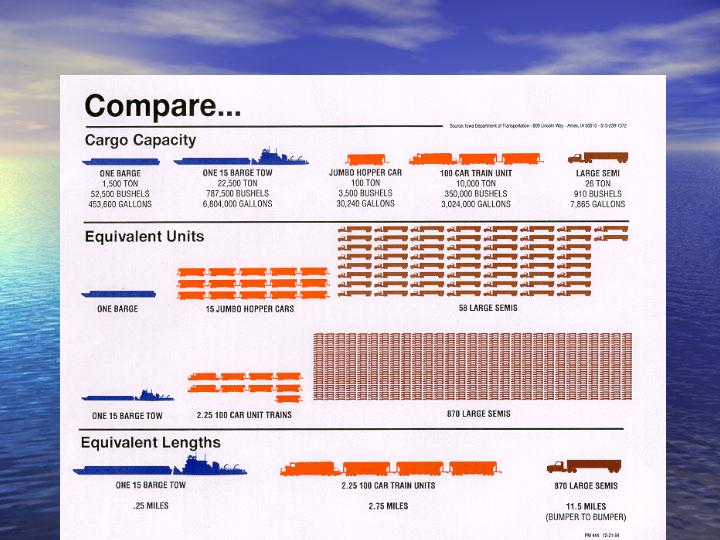
How farone gallon of fuel
movesone ton of freight, average by mode…
Truck: 70 miles
Rail: 420 miles
Barge: 530 miles
0
100
200
300
400
500
600
Miles
Barge transportation enjoys similar efficiencies in air
emissions per ton mile.
emissions per ton mile.
We Conserve Fuel & Reduce
Air Emissions
Air Emissions
We offer a solution to Congestion:
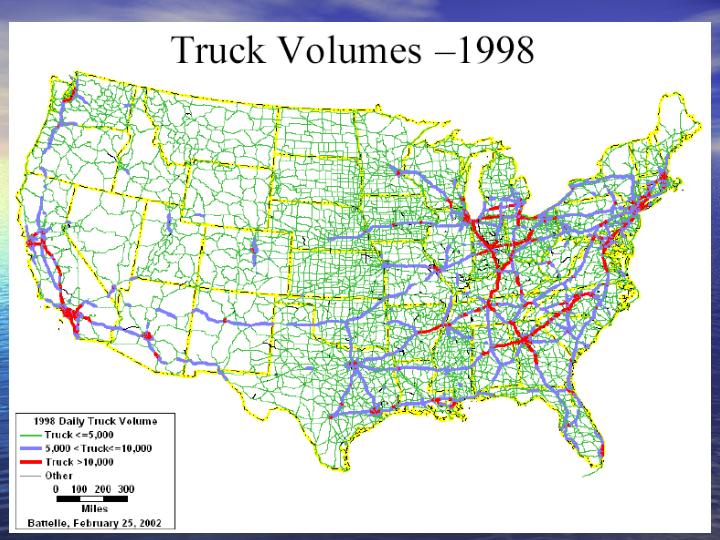
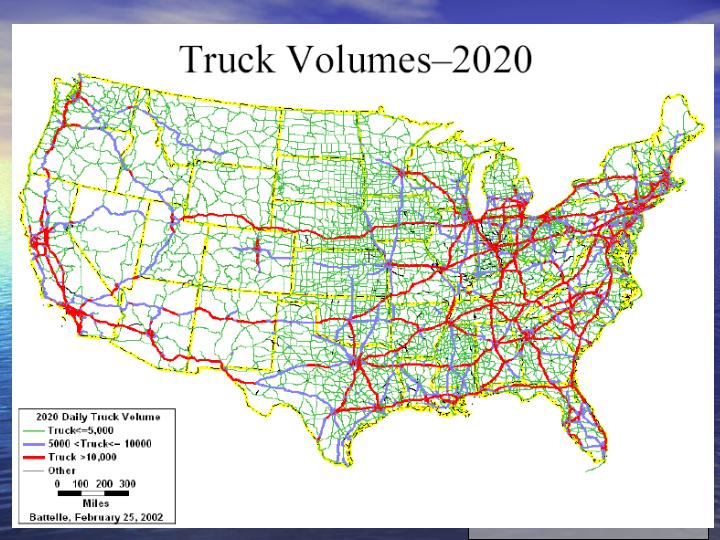
The waterways
serve key future
transportation corridors
serve key future
transportation corridors
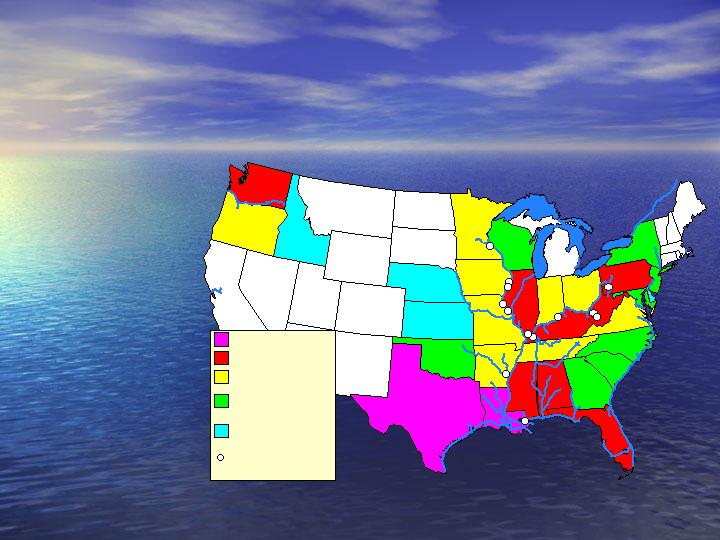
The waterways serve many
traffic growth corridors.

America’s Waterways Advantage
| • | American farmers and industries compete in a tough global marketplace |
| – | If you get the goods to the customer cheaper, you get the sale |
| – | Efficient, low cost waterways transportation reduces total costs and allows us to compete |
| • | The Result: American exports win and vital, high paying jobs stay here! |
Over $10
Billion
Billion
$2 - 10
Billion
Billion
$1 - 2
Billion
Billion
$100 Million to
$1 Billion
Lock Construction
or Rehabilitation
Under $100
Million
Based on data developed by TVA and USACE.
Value of Inland and Intracoastal
Waterborne Cargo
Waterborne Cargo
by State of Origin
| • | Over $112 billion in cargo |
| • | Shipped from 31 states |
| • | At average savings of $11 / ton over competing modes |

Waterways Role in Nation’s
Economic Prosperity
Economic Prosperity
| • | Grain Exports |
| – | 90 million tons annually |
| – | 70% of soybean and 62% of corn exports move by barge |
Waterways Role in Nation’s
Economic Prosperity
Economic Prosperity
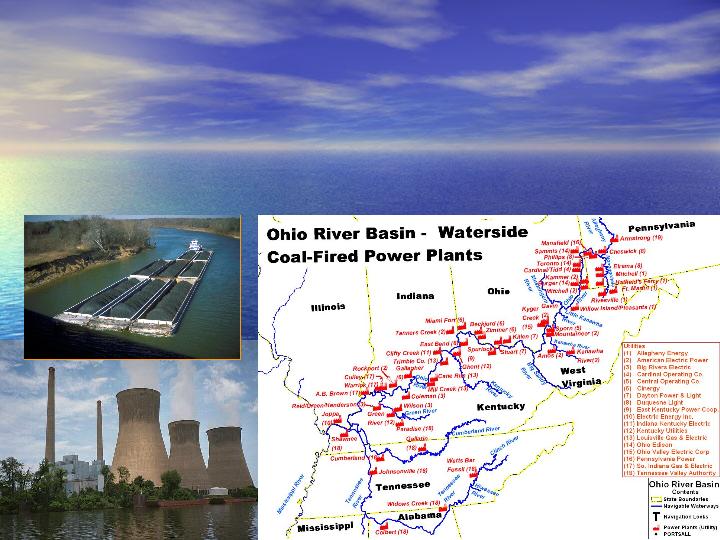
| • | Coal for power plants |
| – | 227 million tons annually – inland, Lakes, coastal |
| – | 20 % of utility coal supplied by waterway |

Waterways Role in Nation’s
Economic Prosperity
Economic Prosperity
| • | Petrochemicals & Petroleum Products |
| – | 350 million tons annually between domestic points |

We are having success…
…because we have a good story to tell
…because we have a good story to tell
| • | Keeping our industries and farmers competitive in a very tough global marketplace preserves U.S. jobs |
| • | Reduces congestion on our highways |
This is an easy story to understand, but
somebody has to tell it to the Washington
lawmakers.
somebody has to tell it to the Washington
lawmakers.

Traditionally, the industry did not take a proactive
role in telling this story. Over time, this resulted in:
The 90’s
| • | Declining support in the Administration and Congress |
| • | Corps spending on waterways diverted elsewhere |
| • | Trust fund balance starts to rise |
| • | “Environmentalists” mount attack on the Corps |
| • | Media & editorial campaigns against the Corps and water resources development |
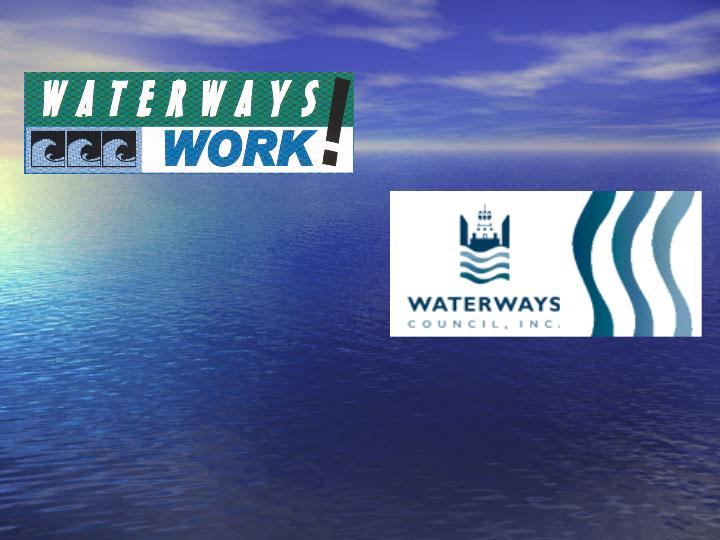
Waterways Work! was formed
in 2001 to counter negative
publicity about the industry
In 2003, Waterways Work
merged with DINAMO, the
Association for the Ohio
Valley, and formed the
Waterways Council, Inc.
The Waterways Council, Inc.:
| • | Professional staff based in Washington, DC |
| • | Media relations team |
| • | Annual budget now over $1 million |
| • | Active member involvement |
| • | Dedicated lobbying team – Jones Walker/Livingston Group |
The waterway community response:
Who are WCI
Members?
Members?
| • | All waterway business interests: |
| – | Carriers |
| – | Shippers |
| – | Waterways Service Providers |
| – | Port Authorities & Governmental Entities |
| – | Regional Associations |
| • | Geographically Diverse |
| • | All major commodity groups: |
| – | Oil, chemical and petrochemical |
| – | Grain |
| – | Coal |
| – | Building Materials |
| – | Steel, Aluminum and Ore |
| – | Containers |
The Objectives:
| • | Get the President to propose adequate budgets |
| • | Get Congress to pass laws that authorize projects and appropriate the money needed each year to build and maintain them |
| • | Ensure the Corps of Engineers actually spends the money as intended by Congress |

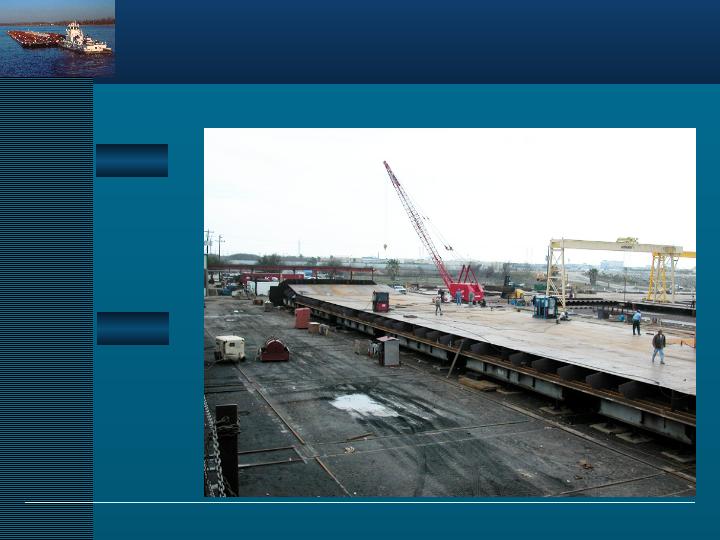
New Construction
Major Rehabilitation
Olmsted
Inner
Harbor
Marmet
McAlpine
Kentucky
L&D 11 Rehab
L&D 19 Rehab
L&D 24 Rehab
Lower Mon 2-4
Myers
Chickamauga
Active new lock
construction and major
rehabilitation program
underway in FY ‘05:
construction and major
rehabilitation program
underway in FY ‘05:
| • | 8 new or replacement |
locks(receiving IWTF funds)
| • | 3 major rehabs |
| • | $332 million in funding |
New Construction and Modernization:
Major Navigation Projects Underway
Major Navigation Projects Underway
Based on FY 2005 Appropriations

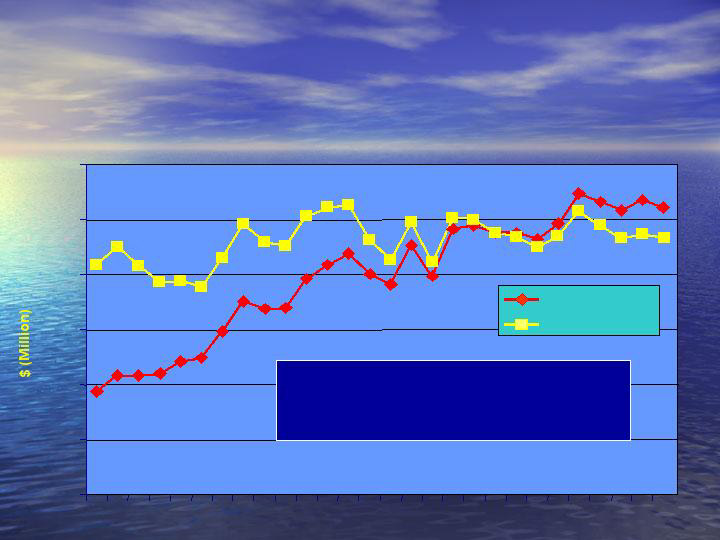
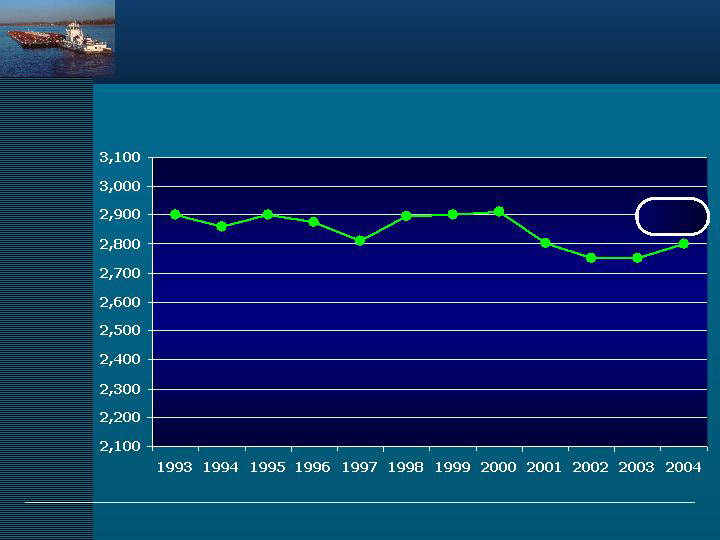
Year | Estimated Outlays | Tax Revenues | Interest Earnings | Year-End Balances |
| ($Millions) | ||||
1990 | 117.3 | 62.8 | 26.2 | 292.8 |
1991 | 148.6 | 60.5 | 21.2 | 225.9 |
1992 | 122.7 | 69.9 | 13.7 | 186.7 |
1993 | 74.5 | 78.6 | 7.5 | 198.3 |
1994 | 75.7 | 88.4 | 9.3 | 220.2 |
1995 | 94.8 | 103.4 | 13.3 | 242.1 |
1996 | 85.5 | 108.4 | 15.6 | 280.6 |
1997 | 89.5 | 96.4 | 17.0 | 304.6 |
1998 | 76.9 | 91.1 | 18.3 | 337.1 |
1999 | 88.2 | 104.4 | 16.0 | 369.2 |
2000 | 102.4 | 99.6 | 20.0 | 387.8 |
2001 | 120.3 | 102.6 | 20.9 | 390.9 |
2002 | 104.5 | 95.3 | 12.4 | 394.1 |
2003 | 101.6 | 89.5 | 9.5 | 391.6 |
2004 | 117.3 | 90.8 | 6.9 | 372.0 |
*2005 | 146.0 | 92.0 | 7.0 | 325.0 |
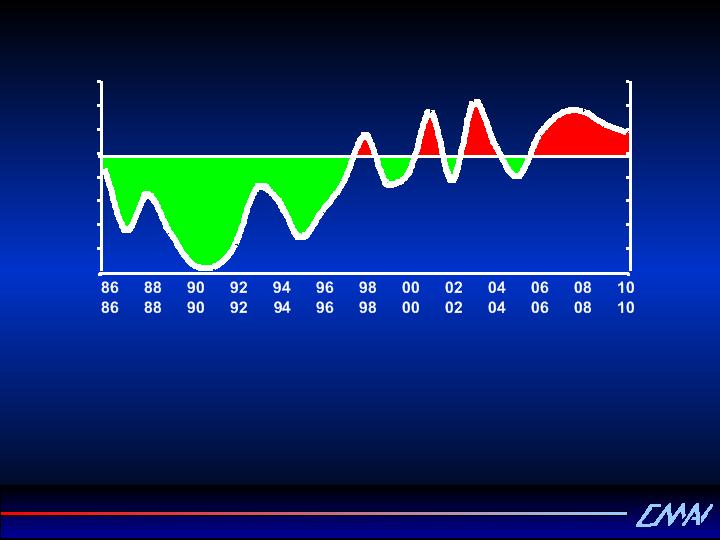
Inland Waterways Trust Fund
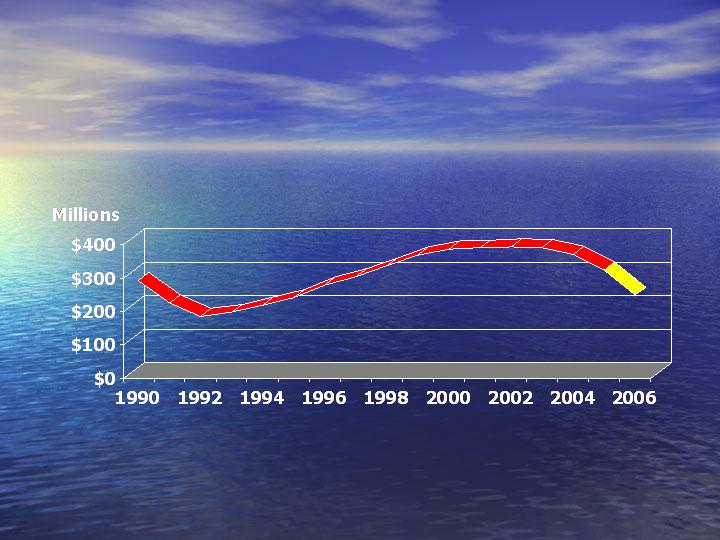
Trust Fund Balances
Money from 20 cent per gallon fuel tax. This is matched with an
equal sum from the Treasury. Actual spending is double this amount.
50
70
90
110
130
150
170
190
210
96
97
98
99
OO
O1
O2
O3
O4
O5
O6
Fiscal Year
$184 Mil.
in Bush
Budget.
Appropriations
bill pending.
Waterways Work /
Waterways Council
Formed
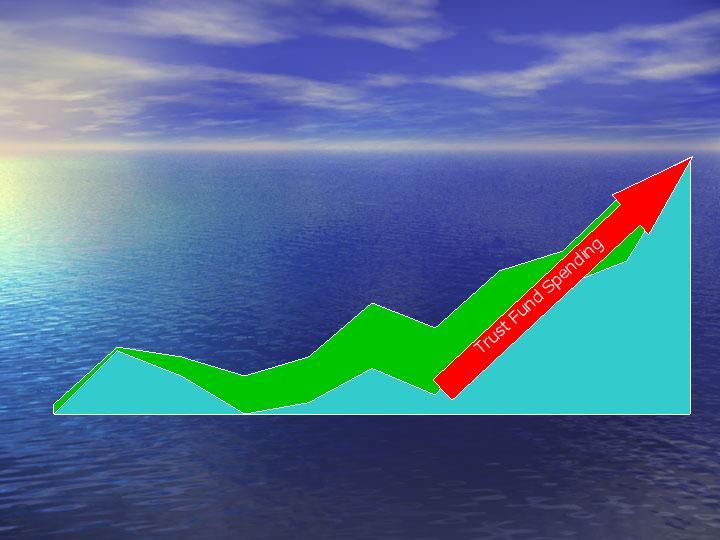
Trust Fund Spending:
New Construction and Major Rehab
New Construction and Major Rehab
Millions of dollars
from trust fund.
Matched with
general revenues.
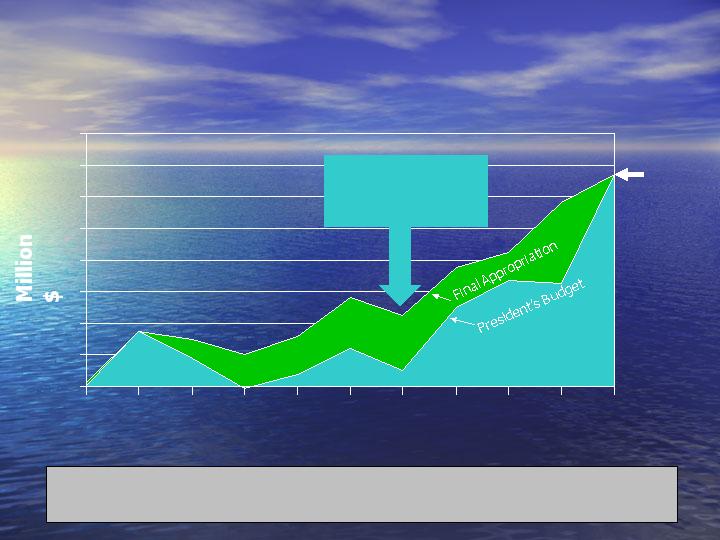
Recent Trust Fund Spending

| FY 2002 Enacted | FY 2003 Enacted | FY 2004 Enacted | FY 2005 Enacted | FY 2006 Request | % Difference (05 vs. 02) | % Difference (06 vs. 02) | |
| Construction General | 1,712 | 1,745 | 1,731 | 1,782 | 1,637 | 4.1 | (-4.4) |
| Inland Waterways Trust Fund | 189 | 253 | 270 | 332 | 368 | 75.7 | 94.7 |
| Corps Civil Works Total | 4,650 | 4,699 | 4,563 | 4,668 | 4,513 | 0.4 | (-2.9) |
Inland Waterways Trust Fund
Appropriations Comparison
Appropriations Comparison
($ in millions)

Goals for Fiscal Year 2006
Appropriations:
Appropriations:
| • | At least $300 million ($150 million from the Inland Waterways Trust Fund) for Building Priority Projects |
| • | An additional $100 million above the President’s budget for inland navigation Operations and Maintenance priority needs |
0
100
200
300
400
500
600
1977
1980
1983
1986
1989
1992
1995
1998
2001
Current $ and 1996 Constant $,
Fuel-Taxed Waterways Only
Fuel-Taxed Waterways Only
2004
Real O&M funding remains flat even
as project portfolio grows and
ages…
as project portfolio grows and
ages…
Current $
Constant
$
$
Operations & Maintenance (O&M)
funding is our next major challenge
funding is our next major challenge

The O&M Challenge
| • | Intensified Focus in 2005 |
| • | System-Wide Examination |
| • | Joint Industry/Corps Initiative |
| • | Maintain and Improve System Reliability |
| • | Secure Adequate Resources and Invest to Maximize Results |
| – | Reduce Risk and Increase Reliability |

Industry/Corps O&M Workshops in 2005
| • | Conducted |
| – | January Cincinnati, OH Ohio River System |
| – | January St. Louis, MO Upper Miss./Illinois |
| – | February Tampa, FL Integration |
| – | April New Orleans, LA Gulf Intracoastal |
| • | Being Planned |
| – | TBD TBD Lower Miss. & Tribs. |
| – | TBD TBD Columbia/Snake |

Industry/Corps O&M Workshops
| • | Identify most pressing problems from perspective of Corps and industry |
| • | Allocate resources to address most pressing needs |
| • | We are committed to both short term and long term solutions to navigational issues |

Also Where We Are Going…
| • | Passage of Water Resources Development Act (WRDA) |
| – | Authorize Lock Modernization on the Upper Mississippi and Illinois Rivers |
| – | Reasonable, Non-Damaging “Corps Reform” Provisions |

Kirby is a leader in efforts to
maintain and improve our
waterways infrastructure.
| • | Kirby supports national efforts: |
| – | Berdon Lawrence, Chair, Waterways Works/Waterways Council 2001- March, 2005 |
| – | Steve Valerius, Incoming Chair, American Waterways Operators |
| – | Joe Pyne, Chair, National Waterways Foundation |

Kirby is a leader in efforts to
maintain and improve our
waterways infrastructure.
| • | Kirby also supports regional efforts. Examples: |
| – | *Gulf Intracoastal Canal Association (GICA) |
| – | Midwest Area River Coalition (MARC 2000) |
| – | *Louisiana Association of Waterways Operators and Shipyards (LAWS) |
| – | *Texas Waterway Operators Association (TWOA) |
| – | *Warrior Tombigbee Waterway Association |
*Kirby employee is officer or director
Thingsare getting better
…yet we still have much work to do.
Some of the images in this presentation are courtesy of the
U.S. Army Corps of Engineers

2:00 – 2:05 | Welcome and Introductions |
2:05 – 2:30 | U.S. Inland Waterways |
2:30 – 3:00 | Kirby Overview |
3:00 – 3:15 | Kirby Inland Marine · Kirby and Industry Fleet Profile |
3:15 – 3:30 | Break 15 minutes |
3:30 – 3:50 | Kirby Engine Systems Overview |
3:50 – 4:35 | Outlook for the Petrochemical Industry · Chemical Market Associates, Inc. |
4:35 – 5:20 | Refined Products Supply & Demand Drivers · Purvin & Gertz, Inc. |
5:20 – 5:25 | Closing Remarks |
Agenda
Kirby Analyst/Investor Meeting
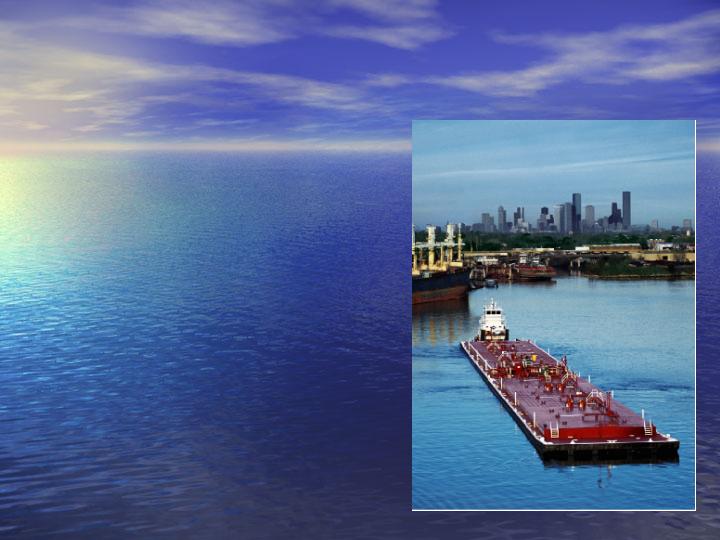
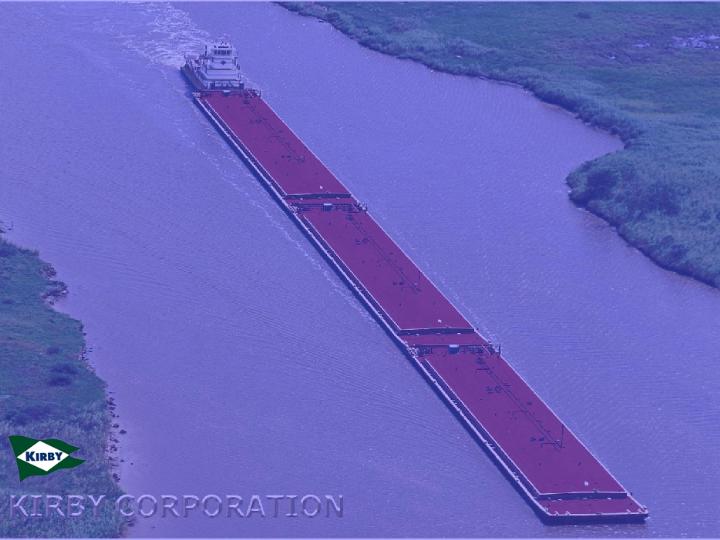
Kirby Corporation
Putting America’s Waterways to Work
NYSE: KEX
May 2005
Statements contained in this presentation with respect to the future are
forward-looking statements. These statements reflect management’s
reasonable judgement with respect to future events. Forward-looking
statements involve risks and uncertainties. Actual results could differ
materially from those anticipated as a result of various factors, including cyclical or other downturns in demand, significant pricing competition, unanticipated additions to industry capacity, changes in the Jones Act or in U.S. maritime policy and practice, fuel costs, interest rates, weather conditions and the timing, magnitude and the number of acquisitions made by Kirby. A list of additional risk factors can be found in Kirby’s annual report on Form 10-K for the year ended December 31, 2004, filed with the Securities and Exchange Commission.
Kirby reports its financial results in accordance with generally accepted
financial principles (GAAP). However, Kirby believes that certain
Non-GAAP financial measures are useful in managing Kirby’s businesses and evaluating Kirby’s performance. This presentation contains two Non-GAAP financial measures, adjusted net earnings and EBITDA. Please see the Appendix for a reconciliation of GAAP to Non-GAAP financial measures.
Kirby Forward Looking Statement
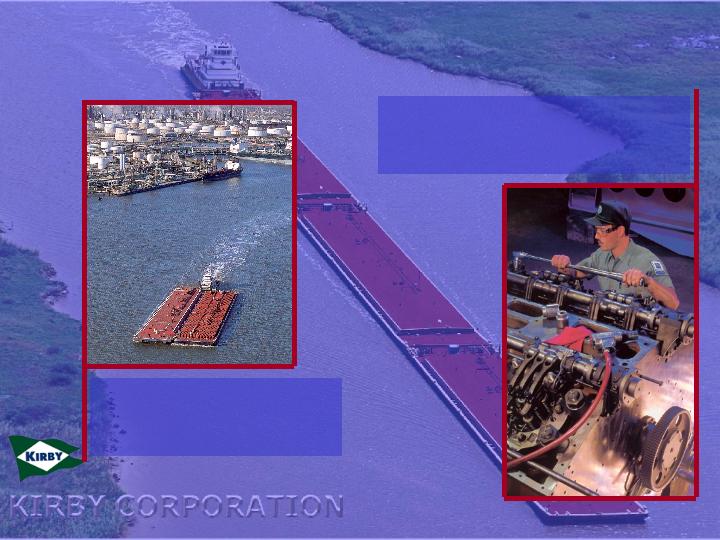
Marine Transportation
87% of 2004 Revenue - $588.8 million
Largest U.S. Inland Tank Barge Operator
Diesel Engine Services
13% of 2004 Revenue - $86.5 million
Largest Domestic EMD Diesel Services Company
Kirby... Business Operations

Kirby Facts
| • | Largest inland tank barge operator |
| • | Operates 878 barges and 239 towing vessels |
| • | Sustainable competitive advantages: |
| – | Lowest cost due to economies of scale |
| – | Best positioned for growth opportunities |
| – | “One Stop Shop” for customers |
| • | 70% of Kirby’s business is under contract, 30% spot market |
| • | Successful integration of 23 acquisitions |
17% growth
rate from
1988-2004
rate from
1988-2004
Revenue... Business Operations
1994-2001 adjusted to exclude goodwill amortization expense
2002 adjusted to exclude impairment charges of $12.5 million, net of taxes, or $.51 per share
See Appendix for reconciliation of GAAP to Non-GAAP earnings per share
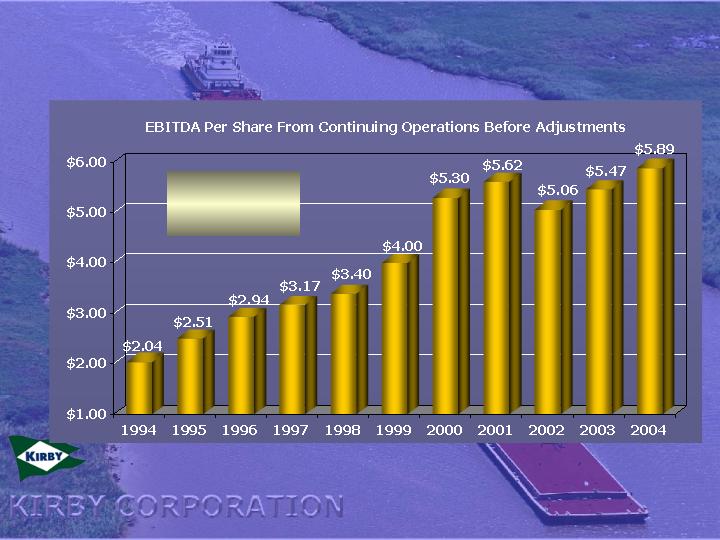
12.4% growth
rate from
1994 - 2004
rate from
1994 - 2004
Earnings Per Share From Continuing Operations Before Adjustments
Guidance
Earnings Per Share…

| • | Record 1st quarter 2005 earnings of $.52, 44% increase over 1st quarter 2004 earnings of $.36 |
| • | Raised 2005 annual forecast to $2.45 - $2.55, 24% to 29% above 2004 |
| • | 1st quarter 2005 spot and contract rates increased 4% to 5% |
| • | 2004 chemical volumes up 4% to 5%; 2005 chemical volumes expected to improve but at a slower rate |
| • | Diesel engine business during 1st quarter 2005 increased prices on both parts and labor |
Recent Demands and Pricing Trends

| • | 70% Contract, 30% Spot |
| – | Reduces volatility and improves predictability |
| – | Allows Kirby to service peak demand from contract customers |
| – | Long-term approach to business |
| • | Ideally would want higher spot exposure when spot rates were higher than contract rates |
| – | Short-term approach to business |
| – | More risk |
| – | Difficult to achieve |
Contract to Spot Market Mix
| • | Why has Kirby not benefited more from the problems that rail and trucks are having with their infrastructure? |
Issues
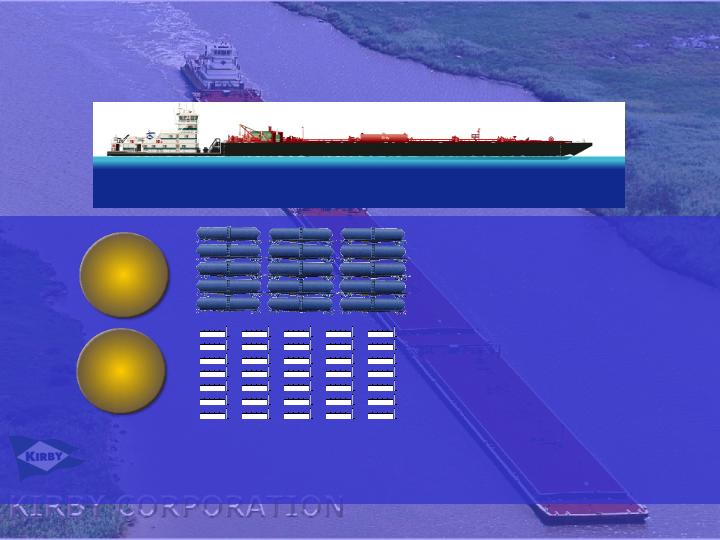
60,000 bbl. two-barge tow is equivalent to:
Kirby’s fleet capacity of 16.4 million bbls. equates
to82,000 trucks, or21,900 rail cars
to82,000 trucks, or21,900 rail cars
Rail Cars
80
Trucks
300
Barges Compete SuccessfullyWith Rails and Trucks
St. Paul
Sioux City
Chicago
Pittsburgh
Charleston
St. Marks
Tulsa
Brownsville
Corpus Christi
Houston
New Orleans
St. Louis
Cincinnati
Mobile
Kirby is one of the fewoperators offering distribution
throughout the
MississippiRiver System and Gulf
MississippiRiver System and Gulf
Intracoastal
Waterway
Waterway
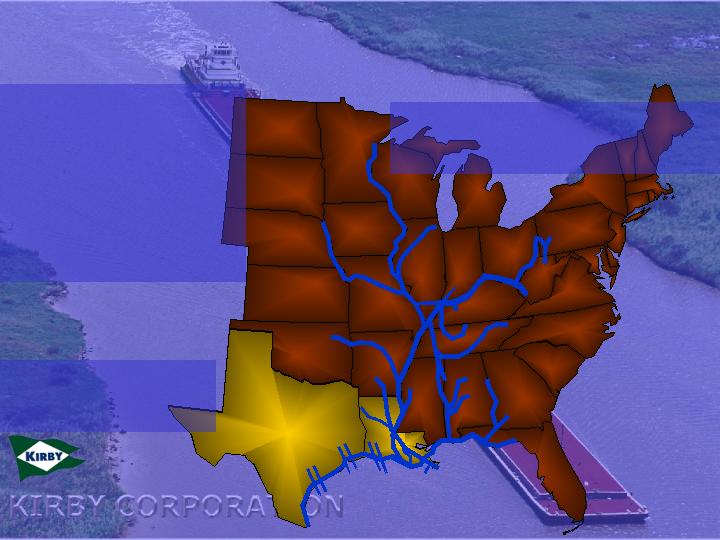
12,000 miles of navigable waterways
linking America’s heartland to the world
linking America’s heartland to the world
Texas and Louisiana account for 80% of the total U.S. production of chemicals and petrochemicals
Putting America’s Waterways to Work
Inland Waterway System
Inland Waterway System
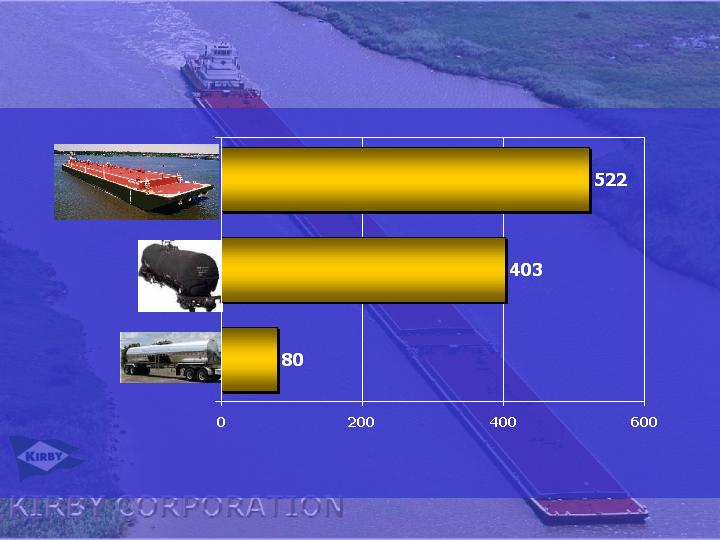
One gallon of fuel in a barge can move one ton of freight 522 miles, compared
to 403 miles by rail and only 80 miles for a truck.
to 403 miles by rail and only 80 miles for a truck.
Barge
Rail
Truck
Barges…
Efficient
Efficient

While moving one ton of freight 1,000 miles:
| • | Smog is a major problem in most major cities |
| • | Oxides of nitrogen are the chemicals that produce smog |
Trains produce 3.5times as much oxides of
nitrogen as barges
nitrogen as barges
Trucks produce 19times as much oxides of
nitrogen as barges
nitrogen as barges
Barges…
Environmentally Friendly
Environmentally Friendly
| • | Why has Kirby not benefited more from the problems that rail and trucks are having with their infrastructure? |
| • | What has been the cost of security measures required by the Homeland Security Act? |
| • | What are the prospects for an acquisition this year? |
Issues

Shipper Owned Independent | Tank Barges Operated | Dry Cargo Barges Operated |
Kirby Corporation | 878 | - |
American Commercial Lines LLC | 379 | 2,861 |
Marathon Ashland Petroleum | 167 | - |
Ingram Barge Company | 165 | 3,468 |
Canal Barge Company, Inc. | 150 | 226 |
Florida Marine | 103 | - |
American River Transportation Co | 84 | 1,892 |
Blessey Enterprises | 83 | - |
Higman Barge Lines, Inc. | 77 | - |
Cenac Towing Company, Inc. | 69 | - |
Magnolia Marine Transport Co | 60 | - |
PPG Industries, Inc. | 59 | - |
Martin Midstream Partners | 55 | - |
Southern Towing Company | 53 | - |
Settoon Towing, LLC | 49 | - |
LeBeouf Brothers Towing Co | 43 | - |
John W. Stone Oil | 31 | - |
Dupont | 30 | - |
Olin Corporation | 26 | - |
Buffalo Marine Service, Inc. | 22 | - |
River City Towing Services | 19 | - |
Rhodia, Inc. | 19 | - |
Lyondell Chemical Company | 17 | - |
Shipper Owned Independent | Tank Barges Operated | Dry Cargo Barges Operated |
Dynegy Midstream Services | 16 | - |
Waxler Towing Company, Inc. | 15 | - |
Highland Towing | 15 | - |
ConocoPhillips Company | 15 | - |
Plaquemine Towing Corp. | 13 | - |
Houston Marine Services, Inc. | 13 | - |
Devall Towing | 12 | - |
Chem Carriers, Inc. | 11 | - |
Westlake/GA&O Corporation | 10 | - |
Merichem Company | 8 | - |
Grifco | 8 | - |
Apex Towing | 7 | - |
Golding Barge Lines, Inc. | 6 | - |
Republic of Texas | 6 | - |
American Milling | 5 | 17 |
Barge Management, Inc. | 5 | - |
Mon River Towing, Inc. | 4 | 142 |
Reilly Industries | 4 | - |
Memphis Barge Lines | 2 | - |
Cytec Industries | 2 | - |
Jantran, Inc. | 1 | 3 |
Other dry cargo carriers | - | 9, 670 |
TOTAL | 2,816 | 18,279 |
Sparks Companies, March 2005
Kirby Outpaces the Competition
Tank Barge Owners By Number of Tank Barges

| • | Why has Kirby not benefited more from the problems that rail and trucks are having with their infrastructure? |
| • | What has been the cost of security measures required by the Homeland Security Act? |
| • | What are the prospects for an acquisition this year? |
| • | How is Osprey doing? |
Issues
Osprey
| • | Container on barge operation |
| – | Developing a new market |
| – | Challenge is to divert traffic from other modes and routes |
| – | Shorebased infrastructure more important than actual movement |
| • | Inland service shows great potential |
| – | Developing infrastructure |
| – | Building volume |
| – | Testing pricing |
| • | Coastal service using small ship struggling |
| – | Cost of vessel |
| – | Volume |
| • | Significant long term potential but short term development will be slow and uneven |
| – | 5 to 10 year play |
Observations About Market
| • | Bear Sterns Conference |
| – | Disconnect between Wall Street’s perception and what transportation companies are seeing |
| • | Kirby’s current business conditions |
| – | Saw no February/March soft patch |
| – | Remain very busy |
| – | Customers are not telling us they are worried about their volumes |
| • | Best fundamentals Kirby has seen in 25 years |
Financial Highlights
For Three Months Ended March 31
12.7%
15.2%
Operating Margins
11.2% growth
rate from
1994 - 2004
rate from
1994 - 2004
See Appendix for reconciliation of GAAP net earnings to Non-GAAP EBITDA
EBITDA Per Share Growth
* Excluding acquisitions
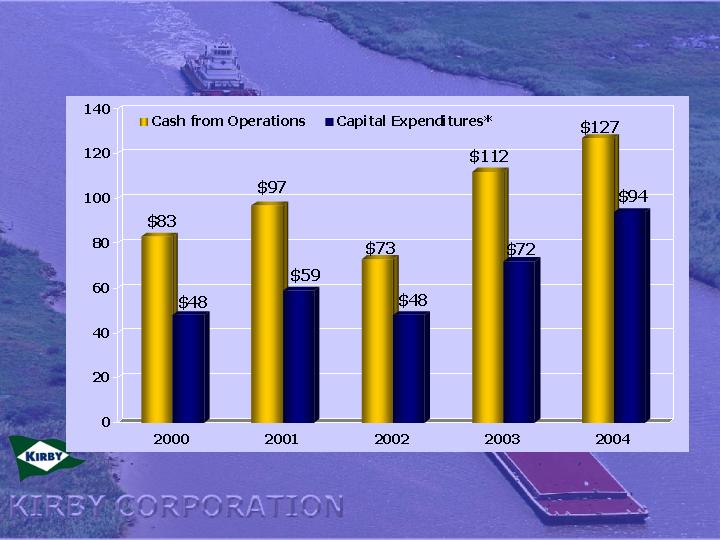
Cash Flows
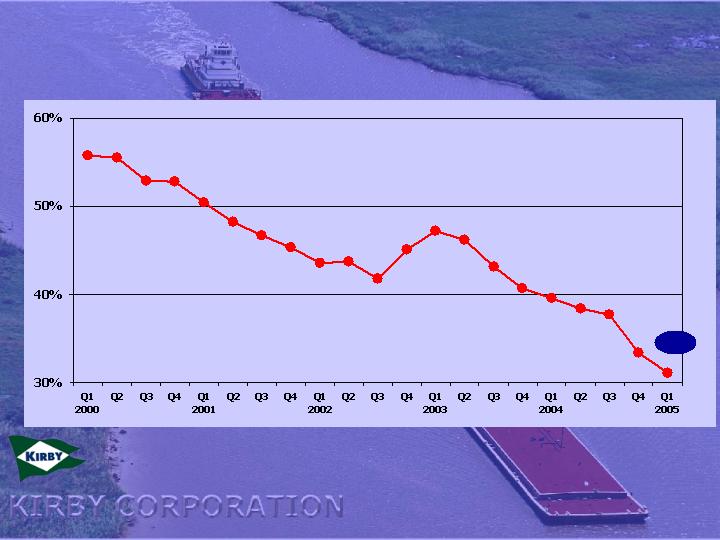
31.1%
Debt / Capitalization
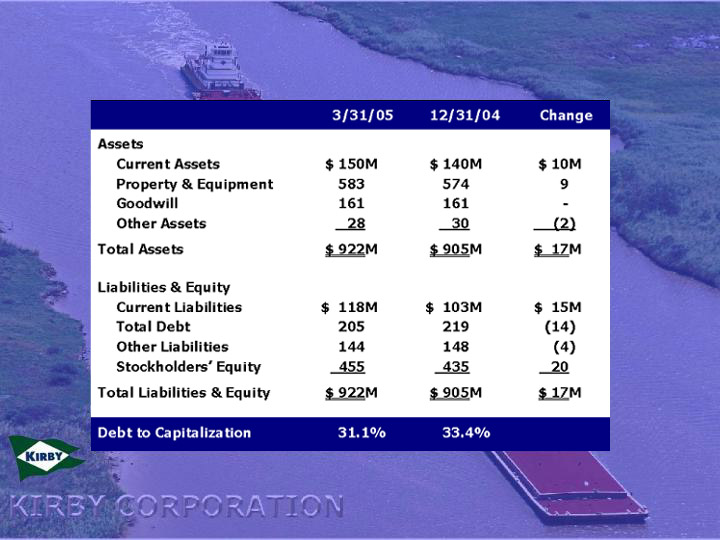
Balance Sheet
| • | Investment grade public debt |
| – | Standard & Poor’s – BBB |
| – | Moody’s – Baa3 |
| • | 10-year unsecured Private Placement due 2013 |
| – | $200 million outstanding |
| – | Floating rate of LIBOR +1.2% |
| – | Callable at par after one year without penalty |
| – | No required principal payments until maturity |
| • | $150 Million Revolving Credit Facility – December 2003 |
| – | Maturity extended three years to December 2007 |
| – | Accordion feature added to allow maximum amount to increase to $225 million without amendment |
Financial Strength
| • | Approximately $200 million of outstanding debt |
| – | Floating rate private placement maturing 2013 |
| – | $150 million bank revolving credit maturing December 2007 (expandable to $225 million) |
| • | $150 million hedged against interest rate movements |
| – | $50 million hedged until May 2009 |
| – | $100 million hedged until February 2013 |
| • | Total cost of debt in Q1 2005 averaged 6.0% |
Interest Rate Risk
| • | Completed first annual assessment of internal controls over financial reporting |
| – | No material weaknesses |
| – | No significant deficiencies |
| – | Clean opinion from KPMG |
| • | Total cost for 2004 compliance - $1 million plus |
| • | 2005 Compliance |
| – | Minimal effort to update controls |
| – | Testing of controls |
| • | PCAOB and SEC rule changes expected to reduce projected time and cost |
Section 404
Sarbanes-Oxley Act of 2002
| • | Covers only vessel employees |
| • | Kirby’s policy is to fund 100% of Accumulated Benefit Obligation (ABO) |
| – | Plan assets: $76.4 million at 12/31/04 |
| – | ABO: $75.6 million at 12/31/04 |
| • | Pension expense |
| – | 2003: $4.0 million |
| – | 2004: $5.2 million |
| – | 2005 Projected: $5.2 million |
| • | Contribution |
| – | 2003: $5.6 million |
| – | 2004: $4.6 million |
| – | 2005 Projected: $4 - $8 million |
Defined Benefit Pension Plan

2:00 – 2:05 | Welcome and Introductions |
2:05 – 2:30 | U.S. Inland Waterways |
2:30 – 3:00 | Kirby Overview |
3:00 – 3:15 | Kirby Inland Marine · Kirby and Industry Fleet Profile |
3:15 – 3:30 | Break 15 minutes |
3:30 – 3:50 | Kirby Engine Systems Overview |
3:50 – 4:35 | Outlook for the Petrochemical Industry · Chemical Market Associates, Inc. |
4:35 – 5:20 | Refined Products Supply & Demand Drivers · Purvin & Gertz, Inc. |
5:20 – 5:25 | Closing Remarks |
Agenda
Kirby Analyst/Investor Meeting
Kirby Inland Marine
May 2005

| • | Industry Fleet Profile |
| • | Logistics Management |
| • | Marine Workforce |
Focus
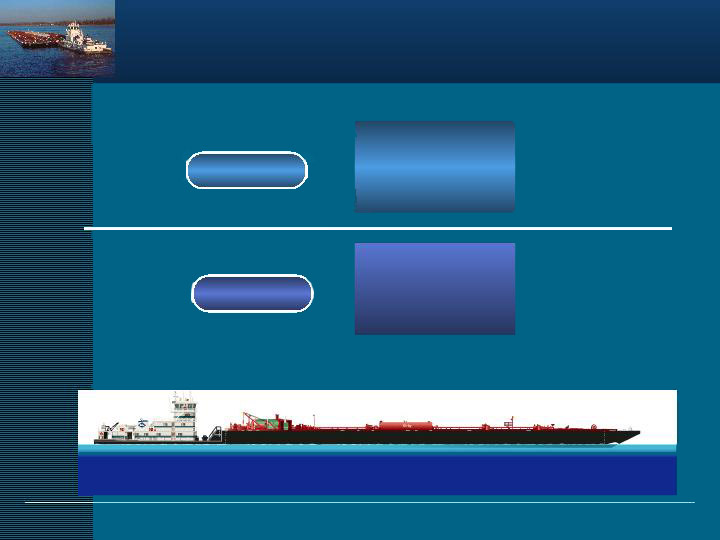
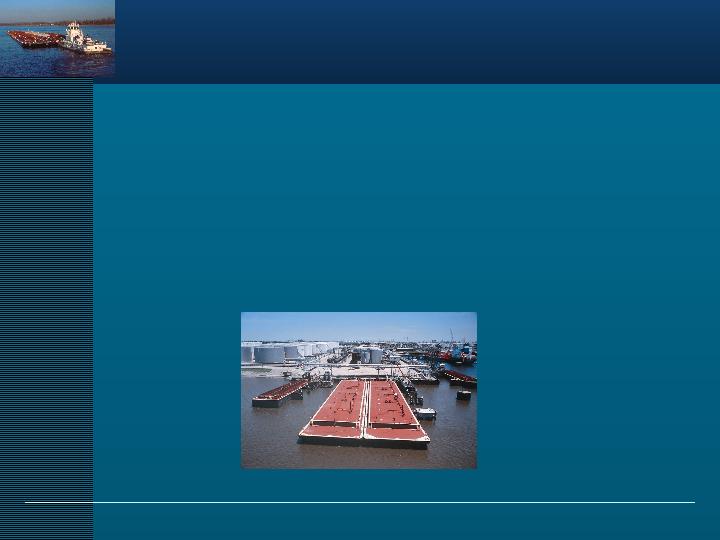
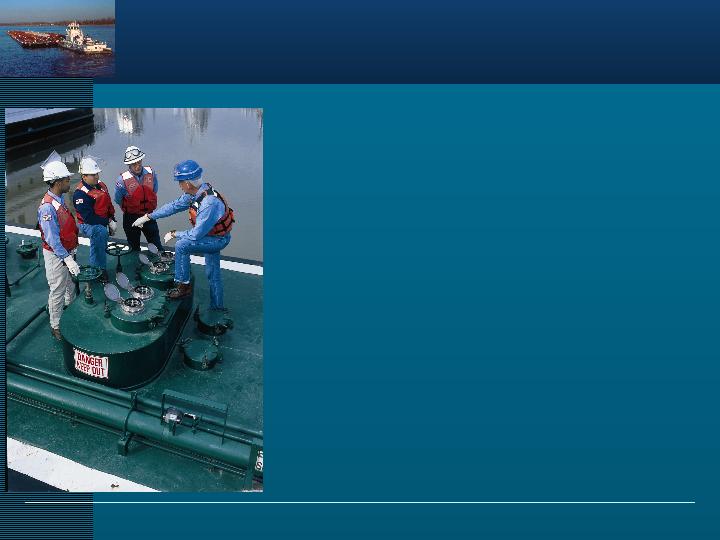
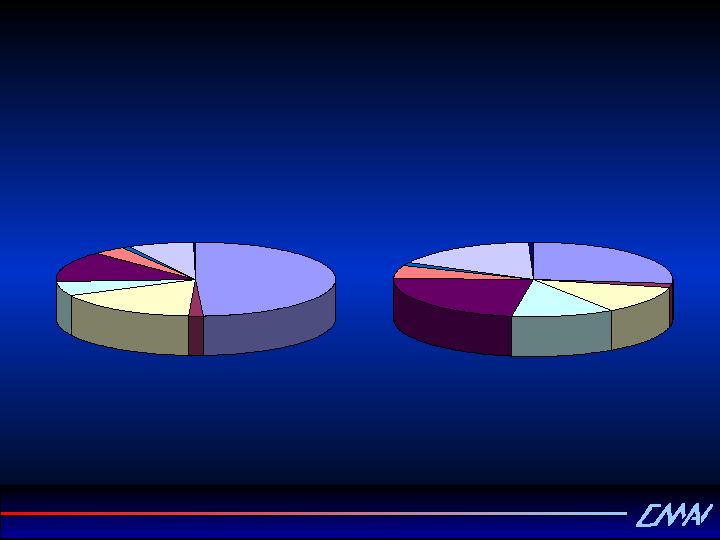
Industry Fleet Profile
Refined Products
10%
Black Oil
20%
Agricultural Chemicals
5%
Petrochemicals
65%
Market Segments

878 Active Tank Barges
Petrochemical
Refined
Products
Refined
Products
High Capacity
pumps –
Specialty coated
tanks
pumps –
Specialty coated
tanks
694
105
63
13
3
Pressure
Pressurized
tanks
tanks
Black Oil
Self-contained
heating systems
heating systems
Anhydrous
Ammonia
Ammonia
Refrigeration
tanks
tanks
Specialty
Stainless steel
tanks
tanks
High Tech and Diverse Fleet

Shipper Owned Independent | Tank Barges Operated | Dry Cargo Barges Operated |
Kirby Corporation | 878 | - |
American Commercial Lines LLC | 379 | 2,861 |
Marathon Ashland Petroleum | 167 | - |
Ingram Barge Company | 165 | 3,468 |
Canal Barge Company, Inc. | 150 | 226 |
Florida Marine | 103 | - |
American River Transportation Co | 84 | 1,892 |
Blessey Enterprises | 83 | - |
Higman Barge Lines, Inc. | 77 | - |
Cenac Towing Company, Inc. | 69 | - |
Magnolia Marine Transport Co | 60 | - |
PPG Industries, Inc. | 59 | - |
Martin Midstream Partners | 55 | - |
Southern Towing Company | 53 | - |
Settoon Towing, LLC | 49 | - |
LeBeouf Brothers Towing Co | 43 | - |
John W. Stone Oil | 31 | - |
Dupont | 30 | - |
Olin Corporation | 26 | - |
Buffalo Marine Service, Inc. | 22 | - |
River City Towing Services | 19 | - |
Rhodia, Inc. | 19 | - |
Lyondell Chemical Company | 17 | - |
Shipper Owned Independent | Tank Barges Operated | Dry Cargo Barges Operated |
Dynegy Midstream Services | 16 | - |
Waxler Towing Company, Inc. | 15 | - |
Highland Towing | 15 | - |
ConocoPhillips Company | 15 | - |
Plaquemine Towing Corp. | 13 | - |
Houston Marine Services, Inc. | 13 | - |
Devall Towing | 12 | - |
Chem Carriers, Inc. | 11 | - |
Westlake/GA&O Corporation | 10 | - |
Merichem Company | 8 | - |
Grifco | 8 | - |
Apex Towing | 7 | - |
Golding Barge Lines, Inc. | 6 | - |
Republic of Texas | 6 | - |
American Milling | 5 | 17 |
Barge Management, Inc. | 5 | - |
Mon River Towing, Inc. | 4 | 142 |
Reilly Industries | 4 | - |
Memphis Barge Lines | 2 | - |
Cytec Industries | 2 | - |
Jantran, Inc. | 1 | 3 |
Other dry cargo carriers | - | 9, 670 |
TOTAL | 2,816 | 18,279 |
Tank Barge Owners By Number of Tank Barges
Sparks Companies, March 2005
6
Fleet Size and Diversity
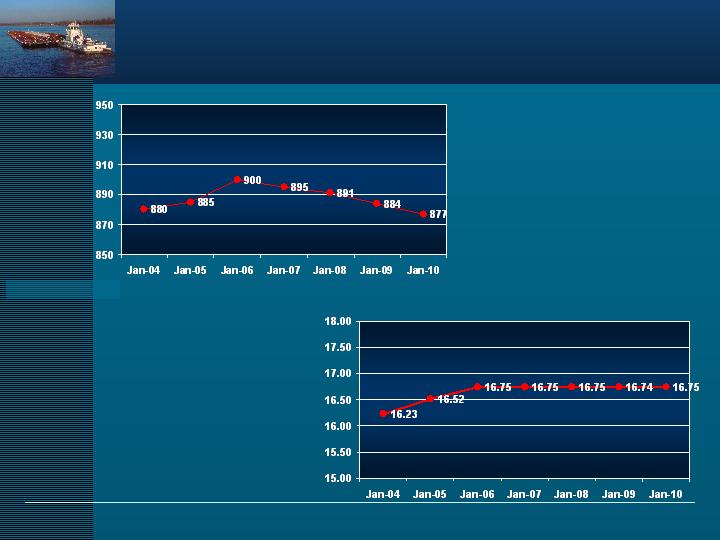
Total Tank Barges
2,816
Inland Tank Barge Industry

| 1,205 | Double Skin 30K barges |
| 1,292 | Double Skin 10K barges |
| 124 | Double Skin < 10K barges |
| 195 | Single Skin barges |
2,816 | Total |
Industry Fleet Hull Profile
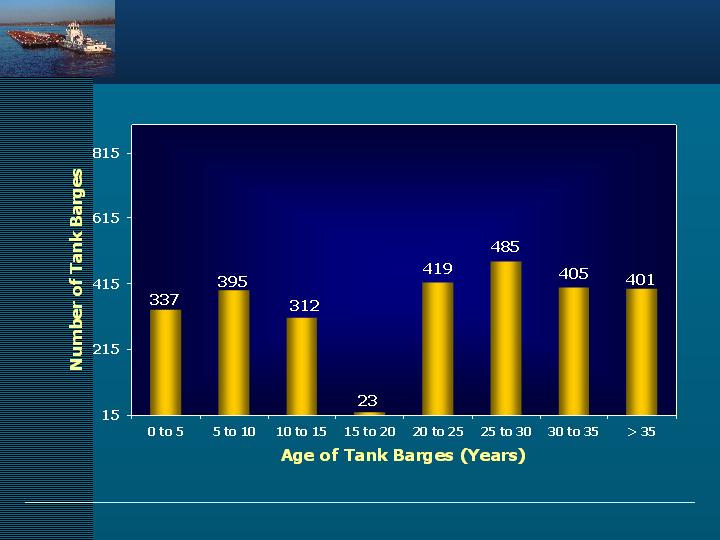
Source: Sparks Companies, March 2005
Inland Tank Barge Fleet
2005 |
2006 |
113
29
Total Industry
New Construction on Order
31 Clean
8 Black Oil
39 Total
7 Clean
8 Black Oil
15 Total
2005
2006
Kirby New Construction Plan
New Construction | 23 | 39 | 15 | 6 | 9 | 11 | 18 |
Number of Barges
Barrel Capacity (mm)
Kirby Fleet Status
10,000 bbl – Clean | $1.0M |
30,000 bbl – Clean | $2.1M |
30,000 bbl – Heated Black Oil | $2.7M |
New Construction Prices
Construction labor | 38% |
Steel, steel products | 37% |
Components | 17% |
Engineering | 8% |
100% |
New Construction Cost
Components
Components

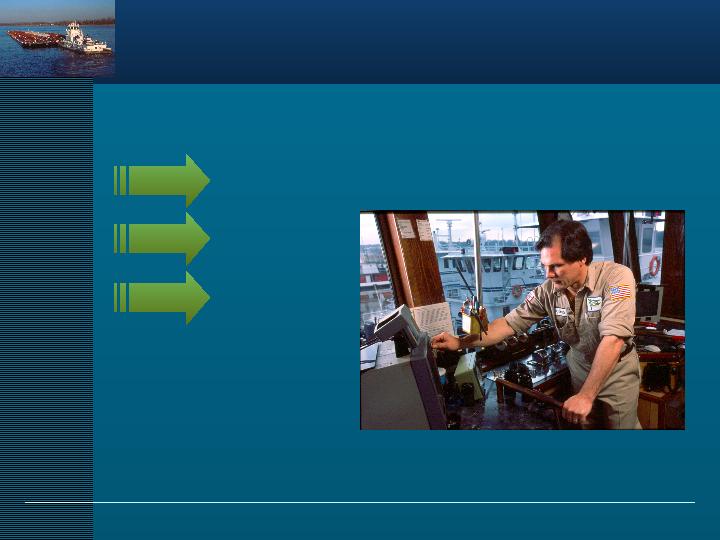
Logistics Management System
Logistics Management System
State-of-the-Art Communication and Positioning
Kirby Leads Industry
| • | All equipment locations instantly available to customer |
| – | Current position |
| – | ETA to customer’s dock |
| – | Information available from booking to final invoice |
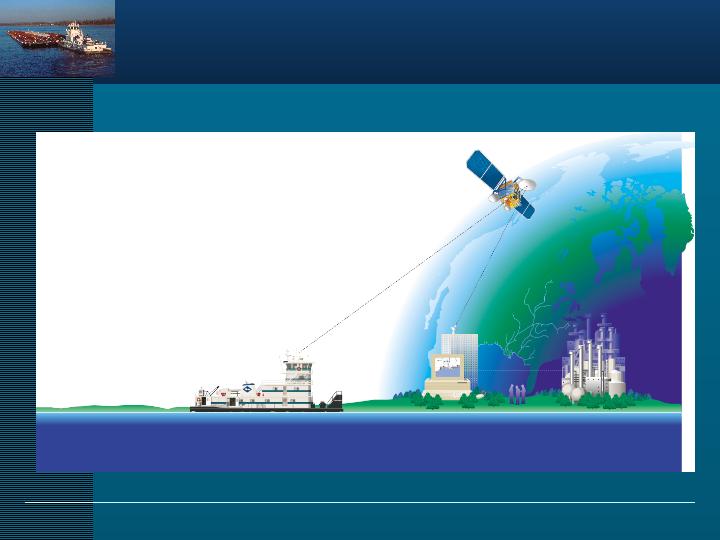
Logistics Management
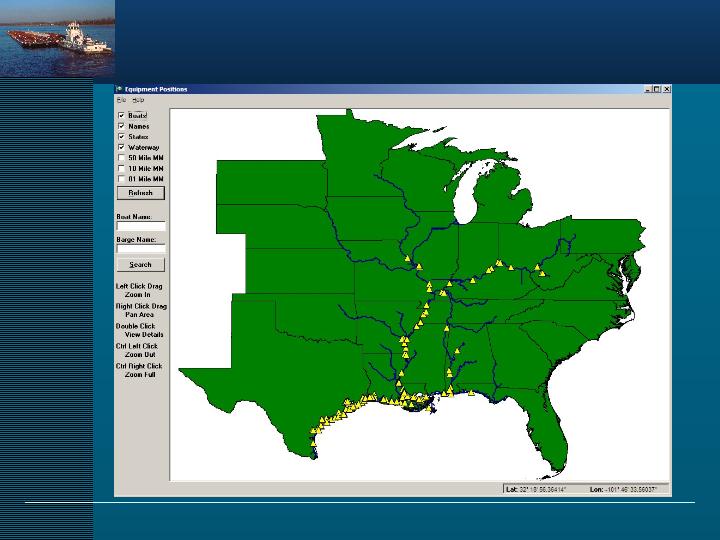
Equipment Positioning
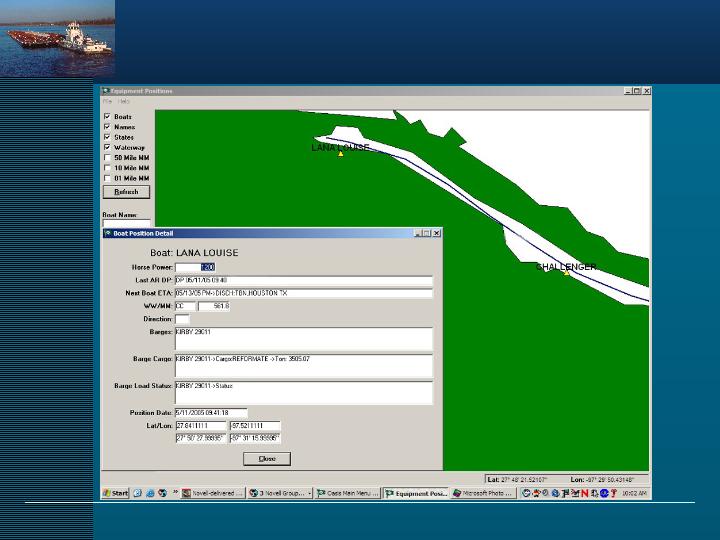
Equipment Positioning

Kirby Leads Industry
| • | All equipment locations instantly available to customers |
| – | Current position |
| – | ETA to customer’s dock |
| – | Information available from booking to final invoice |
Logistics Management
| • | Advanced logistics system enables higher equipment utilization and increased efficiency |
| • | Kirby’s software automatically selects least cost communications route |
| • | Communication system allows Kirby to effortlessly comply with new security regulations |
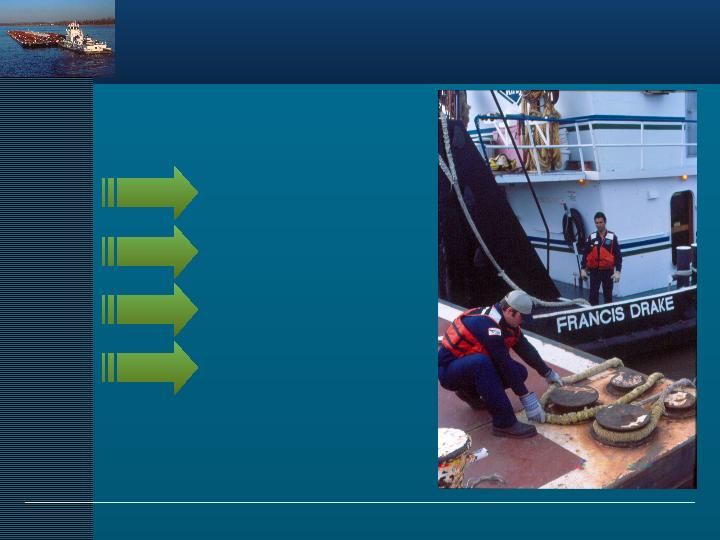
Marine Workforce

| • | Focus on Safety |
| • | Recruit |
| • | Train to be the best |
| • | Retain skilled personnel |
| • | Offer excellent pay and benefits |
| • | Provide advancement opportunity |
| • | Foster community environment |
Recruit, Train and Retain
Captains / Pilots
Tankermen
Deckhands / Tankerman Trainees
Engineers
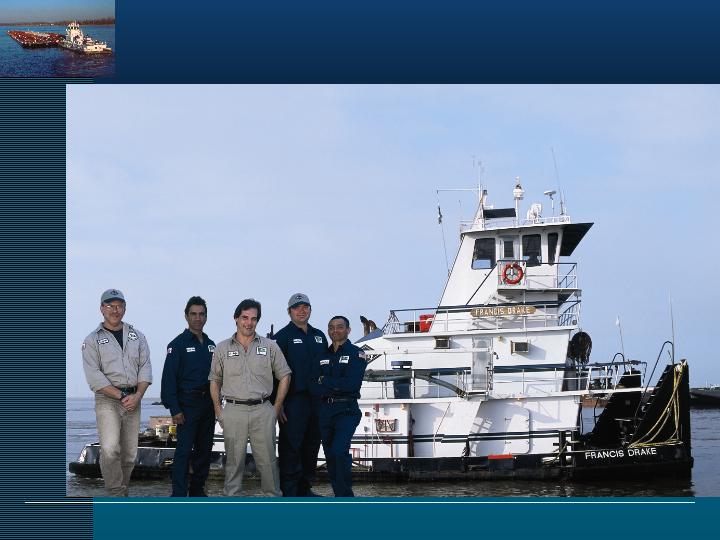
1,295 Marine Employees
468
424
307
96
Vessel Personnel Profile
Average Years of Service
Captains / Pilots
Tankermen
Engineers
12
5
13
Vessel Personnel Profile
| • | Recruit |
| – | Hirethe right people |
| – | Provide opportunity in rural areas with weak job markets |
| – | Comprehensive screening |
| • | Training and Development |
| – | Only company-owned and operated Training Center in industry |
| – | U.S. Coast Guard-approved programs |
| – | Provide safety and job skill training |
| – | Steersmen Training Program ensures lower turnover |
Recruit, Train and Retain
| • | Retain skilled personnel |
| – | Retain 30% we hire licensed from the outside |
| – | Retain 90% of the personnel we train in our program from deckhand to pilot |
Recruit, Train and Retain
Deckhand
Tankerman
Steersman
Pilot
Relief Captain
Captain
Starting salary
$29,000
As soon as 6 mos.
$31,200 to $44,300
In 2-3 years
$46,900
In 3-5 years
$71,900
In 5-10 years
$76,500
In 10 years
$82,000* Up to
$100,000 plus
bonus
$100,000 plus
bonus
Kirby Offers Excellent Benefits
| Highly competitive wages | 401(k) |
| Insurance | Disability coverage |
| Pension plan | Annual incentive bonus |
| Free training | Longevity pay* |
| Paid salary while training | Holiday pay* |
Provide Advancement
Opportunity
Opportunity

2:00 – 2:05 | Welcome and Introductions |
2:05 – 2:30 | U.S. Inland Waterways |
2:30 – 3:00 | Kirby Overview |
3:00 – 3:15 | Kirby Inland Marine · Kirby and Industry Fleet Profile |
3:15 – 3:30 | Break 15 minutes |
3:30 – 3:50 | Kirby Engine Systems Overview |
3:50 – 4:35 | Outlook for the Petrochemical Industry · Chemical Market Associates, Inc. |
4:35 – 5:20 | Refined Products Supply & Demand Drivers · Purvin & Gertz, Inc. |
5:20 – 5:25 | Closing Remarks |
Agenda
Kirby Analyst/Investor Meeting
The Diesel Engine
Service Market
Service Market

Engine Speed | Horsepower Range | Applications | Manufacturers | |
Slow Speed | Less than 400 RPM | 7,000 – 108,000 hp | Large diesel-powered ocean going tankers, cruise ships, container ships and cargo carriers | Man B&W, Sulzer, Wartsila |
Medium Speed | 400 – 1,000 RPM | 800 – 32,000 hp | Locomotives, inland towing, ocean towing, oil services, harbor towing, fishing, power generation | EMD, GE, Caterpillar/MAK, MAN B&W, Colt-Pielstick, Wartsila |
High Speed | Over 1,000 RPM | 50 – 8,375 hp | On- and off-road trucks and equipment, oil services, inland towing, power generation, locomotives | Caterpillar, Cummins, MTU, Mitsubishi, Volvo, John Deere |
Basic Diesel Engine Types
Slow Speed Diesel Engine
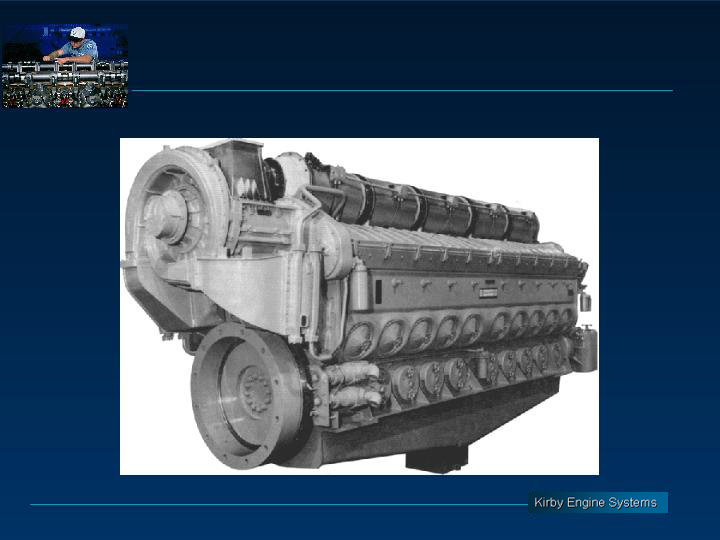
Medium Speed Diesel Engine
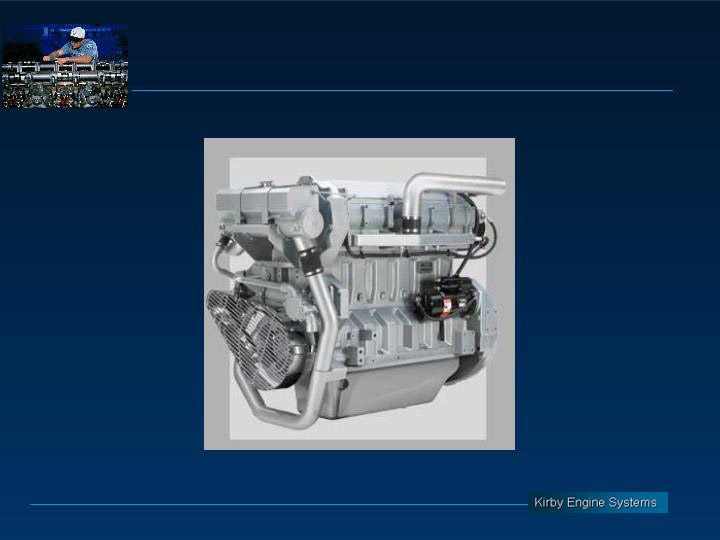
High Speed Diesel Engine
No. of Engines* | % of Outstanding Population | |
EMD | 4,500 | 39% |
Detroit Diesel | 3,300 | 29% |
Caterpillar | 2,400 | 21% |
Cummins | 1,200 | 11% |
Marine Engines
*Estimated marine engines

What We Do
| • | Sell new & remanufactured OEM parts |
| – | EMD and Alco medium speed diesel engines |
| – | Caterpillar, Cummins and Detroit Diesel high speed diesel engines in Midwest market |
| • | Provide skilled labor & specialty services |
| – | Diesel engine repairs, overhauls & rebuilding |
| – | Marine reduction gear repairs & overhauls |
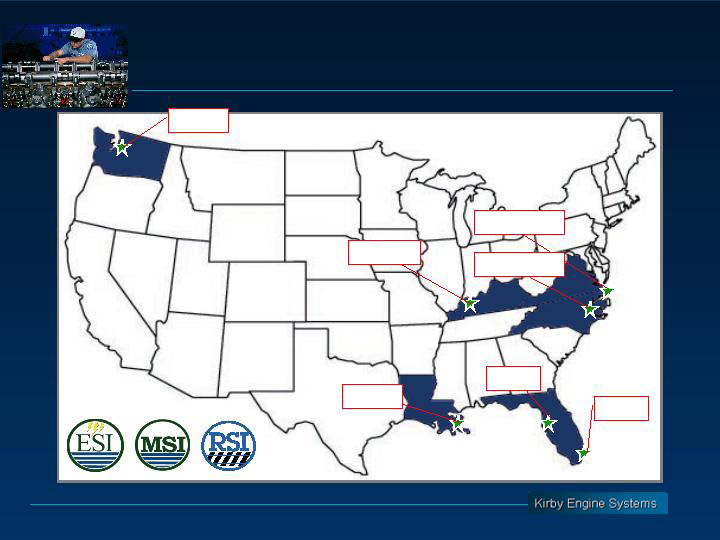
Seattle
Paducah
Houma
Chesapeake
Rocky Mount
Tampa
Miami
Facility Locations

2004 Revenue
Rail
21%
Marine
59%
Power
Generation
20%
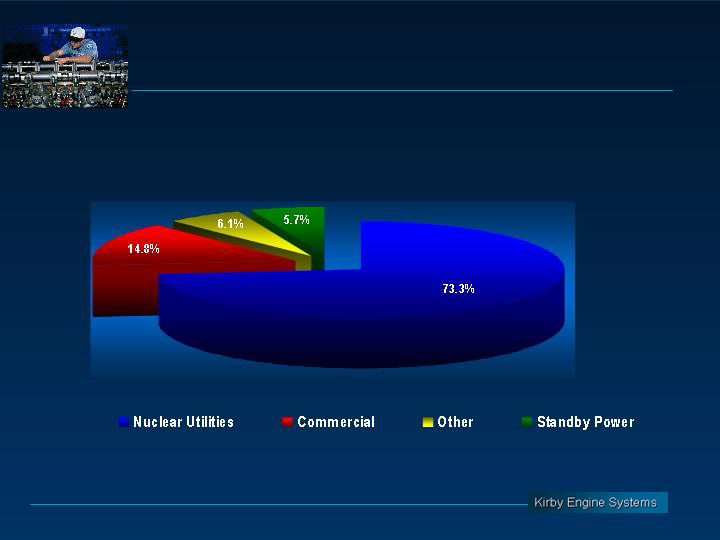
KES Primary Markets

Revenue Sources
| • | Part Sales (51%) |
| – | New parts |
| – | Nuclear parts dedication |
| – | Rebuilt parts |
| • | Services (49%) |
| – | Complete overhauls to OEM specifications |
| – | ABS certified block welding |
| – | In-place machining |
| – | Laser alignment |
| – | Troubleshooting |
| – | Preventive maintenance |
| – | Engine controls modifications |

Top Ten Customers
| • | America Electric Power (AEP) |
| • | Amtrak |
| • | Crowley |
| • | ENSCO (ESV) |
| • | Exelon (EXC) |
| • | Ingram Barge Company |
| • | Maritrans (TUG) |
| • | Moran Towing |
| • | New Jersey Transit |
| • | Tidewater, Inc. (TDW) |
59% of Total Revenue
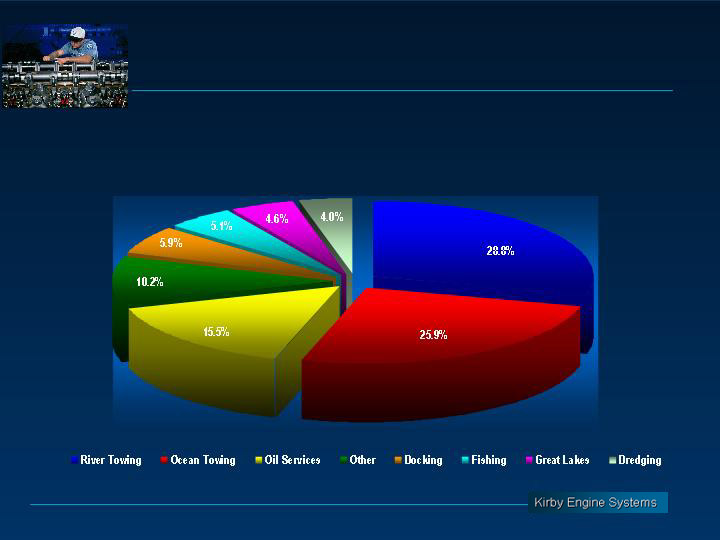
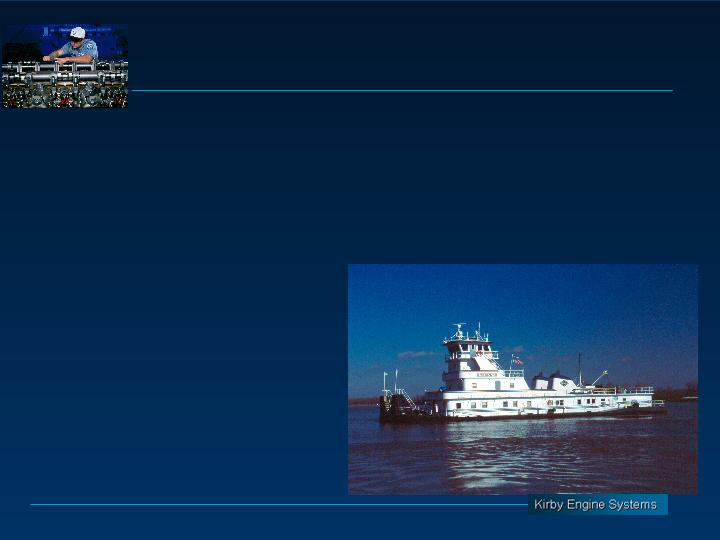
Marine Markets
Marine Market Drivers
| • | Market Drivers |
| – | Chemicals, petrochemicals, fertilizer, black oil, refined products, grain, coal, cement & steel |
| – | General import/export activity |
| • | Containers |
| • | Break bulk |
| – | Exploration and drilling |
21% of Total Revenue
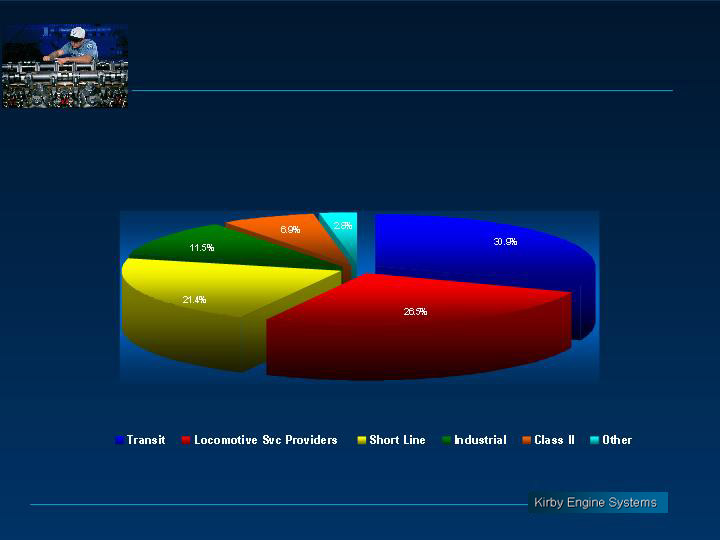
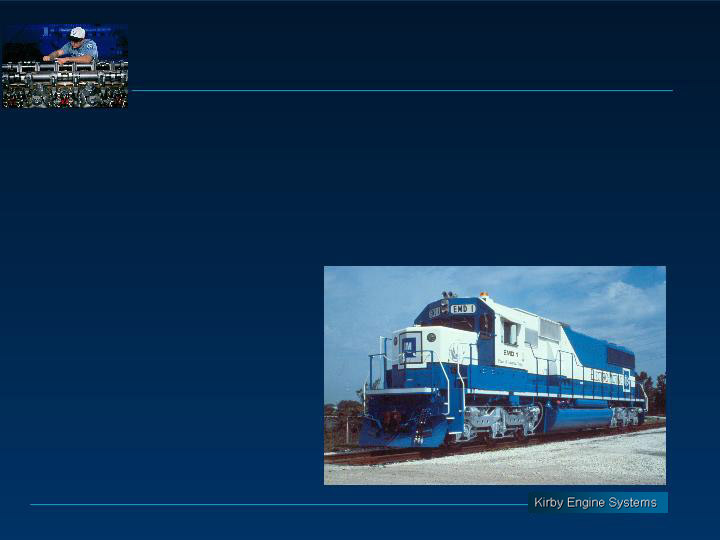
Rail Markets
Rail Market Drivers
| • | Market Drivers |
| – | Commuter demand |
| – | Chemicals, petrochemicals, fertilizer, black oil, grain, coal, cement, automotive and steel |
| – | Containers |
20% of Total Revenue
Power Generation Markets

Power Generation Market
Drivers
Drivers
| • | Market Drivers |
| – | Increasing electrical demand |
| – | Nuclear license renewals |
| – | Technology upgrades/modifications |
| – | Maintenance outsourcing |

Growth Opportunities
| • | Organic |
| – | Emissions Reduction Programs - new services to existing customers |
| – | Term Maintenance Contracts |
| • | Acquisition |
| – | Competitors |
| • | High Speed Diesel Engine Services |
| – | Engine Populations |
| • | New product lines for existing customers |
| • | New product lines for new customers |

2:00 – 2:05 | Welcome and Introductions |
2:05 – 2:30 | U.S. Inland Waterways |
2:30 – 3:00 | Kirby Overview |
3:00 – 3:15 | Kirby Inland Marine · Kirby and Industry Fleet Profile |
3:15 – 3:30 | Break 15 minutes |
3:30 – 3:50 | Kirby Engine Systems Overview |
3:50 – 4:35 | Outlook for the Petrochemical Industry · Chemical Market Associates, Inc. |
4:35 – 5:20 | Refined Products Supply & Demand Drivers · Purvin & Gertz, Inc. |
5:20 – 5:25 | Closing Remarks |
Agenda
Kirby Analyst/Investor Meeting
Outlook for Commodity
Chemicals in the United States
May 19, 2005
Presentedto:
Transportation Analyst Group
Outline
| • | 40,000 ft - Global Economic view, petrochemical cycle, new investment |
| • | 10,000 ft– Changing role of U.S. olefins industry, impact on feedstocks & derivatives |
| • | River Level– Bottom line, things are changing, but liquid movements expected to trend higher |
Chemicals & plastics markets
are in a full revival mode
Economic recovery firmly
entrenched – especially in
Asia & Americas.
The rate of new capacity
additions increasing but
remaining measured
Hyper natural gas & oil markets
maintaining high price levels
Producers leveraged their position of market strength,
improved profitability regardless of cost changes
improved profitability regardless of cost changes
Current Global Market Conditions…

Short-term Outlook Is Somewhat Tempered
Developing world healthy, Japan and Europe slowing
Geopolitical Uncertainties & High Energy are a big negative
Services Sector still very strong. Can China moderate?
Sustained by Longer-term Supporting Strengths
Monetary and Fiscal policies imply continuation
Moderately higher interest rates are still simulative
Banking Systems supportive and functioning well
International trade still gaining momentum (WTO)
Global Expansion Remains Firmly Entrenched
Recovery still responding to several stimuli
Developed Country consumption remains strong
The Economic Outlook
Next Two Years
Global GDP Growth Rates
Constant 2000 Dollars
-2
-1
0
1
2
3
4
5
6
7
8
81
83
85
87
89
91
93
95
97
99
01
03
05
07
09
Percent Change
Global
U.S.
Demand Is Robust!
Petrochemicals
Health Care
Household Goods
Rubber & Plastics
Transportation
Construction
Food &
Beverage
Beverage
Textiles
Electronics

Impact of High Energy Prices
| • | Economies have underperformed by about 0.75 points |
| • | Extreme volatility |
| • | Declining energy prices will be supportive of economic growth in 2007 - - 2009 |

Feedstock Cost: Impacts all Regions
(well, some more than others…)
(well, some more than others…)
| • | Dramatic Increase in North America with higher natural gas prices |
| • | Up in West Europe, Latin America & Asia with $50+ per barrel crude oil |
| • | Middle East remains the lowest |

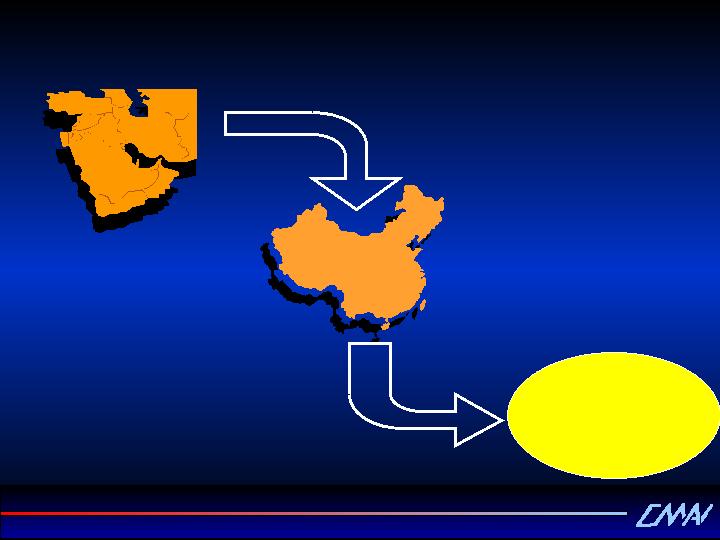
Middle East Advantage is All Natural Gas
Based
Based
$7.50/$50
$5.50/$47
$1.00/$45
$4.50
/$49
/$49
Nat Gas $/MMbtu /Crude Oil $/bbl
Ratio of Natural Gas vs. Crude Oil Price in the U.S.
40%
50%
60%
70%
80%
90%
100%
110%
120%
Environmental emphasis was not offset with sufficient supply incentives
Drilling (replacement) rates have not maintained pace - steady demand growth
Market will produce sufficient supply/demand reaction – at best, back to parity
(Conservation – Demand Switching – LNG Terminals – Northern Gas)
(Conservation – Demand Switching – LNG Terminals – Northern Gas)
Btu basis using 6 million per bbl for oil
40%
50%
60%
70%
80%
90%
100%
110%
120%
U.S. petchem industry was built on natural gas - an abundant and low cost fuel
Current Crude Oil
Current Nat Gas
U.S. Energy
Values
Values
10
15
20
25
30
35
40
45
50
55
86
87
88
89
90
91
92
93
94
95
96
97
98
99
00
01
02
03
04
05
06
07
08
09
10
0.00
1.00
2.00
3.00
4.00
5.00
6.00
7.00
8.00
9.00
($ per barrel)
($ per mmBtu)
Market Forces Will Eventually Return Energy
Prices To Fundamental Levels(Greenspan April-05)
Prices To Fundamental Levels(Greenspan April-05)
Rising crude oil prices impact
chemicals sector earnings
most severely in periods of
oversupply
chemicals sector earnings
most severely in periods of
oversupply
Strong market conditions
allow producers to pass
through rising costs (and
more), building up margins
allow producers to pass
through rising costs (and
more), building up margins
Cost push supported price
increases facilitate higher
earnings when cost fall – but
tight conditions must persist
increases facilitate higher
earnings when cost fall – but
tight conditions must persist
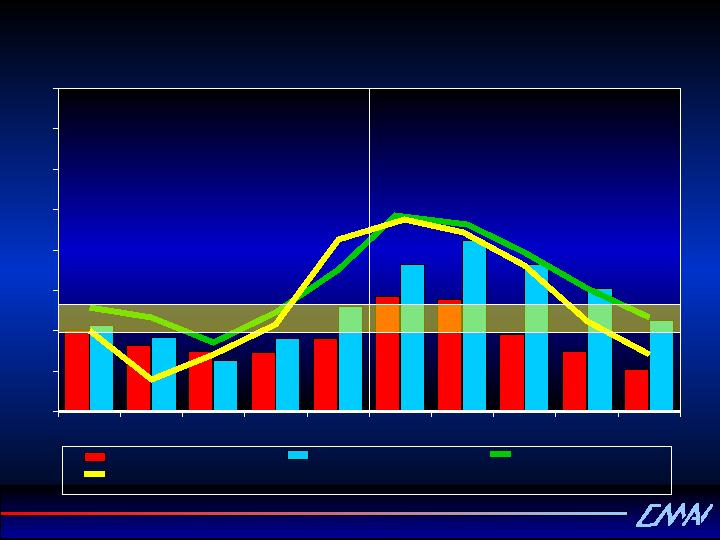
Sector Leverages High Energy Prices...
Basic Chemicals and Plastics
Annual Demand Growth
0
5
10
15
20
25
30
90
91
92
93
94
95
96
97
98
99
00
01
02
03
04
Million Metric Tons
Timing &
Duration
Duration
Ethylene
Glycol
Glycol
There now or
may not get
there
may not get
there
Remain above
for several
more years
for several
more years
From a Re-Investment Perspective
From a
Historical
Perspective
Historical
Perspective
Lower than
before
before
Higher than
previous
peaks
previous
peaks
PET
Resins
Resins
PE
Resins
Resins
PP
Resins
Resins
Ethylene
Propylene
Benzene
ECUs
Methanol
Paraxylene
Styrene
PS
Resins
Resins
PVC
Resins
Resins
Quality of
the
Earnings
the
Earnings
From a non-integrated
vantage
vantage
Up Cycle Peak Earnings Profile
Americas
Europe
Middle East/Africa
Asia Pacific
-2
0
2
4
6
8
10
Million Tons
00
01
02
03
04
05
06
07
08
09
10
Global Ethylene Capacity Growth
Global Assembly Line
Commodities to Converted Products to Retail Goods…
Growth In Chemicals
Demand Will Continue
To Outpace That Of
The World Economies
Demand Will Continue
To Outpace That Of
The World Economies
Extremely Efficient
Supply Chains Have
Been Developed -
Internationals and WTO
Very Supportive
Supply Chains Have
Been Developed -
Internationals and WTO
Very Supportive
Improving Standard Of
Living In China Has
Significantly Increase
Internal Consumption
Living In China Has
Significantly Increase
Internal Consumption
Implies That Current
Pace Of Additions Can
Be Absorbed As Long As
Restraint Continues
Pace Of Additions Can
Be Absorbed As Long As
Restraint Continues
Hydrocarbon
Value
Labor Cost
Consumer
Demand
Demand
Largest Deleterious
Impact on PE
Impact on PE

World
0.0
20.0
40.0
60.0
80.0
100.0
120.0
140.0
160.0
99
00
01
02
03
04
05
06
07
08
09
PE 3.6 / 4.9*
Ethylene Oxide 4.0 / 5.3*
EDC 2.4 / 3.2*
EBZ 3.4 / 4.1*
Others 1.2 / 3.0*
Capacity 3.6 / 4.8*
Million Metric Tons
*%AAGR 99-04 / %AAGR 04-09
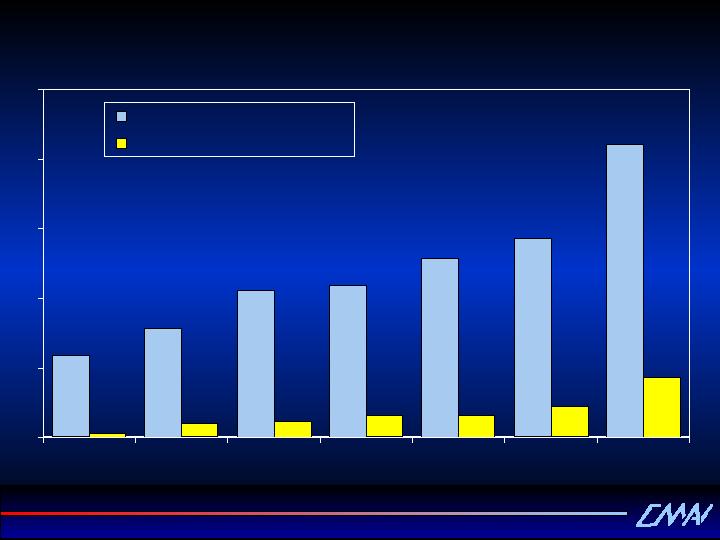
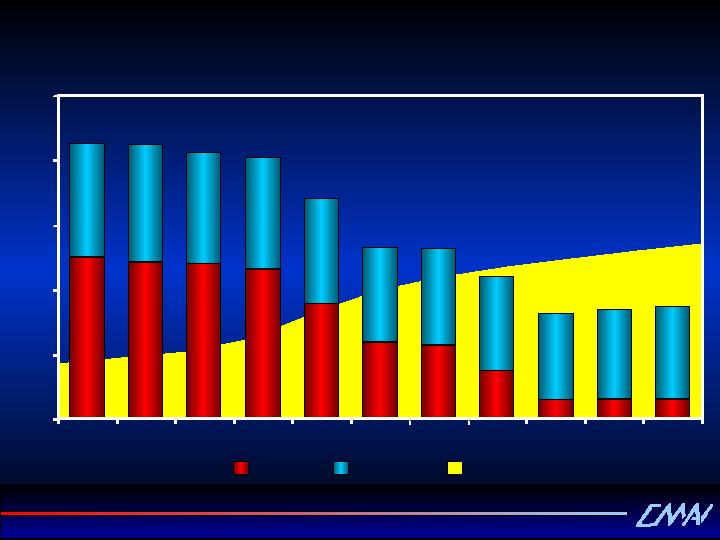
Ethylene Demand Forecast
Total Demand Growth = 4.4% AAGR 2004-09
0
100
200
300
400
500
600
700
800
00
01
02
03
04
05
06
07
08
09
Dollars Per Ton
U.S. Ethane
U.S. Light Naphtha
WEP Naphtha
NEA Naphtha
Global Ethylene Cash Margins
Ethylene Margin Outlook Very Positive
U.S. Producers Respond
by Closing or Revamping E/PUnits
Feedstock Required Per Ton of Ethylene
0.0
0.5
1.0
1.5
2.0
2.5
3.0
3.5
4.0
4.5
5.0
Ethane
Propane
Butane
Light Naphtha
Gasoil
Tons
0
0.5
1.0
1.5
2.0
2.5
3.0
Ethane
Propane
Butane
Light
Naphtha
Naphtha
Gasoil
Volume of Liquid Co-products
per Ton of Ethylene
Tons
0
5
10
15
20
25
30
1999
2000
2001
2002
2003
2004
2005
2006
2007
2008
2009
Million Tons
Ethane/Propane
Naphtha
Gas Oil
Others
Butane
U.S. Ethylene Production by Feedstock
(trend is flat to declining)
0
10
20
30
40
50
60
70
1999
2000
2001
2002
2003
2004
2005
2006
2007
2008
2009
Million Tons
Naphtha
Gas Oil
Butane
Ethane/Propane (pipeline)
U.S. Ethylene Feedstock Requirements
(heavier feedslate will require increased liquid movements)
Co-Product Yield
Avg 2.7 million
tons/yr more than
2004 baseline
tons/yr more than
2004 baseline
0
2
4
6
8
10
12
14
16
18
20
1999
2000
2001
2002
2003
2004
2005
2006
2007
2008
2009
Million Tons
Propylene
Butadiene
U.S. Propylene & Butadiene
Domestic Demand Forecast
Avg 1.0 million
tons/yr more than
2004 baseline
tons/yr more than
2004 baseline
Regional Refining & Reforming
0
5
10
15
20
25
SAM
ISC/SEA
AFR/MDE
CEP/FSU
NEA
WEP
NAM
Crude Refining Capacity
Reforming Capacity
MMBPCD
Sources: PGI/CMAI
0
5
10
15
20
25
1999
2000
2001
2002
2003
2004
2005
2006
2007
2008
2009
Million Tons
Benzene
Styrene
Cumene
Phenol
Cyclohexane
U.S. Benzene & Derivative
Domestic Demand Forecast
Avg 500 thousand
tons/yr more than
2004 baseline
tons/yr more than
2004 baseline
0
2
4
6
8
10
12
14
16
18
1999
2000
2001
2002
2003
2004
2005
2006
2007
2008
2009
Million Tons
Mixed Xylene
Paraxylene
Toluene
U.S. Xylene & Toluene
Domestic Demand Forecast
Avg 600 thousand
tons/yr more than
2004 baseline
tons/yr more than
2004 baseline

U.S. MTBE Federal Actions – Will it Pass?
| • | Federal Ban to pass eventually, but tough negotiation still required. |
| • | Energy Bill has been stalled in Congress since 2000, high priority for 2005. |
| – | Oxygen Mandate removed effective 270 days after the bill is signed |
| – | MTBE banned explicitly beginning 2015, but individual states can override and production for export expressly permitted |
| – | Renewable Fuels Standard (RFS) in 2007 (?) |
NAM
49.3%
SAM
1.6%
WEP
16.7%
CEP
6.4%
NEA
13.4
%
%
SEA
3.8%
MDE
7.7%
ISC
0.4%
AFR
0.8%
Total Demand =
16.1 Million Tons
16.1 Million Tons
2004
2009
NAM
26%
SAM
2%
WEP
12%
CEP
12%
NEA
23%
SEA
6%
AFR
1%
MDE
17%
ISC
1%
Total Demand =
10.8 Million Tons
10.8 Million Tons
Global MTBE Demand
- adopted ban prior to 2004
- adopted ban in/after 2004
- pending
States with MTBE Ban
3.1%
States with MTBE Ban
% consumption
- adopted ban prior to 2004
- adopted ban in/after 2004
- pending

31.7%
0.8%
1.1%
7.5%
States with MTBE Ban
% consumption
- adopted ban prior to 2004
- adopted ban in/after 2004
- pending
States with MTBE Ban
- adopted ban prior to 2004
- adopted ban in/after 2004
- pending
0
5
10
15
20
25
1999
2000
2001
2002
2003
2004
2005
2006
2007
2008
2009
Million Tons
MTBE
Methanol
U.S. MTBE, Methanol & Ethanol
Domestic Demand Forecast
Ethanol

Mitigating Factors Around MTBE
| • | Vast Majority of MTBE moves via pipeline |
| • | States retaining MTBE are in Gulf Coast region |
| • | MTBE ban requires greater movement of other octane components |
| • | RFS will ultimately lead to longer mid-west to coast and inter-coastal barge movement of ethanol (all forms of ethanol are prohibited in pipeline system) |
| • | Japan evaluating large ETBE requirement for Kyoto Agreement that would require several U.S. units to convert |
| • | Isobutane dehydro units will be retrofitted to iso-octane swapping out MTBE movements |

Conclusions
| • | Global petrochemical markets are enjoying a significant up-cycle |
| • | Naphtha/gas oil based ethylene production remains competitive in the industrialized regions |
| • | U.S. producers have moved towards cracking more liquids that increase both feedstock and co-product volumes and traffic |
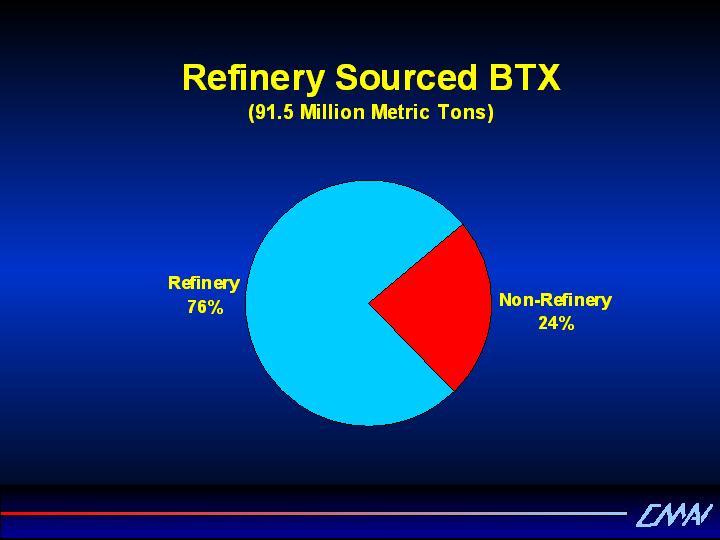
| • | Basic aromatics production is dominated by refinery sources and the U.S. remains the clear leader in supply |
| • | MTBE reductions will be largely off-set by ethanol opportunities |

2:00 – 2:05 | Welcome and Introductions |
2:05 – 2:30 | U.S. Inland Waterways |
2:30 – 3:00 | Kirby Overview |
3:00 – 3:15 | Kirby Inland Marine · Kirby and Industry Fleet Profile |
3:15 – 3:30 | Break 15 minutes |
3:30 – 3:50 | Kirby Engine Systems Overview |
3:50 – 4:35 | Outlook for the Petrochemical Industry · Chemical Market Associates, Inc. |
4:35 – 5:20 | Refined Products Supply & Demand Drivers · Purvin & Gertz, Inc. |
5:20 – 5:25 | Closing Remarks |
Agenda
Kirby Analyst/Investor Meeting
U.S. Refining Industry Outlook
Bill Sanderson
May 19, 2005

Agenda
| Ø | U.S. Economic and Product Demand Outlook |
| Ø | Refining Industry Outlook |
| Ø | Regional Product Movements |
Percent Annual Growth
Note: GDP forecast provided by CMAI.
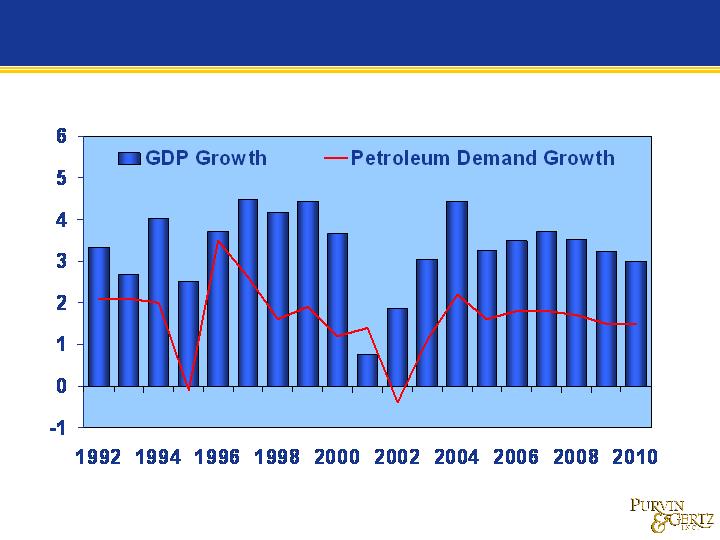
U.S. GDP and petroleum demand growth are
expected to remain strong short-term . . ..
expected to remain strong short-term . . ..
2005 – 2010
Year-to-Year Change, Thousand B/D
U.S. refined product demand is expected to
stay strong through this economic cycle . . ..
stay strong through this economic cycle . . ..

Will gasoline demand growth slow down
longer term?
longer term?
| Ø | Higher prices are beginning to affect consumer choices |
| § | Large SUV sales are beginning to fall |
| § | Hybrid sales are beginning to gain acceptance |
| Ø | In our view, policy and market factors are likely to increase vehicle efficiency after 2010 |
| Ø | Greenhouse Gas control may eventually become a U.S. regulatory goal, but not yet |
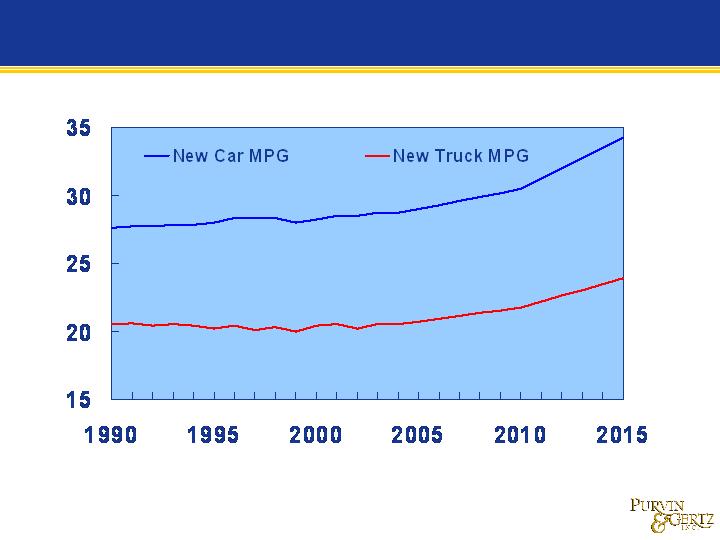
Note: Average U.S. new car efficiency
Miles per Gallon
Technology, policy and market factors expected
to increase new vehicle efficiency long-term ...
to increase new vehicle efficiency long-term ...
Five-Year Demand Change (Millions of B/D)
Gasoline demand to stay strong through 2010.
Diesel/jet fuel demand will remain strong . . .
Diesel/jet fuel demand will remain strong . . .
MTBE
Ban
(Cal.
and NY)
Low
Sulfur
Diesel
(15 ppm)
Low
Sulfur
Gasoline
(30 ppm)
(Tier 2)
Carbon taxes or
emissions controls?
2000-2006
2006-2010
Regulatory changes will continue to strongly
influence U.S. refining and distribution . .. .
influence U.S. refining and distribution . .. .
Renewable Fuel Requirements
MTBE Phaseouts
Increasing Vehicle Efficiency
Zero-sulfur fuels?
2010 +

Gasoline quality will continue improving . . .
| Ø | Sulfur is being reduced to 30 ppm |
| § | Sulfur poisons automobile emissions catalysts |
| § | Sulfur reductions provide … |
| • | Immediate emissions reduction impact on entire fleet |
| • | NOx trap capability |
| Ø | MTBE and Ethanol use will change |
| § | Nationwide MTBE ban expected, with many states moving more quickly |
| § | RFG oxygen mandate expected to disappear |
| § | Renewable mandate expected to boost ethanol |
| § | Current Energy Bill contains all these elements |

Both programs will affect the refining and
distribution industries . . ..
distribution industries . . ..
Gasoline Supply and Cost Impacts
Diesel Supply and Cost Impacts
| Ø | Upgrading of existing desulfurization capacity most common |
| Ø | May tighten international low-sulfur markets |
| Ø | Distribution, contamination issues remain unresolved |
| Ø | Recovery of ULSD costs of 5.0-6.0 cpg (vs 0.2%) expected |
| Ø | Refining investment to offset octane loss |
| Ø | Potential import reductions from non-complying suppliers |
| Ø | Increased domestic gasoline trade |
| Ø | Reduction in finished product distribution flexibility |

| Ø | Strong U.S. petroleum demand growth should continue through 2010 |
| Ø | Vehicle efficiency gains expected to reduce growth after the turn of the decade |
| Ø | Diesel growth will be stronger than gasoline |
| Ø | Refining capacity should remain tight for several years, due to investment lag times and focus on clean fuels compliance |
| Ø | Strong demand for U.S. product trade expected to continue in the near-term |
Supply/Demand Conclusions
Agenda
| Ø | U.S. Economic and Product Demand Outlook |
| Ø | Refining Industry Outlook |
| Ø | Regional Product Movements |
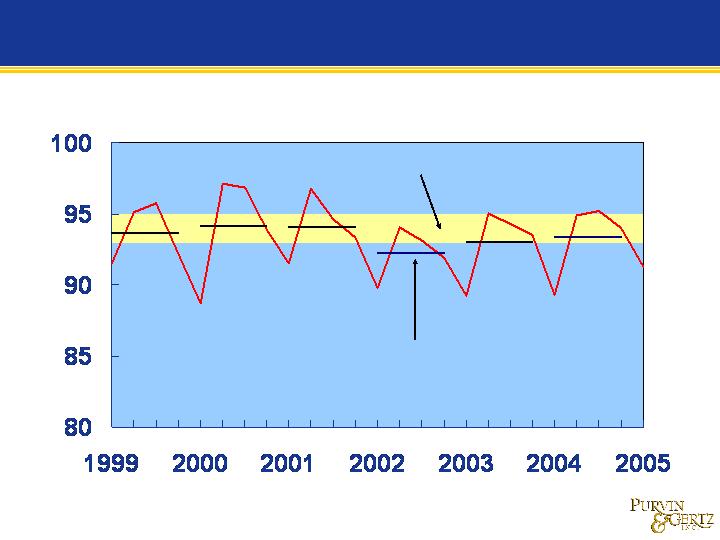
U.S. Refinery Utilization of Operating Capacity, %
Maximum Sustainable Capacity
Annual Average
Note: Figures are distillation capacity utilization for operating refineries.
U.S. refinery utilization has been operating at
or near capacity since the late 1990s . . .
or near capacity since the late 1990s . . .
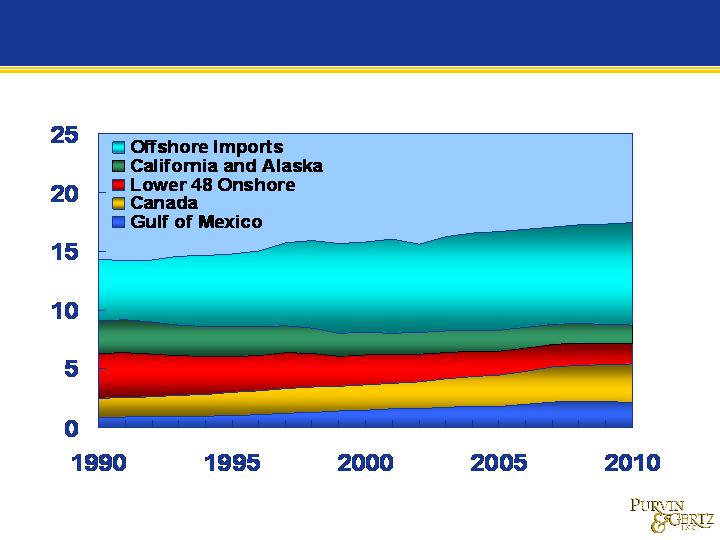
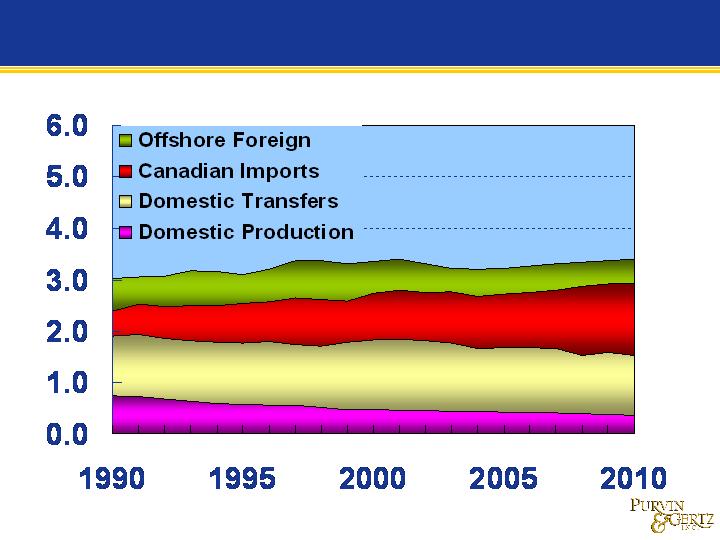
U.S. Crude Supplies by Source – Million B/D
Growth in crude oil supplies will be sourced by
offshore imports and Canadian supplies .. . .
offshore imports and Canadian supplies .. . .
V
IV
III
II
I
The U.S. market is divided into five Petroleum
Administration for Defense Districts (PADDs) . . .
Administration for Defense Districts (PADDs) . . .
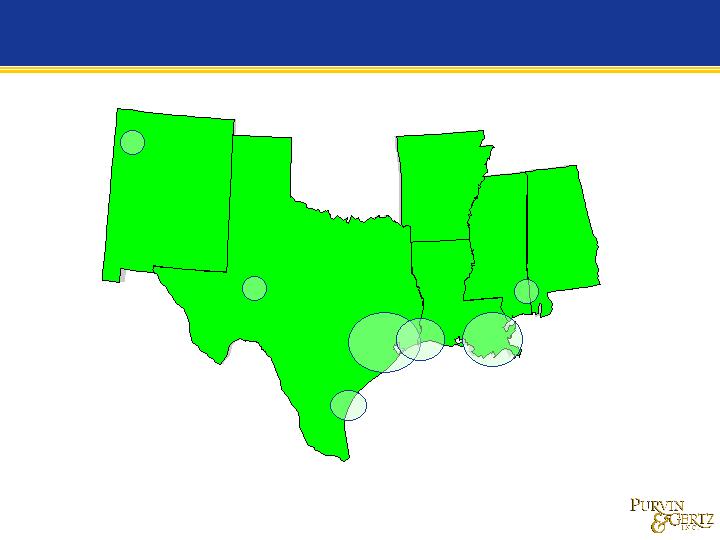
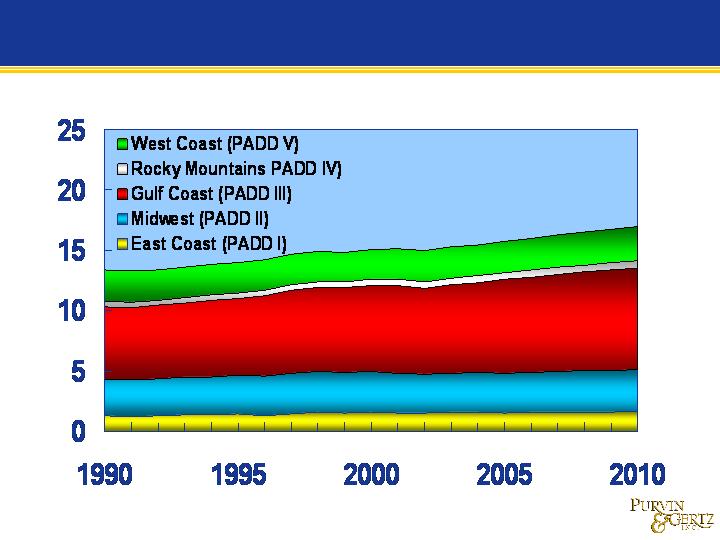
PADD III includes the U.S. Gulf Coast which is
the largest refining region in the U.S. .. . .
the largest refining region in the U.S. .. . .
740
2,270
1,770
2,130
Total PADD III Distillation Capacity = 8.2 Million B/D
590
Note: Figures are distillation capacity for operating refineries in ‘000 B/D.
570
120
Crude Runs by Region - Million Barrels per Day
The Gulf Coast (PADD III) is the largest refining
region, at roughly 50% of the U.S. total . . .
region, at roughly 50% of the U.S. total . . .
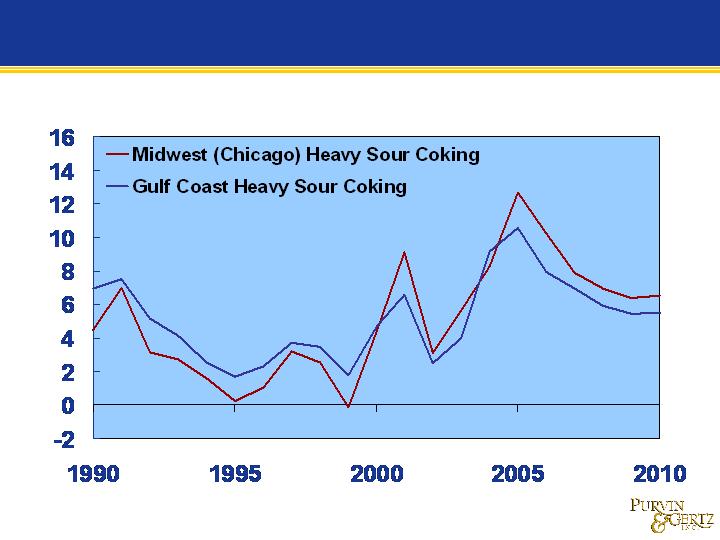
Gulf Coast Crude Oil Runs by Source, Million B/D
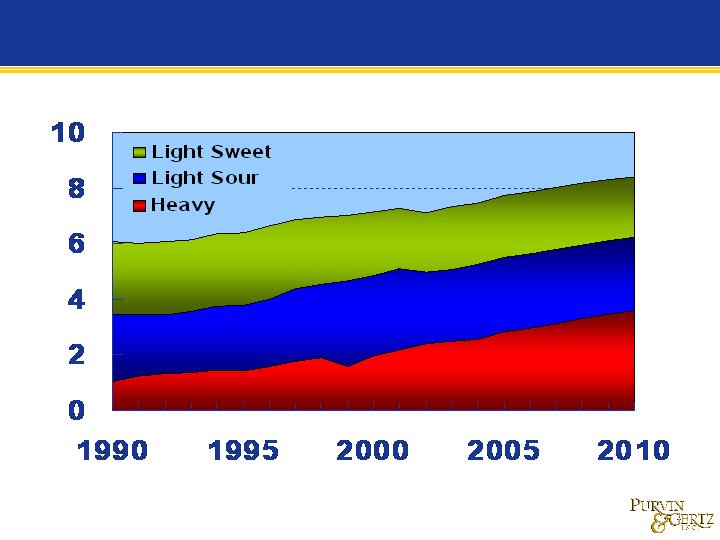
Gulf Coast (PADD III) crude runs will continue to
become heavier, driving refining investment ...
become heavier, driving refining investment ...
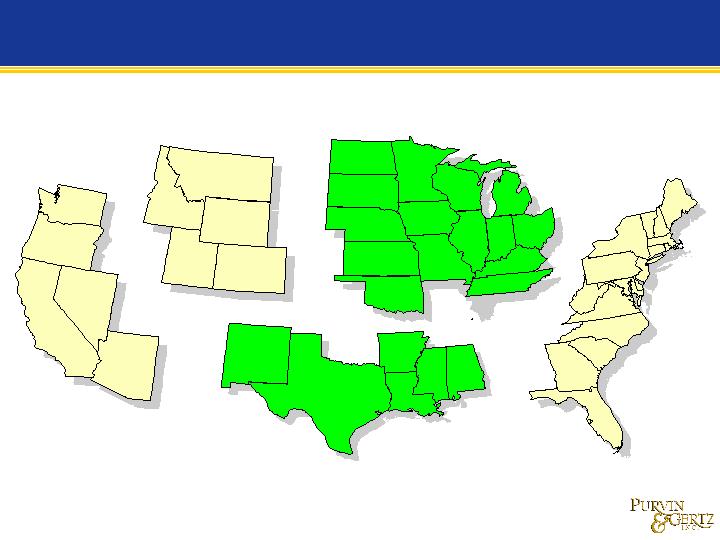
Midcontinent
Upper Midwest
Midwest
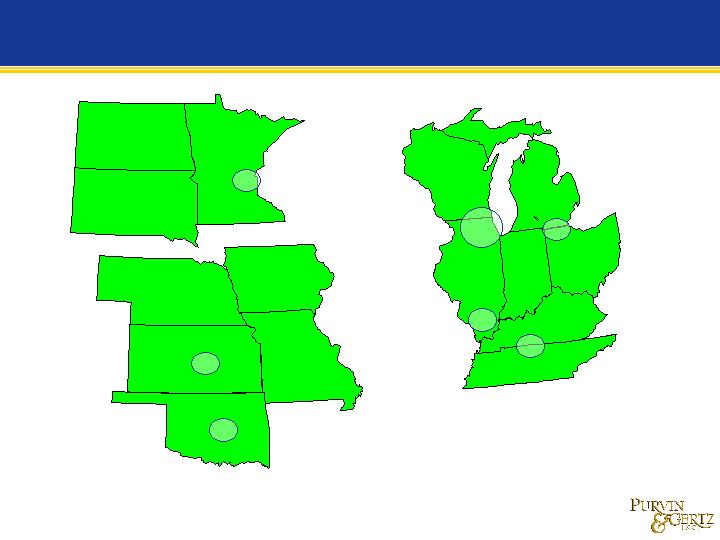
PADD II includes a number of sub-regions
comprised of smaller, local refining centers .. . .
comprised of smaller, local refining centers .. . .
Note: Figures are distillation capacity for operating refineries in ‘000 B/D.
Total PADD II Distillation Capacity = 3.6 Million B/D
400
420
870
500
600
300
490
Midwest Crude Oil Runs, Million B/D
Midwest (PADD II) crude supply balance
reflects growth of Canadian production . . ..
reflects growth of Canadian production . . ..
Midwest Crude Oil Runs, Million B/D
Midwest crude runs become heavier requiring
conversion capacity investment . . ..
conversion capacity investment . . ..
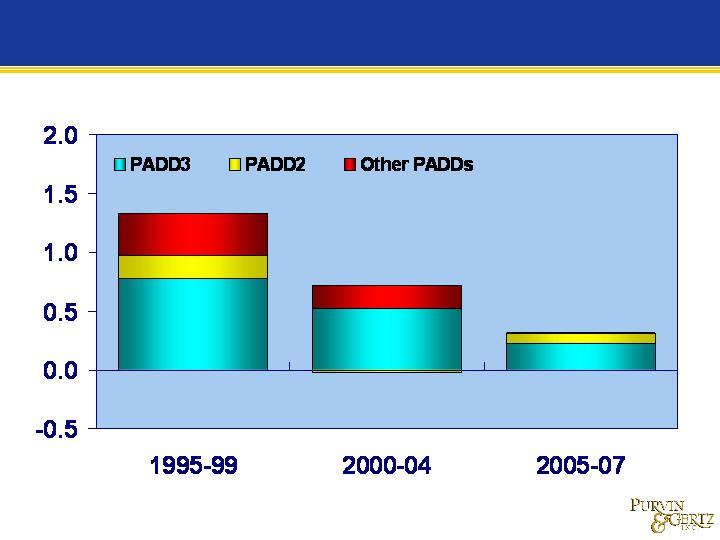
U.S. Refinery Distillation Capacity Changes
Thousand B/D of Capacity (Announced projects, excludes creep)

Million Barrels per Day
U.S. gasoline imports are expected to increase
until demand begins to slow late in decade . . .
until demand begins to slow late in decade . . .
Forecast in Constant 2005 Dollars per Barrel
Comparable Gulf Coast and Midwest margins
track relatively well due to market factors . .. .
track relatively well due to market factors . .. .
Agenda
| Ø | U.S. Economic and Product Demand Outlook |
| Ø | Refining Industry Outlook |
| Ø | Regional Refined Product Movements |
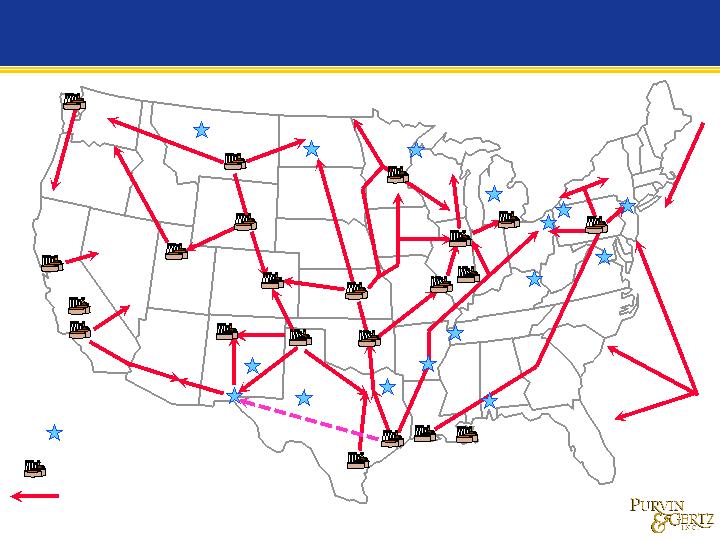
Refinery
Refining Centers
Refined product pipelines help integrate the
U.S. market . . .
U.S. market . . .
Refined Product Transportation
Routes
Routes
Refinery
Refining Centers
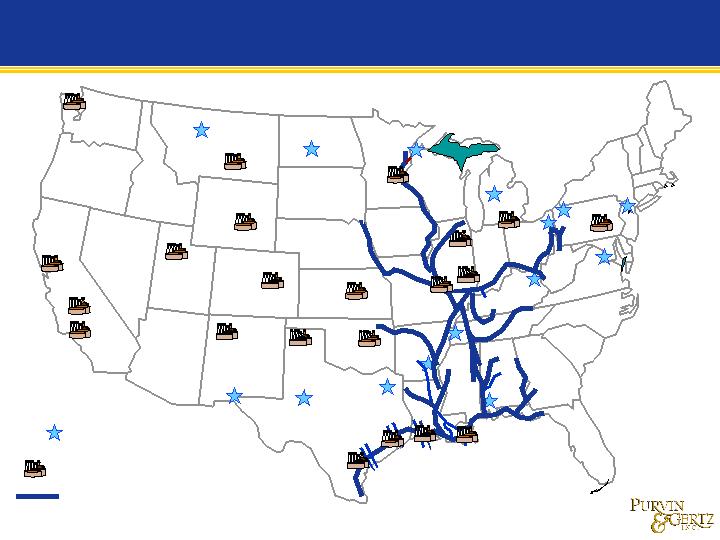
But the inland waterway system remains
crucial in supplying certain markets . . ..
crucial in supplying certain markets . . ..
Inland Waterways
About 65% of PADD III products move to
consumers in PADDS I and II . . ..
consumers in PADDS I and II . . ..
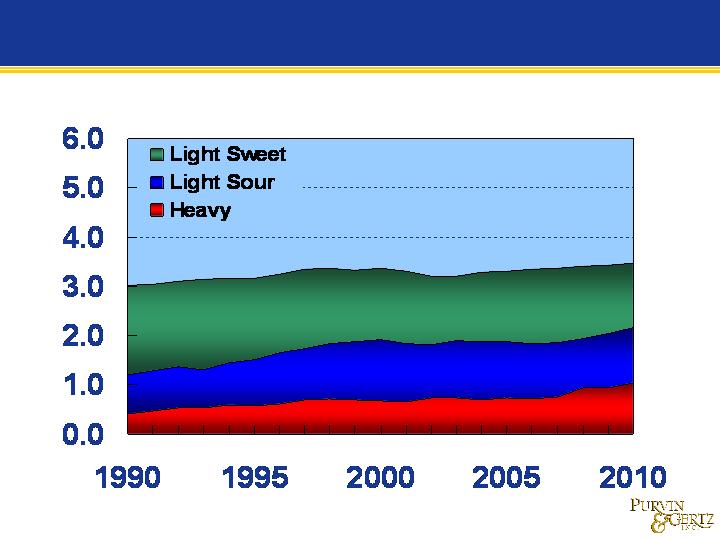
PADD III Production
Major Light Products - Million B/D
Note: Major light products include gasoline, jet fuel and diesel fuels.
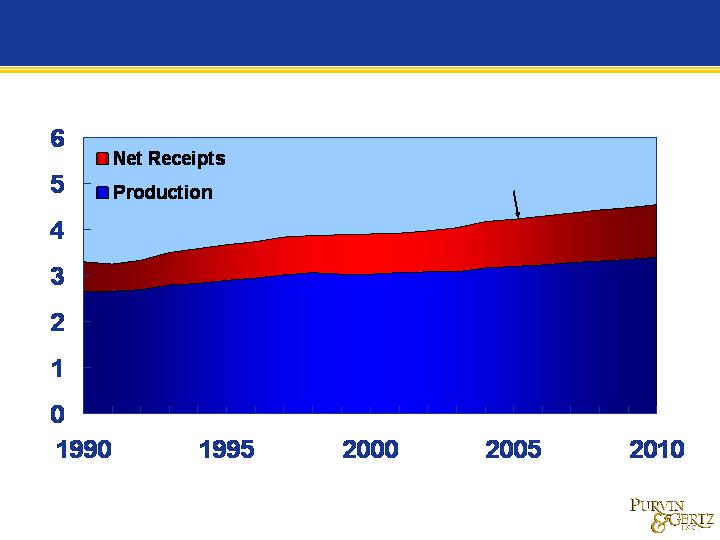
PADD II depends on PADD III for over 20% of
the total light product supply . . ..
the total light product supply . . ..
Major Light Products - Million B/D
PADD II Consumption
Note: Major light products include gasoline, jet fuel and diesel fuels.
PADD II receives large volumes of all light
refined products from PADD III . . ..
refined products from PADD III . . ..
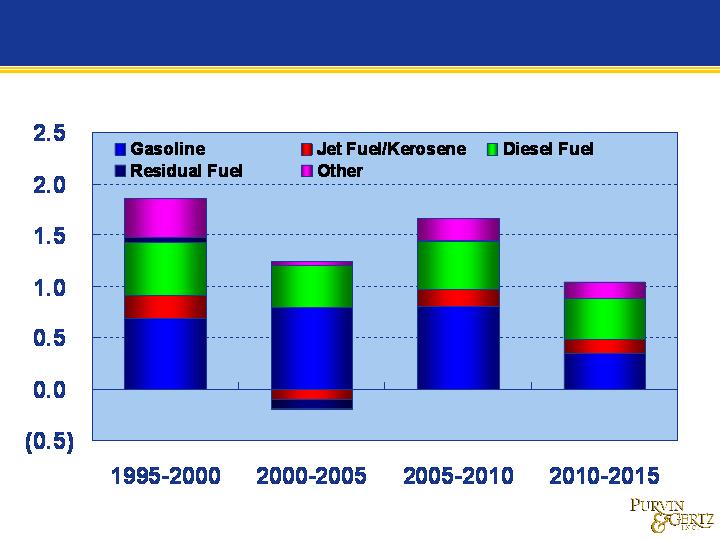
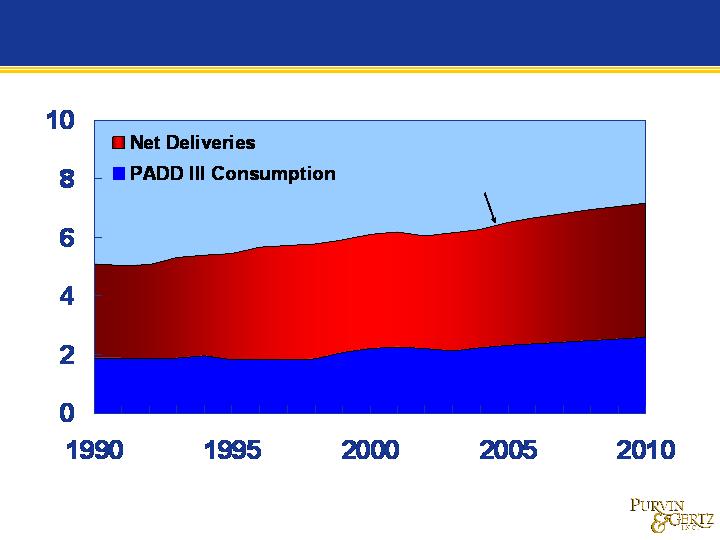
PADD II Net Receipts - Million B/D
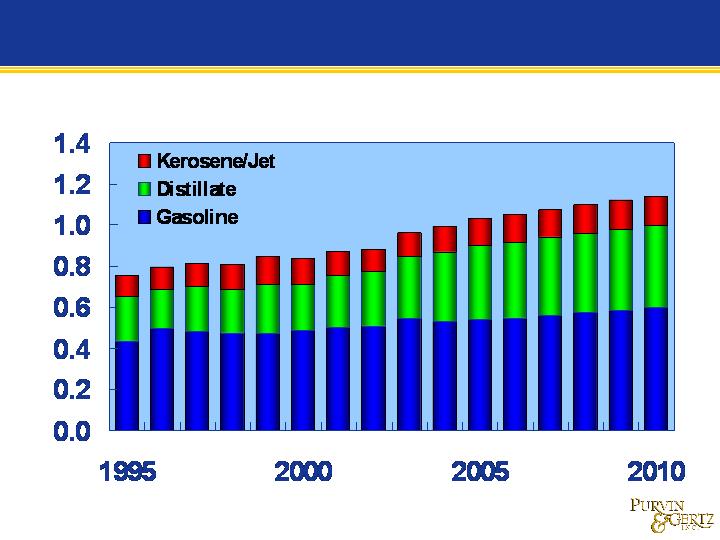
Most light products move to PADD II by
pipeline . . .
pipeline . . .
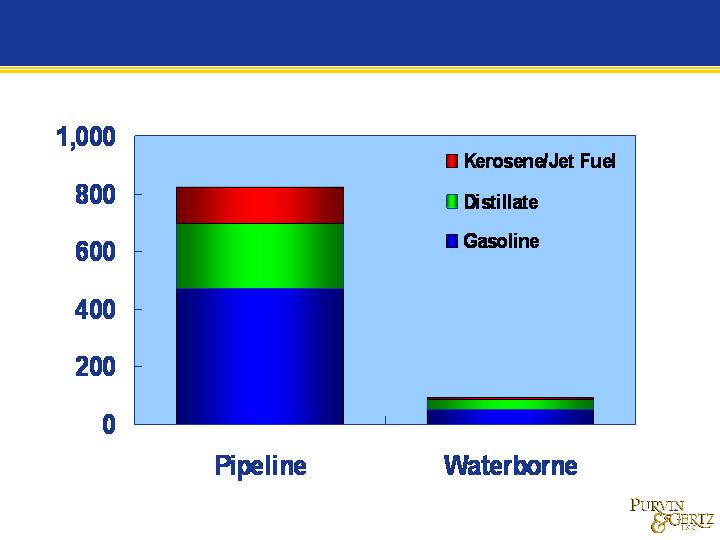
Thousand B/D
Note: Product movements from PADD III to PADD II in 2004.
Thousand B/D
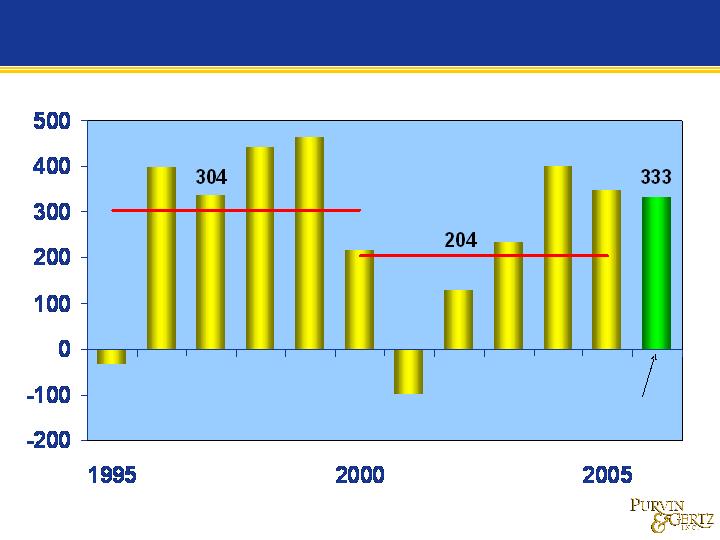
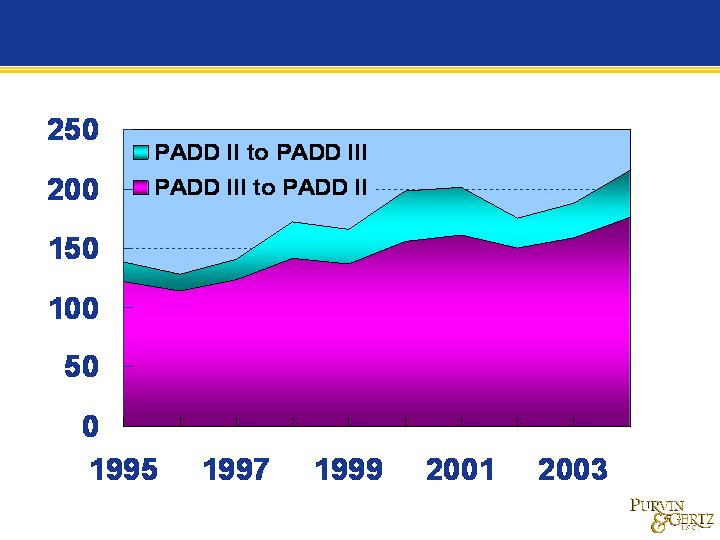
Waterborne commerce between PADD III and
PADD II has increased steadily . . ..
PADD II has increased steadily . . ..
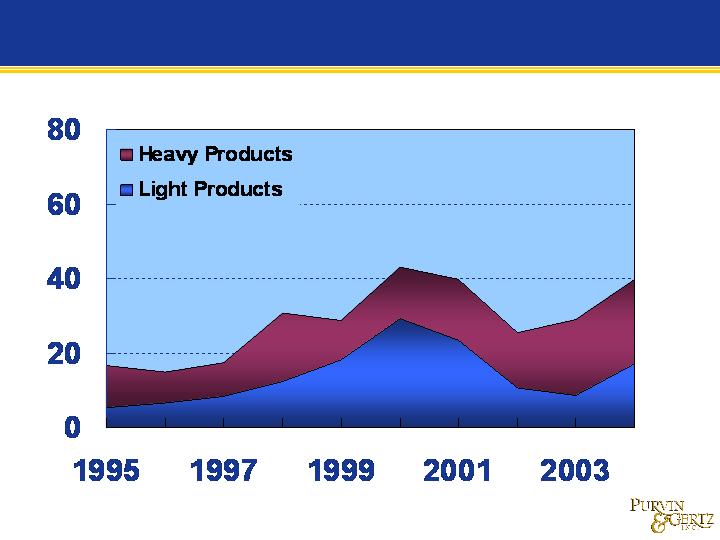
Note: Waterborne product movements from PADD III to PADD II.
Thousand B/D
Movements from PADD III are primarily light
products . . ..
products . . ..
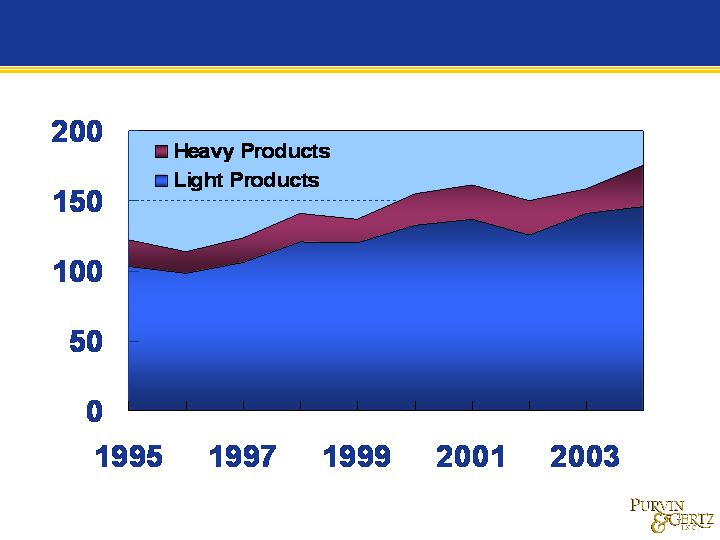
Note: Waterborne product movements from PADD II to PADD III.
Thousand B/D
PADD II generally moves out surplus heavy
products by water, some light products move .. . .
products by water, some light products move .. . .
Thousand B/D
Note: Waterborne movements from PADD II to PADD III. Figures for 2004
are estimated.
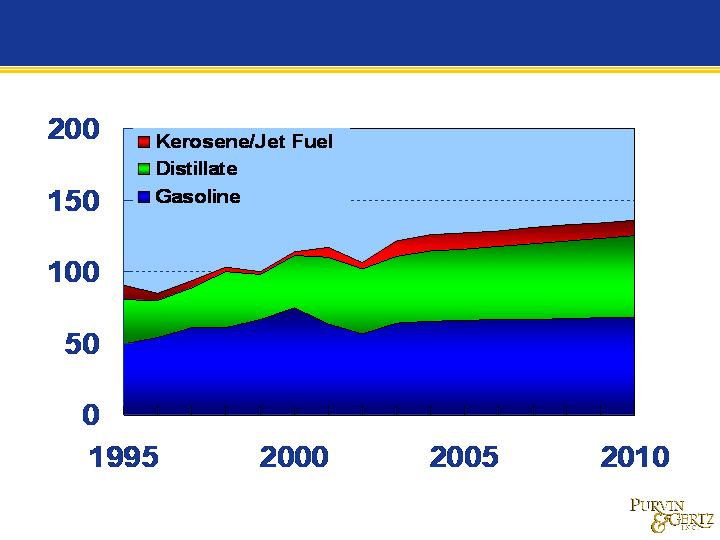
Waterborne light product movements from
PADD III to PADD II are projected to grow . . ..
PADD III to PADD II are projected to grow . . ..
Note: Waterborne movements from PADD II to PADD III. Figures for 2004
are estimated.
Thousand B/D
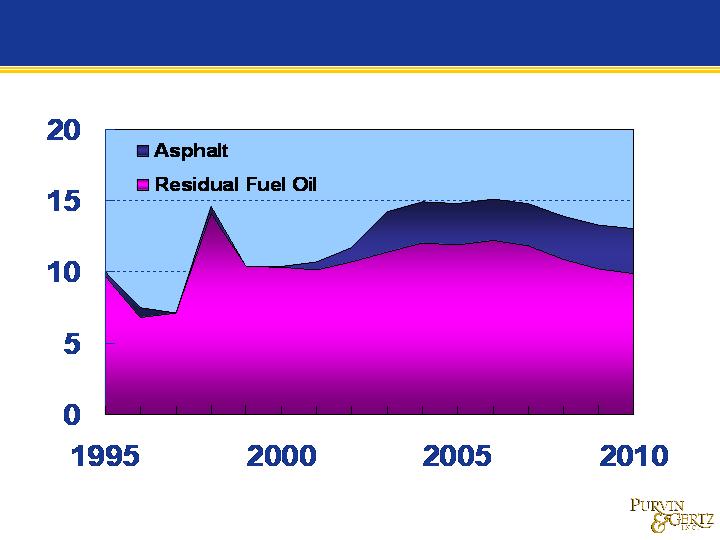
PADD II will remain in surplus for residual fuel
and asphalt . . ..
and asphalt . . ..

Conclusions
| Ø | Continued demand growth in PADD II will require additional movements to markets served by the inland waterway system |
| Ø | Growing heavy crude processing in PADD II will increase the local surplus of asphalt and residual fuel |

This analysis has been prepared for the sole benefit of Kirby Corporation. Neither the analysis nor any part of the analysis shall be provided to third parties without the written consent of Purvin & Gertz. Any third party in possession of the analysis may not rely upon its conclusions without the written consent of Purvin & Gertz. Possession of the analysis does not carry with it the right of publication.
Purvin & Gertz conducted this analysis utilizing reasonable care and skill in applying methods of analysis consistent with normal industry practice. All results are based on information available at the time of review. Changes in factors upon which the review is based could affect the results. Forecasts are inherently uncertain because of events or combinations of events that cannot reasonably be foreseen including the actions of government, individuals, third parties and competitors. NO IMPLIED WARRANTY OF MERCHANTABILITY OR FITNESS FOR A PARTICULAR PURPOSE SHALL APPLY.
Some of the information on which this analysis is based has been provided by others. Purvin & Gertz has utilized such information without verification unless specifically noted otherwise. Purvin & Gertz accepts no liability for errors or inaccuracies in information provided by others.
Terms and Conditions

U.S. Refining Industry Outlook
Bill Sanderson
May 19, 2005

2:00 – 2:05 | Welcome and Introductions |
2:05 – 2:30 | U.S. Inland Waterways |
2:30 – 3:00 | Kirby Overview |
3:00 – 3:15 | Kirby Inland Marine · Kirby and Industry Fleet Profile |
3:15 – 3:30 | Break 15 minutes |
3:30 – 3:50 | Kirby Engine Systems Overview |
3:50 – 4:35 | Outlook for the Petrochemical Industry · Chemical Market Associates, Inc. |
4:35 – 5:20 | Refined Products Supply & Demand Drivers · Purvin & Gertz, Inc. |
5:20 – 5:25 | Closing Remarks |
Agenda
Kirby Analyst/Investor Meeting

| • | Fundamentals have not been this good in 25 years |
| • | Business will continue to consolidate. Kirby is best positioned company to be the consolidator. |
| • | Strong free cash flow |
| • | Great operating leverage |
| • | Age profile of fleet provides hedge against over building |
| • | Best transportation franchise around |
Why is Kirby a Good
Investment?
Investment?