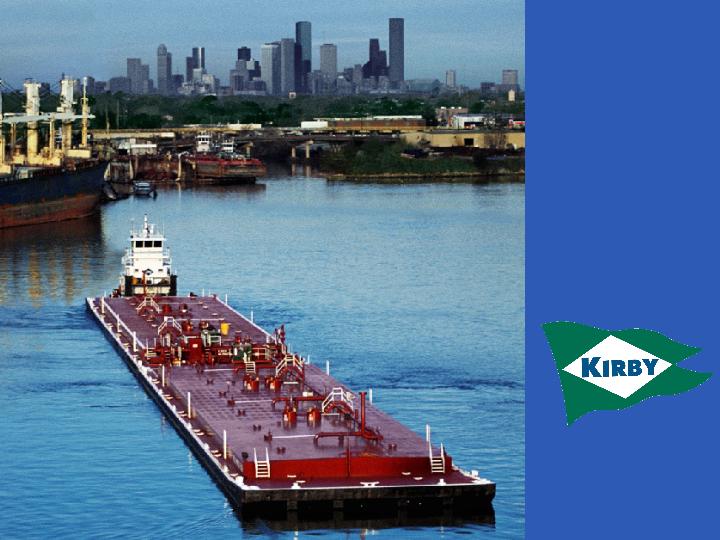
Kirby Corporation
Putting America’s Waterways to Work
NYSE: KEX
February 2006
Statements contained in this presentation with respect to the future are forward-looking statements. These statements reflect management’s reasonable judgement with respect to future events. Forward-looking statements involve risks and uncertainties. Actual results could differ materially from those anticipated as a result of various factors, including cyclical or other downturns in demand, significant pricing competition, unanticipated additions to industry capacity, changes in the Jones Act or in U.S. maritime policy and practice, fuel costs, interest rates, weather conditions and the timing, magnitude and the number of acquisitions made by Kirby. Forward-looking statements are based on currently available information and Kirby assumes no obligation to update such statements. A list of additional risk factors can be found in Kirby’s annual report on Form 10-K for the year ended December 31, 2004, filed with the Securities and Exchange Commission.
Kirby reports its financial results in accordance with generally accepted accounting principles (GAAP). However, Kirby believes that certain Non-GAAP financial measures are useful in managing Kirby’s businesses and evaluating Kirby’s performance. This presentation contains two Non-GAAP financial measures, adjusted net earnings and EBITDA. Please see the Appendix for a reconciliation of GAAP to Non-GAAP financial measures.
Forward Looking Statement
Non-GAAP Financial Measures
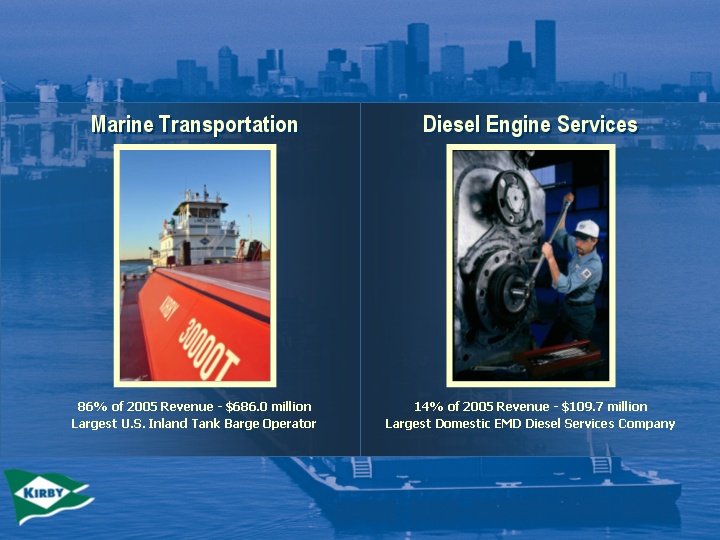
Kirby... Business Operations
NYSE: K E X
Current Price (February 13, 2006) | $54.67 |
Number of Shares O/S | 26.2M |
Market Capitalization | $1,435M |
Debt (December 31, 2005) | $200M |
Enterprise Value | $1,635M |
Employees | 2,400 |
Kirby…Public Market Facts
Kirby Facts
•
Largest inland tank barge operator
•
Operates 897 barges and 242 towing vessels
•
Sustainable competitive advantages:
–
Lowest cost due to economies of scale
–
Best positioned for growth opportunities
–
“One Stop Shop” for customers
•
70% of Kirby’s business is under contract,
30% spot market
•
Successful integration of 24 acquisitions
Towboats Only
Date | No. of
Tank
Barges | Description |
1986 | 5 | Alliance Marine |
1989 | 35 | Alamo Inland Marine Co. |
1989 | 53 | Brent Towing Company |
1991 | 3 | International Barge Lines, Inc. |
1992 | 38 | Sabine Towing & Transportation Co. |
1992 | 26 | Ole Man River Towing, Inc. |
1992 | 29 | Scott Chotin, Inc. |
1992 | | South Texas Towing |
1993 | 72 | TPT, Division of Ashland |
1993 | | Guidry Enterprises |
1993 | 53 | Chotin Transportation Company |
1994 | 96 | Dow Chemical (transportation assets) |
Date | No. of
Tank
Barges | Description |
1999 | 270 | Hollywood Marine, Inc. Stellman Alamo Barge Lines Ellis Towing Arthur Smith Koch Ellis Mapco |
2002 | 15 | Cargo Carriers |
2002 | 64 | Coastal Towing, Inc. (barge
management agreement for 54
barges) |
2002 | 94 | Dow/Union Carbide (transportation
assets) |
2003 | 64 | SeaRiver Maritime (ExxonMobil) |
2005 | 10 | American Commercial Lines (black oil
fleet) |
Shipper Owned (Blue)
Independent (Red)
Acquisitions in Core Business
17% growth
rate from
1988-2005
Revenue... Business Operations
1994-2001 adjusted to exclude goodwill amortization expense
2002 adjusted to exclude impairment charges of $12.5 million, net of taxes, or $.51 per share
See Appendix for reconciliation of GAAP to Non-GAAP earnings per share
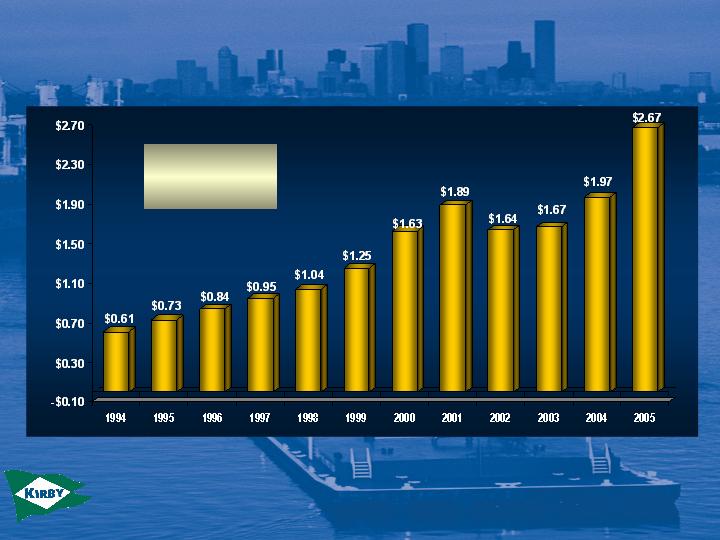
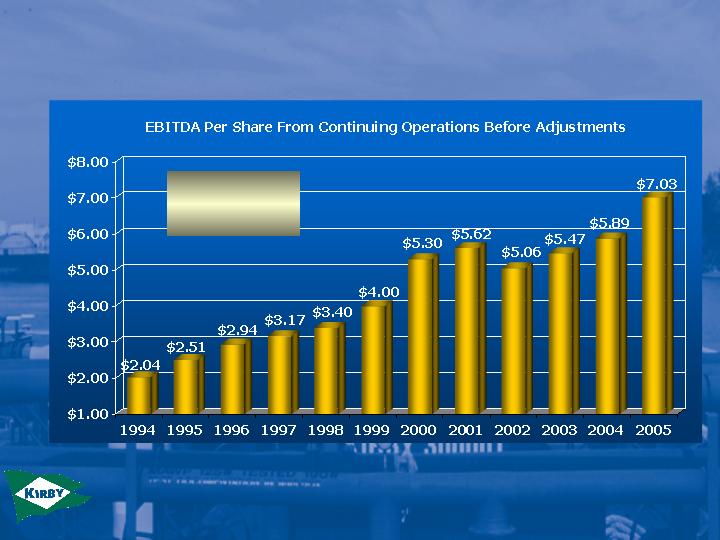
14.4% growth
rate from
1994 - 2005
Earnings Per Share From Continuing Operations Before Adjustments
Earnings Per Share…
St. Paul
Sioux City
Chicago
Pittsburgh
Charleston
St. Marks
Tulsa
Corpus Christi
New Orleans
St. Louis
Cincinnati
Mobile
Brownsville
Houston
Texas and Louisiana
account for
80% of the
total U.S. production of
chemicals and
petrochemicals
12,000 miles of navigable
waterways linking America’s
heartland to the world
Kirby is one of the few
operators offering distribution
throughout the Mississippi
River System and Gulf
Intracoastal Waterway
Putting America’s Waterways to Work
Inland Waterway System
Industry Facts
•
Approximately 18,300 dry cargo barges, 2,800 liquid tank
barges. Kirby in the liquid cargo business only.
•
No competition from foreign companies due to a U.S. law
known as the Jones Act
•
Always a market to move product by barge on inland
waterways
•
Equipment not subject to economic obsolescence because
draft and lock restrictions limit the size of barges
•
Barges are mobile, carry wide range of cargoes, and service
different geographic markets
•
Inland waterway system plays a vital role in the U.S. economy
•
Inland waterway system is an environmentally friendly mode
of transportation
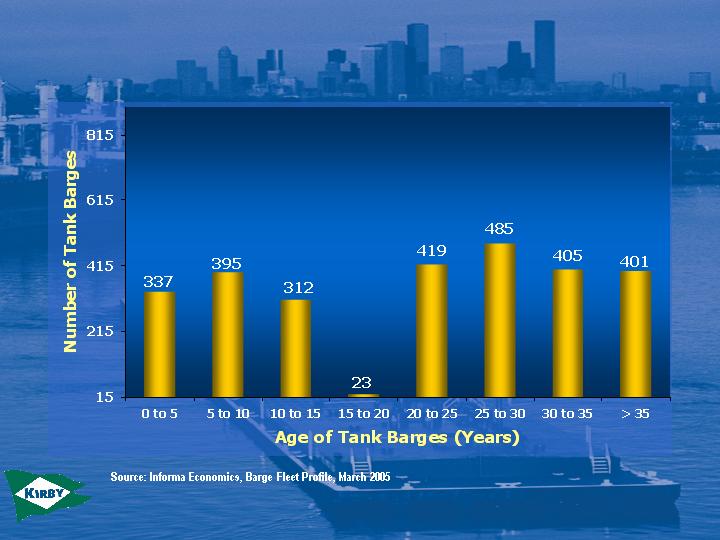
For the years 1993 through 2004
Number of Inland Tank Barges
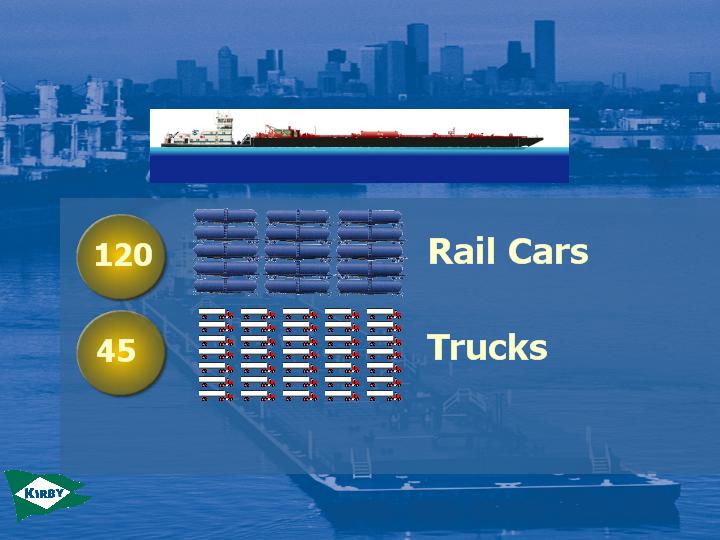
90,000 bbl. three-barge tow is equivalent to:
Kirby’s fleet capacity of 16.7 million bbls. equates
to 83,500 trucks, or 22,200 rail cars
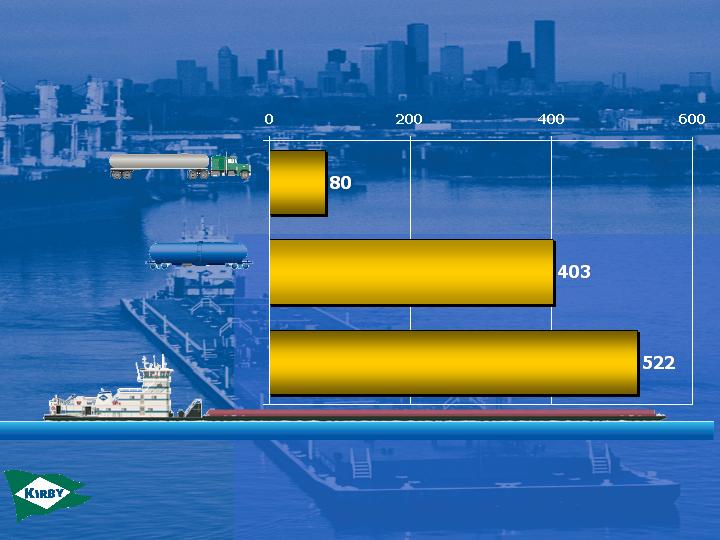
Barges Compete Successfully
With Rails and Trucks
One gallon of fuel in a barge can move one ton of freight 522 miles,
compared to 403 miles by rail and only 80 miles for a truck.
Barge
Rail
Truck
Barges…
Efficient
While moving one ton of freight 1,000 miles:
•
Smog is a major problem in most major cities
•
Oxides of nitrogen are the chemicals that produce smog
Trains produce 3.5 times as much oxides of
nitrogen as barges
Trucks produce 19 times as much oxides of
nitrogen as barges
Barges…
Environmentally Friendly
Largest Inland Tank Barge
Operator
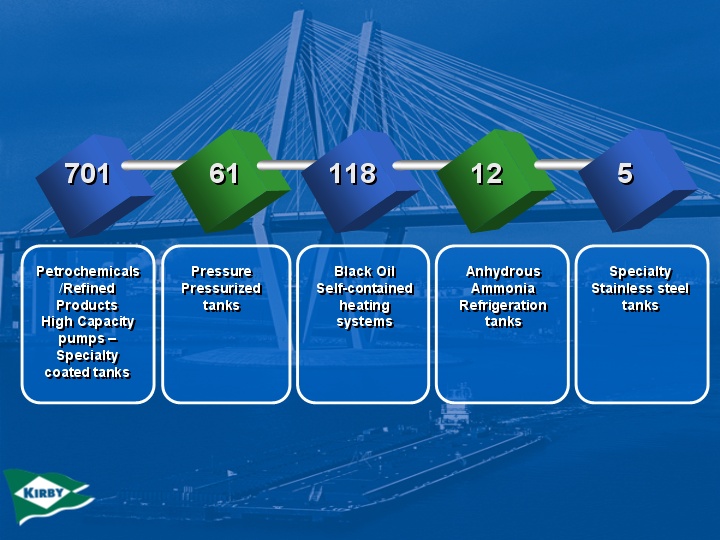
High Tech and Diverse Fleet
897 Active Tank Barges
Fleet Size and Diversity…
Better Asset Utilization
•
Better Asset Utilization
–
More backhaul
opportunities
–
Faster barge
turnarounds
–
More efficient use of
horsepower
–
Barges positioned
closer to cargos
•
Lower Incremental Costs
–
Enhanced purchasing
power
–
Minimal incremental
G&A from fleet
additions
–
Less cleaning due to
more barges with
compatible prior cargos
Shipper Owned Independent | Tank
Barges
Operated | Dry Cargo
Barges
Operated |
Kirby Corporation | 897 | - |
American Commercial Lines LLC | 369 | 2,861 |
Marathon Ashland Petroleum | 167 | - |
Ingram Barge Company | 165 | 3,468 |
Canal Barge Company, Inc. | 150 | 226 |
Florida Marine | 103 | - |
American River Transportation
Co | 84 | 1,892 |
Blessey Enterprises | 83 | - |
Higman Barge Lines, Inc. | 77 | - |
Cenac Towing Company, Inc. | 69 | - |
Magnolia Marine Transport Co | 60 | - |
PPG Industries, Inc. | 59 | - |
Martin Midstream Partners | 55 | - |
Southern Towing Company | 53 | - |
Settoon Towing, LLC | 49 | - |
LeBeouf Brothers Towing Co | 43 | - |
John W. Stone Oil | 31 | - |
Dupont | 30 | - |
Olin Corporation | 26 | - |
Buffalo Marine Service, Inc. | 22 | - |
River City Towing Services | 19 | - |
Rhodia, Inc. | 19 | - |
Lyondell Chemical Company | 17 | - |
Shipper Owned Independent | Tank Barges
Operated | Dry Cargo
Barges
Operated |
Dynegy Midstream Services | 16 | - |
Waxler Towing Company, Inc. | 15 | - |
Highland Towing | 15 | - |
ConocoPhillips Company | 15 | - |
Plaquemine Towing Corp. | 13 | - |
Houston Marine Services, Inc. | 13 | - |
Devall Towing | 12 | - |
Chem Carriers, Inc. | 11 | - |
Westlake/GA&O Corporation | 10 | - |
Merichem Company | 8 | - |
Grifco | 8 | - |
Apex Towing | 7 | - |
Golding Barge Lines, Inc. | 6 | - |
Republic of Texas | 6 | - |
American Milling | 5 | 17 |
Barge Management, Inc. | 5 | - |
Mon River Towing, Inc. | 4 | 142 |
Reilly Industries | 4 | - |
Memphis Barge Lines | 2 | - |
Cytec Industries | 2 | - |
Jantran, Inc. | 1 | 3 |
Other dry cargo carriers | - | 9, 670 |
TOTAL | 2,825 | 18,279 |
Informa Economics, Barge Fleet Profile, March 2005
Kirby Outpaces the Competition
Tank Barge Owners By Number of Tank Barges
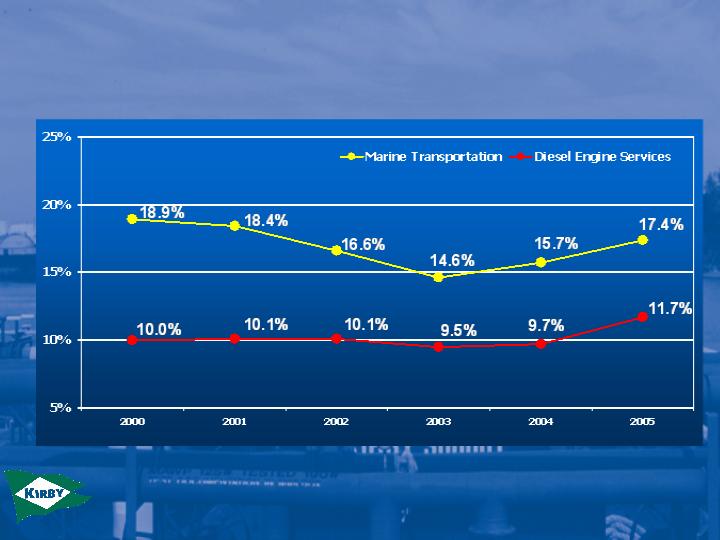
Revenue
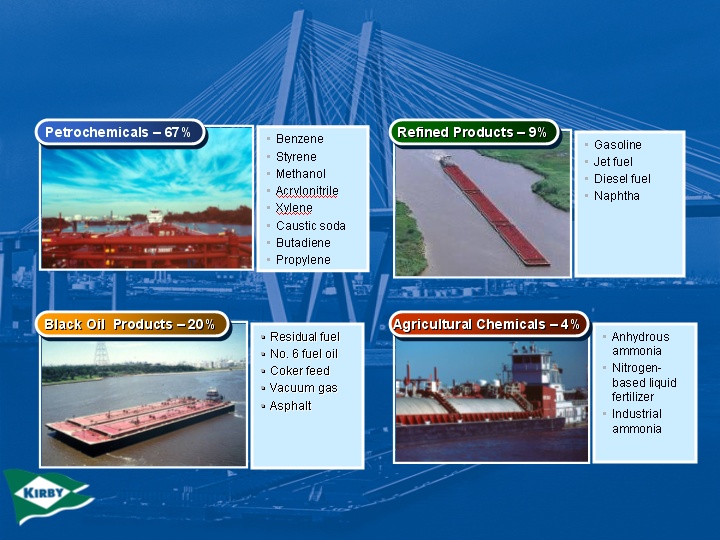
Distribution | Products Moved | Products | Drivers |
67% | Petrochemicals and
Chemicals | Benzene, Styrene, Methanol,
Acrylonitrile, Xylene, Caustic Soda,
Butadiene, Propylene | Housing, Consumer Goods,
Autos, Clothing |
20% | Black Oil Products | Residual Fuel, No. 6 Fuel Oil, Coker
Feed, Vacuum Gas, Asphalt | Road Construction, Feed
Stock for Refineries and Fuel
for Power Plants and Ships |
9% | Refined Products | Gasoline, Jet Fuel, Diesel Fuel,
Naphtha | Vehicle Usage, Air Travel,
Weather |
4% | Agricultural
Chemicals | Anhydrous Ammonia,
Nitrogen-based Liquid Fertilizer,
Industrial Ammonia | Corn, Cotton and Wheat
Production |
End Uses of Products…
Demand Drivers
•
Committed to dedicating adequate
resources to achieve safety
objectives
–
Extensive company-owned and
operated training facility
–
Seamen’s Church Institute
(Towboat Simulator)
•
Industry leader
–
First winner of Benkert Award,
highest award given by
Department of Transportation for
safety and environmental
protection
Strong Emphasis on Safety…
Safety Is Our Franchise To Operate
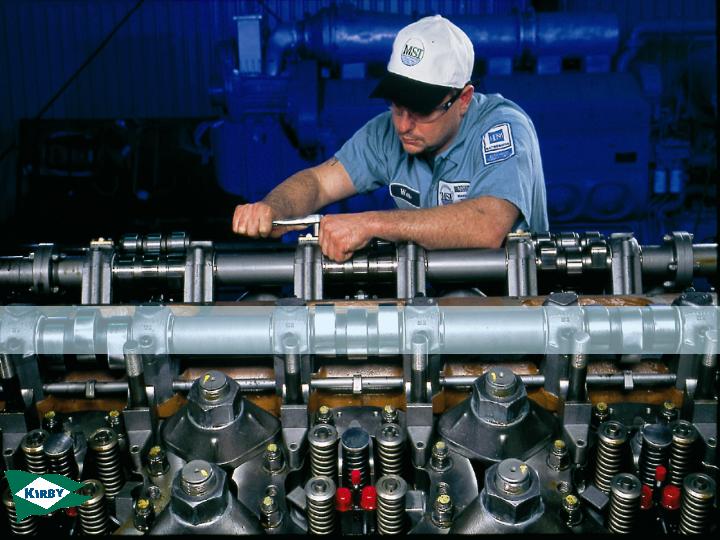
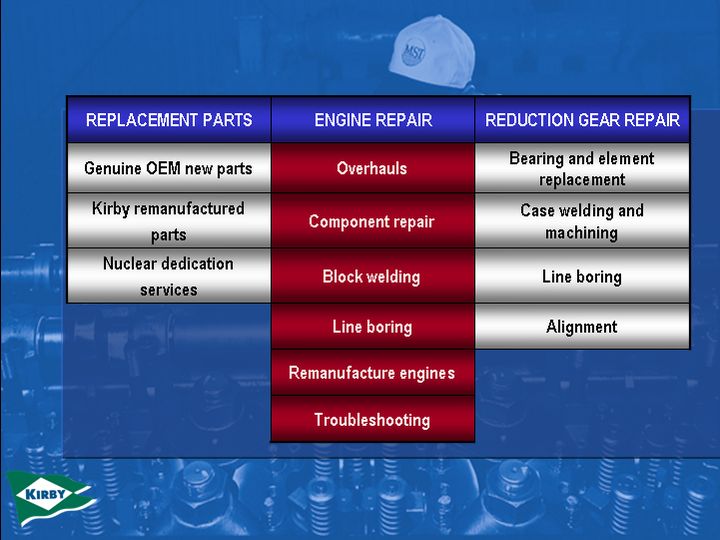
Diesel Engine Services Markets
•
Marine (59%)
–
Inland River Carriers – Dry and Liquid
–
Offshore Towing – Dry and Liquid
–
Offshore Oilfield Services – Drilling Rigs &
Supply Boats
–
Harbor Towing
–
Dredging
–
Great Lakes Ore Carriers
•
Power Generation, Nuclear and Industrial (20%)
–
Standby Power Generation
–
Pumping Stations
–
Industrial Reduction Gears
•
Railroad (21%)
–
Passenger (Transit Systems)
–
Class II
–
Shortline and Industrial
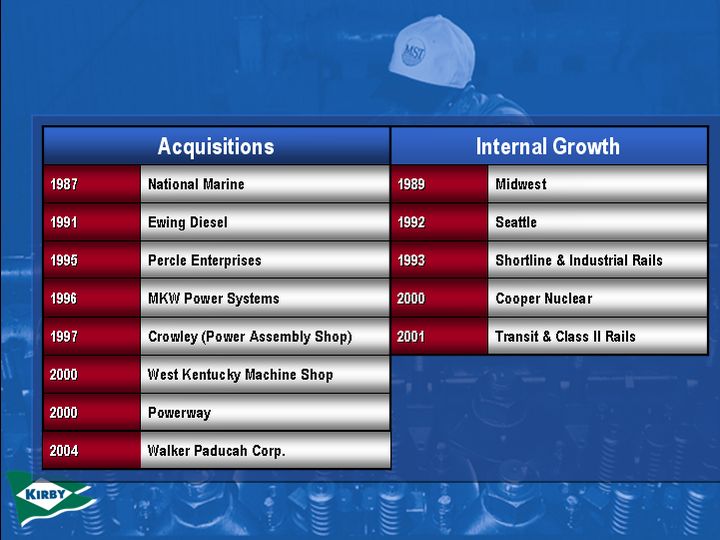
Acquisitions and Internal
Growth
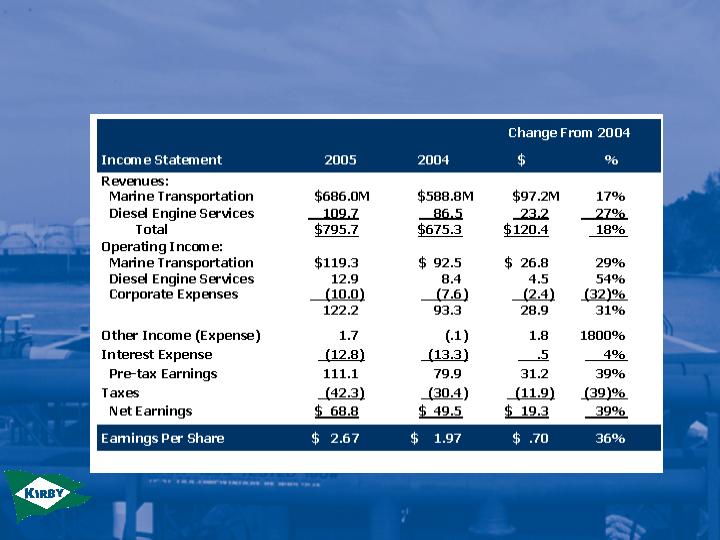
•
Record revenues, net earnings, earnings per share and EBITDA
•
Petrochemical and black oil products markets remained strong
•
Winter weather conditions in January and February. Favorable
conditions in March, second quarter and fourth quarter
•
Hurricanes Katrina and Rita negatively impacted the third
quarter by an estimated $.10 per share
•
Contract rates up 4% to 6%. Spot market rates higher than
contract and up 20% over 2004
•
Diesel engine services – strong service and direct parts sales,
coupled with increased prices for both service and parts
Market Conditions
2005 Year
•
2006 first quarter earnings per share guidance of $.64 to
$.70, compared with $.52 for 2005 first quarter
•
Guidance based on:
•
Petrochemical and black oil volumes will remain strong
•
Expect increased delay days from winter weather conditions
•
2006 year earnings per share guidance of $2.95 to $3.15,
compared with $2.67 for 2005
2006 First Quarter and Year
Outlook
Future Growth Opportunities
•
Acquire inland tank barge operations
–
Kirby operates more efficiently due to size and distribution system
–
Competitors face fleet replacement decisions
–
Outsourcing by shippers provides growth opportunities
–
Customers seek to single source their requirements
•
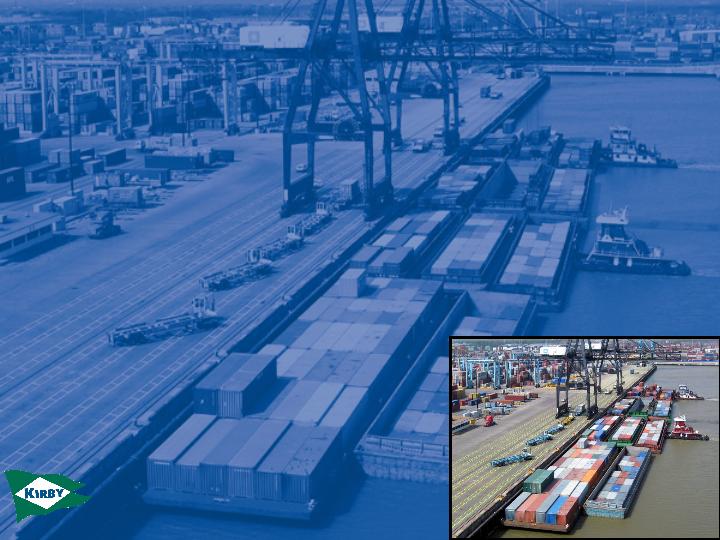
Expand services related to marine operations
–
Purchased two-thirds interest in Osprey Line, a provider of container
on barge feeder service
–
Manage or acquire marine facilities
•
Expand diesel engine service operations
–
Existing geographic foot print presents opportunities for expansion
–
Continue to develop exclusive parts distribution relationships
Osprey Line, LLC
•
Purchased one-third interest in April 2004
•
Increased ownership to two-thirds in January
2006
•
Transports containers on barge on U.S. inland
waterway system and Gulf of Mexico
•
Future growth opportunity as U.S. contends
with congestion problems
•
Provides attractive alternative to rail and
truck
•
Very complementary to Kirby’s existing
distribution system and customer base
For Year Ended December 31, 2005
11.9% growth
rate from
1994 - 2005
See Appendix for reconciliation of GAAP net earnings to Non-GAAP EBITDA
EBITDA Per Share Growth
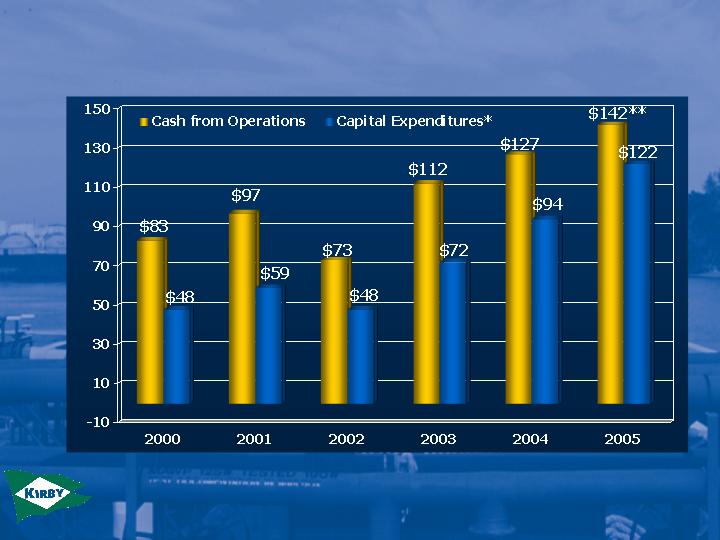
Excluding acquisitions
* Unaudited
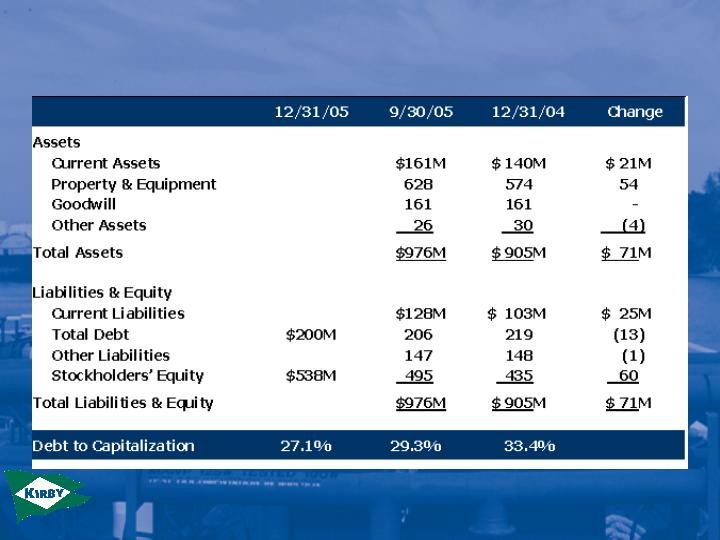
Cash Flows
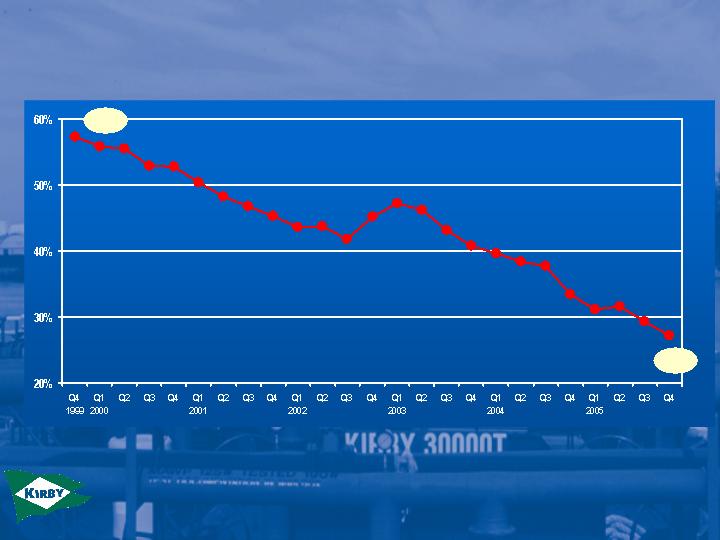
27.1%
57.3%
Debt / Capitalization
•
Investment grade public debt
–
Standard & Poor’s – BBB+
–
Moody’s – Baa3
•
8-year unsecured Private Placement due 2013
–
$200 million outstanding
–
Floating rate of LIBOR +0.5%
–
No required principal payments until maturity
•
$150 Million Revolving Credit Facility
–
Accordion feature added to allow maximum amount to
increase to $225 million without amendment
•
Protection against interest rate increases
–
$150 million of interest rate swaps
Financial Strength
•
Consistent long-term record of success in core
businesses
•
Excellent business fundamentals
•
Strong free cash flow
•
Internal and external growth opportunities in core
businesses
•
Strong operating leverage with every 1% increase
in marine transportation segment margin adds $.16
per share to earnings; for diesel segment, adds $.03
per share to earnings
•
Fleet expansions will improve asset utilization,
operating efficiencies and reduce costs
Why Invest in Kirby?
Thank You For Listening to Our Story
Kirby Corporation
Putting America’s
Waterways to Work
KIRBY CORPORATION
Reconciliation of GAAP to Non-GAAP Financial Measures
Kirby reports its financial results in accordance with generally accepted accounting principles (GAAP). However, Kirby believes that certain non-GAAP financial measures are useful in managing Kirby’s businesses and evaluating Kirby’s performance. Two such non-GAAP financial measures are adjusted net earnings and EBITDA.
Adjusted net earnings and adjusted net earnings per share exclude non-recurring adjustments in order to present a measure of earnings that facilitates a comparison of results from one period to results from another period on a more consistent basis, since the non-recurring items are materially different in nature and amount from one period to another. The adjustments generally represent items that are outside normal business operations and are therefore difficult to predict for future periods.
EBITDA, which Kirby defines as net earnings before interest expense, taxes on income, depreciation and amortization, is used because of its wide acceptance as a measure of operating profitability before nonoperating expenses (interest and taxes) and noncash charges (depreciation and amortization). EBITDA is one of the performance measures used in Kirby’s incentive bonus plan. EBITDA is also used by rating agencies in determining Kirby’s credit rating and by analysts publishing research reports on Kirby, as well as by investors and investment bankers generally in valuing companies.
These non-GAAP financial measures are not a substitute for GAAP financial results and should only be considered in conjunction with Kirby’s financial information that is presented in accordance with GAAP.
Quantitative reconciliations of adjusted net earnings to GAAP net earnings and of EBITDA to GAAP net earnings are provided in the following tables.
KIRBY CORPORATION
Reconciliation of GAAP Net Earnings and Earnings Per Share to Adjusted Non-GAAP
Net Earnings and Adjusted Earnings Per Share
| | | For the years ended December 31, | |
| | | 2005 | | 2004 | | 2003 | | 2002 | | 2001 | | 2000 | | 1999 | | 1998 | | 1997 | | 1996 | |
| | | (In millions, except per share amounts) | |
| | | | | | | | | | | | | | | | | | | | | | |
Net earnings from continuing operations, GAAP | | $ | 68.8 | | $ | 49.5 | | $ | 40.9 | | $ | 27.4 | | $ | 39.6 | | $ | 34.1 | | $ | 21.4 | | $ | 10.1 | | $ | 22.7 | | $ | 21.2 | |
Adjustments or charges, net of taxes: | | | | | | | | | | | | | | | | | | | | | | | | | | | | | | | |
Impairment of assets | | | - | | | - | | | - | | | 12.5 | | | - | | | - | | | .7 | | | 5.4 | | | - | | | - | |
Amortization of goodwill expense | | | - | | | - | | | - | | | - | | | 6.3 | | | 5.9 | | | 1.7 | | | .6 | | | .7 | | | .5 | |
Loss on sale of Universal Insurance Company | | | - | | | - | | | - | | | - | | | - | | | - | | | - | | | 6.9 | | | - | | | - | |
Merger related charges | | | - | | | - | | | - | | | - | | | - | | | .1 | | | 2.9 | | | - | | | - | | | - | |
| | | | - | | | - | | | - | | | 12.5 | | | 6.3 | | | 6.0 | | | 5.3 | | | 12.9 | | | .7 | | | .5 | |
| | | | | | | | | | | | | | | | | | | | | | | | | | | | | | | | |
Adjusted net earnings from continuing operations, Non-GAAP | | $ | 68.8 | | $ | 49.5 | | $ | 40.9 | | $ | 39.9 | | $ | 45.9 | | $ | 40.1 | | $ | 26.7 | | $ | 23.0 | | $ | 23.4 | | $ | 21.7 | |
| | | | | | | | | | | | | | | | | | | | | | | | | | | | | | | | |
Net earnings per share from continuing operations, GAAP | | $ | 2.67 | | $ | 1.97 | | $ | 1.67 | | $ | 1.13 | | $ | 1.63 | | $ | 1.39 | | $ | 1.01 | | $ | .46 | | $ | .92 | | $ | .82 | |
Adjustments or charges per share, net of taxes | | | - | | | - | | | - | | | .51 | | | .26 | | | .24 | | | .24 | | | .58 | | | .03 | | | .02 | |
| | | | | | | | | | | | | | | | | | | | | | | | | | | | | | | | |
Adjusted net earnings per share from continuing operations, Non-GAAP | | $ | 2.67 | | $ | 1.97 | | $ | 1.67 | | $ | 1.64 | | $ | 1.89 | | $ | 1.63 | | $ | 1.25 | | $ | 1.04 | | $ | .95 | | $ | .84 | |
KIRBY CORPORATION
Reconciliation of GAAP Net Earnings to Non-GAAP EBITDA
| | | For the years ended December 31, | |
| | | 2005 | | 2004 | | 2003 | | 2002 | | 2001 | | 2000 | | 1999 | | 1998 | | 1997 | | 1996 | |
| | | (In millions, except per share amounts) | |
| | | | | | | | | | | | | | | | | | | | | | |
Net earnings from continuing operations, GAAP | | $ | 68.8 | | $ | 49.5 | | $ | 40.9 | | $ | 27.4 | | $ | 39.6 | | $ | 34.1 | | $ | 21.4 | | $ | 10.1 | | $ | 22.7 | | $ | 21.2 | |
Interest expense | | | 12.8 | | | 13.3 | | | 14.6 | | | 13.7 | | | 19.0 | | | 23.9 | | | 12.8 | | | 11.9 | | | 13.4 | | | 13.3 | |
Provision for taxes on income | | | 42.3 | | | 30.4 | | | 25.1 | | | 18.0 | | | 27.5 | | | 23.7 | | | 14.0 | | | 6.9 | | | 13.8 | | | 12.9 | |
Depreciation and amortization | | | 57.4 | | | 55.1 | | | 53.4 | | | 45.5 | | | 50.3 | | | 48.2 | | | 31.3 | | | 27.4 | | | 28.1 | | | 28.4 | |
| | | | | | | | | | | | | | | | | | | | | | | | | | | | | | | | |
EBITDA from continuing operations, Non-GAAP | | | 181.3 | | | 148.3 | | | 134.0 | | | 104.6 | | | 136.4 | | | 129.9 | | | 79.5 | | | 56.3 | | | 78.0 | | | 75.8 | |
Adjustments or charges: | | | | | | | | | | | | | | | | | | | | | | | | | | | | | | | |
Impairment of assets | | | - | | | - | | | - | | | 18.9 | | | - | | | - | | | 1.1 | | | 8.3 | | | - | | | - | |
Loss on sale of Universal Insurance Company | | | - | | | - | | | - | | | - | | | - | | | - | | | - | | | 10.6 | | | - | | | - | |
Merger related charges | | | - | | | - | | | - | | | - | | | - | | | .2 | | | 4.5 | | | - | | | - | | | - | |
| | | | - | | | - | | | - | | | 18.9 | | | - | | | .2 | | | 5.6 | | | 18.9 | | | - | | | - | |
| | | | | | | | | | | | | | | | | | | | | | | | | | | | | | | | |
EBITDA from continuing operations, after adjustments, Non-GAAP | | $ | 181.3 | | $ | 148.3 | | $ | 134.0 | | $ | 123.5 | | $ | 136.4 | | $ | 130.1 | | $ | 85.1 | | $ | 75.2 | | $ | 78.0 | | $ | 75.8 | |
KIRBY CORPORATION
Reconciliation of GAAP Net Earnings to Non-GAAP EBITDA
| | | Three months ended | |
| | | March 31, | | June 30, | | September 30, | | December 31, | | Year | |
| | | 2005 | | 2004 | | 2005 | | 2004 | | 2005 | | 2004 | | 2005 | | 2004 | | 2005 | | 2004 | |
| | | (In millions, except per share amounts) | |
| | | | | | | | | | | | | | | | | | | | | | |
Net earnings, GAAP | | $ | 13.3 | | $ | 9.0 | | $ | 18.4 | | $ | 13.8 | | $ | 17.3 | | $ | 13.3 | | $ | 19.8 | | $ | 13.4 | | $ | 68.8 | | $ | 49.5 | |
Interest expense | | | 3.1 | | | 3.4 | | | 3.2 | | | 3.3 | | | 3.0 | | | 3.3 | | | 3.5 | | | 3.3 | | | 12.8 | | | 13.3 | |
Provision for taxes on income | | | 8.1 | | | 5.5 | | | 11.3 | | | 8.4 | | | 10.6 | | | 8.2 | | | 12.3 | | | 8.3 | | | 42.3 | | | 30.4 | |
Depreciation and amortization | | | 15.0 | | | 13.8 | | | 14.0 | | | 13.6 | | | 13.7 | | | 14.0 | | | 14.7 | | | 13.7 | | | 57.4 | | | 55.1 | |
| | | | | | | | | | | | | | | | | | | | | | | | | | | | | | | | |
EBITDA, Non-GAAP | | $ | 39.5 | | $ | 31.7 | | $ | 46.9 | | $ | 39.1 | | $ | 44.6 | | $ | 38.8 | | $ | 50.3 | | $ | 38.7 | | $ | 181.3 | | $ | 148.3 | |
KIRBY CORPORATION
MARINE TRANSPORTATION PERFORMANCE MEASUREMENTS
| | | 2002 | | 2003 | | 2004 | | 2005 | |
| | | Year | | 1st Qtr | | 2nd Qtr | | 3rd Qtr | | 4th Qtr | | Year | | 1st Qtr | | 2nd Qtr | | 3rd Qtr | | 4th Qtr | | Year | | 1st Qtr | | 2nd Qtr | | 3rd Qtr | | 4th Qtr | | Year | |
| | | | | | | | | | | | | | | | | | | | | | | | | | | | | | | | | | |
Ton miles (in millions) (1) | | | 13,377 | | | 3,455 | | | 3,991 | | | 4,021 | | | 4,115 | | | 15,582 | | | 3,735 | | | 4,321 | | | 4,238 | | | 3,938 | | | 16,232 | | | 3,738 | | | 4,135 | | | 4,027 | | | 4,241 | | | 16,141 | |
Revenues/Ton mile (cents/tm) (2) | | | 3.4 | | | 3.6 | | | 3.4 | | | 3.3 | | | 3.3 | | | 3.4 | | | 3.6 | | | 3.5 | | | 3.6 | | | 3.8 | | | 3.6 | | | 4.2 | | | 4.1 | | | 4.3 | | | 4.4 | | | 4.3 | |
Towboats operated (3) | | | 201 | | | 229 | | | 226 | | | 222 | | | 224 | | | 225 | | | 233 | | | 237 | | | 237 | | | 235 | | | 235 | | | 239 | | | 241 | | | 243 | | | 242 | | | 242 | |
Delays days (4) | | | 5,974 | | | 2,583 | | | 1,268 | | | 1,001 | | | 1,610 | | | 6,462 | | | 2,359 | | | 1,822 | | | 1,658 | | | 2,553 | | | 8,392 | | | 3,289 | | | 1,790 | | | 2,080 | | | 1,863 | | | 9,022 | |
| | (1) | Ton miles indicate fleet productivity by measuring the distance (in miles) a loaded tank barge is moved. Example: A typical 30,000 barrel tank barge loaded with 3,300 tons of liquid cargo is moved 100 miles, thus generating 330,000 ton miles. |
| | (2) | Marine transportation revenues divided by ton miles. Example: 4th quarter 2005 revenues of $185,788,000 divided by 4,241,000,000 ton miles = 4.4 cents. |
| | (3) | Towboats operated is the average number of owned and chartered towboats operated during the period. |
| | (4) | Delay days measures the lost time incurred by a tow (towboat and tank barges) during transit. The measure includes transit delays caused by weather, lock congestion and other navigational factors. |
5