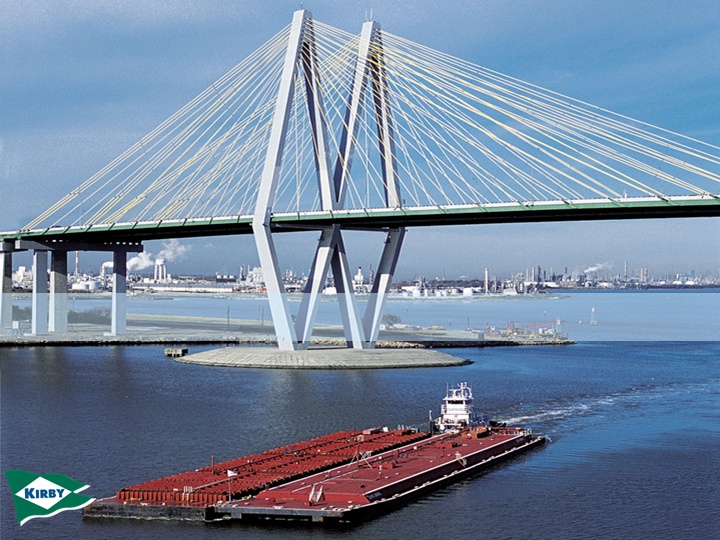
Kirby Corporation
Putting America’s Waterways to Work
NYSE: KEX
November 2006
Statements contained in this presentation with respect to the future are forward-looking statements. These statements reflect management’s reasonable judgement with respect to future events. Forward-looking statements involve risks and uncertainties. Actual results could differ materially from those anticipated as a result of various factors, including cyclical or other downturns in demand, significant pricing competition, unanticipated additions to industry capacity, changes in the Jones Act or in U.S. maritime policy and practice, fuel costs, interest rates, weather conditions and the timing, magnitude and the number of acquisitions made by Kirby. Forward-looking statements are based on currently available information and Kirby assumes no obligation to update such statements. A list of additional risk factors can be found in Kirby’s annual report on Form 10-K for the year ended December 31, 2005, filed with the Securities and Exchange Commission.
Kirby reports its financial results in accordance with generally acceptedaccounting principles (GAAP). However, Kirby believes that certain Non-GAAP financial measures are useful in managing Kirby’s businesses and evaluating Kirby’s performance. This presentation contains two Non-GAAP financial measures, adjusted net earnings and EBITDA. Please see the Appendix for a reconciliation of GAAP to Non-GAAP financial measures.
Forward Looking Statement
Non-GAAP Financial Measures
2
Marine Transportation
86% of 2005 Revenue - $686.0 million
Largest U.S. Inland Tank Barge Operator
Diesel Engine Services
14% of 2005 Revenue - $109.7 million
Largest U.S. EMD Diesel Services Company
Kirby... Business Operations
3
NYSE: K E X
Current Price (October 27 , 2006) | $35.36 |
Number of Shares O/S | 52.9M |
Market Capitalization | $1,871M |
Debt (September 30, 2006) | $327M |
Enterprise Value | $2,198M |
Employees | 2,950 |
Kirby…Public Market Facts
4

Kirby Facts
•
Largest inland tank barge operator
•
Operates 903 barges and 242 towingvessels
•
Sustainable competitive advantages:
–
Lowest cost due to economies of scale
–
Best positioned for growth opportunities
–
“One Stop Shop” for customers
•
70% of Kirby’s business is under contractand 30% in the spot market
•
Successful integration of 25 marineacquisitions
5

* Towboats Only
Date | No. of Tank Barges | Description |
1986 | 5 | Alliance Marine |
1989 | 35 | Alamo Inland Marine Co. |
1989 | 53 | Brent Towing Company |
1991 | 3 | International Barge Lines, Inc. |
1992 | 38 | Sabine Towing & Transportation Co. |
1992 | 26 | Ole Man River Towing, Inc. |
1992 | 29 | Scott Chotin, Inc. |
1992 | * | South Texas Towing |
1993 | 72 | TPT, Division of Ashland |
1993 | * | Guidry Enterprises |
1993 | 53 | Chotin Transportation Company |
1994 | 96 | Dow Chemical (transportation assets) |
Date | No. of Tank Barges | Description |
1999 | 270 | Hollywood Marine, Inc. - Stellman - Alamo Barge Lines - Ellis Towing - Arthur Smith - Koch Ellis - Mapco |
2002 | 15 | Cargo Carriers |
2002 | 64 | Coastal Towing, Inc. (barge management agreement for 54 barges) |
2002 | 94 | Dow/Union Carbide (transportation assets) |
2003 | 64 | SeaRiver Maritime (ExxonMobil) |
2005 | 10 | American Commercial Lines (black oil fleet) |
2006 | * | Capital Towing |
Shipper Owned (Blue)
Independent (Red)
Acquisitions in Core Business
6
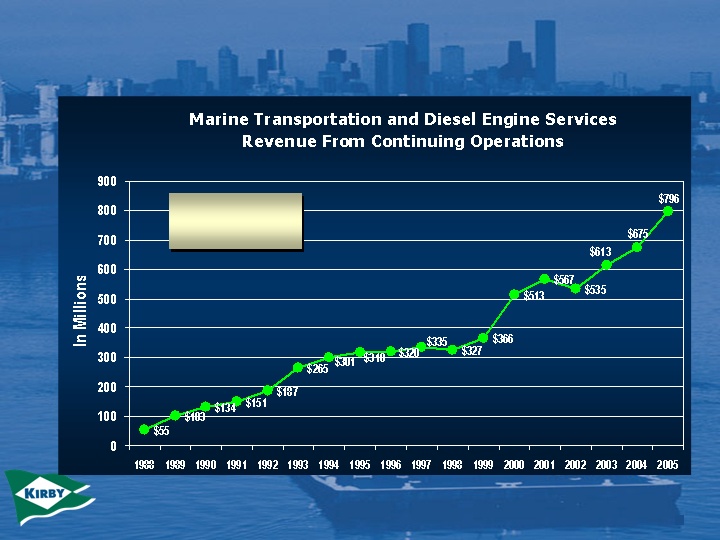
17% growth
rate from
1988-2005
1988-2005
Revenue... Business Operations
7
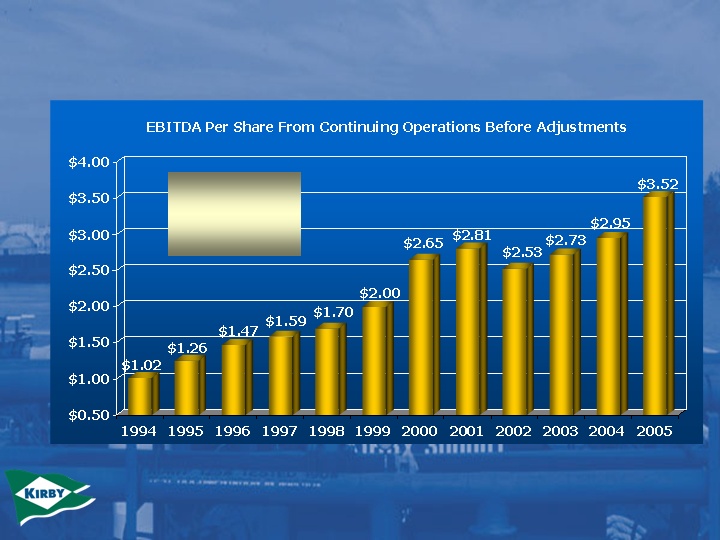
1994-2001 adjusted to exclude goodwill amortization expense
2002 adjusted to exclude impairment charges of $12.5 million, net of taxes, or $.51 per share
See Appendix for reconciliation of GAAP to Non-GAAP earnings per share
Earnings per share have been revised to reflect 2-for-1 stock split effective May 31, 2006
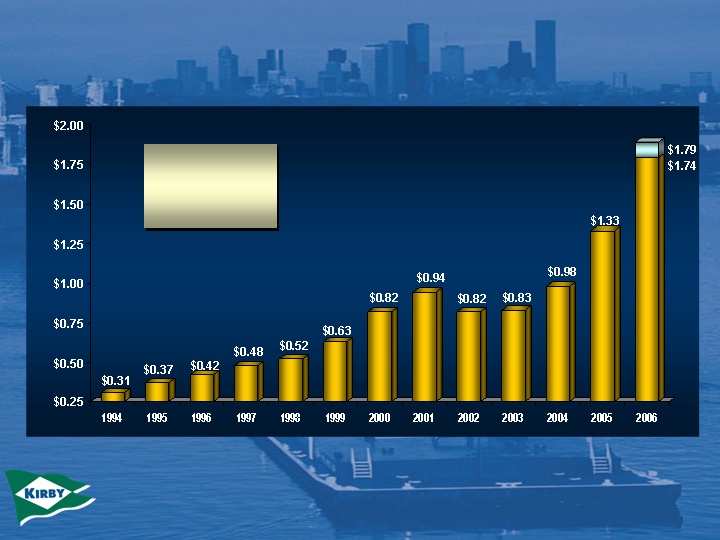
14.2% growth
rate from
1994 - 2005
Earnings Per Share From Continuing Operations Before Adjustments
Guidance
Earnings Per Share
8
St. Paul
Sioux City
Chicago
Pittsburgh
Charleston
St. Marks
Tulsa
Corpus Christi
New Orleans
St. Louis
Cincinnati
Mobile
Brownsville
Houston
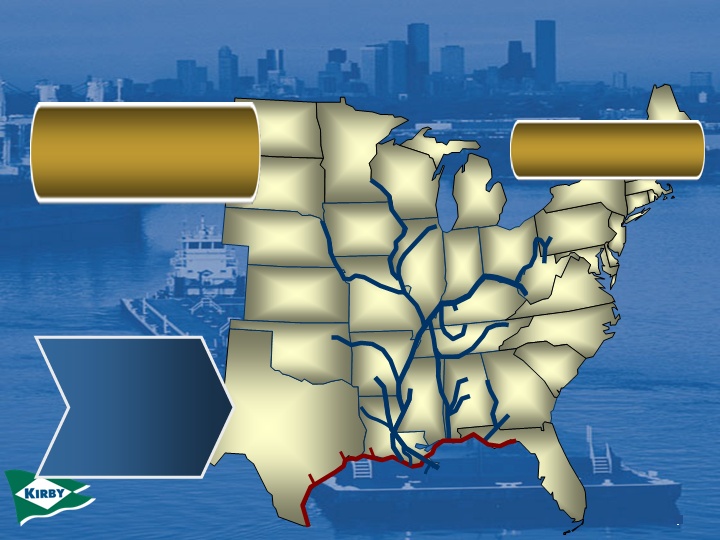
Texas and Louisiana account for 80% of the total U.S. production of
chemicals and
petrochemicals
chemicals and
petrochemicals
12,000 miles of navigable waterways linking America’s heartland to the world
Kirby is one of the few operators offeringdistribution throughout the Mississippi River System and
Gulf Intracoastal Waterway
Gulf Intracoastal Waterway
Inland Waterway System
9

Industry Facts
•
Approximately 17,800 dry cargo barges, 2,800 liquid tank barges. Kirby is principally in the liquid cargo business.
•
No competition from foreign companies due to a U.S. lawknown as the Jones Act
•
Always a market to move product by barge on inlandwaterways
•
Equipment not subject to economic obsolescence because draft and lock restrictions limit the size of barges
•
Barges are mobile, carry wide range of cargoes, andservice different geographic markets
•
Inland waterway system plays a vital role in the U.S.economy
•
Inland waterway system is an environmentally friendlymode of transportation
10

Liquid | Dry Cargo | ||
Cargoes | Petrochemicals, Black oil products, Refined products | Grain, Coal, Aggregate, Steel | |
Value of Cargo | High | Generally much lower | |
Pricing Drivers | Added value-safety, service and availability | Availability | |
Volatility of Volumes | Low | High | |
Crews | Licensed Pilothouse, Licensed Tankerman | Pilot house only | |
Cost of Barges | 195x35/1500 tons barge - $1,300,000 | 195x35/1500 tons barge -$450,000 | |
Regulatory Requirements | U.S. Coast Guard Inspected | Not Inspected |
2,800 Barges
17,800 Barges
Differences Between Liquid Tank
Barges and Dry Cargo Barges
11
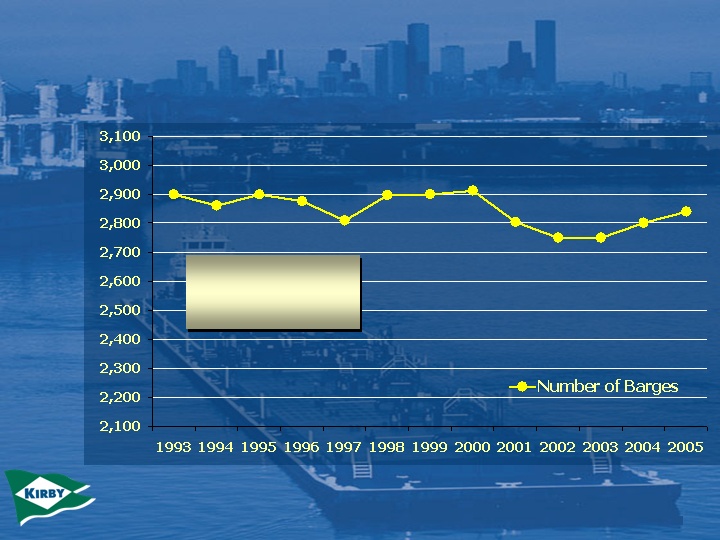
For the years 1993 through 2005
185 single hull tank
barges industry wide,
15 operated by Kirby
Number of Inland Tank Barges
12
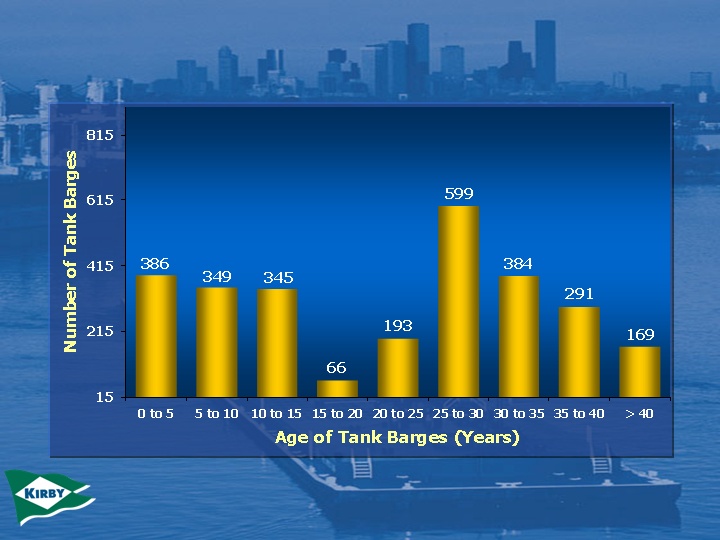
Source: Informa Economics, Barge Fleet Profile, March 2006
Inland Tank Barge Fleet
13
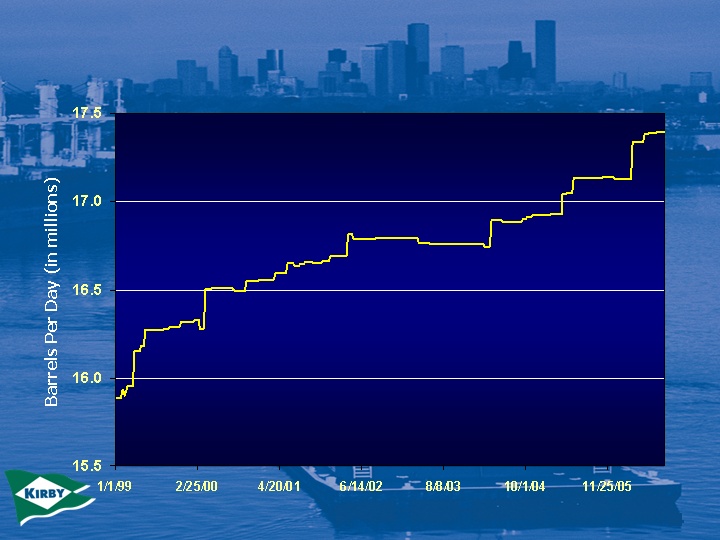
17,395 on Sep 8, 2006
Refinery Operable Capacity
14
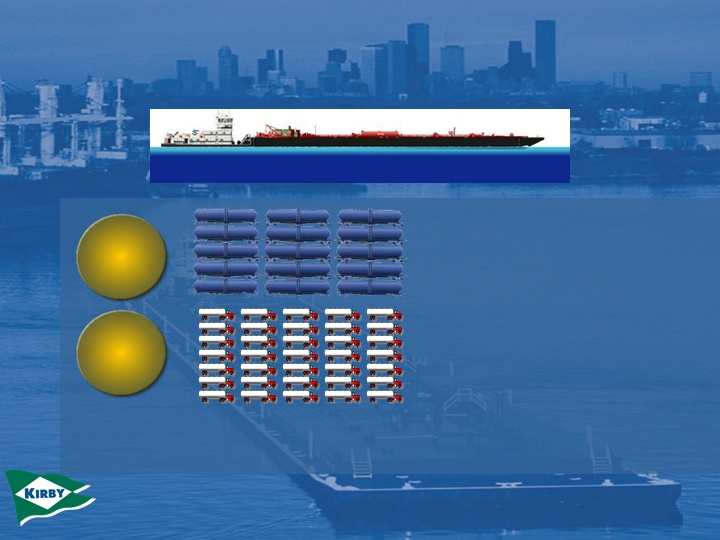
90,000 bbl. three-barge tow is equivalentto:
Kirby’s fleet capacity of 17.0 million bbls.equates to 85,000 trucks, or 22,600 rail cars
Rail Cars
120
Trucks
450
Barges Compete Successfully
With Rails and Trucks
15

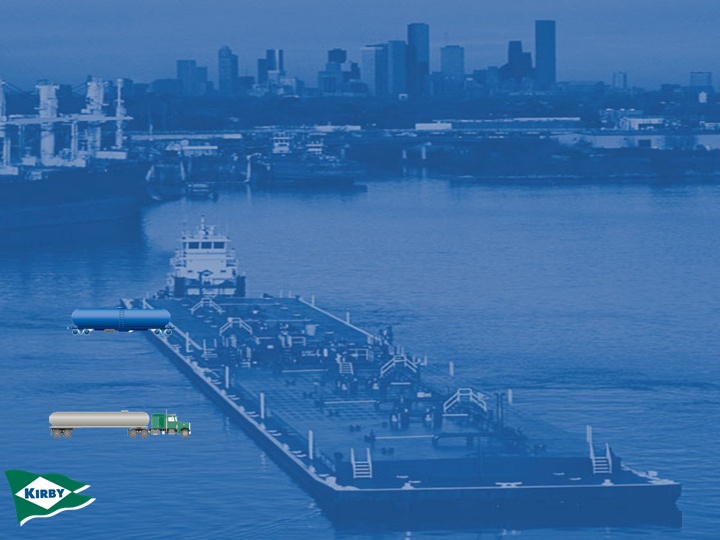
One gallon of fuel in a barge can move one ton of freight 522miles, compared to 403 miles by rail and only 80 miles for a truck.
Barge
Rail
Truck
Barges…
Efficient
16
While moving one ton of freight 1,000 miles:
•
Smog is a major problem in most major cities
•
Oxides of nitrogen are the chemicals that produce smog
Trains produce 3.5 times more nitrogenoxides as barges
Trucks produce 19 times more nitrogenoxides as barges
Barges…
Environmentally Friendly
17
KIRBY INLAND MARINE
18
•
Benzene
•
Styrene
•
Methanol
•
Acrylonitrile
•
Xylene
•
Caustic soda
•
Butadiene
•
Propylene
Petrochemicals – 67%
•
Residual fuel
•
No. 6 fuel oil
•
Coker feed
•
Vacuum gas
•
Asphalt
Black Oil Products – 20%
•
Anhydrous ammonia
•
Nitrogen-based liquid fertilizer
•
Industrial ammonia
Agricultural Chemicals – 3%
•
Gasoline
•
Jet fuel
•
Diesel fuel
•
Naphtha
Refined Products – 10%
Largest Inland Tank Barge Operator
19
Petrochemicals
/Refined
Products
High Capacity
pumps –
Specialty
coated tanks
Specialty
coated tanks
709
63
114
12
5
Pressure
Pressurized
tanks
Black Oil
Self-contained
heating
systems
systems
Anhydrous
Ammonia
Refrigeration
tanks
Specialty
Stainless
steel
tanks
High Tech and Diverse Fleet
903 Active Tank Barges
20
Fleet Size and Diversity…
Better Asset Utilization
•
Better Asset Utilization
–
More backhaul
opportunities
–
Faster barge
turnarounds
–
More efficient use of horsepower
–
Barges positioned closer to cargos
•
Lower Incremental Costs
–
Enhanced purchasing power
–
Minimal incremental G&A from fleet additions
–
Less cleaning due to more barges with compatible prior cargos
21

Shipper Owned Independent | Tank Barges Operated | Dry Cargo Barges Operated |
Kirby Corporation | 903 | - |
American Commercial Lines LLC | 371 | 2,803 |
Marathon Oil Corporation | 170 | - |
Canal Barge Company, Inc. | 169 | 273 |
Ingram Barge Company | 165 | 3,716 |
Florida Marine | 91 | - |
Blessey Enterprises | 86 | - |
American River Transportation Co | 82 | 2,076 |
Higman Barge Lines, Inc. | 80 | - |
Cenac Towing Company, Inc. | 72 | - |
PPG Industries, Inc. | 59 | - |
Southern Towing Company | 53 | - |
Martin Midstream Partners | 52 | - |
Settoon Towing, LLC | 49 | - |
Magnolia Marine Transport Co | 45 | - |
LeBeouf Brothers Towing Co | 44 | - |
Olin Corporation | 29 | - |
John W. Stone Oil | 28 | - |
Buffalo Marine Service, Inc. | 24 | - |
Rhodia, Inc. | 20 | - |
ConocoPhillips Company | 20 | - |
River City Towing Services | 19 | - |
Houston Marine Services, Inc. | 18 | - |
Lyondell Chemical Company | 17 | - |
Shipper Owned Independent | Tank Barges Operated | Dry Cargo Barges Operated |
Dynegy Midstream Services | 16 | - |
Dupont | 16 | - |
Waxler Towing Company, Inc. | 15 | - |
Horizon Maritime | 15 | - |
Highland Towing | 13 | - |
Devall Towing | 12 | - |
Chem Carriers, Inc. | 12 | - |
Plaquemine Towing Corp. | 11 | - |
Golding Barge Lines, Inc. | 9 | - |
Grifco | 8 | - |
Westlake/GA&O Corporation | 8 | - |
Merichem Company | 7 | - |
Apex Towing | 7 | - |
Republic of Texas | 6 | - |
Hines Barge Line | 6 | |
American Milling | 5 | 11 |
Mon River Towing, Inc. | 4 | 142 |
Reilly Industries | 4 | - |
Memphis Barge Lines | 4 | - |
Barge Management, Inc. | 3 | - |
Cytec Industries | 2 | - |
Jantran, Inc. | 1 | - |
Other dry cargo carriers | - | 8,768 |
TOTAL | 2,850 | 17,789 |
Informa Economics, Barge Fleet Profile, March 2006 - Adjusted
Kirby Outpaces the Competition
Tank Barge Owners By Number of Tank Barges
22

Revenue Distribution | Products Moved | Products | Drivers |
67% | Petrochemicals and Chemicals | Benzene, Styrene, Methanol, Acrylonitrile, Xylene, Caustic Soda, Butadiene, Propylene | Housing, Consumer Goods, Autos, Clothing |
20% | Black Oil Products | Residual Fuel, No. 6 Fuel Oil, Coker Feedstock, Vacuum Gas Oil, Asphalt | Road Construction, Feed Stock for Refineries and Fuel for Power Plants and Ships |
10% | Refined Products | Gasoline, Jet Fuel, Diesel Fuel, Naphtha | Vehicle Usage, Air Travel, Weather |
3% | Agricultural Chemicals | Anhydrous Ammonia, Nitrogen-based Liquid Fertilizer, Industrial Ammonia | Corn, Cotton and Wheat Production |
End Uses of Products…
Demand Drivers
23
•
Committed to dedicating adequateresources to achieve safety objectives
–
Extensive company-owned and operated training facility
–
Seamen’s Church Institute (Towboat Simulator)
•
Industry leader
–
First winner of Benkert Award, highest award given by Department of Transportation for safety and environmental
protection
protection
Strong Emphasis on Safety…
Safety Is Our Franchise To Operate
24
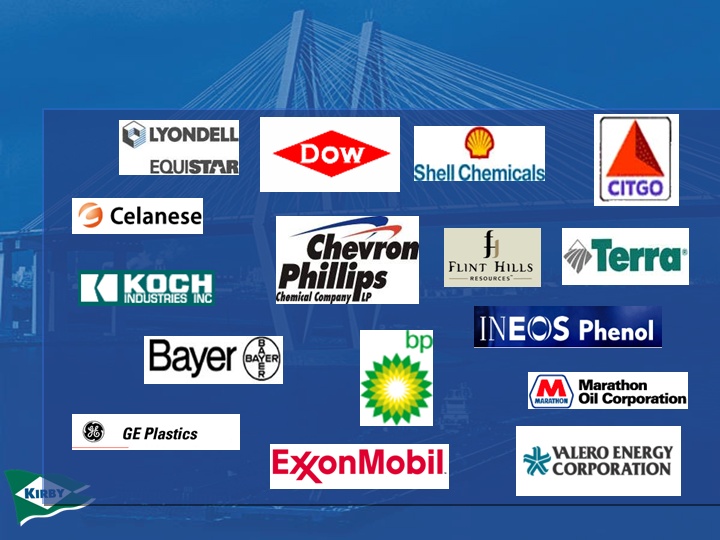
Blue Chip Customers
25
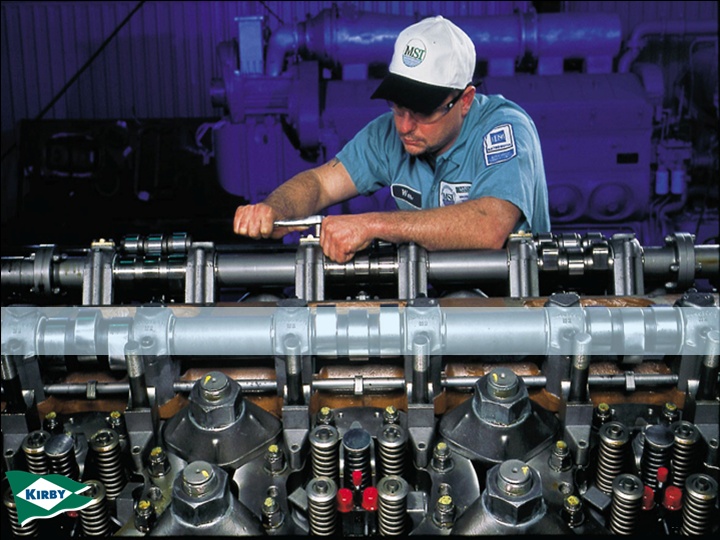
Kirby Engine Systems
26
Markets
•
Medium-Speed
–
Electro-Motive Diesel (EMD)
–
Alco
–
Ingersoll-Rand
•
High-Speed
–
Caterpillar
–
Cummins
–
Detroit Diesel
–
John Deere
•
Transmissions/Reduction Gears
–
Allison
–
Falk
–
Twin-Disc
Engines and Transmissions/ Reduction Gears
Diesel Engine Services
Medium-Speed and High-Speed Diesel Engines
•
Marine
–
Inland Waterway Carriers – Dry and Liquid
–
Offshore Towing – Dry and Liquid
–
Offshore Drilling Rigs & Supply Boats
–
Harbor Towing
–
Dredging
–
Great Lakes Ore Carriers
•
Power Generation, Nuclear and Industrial
–
Standby Power Generation
–
Pumping Stations
–
Industrial Reduction Gears
–
Land Drilling Rigs – Expansion Opportunity
•
Railroad
–
Passenger (Transit Systems)
–
Class II
–
Shortline and Industrial
27
Bearing and element replacement
Case welding and machining
Line boring Alignment
Overhauls
Component repair
Block welding
Line boring
Remanufacture engines
Troubleshooting
Genuine OEM new parts
Kirby remanufactured parts
Nuclear dedication services
Replacement Parts
Engine Repair
Reduction Gear Repair
Services
28
Acquisitions | |
1987 | National Marine |
1991 | Ewing Diesel |
1995 | Percle Enterprises |
1996 | MKW Power Systems |
1997 | Crowley (Power Assembly Shop) |
2000 | West Kentucky Machine Shop |
2000 | Powerway |
2004 | Walker Paducah Corp. |
2005 | TECO (Diesel Services Division) |
2006 | Global Power Holding Company |
2006 | Marine Engine Specialists |
Internal Growth | |
1989 | Midwest |
1992 | Seattle |
1993 | Shortline & Industrial Rails |
2000 | Cooper Nuclear |
2001 | Transit & Class II Rails |
Acquisitions and Internal
Growth
29
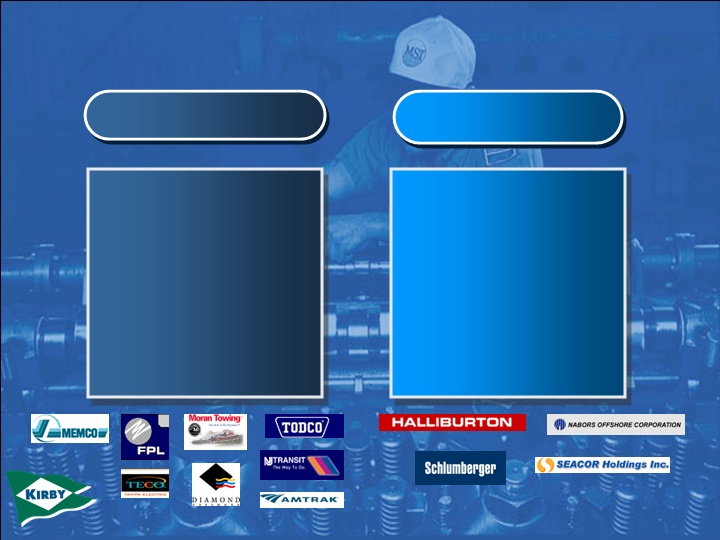
Medium – Speed Engines
High-Speed Engines
AMTRAK
AEP/Memco
Diamond Offshore
Florida Power & Light
Moran Towing
NJ Transit
TECO Transport
Tidewater
TODCO
Cal Dive International
Halliburton
Horizon Offshore
Nabors Offshore
Pride Offshore
Schlumberger
Seacor Holdings
Superior Energy Services
Tidewater
Key Customers
30
Market Conditions
31

•
Record revenues, net earnings, earnings per share and EBITDA
•
Petrochemical and black oil products markets remained strong
•
Winter weather conditions in January and February. Favorable conditions in March, second quarter and fourth quarter
•
Hurricanes Katrina and Rita negatively impacted the third quarter by an estimated $.05 per share
•
Contract rates up 4% to 6%. Spot market rates higher than contract and up 20% to 25% over 2004
•
Diesel engine services – strong service and direct parts sales, coupled with increased prices for both service and parts
Market Conditions
2005 Year
32
•
Record revenues, net earnings, earnings per share and EBITDA
•
Petrochemical, black oil and refined products markets remained strong
•
Favorable weather conditions positively impacted financial results, with delay days down 29% when compared with 2005 first nine months
•
Contract rates up 6% to 8%. Spot market rates higher than contract and up over 25% compared with 2005 first nine months
•
Diesel engine services – accretive earnings from Global and Marine Engine Specialist acquisitions, as well as continued strong service and direct parts sales in the majority of its markets
Market Conditions
2006 First Nine Months
33
•
2006 fourth quarter earnings per share guidance of $.40 to $.45, compared with $.38 for 2005 fourth quarter
•
Guidance based on:
•
Marine transportation operating fundamentals remain strong
•
Diesel engine services operating fundamentals remain strong
•
2006 year earnings per share guidance of $1.74 to $1.79, compared with $1.33 for 2005
2006 Fourth Quarter and Year
Outlook
34
Future Growth Opportunities
•
Acquire inland tank barge operations
–
Kirby operates more efficiently due to size and distribution system
–
Competitors face fleet replacement decisions
–
Outsourcing by shippers provides growth opportunities
–
Customers seek to single source their requirements
•
Expand services related to marine operations
–
Purchased two-thirds interest in Osprey Line, a provider of container on barge feeder service
–
Purchased remaining 65% interest in four offshore dry-bulk barge/tug units in March 2006
–
Manage or acquire marine facilities
•
Expand diesel engine service operations
–
Purchased Global Power Holding Company and Marine Engine Specialists, Gulf Coast high-speed diesel engine services providers
–
Existing geographic foot print presents opportunities for expansion
–
Continue to develop exclusive parts distribution relationships
35
35
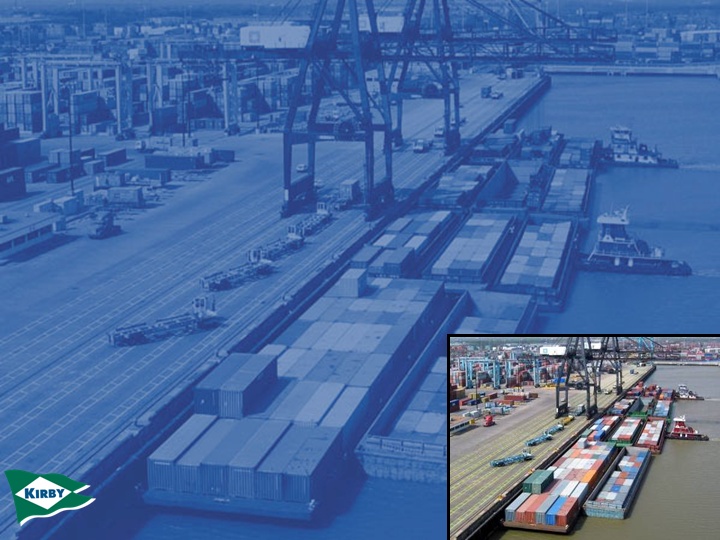
Osprey Line, LLC
•
Purchased one-third interest in April 2004
•
Increased ownership to two-thirds in January 2006
•
Transports containers on barge on U.S. inland waterway system
•
Future growth opportunity as U.S. contends with congestion problems
•
Provides attractive alternative to rail and truck
•
Very complementary to Kirby’s existing distribution system and customer base
36
Financial Highlights
37
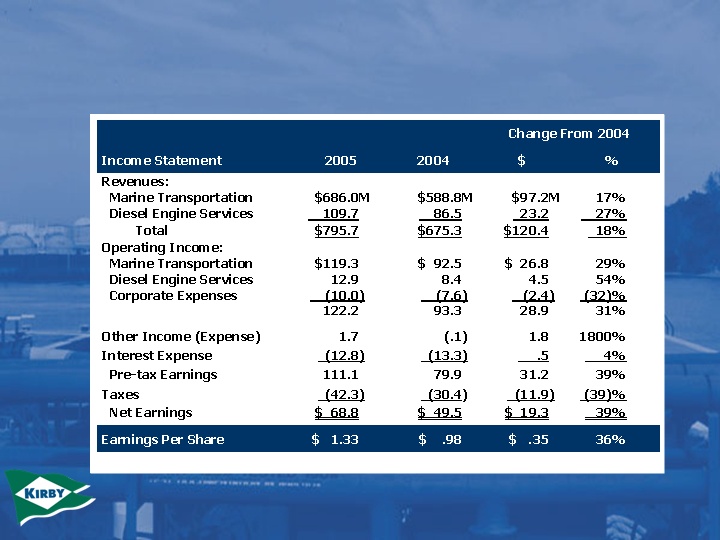
For Year Ended December 31, 2005
38
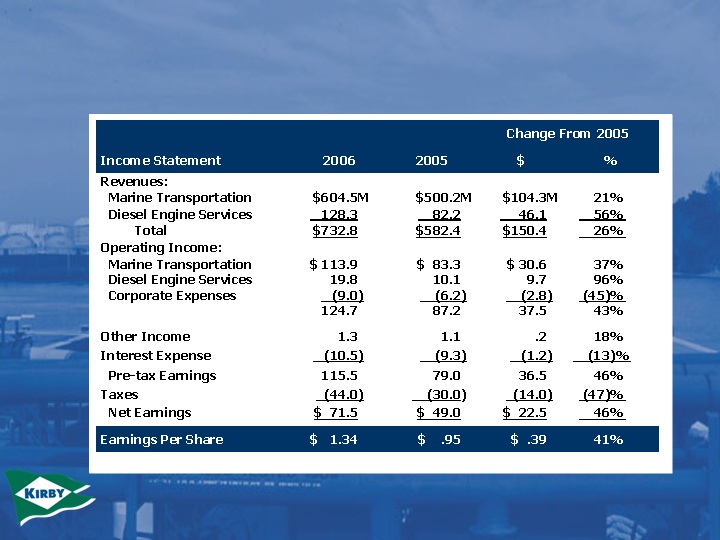
For First Nine Months Ended
September 30, 2006
39
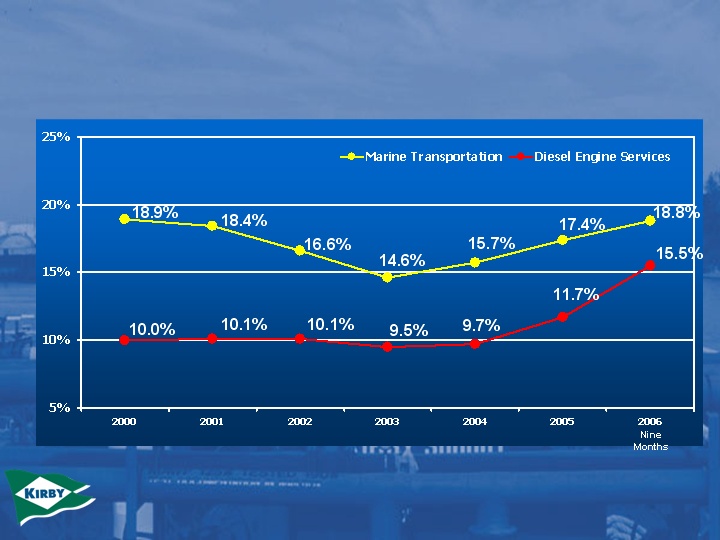
Operating Margins
40
11.9% growth
rate from
1994 - 2005
See Appendix for reconciliation of GAAP net earnings to Non-GAAP EBITDA
EBITDA Per Share Growth
41
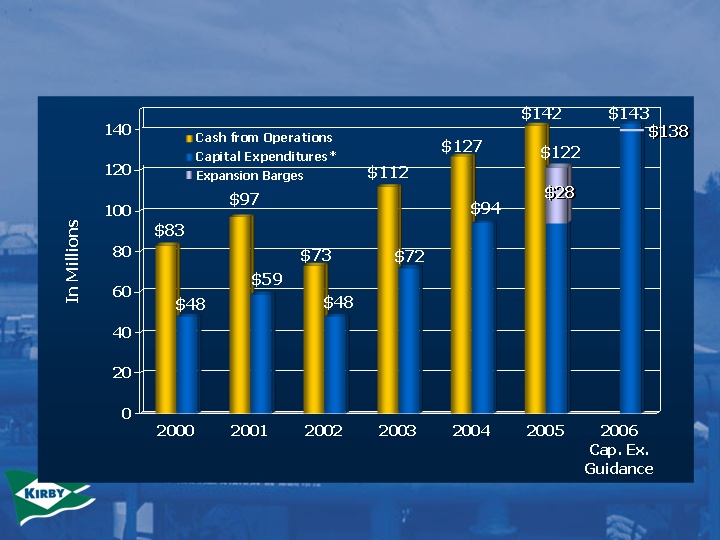
* Excluding acquisitions
Cash Flows
42
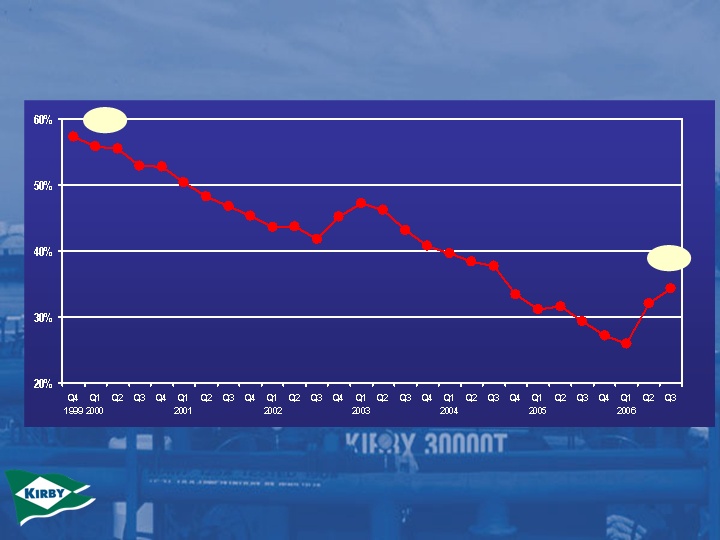
34.3%
57.3%
Debt / Capitalization
43
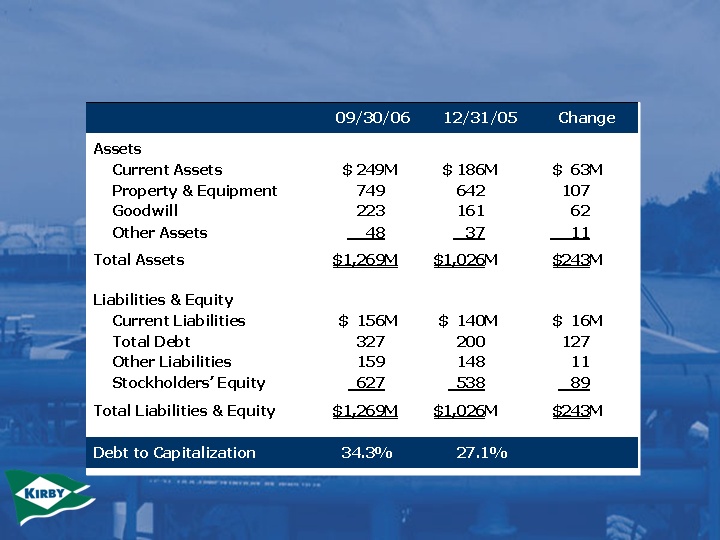
Balance Sheet
44
•
Investment grade public debt
–
Standard & Poor’s – BBB+
–
Moody’s – Baa3
•
8-year unsecured Private Placement due 2013
–
$200 million outstanding
–
Floating rate of LIBOR +0.5%
–
No required principal payments until maturity
•
$250 Million Revolving Credit Facility
–
Accordion feature allows maximum amount to increase to $325 million without amendment
•
Protection against interest rate increases
–
$150 million of interest rate swaps
Financial Strength
45
Why Invest In Kirby?
46
•
Consistent long-term record of success in our two core businesses
•
Excellent business fundamentals
•
Strong free cash flow for growth
•
Internal and external growth opportunities in core businesses
•
Strong operating leverage with every 1% increase in marine transportation segment margin adds $.08 per share to earnings; for diesel segment, adds $.02 per share to earnings
•
Fleet expansions will improve asset utilization, operating efficiencies and reduce costs
Why Invest in Kirby?
47
Thank You For Listening to Our Story
Kirby Corporation
Putting America’s
Waterways to Work
48
Appendix
49
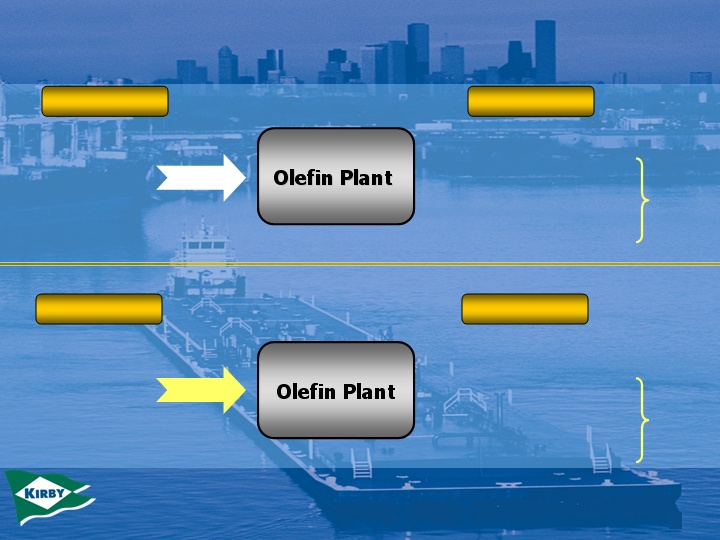
Petrochemical Plant Inputs and Products
Natural Gas
è
Ethylene 80%
Naptha
20%
77%
Feedstock
Feedstock
Products
Products
Source: Petrochemicals by Burdick & Leffer
è
Propylene 3%
è
Butylene 2%
è
Others 15%
è
Ethylene 23%
è
Propylene 13%
è
Butylene 15%
è
Others 49%
50