Slide 1
It’s a pleasure to be here today and to have the opportunity to share the LaBarge story and discuss with you the reasons we’re so positive as we look to the future of LaBarge.
That may sound like a bit of a bold statement given what’s happening to many companies right now in the midst of this prolonged economic slowdown going on both here and abroad. Although our shipments and profits are not setting records right now, wearepleased with how effectively our diversified market strategy has performed one of its key functions by mitigating the impact of these slow economic times. And, we’re fortunate to have the financial resources and outstanding customer relationships that provide a strong foundation for our business going forward.
| A Framework for Value Creation An Overview of LaBarge, Inc. May 2003 |
Slide 2
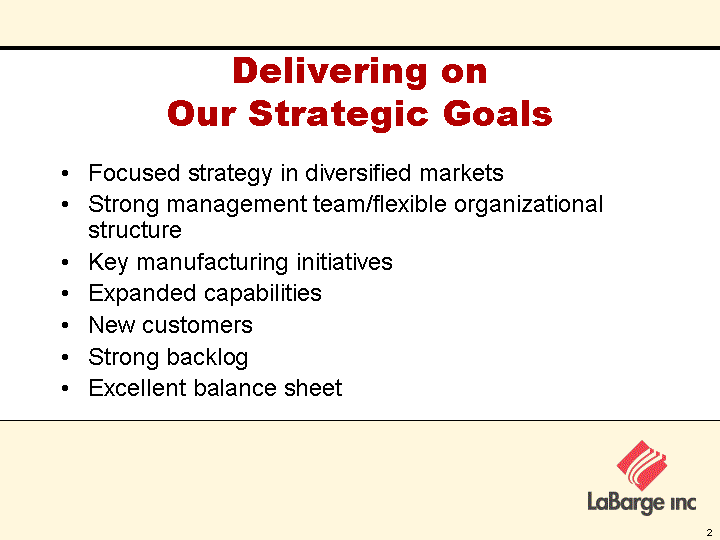
I’d like to begin by sharing with you some of our key accomplishments during the last couple of years. First, we are making important strides in executing our focused business strategy in diversified markets. Second, we’re realizing important contributions from a strengthened management team and a flexible organizational structure. Third, we have implemented key manufacturing initiatives that are reducing costs and improving productivity. In addition, we have expanded our capabilities and developed important new customers. Our backlog of unshipped orders is robust and growing. And, finally, we have an excellent balance sheet with debt, quite literally, at its lowest level in many years, and healthy operations that are generating cash.
| Delivering on Our Strategic Goals Focused strategy in diversified markets Strong management team/flexible organizational structure Key manufacturing initiatives Expanded capabilities New customers Strong backlog Excellent balance sheet |
Slide 3

Before I elaborate further on these accomplishments, I’d like to take a few minutes and give you a brief overview of LaBarge’s business and where we fit in our industry.
As the slide says, LaBarge is a contract manufacturer of sophisticated electronic equipment for customers in a wide variety of technology-driven markets.
| Electronics Manufacturing Services Contract design and manufacturing services for sophisticated, high- reliability electronics to customers in a wide variety of technology- driven markets 3 |
Slide 4
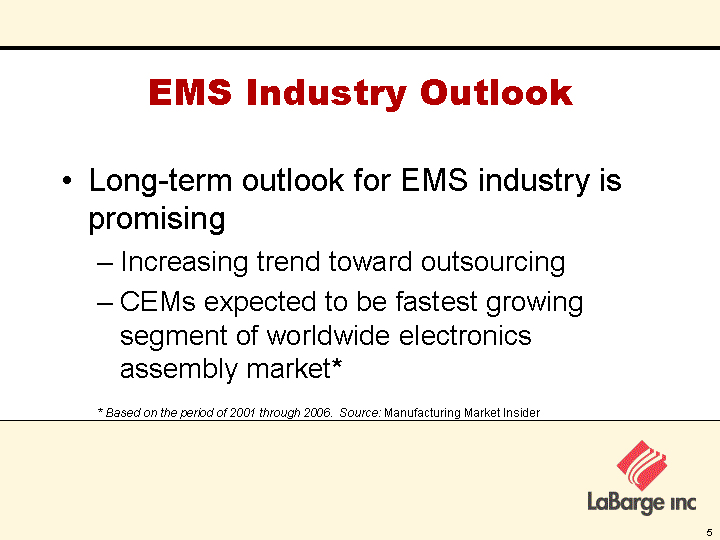
Our own industry is called electronics manufacturing services, or EMS for short. It’s quite large, estimated to generate annual worldwide revenues of at least $100 billion.
In addition to being large, it’s very diverse and fragmented. What I mean by that is that the range of companies that make up the industry is dramatic. There’s everything from small mom-and-pop job shops to highly automated factories. The industry’s collective capabilities range from simple electronic assembly to sophisticated high-tech systems. And production volumes range from small quantities of custom assemblies used in industrial applications to large production runs of consumer electronics.
| Electronics Manufacturing Services $100 billion worldwide market Diverse and fragmented Job shops to highly automated factories Simple assembly to high-tech electronics Low volume to high volume |
Slide 5
Critical to LaBarge’s success, of course, is the long-term health of the EMS industry. This industry has enjoyed significant growth in recent years. And, although the EMS industry has recently felt the effect of weak economic conditions, most industry analysts agree that the long-term future of the EMS industry is promising.
The trend toward outsourcing is increasing and contract electronics manufacturers like LaBarge are expected to be the fastest growing segment of the worldwide electronics assembly market.
| EMS Industry Outlook Long-term outlook for EMS industry is promising Increasing trend toward outsourcing CEMs expected to be fastest growing segment of worldwide electronics assembly market* * Based on the period of 2001 through 2006. Source: Manufacturing Market Insider |
Slide 6
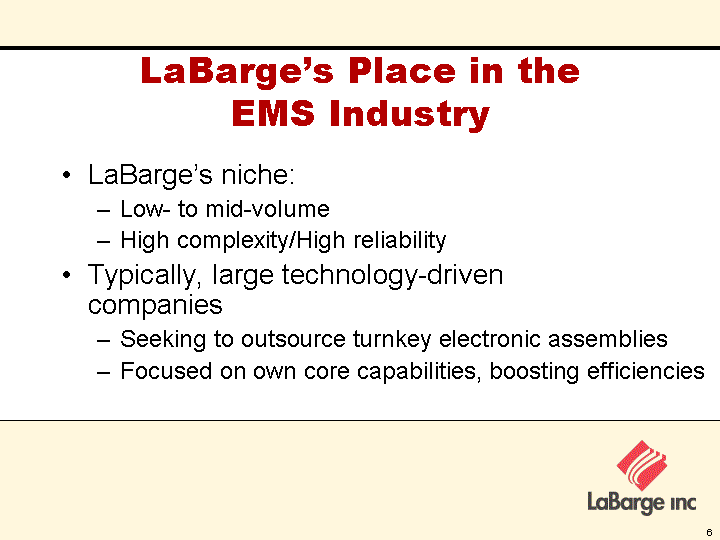
So, where does LaBarge fit in the EMS industry?
Our niche is low- to medium-volume production of high complexity, high reliability electronic assemblies.
Our customers are typically, large original equipment manufacturers. Although they span many different markets, they have a lot in common: they tend to be leaders in their respective industries, their businesses are technology-oriented and they have a need for high-performance electronics either for their own capital equipment needs or to meet their own customers’ requirements. To meet these needs, they are choosing to reduce the amount of manufacturing done in-house in favor of outsourcing the production to specialty manufacturers that can do the job faster and more cost effectively.
| LaBarge's Place in the EMS Industry LaBarge's niche: Low- to mid-volume High complexity/High reliability Typically, large technology-driven companies Seeking to outsource turnkey electronic assemblies Focused on own core capabilities, boosting efficiencies |
Slide 7
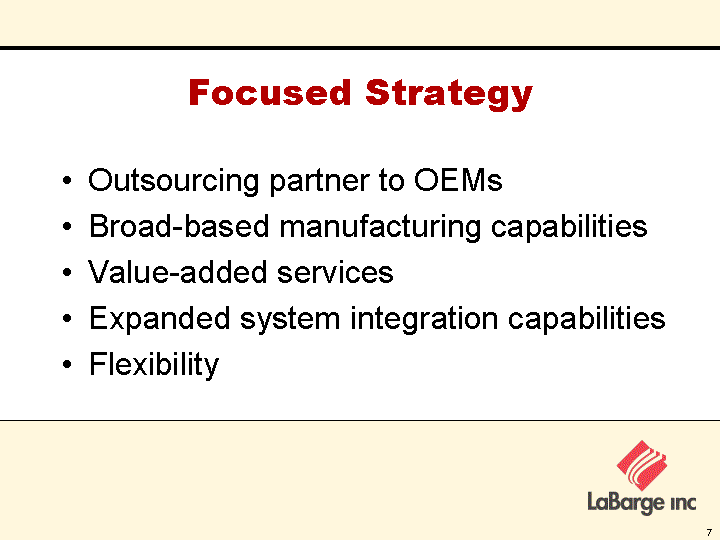
During the last few years, LaBarge has successfully refined and focused its strategy in the EMS industry to capitalize on its strengths. A key component of the strategy is to position LaBarge as a partner to large OEMs.
LaBarge’s niche is complex applications that require specialized, yet broad-based, manufacturing capabilities supported by value-added services such as engineering and product development.
By expanding its core competencies to include the integration of small subsystems into complete, higher-end assemblies, LaBarge can now add value to more highly engineered products, drawing on capabilities across the company.
In addition, flexibility is critical. The ability to quickly adapt its broad capabilities to meet customer needs has made LaBarge a standout in its market niche. I’d like to elaborate on a few of these components of our strategy.
| Focused Strategy Outsourcing partner to OEMs Broad-based manufacturing capabilities Value-added services Expanded system integration capabilities Flexibility |
Slide 8
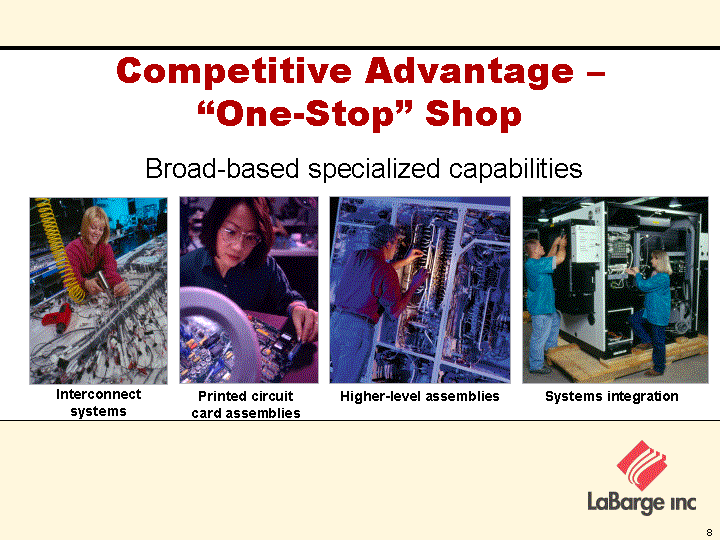
Our broad-based capabilities allow LaBarge to provide customers a “one-stop-shop” solution to their outsourcing needs. These specialized capabilities include complex interconnect systems, printed circuit board assemblies, higher-level electronic assemblies and, as I just mentioned, systems integration.
| Competitive Advantage - "One-Stop" Shop Broad-based specialized capabilities Interconnect systems Printed circuit card assemblies Higher-level assemblies Systems integration |
Slide 9
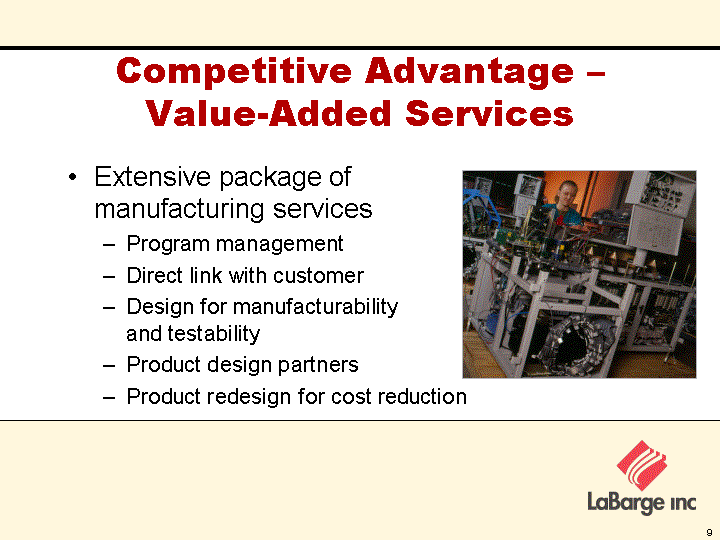
Coupled with these capabilities is an extensive package of value-added manufacturing services, ranging from program management to engineering, that allows LaBarge to be a real partner to its customers, focused on finding a complete solution to their needs rather than merely building a product.
| Competitive Advantage - Value-Added Services Extensive package of manufacturing services Program management Direct link with customer Design for manufacturability and testability Product design partners Product redesign for cost reduction |
Slide 10
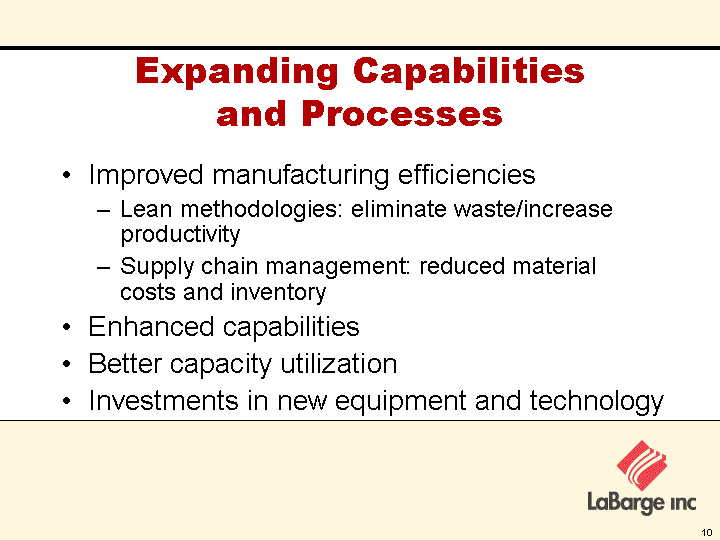
We’re also making excellent progress in our ongoing initiatives to improve manufacturing efficiencies, enhance capabilities and effectively utilize capacity. We have made additional investments in new equipment, and have reconfigured and augmented the capabilities of all our facilities to provide more flexibility with regard to product mix and scheduling. These enhancements have created a real competitive advantage for LaBarge as the shared resources of our facilities prompt more customers to consider us a turnkey solution for their electronics outsourcing needs.
In addition, our success in winning bigger contracts with larger integration components has prompted continuous assessment of our overall capabilities to ensure we remain aligned with the needs of our customers.
| Expanding Capabilities and Processes Improved manufacturing efficiencies Lean methodologies: eliminate waste/increase productivity Supply chain management: reduced material costs and inventory Enhanced capabilities Better capacity utilization Investments in new equipment and technology |
Slide 11
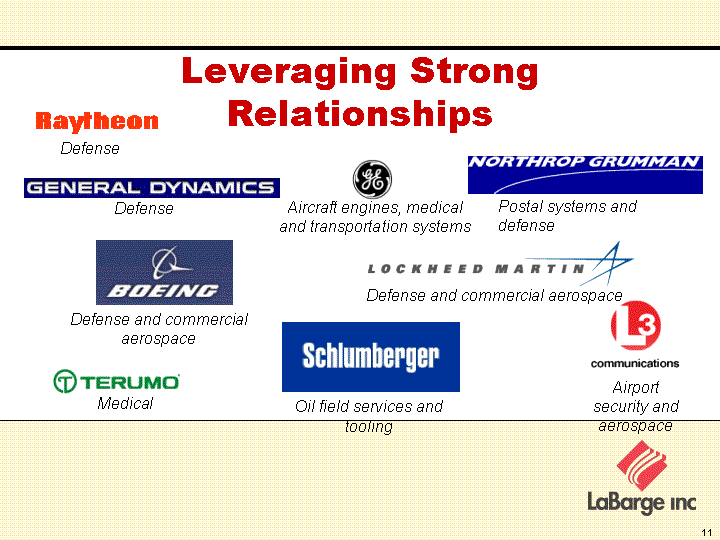
Our customers are typically industry leaders, often in the Fortune 100, who appreciate LaBarge’s superior capabilities and performance. They are looking for a trusted outsourcing partner on which they can consistently rely. The stakes are high since many OEMs are consolidating their supplier lists, rather than expanding them. Two such customers are Northrop Grumman and Boeing, both of which have awarded LaBarge preferred supplier status.
Our established relationships with leaders in target growth areas, such as defense, government systems and commercial aerospace, are serving as a springboard to growth. Although weak economic conditions have caused some customers to pause, others are ramping up.
(continued)
| Leveraging Strong Relationships Postal systems and defense Oil field services and tooling Defense and commercial aerospace Aircraft engines, medical and transportation systems Defense Defense and commercial aerospace Medical Defense Airport security and aerospace |
Slide 12
Our market diversity is attractive to customers, too. When large companies pull back their outsourcing activities due to changing market demand, they sometimes later find their regular suppliers could not survive the downturn. LaBarge is equipped to ride out fluctuations in market activity better than many other providers whose fortunes are more heavily tied to one industry.
Slide 13
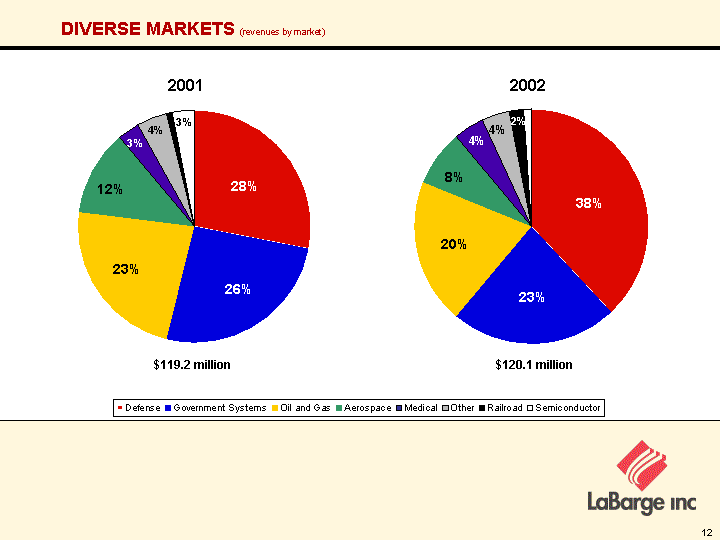
These two pie graphs illustrate what I’m talking about. In comparing fiscal 2001 and fiscal 2002 full-year revenues, you can see that while actual sales dollars were essentially the same for the two years, the breakdown of those sales was quite different. In fiscal 2002, the percentage of sales to defense customers — represented here in red — increased to 38 percent from 28 percent, while the percentage of sales attributable to customers in government systems — shown in blue, oil and gas — shown in yellow, and aerospace — shown in green, all declined from the year before.
| Defense Government Systems Oil and Gas Aerospace Medical Other Railroad Semiconductor 0.38 0.23 0.2 0.08 0.04 0.04 0.02 0.01 DIVERSE MARKETS (revenues by market) Defense Government Systems Oil and Gas Aerospace Medical Other Railroad Semiconductor 0.38 0.23 0.2 0.08 0.04 0.04 0.02 0.01 2002 Defense Government Systems Oil and Gas Aerospace Medical Other Railroad Semiconductor 0.28 0.26 0.23 0.12 0.03 0.04 0.01 0.03 2001 $119.2 million $120.1 million |
Slide 14
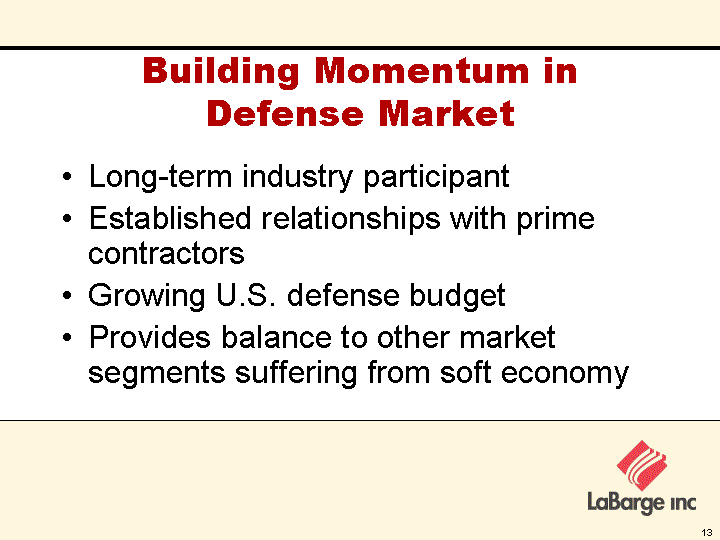
Clearly, an important contributor to our business right now is the momentum in the defense market. LaBarge has participated in this industry for many, many years, and, in fact, if you were to go back 10 or 15 years, you’d find that 90 percent or more of our annual revenue was generated by defense customers at that time.
As you saw just a few slides ago, we have strong and established relationships with all the major prime contractors. These relationships are advantageous during this current environment of increased defense spending.
And, our defense work provides balance to other market segments suffering from the soft economy.
| Building Momentum in Defense Market Long-term industry participant Established relationships with prime contractors Growing U.S. defense budget Provides balance to other market segments suffering from soft economy |
Slide 15
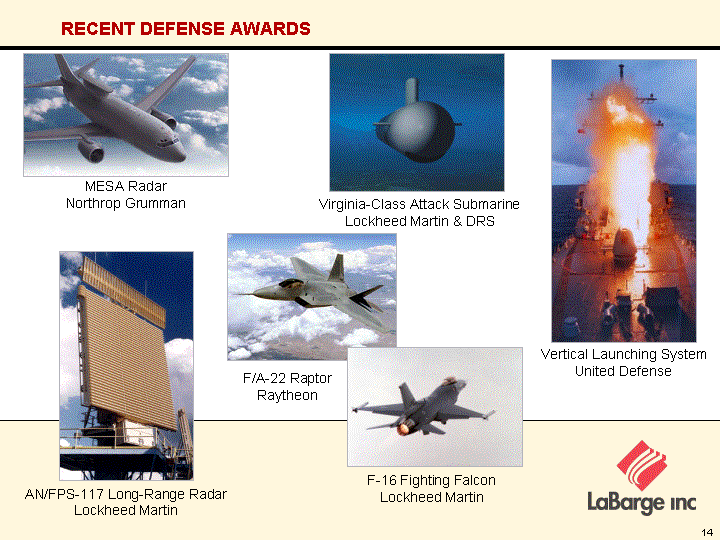
We are continuing to book new and follow-on defense contracts, and we recently announced several, including an arrangement with Northrop Grumman to supply subsystems for its new MESA radar; contracts with Lockheed Martin and DRS to provide cable assemblies and circuit cards for the U.S. Navy’s next-generation attack submarine; contracts with Raytheon and Northrop to provide electronic assemblies for the F/A-22 Raptor and F-16 aircraft, respectively; as well as a variety of other agreements to supply prime contractors with mission-critical electronic equipment.
| F/A-22 Raptor Raytheon MESA Radar Northrop Grumman RECENT DEFENSE AWARDS AN/FPS-117 Long-Range Radar Lockheed Martin Vertical Launching System United Defense Virginia-Class Attack Submarine Lockheed Martin & DRS F-16 Fighting Falcon Lockheed Martin |
Slide 16
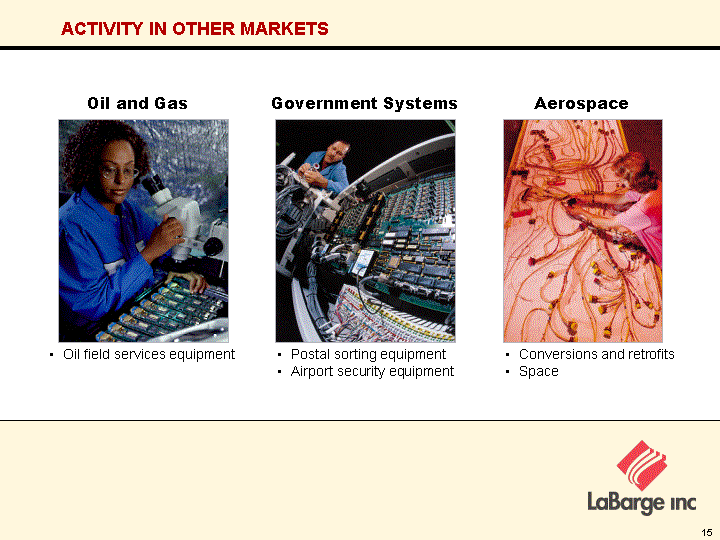
Activity in our other major markets has been steady. In the oil and gas market, which represents about 17 percent of our revenue year-to-date, we make capital equipment used by our customers for exploration and production. Government systems, where we make equipment used in postal sorting and airport security applications, contributes approximately 14 percent of sales. And, the commercial aerospace market, where we make electronic equipment used in aircraft retrofits and conversions, as well as in space applications such as satellites and space launch vehicles, represents 8 percent of revenues.
| ACTIVITY IN OTHER MARKETS Government Systems Postal sorting equipment Airport security equipment Oil and Gas Oil field services equipment Aerospace Conversions and retrofits Space |
Slide 17
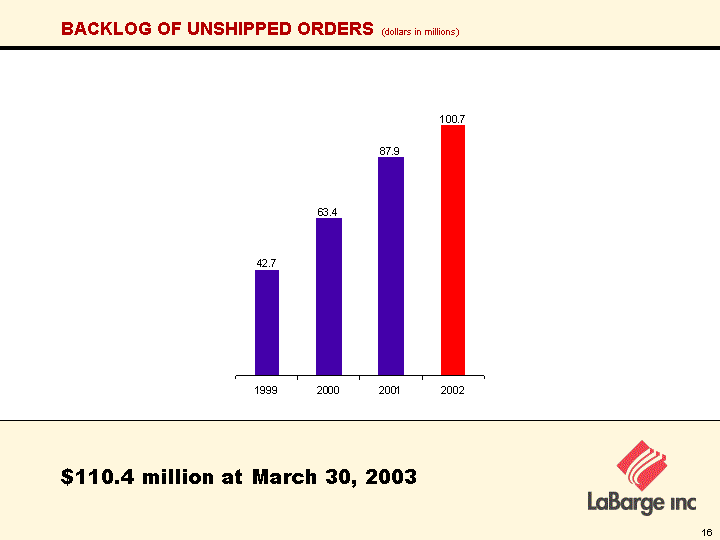
The success of our approach is well illustrated by our backlog, which set a year-end record of $100.7 million at the end of fiscal 2002 and has beaten that number every quarter since. At the end of March, backlog had grown to more than $110 million. Backlog has been consistently increasing year-over-year since fiscal 2000, the result of our focused sales effort, increased capabilities and diversified market approach.
| BACKLOG OF UNSHIPPED ORDERS (dollars in millions) 1999 2000 2001 2002 42.7 63.4 87.9 100.7 $110.4 million at March 30, 2003 |
Slide 18
We also have an active effort underway to supplement our internal growth through acquisition. The opportunities we are looking for are those that fit well with our core electronics manufacturing business and can add new customers, enhanced capabilities and, when necessary, more manufacturing capacity. We are not looking for a turnaround situation. We are committed to completing only the right, reasonably priced acquisitions to advance the company’s growth goals.
| Acquisition Strategy Aggressively pursuing companies that: Are compatible with LB's core electronics manufacturing business Bring: New customers Enhanced capabilities Manufacturing capacity Are reasonably priced/accretive to LB's EPS |
Slide 19

Those of you who are familiar with LaBarge will recall that last fall we sold the railroad portion of our ScadaNET Network business to General Electric in a transaction valued at $6.8 million.
In connection with the sale, LaBarge and GE entered into a manufacturing agreement under which LaBarge will continue to produce the ScadaNET hardware, and which gives LaBarge the opportunity for additional manufacturing business. As part of the deal, LaBarge retained the rights to utilize the ScadaNET Network technology in industries other than railroad. In March, we announced that we would divest the remainder of the ScadaNET business and we are currently in discussions with a small number of prospective buyers.
(pause)
| Sale of ScadaNET Network Railroad Assets Purchased by GE Transportation Systems Global Signaling, LLC Transaction valued at $6.8 million LaBarge will produce ScadaNET hardware for GE LaBarge retains rights to other industries; pursuing divestiture |
Slide 20
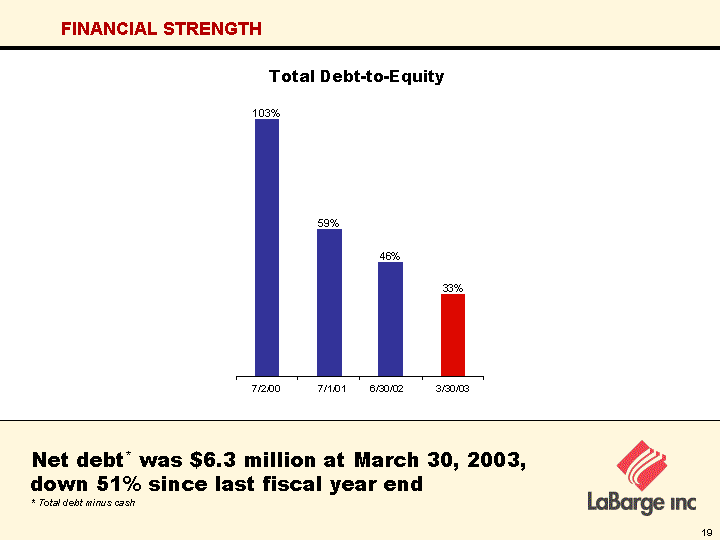
I’d like to turn now to LaBarge’s financial strength. We are operating with an extremely healthy balance sheet. At March 30, our total-debt-to-equity ratio was .33 to 1. As you can see from the graph, this ratio has steadily improved over the last few years. This is largely attributable to our successful efforts to reduce debt. In fact, at March 30, our net debt — that is, total debt minus cash — was $6.3 million, down 51 percent since last fiscal year end.
| FINANCIAL STRENGTH 2000 2001 2002 3/29/1999 1.03 0.59 0.46 0.33 7/2/00 7/1/01 6/30/02 3/30/03 Net debt* was $6.3 million at March 30, 2003, down 51% since last fiscal year end * Total debt minus cash Total Debt-to-Equity |
Slide 21
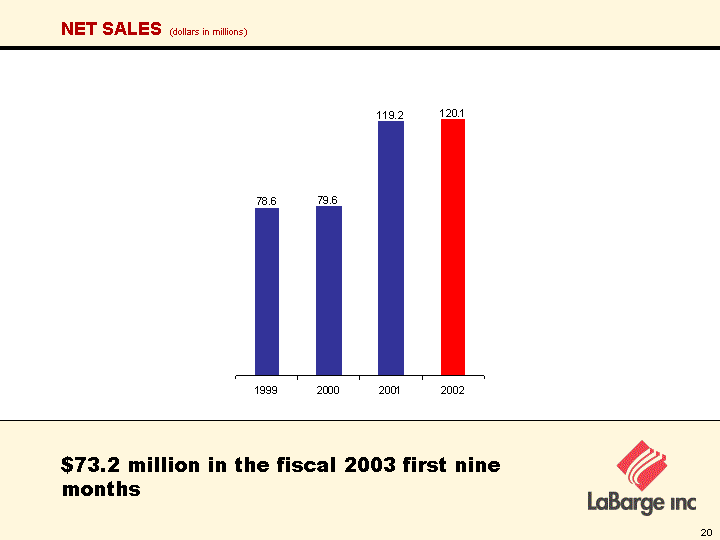
Net sales for the last full fiscal year came in at just over $120 million. Through the first three quarters of the current fiscal year, net sales were $73.2 million. At this point in the year, it would be very difficult to surpass last year’s full-year results and we don’t expect to. However, with our robust backlog, we expect fiscal 2004 to shape up nicely.
| NET SALES (dollars in millions) 1999 2000 2001 2002 78.6 79.6 119.2 120.1 $73.2 million in the fiscal 2003 first nine months |
Slide 22
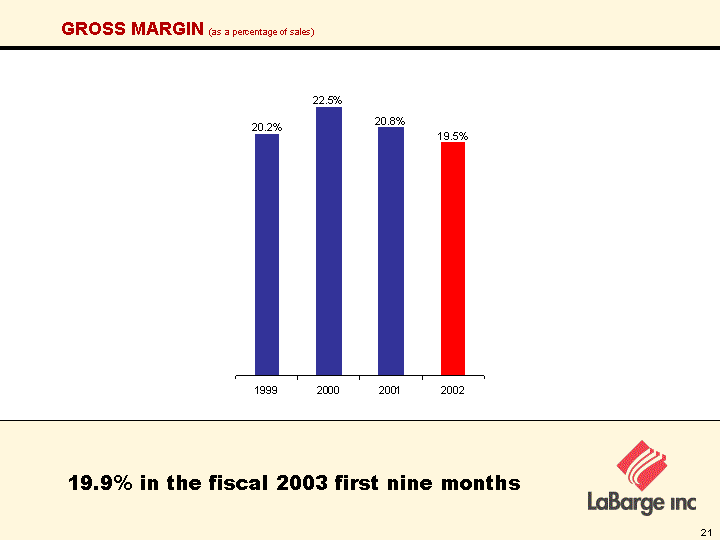
LaBarge’s gross margins historically run in the 20 to 23 percent range and that is holding true for the current fiscal year. Although lower sales volume negatively impacted gross margins early in the year, margins have begun to recover and we anticipate that improvement will continue during the rest of this fiscal year and into next.
| GROSS MARGIN (as a percentage of sales) 1999 2000 2001 2002 0.202 0.225 0.208 0.195 19.9% in the fiscal 2003 first nine months |
Slide 23
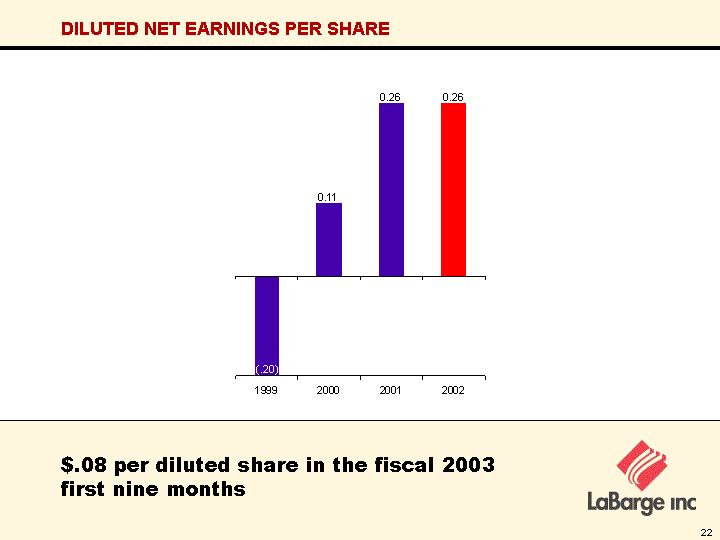
As you can see, earnings follow suit with revenues. Last fiscal year, LaBarge earned 26 cents per diluted share. Through the first nine months of the current fiscal year, continuing operations generated earnings of 13 cents per diluted share and discontinued operations resulted in a net loss of 5 cents per diluted share. As a result, year-to-datenetearnings were 8 cents per share.
| DILUTED NET EARNINGS PER SHARE 1999 2000 2001 2002 -0.15 0.11 0.26 0.26 $.08 per diluted share in the fiscal 2003 first nine months |
Slide 24
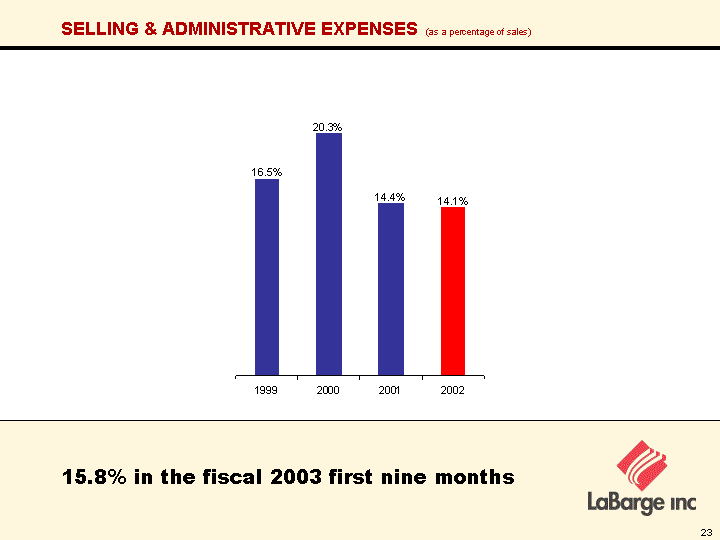
Selling and administrative expenses ran just over 14 percent of sales in the last full fiscal year. Through the first nine months of the current year, SG&A expenses were 15.8 percent of sales. However, this number has improved throughout the year as many of our efficiency improvements have begun to yield results. We have achieved levels of 12 percent in the recent past and have ongoing efforts to contain expenses.
| SELLING & ADMINISTRATIVE EXPENSES (as a percentage of sales) 1999 2000 2001 2002 0.165 0.203 0.144 0.141 15.8% in the fiscal 2003 first nine months |
Slide 25
As we look ahead, we know that the current economic uncertainty presents us with challenges. But, despite this uncertainty, here’s what weknowabout our business:
| | • | | Our weakest quarter of the current fiscal year was the first quarter. |
| |
| | • | | Our second and third quarters showed sequential improvement. |
| |
| | • | | We believe fourth-quarter sales and profits will be up from the third quarter. |
| |
| | • | | Our record backlog supports future growth. |
| |
| | • | | And, we expect further growth of our backlog. |
| Results/Outlook Challenges from economic uncertainty Weakest quarter was FY03 first quarter Second and third quarters improved sequentially Anticipate fourth-quarter sales and profits will be up from the third quarter Record backlog supports growth in future quarters Expect further growth in backlog |
Slide 26
To conclude, I’d just like to recap the components that are driving LaBarge’s future growth.
| | • | | LaBarge has an excellent reputation with customers in diverse industries. |
| |
| | • | | We believe the current momentum in defense will translate into additional growth. |
| |
| | • | | Ongoing investments in people, facilities and technology are improving LaBarge’s competitive edge. |
| |
| | • | | We are broadening our reach by targeting new customers, attaining new proprietary skills and seeking attractive EMS industry acquisitions. |
| |
| | • | | We are experiencing increased bidding activity which will further strengthen our robust backlog. |
| |
| | • | | LaBarge is in excellent financial health and has the resources to attain future growth. |
I appreciate your interest and attention here today, and now I’d be happy to take any questions you may have.
| LaBarge's Focused Commitment to Aggressive, Profitable Growth Excellent reputation and customer base in diverse industries Significant growth potential in defense Investment in people, facilities and technology Broadening our reach Target new customers Attain new proprietary skills Seek attractive EMS industry acquisitions Increased bidding activity/strong backlog Excellent balance sheet |