Exhibit 99.3
Item 7. Management’s Discussion and Analysis of Financial Condition and Results of Operations.
HIGHLIGHTS
Sales decreased in 2016, with growth in unit volume and acquisitions more than offset by divestitures, raw material-related price deflation, and currency impact. Sales growth continued in Automotive, reflecting content gains and new program awards, but several other businesses experienced soft market demand and lower unit volume during the year.
Earnings from continuing operations increased reflecting several factors, including divestiture gains, lower income taxes, and reduced share count. Steel inflation in late 2016 and the non-recurrence of a pricing lag benefit associated with deflation in late 2015 offset the benefit from increased unit volume.
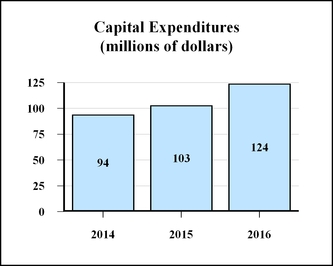
We continue to optimize our portfolio by increasing investment in those businesses that possess strong competitive advantage and reducing our exposure to businesses and markets that are less attractive. We increased capital expenditures in 2016 to support product categories that are growing. In addition, we acquired three small businesses and purchased the remaining minority interest in a key Automotive joint venture in China. We also divested four small operations during the year.
Operating cash flow increased significantly versus 2015 levels. Payments made to settle foam litigation in 2015 did not recur, and in 2016 we received litigation settlement proceeds related to a separate matter. Cash from operations also benefited from reduced working capital.
We raised the quarterly dividend by 6% in 2016 (the largest increase since 2007) and extended our record of consecutive annual increases to 45 years. We also bought back 4.5 million shares of our stock.
During the year, we extended the term of and expanded the borrowing capacity under our revolving credit facility to $750 million and correspondingly increased our commercial paper program. We ended 2016 with net debt to net capital comfortably within our long-standing targeted range of 30-40%, as discussed on page 20.
We assess our overall performance by comparing our Total Shareholder Return (TSR) to that of peer companies on a rolling three-year basis. We target TSR in the top third of the S&P 500 over the long term. For the three years ended December 31, 2016, we generated TSR in the top 11% of the S&P 500.
With this top-third TSR goal continuing to be our primary long-term financial objective, in September we revised our TSR framework to place a moderately higher emphasis on disciplined growth and a lesser requirement on further profit margin expansion.
These topics are discussed in more detail in the sections that follow.
1
Exhibit 99.3
INTRODUCTION
Total Shareholder Return
Total Shareholder Return (TSR), relative to peer companies, is the key financial measure that we use to assess long-term performance. TSR is driven by the change in our share price and the dividends we pay: TSR = (Change in Stock Price + Dividends) / Beginning Stock Price. We seek to achieve TSR in the top third of the S&P 500 over the long-term through an approach that employs four TSR drivers: revenue growth, margin expansion, dividends, and share repurchases.
We monitor our TSR performance relative to the S&P 500 on a rolling three-year basis. For the three-year measurement period that ended December 31, 2016, we generated TSR of 20% per year on average, well above the S&P 500's 9% annual TSR for that same time period. That performance placed us in the top 11% of the S&P 500, achieving our top-third goal.
During 2016, we reevaluated our long-standing TSR framework and concluded that a few modifications were appropriate. We moderately increased the expected long-term contribution from revenue growth (to 6-9% per year on average) and reduced the expected benefit from additional EBIT margin increases. The table below shows the components of TSR, including our prior targets and our revised current targets. Accomplishing this level of performance over rolling three-year periods should enable us to consistently attain our top-third TSR goal.
| Prior Targets | Current Targets | ||
| Revenue Growth | 4-5% | 6-9% | |
| Margin Increase | 2-3% | 1% | |
| Change in Multiple | - | - | |
| Dividend Yield | 3-4% | 3% | |
| Stock Buyback | 2-4% | 1% | |
| Total Shareholder Return | 12-15% | 11-14% | |
Customers
We serve a broad suite of customers, with our largest customer representing approximately 7% of our sales. Many are companies whose names are widely recognized. They include most producers of residential furniture and bedding, automotive and office seating manufacturers, and a variety of other companies.
Major Factors That Impact Our Business
Many factors impact our business, but those that generally have the greatest impact are market demand, raw material cost trends, and competition.
Market Demand
Market demand (including product mix) is impacted by several economic factors, with consumer confidence being most significant. Other important factors include disposable income levels, employment levels, housing turnover, and interest rates. All of these factors influence consumer spending on durable goods, and therefore affect demand for our components and products. Some of these factors also influence business spending on facilities and equipment, which impacts approximately 20% of our sales.
2
Exhibit 99.3
Raw Material Costs
In many of our businesses, we enjoy a cost advantage from being vertically integrated into steel wire and rod. This is a benefit that our competitors do not have. We also experience favorable purchasing leverage from buying large quantities of raw materials. Still, our costs can vary significantly as market prices for raw materials (many of which are commodities) fluctuate.
We typically have short-term commitments from our suppliers; accordingly, our raw material costs generally move with the market. Our ability to recover higher costs (through selling price increases) is crucial. When we experience significant increases in raw material costs, we typically implement price increases to recover the higher costs. Conversely, when costs decrease significantly, we generally pass those lower costs through to our customers. The timing of our price increases or decreases is important; we typically experience a lag in recovering higher costs, and we also realize a lag as costs decline.
Steel is our principal raw material. At various times in past years we have experienced significant cost fluctuations in this commodity. In most cases, the major changes (both increases and decreases) were passed through to customers with selling price adjustments. Throughout 2015, market prices for steel scrap, rod, and flat-rolled products decreased significantly, leading to downward pressure on selling prices. We realized a beneficial pricing lag during 2015, as costs generally decreased at a faster rate than selling prices. In 2016, steel costs have once again become volatile. Steel inflation during the first half of the year was followed by deflation in the third quarter, and significant inflation late in the year. With the normal lag in selling price increases, this cost inflation led to margin pressure in the fourth quarter. We are implementing price increases in 2017 to recover the higher costs.
As a producer of steel rod, we are also impacted by changes in metal margins (the difference between the cost of steel scrap and the market price for steel rod). Metal margins within the steel industry have been volatile in past years and were moderately compressed in late 2016.
Our other raw materials include woven and non-woven fabrics, foam scrap, and chemicals. We have experienced changes in the cost of these materials in past years and generally have been able to pass them through to our customers.
When we raise our prices to recover higher raw material costs, this sometimes causes customers to modify their product designs and replace higher cost components with lower cost components. We must continue providing product options to our customers that enable them to improve the functionality of their products and manage their costs, while providing higher profits for our operations.
Competition
Many of our markets are highly competitive, with the number of competitors varying by product line. In general, our competitors tend to be smaller, private companies. Many of our competitors, both domestic and foreign, compete primarily on the basis of price. Our success has stemmed from the ability to remain price competitive, while delivering innovation, better product quality, and customer service.
We continue to face pressure from foreign competitors as some of our customers source a portion of their components and finished products offshore. In addition to lower labor rates, foreign competitors benefit (at times) from lower raw material costs. They may also benefit from currency factors and more lenient regulatory climates. We typically remain price competitive, even versus many foreign manufacturers, as a result of our highly efficient operations, low labor content, vertical integration in steel and wire, logistics and distribution efficiencies, and large scale purchasing of raw materials and commodities. However, we have also reacted to foreign competition in certain cases by selectively adjusting prices, and by developing new proprietary products that help our customers reduce total costs.
Since 2009, there have been antidumping duty orders on innerspring imports from China, South Africa and Vietnam, ranging from 116% to 234%. In March 2014, the Department of Commerce (DOC) and the International
3
Exhibit 99.3
Trade Commission (ITC) determined that the duties should be continued. In April 2014, the DOC published its final order continuing the duties through February 2019 (for China) and December 2018 (for South Africa and Vietnam).
An antidumping and countervailing duty case filed in January 2014 by major U.S. steel wire rod producers was concluded in December 2014, resulting in the imposition of duties on imports of Chinese steel wire rod. The antidumping duties range from 106% to 110% and the countervailing duties range from 178% to 193%. Both remain in effect through December 2019.
Because of the documented evasion of antidumping orders by certain importers, typically shipping goods through third countries and falsely identifying the countries of origin, Leggett and several other U.S. manufacturers formed a coalition to seek stronger enforcement of existing antidumping and/or countervailing duty orders. As a result of these efforts, the U.S. Congress passed the Enforcing Orders and Reducing Customs Evasion (ENFORCE) Act. The ENFORCE Act requires U.S. Customs and Border Protection to implement a transparent, time-limited process to investigate allegations of duty evasion and to assess duties where appropriate.
Leggett Settles Claims as Plaintiff
We previously disclosed that we were a plaintiff in an antitrust case against The Dow Chemical Company. We, along with other plaintiffs, alleged that several defendants conspired to fix prices and allocate customers and markets for certain urethane chemical products. We reached a settlement for our antitrust claims against The Dow Chemical Company in 2016 by agreeing to release our claims regarding this matter for a net cash payment of approximately $38 million (pretax, after deducting expenses). We received payment in 2016 and recorded after-tax income of $25 million. Because the settlement is largely attributable to our former Prime Foam Products business, $20 million was reflected in discontinued operations.
Change in Segment Reporting for 2017
Our reportable segments are the same as our operating segments, which also correspond with our management organizational structure. In conjunction with a change in executive officers, our management organizational structure and all related internal reporting changed as of January 1, 2017. Effective January 1, 2017, Perry E. Davis became President of the Residential Products and Industrial Products segments, and J. Mitchell Dolloff became President of the Specialized Products and Furniture Products segments.
The composition of our four segments has changed effective January 1, 2017. The table below outlines the new segment structure. We reported under this new structure when we filed our 2017 first quarter 10-Q.
| Residential Products | Industrial Products | Furniture Products | Specialized Products |
| Bedding Group | Wire Group | Home Furniture Group | Automotive Group |
| Fabric & Carpet Cushion Group | Work Furniture Group | Aerospace Products Group | |
| Machinery Group | Consumer Products Group | CVP Group | |
The new structure is largely the same as in prior years except that the Home Furniture Group has been moved from Residential Products (formerly Residential Furnishings) to Furniture Products (formerly Commercial Products), and the Machinery Group has been moved from Specialized Products to Residential Products. The Industrial Products segment (formerly Industrial Materials) had no changes.
4
Exhibit 99.3
Previously all of our segments used the first-in, first-out (FIFO) method for valuing inventory. In our consolidated financials, an adjustment was made at the corporate level (i.e., outside the segments) to convert about 50% of our inventories to the last-in, first-out (LIFO) method. These are primarily our domestic, steel-related inventories. Effective January 1, 2017, the LIFO impact was recognized within the segment to which it relates.
RESULTS OF OPERATIONS—2016 vs. 2015
Sales decreased 4% in 2016, with slightly higher unit volume and acquisitions more than offset by divestitures, raw material-related price deflation, and currency impact. Sales growth continued in Automotive, reflecting content gains and new program awards, but several other businesses experienced soft market demand and lower unit volume during the year.
Earnings from continuing operations increased from several factors, including divestiture gains. The benefit from increased unit volume and lower income taxes was partially offset by steel inflation and the non-recurrence of a pricing lag benefit associated with deflation late in 2015. Further details about our consolidated and segment results are discussed below.
Consolidated Results (continuing operations)
The following table shows the changes in sales and earnings from continuing operations during 2016, and identifies the major factors contributing to the changes.
| (Dollar amounts in millions, except per share data) | Amount | % | ||||
| Net sales: | ||||||
| Year ended December 31, 2015 | $ | 3,917 | ||||
| Divestitures | (141 | ) | (4 | )% | ||
| 2015 sales excluding divestitures | 3,776 | |||||
| Approximate volume gains | 58 | 2 | % | |||
| Approximate raw material-related deflation and currency impact | (111 | ) | (3 | )% | ||
| Same location sales | (53 | ) | (1 | )% | ||
| Acquisition sales growth | 27 | 1 | % | |||
| Year ended December 31, 2016 | $ | 3,750 | (4 | )% | ||
| Earnings from continuing operations: | ||||||
| (Dollar amounts, net of tax) | ||||||
| Year ended December 31, 2015 | $ | 328 | ||||
| Divestiture gains | 17 | |||||
| Litigation settlement gain | 5 | |||||
| Non-recurrence of lump-sum pension buyout | 8 | |||||
| Other, including benefit from higher volume and lower income taxes, partially | ||||||
| offset by steel inflation and non-recurrence of prior year pricing lag benefit | 9 | |||||
| Year ended December 31, 2016 | $ | 367 | ||||
| Earnings Per Diluted Share (continuing operations)—2015 | $ | 2.27 | ||||
| Earnings Per Diluted Share (continuing operations)—2016 | $ | 2.62 | ||||
Sales decreased 4%, with unit volume growth and small acquisitions more than offset by divestitures, raw material-related price decreases, and currency impact. Strong growth in Automotive was partially offset by soft demand in several other markets, including bedding and home furniture.
5
Exhibit 99.3
During 2016, we divested two Wire Products operations, a CVP business and a Machinery operation. These businesses had total combined annual sales of approximately $100 million.
As indicated in the table above, earnings from continuing operations increased from divestiture gains (related to a CVP business and a Wire Products business), a litigation settlement gain, and the non-recurrence of the prior year's lump-sum pension buyout. Operationally, earnings also benefited from higher unit volume and lower income taxes related to a new accounting standard for stock-based compensation. These improvements were partially offset by steel inflation that began to occur in late 2016 and the non-recurrence of the prior year pricing lag benefit (that occurred as steel costs deflated in late 2015).
LIFO Impact
Approximately 50% of our inventories are valued on the last-in, first-out (LIFO) method. These are primarily our domestic, steel-related inventories. In 2016, increasing steel costs, particularly in the fourth quarter, resulted in a full-year pretax LIFO expense of $11 million. In 2015, significant deflation in steel costs, particularly in the fourth quarter, resulted in a full-year pretax LIFO benefit of $46 million.
For further discussion of inventories, see Note A to the Consolidated Financial Statements on page 9 in Exhibit 99.4 attached to this Form 8-K.
Interest and Income Taxes
Net interest expense in 2016 decreased slightly due to the repayment of a $200 million 5% note in August 2015.
Our tax rate is determined by a combination of items, some recurring and some discrete. Recurring items include things like income earned in various tax jurisdictions, and differences in tax rates in those jurisdictions. These items tend to be relatively stable from year to year. Conversely, discrete items are things that may not be as consistent from year to year.
While the U.S. statutory federal income tax rate was 35% in both years, our worldwide effective income tax rate on continuing operations was 25% in 2016, compared to 27% for 2015. In both years our tax rate benefited from earnings in non-U.S. jurisdictions, which reduced our effective tax rate by 6% in each year. In addition, the 2016 tax rate benefited by 3% related to the tax effects of stock-based compensation deductions in the year, and 1% (net) from other items. The 2015 tax rate benefited by 1% related to the reduction of a tax accrual for Chinese earnings that we decided to reinvest within China to acquire the remaining interest in a joint venture and 1% (net) from other items.
In the first quarter of 2016 we adopted Accounting Standards Update (ASU) 2016-09, Improvements to Employee Share-Based Payment Accounting (see Note A to the Consolidated Financial Statements on page 9 in Exhibit 99.4 attached to this Form 8-K). This ASU provides that the tax effects of stock-based awards must be treated as discrete items affecting the tax rate in the interim reporting period in which the tax deductions occur. Many variables (such as timing of award settlements or expirations, changes in stock price over time, ultimate payout levels for awards with performance contingencies, shares cancelled before vesting, and the tax rules in effect at the time of settlement) will impact both the timing and the amount of the tax deductions. Thus, this ASU is likely to add more volatility to the effective tax rate of companies such as Leggett that use stock-based compensation plans.
6
Exhibit 99.3
Segment Results
In the following section we discuss 2016 sales and EBIT (earnings before interest and taxes) for each of our segments. We provide additional detail about segment results and a reconciliation of segment EBIT to consolidated EBIT in Note E to the Consolidated Financial Statements on page 21 in Exhibit 99.4 attached to this Form 8-K. All segment data has been retrospectively adjusted to reflect the change in segment structure discussed on page 4.
| (Dollar amounts in millions) | 2016 | 2015 | Change in Sales | % Change Same Location Sales (1) | ||||||||||||||||
| $ | % | |||||||||||||||||||
| Sales | ||||||||||||||||||||
| Residential Products | $ | 1,589 | $ | 1,688 | $ | (99 | ) | (6 | )% | (6 | )% | |||||||||
| Industrial Products | 583 | 777 | (194 | ) | (25 | )% | (12 | )% | ||||||||||||
| Furniture Products | 1,048 | 1,072 | (24 | ) | (2 | )% | (3 | )% | ||||||||||||
| Specialized Products | 906 | 847 | 59 | 7 | % | 8 | % | |||||||||||||
| Total Sales | 4,126 | 4,384 | (258 | ) | ||||||||||||||||
| Intersegment sales elimination | (376 | ) | (467 | ) | 91 | |||||||||||||||
| Trade sales | $ | 3,750 | $ | 3,917 | $ | (167 | ) | (4 | )% | (1 | )% | |||||||||
| 2016 | 2015 | Change in EBIT | EBIT Margins (2) | |||||||||||||||||
| $ | % | 2016 | 2015 | |||||||||||||||||
| EBIT | ||||||||||||||||||||
| Residential Products | $ | 168 | $ | 155 | $ | 13 | 8 | % | 10.5 | % | 9.2 | % | ||||||||
| Industrial Products | 65 | 77 | (12 | ) | (16 | )% | 11.2 | % | 9.9 | % | ||||||||||
| Furniture Products | 107 | 118 | (11 | ) | (9 | )% | 10.2 | % | 11.0 | % | ||||||||||
| Specialized Products | 181 | 150 | 31 | 21 | % | 20.0 | % | 17.7 | % | |||||||||||
| Intersegment eliminations & other | 1 | (13 | ) | 14 | ||||||||||||||||
| Total EBIT | $ | 522 | $ | 487 | $ | 35 | 7 | % | 13.9 | % | 12.4 | % | ||||||||
______________________________
| (1) | This is the change in sales not attributable to acquisitions or divestitures. These are sales that come from the same plants and facilities that we owned one year earlier. |
| (2) | Segment margins are calculated on total sales. Overall company margin is calculated on trade sales. |
Residential Products
Residential Products sales decreased 6% in 2016 from a combination of lower unit volume in several product categories, lower pass-through sales of adjustable beds (which originate in Furniture Products but are occasionally distributed through Residential Products), raw material-related price decreases, and currency impact. Within our U.S. Spring business, total innerspring units decreased 6%, but growth continued in ComfortCore® (our pocketed coil innersprings), with unit volume in that category up 4%. Volume also increased in our European Spring business.
EBIT and EBIT margin increased in 2016 due to a litigation gain ($7 million) and non-recurrence of last year's foam litigation expense ($5 million). Operationally, the impact on EBIT from lower unit volume was offset by pricing discipline.
7
Exhibit 99.3
Industrial Products
Same location sales in Industrial Products were down 12% from steel-related price decreases and lower unit volume in Drawn Wire. Total sales in the segment declined 25%, also reflecting the divestitures of the Steel Tubing business in late 2015 and two small Wire Products operations in 2016.
EBIT decreased primarily due to higher raw material costs (including LIFO impact) and lower unit volume. These operational impacts were partially offset by a divestiture gain ($16 million) from the sale of one of the Wire Products operations, and the non-recurrence of the prior year's impairment charge ($6 million) and divestiture loss ($3 million), both associated with the sale of the Steel Tubing business.
Furniture Products
Sales in Furniture Products decreased 2%, primarily from lower volume in Home Furniture, steel-related price decreases, and currency impact. These items were partially offset by growth from a Work Furniture acquisition completed in March 2015. Adjustable Bed unit volume increased 1% (versus strong growth in each of the prior two years) as we began ramping up new programs selling directly to major bedding retailers and transitioning away from former programs with bedding manufacturers. The decline in these bedding customer programs also caused the decrease in "pass-through sales of adjustable beds" discussed in the Residential Products segment above.
EBIT and EBIT margin decreased, primarily from higher raw material costs (including LIFO impact) and lower volume, partially offset by operational improvements, gains from building sales of $3 million, and a favorable sales mix.
Specialized Products
In Specialized Products, sales increased 7% in 2016, with volume gains in Automotive and a small Aerospace acquisition completed early in the year, partially offset by divestitures of two small CVP operations, and currency impact.
EBIT and EBIT margin increased from higher sales, a divestiture gain ($11 million) related to the sale of a CVP operation, and currency impact. These items were partially offset by goodwill impairment of $4 million.
We have agreed to sell real estate associated with the remaining CVP business and expect to realize a gain on this transaction in 2017. This property reached held for sale status in 2016, causing the fair value of the CVP reporting unit to fall below its carrying value, and triggering the $4 million impairment charge.
Results from Discontinued Operations
Full year earnings from discontinued operations, net of tax, increased to $19 million from $1 million in 2015. This increase is primarily due to a litigation gain ($20 million) related to our former Prime Foam business. For further information about discontinued operations, see Note B to the Consolidated Financial Statements on page 15 in Exhibit 99.4 attached to this Form 8-K.
8
Exhibit 99.3
RESULTS OF OPERATIONS—2015 vs. 2014
Sales from continuing operations grew 4% in 2015, with higher unit volume and acquisitions partially offset by raw material-related price deflation and currency impact. Nearly all of our businesses experienced unit volume growth during the year from a combination of new program awards, market share gains, and broadly improving end market demand.
Full year earnings from continuing operations increased significantly reflecting several factors, including the benefit from higher sales, pricing discipline, and lower foam litigation expense. Further details about our consolidated and segment results are discussed below.
Consolidated Results (continuing operations)
The following table shows the changes in sales and earnings from continuing operations during 2015, and identifies the major factors contributing to the changes.
| (Dollar amounts in millions, except per share data) | Amount | % | ||||
| Net sales (continuing operations): | ||||||
| Year ended December 31, 2014 | $ | 3,782 | ||||
| Approximate volume gains | 196 | 6 | % | |||
| Approximate raw material-related deflation and currency impact | (183 | ) | (5 | )% | ||
| Same location sales | 13 | 1 | % | |||
| Acquisition sales growth | 123 | 3 | % | |||
| Divestitures | (1 | ) | — | % | ||
| Year ended December 31, 2015 | $ | 3,917 | 4 | % | ||
| Earnings from continuing operations: | ||||||
| (Dollar amounts, net of tax) | ||||||
| Year ended December 31, 2014 | $ | 225 | ||||
| Lower foam litigation expense | 30 | |||||
| Lump-sum pension buyout | (8 | ) | ||||
| Other, including benefit from higher sales and pricing discipline | 81 | |||||
| Year ended December 31, 2015 | $ | 328 | ||||
| Earnings Per Diluted Share (continuing operations)—2014 | $ | 1.55 | ||||
| Earnings Per Diluted Share (continuing operations)—2015 | $ | 2.27 | ||||
Same location sales (from continuing operations) grew 1%, with volume gains in Automotive, in most of our Residential Products businesses, and in Adjustable Bed, largely offset by raw material-related price deflation and currency impact.
Full year 2015 sales growth also benefited from the July 2014 acquisition of Tempur Sealy's three innerspring component production facilities, the March 2015 acquisition of a Work Furniture business, and other smaller acquisitions. In late 2015, we sold our Steel Tubing business (which had total annual sales of approximately $100 million), and a small CVP operation. These divestitures did not significantly impact the comparison of 2015's sales to the prior year.
Earnings from continuing operations increased significantly in 2015, primarily from higher sales and pricing discipline. As indicated in the table above, earnings also benefited from the reduction in foam litigation expense ($3
9
Exhibit 99.3
million in 2015 versus $33 million in 2014). Partially offsetting these improvements was a one-time lump-sum pension buyout funded from pension plan assets late in 2015.
LIFO Impact
Approximately 50% of our inventories are valued on the last-in, first-out (LIFO) method. These are primarily our domestic, steel-related inventories. In 2014, steel costs were relatively stable and we ended the year with LIFO expense of $1 million. Significant deflation in steel costs during 2015, particularly in the fourth quarter, resulted in a full-year pretax LIFO benefit of $46 million.
For further discussion of inventories, see Note A to the Consolidated Financial Statements on page 9 in Exhibit 99.4 attached to this Form 8-K.
Interest and Income Taxes
Net interest expense in 2015 increased slightly versus 2014.
Our tax rate is determined by a combination of items, some recurring and some discrete. Recurring items include things like income earned in various tax jurisdictions, and differences in tax rates in those jurisdictions. These items tend to be relatively stable from year to year. Conversely, discrete items are things that may not be as consistent from year to year.
While the U.S. statutory federal income tax rate was 35% in both years, our worldwide effective income tax rate on continuing operations was 27% in 2015, compared to 24% for 2014. In both years our tax rate benefited from earnings in non-U.S. jurisdictions, which reduced our effective tax rate by 6% in 2015, and 7% in 2014. In addition, the 2015 tax rate benefited by 1% related to the reduction of a tax accrual for Chinese earnings that we decided to reinvest within China to acquire the remaining interest in a joint venture, and 1% (net) from other items. The 2014 tax rate benefited by 3% related to additional Domestic Production Activities Deductions claimed for the current and prior years, and 1% (net) from other items.
10
Exhibit 99.3
Segment Results (continuing operations)
In the following section we discuss 2015 sales and EBIT from continuing operations for each of our segments. We provide additional detail about segment results and a reconciliation of segment EBIT to consolidated EBIT in Note E to the Consolidated Financial Statements on page 21 in Exhibit 99.4 attached to this Form 8-K. All segment data has been retrospectively adjusted to reflect the change in segment structure discussed on page 4.
| (Dollar amounts in millions) | 2015 | 2014 | Change in Sales | % Change Same Location Sales (1) | ||||||||||||||||
| $ | % | |||||||||||||||||||
| Sales (continuing operations) | �� | |||||||||||||||||||
| Residential Products | $ | 1,688 | $ | 1,595 | $ | 93 | 6 | % | 1 | % | ||||||||||
| Industrial Products | 777 | 813 | (36 | ) | (4 | )% | (4 | )% | ||||||||||||
| Furniture Products | 1,072 | 953 | 119 | 12 | % | 7 | % | |||||||||||||
| Specialized Products | 847 | 817 | 30 | 4 | % | 4 | % | |||||||||||||
| Total Sales | 4,384 | 4,178 | 206 | |||||||||||||||||
| Intersegment sales elimination | (467 | ) | (396 | ) | (71 | ) | ||||||||||||||
| Trade sales | $ | 3,917 | $ | 3,782 | $ | 135 | 4 | % | 1 | % | ||||||||||
| 2015 | 2014 | Change in EBIT | EBIT Margins (2) | |||||||||||||||||
| $ | % | 2015 | 2014 | |||||||||||||||||
| EBIT (continuing operations) | ||||||||||||||||||||
| Residential Products | $ | 155 | $ | 88 | $ | 67 | 76 | % | 9.2 | % | 5.5 | % | ||||||||
| Industrial Products | 77 | 44 | 33 | 75 | % | 9.9 | % | 5.4 | % | |||||||||||
| Furniture Products | 118 | 82 | 36 | 44 | % | 11.0 | % | 8.6 | % | |||||||||||
| Specialized Products | 150 | 120 | 30 | 25 | % | 17.7 | % | 14.6 | % | |||||||||||
| Intersegment eliminations & other | (13 | ) | (2 | ) | (11 | ) | ||||||||||||||
| Total EBIT | $ | 487 | $ | 332 | $ | 155 | 47 | % | 12.4 | % | 8.8 | % | ||||||||
______________________________
| (1) | This is the change in sales not attributable to acquisitions or divestitures. These are sales that come from the same plants and facilities that we owned one year earlier. |
| (2) | Segment margins are calculated on total sales. Overall company margin is calculated on trade sales. |
Residential Products
Residential Products sales increased 6% in 2015, with unit volume growth in most product categories and acquisitions partially offset by raw material-related price decreases and currency impact. Volume grew in Bedding, Geo Components, Fabric Converting, and Machinery. Within our U.S. Spring business, we again experienced significant growth in ComfortCore® (our pocketed coil innersprings), with unit volume in that product category up 51%. We expect strong growth in this category to continue from our introduction of new ComfortCore® products and our customers' growing use of these components in their product lines.
EBIT and EBIT margin increased in 2015 due to higher sales, pricing discipline (including LIFO benefit), and significantly lower foam litigation expense ($48 million).
11
Exhibit 99.3
Industrial Products
Sales in the segment decreased 4% in 2015, with higher unit volume in Drawn Wire more than offset by steel-related price decreases and reduced rod mill trade sales.
EBIT and EBIT margin improved versus 2014, with cost reductions (including LIFO benefit) more than offsetting a $6 million impairment charge and a $3 million divestiture loss, both of which related to the sale of our Steel Tubing business late in the year.
Furniture Products
Sales in Furniture Products increased 12% in 2015, with same location sales up 7%. Continued strong demand in the Adjustable Bed and Fashion Bed businesses, along with volume gains in Home Furniture, drove this improvement. Unit volume in the Adjustable Bed business increased 51% from a combination of new programs and strength in ongoing customer programs. In our Work Furniture business, we acquired a European private-label manufacturer of high-end upholstered furniture. Acquisitions contributed 5% to the segment's sales growth during the year.
EBIT and EBIT margin increased in 2015, primarily from higher sales, pricing discipline (including LIFO benefit), and improved operating efficiency.
Specialized Products
In Specialized Products, sales increased 4% in 2015, with volume gains in Automotive partially offset by currency impact. Our Automotive business continued to experience strong growth from a combination of factors, including expanded component content (via upgraded features), participation in new vehicle platforms, and continued industry growth in each of the major markets.
EBIT and EBIT margin increased primarily from higher sales.
Results from Discontinued Operations
Full year earnings from discontinued operations, net of tax, increased to $1 million from a loss of $124 million in 2014. This significant increase is primarily due to the non-recurrence of a goodwill impairment charge of $93 million related to the Store Fixtures business, and foam litigation accruals of $22 million. The divestiture of the majority of the Store Fixtures business late in 2014 resulted in an additional loss of $5 million. Two remaining Store Fixtures facilities were sold in 2015 and resulted in a gain of $3 million.
2014 Goodwill Impairment of Store Fixtures Group
A significant portion of our assets consists of goodwill and other long-lived assets, the carrying value of which may be reduced if we determine that those assets are impaired. We review our reporting units for potential goodwill impairment in June of each year, and more often if an event or circumstance occurs making it likely that impairment exists. In 2014, we concluded that an impairment charge of $108 million ($93 million after tax) was required for our Store Fixtures group. This non-cash impairment charge reflected the complete write-off of the goodwill associated with the Store Fixtures group. For more information, see Note C to the Consolidated Financial Statements on page 17 in Exhibit 99.4 attached to this Form 8-K.
For further information about discontinued operations, see Note B to the Consolidated Financial Statements on page 15 in Exhibit 99.4 attached to this Form 8-K.
12
Exhibit 99.3
LIQUIDITY AND CAPITALIZATION
Cash from operations was very strong in 2016. In each year for over 25 years, our operations have provided more than enough cash to fund both capital expenditures and dividend payments. We expect this to again be the case in 2017.
We continue to invest to support businesses and product categories that are growing. This resulted in higher capital expenditures in 2016, and we expect further increases in 2017.
We raised the quarterly dividend by 6% (the largest increase since 2007) and extended our record of consecutive annual increases to 45 years. We also bought back 4.5 million shares of our stock during the year.
In May 2016, we extended the term of our revolving credit facility to May 2021 and expanded the borrowing capacity from $600 million to $750 million and correspondingly increased our commercial paper program. We ended 2016 with net debt to net capital comfortably within our long-standing targeted range of 30-40%, as discussed on page 20.
Cash from Operations
Cash from operations is our primary source of funds. Earnings and changes in working capital levels are the two factors that generally have the greatest impact on our cash from operations.
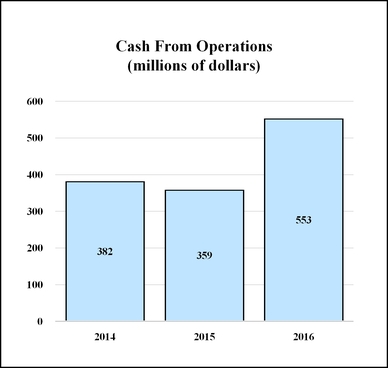
Cash from operations increased significantly in 2016. Payments we made to settle foam litigation in 2015 (totaling $82 million) did not recur, and in 2016 we received litigation settlement proceeds (of $25 million net of taxes paid) related to the antitrust claims discussed on page 4. Cash from operations also reflected higher earnings and lower working capital. The reduction in working capital was driven primarily by changes in accounts payable that were largely due to steel price inflation in late 2016 (versus deflation in late 2015).
Cash from operations should exceed $450 million in 2017, with working capital increases attributable to sales growth and inflation expected to be uses of cash.
13
Exhibit 99.3
We closely monitor our working capital levels, and we ended 2016 with adjusted working capital at 9.4% of annualized sales1. The table below explains this non-GAAP calculation. We eliminate cash and current debt maturities from working capital to monitor our operating efficiency and performance related to trade receivables, total inventories, and accounts payable. We believe this provides a more useful measurement to investors since cash and current maturities can fluctuate significantly from period to period. As discussed on page 21, a substantial amount of our cash is held by international operations and may not be immediately available to reduce debt on a dollar for dollar basis.
| (Dollar amounts in millions) | 2016 | 2015 | |||||
| Current assets | $ | 1,325 | $ | 1,311 | |||
| Current liabilities | (707 | ) | (701 | ) | |||
| Working capital | 618 | 610 | |||||
| Cash and cash equivalents | (282 | ) | (253 | ) | |||
| Current debt maturities | 4 | 3 | |||||
| Adjusted working capital | $ | 340 | $ | 360 | |||
Annualized sales 1 | $ | 3,616 | $ | 3,780 | |||
| Working capital as a percent of annualized sales | 17.1 | % | 16.1 | % | |||
| Adjusted working capital as a percent of annualized sales | 9.4 | % | 9.5 | % | |||
___________________________________________
1. | Annualized sales equal 4th quarter sales ($904 million in 2016 and $945 million in 2015) multiplied by 4. We believe measuring our working capital against this sales metric is more useful, since efficient management of working capital includes adjusting those net asset levels to reflect current business volume. |
Three Primary Components of our Working Capital
| Amount (in millions) | Days | ||||||||||||||||
| 2016 | 2015 | 2014 | 2016 | 2015 | 2014 | ||||||||||||
| Trade Receivables | $ | 451 | $ | 449 | $ | 469 | DSO 1 | 44 | 43 | 44 | |||||||
| Inventories | $ | 520 | $ | 505 | $ | 481 | DIO 2 | 66 | 60 | 59 | |||||||
| Accounts Payable | $ | 351 | $ | 307 | $ | 370 | DPO 3 | 42 | 41 | 43 | |||||||
Calculations of days are as follows:
| 1. | Days sales outstanding: ((beginning of year trade receivables + end of year trade receivables)÷2) ÷ (net trade sales ÷ number of days in the year). |
| 2. | Days inventory on hand: ((beginning of year trade inventory + end of year inventory)÷2) ÷ (cost of goods sold ÷ number of days in the year). |
| 3. | Days payables outstanding: ((beginning of year accounts payable + end of year accounts payable)÷2) ÷ (cost of goods sold ÷ number of days in the year). |
14
Exhibit 99.3
Trade Receivables - Our net trade receivables and our days sales outstanding at December 31, 2016 did not meaningfully change compared to the prior year. We continue to look for ways to improve speed of customer payments, including third party programs with early payment incentives in certain circumstances. We obtain credit applications, credit reports, bank and trade references, and periodic financial statements from our customers to establish credit limits and terms. In cases where a customer’s payment performance or financial condition begins to deteriorate, we tighten our credit limits and terms and make appropriate reserves. Our provision for losses on accounts receivable has averaged $3 million and our allowance for bad debt as a percentage of our net receivables has averaged 2% for the last three years.
Inventories - The increase in inventories of $15 million at December 31, 2016 compared to the prior year primarily reflects higher levels necessary to support sales growth and meet customer delivery requirements, as well as opportunistic purchases of raw materials.
Days inventory on hand of 66 days at the end of 2016 is within a reasonable historical range, and we believe the increase compared to the prior year does not indicate a greater risk of inventory obsolescence. We continuously monitor our slow moving and potentially obsolete inventory through reports on inventory quantities compared to usage within the previous 120 days. We also utilize cycle counting programs and complete physical counts of our inventory. When potential inventory obsolescence is indicated by these controls, we will take charges for write-downs to maintain an adequate level of reserves. We have averaged inventory obsolescence charges of $10 million annually for the last three years. Our reserve balances (not including our LIFO reserves) as a percentage of our year-end inventory were 6.4% at the end of 2016, which is consistent with our historical average.
Accounts Payable - The increase in accounts payables of $44 million at December 31, 2016 compared to the prior year is primarily due to steel price volatility experienced in both 2016 (increasing prices, particularly toward the end of the year) and 2015 (decreasing prices, particularly toward the end of the year). Steel is our principal raw material. Our payment terms did not change meaningfully in 2016 or 2015. We continue to optimize payment terms through our significant purchasing power and also utilize third party services that allow flexible payment options.
15
Exhibit 99.3
Uses of Cash
Finance Capital Requirements
Cash is readily available to fund growth.
In certain of our businesses and product lines we have minimal excess capacity, and we are investing to support continued growth. In Automotive, we are expanding capacity to support new programs that will begin production over the next few years. In Bedding, we are investing in equipment to support ongoing growth in ComfortCore® innersprings and newer product features.
We will continue to make investments to support expansion in businesses and product lines where sales are growing, and for efficiency improvement and maintenance. We expect capital expenditures to approximate $150 million in 2017. Our employee incentive plans emphasize returns on capital, which include net fixed assets and working capital. This emphasis focuses our management on asset utilization and helps ensure that we are investing additional capital dollars where attractive return potential exists.
In some of our businesses, we have capacity to accommodate additional volume. For each $100 million of sales from incremental unit volume produced utilizing spare capacity, we expect to generate approximately $25 million to $35 million of additional pre-tax earnings. The earnings and margin improvement that we have realized over the past few years reflects, in part, higher utilization in our businesses from market share gains and higher market demand.
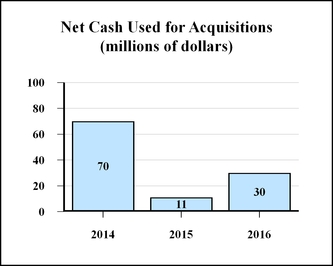
Our long-term 6-9% annual growth objective envisions periodic acquisitions. We are seeking acquisitions primarily within our Grow business units, and we are looking for opportunities to enter new growth markets (carefully screened for sustainable competitive advantage).
In 2014, we purchased Tempur Sealy's three U.S. innerspring production facilities for $45 million. We also acquired a German designer and distributor of high-end, European-style motion components for residential furniture.
In 2015, we acquired a 70% interest in a European private-label manufacturer of high-end upholstered furniture for an initial cash outlay of $12 million and will acquire the remaining 30% in two equal parts, in 2018 and 2020 for a currently estimated amount of $11 million. This business is complementary to our North American private-label operation and allows us to support our Work Furniture customers as they expand globally.
16
Exhibit 99.3
In 2016, we acquired three small businesses for a total purchase price of $30 million. The first, a U.S. manufacturer of aerospace tube assemblies, expands our tube forming and fabrication capabilities and adds precision machining to our aerospace platform. The second is a distributor of geosynthetic products, and the third, a South African producer of mattress innersprings. In addition to these acquisitions, we purchased the remaining interest in an Automotive joint venture in China for $35 million.
Additional details about acquisitions can be found in Note Q to the Consolidated Financial Statements on page 46 in Exhibit 99.4 attached to this Form 8-K.
Pay Dividends
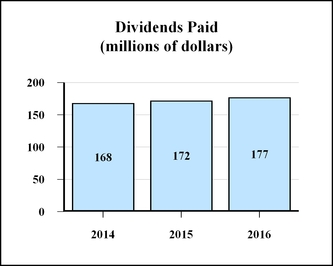
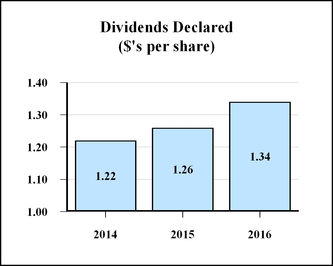
Increasing the dividend remains a high priority. In 2016, we increased the quarterly dividend by $.02, or 6%, to $.34 per share, our largest quarterly increase since 2007. This extended our record of consecutive annual dividend increases to 45 years. Our targeted dividend payout ratio is approximately 50-60% of continuing operations adjusted EPS (which would exclude special items such as divestiture gains, impairment charges, litigation accruals and settlement proceeds). We expect future dividend growth to approximate earnings growth.
17
Exhibit 99.3
Repurchase Stock
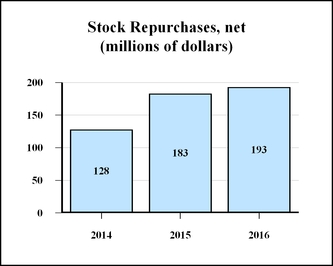
As shown in the chart above, share repurchases were significant in each of the last three years. During that time frame, we repurchased a total of 14.3 million shares of our stock and issued 8.4 million shares (through employee benefit plans and stock option exercises), reducing outstanding shares by 4%. In 2016, we repurchased 4.5 million shares (at an average price of $46.52) and issued 2.4 million shares.
Our top priorities for uses of cash are organic growth (via capital expenditures), dividends, and strategic acquisitions. After funding those priorities, to the extent there is remaining cash available, we generally intend to repurchase stock rather than repay debt early or stockpile cash. We have been authorized by the Board to repurchase up to 10 million shares each year, but we have established no specific repurchase commitment or timetable.
18
Exhibit 99.3
Capitalization
This table presents key debt and capitalization statistics at the end of the three most recent years.
| (Dollar amounts in millions) | 2016 | 2015 | 2014 | ||||||||
| Long-term debt outstanding: | |||||||||||
| Scheduled maturities | $ | 760 | $ | 761 | $ | 762 | |||||
Average interest rates (1) | 3.7 | % | 3.7 | % | 4.6 | % | |||||
Average maturities in years (1) | 5.8 | 6.8 | 6.4 | ||||||||
| Revolving credit/commercial paper | 196 | 181 | — | ||||||||
| Average interest rate on year-end balance | 1.0 | % | .5 | % | — | % | |||||
| Average interest rate during the year | .8 | % | .5 | % | .2 | % | |||||
| Total long-term debt | 956 | 942 | 762 | ||||||||
| Deferred income taxes and other liabilities | 227 | 223 | 227 | ||||||||
| Equity | 1,094 | 1,098 | 1,155 | ||||||||
| Total capitalization | $ | 2,277 | $ | 2,263 | $ | 2,144 | |||||
Unused committed credit: (2) | |||||||||||
| Long-term | $ | 554 | $ | 419 | $ | 600 | |||||
| Short-term | — | — | — | ||||||||
| Total unused committed credit | $ | 554 | $ | 419 | $ | 600 | |||||
| Current maturities of long-term debt | $ | 4 | $ | 3 | $ | 202 | |||||
| Cash and cash equivalents | $ | 282 | $ | 253 | $ | 333 | |||||
Ratio of earnings to fixed charges (3) | 9.6 x | 8.6 x | 6.0 x | ||||||||
___________________________________________
| (1) | These rates include current maturities, but exclude commercial paper to reflect the averages of outstanding debt with scheduled maturities. The rates also include amortization of interest rate swaps. |
| (2) | The unused credit amount is based upon our revolving credit facility and commercial paper program which, at the end of 2015, had $600 million of borrowing capacity. The credit facility was amended in the second quarter of 2016 to increase the borrowing capacity to $750 million and the commercial paper program was increased to a corresponding amount. |
| (3) | Fixed charges include interest expense, capitalized interest, plus implied interest included in operating leases. Earnings consist principally of income from continuing operations before income taxes, plus fixed charges. |
19
Exhibit 99.3
The next table shows the ratio of long-term debt to total capitalization at December 31, 2016 and 2015, calculated in two ways:
| • | Long-term debt and total capitalization as reported in the previous table. |
| • | Long-term debt and total capitalization each reduced by total cash and increased by current maturities of long-term debt. |
We believe that adjusting this measure for cash and current maturities allows a more useful comparison to periods during which cash fluctuates significantly. We use these adjusted (non-GAAP) measures as supplemental information to track leverage trends across time periods with variable levels of cash. Our long-term target is to have net debt as a percentage of net capital in the 30-40% range. As discussed on page 21, a substantial amount of cash is held by our international operations. Therefore, we may not be able to use all of our cash to reduce our debt on a dollar-for-dollar basis, as reflected in the net debt to net capital ratio.
| (Dollar amounts in millions) | 2016 | 2015 | |||||
| Long-term debt | $ | 956 | $ | 942 | |||
| Current debt maturities | 4 | 3 | |||||
| Cash and cash equivalents | (282 | ) | (253 | ) | |||
| Net debt | $ | 678 | $ | 692 | |||
| Total capitalization | $ | 2,277 | $ | 2,263 | |||
| Current debt maturities | 4 | 3 | |||||
| Cash and cash equivalents | (282 | ) | (253 | ) | |||
| Net capitalization | $ | 1,999 | $ | 2,013 | |||
| Long-term debt to total capitalization | 42.0 | % | 41.6 | % | |||
| Net debt to net capitalization | 33.9 | % | 34.4 | % | |||
Total debt (which includes long-term debt and current debt maturities) increased $15 million in 2016, all of which occurred in commercial paper.
Short Term Borrowings
We can raise cash by issuing up to $750 million in commercial paper through a program that is backed by our $750 million revolving credit facility with a syndicate of 14 lenders. In May 2016, we increased the borrowing capacity under the facility and extended the term by two years to 2021. The credit facility allows us to issue letters of credit totaling up to $250 million. When we issue letters of credit under the facility, we reduce our available credit and commercial paper capacity by a corresponding amount. Amounts outstanding related to our commercial paper program were:
| (Dollar amounts in millions) | 2016 | 2015 | 2014 | ||||||||
| Total program authorized | $ | 750 | $ | 600 | $ | 600 | |||||
| Commercial paper outstanding (classified as long-term debt) | (196 | ) | (181 | ) | — | ||||||
| Letters of credit issued under the credit facility | — | — | — | ||||||||
| Total program usage | (196 | ) | (181 | ) | — | ||||||
| Total program available | $ | 554 | $ | 419 | $ | 600 | |||||
The average and maximum amounts of commercial paper outstanding during 2016 were $292 million and $345 million, respectively. During the fourth quarter, the average and maximum amounts outstanding were $282 million and $323 million respectively. At year end, we had no letters of credit outstanding under the credit facility, but we had issued $57 million of stand-by letters of credit under other bank agreements to take advantage of better pricing.
20
Exhibit 99.3
With operating cash flow, cash on hand, our commercial paper program, and our ability to issue debt in the capital markets, we believe we have sufficient funds available to repay maturing debt, as well as support our ongoing operations, pay dividends, fund future growth, and repurchase stock.
Our revolving credit facility and certain other long-term debt obligations contain restrictive covenants, with which we were comfortably in compliance as of December 31, 2016. The covenants limit, among other things: a) our total amount of indebtedness to 65% of our total capitalization (each as defined in the revolving credit facility), b) the amount of total secured debt to 15% of our total consolidated assets, and c) the amount of assets sold, transferred or disposed of in any trailing four quarter period to 40% of total consolidated assets. For more information about long-term debt, see Note I to the Consolidated Financial Statements on page 28 in Exhibit 99.4 attached to this Form 8-K.
Accessibility of Cash
At December 31, 2016, we had cash and cash equivalents of $282 million primarily invested in interest-bearing bank accounts and in bank time deposits with original maturities of three months or less.
Nearly all of these funds are held in the international accounts of our foreign operations. We do not rely on this foreign cash as a source of funds to support our ongoing U.S. liquidity needs. If we were to bring all foreign cash back immediately to the U.S. in the form of dividends, we would incur incremental tax expense of up to $50 million based upon our average historic foreign tax rate. However, due to capital requirements in various jurisdictions, approximately $59 million of this cash is currently inaccessible for repatriation. In 2016, 2015, and 2014, we brought back cash of $5 million, $112 million, and $129 million, respectively, at little to no added tax cost.
21
Exhibit 99.3
CONTRACTUAL OBLIGATIONS
The following table summarizes our future contractual cash obligations and commitments at December 31, 2016:
| Payments Due by Period | |||||||||||||||||||
| Contractual Obligations | Total | Less Than 1 Year | 1-3 Years | 3-5 Years | More Than 5 Years | ||||||||||||||
| (Dollar amounts in millions) | |||||||||||||||||||
| Long-term debt ¹ | $ | 954 | $ | 2 | $ | 152 | $ | 196 | $ | 604 | |||||||||
| Capitalized leases | 6 | 1 | 3 | 2 | — | ||||||||||||||
| Operating leases | 133 | 34 | 48 | 28 | 23 | ||||||||||||||
| Purchase obligations ² | 317 | 315 | 2 | — | — | ||||||||||||||
| Interest payments ³ | 159 | 28 | 47 | 43 | 41 | ||||||||||||||
| Deferred income taxes | 54 | — | — | — | 54 | ||||||||||||||
Other obligations (including pensions and net reserves for tax contingencies) 4 | 174 | 1 | 21 | 13 | 139 | ||||||||||||||
| Total contractual cash obligations | $ | 1,797 | $ | 381 | $ | 273 | $ | 282 | $ | 861 | |||||||||
| 1. | The long-term debt payment schedule presented above could be accelerated if we were not able to make the principal and interest payments when due. |
| 2. | Purchase obligations primarily include open short-term (30-120 days) purchase orders that arise in the normal course of operating our facilities. |
| 3. | Interest payments are calculated on debt outstanding at December 31, 2016 at rates in effect at the end of the year. |
| 4. | Other obligations include our net reserves for tax contingencies in the "More Than 5 Years" column because these obligations are long-term in nature and actual payment dates can not be specifically determined. Other obligations also include our current estimate of minimum contributions to defined benefit pension plans. |
22
Exhibit 99.3
CRITICAL ACCOUNTING POLICIES AND ESTIMATES
We prepare our consolidated financial statements in accordance with accounting principles generally accepted in the United States of America. To do so, we must make estimates and judgments that affect the reported amounts of assets, liabilities, revenues, expenses, and disclosures. If we used different estimates or judgments our financial statements would change, and some of those changes could be significant. Our estimates are frequently based upon historical experience and are considered by management, at the time they are made, to be reasonable and appropriate. Estimates are adjusted for actual events, as they occur.
“Critical accounting estimates” are those that are: a) subject to uncertainty and change, and b) of material impact to our financial statements. Listed below are the estimates and judgments which we believe could have the most significant effect on our financial statements.
We provide additional details regarding our significant accounting policies in Note A to the Consolidated Financial Statements on page 9 in Exhibit 99.4 attached to this Form 8-K.
| Description | Judgments and Uncertainties | Effect if Actual Results Differ From Assumptions | ||
| Goodwill | ||||
Goodwill is assessed for impairment annually as of June 30 and as triggering events occur. In the second quarter of 2016, we sold one of our two remaining Commercial Vehicle Products (CVP) businesses, and real estate associated with the remaining CVP business reached held for sale status. As a result of these two events, the fair value of the CVP reporting unit had fallen below it's book value, and we fully impaired the remaining $4 million of goodwill for this reporting unit in the second quarter of 2016. During 2015, the Steel Tubing unit met the held for sale criteria. Because fair value less cost to sell had fallen below recorded book value, we fully impaired this unit's goodwill and incurred a non-cash charge of $4 million. In 2014, we concluded that an impairment was required related to the goodwill of the Store Fixtures group, which was formerly part of the Furniture Products segment and is now reported in discontinued operations. A non-cash charge of $108 million was recorded for the complete write-off of the goodwill associated with this business. | Goodwill is evaluated annually for impairment as of June 30 using either a quantitative or qualitative analysis at the reporting unit level, which is one level below our operating segments. We begin with a qualitative assessment of whether it is more likely than not that a reporting unit's fair value is less than its carrying value before applying the two step goodwill impairment model. Judgment is required in the two step model to estimate fair value for the reporting unit. We estimate fair value using a combination of a discounted cash flow model and a market approach using price to earnings ratios for comparable publicly traded companies with characteristics similar to the reporting unit. The cash flow model contains uncertainties related to the forecast of future results as many outside economic and competitive factors can influence future performance. Margins, sales growth, and discount rates are the most critical estimates in determining enterprise values using the cash flow model. The market approach requires judgment to determine the appropriate price to earnings ratio. Ratios are derived from comparable publicly-traded companies that operate in the same or similar industry as the reporting unit. | The June 2016 qualitative review indicated it was more likely than not that the fair value of the reporting units exceeded their carrying amount, except for our CVP reporting unit. Information regarding material assumptions used to determine if a goodwill impairment exists can be found in Note C to the Consolidated Financial Statements on page 17 in Exhibit 99.4 attached to this Form 8-K. At December 31, 2016, we had $791 million of goodwill. We conduct impairment testing based on our current business strategy in light of present industry and economic conditions, as well as future expectations. If we are not able to achieve projected performance levels, future impairments could be possible. | ||
23
Exhibit 99.3
| Description | Judgments and Uncertainties | Effect if Actual Results Differ From Assumptions | ||
| Other Long-lived Assets | ||||
Other long-lived assets are tested for recoverability at year-end and whenever events or circumstances indicate the carrying value may not be recoverable. For other long-lived assets we estimate fair value at the lowest level where cash flows can be measured (usually at a branch level). | Impairments of other long-lived assets usually occur when major restructuring activities take place, or we decide to discontinue product lines completely. Our impairment assessments have uncertainties because they require estimates of future cash flows to determine if undiscounted cash flows are sufficient to recover carrying values of these assets. For assets where future cash flows are not expected to recover carrying value, fair value is estimated which requires an estimate of market value based upon asset appraisals for like assets. | These impairments are unpredictable. Impairments averaged less than $2 million per year over the last three years. At December 31, 2016, net property, plant and equipment was $566 million and net intangible assets other than goodwill was $165 million. | ||
| Inventory Reserves | ||||
We reduce the carrying value of inventories to reflect an estimate of net realizable value for obsolete and slow-moving inventory. We value inventory at net realizable value (what we think we will recover). Generally a reserve is not required unless we have more than a one-year's supply of the product. If we have had no sales of a given product for 12 months, those items are generally deemed to have no value and are written down completely. | Our inventory reserve contains uncertainties because the calculation requires management to make assumptions about the value of products that are obsolete or slow-moving (i.e., not selling very quickly). Changes in customer behavior and requirements can cause inventory to quickly become obsolete or slow moving. The calculation also uses an estimate of the ultimate recoverability of items identified as slow moving based upon historical experience (65% on average). | At December 31, 2016, the reserve for obsolete and slow-moving inventory was $33 million (approximately 6% of FIFO inventories). This is consistent with the December 31, 2015 and 2014 reserves of $33 million and $30 million, respectively, representing 6% of FIFO inventories. Additions to inventory reserves in 2016 were $9 million, which were comparable to the previous year. We do not expect obsolescence to change from current levels. | ||
24
Exhibit 99.3
| Description | Judgments and Uncertainties | Effect if Actual Results Differ From Assumptions | ||
| Workers’ Compensation | ||||
| We are substantially self-insured for costs related to workers’ compensation, and this requires us to estimate the liability associated with this obligation. | Our estimates of self-insured reserves contain uncertainties regarding the potential amounts we might have to pay (since we are self-insured). We consider a number of factors, including historical claim experience, demographic factors, and potential recoveries from third party insurance carriers. | Over the past five years, we have incurred, on average, $8 million annually for costs associated with workers’ compensation. Average year-to-year variation over the past five years has been approximately $1 million. At December 31, 2016, we had accrued $34 million to cover future self-insurance liabilities. Internal safety statistics and cost trends have improved in the last several years and are expected to remain at current lower levels for the foreseeable future. | ||
| Credit Losses | ||||
For accounts and notes receivable, we estimate a bad debt reserve for the amount that will ultimately be uncollectible. When we become aware of a specific customer’s potential inability to pay, we record a bad debt reserve for the amount we believe may not be collectible. | Our bad debt reserve contains uncertainties because it requires management to estimate the amount uncollectible based upon an evaluation of several factors such as the length of time that receivables are past due, the financial health of the customer, industry and macroeconomic considerations, and historical loss experience. Our customers are diverse and many are small-to-medium sized companies, with some being highly leveraged. Bankruptcy can occur with some of these customers relatively quickly and with little warning. | A significant change in the financial status of a large customer could impact our estimates. The average annual amount of customer-related bad debt expense was $3 million (significantly less than 1% of annual net sales) over the last three years. At December 31, 2016, our allowances for doubtful accounts were less than $8 million (about 2% of our trade accounts and notes receivable of $458 million). We have not experienced any significant individual customer bankruptcies in the past three years. We believe the financial health of our major customers has modestly improved, but some are highly leveraged, and this could cause circumstances to change in the future. | ||
25
Exhibit 99.3
| Description | Judgments and Uncertainties | Effect if Actual Results Differ From Assumptions | ||
| Pension Accounting | ||||
For our pension plans, we must estimate the cost of benefits to be provided (well into the future) and the current value of those benefit obligations. | The pension liability calculation contains uncertainties because it requires management to estimate an appropriate discount rate to calculate the present value of future benefits paid, which also impacts current year pension expense. Determination of pension expense requires an estimate of expected return on pension assets based upon the mix of investments held (bonds and equities). Other assumptions include rates of compensation increases, withdrawal and mortality rates, and retirement ages. These estimates impact the pension expense or income we recognize and our reported benefit obligations. | Each 25 basis point decrease in the discount rate increases pension expense by $.5 million and increases the plans’ benefit obligation by $9 million. A 25 basis point reduction in the expected return on assets would increase pension expense by $.4 million, but have no effect on the plans’ funded status. Assuming a long-term investment horizon, we do not expect a material change to the return on asset assumption. Mortality assumptions represent our best estimate of the duration of future benefit payments at the measurement date. These estimates are based on each plans' demographics and other relevant facts and circumstances. Longer life expectancies increased our pension liability for our most significant plans by approximately $20 million in 2014. | ||
26
Exhibit 99.3
| Description | Judgments and Uncertainties | Effect if Actual Results Differ From Assumptions | ||
| Contingencies | ||||
| We evaluate various legal, environmental, and other potential claims against us to determine if an accrual or disclosure of the contingency is appropriate. If it is probable that an ultimate loss will be incurred, we accrue a liability for the reasonable estimate of the ultimate loss. | Our disclosure and accrual of loss contingencies (i.e., losses that may or may not occur) contain uncertainties because they are based on our assessment of the likelihood that the expenses will actually occur, and our reasonable estimate of the likely cost. Our estimates and judgments are subjective and can involve matters in litigation, the results of which are generally unpredictable. | Legal contingencies are related to numerous lawsuits and claims described in Note S to the Consolidated Financial Statements on page 50 in Exhibit 99.4 attached to this Form 8-K. During the three year period ended December 31, 2016, we recorded accruals of $108 million ($70 million for continuing operations and $38 million in discontinued operations). A large percentage of these accruals related to a series of antitrust lawsuits involving the sale of polyurethane foam as discussed in Note S to the Consolidated Financial Statements. During 2015, we fully resolved the substantial majority of these cases for amounts not materially different than the amounts originally accrued. Additional details of the 2015 settlements can be found in Note T - Contingencies to the consolidated financial statements in our 2015 Form 10-K filed February 25, 2016. With the exception of antitrust matters, our largest annual accrual for litigation claims was $6 million for the five years ending December 31, 2016 (excluding legal fees). | ||
27
Exhibit 99.3
| Description | Judgments and Uncertainties | Effect if Actual Results Differ From Assumptions | ||
| Income Taxes | ||||
In the ordinary course of business, we must make estimates of the tax treatment of many transactions, even though the ultimate tax outcome may remain uncertain for some time. These estimates become part of the annual income tax expense reported in our financial statements. Subsequent to year end, we finalize our tax analysis and file income tax returns. Tax authorities periodically audit these income tax returns and examine our tax filing positions, including (among other things) the timing and amounts of deductions, and the allocation of income among tax jurisdictions. If necessary, we adjust income tax expense in our financial statements in the periods in which the actual outcome becomes more certain. | Our tax liability for unrecognized tax benefits contains uncertainties because management is required to make assumptions and to apply judgment to estimate the exposures related to our various filing positions. Our effective tax rate is also impacted by changes in tax laws, the current mix of earnings by taxing jurisdiction, and the results of current tax audits and assessments. At December 31, 2016 and 2015, we had $26 million and $32 million, respectively, of net deferred tax assets on our balance sheet related to net operating losses and other tax carryforwards. The ultimate realization of these deferred tax assets is dependent upon the amount, source, and timing of future taxable income. In cases where we believe it is more likely than not that we may not realize the future potential tax benefits, we establish a valuation allowance against them. In addition, assumptions have been made regarding the non-repatriation of earnings from certain subsidiaries. Those assumptions may change in the future, thereby affecting future period results for the tax impact of possible repatriation. | Changes in tax laws could impact assumptions related to the non-repatriation of certain foreign earnings. If all non-repatriated earnings were taxed at current rates, we would incur additional tax expense of approximately $131 million. Audits by various taxing authorities continue as governments look for ways to raise additional revenue. Based upon past audit experience, we do not expect any material changes to our tax liability as a result of this audit activity; however, we could incur additional tax expense if we have audit adjustments higher than recent historical experience. The likelihood of recovery of net operating losses and other tax carryforwards has been closely evaluated and is based upon such factors as the time remaining before expiration, viable tax planning strategies, and future taxable earnings expectations. We believe that appropriate valuation allowances have been recorded as necessary. However, if earnings expectations or other assumptions change such that additional valuation allowances are required, we could incur additional tax expense. Likewise, if fewer valuation allowances are needed, we could incur reduced tax expense. | ||
28
Exhibit 99.3
LITIGATION CONTINGENCIES
Accruals for Probable Losses
Although the Company denies liability in all currently threatened or pending litigation proceedings in which it is or may be a party and believes that it has valid bases to contest all claims threatened or made against it, we have recorded a litigation contingency accrual for our reasonable estimate of probable loss for pending and threatened litigation proceedings, in aggregate, in millions, as follows:
| Twelve Months Ended December 31, | |||||||||||
| 2016 | 2015 | 2014 | |||||||||
| Litigation contingency accrual - Beginning of period | $ | 8.1 | $ | 83.9 | $ | 3.7 | |||||
| Adjustment to accruals - expense - Continuing operations | 7.1 | 5.7 | 56.8 | ||||||||
| Adjustment to accruals - expense - Discontinued operations | 2.0 | .7 | 35.4 | ||||||||
| Cash payments | (14.0 | ) | (82.2 | ) | (12.0 | ) | |||||
| Litigation contingency accrual - End of period | $ | 3.2 | $ | 8.1 | $ | 83.9 | |||||
A large percentage of the accruals and cash payments in the table above are related to antitrust proceedings. The above litigation contingency accrual does not include accrued expenses related to workers' compensation, automobile, product and general liability claims, taxation issues and environmental matters, some of which may contain a portion of litigation expense. However, any litigation expense associated with these categories is not anticipated to have a material effect on our financial condition, results of operations, or cash flows. For more information regarding accrued expenses, see Note H to the Consolidated Financial Statements on page 27 in Exhibit 99.4 attached to this Form 8-K.
We have relied on several facts and circumstances to conclude that some loss is probable with respect to certain proceedings and matters, and to arrive at a reasonable estimate of loss or range of loss and record the accruals, including: the maturation of the pending proceedings and matters; our experience in settlement negotiations and mediation; comparative settlements of other companies in similar proceedings; discovery becoming substantially complete in certain proceedings; certain quantitative metrics used to value probable loss contingencies; and our willingness to settle certain proceedings to forgo the cost and risk of litigation and distraction to our senior executives.
Reasonably Possible Losses in Excess of Accruals
Although there are a number of uncertainties and potential outcomes associated with all of our pending or threatened litigation proceedings, we believe, based on current known facts, that additional losses, if any, are not expected to materially affect our consolidated financial position, results of operations or cash flows. However, based upon current known facts, as of December 31, 2016, aggregate reasonably possible (but not probable, and therefore not recorded) losses in excess of the accruals noted above are estimated to be approximately $26 million, including approximately $21 million for Brazilian VAT matters and $5 million for other matters. If our assumptions or analyses regarding these contingencies are incorrect, or if facts change, we could realize loss in excess of the recorded accruals, and even greater than our estimate of reasonably possible losses in excess of recorded accruals.
For more information regarding litigation contingencies, please refer to Note S on page 50 of the Consolidated Financial Statements in Exhibit 99.4 attached to this Form 8-K, which are incorporated herein by reference.
NEW ACCOUNTING STANDARDS
The FASB has issued accounting guidance effective for current and future periods. See Note A to the Consolidated Financial Statements on page 9 in Exhibit 99.4 attached to this Form 8-K for a more complete discussion.
29