UNITED STATES
SECURITIES AND EXCHANGE COMMISSION
Washington, D.C. 20549
(Mark One)
FORM 10-K
| | | | | |
| ☒ | ANNUAL REPORT PURSUANT TO SECTION 13 OR 15(d) OF THE
SECURITIES EXCHANGE ACT OF 1934 |
For the fiscal year ended December 31, 2024
or
| | | | | |
| ☐ | TRANSITION REPORT PURSUANT TO SECTION 13 OR 15(d) OF THE
SECURITIES EXCHANGE ACT OF 1934 |
For the transition period from to .
Commission File Number 001-07845
LEGGETT & PLATT, INCORPORATED
(Exact name of registrant as specified in its charter)
| | | | | | | | | | | |
| Missouri | | 44-0324630 |
(State or other jurisdiction of
incorporation or organization) | | (I.R.S. Employer
Identification No.) |
| 1 Leggett Road | | |
| Carthage, | Missouri | | 64836 |
| (Address of principal executive offices) | | (Zip code) |
Registrant’s telephone number, including area code: (417) 358-8131
Securities registered pursuant to Section 12(b) of the Act: | | | | | | | | |
| Title of each class | Trading Symbol | Name of each exchange on which registered |
| Common Stock, $.01 par value | LEG | New York Stock Exchange |
Securities registered pursuant to Section 12(g) of the Act: None
Indicate by check mark if the registrant is a well-known seasoned issuer, as defined in Rule 405 of the Securities Act. Yes ☒ No ☐
Indicate by check mark if the registrant is not required to file reports pursuant to Section 13 or Section 15(d) of the Act. Yes ☐ No ☒
Indicate by check mark whether the registrant (1) has filed all reports required to be filed by Section 13 or 15(d) of the Securities Exchange Act of 1934 during the preceding 12 months (or for such shorter period that the registrant was required to file such reports), and (2) has been subject to such filing requirements for the past 90 days. Yes ☒ No ☐
Indicate by check mark whether the registrant has submitted electronically every Interactive Data File required to be submitted pursuant to Rule 405 of Regulation S-T (§232.405 of this chapter) during the preceding 12 months (or for such shorter period that the registrant was required to submit such files). Yes ☒ No ☐
Indicate by check mark whether the registrant is a large accelerated filer, an accelerated filer, a non-accelerated filer, a smaller reporting company, or an emerging growth company. See the definitions of “large accelerated filer,” “accelerated filer,” “smaller reporting company” and “emerging growth company” in Rule 12b-2 of the Exchange Act. | | | | | | | | | | | | | | |
| Large accelerated filer | ☒ | | Accelerated filer | ☐ |
| | | |
| Non-accelerated filer | ☐ | | Smaller reporting company | ☐ |
| | | Emerging growth company | ☐ |
If an emerging growth company, indicate by check mark if the registrant has elected not to use the extended transition period for complying with any new or revised financial accounting standards provided pursuant to Section 13(a) of the Exchange Act. ☐
Indicate by check mark whether the registrant has filed a report on and attestation to its management's assessment of the effectiveness of its internal control over financial reporting under Section 404(b) of the Sarbanes-Oxley Act (15 U.S.C. 7262(b)) by the registered public accounting firm that prepared or issued its audit report. ☒
If securities are registered pursuant to Section 12(b) of the Act, indicate by check mark whether the financial statements of the registrant included in the filing reflect the correction of an error to previously issued financial statements. ☐
Indicate by check mark whether any of those error corrections are restatements that required a recovery analysis of incentive-based compensation received by any of the registrant’s executive officers during the relevant recovery period pursuant to §240.10D-1(b). ☐
Indicate by check mark whether the registrant is a shell company (as defined in Rule 12b-2 of the Act). Yes ☐ No ☒
The aggregate market value of the voting common stock held by non-affiliates of the registrant (based on the closing price of our common stock on the New York Stock Exchange) on June 28, 2024 was $1,505,582,000.
There were 134,733,672 shares of the registrant’s common stock outstanding as of February 20, 2025.
DOCUMENTS INCORPORATED BY REFERENCE
Parts of Item 10, and all of Items 11, 12, 13 and 14 of Part III, are incorporated by reference from the Company's definitive Proxy Statement for the Annual Meeting of Shareholders to be held on May 7, 2025.
LEGGETT & PLATT, INCORPORATED—FORM 10-K
FOR THE YEAR ENDED December 31, 2024
TABLE OF CONTENTS
| | | | | | | | |
| | Page
Number |
| |
| PART I |
| Item 1. | | |
| | |
| Item 1A. | | |
| | |
| Item 1B. | | |
| | |
| Item 1C. | | |
| | |
| Item 2. | | |
| | |
| Item 3. | | |
| | |
| Item 4. | | |
| | |
| Supp. Item. | | |
| PART II |
| Item 5. | | |
| | |
| Item 6. | | |
| | |
| Item 7. | | |
| | |
| Item 7A. | | |
| | |
| Item 8. | | |
| | |
| Item 9. | | |
| | |
| Item 9A. | | |
| | |
| Item 9B. | | |
| | |
| Item 9C. | | |
| PART III |
| Item 10. | | |
| | |
| Item 11. | | |
| | |
| Item 12. | | |
| | |
| Item 13. | | |
| | |
| Item 14. | | |
| PART IV |
| Item 15. | | |
| | |
| | |
| | |
| Item 16. | | |
| |
| |
Forward-Looking Statements
This Annual Report on Form 10-K, as well as the documents, or portion thereof, incorporated by reference herein, may contain “forward-looking” statements within the meaning of Section 27A of the Securities Act of 1933, as amended, and Section 21E of the Securities Exchange Act of 1934, as amended, including, but not limited to: projections of our revenue, income, earnings, capital expenditures, dividends, product demand, capital structure, cash flows, interest costs, the payment of cash dividends, metal margins, cash repatriation, tax impacts, effective tax rate, maintenance of commercial paper indebtedness, litigation expense, acquisition or disposition activity, collectability of receivables, ability to issue debt, cybersecurity protections and costs, cash expenditures, antidumping determinations, amortization expense, uses of cash, our technological competitiveness, compiling a GHG emissions inventory, hedge accounting treatment, unauthorized use of artificial intelligence, industry demand projections, impact of accounts receivable and payable programs, access to liquidity, compliance with debt covenants, raw material and parts availability and pricing, supply chain disruptions, labor, raw material and part shortages, inventory levels, climate-related targets and costs, goodwill or other asset impairment; possible plans, goals, objectives, prospects, strategies, or trends concerning future operations; statements concerning future economic performance; items related to the restructuring plan (the “2024 Restructuring Plan” or “2024 Plan”) such as estimates of the amounts, types, and timing of facility closures, restructuring-related costs (cash and non-cash including write-down of inventories) and impairment charges, sales reduction, proceeds from the sale of facilities, and EBIT benefit; and the underlying assumptions relating to forward-looking statements. These statements are identified either by the context in which they appear or by use of words such as “anticipate,” “believe,” “estimate,” “expect,” “guidance,” “intend,” “may,” “plan,” “project,” “should,” or the like. All such forward-looking statements, whether written or oral, and whether made by us or on our behalf, are expressly qualified by the cautionary statements described in this provision.
Any forward-looking statement reflects only the beliefs of Leggett & Platt or its management at the time the statement is made. Because all forward-looking statements deal with the future, they are subject to risks, uncertainties, and developments, which might cause actual events or results to differ materially from those envisioned or reflected in any forward-looking statement. Moreover, we do not have and do not undertake any duty to update or revise any forward-looking statement to reflect events or circumstances after the date on which the statement was made. For all of these reasons, forward-looking statements should not be relied upon as a prediction of actual future events, objectives, strategies, trends, or results.
Listed below and discussed elsewhere in further detail in this Annual Report on Form 10-K, including in Item 1A. Risk Factors herein, are some important risks, uncertainties, and contingencies that could cause actual events or results to differ materially from forward-looking statements. It is not possible to anticipate and list all of the risks, uncertainties, and contingencies which could cause actual events or results to differ from forward-looking statements. However, some of these risks and uncertainties include the following:
•potential changes to our 2024 Restructuring Plan, including estimates relating to cash and non-cash costs, EBIT benefit, sales attrition, and the sale of real estate; our ability to implement the 2024 Plan or sell real estate and obtain expected proceeds in a timely manner; the impact on relationships with employees, customers, and suppliers; and other restructuring and impairment costs in addition to the 2024 Plan;
•delays and non-delivery of raw materials, parts, and finished products in our supply chain from fire, explosion, terrorism, geopolitical conflicts, government action, labor strikes, delivery port shutdowns, trade tensions, trucking constraints, pandemics, vendor quality issues, and non-compliance with laws;
•our product demand, growth rates, and reduced opportunities in the industries in which we participate;
•consumer confidence, housing turnover, employment levels, interest rates, and trends in capital spending;
•the loss of business with customers;
•impairment of goodwill and long-lived assets;
•our ability to manage working capital;
•our ability to borrow under our credit facility and comply with restrictive covenants;
•our ability to simplify our portfolio through our strategic review;
•compliance with environmental and climate change laws, including the cost, market, technological, and reputational impacts;
•the direct and indirect physical effects of climate change, including severe weather-related events, natural disasters, and changes in climate patterns, on our markets, operations, supply chains, and results;
•inability to collect receivables due to customer financial difficulties or insolvency;
•inflationary and deflationary impacts on raw materials, wage rates and energy costs, and availability and pricing of steel scrap and rod, chemicals, and semiconductors;
•our market share in goods and services we sell or provide;
•our ability to pass along cost increases through increased selling prices;
•price and product competition from Asian, European, Mexican, and domestic competitors;
•our ability to maintain profit margins if our customers change the quantity and mix of our products;
•our ability to access the commercial paper market and debt markets and increased borrowing costs due to credit rating changes;
•changes in political risk, U.S. or foreign laws, regulations, or legal systems (including tax and trade laws);
•the realization of deferred tax assets and challenges to tax positions pursuant to ongoing or future audits;
•cash repatriation from foreign accounts;
•the enforcement of antidumping and countervailing duties on the import of innersprings, steel wire rod, and finished mattresses;
•tariffs imposed by the U.S. government resulting in increased costs of imported purchases;
•the disruption of the semiconductor industry and our global operations generally from conflict between China and Taiwan;
•the development of commercially viable and innovative products;
•the financial health and stability of domestic mattress manufacturers, along with their ability to purchase mattress components, which could result in a reduction in the overall demand for our products;
•volatility related to growth of Chinese EV manufacturers and potential declines in market share among multinational OEMs, which could result in a reduction in the overall demand for our Automotive products;
•the functioning of our internal business processes and information systems through technology failures;
•cybersecurity incidents on our business, financial results, supplier or customer relationships, cybersecurity protection and remediation costs, legal costs, insurance premiums, competitiveness, and reputation;
•the unauthorized use of artificial intelligence that could expose Company information, infringe intellectual property rights, violate privacy laws, and harm our reputation;
•the costs and risk exposure relating to sustainability matters, including sustainability issues, regulatory or legal requirements, and disparate stakeholder expectations;
•litigation risks including antitrust, intellectual property, personal injury, contract disputes, product liability and warranty, taxation, patent, climate change, environmental, and workers’ compensation;
•business disruptions to our steel rod mill or wire mills, including a lack of adequate supply of steel scrap;
•foreign operating risks, including credit, intellectual property rights, exchange rates, labor strikes, customs rates, asset seizure, business licensing, land use requirements, and inconsistent enforcement of laws;
•controls regarding the exportation of semiconductor chips and equipment to China;
•compliance with privacy and data protection regulations; and
•continuation of cash dividends on our common stock.
PART I
Item 1. Business.
Summary
Leggett & Platt, Incorporated ("Leggett & Platt," "Company," "we," "us," or "our"), a pioneer of the steel coil bedspring, is an international diversified manufacturer that conceives, designs, and produces a wide range of engineered components and products found in many homes and automobiles. As discussed below, our operations are organized into 15 business units, which are divided into seven groups under our three segments: Bedding Products; Specialized Products; and Furniture, Flooring & Textile Products.
Overview of Our Segments
Bedding Products Segment
| | |
| BEDDING GROUP |
| Steel Rod |
| Drawn Wire |
| U.S. Spring |
| Specialty Foam |
| Adjustable Bed |
| International Bedding |
| Machinery |
Our Bedding Products segment has its roots in the Company's founding in 1883 with the manufacture of steel coil bedsprings. Today, we support our customers' product needs from raw materials to components to finished mattresses and foundations and provide distribution and fulfillment capabilities. Our industry-leading innerspring and specialty foam technologies, innovative product development, and vertical integration allow us to create value for our customers at each step, from raw material to end consumer.
We operate a steel rod mill in the United States with annual capacity of approximately 500,000 tons. Approximately half of the rod mill's output is used internally by our wire mills to supply virtually all of the wire consumed by our domestic innerspring operations and other businesses. We also supply steel rod and wire to trade customers that operate in a broad range of markets. Our innerspring operations produce coils and semi-finished mattress products with internally designed and manufactured wire-forming machines.
In Specialty Foam, we blend polyols and chemical additives to enhance foam properties and pour and fabricate foam for use in bedding and furniture applications. We utilize our specialty foam capabilities to produce mattress accessories and private label boxed mattresses, which often also incorporate our innersprings in hybrid mattress designs.
We are a major supplier of adjustable beds, with North American manufacturing and distribution, and global sourcing capabilities. Internationally, primarily in Europe, we produce innersprings, specialty foam, and finished mattresses. We also produce machinery used by bedding manufacturers in the production and assembly of their finished products. Our range of products offers our customers a single source for many of their component and finished product needs.
These innovative proprietary products and our efficient vertical integration have made us one of the largest U.S.-based manufacturers in many of these businesses. We strive to understand what drives consumer purchases in our markets and focus our product development activities on meeting end-consumer needs. We believe we attain a cost advantage from efficient manufacturing methods, internal production of certain raw materials, large-scale production, and purchasing leverage. Sourcing components and finished products from us allows our customers to focus on designing, merchandising, and marketing their products.
PRODUCTS
Bedding Group
| | | | | | | | | | | |
| • | | Steel rod |
| • | | Drawn wire |
| • | | Innersprings (sets of steel coils, bound together, that form the core of a mattress) |
| • | | Specialty foam chemicals and additives |
| • | | Specialty foam for use primarily in bedding and furniture |
| • | | Semi-finished mattresses (a subassembly including innersprings and foam) |
| • | | Private label finished mattresses, often sold compressed and boxed |
| • | | Mattress accessories, such as pillows and toppers |
| • | | Static foundations |
| • | | Adjustable beds |
| • | | Machines that we use to produce innersprings; industrial sewing and quilting machines; mattress-packaging and glue-drying equipment |
CUSTOMERS
| | | | | | | | | | | |
| • | | We used more than 60% of our wire mill output to manufacture our own products in 2024, with the majority going to our U.S. innerspring operations |
| • | | Various industrial users of steel rod and wire |
| • | | Manufacturers of finished bedding (mattresses and foundations) |
| • | | Bedding brands and mattress retailers |
| • | | E-commerce retailers |
| • | | Big box retailers, department stores, and home improvement centers |
Specialized Products Segment
| | |
| AUTOMOTIVE GROUP |
| Automotive |
|
| AEROSPACE PRODUCTS GROUP |
| Aerospace Products |
|
| HYDRAULIC CYLINDERS GROUP |
| Hydraulic Cylinders |
Our Specialized Products segment designs, manufactures, and sells products including automotive comfort and convenience systems, tubing and fabricated assemblies for the aerospace industry, and hydraulic cylinders for the material handling and heavy construction industries. In our Automotive business, our technical capability and deep customer engagement allows us to compete on critical functionality, such as comfort, size, weight, and noise. We believe our reliable product development and launch capability, coupled with our global footprint, makes us a trusted supplier to our Tier 1 and Original Equipment Manufacturer (OEM) customers.
PRODUCTS
Automotive Group
| | | | | | | | | | | |
| • | | Mechanical and pneumatic lumbar support and massage systems for automotive seating |
| • | | Seat suspension systems |
| • | | Motors and actuators, used in a wide variety of vehicle power features |
| • | | Cables |
Aerospace Products Group
| | | | | | | | | | | |
| • | | Titanium, nickel, and stainless-steel tubing, formed tube, tube assemblies, and flexible joint components, primarily used in fluid conveyance systems |
Hydraulic Cylinders Group
| | | | | | | | | | | |
| • | | Engineered hydraulic cylinders |
CUSTOMERS
| | | | | | | | | | | |
| • | | Automobile Tier 1 suppliers and OEMs |
| • | | Aerospace OEMs and suppliers |
| • | | Mobile equipment OEMs, primarily serving material handling and heavy construction markets |
Furniture, Flooring & Textile Products Segment
| | |
| HOME FURNITURE GROUP |
| Home Furniture |
|
| WORK FURNITURE GROUP |
| Work Furniture |
|
| FLOORING & TEXTILE PRODUCTS GROUP |
| Flooring Products |
| Fabric Converting |
| Geo Components |
In our Furniture, Flooring & Textile Products segment, we design, manufacture, and distribute a wide range of components and finished products for residential and commercial markets, and select structural fabric and geo component markets. We supply components used by home and work furniture manufacturers to provide comfort, motion, and style in their finished products and manufacture select lines of private-label finished furniture. We produce carpet cushion and hard surface flooring underlayment for residential and commercial use. We convert fabrics into components used by bedding and furniture manufacturers and in other applications such as filtration, hospitality, automotive, and packaging. We also convert and distribute geo components for erosion control, subgrade stabilization, and storm water management.
PRODUCTS
Home Furniture Group
| | | | | | | | | | | |
| • | | Steel mechanisms and motion hardware (enabling furniture to recline, tilt, swivel, rock, and elevate) for reclining chairs, sofas, sleeper sofas, and lift chairs |
| • | | Springs and seat suspensions for chairs, sofas, and loveseats |
Work Furniture Group
| | | | | | | | | | | |
| • | | Components and private-label finished goods for collaborative soft seating |
| • | | Bases, columns, back rests, casters, and frames for office chairs, and control devices that allow chairs to tilt, swivel, and elevate |
Flooring & Textile Products Group
| | | | | | | | | | | |
| • | | Carpet cushion and hard surface flooring underlayment (made from bonded scrap foam, fiber, rubber, and prime foam) |
| • | | Structural fabrics for mattresses, residential furniture, and industrial uses |
| • | | Geo components (synthetic fabrics and various other products used in ground stabilization, drainage protection, erosion, and weed control) |
CUSTOMERS
| | | | | | | | | | | |
| • | | Manufacturers of upholstered and office furniture |
| • | | Flooring retailers and distributors, including big box retailers and home improvement centers |
| • | | Contractors, landscapers, road construction companies, retailers, and government agencies using or selling geo components |
| • | | Mattress and furniture producers |
| • | | Manufacturers of draperies, specialty packaging, filtration, and automotive upholstery |
2024 Restructuring Plan
In the first quarter of 2024, we committed to a restructuring plan, primarily associated with our Bedding Products segment and, to a lesser extent, our Furniture, Flooring & Textile Products segment (the “2024 Restructuring Plan” or “2024 Plan”), which is expected to be substantially complete by the end of 2025. The 2024 Plan was expanded in the second quarter of 2024 to include a restructuring opportunity within the Specialized Products segment and in the third quarter of 2024 to include general and administrative cost structure initiatives.
For more information about the 2024 Restructuring Plan, please see the discussion under Operational Risk Factors beginning on page 15 in Item 1A. Risk Factors, and in Item 7. Management's Discussion and Analysis of Financial Condition and Results of Operations on page 39.
Strategic Initiatives
We are evaluating the market attractiveness and competitive position of all our businesses and assessing opportunities for profitable, long-term growth. We are also determining which businesses are the best long-term fit for the company and as part of this review, we are currently exploring the potential sale of our Aerospace business. This business has not reached the criteria to be classified as held for sale.
Acquisitions
We did not acquire any businesses in 2024 or 2023.
In August 2022, we acquired two businesses. First, we acquired a small U.S. textiles business that converts and distributes construction fabrics for the furniture and bedding industries for a cash purchase price of $2 million. This acquisition became part of our Furniture, Flooring & Textile Products segment. Second, we acquired a global manufacturer of hydraulic cylinders for heavy construction equipment for a final purchase price of $88 million ($61 million cash plus additional contingent consideration). This business has manufacturing
locations in Germany and China and a distribution facility in the United States, and operates within the Specialized Products segment.
In early October and mid-December 2022, we acquired two Canadian distributors of products used for erosion control, stormwater management, and various other applications for a cash purchase price of $7 million and $13 million, respectively. These acquisitions became a part of our Furniture, Flooring & Textile Products segment and expanded the geographic scope of our Geo Components business unit.
For more information regarding our acquisitions, please refer to Note R on page 119 of the Notes to Consolidated Financial Statements. Divestitures
We did not have any divestitures of businesses in 2024 or 2023.
In February 2022, we sold our South African bedding innerspring operation for a cash purchase price of approximately $2 million. This business was reported in our Bedding Products segment.
Foreign Operations
The percentages of our trade sales related to products manufactured outside the United States were 35%, 39%, and 40% in 2022, 2023, and 2024, respectively. In comparison to our other two segments, our Specialized Products segment has a larger percentage of trade sales manufactured outside the United States, which ranged between 84% and 86% over the last three years.
Our international operations are principally located in Europe, China, Canada, and Mexico. Our products in these foreign locations primarily consist of:
Europe
| | | | | |
| • | Innersprings, specialty foam, and finished mattresses |
| • | Lumbar and seat suspension systems for automotive seating and actuators for automotive applications |
| • | Seamless and welded tubing and fabricated assemblies for aerospace applications |
| • | Select lines of private-label finished furniture |
| • | Hydraulic cylinders for material handling and heavy construction equipment |
| • | Machinery and equipment designed to manufacture innersprings for mattresses |
China
| | | | | |
| • | Lumbar and seat suspension systems for automotive seating |
| • | Cables, motors, and actuators for automotive applications |
| • | Recliner mechanisms and bases for upholstered furniture |
| • | Work furniture components, including chair bases and casters |
| • | Innersprings for mattresses |
| • | Hydraulic cylinders for heavy construction equipment |
Canada
| | | | | |
| • | Lumbar and seat suspension systems for automotive seating |
| • | Fabricated wire for the furniture and automotive industries |
| • | Work furniture chair controls and bases |
| • | Geo components |
Mexico
| | | | | |
| • | Lumbar and seat suspension systems for automotive seating |
| • | Motors and actuators for automotive applications |
| • | Adjustable beds |
| • | Select lines of private-label finished furniture |
Geographic Areas of Operation
As of December 31, 2024, we had 119 manufacturing facilities in 18 countries; 71 located in the United States and 48 located in foreign countries, as shown below. We also had various sales, warehouse, and administrative facilities. However, our manufacturing facilities are our most important properties.
| | | | | | | | | | | |
| Bedding Products | Specialized Products | Furniture, Flooring & Textile Products |
| North America | | | |
| Canada | | n | n |
| Mexico | n | n | n |
| United States | n | n | n |
| Europe | | | |
| Austria | | n | |
| Belgium | | n | |
| Croatia | n | | |
| Denmark | n | | |
| France | | n | |
| Germany | | n | |
| Hungary | | n | |
| Ireland | n | | |
| Poland | | | n |
| Switzerland | n | | |
| United Kingdom | n | n | |
| South America | | | |
| Brazil | n | | |
| Asia | | | |
| China | n | n | n |
| India | | n | |
| South Korea | | n | |
Dependence on Market Demand for Key Product Families
The following table shows our approximate percentage of trade sales by product family for the last three years, which indicates the degree of dependence upon market demand:
| | | | | | | | | | | | | | | | | | | | | | | | | | |
| Product Families | 2024 | | 2023 | | 2022 |
| Bedding Group | 40 | % | | 42 | % | | 46 | % |
| Flooring & Textile Products Group | 20 | | | 19 | | | 18 | |
| Automotive Group | 19 | | | 19 | | | 17 | |
| Home Furniture Group | 6 | | | 6 | | | 8 | |
| Work Furniture Group | 6 | | | 6 | | | 6 | |
| Hydraulic Cylinders Group | 5 | | | 5 | | | 3 | |
| Aerospace Products Group | 4 | | | 3 | | | 2 | |
| | | | | | | | |
We do not have a material amount of sales derived from government contracts subject to renegotiation of profits or termination at the election of any government. As such, our business is not materially dependent upon governmental customers.
Distribution of Products
We sell and distribute our products primarily through our own personnel. However, many of our businesses have relationships and agreements with outside sales representatives and distributors. We do not believe any of these agreements or relationships would, if terminated, have a material adverse effect on our consolidated financial condition, operating cash flows, or results of operations.
Sources and Availability of Raw Materials
The products we manufacture require a variety of raw materials. We believe that worldwide supply sources are available for all the raw materials we use, as explained below. Among the most important raw materials we use are:
| | | | | |
| • | Various types of steel, including scrap, rod, wire, sheet, and stainless |
| • | Chemicals used in foam production |
| • | Foam scrap |
| • | Woven and nonwoven fabrics |
| • | Titanium and nickel-based alloys and other high strength metals |
| • | Electronic systems (including semiconductors) |
We supply our own raw materials for many of the products we make. For example, we produce steel rod that we make into steel wire, which we then use to manufacture innersprings and static foundations for mattresses. Our domestic wire drawing mills purchase nearly all of their steel rod requirements from our rod mill. Our wire drawing mills supply nearly all of our U.S. requirements for steel wire.
Customer Concentration
We serve thousands of customers worldwide, sustaining many long-term business relationships. Our largest customer represented less than 8% of our 2024 consolidated revenue. Our top 10 customers accounted for approximately 32% of these consolidated revenues. The loss of one or more of these customers could have a material adverse effect on the Company and the respective segments in which the customer’s sales are reported.
Patents and Trademarks
As of December 31, 2024, we had 1,281 patents issued, 503 patents in process, 1,007 trademarks registered, and 57 trademarks in process. No single patent or group of patents, or trademark or group of trademarks, is material to our operations as a whole. A significant number of our patents relate to products manufactured in each of our three segments, while over half of our trademarks relate to products manufactured by the Bedding Products segment. The expiration of any single patent would not have a material negative effect on our results of operations or financial condition.
Some of the most significant trademarks used in our businesses include: | | | | | |
| • | ComfortCore®, Quantum®, Eco-Base®, CombiCoreTM, Nanocoil®, Softech®, Active Support Technology®, Mira-Coil®, and VertiCoil® (mattress innersprings) |
| • | Energex®, Coolflow®, ThermaGel®, EcoFlowTM, and Gorilla FoamTM (specialty foam products) |
| • | Semi-Flex® (box spring components and foundations) |
| • | Spuhl® (mattress innerspring manufacturing machines) |
| • | Wall Hugger® (recliner chair mechanisms) |
| • | No-Sag® (wire forms used in seating) |
| • | LPSense® (capacitive sensing) |
| • | Hanes® (fabric materials) |
| • | Schukra® (automotive seating products) |
| • | Gribetz® and Porter® (quilting and sewing machines) |
Product Development
One of our strongest performing product categories across the Company is ComfortCore®, our fabric-encased innerspring coils used in hybrid mattresses. ComfortCore® represented 70% of our U.S. innerspring units in 2024. Our ComfortCore® innersprings can be further enhanced with Quantum® Edge and Eco-Base® features. Quantum® Edge units are narrow-diameter, fabric-encased coils that form a perimeter around an innerspring set, replacing a rigid foam perimeter in a finished mattress. In 2024, over 40% of our ComfortCore® innersprings in the United States had the Quantum® Edge feature. In 2022, we launched two new products called the Quantum® Edge Enhanced Profile with Eco-Base® and Caliber Edge® Enhanced Profile with Eco-Base®. Our Eco-Base® products feature a robust polyester fabric attached to the bottom of a ComfortCore® unit, eliminating non-value-added base foam in a finished mattress and saving customers time and labor. To maintain mattress profile, innerspring coil height is increased by one inch.
Our Specialty Foam business formulates many of the chemicals and additives used in the production of specialty foams for the bedding and furniture industries. These branded, specialty polyols and additives enhance foam performance by reducing heat retention and improving mobility, support, and durability. Our innovations enable us to produce high-quality, differentiated compressed mattresses.
We are leveraging our innerspring and specialty foam technologies to develop unique products that meet end-consumer needs while streamlining mattress manufacturing for our customers by reducing labor constraints and simplifying supply chain and inventory requirements. In 2023, we launched CombiCoreTM, a semi-finished mattress featuring fabric-encased perimeter edge innerspring and specialty foam columns that minimize motion disturbance from a sleeping partner and improve airflow. In 2024, we launched our pre-foam encased product, which features foam rails automatically attached to an Eco-Base® innerspring set during the innerspring production process.
Our Automotive business designs and engineers lightweight components that help reduce overall vehicle weight and improve fuel efficiency (and thus reduce noise and greenhouse gas emissions), while maintaining performance, safety, and functionality. These products help auto manufacturers meet emission standards and their environmental goals for both internal combustion engines and electric vehicles.
Across our other businesses, we are engaged in product development activities to improve product quality, increase efficiency, support ongoing growth, and help our customers achieve their goals.
Human Capital Management
Our success depends on our ability to attract and retain talent, foster a culture of inclusion, respect, and equal opportunity, provide a safe and healthy work environment, train and develop our employees, and ensure productive succession planning efforts. The Board’s Human Resources and Compensation Committee has oversight of our human resources policies and programs, officer and director compensation, compensation plans, executive succession planning, and senior management leadership development. This oversight is designed to support our business objectives, to attract, retain, and develop high-quality leadership, and to link compensation with business performance.
Our Employees
At year-end 2024, we had approximately 17,700 employees, of which around 11,500 were engaged in production and around 10,200 were international employees. Of these employees, approximately 5,400 were in Bedding Products, 7,000 were in Specialized Products, and 4,500 were in Furniture, Flooring & Textile Products, with the remainder in other roles. Also, at year-end 2024, approximately 14% of our employees were represented by labor unions that collectively bargain for work conditions, wages, or other issues. We did not experience any material work stoppage related to labor contract negotiations during 2024, and we are not aware of circumstances likely to result in a material work stoppage during 2025. At year-end 2023, we had approximately 19,300 employees.
Our Ability to Attract, Recruit, and Retain Employees
We operate in competitive labor markets, and accordingly, we attract, recruit, and retain employees through competitive compensation and benefits, training and development programs that support career growth, and employee engagement initiatives designed to foster a strong, inclusive culture.
Compensation and Benefits. We offer cash compensation and benefits designed to attract and retain the talent needed to achieve our business objectives. Depending on location, we offer health, dental, and vision benefits; flexible spending plans and health savings accounts; retirement savings; disability, life, critical illness, accident, and travel insurance; well-being and employee assistance programs; vacation, personal time, and holidays; and a discount stock purchase plan. We also provide incentive programs for management employees based on performance. Finally, we offer part-time jobs, flexible hours, and remote and hybrid working, where applicable.
Training and Development Programs. Developing our talent continues to be part of our ongoing, long-term strategy, which is focused on growing talent, including technical/skilled positions, supervisory and management levels, and other future leaders. We believe that the first step toward achieving our long-term strategic business goals is to maintain a culture of employee development at all levels of the Company. In 2024, we engaged employees on a monthly basis in learning spotlights which included development programs regarding career growth, change management, collaboration, feedback, gratitude, professional growth, psychological safety, and other topics.
Employee Engagement and Satisfaction. We analyze employee satisfaction to better enhance engagement. At many of our locations, we collect data on employee satisfaction, feedback, and turnover through surveys, employee focus groups, and turnover analysis. From this data, we develop plans designed to improve engagement and reduce turnover.
We rely on a stable workforce to deliver our operating results. In 2024, our turnover rates in the United States were reasonably comparable to average voluntary turnover rates of the manufacturing industry in the United States.
At all locations, we also have an Ethics Hotline where employees can express concerns, confidentially and anonymously, regarding possible violations of ethics, law, or our policies. All reports received are promptly investigated, and appropriate action is taken based on the findings. Our Ethics Hotline helps ensure that the voices of our employees are heard.
Our Culture of Inclusion, Respect, and Equal Opportunity
We continue to foster a culture of inclusion in which everyone is respected, valued, and has an equal opportunity to contribute, grow, thrive, and advance. We strive to cultivate inclusive team environments that empower all employees to realize their full potential. We believe that it is important to appreciate people's differences and provide equal employment opportunities at all organizational levels, without regard to irrelevant factors such as sex, race, age, etc. Our commitment is to maintain our focus on building a workforce of qualified and talented individuals, who can best contribute to the Company's success. We are taking comprehensive actions to build on our foundational awareness, understanding, engagement, and skills to promote a culture of respect and equal opportunity.
Our Workforce Health and Safety
We are dedicated to the health and safety of our employees through prevention, education, and awareness with the objective of mitigating workplace injuries through accident investigation and process safety. Our dedicated staff of professionals supports health and safety management at our manufacturing facilities, including implementation of a comprehensive program called “SafeGuard.” The SafeGuard program develops relevant job hazard analyses, which are undertaken on many processes and used to develop comprehensive job procedures. This allows us to implement job-specific health and safety practices across our business.
Our manufacturing employees receive new hire and annual refresher safety training, weekly “tool box” talks regarding safety and training, job-specific safety training based on the job hazards analysis developed from our SafeGuard program, and safety stand-down training based on real-time identified and emerging risks, when needed.
Succession Development
We are committed to having strong managers and leadership in critical roles across the Company. Our values and culture guide our talent initiatives, which are designed to create a pipeline of strong, high performing leadership candidates to serve in progressively important roles throughout the Company. Our internal promotion rate over the last three years for corporate officer positions was 100%. We are building on our success in these areas and continue to develop our succession processes to allow us to adapt and grow.
Trends in Market Demand and Competition
Market Demand. Market demand (including product mix) is impacted by several economic factors, with housing turnover and consumer confidence being the most significant. Other important factors include disposable income levels, employment levels, and interest rates. All of these factors influence consumer spending on durable goods, and therefore affect demand for our products and components. Some of these factors also influence spending on infrastructure, facilities, and equipment, which has historically impacted approximately 25%-30% of our sales. The dynamic macroeconomic environment has pressured most of our end markets and negatively affected the demand for our products. As a result of these uncertainties, we expect 2025 overall demand to be down modestly from 2024 levels. For more information on our trends in market demand, see Market Demand in Item 7. Management’s Discussion and Analysis of Financial Condition and Results of Operations on page 41. Competition. Many companies offer products that compete with those we manufacture and sell. The number of competing companies varies by product family, but many of the markets for our products are highly competitive. We tend to attract and retain customers through innovation, product quality, competitive pricing, and customer service. Many of our competitors try to win business primarily on price, but, depending upon the particular product, we experience competition based on quality and performance as well. In general, our competitors tend to be smaller, private companies.
Based on certain industry data, we believe we are a leading supplier, in terms of revenue, of the following:
| | | | | |
| • | Bedding components and private label finished goods |
| • | Automotive seat comfort and convenience systems |
| • | Home and work furniture components |
| • | Geo components |
| • | Flooring underlayment |
| • | Hydraulic cylinders for material handling and heavy construction applications |
| • | Aerospace tubing and fabricated assemblies |
We continue to face pressure from foreign competitors, as some of our customers source a portion of their components and finished products offshore. In addition to lower labor rates, foreign competitors benefit (at times) from lower raw material costs. They may also benefit from currency factors and more lenient regulatory climates. We typically compete in market segments that value product differentiation. When we do compete on cost, we typically remain price competitive in most of our business units, even versus many foreign manufacturers, as a result of our efficient operations, automation, vertical integration in steel rod and wire, logistics and distribution efficiencies, and large-scale purchasing of raw materials and commodities. To stay competitive with global steel costs, both contract and non-contract innerspring pricing was adjusted in the back half of 2023 and fully realized in 2024. We have also reacted to foreign competition in certain cases by developing new proprietary products that help our customers reduce total costs and by shifting production offshore to take advantage of lower input costs.
For information about antidumping duty orders regarding innerspring, steel wire rod, and mattress imports, please see Competition in Item 7. Management’s Discussion and Analysis of Financial Condition and Results of Operations on page 42. Seasonality
We generally experience some seasonality in our consolidated sales, earnings, and operating cash flows. Both sales and earnings are typically higher in the second and third quarters, primarily driven by our residential bedding and furniture businesses, as well as our geo components business. Also, historically, our operating cash flows have been stronger in the fourth quarter, primarily related to the timing of cash collections from customers and payments to vendors, and lower in the first quarter, when annual cash incentive payments are paid and as inventories typically increase. However, supply chain disruptions, inflation, and other macroeconomic factors have impacted seasonality in prior years.
Governmental Regulations
Our operations are subject to various federal, state, local, and international laws and regulations, including environmental regulations. We have policies intended to ensure that our operations are conducted in compliance with applicable laws and regulations. While we cannot predict policy changes by various regulatory agencies or unexpected operational or other developments, management expects that compliance with these laws and regulations will not have a material adverse effect on our capital expenditures (including those capital expenditures for environmental control facilities), earnings, and competitive position.
Internet Access to Information
We routinely post information for investors under the Investor Relations section of our website (www.leggett.com). Our annual reports on Form 10-K, quarterly reports on Form 10-Q, current reports on Form 8-K, and all amendments to those reports are made available, free of charge, on our website as soon as reasonably practicable after electronically filed with, or furnished to, the SEC. In addition to these reports, the Company’s Financial Code of Ethics, Code of Business Conduct and Ethics, and Corporate Governance Guidelines, as well as charters for the Audit, Human Resources and Compensation, and Nominating, Governance and Sustainability Committees of our Board of Directors, can be found on our website under the Governance section. Information contained on our website does not constitute part of this Annual Report on Form 10-K.
Industry and Market Data
Unless indicated otherwise, the information concerning our industries contained in this Annual Report is based on our general knowledge of and expectations concerning the industries. Our market share is based on estimates using our internal data, information from various industry analyses, internal research, and adjustments and assumptions that we believe to be reasonable. We have not independently verified data from industry analyses and cannot guarantee their accuracy or completeness.
Item 1A. Risk Factors.
Investing in our securities involves risk. Set forth below and elsewhere in this report are risk factors that could cause actual results to differ materially from the results contemplated by the forward-looking statements contained in this report. We may amend or supplement these risk factors from time to time by other reports we file with the SEC.
Operational Risk Factors
Supply chain disruptions and shortages impacting our ability to timely receive competitively priced raw materials and parts used in our products, or impacting our ability to timely deliver our finished products to customers, may adversely affect our manufacturing processes, financial condition, results of operations, and cash flows.
We have manufacturing facilities in 18 countries, primarily located in North America, Europe, and Asia. In our manufacturing processes, we source raw materials and parts from a global supply chain. We sell and deliver our finished products to customers all over the world. We rely on third parties to supply certain raw materials, components, and packaging products and to deliver our finished products. Any interruption or failure by our suppliers to meet their obligations on schedule could adversely affect our business and financial results. In recent years, we have experienced supply chain disruptions related to foam chemical shortages, semiconductor shortages, labor availability, and freight challenges, as well as higher costs associated with each of these issues. We have also experienced delays in delivery of materials, parts, and finished goods because of delivery port disruptions, trucking constraints, and inclement weather. At times, this has resulted in reduced volume and higher costs in many of our businesses, including our Automotive Group and Bedding Products segment.
We also bear the risk of delays or non-delivery from our suppliers or reduced demand from our customers because of natural disasters, fires, explosions, terrorism, pandemics, labor strikes, foreign government action including asset seizure, changed licensing, or land use requirements which restrict operations, or other reasons beyond our control or the control of our suppliers, all of which could impair our ability to timely manufacture and deliver our products.
Labor strikes or shutdowns at delivery ports, loss of or damage to raw materials, parts, or finished products while they are in transit or storage, losses due to tampering, third-party vendor issues with quality, failure by our suppliers to comply with applicable laws and regulations, potential tariffs or other trade restrictions, or similar problems could restrict or delay the supply of raw materials, parts, or finished products, resulting in harm to our business and reputation. Also, in late 2023 and early 2024, the conflict in the Red Sea caused delays with some of our shipments, while other shipments from China to the United States or Europe have been re-routed.
The aforementioned supply chain risks can materially adversely affect our manufacturing processes, financial condition, results of operations, and cash flows.
Our 2024 Restructuring Plan may not achieve its intended outcomes, and we may incur restructuring costs, restructuring-related costs, and impairments in addition to those anticipated to be incurred in connection with our announced 2024 Restructuring Plan.
2024 Restructuring Plan
In the first quarter of 2024, we committed to a restructuring plan (the “2024 Restructuring Plan” or “2024 Plan”). The 2024 Plan is primarily associated with our Bedding Products segment and, to a lesser extent, our Furniture, Flooring & Textile Products segment. The 2024 Plan was expanded in the second quarter of 2024 to include a restructuring opportunity within the Specialized Products segment and in the third quarter of 2024 to include the general and administrative cost structure initiatives. We expect to consolidate between 15 and 20 production and distribution facilities in the Bedding Products segment and a small number of production facilities in the Furniture, Flooring & Textile Products segment.
With respect to Bedding Products, we (i) consolidated 14 production and distribution facilities (ten in U.S. Spring, three in Specialty Foam, one in Adjustable Bed); (ii) consolidated all domestic innerspring production
into our four larger remaining spring production facilities; (iii) exited our Mexican innerspring operation; (iv) downsized our Chinese innerspring operation; and (v) sold two properties. With respect to Specialized Products, we launched restructuring activities in our Hydraulic Cylinders business to optimize manufacturing and improve operating efficiencies. With respect to Furniture, Flooring & Textile Products, we closed one facility each in the Home Furniture and Flooring Products business units. Finally, we reduced corporate general and administrative expenses, which are expected to be fully realized in 2025. In 2025, we expect to have further consolidations in Bedding Products (primarily in Specialty Foam), achieve full implementation of manufacturing efficiency improvement activities in Hydraulic Cylinders, and complete restructuring initiatives in Flooring Products.
Below is a table containing the 2024 Restructuring Plan costs, EBIT benefit, sales attrition, and proceeds from the sale of real estate incurred or realized in 2024, and our estimates for 2025 and thereafter:
| | | | | | | | | | | | | | | | | | | | | | | | | | | | |
| (Dollar amounts in millions-all pretax) | | 2024
Actual | | | | Estimates for 2025 1 | | Total Plan Estimate 2, 3, 4 | | Total Plan Prior Estimate 3 |
| Plan activity: | | | | | | | | | | |
| Restructuring and restructuring-related costs: | | | | | | | | | | |
| Cash | | $ | 30 | | | | | $15 to $20 | | $45 to $50 | | $30 to $40 |
| Non-cash | | 18 | | | | | 15 to 20 | | 35 to 40 | | 35 to 45 |
| Total costs | | $ | 48 | | | | | $30 to $40 | | $80 to $90 | | $65 to $85 |
| | | | | | | | | | |
Pretax net cash from real estate 5 | | $ | 20 | | | | | $15 to $40 | | $60 to $80 | | $60 to $80 |
| | | | | | | | | | |
| Plan impacts: | | | | | | | | | | |
| Sales attrition | | $ | 15 | | | | | $ | 60 | | | $ | 80 | | | $ | 80 | |
| | | | | | | | | | |
| EBIT benefit | | $ | 22 | | | | | $55 to $60 | | $60 to $70 | | $50 to $60 |
1 Estimates for 2025 sales attrition and EBIT benefit include full year impacts of the actions completed in 2024 and additional actions expected to be completed in 2025.
2 Due to implementation timing of certain restructuring activities, we expect to have a small amount of incremental EBIT benefit and sales attrition in 2026. Additionally, due to the timing of listing properties, we expect the remainder of real estate sales to occur in 2026.
3 Estimates of annualized sales attrition and EBIT benefit are expected to be realized after the 2024 Plan is fully implemented in late 2025.
4 Increases in our total plan estimates for both cash costs and EBIT benefit are related to 2024 Plan activities in our Specialized Products segment and our general and administrative initiatives.
5 Pretax net cash from real estate is only related to the 2024 Plan and does not include the sale of idle real estate. The 2024 sale of real estate resulted in a pretax gain of $17 million. We estimate up to $37 million of pretax gains on the sale of real estate in 2025.
Total restructuring and restructuring-related costs, including 2024 Plan costs and costs to explore the potential sale of our Aerospace business, for the year ending December 31, 2024, were $51 million ($33 million cash and $18 million non-cash).
2024 Plan costs are expected to be substantially complete by the end of 2025.
Because of certain risks and uncertainties, the estimates of the number of facilities to be consolidated, EBIT benefit, sales attrition, proceeds from the sale of real estate, and the cash and non-cash costs and impairments associated with the 2024 Plan may change as our analysis develops and additional information is obtained. Also, we may not be able to implement the 2024 Plan in a timely manner that will positively impact our
financial condition and results of operations. Moreover, we may not be able to dispose of real estate pursuant to the 2024 Plan or obtain the expected proceeds in a timely manner. The 2024 Plan may also negatively impact our relationships with employees, customers, and vendors. Any failure to achieve the intended outcomes could materially adversely affect our business, financial condition, results of operations and cash flows, and liquidity. The 2024 Plan may not achieve its intended outcomes.
We continue to evaluate our businesses for further restructuring opportunities in addition to those activities included in the 2024 Plan. The execution of any of these opportunities may result in additional material restructuring costs, restructuring-related costs, or impairments.
Business disruptions to our steel rod mill or wire drawing mills, if coupled with an inability to purchase an adequate and/or timely supply of quality steel rod from alternative sources, could have a material negative impact on our Bedding Products segment and the Company's results of operations.
We purchase steel scrap from third-party suppliers and convert it into steel rod in our mill in Sterling, Illinois. Our steel rod mill has historically had annual output of approximately 500,000 tons, a majority of which has been used internally by our wire mills. Our two wire mills, located in Carthage, Missouri, and Kouts, Indiana, convert steel rod into drawn steel wire, which is used in the production of mattress innersprings and other products.
A disruption to the operation of, or supply of steel scrap to, our steel rod mill could require us to purchase steel rod from alternative supply sources, subject to market availability. Ongoing trade action by the U.S. government, along with the existence of antidumping and countervailing duty orders against multiple countries, could result in reduced market availability and/or higher cost of steel rod.
If we experience a disruption to our ability to produce steel rod in our mill, coupled with a reduction of adequate and/or timely supply from alternative market sources of quality steel rod, we could experience a material negative impact on our Bedding Products segment and the Company’s results of operations.
The physical effects of climate change could adversely affect our business, results of operations, and financial condition.
Direct Physical Effects
The acute and chronic physical effects of severe weather-related events, natural disasters, and/or significant changes in climate patterns, could have an increasingly adverse impact on our business and customers. At December 31, 2024, we had 119 manufacturing facilities in 18 countries, primarily located in North America, Europe, and Asia. We serve thousands of customers worldwide. In 2024, our customers were located in approximately 100 countries. Western states, including California and Washington, have historically experienced, and are projected to continue to experience, climate-related events (such as wildfires) at an increasing frequency. In early 2025, there were multiple wildfires in California, including unprecedented wildfires in the Los Angeles County area. We have production facilities located in California and Washington in each of our segments. To date, no facilities have suffered damage from these fires. However, because of lack of rain, higher temperatures, and unpredictable winds, we could experience potential adverse physical effects, including damage to our properties and disruption to our operations. Although our diverse geographical manufacturing footprint and our broad geographical customer base mitigates the potential physical risks of any local or regional severe weather-related event having a material effect on our operations and results, the increased frequency and severity of such weather-related events could result in potential damage to our physical assets, local infrastructure, transportation systems, water delivery systems, our customers’ or suppliers’ operations, as well as prolonged disruptions in our manufacturing operations (including, but not limited to, our steel rod mill and wire drawing mills), all of which could harm our business, results of operations, and financial condition.
Indirect Physical Effects
The physical effects of climate change could continue to have an adverse impact on our supply chain. In prior years, we experienced (due, in part, to severe weather-related impacts) supply shortages in chemicals, which restricted foam supply and constrained overall mattress production in the bedding industry. This reduced our production levels and increased the cost of chemicals and foam. Severe weather impacts could also reduce supply of other products in our supply chain that could result in higher prices for our products and the resources needed to produce them. If we are unable to secure an adequate and timely supply of products in our supply chain, or the cost of these products materially increases, it could have a negative impact on our business, results of operations, and financial condition.
In recent years, drought conditions lowered water levels of the Mississippi River and Panama Canal, reducing traffic through these waterways, which impacted some of our shipments. Although these issues did not have a material impact on our results of operations, additional logistical disruptions could result in additional costs and delays in our ability to deliver products timely to certain customers.
In addition, although the cost has not been material to our business, results of operations, and financial condition, severe weather-related incidents have resulted and may, in the future, result in increased costs of property insurance.
The market transition risks related to climate change could adversely affect our business, results of operations, and financial condition.
We are engaged in the manufacture of various automotive components, including lumbar supports and massage systems for seating, seat suspension systems, motors and actuators, and cables. For several decades, automotive manufacturers have sought lightweight components designed to increase fuel efficiency in the automobiles they manufacture. Replacing traditional steel components with lightweight alternative components can directly reduce the weight of a vehicle's body and chassis and therefore reduce a vehicle's fuel consumption. This increased fuel efficiency also indirectly reduces greenhouse gas (GHG) emissions.
These long-standing market transitions have negatively impacted our market share, although not materially because of our technological competitiveness. However, if we are unable to continue to react to changes in technology, successfully develop new and innovative products, or successfully respond to evolving business trends, including continuing to produce comparatively lightweight components, our share in these markets could be materially negatively impacted.
Global economic, political, legal, and business factors could adversely impact our business.
We operate in global markets. Approximately 40% of our sales in 2024 were generated outside the United States. In addition, as of December 31, 2024, 48 manufacturing facilities and approximately one-third of our tangible long-lived assets were located outside the United States. Our reliance on sales and manufacturing facilities outside the United States expose us to a number of risks, including price and currency controls; sanctions, export controls or trade restrictions, including import and export tariffs; extraterritorial effects of U.S. laws; expropriation of assets; war, civil uprisings; political instability; nationalization of private enterprises; hyperinflationary conditions; the necessity of governmental approvals for products and operations, currency conversion, cash repatriation; and laws and regulations that may be arbitrarily applied.
These factors could result in, or could continue to result in, among other things, supply chain or production disruptions, lower consumer demand, compressed profit margins, and unfavorable foreign currency exchange rates, any of which could materially negatively impact our business, results of operations, financial condition, and cash flows.
Geopolitical Risk Factors
Conflict between China and Taiwan could lead to trade sanctions, export controls, technology disputes, or supply chain disruptions, which could, in particular, impact the semiconductor industry, and our operations globally.
Our Automotive Group uses semiconductors in seat comfort products and, to a lesser extent, in motors and actuators. Our OEM and Tier customers also use semiconductors, or components containing semiconductors, in their manufacture of automotive components and/or vehicles. This supply could be challenged by any number of unexpected or unplanned events. According to certain market reports, Taiwan and, to a lesser extent, China are leading manufacturers of the world’s semiconductor supply. Conflict between China and Taiwan might lead to trade sanctions, export controls, technology disputes, or supply chain disruptions, which could, in particular, affect the semiconductor industry. If this were to occur, our Automotive Group’s ability to source an adequate supply of semiconductors may be reduced, which could adversely harm our business, financial condition, and results of operations. Such a conflict also could negatively impact our OEM and Tier customers' supply chains and production schedules. In addition, any outbreak of hostilities or conflict between China and Taiwan could harm our operations globally and the operations of our customers and suppliers.
Financial Risk Factors
Our borrowing costs and access to liquidity may be impacted by lower credit ratings.
Independent rating agencies evaluate our credit profile and have assigned ratings for our long-term and short-term debt. Recently, our credit ratings have been lowered and could be lowered further. These recent downgrades have resulted in slightly higher interest rates and could impact marketability. Lower credit ratings could adversely affect our sources of borrowing and our financial arrangements, including access to the commercial paper market, our lending agreements, and supply chain financing arrangements. If we are unable to meet our short-term borrowing needs in the commercial paper market, we may need to access our credit facility or other bank debt to fund short-term working capital needs at higher interest costs.
Our inability to collect receivables in accordance with their terms could negatively impact our earnings, liquidity, cash flow, and financial condition.
Some of our customers have suffered financial difficulty. As a result, some of our customers have been unable to pay their debts to us, have exhibited slow payments, have rejected their contractual obligations to us under bankruptcy laws or otherwise, or we have had to negotiate significant discounts and/or extend financing terms with these parties. These collection issues may continue.
We monitor our receivable portfolio closely and make reserve decisions based upon individual customer credit risk reviews, aging of customer accounts, historical loss experience, and general macroeconomic and industry trends that could impact the expected collectability of all customers or pools of customers with similar risks. Our bad debt expense has fluctuated over the last three years: $6 million expense in 2024, $(7) million benefit in 2023, and $3 million expense in 2022. As of December 31, 2024, our allowance for doubtful accounts for trade receivables was $14 million. If we are unable to collect receivables on a timely basis, larger provisions for bad debt may be required and may result in a negative impact on our earnings, liquidity, cash flow, and financial condition.
Our goodwill and other long-lived assets are subject to potential impairment which could negatively impact our earnings.
A significant portion of our assets consists of goodwill and other long-lived assets, the carrying value of which would be reduced if we determine that those assets are impaired. At December 31, 2024, goodwill and other intangible assets represented $935 million, or 26% of our total assets. In addition, net property, plant, and equipment, operating lease right-of-use assets, and sundry assets totaled $1,036 million, or 28% of total assets.
Goodwill Impairment
We test goodwill for impairment at the reporting unit level (the business groups that are one level below the operating segments) when triggering events occur or at least annually. We perform our annual goodwill impairment testing in the second quarter.
The 2024 annual goodwill impairment testing indicated that fair value had fallen below carrying value for three reporting units, and fair value exceeded carrying value by less than 100% for one reporting unit. We had 2024 impairments of $588 million, $44 million, and $44 million in our Bedding, Work Furniture, and Hydraulic Cylinders reporting units, respectively. The fair values of our reporting units in relation to their respective carrying values and significant assumptions used are presented in the tables in Note F to the Consolidated Financial Statements, beginning on page 96. In general, the fair values for these reporting units decreased versus prior year due to macroeconomic pressures, including low demand, particularly in residential end markets. The fair values of our reporting units were reconciled to our consolidated market capitalization, which decreased due to the significant decline in stock price during the second quarter of 2024. Our closing stock price per share was $26.17 on December 29, 2023, $19.15 on March 28, 2024, and $11.46 on June 28, 2024. We concluded that an impairment existed under generally accepted accounting principles in connection with the preparation and review of our second quarter financial statements filed on August 7, 2024 as part of the quarterly report on Form 10-Q.
While the Aerospace Products reporting unit did not incur impairment charges, fair value exceeded carrying value by 21% in our 2024 testing. Aerospace’s long-term forecasts continue to reflect demand improvements as industry recovery continues.
Long-lived Asset Impairment
Late in the fourth quarter of 2023, we had a triggering event to review long-lived assets and test for impairment when certain of our Elite Comfort Solutions (ECS) and Kayfoam customers notified us of efforts to improve their financial position by moving their business to or exploring alternative suppliers, which adversely impacted our future cash flow forecast. In early January 2024, we conducted an evaluation and determined that our sales and earnings forecasts should be reduced, and, as a result, we performed a recoverability test for these asset groups. Because the forecasted undiscounted cash flows had fallen below the carrying value for these asset groups, we tested for impairment by comparing the estimated fair value of long-lived assets to their carrying values. This resulted in a non-cash pretax charge of $444 million for long-lived asset impairments (primarily customer relationships, technology, and trademark intangibles) in the Bedding Products segment during the fourth quarter of 2023. This impairment was unrelated to the 2024 Restructuring Plan.
In evaluating the potential for impairment of goodwill and other long-lived assets, we make assumptions and estimates regarding future operating performance, business trends, and market and economic performance, including future sales, operating margins, growth rates, and discount rates. If actual results or the long-term outlook of any of our reporting units materially differ from the assumptions and estimates used in the goodwill and other long-lived assets valuation calculations, we could incur future non-cash impairment charges, which could have a material negative impact on our earnings.
If we do not comply with the restrictive covenants in our credit facility, we may not be able to borrow in the commercial paper market or under our credit facility and our outstanding debt instruments may default, all of which would adversely impact our liquidity.
Our credit facility is a multi-currency facility maturing in September 2026, providing us the ability, from time to time, to borrow, repay, and re-borrow up to $1.2 billion, subject to certain restrictive covenants and customary conditions. The credit facility serves as back-up for our commercial paper borrowing. Capitalized terms used in this section but not defined herein have the meanings set forth in the Credit Agreement.
To provide additional borrowing capacity and financial flexibility, we amended our credit agreement in March 2024 to increase the Leverage Ratio from 3.50 to 1.00 to 4.00 to 1.00. After the amendment, our credit facility contains restrictive covenants which include (a) an amended Leverage Ratio requiring us to maintain, as of the last day of each fiscal quarter, or when we borrow under the credit facility (i) Consolidated Funded Indebtedness minus the lesser of: (A) Unrestricted Cash, or (B) $750 million to (ii) Consolidated EBITDA for the four consecutive trailing quarters, such ratio not being greater than 4.00 to 1.00 as of March 31, 2024 through June 30, 2025, and not greater than 3.50 to 1.00 beginning September 30, 2025 through maturity, provided however, subject to certain limitations, if we make a Material Acquisition in any fiscal quarter after June 30, 2025, at our election, the maximum Leverage Ratio shall be 4.00 to 1.00 for the fiscal quarter during which such Material Acquisition is consummated and the next three consecutive fiscal quarters; (b) a limitation of the amount of total secured obligations to 15% of our total consolidated assets; and (c) a limitation on our ability to sell, lease, transfer, or dispose of all or substantially all of our assets and the assets of our subsidiaries, taken as a whole (other than accounts receivable sold in a Permitted Securitization Transaction, products sold in the ordinary course of business and our ability to sell, lease, transfer, or dispose of any of our assets or the assets of one of our subsidiaries to us or one of our subsidiaries, as applicable) at any given point in time.
If our earnings are reduced, the covenants in the credit facility will continue to reduce our borrowing capacity, both under the credit facility or through commercial paper issuances. Depending on the degree of earnings reduction, our liquidity could be materially negatively impacted. This covenant may also restrict our current and future operations, including (i) our flexibility to plan for, or react to, changes in our businesses and industries; and (ii) our ability to use our cash flows, or obtain additional financing, for future working capital, capital expenditures, acquisitions, or other general corporate purposes. If we are not in compliance with the restrictive covenants in our credit facility, and are not able to negotiate more lenient terms, we may not be able to access the commercial paper market or borrow under the credit facility.
Also, if we fail to comply with the covenants specified in the credit facility, we may trigger an event of default, in which case the lenders would have the right to: (i) terminate their commitment to provide loans under the credit facility; and (ii) declare all borrowings outstanding, together with accrued and unpaid interest and fees, to be immediately due and payable. Additionally, our senior notes contain cross-default provisions which could make outstanding amounts under the senior notes immediately payable in the event of an acceleration of amounts due under the credit facility following a material uncured default. If debt under the credit facility or
senior notes were to be accelerated, we may not have sufficient cash to repay this debt, which would have an immediate material adverse effect on our business, results of operations, and financial condition.
We may not be able to realize deferred tax assets on our balance sheet, depending upon the amount and source of future taxable income.
Our ability to realize deferred tax assets on our balance sheet is dependent upon the amount and source of future taxable income. As discussed in Note O of the Consolidated Financial Statements, we had $148 million of deferred tax assets (net of a $21 million valuation allowance) as of December 31, 2024. It is possible the amount and source of our taxable income could materially change in the future. This change may impact our underlying assumptions on which valuation allowances are established and negatively affect future period earnings and balance sheets. As a result, we may not be able to realize deferred tax assets on our balance sheet. There can be no assurance that we will continue to pay cash dividends on our common stock.
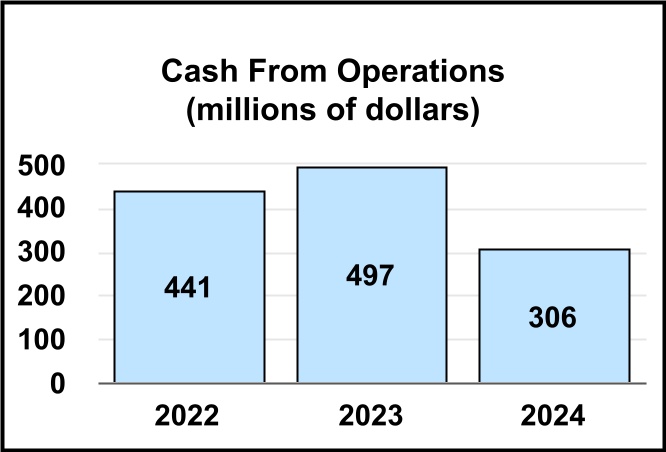
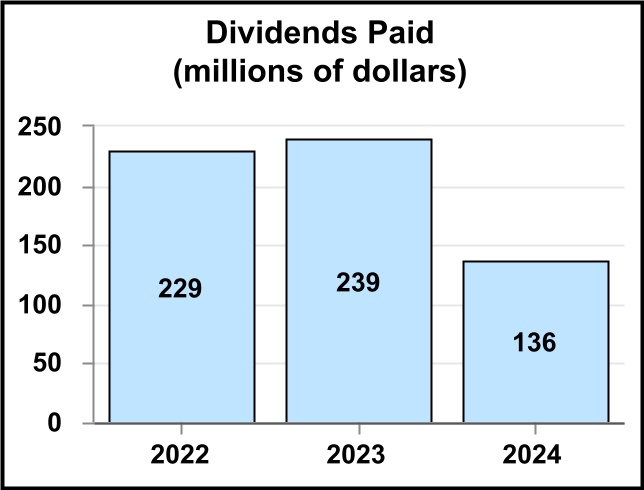
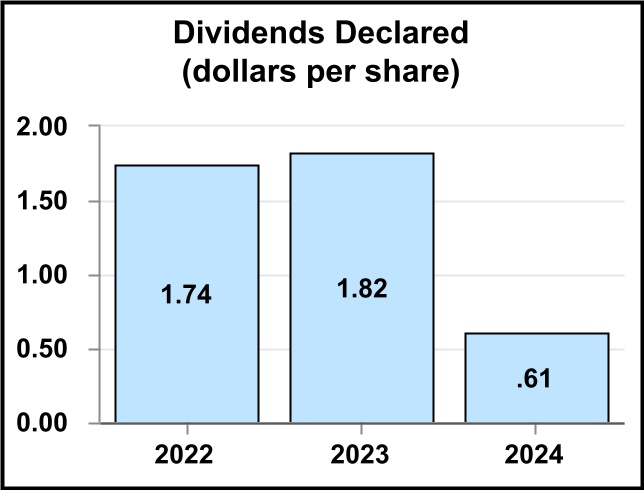
We recently reduced our quarterly cash dividend per share. Dividends on shares of common stock are declared at the discretion of the Board of Directors, which may decide to further reduce, suspend or terminate the dividend, based upon general economic conditions, our financial condition, operating results, cash flows, available cash and current and anticipated cash needs, capital requirements, strategic alternatives, compliance with contractual debt leverage ratios, and other factors.
Market Risk Factors
Costs of raw materials have negatively affected, and could continue to negatively affect, our profit margins and earnings.
Raw material cost increases, whether from inflation or otherwise (and our ability to respond to cost increases through selling price increases), can significantly impact our earnings. We typically have short-term commitments from our suppliers; accordingly, our raw material costs generally move with the market. When we experience significant increases in raw material costs, we typically implement price increases to recover the higher costs. Inability to recover cost increases (or a delay in the recovery time) can negatively impact our earnings. Conversely, if raw material costs decrease, we generally pass through reduced selling prices to our customers. The timing of lower selling prices, combined with turnover rate of the higher-cost inventory on hand prior to the cost reduction, may reduce our profit margins and earnings.
Steel is our principal raw material. The global steel markets are cyclical in nature and have been volatile in recent years. This volatility can result in large swings in pricing and margins from year to year. As a producer of steel rod, we are also impacted by volatility in metal margins (the difference between the cost of steel scrap and the market price for steel rod). If market conditions cause scrap costs and rod pricing to change at different rates (both in terms of timing and amount), metal margins could continue to be compressed, and this would negatively impact our results of operations.
We import certain chemicals to supplement domestic supply, but port delays and logistics issues could limit access to those products. We have exposure to the cost of chemicals, including TDI, MDI, and polyol. The cost of these chemicals has fluctuated at times, but we have generally passed the changes through to our customers. If we are unable to obtain the chemicals or pass the cost along to our customers, our results of operations may be negatively impacted.
Higher raw material costs could lead some of our customers to modify their product designs, causing a change in the quantity and mix of our components in their finished goods (replacing higher-cost with lower-cost components). If this were to occur, it could negatively impact our results of operations.
Mattress and innerspring imports from foreign manufacturers have affected, and could continue to adversely affect, our market share, sales, profit margins, and earnings.
We continue to face pressure from foreign competitors, as some of our customers source a portion of their components and finished products offshore. We have experienced some reduced sales and lower earnings related to lower-priced imports of mattresses and innersprings. Continued lower-priced mattress and innerspring imports could further negatively impact market share, sales, profit margins, and earnings.
Unfair competition could adversely affect our market share, sales, profit margins, and earnings.
We produce innersprings for mattresses that are sold to bedding manufacturers. We produce steel wire rod for consumption by our wire mills (primarily to produce innersprings) and to sell to third parties. We also produce and sell finished mattresses.
In response to petitions filed with the U.S. Department of Commerce (DOC) and the International Trade Commission (ITC) generally alleging that innersprings, steel wire rod, and mattresses were being unfairly sold in the United States by certain foreign manufacturers at less than fair value (dumping) and that certain foreign manufacturers of steel wire rod and mattresses were unfairly benefiting from subsidies, certain antidumping and/or countervailing duties have been imposed on the imports of such products. Some antidumping and countervailing duties orders are subject to ongoing appeal. The ITC is currently examining whether to extend a 2019 order on mattresses from China, following the DOC's determination in February 2025 that revocation of the 2019 duty order would likely lead to the continuation or recurrence of dumping of mattresses from China. If any of the antidumping and countervailing duties are overturned on appeal, or not extended beyond their current terms and dumping and/or subsidization recurs, or manufacturers in the subject countries circumvent the existing duties through transshipment in other jurisdictions or otherwise, our market share, sales, profit margins, and earnings could be adversely affected. For more information on antidumping and/or countervailing duties regarding innersprings, steel wire rod and mattresses, please refer to the Competition section on page 42 in Item 7. Management's Discussion and Analysis of Financial Conditions and Results of Operations, and Item 3. Legal Proceedings on page 30. We operate in a highly competitive automotive industry and efforts by our competitors, as well as new entrants to the industry, to gain market share could negatively impact our business, results of operations, and financial condition.
The automotive component industry is highly competitive. The evolving automotive market, including the growth of hybrid and electric vehicles, has attracted, and may continue to attract, new OEM entrants to the industry, resulting in market share losses for our existing customers. We have also experienced increased competition from Chinese-based component suppliers who are growing market share in China, particularly with Chinese-based OEMs, which may adversely affect sales and profit margins on our products.
In Europe, economic softness and consumer affordability issues have given Chinese electric vehicle (EV) manufacturers opportunities to supply lower price electric vehicles, leading to production declines and program launch delays for our customers. In North America, consumer affordability issues and uncertainty around EV transition timelines are resulting in program launch delays and our customers replacing higher cost components with lower cost components.
If we are unable to differentiate existing or create new innovative products, adapt to new technologies or evolving customer requirements, maintain a low-cost footprint, or compete effectively, we may lose market share or be forced to reduce prices, thereby lowering our margins. Any such occurrences could adversely affect our business, results of operations, and financial condition.
We are exposed to foreign currency exchange rate risk which may negatively impact our competitiveness, profit margins, and earnings.
In 2024, 40% of our sales were generated by international operations, primarily in Europe, China, Canada, and Mexico. As of December 31, 2024, 48 of our manufacturing facilities were located outside the United States. We are exposed to currency exchange rate fluctuations by our purchase of raw materials and component parts from suppliers in multiple countries. We experience currency-related gains and losses where sales or purchases are denominated in currencies other than the functional currency. We also have balance sheet, cash flow, and net investment risk associated with foreign currency exchange rates. If the applicable foreign currency exchange rates devalue the currency we receive for the sale of our products or the currency we use to purchase raw materials or component parts from our suppliers, it may have a material adverse effect on our competitiveness, profit margins, and earnings. For more information regarding currency exchange rate risk, please refer to Note S on page 120 of the Notes to Consolidated Financial Statements.
Information Technology and Cybersecurity Risk Factors
Information technology failures, cybersecurity incidents, or new technology disruptions could have a material adverse effect on our operations.
We rely on information systems to obtain, process, analyze, and manage data and critical financial activities, as well as to facilitate the manufacture and distribution of inventory to and from our facilities. We receive, process, and ship orders and manage our accounting and financial records, including invoicing and collecting from our customers and paying our vendors. We also manage our production processes with certain industrial control systems. Consequently, we are subject to cybersecurity risk. We face risks associated with network connectivity and systems for consolidated reporting. Technology failures or security breaches of our infrastructure, including our industrial control systems, could impede normal operations, create system disruptions, or create unauthorized disclosure or alteration of confidential information.
From time to time, we have experienced immaterial cybersecurity threats and incidents. When these threats and incidents occur, we have taken appropriate remediation steps and, through investigation, determined that the threats or incidents did not have a material effect on our business, results of operations, or financial results. Although we are not aware of any material cybersecurity incidents, because of past immaterial cybersecurity threats and what we have learned in responding to those threats, we have improved cybersecurity efforts, including stronger protective processes and controls.
Although we have purchased broad form cyber insurance coverage and strive to provide a balanced level of cybersecurity protections, cybersecurity risk has increased due to remote access and increased sophistication of cybersecurity adversaries, as well as the increased frequency of cybersecurity attacks, including malware. As such, information technology failures or cybersecurity breaches could still create system disruptions or unauthorized disclosure or alterations of confidential information and disruptions to the systems of our third-party suppliers and providers. We cannot be certain that the attacker’s capabilities will not compromise our technology protecting information systems or bypass our detection capabilities, including those resulting from ransomware attached to our industrial control systems. If these systems are materially interrupted or damaged by any incident or fail for any extended period of time, then our results of operations could be adversely affected. We may incur remediation costs, increased cybersecurity protection costs, ransom payments, lost revenues resulting from unauthorized use of proprietary information, litigation and legal costs, increased insurance premiums, reputational damage, damage to our competitiveness, and negative impact on our stock price and long-term shareholder value. We may also be required to devote significant management resources and expend significant additional resources to address problems created by any such interruption, damage, or failure.
The unauthorized use of artificial intelligence could expose sensitive Company information, infringe intellectual property rights, violate privacy laws, and harm our reputation.
Our business uses artificial intelligence (AI) technologies, including those offered by third parties, on a limited basis, generally to mitigate cybersecurity risks. While we prohibit the use of unauthorized AI technologies, our employees may use AI in an unauthorized manner, which could expose our sensitive data to disclosure, violate third-party intellectual property rights or privacy laws, produce inaccurate responses that could lead to errors in our business activities, and harm our reputation. Our ability to mitigate these risks will depend on our continued effective maintenance, training, monitoring, and enforcement of appropriate policies governing the use of AI technologies, and the results of any such use, by us. The legal and regulatory landscape relating to AI and its use is uncertain and rapidly evolving. These evolving laws and regulations could require changes in our implementation of AI technology and increase our compliance costs and the risk of non-compliance. If any of these risks are realized, it could adversely impact our results of operations, cash flow, financial condition, and stock price.
Trade Risk Factors
Tariffs by the U.S. government could result in materially lower margins, lost sales, and an overall adverse effect on our results of operations.
We import and export various raw materials, components, or finished goods across all segments, with our Bedding Products and Furniture, Flooring & Textile Products segments being the most impacted. Our customers also import into the United States various raw materials, components, or finished goods purchased from our Specialized Products and Furniture, Flooring & Textile Products segments. The United States has imposed broad-ranging tariffs on steel and aluminum (each of which we use in our manufacturing processes), a wide assortment of Chinese-made products, and other products on a country-specific basis. Additional tariffs could be imposed. In retaliation, many other countries have imposed, and could impose in the future, counter-tariffs on U.S.-produced items.
Recently, the Trump Administration imposed tariffs on imports from Canada, China, and Mexico, and then subsequently paused tariffs on imports from Canada and Mexico for at least thirty days. We have production facilities in the United States, Canada, China, and Mexico. In addition, new tariffs have been announced that will eliminate certain exclusions to existing steel tariffs and raise tariffs on aluminum imports. These new tariffs have spurred, and could also spur, additional retaliatory moves between the affected countries. Furthermore, the Trump Administration has initiated investigations into nonreciprocal trade arrangements with the goal of implementing a tariff equalization scheme, the threat or implementation of which could spur additional retaliatory moves by other countries.
If we are unable to pass through additional costs created by current or new tariffs, it could result in materially lower margins, lost sales, and an overall adverse effect on our results of operations. Tariffs also could negatively impact our customers' demand for our products, as our customers may face significantly increased costs from importing our products or from selling their foreign-produced products containing our foreign-produced components into the United States.
U.S. export controls against China could contribute to a global semiconductor shortage and negatively impact (i) our ability to manufacture and timely deliver our products, (ii) our OEM and Tier customers’ production schedules, and (iii) the demand for our products.
Our Automotive Group uses semiconductors in seat comfort products and, to a lesser extent, in motors and actuators. Our OEM and Tier customers also use semiconductors, or components containing semiconductors, in their manufacture of automotive components and/or vehicles. According to certain market reports, China is a significant manufacturer of semiconductors. The U.S. government has imposed export controls regarding certain advanced semiconductor chips and semiconductor manufacturing equipment which restrict U.S. companies’ ability to export these products to China without a license. The Netherlands and Japan have also moved forward with more restrictive export controls related to specific equipment used for the manufacture of semiconductors. The new controls may contribute to a global semiconductor shortage and negatively impact our ability to source an adequate supply of semiconductors used in our manufacturing processes. If so, any resulting shortage could endanger our ability to manufacture and timely deliver our products. It also could negatively impact our OEM and Tier customers’ production schedules and the demand for our products. Additionally, China may adopt retaliatory trade restrictions against U.S. companies. If this occurs, our Chinese-based operations may be negatively impacted. Any of these risks, if realized, could negatively impact our business, results of operations, and financial condition.
Regulatory Risk Factors
Privacy and data protection regulations are complex and could harm our business, reputation, financial condition, and operating results.
As a multinational company with personal data and business contact information from individuals in many countries, we are subject to numerous complex and evolving data protection laws. These include the federal and state-specific laws in the United States as well as the laws of other jurisdictions where we operate, such as those in Europe, China, India, and Brazil. If our operations are found to violate these broad-ranging data protection laws, we may incur substantial fines, face reputational harm, and be required to change our business practices, any of which could have an adverse effect on our business.
As a U.S. company, the ability to manage aspects of our operation and workforce centrally and the ability to make decisions based on complete and accurate global data are important and require the ability to transfer
and access personal data. The adequacy of the laws of the data-importing country are of increasing importance under various international laws. The validity of data transfer mechanisms remains subject to legal, regulatory, and political developments in many countries and could have an adverse impact on our ability to process and transfer personal data. This may inhibit our ability to transfer our employee personal data from our other operations, such as in Europe, China, and Brazil, to our headquarters in the United States or elsewhere, making it much more difficult to effectively manage our global human capital. These evolving privacy and data protection requirements create uncertainty and add compliance obligations that could harm our business, reputation, financial condition, and operating results.
Environmental regulatory compliance costs, additional potential related liabilities and climate change transition risks, including new treaties, laws, and regulations, could negatively impact our business, capital expenditures, compliance costs, results of operations, financial condition, competitive position, and reputation.
Increased focus by the United States and other governmental authorities on climate change and other environmental matters has led to enhanced regulation in these areas, which is expected to result in increased compliance costs and could subject us to potential liabilities. The extent of these costs and risks is difficult to predict and will depend, in large part, on the extent of final regulations and the ways in which those regulations are enforced.
As of December 31, 2024, we had 119 manufacturing facilities in 18 countries, primarily in North America, Europe, and Asia. Most of our facilities are engaged in manufacturing processes that produce GHG emissions, including carbon dioxide. We also maintain a fleet of over-the-road tractor trailers that emit GHG emissions when providing freight services to many of our U.S.-based manufacturing locations. There are certain transition risks (meaning risks related to the process of reducing our carbon footprint) that could materially affect our business, capital expenditures, results of operations, financial condition, competitive position, and reputation. One of these transition risks is the change in treaties, laws, policies, and regulations that could impose significant operational and compliance burdens. If our customers (who may be subject to climate change regulatory requirements or similarly proposed or newly-enacted laws and regulations) incur additional costs to comply with such laws and regulations, which in turn, impact their ability to operate at similar levels in certain jurisdictions, the demand for our products could be adversely affected.
In addition, overall, there continues to be a lack of consistent climate legislation in the jurisdictions in which we operate, which creates economic and regulatory uncertainty. If these laws or regulations (including the SEC's climate-related disclosure rules, if upheld) impose significant operational restrictions and compliance requirements on us, they could increase costs associated with our operations, including costs for raw materials and transportation. Non-compliance with climate change treaties or legislative and regulatory requirements could also lead to significant fines and penalties and negatively impact our reputation. To date, we have not experienced a material impact from such legislative and regulatory efforts. Further, we currently do not have an estimate of the capital expenditures or operating and administrative costs that may be required to implement our GHG reduction strategy or comply with regulatory requirements, but these items are expected to require capital investment and increase costs. The ultimate impact and associated cost of these legislative and regulatory developments and implementing our GHG reduction strategy cannot be predicted at this time.
Increased scrutiny from stakeholders regarding our sustainability responsibilities could expose us to additional costs or risks and adversely impact our liquidity, results of operations, reputation, employee retention, and stock price.
Investor advocacy groups, certain institutional investors, investment funds, lenders, market participants, shareholders, customers, and other stakeholders have increasingly focused on the sustainability practices of companies. These parties have placed increased importance on the social cost implications of their investments. If our sustainability practices do not meet these stakeholder expectations and standards, which continue to evolve, our access to capital may be negatively impacted based on an assessment of our sustainability practices. These limitations, in both the debt and equity markets, may materially negatively affect our ability to manage our liquidity, refinance existing debt, grow our businesses, and implement our strategies, as well as adversely impact our results of operations and the price of our common stock.
Our Sustainability Report details how we seek to manage our operations responsibly and ethically. It includes our sustainability policies and practices on a variety of matters, including, but not limited to, Board and management sustainability oversight, governance and ethics, environmental sustainability, greenhouse gas
emissions reduction, employee health, safety, product stewardship, quality and safety management, and supply chain social standards and compliance. The Board’s Nominating, Governance and Sustainability Committee oversees our sustainability programs and related risks. However, it is possible that stakeholders may not be satisfied with our sustainability practices or the speed of their adoption. We could also incur additional costs and require more resources to monitor, report, and comply with various sustainability practices. Furthermore, our failure, or perceived failure, to meet the standards set forth in the Sustainability Report could negatively impact our reputation, employee retention, and the willingness of our customers and suppliers to do business with us. Our Sustainability Report can be found at www.leggett.com. Our website does not constitute part of this Form 10-K.
Changes in tax laws or challenges to our tax positions pursuant to ongoing tax audits could negatively impact our earnings and cash flows.
We are subject to the tax laws and reporting rules of the United States (federal, state, and local) and several foreign jurisdictions. Current economic and political conditions make these tax rules (and governmental interpretation of these rules) subject to significant change and uncertainty. There are proposals by the Organization for Economic Cooperation and Development, the European Union, and other tax jurisdictions, some of which have already been adopted in various countries, to reform tax laws or change interpretations of existing tax rules. These proposals generally center around global base erosion and profit shifting (BEPS) concepts, and, as they are adopted, could continue to impact how our earnings and transactions are taxed as a multinational corporation. Whether, or in what form, these proposals become law in various countries around the world, or how such laws might be interpreted, could impact our assumptions related to the taxation of certain foreign earnings and have an adverse effect on our earnings and cash flows.
We are subject to audit by taxing authorities in the countries where we operate and are currently in various stages of examination in several jurisdictions. We have established liabilities we believe are appropriate, with such amounts representing what we believe is a reasonable provision for taxes that we ultimately might be required to pay. However, these liabilities could be increased over time as more information becomes known relative to the resolution of these audits, as governmental tax positions may be sustained, or we may agree to certain tax adjustments. We could incur additional tax expense if we have adjustments higher than the liabilities recorded.
We are subject to value-added taxes (VAT) in various foreign jurisdictions. Where we are entitled to a refund of the VAT we have paid, we are required to make a claim for refund from the government authorities. We establish VAT receivables for these claims, but have been experiencing refund delays in Mexico. As of December 31, 2024, we had outstanding VAT refund claims with the Mexican government of $35 million. We received $19 million of the December 31, 2024 balance in January 2025. Although we believe the amounts we claimed are fully collectible, continued government actions in Mexico, including audits of the refund amounts, could either further delay the receipt of our refunds, or cause us to settle for a lesser amount than the recorded VAT receivable. These actions could adversely impact our future cash flows and/or pretax earnings.
Litigation Risk Factors
We are exposed to litigation contingencies that, if realized, could have a material negative impact on our financial condition, results of operations, and cash flows.
Although we deny liability in all currently threatened or pending litigation proceedings, we have recorded an immaterial aggregate litigation contingency accrual at December 31, 2024. Based on current facts and circumstances, aggregate reasonably possible (but not probable) losses in excess of the recorded accruals for litigation contingencies are estimated to be $13 million. If our assumptions or analyses regarding any of our contingencies are incorrect, if facts and circumstances change, or if future litigation arises, we could realize losses in excess of the recorded accruals (and in excess of the $13 million referenced above), which could have a material negative impact on our financial condition, results of operations, and cash flows. For more information regarding our legal contingencies, please see Note T on page 121 of the Notes to Consolidated Financial Statements.
Item 1B. Unresolved Staff Comments.
None.
Item 1C. Cybersecurity.
We rely on information systems to obtain, process, analyze, and manage data, as well as to facilitate the manufacture and distribution of inventory to and from our facilities. We receive, process, and ship orders, manage the billing of and collections from our customers, and manage the accounting for and payment to our vendors. We also manage our production processes with certain industrial control systems. Consequently, we are subject to cybersecurity risk.
From time to time, we have experienced immaterial cybersecurity threats and incidents. When these threats and incidents have occurred, we have taken appropriate remediation steps and, through investigation, determined that the threats or incidents did not have a material effect on our business, results of operations, or financial results.
Cybersecurity Risk Management and Strategy
We have processes in place for assessing, identifying, and managing material risks from cybersecurity threats and incidents, which is based on industry-recognized frameworks and takes a multifaceted approach to protecting our network, systems, and data, including personal information. To prevent cybersecurity incidents, we deploy a wide range of protective security technologies and tools, including, but not limited to, encryption, firewalls, endpoint detection and response, security information and event management, multi-factor authentication, and threat intelligence feeds. To maintain the effectiveness of this framework, we conduct periodic real-world simulation exercises to test, educate, promote awareness, and identify any refinements needed.
Cybersecurity threats are identified, assessed, and monitored by our Security Operations Center, which is staffed with cybersecurity professionals who report to the Company's Chief Information Security Officer (CISO), and includes resources provided by external vendors to cover continuous monitoring. When a cybersecurity threat or incident meets certain categorized thresholds, as determined by our Cybersecurity Incident Response Plan, we follow an escalation review process which can result in our CISO forwarding the threat or incident to our cybersecurity crisis response team consisting of our CEO, CFO, CHRO, CIO, and General Counsel (the "Crisis Response Team"). Our CISO and the Crisis Response Team, pursuant to guidance from our CISO, assess and manage our response to cybersecurity threats and incidents. Our CISO follows a risk-based escalation process to notify our General Counsel of certain cybersecurity threats and incidents, and our General Counsel analyzes our obligation to report any incident publicly. If the General Counsel determines disclosure is warranted, she reports this conclusion to the CISO, the Crisis Response Team, and the Company's Public Disclosure Committee for consideration and disclosure.
We have integrated cybersecurity risk into our overall enterprise risk management (ERM) process. Pursuant to the ERM process, cybersecurity risk is evaluated for likelihood, significance, and velocity on a semiannual basis by designated risk owners. The risk owners consist of a cross-functional group of leaders, led by our CISO. Based on the ERM analysis, we adjust, if necessary, our process for the identification, assessment, and monitoring of cybersecurity threats and incidents.
We engage third parties in connection with our cybersecurity identification, assessment, and response processes, including to periodically benchmark our cybersecurity program against the National Institute of Standards and Technology’s Cybersecurity Framework. We also maintain active retainers with certain third parties that can be engaged in the event of a cybersecurity threat or incident. We have established a process to oversee and identify risks and cybersecurity threats associated with our third-party service providers, which includes the use of monitoring technology. We also survey certain third-party providers regarding their security controls.
Although we have not experienced any material cybersecurity incidents, because of past immaterial cybersecurity threats and incidents, and what we have learned in responding to those threats, we have increased our cybersecurity program enhancement efforts, including stronger protective controls. As of the date of this report, we are not aware of any risks from cybersecurity threats, including as a result of any previous cybersecurity incidents, that have materially affected us, including our business strategy, results of operations, or financial condition. However, for a discussion of risks from cybersecurity threats that could materially affect
Cybersecurity Governance
Our Board has oversight of all cybersecurity threats and incidents. On a quarterly basis, and more often if warranted, the Company's CIO, or the CFO in coordination with the CIO, each after consultation with the CISO, reports to the full Board any potentially material cybersecurity threat or incident and our activities monitoring the prevention, detection, mitigation, and remediation of cybersecurity threats and incidents.
Our CISO and the Crisis Response Team, pursuant to guidance from our CISO, assess, identify, and manage material risks from cybersecurity threats and incidents, as described above under "Cybersecurity Risk Management and Strategy." The CISO has served in this role since October 2024, and has over 20 years of professional experience in identifying, evaluating, and responding to cybersecurity threats and incidents. Our CISO holds a Bachelor of Science degree from DeVry University, Addison, Illinois, a Masters in Business Administration from Western Governors University, is a Certified Information Systems Security Professional (CISSP), a GIAC Certified Incident Handler (GCIH), and holds a GIAC Certification in Strategic Planning, Policy and Leadership. Members of the Crisis Response Team have extensive work experience in systems and programming, auditing, compliance and privacy laws, financial controls and procedures, and operations management. With the assistance of the CISO, along with our internal cybersecurity and information technology professionals and our third-party cybersecurity consultants and advisors, the Crisis Response Team is charged with the responsibility of preventing, detecting, mitigating, and remediating cybersecurity threats and incidents.
Although we have purchased broad form cyber insurance coverage and strive to provide a balanced level of cybersecurity protections, cybersecurity risk has increased due to remote access and increased sophistication of cybersecurity adversaries, as well as the increased frequency of cybersecurity attacks, including malware. As such, information technology failures or cybersecurity breaches could still create system disruptions or unauthorized disclosure or alterations of confidential information and disruptions to the systems of our third-party suppliers and providers. We cannot be certain that the attacker’s capabilities will not compromise our technology protecting information systems or bypass our detection capabilities, including those resulting from ransomware attached to our industrial control systems. If these systems are materially interrupted or damaged by any incident or fail for any extended period of time, then our results of operations could be adversely affected. We may incur remediation costs, increased cybersecurity protection costs, ransom payments, lost revenues resulting from unauthorized use of proprietary information, litigation and legal costs, increased insurance premiums, reputational damage, damage to our competitiveness, and negative impact on our stock price and long-term shareholder value. We may also be required to devote significant management resources and expend significant additional resources to address problems created by any such interruption, damage, or failure.
Item 2. Properties.
Our corporate office is located in Carthage, Missouri. As of December 31, 2024, we had 119 manufacturing locations in 18 countries, of which 71 were located across the United States and 48 were located in foreign countries. We also had various sales, warehouse, and administrative facilities. However, our manufacturing plants are our most important properties.
Manufacturing Locations by Segment
| | | | | | | | | | | | | | | | | | | | | | | | | | |
| | Company- Wide | | Subtotals by Segment |
| Manufacturing Locations | | Bedding Products | | Specialized Products | | Furniture, Flooring & Textile Products |
| United States | | 71 | | 23 | | 6 | | 42 |
| Europe | | 19 | | 7 | | 10 | | 2 |
| China | | 13 | | 1 | | 10 | | 2 |
| Canada | | 8 | | — | | 3 | | 5 |
| Mexico | | 4 | | 1 | | 2 | | 1 |
| Other | | 4 | | 1 | | 3 | | — |
| Total | | 119 | | 33 | | 34 | | 52 |
For more information regarding the geographic location of our manufacturing facilities refer to Geographic Areas of Operation under Item 1. Business on page 8. Manufacturing Locations Owned or Leased by Segment
| | | | | | | | | | | | | | | | | | | | | | | | | | |
| | Company- Wide | | Subtotals by Segment |
| Manufacturing Locations | | Bedding Products | | Specialized Products | | Furniture, Flooring & Textile Products |
| Owned | | 61 | | 25 | | 14 | | 22 |
| Leased | | 58 | | 8 | | 20 | | 30 |
| Total | | 119 | | 33 | | 34 | | 52 |
We lease many of our manufacturing, warehouse, and other facilities on terms that vary by lease (including purchase options, renewals, and maintenance costs). For additional information regarding lease obligations, see Note K on page 103 of the Notes to Consolidated Financial Statements. We do not have any manufacturing facilities that are subject to liens or encumbrances that are material to the segment in which they are reported or to the Company as a whole. No individual physical property is material to our overall manufacturing processes, except for our steel rod mill in Sterling, Illinois, and our wire mills in Carthage, Missouri, and Kouts, Indiana. These facilities are reported in our Bedding Products segment. The rod mill consists of approximately 1 million square feet of owned production space. It has annual output capacity of approximately 500,000 tons of steel rod, of which approximately half is used by our own wire mills. Our wire mills convert the steel rod into drawn steel wire. This wire is used in the production of many of our products, including mattress innersprings. A disruption to the operation of, or supply of steel scrap to, our steel rod mill could require us to purchase steel rod from alternative supply sources, subject to market availability. A disruption to the operation of, or supply of steel rod to, our wire mills could require us to purchase drawn wire from alternative supply sources, subject to market availability. Trade actions by the U.S. government, along with the existence of antidumping and countervailing duty orders against multiple countries, could result in reduced market availability and/or an increase in the cost of steel rod and/or drawn wire. If we experience a disruption in our ability to produce steel rod in our mill, for whatever reason, coupled with a reduction of adequate and/or timely supply from alternative market sources of quality
steel rod, or if we experience a disruption in our ability to produce drawn wire in our wire mills, for whatever reason, coupled with a reduction of adequate and/or timely supply from alternative market sources of quality drawn wire, we could experience a material negative impact on our Bedding Products segment’s and the Company’s results of operations.
We believe that our owned and leased facilities are suitable and adequate for the manufacture, assembly, and distribution of our products. Our properties are strategically located to allow timely and efficient delivery of products and services to our diverse customer base. In 2024, most of our manufacturing facilities operated at less than full capacity utilization rates. As such, we have excess production capacity in most of our businesses.
In the first quarter of 2024, we committed to the 2024 Restructuring Plan, pursuant to which we have consolidated 14 manufacturing and distribution facilities in the Bedding Products segment, and two production facilities in the Furniture, Flooring & Textile Products segment, primarily in the United States. The production in the affected facilities has been consolidated into other facilities, or in a few cases, eliminated. Optimizing our manufacturing and distribution footprint should reduce complexity, improve overall efficiency, and align capacity with anticipated future market demand. For more information about the 2024 Restructuring Plan, please see the discussion under 2024 Restructuring Plan in Operational Risk Factors beginning on page 15 in Item 1A. Risk Factors, and on page 39 in Item 7. Management's Discussion and Analysis of Financial Condition and Results of Operations. Item 3. Legal Proceedings.
Reference is made to the information in Note T on page 121 of the Notes to Consolidated Financial Statements, which is incorporated into this section by reference. Mattress Antidumping Matters
Petition Regarding China, Cambodia, Indonesia, Malaysia, Serbia, Thailand, Turkey, and Vietnam. On March 31, 2020, the Company, along with six other domestic mattress producers, Brooklyn Bedding LLC, Corsicana Mattress Company, Elite Comfort Solutions (a Leggett subsidiary), FXI, Inc., Innocor, Inc., and Kolcraft Enterprises, Inc., and two labor unions, the International Brotherhood of Teamsters and the United Steel, Paper and Forestry, Rubber, Manufacturing, Energy, Allied Industrial and Service Workers International Union, AFL-CIO (collectively, 2020 Petitioners), filed petitions with the U.S. Department of Commerce (DOC) and the U.S. International Trade Commission (ITC) alleging that manufacturers of mattresses in Cambodia, Indonesia, Malaysia, Serbia, Thailand, Turkey, and Vietnam were unfairly selling their products in the United States at less than fair value and manufacturers of mattresses in China were unfairly benefiting from subsidies, causing harm to the U.S. industry and seeking the imposition of duties on mattresses imported from these countries.
These petitions resulted in antidumping and countervailing duty orders imposing duties ranging from 2.22% to 763.28% on mattresses imported from China, Cambodia, Indonesia, Malaysia, Serbia, Thailand, Turkey, and Vietnam for five years, through May 2026. The ITC is currently examining whether to extend a 2019 order on mattresses from China, following the DOC's February 2025 determination that revocation of the 2019 duty order would likely lead to the continuation of reoccurrence of dumping of mattresses from China.
Following certain appeals that were filed with the U.S. Court of International Trade (CIT), some of which remain ongoing, the CIT ruled in favor of the ITC and 2020 Petitioners and sustained the ITC’s unanimous injury decision. On February 15, 2024, one respondent filed an appeal of the CIT's decision to the U.S. Court of Appeals for the Federal Circuit but agreed to dismiss the appeal on October 29, 2024. As a result, this particular appeal to the U.S. Court of Appeals for the Federal Circuit has been finally resolved.
Petition Regarding Indonesia, Bosnia and Herzegovina, Bulgaria, Burma, India, Italy, Kosovo, Mexico, the Philippines, Poland, Slovenia, Spain, and Taiwan. On July 28, 2023, the Company, along with nine other domestic mattress producers, Brooklyn Bedding LLC, Carpenter Company, Corsicana Mattress Company, Future Foam, Inc., FXI, Inc., Kolcraft Enterprises Inc., Serta Simmons Bedding, LLC, Southerland Inc., and Tempur Sealy International, and two labor unions, the International Brotherhood of Teamsters and the United Steel, Paper and Forestry, Rubber, Manufacturing, Energy, Allied Industrial and Service Workers International Union, AFL-CIO, filed petitions with the DOC and the ITC alleging that manufacturers of mattresses in Bosnia and Herzegovina, Bulgaria, Burma, India, Italy, Kosovo, Mexico, the Philippines, Poland, Slovenia, Spain, and Taiwan were unfairly selling their products in the United States at less than fair value
(dumping) and manufacturers of mattresses in Indonesia were unfairly benefiting from subsidies, causing harm to the U.S. industry and seeking the imposition of duties on mattresses imported from these countries.
The ITC made a preliminary determination of injury on September 11, 2023. On December 26, 2023, the DOC made a negative preliminary determination regarding Indonesian subsidies, but, on February 26, 2024, imposed duties on finished mattresses. With respect to Bosnia and Herzegovina, Bulgaria, Burma, Italy, Philippines, Poland, Slovenia, and Taiwan, the DOC’s final determinations were issued on May 9, 2024, and imposed duties ranging from 106.27% to 744.81% on finished mattresses. The ITC’s final determination with respect to those countries was issued on June 11, 2024. In June 2029, the DOC and ITC will conduct a sunset review to determine whether to extend the orders for an additional five years.
With respect to Indonesia, India, Kosovo, Mexico, and Spain, the DOC’s final determinations were issued July 16, 2024, and (excluding Indonesia) imposed duties ranging from 4.61% to 344.70%. Regarding Indonesia, the DOC found that the subsidies were below the de minimis threshold. The order evidencing the ITC’s final determination as to India, Kosovo, Mexico, and Spain was issued in September 2024. This case has been finally resolved with respect to the duties and injury findings, but an importer filed an appeal with respect to the ITC's critical circumstances determination imposing retroactive duties, which is still pending. In October 2029, the DOC and ITC will conduct a sunset review to determine whether to extend the orders for an additional five years.
Environmental Matters
Item 103 of the SEC's Regulation S-K requires disclosure of certain environmental matters when a governmental authority is a party to the proceedings and the proceedings involve potential monetary sanctions unless we reasonably believe the monetary sanctions, exclusive of interest and costs, will not equal or exceed a threshold which we determine is reasonably designed to result in disclosure of any such proceeding that is material to our business or financial condition. Item 103 states that the disclosure threshold is $300,000, or at our election, a threshold that does not exceed the lesser of $1 million or one percent of our consolidated current assets. In the past, we have used the $300,000 threshold for this purpose. However, we have determined such disclosure threshold to be $1 million. We have no environmental matters to disclose for this period under either threshold.
Item 4. Mine Safety Disclosures.
Not applicable.
Supplemental Item. Information About Our Executive Officers.
The following information is included in accordance with the provisions of Part III, Item 10 of Form 10-K, Item 401(b) of Regulation S-K, and the Instruction to Item 401 of Regulation S-K.
The table below sets forth the names, ages, and positions of persons appointed as executive officers of the Company. Executive officers are normally appointed annually by the Board of Directors.
| | | | | | | | | | | | | | |
| Name | | Age | | Position |
| Karl G. Glassman | | 66 | | President and Chief Executive Officer |
| Benjamin M. Burns | | 47 | | Executive Vice President and Chief Financial Officer |
| Jennifer J. Davis | | 49 | | Executive Vice President and General Counsel |
| J. Tyson Hagale | | 47 | | Executive Vice President, President—Bedding Products |
| Ryan M. Kleiboeker | | 46 | | Executive Vice President—Chief Strategic Planning Officer |
| Lindsey N. Odaffer | | 42 | | Executive Vice President—Chief Human Resources Officer |
| R. Samuel Smith, Jr. | | 57 | | Executive Vice President, President—Specialized Products and Furniture, Flooring & Textile Products |
| Tammy M. Trent | | 58 | | Senior Vice President—Chief Accounting Officer |
Subject to certain severance benefit agreements, the executive officers generally serve at the pleasure of the Board of Directors. The severance benefit agreements with Ms. Davis and Messrs. Glassman, Burns,
Hagale and Smith are listed as exhibits to this report. Please see Exhibit Index on page 123 for reference to the agreements. Karl G. Glassman has served as the Company's President and Chief Executive Officer since May 2024, and served as segment manager of Specialized Products on a temporary basis until February 2025. He previously served as the Company's Executive Chairman of the Board from 2022 until his retirement in May 2023 and was first appointed Chairman of the Board in 2020. Mr. Glassman also served as the Company's Chief Executive Officer from 2016 to 2021, President from 2013 to 2019, Chief Operating Officer from 2006 to 2015, Executive Vice President from 2002 to 2013, President of the former Residential Furnishings segment from 1999 to 2006, Senior Vice President from 1999 to 2002, and in various capacities since 1982.
Benjamin M. Burns was appointed Executive Vice President and Chief Financial Officer in 2023. He previously served the Company as Executive Vice President—Business Support Services during 2023 until his appointment as CFO, Senior Vice President—Business Support Services in 2022, Vice President, Business Support Services from 2019 to 2022, Vice President, Treasurer from 2017 to 2019 and Vice President, Internal Audit/Due Diligence from 2012 to 2017. Mr. Burns served the Company in various other auditing capacities since 2003.
Jennifer J. Davis was appointed Executive Vice President and General Counsel in January 2024. She previously served as Vice President – Deputy General Counsel from 2020 to 2023, as Deputy General Counsel from 2015 to 2020, and as Associate General Counsel & Chief Litigation Counsel from 2012 to 2022 after joining the Company’s Legal Department in 2006.
J. Tyson Hagale was appointed Executive Vice President, President—Bedding Products in 2023. He previously served the Company as Senior Vice President, President—Bedding Products since 2021, Commercial Vice President for Domestic Bedding since 2020, President of the Home Furniture Group in 2020, President of the Furniture Hardware Division from 2018 to 2020, Director of Market Plan Development from 2015 to 2018, and Business Development Director from 2011 to 2015. He joined Leggett in 2001 as a member of the Corporate Development Department, and served in a variety of financial and strategic roles during his first ten years with the Company.
Ryan M. Kleiboeker was appointed Executive Vice President—Chief Strategic Planning Officer in February 2024. He previously served the Company as Senior Vice President—Chief Strategic Planning Officer since 2023 and Vice President—Corporate Development and Financial Planning since 2020. He held roles within the Company’s operations from 2016 to 2020, including Director of Finance and Business Development for the Specialized and Furniture, Flooring & Textile Products segments, and served as Director of Corporate Development in 2015 and in various other roles since 2005.
Lindsey N. Odaffer was appointed Executive Vice President—Chief Human Resources Officer, effective January 1, 2025. She previously served the Company as Vice President, Financial Support Services in 2024, as Vice President, Internal Audit/Due Diligence since 2017, and in various other internal audit roles of increasing responsibility since 2005.
R. Samuel Smith, Jr. was appointed as Executive Vice President, President—Specialized Products and Furniture, Flooring & Textile Products in February 2025. He previously served as Executive Vice President, President—Furniture, Flooring & Textile Products since August 2024, and Senior Vice President, President—Furniture, Flooring & Textile Products since April 2024. Mr. Smith previously served the Company as President—Home Furniture Group from 2020 to 2024, VP Operations—Home Furniture Group from 2019 to 2020, and VP Operations—Seating & Distribution from 2018 to 2019 after joining the Company in 2014 as the general manager of Matrex, a Home Furniture operation. Prior to Leggett, Mr. Smith served as Chief Operating Officer for a medical billing company, and he spent sixteen years at Unifi, Inc., a multinational textile fiber processor in various engineering, sales, and general management roles.
Tammy M. Trent was appointed Senior Vice President in 2017 and has served as Chief Accounting Officer since 2015. She previously served as Vice President from 2015 to 2017, and Staff Vice President, Financial Reporting from 2007 to 2015. She has served the Company in various financial capacities since 1998.
PART II
Item 5. Market for Registrant’s Common Equity, Related Stockholder Matters and Issuer Purchases of Equity Securities.
Market Information
Our common stock is traded on the New York Stock Exchange (symbol LEG).
Shareholders and Dividends
As of February 20, 2025, we had 5,748 shareholders of record.
In 2024, we decreased the annual dividend by $1.21 from $1.82 to $.61 per share.
On February 26, 2025, our Board declared a quarterly cash dividend of $.05 per share payable on April 15, 2025 to shareholders of record on March 14, 2025. We have no contractual restrictions that materially limit our ability to pay such dividends. Our Board may change our dividend policy at any time and could do so, for example, if it was to determine that (i) strategic alternative uses of cash are in the best interest of the Company and its shareholders, or (ii) we have insufficient cash to fund dividends, capital expenditures, or working capital needs, to reduce leverage, or to ensure compliance with our leverage ratio under our credit agreement. However, our current expectation is to continue paying dividends at a comparable quarterly rate or higher.
For more information on dividends, see Dividends in Item 7. Management’s Discussion and Analysis of Financial Condition and Results of Operations on page 53. Issuer Purchases of Equity Securities
As seen by the below table, neither us nor any affiliated purchaser purchased any shares of our common stock during any calendar month in the fourth quarter of 2024.
| | | | | | | | | | | | | | | | | | | | | | | | | | |
| Period | | Total Number of Shares Purchased 1 | | Average
Price
Paid per
Share | | Total Number of Shares Purchased as Part of Publicly Announced Plans or Programs 2 | | Maximum Number of Shares that May Yet Be Purchased Under the Plans or Programs 2 |
| October 2024 | | — | | | $ | — | | | — | | | 10,000,000 | |
| November 2024 | | — | | | $ | — | | | — | | | 10,000,000 | |
| December 2024 | | — | | | $ | — | | | — | | | 10,000,000 | |
| Total | | — | | | $ | — | | | — | | | |
1 This column does not include shares withheld for taxes on stock unit conversions, as well as forfeitures of stock units, all of which totaled 42,500 shares in the fourth quarter of 2024. The average price per share for these shares was $10.61.
2 On August 7, 2024, the Board authorized the Company to repurchase up to 10 million shares each calendar year. This standing authorization was first announced on Form 10-Q for the quarter ended June 30, 2024, filed August 7, 2024, and will remain in force until repealed by the Board of Directors. This standing Board authorization replaced the prior Board authorization adopted in 2022, which provided the same repurchase authority to the Company with only minor administrative differences. We substantively have had the same share repurchase authority since 2004, and this authority includes the 2025 calendar year. No specific repurchase schedule has been established. The authority does not obligate the Company to purchase a minimum number of shares.
Stock Performance Graph
The following graph and table below show the cumulative total shareholder return for five years for the Company’s common stock (LEG), the S&P Midcap 400® index, the S&P SmallCap 600® index, our Old Peer Group index, and our New Peer Group index. The comparison assumes that $100 was invested on December 31, 2019 in shares of LEG and in each of the indices, and assumes that all of the dividends were reinvested. The Company exited the S&P Midcap 400® index and joined the S&P SmallCap 600® index in June 2024, at which time we began measuring the Company's relative performance against the S&P SmallCap 600® index. The Company compared itself against the S&P Midcap 400® index in previous years and this index has been included in the graph and chart below for comparative purposes only.
The Company has selected a New Peer Group of manufacturing companies to be more closely aligned with the Company’s current end market exposure, macroeconomic sensitivity, and capital discipline. Our New Peer Group includes: AMETEK, Inc. (AME), Core & Main, Inc. (CNM), Fortune Brands Innovations, Inc. (FBIN), Gentherm Incorporated (THRM), La-Z-Boy Incorporated (LZB), Lear Corporation (LEA), Masco Corporation (MAS), MillerKnoll, Inc. (MLKN), Mohawk Industries, Inc. (MHK), and Somnigroup International Inc. (SGI) (formerly known as Tempur Sealy International, Inc. (TPX)). Our Old Peer Group was based on diversification, strategy, growth objectives, acquisitiveness, customer breadth, and geographic extent, which created some misalignment given the Company's current strategic and operational goals. The Old Peer Group included: Carlisle Companies Incorporated (CSL), Danaher Corporation (DHR), Dover Corporation (DOV), Eaton Corporation plc (ETN), Emerson Electric Co. (EMR), Illinois Tool Works Inc. (ITW), Ingersoll Rand Inc. (IR), Masco Corporation (MAS), Pentair plc (PNR), and PPG Industries, Inc. (PPG).
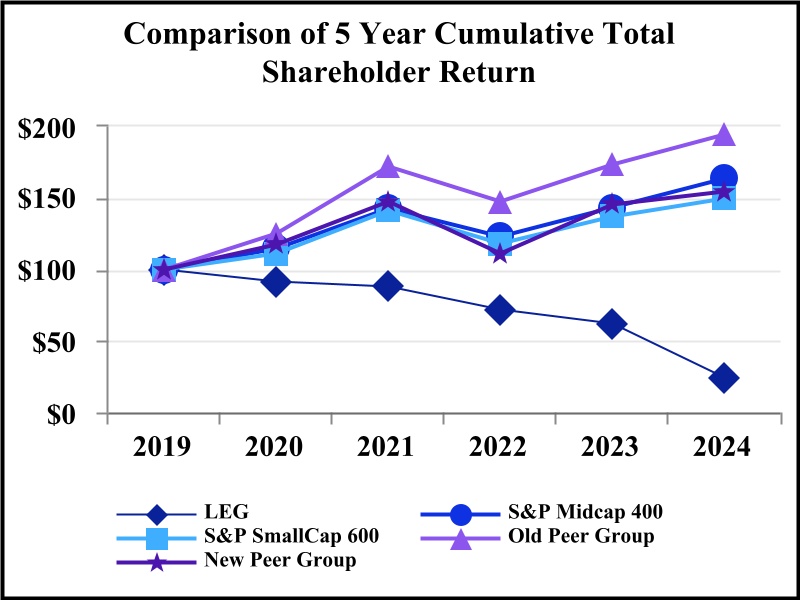
| | | | | | | | | | | | | | | | | | | | | | | | | | | | | | | | | | | |
| For the Years Ended |
| 2019 | | 2020 | | 2021 | | 2022 | | 2023 | | 2024 |
| LEG | $ | 100 | | | $ | 91 | | | $ | 88 | | | $ | 72 | | | $ | 62 | | | $ | 24 | |
| S&P Midcap 400 | 100 | | | 114 | | | 142 | | | 123 | | | 143 | | | 163 | |
| S&P SmallCap 600 | 100 | | | 111 | | | 141 | | | 118 | | | 137 | | | 149 | |
| Old Peer Group | 100 | | | 125 | | | 172 | | | 147 | | | 173 | | | 194 | |
| New Peer Group | 100 | | | 117 | | | 147 | | | 111 | | | 145 | | | 154 | |
This Stock Performance Graph section does not constitute soliciting material, is not deemed filed with the Securities and Exchange Commission, is not subject to Regulation 14A or 14C of the Securities Exchange Act, as amended (the “Exchange Act”), and is not subject to the liabilities of Section 18 of the Exchange Act. Also, it is not incorporated by reference in any of our filings under the Securities Act of 1933 or the Exchange Act, whether made before or after the date of this Form 10-K and irrespective of any general incorporation language
in any such filing, except to the extent we specifically incorporate this Stock Performance Graph section by reference therein.
Item 6. Reserved.
Item 7. Management’s Discussion and Analysis of Financial Condition and Results of Operations.
HIGHLIGHTS
| | | | | | | | | | | | | | | | | | | | | |
| 2024 | | 2023 | | 2022 | | | | |
| (Dollar amounts in millions, except for per share data) | | | | | | | | | |
| Net trade sales | $ | 4,384 | | | $ | 4,725 | | | $ | 5,147 | | | | | |
| Earnings (loss) before interest and taxes (EBIT) | (430) | | | (90) | | | 485 | | | | | |
| | | | | | | | | |
| Cash from operations | 306 | | | 497 | | | 441 | | | | | |
| | | | | | | | | |
| Total debt | 1,864 | | | 1,988 | | | 2,084 | | | | | |
| Dividends per share | $ | .61 | | | $ | 1.82 | | | $ | 1.74 | | | | | |
Trade sales decreased 7% in 2024. Organic sales decreased 7% with volume declines of 4% and raw material-related price decreases of 3%. 2023 trade sales decreased 8%. Organic sales decreased 10%, with volume declines of 6% and combined raw material-related price decreases and currency impact of 4%. Acquisitions, net of divestitures, contributed 2% to sales growth.
Earnings in 2024 decreased primarily from $676 million non-cash goodwill impairment charges, $50 million of restructuring and impairment charges, lower volume and unfavorable sales mix, raw material-related pricing adjustments (primarily in our Bedding Products segment), metal margin compression in our Steel Rod business, and other expected higher expense items such as bad debt, medical, and less benefit from a reduction to a contingent purchase price liability associated with a prior year acquisition. These decreases were partially offset by the non-recurrence of a $444 million non-cash impairment of long-lived assets (primarily customer relationships, technology, and trademark intangibles), lower amortization as a result of the 2023 long-lived asset impairment, operational efficiency improvements, gains on the sale of real estate, and restructuring benefit. Earnings in 2023 decreased primarily from a $444 million non-cash impairment of long-lived assets, metal margin compression in our Steel Rod business, and lower trade sales volume in residential end markets partially offset by higher trade sales volume in industrial end markets.
In 2024, we generated $306 million in cash from operations compared to $497 million in 2023. The decrease was primarily driven by lower earnings and less benefit from working capital. Cash flow in 2023 increased primarily from working capital improvements partially offset by lower earnings.
We ended 2024 with $443 million of availability under the $1.2 billion credit facility. In November 2024, we used our commercial paper program to repay $300 million of 3.8%, 10-year bonds that matured. In 2024, we paid down $126 million of debt.
We decreased the annual dividend in 2024 to $.61 per share from $1.82 per share in 2023. The decision to reduce the dividend was made following a thorough evaluation by the Board and our management team. This action along with minimal acquisitions and share repurchases frees up capital to accelerate the deleveraging of our balance sheet and solidify our long-held financial strength. We had no acquisitions in 2024 and 2023. In 2024, we used $5 million to repurchase approximately .3 million shares of our stock at an average price of $19.17.
In the first quarter of 2024, we committed to a restructuring plan (the “2024 Restructuring Plan” or “2024 Plan”). The 2024 Plan is primarily associated with our Bedding Products segment and, to a lesser extent, our Furniture, Flooring & Textile Products segment. The 2024 Plan was expanded in the second quarter of 2024 to include a restructuring opportunity within the Specialized Products segment and in the third quarter of 2024 to include the general and administrative cost structure initiatives. We continue to make solid progress implementing the 2024 Plan. Portfolio management remains a strategic priority. We are focused on simplifying our portfolio to businesses that are the right long-term fit.
These topics are discussed in more detail in the sections that follow. INTRODUCTION
Customers
We serve a broad suite of customers, with our largest customer representing less than 8% of our sales in 2024. Many are companies whose names are widely recognized. They include bedding brands and manufacturers, residential and office furniture producers, automotive OEM and Tier 1 manufacturers, and a variety of other companies.
Organic Sales
We calculate organic sales as trade sales excluding sales attributable to acquisitions and divestitures consummated within the last twelve months. Management uses the metric, and it is useful to investors, as supplemental information to analyze our underlying sales performance from period to period in our legacy businesses.
Major Factors That Impact Our Business
Goodwill and Long-Lived Asset Impairments
A significant portion of our assets consists of goodwill and other long-lived assets, the carrying value of which may be reduced if we determine that those assets are impaired. At December 31, 2024, goodwill and other intangible assets represented $935 million, or 26% of our total assets. In addition, net property, plant and equipment, operating lease right-of-use assets, and sundry assets totaled $1,036 million, or 28% of total assets.
GOODWILL IMPAIRMENT
We test goodwill for impairment at the reporting unit level (the business groups that are one level below the operating segments) when triggering events occur or at least annually. We perform our annual goodwill impairment testing in the second quarter. The 2023 goodwill impairment testing indicated no impairments.
The 2024 annual goodwill impairment testing indicated that fair value had fallen below carrying value for three reporting units, and fair value exceeded carrying value by less than 100% for one reporting unit.
The following table represents 2024 total goodwill impairments. This includes non-cash pretax charges of $675 million related to our second quarter annual goodwill impairment testing and $1 million related to a small operation in the Bedding Products segment that reached held-for-sale status in the fourth quarter of 2024 and was associated with the 2024 Plan.
| | | | | | | | | | | | | | |
| | | | Year Ended |
| Reporting Unit | | Segment | | December 31, 2024 |
| Bedding | | Bedding Products | | $ | 588 | |
| Work Furniture | | Furniture, Flooring & Textile Products | | 44 | |
| Hydraulic Cylinders | | Specialized Products | | 44 | |
| | | | $ | 676 | |
The fair values of our reporting units in relation to their respective carrying values and significant assumptions used are presented in the tables in Note F to the Consolidated Financial Statements, beginning on page 96. In general, the fair values for these reporting units decreased versus prior year due to macroeconomic pressures, including low demand, particularly in residential end markets. The fair values of our reporting units were reconciled to our consolidated market capitalization, which decreased due to the significant decline in stock price during the second quarter of 2024. Our closing stock price per share was $26.17 on December 29, 2023, $19.15 on March 28, 2024, and $11.46 on June 28, 2024. We concluded that an impairment existed under generally accepted accounting principles in connection with the preparation and review of our second quarter financial statements filed on August 7, 2024 as part of the quarterly report on Form 10-Q. If actual results differ materially from estimates used in our calculations, we could incur future impairment charges. Units with Impairments
In addition to the decline in our stock price during the second quarter, the reporting units discussed below also had the following factors contributing to the impairments:
Bedding
Domestic bedding manufacturers are facing numerous challenges, including low demand, overcapacity, and increased pressure from finished mattress imports, resulting in financial stress across the industry. The domestic mattress market has changed dramatically in a relatively short time span. The landscape has shifted from a largely domestic OEM-produced innerspring mattress market to one where innerspring, foam, and hybrid mattresses are sold at a wide range of price points through a variety of channels and produced by a mix of domestic OEMs, domestic private label producers, and import manufacturers. These changing market dynamics and weak demand have created disruption and financial instability with some of our customers.
The Bedding reporting unit's fair value exceeded carrying value by 40% at our second quarter 2023 testing date and had decreased to 19% after a triggering event occurred to test for goodwill impairment for this reporting unit late in the fourth quarter of 2023, as discussed in the "Long-lived asset impairment" section below.
Work Furniture
Work Furniture demand for both contract and residential end-use products has remained at sustained low levels. Fair value exceeded carrying value by 74% at our second quarter 2023 testing date.
Hydraulic Cylinders
The Hydraulic Cylinders reporting unit's fair value at our second quarter 2023 testing date exceeded carrying value by 18%. Fair value approximated carrying value primarily due to an August 2022 acquisition that is experiencing operational inefficiencies.
Units with No Impairments, but Fair Value Exceeded Carrying Value by Less than 100%
Aerospace Products
The Aerospace Products reporting unit did not incur impairment charges, but fair value exceeded carrying value by less than 100% at both testing dates. The fair value of this reporting unit exceeded its carrying value by 21% at our second quarter 2024 testing date as compared to 44% in 2023. Aerospace’s long-term forecasts continue to reflect demand improvements as industry recovery continues.
LONG-LIVED ASSET IMPAIRMENT
Late in the fourth quarter of 2023, we had a triggering event to review long-lived assets and test for impairment when certain of our Elite Comfort Solutions (ECS) and Kayfoam customers notified us of efforts to improve their financial position by moving their business to or exploring alternative suppliers, which adversely impacted our future cash flow forecast. While sales and earnings were lower as compared to acquisition-date estimates for the customer bases associated with ECS and Kayfoam (acquired in 2019 and 2021, respectively), estimated undiscounted cash flows for these asset groups exceeded their carrying amounts until the fourth quarter of 2023. In early January 2024, we conducted an evaluation and determined that our sales and earnings forecasts should be reduced, and, as a result, we performed a recoverability test for these asset groups. Because the forecasted undiscounted cash flows had fallen below the carrying value for these asset groups, we tested for impairment by comparing the estimated fair value of long-lived assets to their carrying values. This resulted in a non-cash pretax charge of $444 million for long-lived asset impairments (primarily customer relationships, technology, and trademark intangibles) in the Bedding Products segment during the fourth quarter of 2023. This impairment was unrelated to the 2024 Restructuring Plan discussed below.
The fourth quarter 2023 activities resulting in the long-lived asset impairments discussed above were also considered a triggering event for goodwill impairment testing of the Bedding reporting unit, and no impairments were indicated (as discussed in Goodwill and Long-Lived Asset Impairments) starting on page 36. In evaluating the potential for impairment of goodwill and other long-lived assets, we make assumptions and estimates regarding future operating performance, business trends, and market and economic performance, including future sales, operating margins, growth rates, and discount rates. If actual results or the long-term outlook of any of our reporting units materially differ from the assumptions and estimates used in the goodwill and other long-lived assets valuation calculations, we could incur future non-cash impairment charges, which could have a material negative impact on our earnings.
2024 Restructuring Plan
In the first quarter of 2024, we committed to a restructuring plan. The 2024 Plan is primarily associated with our Bedding Products segment and, to a lesser extent, our Furniture, Flooring & Textile Products segment. The 2024 Plan was expanded in the second quarter of 2024 to include a restructuring opportunity within the Specialized Products segment and in the third quarter of 2024 to include the general and administrative cost structure initiatives. We expect to consolidate between 15 and 20 production and distribution facilities in the Bedding Products segment and a small number of production facilities in the Furniture, Flooring & Textile Products segment. The following summarizes the 2024 Plan activity:
| | |
| 2024 PROGRESS |
| Bedding Products segment |
•Consolidated 14 production and distribution facilities (ten in U.S. Spring, three in Specialty Foam, one in Adjustable Bed) |
•Consolidated all domestic innerspring production into our four larger remaining spring production facilities |
•Exited our Mexican innerspring operation |
•Downsized our Chinese innerspring operation |
•Sold two properties |
| Specialized Products segment |
•Launched restructuring activities in our Hydraulic Cylinders business to optimize manufacturing and improve operating efficiencies |
| Furniture, Flooring & Textile Products segment |
•Closed one facility in Home Furniture |
•Closed one facility in Flooring Products |
| Corporate |
•Reduced corporate general and administrative expenses to be fully realized in 2025 |
| | |
| 2025 EXPECTATIONS |
| Bedding Products segment |
•Further reductions of our Bedding footprint (primarily consolidations in Specialty Foam) |
| Specialized Products segment |
•Full implementation of manufacturing efficiency improvement activities in Hydraulic Cylinders. |
| Furniture, Flooring & Textile Products segment |
•Completion of restructuring initiatives in Flooring Products |
| | | | | | | | | | | | | | | | | | | | | | | | | | | | |
| (Dollar amounts in millions-all pretax) | | 2024
Actual | | | | Estimates for 2025 1 | | Total Plan Estimate 2, 3, 4 | | Total Plan Prior Estimate 3 |
| Plan activity: | | | | | | | | | | |
| Restructuring and restructuring-related costs: | | | | | | | | | | |
| Cash | | $ | 30 | | | | | $15 to $20 | | $45 to $50 | | $30 to $40 |
| Non-cash | | 18 | | | | | 15 to 20 | | 35 to 40 | | 35 to 45 |
| Total costs | | $ | 48 | | | | | $30 to $40 | | $80 to $90 | | $65 to $85 |
| | | | | | | | | | |
Pretax net cash from real estate 5 | | $ | 20 | | | | | $15 to $40 | | $60 to $80 | | $60 to $80 |
| | | | | | | | | | |
| Plan impacts: | | | | | | | | | | |
| Sales attrition | | $ | 15 | | | | | $ | 60 | | | $ | 80 | | | $ | 80 | |
| | | | | | | | | | |
| EBIT benefit | | $ | 22 | | | | | $55 to $60 | | $60 to $70 | | $50 to $60 |
1 Estimates for 2025 sales attrition and EBIT benefit include full year impacts of the actions completed in 2024 and additional actions expected to be completed in 2025.
2 Due to implementation timing of certain restructuring activities, we expect to have a small amount of incremental EBIT benefit and sales attrition in 2026. Additionally, due to the timing of listing properties, we expect the remainder of real estate sales to occur in 2026.
3 Estimates of annualized sales attrition and EBIT benefit are expected to be realized after the 2024 Plan is fully implemented in late 2025.
4 Increases in our total plan estimates for both cash costs and EBIT benefit are related to 2024 Plan activities in our Specialized Products segment and our general and administrative initiatives.
5 Pretax net cash from real estate is only related to the 2024 Plan and does not include the sale of idle real estate. The 2024 sale of real estate resulted in a pretax gain of $17 million. We estimate up to $37 million of pretax gains on the sale of real estate in 2025.
Unrelated to the 2024 Plan, we began exploring a potential sale of our Aerospace business in 2024 and have incurred $3 million of restructuring-related costs related to this activity. This business has not reached the criteria to be classified as held for sale.
Total restructuring and restructuring-related costs, including 2024 Plan costs and costs to explore the potential sale of our Aerospace business, for the year ending December 31, 2024, were $51 million ($33 million cash and $18 million non-cash).
2024 Plan costs are expected to be substantially complete by the end of 2025.
Because of certain risks and uncertainties, the 2024 Plan may not achieve its intended outcomes. Our estimates of the number of facilities to be consolidated, EBIT benefit, sales attrition, proceeds from the sale of real estate, and the cash and non-cash costs and impairments associated with the 2024 Plan may change as our analysis develops and additional information is obtained. Also, we may not be able to implement the 2024 Plan in a timely manner that will positively impact our financial condition and results of operations. Moreover, we may not be able to dispose of real estate pursuant to the 2024 Plan or obtain the expected proceeds in a timely manner. Any potential sales of real estate pursuant to the 2024 Plan are subject to conditions, some of which may be out of our control, that could change the timing of any sale, the amounts, the pretax gains, as well as whether such sale is completed at all. Those conditions include the listing and marketing of these properties, negotiations with prospective buyers, and other factors. The 2024 Plan may also negatively impact our
relationships with employees, customers, and vendors. Any failure to achieve the intended outcomes could materially adversely affect our business, financial condition, results of operations and cash flows, and liquidity.
We continue to evaluate our businesses for further restructuring opportunities in addition to those activities included in the 2024 Plan. The execution of any of these opportunities may result in additional material restructuring costs, restructuring-related costs, or impairments.
Market Demand
Market demand (including product mix) is impacted by several economic factors, with housing turnover and consumer confidence being the most significant. Other important factors include disposable income levels, employment levels, and interest rates. All of these factors influence consumer spending on durable goods, and therefore affect demand for our products and components. Some of these factors also influence spending on infrastructure, facilities, and equipment, which has historically impacted approximately 25%-30% of our sales. The dynamic macroeconomic environment has pressured most of our end markets and negatively affected the demand for our products.
In recent years, the U.S. mattress market has become increasingly bifurcated. High volume imports have dominated online sales and pressured opening and mid-tier price points for traditional domestic OEMs. Additionally, some mattress manufacturers and retailers have faced financial stress as overall consumer demand for mattresses has declined. In the near-term, the domestic mattress industry is expected to continue to experience some level of volatility resulting from industry bankruptcies and consolidations and import pressure.
Volatility related to the growth of Chinese EV manufacturers and multinational OEM market share challenges are expected to continue to impact the automotive industry. Delays in EV programs in Europe and changing expectations for internal combustion engines to EV program transitions in North America, along with consumer affordability issues, add additional uncertainty to OEM demand.
As a result of these uncertainties, we expect 2025 overall demand to be down modestly from 2024 levels.
Trends in Cost of Goods Sold
Our costs can vary significantly as market prices for raw materials (many of which are commodities) fluctuate. We typically have short-term commitments from our suppliers; accordingly, our raw material costs generally move with the market. We have also been impacted by fluctuations in transportation, energy, and labor costs. Our ability to recover higher costs (through selling price increases) is crucial. When we experience significant increases in costs, we typically implement price increases to recover the higher costs. Conversely, when costs decrease significantly, we generally pass those lower costs through to our customers. The timing of our price increases or decreases is important; we typically experience a lag in recovering higher costs, and we also realize a lag as costs decline.
Steel is our principal raw material. At various times in past years, we have experienced significant cost fluctuations in this commodity. In most cases, the major changes (both increases and decreases) were passed through to customers with selling price adjustments. Steel costs modestly declined throughout 2024 as U.S. steel markets continued to face soft demand and increased foreign competition.
As a producer of steel rod, we are also impacted by changes in metal margins (the difference in the cost of steel scrap and the market price for steel rod). Steel rod and steel scrap costs both declined modestly during 2024, leading to metal margin compression. As a result, we experienced lower metal margins in our Steel Rod business.
We have exposure to the cost of chemicals, including TDI, MDI, and polyol. The cost of these chemicals has fluctuated at times, but we have generally passed the changes through to our customers. Although pricing fluctuated throughout 2024, average costs for the year were flat versus 2023.
Our other raw materials include woven and nonwoven fabrics. We have experienced changes in the costs of these materials and generally have been able to pass them through to our customers.
When we raise our prices to recover higher raw material costs, this sometimes causes customers to modify their product designs and replace higher cost components with lower cost components. We must continue providing product options to our customers that enable them to improve the functionality of their products and manage their costs, while providing higher profits for our operations.
Supply Chain Shortages and Disruptions
We have experienced supply chain disruptions related to freight challenges, including higher costs.
In recent years, drought conditions lowered water levels of the Mississippi River and Panama Canal, reducing traffic through these waterways, which impacted some of our shipments. Also, in late 2023 and early 2024, the conflict in the Red Sea caused delays with some of our shipments, while other shipments from China to the United States or Europe have been re-routed. Although these issues did not have a material impact on our results of operations, additional logistical disruptions including, but not limited to, labor availability, potential labor strikes, port congestion, and trade tensions, could result in additional costs and delays in our ability to deliver products timely to certain customers.
Competition
Many of our markets are highly competitive, with the number of competitors varying by product line. In general, our competitors tend to be smaller, private companies. Many of our competitors, both domestic and foreign, compete primarily on the basis of price. Our success has stemmed from the ability to remain price competitive while delivering innovation, product quality, and customer service.
We continue to face pressure from foreign competitors, as some of our customers source a portion of their components and finished products offshore. In addition to lower labor rates, foreign competitors benefit (at times) from lower raw material costs. They may also benefit from currency factors and more lenient regulatory climates. We typically compete in market segments that value product differentiation. When we do compete on cost, we typically remain price competitive in most of our business units, even versus many foreign manufacturers, as a result of our efficient operations, automation, vertical integration in steel rod and wire, logistics and distribution efficiencies, and large-scale purchasing of raw materials and commodities. To stay competitive with global steel costs, both contract and non-contract innerspring pricing was adjusted in the back half of 2023 and fully realized in 2024. We have also reacted to foreign competition in certain cases by developing new proprietary products that help our customers reduce total costs and by shifting production offshore to take advantage of lower input costs.
We produce innersprings for mattresses that are sold to bedding manufacturers. We produce steel wire rod for consumption by our wire mills (primarily used by our innerspring manufacturing facilities to produce innersprings) and to sell to third parties. We also produce and sell finished mattresses.
In response to petitions filed with the U.S. Department of Commerce (DOC) and the U.S. International Trade Commission (ITC) generally alleging that innersprings, steel wire rod, and mattresses were being unfairly sold in the United States by certain foreign manufacturers at less than fair value (dumping) and that certain foreign manufacturers of steel wire rod and mattresses were unfairly benefiting from subsidies, antidumping and/or countervailing duties have been imposed on the imports of such products. The ITC is currently examining whether to extend a 2019 order on mattresses from China, following the DOC's February 2025 determination that revocation of the 2019 duty order would likely lead to the continuation or reoccurrence of dumping of mattresses from China.
In March 2020, the Company, along with other petitioners, filed petitions with the DOC and the ITC alleging that manufacturers of mattresses in seven different countries were unfairly selling their products in the United States at less than fair value and manufacturers of mattresses in China were benefiting from subsidies. These petitions resulted in antidumping and countervailing duty orders set to remain in effect for five years, through May 2026, at which time the DOC and ITC will conduct a sunset review to determine whether to extend the orders for an additional five years. Following certain appeals that were filed with the U.S. Court of International Trade (CIT), some of which remain ongoing, the CIT ruled in favor of the ITC and petitioners and sustained the ITC’s unanimous injury decision. In February 2024, one respondent filed an appeal of the CIT's decision to the U.S. Court of Appeals for the Federal Circuit, but that respondent agreed to dismiss the appeal on October 29, 2024. As a result, this particular appeal to the U.S. Court of Appeals for the Federal Circuit has been finally resolved.
In July 2023, the Company, along with other petitioners, filed petitions with the DOC and the ITC alleging that manufacturers of mattresses in twelve additional countries were unfairly selling their products in the United States at less than fair value and manufacturers of mattresses in Indonesia were unfairly benefiting from subsidies, causing harm to the U.S. industry and seeking the imposition of duties on mattresses imported from these countries. The ITC made a preliminary determination of injury in September 2023, and the DOC’s
preliminary determination on dumping was issued in February 2024. With respect to eight of the countries, the DOC’s final dumping determinations were issued in May 2024, and the ITC's final injury determination was issued in June 2024. In June 2029, the DOC and ITC will conduct a sunset review to determine whether to extend those orders for an additional five years. With respect to the five remaining countries, the DOC’s final determinations were issued in July 2024, and the order evidencing the ITC’s final determination with respect to the four countries which were above the de minimis threshold was issued in September 2024. This case has been finally resolved with respect to the duties and injury findings, but an importer filed an appeal with respect to the ITC's critical circumstances determination imposing retroactive duties, which is still pending. In October 2029, the DOC and ITC will conduct a sunset review to determine whether to extend the orders for an additional five years.
If any of the foregoing existing or future antidumping and countervailing duties are overturned on appeal or not extended beyond their current terms and dumping and/or subsidization recurs, or manufacturers in the subject countries circumvent the existing duties through transshipment in other jurisdictions or otherwise, our market share, sales, profit margins, and earnings could be adversely affected.
RESULTS OF OPERATIONS—2024 vs. 2023
Consolidated Results
The following table shows the changes in sales and earnings during 2024 and identifies the major factors contributing to the changes from prior year.
| | | | | | | | | | | |
| (Dollar amounts in millions, except per share data) | Amount | | % |
| Net trade sales: | | | |
| Year ended December 31, 2023 | $ | 4,725 | | | |
| | | |
| | | |
| Approximate volume declines | (205) | | | (4) | |
| Approximate raw material-related deflation | (136) | | | (3) | |
| | | |
| | | |
| Year ended December 31, 2024 | $ | 4,384 | | | (7) | % |
| Earnings: | | | |
| (Dollar amounts, net of tax) | | | |
| Year ended December 31, 2023 | $ | (137) | | | |
| 2024 goodwill impairment | (634) | | | |
| Non-recurring 2023 long-lived asset impairment | 341 | | | |
| 2024 restructuring, restructuring-related, and impairment charges | (38) | | | |
| Offsetting 2023 and 2024 net real estate gains | 15 | | | |
| Offsetting 2023 and 2024 net insurance proceeds from tornado damage | (5) | | | |
| 2024 CEO transition costs | (4) | | | |
| Special tax item | (5) | | | |
| Other items, primarily lower volume and unfavorable sales mix, raw material-related pricing adjustments, metal margin compression, and higher expenses (bad debt, medical, etc.) | (45) | | | |
| Year ended December 31, 2024 | $ | (512) | | | |
| 2023 Earnings (Loss) Per Diluted Share | $ | (1.00) | | | |
| 2024 Earnings (Loss) Per Diluted Share | $ | (3.73) | | | |
Full-year trade sales decreased 7%, to $4.38 billion. Organic sales decreased 7%, with volume declines of 4% and raw material-related price decreases of 3%.
Earnings decreased as a result of the items listed in the above table. The special tax item is associated with a deferred tax asset valuation allowance related to a 2022 acquisition in our Specialized Products segment.
Interest and Income Taxes
Net interest expense in 2024 was lower by $4 million compared to 2023. Interest rates on borrowings were higher, reflecting the effect of the retirement of our $300 million Senior Notes in the fourth quarter of 2024 paid with commercial paper, but were more than offset by lower outstanding balances due to our deleveraging efforts.
Our worldwide effective income tax rate was approximately 0% in 2024 and 21% in 2023. The following table reflects how our effective income tax rate differs from the statutory federal income tax rate. See Note O on page 114 of the Notes to Consolidated Financial Statements for additional details. | | | | | | | | | | | |
| Year Ended December 31 |
| 2024 | | 2023 |
| Statutory federal income tax rate | 21.0 | % | | 21.0 | % |
| Increases (decreases) in rate resulting from: | | | |
| State taxes, net of federal benefit | .1 | | | .2 | |
| Tax effect of foreign operations | .8 | | | (1.4) | |
| Global intangible low-taxed income | (.4) | | | (1.5) | |
| Current and deferred foreign withholding taxes | (1.9) | | | (7.3) | |
| Goodwill and long-lived asset impairments | (19.5) | | | 5.4 | |
| | | |
| Stock-based compensation | (.2) | | | .1 | |
| | | |
| Change in valuation allowance | (1.3) | | | (.4) | |
| Change in uncertain tax positions, net | (.1) | | | (.3) | |
| | | |
| Other permanent differences, net | 1.1 | | | 3.9 | |
| Other, net | — | | | 1.4 | |
| Effective tax rate | (.4) | % | | 21.1 | % |
Segment Results
In the following section we discuss 2024 sales and EBIT (earnings before interest and taxes) for each of our segments. We provide additional detail about segment results in Note C on page 89 of the Notes to Consolidated Financial Statements. We use EBIT to assess operational performance, and it is useful to investors as it aids in understanding of underlying operational profitability. | | | | | | | | | | | | | | | | | | | | | | | | | | | | | | | | | | | |
| (Dollar amounts in millions) | 2024 | | 2023 | | Change in Sales | | % Change
Organic | | |
| $ | | % | | Sales 1 |
| Trade sales | | | | | | | | | | | |
| Bedding Products | $ | 1,751.7 | | | $ | 1,964.7 | | | $ | (213.0) | | | (10.8) | % | | (10.8) | % | | |
| Specialized Products | 1,239.1 | | | 1,279.8 | | | (40.7) | | | (3.2) | | | (3.2) | | | |
| Furniture, Flooring & Textile Products | 1,392.8 | | | 1,480.8 | | | (88.0) | | | (5.9) | | | (5.9) | | | |
| | | | | | | | | | | |
| | | | | | | | | | | |
| Total trade sales | $ | 4,383.6 | | | $ | 4,725.3 | | | $ | (341.7) | | | (7.2) | % | | (7.2) | % | | |
| | | | | | | | | | | |
| | 2024 | | 2023 | | Change in EBIT | | EBIT Margins |
| $ | | % | | 2024 | | 2023 |
| EBIT | | | | | | | | | | | |
| Bedding Products | $ | (549.0) | | | $ | (344.2) | | | $ | (204.8) | | | (59.5) | % | | (31.3) | % | | (17.5) | % |
| Specialized Products | 64.4 | | | 125.0 | | | (60.6) | | | (48.5) | | | 5.2 | | | 9.8 | |
| Furniture, Flooring & Textile Products | 58.2 | | | 128.6 | | | (70.4) | | | (54.7) | | | 4.2 | | | 8.7 | |
| Intersegment eliminations & other | (3.5) | | | .2 | | | (3.7) | | | | | | | |
| | | | | | | | | | | |
Total EBIT 2 | $ | (429.9) | | | $ | (90.4) | | | $ | (339.5) | | | (375.6) | % | | (9.8) | % | | (1.9) | % |
| | | | | | | | | | | |
| 2024 | | 2023 | | | | | | | | |
| Depreciation and amortization | | | | | | | | | | | |
| Bedding Products | $ | 59.0 | | | $ | 103.9 | | | | | | | | | |
| Specialized Products | 43.0 | | | 41.1 | | | | | | | | | |
| Furniture, Flooring & Textile Products | 21.7 | | | 22.5 | | | | | | | | | |
Unallocated 3 | 12.3 | | | 12.4 | | | | | | | | | |
| Total depreciation and amortization | $ | 136.0 | | | $ | 179.9 | | | | | | | | | |
1 This is the change in sales not attributable to acquisitions or divestitures in the last 12 months.
2 Total 2024 EBIT of $(429.9) million less interest expense net of interest income of $79.3 million and income tax of $2.2 million equals 2024 Net earnings (loss) of $(511.4) million. Total 2023 EBIT of $(90.4) million less interest expense net of interest income of $83.0 million and and income tax of $(36.6) million equals 2023 Net earnings (loss) of $(136.8) million.
3 Unallocated consists primarily of depreciation and amortization on non-operating assets.
Bedding Products
Trade sales decreased 11%. Organic sales were down 11%, from volume declines of 6%, primarily due to demand softness in U.S. and European bedding markets and the expected exit of a customer in Specialty Foam, partially offset by higher trade rod sales. Raw material-related selling price decreases reduced sales 5%.
EBIT decreased $205 million, primarily from $588 million of non-cash goodwill impairment charges, $37 million of restructuring and impairment charges, raw material-related pricing adjustments, unfavorable sales mix in Steel Rod and Specialty Foam, metal margin compression, lower volume, and other expense items such as higher bad debt reserves and increased inventory write-downs/reserves. These decreases were partially offset
by the non-recurrence of a $444 million long-lived asset impairment, lower amortization expense due to the 2023 long-lived asset impairment, gains on sales of real estate, restructuring benefit, and operational efficiency improvements in Specialty Foam.
Specialized Products
Trade sales decreased 3%. Organic sales decreased 3%. Volume decreased 3% with soft demand in the second half of the year in Automotive and Hydraulic Cylinders partially offset by strong demand in Aerospace. Raw material-related price increases were offset by currency impact.
EBIT decreased $61 million, primarily from a $44 million non-cash goodwill impairment charge in Hydraulic Cylinders, lower volume, $10 million of restructuring and impairment charges, and less benefit from a reduction to a contingent purchase price liability associated with a prior year acquisition, partially offset by disciplined cost management and operational efficiency improvements.
Furniture, Flooring & Textile Products
Trade sales decreased 6%. Organic sales were down 6%. Volume decreased 3% with continued weak demand in residential end markets and demand softness in Geo Components through the third quarter. Raw material-related selling price decreases reduced sales 3%.
EBIT decreased $70 million, primarily from a $44 million non-cash goodwill impairment charge in Work Furniture, lower volume, $2 million of restructuring charges, and the non-recurrence of a $5 million net gain on insurance proceeds from tornado damage ($7 million in 2023 and $2 million in 2024) and a $6 million gain from the sale of real estate.
RESULTS OF OPERATIONS—2023 vs. 2022
Consolidated Results
The following table shows the changes in sales and earnings during 2023, and identifies the major factors contributing to the changes from prior year.
| | | | | | | | | | | |
| (Dollar amounts in millions, except per share data) | Amount | | % 1 |
| Net trade sales: | | | |
| Year ended December 31, 2022 | $ | 5,147 | | | |
| Divestitures | (1) | | | — | % |
| 2022 sales excluding divestitures | 5,146 | | | |
| Approximate volume declines | (299) | | | (6) | |
| Approximate raw material-related deflation and currency impact | (238) | | | (4) | |
| Organic sales | (537) | | | (10) | |
| Acquisition sales growth | 116 | | | 2 | |
| Year ended December 31, 2023 | $ | 4,725 | | | (8) | % |
| Earnings: | | | |
| (Dollar amounts, net of tax) | | | |
| Year ended December 31, 2022 | $ | 310 | | | |
| 2023 long-lived asset impairment | (341) | | | |
| 2023 gain on sale of real estate | 8 | | | |
| 2023 gain from net insurance proceeds from tornado damage | 7 | | | |
| Other items, primarily lower metal margin and lower volume | (121) | | | |
| Year ended December 31, 2023 | $ | (137) | | | |
| 2022 Earnings Per Diluted Share | $ | 2.27 | | | |
| 2023 Earnings (Loss) Per Diluted Share | $ | (1.00) | | | |
1 Calculations impacted by rounding
Full-year trade sales decreased 8%, to $4.73 billion. Organic sales decreased 10%, with volume declines of 6% and combined raw material-related price decreases and currency impact of 4%. Acquisitions, net of divestitures, contributed 2% to sales growth. Volume declines were impacted by continued weak residential end market demand, partially offset by automotive and industrial end market demand strength.
Earnings decreased primarily from a long-lived asset impairment charge, metal margin compression in our Steel Rod business, and lower trade sales volume in residential end markets.
Interest and Income Taxes
Net interest expense in 2023 was higher by $2 million compared to 2022, primarily due to increased interest rates on higher average commercial paper balances, somewhat offset by the interest expense associated with our matured 2012 $300 million Senior Notes, which were fully paid in the third quarter of 2022.
Our worldwide effective income tax rate was approximately 21% in 2023 and 23% in 2022. The following table reflects how our effective income tax rate differs from the statutory federal income tax rate. See Note O on page 114 of the Notes to Consolidated Financial Statements for additional details. | | | | | | | | | | | |
| Year Ended December 31 |
| 2023 | | 2022 |
| Statutory federal income tax rate | 21.0 | % | | 21.0 | % |
| Increases (decreases) in rate resulting from: | | | |
| State taxes, net of federal benefit | .2 | | | .9 | |
| Tax effect of foreign operations | (1.4) | | | (.5) | |
| Global intangible low-taxed income | (1.5) | | | .6 | |
| Current and deferred foreign withholding taxes | (7.3) | | | 2.6 | |
| Long-lived asset impairment | 5.4 | | | — | |
| | | |
| Stock-based compensation | .1 | | | (.1) | |
| | | |
| Change in valuation allowance | (.4) | | | (.1) | |
| Change in uncertain tax positions, net | (.3) | | | — | |
| | | |
| Other permanent differences, net | 3.9 | | | (1.0) | |
| Other, net | 1.4 | | | (.2) | |
| Effective tax rate | 21.1 | % | | 23.2 | % |
Segment Results
In the following section we discuss 2023 sales and EBIT for each of our segments. We provide additional detail about segment results in Note C on page 89 of the Notes to Consolidated Financial Statements. We use EBIT to assess operational performance, and it is useful to investors as it aids in understanding of underlying operational profitability. | | | | | | | | | | | | | | | | | | | | | | | | | | | | | | | | | | | |
| (Dollar amounts in millions) | 2023 | | 2022 | | Change in Sales | | % Change
Organic | | |
| $ | | % | | Sales 1 |
| Trade sales | | | | | | | | | | | |
| Bedding Products | $ | 1,964.7 | | | $ | 2,356.3 | | | $ | (391.6) | | | (16.6) | % | | (16.6) | % | | |
| Specialized Products | 1,279.8 | | | 1,118.3 | | | 161.5 | | | 14.4 | | | 7.1 | | | |
| Furniture, Flooring & Textile Products | 1,480.8 | | | 1,672.1 | | | (191.3) | | | (11.4) | | | (13.5) | | | |
| | | | | | | | | | | |
| | | | | | | | | | | |
| Total trade sales | $ | 4,725.3 | | | $ | 5,146.7 | | | $ | (421.4) | | | (8.2) | % | | (10.4) | % | | |
| | | | | | | | | | | |
| | 2023 | | 2022 | | Change in EBIT | | EBIT Margins |
| $ | | % | | 2023 | | 2022 |
| EBIT | | | | | | | | | | | |
| Bedding Products | $ | (344.2) | | | $ | 219.6 | | | $ | (563.8) | | | (256.7) | % | | (17.5) | % | | 9.3 | % |
| Specialized Products | 125.0 | | | 99.4 | | | 25.6 | | | 25.8 | | | 9.8 | | | 8.9 | |
| Furniture, Flooring & Textile Products | 128.6 | | | 165.0 | | | (36.4) | | | (22.1) | | | 8.7 | | | 9.9 | |
| Intersegment eliminations & other | .2 | | | 1.0 | | | (.8) | | | | | | | |
| | | | | | | | | | | |
Total EBIT 2 | $ | (90.4) | | | $ | 485.0 | | | $ | (575.4) | | | (118.6) | % | | (1.9) | % | | 9.4 | % |
| | | | | | | | | | | |
| 2023 | | 2022 | | | | | | | | |
| Depreciation and amortization | | | | | | | | | | | |
| Bedding Products | $ | 103.9 | | | $ | 104.1 | | | | | | | | | |
| Specialized Products | 41.1 | | | 40.5 | | | | | | | | | |
| Furniture, Flooring & Textile Products | 22.5 | | | 23.2 | | | | | | | | | |
Unallocated 3 | 12.4 | | | 12.0 | | | | | | | | | |
| Total depreciation and amortization | $ | 179.9 | | | $ | 179.8 | | | | | | | | | |
1 This is the change in sales not attributable to acquisitions or divestitures in the last 12 months. Refer to the respective segment discussion below for a reconciliation of the change in total segment sales to organic sales.
2 Total 2023 EBIT of $(90.4) million less interest expense net of interest income of $83.0 million and income tax of $(36.6) million equals 2023 Net earnings (loss) of $(136.8) million. Total 2022 EBIT of $485.0 million less interest expense net of interest income of $81.4 million and income tax of $93.7 million equals 2022 Net earnings (loss) of $309.9 million.
3 Unallocated consists primarily of depreciation and amortization on non-operating assets.
Bedding Products
Trade sales decreased 17%. Organic sales were down 17%, from volume declines of 8% and raw material-related selling price decreases, net of currency benefit, of 9%.
EBIT decreased $564 million, primarily from a $444 million non-cash long-lived asset impairment charge, lower metal margin in our Steel Rod business, and lower volume.
Specialized Products
Trade sales increased 14%. Organic sales were up 7%, from volume growth of 8% partially offset by currency impact, net of raw material-related price increases, of 1%. Acquisitions contributed 7% to sales growth.
EBIT increased $26 million, primarily from higher volume. 2023 also benefited from a $15 million reduction to a contingent purchase price liability associated with a prior year acquisition mostly offset by higher costs to support demand.
Furniture, Flooring & Textile Products
Trade sales decreased 11%. Organic sales were down 13% from volume declines of 11% and raw material-related selling price decrease, net of currency benefit, of 2%. Acquisitions contributed 2% to sales growth.
EBIT decreased $36 million, primarily from lower volume partially offset by pricing discipline, a $7 million gain on net insurance proceeds from tornado damage, and a $6 million gain on the sale of real estate.
LIQUIDITY AND CAPITALIZATION
Liquidity
Sources of Cash
Cash on Hand
At December 31, 2024, we had cash and cash equivalents of $350 million primarily invested in interest-bearing bank accounts and in bank time deposits with original maturities of three months or less. Substantially all of these funds are held in the international accounts of our foreign operations.
If we were to immediately bring back all our foreign cash to the United States in the form of dividends, we would pay foreign withholding taxes of approximately $20 million. Due to capital requirements in various jurisdictions, $70 million of this cash was inaccessible for repatriation at year end. Inaccessible cash balances can fluctuate from quarter to quarter based on the amount of foreign distributable profits available and the variability of our foreign cash balances.
Cash from Operations
The primary source of funds for our short-term cash requirements is our cash generated from operating activities. Earnings and changes in working capital levels are the two factors that generally have the greatest impact on our cash from operations.
Cash from operations - 2022 $441 million, 2023 $497 million, 2024 $306 million
Cash from operations decreased $191.5 million in 2024, primarily from lower earnings and less benefit from working capital versus last year.
We ended 2024 with working capital at 20.0% and adjusted working capital at 13.0% of annualized sales.1 The table below explains this non-GAAP calculation. We eliminate cash, current debt maturities, and the current portion of operating lease liabilities from working capital to monitor our operating efficiency and performance related to trade receivables, inventories, and accounts payable. We believe this provides a more useful measurement to investors since cash and current maturities can fluctuate significantly from period to period. As discussed in Cash on Hand on page 49, substantially all of these funds are held by international operations and may not be immediately available to reduce debt on a dollar-for-dollar basis. | | | | | | | | | | | |
| (Dollar amounts in millions) | 2024 | | 2023 |
| Current assets | $ | 1,690.5 | | | $ | 1,881.4 | |
| Current liabilities | 846.4 | | | 1,262.6 | |
| Working capital | 844.1 | | | 618.8 | |
| Cash and cash equivalents | 350.2 | | | 365.5 | |
| Current debt maturities and current portion of operating lease liabilities | 54.7 | | | 365.3 | |
| Adjusted working capital | $ | 548.6 | | | $ | 618.6 | |
Annualized sales 1 | $ | 4,225.6 | | | $ | 4,460.4 | |
| Working capital as a percent of annualized sales | 20.0 | % | | 13.9 | % |
| Adjusted working capital as a percent of annualized sales | 13.0 | % | | 13.9 | % |
1 Annualized sales equal fourth quarter sales ($1,056.4 million in 2024 and $1,115.1 million in 2023) multiplied by 4. We believe measuring our working capital against this sales metric is more useful, since efficient management of working capital includes adjusting those net asset levels to reflect current business volume.
| | | | | | | | | | | | | | | | | | | | | | | | | | | | | | | | | | | | | | |
| Three Primary Components of our Working Capital |
| | Amount (in millions) | | | Days |
| 2024 | | 2023 | | 2022 | | | 2024 | | 2023 | | 2022 |
| Trade Receivables | $ | 503.0 | | | $ | 564.9 | | | $ | 609.0 | | | DSO 1 | 44 | | 45 | | 44 |
| | | | | | | | | | | | |
| Inventories | $ | 722.6 | | | $ | 819.7 | | | $ | 907.5 | | | DIO 2 | 77 | | 81 | | 83 |
| | | | | | | | | | | | |
| Accounts Payable | $ | 497.7 | | | $ | 536.2 | | | $ | 518.4 | | | DPO 3 | 52 | | 50 | | 50 |
1Days sales outstanding: ((beginning of year trade receivables + end of year trade receivables) ÷ 2) ÷ (net trade sales ÷ number of days in the period)
2Days inventory on hand: ((beginning of year inventory + end of year inventory) ÷ 2) ÷ (cost of goods sold ÷ number of days in the period)
3Days payables outstanding: ((beginning of year accounts payable + end of year accounts payable) ÷ 2) ÷ (cost of goods sold ÷ number of days in the period)
We continue to monitor all elements of working capital in order to optimize cash flow.
Trade Receivables - Our trade receivables decreased by $62 million at December 31, 2024 compared to the prior year and our DSO has been relatively consistent the last three years. The decrease in accounts receivable was primarily due to demand softness, lower pricing due to deflation, and restructuring plan impacts.
We recorded bad debt expense of $6 million during 2024 and a benefit of $7 million during 2023. Weak demand and changing market dynamics have created disruption and financial instability for some of our customers, particularly in the Bedding Products segment. A few customers began to exhibit slow payment and past-due trends during 2024. As a result, we increased our reserves for these customers
and implemented payment plans where needed. The 2023 reduced expense is primarily related to adjustments to our allowance for certain reduced risk, including specifically-reserved accounts.
We monitor our receivable portfolio closely and make reserve decisions based upon individual customer credit risk reviews, aging of customer accounts, historical loss experience, and general macroeconomic and industry trends that could impact the expected collectability of all customers or pools of customers with similar risks. We obtain credit applications, credit reports, bank and trade references, and periodic financial statements from our customers to establish credit limits and terms as appropriate. In cases where a customer’s payment performance or financial condition begins to deteriorate or in the event of a customer bankruptcy, we tighten our credit limits and terms and make appropriate reserves based upon the facts and circumstances for each individual customer, as well as pools of similar customers.
Inventories - Our inventories decreased by $97 million at December 31, 2024 compared to the prior year, and our DIO decreased during 2024 primarily due to the impacts of the 2024 Restructuring Plan through write-downs, efforts to manage inventory to current demand, and deflation. Throughout 2022 and 2023, inventories decreased as we worked to manage inventories to levels needed to support current demand, while maintaining our ability to service customer requirements. In 2023, raw material deflation, primarily in our Bedding Products and Furniture, Flooring & Textile Products segments, was partially offset by currency impacts and increased inventories in the Specialized Products segment to support sales growth.
We continuously monitor our slower-moving and potentially obsolete inventory through reports on inventory quantities compared to usage within the previous 12 months. We also utilize cycle counting programs and complete physical counts of our inventory. When potential write-down of inventories is indicated by these controls, we will take charges for write-downs to maintain an adequate level of reserves. Additions to inventory reserves were $36 million, $9 million, and $17 million during 2024, 2023, and 2022, respectively. Reserves increased in 2024 primarily due to 2024 Restructuring Plan impacts.
Accounts Payable - Our accounts payable decreased by $38 million at December 31, 2024 compared to the prior year, and our DPO increased during 2024. The 2024 accounts payable decrease was related to lower purchasing volumes due to softening demand and efforts to lower inventory levels, partially offset by timing of payments. The 2023 increase in accounts payable was primarily related to working capital initiatives and currency. Our payment terms did not change meaningfully since last year, and we have continued to focus on optimizing payment terms with our vendors. We continue to look for ways to establish and maintain favorable payment terms through our significant purchasing power and also utilize third-party services that offer flexibility to our vendors, which in turn helps us manage our DPO as discussed below.
Accounts Receivable and Accounts Payable Programs - We participate in trade receivables sales programs in combination with third-party banking institutions and certain customers. Under each of these programs, we sell our entire interest in the trade receivable for 100% of face value, less a discount. Because control of the sold receivable is transferred to the buyer at the time of sale, accounts receivable balances sold are removed from the Consolidated Balance Sheets, and the related proceeds are reported as cash provided by operating activities in the Consolidated Statements of Cash Flows. We had approximately $45 million and $60 million of trade receivables that were sold and removed from our Consolidated Balance Sheets at December 31, 2024 and 2023, respectively. These sales reduced our quarterly DSO by roughly four and five days at December 31, 2024 and 2023, respectively. The impact to operating cash flow was an approximate $15 million decrease and $5 million decrease for the years ended December 31, 2024 and 2023, respectively.
For accounts payable, we have historically looked for ways to optimize payment terms through utilizing third-party programs that allow our suppliers to be paid earlier at a discount or for a fee. While these programs assist us in negotiating payment terms with our suppliers, we continue to make payments based on our customary terms. Contracts with our suppliers are negotiated independently of supplier participation in the programs, and we cannot increase payment terms pursuant to the programs. The primary program allows a supplier to elect to take payment from a third party earlier with a discount, and in that case, we pay the third party on the original due date of the invoice. As such, there is no direct impact on our DPO, accounts payable, operating cash flows, or liquidity. The accounts payable settled through the third-party programs, which remain on our Consolidated Balance Sheets, were approximately $120 million and $105 million at December 31, 2024 and 2023, respectively.
The above items encompass multiple individual programs that are utilized as tools in our cash flow management, and we offer them as options to facilitate customer and vendor operating cycles. Because many of these programs operate independently, and a cessation of all these programs at the same time is not reasonably likely, we do not expect changes in these programs to have a material impact on our operating cash flows or liquidity.
Mexico Value-Added Taxes (VAT) Recoverable - We are subject to VAT in various jurisdictions. Where we are entitled to a refund of the VAT we have paid, we are required to make a claim for refund from the government authorities. We establish VAT receivables for these claims, but have been experiencing refund delays in Mexico. We believe these are fully collectible. The aggregate of current and long-term balances of Mexico VAT recoverable was $35 million and $48 million at December 31, 2024 and 2023, respectively, of which $6 million was classified as long-term as of December 31, 2024. We received $19 million of the December 31, 2024 balance in January 2025.
Commercial Paper Program
Another source of funds for our short-term cash requirements is our $1.2 billion commercial paper program. As of December 31, 2024, we had $443 million available under the program. For more information on our commercial paper program, see Commercial Paper Program on page 56. Credit Facility
Our credit facility is a multi-currency facility providing us the ability, from time to time, to borrow, repay, and re-borrow up to $1.2 billion until the maturity date, at which time our ability to borrow under the facility will terminate. The credit facility matures in September 2026. Currently, there are no borrowings under the credit facility. For more information on our credit facility, see Credit Facility on page 57, and Note J on page 101 of the Notes to Consolidated Financial Statements. Capital Markets
We also believe that we have the ability to raise debt in the capital markets, which acts as a source of funding of long-term cash requirements. Currently, we have $1.9 billion of total debt outstanding. The maturities of the long-term debt range from 2027 through 2051. We paid outstanding debt of $300 million senior notes which matured in November 2024 with commercial paper. For more information, please see Long-Term Debt on page 57, and Note J on page 101 of the Notes to Consolidated Financial Statements. Uses of Cash
In 2024, the Board and our management team thoroughly evaluated our capital allocation priorities and determined to reduce our quarterly dividend. We expect to reallocate a large portion of cash spent on dividends to deleverage our balance sheet and enhance our financial position in the near term as weak demand continues to pressure earnings. In the longer term, we expect to use cash to grow our business both organically and through strategic acquisitions, while also returning cash to shareholders via a combination of dividends and share buybacks.
Capital Expenditures
Capital expenditures - 2022 $100 million, 2023 $114 million, 2024 $82 million
Total capital expenditures in 2024 were $82 million, reflecting a balance of investing for the future while controlling our spending. We are making investments to support expansion in businesses and product lines where sales are profitably growing, for efficiency improvement and maintenance, and for system enhancements. We expect capital expenditures to approximate $100 million in 2025. For the periods covered, our employee incentive plans emphasized returns on capital, including capital expenditures and working capital. This emphasis focuses our management on asset utilization and helps ensure that we are investing additional capital dollars where attractive return potential exists.
Dividends
Dividends Paid-2022 $229 million, 2023 $239 million, 2024 $136 million; Dividends Declared-2022 $1.74, 2023 $1.82, 2024 $.61
In the last two quarters of 2024, we paid a quarterly dividend of $.05 per share compared to $.46 per share in the last two quarters of 2023. The decision to reduce the dividend was made following a thorough evaluation by the Board and our management team. This action frees up capital to accelerate the deleveraging of our balance sheet and solidify our long-held financial strength.
Acquisitions
In 2022, we acquired four businesses for total consideration of $112 million ($83 million cash and $29 million additional contingent consideration). In August, we acquired a global manufacturer of hydraulic cylinders for heavy construction equipment with manufacturing locations in Germany and China and a distribution facility in the United States for a total final purchase price of $88 million ($61 million cash plus $27 additional contingent consideration, including a $2 million 2023 subsequent measurement period adjustment). Also in August, we acquired a small U.S. textiles business that converts and distributes construction fabrics for the furniture and bedding industries for a cash purchase price of $2 million. In early October and mid-December, we acquired two Canadian-based distributors of products used for erosion control, stormwater management, and various other applications for a cash purchase price of $7 million and $13 million, respectively.
In 2023 and 2024, we acquired no businesses.
Additional details about acquisitions can be found in Note R on page 119 of the Notes to Consolidated Financial Statements. Stock Repurchases
Stock repurchases are the other means by which we return cash to shareholders. We have been authorized by the Board to repurchase up to 10 million shares each calendar year, but we have established no specific repurchase commitment or timetable. The amount of future repurchases is dependent upon price of the stock, the amount of discretionary cash flow generated by the Company, alternative uses for the cash (including debt reduction, organic growth opportunities, and acquisitions) and other factors. We expect stock repurchases to be minimal in 2025.
During the last three years, we repurchased a total of 2 million shares of our stock and issued 3 million shares (through employee benefit plans and stock option exercises). Our net stock repurchases were $60 million, $6 million, and $5 million in 2022, 2023, and 2024, respectively. In 2024, we repurchased .3 million shares (at an average price of $19.17) and issued 1 million shares.
Short-Term and Long-Term Cash Requirements
In addition to the expected uses of cash discussed above, we have various material short-term (12 months or less) and long-term (more than 12 months) cash requirements as of December 31, 2024 as listed below:
| | | | | | | | | | | | | | |
| Cash Requirements | | Short-Term | | Long-Term |
| (Dollar amounts in millions) | | | | |
Current and long-term debt, excluding finance leases 1 | | $ | — | | | $ | 1,860 | |
| | | | |
Operating and finance leases 2 | | 60 | | | 143 | |
Purchase obligations 3 | | 340 | | | 12 | |
Interest payments 4 | | 57 | | | 566 | |
Deemed repatriation tax payable 5 | | 12 | | | — | |
Liability for pension benefits 6 | | 1 | | | 6 | |
Contingent consideration 7 | | 5 | | | — | |
| | | | |
1The long-term debt presented above could be accelerated if we were not able to make the principal and interest payments when due. See Note J on page 101 in the Notes to Consolidated Financial Statements for more information regarding scheduled maturities of our long-term debt. 2See Note K on page 103 in the Notes to Consolidated Financial Statements for additional information on leases. 3Purchase obligations primarily include open short-term (30-120 days) purchase orders that arise in the normal course of operating our facilities.
4Interest payments assume debt outstanding remains constant with amounts at December 31, 2024 and at rates in effect at the end of the year.
5In addition to the deemed repatriation tax payable, we also have deferred income taxes and other reserves for tax contingencies included in our Consolidated Balance Sheets. The resolution or settlement of these tax positions with the taxing authorities is subject to significant uncertainty. We are therefore unable to make a reliable estimate of the amount or timing of cash that may be required to settle these matters, or whether the matters will require cash to settle or resolve.
6See Note M on page 110 in the Notes to Consolidated Financial Statements for additional information on pension benefit plans. 7See Note R on page 119 in the Notes to Consolidated Financial Statements for more information on contingent consideration liabilities related to acquisitions. See Note I on page 101 of the Notes to Consolidated Financial Statements for details regarding the accrued expenses and other liabilities reflected on our Consolidated Balance Sheets.
Capitalization
Capitalization Table
This table presents key debt and capitalization statistics at the end of the three most recent years:
| | | | | | | | | | | | | | | | | | | | | | | | |
| (Dollar amounts in millions) | 2024 | | 2023 | | 2022 | | | | | | | |
| | | | | | | | | | | | |
| Total debt excluding credit facility/commercial paper | $ | 1,496.1 | | | $ | 1,801.6 | | | $ | 1,801.1 | | | | | | | | |
| Less: Current maturities of long-term debt and short-term debt | 1.3 | | | 308.0 | | | 9.4 | | | | | | | | |
| Scheduled maturities of long-term debt | 1,494.8 | | | 1,493.6 | | | 1,791.7 | | | | | | | | |
Average interest rates 1 | 3.8 | % | | 3.8 | % | | 3.8 | % | | | | | | | |
Average maturities in years 1 | 11.4 | | | 10.5 | | | 11.5 | | | | | | | | |
Credit facility/commercial paper 2 | 368.0 | | | 186.0 | | | 282.5 | | | | | | | | |
| Weighted average interest rate on year-end balance | 5.1 | % | | 5.6 | % | | 4.8 | % | | | | | | | |
| Average interest rate during the year | 5.6 | % | | 5.2 | % | | 3.2 | % | | | | | | | |
| Total long-term debt | 1,862.8 | | | 1,679.6 | | | 2,074.2 | | | | | | | | |
| Deferred income taxes and other liabilities | 262.2 | | | 358.3 | | | 502.4 | | | | | | | | |
| Total equity | 690.2 | | | 1,334.0 | | | 1,641.4 | | | | | | | | |
| Total capitalization | $ | 2,815.2 | | | $ | 3,371.9 | | | $ | 4,218.0 | | | | | | | | |
Unused committed credit: 2 | | | | | | | | | | | | |
| Long-term | $ | 832.0 | | | $ | 1,014.0 | | | $ | 917.5 | | | | | | | | |
| Short-term | — | | | — | | | — | | | | | | | | |
| Total unused committed credit | $ | 832.0 | | | $ | 1,014.0 | | | $ | 917.5 | | | | | | | | |
| | | | | | | | | | | | |
| Cash and cash equivalents | $ | 350.2 | | | $ | 365.5 | | | $ | 316.5 | | | | | | | | |
| | | | | | | | | | | | |
1 These rates include current maturities, but exclude commercial paper to reflect the averages of outstanding debt with scheduled maturities.
2 The unused committed credit amount is based on our revolving credit facility and commercial paper program which, during all periods presented, had a total authorized program amount of $1.2 billion. However, our borrowing capacity is limited by covenants to our credit facility. Reference is made to the discussion under Commercial Paper Program below on page 56 and Credit Facility on page 57 for more details about our borrowing capacity at December 31, 2024. Commercial Paper Program
Details of our commercial paper program at December 31 are presented in the table below:
| | | | | | | | | | | | | | | | | |
| (Dollar amounts in millions) | 2024 | | 2023 | | 2022 |
| Total authorized program | $ | 1,200.0 | | | $ | 1,200.0 | | | $ | 1,200.0 | |
| Commercial paper outstanding (classified as long-term debt) | 368.0 | | | 186.0 | | | 282.5 | |
| Letters of credit issued under the credit agreement | — | | | — | | | — | |
Amount limited by restrictive covenants of credit facility 1 | 388.8 | | | 682.1 | | | 200.9 | |
| Total program available | $ | 443.2 | | | $ | 331.9 | | | $ | 716.6 | |
1 Our borrowing capacity is limited by covenants in our credit facility. Reference is made to the discussion under Credit Facility on page 57 for more details about our borrowing capacity at December 31, 2024.
The average and maximum amounts of commercial paper outstanding during 2024 were $290 million and $428 million, respectively. During the fourth quarter, the average and maximum amounts outstanding were $311 million and $428 million, respectively. At year end, we had no letters of credit outstanding under the credit
facility, but we had issued $61 million of stand-by letters of credit under other bank agreements to take advantage of better pricing.
Over the long-term, and subject to our credit ratings, market conditions, capital needs, and alternative capital market opportunities, we expect to maintain the indebtedness under the commercial paper program by continuously repaying and reissuing the commercial paper notes. We view the notes as a source of long-term funds and have classified the borrowings under the commercial paper program as long-term borrowings on our balance sheet. We have the intent to roll over such obligations on a long-term basis and have the ability to refinance these borrowings on a long-term basis as evidenced by our $1.2 billion revolving credit facility maturing in 2026 discussed below. Recently, our credit ratings have been lowered and could be lowered further. Lower credit ratings could adversely affect our borrowing capacity and our financial arrangements, including access to the commercial paper market, our lending agreements, and supply chain financing arrangements. If we are unable to meet our short-term borrowing needs in the commercial paper market, we may rely on bank debt to fund short-term working capital needs at higher interest costs.
Credit Facility
Our multi-currency credit facility matures in September 2026. It provides us the ability, from time to time, subject to certain restrictive covenants and customary conditions, to borrow, repay, and re-borrow up to $1.2 billion. Capitalized terms used in this section but not defined herein have the meanings set forth in the Credit Agreement.
To provide additional borrowing capacity and financial flexibility, we amended our credit agreement in March 2024 to increase the Leverage Ratio from 3.50 to 1.00 to 4.00 to 1.00. After the amendment, our credit facility contains restrictive covenants which include (a) an amended Leverage Ratio requiring us to maintain, as of the last day of each fiscal quarter, or when we borrow under the credit facility (i) Consolidated Funded Indebtedness minus the lesser of: (A) Unrestricted Cash, or (B) $750 million to (ii) Consolidated EBITDA for the four consecutive trailing quarters, such ratio not being greater than 4.00 to 1.00 as of March 31, 2024 through June 30, 2025, and not greater than 3.50 to 1.00 beginning September 30, 2025 through maturity, provided however, subject to certain limitations, if we make a Material Acquisition in any fiscal quarter after June 30, 2025, at our election, the maximum Leverage Ratio shall be 4.00 to 1.00 for the fiscal quarter during which such Material Acquisition is consummated and the next three consecutive fiscal quarters; (b) a limitation of the amount of total secured obligations to 15% of our total consolidated assets; and (c) a limitation on our ability to sell, lease, transfer, or dispose of all or substantially all of our assets and the assets of our subsidiaries, taken as a whole (other than accounts receivable sold in a Permitted Securitization Transaction, products sold in the ordinary course of business and our ability to sell, lease, transfer, or dispose of any of our assets or the assets of one of our subsidiaries to us or one of our subsidiaries, as applicable) at any given point in time. We were in compliance with all of our debt covenants at the end of 2024. For more information about long-term debt, please see Note J on page 101 of the Notes to Consolidated Financial Statements. Our credit facility serves as back-up for our commercial paper program. At December 31, 2024, we had $368 million commercial paper outstanding and had no borrowing under the credit facility. As our trailing 12-month Consolidated EBITDA, Unrestricted Cash, and debt levels change, our borrowing capacity increases or decreases. Based on our trailing 12-month Consolidated EBITDA, Unrestricted Cash, and debt levels at December 31, 2024, our borrowing capacity under the credit facility was $443 million. However, this may not be indicative of the actual borrowing capacity moving forward, which may be materially different depending on our Consolidated EBITDA, Unrestricted Cash, debt levels, and leverage ratio requirements at that time.
Long-Term Debt
We have total debt of $1.9 billion. The maturities of the long-term debt range from 2027 through 2051. We paid outstanding debt of $300 million senior notes which matured in November 2024 with commercial paper. We expect lower interest expense as we deleverage. For more details on long-term debt see Note J on page 101 of the Notes to Consolidated Financial Statements.
CRITICAL ACCOUNTING POLICIES AND ESTIMATES
We prepare our consolidated financial statements in accordance with accounting principles generally accepted in the United States of America. To do so, we must make estimates and judgments that affect the reported amounts of assets, liabilities, revenues, expenses, and disclosures. If we used different estimates or judgments, our financial statements could change. Some of these changes could be significant. Our estimates are frequently based upon historical experience and are considered by management, at the time they are made, to be reasonable and appropriate. Estimates are adjusted for actual events as they occur.
Critical accounting estimates are those that are: (a) subject to uncertainty and change and (b) of material impact to our financial statements. Listed below are the estimates and judgments which we believe could have the most significant effect on our financial statements.
We provide additional details regarding our significant accounting policies in Note A on page 82 of the Notes to Consolidated Financial Statements. | | | | | | | | | | | | | | |
| Description | | Judgments and Uncertainty | | Changes in Estimate and Effect if Actual Results Differ from Assumptions |
| Goodwill | | | | |
Goodwill is assessed for impairment annually as of June 30 and as triggering events occur.
| | Goodwill is evaluated annually for impairment as of June 30 using a quantitative analysis at the reporting unit level, which is one level below our operating segments.
Judgment is required in the quantitative analysis. We estimate fair value using a combination of:
(a) A discounted cash flow model that contains uncertainties related to the forecast of future results, as many outside economic and competitive factors can influence future performance as discussed in Note A on page 82 of the Notes to Consolidated Financial Statements.
(b) A market approach, using price to earnings ratios for comparable publicly traded companies that operate in the same or similar industry and with characteristics similar to the reporting unit. | | In 2024, we had total goodwill impairments of $676 million. We had no goodwill impairments in 2023 and 2022.
Four reporting units had fair values in excess of carrying value of less than 100% in 2024 as discussed in Note F on page 96 of the Notes to Consolidated Financial Statements. At December 31, 2024, we had $794 million of goodwill.
Information regarding material assumptions used to determine if a goodwill impairment exists can be found in Note A on page 82 and Note F on page 96 of the Notes to Consolidated Financial Statements.
Our assumptions are based on our current business strategy in light of present industry and economic conditions, as well as future expectations. If we are not able to achieve projected performance levels, future non-cash impairments could be possible. For additional information regarding uncertainties, see discussions in Goodwill and Long-Lived Asset Impairments starting on page 36. |
| | | | | | | | | | | | | | |
| Description | | Judgments and Uncertainty | | Changes in Estimate and Effect if Actual Results Differ from Assumptions |
| Other Long-Lived Assets | | | | |
Other long-lived assets are tested for recoverability at year end and whenever events or circumstances indicate the carrying value may not be recoverable.
For other long-lived assets we estimate fair value at the lowest level where cash flows can be measured.
| | Impairments of other long-lived assets usually occur when industry trends reduce our forecasted sales and earnings, major restructuring activities take place, or we decide to discontinue selected products. Our impairment assessments have uncertainties because they require estimates of future cash flows to determine if undiscounted cash flows are sufficient to recover carrying values of these assets. For assets where undiscounted cash flows are not expected to recover carrying value, fair value is estimated using discounted cash flow models for intangibles and right-of-use assets or estimated replacement cost for fixed assets. | | In 2024, we had non-cash pretax impairment charges of $6 million, partially related to the 2024 Restructuring Plan. We had a triggering event to review long-lived assets for impairment late in the fourth quarter of 2023, which resulted in non-cash pretax impairment charges of $444 million in our Bedding Products segment. We had no impairment charges in 2022.
For additional information, see Note F on page 96 of the Notes to Consolidated Financial Statements and Goodwill and Long-Lived Asset Impairments starting on page 36.
At December 31, 2024, net property, plant and equipment was $724 million, net intangible assets (other than goodwill) were $140 million, and operating lease right-of-use assets were $176 million. |
| Inventory Reserves | | | | |
We reduce the carrying value of inventories to reflect an estimate of net realizable value for slow-moving (i.e., not selling very quickly) and obsolete inventory.
Generally, a reserve is required when we have more than a 12-month supply of the product.
The calculation also uses an estimate of the ultimate recoverability of items identified as slow-moving, based upon historical experience.
If we have had no sales of a given product for 12 months, those items are generally deemed to be obsolete with no value and are written down completely.
| | Our inventory reserve contains uncertainties because the calculation requires management to make assumptions about the value of products that are obsolete or slow-moving.
Purchases of inventories in excess of quantities ultimately sold and/or changes in customer behavior and requirements can cause inventory to become obsolete or slow-moving. Restructuring activity and decisions to narrow product offerings also impact the estimated net realizable value of inventories.
| | At December 31, 2024, the reserve for obsolete and slow-moving inventory was $58 million (approximately 8% of inventories). This is slightly higher than the reserves at December 31, 2023 and 2022, representing approximately 6% of inventories for both years.
Additions to inventory reserves in 2024 were $36 million, which is higher than our $19 million three-year average. Reserves increased in 2024 primarily due to 2024 Restructuring Plan impacts and write-downs of selected products primarily in our Bedding Products segment.
There have been no changes to our policies for establishing reserves, and we expect to return to our historical obsolescence levels. For additional information, see discussions of our inventories in the working capital section starting on page 50.
|
| | | | | | | | | | | | | | |
| Description | | Judgments and Uncertainty | | Changes in Estimate and Effect if Actual Results Differ from Assumptions |
| Income Taxes | | | | |
| In the ordinary course of business, we must make estimates of the tax treatment of many transactions, even though the ultimate tax outcome may remain uncertain for some time. These estimates become part of the annual income tax expense reported in our financial statements. Subsequent to year end, we finalize our tax analysis and file income tax returns. Tax authorities periodically audit these income tax returns and examine our tax filing positions, including (among other things) the timing and amounts of deductions, and the allocation of income among tax jurisdictions. If necessary, we adjust income tax expense in our financial statements in the periods in which the actual outcome becomes more certain. | | Our tax liability for unrecognized tax benefits contains uncertainties because management is required to make assumptions and to apply judgment to estimate the exposures related to our various filing positions. Our effective tax rate is also impacted by changes in tax laws, the current mix of earnings by taxing jurisdiction, and the results of current tax audits and assessments. At December 31, 2024 and 2023, we had $148 million and $134 million, respectively, of net deferred tax assets on our balance sheet. The ultimate realization of these deferred tax assets is dependent upon the amount, source, and timing of future taxable income. In cases where we believe it is more likely than not that we may not realize the future potential tax benefits, we establish a valuation allowance against them. | | Changes in U.S. and foreign tax laws could impact assumptions related to the taxation and repatriation of certain foreign earnings. Audits by various taxing authorities continue as governments look for ways to raise additional revenue. Based upon past audit experience, we do not expect any material changes to our tax liability as a result of this audit activity; however, we could incur additional tax expense if we have audit adjustments higher than recent historical experience.
We believe that appropriate valuation allowances have been recorded as necessary. However, if earnings expectations or other assumptions change such that additional valuation allowances are required, we could incur additional tax expense. Likewise, if fewer valuation allowances are needed, we could incur reduced tax expense. |
| | | | |
| | | | |
CONTINGENCIES
Litigation
Accruals for Probable Losses
We are exposed to litigation contingencies that, if realized, could have a material negative impact on our financial condition, results of operations, and cash flows. Although we deny liability in all currently threatened or pending litigation proceedings, we have recorded an immaterial aggregate litigation contingency accrual of $1.4 million, $1.4 million, and $.9 million at December 31, 2024, 2023, and 2022, respectively. The accruals do not include accrued expenses related to workers’ compensation, vehicle-related personal injury, product and general liability claims, taxation issues, and environmental matters, some of which may contain a portion of litigation expense. However, any litigation expense associated with these categories is not anticipated to have a material effect on our financial condition, results of operations, or cash flows. For more information regarding accrued expenses, see “Accrued expenses” under Note I on page 101 of the Notes to Consolidated Financial Statements. Reasonably Possible Losses in Excess of Accruals
Although there are a number of uncertainties and potential outcomes associated with all of our pending or threatened litigation proceedings, we believe, based on current known facts, that additional losses, if any, are not expected to materially affect our consolidated financial position, results of operations, or cash flows. However, based upon current known facts, as of December 31, 2024, aggregate reasonably possible (but not probable, and therefore not accrued) losses in excess of the accruals for litigation contingencies are estimated
to be $13 million. If our assumptions or analyses regarding any of our contingencies are incorrect, or if facts change, we could realize losses in excess of the recorded accruals (including losses in excess of the $13 million referenced above), which could have a material negative impact on our financial condition, results of operations, and cash flows. Also, we could be subject to future litigation of various types (including, but not limited to, litigation related to employment, intellectual property, environmental, taxation, vehicle-related personal injury, antitrust, climate change, and others) that could negatively impact our financial condition, results of operations, and cash flows.
For more information regarding our litigation contingencies, see Item 3. Legal Proceedings on page 30 and Note T on page 121 of the Notes to Consolidated Financial Statements, which is incorporated herein by reference. Climate Change
Transition Risks
Change in Laws, Policies, and Regulations. Many scientists, legislators, and others attribute climate change to increased levels of greenhouse gas (GHG) emissions, including carbon dioxide, which has led to significant legislative and regulatory efforts to limit such emissions. At December 31, 2024, we had 119 manufacturing facilities in 18 countries. We also maintain a fleet of over-the-road tractor trailers that emit GHG emissions. Our manufacturing facilities are primarily located in North America, Europe, and Asia. There are certain transition risks (meaning risks related to the process of reducing our carbon footprint) that could materially affect our business, capital expenditures, results of operations, financial condition, competitive position, and reputation. One of these transition risks is the change in treaties, laws, policies, and regulations that could impose significant operational and compliance burdens. If our customers (who may be subject to climate change regulatory requirements or similarly proposed or newly-enacted laws and regulations) incur additional costs to comply with such laws and regulations, which in turn, impact their ability to operate at similar levels in certain jurisdictions, the demand for our products could be adversely affected. Also, overall, there continues to be a lack of consistent climate legislation in the jurisdictions in which we operate, which creates economic and regulatory uncertainty. If these laws or regulations (including the SEC’s rule regarding climate-related disclosures, if upheld) impose significant operational restrictions and compliance requirements on us, they could increase costs associated with our operations, including costs for raw materials and transportation. Non-compliance with climate change treaties, legislative, and regulatory requirements could also negatively impact our reputation. To date, however, we have not experienced a material impact from such legislative and regulatory efforts.
Market Transition. We are engaged in the manufacture of various automotive components, including lumbar supports and massage systems for seating, seat suspension systems, motors and actuators, and cables. For several decades, automotive manufacturers have sought lightweight components designed to increase fuel efficiency in the automobiles they manufacture. Replacing traditional steel components with lightweight alternative components can directly reduce the weight of a vehicle's body and chassis and therefore reduce a vehicle's fuel consumption. This increased fuel efficiency also indirectly reduces GHG emissions.
These long-standing market transitions have negatively impacted our market share, although not materially because of our technological competitiveness. However, if we are unable to continue to react to changes in technology, successfully develop new and innovative products, or successfully respond to evolving business trends, including continuing to produce comparatively lightweight components, our share in these markets could be materially negatively impacted.
Physical Climate Change Risks
Direct Physical Effects. The acute and chronic physical effects of severe weather-related events, natural disasters, and/or significant changes in climate patterns, could have an increasingly adverse impact on our business and customers. As mentioned above, at December 31, 2024, we had 119 manufacturing facilities in 18 countries, primarily in North America, Europe, and Asia. We serve thousands of customers worldwide. In 2024, our largest customer represented less than 8% of our sales, and our customers were located in approximately 100 countries. Although our diverse geographical manufacturing footprint and our broad geographical customer base mitigates the potential physical risks of any local or regional severe weather-related event having a material effect on our operations and results, the increased frequency and severity of such weather-related
events could result in potential damage to our physical assets, local infrastructure, transportation systems, water delivery systems, our customers’ or suppliers’ operations, as well as prolonged disruptions in our manufacturing operations (including, but not limited to, our steel rod mill and wire drawing mills), all of which could harm our business, results of operations, and financial condition.
Indirect Physical Effects. The physical effects of climate change could continue to have an adverse impact on our supply chain. In prior years, we experienced (due, in part, to severe weather-related impacts) supply shortages in chemicals, which restricted foam supply and constrained overall mattress production in the bedding industry. This reduced our production levels and increased the cost of chemicals and foam. Severe weather impacts could also reduce supply of other products in our supply chain that could result in higher prices for our products and the resources needed to produce them. If we are unable to secure an adequate and timely supply of products in our supply chain, or the cost of these products materially increases, it could have a negative impact on our business, results of operations, and financial condition.
In recent years, drought conditions lowered water levels of the Mississippi River and Panama Canal, reducing traffic through these waterways, which impacted some of our shipments. Although these issues did not have a material impact on our results of operations, additional logistical disruptions could result in additional costs and delays in our ability to deliver products timely to certain customers.
In addition, although the cost has not been material to our business, results of operations, and financial condition, severe weather-related incidents have resulted and may, in the future, result in increased costs of property insurance.
GHG Reduction Strategy and Compliance Costs
To date, we have not experienced material climate-related compliance costs. However, evaluating opportunities to reduce our carbon footprint, setting goals for carbon reduction, and measuring performance in achieving those goals are part of our sustainability and corporate governance strategy. We have completed our GHG emissions inventory covering 2019 through 2023. To ensure our information is complete and accurate, we engaged a third-party limited assurance provider for all years. Our emissions inventory includes Scope 1 and Scope 2 carbon dioxide equivalent emissions. We considered the principles and guidance of the GHG Protocol Corporate Accounting and Reporting Standard. As of the end of 2023, our total GHG emissions, measured using a market-based approach, were approximately 25% less than our combined Scope 1 and 2 GHG emissions over our baseline year of 2019, which was due in significant part, to the decrease in production over the same time period.
Our baseline measurement will inform a long-term GHG reduction strategy, including setting reduction targets and other key performance areas. Our key initiatives as we move through 2025 and into 2026 include: developing our emissions reduction pathways to reduce GHG emissions, undertaking our first Scope 3 emissions inventory, assessing where emission reduction opportunities lie within our value chain, and preparing for and complying with new reporting requirements. We anticipate setting a climate reduction target in line with climate science by the end of 2025. We currently do not have an estimate of the capital expenditures or operating costs that may be required to implement our GHG reduction strategy. However, we do not expect that such capital expenditures or operating costs will be material to our financial condition or results of operations. Our GHG reduction strategy is expected to be published in our 2025 Sustainability Report. Our current Sustainability Report can be found at www.leggett.com/sustainability. Neither our Sustainability Report nor the Leggett website constitute part of this Annual Report on Form 10-K.
Cybersecurity Risk
We rely on information systems to obtain, process, analyze, and manage data, as well as to facilitate the manufacture and distribution of inventory to and from our facilities. We receive, process, and ship orders, manage the billing of and collections from our customers, and manage the accounting for and payment to our vendors. We also manage our production processes with certain industrial control systems. Consequently, we are subject to cybersecurity risk.
Although we have purchased broad form cyber insurance coverage and strive to provide a balanced level of cybersecurity protections, cybersecurity risk has increased due to remote access and increased sophistication of cybersecurity adversaries, as well as the increased frequency of cybersecurity attacks. As such, information technology failures or cybersecurity breaches could still create system disruptions or
unauthorized disclosure or alterations of confidential information and disruptions to the systems of our third-party suppliers and providers. We cannot be certain that the attacker’s capabilities will not compromise our technology protecting information systems or bypass our detection capabilities, including those resulting from ransomware attached to our industrial control systems. If these systems are interrupted or damaged by any incident or fail for any extended period of time, then our results of operations could be adversely affected. We may incur remediation costs, increased cybersecurity protection costs, lost revenues resulting from unauthorized use of proprietary information, litigation and legal costs, increased insurance premiums, reputational damage, damage to our competitiveness, and negative impact on our stock price and long-term shareholder value. We may also be required to devote significant management resources and expend significant additional resources to address problems created by any such interruption, damage, or failure.
NEW ACCOUNTING STANDARDS
The FASB has issued accounting guidance effective for current and future periods. See Note A on page 82 of the Notes to Consolidated Financial Statements for a more complete discussion. TERMINATION OF PENSION PLAN
In September 2024, the Board of Directors approved a resolution to merge two of our domestic defined benefit pension plans and terminate the resulting merged plan effective December 31, 2024. Participants in the plan have stopped earning benefits. The distribution of plan assets and settlement of benefit obligations will occur after the plan termination satisfies all regulatory requirements, which is expected to be completed by mid-2026. The plan was underfunded by $4 million and $6 million as of December 31, 2024 and 2023, respectively. Upon completion, we expect to recognize a pretax pension settlement charge that will include a non-cash charge for the recognition of pretax actuarial losses in Accumulated other comprehensive loss ($22 million as of December 31, 2024) and any additional cash contributions that may be needed to settle the plan's obligations. The actual amount of the settlement charge and any potential cash contribution will depend on various factors. For more information on the termination of the merged plan, see Note M beginning on page 110 of the Notes to Consolidated Financial Statements.
Item 7A. Quantitative and Qualitative Disclosures About Market Risk.
(Unaudited)
(Dollar amounts in millions)
Interest Rates
The table below provides information about our debt obligations sensitive to changes in interest rates. Substantially all of the debt shown in the table below is denominated in U.S. dollars. The fair value of fixed rate debt was approximately $245.0 million less than carrying value at December 31, 2024 and approximately $175.0 million less than carrying value at December 31, 2023. The fair value of the fixed rate debt was based on quoted prices in an active market. The fair value of variable rate debt is not significantly different from its recorded amount.
| | | | | | | | | | | | | | | | | | | | | | | | | | | | | | | | | | | | | | | | | | | | | | | |
| Long-term debt as of December 31, | Scheduled Maturity Date | | | | |
| 2025 | | 2026 | | 2027 | | 2028 | | 2029 | | Thereafter | | 2024 | | 2023 |
| Principal fixed rate debt | $ | — | | | $ | — | | | $ | 500.0 | | | $ | — | | | $ | 500.0 | | | $ | 500.0 | | | $ | 1,500.0 | | | $ | 1,800.0 | |
| Average stated interest rate | — | | | — | | | 3.50 | % | | — | | | 4.40 | % | | 3.50 | % | | 3.80 | % | | 3.80 | % |
| Principal variable rate debt | — | | | — | | | 1.8 | | | — | | | — | | | 2.0 | | | 3.8 | | | 3.8 | |
| | | | | | | | | | | | | | | |
| Unamortized discounts and deferred loan costs | | | | | | . | | | | | | | (11.7) | | | (13.6) | |
Commercial paper 1 | | | | | | | | | | | | | 368.0 | | | 186.0 | |
| Miscellaneous debt and finance leases | | | | | | | | | | | | | 4.0 | | | 11.4 | |
| Total debt | | | | | | | | | | | | | 1,864.1 | | | 1,987.6 | |
| Less: current maturities | | | | | | | | | | | | | 1.3 | | | 308.0 | |
| Total long-term debt | | | | | | | | | | | | | $ | 1,862.8 | | | $ | 1,679.6 | |
1The weighted average interest rate for the average net commercial paper outstanding activity during the years ended December 31, 2024 and 2023 was 5.6% and 5.2%, respectively.
Derivative Financial Instruments
We are subject to market and financial risks related to interest rates and foreign currency. In the normal course of business, we utilize derivative instruments (individually or in combinations) to reduce or eliminate these risks. We seek to use derivative contracts that qualify for hedge accounting treatment; however, some instruments may not qualify for hedge accounting treatment. It is our policy not to speculate using derivative instruments. Information regarding cash flow hedges and fair value hedges is provided in Note A beginning on page 82 and Note S beginning on page 120 of the Notes to Consolidated Financial Statements and is incorporated by reference into this section.
Investment in Foreign Subsidiaries
We view our investment in foreign subsidiaries as a long-term commitment. This investment may take the form of either permanent capital or notes. Our net investment (i.e., total assets less total liabilities subject to translation exposure) in foreign operations with functional currencies other than the U.S. dollar at December 31 is as follows:
| | | | | | | | | | | | | | |
| Functional Currency (amounts in millions) | | 2024 | | 2023 |
| European Currencies | | $ | 396.5 | | | $ | 525.9 | |
| Chinese Yuan | | 267.2 | | | 271.2 | |
| Canadian Dollar | | 208.9 | | | 236.3 | |
| Mexican Peso | | 71.4 | | | 85.4 | |
| Other | | 78.8 | | | 83.3 | |
| Total | | $ | 1,022.8 | | | $ | 1,202.1 | |
Item 8. Financial Statements and Supplementary Data.
The Consolidated Financial Statements and Notes and Financial Statement Schedule included in this Report are listed and included in Item 15 on page 72, and are incorporated by reference into this item. Item 9. Changes in and Disagreements With Accountants on Accounting and Financial Disclosure.
None.
Item 9A. Controls and Procedures.
Effectiveness of the Company’s Disclosure Controls and Procedures
An evaluation as of December 31, 2024, was carried out by the Company’s management, with the participation of the Company’s Chief Executive Officer and Chief Financial Officer, of the effectiveness of the Company’s disclosure controls and procedures (as defined in Rule 13a-15(e) under the Securities Exchange Act of 1934, as amended (the “Exchange Act”)). Based upon this evaluation, the Chief Executive Officer and Chief Financial Officer have concluded the Company’s disclosure controls and procedures were effective, as of December 31, 2024, to provide assurance that information required to be disclosed by the Company in the reports that it files or submits under the Exchange Act is recorded, processed, summarized, and reported within the time periods specified by the Securities and Exchange Commission’s rules and forms. Disclosure controls and procedures include, without limitation, controls and procedures designed to ensure that information required to be disclosed by the Company in the reports that it files or submits under the Exchange Act is accumulated and communicated to the Company’s management, including its Chief Executive Officer and Chief Financial Officer, or persons performing similar functions, as appropriate to allow timely decisions regarding required disclosure.
Management’s Annual Report on Internal Control over Financial Reporting and Auditor’s Attestation Report
Changes in the Company’s Internal Control Over Financial Reporting
There were no changes during the quarter ended December 31, 2024 that have materially affected, or are reasonably likely to materially affect, our internal control over financial reporting.
Item 9B. Other Information.
During the three months ended December 31, 2024, no director or officer (as defined in Rule 16a-1(f) under the Securities Exchange Act of 1934, as amended) of the Company adopted, modified, or terminated a “Rule 10b5-1 trading arrangement.”
The following elections made pursuant to the Company’s Deferred Compensation Program (“DC Program”) and Executive Stock Unit Program (“ESU Program”) may be considered to constitute “non-Rule 10b5-1 trading arrangements.” As such, we have disclosed them below. All elections were made at a time when the individual was not aware of material non-public information about the Company. The securities under the DC Program and the ESU Program are issued from the Company to the individual and no market transaction is involved.
Elections were made pursuant to the DC Program, effective December 15, 2024, which deferred cash compensation that would have been earned from January 1, 2025 through December 31, 2025, into Company stock units convertible into Company common stock on a one-to-one basis. Joseph W. McClanathan (director), Manuel A. Fernandez (director), Benjamin M. Burns (EVP and CFO), Jennifer J. Davis (EVP and General Counsel), J. Tyson Hagale (EVP, President - Bedding Products), Ryan M. Kleiboeker (EVP and Chief Strategic Planning Officer), Lindsey N. Odaffer (EVP and CHRO), R. Samuel Smith, Jr. (EVP, President - Specialized Products and Furniture, Flooring & Textile Products), and Tammy M. Trent (SVP and CAO) elected to defer cash compensation into stock units. The number of stock units acquired under the DC Program is determined by taking the cash deferred and dividing it by 80% of the closing price of the Company common stock on the NYSE on the date the cash would have otherwise been paid.
On December 2, 2024, Karl G. Glassman (President and CEO, director) elected to participate in the ESU program beginning January 1, 2025. The number of stock units awarded in the ESU Program is determined by taking the amount of any Company matching contributions and dividend equivalent contributions and dividing it by 85% of the fair market value of the Company common stock on the date the cash would have otherwise been paid.
Item 9C. Disclosure Regarding Foreign Jurisdictions that Prevent Inspections.
Not Applicable.
PART III
Item 10. Directors, Executive Officers and Corporate Governance.
The subsections titled “PROPOSAL ONE: Election of Directors,” “Board and Committee Composition and Meetings,” “Consideration of Director Nominees and Diversity,” “Delinquent Section 16(a) Reports,” and “Director Independence and Board Service,” as well as the introductory paragraph under the “Corporate Governance and Board Matters” section in the Company’s definitive Proxy Statement for the Company’s Annual Meeting of Shareholders to be held on May 7, 2025, are incorporated by reference.
Directors of the Company
Directors are normally elected annually at the Annual Meeting of Shareholders and hold office until the next annual meeting of shareholders or until their successors are elected and qualified. All current directors, except Mark A. Blinn and Manuel A. Fernandez, have been nominated for re-election at the Company’s annual meeting of shareholders to be held May 7, 2025. On February 25, 2025, Mr. Blinn and Mr. Fernandez notified the Company that each will retire as a director effective as of the annual shareholders meeting.
In order to be nominated for election as a director, a nominee must submit a contingent resignation to the Nominating, Governance and Sustainability Committee (NGS Committee). The resignation will become effective only if (i) the director nominee fails to receive an affirmative vote of a majority of the shares, represented in person or by proxy, entitled to vote at a meeting for the election of directors; and (ii) the Board accepts the resignation. If a nominee fails to receive an affirmative majority of such votes, the NGS Committee will make a recommendation to the Board of Directors whether to accept or reject the director’s resignation and whether any other action should be taken. If a director’s resignation is not accepted, that director will continue to serve until the Company’s next annual meeting or until his or her successor is duly elected and qualified. If the Board accepts the director’s resignation, it may, in its sole discretion, either fill the resulting vacancy or decrease the size of the Board to eliminate the vacancy.
Brief biographies of the Company’s Board of Directors are provided below.
Angela Barbee, age 59, was Senior Vice President of Technology and Global R&D of Weber Inc., a manufacturer of charcoal, gas, pellet, and electric outdoor grills and accessories, from 2021 until 2022. She previously served as Vice President of Advance Development, Global Kitchen & Bath Group of Kohler Company, a global leader in design, innovation and manufacture of kitchen and bath products, engines and power systems, and luxury cabinetry and tile, from 2020 to 2021, and as Vice President of New Product Development and Engineering, Global Faucets from 2018 to 2020. Ms. Barbee served as Director of Global Creative Design Operations of General Motors, a global company that designs, builds, and sells trucks, crossovers, cars, and automobile parts and accessories, from 2013 to 2017, and in various other capacities since 1994. Ms. Barbee holds a bachelor’s degree in mechanical engineering from Wayne State University, a master’s degree in mechanical engineering from Purdue University, and has completed the Executive Education Program in the Ross Business School at the University of Michigan. Through her positions at Weber, Kohler, and General Motors, Ms. Barbee has a wide-ranging knowledge of manufacturing, engineering and innovation, management, and operations in the consumer products and automotive industries. She also has extensive international experience in leading engineering, development and innovation efforts. She was first elected as a director of the Company in 2022.
Mark A. Blinn, age 63, was President and Chief Executive Officer and a director of Flowserve Corporation, a leading provider of fluid motion and control products and services for the global infrastructure markets, from 2009 until his retirement in 2017. He previously served Flowserve as Chief Financial Officer from 2004 to 2009 and in the additional role of Head of Latin America from 2007 to 2009. Prior to Flowserve, Mr. Blinn’s positions included Chief Financial Officer of FedEx Kinko’s Office and Print Services Inc. and Vice President, Corporate Controller and Chief Accounting Officer of Centex Corporation. Mr. Blinn holds a bachelor’s degree, a law degree, and an MBA from Southern Methodist University. Mr. Blinn currently serves as a director of Texas Instruments, Incorporated, a global semiconductor design and manufacturing company, Emerson Electric Co., a global technology and engineering company for industrial, commercial and residential markets, and Globe Life Inc., a financial services holding company specializing in life insurance, annuity, and supplemental health insurance products. He previously served as a director of Kraton Corporation, a leading
global producer of polymers for a wide range of applications. As the former CEO and CFO of Flowserve, Mr. Blinn has exceptional leadership experience in operations and finance, as well as strategic planning and risk management. His board service at other global, public companies provides additional perspective on current finance, oversight, and governance matters. He was first elected as a director of the Company in 2019.
Robert E. Brunner, age 67, was the Executive Vice President of Illinois Tool Works (ITW), a Fortune 250 global, multi-industrial manufacturer of advanced industrial technology, from 2006 until his retirement in 2012. He previously served ITW as President—Global Auto beginning in 2005 and President—North American Auto from 2003. Mr. Brunner holds a degree in finance from the University of Illinois and an MBA from Baldwin-Wallace University. Mr. Brunner currently serves as the independent Board Chair of Lindsay Corporation, a global manufacturer of irrigation equipment and road safety products, and previously served as a director of NN, Inc., a diversified industrial company that designs and manufactures high-precision components and assemblies on a global basis. Mr. Brunner’s experience and leadership with ITW, a diversified manufacturer with a global footprint, provides valuable insight to our Board on the automotive strategy, business development, mergers and acquisitions, operations, and international issues. He was first elected as a director of the Company in 2009.
Mary Campbell, age 57, served as President, vCommerce Ventures of Qurate Retail, Inc., from 2022 until her retirement at the end of 2023. Qurate Retail is comprised of a select group of retail brands including QVC, HSN, Ballard Designs, Frontgate, Garnet Hill, and Grandin Road and is a leader in video commerce, and a leader in mobile and social commerce. During her more than 20 years with the company, Ms. Campbell held various leadership positions across the Merchandising, Planning and Commerce Platforms functions. Most recently, and prior to her most recent position, she served as Chief Merchandising Officer of Qurate Retail Group and Chief Commerce Officer of QVC from 2018 to 2022, as Chief Merchandising and Interactive Officer in 2018, as Chief Interactive Experience Officer from 2017 to 2018, and as Executive Vice President, Commerce Platforms for QVC from 2014 to 2017. Ms. Campbell holds a bachelor’s degree in psychology from Central Connecticut State University. Ms. Campbell currently serves as a director of Kontoor Brands, Inc., a global lifestyle apparel company. Through her positions at QxH, Qurate Retail Group and QVC, Ms. Campbell has extensive knowledge in consumer driven product innovation, marketing and brand building, and traditional and new media platforms, as well as leading teams for long-term growth and evolution. She was first elected as a director of the Company in 2019.
Manuel A. Fernandez, age 78, co-founded SI Ventures, a venture capital firm focusing on IT and communications infrastructure, and has served as the managing director since 2000. Previously, he served as the Chairman, President and Chief Executive Officer at Gartner, Inc., a research and advisory company, from 1989 to 2000. Prior to Gartner, Mr. Fernandez was President and CEO of three technology-driven companies, including Dataquest, an information services company, Gavilan Computer Corporation, a laptop computer manufacturer, and Zilog Incorporated, a semiconductor manufacturer. Mr. Fernandez was the Executive Chairman of Sysco Corporation, a marketer and distributor of foodservice products, from 2012 until his retirement in 2013, having previously served as Non-executive Chairman since 2009 and as a director since 2006. Mr. Fernandez holds a degree in electrical engineering from the University of Florida and completed post-graduate work in solid-state engineering at the University of Florida. Mr. Fernandez currently serves as the lead independent director of Performance Food Group Company, a foodservice products distributor. He was previously the non-executive chairman of Brunswick Corporation, a market leader in the marine industry. Mr. Fernandez’ venture capital experience, leadership of several technology companies as CEO, and service on a number of public company boards, offers Leggett outstanding insight into corporate strategy and development, information technology, international growth, and corporate governance. He was first elected as a director of the Company in 2014.
Karl G. Glassman, age 66, served as the Company's President and Chief Executive Officer since May 2024, and as segment manager of Specialized Products on a temporary basis until February 2025. Mr. Glassman previously served as Executive Chairman of the Board from 2022 until his retirement in May 2023 and was first appointed Chairman of the Board in 2020. Mr. Glassman served as the Company’s Chief Executive Officer from 2016 to 2021, President from 2013 to 2019, Chief Operating Officer from 2006 to 2015, Executive Vice President from 2002 to 2013, President of the former Residential Furnishings segment from 1999 to 2006, Senior Vice President from 1999 to 2002, and in various capacities since 1982. Mr. Glassman holds a degree in business management and finance from California State University-Long Beach. As the Company's President and CEO with decades of experience in Leggett’s senior management team, Mr. Glassman offers exceptional knowledge of the Company’s operations, strategy, and governance, as well as
customers and end markets. Mr. Glassman also served on the Board of Directors of the National Association of Manufacturers through the end of 2022. He was first elected as a director of the Company in 2002.
Joseph W. McClanathan, age 72, served as President and Chief Executive Officer of the Household Products Division of Energizer Holdings, Inc., a manufacturer of portable power solutions, from 2007 through his retirement in 2012. Previously, he served Energizer as President and Chief Executive Officer of the Energizer Battery Division from 2004 to 2007, as President—North America from 2002 to 2004, and as Vice President—North America from 2000 to 2002. Mr. McClanathan holds a degree in management from Arizona State University. Mr. McClanathan currently serves as a director of Brunswick Corporation, a market leader in the marine industry. Through his leadership experience at Energizer and as a former director of the Retail Industry Leaders Association, Mr. McClanathan offers an exceptional perspective to the Board on manufacturing operations, marketing and development of international capabilities. He was first elected as a director of the Company in 2005.
Srikanth Padmanabhan, age 60, was appointed Executive Vice President and President, Operations, of Cummins Inc., a global manufacturer of engines and power solutions, in 2024. Cummins announced that Mr. Padmanabhan would retire from this role, effective April 4, 2025. He previously served as President of its Engine Business segment from 2016 to 2023, as Vice President—Engine Business from 2014 to 2016, Vice President and General Manager of Emission Solutions from 2008 to 2014, and in various other capacities since 1991. Mr. Padmanabhan holds a bachelor’s degree in mechanical engineering from the National Institute of Technology in Trichy, India, a Ph.D. in mechanical engineering from Iowa State University, and has completed the Advanced Management Program at Harvard Business School. With over 30 years at Cummins in a variety of leadership roles, Mr. Padmanabhan offers considerable knowledge of the automotive industry and the industrial sector. He brings extensive experience in managing operations, technology and innovation across a multi-billion-dollar global business. He has lived and worked in India, the United States, Mexico, and the United Kingdom. He was first elected as a director of the Company in 2018.
Jai Shah, age 58, serves as a Group President of Masco Corporation, a Fortune 500 global leader in the design, manufacture and distribution of branded home improvement and building products. In this position since 2018, Mr. Shah currently has responsibility for operating companies with leading brands in global decorative and rough plumbing in North America and previously headed Masco's platform of decorative architectural and wellness businesses. Mr. Shah is also responsible for Masco’s Corporate Strategic Planning activities. He previously served as President of Delta Faucet Company, a Masco business unit, from 2014 to 2018, as Vice President and Chief Human Resources Officer for Masco from 2012 to 2014, and in various capacities since 2003. Prior to Masco, Mr. Shah held a number of senior management positions at Diversey Corporation and served as Senior Auditor for KPMG Peat Marwick Chartered Accountants. Mr. Shah is a Certified Public Accountant and Chartered Professional Accountant (Canada) and holds an MBA from the University of Michigan, as well as bachelor’s and master’s degrees in accounting from the University of Waterloo in Ontario, Canada. Mr. Shah’s range of experience at Masco in a variety of operational, financial and corporate roles offers the Board a broad perspective on relevant issues facing global corporations, including growth strategy development and implementation, talent management, and adapting to e-business and market innovations. He was first elected as a director of the Company in 2019.
Phoebe A. Wood, age 71, has been a principal in CompaniesWood, a consulting firm specializing in early stage investments, since her 2008 retirement as Vice Chairman and Chief Financial Officer of Brown-Forman Corporation, a diversified consumer products manufacturer, where she had served since 2001. Ms. Wood previously held various positions at Atlantic Richfield Company, an oil and gas company, from 1976 to 2000. She has also served as Chief Executive Officer of KirtleyWood LLC, a board advisory firm, since January 2025. Ms. Wood holds a degree in psychology from Smith College and an MBA from UCLA. Ms. Wood is a director of Invesco, Ltd., an independent global investment manager, and PPL Corporation, a utility and energy services company. Ms. Wood previously served as a director of Pioneer Natural Resources, an independent oil and gas company, from 2013 to 2024. From her career in business and various directorships, Ms. Wood provides the Board with a wealth of understanding of the strategic, financial and accounting issues the Board addresses in its oversight role. She was first elected as a director of the Company in 2005.
The Supplemental Item in Part I on page 31, which includes a listing and description of the positions and offices held by the executive officers of the Company, is incorporated into this section by reference.
The Company has adopted a code of ethics that applies to its chief executive officer, chief financial officer, and chief accounting officer called the Financial Code of Ethics. The Company has also adopted a Code of Business Conduct and Ethics for directors, officers, and employees and Corporate Governance Guidelines. The Financial Code of Ethics, the Code of Business Conduct and Ethics, and the Corporate Governance Guidelines are available on the Company’s website at www.leggett.com/governance. Each of these documents is available in print to any person, without charge, upon request. Such requests may be made to the Company’s Secretary at Leggett & Platt, Incorporated, 1 Leggett Road, Carthage, Missouri 64836.
The Company intends to satisfy the disclosure requirement under Item 5.05 of Form 8-K by posting any applicable amendment to, or waiver from its Financial Code of Ethics, within four business days, on its website at www.leggett.com/governance for at least a 12-month period. We routinely post important information to our website. However, the Company’s website does not constitute part of this Annual Report on Form 10-K.
Insider Trading Policy and Procedures
The Company has adopted an Insider Trading Policy and procedures governing the purchase, sale, and/or other dispositions of the Company’s securities by directors, officers, and employees, and the Company itself, that we believe are reasonably designed to promote compliance with insider trading laws, rules and regulations, and applicable NYSE listing standards. The Company's Insider Trading Policy is included with this Annual Report on Form 10-K as Exhibit 19 and is incorporated herein by reference. Changes to Procedure for Identifying and Evaluating Director Candidates
On November 5, 2024, the Board of Directors (the “Board”) approved changes to the Company’s Procedure for Identifying and Evaluating Director Candidates (the “Procedure”) which applies, in part, to director nominees recommended by shareholders. The Procedure was amended to clarify that the Nominating, Governance and Sustainability Committee of the Board may consider the “applicability to the Company’s business and industry” when evaluating the potential director nominee's “accomplishments in his or her field.” The complete Procedure can be found at www.leggett.com/governance, under Leggett & Platt Governance, Director Nomination Procedure. The Leggett website does not constitute part of this Form 10-K filing.
Item 11. Executive Compensation.
The subsections titled “Board’s Oversight of Risk Management,” “Director Compensation,” together with the entire section titled “Executive Compensation and Related Matters” in the Company’s definitive Proxy Statement for the Company’s Annual Meeting of Shareholders to be held on May 7, 2025, are incorporated by reference. No Human Resources and Compensation Committee member had an interlocking relationship as described in Item 407(e)(4) of Regulation S-K.
Item 12. Security Ownership of Certain Beneficial Owners and Management and Related Stockholder Matters.
The entire sections titled “Security Ownership” and “Equity Compensation Plan Information” in the Company’s definitive Proxy Statement for the Company’s Annual Meeting of Shareholders to be held on May 7, 2025, are incorporated by reference.
Item 13. Certain Relationships and Related Transactions, and Director Independence.
The subsections titled “PROPOSAL ONE: Election of Directors,” “Transactions with Related Persons,” “Director Independence and Board Service,” and “Board and Committee Composition and Meetings” in the Company’s definitive Proxy Statement for the Company’s Annual Meeting of Shareholders to be held on May 7, 2025, are incorporated by reference.
Item 14. Principal Accountant Fees and Services.
The subsections titled “Audit and Non-Audit Fees” and “Pre-Approval Procedures for Audit and Non-Audit Services” in the Company’s definitive Proxy Statement for the Company’s Annual Meeting of Shareholders to be held on May 7, 2025, are incorporated by reference.
PART IV
Item 15. Exhibits and Financial Statement Schedules.
(a) Financial Statements and Financial Statement Schedule.
The Reports, Financial Statements and Notes, and Financial Statement Schedule listed below are included in this Form 10-K:
We have omitted other information schedules because the information is inapplicable, not required, or in the financial statements or notes.
We did not file other long-term debt instruments because the total amount of securities authorized under all of these instruments does not exceed ten percent of the total assets of the Company and its subsidiaries on a consolidated basis. We agree to furnish a copy of such instruments to the SEC upon request.
Management’s Annual Report on Internal Control Over Financial Reporting
Management of Leggett & Platt, Incorporated is responsible for establishing and maintaining adequate internal control over financial reporting as defined in Exchange Act Rule 13a-15(f). Leggett & Platt’s internal control over financial reporting is a process designed to provide reasonable assurance regarding the reliability of financial reporting and the preparation of financial statements for external purposes in accordance with accounting principles generally accepted in the United States of America. The Company’s internal control over financial reporting includes those policies and procedures that:
•Pertain to the maintenance of records that, in reasonable detail, accurately and fairly reflect the transactions and dispositions of the assets of Leggett & Platt;
•Provide reasonable assurance that transactions are recorded as necessary to permit preparation of financial statements in accordance with accounting principles generally accepted in the United States of America, and that receipts and expenditures of Leggett & Platt are being made only in accordance with authorizations of management and directors of Leggett & Platt; and
•Provide reasonable assurance regarding prevention or timely detection of unauthorized acquisition, use, or disposition of Leggett & Platt assets that could have a material effect on the financial statements.
Because of its inherent limitations, internal control over financial reporting may not prevent or detect misstatements. Also, projections of any evaluation of effectiveness to future periods are subject to the risk that controls may become inadequate because of changes in conditions, or that the degree of compliance with the policies or procedures may deteriorate.
Under the supervision and with the participation of management (including ourselves), we conducted an evaluation of the effectiveness of Leggett & Platt’s internal control over financial reporting, as of December 31, 2024, based on the criteria in Internal Control—Integrated Framework (2013) issued by the Committee of Sponsoring Organizations of the Treadway Commission. Based on the evaluation under this framework, we concluded that Leggett & Platt’s internal control over financial reporting was effective as of December 31, 2024.
Leggett & Platt’s internal control over financial reporting, as of December 31, 2024, has been audited by PricewaterhouseCoopers LLP, an independent registered public accounting firm, as stated in their report appearing on page 74 of this Form 10-K.
| | | | | | | | |
| /s/ KARL G. GLASSMAN | | /s/ BENJAMIN M. BURNS |
Karl G. Glassman
President and Chief Executive Officer | | Benjamin M. Burns
Executive Vice President and Chief Financial Officer |
| | |
| February 26, 2025 | | February 26, 2025 |
Report of Independent Registered Public Accounting Firm
To the Board of Directors and Shareholders of Leggett & Platt, Incorporated
Opinions on the Financial Statements and Internal Control over Financial Reporting
We have audited the accompanying consolidated balance sheets of Leggett & Platt, Incorporated and its subsidiaries (the "Company") as of December 31, 2024 and 2023, and the related consolidated statements of operations, of comprehensive income (loss), of changes in equity and of cash flows for each of the three years in the period ended December 31, 2024, including the related notes and financial statement schedule listed in the index appearing under Item 15 (collectively referred to as the "consolidated financial statements"). We also have audited the Company's internal control over financial reporting as of December 31, 2024, based on criteria established in Internal Control - Integrated Framework (2013) issued by the Committee of Sponsoring Organizations of the Treadway Commission (COSO).
In our opinion, the consolidated financial statements referred to above present fairly, in all material respects, the financial position of the Company as of December 31, 2024 and 2023, and the results of its operations and its cash flows for each of the three years in the period ended December 31, 2024 in conformity with accounting principles generally accepted in the United States of America. Also in our opinion, the Company maintained, in all material respects, effective internal control over financial reporting as of December 31, 2024, based on criteria established in Internal Control - Integrated Framework (2013) issued by the COSO.
Basis for Opinions
The Company's management is responsible for these consolidated financial statements, for maintaining effective internal control over financial reporting, and for its assessment of the effectiveness of internal control over financial reporting, included in Management’s Annual Report on Internal Control over Financial Reporting appearing under Item 15. Our responsibility is to express opinions on the Company’s consolidated financial statements and on the Company's internal control over financial reporting based on our audits. We are a public accounting firm registered with the Public Company Accounting Oversight Board (United States) (PCAOB) and are required to be independent with respect to the Company in accordance with the U.S. federal securities laws and the applicable rules and regulations of the Securities and Exchange Commission and the PCAOB.
We conducted our audits in accordance with the standards of the PCAOB. Those standards require that we plan and perform the audits to obtain reasonable assurance about whether the consolidated financial statements are free of material misstatement, whether due to error or fraud, and whether effective internal control over financial reporting was maintained in all material respects.
Our audits of the consolidated financial statements included performing procedures to assess the risks of material misstatement of the consolidated financial statements, whether due to error or fraud, and performing procedures that respond to those risks. Such procedures included examining, on a test basis, evidence regarding the amounts and disclosures in the consolidated financial statements. Our audits also included evaluating the accounting principles used and significant estimates made by management, as well as evaluating the overall presentation of the consolidated financial statements. Our audit of internal control over financial reporting included obtaining an understanding of internal control over financial reporting, assessing the risk that a material weakness exists, and testing and evaluating the design and operating effectiveness of internal control based on the assessed risk. Our audits also included performing such other procedures as we considered necessary in the circumstances. We believe that our audits provide a reasonable basis for our opinions.
Definition and Limitations of Internal Control over Financial Reporting
A company’s internal control over financial reporting is a process designed to provide reasonable assurance regarding the reliability of financial reporting and the preparation of financial statements for external purposes in accordance with generally accepted accounting principles. A company’s internal control over financial reporting includes those policies and procedures that (i) pertain to the maintenance of records that, in reasonable detail, accurately and fairly reflect the transactions and dispositions of the assets of the company; (ii) provide reasonable assurance that transactions are recorded as necessary to permit preparation of financial statements in accordance with generally accepted accounting principles, and that receipts and expenditures of the company are being made only in accordance with authorizations of management and directors of the company; and (iii) provide reasonable assurance regarding prevention or timely detection of unauthorized
acquisition, use, or disposition of the company’s assets that could have a material effect on the financial statements.
Because of its inherent limitations, internal control over financial reporting may not prevent or detect misstatements. Also, projections of any evaluation of effectiveness to future periods are subject to the risk that controls may become inadequate because of changes in conditions, or that the degree of compliance with the policies or procedures may deteriorate.
Critical Audit Matters
The critical audit matter communicated below is a matter arising from the current period audit of the consolidated financial statements that was communicated or required to be communicated to the audit committee and that (i) relates to accounts or disclosures that are material to the consolidated financial statements and (ii) involved our especially challenging, subjective, or complex judgments. The communication of critical audit matters does not alter in any way our opinion on the consolidated financial statements, taken as a whole, and we are not, by communicating the critical audit matter below, providing a separate opinion on the critical audit matter or on the accounts or disclosures to which it relates.
Annual Goodwill Impairment Assessments – Bedding and Work Furniture Reporting Units
As described in Notes A, F, and G to the consolidated financial statements, the Company’s consolidated net goodwill balance was $794.4 million as of December 31, 2024, and the goodwill associated with the Bedding and Work Furniture reporting units was $310.0 million and $53.6 million, respectively. The current year goodwill impairment charge associated with the Bedding and Work Furniture reporting units was $587.9 million and $44.5 million, respectively. Management assesses goodwill for impairment annually in the second quarter and as triggering events may occur. An impairment charge is recognized for the amount by which the carrying amount exceeds the reporting unit's fair value, up to the total amount of goodwill for the reporting unit. Fair value of the reporting units is determined by management using a combination of two valuation methods, a market approach and an income approach. The market approach estimates fair value by first determining price-to-earnings ratios for comparable publicly traded companies with similar characteristics of the reporting unit and applying the ratios to the projected earnings of the reporting unit. The income approach is based on projected future (debt-free) cash flow that is discounted to present value using factors that consider the timing and risk of future cash flows. Discounted cash flow projections are based on 5-year financial forecasts developed from operating plans and economic projections, sales growth, estimates of future expected changes in operating margins, a discount rate, terminal value growth rates, future capital expenditures and changes in working capital requirements.
The principal considerations for our determination that performing procedures relating to the annual goodwill impairment assessments of the Bedding and Work Furniture reporting units is a critical audit matter are (i) the significant judgment by management when developing the fair value estimates of the reporting units; (ii) a high degree of auditor judgment, subjectivity, and effort in performing procedures and evaluating management’s significant assumptions related to (a) sales growth, estimates of future expected changes in operating margins, and discount rates used in the income approach for the Bedding and Work Furniture reporting units, (b) terminal value growth rate used in the income approach for the Bedding reporting unit, and (c) price-to-earnings ratios used in the market approach for the Bedding and Work Furniture reporting units; and (iii) the audit effort involved the use of professionals with specialized skill and knowledge.
Addressing the matter involved performing procedures and evaluating audit evidence in connection with forming our overall opinion on the consolidated financial statements. These procedures included testing the effectiveness of controls relating to management’s annual goodwill impairment assessments, including controls over the valuation of the Bedding and Work Furniture reporting units. These procedures also included, among others, (i) testing management's process for developing the fair value estimates of the reporting units; (ii) evaluating the appropriateness of the income and market valuation approaches used by management; (iii) testing the completeness and accuracy of underlying data used in the valuation approaches; and (iv) evaluating the reasonableness of the significant assumptions used by management related to sales growth, estimates of future expected changes in operating margins, discount rates, terminal value growth rate, and price-to-earnings ratios, as applicable to the reporting units. Evaluating management’s assumptions related to sales growth and estimates of future expected changes in operating margins involved evaluating whether the assumptions used by management were reasonable considering (i) the past and present performance of the reporting units; (ii) the consistency with external market and industry data; and (iii) whether the assumptions were consistent with
evidence obtained in other areas of the audit. Professionals with specialized skill and knowledge were used to assist in evaluating (i) the appropriateness of the Company’s valuation approaches and (ii) the reasonableness of the discount rates, terminal value growth rate, and price-to-earnings ratios, as applicable to the reporting units.
/s/ PricewaterhouseCoopers LLP
St. Louis, Missouri
February 26, 2025
We have served as the Company’s auditor since 1991.
LEGGETT & PLATT, INCORPORATED
Consolidated Balance Sheets | | | | | | | | | | | |
| | December 31, |
| (Amounts in millions, except per share data) | 2024 | | 2023 |
| ASSETS | | | |
| Current Assets | | | |
| Cash and cash equivalents | $ | 350.2 | | | $ | 365.5 | |
| Trade receivables, net | 503.0 | | | 564.9 | |
| Other receivables, net | 56.4 | | | 72.4 | |
| Inventories | 722.6 | | | 819.7 | |
| Prepaid expenses and other current assets | 58.3 | | | 58.9 | |
| | | |
| Total current assets | 1,690.5 | | | 1,881.4 | |
| Property, Plant and Equipment—at cost | | | |
| Machinery and equipment | 1,466.3 | | | 1,488.3 | |
| Buildings and other | 780.6 | | | 820.3 | |
| Land | 39.0 | | | 42.8 | |
| Total property, plant and equipment | 2,285.9 | | | 2,351.4 | |
| Less accumulated depreciation | 1,561.5 | | | 1,570.2 | |
| Net property, plant and equipment | 724.4 | | | 781.2 | |
| Other Assets | | | |
| Goodwill | 794.4 | | | 1,489.8 | |
| Other intangibles, net | 140.4 | | | 167.5 | |
| Operating lease right-of-use assets | 175.7 | | | 193.2 | |
| Sundry | 136.2 | | | 121.4 | |
| Total other assets | 1,246.7 | | | 1,971.9 | |
| TOTAL ASSETS | $ | 3,661.6 | | | $ | 4,634.5 | |
| LIABILITIES AND EQUITY | | | |
| Current Liabilities | | | |
| Current maturities of long-term debt and short-term debt | $ | 1.3 | | | $ | 308.0 | |
| Current portion of operating lease liabilities | 53.4 | | | 57.3 | |
| Accounts payable | 497.7 | | | 536.2 | |
| Accrued expenses | 242.2 | | | 256.8 | |
| Other current liabilities | 51.8 | | | 104.3 | |
| Total current liabilities | 846.4 | | | 1,262.6 | |
| Long-term Liabilities | | | |
| Long-term debt | 1,862.8 | | | 1,679.6 | |
| Operating lease liabilities | 131.1 | | | 150.5 | |
| Other long-term liabilities | 82.2 | | | 106.6 | |
| Deferred income taxes | 48.9 | | | 101.2 | |
| Total long-term liabilities | 2,125.0 | | | 2,037.9 | |
| Commitments and Contingencies | | | |
| Equity | | | |
| Common stock—authorized, 600.0 shares of $.01 par value; 198.8 shares issued; Preferred stock—authorized, 100.0 shares; none issued | 2.0 | | | 2.0 | |
| Additional contributed capital | 568.7 | | | 575.8 | |
| Retained earnings | 2,064.5 | | | 2,661.1 | |
| Accumulated other comprehensive loss | (115.8) | | | (43.7) | |
| Less treasury stock—at cost (64.4 and 65.4 shares at December 31, 2024 and 2023, respectively) | (1,830.0) | | | (1,861.9) | |
| Total Leggett & Platt, Inc. equity | 689.4 | | | 1,333.3 | |
| Noncontrolling interest | .8 | | | .7 | |
| Total equity | 690.2 | | | 1,334.0 | |
| TOTAL LIABILITIES AND EQUITY | $ | 3,661.6 | | | $ | 4,634.5 | |
The accompanying notes are an integral part of these consolidated financial statements.
LEGGETT & PLATT, INCORPORATED
Consolidated Statements of Operations
| | | | | | | | | | | | | | | | | |
| | | | | |
| | Year Ended December 31, |
| (Amounts in millions, except per share data) | 2024 | | 2023 | | 2022 |
| Net trade sales | $ | 4,383.6 | | | $ | 4,725.3 | | | $ | 5,146.7 | |
| Cost of goods sold | 3,634.5 | | | 3,871.5 | | | 4,169.9 | |
| Gross profit | 749.1 | | | 853.8 | | | 976.8 | |
| Selling and administrative expenses | 508.8 | | | 465.4 | | | 427.3 | |
| Amortization of intangibles | 22.0 | | | 69.0 | | | 66.8 | |
| Goodwill impairment | 676.0 | | | — | | | — | |
| Long-lived asset impairment | 6.3 | | | 443.7 | | | — | |
| Net gain from disposal of assets and businesses | (35.6) | | | (20.1) | | | (2.5) | |
| Other expense (income), net | 1.5 | | | (13.8) | | | .2 | |
| Earnings (loss) before interest and income taxes | (429.9) | | | (90.4) | | | 485.0 | |
| Interest expense | 85.9 | | | 88.4 | | | 85.5 | |
| Interest income | 6.6 | | | 5.4 | | | 4.1 | |
| Earnings (loss) before income taxes | (509.2) | | | (173.4) | | | 403.6 | |
| Income taxes | 2.2 | | | (36.6) | | | 93.7 | |
| | | | | |
| | | | | |
| Net earnings (loss) | (511.4) | | | (136.8) | | | 309.9 | |
| Earnings attributable to noncontrolling interest, net of tax | (.1) | | | — | | | (.1) | |
| Net earnings (loss) attributable to Leggett & Platt, Inc. common shareholders | $ | (511.5) | | | $ | (136.8) | | | $ | 309.8 | |
| | | | | |
| | | | | |
| | | | | |
| | | | | |
| | | | | |
| | | | | |
| Net earnings (loss) per share attributable to Leggett & Platt, Inc. common shareholders | | | | | |
| Basic | $ | (3.73) | | | $ | (1.00) | | | $ | 2.28 | |
| Diluted | $ | (3.73) | | | $ | (1.00) | | | $ | 2.27 | |
The accompanying notes are an integral part of these consolidated financial statements.
LEGGETT & PLATT, INCORPORATED
Consolidated Statements of Comprehensive Income (Loss)
| | | | | | | | | | | | | | | | | |
| | Year Ended December 31, |
| (Amounts in millions) | 2024 | | 2023 | | 2022 |
| Net earnings (loss) | $ | (511.4) | | | $ | (136.8) | | | $ | 309.9 | |
| Other comprehensive income (loss), net of tax: | | | | | |
| Foreign currency translation adjustments | (73.2) | | | 40.9 | | | (71.8) | |
| Cash flow hedges | (5.3) | | | 4.1 | | | (3.5) | |
| Defined benefit pension plans | 6.4 | | | 4.8 | | | 20.1 | |
| Other comprehensive income (loss), net of tax | (72.1) | | | 49.8 | | | (55.2) | |
| Comprehensive income (loss) | (583.5) | | | (87.0) | | | 254.7 | |
| Less: comprehensive income attributable to noncontrolling interest | (.1) | | | — | | | (.1) | |
| Comprehensive income (loss) attributable to Leggett & Platt, Inc. | $ | (583.6) | | | $ | (87.0) | | | $ | 254.6 | |
The accompanying notes are an integral part of these consolidated financial statements.
LEGGETT & PLATT, INCORPORATED
Consolidated Statements of Cash Flows | | | | | | | | | | | | | | | | | |
| | Year Ended December 31, |
| (Amounts in millions) | 2024 | | 2023 | | 2022 |
| Operating Activities | | | | | |
| Net earnings (loss) | $ | (511.4) | | | $ | (136.8) | | | $ | 309.9 | |
| Adjustments to reconcile net earnings to net cash provided by operating activities: | | | | | |
| Depreciation | 112.4 | | | 108.9 | | | 110.2 | |
| Amortization of intangibles and supply agreements | 23.6 | | | 71.0 | | | 69.6 | |
| Long-lived asset impairment | 6.3 | | | 443.7 | | | — | |
| Goodwill impairment | 676.0 | | | — | | | — | |
| Increase (decrease) in provision for losses on accounts and notes receivable | 6.3 | | | (6.5) | | | 3.2 | |
| Write-down of inventories | 35.7 | | | 9.0 | | | 17.1 | |
| Net gain from disposal of assets and businesses | (35.6) | | | (20.1) | | | (2.5) | |
| | | | | |
| Deferred income tax benefit | (58.0) | | | (129.2) | | | (15.7) | |
| Stock-based compensation | 26.5 | | | 27.6 | | | 30.1 | |
| | | | | |
| | | | | |
| | | | | |
| Other, net | (6.1) | | | 13.6 | | | (2.5) | |
| Changes in working capital, excluding effects from acquisitions and divestitures: | | | | | |
| Accounts and other receivables | 42.5 | | | 48.6 | | | (26.6) | |
| Inventories | 44.7 | | | 86.5 | | | 96.1 | |
| Other current assets | 3.6 | | | 4.0 | | | (3.7) | |
| Accounts payable | (27.9) | | | 13.7 | | | (102.1) | |
| Accrued expenses and other current liabilities | (32.9) | | | (36.8) | | | (41.7) | |
| Net Cash Provided by Operating Activities | 305.7 | | | 497.2 | | | 441.4 | |
| Investing Activities | | | | | |
| Additions to property, plant and equipment | (81.6) | | | (113.8) | | | (100.3) | |
| Purchases of companies, net of cash acquired | — | | | — | | | (83.3) | |
| Proceeds from sales of assets and businesses | 47.0 | | | 23.4 | | | 4.2 | |
| | | | | |
| | | | | |
| Other, net | (2.0) | | | (.9) | | | (1.8) | |
| Net Cash Used for Investing Activities | (36.6) | | | (91.3) | | | (181.2) | |
| Financing Activities | | | | | |
| Additions to long-term debt | — | | | .7 | | | 4.7 | |
| Payments on long-term debt | (300.1) | | | (2.0) | | | (301.5) | |
| Change in commercial paper and short-term debt | 174.2 | | | (105.8) | | | 301.8 | |
| Dividends paid | (136.3) | | | (239.4) | | | (229.2) | |
| | | | | |
| Purchases of common stock | (4.9) | | | (6.0) | | | (60.3) | |
| | | | | |
| | | | | |
| | | | | |
| | | | | |
| Other, net | (2.9) | | | (6.3) | | | (1.7) | |
| Net Cash Used for Financing Activities | (270.0) | | | (358.8) | | | (286.2) | |
| Effect of Exchange Rate Changes on Cash | (14.4) | | | 1.9 | | | (19.2) | |
| (Decrease) Increase in Cash and Cash Equivalents | (15.3) | | | 49.0 | | | (45.2) | |
| Cash and Cash Equivalents—Beginning of Year | 365.5 | | | 316.5 | | | 361.7 | |
| Cash and Cash Equivalents—End of Year | $ | 350.2 | | | $ | 365.5 | | | $ | 316.5 | |
| Supplemental Information | | | | | |
| Interest paid (net of amounts capitalized) | $ | 84.9 | | | $ | 85.8 | | | $ | 84.0 | |
| Income taxes paid | 82.4 | | | 98.8 | | | 125.2 | |
| | | | | |
| Property, plant and equipment acquired through finance leases | 1.1 | | | 1.4 | | | 1.4 | |
| Capital expenditures in accounts payable | 4.7 | | | 3.2 | | | 3.6 | |
| Prepaid income taxes and taxes receivable applied against the deemed repatriation tax liability | 11.9 | | | 9.5 | | | 6.1 | |
| | | | | |
The accompanying notes are an integral part of these consolidated financial statements.
LEGGETT & PLATT, INCORPORATED
Consolidated Statements of Changes in Equity
| | | | | | | | | | | | | | | | | | | | | | | | | | | | | | | | | | | | | | | | | | | | | | | | | | | | | |
| (Amounts in millions, except per share data) | Common Stock | | Additional
Contributed
Capital | | Retained
Earnings | | Accumulated
Other
Comprehensive
Income (Loss) | | Treasury Stock | | Non-
controlling
Interest | | Total
Equity |
| Shares | | Amount | | Shares | | Amount | |
| Balance, December 31, 2021 | 198.8 | | | $ | 2.0 | | | $ | 557.9 | | | $ | 2,973.0 | | | $ | (38.3) | | | (65.4) | | | $ | (1,846.6) | | | $ | .6 | | | $ | 1,648.6 | |
| | | | | | | | | | | | | | | | | |
| | | | | | | | | | | | | | | | | |
| Net earnings (loss) attributable to Leggett & Platt, Inc. common shareholders | — | | | — | | | — | | | 309.8 | | | — | | | — | | | — | | | .1 | | | 309.9 | |
| | | | | | | | | | | | | | | | | |
| Dividends declared | — | | | — | | | 5.3 | | | (236.8) | | | — | | | — | | | — | | | — | | | (231.5) | |
| | | | | | | | | | | | | | | | | |
| Treasury stock purchased | — | | | — | | | — | | | — | | | — | | | (1.7) | | | (60.3) | | | — | | | (60.3) | |
| Treasury stock issued | — | | | — | | | (15.2) | | | — | | | — | | | .9 | | | 24.6 | | | — | | | 9.4 | |
Other comprehensive income (loss), net of tax (See Note P) | — | | | — | | | — | | | — | | | (55.2) | | | — | | | — | | | — | | | (55.2) | |
| | | | | | | | | | | | | | | | | |
| | | | | | | | | | | | | | | | | |
| Stock-based compensation, net of tax | — | | | — | | | 20.5 | | | — | | | — | | | — | | | — | | | — | | | 20.5 | |
| | | | | | | | | | | | | | | | | |
| | | | | | | | | | | | | | | | | |
| Balance, December 31, 2022 | 198.8 | | | $ | 2.0 | | | $ | 568.5 | | | $ | 3,046.0 | | | $ | (93.5) | | | (66.2) | | | $ | (1,882.3) | | | $ | .7 | | | $ | 1,641.4 | |
| | | | | | | | | | | | | | | | | |
| | | | | | | | | | | | | | | | | |
| Net earnings (loss) attributable to Leggett & Platt, Inc. common shareholders | — | | | — | | | — | | | (136.8) | | | — | | | — | | | — | | | — | | | (136.8) | |
| | | | | | | | | | | | | | | | | |
| Dividends declared | — | | | — | | | 5.7 | | | (248.1) | | | — | | | — | | | — | | | — | | | (242.4) | |
| | | | | | | | | | | | | | | | | |
| Treasury stock purchased | — | | | — | | | — | | | — | | | — | | | (.2) | | | (6.4) | | | — | | | (6.4) | |
| Treasury stock issued | — | | | — | | | (21.1) | | | — | | | — | | | 1.0 | | | 26.8 | | | — | | | 5.7 | |
Other comprehensive income (loss), net of tax (See Note P) | — | | | — | | | — | | | — | | | 49.8 | | | — | | | — | | | — | | | 49.8 | |
| | | | | | | | | | | | | | | | | |
| | | | | | | | | | | | | | | | | |
| Stock-based compensation, net of tax | — | | | — | | | 22.7 | | | — | | | — | | | — | | | — | | | — | | | 22.7 | |
| | | | | | | | | | | | | | | | | |
| | | | | | | | | | | | | | | | | |
| Balance, December 31, 2023 | 198.8 | | | $ | 2.0 | | | $ | 575.8 | | | $ | 2,661.1 | | | $ | (43.7) | | | (65.4) | | | $ | (1,861.9) | | | $ | .7 | | | $ | 1,334.0 | |
| | | | | | | | | | | | | | | | | |
| | | | | | | | | | | | | | | | | |
| Net earnings (loss) attributable to Leggett & Platt, Inc. common shareholders | — | | | — | | | — | | | (511.5) | | | — | | | — | | | — | | | .1 | | | (511.4) | |
| | | | | | | | | | | | | | | | | |
| Dividends declared | — | | | — | | | 3.4 | | | (85.1) | | | — | | | — | | | — | | | — | | | (81.7) | |
| | | | | | | | | | | | | | | | | |
| Treasury stock purchased | — | | | — | | | — | | | — | | | — | | | (.3) | | | (4.9) | | | — | | | (4.9) | |
| Treasury stock issued | — | | | — | | | (32.0) | | | — | | | — | | | 1.3 | | | 36.8 | | | — | | | 4.8 | |
Other comprehensive income (loss), net of tax (See Note P) | — | | | — | | | — | | | — | | | (72.1) | | | — | | | — | | | — | | | (72.1) | |
| | | | | | | | | | | | | | | | | |
| | | | | | | | | | | | | | | | | |
| Stock-based compensation, net of tax | — | | | — | | | 21.5 | | | — | | | — | | | — | | | — | | | — | | | 21.5 | |
| | | | | | | | | | | | | | | | | |
| | | | | | | | | | | | | | | | | |
| Balance, December 31, 2024 | 198.8 | | | $ | 2.0 | | | $ | 568.7 | | | $ | 2,064.5 | | | $ | (115.8) | | | (64.4) | | | $ | (1,830.0) | | | $ | .8 | | | $ | 690.2 | |
The accompanying notes are an integral part of these consolidated financial statements.
LEGGETT & PLATT, INCORPORATED
Notes to Consolidated Financial Statements
(Dollar amounts in millions, except per share data)
December 31, 2024, 2023 and 2022
A—Summary of Significant Accounting Policies
PRINCIPLES OF CONSOLIDATION: The consolidated financial statements include the accounts of Leggett & Platt, Incorporated and its subsidiaries (“we” or “our”). Management does not expect foreign exchange restrictions to significantly impact the ultimate realization of amounts consolidated in the accompanying financial statements for subsidiaries located outside the United States. All intercompany transactions and accounts have been eliminated in consolidation.
ESTIMATES: The preparation of financial statements in conformity with generally accepted accounting principles in the United States of America ("GAAP") requires management to make estimates and assumptions that affect the reported amounts of assets, liabilities, revenues, and expenses and the accrual and disclosure of loss contingencies.
CASH EQUIVALENTS: Cash equivalents include cash in excess of daily requirements, which is invested in various financial instruments with original maturities of three months or less. Restricted cash was less than $6.0 in the years presented and was primarily related to restricted deposits against a short-term borrowing arrangement of a foreign entity.
TRADE AND OTHER RECEIVABLES AND ALLOWANCE FOR DOUBTFUL ACCOUNTS: Trade receivables are recorded at the invoiced amount and generally do not bear interest. Credit is also occasionally extended in the form of a note receivable to facilitate our customers’ operating cycles. Other notes receivable are established in special circumstances, such as in partial payment for the sale of a business or to support other business opportunities. Other notes receivable generally bear interest at market rates commensurate with the corresponding credit risk on the date of origination.
We participate in trade receivables sales programs in combination with third-party banking institutions and certain customers. Under each of these programs, we sell our entire interest in the trade receivable for 100% of face value, less a discount. Because control of the sold receivable is transferred to the buyer at the time of sale, accounts receivable balances sold are removed from the Consolidated Balance Sheets and the related proceeds are reported as cash provided by operating activities in the Consolidated Statements of Cash Flows. We had approximately $45.0 and $60.0 of trade receivables that were sold and removed from our Consolidated Balance Sheets at December 31, 2024 and 2023, respectively.
The above items encompass multiple individual programs that are utilized as tools in our cash flow management, and we offer them as options to facilitate customer operating cycles. Because many of these programs operate independently, and a cessation of all these programs at the same time is not reasonably likely, we do not expect changes in these programs to have a material impact on our operating cash flows or liquidity.
The allowance for doubtful accounts is an estimate of the amount of probable credit losses. Allowances and nonaccrual status designations are determined by individual account reviews by management and are based on several factors, such as the length of time that receivables were past due, the financial health of the companies involved, industry and macroeconomic considerations, and historical loss experience. We also utilize a pool approach to group our receivables with similar risk characteristics. Our pools correspond with our business units, which generally have similar terms, industry-specific conditions, and historical or expected loss patterns. Reserves are established for each pool based on their level of risk exposure. When credit deterioration occurs on a specific customer within a pool, we evaluate the receivable separately to estimate the expected credit loss, based on the specific risk characteristics. A qualitative reserve is also established for any current macroeconomic conditions or reasonable and supportable forecasts that could impact the expected collectability of all or a portion of our receivables portfolio.
Account balances are charged against the allowance when it is probable the receivable will not be recovered. Interest income is not recognized for nonperforming accounts that are placed on nonaccrual status. For accounts on nonaccrual status, any interest payments received are applied against the balance of the nonaccrual account.
ACCOUNTS PAYABLE: Accounts payable are recorded at the invoiced amount for services at the time they are rendered and for inventory based on the delivery terms of the purchase. We occasionally utilize third-party programs that allow our suppliers to be paid earlier at a discount or for a fee. While these programs assist us in negotiating payment terms with our suppliers, we continue to make payments based on our customary terms. A supplier can elect to take payment from a third party earlier with a discount, and in that case, we pay the third party on the original due date of the invoice. Contracts with our suppliers are negotiated independently of supplier participation in the programs, and we cannot increase payment terms pursuant to the programs. The accounts payable settled through the third-party programs, which remain on our Consolidated Balance Sheets, were approximately $120.0 and $105.0 at December 31, 2024 and 2023, respectively.
Presented below are the approximate outstanding obligations confirmed as valid under the supplier finance program for the year ending December 31, 2024:
| | | | | | | |
| December 31, 2024 | | |
| Confirmed obligations outstanding at the beginning of the year | $ | 105.0 | | | |
| Invoices confirmed during the year | 510.0 | | | |
| Confirmed invoices paid during the year | (495.0) | | | |
| | | |
| Confirmed obligations outstanding at the end of the year | $ | 120.0 | | | |
While we utilize the above programs as tools in our cash flow management and offer them as options to facilitate vendor operating cycles, if there were to be a cessation of these programs, we do not expect it would materially impact our operating cash flows or liquidity.
INVENTORIES:
The following table recaps the components of inventory for each period presented:
| | | | | | | | | | | |
| December 31, 2024 | | December 31, 2023 |
| Finished goods | $ | 321.6 | | | $ | 361.3 | |
| Work in process | 72.1 | | | 73.5 | |
| Raw materials and supplies | 328.9 | | | 384.9 | |
| | | |
| Inventories | $ | 722.6 | | | $ | 819.7 | |
All inventories are stated at the lower of cost or net realizable value. For the majority of our inventories, we use the first-in, first-out method which is representative of our standard costs (includes materials, labor, and production overhead at normal production capacity). Remaining inventories are valued using an average-cost method. Inventories are reviewed at least quarterly for slow-moving and potentially obsolete items using actual inventory turnover and, if necessary, are written down to estimated net realizable value.
LOSS CONTINGENCIES: Loss contingencies are accrued when a loss is probable and reasonably estimable. If a range of outcomes is possible, the most likely outcome is used to accrue these costs. If no outcome is more likely, we accrue at the minimum amount of the range. Any insurance recovery is recorded separately if it is determined that a recovery is probable. Legal fees are accrued when incurred.
ACQUISITIONS: When acquisitions occur, we value the assets acquired, liabilities assumed, and any noncontrolling interest in acquired companies at estimated acquisition-date fair values. Goodwill is measured as the excess amount of consideration transferred, compared to fair value of the assets acquired and the liabilities assumed. While we use our best estimates and assumptions to accurately value these items at the acquisition date (as well as contingent consideration, where applicable), our estimates are inherently uncertain and subject to refinement during the measurement period, which may be up to one year from the acquisition date.
We utilize the following methodologies in determining fair value:
•Inventory is valued at current replacement cost for raw materials, with a step-up for work in process and finished goods items that reflects the amount of ultimate profit earned as of the valuation date.
•Other working capital items are generally recorded at carrying value, unless there are known conditions that would impact the ultimate settlement amount of the particular item.
•Buildings and machinery are valued at an estimated replacement cost for an asset of comparable age and condition. Market pricing of comparable assets is used to estimate replacement cost where available.
•The most common identified intangible assets are customer relationships, technology, trademarks, and trade names. Discount rates discussed below are typically derived from a weighted-average cost of capital analysis and adjusted to reflect inherent risks.
◦Customer relationships are valued using an excess earnings method with various inputs, such as the estimated customer attrition rate, revenue growth rate, operating margins, the amount of contributory asset charges, and an appropriate discount rate. The economic useful life is determined based on historical customer turnover rates.
◦Technology, trademarks, and trade names are typically valued using a relief-from-royalty method with various inputs, such as comparable market royalty rates for items of similar value, future earnings forecast, an appropriate discount rate, and a replacement rate for technology. The economic useful life is determined based on the expected life of the technology, trademarks, and trade names.
PROPERTY, PLANT AND EQUIPMENT: Property, plant and equipment is stated at cost, less accumulated depreciation, and depreciated using the straight-line method over the estimated useful lives. Salvage value, if any, is assumed to be minimal. Accelerated methods are used for tax purposes. These assets are reviewed for recoverability as discussed below in Long-Lived Assets Impairment Evaluation.
| | | | | | | | | | | |
| | Useful Life Range | | Weighted Average Life |
| Machinery and equipment | 5-30 years | | 13 years |
| Buildings | 4-40 years | | 24 years |
| Other items | 5-15 years | | 12 years |
LEASES: At the inception of a contract, we assess whether a contract is, or contains, a lease. Our assessment is based on whether the contract involves the use of a distinct identified asset, whether we obtain the right to substantially all the economic benefit of the asset, and whether we have the right to direct the use of the asset.
Where renewal or termination options are reasonably likely to be exercised, we recognize the option as part of the right-of-use asset and lease liability. Leases with an initial term of 12 months or less are not recorded on the balance sheet; we recognize lease expense for these leases on a straight-line basis over the lease term.
As most of our leases do not provide an implicit rate, we use our incremental borrowing rate in determining the present value of the lease payments. We apply a portfolio approach for determining the incremental borrowing rate based on the applicable lease terms and the economic environment in the various regions where our operations are located.
Right-of-use assets are reviewed for recoverability as discussed below in Long-Lived Assets Impairment Evaluation.
GOODWILL: Goodwill results from the acquisition of existing businesses. We test goodwill for impairment at the reporting unit level which are the business groups that are one level below the operating segments for which discrete financial information is available. We have seven reporting units. We perform our testing annually in the second quarter, or when triggering events occur. We use a quantitative analysis, comparing the fair value of each reporting unit with its carrying amount. An impairment charge is recognized for the amount by which the carrying amount exceeds the reporting unit's fair value, up to the total amount of goodwill for the reporting unit.
Fair value of reporting units is determined using a combination of two valuation methods: a market approach and an income approach. Absent an indication of fair value from a potential buyer or similar specific transaction, we believe that the use of these two methods provides a reasonable estimate of a reporting unit’s fair value. Assumptions common to both methods are operating plans and economic projections, which are used to project future revenues, earnings, and after-tax cash flows for each reporting unit. These assumptions are applied consistently for both methods.
The market approach estimates fair value by first determining price-to-earnings ratios for comparable publicly-traded companies with similar characteristics of the reporting unit. The price-to-earnings ratio for comparable companies is based upon current enterprise value compared to the projected earnings for the next two years. The enterprise value is based upon current market capitalization and includes a control premium. Projected earnings are based upon market analysts’ projections. The earnings ratios are applied to the projected earnings of the comparable reporting unit to estimate fair value. Management believes this approach
is appropriate because it provides a fair value estimate using multiples from entities with operations and economic characteristics comparable to our reporting units.
The income approach is based on projected future (debt-free) cash flow that is discounted to present value using factors that consider the timing and risk of future cash flows. Management believes that this approach is appropriate because it provides a fair value estimate based upon the reporting unit’s expected long-term operating cash flow performance. Discounted cash flow projections are based on 5-year financial forecasts developed from operating plans and economic projections noted above, sales growth, estimates of future expected changes in operating margins, an appropriate discount rate, terminal value growth rates, future capital expenditures, and changes in working capital requirements. There are inherent assumptions and judgments required in the analysis of goodwill impairment. It is possible that assumptions underlying the impairment analysis will change in such a manner that impairment in value may occur in the future.
OTHER INTANGIBLE ASSETS: Other intangibles are stated at cost, less accumulated amortization, and substantially all are amortized using the straight-line method over their estimated useful lives. These assets are evaluated for impairment as discussed below in Long-Lived Assets Impairment Evaluation.
| | | | | | | | | | | |
| | Useful Life Range | | Weighted Average Life |
| Other intangible assets | 6-20 years | | 14 years |
LONG-LIVED ASSETS IMPAIRMENT EVALUATION: Long-lived assets are reviewed for recoverability at year end and whenever events or changes in circumstances indicate carrying values may not be recoverable. Fair value is calculated using similar methodologies as discussed above in Acquisitions.
Assets Held and Used—Assets are tested for recoverability at the asset group level. If the carrying value of an asset group exceeds its undiscounted expected cash flows, then a fair value analysis is performed. An impairment charge is recognized if the carrying value exceeds the fair value.
Assets Held for Sale—An asset or business is classified as held for sale when (i) management commits to a plan to sell and it is actively marketed; (ii) it is available for immediate sale and the sale is expected to be completed within one year; and (iii) it is unlikely significant changes to the plan will be made or that the plan will be withdrawn. Upon being classified as held for sale, a recoverability test is performed, and an impairment charge is recognized if the carrying value exceeds the fair value less cost to sell. These assets are no longer depreciated or amortized. We had $2.5 and $4.7 of held-for-sale assets in “Other current assets” and “Sundry”, respectively, at December 31, 2024, and $7.3 of held-for-sale assets in "Sundry" at December 31, 2023. There were no held-for-sale liabilities at December 31, 2024 or December 31, 2023.
STOCK-BASED COMPENSATION: The cost of employee services received in exchange for all equity awards granted is based on the fair market value of the award as of the grant date. Expense is recognized net of an estimated forfeiture rate using the straight-line method over the vesting period of the award.
REVENUE RECOGNITION: We recognize revenue when performance obligations, under the terms of a contract with our customers, are satisfied. Substantially all of our revenue is recognized upon transfer of control of our products to our customers, which is generally upon shipment from our facilities or upon delivery to our customers' facilities, and is dependent on the terms of the specific contract. This conclusion considers the point at which our customers have the ability to direct the use of and obtain substantially all of the remaining benefits of the products that were transferred. Substantially all performance obligations are satisfied within one year or less.
The amount of consideration we receive and revenue we recognize varies with changes in various sales allowances, discounts, and rebates (variable consideration) that we offer to our customers. We reduce revenue by our estimates of variable consideration, based on contract terms and historical experience. Changes in estimates of variable consideration for the periods presented were not material.
Some of our customers have the right to return products after transfer. For this right, we recognize an estimated refund liability and a corresponding reduction to revenue, based on historical returns experience. We also record an asset and a corresponding reduction to cost of sales for our right to recover products from customers upon settling the refund liability. We reduce the carrying amount of these assets by estimates of costs associated with the recovery and any additional expected reduction in value. Our refund liability and the corresponding asset associated with our right to recover products from our customers were immaterial for the periods presented.
We expect that at contract inception, the time period between when we transfer a promised good to our customer and our receipt of payment from that customer for that good will be one year or less (our typical trade terms are 30 to 60 days for U.S. customers and up to 90 days for our international customers). We generally expense costs of obtaining a contract because the amortization period would be one year or less. Sales, value added, and other taxes collected in connection with revenue-producing activities are excluded from revenue.
SHIPPING AND HANDLING FEES AND COSTS: Shipping and handling costs are included as a component of “Cost of goods sold.”
RESTRUCTURING COSTS: Restructuring costs are items such as employee termination, contract termination, plant closure, and asset relocation costs related to exit activities or workforce reductions. Restructuring-related items are primarily the write-down of inventories and professional services. We recognize a liability for costs associated with an exit or disposal activity when the liability is incurred. Certain termination benefits for which employees are required to render service are recognized ratably over the respective future service periods.
INCOME TAXES: The provision for income taxes is determined using the asset and liability approach of accounting for income taxes. Under this approach, deferred taxes represent the future tax consequences expected to occur when the reported amounts of assets and liabilities are recovered or paid. The provision for income taxes represents income taxes paid or payable for the current year plus the change in deferred taxes during the year. Deferred taxes result from differences between the financial and tax basis of our assets and liabilities and are adjusted for changes in tax rates and laws, as appropriate. A valuation allowance is provided to reduce deferred tax assets when management cannot conclude that it is more likely than not that a tax benefit will be realized. A provision is also made for incremental withholding taxes on undistributed earnings of foreign subsidiaries and related companies to the extent that such earnings are not deemed to be indefinitely invested.
The calculation of our U.S., state, and foreign tax liabilities involves dealing with uncertainties in the application of complex global tax laws. We recognize potential liabilities for anticipated tax issues which might arise in the United States and other tax jurisdictions based on management’s estimate of whether, and the extent to which, additional taxes will be due. If payment of these amounts ultimately proves to be unnecessary, the reversal of the liabilities would result in tax benefits being recognized in the period when we determine the liabilities are no longer necessary. Conversely, if the estimate of tax liabilities proves to be less than the ultimate tax assessment, a further charge to tax expense would result.
CONCENTRATION OF CREDIT RISKS, EXPOSURES, AND FINANCIAL INSTRUMENTS: We manufacture, market, and distribute products for the various end markets described in Note C. Our operations are principally located in the United States, although we also have operations in Europe, China, Canada, Mexico, and other countries. At December 31, 2024, we had cash and cash equivalents of $350.2 primarily invested in interest-bearing bank accounts and in bank time deposits with original maturities of three months or less. Substantially all of these funds are held in the international accounts of our foreign operations. Due to capital requirements in various jurisdictions, $70.4 of this cash was inaccessible for repatriation at year end.
We maintain allowances for potential credit losses. We perform ongoing credit evaluations of our customers’ financial conditions and generally require no collateral from our customers, some of which are highly leveraged. Management also monitors the financial condition and status of other notes receivable. Other notes receivable have historically primarily consisted of notes accepted as partial payment for the divestiture of a business or to support other business opportunities. Some of these companies are highly leveraged and the notes are not fully collateralized.
We have no material guarantees or liabilities for product warranties which require disclosure.
From time to time, we will enter into contracts to hedge foreign currency denominated transactions and interest rates related to our debt. To minimize the risk of counterparty default, only highly-rated financial institutions that meet certain requirements are used. We do not anticipate that any of the financial institution counterparties will default on their obligations.
The carrying value of cash and short-term financial instruments approximates fair value due to the short maturity of those instruments
OTHER RISKS: Although we obtain insurance for workers’ compensation, automobile, product and general liability, property loss, and medical claims, we have elected to retain a significant portion of expected losses through the use of deductibles. Accrued liabilities include estimates for unpaid reported claims and for claims incurred but not yet reported. Provisions for losses are recorded based upon reasonable estimates of the aggregate liability for claims incurred utilizing our prior experience and information provided by our third-party administrators and insurance carriers.
DERIVATIVE FINANCIAL INSTRUMENTS: We utilize derivative financial instruments to manage market and financial risks related to foreign currency and interest rates. We seek to use derivative contracts that qualify for hedge accounting treatment; however, some instruments that economically manage currency risk may not qualify for hedge accounting treatment. It is our policy not to speculate using derivative instruments.
Under hedge accounting, we formally document our hedge relationships, including identification of the hedging instruments and the hedged items, as well as our risk management objectives and strategies for entering into the hedge transaction. The process includes designating derivative instruments as hedges of specific assets, liabilities, firm commitments, or forecasted transactions. We also formally assess, both at inception and on a quarterly basis thereafter, whether the underlying transactions are probable of occurring. If it is determined that an underlying transaction is probable of not occurring, deferred gains or losses are recorded in the Consolidated Statements of Operations on the same line item as the hedged item.
On the date the contract is entered into, we designate the derivative as one of the following types of hedging instruments and account for it as follows:
Cash Flow Hedge—The hedge of a forecasted transaction or of the variability of cash flows to be received or paid, related to a recognized asset or liability or anticipated transaction, is designated as a cash flow hedge. The change in fair value is recorded in accumulated other comprehensive income. When the hedged item impacts the income statement, the gain or loss included in "Other comprehensive income (loss)" is reported on the same line of the Consolidated Statements of Operations as the hedged item, to match the gain or loss on the derivative to the gain or loss on the hedged item. Specifically, we regularly use currency cash flow hedges to manage risk associated with exchange rate volatility of various currencies and occasionally use interest rate cash flow hedges to manage interest rate risks. Settlements associated with the sale or production of product are presented in operating cash flows, and settlements associated with debt issuance are presented in financing cash flows.
Fair Value Hedge and Derivatives not Designated as Hedging Instruments—These derivatives typically manage foreign currency risk associated with subsidiaries’ assets and liabilities or unrecognized firm commitments. The changes in fair value of the derivative, along with the gain or loss on the hedged item that is attributable to the hedged risk, are recorded in earnings and reported in the Consolidated Statements of Operations, and in the case of fair value hedges, on the same line as the hedged item. Cash flows from settled contracts are presented in the category consistent with the nature of the item being hedged.
FOREIGN CURRENCY TRANSLATION: The functional currency for most foreign operations is the local currency. The translation of foreign currencies into U.S. dollars is performed for balance sheet accounts using current exchange rates in effect at the balance sheet date and for income and expense accounts using monthly average exchange rates. The cumulative effects of translating the functional currencies into the U.S. dollar are included in comprehensive income.
RECLASSIFICATIONS: Certain immaterial reclassifications have been made to the prior years’ information in the Consolidated Financial Statements and related notes to conform to the 2024 presentation.
NEW ACCOUNTING GUIDANCE: The Financial Accounting Standards Board (FASB) regularly issues updates to the FASB Accounting Standards Codification that are communicated through issuance of an Accounting Standards Update (ASU). Below is a summary of the ASUs that are most relevant to our financial statements:
Adopted in the current year
•ASU 2023-07 “Segment Reporting (Topic 280): Improvements to Reportable Segment Disclosures”: This ASU requires additional disclosures about reportable segments' expenses and other items on an interim and annual basis. We adopted the new standard effective December 31, 2024. As a result, we have enhanced our segment disclosures that are presented in Note C. The adoption of
this ASU affects only our disclosures, with no impacts to our financial condition and results of operations.
To be adopted in future years
•ASU 2023-09 “Income Taxes (Topic 740): Improvements to Income Tax Disclosures”: This ASU requires disclosure of specific categories in the rate reconciliation and income taxes paid disaggregated by jurisdiction. This guidance will be effective for our annual periods beginning January 1, 2025. We are currently evaluating the impact of adopting this guidance.
•ASU 2024-03 "Income Statement (Subtopic 220-40)—Reporting Comprehensive Income—Expense Disaggregation Disclosures": This ASU requires disaggregated disclosures for specific categories such as inventory purchases, employee compensation, depreciation, and amortization, as well as other qualitative descriptions. This guidance will be effective for our annual periods beginning January 1, 2027, and interim periods beginning January 1, 2028. We are currently evaluating the impact of adopting this guidance.
The FASB has issued accounting guidance, in addition to the issuance discussed above, effective for current and future periods. This guidance did not have a material impact on our current financial statements, and we do not believe it will have a material impact on our future financial statements.
B—Revenue
Revenue by Product Family
We disaggregate revenue by customer group, which is the same as our product families for each of our segments, as we believe this best depicts how the nature, amount, timing, and uncertainty of our revenue and cash flows are affected by economic factors. For information regarding our segment structure, see Note C. | | | | | | | | | | | | | | | | | |
| | Year Ended December 31, |
| | 2024 | | 2023 | | 2022 |
| Bedding Products | | | | | |
| Bedding Group | $ | 1,751.7 | | | $ | 1,964.7 | | | $ | 2,356.3 | |
| | 1,751.7 | | | 1,964.7 | | | 2,356.3 | |
| Specialized Products | | | | | |
| Automotive Group | 834.6 | | | 878.4 | | | 846.5 | |
| Aerospace Products Group | 190.2 | | | 154.1 | | | 120.9 | |
Hydraulic Cylinders Group 1 | 214.3 | | | 247.3 | | | 150.9 | |
| 1,239.1 | | | 1,279.8 | | | 1,118.3 | |
| Furniture, Flooring & Textile Products | | | | | |
| Home Furniture Group | 273.8 | | | 300.5 | | | 398.0 | |
| Work Furniture Group | 272.3 | | | 272.8 | | | 318.7 | |
| Flooring & Textile Products Group | 846.7 | | | 907.5 | | | 955.4 | |
| | 1,392.8 | | | 1,480.8 | | | 1,672.1 | |
| | $ | 4,383.6 | | | $ | 4,725.3 | | | $ | 5,146.7 | |
1 In August 2022, we acquired a manufacturer of hydraulic cylinders for material-handling and heavy construction equipment (see Note R).
C—Segment Information
We have three operating segments that supply a wide range of products:
•Bedding Products: This segment supplies a variety of components and machinery used by bedding manufacturers in the production and assembly of their finished products, as well as produces private label finished mattresses and adjustable bed bases. This segment is also vertically integrated into the production and supply of specialty foam chemicals, steel rod, and drawn steel wire to our own operations and to external customers. We also supply steel rod and wire to trade customers that operate in a broad range of markets.
•Specialized Products: From this segment, we supply lumbar support systems, seat suspension systems, motors and actuators, and control cables used by automotive manufacturers. We also produce and distribute tubing and tube assemblies for the aerospace industry and engineered hydraulic cylinders used in the material-handling and heavy construction industries.
•Furniture, Flooring & Textile Products: Operations in this segment supply a wide range of components for residential and work furniture manufacturers, as well as select lines of private label finished furniture. We also produce or distribute carpet cushion, hard surface flooring underlayment, and textile and geo components.
Our reportable segments are the same as our operating segments, which correspond with our management organizational structure. Each of our segments have an executive vice president who has accountability to, and maintains regular contact with, our CEO, who is the chief operating decision maker (CODM).
The accounting policies used in the preparation of the segment information are the same as those used for the consolidated financial statements. Earnings Before Interest and Taxes (EBIT) is used by the CODM to evaluate segment performance, allocate overall resources, and determine management incentive compensation. Intersegment sales are made primarily at prices that approximate market-based selling prices. Centrally incurred costs are allocated to the segments based on estimates of services used by the segment. Certain of our general and administrative costs and miscellaneous corporate income and expenses are allocated to the segments based on sales or other appropriate metrics. These allocated corporate costs include depreciation and other costs and income related to assets that are not allocated or otherwise included in the segment assets.
A summary of segment results for the periods presented are as follows:
| | | | | | | | | | | | | | | | | | | | | | | | | | |
| Year Ended December 31, | | Bedding Products | | Specialized Products | | Furniture, Flooring & Textile Products | | Total |
| 2024 | | | | | | | | |
Trade sales 1 | | $ | 1,751.7 | | | $ | 1,239.1 | | | $ | 1,392.8 | | | $ | 4,383.6 | |
| Inter-segment sales | | 25.0 | | | 3.3 | | | 9.8 | | | 38.1 | |
| Total segment sales | | 1,776.7 | | | 1,242.4 | | | 1,402.6 | | | 4,421.7 | |
| Less: | | | | | | | | |
| | | | | | | | |
| Depreciation and amortization | | 59.0 | | | 43.0 | | | 21.7 | | | 123.7 | |
Nonoperating assets depreciation and amortization 2 | | 5.0 | | | 3.4 | | | 3.9 | | | 12.3 | |
| Total depreciation and amortization | | 64.0 | | | 46.4 | | | 25.6 | | | 136.0 | |
| | | | | | | | |
Goodwill impairment (See Note F) | | 587.9 | | | 43.6 | | | 44.5 | | | 676.0 | |
Restructuring, restructuring-related, and impairment charges (See Note E) | | 37.4 | | | 10.1 | | | 2.3 | | | 49.8 | |
| Gain on sale of real estate | | (30.9) | | | — | | | — | | | (30.9) | |
| Gain from net insurance proceeds | | — | | | — | | | (2.2) | | | (2.2) | |
| | | | | | | | |
Other segment items 3 | | 1,667.3 | | | 1,077.9 | | | 1,274.2 | | | 4,019.4 | |
| Segment EBIT | | $ | (549.0) | | | $ | 64.4 | | | $ | 58.2 | | | (426.4) | |
Intersegment eliminations and other 4 | | | | | | | | (3.5) | |
| | | | | | | | |
| Interest expense net of interest income | | | | | | | | (79.3) | |
| Earnings (loss) before income taxes | | | | | | | | $ | (509.2) | |
| | | | | | | | | | | | | | | | | | | | | | | | | | |
| Year Ended December 31, | | Bedding Products | | Specialized Products | | Furniture, Flooring & Textile Products | | Total |
| 2023 | | | | | | | | |
Trade sales 1 | | $ | 1,964.7 | | | $ | 1,279.8 | | | $ | 1,480.8 | | | $ | 4,725.3 | |
| Inter-segment sales | | 31.9 | | | 1.5 | | | 11.7 | | | 45.1 | |
| Total segment sales | | 1,996.6 | | | 1,281.3 | | | 1,492.5 | | | 4,770.4 | |
| Less: | | | | | | | | |
| | | | | | | | |
| Depreciation and amortization | | 103.9 | | | 41.1 | | | 22.5 | | | 167.5 | |
Nonoperating assets depreciation and amortization 2 | | 5.3 | | | 3.3 | | | 3.8 | | | 12.4 | |
| Total depreciation and amortization | | 109.2 | | | 44.4 | | | 26.3 | | | 179.9 | |
| | | | | | | | |
Long-lived asset impairment (See Note F) | | 443.7 | | | — | | | — | | | 443.7 | |
| Gain on sale of real estate | | (5.4) | | | — | | | (5.5) | | | (10.9) | |
| Gain from net insurance proceeds | | (1.9) | | | — | | | (7.0) | | | (8.9) | |
Other segment items 3 | | 1,795.2 | | | 1,111.9 | | | 1,350.1 | | | 4,257.2 | |
| Segment EBIT | | $ | (344.2) | | | $ | 125.0 | | | $ | 128.6 | | | (90.6) | |
| Intersegment eliminations and other | | | | | | | | .2 | |
| | | | | | | | |
| Interest expense net of interest income | | | | | | | | (83.0) | |
| Earnings (loss) before income taxes | | | | | | | | $ | (173.4) | |
| | | | | | | | | | | | | | | | | | | | | | | | | | |
| Year Ended December 31 | | Bedding Products | | Specialized Products | | Furniture, Flooring & Textile Products | | Total |
| 2022 | | | | | | | | |
Trade sales 1 | | $ | 2,356.3 | | | $ | 1,118.3 | | | $ | 1,672.1 | | | $ | 5,146.7 | |
| Inter-segment sales | | 40.5 | | | 2.2 | | | 14.5 | | | 57.2 | |
| Total segment sales | | 2,396.8 | | | 1,120.5 | | | 1,686.6 | | | 5,203.9 | |
| Less: | | | | | | | | |
| | | | | | | | |
| Depreciation and amortization | | 104.1 | | | 40.5 | | | 23.2 | | | 167.8 | |
Nonoperating assets depreciation and amortization 2 | | 5.5 | | | 2.6 | | | 3.9 | | | 12.0 | |
| Total depreciation and amortization | | 109.6 | | | 43.1 | | | 27.1 | | | 179.8 | |
| | | | | | | | |
| | | | | | | | |
| | | | | | | | |
| | | | | | | | |
Other segment items 3 | | 2,067.6 | | | 978.0 | | | 1,494.5 | | | 4,540.1 | |
| Segment EBIT | | $ | 219.6 | | | $ | 99.4 | | | $ | 165.0 | | | 484.0 | |
| Intersegment eliminations and other | | | | | | | | 1.0 | |
| | | | | | | | |
| Interest expense net of interest income | | | | | | | | (81.4) | |
| Earnings (loss) before income taxes | | | | | | | | $ | 403.6 | |
1 See Note B for revenue by product family. 2 Assets are not allocated to segments for internal reporting presentations. A portion of amortization and depreciation is included with various other costs in an overhead allocation to each segment.
3 Other segment items included in segment EBIT but not regularly provided to the CODM are comprised of cost of goods sold, selling and administrative expenses, and other expense (income), net.
4 2024 Intersegment eliminations and other included $3.7 in CEO transition compensation costs.
Average assets for our segments are shown in the table below and reflect the basis for return measures used by management to evaluate segment performance. These segment totals include working capital (current assets and current liabilities utilized in operations) plus net property, plant and equipment. Segment assets for all years are reflected at their estimated average for the year. Acquired companies’ long-lived assets as disclosed below include property, plant and equipment, goodwill, and intangible assets.
| | | | | | | | | | | | | | | | | | | |
| | Year Ended December 31, |
| | Assets | | Additions
to
Property,
Plant and
Equipment | | Acquired
Companies’
Long-Lived
Assets | | |
| 2024 | | | | | | | |
| Bedding Products | $ | 741.8 | | | $ | 30.5 | | | $ | — | | | |
| Specialized Products | 398.7 | | | 35.2 | | | — | | | |
| Furniture, Flooring & Textile Products | 346.1 | | | 9.7 | | | — | | | |
| Average current liabilities included in segment numbers above | 692.7 | | | — | | | — | | | |
Unallocated assets and other 1, 2 | 1,634.0 | | | 6.2 | | | — | | | |
| Difference between average assets and year-end balance sheet | (151.7) | | | — | | | — | | | |
| | $ | 3,661.6 | | | $ | 81.6 | | | $ | — | | | |
| 2023 | | | | | | | |
| Bedding Products | $ | 815.2 | | | $ | 47.3 | | | $ | — | | | |
| Specialized Products | 398.6 | | | 42.7 | | | — | | | |
| Furniture, Flooring & Textile Products | 390.3 | | | 12.7 | | | — | | | |
| Average current liabilities included in segment numbers above | 736.1 | | | — | | | — | | | |
Unallocated assets and other 1, 3 | 2,403.2 | | | 11.1 | | | — | | | |
| Difference between average assets and year-end balance sheet | (108.9) | | | — | | | — | | | |
| | $ | 4,634.5 | | | $ | 113.8 | | | $ | — | | | |
| 2022 | | | | | | | |
| Bedding Products | $ | 931.2 | | | $ | 42.1 | | | $ | — | | | |
| Specialized Products | 350.1 | | | 28.2 | | | 93.8 | | | |
| Furniture, Flooring & Textile Products | 423.1 | | | 12.5 | | | 7.1 | | | |
| Average current liabilities included in segment numbers above | 793.9 | | | — | | | — | | | |
Unallocated assets and other 1 | 2,840.6 | | | 17.5 | | | — | | | |
| Difference between average assets and year-end balance sheet | (152.8) | | | — | | | — | | | |
| | $ | 5,186.1 | | | $ | 100.3 | | | $ | 100.9 | | | |
1 Unallocated assets consists primarily of goodwill, other intangibles, cash, and deferred tax assets.
2 2024 unallocated assets reflects a $676.0 goodwill impairment as discussed in Note F. 3 2023 unallocated assets reflects a $443.7 long-lived asset impairment as discussed in Note F.
Trade sales and tangible long-lived assets are presented below, based on the geography of manufacture.
| | | | | | | | | | | | | | | | | |
| Year Ended December 31, |
| | 2024 | | 2023 | | 2022 |
| Trade sales | | | | | |
| Foreign sales | | | | | |
| Europe | $ | 660.6 | | | $ | 715.2 | | | $ | 624.5 | |
| China | 443.5 | | | 464.7 | | | 501.5 | |
| Canada | 289.5 | | | 296.6 | | | 279.4 | |
| Mexico | 214.0 | | | 232.6 | | | 262.8 | |
| Other | 143.4 | | | 139.2 | | | 129.2 | |
| Total foreign sales | 1,751.0 | | | 1,848.3 | | | 1,797.4 | |
| United States | 2,632.6 | | | 2,877.0 | | | 3,349.3 | |
| Total trade sales | $ | 4,383.6 | | | $ | 4,725.3 | | | $ | 5,146.7 | |
| | | | | |
| Tangible long-lived assets | | | | | |
| Foreign tangible long-lived assets | | | | | |
| Europe | $ | 144.9 | | | $ | 149.4 | | | $ | 142.1 | |
| China | 44.3 | | | 47.1 | | | 45.2 | |
| Canada | 23.1 | | | 25.6 | | | 24.3 | |
| Mexico | 11.6 | | | 14.3 | | | 14.1 | |
| Other | 6.8 | | | 7.3 | | | 7.9 | |
| Total foreign tangible long-lived assets | 230.7 | | | 243.7 | | | 233.6 | |
| United States | 493.7 | | | 537.5 | | | 538.8 | |
| Total tangible long-lived assets | $ | 724.4 | | | $ | 781.2 | | | $ | 772.4 | |
D—Earnings (Loss) Per Share (EPS)
Basic and diluted earnings (loss) per share were calculated as follows: | | | | | | | | | | | | | | | | | |
| | Year Ended December 31, |
| | 2024 | | 2023 | | 2022 |
| Net earnings (loss) | | | | | |
| Net earnings (loss) | $ | (511.4) | | | $ | (136.8) | | | $ | 309.9 | |
| Earnings attributable to noncontrolling interest, net of tax | (.1) | | | — | | | (.1) | |
| | | | | |
| | | | | |
| Net earnings (loss) attributable to Leggett & Platt, Inc. common shareholders | $ | (511.5) | | | $ | (136.8) | | | $ | 309.8 | |
| | | | | |
| Weighted average number of shares (in millions) | | | | | |
| Weighted average number of common shares used in basic EPS | 137.3 | | | 136.3 | | 136.1 |
| Dilutive effect of stock-based compensation | — | | | — | | .4 |
| Weighted average number of common shares and dilutive potential common shares used in diluted EPS | 137.3 | | | 136.3 | | | 136.5 | |
| | | | | |
| Basic and diluted EPS | | | | | |
| | | | | |
| | | | | |
| | | | | |
| Basic EPS attributable to Leggett & Platt, Inc. common shareholders | $ | (3.73) | | | $ | (1.00) | | | $ | 2.28 | |
| | | | | |
| | | | | |
| | | | | |
| | | | | |
| Diluted EPS attributable to Leggett & Platt, Inc. common shareholders | $ | (3.73) | | | $ | (1.00) | | | $ | 2.27 | |
| | | | | |
| Other information | | | | | |
| Anti-dilutive shares excluded from diluted EPS computation | .5 | | | .5 | | | .4 | |
| | | | | |
| Cash dividends declared per share | $ | .61 | | | $ | 1.82 | | | $ | 1.74 | |
E—Restructuring and Related Activities
Restructuring and restructuring-related activity for 2023 and 2022 was $2.9 and $1.4, respectively, and was not associated with any formal plan.
In the first quarter of 2024, we committed to a restructuring plan (the “2024 Restructuring Plan” or “2024 Plan”). The 2024 Plan is primarily associated with our Bedding Products segment and, to a lesser extent, our Furniture, Flooring & Textile Products segment. The 2024 Plan was expanded in the second quarter of 2024 to include a restructuring opportunity within the Specialized Products segment and in the third quarter of 2024 to include the general and administrative cost structure initiatives. 2024 Plan costs are expected to be substantially complete by the end of 2025.
Over the course of the restructuring timeline, we plan to consolidate between 15 and 20 production and distribution facilities in the Bedding Products segment and a small number of production facilities in the Furniture, Flooring & Textile Products segment. Our total restructuring, restructuring-related, and impairment costs for the 2024 Plan are expected to be between $80.0 and $90.0, versus our prior estimate of $65.0 to $85.0, of which $47.8 was incurred in 2024 with the remainder expected to be incurred in 2025.
The following table presents all 2024 restructuring and restructuring-related activity, including impairments:
| | | | | | | | | | | | |
| | Total Amount Expected to be Incurred | Year Ended
December 31, |
| | 2024 | | | | |
| | | | | | |
| 2024 Restructuring Plan activity: | | | | | | |
| Net restructuring and restructuring-related | $60.0 to $70.0 | $ | 43.6 | | | | | |
Goodwill and long-lived asset impairment costs associated with this plan (see Note F) | Approximately $20.0 | 4.2 | | | | | |
| Total 2024 Restructuring Plan activity | $80.0 to $90.0 | 47.8 | | | | | |
| | | | | | |
| Other restructuring activity: | | | | | | |
Net restructuring and restructuring-related 1 | | 2.9 | | | | | |
| Total net restructuring and restructuring-related activity, including impairments | | $ | 50.7 | | | | | |
| | | | | | |
| Amount of total that represents net cash charges to 2024 Plan | | 30.3 | | | | | |
| Amount of total that represents net cash charges to other restructuring | | 2.9 | | | | | |
| Amount of total that represents net cash charges | | $ | 33.2 | | | | | |
1 This includes $2.7 of restructuring-related costs due to exploring a potential sale of our Aerospace business. This business has not reached the criteria to be classified as held for sale.
The table below presents all 2024 Plan restructuring and restructuring-related activity:
| | | | | | | | | | | | | | | |
| Income Statement Presentation | | Year Ended
December 31, |
| | | 2024 | | | | |
| Restructuring costs associated with the 2024 Plan: | | | | | | | |
| Termination benefits, relocation, and other restructuring costs | Other expense (income), net | | $ | 18.5 | | | | | |
| Restructuring-related costs (gains): | | | | | | | |
| | | | | | | |
| Write-down of inventories and other | Cost of goods sold | | 13.2 | | | | | |
| | | | | | | |
| Professional services and other | Selling and administrative expenses | | 13.5 | | | | | |
| | | | | | | |
| | | | | | | |
| Gain on sale of equipment | Net gain from disposal of assets | | (1.6) | | | | | |
| Total restructuring-related costs | | | 25.1 | | | | | |
| Total net restructuring and restructuring-related costs | | | $ | 43.6 | | | | | |
| | | | | | | |
| Amount of total that represents net cash charges | | | $ | 30.3 | | | | | |
Net restructuring and restructuring-related 2024 Plan costs by segment were as follows:
| | | | | | | | | |
| | Year Ended
December 31, |
| | 2024 | | | | |
| Bedding Products | $ | 33.9 | | | | | |
| Specialized Products | 7.4 | | | | | |
| Furniture, Flooring & Textile Products | 2.3 | | | | | |
| | | | | |
| Total | $ | 43.6 | | | | | |
During 2024, we recognized gains of $16.6 from the sale of real estate associated with the 2024 Plan within the Bedding Products segment. These gains are not reflected in the tables above.
The accrued liability associated with the 2024 Plan consisted of the following:
| | | | | | | | | | | | | | | | | | | | | | | | | | | | | | | |
| | | | | | | Balance at December 31, 2023 | | Add: 2024 Charges | | Less: 2024 Payments | | Balance at December 31, 2024 |
| Termination benefits | | | | | | | $ | — | | | $ | 6.9 | | | $ | 6.1 | | | $ | .8 | |
| | | | | | | | | | | | | |
| Relocation and other restructuring costs | | | | | | | — | | | 11.6 | | | 11.6 | | | — | |
| | | | | | | | $ | — | | | $ | 18.5 | | | $ | 17.7 | | | $ | .8 | |
F—Impairment Charges
Pretax impairment charges are reported in “Goodwill impairment” and “Long-lived asset impairment” in the Consolidated Statements of Operations and summarized in the table below. There were no impairment charges in 2022.
| | | | | | | | | | | | | | | | | | | | | | | | | | | | | | | | | | | |
| Year Ended December 31, 2024 | | Year Ended December 31, 2023 |
| | Goodwill Impairment | | Other Long-Lived Asset Impairment | | Total Impairments 1 | | Goodwill Impairment | | Other Long-Lived Asset Impairment | | Total Impairments |
| Bedding Products | $ | 587.9 | | | $ | 4.6 | | | $ | 592.5 | | | $ | — | | | $ | 443.7 | | | $ | 443.7 | |
| Specialized Products | 43.6 | | | .8 | | | 44.4 | | | — | | | — | | | — | |
| Furniture, Flooring & Textile Products | 44.5 | | | .9 | | | 45.4 | | | — | | | — | | | — | |
| | | | | | | | | | | |
| Total impairment charges | $ | 676.0 | | | $ | 6.3 | | | $ | 682.3 | | | $ | — | | | $ | 443.7 | | | $ | 443.7 | |
1 This includes $4.2 associated with the 2024 Plan as discussed in Note E ($.7 of goodwill and $3.5 of long-lived assets discussed below). Goodwill
The following table represents 2024 total goodwill impairments. This includes non-cash pretax charges of $675.3 related to our second quarter annual goodwill impairment testing and $.7 related to a small operation in the Bedding Products segment that reached held-for-sale status in the fourth quarter of 2024 and was associated with the 2024 Plan.
| | | | | | | | | | | | | | |
| | | | Year Ended |
| Reporting Unit | | Segment | | December 31, 2024 |
| Bedding | | Bedding Products | | $ | 587.9 | |
| Work Furniture | | Furniture, Flooring & Textile Products | | 44.5 | |
| Hydraulic Cylinders | | Specialized Products | | 43.6 | |
| | | | $ | 676.0 | |
In general, the fair values for these reporting units decreased versus prior year due to macroeconomic pressures, including low demand, particularly in residential end markets. The fair values of our reporting units were reconciled to our consolidated market capitalization, which decreased due to the significant decline in stock price during the second quarter of 2024. Our closing stock price per share was $26.17 on December 29, 2023, $19.15 on March 28, 2024, and $11.46 on June 28, 2024. The impairment was concluded in connection with the preparation of the second quarter financial statements. If actual results differ materially from estimates used in our calculations, we could incur future impairment charges.
The fair values of our reporting units in relation to their respective carrying values and significant assumptions used are presented in the tables below. The 2024 information excludes Hydraulic Cylinders, as this unit had no goodwill remaining after the second quarter 2024 impairment.
| | | | | | | | | | | | | | | | | | | | | | | | | | |
| 2024 |
| Fair Value over Carrying Value divided by Carrying Value | | December 31, 2024 Goodwill Value | | Compound
Annual Growth Rate (CAGR)
Range for Sales | | Terminal Values Long-term Growth Rate for Debt-Free Cash Flow | | Discount Rate Ranges |
Less than 50%1 | | $ | 430.4 | | | (1) - 12% | | 3 | % | | 14 - 17% |
| | | | | | | | |
| 101 - 300% | | 364.0 | | | 3 - 7 | | 3 | | | 14 |
| | | | | | | | |
| | $ | 794.4 | | | (1) - 12% | | 3 | % | | 14-17% |
| | | | | | | | | | | | | | | | | | | | | | | | | | |
| 2023 |
| Fair Value over Carrying Value divided by Carrying Value | | December 31, 2023 Goodwill Value | | CAGR Range for Sales | | Terminal Values Long-term Growth Rate for Debt-Free Cash Flow | | Discount Rate Ranges |
Less than 50% 1 | | $ | 1,018.1 | | | 1 - 17% | | 3 | % | | 10% - 12% |
| 50-100% | | 99.6 | | | <1 | | 3 | | | 8 |
| 101-300% | | 372.1 | | | 3 - 6 | | 3 | | | 8 - 10 |
| | | | | | | | |
| | $ | 1,489.8 | | | <1 - 17% | | 3 | % | | 8 - 12% |
1 This category includes Bedding, Aerospace, and Work Furniture for 2024 and Bedding, Aerospace, and Hydraulic Cylinders for 2023.
• The fair value of our Bedding reporting unit was less than its carrying value at our second quarter 2024 testing date, resulting in a partial goodwill impairment, as discussed above. Fair value exceeded carrying value by 40% at our second quarter 2023 testing date and had decreased to 19% after a triggering event occurred to test for goodwill impairment for the reporting unit late in the fourth quarter of 2023, as discussed in the "Other long-lived assets" section below. Goodwill associated with this reporting unit was $310.0 and $906.5 at December 31, 2024 and 2023, respectively.
• The fair value of our Aerospace reporting unit exceeded its carrying value by 21% at our second quarter 2024 testing date as compared to 44% at our second quarter 2023 testing date. Goodwill associated with this reporting unit was $66.8 and $67.0 at December 31, 2024 and 2023, respectively.
• The fair value of our Work Furniture reporting unit was less than its carrying value at our second quarter 2024 testing date, resulting in a partial goodwill impairment, as discussed above. Fair value exceeded carrying value by 74% at our second quarter 2023 testing date. Goodwill associated with this reporting unit was $53.6 and $99.6 at December 31, 2024 and 2023, respectively.
• The fair value of our Hydraulic Cylinders reporting unit was less than its carrying value at our second quarter 2024 testing date, resulting in a full goodwill impairment, as discussed above. Fair value exceeded carrying value by 18% at our second quarter 2023 testing date. Goodwill associated with this reporting unit was $44.6 at December 31, 2023.
Other Long-Lived Assets
As discussed in Note A, we test other long-lived assets for recoverability at year end and whenever events or changes in circumstances indicate that the carrying value may not be recoverable. Of the $6.3 long-lived asset impairment charges in 2024, $3.5 were associated with the 2024 Plan, as discussed in Note E. Late in the fourth quarter of 2023, we had a triggering event to review long-lived assets and test for impairment when certain of our Elite Comfort Solutions (ECS) and Kayfoam customers notified us of efforts to improve their financial position by moving their business to or exploring alternative suppliers, which adversely impacted our future cash flow forecast. While sales and earnings were lower as compared to acquisition-date estimates for the customer bases associated with ECS and Kayfoam (acquired in 2019 and 2021, respectively),
estimated undiscounted cash flows for these asset groups exceeded their carrying amounts until the fourth quarter of 2023. In early January 2024, we conducted an evaluation and determined that our sales and earnings forecasts should be reduced, and, as a result, we performed a recoverability test for these asset groups. Because the forecasted undiscounted cash flows had fallen below the carrying value for these asset groups, we tested for impairment by comparing the estimated fair value of long-lived assets to their carrying values. This resulted in a non-cash pretax charge of $443.7 for long-lived asset impairments (primarily customer relationships, technology, and trademark intangibles) in the Bedding Products segment during the fourth quarter of 2023. This impairment was unrelated to the 2024 Restructuring Plan discussed in Note E. Fair value of the long-lived assets and the resulting impairment charges noted above were determined using the following methodologies.
•Customer relationships were valued using an excess earnings method with various inputs, such as the estimated customer attrition rate, revenue growth rate, operating margins, the amount of contributory asset charges, and an appropriate discount rate.
•Technology, trademarks, and trade names were valued using a relief-from-royalty method with various inputs, such as comparable market royalty rates for items of similar value, future earnings forecast, an appropriate discount rate, and a replacement rate for technology.
This impairment represents substantially all of the intangibles associated with the asset groups noted above. We believe the estimates and assumptions utilized in our impairment testing are reasonable and are comparable to those that would be used by other market participants. However, if actual results differ materially from estimates used in these calculations, we could incur future impairment charges.
G—Goodwill and Other Intangible Assets
The changes in the carrying amounts of goodwill are as follows:
| | | | | | | | | | | | | | | | | | | | | | | |
| Bedding Products | | Specialized
Products | | Furniture, Flooring & Textile Products | | Total |
| Net goodwill as of January 1, 2023 | $ | 900.3 | | | $ | 227.4 | | | $ | 346.7 | | | $ | 1,474.4 | |
| | | | | | | |
| Adjustments to prior year acquisitions | — | | | 2.9 | | | .8 | | | 3.7 | |
| | | | | | | |
| | | | | | | |
| | | | | | | |
| Foreign currency translation adjustment | 6.2 | | | 3.4 | | | 2.1 | | | 11.7 | |
Net goodwill as of December 31, 2023 1 | 906.5 | | | 233.7 | | | 349.6 | | | 1,489.8 | |
| | | | | | | |
| | | | | | | |
| | | | | | | |
| | | | | | | |
| Impairment charge | (587.9) | | | (43.6) | | | (44.5) | | | (676.0) | |
| Foreign currency translation adjustment | (8.6) | | | (7.2) | | | (3.6) | | | (19.4) | |
Net goodwill as of December 31, 2024 2 | $ | 310.0 | | | $ | 182.9 | | | $ | 301.5 | | | $ | 794.4 | |
| | | | | | | |
1 Net goodwill as of December 31, 2023 is comprised of: | | | | | | | |
| Gross goodwill | $ | 911.9 | | | $ | 325.8 | | | $ | 600.2 | | | $ | 1,837.9 | |
| Accumulated impairment losses | (5.4) | | | (92.1) | | | (250.6) | | | (348.1) | |
| Net goodwill as of December 31, 2023 | $ | 906.5 | | | $ | 233.7 | | | $ | 349.6 | | | $ | 1,489.8 | |
| | | | | | | |
2 Net goodwill as of December 31, 2024 is comprised of: | | | | | | | |
| Gross goodwill | $ | 903.3 | | | $ | 318.6 | | | $ | 596.6 | | | $ | 1,818.5 | |
| Accumulated impairment losses | (593.3) | | | (135.7) | | | (295.1) | | | (1,024.1) | |
| Net goodwill as of December 31, 2024 | $ | 310.0 | | | $ | 182.9 | | | $ | 301.5 | | | $ | 794.4 | |
The gross carrying amount and accumulated amortization by intangible asset class and intangible assets acquired during the periods presented, included in "Other intangibles, net" on the Consolidated Balance Sheets, are as follows:
| | | | | | | | | | | | | | | | | | | | | | | | | | | | | |
| December 31, 2024 | | Year Ended December 31, 2024 |
| Gross Carrying Amount | | Accumulated Amortization | | Net Intangibles | | Gross carrying amounts of items acquired | | Weighted average life in years for items acquired |
| Customer-related intangibles | $ | 193.0 | | | $ | 120.5 | | | $ | 72.5 | | | $ | — | | | 0 |
| Technology | 85.8 | | | 63.8 | | | 22.0 | | | — | | | 0 |
Patents and trademarks 1 | 77.6 | | | 39.4 | | | 38.2 | | | 1.5 | | | 8.5 |
| Non-compete agreements, supply agreements and other | 30.0 | | | 22.3 | | | 7.7 | | | .9 | | | 5.0 |
| Total | $ | 386.4 | | | $ | 246.0 | | | $ | 140.4 | | | $ | 2.4 | | | 7.2 |
| | | | | | | | | |
| December 31, 2023 | | Year Ended December 31, 2023 |
| Customer-related intangibles | $ | 331.5 | | | $ | 244.7 | | | $ | 86.8 | | | $ | — | | | 0 |
| Technology | 86.8 | | | 60.8 | | | 26.0 | | | — | | | 0 |
Patents and trademarks 1 | 103.6 | | | 59.8 | | | 43.8 | | | 1.5 | | | 19.3 |
| Non-compete agreements, supply agreements and other | 62.0 | | | 51.1 | | | 10.9 | | | — | | | 0 |
Total 2 | $ | 583.9 | | | $ | 416.4 | | | $ | 167.5 | | | $ | 1.5 | | | 19.3 |
| | | | | | | | | |
1 $17.4 and $18.2 of our trademarks at December 31, 2024 and December 31, 2023, respectively, are not subject to amortization.
2 We incurred impairment charges in 2023 associated with intangible assets as discussed in Note F. Estimated amortization expense for the next five years is as follows:
| | | | | |
| 2025 | $ | 21.9 | |
| 2026 | 19.9 | |
| 2027 | 18.3 | |
| 2028 | 17.5 | |
| 2029 | 16.4 | |
H—Accounts and Other Receivables
Accounts and other receivables at December 31 consisted of the following: | | | | | | | | | | | | | | | | | | | | | | | |
| 2024 | | 2023 |
| | Current | | Long-term | | Current | | Long-term |
| Total trade receivables | $ | 517.2 | | | $ | — | | | $ | 575.4 | | | $ | — | |
| Allowance for doubtful accounts - trade receivables | (14.2) | | | — | | | (10.5) | | | — | |
| Trade receivables, net | $ | 503.0 | | | $ | — | | | $ | 564.9 | | | $ | — | |
| | | | | | | |
| | | | | | | |
| Taxes receivable, including income taxes | 4.1 | | | — | | | 3.1 | | | — | |
Value-added taxes (VAT) recoverable 1 | 40.1 | | | 6.0 | | | 56.6 | | | — | |
| Other receivables | 12.2 | | | 4.5 | | | 12.7 | | | 1.2 | |
| | | | | | | |
| Other receivables, net | $ | 56.4 | | | $ | 10.5 | | | $ | 72.4 | | | $ | 1.2 | |
1 This includes recoverable amounts from various countries, including Mexico, where we have experienced VAT refund delays from the Mexican government. We believe these are fully collectible. The aggregate of current and long-term balances of Mexico VAT recoverable was $35.5 and $48.2 at December 31, 2024 and December 31, 2023, respectively. We received $18.8 of the December 31, 2024 balance in January 2025.
Activity related to the allowance for doubtful accounts is reflected below: | | | | | | | | | | | | | | | | | | | | | | | | | | | | | | | | | | | | | | | | | |
| Balance at December 31, 2022 | | Change in Provision | | Less: Net
Charge-offs/(Recoveries) and Other | | Balance at December 31, 2023 | | Change in Provision | | Less: Net
Charge-offs/(Recoveries) and Other | | Balance at December 31, 2024 |
| | | | | | | | | | | | | |
| | | | | | | | | | | | | |
| Total trade receivables | $ | 17.8 | | | $ | (5.8) | | | $ | 1.5 | | | $ | 10.5 | | | $ | 6.3 | | | $ | 2.6 | | | $ | 14.2 | |
| | | | | | | | | | | | | |
| | | | | | | | | | | | | |
| Other notes receivable | 21.2 | | | (.7) | | | 20.5 | | | — | | | — | | | — | | | — | |
| | | | | | | | | | | | | |
| Total allowance for doubtful accounts | $ | 39.0 | | | $ | (6.5) | | | $ | 22.0 | | | $ | 10.5 | | | $ | 6.3 | | | $ | 2.6 | | | $ | 14.2 | |
I—Supplemental Balance Sheet Information
Additional supplemental balance sheet details at December 31 consisted of the following: | | | | | | | | | | | |
| 2024 | | 2023 |
| | | |
| | | |
| | | |
| | | |
| | | |
| | | |
| Sundry | | | |
Deferred income taxes (see Note O) | $ | 18.3 | | | $ | 13.2 | |
| | | |
Diversified investments associated with stock-based compensation plans (see Note L) | 51.4 | | | 46.8 | |
| | | |
| | | |
Pension plan assets (see Note M) | 7.3 | | | 4.7 | |
| Tooling and molds | 11.6 | | | 16.0 | |
| | | |
| 3.6 | | | 4.0 | |
| Other | 44.0 | | | 36.7 | |
| | $ | 136.2 | | | $ | 121.4 | |
| Accrued expenses | | | |
| Wages and commissions payable | $ | 85.9 | | | $ | 78.5 | |
| Workers’ compensation, vehicle-related and product liability, medical/disability | 40.7 | | | 44.6 | |
| Sales promotions | 25.8 | | | 37.0 | |
Liabilities associated with stock-based compensation plans (see Note L) | 5.5 | | | 5.5 | |
| Accrued interest | 10.8 | | | 12.6 | |
| General taxes, excluding income taxes | 18.4 | | | 20.9 | |
| | | |
Litigation contingency accruals (see Note T) | 1.4 | | | 1.4 | |
| Other | 53.7 | | | 56.3 | |
| | $ | 242.2 | | | $ | 256.8 | |
| Other current liabilities | | | |
| Dividends payable | $ | 6.7 | | | $ | 61.3 | |
| Customer deposits | 12.5 | | | 12.1 | |
| | | |
Additional consideration for acquisition of businesses (see Note R) | 5.3 | | | 6.1 | |
Derivative financial instruments (see Note S) | 6.7 | | | 3.3 | |
Liabilities associated with stock-based compensation plans (see Note L) | 3.7 | | | 3.7 | |
| Outstanding checks in excess of book balances | 9.4 | | | 10.3 | |
| Other | 7.5 | | | 7.5 | |
| | $ | 51.8 | | | $ | 104.3 | |
| Other long-term liabilities | | | |
Liability for pension benefits (see Note M) | $ | 6.6 | | | $ | 11.2 | |
Liabilities associated with stock-based compensation plans (see Note L) | 51.2 | | | 50.5 | |
| Deemed repatriation tax payable | — | | | 11.9 | |
| Net reserves for tax contingencies | 4.5 | | | 4.6 | |
| Deferred compensation | 9.0 | | | 11.2 | |
Additional consideration for acquisition of businesses (see Note R) | — | | | 6.3 | |
| Other | 10.9 | | | 10.9 | |
| | $ | 82.2 | | | $ | 106.6 | |
J—Long-Term Debt
Our multi-currency credit facility matures in September 2026. It provides us the ability, from time to time, subject to certain restrictive covenants and customary conditions, to borrow, repay, and re-borrow up to $1,200.0. At December 31, 2024, we were in compliance with all of our debt covenants. Capitalized terms used in this section but not defined herein have the meanings set forth in the Credit Agreement.
To provide additional borrowing capacity and financial flexibility, we amended our credit agreement in March 2024 to increase the Leverage Ratio from 3.50 to 1.00 to 4.00 to 1.00. After the amendment, our credit facility contains restrictive covenants which include (a) an amended Leverage Ratio requiring us to maintain, as of the last day of each fiscal quarter, or when we borrow under the credit facility (i) Consolidated Funded Indebtedness minus the lesser of: (A) Unrestricted Cash, or (B) $750.0 to (ii) Consolidated EBITDA for the four consecutive trailing quarters, such ratio not being greater than 4.00 to 1.00 as of March 31, 2024 through June 30, 2025, and not greater than 3.50 to 1.00 beginning September 30, 2025 through maturity, provided however, subject to certain limitations, if we make a Material Acquisition in any fiscal quarter after June 30, 2025, at our election, the maximum Leverage Ratio shall be 4.00 to 1.00 for the fiscal quarter during which such Material Acquisition is consummated and the next three consecutive fiscal quarters; (b) a limitation of the amount of total secured obligations to 15% of our total consolidated assets; and (c) a limitation on our ability to sell, lease, transfer, or dispose of all or substantially all of our assets and the assets of our subsidiaries, taken as a whole (other than accounts receivable sold in a Permitted Securitization Transaction, products sold in the ordinary course of business and our ability to sell, lease, transfer, or dispose of any of our assets or the assets of one of our subsidiaries to us or one of our subsidiaries, as applicable) at any given point in time.
During the year ended December 31, 2024, we repaid $300.0 of 3.80% Senior Notes.
Long-term debt, interest rates, and due dates at December 31 are as follows: | | | | | | | | | | | | | | | | | | | | | | | | | | | | | | | | | | | |
| | 2024 | | 2023 |
| | Year-end Interest Rate | | Due Date
Through | | Balance | | Year-end Interest Rate | | Due Date
Through | | Balance |
| | | | | | | | | | | |
Senior Notes 1 | — | % | | — | | | $ | — | | | 3.8 | % | | 2024 | | $ | 300.0 | |
Senior Notes 1 | 3.5 | % | | 2027 | | 500.0 | | | 3.5 | % | | 2027 | | 500.0 | |
Senior Notes 1 | 4.4 | % | | 2029 | | 500.0 | | | 4.4 | % | | 2029 | | 500.0 | |
Senior Notes 1 | 3.5 | % | | 2051 | | 500.0 | | | 3.5 | % | | 2051 | | 500.0 | |
| | | | | | | | | | | |
| Industrial development bonds - variable interest rates | 5.0 | % | | 2030 | | 3.8 | | | 4.1 | % | | 2030 | | 3.8 | |
Commercial paper 2 | 5.1 | % | | 2026 | | 368.0 | | | 5.6 | % | | 2026 | | 186.0 | |
| Finance leases | | | | | 3.7 | | | | | | | 4.0 | |
| Other, partially secured | | | | | .3 | | | | | | | 7.4 | |
| Unamortized discounts and deferred loan costs | | | | | (11.7) | | | | | | | (13.6) | |
| Total debt | | | | | 1,864.1 | | | | | | | 1,987.6 | |
| Less: current maturities | | | | | 1.3 | | | | | | | 308.0 | |
| Total long-term debt | | | | | $ | 1,862.8 | | | | | | | $ | 1,679.6 | |
1 Senior notes are unsecured and unsubordinated obligations. For each of the senior notes: (i) interest is paid semi-annually in arrears; (ii) principal is due at maturity with no sinking fund; and (iii) we may, at our option, at any time, redeem all or a portion of any of the debt at a make-whole redemption price equal to the greater of: (a) 100% of the principal amount of the notes being redeemed; and (b) the sum of the present values of the remaining scheduled payments of principal and interest thereon to the "par call date", discounted to the date of redemption on a semi-annual basis (assuming a 360-day year consisting of twelve 30-day months) at a specified discount rate, determined by the terms of each respective note. The senior notes may also be redeemed by us within 90 days of maturity (or within 180 days of maturity for the notes maturing in 2051) at 100% of the principal amount plus accrued and unpaid interest, and we are required to offer to purchase such notes at 101% of the principal amount, plus accrued and unpaid interest, if we experience a Change of Control Repurchase Event, as defined in the Senior Notes. Also, each respective senior note contains restrictive covenants, including a limitation on secured debt of 15% of our consolidated assets, a limitation on sale and leaseback transactions, and a limitation on certain consolidations, mergers, and sales of assets.
2 The weighted average interest rate for the net commercial paper activity during the years ended December 31, 2024 and 2023 was 5.6% and 5.2%, respectively. We view the notes as a source of long-
term funds and have classified the borrowings under the commercial paper program as long-term borrowings on our balance sheet. We have the intent to roll over such obligations on a long-term basis and have the ability to refinance these borrowings on a long-term basis, as evidenced by our $1,200.0 revolving credit facility maturing in 2026 discussed above.
Maturities are as follows:
| | | | | |
| 2025 | $ | 1.3 | |
| 2026 | 369.1 | |
| 2027 | 500.4 | |
| 2028 | .4 | |
| 2029 | 497.1 | |
| Thereafter | 495.8 | |
| | $ | 1,864.1 | |
Details of our commercial paper program at December 31 are presented in the table below:
| | | | | | | | | | | |
| 2024 | | 2023 |
| Total authorized program | $ | 1,200.0 | | | $ | 1,200.0 | |
| Commercial paper outstanding (classified as long-term debt) | 368.0 | | | 186.0 | |
| Letters of credit issued under the credit agreement | — | | | — | |
| Amount limited by restrictive covenants of credit facility | 388.8 | | | 682.1 | |
| Total program available | $ | 443.2 | | | $ | 331.9 | |
At December 31, 2024, subject to restrictive covenants, we could raise cash by issuing commercial paper through a program that is backed by a $1,200.0 revolving credit facility with a syndicate of 12 lenders. The credit facility allows us to issue total letters of credit up to $125.0. When we issue letters of credit in this manner, our capacity under the revolving facility, and consequently, our ability to issue commercial paper, is reduced by a corresponding amount. We had no outstanding letters of credit under the facility at year end for the periods presented, but we had issued $61.4 and $52.0 at December 31, 2024 and 2023, respectively, of stand-by letters of credit under other bank agreements to take advantage of better pricing. Our borrowing capacity may be limited by covenants to our credit facility. At December 31, 2024, our borrowing capacity under the credit facility was $443.2.
Generally, we may elect one of five types of borrowing under the revolving credit facility, which determines the rate of interest to be paid on the outstanding principal balance. The interest rate would typically be commensurate with the currency borrowed and the term of the borrowing, as well as either (i) a competitive variable or fixed rate or (ii) various published rates plus a pre-defined spread.
We are required to periodically pay accrued interest on any outstanding principal balance under the revolving credit facility at different time intervals based upon the elected interest rate and the elected interest period. Any outstanding principal under this facility will be due upon the maturity date. We may also terminate or reduce the lending commitments under this facility, in whole or in part, upon three business days’ notice. No amounts were outstanding under the revolving credit facility at December 31, 2024 and 2023.
K—Lease Obligations
Substantially all of our operating lease right-of-use assets and operating lease liabilities represent leases for certain operating facilities, warehouses, office space, trucking equipment, and various other assets. Finance lease balances consist of vehicle and certain equipment leases. Our leases have terms that expire at various dates through 2039, some of which include options to extend or terminate the leases at our discretion.
At December 31, 2024, we had $4.0 of additional operating leases that had not yet commenced. These leases will commence in 2025 with average lease terms of five years.
Supplemental balance sheet information related to leases was as follows:
| | | | | | | | | | | |
| December 31, |
| 2024 | | 2023 |
| Operating leases: | | | |
| Operating lease right-of-use assets | $ | 175.7 | | | $ | 193.2 | |
| | | |
| Current portion of operating lease liabilities | $ | 53.4 | | | $ | 57.3 | |
| Operating lease liabilities | 131.1 | | | 150.5 | |
| Total operating lease liabilities | $ | 184.5 | | | $ | 207.8 | |
| | | |
| Finance leases: | | | |
| Sundry | $ | 3.6 | | | $ | 4.0 | |
| | | |
| Current maturities of long-term debt | $ | 1.3 | | | $ | 1.2 | |
| Long-term debt | 2.4 | | | 2.8 | |
| Total finance lease liabilities | $ | 3.7 | | | $ | 4.0 | |
The components of lease expense were as follows:
| | | | | | | | | | | | | | | | | |
| Year Ended December 31, |
| 2024 | | 2023 | | 2022 |
| Operating lease costs: | | | | | |
| Lease costs | $ | 65.6 | | | $ | 65.4 | | | $ | 56.1 | |
| Variable lease costs | 15.0 | | | 18.6 | | | 15.1 | |
| Total operating lease costs | $ | 80.6 | | | $ | 84.0 | | | $ | 71.2 | |
| | | | | |
| Short-term lease costs | $ | 6.6 | | | $ | 6.6 | | | $ | 6.6 | |
| | | | | |
| Finance lease costs: | | | | | |
| Amortization of right-of-use assets | $ | 1.5 | | | $ | 1.8 | | | $ | 1.7 | |
| Interest on lease liabilities | .1 | | | .1 | | | .1 | |
| Total finance lease costs | $ | 1.6 | | | $ | 1.9 | | | $ | 1.8 | |
| | | | | |
| Total lease costs | $ | 88.8 | | | $ | 92.5 | | | $ | 79.6 | |
Variable lease costs consist primarily of taxes, insurance, and common-area or other maintenance costs for our leased facilities and equipment, which are paid based on actual costs incurred by the lessor.
Supplemental cash flow information related to leases was as follows: | | | | | | | | | | | | | | | | | |
| | Year Ended December 31, |
| 2024 | | 2023 | | 2022 |
| Cash paid for amounts included in the measurement of lease liabilities: | | | | | |
| Operating cash flows from operating leases | $ | 66.5 | | | $ | 60.4 | | | $ | 52.4 | |
| Operating cash flows from finance leases | .1 | | | .1 | | | .1 | |
| Financing cash flows from finance leases | 1.5 | | | 1.8 | | | 1.7 | |
| | | | | |
| Right-of-use assets obtained in exchange for new operating lease liabilities | 44.6 | | | 59.8 | | | 53.0 | |
| Right-of-use assets obtained in exchange for new finance lease liabilities | 1.1 | | | 1.4 | | | 1.4 | |
The following table reconciles the undiscounted cash flows for the operating and finance leases at December 31, 2024 to the operating and finance lease liabilities recorded on the Consolidated Balance Sheets:
| | | | | | | | | | | |
| December 31, 2024 |
| Operating Leases | | Finance Leases |
| 2025 | $ | 58.3 | | | $ | 1.4 | |
| 2026 | 53.1 | | | 1.2 | |
| 2027 | 36.7 | | | .9 | |
| 2028 | 19.6 | | | .4 | |
| 2029 | 11.6 | | | — | |
| Thereafter | 16.1 | | | — | |
| Total | 195.4 | | | 3.9 | |
| Less: interest | 10.9 | | | .2 | |
| Lease liability | $ | 184.5 | | | $ | 3.7 | |
| | | |
| Weighted average remaining lease term (years) | 4.2 | | 3.2 |
| Weighted average discount rate | 2.9 | % | | 3.1 | % |
L—Stock-Based Compensation
We use various forms of share-based compensation, which are summarized below. One stock unit is equivalent to one common share for accounting and earnings-per-share purposes. Shares are issued from treasury for the majority of our stock plans’ activity. All share information is presented in millions.
Stock options and stock units are granted pursuant to our Flexible Stock Plan (the "Plan"). On May 8, 2024, the Flexible Stock Plan changed the way awards granted under the plan are charged against the number of available shares. Under the 2024 Plan modification, all options and other awards granted will count as one share against the shares available under the plan.
At December 31, 2024, the following common shares were authorized for issuance under the Plan:
| | | | | | | |
| | Common Shares | | |
| Unexercised options | .4 | | | |
| Outstanding stock units—vested | 3.9 | | | |
| Outstanding stock units—unvested | 1.4 | | | |
| Available for grant | 3.9 | | | |
| Authorized for issuance at December 31, 2024 | 9.6 | | | |
The following table recaps the impact of stock-based compensation on the results of operations for each of the periods presented: | | | | | | | | | | | | | | | | | | | | | | | | | | | | | | | | | | | |
| Year Ended December 31, |
| 2024 | | 2023 | | 2022 |
| To Be Settled With Stock | | To Be Settled In Cash | | To Be Settled With Stock | | To Be Settled In Cash | | To Be Settled With Stock | | To Be Settled In Cash |
| | | | | | | | | | | |
| | | | | | | | | | | |
| | | | | | | | | | | |
Executive Stock Unit (ESU) program matching contributions 1 | $ | 3.7 | | | $ | .7 | | | $ | 3.0 | | | $ | .7 | | | $ | 3.7 | | | $ | .7 | |
| Discounts on various stock awards: | | | | | | | | | | | |
Deferred Stock Compensation Program 2 | 1.2 | | | — | | | 1.5 | | | — | | | 1.6 | | | — | |
ESU program 1 | 1.0 | | | — | | | 1.2 | | | — | | | 1.4 | | | — | |
Discount Stock Plan 3 | .7 | | | — | | | .7 | | | — | | | .8 | | | — | |
Performance Stock Unit (PSU) awards 4 | .1 | | | (.8) | | | 2.6 | | | .6 | | | .8 | | | (2.5) | |
| | | | | | | | | | | |
Restricted Stock Unit (RSU) awards 5 | 11.8 | | | — | | | 8.8 | | | — | | | 10.2 | | | — | |
| Other, primarily non-employee directors restricted stock | .8 | | | — | | | .8 | | | — | | | 1.0 | | | — | |
| Total stock-related compensation expense (income) | 19.3 | | | $ | (.1) | | | 18.6 | | | $ | 1.3 | | | 19.5 | | | $ | (1.8) | |
| Employee contributions for above stock plans | 7.2 | | | | | 9.0 | | | | | 10.6 | | | |
| Total stock-based compensation | $ | 26.5 | | | | | $ | 27.6 | | | | | $ | 30.1 | | | |
| | | | | | | | | | | |
| Tax benefits on stock-based compensation expense | $ | 4.7 | | | | | $ | 4.5 | | | | | $ | 4.7 | | | |
| Tax (expense)/benefits on stock-based compensation payments | (1.1) | | | | | .4 | | | | | 0.6 | | | |
| Total tax benefits associated with stock-based compensation | $ | 3.6 | | | | | $ | 4.9 | | | | | $ | 5.3 | | | |
The following table recaps the impact of stock-based compensation on assets and liabilities for each of the periods presented: | | | | | | | | | | | | | | | | | | | | | | | | | | | | | | | | | | | |
| 2024 | | 2023 |
| Current | | Long-term | | Total | | Current | | Long-term | | Total |
| Assets: | | | | | | | | | | | |
Diversified investments associated with the ESU program 1 | $ | 3.7 | | | $ | 51.4 | | | $ | 55.1 | | | $ | 3.6 | | | $ | 46.8 | | | $ | 50.4 | |
| | | | | | | | | | | |
| Liabilities: | | | | | | | | | | | |
ESU program 1 | $ | 3.7 | | | $ | 50.2 | | | $ | 53.9 | | | $ | 3.7 | | | $ | 48.7 | | | $ | 52.4 | |
PSU awards 4 | — | | | 1.0 | | | 1.0 | | | .1 | | | 1.8 | | | 1.9 | |
| | | | | | | | | | | |
| Other - primarily timing differences between employee withholdings and related employer contributions to be submitted to various plans' trust accounts | 5.5 | | | — | | | 5.5 | | | 5.5 | | | — | | | 5.5 | |
| Total liabilities associated with stock-based compensation | $ | 9.2 | | | $ | 51.2 | | | $ | 60.4 | | | $ | 9.3 | | | $ | 50.5 | | | $ | 59.8 | |
1 ESU Program
The ESU program is a stock-based retirement plan for highly compensated employees. We make a matching contribution of 50% and will make another matching contribution of up to 50% of the
employee’s contributions for the year if certain profitability levels, as defined in the ESU program, are obtained.
Participants in the ESU program may contribute up to 10% (depending upon certain qualifications) of their compensation above a defined threshold. Participant contributions are credited to a diversified investment account established for the participant, and we make premium contributions to the diversified investment accounts equal to 17.65% of the participant’s contribution. A participant’s diversified investment account balance is adjusted to mirror the investment experience, whether positive or negative, of the diversified investments selected by the participant. Participants may change investment elections in the diversified investment accounts, but cannot purchase Company common stock or stock units. The diversified investment accounts consist of various mutual funds and retirement target funds and are unfunded, unsecured obligations of the Company that will be settled in cash. Both the assets and liabilities associated with this program are presented in the table above and are adjusted to fair value at each reporting period.
Company matching contributions to the ESU program, including dividend equivalents, are used to acquire stock units at 85% of the common stock market price on the acquisition date. Stock units are converted to common stock at a 1-to-1 ratio upon distribution from the program and may be settled in cash, except for distributions to the Company's Section 16 Officers.
Company matches in the ESU program fully vest upon five years of cumulative service, subject to certain participation requirements. Distributions are triggered by an employee’s retirement, death, disability, or separation from Leggett.
In 2024, employee contributions were $3.5, and employer premium contributions to diversified investment accounts were $.6. See the stock-based compensation table above for information regarding employer contributions.
Details regarding stock unit activity for the ESU program are reflected in the stock units summary table below.
2 Deferred Compensation Program
We offer a Deferred Compensation Program under which key managers and outside directors may elect to receive stock options, stock units, or interest-bearing cash deferrals in lieu of cash compensation:
•Until January 1, 2025, stock options under this program were granted in the last month of the year prior to the year the compensation was earned. The number of options granted equals the deferred compensation times five, divided by the stock’s market price on the date of grant. The option has a 10-year term. It vests as the associated compensation is earned and becomes exercisable beginning 15 months after the grant date. Stock is issued when the option is exercised. Grant date fair values are calculated using the Black-Scholes option pricing model and are amortized by the straight-line method over the options’ total vesting period, except for employees who are retirement eligible. Expense for employees who are retirement eligible is recognized immediately. Stock option activity for the years presented was not material.
•Deferred stock units (DSU) under this program are acquired every two weeks (when the compensation would have otherwise been paid) at a 20% discount to the market price of our common stock on each acquisition date, and they vest immediately. Expense is recorded as the compensation is earned. Stock units earn dividends at the same rate as cash dividends paid on our common stock. These dividends are used to acquire stock units at a 20% discount. Stock units are converted to common stock and distributed in accordance with the participant’s pre-set election. However, stock units may be settled in cash, but only if there is not a sufficient amount of shares reserved for future issuance under the Flexible Stock Plan. Participants must begin receiving distributions no later than 10 years after the effective date of the deferral, and installment distributions cannot exceed 10 years.
•Interest-bearing cash deferrals under this program are reported in "Other long-term liabilities" on the Consolidated Balance Sheets and are disclosed in Note I. | | | | | | | | | | | | | | | | | |
| Options | | Units | | Cash |
| Aggregate amount of compensation deferred during 2024 | $ | .1 | | | $ | 3.4 | | | $ | .8 | |
3 Discount Stock Plan
Under the Discount Stock Plan (DSP), a tax-qualified §423 stock purchase plan, eligible employees may purchase shares of Leggett common stock at 85% of the closing market price on the last business day of each month. Shares are purchased and issued on the last business day of each month and generally cannot be sold or transferred for one year.
| | | | | |
| Average 2024 purchase price per share (net of discount) | $ | 12.63 | |
| 2024 number of shares purchased by employees | .3 | |
| Shares purchased since inception in 1982 | 24.3 | |
| Maximum shares under the plan | 27.0 | |
4 PSU Awards
Our long-term incentive awards are split between PSUs and RSUs. Beginning in 2023, executive officers received 60% PSUs and 40% RSUs. Prior to 2023, executive officers received two thirds PSUs and one third RSUs. For other selected participants, the award is granted at either half PSUs and half RSUs or 100% RSUs.
We intend to pay 50% in shares of our common stock and 50% in cash, although we reserve the right (subject to the Human Resources and Compensation (HRC) Committee's approval) to pay up to 100% in cash. Cash settlements are recorded as a liability and adjusted to fair value at each reporting period.
2023 and 2024 PSU Awards
In March 2023, the HRC Committee amended the PSU award agreement. Following the amendment, the awards are based on two performance conditions as detailed below. The base payout percentage will be determined by the level of achievement of these performance conditions, and then adjusted by a payout multiplier based on our Total Shareholder Return (TSR) compared to a peer group. Participants will earn from 0% to 200% of the base award.
Grant date fair values are calculated based on the grant date stock price and a Monte Carlo simulation of stock and volatility data for Leggett and each of the peer companies for the payout multiplier. Expense is adjusted quarterly over the three-year vesting period based on the number of shares expected to vest.
The PSU awards contain the following conditions:
•A service requirement—Awards generally "cliff" vest three years following the grant date.
•Two performance conditions over the three-year performance period:
◦50% of the awards are based on Return on Invested Capital (ROIC). ROIC is calculated as our average annual net operating profit after tax divided by our average invested capital.
◦50% of the awards are based on achieving specified Earnings Before Interest, Taxes, Depreciation, and Amortization (EBITDA) performance targets.
•A market condition—The payout multiplier is based upon our relative TSR compared to a group of peer companies during the three-year performance period. The peer group consists of all the companies in the Industrial, Materials, and Consumer Discretionary sectors of the S&P 500 and S&P Midcap 400 (approximately 320 companies). The multiplier will increase or decrease the payout by up to 25%, not to exceed the maximum 200% payout, and may not increase the payout above 100% if our TSR is negative.
2022 and Prior PSU Awards
TSR Based
Previous to 2023, PSU awards were based 50% upon our TSR compared to a peer group. A small number of PSU awards were based 100% upon relative TSR for certain
business unit employees to complement their particular mix of incentive compensation. Grant date fair values were calculated using a Monte Carlo simulation of stock and volatility data for Leggett and each of the peer companies. Grant date fair values are amortized using the straight-line method over the three-year vesting period.
The relative TSR component of the PSU awards contained the following conditions:
•A service requirement—Awards generally “cliff” vest three years following the grant date.
•A market condition—Awards are based on our TSR compared to the same peer group as noted above. Participants will earn from 0% to 200% of the base award depending upon how our TSR ranks within the peer group at the end of the three-year performance period.
EBIT CAGR Based
Previous to 2023, PSU awards were based 50% upon our, or the applicable profit center's, EBIT CAGR. Grant date fair values were calculated using the grant date stock price discounted for dividends over the vesting period. Expense is adjusted quarterly over the three-year vesting period based on the number of shares expected to vest.
The EBIT CAGR component of the PSU awards contained the following conditions:
•A service requirement—Awards generally “cliff” vest three years following the grant date.
•A performance condition—Awards are based on achieving specified EBIT CAGR targets for our, or the applicable profit center's, EBIT during the third year of the period compared to EBIT during the fiscal year immediately preceding the period. Participants will earn from 0% to 200% of the base award.
Below is a summary of shares and grant date fair value related to PSU awards for the periods presented:
| | | | | | | | | | | | | | | | | |
| | Year Ended December 31, |
| | 2024 | | 2023 | | 2022 |
| | | | | |
| Total shares base award | .3 | | | .1 | | | .1 | |
| Grant date per share fair value | $ | 15.30 | | | $ | 29.31 | | | $ | 41.13 | |
| Risk-free interest rate | 4.5 | % | | 4.4 | % | | 1.7 | % |
| Vesting period in years | 3.0 | | 3.0 | | 3.0 |
| Expected volatility | 30.9 | % | | 45.7 | % | | 45.2 | % |
| Expected dividend yield | 9.0 | % | | 5.5 | % | | 4.6 | % |
| | | | | |
| | | | | |
| | | | | |
| | | | | |
| | | | | |
| | | | | | | | | | | | | | | | | | | | | | | | | | | | | | | | |
| Three-Year Performance Cycle for PSU - EBIT CAGR Based |
| Award Year | | Completion Date | | Payout as a
Percent of the
Base Award | | Number of Shares
Distributed | | Cash Portion | | Distribution Date |
| 2020 | | December 31, 2022 | | —% | | — million | | $ | — | | | First quarter 2023 |
| 2021 | | December 31, 2023 | | 6.0% | | <.1 million | | $ | .1 | | | First quarter 2024 |
| 2022 | | December 31, 2024 | | 5.0% | | <.1 million | | $ <.1 | | First quarter 2025 |
There were no stock or cash distributions in the PSU - TSR Based awards in the years presented as our TSR performance relative to the peer group was below the payout criteria for the 2020 - 2022 award years (for which the three-year performance periods ended December 31, 2022, 2023, and 2024).
5 Restricted Stock Unit Awards
RSU awards are generally granted as follows:
•As part of our long-term incentive awards, along with PSUs as discussed above
•As annual awards to selected managers
•On a discretionary basis to selected employees
•As compensation for outside directors
The value of these awards is determined by the stock price on the day of the award, and expense is generally recognized over the three-year vesting period, except for retirement-eligible employees that are expensed immediately at the RSU grant date or as they become retirement eligible. Those who are retirement eligible (after age 65 or on the date where the participant’s age plus years of service is greater than or equal to 70 years) will continue to receive shares that will vest after the retirement date.
Stock Units Summary
As of December 31, 2024, the unrecognized cost of non-vested stock units that is not adjusted to fair value was $7.0 with a weighted-average remaining contractual life of one year.
Stock unit information for the plans discussed above is presented in the table below:
| | | | | | | | | | | | | | | | | | | | | | | | | | | | | | | | | | | | | | | | | | | |
| DSU | | ESU | | PSU | | RSU | | | | Total Units | | Weighted
Average
Grant Date
Fair Value
per Unit | | Aggregate
Intrinsic
Value |
| Unvested at December 31, 2023 | — | | | — | | | .8 | | | .2 | | | | | 1.0 | | | $ | 42.38 | | | |
| Granted based on current service | .3 | | | .4 | | | — | | | .7 | | | | | 1.4 | | | 16.67 | | | |
| Granted based on future conditions* | — | | | — | | | .8 | | | — | | | | | .8 | | | 7.67 | | | |
| Vested | (.3) | | | (.4) | | | — | | | (.5) | | | | | (1.2) | | | 19.45 | | | |
| Forfeited* | — | | | — | | | (.5) | | | (.1) | | | | | (.6) | | | 12.02 | | | |
| | | | | | | | | | | | | | | |
| | | | | | | | | | | | | | | |
| Unvested at December 31, 2024 | — | | | — | | | 1.1 | | | .3 | | | | | 1.4 | | | $ | 13.19 | | | $ | 13.3 | |
| Fully vested shares available for issuance at December 31, 2024 | | | | | | | | | | | 3.9 | | | | | $ | 37.4 | |
*Stock-settled PSU awards (50%) are presented at maximum payout of 200% at grant date and when forfeited.
| | | | | | | | | | | | | | | | | |
| | Year Ended December 31, |
| | 2024 | | 2023 | | 2022 |
| Total intrinsic value of vested stock units converted to common stock | $ | .1 | | | $ | 1.9 | | | $ | 5.7 | |
M—Employee Benefit Plans
In September 2024, the Board of Directors approved a resolution to merge two of our domestic defined benefit pension plans and terminate the resulting merged plan (Frozen Plan) effective December 31, 2024. Participants in the Frozen Plan have stopped earning benefits. The distribution of plan assets and settlement of benefit obligations will occur after the plan termination satisfies all regulatory requirements, which is expected to be completed by mid-2026. The Frozen Plan was underfunded by $4.2 and $6.1 as of December 31, 2024 and 2023, respectively. Additionally, we recognized a curtailment loss of $.7 during the year ended December 31, 2024 associated with the planned termination of the Frozen Plan, primarily due to the immediate recognition of prior service cost.
The Consolidated Balance Sheets reflect a net liability for the funded status of our domestic and foreign defined benefit pension plans as of all periods presented. Our domestic plans (comprised primarily of two significant plans at December 31, 2024 and three significant plans at December 31, 2023 and 2022) represent approximately 85% of our pension benefit obligation in each of the periods presented.
A summary of our pension obligations and funded status as of December 31 is as follows: | | | | | | | | | | | | | | | | | |
| 2024 | | 2023 | | 2022 |
| Change in benefit obligation | | | | | |
| Benefit obligation, beginning of period | $ | 194.6 | | | $ | 191.2 | | | $ | 270.4 | |
| Service cost | 2.8 | | | 3.4 | | | 5.3 | |
| Interest cost | 9.1 | | | 9.2 | | | 6.6 | |
| Plan participants’ contributions | .4 | | .4 | | .4 |
Actuarial loss (gain) 1 | (10.3) | | | 4.8 | | | (71.6) | |
| Benefits paid | (16.0) | | | (15.8) | | | (15.9) | |
| Plan amendments | .1 | | | — | | | — | |
| Curtailments and settlements | (.7) | | | — | | | — | |
| Foreign currency exchange rate changes | (1.3) | | | 1.4 | | | (4.0) | |
| Other | (.2) | | | — | | | — | |
| Benefit obligation, end of period | $ | 178.5 | | | $ | 194.6 | | | $ | 191.2 | |
| Change in plan assets | | | | | |
| Fair value of plan assets, beginning of period | $ | 187.8 | | | $ | 175.8 | | | $ | 227.7 | |
| Actual return on plan assets | 7.3 | | | 20.9 | | | (35.4) | |
| Employer contributions | 1.0 | | | 5.0 | | | 2.9 | |
| Plan participants’ contributions | .4 | | | .4 | | | .4 | |
| Benefits paid | (16.0) | | | (15.8) | | | (15.9) | |
| Settlements | (.2) | | | — | | | — | |
| Foreign currency exchange rate changes | (1.2) | | | 1.5 | | | (3.9) | |
| Other | (.2) | | | — | | | — | |
| Fair value of plan assets, end of period | $ | 178.9 | | | $ | 187.8 | | | $ | 175.8 | |
| Net funded status | $ | .4 | | | $ | (6.8) | | | $ | (15.4) | |
| Funded status recognized in the Consolidated Balance Sheets | | | | | |
| Other assets—sundry | $ | 7.3 | | | $ | 4.7 | | | $ | 3.9 | |
| Other current liabilities | (.3) | | | (.3) | | | (.3) | |
| Other long-term liabilities | (6.6) | | | (11.2) | | | (19.0) | |
| Net funded status | $ | .4 | | | $ | (6.8) | | | $ | (15.4) | |
1 Year-over-year fluctuations in "Actuarial loss (gain)" are primarily driven by changes in the weighted average discount rate assumptions.
Our accumulated benefit obligation was not materially different from our projected benefit obligation for the periods presented.
Comprehensive Income (Loss)
Amounts and activity included in “Accumulated other comprehensive loss” in the Consolidated Balance Sheets associated with pensions are reflected below: | | | | | | | | | | | | | | | | | | | | | | | | | | | | | | | | | | | |
| December 31, 2023 | | 2024 Amortization | | 2024 Net Actuarial Loss | | 2024 Foreign Currency Exchange Rates Change | | 2024 Income Tax Change | | December 31, 2024 |
| Net (loss) gain (before tax) | $ | (20.5) | | | $ | .8 | | | $ | 7.5 | | | $ | .2 | | | $ | — | | | $ | (12.0) | |
| Deferred income taxes | 6.9 | | | $ | — | | | — | | | — | | | (2.1) | | | 4.8 | |
| Accumulated other comprehensive income (loss) (net of tax) | $ | (13.6) | | | $ | .8 | | | $ | 7.5 | | | $ | .2 | | | $ | (2.1) | | | $ | (7.2) | |
Net Pension Expense (Income)
Components of net pension expense (income) for the years ended December 31 were as follows: | | | | | | | | | | | | | | | | | |
| 2024 | | 2023 | | 2022 |
| Service cost | $ | 2.8 | | | $ | 3.4 | | | $ | 5.3 | |
| Interest cost | 9.1 | | | 9.2 | | | 6.6 | |
| Expected return on plan assets | (11.5) | | | (10.9) | | | (13.2) | |
| | | | | |
| Recognized net actuarial loss | 1.1 | | | 1.3 | | | 2.5 | |
| | | | | |
| Curtailments and settlements | .7 | | | — | | | — | |
| Net pension expense | $ | 2.2 | | | $ | 3.0 | | | $ | 1.2 | |
| Weighted average assumptions for pension costs: | | | | | |
| Discount rate | 4.8 | % | | 5.0 | % | | 2.5 | % |
| Rate of compensation increase | 3.4 | % | | 3.4 | % | | 3.5 | % |
| Expected return on plan assets | 6.4 | % | | 6.4 | % | | 6.0 | % |
| Weighted average assumptions for benefit obligation: | | | | | |
| Discount rate | 5.3 | % | | 4.8 | % | | 5.0 | % |
| Rate of compensation increase | 3.1 | % | | 3.4 | % | | 3.4 | % |
Assumptions used for domestic and international plans were not significantly different.
The components of net pension expense other than the service cost are included in the line item "Other expense (income), net" in the Consolidated Statements of Operations.
We use the Pension Liability Index rate to determine the discount rate used for our significant pension plans. The Pension Liability Index rate is a calculated rate using yearly spot rates matched against expected future benefit payments. The discount rates used for our other, primarily foreign, plans are based on rates appropriate for the respective country and the plan obligations.
The overall expected long-term rate of return is based on each plan’s historical experience and our expectations of future returns based upon each plan’s investment holdings, as discussed below.
Pension Plan Assets
The fair value of our major categories of pension plan assets is disclosed below using a three-level valuation hierarchy that separates fair value valuation techniques into the following categories:
•Level 1: Quoted prices for identical assets or liabilities in active markets.
•Level 2: Other significant inputs observable either directly or indirectly (including quoted prices for similar securities, interest rates, yield curves, credit risk, etc.).
•Level 3: Unobservable inputs that are not corroborated by market data.
Presented below are our major categories of investments for the periods presented: | | | | | | | | | | | | | | | | | | | | | | | | | | | | | | | | | | | | | | | | | | | | | | | | | | | | | | | | | | | |
| | Year Ended December 31, 2024 | | Year Ended December 31, 2023 |
| | Level 1 | | Level 2 | | Level 3 1 | | Assets Measured at NAV 2 | | Total | | Level 1 | | Level 2 | | Level 3 1 | | Assets Measured at NAV 2 | | Total |
| Mutual and pooled funds | | | | | | | | | | | | | | | | | | | |
| Fixed income | $ | 102.9 | | | $ | 11.6 | | | $ | — | | | $ | — | | | $ | 114.5 | | | $ | 46.3 | | | $ | 1.4 | | | $ | — | | | $ | — | | | $ | 47.7 | |
| Equities | 35.9 | | | 1.5 | | | — | | | — | | | 37.4 | | | 107.2 | | | 12.8 | | | — | | | — | | | 120.0 | |
| Stable value funds | — | | | — | | | — | | | — | | | — | | | — | | | 7.3 | | | — | | | — | | | 7.3 | |
| Money market funds, cash and other | — | | | — | | | 6.3 | | | 20.7 | | | 27.0 | | | — | | | — | | | 6.9 | | | 5.9 | | | 12.8 | |
| Total investments at fair value | $ | 138.8 | | | $ | 13.1 | | | $ | 6.3 | | | $ | 20.7 | | | $ | 178.9 | | | $ | 153.5 | | | $ | 21.5 | | | $ | 6.9 | | | $ | 5.9 | | | $ | 187.8 | |
1 We entered into a buy-in arrangement during 2023 for one of our frozen international plans. The bulk purchase annuity policy assets from this transaction are classified as level 3 in the fair value hierarchy.
2 Certain investments that are measured at fair value using the net asset value (NAV) per share (or its equivalent) practical expedient have not been classified in the fair value hierarchy. Our investment policy and strategies are established with a long-term view in mind. We strive for a sufficiently diversified asset mix to minimize the risk of a material loss to the portfolio value due to the devaluation of any single investment. In determining the appropriate asset mix, our financial strength and ability to fund potential shortfalls that might result from poor investment performance are considered. The assets in our Frozen Plan employ a liability-driven investment strategy and have a target allocation of 100% fixed income. The remaining significant plan has a target allocation of 75% equities and 25% fixed income, as historical equity returns have tended to exceed bond returns over the long term.
Future Contributions and Benefit Payments (excluding plan termination impacts discussed above)
We expect to contribute approximately $.3 to our defined benefit pension plans in 2025.
Estimated benefit payments expected over the next 10 years are as follows:
| | | | | |
| 2025 | $ | 13.4 | |
| 2026 | 13.6 | |
| 2027 | 14.0 | |
| 2028 | 14.3 | |
| 2029 | 14.4 | |
| 2030-2034 | 67.6 | |
Defined Contribution Plans
Total expense for our defined contribution plans was $15.4, $14.2, and $13.7 for the years ended December 31, 2024, 2023, and 2022, respectively.
Multi-employer Pension Plan
We have limited participation in one union-sponsored, defined benefit, multi-employer pension plan that covers selected employees at one of our locations in the Aerospace Products Group. The plan is not administered by us, and contributions are determined in accordance with provisions of negotiated labor contracts. Aggregate contributions to the plan were immaterial for each of the years presented. In addition to regular contributions, we could be obligated to pay additional contributions (known as complete or partial withdrawal liabilities) if a plan has unfunded vested benefits. Factors that could impact the funded status of the plan include investment performance, changes in the participant demographics, financial stability of contributing employers, and changes in actuarial assumptions. Withdrawal liability triggers could include a plan's termination, a withdrawal of substantially all employers, or our voluntary withdrawal from the plan (such as decision to close a facility or the dissolution of a collective bargaining unit). We have a very small share of the liability among the participants of the plan. Based upon the information available from the plan administrator, the multi-employer plan in which we participate is underfunded, and we estimate our aggregate share of potential withdrawal liability for the plan to approximate $16.0. We have not recorded any material withdrawal liabilities for the years presented.
N—Other Expense (Income), Net
The components of "Other expense (income), net" were as follows: | | | | | | | | | | | | | | | | | |
| | Year Ended December 31, |
| | 2024 | | 2023 | | 2022 |
| | | | | |
| | | | | |
Restructuring charges (See Note E) | $ | 18.7 | | | $ | 2.9 | | | $ | 1.4 | |
| | | | | |
| Currency (gain) loss | (.4) | | | 4.2 | | | (3.3) | |
| | | | | |
(Gain) loss from diversified investments associated with the ESU program | (6.7) | | | (7.7) | | | 8.4 | |
Reduction to contingent purchase price liability (See Note R) | (6.4) | | | (14.9) | | | (1.2) | |
| | | | | |
| | | | | |
Non-service pension income (See Note M) | (.6) | | | (.4) | | | (4.1) | |
| Other (income) expense | (3.1) | | | 2.1 | | | (1.0) | |
| $ | 1.5 | | | $ | (13.8) | | | $ | .2 | |
The components of "Earnings (loss) before income taxes" are as follows:
| | | | | | | | | | | | | | | | | |
| | Year Ended December 31, |
| | 2024 | | 2023 | | 2022 |
| Domestic | $ | (586.2) | | | $ | (388.6) | | | $ | 163.6 | |
| Foreign | 77.0 | | | 215.2 | | | 240.0 | |
| Earnings (loss) before income taxes | $ | (509.2) | | | $ | (173.4) | | | $ | 403.6 | |
"Income taxes" is comprised of the following components:
| | | | | | | | | | | | | | | | | |
| | Year Ended December 31, |
| | 2024 | | 2023 | | 2022 |
| Current | | | | | |
| Federal | $ | 7.2 | | | $ | 24.4 | | | $ | 48.3 | |
| State and local | 1.4 | | | 3.7 | | | 7.9 | |
| Foreign | 51.6 | | | 64.5 | | | 53.2 | |
| Total current | 60.2 | | | 92.6 | | | 109.4 | |
| Deferred | | | | | |
| Federal | (48.6) | | | (100.6) | | | (14.1) | |
| State and local | (7.2) | | | (19.9) | | | (2.0) | |
| Foreign | (2.2) | | | (8.7) | | | .4 | |
| Total deferred | (58.0) | | | (129.2) | | | (15.7) | |
| Total income taxes | $ | 2.2 | | | $ | (36.6) | | | $ | 93.7 | |
"Income taxes" as a percentage of "Earnings (loss) before income taxes" differs from the statutory federal income tax rate as follows:
| | | | | | | | | | | | | | | | | |
| | Year Ended December 31, |
| | 2024 | | 2023 | | 2022 |
| Statutory federal income tax rate | 21.0 | % | | 21.0 | % | | 21.0 | % |
| Increases (decreases) in rate resulting from: | | | | | |
| State taxes, net of federal benefit | .1 | | | .2 | | | .9 | |
| Tax effect of foreign operations | .8 | | | (1.4) | | | (.5) | |
| Global intangible low-taxed income (GILTI) | (.4) | | | (1.5) | | | .6 | |
| Current and deferred foreign withholding taxes | (1.9) | | | (7.3) | | | 2.6 | |
| Goodwill and long-lived asset impairments | (19.5) | | | 5.4 | | | — | |
| | | | | |
| Stock-based compensation | (.2) | | | .1 | | | (.1) | |
| | | | | |
| Change in valuation allowance | (1.3) | | | (.4) | | | (.1) | |
| Change in uncertain tax positions, net | (.1) | | | (.3) | | | — | |
| | | | | |
| Other permanent differences, net | 1.1 | | | 3.9 | | | (1.0) | |
| Other, net | — | | | 1.4 | | | (.2) | |
| Effective tax rate | (.4) | % | | 21.1 | % | | 23.2 | % |
Dollar amounts for significant items for all years presented are discussed below.
For all periods presented, the tax rate benefited from income earned in various foreign jurisdictions at rates lower than the U.S. federal statutory rate, primarily in China and Cyprus. In 2023, the rate associated with foreign operations was also adversely impacted by changes in estimates related to tax filings and a reduction to a contingent purchase price liability.
In 2024, our rate was adversely impacted by $99.3 primarily due to non-deductible tax effects from goodwill impairment charges, but benefited by $9.4 in 2023 from deductible tax effects of other long-lived asset impairment charges, both of which are discussed in Note F. We also recognized tax expense related to foreign withholding taxes of $9.7, $12.7, and $10.5, and other net tax (benefits) expenses of $(.8), $(5.9), and $.4 for the years ended December 31, 2024, 2023, and 2022, respectively. In 2024, our rate was also adversely impacted by $4.8 due to a change in valuation allowance related to a 2022 acquisition in our Specialized Products segment. We file tax returns in each jurisdiction where we are required to do so. In these jurisdictions, a statute of limitations period exists. After a statute period expires, the tax authorities can no longer assess additional income tax for the expired period. In addition, once the statute expires we are no longer eligible to file claims for refund for any tax that we may have overpaid.
Unrecognized Tax Benefits
The total amount of our gross unrecognized tax benefits including interest and penalties at December 31, 2024, 2023, and 2022 was $8.0 (of which $3.9 would impact our effective tax rate, if recognized), $5.0, and $5.9, respectively. We recognize interest and penalties related to unrecognized tax benefits as part of income tax expense in the Consolidated Statements of Operations, which is consistent with prior reporting periods.
We are currently in various stages of audit by certain governmental tax authorities. We have established liabilities for unrecognized tax benefits as appropriate, with such amounts representing a reasonable provision for taxes we ultimately might be required to pay. However, these liabilities could be adjusted over time as more information becomes known and management continues to evaluate the progress of these examinations.
We are not subject to significant U.S. federal tax examinations for years prior to 2021, or significant U.S. state or foreign income tax examinations for years prior to 2015.
It is reasonably possible that the resolution of certain tax audits could reduce our unrecognized tax benefits within the next 12 months, as certain tax positions may either be sustained on audit or we may agree to certain adjustments, or resulting from the expiration of statutes of limitations in various jurisdictions. It is not expected that any change would have a material impact on our Consolidated Financial Statements.
Deferred Income Taxes
Deferred income taxes are provided for the temporary differences between the financial reporting basis and the tax basis of our assets and liabilities. The major temporary differences and their associated deferred tax assets or liabilities are as follows: | | | | | | | | | | | | | | | | | | | | | | | |
| | December 31, |
| | 2024 | | 2023 |
| | Assets | | Liabilities | | Assets | | Liabilities |
| Property, plant and equipment | $ | 13.7 | | | $ | (76.2) | | | $ | 14.7 | | | $ | (80.7) | |
| Inventories | 5.8 | | | (.7) | | | 6.5 | | | (1.0) | |
| Accrued expenses | 51.1 | | | (.3) | | | 52.7 | | | (.6) | |
Net operating losses and other tax carryforwards 1 | 56.2 | | | — | | | 39.8 | | | — | |
| Pension cost and other post-retirement benefits | 3.8 | | | (.9) | | | 5.6 | | | (.9) | |
| | | | | | | |
Intangible assets 2 | 10.8 | | | (69.1) | | | 12.0 | | | (108.2) | |
| Derivative financial instruments | .9 | | | (4.0) | | | .5 | | | (4.2) | |
| Capitalized research and experimentation expenses | 12.5 | | | — | | | 9.1 | | | — | |
| Tax on undistributed earnings (primarily from Canada and China) | — | | | (18.6) | | | — | | | (18.5) | |
| Uncertain tax positions | 3.3 | | | — | | | .7 | | | — | |
| Other | 9.9 | | | (8.3) | | | 9.7 | | | (7.5) | |
| Gross deferred tax assets (liabilities) | 168.0 | | | (178.1) | | | 151.3 | | | (221.6) | |
| Valuation allowance | (20.5) | | | — | | | (17.7) | | | — | |
| Total deferred taxes | $ | 147.5 | | | $ | (178.1) | | | $ | 133.6 | | | $ | (221.6) | |
| Net deferred tax liability | | | $ | (30.6) | | | | | $ | (88.0) | |
1 The $16.4 increase in our deferred tax asset was primarily associated with the U.S. interest expense limitation related to an expired provision of the Tax Cuts and Jobs Act of 2017.
2 Intangible assets includes a $39.1 decrease in our deferred tax liability relating primarily to the goodwill and long-lived asset impairment charges discussed in Note F.
Deferred tax assets (liabilities) included in the Consolidated Balance Sheets are as follows:
| | | | | | | | | | | |
| | December 31, |
| | 2024 | | 2023 |
| Sundry | $ | 18.3 | | | $ | 13.2 | |
| Deferred income taxes | (48.9) | | | (101.2) | |
| Net deferred tax liability | $ | (30.6) | | | $ | (88.0) | |
The valuation allowance recorded primarily relates to net operating loss, tax credit, and capital loss carryforwards for which utilization is uncertain. Cumulative tax losses in certain state and foreign jurisdictions during recent years, limited carryforward periods in certain jurisdictions, future reversals of existing taxable temporary differences, and reasonable tax planning strategies were among the factors considered in determining the valuation allowance. Individually, none of these tax carryforwards presents a material exposure.
Most of our tax carryforwards have expiration dates that vary generally over the next 20 years, with no amount greater than $10.0 expiring in any one year.
Deferred withholding taxes (tax on undistributed earnings) have been provided on the earnings of our foreign subsidiaries to the extent it is anticipated that the earnings will be remitted in the future as dividends. We are not asserting permanent reinvestment on $541.1 of our earnings and have accrued tax on these undistributed earnings as presented in the table above.
Foreign withholding taxes have not been provided on certain foreign earnings which are indefinitely reinvested outside the United States. The cumulative undistributed earnings which are indefinitely reinvested as of December 31, 2024, are $316.9. If such earnings were repatriated to the United States through dividends, the resulting incremental tax expense would approximate $19.2, based on present income tax laws.
P—Accumulated Other Comprehensive Income (Loss)
The following table sets forth the changes in each component of accumulated other comprehensive income (loss):
| | | | | | | | | | | | | | | | | | | | | | | |
| Foreign
Currency
Translation
Adjustments | | Cash
Flow
Hedges | | Defined
Benefit
Pension
Plans | | Accumulated
Other
Comprehensive
Income (Loss) |
| Balance at January 1, 2022 | $ | (11.7) | | | $ | 11.9 | | | $ | (38.5) | | | $ | (38.3) | |
| Other comprehensive income (loss) | (71.8) | | | (3.7) | | | 23.8 | | | (51.7) | |
| Reclassifications, pretax | — | | | (.5) | | | 2.5 | | | 2.0 | |
| Income tax effect | — | | | .7 | | | (6.2) | | | (5.5) | |
| | | | | | | |
| Balance at December 31, 2022 | (83.5) | | | 8.4 | | | (18.4) | | | (93.5) | |
| Other comprehensive income (loss) | 40.9 | | | 3.0 | | | 1.3 | | | 45.2 | |
| Reclassifications, pretax | — | | | 2.2 | | | 5.0 | | | 7.2 | |
| Income tax effect | — | | | (1.1) | | | (1.5) | | | (2.6) | |
| | | | | | | |
| Balance at December 31, 2023 | (42.6) | | | 12.5 | | | (13.6) | | | (43.7) | |
| Other comprehensive income (loss) | (73.2) | | | (3.1) | | | 7.7 | | | (68.6) | |
| Reclassifications, pretax | — | | | (3.2) | | | .8 | | | (2.4) | |
| Income tax effect | — | | | 1.0 | | | (2.1) | | | (1.1) | |
| | | | | | | |
| Balance at December 31, 2024 | $ | (115.8) | | | $ | 7.2 | | | $ | (7.2) | | | $ | (115.8) | |
| | | | | | | |
| | | | | | | |
| | | | | | | |
| | | | | | | |
| | | | | | | |
| | | | | | | |
| | | | | | | |
| | | | | | | |
| | | | | | | |
| | | | | | | |
| | | | | | | |
| | | | | | | |
| | | | | | | |
| | | | | | | |
| | | | | | | |
| | | | | | | |
| | | | | | | |
| | | | | | | |
| | | | | | | |
| | | | | | | |
| | | | | | | |
Q—Fair Value
We utilize fair value measures for both financial and non-financial assets and liabilities.
Items measured at fair value on a recurring basis
Fair value measurements are established using a three-level valuation hierarchy that prioritizes the inputs to valuation techniques used to measure fair value into the following categories:
•Level 1: Quoted prices for identical assets or liabilities in active markets.
•Level 2: Inputs, other than quoted prices included in Level 1, that are observable for the asset or liability either directly or indirectly. Short-term investments in this category are valued using discounted cash flow techniques with all significant inputs derived from or supported by observable market data. Derivative assets and liabilities in this category are valued using models that consider various assumptions and information from market-corroborated sources. The models used are primarily industry-standard models that consider items such as quoted prices, market interest rate curves applicable to the instruments being valued as of the end of each period, discounted cash flows, volatility factors, current market, and contractual prices for the underlying instruments, as well as other relevant economic measures. Substantially all of these assumptions are observable in the marketplace, can be derived from observable data, or are supported by observable levels at which transactions are executed in the marketplace.
•Level 3: Unobservable inputs that are not corroborated by market data.
The areas in which we utilize fair value measures of financial assets and liabilities are presented in the table below: | | | | | | | | | | | | | | | | | | | | | | | |
| | As of December 31, 2024 |
| | Level 1 | | Level 2 | | Level 3 | | Total |
| Assets: | | | | | | | |
| Cash equivalents: | | | | | | | |
| Bank time deposits with original maturities of three months or less | $ | — | | | $ | 156.0 | | | $ | — | | | $ | 156.0 | |
Derivative assets (see Note S) | — | | | 5.1 | | | — | | | 5.1 | |
Diversified investments associated with the ESU program (see Note L) | 55.1 | | | — | | | — | | | 55.1 | |
| Total assets | $ | 55.1 | | | $ | 161.1 | | | $ | — | | | $ | 216.2 | |
| Liabilities: | | | | | | | |
Derivative liabilities (see Note S) | $ | — | | | $ | 7.0 | | | $ | — | | | $ | 7.0 | |
Liabilities associated with the ESU program (see Note L) | 53.9 | | | — | | | — | | | 53.9 | |
| Total liabilities | $ | 53.9 | | | $ | 7.0 | | | $ | — | | | $ | 60.9 | |
| | | | | | | | | | | | | | | | | | | | | | | |
| | As of December 31, 2023 |
| | Level 1 | | Level 2 | | Level 3 | | Total |
| Assets: | | | | | | | |
| Cash equivalents: | | | | | | | |
| Bank time deposits with original maturities of three months or less | $ | — | | | $ | 147.5 | | | $ | — | | | $ | 147.5 | |
Derivative assets (see Note S) | — | | | 6.2 | | | — | | | 6.2 | |
Diversified investments associated with the ESU program (see Note L) | 50.4 | | | — | | | — | | | 50.4 | |
| Total assets | $ | 50.4 | | | $ | 153.7 | | | $ | — | | | $ | 204.1 | |
| Liabilities: | | | | | | | |
Derivative liabilities (see Note S) | $ | — | | | $ | 3.5 | | | $ | — | | | $ | 3.5 | |
Liabilities associated with the ESU program (see Note L) | 52.4 | | | — | | | — | | | 52.4 | |
| Total liabilities | $ | 52.4 | | | $ | 3.5 | | | $ | — | | | $ | 55.9 | |
There were no transfers between Level 1 and Level 2 for any of the periods presented.
The fair value for fixed rate debt (Level 1) was approximately $245.0 less than carrying value of $1,488.3 at December 31, 2024 and was approximately $175.0 less than carrying value of $1,786.4 at December 31, 2023.
Items measured at fair value on a non-recurring basis
The primary areas in which we utilize fair value measures of non-financial assets and liabilities are allocating purchase price to the assets and liabilities of acquired companies (Note R) and evaluating long-term assets (including goodwill) for potential impairment (Note F). Determining fair values for these items requires
significant judgment and includes a variety of methods and models that utilize significant Level 3 inputs (Note A). R—Acquisitions
The following table contains the estimated fair values of the assets acquired and liabilities assumed and the estimated intangible asset lives at the date of acquisition for all acquisitions during the periods presented (using inputs discussed in Note A). Of the goodwill included in the table below, none is expected to be deductible for tax purposes. | | | | | | | | | |
| | | | | 2022 |
| Accounts receivable | | | | | $ | 37.8 | |
| Inventories | | | | | 43.0 | |
| Property, plant and equipment | | | | | 16.6 | |
| | | | | 42.5 | |
Other intangible assets (see Note G) | | | | | |
| Customer relationships (8 to 15 year life) | | | | | 22.0 | |
| Technology (10 year life) | | | | | 11.3 | |
| Trademarks and trade names (8 to 15 year life) | | | | | 7.1 | |
| Non-compete agreements (5 year life) | | | | | .2 | |
| Other current and long-term assets | | | | | 9.1 | |
| Current liabilities | | | | | (54.7) | |
| Deferred income taxes | | | | | (17.7) | |
| Other long-term liabilities | | | | | (5.0) | |
| | | | | |
| Fair value of net identifiable assets | | | | | 112.2 | |
| Less: additional consideration (receivable) | | | | | (1.3) | |
| | | | | |
| Less: additional contingent consideration payable | | | | | 30.2 | |
| | | | | |
| Net cash consideration | | | | | $ | 83.3 | |
The following table summarizes acquisitions for the periods presented.
| | | | | | | | | | | | | | | | | | | | |
| Year Ended | | Number of
Acquisitions | | Segment | | Product/Service |
| December 31, 2024 | | None | | | | |
| December 31, 2023 | | None | | | | |
| December 31, 2022 | | 4 | | Specialized Products
Furniture, Flooring & Textile Products | | Manufacturer of hydraulic cylinders for heavy construction equipment;
Converter and distributor of construction fabrics for the furniture and bedding industries;
Distributor of products used for erosion control and geosynthetic products for civil construction applications;
Distributor of products used for erosion control and stormwater management |
The results of operations of the above acquired companies have been included in the consolidated financial statements since the dates of each acquisition. The unaudited pro forma consolidated net trade sales, net earnings, and earnings per share as though these acquisitions had occurred on January 1 of each year presented are not materially different from the amounts reflected in the accompanying financial statements.
Certain of our acquisition agreements provide for additional contingent consideration to be paid based upon analysis of the closing balance sheet and if the acquired company's performance exceeds certain targeted levels through December 31, 2025. Such additional consideration will be paid in cash and the liability is recorded at discounted fair value at the acquisition date. Components of the liability are based on estimates and
contingent upon future events, therefore, the amounts may fluctuate materially until the payment dates. Subsequent measurement of the estimate is recorded in "Other expense (income), net" in the Consolidated Statements of Operations (see Note N). Our liability for these future payments was $5.3 ($5.3 current) at December 31, 2024, $12.4 ($6.1 current and $6.3 long-term) at December 31, 2023, and $31.9 ($14.4 current and $17.5 long-term) at December 31, 2022. Additional consideration paid for acquisitions was $.5 and $4.5 in the years ended 2024 and 2023, respectively. No payments were made in 2022. No businesses were acquired during 2024 or 2023. A brief description of our acquisition activity for 2022 is included below. Final purchase prices and goodwill values include measurement period adjustments recorded subsequent to the values shown in the above table.
We acquired four businesses in the last half of 2022:
•A small U.S. textiles business that converts and distributes construction fabrics for the furniture and bedding industries. This acquisition became a part of our Furniture, Flooring & Textile Products segment. The final purchase price was $2.0 and added no goodwill.
•A global manufacturer of hydraulic cylinders for heavy construction equipment. This business has manufacturing locations in Germany and China and a distribution facility in the United States, and operates within the Specialized Products segment. The final purchase price was $87.8 and added $41.9 of goodwill. As discussed in Note F, the goodwill for this acquisition was fully impaired in 2024. •Two Canadian distributors of products used for erosion control, stormwater management, and various other applications that expanded the geographic scope of our Geo Components business unit. These acquisitions became a part of our Furniture, Flooring & Textile Products segment.
◦An acquisition with a final purchase price of $7.5 and added $3.5 goodwill.
◦An acquisition with a final purchase price of $12.9 and added $.7 goodwill.
S—Derivative Financial Instruments
The following table presents assets and liabilities representing the fair value of our most significant derivative financial instruments. The fair values of the derivatives reflect the change in the market value of the derivative from the date of the trade execution and do not consider the offsetting underlying hedged item. | | | | | | | | | | | | | | | | | | | | | | | | | | | | | | | | | | | | | | |
| | | Expiring at various dates through: | | Total USD
Equivalent
Notional
Amount | | As of December 31, 2024 |
| Derivatives | | | Assets | | Liabilities |
| Other Current
Assets | | Sundry | | Other Current
Liabilities | | Other Long-Term
Liabilities |
| Designated as hedging instruments | | | | | | | | | | | | |
| Total cash flow hedges-currency hedges | | Jun 2026 | | $ | 254.0 | | | $ | 3.1 | | | $ | .3 | | | $ | 5.8 | | | $ | .3 | |
| Total fair value hedges | | Jun 2025 | | 19.0 | | | .1 | | | — | | | .1 | | | — | |
| | | | | | | | | | | | |
| | | | | | | | | | | | |
| Not designated as hedging instruments | | Dec 2025 | | 166.5 | | | 1.6 | | | — | | | .8 | | | — | |
| Total derivatives | | | | | | $ | 4.8 | | | $ | .3 | | | $ | 6.7 | | | $ | .3 | |
| | | | | | | | | | | | | | | | | | | | | | | | | | | | | | | | | | | | | | |
| | | Expiring at various dates through: | | Total USD
Equivalent
Notional
Amount | | As of December 31, 2023 |
| Derivatives | | | Assets | | Liabilities |
| | Other Current
Assets | | Sundry | | Other Current
Liabilities | | Other Long-Term
Liabilities |
| | | | | | | | | | | | |
| | | | | | | | | | | | |
| | | | | | | | | | | | |
| | | | | | | | | | | | |
| | | | | | | | | | | | |
| | | | | | | | | | | | |
| | | | | | | | | | | | |
| Designated as hedging instruments | | | | | | | | | | | | |
| Total cash flow hedges-currency hedges | | Jun 2025 | | $ | 298.2 | | | $ | 5.3 | | | $ | .5 | | | $ | 2.4 | | | $ | .2 | |
| | | | | | | | | | | | |
| | | | | | | | | | | | |
| Total fair value hedges | | Mar 2024 | | 21.7 | | | .3 | | | — | | | — | | | — | |
| | | | | | | | | | |
| | | | | | | | | | | | |
| | | | | | | | | | | | |
| Not designated as hedging instruments | | Dec 2024 | | 87.9 | | | .1 | | | — | | | .9 | | | — | |
| Total derivatives | | | | | | $ | 5.7 | | | $ | .5 | | | $ | 3.3 | | | $ | .2 | |
| | | | | | | | | | | | |
The following table sets forth the pretax (gains) losses for our hedging activities for the years presented. This schedule includes reclassifications from accumulated other comprehensive income as well as derivative settlements recorded directly to income or expense.
| | | | | | | | | | | | | | | | | | | | | | | | | | |
| | | Income Statement Caption | | Amount of Loss (Gain) Recorded in Income for the Year Ended December 31, |
| Derivatives | | 2024 | | 2023 | | 2022 |
| | | | | | | |
| Designated as hedging instruments | | | | | | | | |
Interest rate cash flow hedges 1 | | Interest expense | | $ | (.3) | | | $ | (.3) | | | $ | 2.3 | |
| Currency cash flow hedges | | Net trade sales | | 1.6 | | | 3.7 | | | .5 | |
| Currency cash flow hedges | | Cost of goods sold | | (1.7) | | | (2.5) | | | (2.8) | |
| | | | | | | | |
| Total cash flow hedges | | | | (.4) | | | .9 | | | — | |
| Fair value hedges | | Other expense (income), net | | .5 | | | .9 | | | 3.5 | |
| Not designated as hedging instruments | | Other expense (income), net | | (5.7) | | | 3.9 | | | (1.3) | |
| | | | | | | | |
| | | | | | | | |
| | | | | | | | |
| | | | | | | | |
| | | | | | | | |
| | | | | | | | |
| | | | | | | | |
| Total derivative instruments | | | | $ | (5.6) | | | $ | 5.7 | | | $ | 2.2 | |
| | | | | | | | |
| | | | | | | | |
1 In the third quarter of 2022, we completed amortization of the $43.0 loss on our $200.0 forward starting interest rate swap that was related to our 2012 $300.0 Senior Notes; the 2012 issuance matured and was fully paid in the third quarter of 2022.
T—Contingencies
We are a party to various proceedings and matters involving employment, intellectual property, environmental, taxation, vehicle-related personal injury, and other laws. When it is probable, in management's judgment, that we may incur monetary damages or other costs resulting from these proceedings or other claims, and we can reasonably estimate the amounts, we record appropriate accruals in the financial statements and make charges against earnings. For all periods presented, we have recorded no material charges against earnings. Also, when it is reasonably possible that we may incur additional loss in excess of recorded accruals, and we can reasonably estimate the additional losses or range of losses, we disclose such additional reasonably possible losses in these notes.
Accruals and Reasonably Possible Losses in Excess of Accruals
Accruals for Probable Losses
Although we deny liability in all currently threatened or pending litigation proceedings, we have recorded a litigation contingency accrual for our reasonable estimate of probable loss, in the aggregate, of $1.4, $1.4, and $.9 at December 31, 2024, 2023, and 2022, respectively. There were no material adjustments to the accrual, including cash payments and expense, for each of the years ended December 31, 2024, 2023, and 2022, respectively. The accruals do not include accrued expenses related to workers' compensation, vehicle-related personal injury, product and general liability claims, taxation issues, and environmental matters, some of which may contain a portion of litigation expense. However, any litigation expense associated with these categories is not anticipated to have a material effect on our financial condition, results of operations, or cash flows. For more information regarding accrued expenses, see Note I. Reasonably Possible Losses in Excess of Accruals
Although there are a number of uncertainties and potential outcomes associated with our pending or threatened litigation proceedings, we believe, based on current known facts, that additional losses, if any, are not expected to materially affect our consolidated financial position, results of operations, or cash flows. However, based upon current known facts, as of December 31, 2024, aggregate reasonably possible (but not probable, and therefore not accrued) losses in excess of the accruals noted above are estimated to be $13.0. If our assumptions or analyses regarding any of our contingencies are incorrect, or if facts change or future litigation arises, we could realize losses in excess of the recorded accruals (including losses in excess of the $13.0 referenced above), which could have a material negative impact on our financial condition, results of operations, and cash flows.
LEGGETT & PLATT, INCORPORATED
SCHEDULE II—VALUATION AND QUALIFYING ACCOUNTS AND RESERVES
(Amounts in millions)
| | | | | | | | | | | | | | | | | | | | | | | |
| Column A | Column B | | Column C | | Column D | | Column E |
| | | Additions | | | | |
| Description | Balance at
beginning of period | | Charged to
cost and
expenses | | Deductions | | Balance at
end of
period |
| Year ended December 31, 2024 | | | | | | | |
| Allowance for doubtful receivables | $ | 10.5 | | | $ | 6.3 | | | $ | 2.6 | | 1 | $ | 14.2 | |
| | | | | | | |
| Tax valuation allowance | $ | 17.7 | | | $ | 6.8 | | | $ | 4.0 | | | $ | 20.5 | |
| | | | | | | |
| Year ended December 31, 2023 | | | | | | | |
| Allowance for doubtful receivables | $ | 39.0 | | | $ | (6.5) | | | $ | 22.0 | | 1 | $ | 10.5 | |
| | | | | | | |
| Tax valuation allowance | $ | 15.7 | | | $ | .8 | | | $ | (1.2) | | | $ | 17.7 | |
| | | | | | | |
| Year ended December 31, 2022 | | | | | | | |
| Allowance for doubtful receivables | $ | 37.0 | | | $ | 3.2 | | | $ | 1.2 | | 1 | $ | 39.0 | |
| | | | | | | |
| Tax valuation allowance | $ | 16.2 | | | $ | (.4) | | | $ | .1 | | | $ | 15.7 | |
| | | | | | | |
1Uncollectible accounts charged off, net of recoveries. The 2023 deduction includes $20.5 for a charge-off of a non-trade note receivable that was fully reserved in prior years.
EXHIBIT INDEX
| | | | | | | | |
| Exhibit No. | | Document Description |
| 3.1 | | |
| 3.2 | | |
| 4.1 | | |
| 4.2 | | |
| 4.2.1 | | Tri-Party Agreement under the May 6, 2005 Senior Indenture, between the Company, The Bank of New York Mellon Trust Company, NA (successor in interest to JPMorgan Chase Bank, N.A.) (as Prior Trustee) and U.S. Bank, National Association (now U.S. Bank Trust Company, National Association as Successor Trustee), dated February 20, 2009, filed February 25, 2009 as Exhibit 4.3.1 to the Company’s Form 10-K for the year ended December 31, 2008, is incorporated herein by reference. (SEC File No. 001-07845) |
| 4.3 | | |
| 4.4 | | |
| 4.5 | | |
| 4.6** | | |
| 10.1* | | |
| 10.2* | | |
10.3*,** | | |
| 10.4* | | |
10.5*,** | | |
| 10.6* | | |
| 10.7* | | |
| | | | | | | | |
| Exhibit No. | | Document Description |
| 10.8* | | |
| 10.9* | | |
10.10*,** | | |
| 10.11* | | |
| 10.12* | | |
| 10.12.1* | | |
| 10.12.2* | | |
| 10.12.3* | | |
| 10.12.4* | | |
10.12.5*,** | | |
| 10.12.6* | | |
| 10.12.7* | | |
| 10.12.8* | | |
| 10.13* | | |
| 10.14* | | |
| 10.15* | | |
| 10.16* | | |
| 10.17* | | |
| 10.18* | | |
| | | | | | | | |
| Exhibit No. | | Document Description |
| 10.19* | | |
| 10.20* | | |
| 10.21* | | |
| 10.22* | | |
| 10.23 | | |
| 10.24 | | |
| 10.25 | | |
| 10.26 | | |
| 19** | | |
| 21** | | |
| 23** | | |
| 24** | | |
| 31.1** | | |
| 31.2** | | |
| 32.1** | | |
| 32.2** | | |
| 97* | | |
| 101.INS*** | | Inline XBRL Instance Document - the instance document does not appear in the Interactive Data File because its XBRL tags are embedded within the Inline XBRL document. |
| 101.SCH*** | | Inline XBRL Taxonomy Extension Schema. |
| 101.CAL*** | | Inline XBRL Taxonomy Extension Calculation Linkbase. |
| 101.DEF*** | | Inline XBRL Taxonomy Extension Definition Linkbase. |
| 101.LAB*** | | Inline XBRL Taxonomy Extension Label Linkbase. |
| | | | | | | | |
| Exhibit No. | | Document Description |
| 101.PRE*** | | Inline XBRL Taxonomy Extension Presentation Linkbase. |
| 104 | | Cover Page Interactive Data File - the cover page interactive data file does not appear in the Interactive Data File because its XBRL tags are embedded within the Inline XBRL document. |
______________________________
| | | | | | | | |
| * | Denotes management contract or compensatory plan or arrangement. | |
| ** | Denotes filed or furnished herewith. | |
| *** | Filed as Exhibit 101 to this report are the following formatted in Inline XBRL (eXtensible Business Reporting Language): (i) Consolidated Balance Sheets at December 31, 2024 and December 31, 2023; (ii) Consolidated Statements of Operations for each year in the three year period ended December 31, 2024; (iii) Consolidated Statements of Comprehensive Income (Loss) for each year in the three year period ended December 31, 2024; (iv) Consolidated Statements of Cash Flows for each year in the three year period ended December 31, 2024; (v) Consolidated Statements of Changes in Equity for each year in the three year period ended December 31, 2024; and (vi) Notes to Consolidated Financial Statements. | |
Item 16. Form 10-K Summary.
None.
SIGNATURES
Pursuant to the requirements of Section 13 or 15(d) of the Securities Exchange Act of 1934, the registrant has duly caused this report to be signed on its behalf by the undersigned, thereunto duly authorized. | | | | | | | | |
| LEGGETT & PLATT, INCORPORATED |
| | |
| By: | /s/ KARL G. GLASSMAN |
| | Karl G. Glassman |
| | President and Chief Executive Officer |
| | |
Date: February 26, 2025
Pursuant to the requirements of the Securities Exchange Act of 1934, this report has been signed below by the following persons on behalf of the registrant and in the capacities and on the dates indicated. | | | | | | | | | | | | | | |
| Signature | | Title | | Date |
| | |
| (a) Principal Executive Officer: | | | | |
| | |
| /s/ KARL G. GLASSMAN | | President and Chief Executive Officer
(Director) | | February 26, 2025 |
| Karl G. Glassman | | |
| | |
| (b) Principal Financial Officer: | | | | |
| | |
/s/ BENJAMIN M. BURNS | | Executive Vice President and Chief Financial Officer | | February 26, 2025 |
| Benjamin M. Burns | | |
| | |
| (c) Principal Accounting Officer: | | | | |
| | |
/s/ TAMMY M. TRENT | | Senior Vice President and Chief Accounting Officer | | February 26, 2025 |
| Tammy M. Trent | | |
| | |
| (d) Directors: | | | | |
| | | | |
ANGELA BARBEE* | | Director | | |
| Angela Barbee | | | | |
| | | | |
MARK A. BLINN* | | Director | | |
| Mark A. Blinn | | | | |
| | | | |
ROBERT E. BRUNNER* | | Director | | |
| Robert E. Brunner | | | | |
| | | | |
MARY CAMPBELL* | | Director | | |
| Mary Campbell | | | | |
| | | | | | | | | | | | | | |
| Signature | | Title | | Date |
| | | | |
MANUEL A. FERNANDEZ* | | Director | | |
| Manuel A. Fernandez | | | | |
| | |
KARL G. GLASSMAN* | | Director | | |
| Karl G. Glassman | | | | |
| | | | |
JOSEPH W. MCCLANATHAN* | | Director | | |
Joseph W. McClanathan | | | | |
| | | |
SRIKANTH PADMANABHAN* | | Director | | |
| Srikanth Padmanabhan | | | | |
| | | |
JAI SHAH* | | Director | | |
| Jai Shah | | | | |
| | | | |
PHOEBE A. WOOD* | | Director | | |
| Phoebe A. Wood | | | | |
| | | | | | | | | | | |
| | | |
| | | |
| *By: | /s/ S. SCOTT LUTON | | |
| | S. Scott Luton | | February 26, 2025 |
| | Attorney-in-Fact
Under Power-of-Attorney
dated | |
| February 25, 2025 | | |