CHANGING COURSE Investor Day November 14, 2007 Exhibit 99.2 |
11/13/2007 2 Forward Looking Statements Forward Looking Statements Statements in this presentation that are not historical in nature are “forward-looking.” These statements involve uncertainties and risks, including the company’s ability to improve operations and realize cost savings, price and product competition from foreign and domestic competitors, changes in demand for the company’s products, cost and availability of raw materials and labor, fuel and energy costs, future growth of acquired companies, general economic conditions, foreign currency fluctuation, litigation risks, and other factors described in the company’s latest Form 10-Q. Any forward-looking statement reflects only the company’s beliefs when the statement is made. Actual results could differ materially from expectations, and the company undertakes no duty to update these statements. |
11/13/2007 3 Presentation Topics Presentation Topics Leggett is Changing Course Why Change? New Strategic Direction Key Changes Expected Results Presentation Team Dave Haffner, President and CEO Karl Glassman, Executive VP and COO Matt Flanigan, Senior VP and CFO Dave DeSonier, VP Strategy and IR |
11/13/2007 4 Executive Summary Executive Summary Becoming Better Stewards of Shareholders’ Capital Historically: Revenue Driven Future: TSR Driven (Total Shareholder Return) Phase 1 (2-3 Years): Improve Returns on Assets Increase Free Cash Flow Phase 2 (2010+): Profitably Grow > GDP |
11/13/2007 5 Why Change? Why Change? Poor Return to Shareholders Inefficient Use of Capital Not Hitting Financial Targets Parts of Portfolio Weighing Us Down |
11/13/2007 6 State of the Company State of the Company Strengths Market Leadership Low Cost Converters Product Development Customer Relationships > 20% Foreign Generate Lots of Cash Weaknesses Too Patient Overly Optimistic “We Can Fix It” Strategic Planning |
11/13/2007 7 Agenda: Key Changes Agenda: Key Changes Phase 1: Clean Up Portfolio & Implement More Rigorous Strategic Planning (2-3 Years) Success = TSR Role-Based BU Management Stronger BU-Level Strategic Planning Eliminate Over 1/5 of Portfolio Higher Returns on Base Portfolio 39% Dividend Increase + Buybacks Phase 2: Profitably Grow > GDP (2010+) |
11/13/2007 8 Success = TSR Success = TSR TSR = ( Price + Dividends) / Initial Price Target Top 1/3 of S&P 500 Several Levers: Earnings = ( Revenue) x ( Margin) Cash Yield = Dividends + Repurchases P/E Multiple Exec and BU Incentives Linked to TSR |

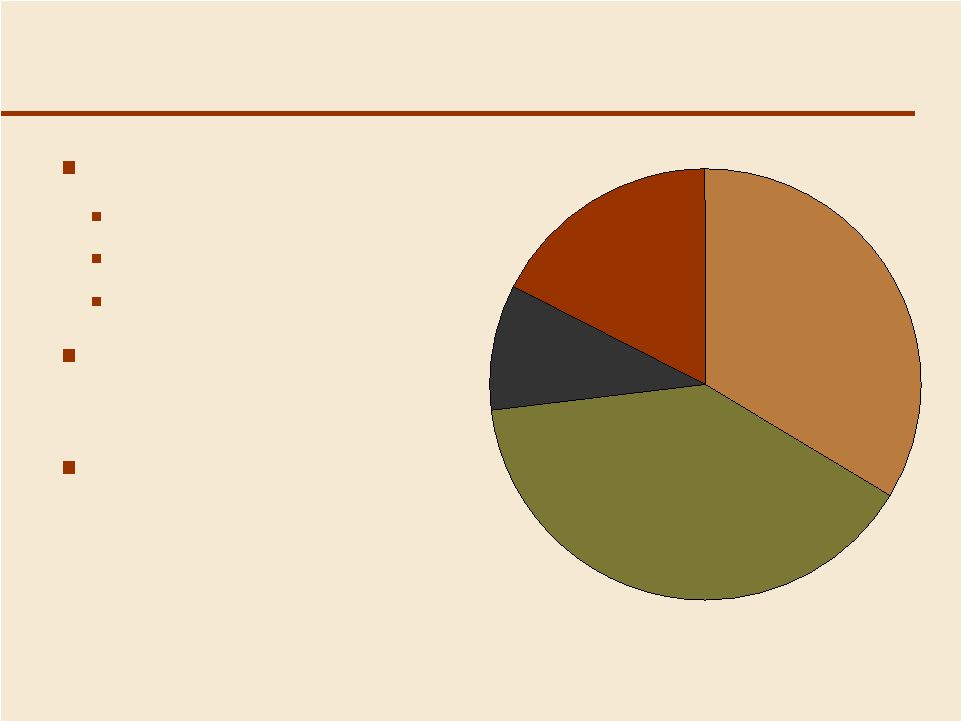
11/13/2007 9 Role-Based BU Management Role-Based BU Management Different Goals: Grow: Profitable Growth Core: Maximize Cash Fix: Rapidly Improve Based on Strategy and Returns Capex Skewed Grow 34% Core 39% Fix 9% Divest 18% 2007 Expected Revenue |
11/13/2007 10 Rigorous BU Strategic Planning Rigorous BU Strategic Planning More Formal Process Influences BU “Role” Assess BU Position and Advantages 3-Year Plan to Achieve 10% TBR / yr |
11/13/2007 11 Eliminate 1/5 of Portfolio Revenue Eliminate 1/5 of Portfolio Revenue $900m Divested: Aluminum & 6 BUs $100m Pruned from Store Fixtures BU $200m from Poor Performing Plants Aim to Finish by End of 2008 |
11/13/2007 12 “Fix” “Fix” the Store Fixtures BU the Store Fixtures BU Shrink to Higher Profitability Core Prune ~$100m (20%) of Low-Margin Sales Eliminate ~$180m (31%) of Production Capacity • Closing 4 of 14 Facilities; Utilization Increases to ~80% Urgency; Hard Targets and Deadlines Attain Return WACC by Q4’08 250 Basis Point Higher Margin (run rate) by March |
11/13/2007 13 Prune Low Profitability BUs Prune Low Profitability BUs $904 $854 $52 $16 30% 40% 50% 60% 70% 80% 90% 100% Sales Assets EBIT Cash Flow Divest Fix Core + Grow Net Trade Sales; Assets = Receivables + Inventory + Net PPE + Goodwill + Intangibles; EBIT excludes Non-Recurring items; Cash Flow = EBITDA + WC – Capex Estimated 2007 Results, in $millions |
11/13/2007 14 Higher Returns on Base Portfolio Higher Returns on Base Portfolio BU Bonus Linked to Returns Initiatives: Product Development Pricing Discipline Cost Reduction Consolidation; Prune Underperforming Plants Overhead If BU Return < WACC, 1 Year to Improve |
11/13/2007 15 Send More Cash to Shareholders Send More Cash to Shareholders Generate Much More Free Cash Increase Dividend by 39% To $1.00 / year (from $0.72 / year currently) Requires Additional ~$50m in Cash / Year • More Than Offset by Reduction in Capex, Acquisitions 10m Shares / yr Standing Authorization Maintain Priority on Stock Repurchases Use Proceeds from Divestitures |
11/13/2007 16 Phase 2: Profitably Grow > GDP Phase 2: Profitably Grow > GDP Minimal Growth for 2-3 Years (Phase 1) Focus is “Clean Up”, High Return Longer Term: 4-5% Growth (Phase 2) Base Opportunities Identified in Strategic Plans Possible New BUs; Must Meet Rigorous Criteria Seek Growth, But Not at Expense of TSR |
11/13/2007 17 Agenda: Expected Results Agenda: Expected Results Significant Restructuring Costs Lower Sales, Higher Margin 40% Lower Capex, Acquisitions Free Cash More Than Doubles 3-Yr TSR Exceeds Target Levels |
11/13/2007 18 Restructuring-Related Costs Restructuring-Related Costs Cost Estimates Not Yet Finalized $150 - 300 million, Virtually All Non-Cash Update 4Q Guidance Once Resolved Issue 2008 Guidance on Jan 24 Annual Guidance Only, Updated Quarterly |
11/13/2007 19 Sales Sales $4.3B in 2010 $4.3B in 2010 Sales in $B 4.3 5.2 3.0 3.2 3.4 3.6 3.8 4.0 4.2 4.4 4.6 4.8 5.0 5.2 5.4 2007 "Divest" "Fix" Poor Plants Future Growth 2010 ASSUMPTIONS: • Exit ~ $1.2 B in Sales • 3% / year Total Sales Growth • Modest Acquisitions; No New BUs |
11/13/2007 20 EBIT Margin EBIT Margin 11% by 2010 11% by 2010 Expected EBIT Margin % 11 7.5 0 2 4 6 8 10 12 2007 "Divest" "Fix" Poor Plants Initiatives 2010 Eliminate Poor Performing Plants in Otherwise Healthy BUs • Product Dev. • Efficiency • Purchasing • Pricing excl non-recur |
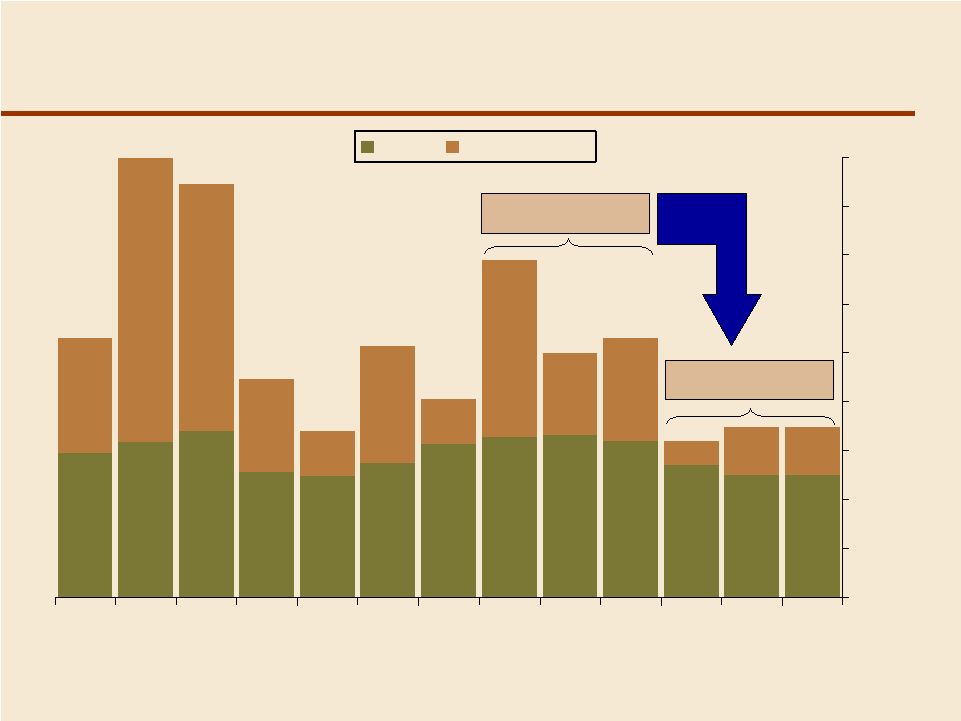
11/13/2007 21 170 124 137 157 160 135 125 125 117 290 252 95 46 120 46 181 83 105 50 159 148 128 164 166 50 25 0 50 100 150 200 250 300 350 400 450 98 '01 '04 07E 10E Capex Acquisitions ~40% Lower Capex and Acquisitions ~40% Lower Capex and Acquisitions 3yr: $510m 3yr: $860m |
11/13/2007 22 Free Cash Should More Than Double Free Cash Should More Than Double $B ’03-’06 ’07-’10 Cash from Ops 1.6 1.8 On Smaller Asset Base Divestitures 0.1 0.5 .08 Prime Foam; 0.40 Future Capex (0.6) (0.5) 20% Lower in Future Acquisitions (0.4) (0.2) Assumes No New BUs Free Cash Flow 0.7 1.6 > 2 Times as Large Net Debt 0.3 (0.1) $B to Shareholders 1.0 1.5 > $500m Increase -- Dividends, $B 0.5 0.6 $1/share in ‘08; Annual Increase -- Repurchases, $B 0.5 0.9 Buy 20-30m Shares ’08-’10 |
11/13/2007 23 New Strategy, Same Principles New Strategy, Same Principles Changing Success = TSR Portfolio Roles Divesting Several BUs Increased Urgency 39% Dividend Increase Less Capex, Acquisition Modest Growth Targets New Financial Metrics Strategic Plan Process Annual Guidance Continuing Integrity Down-to-Earth, Candid Commitment to Improve Product Innovation Relationships Matter Significant Cash Flow Annual Dividend Growth Clean Financials Strong Balance Sheet Mgmt Stock Ownership |
11/13/2007 24 |
11/13/2007 25 BACK UP SLIDES BACK UP SLIDES |
11/13/2007 26 New Mindset is Required New Mindset is Required Future Future Recent History Recent History Overall Goal: High TSR Revenue Growth Capex: Judiciously Allocated Not Adequately Constrained BU Success: Cash Flow Return Revenue & EBIT Growth Portfolio Mgmt: Role Based on Strategy “1 Size Fits All” Acquisitions: Fewer, Strategy Driven Opportunistic, “Good Deal” Divestitures: Part of Port. Mgmt. Admitting Defeat Urgency: Meet Deadline or Exit “We Can Fix It” |
11/13/2007 27 Criteria for Role Assignments Criteria for Role Assignments GROW CORE FIX / DIVEST 1. COMPETITIVE Advantaged Solid, Stable Tenuous or POSITION Disadvantaged 2. MARKET Strong, Attractive, But Poor Or ATTRACTIVE? Growing With Lower Declining Growth Potential 3. FIT w/ LEGGETT Strong Strong Limited 4. RETURN (ROGI) Consistently Stable, Erratic or > 12% 9-12% < WACC 5. BU SIZE & Large, Large, Inconsequential, MATERIALITY Significant Significant Distracting |
11/13/2007 28 BU Roles By Segments BU Roles By Segments % of Leggett Revenues GROW CORE FIX / DIVEST Residential 30% 14% 4% Commercial 4% 2% 12% Aluminum -- -- 9% Industrial -- 10% -- Specialized -- 13% 2% Total 34% 39% 27% Target Mix 50% 50% -- |
11/13/2007 29 Expectations by Portfolio Role Expectations by Portfolio Role All: Credible Path to 10% TBR Required, else Exit Grow: Provide Profitable Growth; Return > WACC Invest Capital in Competitively Advantaged Positions Identify Major Organic, M&A, or Rollup Investments Core: Send Cash To Corporate; Return WACC Maintain Stable, Competitive Positions to Generate Cash Aggressively Improve EBITDA and Free Cash Flow Profitably Grow Market Share, But With Minimal Capex Enhance Productivity; Reduce Costs, Overhead, Working Capital Fix: Rapidly Restructure, else Exit 12 Months To Achieve Return WACC, Else Divest / Liquidate |
11/13/2007 30 Capex and Acquisition Guidelines Capex and Acquisition Guidelines CAPEX: Reduced; Less Spent on Growth GROW: Available. CORE: Limited; For Productivity Enhancement, but Not Expansion. FIX / DIV: Severely Restricted; Maintenance Only. ACQUISITIONS: Fewer, more strategic; higher “bar” ALL: Value Creating; TSR Accretive; Clear Strategic Rationale; Sustainable Competitive Advantage; Attractive Market. GROW: Typical: Revenue > $50m, Historical ROGI > 15%; If New Market, Growth > GDP. CORE: Rare; Revenue > $15m; Adds Value at 15% Discount Rate; Related to Current Served Market; Low Execution Risk. FIX / DIV: None Allowed. |
11/13/2007 31 Growth Discipline Growth Discipline Strat Plan Process Identifies “Grow” BUs Advantaged Positions in Strategically Attractive Markets Charter Desire Growth, But Not At Expense of TSR Growth Capex Purposely Skewed to the “Grow” BUs BUs Encouraged to Explore R&D and Mktg Investments Acquisitions Allowed If Fits Strategic Plan, TSR Accretive Discipline BU Bonus Based on Return and EBIT (but not revenue) BU Plans Approved Only if 3-Yr TBR > 10% cagr |
11/13/2007 32 BU Incentives / Bonus BU Incentives / Bonus Historical: EBIT based 2008: Based on EBIT and Return - new emphasis on returns - linked to BU TBR and LEG TSR Goals 2009+: Linked to BU Strategic Plans |
11/13/2007 33 New Financial Metrics New Financial Metrics TSR: Total Shareholder Return Total Benefit Investor Realizes from Owing Our Stock Stock Price + Dividends TBR: Total BU Return Analogous to TSR, but at BU Level BU Value + Free Cash Flow; (Value = EBITDA x Multiple) ROGI: After-tax Return on Gross Investment Proxy for Expected Return of Incremental Organic Growth Measure of the “Health” of BU; Basis for Role Assignment (EBITA – Taxes) / (WC + Gross PP&E) FCF: Free Cash Flow Amount of Cash, All In, the BU Returns to Corporate EBITDA – Taxes – Capex – WC – Acquisitions + Sales Proceeds |
11/13/2007 34 Formulae for Financial Metrics Formulae for Financial Metrics ( Earnings x Multiple) + Dividends TSR = --------------------------------------------------- = Total Shareholder Initial Market Value Return ( EBITDA x Multiple) + FCF TBR = ------------------------------------------------- = Total BU Return Initial Market Value EBITA - taxes ROGI = ----------------------------- = Return on WC + Gross PPE Gross Investment FCF = EBITDA – taxes – capex – WC = Free Cash Flow – acquisition cost + sales proceeds WC = working capital; PPE = property, plant, equipment; EBITA = earnings before interest, taxes, and amortization |
11/13/2007 35 TSR: Total Shareholder Return TSR: Total Shareholder Return Beginning price Quarterly dividends Ending price $23.90 $22.96 $0.16 $0.17 $0.17 $0.17 $0.94 of Price Change Dividends + Price Change 0.67 + 0.94 22.96 = 7.0% Beginning of year price = TSR = Leggett’s TSR for 2006 |
11/13/2007 36 LEG, 2006 Revenue 4% 1. Earnings + Margin 5% Market Cap 2. P/E Multiple (8)% + Share Count 3% (e.g. share repurchases) 3. Cash Return Dividend Yield 3% = TSR 7% Several “Levers” Several “Levers” Drive TSR Drive TSR |
11/13/2007 37 TBR: Total Business Return TBR: Total Business Return TSR TBR Change in Stock Price Dividend Yield Change in Value Free Cash Flow Yield CORPORATE value creation: Market based calculation of TSR BUSINESS UNIT value creation: Internal calculation of TBR • EBITDA • EV/EBITDA multiple (= TSR multiple) • EBITDA • EV/EBITDA multiple • minus Debt • divide by # Shares TBR is the BU Equivalent of TSR |
11/13/2007 38 TSR and TBR are Analogous TSR and TBR are Analogous TBR = Total Business Return = Return Corporate Receives on Its Investment Leggett TSR Business Unit TBR 2005 2006 2005 2006 2007 2008 EBITDA 567 657 21 58 21 29 EV Multiple x 9.1 x 8.0 x9.1 x8.0 x8.0 x8.0 Value 5160 5256 190 458 163 231 Debt (955) (980) OPER Market Cap 4204 4276 LEVERS # Shares Outst. 183 178 Share Price $22.96 $23.90 3-yr Change in Value $0.94 268 (295) 68 41 % Change 4.1% 141% (64)% 42% 7% Dividend or FCF $0.67 (29) 8 18 (3) % Yield 2.9% (15)% 2% 11% (0)% % TSR or TBR 7.0% 126% (62)% 53% 6% TSR TBR FCF = Free Cash Flow = EBITDA – taxes – capex – WC – acquis. cost + sale proceeds |
11/13/2007 39 Anticipated Future Results Anticipated Future Results TSR of 12-15% per year Dividend Payout of 50-60% Sales Growth (in Phase 2) of ~ 4-5% / year ~11% EBIT Margin Net Debt-to-Cap of 30-40% |
11/13/2007 40 Future Portfolio Composition Future Portfolio Composition % Sales EBIT Mgn Residential ~50% 10-11% Commercial ~1/6 ~ 9% Industrial ~1/6 8-9% Specialized ~1/6 10-11% Total Company 100% ~11% ~ 30% Foreign Sales (vs. ~ 21% today) Segment margins based on Trade + Intersegment Sales; Company margin based on Trade Sales. |