Dennis Glass
President and Chief Executive Officer
Lincoln Financial Group
Strategic Overview

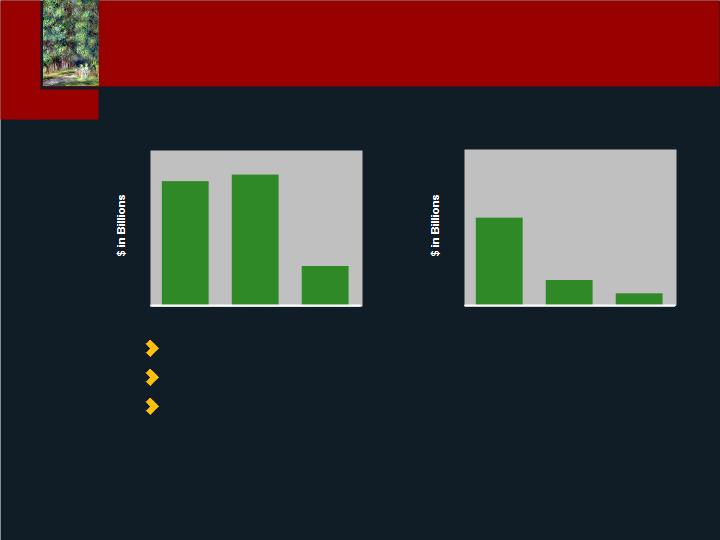
AUM
+ $31 billion
+14%
Life
Annuities
Defined Contribution
Delaware Retail Mutual Funds
Group Protection Premiums
+ 39%
+ 22%
+ 23%
+ 35%
+ 15%
Sales*
*
            Data represents 3Q06 YTD versus 3Q07 YTD sales and includes JP results prior to 2Q06; Life sales represent target premium plus 5% of excess premium (including adjustments for internal replacements at 50%), except whole life and term sales, which represent 100% of first year paid premium; Annuity sales represent deposits; Mutual fund sales represent deposits and reinvested dividends for new and existing accounts; Group Protection premiums represent annualized sales from new policies and include group life, disability and dental.
Strong Year-over-Year Asset and
Sales Growth

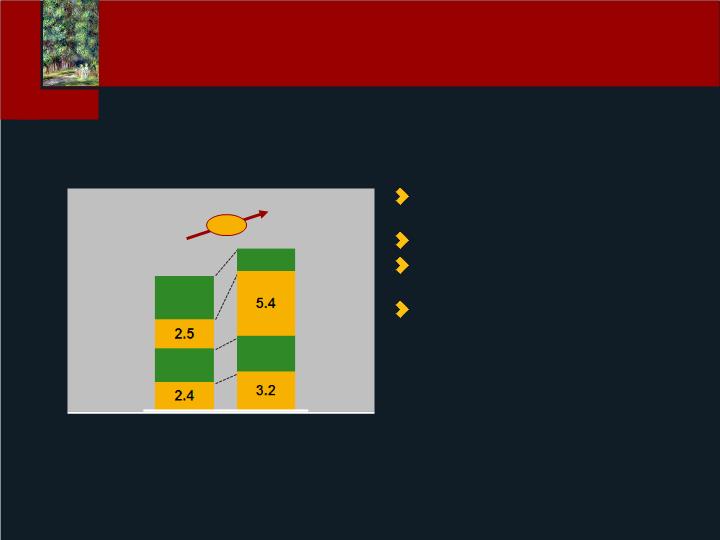
Focused on Top Line and
Bottom Line Growth
     Change the growth trend line by over allocating
     resources to high growth retirement businesses -
     VA a good example
Invest in distribution expansion
     Use acquisitions to accelerate growth in select
     sub-scale businesses
Execute on the details
     Innovate in the retirement income security space to
     drive longer-term growth

Year-end 2006
Headcount
2007
Growth
2008
Growth
530
37
6,576
120
+ 17%
+ 170%
3%
+ 19%
+ 22%
14%
Productivity Increases
Lincoln Financial
Distributors
Employer Markets -
Defined Contribution
Lincoln Financial
Network
Employer Markets -
Group Protection
Distribution Growth and
Productivity Driving Sales Results

Variable
annuities
Fixed
annuities
Channels
Independents/
FPs/IBDs
Banks
Stockbrokers
#1
18%
#10
4%
#9
3%
#5
9%
#7
9%
#14
2%
$28
$17
$4
Source: McKinsey Research, LIMRA 2006 Individual Annuities Sales Survey, LFG
$20
$30
$50
High potential
Market Size in
$ Billions
Opportunities for Further Market
Penetration - Annuities
2006 Lincoln rank and market share

#4
8%
#9
4%
#2
10%
#4
10%
#2
20%
#3
9%
$0.8
$0.9
$0.1
Career/
affiliated
PPGAs/IP
Life brokerage/
MGA
Stock-brokers/
Banks
Source: LIMRA 2006; LFD
VUL/VL
Universal life
High potential
Market Size in
$ Billions
Products
#8
4%
#7
5%
$0.2
$1.0
$3.3
$0.1
$0.8
Opportunities for Further Market
Penetration - Life
2006 Lincoln rank and market share

Career
agents
Advisors/
brokers
Size, 2006 ($ Billions)
$590
$181
$188
$769
Consultants/
institutional
direct
$376
$1552
Large/
mega
Micro/
small
Medium
Health
care
K-12
Higher
ed
403(b)
401(k)
High potential
#3
#3
#8
#11
Opportunities for Further Market
Penetration - DC

Product Development and
Innovation Driving Sales
Unified Product Portfolio
MoneyGuard® Reserve NY
VULONE
Unified Product Portfolio
Lincoln Lifetime Income
Lincoln SmartIncomeSM Inflation Annuity
i4LIFE® Advantage
SmartFutureSM
Closed End Fund
Life
Annuity
DC
Asset
Management
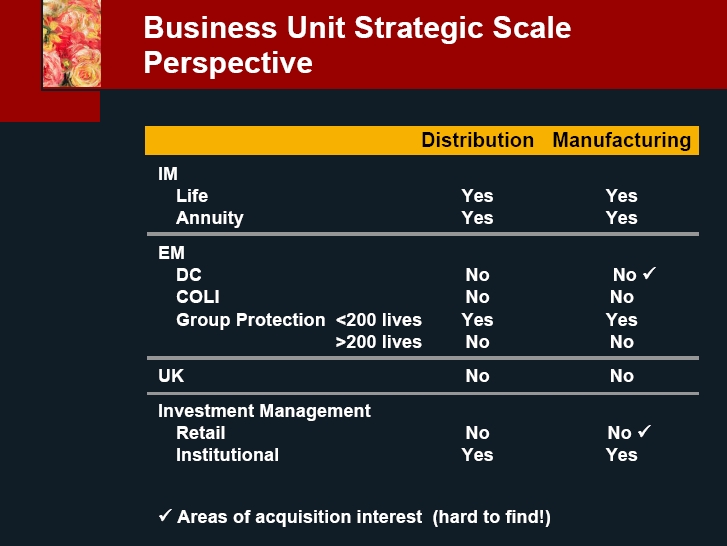
| Distribution | Manufacturing | |
| IM | ||
| Life | yes | yes |
| Annuity | yes | yes |
| EM | ||
| DC | no | no |
| COLI | no | no |
| Group Protection <200 lives | yes | yes |
| >200 lives | no | no |
| UK | ||
| Investment Management | ||
| Retail | no | no |
| Institutional | yes | yes |

“Operating effectiveness equals margin
improvement and increased earnings for
reinvesting in the business.”
Executing on Details -
Operating Effectiveness
Unit costs decreasing across the Company
Raising merger cost savings target by 10%
    LFD and LFN are operating within allowables
    (vs. a loss of ~$36 million in 2005)

Questions?

Patrick Coyne
President
Delaware Investments
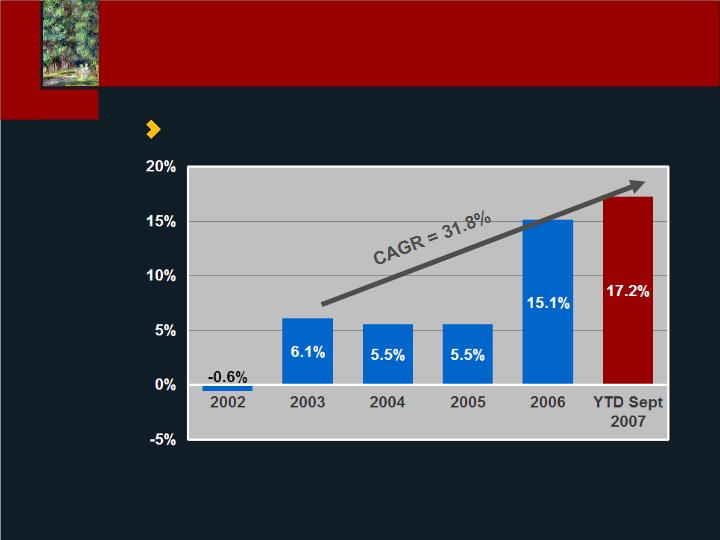
0
5
10
15
20
25
30
35
2002
2003
2004
2005
2006
YTD 9/30/07
0
40
80
120
160
200
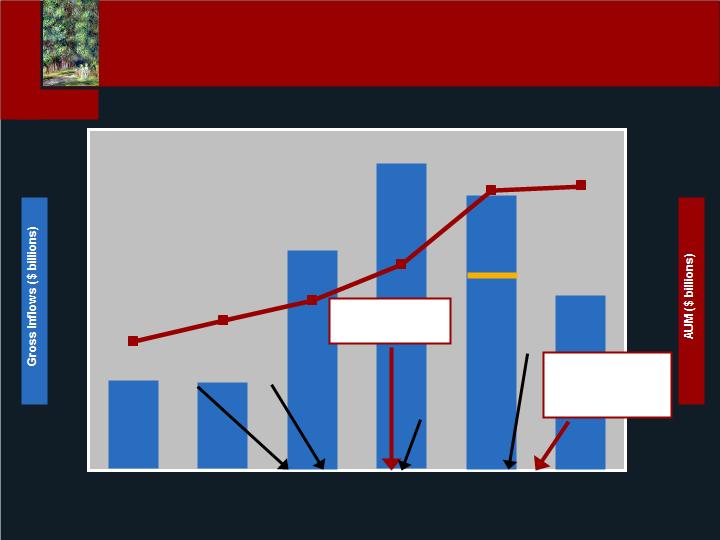
Added
Large Cap
Value Team
Added
Emerging
Markets
Team
Added Focus
Growth Team
Added Int’l
Value Equity
Team
Sold
DIAL
Announcement
of LCP
discussions
As of
9/30/06
2002 and 2003 Sales and AUM excludes Mondrian
Asset & Gross Inflows

Fixed Income Update
Transaction Overview
    Logan Circle Partners (LCP) transaction closed on
    October 31, 2007
    Delaware remains fully committed to the fixed income
    business
•  Since spring 2007, we have actively recruited and
   hired seasoned individuals to replace departed
   team members
•  Delaware currently employs over 100 fixed income
   investment professionals, including dedicated
   insurance resources, that manage approximately
   $93 billion in assets
    Incremental impact to operating earnings in 4Q07
    expected to be minimal relative to 3Q07
    Incremental impact to operating earnings in 2008
    expected to be $3 million / quarter, after tax
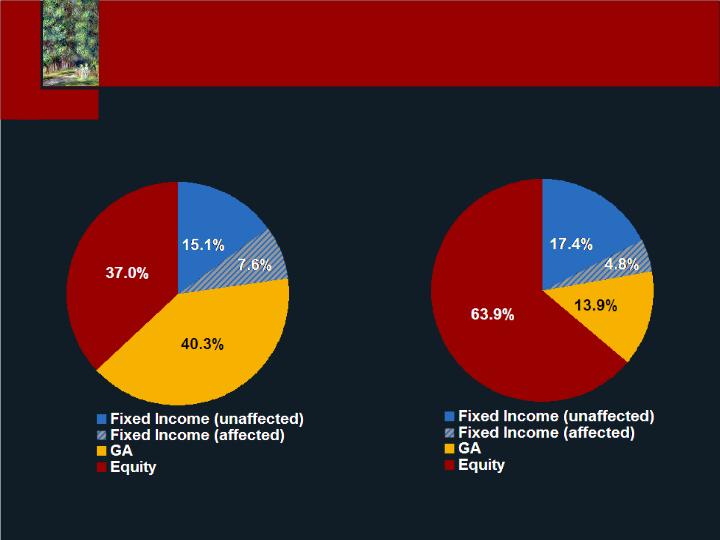
Total AUM
Advisory Revenues
Data pro-forma using September 30, 2007 assets and 3Q07 revenues
Fixed Income Update
Marginal Impact on Overall Business
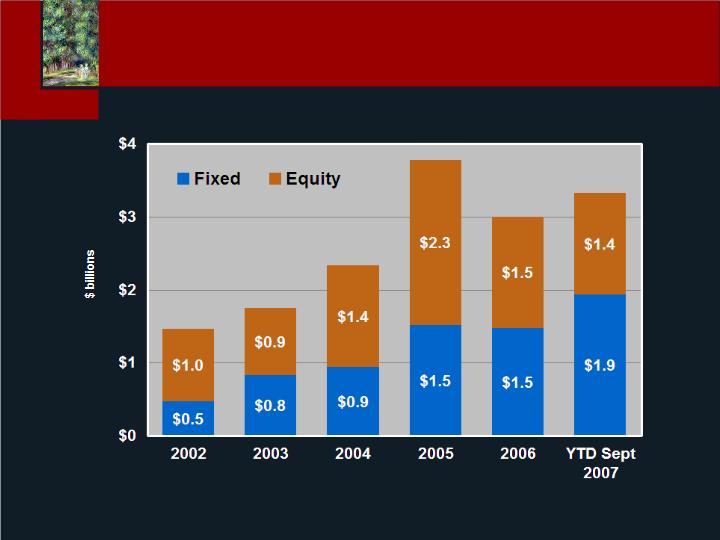
Sales exclude 529, Optimum Funds, Closed End and Dividend Reinvestments
Mutual Fund Sales

Delaware Mutual Fund Family
• In February 2007 Barron’s, ranked #4 based on
– 2nd time in 4 years that Delaware achieved
Top 5 distinction
• Ranked one of the top fund families of 2007 by Lipper
– Won 7 Lipper Awards for 3-, 5-, and 10-year performance2
Individual Fund Distinctions
• Delaware Dividend Income Fund
– One of only 10 “stock-holding funds that have finished
each calendar year since 1997 with positive returns”3
• Delaware Diversified Income Fund
– Overall Morningstar rating of “5-stars”
– Largest fund, as well as best-selling fund in past two years
• Delaware Emerging Markets Fund
– One of the top funds in a 5-year performance period for ALL
Barron’s annual review of
fund families; February 2007
2 March 2007
3 10/9/07 Dow Jones article
4 10/4/07 Wall Street Journal articl
mutual fund

1 Gross Proceeds
Building On Our Momentum
Accelerating Organic Growth
Retail Scale
•  Exploring opportunities, including M&A, to build
   retail scale
     Proprietary in-house international value equity
     and emerging markets teams
•  Internal products now offered as alternatives to
   capacity-constrained Mondrian products
Closed-End Funds
•  Launched $260 million1 fund in June; continuing to
   explore future opportunities based on market
   demand
CDOs
•  $2.4 billion of CDO launches in 2007; opportunistic
   and based on market conditions

Building On Our Momentum
Constant Rationalization of our Business
    Transfer of certain investment accounting
    administrative activities to our provider of
    asset services
Exit of 529 business
    Reducing sub advisory expenses by bringing new
    teams on board to replace external managers
Natural leverage of business as asset base grows
Anticipate pre-tax operating margins for full-year
2008 in 19% - 20% range
* Pre-tax operating margin defined as
income (loss) from operations before
federal income taxes divided by
operating revenue
Improving Operating Results
Pre-Tax Operating Margins*

Questions?

Appendix
All data as of 9/30/07
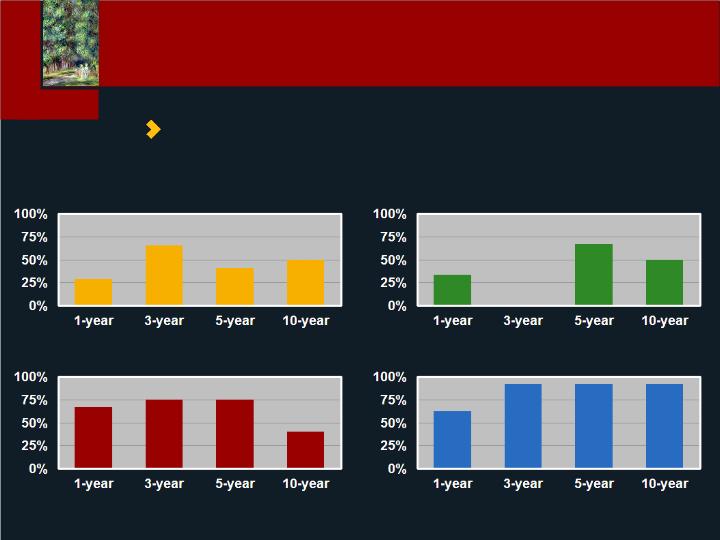
Domestic Equity
International / Global Equity
Taxable Fixed Income
Tax-Free Fixed Income
Lipper Performance
    Percent of Funds by Style in Top Half of
    Lipper universes
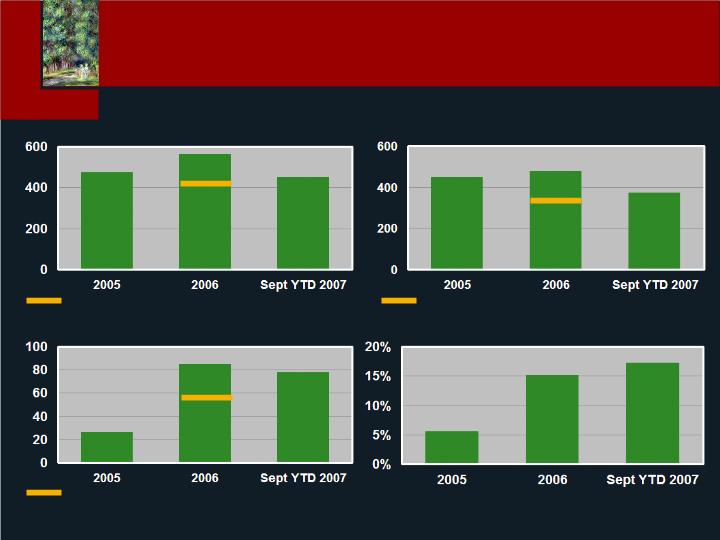
Total Operating Revenue ($ million)
Total Operating Expenses ($ million)
Pre-Tax Operating Income ($ million)
Pre-Tax Operating Margin*
Indicates Sept. YTD 2006
Indicates Sept. YTD 2006
Indicates Sept. YTD 2006
* Pre-tax operating margin defined as income (loss) from operations before federal income taxes divided by operating revenue
Historical Financials

Wes Thompson
President, Lincoln Employer Markets
Employer Markets
Investing for
Long-Term Growth

Employer Markets’ Mission
Addressing the retirement income
security needs of employers and their
employees through:
• Defined Contribution Plans
• Group Protection Plans and
• Executive Benefits

Defined
Contribution
53%
Group
Protection
32%
Executive
Benefits &
Other
15%
23% of LFG Earnings
$43.7 billion in
Account Values
$262.9 million in
Income from
Operations
Employer Markets Business Today
Employer Markets Income from Operations*
| * As of September 30, 2007 YTD |

Healthcare Education 403(b) | Mid-Large Healthcare & Corporate 401(k) and 403(b) | Small Corporate 401(k) |
Advisor-based | Consultants Brokers | Independent Planners, Wirehouses, Banks, TPAs |
Multi-Fund® Alliance® DirectorSM
                (Annuity)                                        (Mutual Fund)                                  (Group Variable

                                                                                                                                                Annuity)
Market
Focus
Distribution
LFG’s DC Business
* As of September 30, 2007 YTD
  ** As of June 30, 2007 YTD
*** Alliance data throughout the presentation includes the fixed portion of the contract.
Earnings**
Account Value*
Deposits*
Alliance (Mid-Large Mutual Fund)***
Director/LALR (Small GVA)
Multi-Fund (403(b) Annuity)
Other
25%
22%
50%
3%
50%
29%
19%
2%
13%
70%
4%
13%
The Changing DC Business Mix
Historically, Lincoln’s DC business mix was
dominated by the annuity 403(b) block
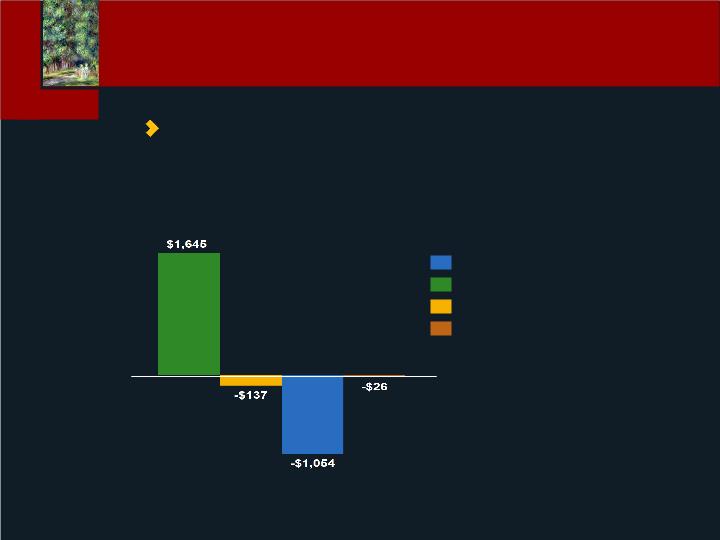
* As of September 30, 2007 YTD
Net Flows*
in Millions
Director/LALR (Small GVA)
Alliance (Mid-Large Mutual Fund)
Multi-Fund (403(b) Annuity)
Other
The Changing DC Business Mix
Positive Net Flows From “New” Products
Business Mix is Shifting to the Mid-Market Mutual Fund and
Small Market Group Variable Annuity Platforms

Annuity 403(b)
Net Flows
- $1,054 million
ROA (bps)
75
Earnings Implication
-$7.9 million
x
=
Mid-Large Mutual Fund
Net Flows
$3,000 million
ROA (bps)
25- 40
Earnings Implication
$7.5 - $12 million
x
=
The Changing DC Business Mix
Earnings Implications
However, the changing mix of Lincoln’s DC business
creates a short-term earnings gap…
To replace $8 million in earnings from Multi-Fund, we
need to generate $3 billion in additional assets in
Alliance and Director

Strategy to Replace and Grow Earnings
Building the Business
• Clear Focus on Growth Markets
• Invest in Distribution and New Channels
• Expand Product and Service Capabilities
• Improve Operating Effectiveness
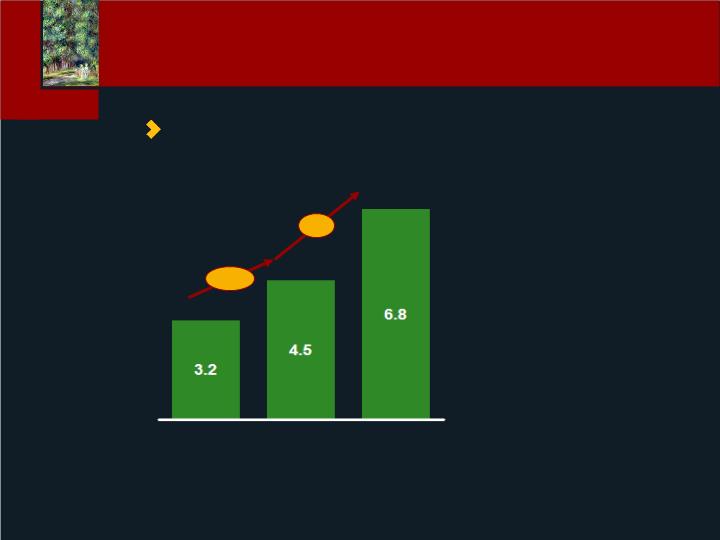
2004
2007E
2012E
11%
9%
Clear Focus on Growth Markets
AUM Projections
Defined Contribution Market
AUM, $ Trillions
* Includes 457 and 401(a), as well as money purchase plans, profit sharing plans, and deferred compensation plans
Source: ICI; Cerulli; EM internal projections of DC net flows (from Cerulli, 2006); McKinsey banking practice

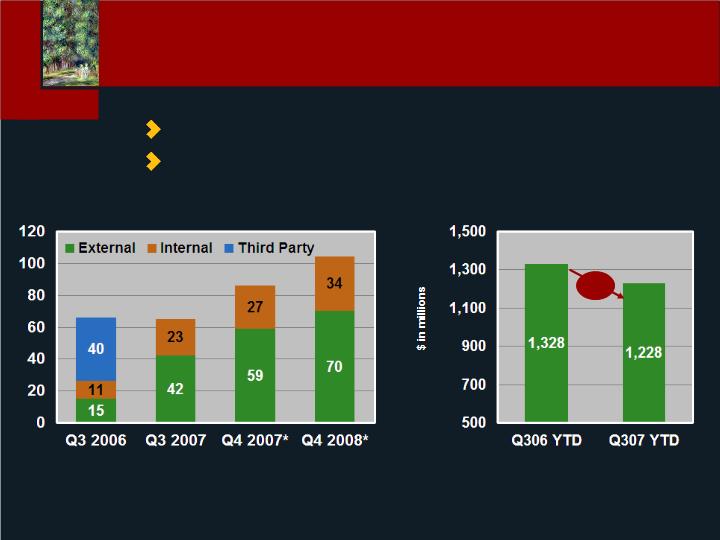
   *As of September 30, 2007 YTD
** DirectorSM deposits include $25 million of deposits from the LALR product.
Multi-Fund® | Alliance® | DirectorSM |
$948m | $2,161m | $1,228m** |
Healthcare Education 403(b) | Mid-Large Healthcare & Corporate 401(k) and 403(b) | Small Corporate 401(k) |
Advisor-based | Consultants Brokers | Independent Planners, Wirehouses, Banks, TPAs |
Market
Focus
Distribution
Deposits*
Clear Focus on Growth Markets
View of Today’s Deposits
Today, 79% of deposits come from our target markets*
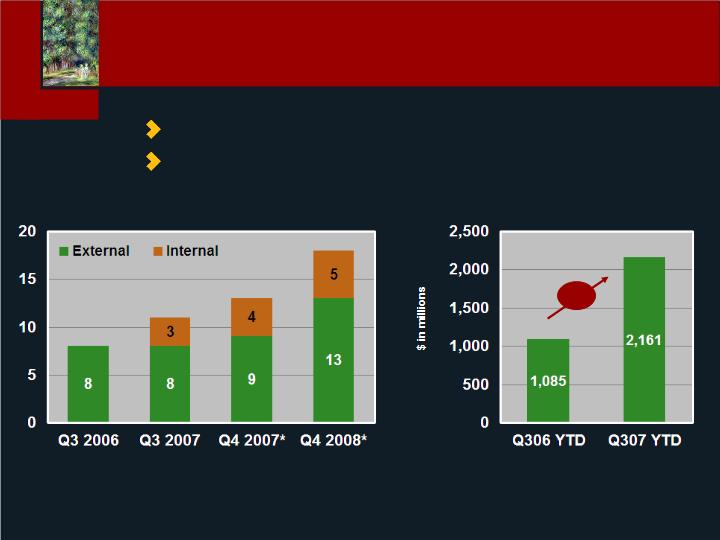
* 2007 Wholesales as of YTD 3Q07, 2008 Wholesalers are projected**Internal and External Wholesaler counts include Sales Management
Number of Wholesalers**
Sales
99%
Investing In Distribution
Capacity and Productivity
Mid-Large Healthcare & Corporate 403(b) & 401(k) Market
Alliance®
8%
* 2007 Wholesales as of YTD 3Q07, 2008 Wholesalers are projected**Internal and External Wholesaler counts include Sales Management
Number of Wholesalers**
Sales
Investing In Distribution
Capacity and Productivity
Small Corporate 401(k) Market
DirectorSM and LALRSM

2+ Years
10%
<1 Year
73%
1-2 Years
17%
2+ Years
27%
1-2 Years
55%
Tenure
DirectorSM/LALRSM Wholesalers*:
Tenure
Alliance® Wholesalers*:
<1 Year
18%
Investing In Distribution
Capacity and Productivity
| * 2007 Wholesalers as of YTD September 30, 2007 |

Top Firms Serving Small to Mid Market
Wire
• Morgan
  Stanley
• UBS
• AG Edwards
• Wachovia
• Smith Barney
• Merrill Lynch
Independent Planner
• LFN
• Edward Jones
• LPL
• Raymond James
• HD Vest
• AIG
Current market opportunity > $30-50 billion*
Investing In Distribution
Capitalizing on Strategic Partner Model
Strategic Partner Focus…Room to Grow
* Estimated Annual Sales

Expanding Product and Service Capabilities
The Customer Experience
Achieving Strategic Scale in Manufacturing
by Launching Innovative Product Solutions
• Lincoln American Legacy RetirementSM
• SmartFutureSM
• i4LIFE® Advantage
• Lincoln Ibbotson Insight Series
Investing in Service Improvements
• Lincoln Unifier (Multi-vendor Consolidation Services)
• Consolidated Platforms
• Customer Facing Enhancements

Defined Contribution
G & A expenses
Average Account Value
G & A as annualized % of AV
$165
$35,174
62 bps
2007
Sept. YTD
2006
Full Year
$210
$31,891
66 bps
$ in millions
Improving Operating Effectiveness
Disciplined Financial Management

What To Expect In 2008
Strong organic deposit growth in our
target markets
Improvement in net flows
Ongoing product enhancements
Additional platform improvements

Taking Market Share
Sources of Competitive Advantage*
• Scale and Brand
• Differentiated Service
• Distribution
• Education and Advice
• Product Innovation
* McKinsey Research

Questions?

Mark Konen
President
Individual Markets
Scale, Momentum, Opportunity

Product | Industry Ranking* |
Life Insurance | 1 |
Variable Annuities | 5 |
Fixed / Indexed Annuities | 10 |
$103 billion in account values**
$518 billion of life insurance in-force**
Annualized sales over $13 billion***
Over $1 billion in annualized operating earnings***
Strategic Scale
Enabling Investments in the Business
| * Based on 2Q07 YTD LIMRA, 3Q07 YTD VARDS rankings |
| **As of September 30, 2007 |
| ***Annualized numbers based on 9/30/07 year-to-date data; Fixed, indexed, and variable annuity sales represent deposits throughout the presentation; Life sales throughout the presentation represent target premium plus 5% of excess premium (including adjustments for internal replacements at 50%), except whole life and term sales, which represent 100% of first year paid premium. |

12th
3.3%
8th
5.5%
6th
6.4%
5th
6.6%
5th
6.9%
Industry Rank*
Market Share*
$6.7
3Q06
YTD
27% Growth YTD
3Q07 vs. 3Q06
Variable Annuity Growth
Taking Market Share
Lincoln Yearly Total VA Sales
* Industry and market share based on VARDS data through 3Q07 YTD
Sources: McKinsey Retirement Practice, ICI, Strategic Insight, Empirical Research Partners, SRI
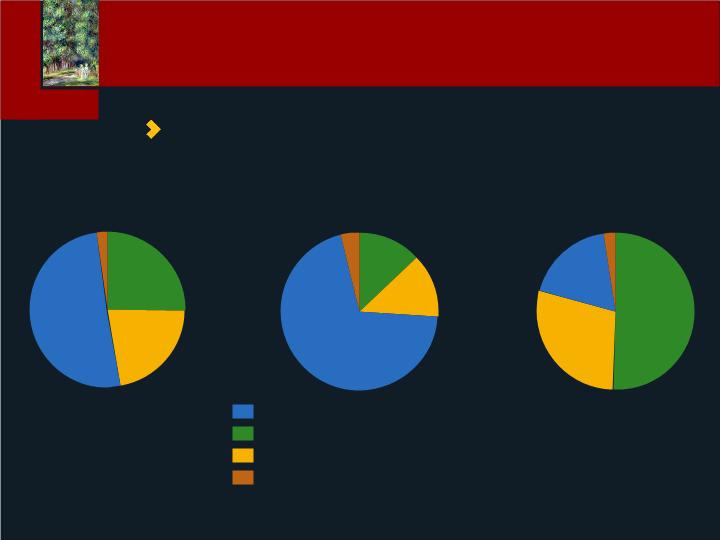
3,608
3,813
1,154
Retirement assets - 2006
Expected net flows
2007-12E
Deposits
Mutual
funds
Annuities
2,556
731
351
Deposits
Mutual
funds
Annuities
Annuity Competitive Landscape
Significant Opportunity to Grow
Large share of assets in deposits and mutual funds
Significant money in motion
            Longevity and investment risk management concerns should
    enable insurers to capture share of money in motion

5th
5.6%
5th
6.0%
1st
7.0%
$405
3Q06
YTD
Industry Rank*
Market Share*
39% Growth YTD
3Q07 vs. 3Q06
Life Insurance Growth
Taking Market Share
Lincoln Life Insurance Sales
* Industry and market share based on VARDS data through 3Q07 YTD
Source: LIMRA
$ in Billions
Big companies taking market
share
Increased focus on protection
            Flat VUL sales since 2003 present
   potential opportunity
            Lincoln well-positioned to
   capitalize on industry trends
3.6
2.8
11.2
2001
1.9
3.0
13.5
2006
Total Industry - New Premiums
Whole
Term
VUL/VL
UL
CAGR
Percent
(12)
17
1
7
Top 10 CAGR =
6.5%
+4%
Life Insurance Competitive Landscape

Leveraging Critical Success Factors

Product Innovation and
Responsiveness
Retirement Income
Security
Operational Effectiveness
Comprehensive Risk
Management
Distribution Depth
and Breadth
Strategic Cornerstones
Blueprint for Profitable Growth
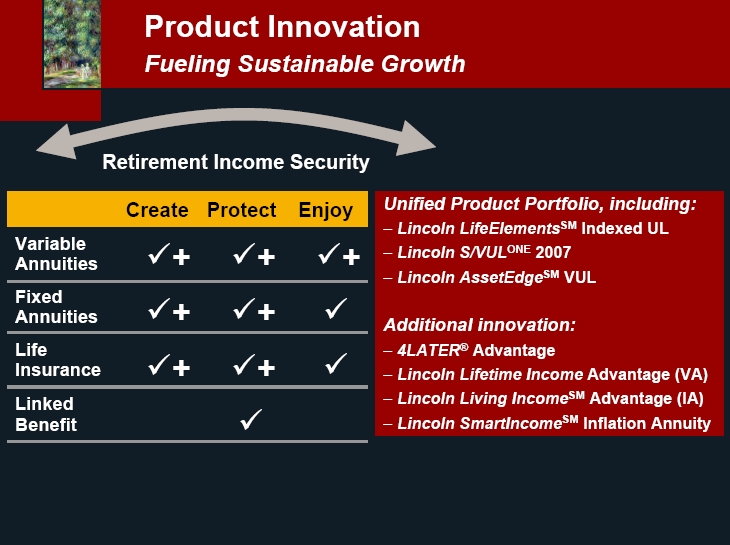
Unified Product Portfolio, including: – Lincoln LifeElementsSM Indexed UL – Lincoln S/VULONE 2007 – Lincoln AssetEdgeSM VUL Additional innovation:
– 4LATER® Advantage– Lincoln Lifetime Income Advantage (VA)– Lincoln Living IncomeSM Advantage (IA)– Lincoln SmartIncomeSM Inflation Annuity

Increasing Top Line While Decreasing Expenses
2006
Post Merger
(4/1/06 - 12/31/06)
Annuity
G & A expenses
Average Account Value
G & A as annualized % of AV
Life
G & A expenses
Collected Premiums
G & A as a % of premiums
$233
$62,046
50 bps
$336
$3,324
10.1%
$233
$70,511
44 bps
$331
$3,476
9.5%
2007
YTD
(1/1/07 - 9/30/07)
2005
Lincoln
(1/1/05 - 12/31/05)
$271
$43,498
62 bps
$297
$2,407
12.3%
Operational Effectiveness
Driving Down Expense Ratios

Customer-Centric, Scale-Enabled = Competitive Differentiator
Front Line Cross-Functional Team
Underwriting Account Executive
Dotted line to UW
Center of
Excellence
Operations Manager
Sr. NBA
NBA
NBA
NBA
NBA
Underwriting Director
Underwriter
Underwriter
Underwriter
Underwriter
Underwriting Team Structure
Operational Effectiveness
Industry Leading Underwriting
Manages New
Business staff
Business staff
Senior team member
Coaches and mentors
Accountable for team performance
Technical and process
training
training
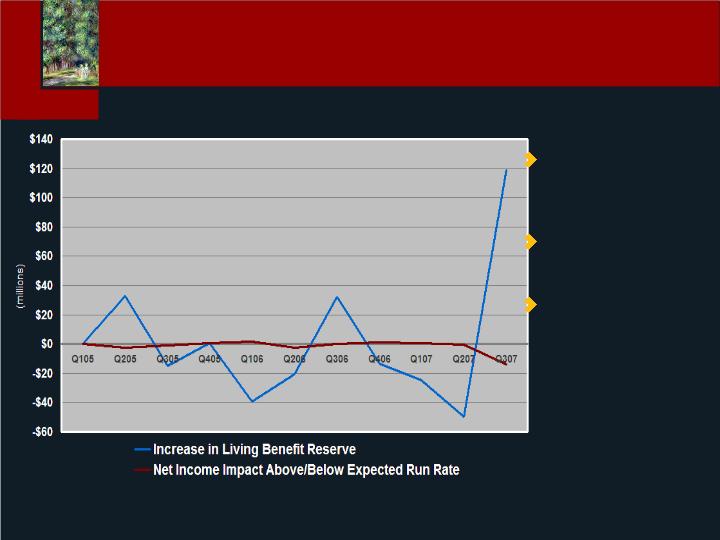
Expected run rate
cost of $2.0 - $3.0
million, after tax, after
DAC, per quarter
Q3 results driven by
volatile market
conditions
Would not expect
significant breakage
in more normal
environment
Comprehensive Risk Management
Variable Annuity Hedging Effectiveness
Macro:
•Balanced business mix:
$2,761M Total**
Margins
•Distribution diversification
Comprehensive Risk Management
Ensuring Stability of Results
Micro:
• Disciplined New
  Business Pricing and
  Monitoring
•YTD new business
expected returns:
–Annuity 18%, Life
13%*
•Equity Risk
Management
•Asset Liability
Management
•Risk Transfer
*Assumes capital solution
**Numbers reflect trailing 12 months as of 9/30/07
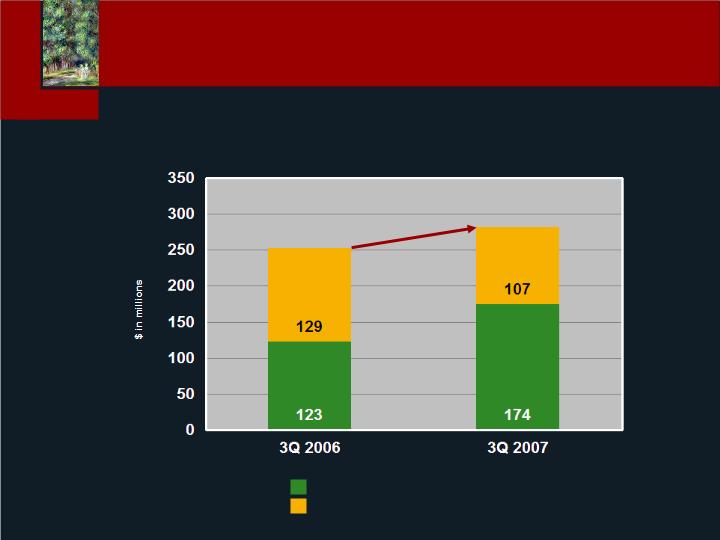
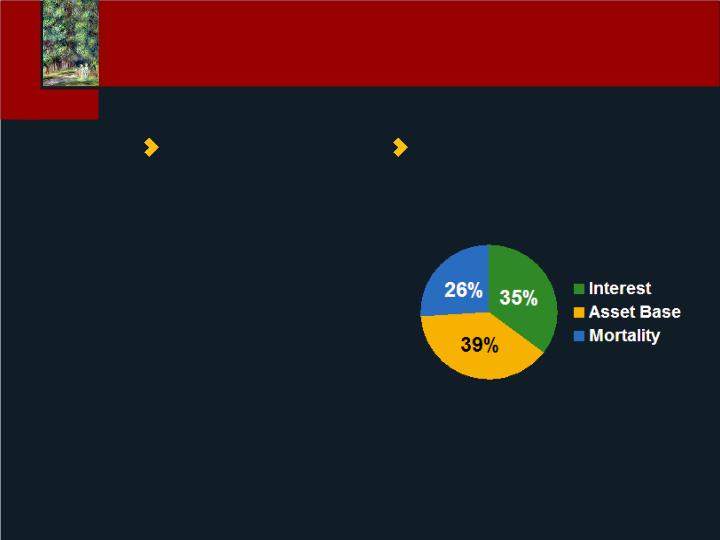
Life Income from Operations
Annuity Income from Operations
Total Individual Markets Income from Operations
11% growth
252
281
Annuity and Life Earnings
Driving Bottom Line Growth

Profitable Growth
Strategic scale
Momentum
Opportunity
Execution
Individual Markets

Questions?

Terry Mullen
President and CEO
Lincoln
Financial
Distributors
Lincoln
Financial
Distributors
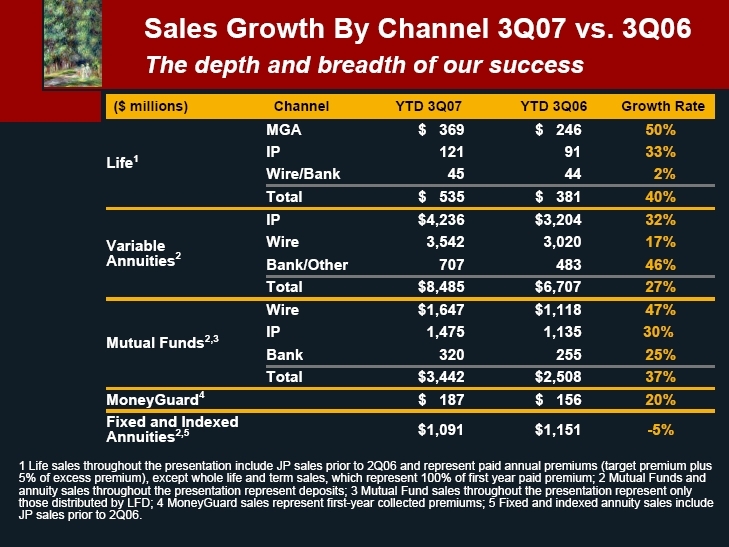
Sales Growth By Channel 3Q07 vs. 3Q06 The depth and breadth of our success ($ millions)Channel YTD 3Q07 YTD 3Q06Growth Rat Life1MGA$ 369$ 246 50% IP12191 33% Wire/Bank4544 2% Total$ 535$ 381 40% Variable Annuities2IP$4,236$3,204 32% Wire3,5423,020 17% Bank/Other707483 46% Total$8,485$6,707 27% Mutual Funds2,3Wire$1,647$1,118 47% IP1,4751,135 30% Bank320255 25% Total$3,442$2,508 37% MoneyGuard4$ 187$ 156 20% Fixed and Indexed Annuities2,5$1,091$1,151 -5% 1 Life sales throughout the presentation include JP sales prior to 2Q06 and represent paid annual premiums (target premium plus 5% of excess premium), except whole life and term sales, which represent 100% of first year paid premium; 2 Mutual Funds and annuity sales throughout the presentation represent deposits; 3 Mutual Fund sales throughout the presentation represent only those distributed by LFD; 4 MoneyGuard sales represent first-year collected premiums; 5 Fixed and indexed annuity sales include JP sales prior to 2Q06.

1 Includes term and JP sales prior to 2Q06
2 Source: LIMRA International, Inc., including term
3 Source: ICI Retail Long-Term New Sales
4 Source: VARDS Online by Morningstar New Sales
LFD | Industry | |
Life | 17%1 | 4%2 |
Mutual Funds | 17% | 6%3 |
Variable Annuity - ChoicePlus | 34% | 8%4 |
Variable Annuity - American Legacy | 25% | 8%4 |
LFD versus Industry:
Compound Annual Growth Rates 2001-2006
Sales Growth By Product 2001-2006
The sustainability of our success
The right business model,
the right strategy, the right people
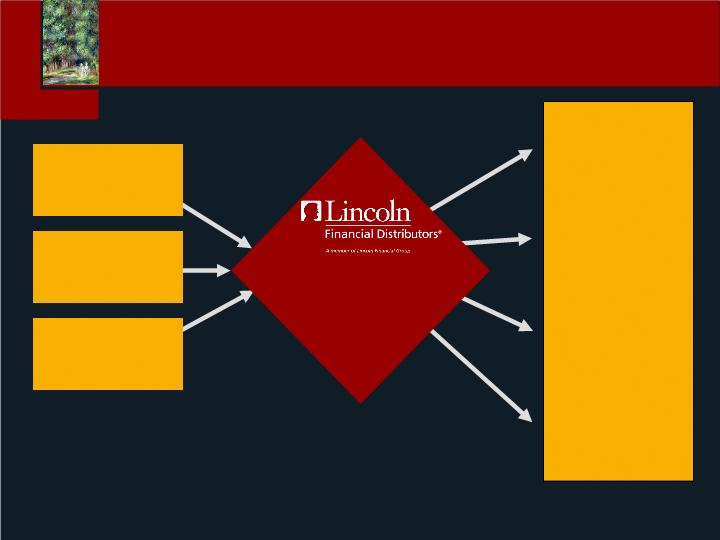
Annuities
Investments
Wirehouse &
Regional B/Ds
Marketing
General
Agents
Independent
Planners
Banks
Wholesaling Scale and
Quality
Life
Strategic
Partnerships
Unique Solutions-Based Distribution Model
Variable
Annuities
49%
Life 26%
Investments3
12%
Number of Wholesalers1
MoneyGuard
8%
Fixed
Annuities
5%
Wholesalers by Product
As of September 30, 2007
2
2
1 Includes External Wholesalers, Internal Wholesalers and Sales Management
2 2007 Wholesalers as of YTD 3Q07, 2008 represents preliminary projections
3 Investments defined as Mutual Funds and Managed Accounts
Scale Of Wholesaling
Distribution Expansion
- Attracting top talent
Strategic Wholesaler Expansion
Redesigning territories and building deeper
relationships
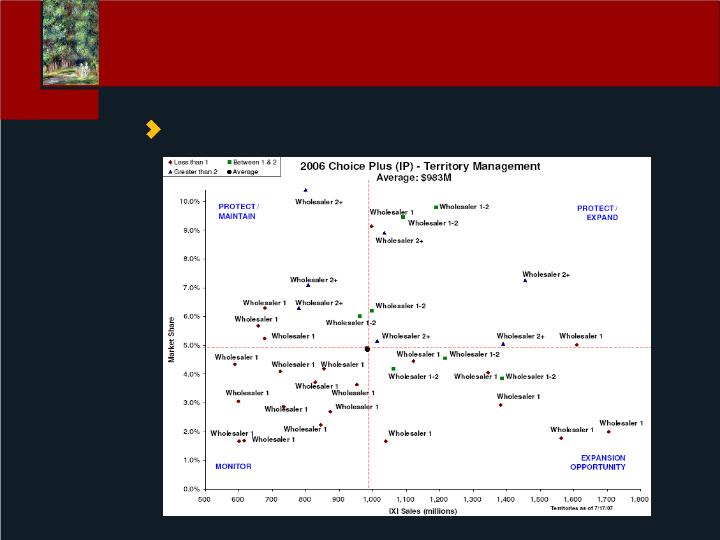
Workforce Planning - Sample Analysis - IXI:

Wholesaler Tenure
As of September 30, 2007
2+ Years
52%
<1 Year
26%
1-2 Years
22%
2+ Years
43%
<1 Year
25%
1-2 Years
32%
As of September 30, 20051
1 Excludes Jefferson-Pilot wholesalers
Wholesaler Quality
Retention leading to increased productivity

Strategic Priorities
2008 - 2010
Attract and retain top wholesaling talent
Continue to surpass industry average variable
annuity, life and linked benefit sales
Develop current and new strategic partnerships
Continue to grow the population of financial advisors
selling multiple LFG products

Questions?

Bob Dineen
President and CEO
Lincoln Financial
Network
Jefferson Pilot Securities Corp.
Lincoln Financial Advisors Corp.
Lincoln Financial
Network

Lincoln Financial Network Overview
LFN positioned for top & bottom-line growth
Multi-channel model is a competitive advantage
for recruiting and retaining top advisors
Retirement Income is a particularly compelling
opportunity for Retail Distribution

Independent
Full Service Support
JPSC GA ABGA / DAN LFA / Sagemark
Lincoln Financial Network Overview
6,950 affiliated producing advisors*
4 channels of independent distribution
2 broker dealers
$89B customer assets**
* Advisors as of September 30, 2007.** Aggregate customer assets for which an LFN planner as the representative of record. |

Year-to-Date September 30, 2007
Contribution to Lincoln Financial
22% life insurance PAP
•$122 million of life target premium
12% annuity premium*
•$1.4 billion of annuity and
retirement investments
            ~50% in-force permanent life
   insurance block
* |
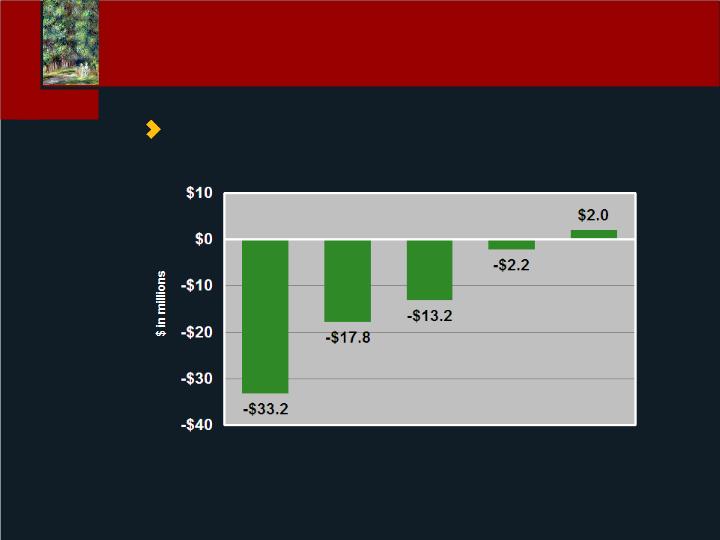
2006 & 2007 YTD show combined JP distribution and LFA/Sagemark
Prior periods reflect operating loss for LFA/Sagemark stand-alone
Operating results are allocated to Individual Markets and Employer Markets for external reporting
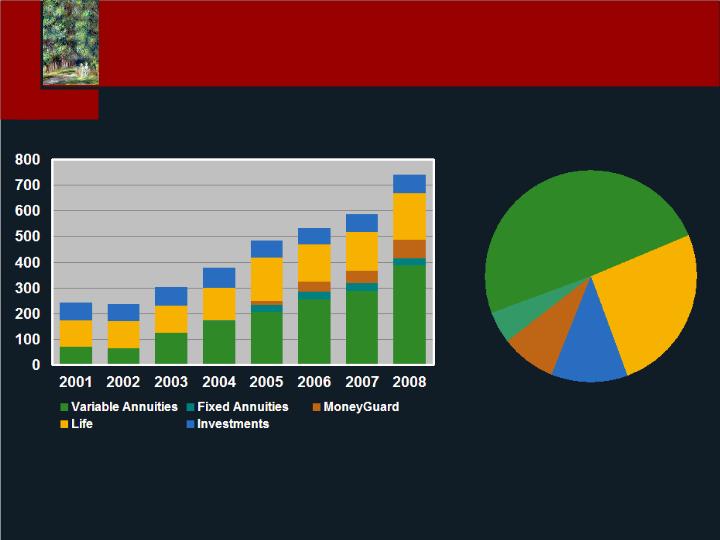
2003
2004
2005
2006
2007
YTD
Delivering Positive Results
Lincoln Financial Network
•Operating Income/Loss
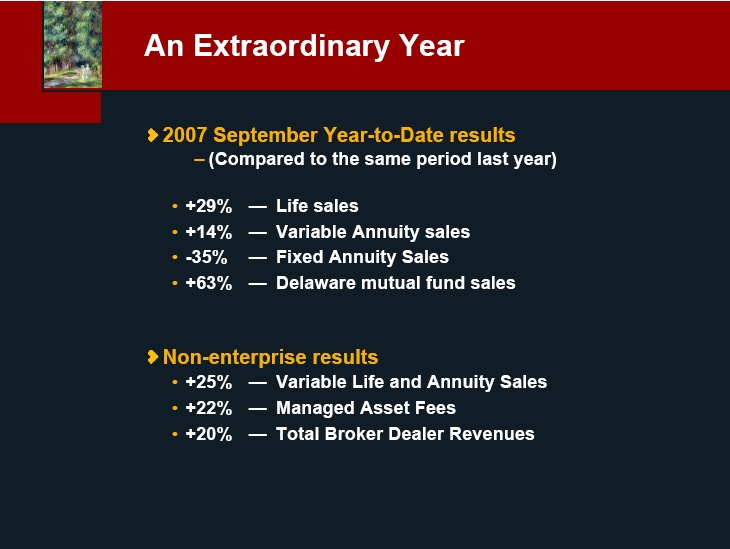
An Extraordinary Year 2007 September Year-to-Date results (Compared to the same period last year) +29% Life sales +14% Variable Annuity sales -35% Fixed Annuity Sales +63% Delaware mutual fund sales Non-enterprise results +25% Variable Life and Annuity Sales +22% Managed Asset Fees +20% Total Broker Dealer Revenues

2007 Growth Drivers
Multi-channel Model (flexibility and choice)
            Investment build-out of our National
   Recruiting Platform
Positive trends in GA / affiliated brokerage activations
            Investment in a more competitive
   compensation structure
•Fixed Life
•VA / Mutual Fund

“Distribution strategies with most success for end
consumers rely on face to face consultations and
personal referrals; independent financial advisors are
capturing greater share of the retirement market.”
- McKinsey Survey, October 2007
LFN Retirement Income Security
Our LFN Integrated Structure is positioned to serve
•Life & Legacy (Retirement Specialists)
–69 received CRPCSM certification as of 10/31/07
–25 graduated, awaiting final certification
–Additional 219 active participants
•RIS Planning Support
•Sagemark Private Wealth Services

Recruiting and Retention
From September 30, 2006 to September 30, 2007
LFN’s Recruiting Strategy
•  Continue positive trend of Net Gross Dealer
   Concession (GDC) Growth from Full-time Recruits
•  Drive incremental GDC Growth from affiliated
   brokerage activations
First full year national recruiting team
• Added 375 producing advisors
• Added 15 national recruiting professionals
• Positive net growth of GDC from Recruiting in 2007
•  Current Recruiting Pipeline - 400+ experienced
   advisors with average GDC of 245,000

Scale =
Growth
Outlook For An Even Better 2008
The power of Lincoln Financial Network
•Sustainable, attractive model
•Growing number of loyal, productive advisors
•Open architecture & affiliation choice
•Best-in-class products and wholesaling
•Deep financial planning expertise
•Forward-thinking retirement strategies
•The leverage of Lincoln Financial Group

Questions?

Fred Crawford
Chief Financial Officer
Lincoln Financial Group
Financial Outlook & Capital
Management

3 Year Rolling Plan - Sets Incentive Compensation
Currently In-Process - Approved by Board in February
A Look Inside Our Financial Plan
Earnings & Capital Plan
Budget Process
Sales Plan
Strategic Investments
Fundamentals
            Heading for a record VA & Life
production year
Strong asset and in-force growth
Solid group protection dynamics
            Investment Management expanding
margins
Defined Contribution in transition
Healthy capital position
Volatility impacts hedging
Pressure on alt. investments
Monitoring credit conditions
Markets
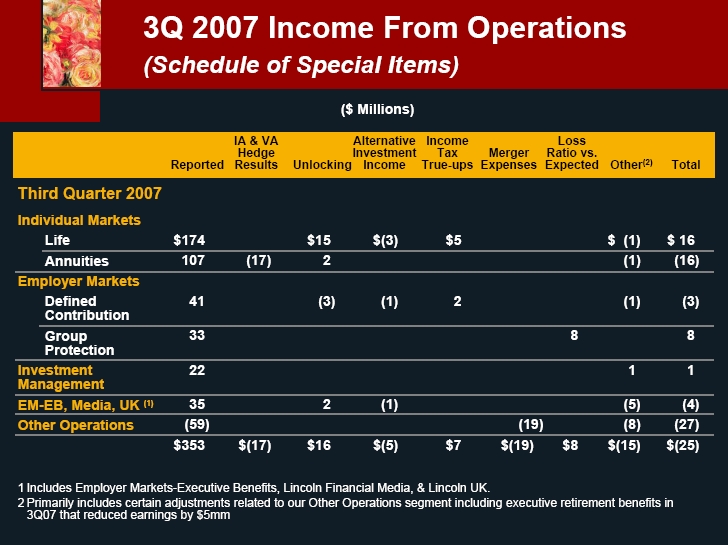
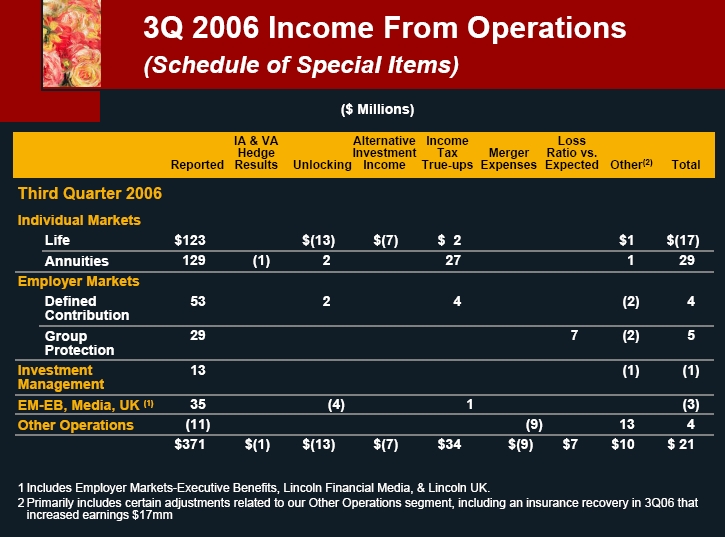
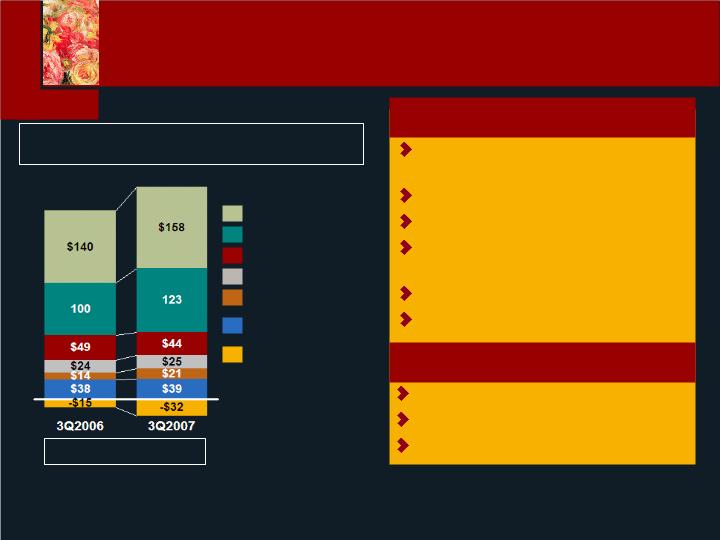
3Q Income from Operations Adjusted for Merger
Expenses & Schedule of Special Items
$350mm
$378mm
Life Insurance
Annuities
Defined Contrib.
Group Protection
Investment Mgmt.
UK, Media, Executive
Benefits**
Other Operations
Avg. diluted shares
282.4 272.5
Third Quarter: Strong Fundamentals
* See Appendix for definition of non-GAAP financial information and/or reconciliations, and schedule of special items. |
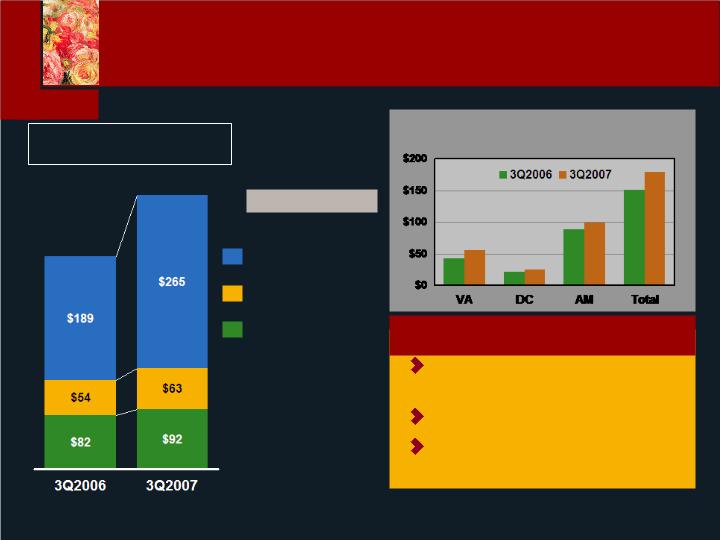
Total Average Variable Assets
($ billions)
            Continued VA deposits and flow
strength
DC flows driven by Alliance
            Delaware retail deposits
continue to build
2008 Outlook
Asset Fee Revenue*
($ millions)
$325
$420
S&P 50015.7%
Variable
Annuities40%
Defined
Contribution17%
Asset
Management12%
Growth Rates
Retirement Asset Gathering Engine
* VA & DC expense assessment income and asset management third-party advisory fee income. S&P represents daily average |
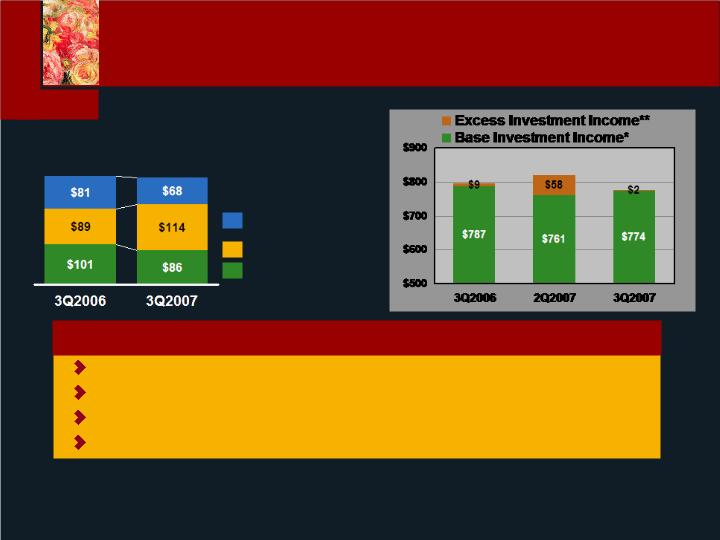
Annuity: Spreads of 200 bps. - negative flows diminish
Life: Spreads of 180 bps. - steady asset growth; securitization impact
DC: Spreads under pressure at 225 bps - with stable assets
Excess income pressured in 2008
2008 Outlook
Fixed Margin* ($ millions)
$271
$268
Defined
Contribution
Life
Annuities
($ Millions)
Fixed Margin - “A Mixed Story”
* Adjusted for FAS 113 Forward-Starting Option valuation of ($7mm) 3Q2006 and ($13mm) 3Q2007. |
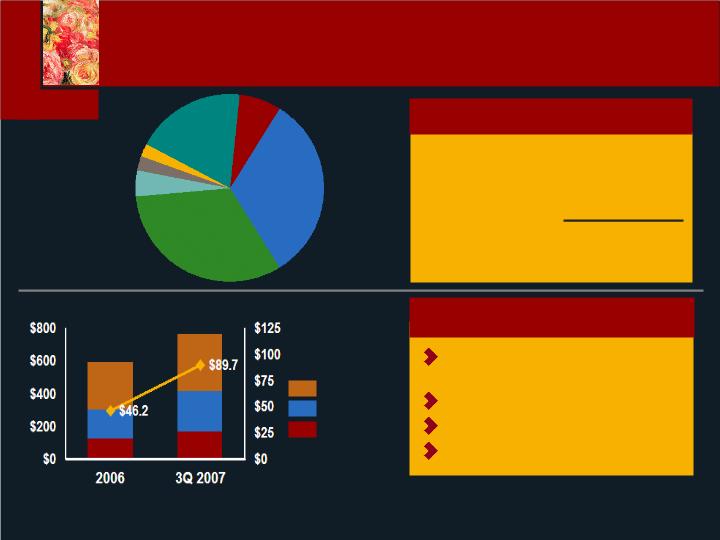
Income** ($ mm)¨
Book Value* ($ mm)
Hedge Funds
Pvt. Equity
Energy/RE
$589
$761
A
28%
BBB
32%
AAA
23%
AA
10%
BB 3%
B & Lower 2%
Adj. Cash 2%
Alternative Investments
Target a 10-12% portfolio
return
Life = BV of $500mm
Annuities = BV of $121mm
DC = BV of $140mm
$60 Billion
Bond Portfolio
S-Prime Alt-A
AAA
AA & A
BBB & Lower
Total
Price / BV
$673
118
52
$843
94%
$1,137
317
30
$1,484
96%
Average Rating
“A”
General Account Conditions
* Book value at amortized cost** Pre-DAC and pre-tax |
Life - 2008 Outlook
Stable 6-8% growth in earnings
drivers
Growth in VUL and M-Guard
Settling into unified product
portfolio
Continued strength in core
small-case markets
Net earned premium growth
of 9-11%
Loss Ratios: low end of our range
71%-74%
Group - 2008 Outlook
Total Charges*
($ millions)¨
$253b
$269b
$348m
$375m
Interest-Sensitive
In-force ($ B)
8%
Non-Medical
Loss Ratio¨
Net Earned
Premium ($ mm)
11%
Life
Disability
Dental
Steady Mortality & Morbidity Margins
* Includes cost of insurance charges and expense assessments. Adjusted for prospective unlocking and related amortization of |

Integrating, Investing, and Growing ….all at the same time
Improving expense ratios in all major segments
Making significant technology & infrastructure investments
3-year save target increased to $195m-$205m range
Enterprise Expense Ratio
Expenses* to Total Revenue
3Q2006 3Q2007
Expenses* to Total Revenue
(Excluding Investment Income)
14.3% 13.3%
25.7% 22.1%
Merger Expenses
2006 2007(E) 2008-2009
$49m $100m $55m- $65m
Operating Effectiveness
* Gross G&A + Commissions (less) Deferred expenses. Adjusted for special expense items including incentive compensation |
Available Capital:
•Capital margin ~ $400 mm
•B of A stock ~ $150 mm
(A-T)
•Reserve relief ~ $300 mm
•FCF run-rate ~ $200 mm +/-
Capital Targets
“AA” capital ratios
RBC 350% to 400%
Leverage 20-25%
Capital structure (10/20/70)
EBIT coverage 8-10x
Repurchase range $300-$400mm
(ex-media)
Support Life & Annuity growth
Strategic investments
Volatile capital markets
2008 Outlook
RBC (%)** ¨
21.1%
21.6%
411%
400%
Leverage* (%)
“AA” Capital Conditions
* Leverage calculated by dividing debt adjusted for capital securities equity credit by total capital (debt plus equity adjusted for |
ROE Drivers
Growth in high-ROE segments
Capital management
Favorable capital conditions
Progress towards 15% in 3 yrs
12.2%
12.9%
ROE* (%)
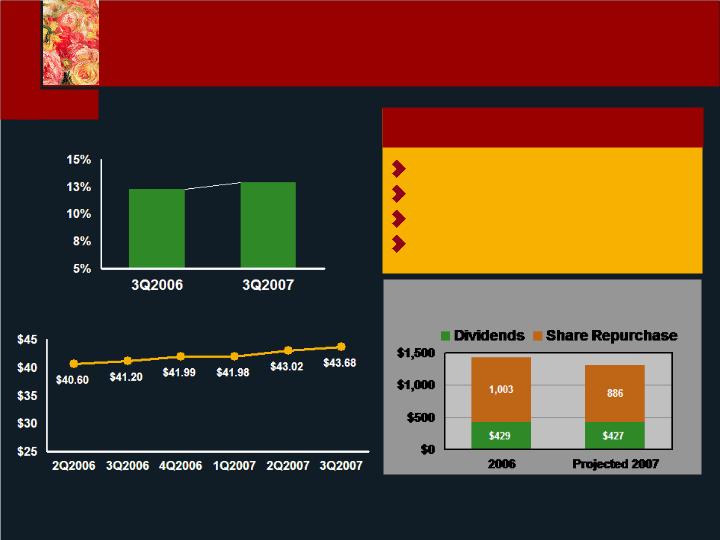
BVPS ($/share ex AOCI)
Capital Returned to
Shareholders ($ millions)
ROE & Book Value Progression
* ROE is based upon income from operations adjusted for special items and merger- related expenses. ROE is calculated by dividing |

Television
Charlotte Radio
Sports
Key
Takeaways
San Diego,
Denver,
Atlanta and
Miami Radio
Markets
Divested
Media
Businesses
Remaining
Media
Investment
Date Agreement
Signed
Purchase Price
($ mm)
2007 Broadcast
Cash Flow
Multiple
Strong offers reflected quality of Lincoln Financial
Media’s operations
Purchase multiples reflect acquisition levels competitive
with “normalized” credit and M&A market conditions
Concluding our strategic review
Deliberate approach in recognition of current market
environment
Continue to actively manage these investments to maximize
station performance and future valuation
Nov. 12th
$548
13.1x
Nov. 12th
100
13.8x
Nov. 12th
35
Residual
Valuation
Lincoln Media Update

Key Assumptions
Pro Forma Impact Calculations
“Leverage neutral” approach - 25% debt reduction & 75% stock repurchase
Assume 3Q adjusted earnings, diluted shares, BVPS, current share price,
and interest rates(2)
(1)Net of fees and expenses.
(2)Accretion/dilution and ROE impact is based upon annualized 3Q2007 income from operations adjusted for special items. See Appendix for non-GAAP financial
information and/or reconciliations. Other assumptions include LNC share price of $60 for repurchase, interest rate on debt of 6% and current book value per share of
$43.68.
Total Pre-tax proceeds$683
Total Net Proceeds(1)~ $450
EPS accretion/dilution (2)~.2%
Book Value Impact From Sale~($130)mm (1.1%)
ROE Impact(2)~0.3%
Media - Pro Forma Impact

3Q07 Results
Capital
Mid-point of the “AA” range
Executed on capital projects
General account well positioned
Earnings
$1.36 adjusted (ex merger exp.)
L&A, GP (80% of total) up 13% with
strong fundamentals
Market volatility
Production
Excellent retail growth - LFD/LFN
Institutional - “a mixed story”
2008 Outlook
Capital
Support growth & monitor capital
markets
Strong available capital position
$300-$400 million of repurchase
Earnings
L&A, GP continued strength in
fundamentals
“Headwinds” in DC & Inv. Mgt. with
plans in place
Markets?
Production
Retail momentum continues
Institutional - investment mode
Invest in retirement income
Financial Plan Roll-Forward

Appendix

Net Income
Less:
Net realized gains (losses) on investments
and derivatives
Net gain on reinsurance derivative/trading
account securities
Reserve development and related amortization
on business sold through reinsurance
Income from Operations
Earnings per share (diluted)
Net Income
Income from Operations
Average Equity
(Excluding accumulated other comprehensive income)
Return on Equity
Net Income
Income from Operations
($ in millions, except per share data)
For the Quarter Ended
September 30,
$329.60
-23.2
-0.5
0.4
$352.90
$1.21
$1.29
$11,726.30
11.20%
12.00%
$364.10
-4.1
-3.1
0.2
$371.10
$1.29
$1.31
$11,437.90
12.70%
13.00%
2007
2006
Net Income to Operating Earnings
Reconciliation
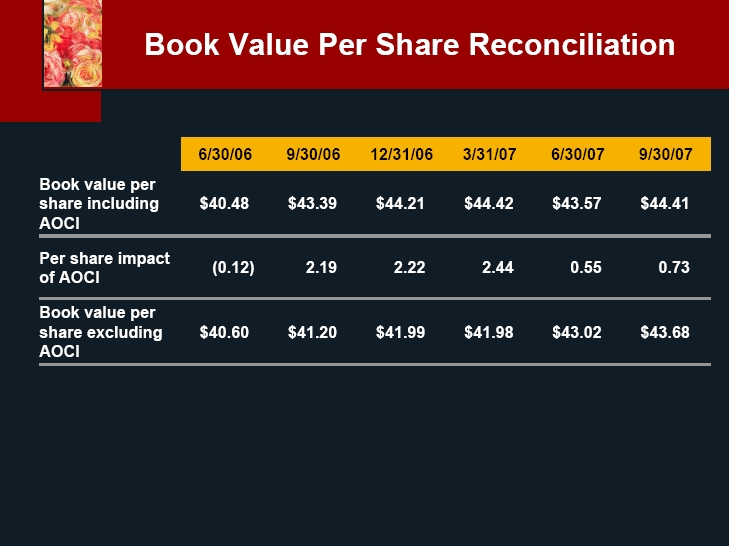
Book Value Per Share Reconciliation 6/30/06 9/30/06 12/31/06 3/31/07 6/30/07 9/30/07 Book value per share including AOCI $40.48 $43.39 $44.21 $44.42 $43.57 $44.41 Per share impact of AOCI (0.12) 2.19 2.22 2.44 0.5 50.73 Book value per share excluding AOCI $40.60 $41.20 $41.99 $41.98 $43.02 $43.68