UNITED STATES
SECURITIES AND EXCHANGE COMMISSION
Washington, DC 20549
FORM N-CSR
CERTIFIED SHAREHOLDER REPORT OF REGISTERED
MANAGEMENT INVESTMENT COMPANIES
Investment Company Act file number 811-00082
CGM TRUST
(Exact name of registrant as specified in charter)
One International Place, Boston, Massachusetts 02110
(Address of principal executive offices) (Zip code)
Barry N. Hurwitz, Esq.
Morgan, Lewis & Bockius LLP
One Federal Street
Boston, MA 02110
(Name and address of agent for service)
Registrant's telephone number, including area code: 1-617-737-3225
Date of fiscal year end: December 31, 2015
Date of reporting period: December 31, 2015
ITEM 1. REPORTS TO STOCKHOLDERS.
|
| |
| INVESTMENT ADVISER |
| CAPITAL GROWTH MANAGEMENT |
| LIMITED PARTNERSHIP |
| Boston, Massachusetts 02110 |
|
| |
| TRANSFER AND DIVIDEND PAYING |
| AGENT AND CUSTODIAN OF ASSETS |
STATE STREET BANK AND TRUST COMPANY
Boston, Massachusetts 02111 |
|
| |
| SHAREHOLDER SERVICING AGENT |
| FOR STATE STREET BANK AND |
| TRUST COMPANY |
BOSTON FINANCIAL DATA SERVICES, INC.
P.O. Box 8511
Boston, Massachusetts 02266-8511 |
|
| | |
| TELEPHONE NUMBERS |
| For information about: |
| n | Account Procedures |
| n | Purchases |
| n | Redemptions |
| n | Exchanges
Call 800-343-5678 |
| n | New Account Procedures and Status |
| n | Prospectuses |
| n | Performance |
| n | Proxy Voting Policies and Voting Records |
| n | Complete Schedule of Portfolio Holdings
for the 1st & 3rd Quarters (as filed on Form N-Q)
Call 800-345-4048 |
| | | |
| MAILING ADDRESS |
| CGM Shareholder Services |
| c/o Boston Financial Data Services |
| P.O. Box 8511 |
| Boston, MA 02266-8511 |
| |
| |
| WEBSITE |
| www.cgmfunds.com |
| |
| |
| This report has been prepared for the shareholders of the Fund and is not authorized for distribution to current or prospective investors in the Fund unless it is accompanied or preceded by a prospectus. |
| | |
| MAR15 | Printed in U.S.A. |
CGM
Mutual Fund
86th Annual Report
December 31, 2015
A No-Load Fund
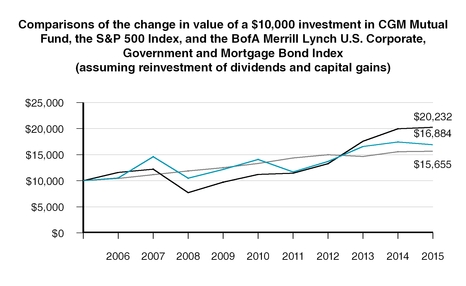
CGM Mutual Fund increased 1.1% during the fourth quarter of 2015, compared to the Standard and Poor’s 500 Index (S&P 500 Index) which increased 7.0% and the BofA Merrill Lynch U.S. Corporate, Government and Mortgage Bond Index which returned -0.6% over the same period. For the twelve months ended December 31, 2015, CGM Mutual Fund decreased -3.1%, the S&P 500 Index increased 1.4% and the BofA Merrill Lynch U.S. Corporate, Government and Mortgage Bond Index returned 0.6%.
The Year in Review and Economic Outlook
2015 began with mixed signals on the direction of the U.S. economy. February reports of prior month U.S. auto sales showed a 14% overall increase from December 2014 and a 19.3% increase for higher priced light trucks and SUVs for the same period. The pace of new home sales continued to expand and the Commerce Department reported that January and February sales remained near the six year high, despite the severe winter weather in much of the U.S., tight credit for borrowers and rising home prices. In March, the Federal Reserve ("Fed") reported U.S. industrial production increased 3.5% and capacity utilization increased 3.1% over the year before, suggesting a long term outlook of moderate economic growth. Despite these positive indicators, the stock market continued to react to the timing uncertainty of an interest rate increase by the Fed, which moved bond yields higher and contributed to the rising value of the dollar. Ultimately, the harsh winter, strong dollar, falling oil prices and a labor dispute that shut down U.S. West Coast ports led to a 0.2% decrease in the gross domestic product for the first quarter, according to the Commerce Department.
In April, the Fed referred to the economic difficulties in the first quarter along with cautious spending by U.S. consumers and businesses as evidence of some restraint in the growth of the U.S. economy. Still, the Fed indicated that it anticipated U.S. economic growth to again pick up to a moderate pace. Growth continued to be found in the housing market. An April report from the Commerce Department showed that first quarter 2015 sales of new homes increased by 21.7% over the first quarter of 2014. The increase was likely attributable to low mortgage rates, job growth and improving wages. In April, the Labor Department’s Employment-Cost Index, a wide-ranging measure of compensation expenses, reported a seasonally adjusted increase of 0.7% for the first quarter, indicating a tightening job market and an upward trend in wages. In May, the strengthening manufacturing sector, coupled with a Commerce Department report that U.S. housing starts rose 20.2% from March to April, led to a sell-off in U.S. Treasuries. However, by the end of the quarter, the 10 year Treasury yield stood at 2.3% as investments moved to safety in response to Greece’s default on its debt to the International Monetary Fund and European creditors.
In July, the Commerce Department provided some positive news of growth, reporting that orders for durable goods in June increased by 3.4%, a sign that businesses started to increase spending. The Commerce Department also reported that the monthly growth in starts for single family housing units, which account for approximately two-thirds of the housing market, increased by 12.3% and again by 12.8% in June and July respectively. However, U.S. stock market performance was negatively impacted by reaction to slowing Chinese economic
growth. Large sell-offs in the Shanghai Composite Index, the impact on commodities prices of weakening demand from China for raw materials and China’s devaluation of the yuan in early August contributed to the first U.S. stock market correction in four years.
The sluggish Chinese manufacturing sector, coupled with OPEC’s decision to maintain its high level of oil production into a near-capacity world market, pushed oil prices below $40 a barrel in the fourth quarter. While subdued oil prices have had a negative impact on the energy sector, the Fed saw enough strength in the overall U.S. economy to raise interest rates for the first time in seven years. Addressing the Fed’s decision, Chair Janet Yellen acknowledged the unevenness across different industrial sectors but pointed to improved labor market conditions and predicted sustainable continued improvement in the economy. Labor Department reports through the year showed increasing average hourly earnings and the unemployment rate dropped to 5% by October. While mixed economic signals are expected to continue, Congress acted in December to extend tax breaks to businesses and low income families and to fund the government through September 2016. This bi-partisan action demonstrated that Congress can work together and avoids the threat that a government shut-down will drag on the U.S. economy into 2016.
Portfolio Strategy
CGM Mutual Fund was fully invested throughout 2015 in anticipation of stronger expansion in the U.S. economy. The fund's portfolio was focused on companies that we believed would benefit from more rapid growth and rising U.S. interest rates. Consumer spending was stimulated by sharply lower gasoline and fuel prices and
rising employment, but growth was less than we anticipated. The strong dollar negatively impacted exports and reduced pricing flexibility for some companies.
The portfolio benefited most from appreciation in our investments in homebuilding, automobile and lighting products companies, and realized its largest losses from investments in retailers and appliance manufacturers.
The fixed income section of the fund fluctuated between 26% and 30% of the portfolio during the year. The fixed income portfolio was invested in U.S. Treasury notes with less than a two year maturity in anticipation of higher interest rates.
On December 31, 2015, CGM Mutual Fund was 27.2% invested in U.S. Treasury securities. The three largest industry positions in the equity portion of the portfolio were in housing and building materials, the retail industry and commercial banks. The Fund’s three largest equity holdings were D.R. Horton, Inc. (housing and building materials), the Lennar Corporation (housing and building materials) and Citigroup Inc. (commercial bank).
David C. Fietze
President
G. Kenneth Heebner
Portfolio Manager
January 2, 2016
Average Annual Total Returns through 12/31/15
|
| | | | | | |
| | | | | 1 Year | 5 Year | 10 Year |
| | n | | CGM Mutual Fund | -3.1% | 3.7% | 5.4% |
| | n | | S&P 500 Index | 1.4% | 12.6% | 7.3% |
| | n | | BofA Merrill Lynch U.S. Corp, Govt & Mortgage Bond Index | 0.6% | 3.3% | 4.6% |
Past performance is no indication of future results and current performance may be higher or lower than the figures shown. Unlike a fund, an index is not managed and does not reflect fees and expenses.
|
| | | |
| CGM MUTUAL FUND |
| Portfolio Manager |
G. Kenneth Heebner has managed CGM Mutual Fund since 1981. In 1990, Mr. Heebner founded Capital Growth Management Limited Partnership ("CGM") with Robert L. Kemp. Prior to establishing CGM, Mr. Heebner was at Loomis, Sayles & Company where he managed the Fund, then known as Loomis Sayles Mutual Fund. In addition to CGM Mutual Fund, he currently manages CGM Realty Fund and CGM Focus Fund as well as other funds.
|
| | | | |
| INVESTMENT PERFORMANCE |
| (unaudited) |
| Cumulative Total Returns for Periods Ended December 31, 2015 |
| | CGM
Mutual Fund (%) |
| 10 Years | + | 68.8 | | |
| 5 Years | + | 19.8 | | |
| 1 Year | - | 3.1 | | |
| 3 Months | + | 1.1 | | |
The performance data contained in the report represent past performance, which is no guarantee of future results. The graph and table above do not reflect the deduction of taxes a shareholder would pay on Fund distributions or the redemption of Fund shares and assumes the reinvestment of all Fund distributions.
The investment return and the principal value of an investment in the Fund will fluctuate so that investors' shares, when redeemed, may be worth more or less than their original cost. Current performance may be higher or lower than the performance data quoted.
PORTFOLIO DIVERSIFICATION as of December 31, 2015 COMMON STOCKS |
| | | |
| Industry | Percent of Net Assets |
| |
| Housing and Building Materials | 25.8 | % | |
| Retail | 9.9 |
| |
| Commercial Banks | 9.0 |
| |
| Broker/Dealers | 8.4 |
| |
| Home Products | 5.1 |
| |
| Technology | 4.5 |
| |
| Home Building Products | 3.5 |
| |
| Leisure | 2.7 |
| |
| Biotechnology | 1.6 |
| |
| Miscellaneous | 1.3 |
| |
| Financial Services - Miscellaneous | 0.7 |
| |
| BONDS |
| | | |
| United States Treasury Notes | 27.2 |
| |
SCHEDULE OF INVESTMENTS as of December 31, 2015 COMMON STOCKS — 72.5% OF TOTAL NET ASSETS |
| | | | | | | | |
| | | Shares | | Value(a) |
| Biotechnology — 1.6% |
|
|
|
| Mallinckrodt public limited company (b) | 85,000 |
|
| $ | 6,343,550 |
|
|
|
|
|
|
| Broker/Dealers — 8.4% |
|
|
|
|
| Morgan Stanley | 600,000 |
|
| 19,086,000 |
|
| TD Ameritrade Holding Corporation | 60,000 |
|
| 2,082,600 |
|
| The Charles Schwab Corporation | 380,000 |
|
| 12,513,400 |
|
| | | | | 33,682,000 |
|
| Commercial Banks — 9.0% |
|
|
|
| Bank of America Corporation | 600,000 |
|
| 10,098,000 |
|
| Citigroup Inc. | 500,000 |
|
| 25,875,000 |
|
|
|
|
| 35,973,000 |
|
| Financial Services - Miscellaneous — 0.7% |
|
|
|
| Lazard Ltd MLP | 65,000 |
|
| 2,925,650 |
|
| | | | | |
| Home Building Products — 3.5% |
|
|
|
| Fortune Brands Home & Security, Inc. | 65,000 |
|
| 3,607,500 |
|
| The Sherwin-Williams Company | 40,000 |
|
| 10,384,000 |
|
|
|
|
| 13,991,500 |
|
| Home Products — 5.1% |
|
|
|
| Whirlpool Corporation | 140,000 |
|
| 20,561,800 |
|
|
|
|
|
|
See accompanying notes to financial statements.
4
SCHEDULE OF INVESTMENTS as of December 31, 2015 (continued) COMMON STOCKS (continued) |
| | | | | | | | |
| Housing and Building Materials —25.8% | Shares |
| Value(a) |
| D.R. Horton, Inc. | 1,260,000 |
|
| $ | 40,357,800 |
|
| Lennar Corporation | 700,000 |
|
| 34,237,000 |
|
| NVR, Inc. (b) | 2,500 |
|
| 4,107,500 |
|
| Toll Brothers, Inc. (b) | 750,000 |
|
| 24,975,000 |
|
|
|
|
| 103,677,300 |
|
| Leisure — 2.7% |
|
|
|
| Carnival Corporation | 80,000 |
|
| 4,358,400 |
|
| Royal Caribbean Cruises Ltd. | 65,000 |
|
| 6,578,650 |
|
|
|
|
| 10,937,050 |
|
| Miscellaneous — 1.3% |
|
|
|
| HD Supply Holdings, Inc. (b) | 180,000 |
|
| 5,405,400 |
|
|
|
|
|
|
| Retail — 9.9% |
|
|
|
| Coach, Inc. | 280,000 |
|
| 9,164,400 |
|
| Dollar Tree, Inc. (b) | 130,000 |
|
| 10,038,600 |
|
| Signet Jewelers Limited | 165,000 |
|
| 20,408,850 |
|
|
|
|
| 39,611,850 |
|
| Technology — 4.5% |
|
|
|
| Alphabet Inc. (b) | 23,700 |
|
| 17,985,456 |
|
|
|
|
|
|
|
TOTAL COMMON STOCKS (Identified cost $267,825,482) |
| 291,094,556 |
|
|
|
|
|
|
|
| BONDS — 27.2% OF TOTAL NET ASSETS | Face
Amount |
|
|
United States Treasury — 27.2%
|
|
|
|
| United States Treasury Notes, 0.375%, 05/31/2016 | $ | 12,500,000 |
|
| 12,495,113 |
|
| United States Treasury Notes, 0.375%, 10/31/2016 | 54,000,000 |
|
| 53,833,356 |
|
| United States Treasury Notes, 0.500%, 01/31/2017 | 34,000,000 |
|
| 33,875,152 |
|
| United States Treasury Notes, 0.625%, 08/31/2017 | 3,000,000 |
|
| 2,980,782 |
|
| United States Treasury Notes, 1.250%, 12/15/2018 | 6,000,000 |
|
| 5,987,346 |
|
TOTAL BONDS (Identified cost $109,387,265) |
| 109,171,749 |
|
| SHORT-TERM INVESTMENT — 0.5% OF TOTAL NET ASSETS |
| | |
| |
|
|
|
| Tri-party Repurchase Agreement with Fixed Income Clearing Corporation, dated 12/31/2015 at 0.03% to be repurchased at $1,935,000 on 01/04/2016 collateralized by $1,740,000 US Treasury Bond, 3.625% due 08/15/2043 valued at $1,983,260 including interest (Cost $1,935,000) | 1,935,000 |
|
| 1,935,000 |
|
| | | | | |
TOTAL INVESTMENTS — 100.2% (Identified cost $379,147,747) |
| 402,201,305 |
|
| Cash and receivables |
| 20,679,830 |
|
| Liabilities |
| (21,301,733 | ) |
| TOTAL NET ASSETS — 100.0% |
| $ | 401,579,402 |
|
(a) See Note 2A.
(b) Non-income producing security.
MLP: Master Limited Partnership - A type of limited partnership that is publicly traded.
See accompanying notes to financial statements.
5
|
| | | | | | | | |
STATEMENT OF ASSETS AND LIABILITIES |
| |
| December 31, 2015 |
| |
| |
| Assets | | | | |
| Investments at value: | | | | |
| (Identified cost $379,147,747) | | $ | 402,201,305 |
|
| Cash | | 4,474 |
|
| Receivable for: | | | | |
| Securities sold | | $ | 20,526,020 |
| | |
| Shares of the Fund sold | | 1,181 |
| | |
| Dividends and interest | | 148,155 |
| | 20,675,356 |
|
| Total assets | | 422,881,135 |
|
| | | | | |
| Liabilities | | | | |
| Payable for: | | | | |
| Securities purchased | | 20,687,256 |
| | |
Shares of the Fund redeemed | | 137,420 |
| | 20,824,676 |
|
| Accrued expenses: | | | | |
| Management fees | | 311,025 |
| | |
| Trustees’ fees | | 18,278 |
| | |
| Accounting, administration and compliance expenses | | 22,607 |
| | |
| Transfer agent fees | | 43,719 |
| | |
| Other expenses | | 81,428 |
| | 477,057 |
|
| Total liabilities | | 21,301,733 |
|
| Net Assets | | $ | 401,579,402 |
|
| | | |
| Net assets consist of: | | | |
| Capital paid-in | | $ | 380,803,685 |
|
| Accumulated net realized losses on investments | | (2,277,841 | ) |
| Net unrealized appreciation on investments | | 23,053,558 |
|
| Net Assets | | $ | 401,579,402 |
|
| | | |
| Shares of beneficial interest outstanding, no par value | | 13,670,284 |
|
| | | |
| Net asset value per share* | | $29.38 |
| | | | | |
* Shares of the Fund are sold and redeemed at net asset
value ($401,579,402 ÷ 13,670,284).
|
| | | | |
STATEMENT OF OPERATIONS |
| |
| Twelve Months Ended December 31, 2015 |
| |
| |
| Investment Income | | |
| Income: | | |
| Dividends | | $ | 2,743,502 |
|
| Interest | | 531,376 |
|
| | | 3,274,878 |
|
| Expenses: | | |
| Management fees | | 3,914,029 |
|
| Trustees’ fees | | 73,548 |
|
| Accounting, administration and compliance expenses | | 271,288 |
|
| Custodian fees and expenses | | 83,039 |
|
| Transfer agent fees | | 380,356 |
|
| Audit and tax services | | 48,247 |
|
| Legal | | 27,263 |
|
| Printing | | 50,281 |
|
| Registration fees | | 26,809 |
|
| Miscellaneous expenses | | 4,437 |
|
| | | 4,879,297 |
|
| Net investment loss | | (1,604,419 | ) |
| | | |
| Realized and Unrealized Gain (Loss) on Investments | | |
| Net realized losses on investments | | (2,277,841 | ) |
| Net change in unrealized depreciation on investments | | (8,542,547 | ) |
| Net realized and unrealized losses on investments | | (10,820,388 | ) |
| | | |
| Change in Net Assets from Operations | | $ | (12,424,807 | ) |
| | | |
See accompanying notes to financial statements.
6
| STATEMENT OF CHANGES IN NET ASSETS |
| | | | | | | |
| | Year Ended December 31, |
| | 2015 | | 2014 |
| From Operations | | | |
| Net investment loss | $ | (1,604,419 | ) | | $ | (2,475,395 | ) |
| Net realized gains (losses) on investments | (2,277,841 | ) | | 50,611,927 |
|
| Net change in unrealized depreciation on investments | (8,542,547 | ) | | (25,747,771 | ) |
| Change in net assets from operations | (12,424,807 | ) | | 22,388,761 |
|
| | | | |
| From Distributions to Shareholders | | | |
| Net short-term realized capital gains on investments | — |
| | (20,965,328 | ) |
| Net long-term realized capital gains on investments | — |
| | (26,440,349 | ) |
| | — |
| | (47,405,677 | ) |
| From Capital Share Transactions | | | |
| Proceeds from sale of shares | 3,673,567 |
| | 3,676,277 |
|
| Net asset value of shares issued in connection with reinvestment of: | | | |
| Distributions from net short-term realized capital gains on investments | — |
| | 19,569,727 |
|
| Distributions from net long-term realized capital gains on investments | — |
| | 24,683,345 |
|
| | 3,673,567 |
| | 47,929,349 |
|
| Cost of shares redeemed | (38,233,376 | ) | | (51,536,233 | ) |
| Change in net assets derived from capital share transactions | (34,559,809 | ) | | (3,606,884 | ) |
| Total change in net assets | (46,984,616 | ) | | (28,623,800 | ) |
| | | | |
| Net Assets | | | |
| Beginning of period | 448,564,018 |
| | 477,187,818 |
|
| End of period | $ | 401,579,402 |
| | $ | 448,564,018 |
|
| | | | |
| Number of Shares of the Fund: | | | |
| Issued from sale of shares | 119,596 |
| | 115,740 |
|
| Issued in connection with reinvestment of: | | | |
| Distributions from net short-term realized capital gains on investments | — |
| | 645,652 |
|
| Distributions from net long-term realized capital gains on investments | — |
| | 814,363 |
|
| | 119,596 |
| | 1,575,755 |
|
| Redeemed | (1,249,744 | ) | | (1,612,564 | ) |
| Net change | (1,130,148 | ) | | (36,809 | ) |
See accompanying notes to financial statements.
7
| FINANCIAL HIGHLIGHTS |
| | | | | | | | | | | | | | | | | | | | |
| | | For the Year Ended December 31, |
| | | 2015 | | 2014 | | 2013 | | 2012 | | 2011 |
| For a share of the Fund outstanding throughout each period: | | | | | | | | | | |
| Net asset value at beginning of period | | $ | 30.31 |
| | $ | 32.16 |
| | $ | 28.42 |
| | $ | 24.42 |
| | $ | 29.46 |
|
| Net investment income (loss) (a) | | (0.11 | ) | | (0.17 | ) | | (0.09 | ) | | 0.09 |
| | 0.05 |
|
| Net realized and unrealized gains (losses) on investments and foreign currency transactions | | (0.82 | ) | | 1.87 |
| | 6.06 |
| | 4.01 |
| | (5.04 | ) |
| Total from investment operations | | (0.93 | ) | | 1.70 |
| | 5.97 |
| | 4.10 |
| | (4.99 | ) |
| | | | | | | | | | | |
| Dividends from net investment income | | — |
| | — |
| | — |
| | (0.10 | ) | | (0.05 | ) |
| Distributions from net short-term realized gains | | — |
| | (1.57 | ) | | (1.62 | ) | | — |
| | — |
|
| Distributions from net long-term realized gains | | — |
| | (1.98 | ) | | (0.61 | ) | | — |
| | — |
|
| Total distributions | | — |
| | (3.55 | ) | | (2.23 | ) | | (0.10 | ) | | (0.05 | ) |
| | | | | | | | | | | |
| Net increase (decrease) in net asset value | | (0.93 | ) | | (1.85 | ) | | 3.74 |
| | 4.00 |
| | (5.04 | ) |
| Net asset value at end of period | | $ | 29.38 |
| | $ | 30.31 |
| | $ | 32.16 |
| | $ | 28.42 |
| | $ | 24.42 |
|
| | | | | | | | | | | |
| Total return (%) | | (3.1 | ) | | 5.3 |
| | 21.0 |
| | 16.8 |
| | (16.9 | ) |
| | | | | | | | | | | |
| Ratios: | | | | | | | | | | |
| Operating expenses to average net assets (%) | | 1.12 |
|
| 1.12 |
| | 1.11 |
| | 1.12 |
| | 1.09 |
|
| Net investment income (loss) to average net assets (%) | | (0.37 | ) |
| (0.55 | ) | | (0.29 | ) | | 0.35 |
| | 0.17 |
|
| Portfolio turnover (%) | | 345 |
|
| 301 |
| | 374 |
| | 325 |
| | 404 |
|
| Net assets at end of period (in thousands) ($) | 401,579 | | 448,564 | | 477,188 | | 440,679 | | 434,031 | |
(a) Per share net investment income (loss) has been calculated using
the average shares outstanding during the period.
See accompanying notes to financial statements.
8
|
|
| |
| CGM MUTUAL FUND |
| |
NOTES TO FINANCIAL STATEMENTS — December 31, 2015
|
| |
1. Organization — CGM Mutual Fund (the "Fund") is a diversified series of CGM Trust (the "Trust") which is organized as a Massachusetts business trust under the laws of Massachusetts pursuant to an Agreement and Declaration of Trust. The Trust is registered under the Investment Company Act of 1940 as an open-end management investment company and is following accounting and reporting guidance in the Financial Accounting Standards Board’s (“FASB”) Topic 946 “Financial Services—Investment Companies”. The Trust has two other funds whose financial statements are not presented herein. The Fund commenced operations on November 5, 1929. The Fund’s objective is reasonable long-term capital appreciation with a prudent approach to protection of capital from undue risks. Current income is a consideration in the selection of the Fund’s portfolio securities, but it is not a controlling factor.
2. Significant accounting policies — Management has evaluated the events and transactions from December 31, 2015 through the date of issuance of the Fund’s financial statements. For the Fund, there were no material subsequent events that required disclosure in the financial statements or footnotes.
A. Security valuation — Equity securities are valued on the basis of valuations furnished by a pricing service, authorized by the Board of Trustees (the “Board”). Equity securities listed or regularly traded on a securities exchange or in the over-the-counter (“OTC”) market are valued at the last quoted sale price or, for certain markets, the official closing price at the time the valuations are made. A security that is listed or traded on more than one exchange is valued at the quotation on the exchange determined to be the primary market for such security. For securities with no sale reported, the last reported bid price is used. Corporate debt securities (other than short-term obligations purchased with an original or remaining maturity of sixty days or less) are valued on the basis of valuations furnished by a pricing service, authorized by the Board, which determines valuations for normal, institutional-size trading units of such securities using market information, transactions for comparable securities and various relationships between securities which are generally recognized by institutional traders. United States government debt securities are valued at the current closing bid, as last reported by a pricing service approved by the Board. Short-term investments purchased with an original or remaining maturity of sixty days or less are valued at amortized cost, which approximates value.
When current market prices or quotations are not readily available or do not accurately reflect fair value, valuations may be determined in accordance with procedures adopted by the Board. For example, when developments occur between the close of a market and the close of the New York Stock Exchange ("NYSE") that may materially affect the value of some or all of the securities, or when trading in a security is halted, these procedures may be used. The frequency with which these procedures are used is unpredictable. These valuation procedures may result in a change to a particular security’s assigned level within the fair value hierarchy described below. The value of securities used for net asset value (“NAV”) calculation under these procedures may differ from published prices for the same securities.
The Fund may use valuation techniques consistent with the market, income, and cost approach to measure fair value. The market approach uses prices and other relevant information generated by market transactions involving identical or comparable assets or liabilities. The income approach uses valuation techniques to convert future amounts (cash flows, earnings) to a single present amount. The cost approach is based on the amount that currently would be required to replace the service capacity of an asset. To increase consistency and comparability in fair value measurements and related disclosure, the Fund utilizes a fair value hierarchy which prioritizes the various inputs to valuation techniques used to measure fair value into three broad levels:
| |
| • | Level 1 - Prices determined using: quoted prices in active markets for identical securities that the Fund has the ability to access at the measurement date. Valuation adjustments are not applied to Level 1 investments. |
|
|
| |
| CGM MUTUAL FUND |
| |
| NOTES TO FINANCIAL STATEMENTS (continued) |
| |
| |
| • | Level 2 - Prices determined using: other significant observable inputs (including quoted prices for similar securities, interest rates, prepayment spreads, credit risk, etc.). |
| |
| • | Level 3 - Prices determined using: significant unobservable inputs, including the Fund’s own assumptions and judgment in determining the fair value of investments. In situations where quoted prices or observable inputs are unavailable (for example, when there is little or no market activity for an investment at the end of the period), unobservable inputs may be used. Unobservable inputs reflect the Fund’s own assumptions about the factors market participants would use in pricing an investment, and would be based on the best information available in the circumstances. Investments falling into the Level 3 category are primarily supported by quoted prices from brokers and dealers participating in the market for those investments. However, these may be classified as Level 3 investments due to lack of market transparency and corroboration to support these quoted prices. Additionally, valuation models may be used as the pricing source for any remaining investments classified as Level 3. These models rely on one or more significant unobservable inputs and/or significant assumptions by Capital Growth Management Limited Partnership, the Fund’s investment adviser (“CGM”). Inputs used in valuations may include, but are not limited to, financial statement analysis, capital account balances, discount rates and estimated cash flows, and comparable company data. |
The inputs or methodology used for valuing securities are not necessarily an indication of the risk associated with investing in those securities. The following is a summary of the inputs used to value the Fund’s investments as of December 31, 2015:
|
| | | | | | | | | | | |
| | | | Valuation Inputs |
| | Classification | | Level 1 -
Quoted Prices | | Level 2 - Other Significant Observable Inputs | | Level 3 - Significant Unobservable Inputs |
| | Investments in Securities-Assets | | | | | | |
| | Common Stocks* | | $ | 291,094,556 |
| | $— | | $— |
| | Bonds | | | | | | |
| | United States Treasury Notes | | — | | 109,171,749 |
| | — |
| | Short-Term Investment | | | | | | |
| | Repurchase Agreement | | — | | 1,935,000 |
| | — |
| | Total | | $ | 291,094,556 |
| | $ | 111,106,749 |
| | $— |
| | | | | | | | |
| * | All common stocks held in the Fund are Level 1 securities. For a detailed break-out of common stocks by major industry classification, please refer to the Schedule of Investments. |
| | | | | | | | |
| | For the twelve months ended December 31, 2015, there were no transfers among Levels 1, 2 and 3. |
B. Security transactions and related investment income — Security transactions are accounted for on the trade date plus one basis for daily NAV calculations. However, for financial reporting purposes, investment transactions are reported on the trade date (date the order to buy or sell is executed). Dividend income is recorded on the ex-dividend date net of applicable foreign taxes, a portion of which may be recoverable. The Fund will accrue such taxes and recoveries as applicable based upon its current interpretations of the tax rules and regulations that exist in the markets in which it invests. Interest income is recorded on an accrual basis and includes amortization of premium and discount. Net gain or loss on securities sold is determined on the identified cost basis and may include proceeds from litigation. Dividend payments received by the Fund from its investment in real estate investment trusts (“REITs”) may consist of ordinary income, capital gains, and return of capital and as such are recorded as dividend
|
|
| |
| CGM MUTUAL FUND |
| |
| NOTES TO FINANCIAL STATEMENTS (continued) |
| |
income, capital gains or a reduction to security cost, as appropriate. Distributions from master limited partnerships (“MLPs”) are generally recorded based on the characterization reported on the Fund’s schedule K-1 received from the MLPs. Non-cash dividend payments, if any, are recorded at the fair market value of the securities received.
C. Federal income taxes — It is the Fund’s policy to comply with the requirements of the Internal Revenue Code applicable to regulated investment companies, and to distribute to its shareholders all of its taxable income and net realized capital gains, within the prescribed time period.
Capital accounts within the financial statements are adjusted for permanent book/tax differences. These adjustments have no impact on the Fund's net assets or results of operations. Temporary book/tax differences, if any, will reverse in a subsequent period. Any difference between book basis and tax basis unrealized appreciation is attributable primarily to the temporary book/tax difference of tax deferral of losses on wash sales.
As of December 31, 2015, the components of distributable earnings on a tax basis were as follows:
|
| | | | |
| Undistributed Ordinary Income | | Undistributed Long-term Capital Gains | | Net Unrealized Appreciation/ (Depreciation) |
| $— | | $— | | $22,445,271 |
The identified cost of investments in securities owned by the Fund for federal income tax purposes, and their respective gross unrealized appreciation and depreciation at December 31, 2015 was as follows:
|
| | | | | | |
| Identified Cost | | Gross Unrealized Appreciation | | Gross Unrealized Depreciation | | Net Unrealized Appreciation |
| $379,756,034 | | $31,352,633 | | $(8,907,362) | | $22,445,271 |
Under the Regulated Investment Company Modernization Act of 2010, the Fund will be permitted to carry forward capital losses for an unlimited period and retain their character as either short-term or long-term capital losses. As of December 31, 2015, the capital loss carryforwards were as follows:
|
| | | | |
Short-term Capital Loss Carryforward | | Long-term Capital Loss Carryforward | | Total |
| $1,669,554 | | $— | | $1,669,554 |
Management has concluded that there are no significant uncertain tax positions for the open tax years as of December 31, 2015 that would require recognition in the financial statements. However, management’s conclusion may be subject to review and adjustment at a later date based on factors including, but not limited to, new tax laws, regulations, and administrative interpretations (including relevant court decisions). Generally, the Fund's federal tax returns for the prior three fiscal years remain subject to examination by the Internal Revenue Service.
D. Dividends and distributions to shareholders — Dividends and distributions are recorded by the Fund on the ex-dividend date. The classification of income and capital gains distributions is determined in accordance with income tax regulations. Distributions from net investment income and short-term capital gains are treated as ordinary income for income tax purposes. Permanent book/tax differences relating to shareholder distributions may result in reclassifications to paid-in capital or accumulated realized gain/(loss). Permanent book/tax differences are primarily attributable to net operating losses. The Fund also may utilize earnings and profits distributed to shareholders on redemption of shares as a part of the dividend deduction for income tax purposes. Undistributed net investment income or accumulated net investment loss may include temporary book/tax differences such as tax deferral of
|
|
| |
| CGM MUTUAL FUND |
| |
| NOTES TO FINANCIAL STATEMENTS (continued) |
| |
losses on wash sales, which will reverse in a subsequent period. Any taxable income or gain remaining at fiscal year end is distributed in the following year.
The tax characterization of distributions is determined on an annual basis. The tax character of distributions paid during the periods ended December 31, 2015 and 2014 were as follows:
|
| | | | | | |
| Year | | Ordinary
Income | | Long-term
Capital Gains | | Total |
| 2015 | | $— | | $— | | $— |
| 2014 | | $20,965,328 | | $26,440,349 | | $47,405,677 |
E. Guarantees and indemnifications — Under the Trust's organizational documents, its officers and trustees are indemnified against certain liabilities arising out of the performance of their duties for the Fund. Additionally, in the normal course of business, the Fund may enter into contracts with service providers that contain general indemnification clauses. The Fund's maximum exposure under these arrangements is unknown, as this would involve future claims that may be made against the Fund that have not yet occurred. The risk of material loss from such claims is considered remote.
F. Foreign currency translation — All assets and liabilities initially expressed in terms of foreign currencies are translated into U.S. dollars each day at the prevailing exchange rate. Transactions affecting Statement of Operations accounts and net realized gain or loss on investments are translated at the rates prevailing at the dates of the transactions. The Fund does not isolate that portion of the results of operations resulting from changes in foreign exchange rates on investments from the fluctuations arising from changes in market prices of securities held. Such fluctuations are included with the net realized and unrealized gain or loss from investments. Reported net realized foreign exchange gains or losses arise from sales of foreign currency, currency gains or losses realized between the trade and settlement dates on securities transactions and the difference between the amounts of dividends, interest, and foreign withholding taxes recorded on the Fund’s books and the U.S. dollar equivalent of the amounts actually received or paid. Net unrealized foreign exchange gains or losses arise from changes in the value of assets and liabilities other than investments in securities at the end of the period, resulting from changes in the exchange rate.
G. Repurchase agreements — The Fund enters into repurchase agreements, under the terms of a Master Repurchase Agreement, secured by U.S. Government or Agency securities, which involve the purchase of securities from a counterparty with a simultaneous commitment to resell the securities at an agreed upon date and price. Certain repurchase agreements are tri-party arrangements whereby the collateral is held in a segregated account for the benefit of the Fund and on behalf of the counterparty. Repurchase agreements afford the Fund the opportunity to earn a return on temporarily available cash at minimal market risk. While the underlying security may be a bill, certificate of indebtedness, note or bond issued by an agency, authority or instrumentality of the U.S. Government, the obligation of the seller is not guaranteed by the U.S. Government and there is a risk that the seller may fail to repurchase the underlying security. Consequently, there may be possible delays or restrictions upon the Fund’s ability to dispose of the underlying securities. Upon an event of default under the Master Repurchase Agreement, the Fund would attempt to exercise its rights with respect to the underlying security, including taking possession of the cash and/or collateral provided by the seller.
At December 31, 2015, the Fund had an investment in a repurchase agreement with a gross value of $1,935,000 on the Statement of Assets and Liabilities which was not offset. The value of the related collateral consisting of cash and/or securities of $1,983,260 exceeded the value of the repurchase agreement at December 31, 2015 by $48,260.
|
|
| |
| CGM MUTUAL FUND |
| |
| NOTES TO FINANCIAL STATEMENTS (continued) |
| |
H. Use of estimates — The preparation of financial statements in accordance with U.S. Generally Accepted Accounting Principles (“GAAP”) requires management to make certain estimates and assumptions that affect the reported amounts of assets and liabilities, the disclosure of contingent assets and liabilities at the date of the financial statements and the reported amounts of revenue and expenses during the reporting period. Actual results could differ from those estimates.
3. Risks and uncertainties
A. Risks associated with focused investing — The Fund, although diversified, takes a focused approach to investing within particular industries or sectors of the economy and may invest in a relatively small number of individual holdings. Therefore, the Fund may be subject to greater price volatility and may be more adversely affected by the performance of particular industries, sectors, or individual holdings than would a more diversified fund. In addition, funds that invest more heavily in certain industries, sectors or individual holdings are particularly susceptible to the impact of market, economic, regulatory and other factors affecting those investments.
B. Risks associated with foreign investments — The Fund may invest in securities issued by institutions, corporations, and governments established by or located in foreign countries, which may be developed or undeveloped countries. Investing in foreign securities may involve significant risks. For example, there is generally less publicly available information about foreign companies, particularly those not subject to the disclosure and reporting requirements of the U.S. securities laws. Foreign issuers are generally not bound by uniform accounting, auditing, and financial reporting requirements and standards of practice comparable to those applicable to domestic issuers. Investments in foreign securities also involve the risk of possible adverse changes in investment or exchange control regulations, expropriation or confiscatory taxation, political or financial instability or diplomatic and other developments which could affect such investments. Foreign stock markets, while growing in volume and sophistication, are generally not as developed as those in the United States, and securities of some foreign issuers (particularly those located in developing countries) may be less liquid and more volatile than securities of comparable U.S. companies. In general, there is less overall governmental supervision and regulation of foreign securities markets, broker-dealers and issuers than in the United States. Additionally, because some foreign securities the Fund may acquire are purchased with and payable in foreign currencies, the value of these assets as measured in U.S. dollars may be affected favorably or unfavorably by changes in currency rates and exchange control regulations.
4. Purchases and sales of securities — For the period ended December 31, 2015, purchases and sales of securities other than United States Government or Agency obligations and short-term investments aggregated $1,439,282,042 and $1,461,300,603, respectively. For long-term government obligations, there were $42,942,695 of purchases and $55,523,555 of sales.
5. Fees and expenses
A. Management fees — During the period ended December 31, 2015, the Fund incurred management fees of $3,914,029, paid or payable to CGM, certain officers and employees of which are also officers and trustees of the Fund. The management agreement provides for a fee at the annual rate of 0.90% on the first $500 million of the Fund’s average daily net assets, 0.80% of the next $500 million of the Fund’s average daily net assets and 0.75% of such assets in excess of $1 billion of the Fund’s average daily net assets.
B. Other expenses — The majority of expenses are directly attributable to the Fund. Expenses that are not readily attributable to the Fund are allocated among each of the three funds comprising the Trust in an equitable manner, taking into consideration, among other things, the nature and type of expense and the funds' respective net assets.
|
|
| |
| CGM MUTUAL FUND |
| |
| NOTES TO FINANCIAL STATEMENTS (continued) |
| |
CGM performs certain administrative, accounting, compliance and other services for the Fund. The expenses of those services, which are paid to CGM by the Fund, include the following: (i) expenses for personnel performing bookkeeping, accounting and financial reporting and clerical functions relating to the Fund; (ii) expenses for services required in connection with the preparation of registration statements and prospectuses, shareholder reports and notices, proxy solicitation material furnished to shareholders of the Fund or regulatory authorities and reports and questionnaires for SEC compliance; (iii) registration, filing and other fees in connection with requirements of regulatory authorities and (iv) compliance in connection to the Investment Company Act of 1940 and the Sarbanes-Oxley Act of 2002. The accounting, administration and compliance expenses of $271,288, for the period ended December 31, 2015, are shown separately in the Statement of Operations. These expenses include the reimbursement of a portion of the compensation expenses incurred by CGM for its employees who provide these administrative, accounting, compliance, and other services to the Fund, including $234,969 of the salaries of CGM employees who are officers of the Fund.
C. Trustees fees and expenses — The Fund does not pay any compensation directly to any trustees who are “interested persons” (as defined in the Investment Company Act of 1940) of CGM or any affiliate of CGM (other than registered investment companies). For the period ending December 31, 2015, each disinterested trustee will be compensated by the Trust with an annual fee of $70,000 plus travel expenses for each meeting attended. The disinterested trustees are responsible for the audit committee functions of the Trust’s Board and have designated a chairman to oversee those functions who receives an additional $30,000 annually. Of these amounts, the Fund is responsible for $10,000 per trustee annually, plus an annual variable fee calculated based on the proportion of the Fund’s average net assets relative to the aggregate average net assets of the Trust.
|
|
| |
| CGM MUTUAL FUND |
| |
| REPORT OF INDEPENDENT REGISTERED PUBLIC ACCOUNTING FIRM |
| |
To the Board of Trustees and Shareholders of CGM Mutual Fund
In our opinion, the accompanying statement of assets and liabilities, including the schedule of investments, and the related statements of operations and of changes in net assets and the financial highlights present fairly, in all material respects, the financial position of the CGM Mutual Fund (the “Fund”) at December 31, 2015, the results of its operations for the year then ended, the changes in its net assets for each of the two years in the period then ended and the financial highlights for each of the five years in the period then ended, in conformity with accounting principles generally accepted in the United States of America. These financial statements and financial highlights (hereafter referred to as "financial statements") are the responsibility of the Fund's management. Our responsibility is to express an opinion on these financial statements based on our audits. We conducted our audits of these financial statements in accordance with the standards of the Public Company Accounting Oversight Board (United States). Those standards require that we plan and perform the audit to obtain reasonable assurance about whether the financial statements are free of material misstatement. An audit includes examining, on a test basis, evidence supporting the amounts and disclosures in the financial statements, assessing the accounting principles used and significant estimates made by management, and evaluating the overall financial statement presentation. We believe that our audits, which included confirmation of securities at December 31, 2015 by correspondence with the custodian and brokers, provide a reasonable basis for our opinion.
PricewaterhouseCoopers LLP
Boston, Massachusetts
February 18, 2016
|
|
| |
| CGM MUTUAL FUND |
| |
| ADDITIONAL INFORMATION |
| (unaudited) |
Availability of proxy voting information:
Proxy voting policies and information regarding how the Fund voted proxies relating to portfolio securities during the twelve month period ended June 30, 2015 are available without charge, by calling 800-345-4048. The policies also appear in the Fund’s Statement of Additional Information, which can be found on the CGM Funds' website, www.cgmfunds.com, and the SEC’s website, www.sec.gov. The voting records can also be found on the SEC’s website on the N-PX filing.
Portfolio holdings:
The Fund files its complete schedule of portfolio holdings with the SEC for the first and third quarters of each fiscal year on Form N-Q. The Fund’s Forms N-Q are available on the SEC’s website at www.sec.gov and may be reviewed and copied at the SEC’s Public Reference Room in Washington, D.C. Information on the operation of the Public Reference Room may be obtained by calling 800-SEC-0330.
The Fund’s Prospectus and Statement of Additional Information contain additional information on other risks and uncertainties relating to the Fund’s investments. The Fund’s Prospectus and Statement of Additional Information can be obtained on the CGM Funds' website, www.cgmfunds.com, and the SEC’s website, www.sec.gov or by calling 800-345-4048.
TAX INFORMATION FOR THE TAX YEAR ENDED December 31, 2015
(unaudited)
We are providing this information as required by the Internal Revenue Code.
The Fund did not make any distributions in 2015.
|
|
| |
| CGM MUTUAL FUND |
| |
| FUND EXPENSES |
| (unaudited) |
As a shareholder of CGM Mutual Fund, you incur two types of costs: (1) transaction costs, which could include, among other charges, wire fees and custodial maintenance fees for certain types of accounts and (2) ongoing costs, including management fees and other Fund expenses. This example is intended to help you understand your ongoing costs (in dollars) of investing in the Fund and to compare these costs with the ongoing costs of investing in other mutual funds.
The example is based on an investment of $1,000 invested at the beginning of the period and held for the entire period July 1, 2015 to December 31, 2015.
Actual return and expenses
The first line of the table below provides information about actual account values and actual expenses.
You may use the information in this line, together with the amount you invested, to estimate the expenses that you paid over the period. Simply divide your account value by $1,000 (for example, an $8,600 account value divided by $1,000 = 8.6), then multiply the result by the number in the first line under the heading entitled ‘‘Expenses Paid During Period’’ to estimate the expenses you paid on your account during this period.
Hypothetical example for comparison purposes
The second line of the table below provides information about hypothetical account values and hypothetical expenses based on the Fund’s actual expense ratio and an assumed rate of return of 5% per year before expenses, which is not the Fund’s actual return. The hypothetical account values and expenses may not be used to estimate the actual ending account balance or expenses you paid for the period.
You may use this information to compare the ongoing costs of investing in the Fund and other funds. To do so, compare this 5% hypothetical example with the 5% hypothetical examples that appear in the shareholder reports of the other funds.
Please note that the expenses shown in the table are meant to highlight your ongoing costs only and do not reflect any transactional costs such as any wire fees or custodial maintenance fees that may be payable. Therefore, the second line of the table is useful in comparing ongoing costs only, and will not help you determine the relative total costs of owning different funds. In addition, if these transactional costs were included, your costs would have been higher.
|
| | | |
| | Beginning Account Value 07/01/15 | Ending
Account Value
12/31/15 | Expenses Paid During Period* 07/01/15 - 12/31/15 |
| Actual | $1,000.00 | $939.56 | $5.46 |
Hypothetical
(5% return before expenses) | $1,000.00 | $1,019.57 | $5.69 |
* Expenses are equal to the Fund’s annualized expense ratio of 1.12%, multiplied by the average account value over the period, multiplied by 184/365 (to reflect the one-half year period).
|
|
| |
| CGM MUTUAL FUND |
| |
| TRUSTEES AND OFFICERS |
The Fund is supervised by the Board of Trustees (the “Board”) of the Trust. The Board is responsible for the general oversight of the Fund, including general supervision and review of the Fund’s investment activities. The Board, in turn, elects the officers who are responsible for administering the Fund’s day-to-day operations.
An asterisk in the following table identifies those trustees and officers who are “interested persons” of the Trust as defined in the Investment Company Act of 1940. Each trustee and officer of the Trust noted as an interested person is interested by virtue of that individual’s position with CGM, as described in the table below. Each trustee serves during the continued lifetime of the Trust, until he or she earlier dies, resigns or is removed, or if sooner, until the election and qualification of his or her successor. Each officer serves until his or her successor is elected or qualified, or until the officer sooner dies, resigns, or is removed or becomes disqualified.
The trustees and officers of the Trust, their ages, their principal occupations during the past five years, the number of CGM Funds they oversee, and other directorships they hold are set forth below. Unless otherwise noted below, the address of each interested trustee and officer is One International Place, Boston, Massachusetts 02110. Correspondence intended for the trustees who are not “interested persons” of the Trust may be sent c/o Capital Growth Management, One International Place, Boston, Massachusetts 02110. The Statement of Additional Information for the Fund includes additional information about Fund trustees and is available on the CGM Funds' website, www.cgmfunds.com, or by calling 800-345-4048.
|
| | | | | | |
| Name, Address and Age | | Positions Held and Length of Time Served | | Principal Occupations and Other Directorships Held During Past 5 Years | | Number of Funds in the CGM Funds Complex Overseen |
| Interested Trustees | |
| |
| |
|
Ken Heebner*
age 75 | | Trustee since 1993 | | Co-founder and Employee, CGM; Controlling owner of Kenbob, Inc. (general partner of CGM) | | 3 |
Leslie A. Lake*
age 70 | | Trustee since 2013 | | Vice President and Secretary of CGM Trust (since 1992); Employee - Office Administrator, CGM | | 3 |
| Disinterested Trustees | | | | | | |
Peter O. Brown
age 75 | | Trustee since 1993 | | Counsel (formerly, Partner), Harter, Secrest & Emery LLP (law firm); formerly Executive Vice President and Chief Operating Officer, The Glenmede Trust Company (from 1990 to 1993); formerly Senior Vice President, J.P. Morgan Chase Bank (from 1981 to 1990); formerly Trustee, TT International U.S.A. Master and Feeder Trusts (four mutual funds) (from 2000 to 2005) | | 3 |
Mark W. Holland
age 66 | | Trustee since 2004 | | President, Wellesley Financial Advisors, LLC (since 2003); formerly Vice President and Chief Operating Officer, Fixed Income Management, Loomis, Sayles & Company, L.P. (from 1999 to 2002); formerly Director, Loomis, Sayles & Company, L.P. (from 1993 to 2001) | | 3 |
|
| | | | | | |
| Name, Address and Age | | Positions Held and Length of Time Served | | Principal Occupations and Other Directorships Held During Past 5 Years | | Number of Funds in the CGM Funds Complex Overseen |
James Van Dyke Quereau, Jr.
age 67 | | Trustee since 1993 | | Senior Vice President and Chief Investment Officer (since 2008), Director (since 2006), Managing Partner (2006 to 2008), Stratton Management Company (investment management); formerly Director and Vice President, Semper Trust Co. (until 2006) | | 3 |
J. Baur Whittlesey
age 69 | | Trustee since 1990 | | Member, Ledgewood, P.C. (law firm) | | 3 |
| Officers | |
| |
| |
|
Ken Heebner*
age 75 | | Vice President since 1990 | | Co-founder and Employee, CGM; Controlling owner of Kenbob, Inc. (general partner of CGM) | | 3 |
David C. Fietze*
age 46 | | President since 2015 and Chief Compliance Officer since 2004 | | Employee – Legal Counsel, CGM | | 3 |
Kathleen S. Haughton*
age 55
| | Vice President since
1992 and Anti-Money | | Employee – Investor Services Division, CGM | | 3 |
Address:
38 Newbury St., 8th Fl.,
Boston, MA 02116 | | Laundering Compliance Officer since 2002
| |
| |
|
Jem A. Hudgins*
age 52 | | Treasurer since 2004 | | Employee – CGM | | 3 |
Leslie A. Lake*
age 70 | | Vice President and Secretary since 1992 | | Employee – Office Administrator, CGM | | 3 |
Martha I. Maguire*
age 60 | | Vice President since
1994 | | Employee – Funds Marketing, CGM | | 3 |
Nicole M. Fembleaux*
age 36 | | Assistant Vice President since 2011 | | Employee – Operations, CGM | | 3 |
Kevin Ure*
age 44 | | Vice President since
2013 | | Employee – Accounts Admin, Operations, CGM | | 3 |
Tony Figueiredo*
age 55
| | Vice President since
2013 | | Employee – Investor Services Division, CGM | | 3 |
Address:
38 Newbury St., 8th Fl.,
Boston, MA 02116 | | | | | | |
Deidra Hewardt*
age 43
| | Assistant Treasurer since 2014 | | Employee – CGM | | 3 |
Address:
38 Newbury St., 8th Fl.,
Boston, MA 02116 | |
| |
| |
|
|
| |
| INVESTMENT ADVISER |
| CAPITAL GROWTH MANAGEMENT |
| LIMITED PARTNERSHIP |
| Boston, Massachusetts 02110 |
|
| |
| TRANSFER AND DIVIDEND PAYING |
| AGENT AND CUSTODIAN OF ASSETS |
STATE STREET BANK AND TRUST COMPANY
Boston, Massachusetts 02111 |
|
| |
| SHAREHOLDER SERVICING AGENT |
| FOR STATE STREET BANK AND |
| TRUST COMPANY |
BOSTON FINANCIAL DATA SERVICES, INC.
P.O. Box 8511
Boston, Massachusetts 02266-8511 |
|
| | |
| TELEPHONE NUMBERS |
| For information about: |
| n | Account Procedures |
| n | Purchases |
| n | Redemptions |
| n | Exchanges
Call 800-343-5678 |
| n | New Account Procedures and Status |
| n | Prospectuses |
| n | Performance |
| n | Proxy Voting Policies and Voting Records |
| n | Complete Schedule of Portfolio Holdings
for the 1st & 3rd Quarters (as filed on Form N-Q)
Call 800-345-4048 |
| | | |
| MAILING ADDRESS |
| CGM Shareholder Services |
| c/o Boston Financial Data Services |
| P.O. Box 8511 |
| Boston, MA 02266-8511 |
| |
| |
| WEBSITE |
| www.cgmfunds.com |
| |
| |
| This report has been prepared for the shareholders of the Fund and is not authorized for distribution to current or prospective investors in the Fund unless it is accompanied or preceded by a prospectus. |
| | |
| RAR15 | Printed in U.S.A. |
CGM
Realty Fund
22nd Annual Report
December 31, 2015
A No-Load Fund
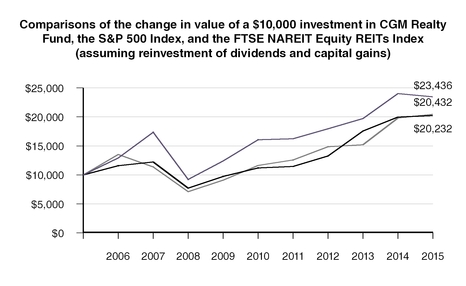
CGM Realty Fund increased 4.3% during the fourth quarter of 2015 compared to the Standard and Poor’s 500 Index (S&P 500 Index) which increased 7.0% and the FTSE NAREIT Equity REITs Index which returned 7.3%. For the twelve months ended December 31, 2015, CGM Realty Fund decreased -2.3%, the S&P 500 Index increased 1.4% and the FTSE NAREIT Equity REITs Index returned 3.2%.
The Year in Review and Economic Outlook
2015 began with mixed signals on the direction of the U.S. economy. February reports of prior month U.S. auto sales showed a 14% overall increase from December 2014 and a 19.3% increase for higher priced light trucks and SUVs for the same period. The pace of new home sales continued to expand and the Commerce Department reported that January and February sales remained near the six year high, despite the severe winter weather in much of the U.S., tight credit for borrowers and rising home prices. In March, the Federal Reserve ("Fed") reported U.S. industrial production increased 3.5% and capacity utilization increased 3.1% over the year before, suggesting a long term outlook of moderate economic growth. Despite these positive indicators, the stock market continued to react to the timing uncertainty of an interest rate increase by the Fed, which moved bond yields higher and contributed to the rising value of the dollar. Ultimately, the harsh winter, strong dollar, falling oil prices and a labor dispute that shut down U.S. West Coast ports led to a 0.2% decrease in the gross domestic product for the first quarter, according to the Commerce Department.
In April, the Fed referred to the economic difficulties in the first quarter along with cautious
spending by U.S. consumers and businesses as evidence of some restraint in the growth of the U.S. economy. Still, the Fed indicated that it anticipated U.S. economic growth to again pick up to a moderate pace. Growth continued to be found in the housing market. An April report from the Commerce Department showed that first quarter 2015 sales of new homes increased by 21.7% over the first quarter of 2014. The increase was likely attributable to low mortgage rates, job growth and improving wages. In April, the Labor Department’s Employment-Cost Index, a wide-ranging measure of compensation expenses, reported a seasonally adjusted increase of 0.7% for the first quarter, indicating a tightening job market and an upward trend in wages. In May, the strengthening manufacturing sector, coupled with a Commerce Department report that U.S. housing starts rose 20.2% from March to April, led to a sell-off in U.S. Treasuries. However, by the end of the quarter, the 10 year Treasury yield stood at 2.3% as investments moved to safety in response to Greece’s default on its debt to the International Monetary Fund and European creditors.
In July, the Commerce Department provided some positive news of growth, reporting that orders for durable goods in June increased by 3.4%, a sign that businesses started to increase spending. The Commerce Department also reported that the monthly growth in starts for single family housing units, which account for approximately two-thirds of the housing market, increased by 12.3% and again by 12.8% in June and July respectively. However, U.S. stock market performance was negatively impacted by reaction to slowing Chinese economic growth. Large sell-offs in the Shanghai Composite Index, the impact on commodities prices of weakening demand from China for raw
materials and China’s devaluation of the yuan in early August contributed to the first U.S. stock market correction in four years.
The sluggish Chinese manufacturing sector, coupled with OPEC’s decision to maintain its high level of oil production into a near-capacity world market, pushed oil prices below $40 a barrel in the fourth quarter. While subdued oil prices have had a negative impact on the energy sector, the Fed saw enough strength in the overall U.S. economy to raise interest rates for the first time in seven years. Addressing the Fed’s decision, Chair Janet Yellen acknowledged the unevenness across different industrial sectors but pointed to improved labor market conditions and predicted sustainable continued improvement in the economy. Labor Department reports through the year showed increasing average hourly earnings and the unemployment rate dropped to 5% by October. While mixed economic signals are expected to continue, Congress acted in December to extend tax breaks to businesses and low income families and to fund the government through September 2016. This bi-partisan action demonstrated that Congress can work together and avoids the threat that a government shut-down will drag on the U.S. economy into 2016.
Portfolio Strategy
CGM Realty Fund was invested in real estate companies that we believed would benefit from a stronger than generally expected U.S. economy in 2015. The Fund focused on hotels (both traditional corporations and REITs), homebuilders, commercial real estate companies and storage REITs. Most of our investments in homebuilders, commercial real estate companies, and storage REITS had positive performance in 2015, but significant
losses in the Fund’s investments in hotels more than offset those gains. CGM Realty Fund’s strongest performers for the year were in the homebuilding and storage REIT industry and the largest losses were hotel securities.
CGM Realty Fund was approximately 32% invested in REITs on December 31, 2015, including 13% in residential REITs, 6.6% in a self-storage REIT and 5.1% in a timber REIT. The Fund also held significant industry positions in housing and building materials, real estate services and commercial banks. The Fund’s largest holdings were Jones Lang LaSalle Incorporated (real estate services), the Lennar Corporation (housing and building materials) and D. R. Horton Inc. (housing and building materials).
David C. Fietze
President
G. Kenneth Heebner
Portfolio Manager
January 2, 2016
Average Annual Total Returns through 12/31/15
|
| | | | | | |
| | | | | 1 Year | 5 Year | 10 Year |
| | n | | CGM Realty Fund | -2.3% | 7.9% | 8.9% |
| | n | | S&P 500 Index | 1.4% | 12.6% | 7.3% |
| | n | | FTSE NAREIT Equity REITs Index | 3.2% | 12.0% | 7.4% |
Past performance is no indication of future results and current performance may be higher or lower than the figures shown. Unlike a fund, an index is not managed and does not reflect fees and expenses.
|
| | | |
| CGM REALTY FUND |
| Portfolio Manager |
G. Kenneth Heebner has managed CGM Realty Fund since its inception on May 13, 1994. In 1990, Mr. Heebner founded Capital Growth Management Limited Partnership ("CGM") with Robert L. Kemp. Prior to establishing CGM, Mr. Heebner managed mutual funds at Loomis, Sayles & Company. In addition to CGM Realty Fund, he currently manages CGM Mutual Fund and CGM Focus Fund as well as other funds.
|
| | | | |
| INVESTMENT PERFORMANCE |
| (unaudited) |
| Cumulative Total Returns for Periods Ended December 31, 2015 |
| | CGM
Realty Fund (%) |
| 10 Years | + | 134.4 | | |
| 5 Years | + | 46.0 | | |
| 1 Year | - | 2.3 | | |
| 3 Months | + | 4.3 | | |
The performance data contained in the report represent past performance, which is no guarantee of future results. The graph and table above do not reflect the deduction of taxes a shareholder would pay on Fund distributions or the redemption of Fund shares and assumes the reinvestment of all Fund distributions.
The investment return and the principal value of an investment in the Fund will fluctuate so that investors' shares, when redeemed, may be worth more or less than their original cost. Current performance may be higher or lower than the performance data quoted.
PORTFOLIO DIVERSIFICATION as of December 31, 2015 COMMON STOCKS |
| | | |
| Real Estate Investment Trusts | Percent of Net Assets |
| |
| Residential | 13.0 | % | |
| Self Storage | 6.6 |
| |
| Timber | 5.1 |
| |
| Infrastructure | 5.0 |
| |
| Diversified | 1.4 |
| |
| Retail | 1.2 |
| |
| Other Common Stocks | | |
| Housing and Building Materials | 27.0 |
| |
| Real Estate Services | 16.2 |
| |
| Commercial Banks | 10.6 |
| |
| Broker/Dealers | 8.7 |
| |
| Hotels and Restaurants | 5.0 |
| |
SCHEDULE OF INVESTMENTS as of December 31, 2015 COMMON STOCKS — 99.8% OF TOTAL NET ASSETS REAL ESTATE INVESTMENT TRUSTS — 32.3% |
| | | | | | | | |
| | | Shares | | Value(a) |
| Diversified — 1.4% |
|
|
|
| Digital Realty Trust, Inc. | 90,000 |
|
| $ | 6,805,800 |
|
| OUTFRONT Media Inc. | 355,000 |
|
| 7,749,650 |
|
|
|
|
| 14,555,450 |
|
| Infrastructure — 5.0% |
|
|
|
| American Tower Corporation | 555,000 |
|
| 53,807,250 |
|
|
|
|
|
|
| Residential — 13.0% |
|
|
|
| Apartment Investment and Management Company | 580,000 |
|
| 23,217,400 |
|
| Essex Property Trust, Inc. | 224,000 |
|
| 53,627,840 |
|
| Mid-America Apartment Communities, Inc. | 535,000 |
|
| 48,583,350 |
|
| UDR, Inc. | 400,000 |
|
| 15,028,000 |
|
|
|
|
| 140,456,590 |
|
| Retail — 1.2% |
|
|
|
| Seritage Growth Properties | 330,000 |
|
| 13,272,600 |
|
|
|
|
|
|
| Self Storage — 6.6% |
|
|
|
| Extra Space Storage Inc. | 810,000 |
|
| 71,450,100 |
|
| | | | | |
| Timber — 5.1% |
|
|
|
| Weyerhaeuser Company | 1,820,000 |
|
| 54,563,600 |
|
|
|
|
|
|
|
TOTAL REAL ESTATE INVESTMENTS TRUSTS (Identified cost $329,411,571) |
| 348,105,590 |
|
See accompanying notes to financial statements.
4
SCHEDULE OF INVESTMENTS as of December 31, 2015 (continued) COMMON STOCKS (continued) |
| | | | | | | | |
| OTHER COMMON STOCKS — 67.5% |
|
|
|
|
|
|
|
|
|
|
| Broker/Dealers — 8.7% | Shares |
| Value(a) |
| Morgan Stanley | 1,210,000 |
|
| $ | 38,490,100 |
|
| The Goldman Sachs Group, Inc. | 310,000 |
|
| 55,871,300 |
|
|
|
|
| 94,361,400 |
|
| Commercial Banks — 10.6% |
|
|
|
| Bank of America Corporation | 3,000,000 |
|
| 50,490,000 |
|
| Citigroup Inc. | 1,240,000 |
|
| 64,170,000 |
|
|
|
|
| 114,660,000 |
|
| Hotels and Restaurants — 5.0% |
|
|
|
| Wyndham Worldwide Corporation | 745,000 |
|
| 54,124,250 |
|
|
|
|
|
|
| Housing and Building Materials — 27.0% |
|
|
|
| D.R. Horton, Inc. | 2,850,000 |
|
| 91,285,500 |
|
| Lennar Corporation | 1,870,000 |
|
| 91,461,700 |
|
| NVR, Inc. (b) | 25,000 |
|
| 41,075,000 |
|
| Toll Brothers, Inc. (b) | 2,020,000 |
|
| 67,266,000 |
|
|
|
|
| 291,088,200 |
|
| Real Estate Services — 16.2% |
|
|
|
| CBRE Group, Inc. (b) | 1,895,000 |
|
| 65,529,100 |
|
| Jones Lang LaSalle Incorporated | 680,000 |
|
| 108,704,800 |
|
|
|
|
|
| 174,233,900 |
|
| | | | | |
TOTAL OTHER COMMON STOCKS (Identified cost $627,398,843) |
| 728,467,750 |
|
TOTAL COMMON STOCKS (Identified cost $956,810,414) |
| 1,076,573,340 |
|
|
|
|
|
|
|
|
| SHORT-TERM INVESTMENT — 1.5% OF TOTAL NET ASSETS |
|
|
|
| Tri-party Repurchase Agreement with Fixed Income Clearing Corporation, dated 12/31/2015 at 0.03% to be repurchased at $16,100,000 on 01/04/2016 collateralized by $14,440,000 US Treasury Bond, 3.625% due 08/15/2043 valued at $16,458,781 including interest (Cost $16,100,000) | Face
Amount |
|
|
|
|
|
|
|
| $ | 16,100,000 |
|
| 16,100,000 |
|
|
|
|
|
|
|
|
TOTAL INVESTMENTS — 101.3% (Identified cost $972,910,414) |
| 1,092,673,340 |
|
| Cash and receivables |
| 5,247,919 |
|
| Liabilities |
| (19,105,928 | ) |
|
|
|
|
|
|
|
| TOTAL NET ASSETS — 100.0% |
| $ | 1,078,815,331 |
|
(a) See Note 2A.
(b) Non-income producing security.
See accompanying notes to financial statements.
5
|
| | | | | | | | |
STATEMENT OF ASSETS AND LIABILITIES |
| |
| December 31, 2015 |
| |
| |
| Assets | | | | |
| Investments at value: | | | | |
| (Identified cost $972,910,414) | | $ | 1,092,673,340 |
|
| Cash | | 587 |
|
| Receivable for: | | | | |
| Securities sold | | $ | 3,840,987 |
| | |
| Shares of the Fund sold | | 502,172 |
| | |
| Dividends and interest | | 904,173 |
| | 5,247,332 |
|
| Total assets | | 1,097,921,259 |
|
| | | | | |
| Liabilities | | | | |
| Payable for: | | | | |
Shares of the Fund redeemed | | 4,221,912 |
| |
|
| Distributions declared | | 13,890,198 |
| | 18,112,110 |
|
| Accrued expenses: | | | | |
| Management fees | | 754,376 |
| | |
| Trustees’ fees | | 30,888 |
| | |
| Accounting, administration and compliance expenses | | 47,941 |
| | |
| Transfer agent fees | | 57,412 |
| | |
| Other expenses | | 103,201 |
| | 993,818 |
|
| Total liabilities | | 19,105,928 |
|
| Net Assets | | $ | 1,078,815,331 |
|
| | | |
| Net assets consist of: | | |
| Capital paid-in | | $ | 963,021,971 |
|
| Accumulated net realized losses on investments | | (3,969,566 | ) |
| Net unrealized appreciation on investments | | 119,762,926 |
|
| Net Assets | | $ | 1,078,815,331 |
|
| | | |
| Shares of beneficial interest outstanding, no par value | | 36,855,642 |
|
| | | |
| Net asset value per share* | | $29.27 |
* Shares of the Fund are sold and redeemed at net asset
value ($1,078,815,331 ÷ 36,855,642).
|
| | | | |
STATEMENT OF OPERATIONS |
| |
| Twelve Months Ended December 31, 2015 |
| |
| | | |
| Investment Income | | |
| Income: | | |
| Dividends | | $ | 12,349,867 |
|
| Interest | | 90 |
|
| | | 12,349,957 |
|
| | | |
| Expenses: | | |
| Management fees | | 9,427,228 |
|
| Trustees’ fees | | 123,986 |
|
| Accounting, administration and compliance expenses | | 575,292 |
|
| Custodian fees and expenses | | 156,945 |
|
| Transfer agent fees | | 495,748 |
|
| Audit and tax services | | 48,247 |
|
| Legal | | 70,517 |
|
| Printing | | 61,750 |
|
| Registration fees | | 27,386 |
|
| Line of credit commitment fees | | 9,333 |
|
| Miscellaneous expenses | | 7,219 |
|
| | | 11,003,651 |
|
| Net investment income | | 1,346,306 |
|
| | | |
| Realized and Unrealized Gain (Loss) on Investments | | |
| Net realized gains on investments | | 95,435,592 |
|
| Net change in unrealized depreciation on investments | | (122,707,040 | ) |
| Net realized and unrealized losses on investments | | (27,271,448 | ) |
| | | |
| Change in Net Assets from Operations | | $ | (25,925,142 | ) |
See accompanying notes to financial statements.
6
| STATEMENT OF CHANGES IN NET ASSETS |
| | | | | | | |
| | Year Ended December 31, |
| | 2015 | | 2014 |
| From Operations | | | |
| Net investment income | $ | 1,346,306 |
| | $ | 10,248,268 |
|
| Net realized gains on investments | 95,435,592 |
| | 162,433,291 |
|
| Net change in unrealized appreciation (depreciation) on investments | (122,707,040 | ) | | 63,698,299 |
|
| Change in net assets from operations | (25,925,142 | ) | | 236,379,858 |
|
| | | | |
| From Distributions to Shareholders | | | |
| Net investment income | (938,546 | ) | | (8,498,818 | ) |
| Net short-term realized capital gains on investments | — |
| | (31,249,069 | ) |
| Net long-term realized capital gains on investments | (96,482,482 | ) | | (116,116,757 | ) |
| | (97,421,028 | ) | | (155,864,644 | ) |
| From Capital Share Transactions | | | |
| Proceeds from sale of shares | 32,896,338 |
| | 34,718,134 |
|
| Net asset value of shares issued in connection with reinvestment of: | | | |
| Dividends from net investment income | 790,426 |
| | 6,988,462 |
|
| Distributions from net short-term realized capital gains on investments | — |
| | 26,199,826 |
|
| Distributions from net long-term realized capital gains on investments | 82,740,403 |
| | 97,355,407 |
|
| | 116,427,167 |
| | 165,261,829 |
|
| Cost of shares redeemed | (158,944,530 | ) | | (175,596,162 | ) |
| Change in net assets derived from capital share transactions | (42,517,363 | ) | | (10,334,333 | ) |
| Total change in net assets | (165,863,533 | ) | | 70,180,881 |
|
| | | | |
| Net Assets | | | |
| Beginning of period | 1,244,678,864 |
| | 1,174,497,983 |
|
| End of period | $ | 1,078,815,331 |
| | $ | 1,244,678,864 |
|
| | | | |
| Number of Shares of the Fund: | | | |
| Issued from sale of shares | 996,662 |
| | 1,057,274 |
|
| Issued in connection with reinvestment of: | | | |
| Dividends from net investment income | 27,005 |
| | 208,927 |
|
| Distributions from net short-term realized capital gains on investments | — |
| | 796,589 |
|
| Distributions from net long-term realized capital gains on investments | 2,826,799 |
| | 2,960,030 |
|
| | 3,850,466 |
| | 5,022,820 |
|
| Redeemed | (4,835,273 | ) | | (5,362,309 | ) |
| Net change | (984,807 | ) | | (339,489 | ) |
See accompanying notes to financial statements.
7
| FINANCIAL HIGHLIGHTS |
| | | | | | | | | | | | | | | | | | | | | | | | | | |
| | | | For the Year Ended December 31, | |
| | | | 2015 | | | 2014 | | | 2013 | | | 2012 | | | 2011 | |
| For a share of the Fund outstanding throughout each period: | | | | | | | | | | | | | | | | |
| Net asset value at beginning of period | | | $ | 32.89 |
| | | $ | 30.76 |
| | | $ | 29.37 |
| | | $ | 26.81 |
| | | $ | 26.79 |
| |
| Net investment income (a) | | | 0.04 |
| | | 0.28 |
| | | 0.23 |
| | | 0.30 |
| | | 0.25 |
| |
| Net realized and unrealized gains (losses) on investments | | | (0.81 | ) | | | 6.41 |
| | | 2.68 |
| | | 2.53 |
| | | 0.04 |
| (b) |
| Total from investment operations | | | (0.77 | ) | | | 6.69 |
| | | 2.91 |
| | | 2.83 |
| | | 0.29 |
| |
| | | | | | | | | | | | | | | | | |
| Dividends from net investment income | | | (0.03 | ) | | | (0.24 | ) | | | (0.28 | ) | | | (0.27 | ) | | | (0.27 | ) | |
| Distributions from net short-term realized gains | | | — |
| | | (0.92 | ) | | | — |
| | | — |
| | | — |
| |
| Distributions from net long-term realized gains | | | (2.82 | ) | | | (3.40 | ) | | | (1.24 | ) | | | — |
| | | — |
| |
| Total distributions | | | (2.85 | ) | | | (4.56 | ) | | | (1.52 | ) | | | (0.27 | ) | | | (0.27 | ) | |
| | | | | | | | | | | | | | | | | |
| Net increase (decrease) in net asset value | | | (3.62 | ) | | | 2.13 |
| | | 1.39 |
| | | 2.56 |
| | | 0.02 |
| |
| Net asset value at end of period | | | $ | 29.27 |
| | | $ | 32.89 |
| | | $ | 30.76 |
| | | $ | 29.37 |
| | | $ | 26.81 |
| |
| | | | | | | | | | | | | | | | | |
| Total return (%) | | | (2.3 | ) | | | 21.8 |
| | | 9.9 |
| | | 10.6 |
| | | 1.0 |
| |
| | | | | | | | | | | | | | | | | |
| Ratios: | | | | | | | | | | | | | | | | |
| Operating expenses to average net assets (%) | | | 0.92 |
|
| | 0.92 |
| | | 0.92 |
| | | 0.89 |
| | | 0.88 |
| |
| Net investment income to average net assets (%) | | | 0.11 |
|
| | 0.86 |
| | | 0.75 |
| | | 1.01 |
| | | 0.91 |
| |
| Portfolio turnover (%) | | | 224 |
|
| | 135 |
| | | 146 |
| | | 101 |
| | | 69 |
| |
| Net assets at end of period (in thousands) ($) | 1,078,815 | | 1,244,679 | | 1,174,498 | | 1,417,608 | | 1,516,681 | | |
(a) Per share net investment income has been calculated using
the average shares outstanding during the period.
(b) The amount shown for a share outstanding does not correspond with the aggregate net realized and unrealized gain (loss) on investments for the period due to the timing of sales and repurchases of shares in relation to fluctuating market values of investments in the Fund.
See accompanying notes to financial statements.
8
|
|
| |
| CGM REALTY FUND |
| |
| NOTES TO FINANCIAL STATEMENTS — December 31, 2015 |
| |
1. Organization — CGM Realty Fund (the "Fund") is a diversified series of CGM Trust (the "Trust") which is organized as a Massachusetts business trust under the laws of Massachusetts pursuant to an Agreement and Declaration of Trust. The Trust is registered under the Investment Company Act of 1940 as an open-end management investment company and is following accounting and reporting guidance in the Financial Accounting Standards Board’s (“FASB”) Topic 946 “Financial Services—Investment Companies”. The Trust has two other funds whose financial statements are not presented herein. The Fund commenced operations on May 13, 1994. The Fund’s investment objective is to provide a combination of income and long-term growth of capital. The Fund intends to pursue its objective by investing primarily in equity securities of companies in the real estate industry, including real estate investment trusts (“REITs”).
2. Significant accounting policies — Management has evaluated the events and transactions from December 31, 2015 through the date of issuance of the Fund’s financial statements. For the Fund, there were no material subsequent events that required disclosure in the financial statements or footnotes.
A. Security valuation — Equity securities are valued on the basis of valuations furnished by a pricing service, authorized by the Board of Trustees (the “Board”). Equity securities listed or regularly traded on a securities exchange or in the over-the-counter (“OTC”) market are valued at the last quoted sale price or, for certain markets, the official closing price at the time the valuations are made. A security that is listed or traded on more than one exchange is valued at the quotation on the exchange determined to be the primary market for such security. For securities with no sale reported, the last reported bid price is used. Corporate debt securities (other than short-term obligations purchased with an original or remaining maturity of sixty days or less) are valued on the basis of valuations furnished by a pricing service, authorized by the Board, which determines valuations for normal, institutional-size trading units of such securities using market information, transactions for comparable securities and various relationships between securities which are generally recognized by institutional traders. United States government debt securities are valued at the current closing bid, as last reported by a pricing service approved by the Board. Short-term investments purchased with an original or remaining maturity of sixty days or less are valued at amortized cost, which approximates value.
When current market prices or quotations are not readily available or do not accurately reflect fair value, valuations may be determined in accordance with procedures adopted by the Board. For example, when developments occur between the close of a market and the close of the New York Stock Exchange ("NYSE") that may materially affect the value of some or all of the securities, or when trading in a security is halted, these procedures may be used. The frequency with which these procedures are used is unpredictable. These valuation procedures may result in a change to a particular security’s assigned level within the fair value hierarchy described below. The value of securities used for net asset value (“NAV”) calculation under these procedures may differ from published prices for the same securities.
The Fund may use valuation techniques consistent with the market, income, and cost approach to measure fair value. The market approach uses prices and other relevant information generated by market transactions involving identical or comparable assets or liabilities. The income approach uses valuation techniques to convert future amounts (cash flows, earnings) to a single present amount. The cost approach is based on the amount that currently would be required to replace the service capacity of an asset. To increase consistency and comparability in fair value measurements and related disclosure, the Fund utilizes a fair value hierarchy which prioritizes the various inputs to valuation techniques used to measure fair value into three broad levels:
| |
| • | Level 1 - Prices determined using: quoted prices in active markets for identical securities that the Fund has the ability to access at the measurement date. Valuation adjustments are not applied to Level 1 investments. |
|
|
| |
| CGM REALTY FUND |
| |
| NOTES TO FINANCIAL STATEMENTS (continued) |
| |
| |
| • | Level 2 - Prices determined using: other significant observable inputs (including quoted prices for similar securities, interest rates, prepayment spreads, credit risk, etc.). |
| |
| • | Level 3 - Prices determined using: significant unobservable inputs, including the Fund’s own assumptions and judgment in determining the fair value of investments. In situations where quoted prices or observable inputs are unavailable (for example, when there is little or no market activity for an investment at the end of the period), unobservable inputs may be used. Unobservable inputs reflect the Fund’s own assumptions about the factors market participants would use in pricing an investment, and would be based on the best information available in the circumstances. Investments falling into the Level 3 category are primarily supported by quoted prices from brokers and dealers participating in the market for those investments. However, these may be classified as Level 3 investments due to lack of market transparency and corroboration to support these quoted prices. Additionally, valuation models may be used as the pricing source for any remaining investments classified as Level 3. These models rely on one or more significant unobservable inputs and/or significant assumptions by Capital Growth Management Limited Partnership, the Fund’s investment adviser (“CGM”). Inputs used in valuations may include, but are not limited to, financial statement analysis, capital account balances, discount rates and estimated cash flows, and comparable company data. |
The inputs or methodology used for valuing securities are not necessarily an indication of the risk associated with investing in those securities. The following is a summary of the inputs used to value the Fund’s investments as of December 31, 2015:
|
| | | | | | | | | | | |
| | | | Valuation Inputs |
| | Classification | | Level 1 -
Quoted Prices | | Level 2 - Other Significant Observable Inputs | | Level 3 - Significant Unobservable Inputs |
| | Investments in Securities-Assets | | | | | | |
| | Common Stocks* | | $ | 1,076,573,340 |
| | $— | | $— |
| | Short-Term Investment | | | | | | |
| | Repurchase Agreement | | — | | 16,100,000 |
| | — |
| | Total | | $1,076,573,340 | | $ | 16,100,000 |
| | $— |
| | | | | | | | |
| * | All common stocks held in the Fund are Level 1 securities. For a detailed break-out of common stocks by major industry classification, please refer to the Schedule of Investments. |
| | | | | | | | |
| | For the twelve months ended December 31, 2015, there were no transfers among Levels 1, 2 and 3. |
B. Security transactions and related investment income — Security transactions are accounted for on the trade date plus one basis for daily NAV calculations. However, for financial reporting purposes, investment transactions are reported on the trade date (date the order to buy or sell is executed). Dividend income is recorded on the ex-dividend date net of applicable foreign taxes, a portion of which may be recoverable. The Fund will accrue such taxes and recoveries as applicable based upon its current interpretations of the tax rules and regulations that exist in the markets in which it invests. Interest income is recorded on an accrual basis and includes amortization of premium and discount. Net gain or loss on securities sold is determined on the identified cost basis and may include proceeds from litigation. Dividend payments received by the Fund from its investment in REITs may consist of ordinary income, capital gains, and return of capital and as such are recorded as dividend income, capital gains or a
|
|
| |
| CGM REALTY FUND |
| |
| NOTES TO FINANCIAL STATEMENTS (continued) |
| |
reduction to security cost, as appropriate. Non-cash dividend payments, if any, are recorded at the fair market value of the securities received.
C. Federal income taxes — It is the Fund’s policy to comply with the requirements of the Internal Revenue Code applicable to regulated investment companies, and to distribute to its shareholders all of its taxable income and net realized capital gains, within the prescribed time period.
Capital accounts within the financial statements are adjusted for permanent book/tax differences. These adjustments have no impact on the Fund's net assets or results of operations. Temporary book/tax differences, if any, will reverse in a subsequent period. Any difference between book basis and tax basis unrealized appreciation is attributable primarily to the temporary book/tax difference of tax deferral of losses on wash sales.
As of December 31, 2015, the components of distributable earnings on a tax basis were as follows:
|
| | | | |
| Undistributed Ordinary Income | | Undistributed Long-term Capital Gains | | Net Unrealized Appreciation/ (Depreciation) |
| $— | | $— | | $115,793,362 |
The identified cost of investments in securities owned by the Fund for federal income tax purposes, and their respective gross unrealized appreciation and depreciation at December 31, 2015 was as follows:
|
| | | | | | |
| Identified Cost | | Gross Unrealized Appreciation | | Gross Unrealized Depreciation | | Net Unrealized Appreciation |
| $976,879,978 | | $132,816,521 | | $(17,023,159) | | $115,793,362 |
Management has concluded that there are no significant uncertain tax positions for the open tax years as of December 31, 2015 that would require recognition in the financial statements. However, management’s conclusion may be subject to review and adjustment at a later date based on factors including, but not limited to, new tax laws, regulations, and administrative interpretations (including relevant court decisions). Generally, the Fund's federal tax returns for the prior three fiscal years remain subject to examination by the Internal Revenue Service.
D. Dividends and distributions to shareholders — Dividends and distributions are recorded by the Fund on the ex-dividend date. The classification of income and capital gains distributions is determined in accordance with income tax regulations. Distributions from net investment income and short-term capital gains are treated as ordinary income for income tax purposes. Permanent book/tax differences relating to shareholder distributions may result in reclassifications to paid-in capital or accumulated realized gain/(loss). The Fund also may utilize earnings and profits distributed to shareholders on redemption of shares as a part of the dividend deduction for income tax purposes. Undistributed net investment income or accumulated net investment loss may include temporary book/tax differences such as tax deferral of losses on wash sales, which will reverse in a subsequent period. Any taxable income or gain remaining at fiscal year end is distributed in the following year.
The tax characterization of distributions is determined on an annual basis. The tax character of distributions paid during the periods ended December 31, 2015 and 2014 were as follows:
|
| | | | | | | | |
| Year | | Ordinary
Income | | Long-term
Capital Gains | | Tax Return
of Capital | | Total |
| 2015 | | $938,546 | | $96,482,482 | | $— | | $97,421,028 |
| 2014 | | $39,116,788 | | $116,747,856 | | $— | | $155,864,644 |
|
|
| |
| CGM REALTY FUND |
| |
| NOTES TO FINANCIAL STATEMENTS (continued) |
| |
E. Guarantees and indemnifications — Under the Trust's organizational documents, its officers and trustees are indemnified against certain liabilities arising out of the performance of their duties for the Fund. Additionally, in the normal course of business, the Fund may enter into contracts with service providers that contain general indemnification clauses. The Fund's maximum exposure under these arrangements is unknown, as this would involve future claims that may be made against the Fund that have not yet occurred. The risk of material loss from such claims is considered remote.
F. Foreign currency translation — All assets and liabilities initially expressed in terms of foreign currencies are translated into U.S. dollars each day at the prevailing exchange rate. Transactions affecting Statement of Operations accounts and net realized gain or loss on investments are translated at the rates prevailing at the dates of the transactions. The Fund does not isolate that portion of the results of operations resulting from changes in foreign exchange rates on investments from the fluctuations arising from changes in market prices of securities held. Such fluctuations are included with the net realized and unrealized gain or loss from investments. Reported net realized foreign exchange gains or losses arise from sales of foreign currency, currency gains or losses realized between the trade and settlement dates on securities transactions and the difference between the amounts of dividends, interest, and foreign withholding taxes recorded on the Fund’s books and the U.S. dollar equivalent of the amounts actually received or paid. Net unrealized foreign exchange gains or losses arise from changes in the value of assets and liabilities other than investments in securities at the end of the period, resulting from changes in the exchange rate.
G. Repurchase agreements — The Fund enters into repurchase agreements, under the terms of a Master Repurchase Agreement, secured by U.S. Government or Agency securities, which involve the purchase of securities from a counterparty with a simultaneous commitment to resell the securities at an agreed upon date and price. Certain repurchase agreements are tri-party arrangements whereby the collateral is held in a segregated account for the benefit of the Fund and on behalf of the counterparty. Repurchase agreements afford the Fund the opportunity to earn a return on temporarily available cash at minimal market risk. While the underlying security may be a bill, certificate of indebtedness, note or bond issued by an agency, authority or instrumentality of the U.S. Government, the obligation of the seller is not guaranteed by the U.S. Government and there is a risk that the seller may fail to repurchase the underlying security. Consequently, there may be possible delays or restrictions upon the Fund’s ability to dispose of the underlying securities. Upon an event of default under the Master Repurchase Agreement, the Fund would attempt to exercise its rights with respect to the underlying security, including taking possession of the cash and/or collateral provided by the seller.
At December 31, 2015, the Fund had an investment in a repurchase agreement with a gross value of $16,100,000 on the Statement of Assets and Liabilities which was not offset. The value of the related collateral consisting of cash and/or securities of $16,458,781 exceeded the value of the repurchase agreement at December 31, 2015 by $358,781.
H. Use of estimates — The preparation of financial statements in accordance with U.S. Generally Accepted Accounting Principles (“GAAP”) requires management to make certain estimates and assumptions that affect the reported amounts of assets and liabilities, the disclosure of contingent assets and liabilities at the date of the financial statements and the reported amounts of revenue and expenses during the reporting period. Actual results could differ from those estimates.
3. Risks and uncertainties
A. Risks associated with focused investing —The Fund, although diversified, takes a focused approach to investing within particular industries or sectors of the economy and may invest in a relatively small number of individual holdings. Therefore, the Fund may be subject to greater price volatility and may be more adversely affected by the
|
|
| |
| CGM REALTY FUND |
| |
| NOTES TO FINANCIAL STATEMENTS (continued) |
| |
performance of particular industries, sectors, or individual holdings than would a more diversified fund. In addition, the Fund invests primarily in companies in the real estate industry, including REITs. Funds with a concentration are particularly susceptible to the impact of market, economic, regulatory and other factors affecting the specific concentration.
B. Risks associated with foreign investments — The Fund may invest in securities issued by institutions, corporations, and governments established by or located in foreign countries, which may be developed or undeveloped countries. Investing in foreign securities may involve significant risks. For example, there is generally less publicly available information about foreign companies, particularly those not subject to the disclosure and reporting requirements of the U.S. securities laws. Foreign issuers are generally not bound by uniform accounting, auditing, and financial reporting requirements and standards of practice comparable to those applicable to domestic issuers. Investments in foreign securities also involve the risk of possible adverse changes in investment or exchange control regulations, expropriation or confiscatory taxation, political or financial instability or diplomatic and other developments which could affect such investments. Foreign stock markets, while growing in volume and sophistication, are generally not as developed as those in the United States, and securities of some foreign issuers (particularly those located in developing countries) may be less liquid and more volatile than securities of comparable U.S. companies. In general, there is less overall governmental supervision and regulation of foreign securities markets, broker-dealers and issuers than in the United States. Additionally, because some foreign securities the Fund may acquire are purchased with and payable in foreign currencies, the value of these assets as measured in U.S. dollars may be affected favorably or unfavorably by changes in currency rates and exchange control regulations.
4. Purchases and sales of securities — For the period ended December 31, 2015, purchases and sales of securities other than short-term investments aggregated $2,621,965,605 and $2,752,560,914, respectively.
5. Fees and expenses
A. Management fees — During the period ended December 31, 2015, the Fund incurred management fees of $9,427,228, paid or payable to CGM, certain officers and employees of which are also officers and trustees of the Fund. The management agreement provides for a fee at the annual rate of 0.85% on the first $500 million of the Fund’s average daily net assets and 0.75% on amounts in excess of $500 million of the Fund’s average daily net assets.
B. Other expenses — The majority of expenses are directly attributable to the Fund. Expenses that are not readily attributable to the Fund are allocated among each of the three funds comprising the Trust in an equitable manner, taking into consideration, among other things, the nature and type of expense and the funds' respective net assets. CGM performs certain administrative, accounting, compliance and other services for the Fund. The expenses of those services, which are paid to CGM by the Fund, include the following: (i) expenses for personnel performing bookkeeping, accounting and financial reporting and clerical functions relating to the Fund; (ii) expenses for services required in connection with the preparation of registration statements and prospectuses, shareholder reports and notices, proxy solicitation material furnished to shareholders of the Fund or regulatory authorities and reports and questionnaires for SEC compliance; (iii) registration, filing and other fees in connection with requirements of regulatory authorities and (iv) compliance in connection to the Investment Company Act of 1940 and the Sarbanes-Oxley Act of 2002. The accounting, administration and compliance expenses of $575,292, for the period ended December 31, 2015, are shown separately in the Statement of Operations. These expenses include the reimbursement of a portion of the compensation expenses incurred by CGM for its employees who provide these administrative, accounting, compliance, and other services to the Fund, including $442,078 of the salaries of CGM employees who are officers of the Fund.
|
|
| |
| CGM REALTY FUND |
| |
| NOTES TO FINANCIAL STATEMENTS (continued) |
| |
C. Trustees fees and expenses — The Fund does not pay any compensation directly to any trustees who are “interested persons” (as defined in the Investment Company Act of 1940) of CGM or any affiliate of CGM (other than registered investment companies). For the period ending December 31, 2015, each disinterested trustee will be compensated by the Trust with an annual fee of $70,000 plus travel expenses for each meeting attended. The disinterested trustees are responsible for the audit committee functions of the Trust’s Board and have designated a chairman to oversee those functions who receives an additional $30,000 annually. Of these amounts, the Fund is responsible for $10,000 per trustee annually, plus an annual variable fee calculated based on the proportion of the Fund’s average net assets relative to the aggregate average net assets of the Trust.
6. Line of credit — The Fund had a $20,000,000 committed unsecured line of credit with State Street Bank and Trust Company through June 10, 2015, which was not extended and expired. Borrowings under the line were charged interest at 1.25% over the higher of the Federal Funds Rate and the Overnight LIBOR Rate. The Fund incurred a commitment fee of 0.105% per annum on the unused portion of the line of credit, payable quarterly, through June 10, 2015. There were no borrowings under the line of credit during the period ended June 10, 2015.
|
|
| |
| CGM REALTY FUND |
| |
| REPORT OF INDEPENDENT REGISTERED PUBLIC ACCOUNTING FIRM |
| |
To the Board of Trustees and Shareholders of CGM Realty Fund
In our opinion, the accompanying statement of assets and liabilities, including the schedule of investments, and the related statements of operations and of changes in net assets and the financial highlights present fairly, in all material respects, the financial position of the CGM Realty Fund (the “Fund”) at December 31, 2015, the results of its operations for the year then ended, the changes in its net assets for each of the two years in the period then ended and the financial highlights for each of the five years in the period then ended, in conformity with accounting principles generally accepted in the United States of America. These financial statements and financial highlights (hereafter referred to as "financial statements") are the responsibility of the Fund's management. Our responsibility is to express an opinion on these financial statements based on our audits. We conducted our audits of these financial statements in accordance with the standards of the Public Company Accounting Oversight Board (United States). Those standards require that we plan and perform the audit to obtain reasonable assurance about whether the financial statements are free of material misstatement. An audit includes examining, on a test basis, evidence supporting the amounts and disclosures in the financial statements, assessing the accounting principles used and significant estimates made by management, and evaluating the overall financial statement presentation. We believe that our audits, which included confirmation of securities at December 31, 2015 by correspondence with the custodian, provide a reasonable basis for our opinion.
PricewaterhouseCoopers LLP
Boston, Massachusetts
February 18, 2016
|
|
| |
| CGM REALTY FUND |
| |
| ADDITIONAL INFORMATION |
| (unaudited) |
Availability of proxy voting information:
Proxy voting policies and information regarding how the Fund voted proxies relating to portfolio securities during the twelve month period ended June 30, 2015 are available without charge, by calling 800-345-4048. The policies also appear in the Fund’s Statement of Additional Information, which can be found on the CGM Funds' website, www.cgmfunds.com, and the SEC’s website, www.sec.gov. The voting records can also be found on the SEC’s website on the N-PX filing.
Portfolio holdings:
The Fund files its complete schedule of portfolio holdings with the SEC for the first and third quarters of each fiscal year on Form N-Q. The Fund’s Forms N-Q are available on the SEC’s website at www.sec.gov and may be reviewed and copied at the SEC’s Public Reference Room in Washington, D.C. Information on the operation of the Public Reference Room may be obtained by calling 800-SEC-0330.
The Fund’s Prospectus and Statement of Additional Information contain additional information on other risks and uncertainties relating to the Fund’s investments. The Fund’s Prospectus and Statement of Additional Information can be obtained on the CGM Funds' website, www.cgmfunds.com, and the SEC’s website, www.sec.gov or by calling 800-345-4048.
TAX INFORMATION FOR THE TAX YEAR ENDED December 31, 2015
(unaudited)
We are providing this information as required by the Internal Revenue Code. The amounts shown may differ from those elsewhere in this report because of the differences between tax and financial reporting requirements.
The Fund hereby designates $97,621,149 as capital gain dividend for the taxable year ended December 31, 2015, or, if subsequently determined to be different, the net capital gain of such year.
For taxable non-corporate shareholders, 100% of the 2015 ordinary dividend is considered qualified dividend income that may be eligible for reduced capital gains rates.
For corporate shareholders, 100% of the 2015 ordinary dividend qualifies for the dividends-received deduction.
|
|
| |
| CGM REALTY FUND |
| |
| FUND EXPENSES |
| (unaudited) |
As a shareholder of CGM Realty Fund, you incur two types of costs: (1) transaction costs, which could include, among other charges, wire fees and custodial maintenance fees for certain types of accounts and (2) ongoing costs, including management fees and other Fund expenses. This example is intended to help you understand your ongoing costs (in dollars) of investing in the Fund and to compare these costs with the ongoing costs of investing in other mutual funds.
The example is based on an investment of $1,000 invested at the beginning of the period and held for the entire period July 1, 2015 to December 31, 2015.
Actual return and expenses
The first line of the table below provides information about actual account values and actual expenses.
You may use the information in this line, together with the amount you invested, to estimate the expenses that you paid over the period. Simply divide your account value by $1,000 (for example, an $8,600 account value divided by $1,000 = 8.6), then multiply the result by the number in the first line under the heading entitled ‘‘Expenses Paid During Period’’ to estimate the expenses you paid on your account during this period.
Hypothetical example for comparison purposes
The second line of the table below provides information about hypothetical account values and hypothetical expenses based on the Fund’s actual expense ratio and an assumed rate of return of 5% per year before expenses, which is not the Fund’s actual return. The hypothetical account values and expenses may not be used to estimate the actual ending account balance or expenses you paid for the period.
You may use this information to compare the ongoing costs of investing in the Fund and other funds. To do so, compare this 5% hypothetical example with the 5% hypothetical examples that appear in the shareholder reports of the other funds.
Please note that the expenses shown in the table are meant to highlight your ongoing costs only and do not reflect any transactional costs such as any wire fees or custodial maintenance fees that may be payable. Therefore, the second line of the table is useful in comparing ongoing costs only, and will not help you determine the relative total costs of owning different funds. In addition, if these transactional costs were included, your costs would have been higher.
|
| | | |
| | Beginning Account Value 07/01/15 | Ending
Account Value
12/31/15 | Expenses Paid During Period* 07/01/15 - 12/31/15 |
| Actual | $1,000.00 | $963.83 | $4.57 |
Hypothetical
(5% return before expenses) | $1,000.00 | $1,020.55 | $4.71 |
* Expenses are equal to the Fund’s annualized expense ratio of 0.92%, multiplied by the average account value over the period, multiplied by 184/365 (to reflect the one-half year period).
|
|
| |
| CGM REALTY FUND |
| |
| TRUSTEES AND OFFICERS |
The Fund is supervised by the Board of Trustees (the “Board”) of the Trust. The Board is responsible for the general oversight of the Fund, including general supervision and review of the Fund’s investment activities. The Board, in turn, elects the officers who are responsible for administering the Fund’s day-to-day operations.
An asterisk in the following table identifies those trustees and officers who are “interested persons” of the Trust as defined in the Investment Company Act of 1940. Each trustee and officer of the Trust noted as an interested person is interested by virtue of that individual’s position with CGM, as described in the table below. Each trustee serves during the continued lifetime of the Trust, until he or she earlier dies, resigns or is removed, or if sooner, until the election and qualification of his or her successor. Each officer serves until his or her successor is elected or qualified, or until the officer sooner dies, resigns, or is removed or becomes disqualified.
The trustees and officers of the Trust, their ages, their principal occupations during the past five years, the number of CGM Funds they oversee, and other directorships they hold are set forth below. Unless otherwise noted below, the address of each interested trustee and officer is One International Place, Boston, Massachusetts 02110. Correspondence intended for the trustees who are not “interested persons” of the Trust may be sent c/o Capital Growth Management, One International Place, Boston, Massachusetts 02110. The Statement of Additional Information for the Fund includes additional information about Fund trustees and is available on the CGM Funds' website, www.cgmfunds.com, or by calling 800-345-4048.
|
| | | | | | |
| Name, Address and Age | | Positions Held and Length of Time Served | | Principal Occupations and Other Directorships Held During Past 5 Years | | Number of Funds in the CGM Funds Complex Overseen |
| Interested Trustees | |
| |
| |
|
Ken Heebner*
age 75 | | Trustee since 1993 | | Co-founder and Employee, CGM; Controlling owner of Kenbob, Inc. (general partner of CGM) | | 3 |
Leslie A. Lake*
age 70 | | Trustee since 2013 | | Vice President and Secretary of CGM Trust (since 1992); Employee - Office Administrator, CGM | | 3 |
| Disinterested Trustees | |
| |
| |
|
Peter O. Brown
age 75 | | Trustee since 1993 | | Counsel (formerly, Partner), Harter, Secrest & Emery LLP (law firm); formerly Executive Vice President and Chief Operating Officer, The Glenmede Trust Company (from 1990 to 1993); formerly Senior Vice President, J.P. Morgan Chase Bank (from 1981 to 1990); formerly Trustee, TT International U.S.A. Master and Feeder Trusts (four mutual funds) (from 2000 to 2005) | | 3 |
Mark W. Holland
age 66 | | Trustee since 2004 | | President, Wellesley Financial Advisors, LLC (since 2003); formerly Vice President and Chief Operating Officer, Fixed Income Management, Loomis, Sayles & Company, L.P. (from 1999 to 2002); formerly Director, Loomis, Sayles & Company, L.P. (from 1993 to 2001) | | 3 |
|
| | | | | | |
| Name, Address and Age | | Positions Held and Length of Time Served | | Principal Occupations and Other Directorships Held During Past 5 Years | | Number of Funds in the CGM Funds Complex Overseen |
James Van Dyke Quereau, Jr.
age 67 | | Trustee since 1993 | | Senior Vice President and Chief Investment Officer (since 2008), Director (since 2006), Managing Partner (2006 to 2008), Stratton Management Company (investment management); formerly Director and Vice President, Semper Trust Co. (until 2006) | | 3 |
J. Baur Whittlesey
age 69 | | Trustee since 1990 | | Member, Ledgewood, P.C. (law firm) | | 3 |
| Officers | |
| |
| |
|
Ken Heebner*
age 75 | | Vice President since 1990 | | Co-founder and Employee, CGM; Controlling owner of Kenbob, Inc. (general partner of CGM) | | 3 |
David C. Fietze*
age 46 | | President since 2015 and Chief Compliance Officer since 2004 | | Employee – Legal Counsel, CGM | | 3 |
Kathleen S. Haughton*
age 55
| | Vice President since
1992 and Anti-Money | | Employee – Investor Services Division, CGM | | 3 |
Address:
38 Newbury St., 8th Fl.,
Boston, MA 02116 | | Laundering Compliance Officer since 2002
| |
| |
|
Jem A. Hudgins*
age 52 | | Treasurer since 2004 | | Employee – CGM | | 3 |
Leslie A. Lake*
age 70 | | Vice President and Secretary since 1992 | | Employee – Office Administrator, CGM | | 3 |
Martha I. Maguire*
age 60 | | Vice President since
1994 | | Employee – Funds Marketing, CGM | | 3 |
Nicole M. Fembleaux*
age 36 | | Assistant Vice President since 2011 | | Employee – Operations, CGM | | 3 |
Kevin Ure*
age 44 | | Vice President since
2013 | | Employee – Accounts Admin, Operations, CGM | | 3 |
Tony Figueiredo*
age 55
| | Vice President since
2013 | | Employee – Investor Services Division, CGM | | 3 |
Address:
38 Newbury St., 8th Fl.,
Boston, MA 02116 | |
| |
| |
|
Deidra Hewardt*
age 43
| | Assistant Treasurer since 2014 | | Employee – CGM | | 3 |
Address:
38 Newbury St., 8th Fl.,
Boston, MA 02116 | |
| |
| |
|
|
| |
| INVESTMENT ADVISER |
| CAPITAL GROWTH MANAGEMENT |
| LIMITED PARTNERSHIP |
| Boston, Massachusetts 02110 |
|
| |
| TRANSFER AND DIVIDEND PAYING |
| AGENT AND CUSTODIAN OF ASSETS |
STATE STREET BANK AND TRUST COMPANY
Boston, Massachusetts 02111 |
|
| |
| SHAREHOLDER SERVICING AGENT |
| FOR STATE STREET BANK AND |
| TRUST COMPANY |
BOSTON FINANCIAL DATA SERVICES, INC.
P.O. Box 8511
Boston, Massachusetts 02266-8511 |
|
| | |
| TELEPHONE NUMBERS |
| For information about: |
| n | Account Procedures |
| n | Purchases |
| n | Redemptions |
| n | Exchanges
Call 800-343-5678 |
| n | New Account Procedures and Status |
| n | Prospectuses |
| n | Performance |
| n | Proxy Voting Policies and Voting Records |
| n | Complete Schedule of Portfolio Holdings
for the 1st & 3rd Quarters (as filed on Form N-Q)
Call 800-345-4048 |
| | | |
| MAILING ADDRESS |
| CGM Shareholder Services |
| c/o Boston Financial Data Services |
| P.O. Box 8511 |
| Boston, MA 02266-8511 |
| |
| |
| WEBSITE |
| www.cgmfunds.com |
| |
| |
| This report has been prepared for the shareholders of the Fund and is not authorized for distribution to current or prospective investors in the Fund unless it is accompanied or preceded by a prospectus. |
| | |
| FAR15 | Printed in U.S.A. |
CGM
Focus Fund
19th Annual Report
December 31, 2015
A No-Load Fund
CGM Focus Fund increased 3.2% during the fourth quarter of 2015 compared to the Standard and Poor’s 500 Index (S&P 500 Index) which increased 7.0%. For the twelve months ended December 31, 2015, CGM Focus Fund decreased -4.1% while the S&P 500 Index increased 1.4%.
The Year in Review and Economic Outlook
2015 began with mixed signals on the direction of the U.S. economy. February reports of prior month U.S. auto sales showed a 14% overall increase from December 2014 and a 19.3% increase for higher priced light trucks and SUVs for the same period. The pace of new home sales continued to expand and the Commerce Department reported that January and February sales remained near the six year high, despite the severe winter weather in much of the U.S., tight credit for borrowers and rising home prices. In March, the Federal Reserve ("Fed") reported U.S. industrial production increased 3.5% and capacity utilization increased 3.1% over the year before, suggesting a long term outlook of moderate economic growth. Despite these positive indicators, the stock market continued to react to the timing uncertainty of an interest rate increase by the Fed, which moved bond yields higher and contributed to the rising value of the dollar. Ultimately, the harsh winter, strong dollar, falling oil prices and a labor dispute that shut down U.S. West Coast ports led to a 0.2% decrease in the gross domestic product for the first quarter, according to the Commerce Department.
In April, the Fed referred to the economic difficulties in the first quarter along with cautious spending by U.S. consumers and businesses as evidence of some restraint in the growth of the
U.S. economy. Still, the Fed indicated that it anticipated U.S. economic growth to again pick up to a moderate pace. Growth continued to be found in the housing market. An April report from the Commerce Department showed that first quarter 2015 sales of new homes increased by 21.7% over the first quarter of 2014. The increase was likely attributable to low mortgage rates, job growth and improving wages. In April, the Labor Department’s Employment-Cost Index, a wide-ranging measure of compensation expenses, reported a seasonally adjusted increase of 0.7% for the first quarter, indicating a tightening job market and an upward trend in wages. In May, the strengthening manufacturing sector, coupled with a Commerce Department report that U.S. housing starts rose 20.2% from March to April, led to a sell-off in U.S. Treasuries. However, by the end of the quarter, the 10 year Treasury yield stood at 2.3% as investments moved to safety in response to Greece’s default on its debt to the International Monetary Fund and European creditors.
In July, the Commerce Department provided some positive news of growth, reporting that orders for durable goods in June increased by 3.4%, a sign that businesses started to increase spending. The Commerce Department also reported that the monthly growth in starts for single family housing units, which account for approximately two-thirds of the housing market, increased by 12.3% and again by 12.8% in June and July respectively. However, U.S. stock market performance was negatively impacted by reaction to slowing Chinese economic growth. Large sell-offs in the Shanghai Composite Index, the impact on commodities prices of weakening demand from China for raw materials and China’s devaluation of the yuan in
early August contributed to the first U.S. stock market correction in four years.
The sluggish Chinese manufacturing sector, coupled with OPEC’s decision to maintain its high level of oil production into a near-capacity world market, pushed oil prices below $40 a barrel in the fourth quarter. While subdued oil prices have had a negative impact on the energy sector, the Fed saw enough strength in the overall U.S. economy to raise interest rates for the first time in seven years. Addressing the Fed’s decision, Chair Janet Yellen acknowledged the unevenness across different industrial sectors but pointed to improved labor market conditions and predicted sustainable continued improvement in the economy. Labor Department reports through the year showed increasing average hourly earnings and the unemployment rate dropped to 5% by October. While mixed economic signals are expected to continue, Congress acted in December to extend tax breaks to businesses and low income families and to fund the government through September 2016. This bi-partisan action demonstrated that Congress can work together and avoids the threat that a government shut-down will drag on the U.S. economy into 2016.
Portfolio Strategy
CGM Focus Fund was fully invested throughout 2015 in anticipation of stronger expansion in the U.S. economy. The portfolio was concentrated in companies that we believed would benefit from more rapid growth and rising U.S. interest rates. In addition, the portfolio maintained a major short position in U.S. Treasury securities also in anticipation of rising domestic interest rates.
Consumer spending was stimulated by sharply lower gasoline and fuel prices and rising employment, but economic growth was less
than we anticipated. The strong dollar negatively impacted exports and reduced pricing flexibility for some companies.
The portfolio benefited from appreciation in our investments in homebuilding, automobile and lighting products companies, and realized its largest losses from investments in financial services and retailers.
In addition to its major position in housing and building materials, CGM Focus Fund had large investments in commercial banks, and in the retail industry. The Fund’s three largest long holdings were the Lennar Corporation (housing and building materials), D. R. Horton, Inc. (housing and building materials) and Citigroup Inc. (commercial bank). On December 31, 2015, approximately 31.8% of the CGM Focus Fund portfolio was invested in U.S. Treasury bonds sold short.
David C. Fietze
President
G. Kenneth Heebner
Portfolio Manager
January 2, 2016
Average Annual Total Returns through 12/31/15
|
| | | | | | |
| | | | | 1 Year | 5 Year | 10 Year |
| | n | | CGM Focus Fund | -4.1% | 2.4% | 4.5% |
| | n | | S&P 500 Index | 1.4% | 12.6% | 7.3% |
Past performance is no indication of future results and current performance may be higher or lower than the figures shown. Unlike a fund, an index is not managed and does not reflect fees and expenses.
|
| | | | | |
| CGM FOCUS FUND | |
| Portfolio Manager | |
G. Kenneth Heebner has managed CGM Focus Fund since its inception on September 3, 1997. In 1990, Mr. Heebner founded Capital Growth Management Limited Partnership ("CGM") with Robert L. Kemp. Prior to establishing CGM, Mr. Heebner managed mutual funds at Loomis, Sayles & Company. In addition to CGM Focus Fund, he currently manages CGM Mutual Fund and CGM Realty Fund as well as other funds.
|
| | | | |
| INVESTMENT PERFORMANCE |
| (unaudited) |
| Cumulative Total Returns for Periods Ended December 31, 2015 |
| | CGM
Focus Fund (%) |
| 10 Years | + | 55.9 | | |
| 5 Years | + | 12.6 | | |
| 1 Year | - | 4.1 | | |
| 3 Months | + | 3.2 | | |
The performance data contained in the report represent past performance, which is no guarantee of future results. The graph and table above do not reflect the deduction of taxes a shareholder would pay on Fund distributions or the redemption of Fund shares and assumes the reinvestment of all Fund distributions.
The investment return and the principal value of an investment in the Fund will fluctuate so that investors' shares, when redeemed, may be worth more or less than their original cost. Current performance may be higher or lower than the performance data quoted.
PORTFOLIO DIVERSIFICATION as of December 31, 2015 COMMON STOCKS |
| | |
| Industry | Percent of Net Assets |
|
| Housing and Building Materials | 34.3 | % |
| Commercial Banks | 16.4 |
|
| Retail | 10.1 |
|
| Leisure | 8.8 |
|
| Broker/Dealers | 8.5 |
|
| Vehicle Assembly | 6.2 |
|
| Electrical Equipment | 5.8 |
|
| Home Products | 5.6 |
|
| Technology | 5.1 |
|
| Biotechnology | 4.1 |
|
| Home Building Products | 1.3 |
|
| SECURITIES SOLD SHORT |
| | |
| United States Treasury Bonds | (31.8 | ) |
SCHEDULE OF INVESTMENTS as of December 31, 2015 COMMON STOCKS — 106.2% OF TOTAL NET ASSETS |
| | | | | | | | |
| Biotechnology — 4.1% | Shares |
| Value(a) |
| Mallinckrodt public limited company (b) | 580,000 |
|
| $ | 43,285,400 |
|
| Broker/Dealers — 8.5% |
|
|
|
|
|
| Morgan Stanley | 1,000,000 |
|
| 31,810,000 |
|
| The Goldman Sachs Group, Inc. | 323,000 |
|
| 58,214,290 |
|
|
|
|
|
| 90,024,290 |
|
| Commercial Banks — 16.4% |
|
|
|
| Bank of America Corporation | 2,700,000 |
|
| 45,441,000 |
|
| Citigroup Inc. | 1,680,000 |
|
| 86,940,000 |
|
| JPMorgan Chase & Co. | 405,000 |
|
| 26,742,150 |
|
| Signature Bank (b) | 100,000 |
|
| 15,337,000 |
|
|
|
|
| 174,460,150 |
|
| Electrical Equipment — 5.8% |
|
|
|
| Acuity Brands, Inc. | 265,000 |
|
| 61,957,000 |
|
| Home Building Products — 1.3% |
|
|
|
| The Sherwin-Williams Company | 55,000 |
|
| 14,278,000 |
|
| Home Products — 5.6% |
|
|
|
| Whirlpool Corporation | 405,000 |
|
| 59,482,350 |
|
| Housing and Building Materials — 34.3% |
|
|
|
| D.R. Horton, Inc. (c) | 3,492,900 |
|
| 111,877,587 |
|
| Lennar Corporation (c) | 3,400,000 |
|
| 166,294,000 |
|
| Toll Brothers, Inc. (b) | 2,610,000 |
|
| 86,913,000 |
|
|
|
|
| 365,084,587 |
|
See accompanying notes to financial statements.
4
SCHEDULE OF INVESTMENTS as of December 31, 2015 (continued) COMMON STOCKS (continued) |
| | | | | | | | |
| Leisure — 8.8% | Shares |
| Value(a) |
| Carnival Corporation | 690,000 |
|
| $ | 37,591,200 |
|
| Royal Caribbean Cruises Ltd. | 560,000 |
|
| 56,677,600 |
|
|
|
|
| 94,268,800 |
|
| Retail — 10.1% |
|
|
|
| Dollar Tree, Inc. (b) | 660,000 |
|
| 50,965,200 |
|
| Signet Jewelers Limited | 455,000 |
|
| 56,278,950 |
|
|
|
|
| 107,244,150 |
|
| Technology — 5.1% |
|
|
|
| Alphabet Inc. (b) | 72,000 |
|
| 54,639,360 |
|
| Vehicle Assembly — 6.2% |
|
|
|
| Ford Motor Company | 2,620,000 |
|
| 36,915,800 |
|
| General Motors Company | 850,000 |
|
| 28,908,500 |
|
|
|
| 65,824,300 |
|
| | | | | |
TOTAL COMMON STOCKS (Identified cost $1,016,572,141) |
| 1,130,548,387 |
|
|
|
|
|
|
| SHORT-TERM INVESTMENT — 0.5% OF TOTAL NET ASSETS | Face Amount |
|
|
| Tri-party Repurchase Agreement with Fixed Income Clearing Corporation, dated 12/31/2015 at 0.03% to be repurchased at $5,690,000 on 01/04/2016 collateralized by $5,105,000 US Treasury Bond, 3.625% due 08/15/2043 valued at $5,818,703 including interest. (Cost $5,690,000) | $ | 5,690,000 |
|
| 5,690,000 |
|
|
|
|
|
|
|
|
TOTAL INVESTMENTS — 106.7% (Identified cost $1,022,262,141) |
| 1,136,238,387 |
|
| Cash and receivables |
| 300,378,701 |
|
| Liabilities |
| (371,690,361 | ) |
| TOTAL NET ASSETS — 100.0% |
| $ | 1,064,926,727 |
|
| | | | |
| SECURITIES SOLD SHORT |
|
|
|
|
|
|
|
| BONDS — 31.8% OF TOTAL NET ASSETS |
|
|
|
|
|
|
|
|
| United States Treasury — 31.8% | Face Amount |
| Value(a) |
| United States Treasury Bonds, 2.500%, 02/15/2045 | $ | 40,000,000 |
|
| $ | 35,910,920 |
|
| United States Treasury Bonds, 2.750%, 08/15/2042 | 170,000,000 |
|
| 162,608,910 |
|
| United States Treasury Bonds, 3.125%, 02/15/2043 | 80,000,000 |
|
| 82,046,880 |
|
| United States Treasury Bonds, 3.750%, 11/15/2043 | 50,000,000 |
|
| 57,623,050 |
|
TOTAL BONDS (Proceeds $327,154,845) |
| 338,189,760 |
|
|
|
|
|
|
| TOTAL SECURITIES SOLD SHORT — 31.8% |
| $ | 338,189,760 |
|
(a) See Note 2A.
(b) Non-income producing security.
(c) A portion of this security has been segregated as collateral in connection with short sale investments (See Note 2E).
See accompanying notes to financial statements.
5
|
| | | | | | | |
STATEMENT OF ASSETS AND LIABILITIES |
| |
| December 31, 2015 |
| |
| Assets | | | |
| Investments at value: | | | |
| (Identified cost $1,022,262,141) | | $ | 1,136,238,387 |
|
| Cash | | 2,604 |
|
| Deposits with brokers for short sales | | 268,590,174 |
|
| Receivable for: | | | |
| Securities sold | $ | 31,501,701 |
| | |
| Shares of the Fund sold | 34,617 |
| | |
| Dividends and interest | 249,605 |
| | 31,785,923 |
|
| Total assets | | 1,436,617,088 |
|
| | | | |
| Liabilities | | | |
| Securities sold short at current market value (Proceeds $327,154,845) | | 338,189,760 |
|
| Payable for: | | |
| Securities purchased | 27,114,828 |
| | |
Shares of the Fund redeemed | 1,864,559 |
| | |
| Interest payable | 3,337,415 |
| | 32,316,802 |
|
| Accrued expenses: | | |
| Management fees | 892,597 |
| | |
| Trustees’ fees | 32,234 |
| | |
| Accounting, administration and compliance expenses | 50,560 |
| | |
| Transfer agent fees | 91,903 |
| | |
| Other expenses | 116,505 |
| | 1,183,799 |
|
| Total liabilities | | 371,690,361 |
|
| Net Assets | | $ | 1,064,926,727 |
|
| | | |
| Net Assets consist of: | | |
| Capital paid-in | | $ | 3,455,084,350 |
|
| Accumulated net realized losses on investments | | (2,493,098,954 | ) |
| Net unrealized appreciation (depreciation) on investments: | | |
| Long positions | | 113,976,246 |
|
| Short positions | | (11,034,915 | ) |
| Net Assets | | $ | 1,064,926,727 |
|
| | | |
| Shares of beneficial interest outstanding, no par value | 27,166,725 |
|
| | | |
| Net asset value per share* | $39.20 |
* Shares of the Fund are sold and redeemed at net asset
value ($1,064,926,727 ÷ 27,166,725).
|
| | | | | |
STATEMENT OF OPERATIONS |
| |
| Twelve Months Ended December 31, 2015 |
| | |
| Investment Income | | | |
| Income: | | | |
| Dividends | | $ | 11,516,026 |
| |
| Interest | | 78 |
| |
| | | 11,516,104 |
| |
| | | | |
| Expenses: | | | |
| Management fees | | 11,656,535 |
| |
| Trustees’ fees | | 129,373 |
| |
| Accounting, administration and compliance expenses | | 606,720 |
| |
| Custodian fees and expenses | | 159,907 |
| |
| Transfer agent fees | | 813,848 |
| |
| Audit and tax services | | 48,247 |
| |
| Legal | | 70,809 |
| |
| Printing | | 88,992 |
| |
| Registration fees | | 27,310 |
| |
| Line of credit commitment fees | | 39,044 |
| |
| Interest Expense on short sales | | 13,236,519 |
| |
| Miscellaneous expenses | | 7,302 |
| |
| | | 26,884,606 |
| |
| Net investment loss | | (15,368,502 | ) | |
| | | | |
| Realized and Unrealized Gain (Loss) on Investments | | | |
| Net realized gains (losses) on investments: | | | |
| Long transactions | | 11,398,683 |
| |
| Short transactions | | (34,723,600 | ) | |
| | | (23,324,917 | ) | |
| Net change in unrealized appreciation (depreciation) on investments: | | | |
| Long transactions | | (37,275,484 | ) | |
| Short transactions | | 29,136,254 |
| |
| | | (8,139,230 | ) | |
| Net realized and unrealized losses on investments | | (31,464,147 | ) | |
Change in Net Assets from Operations | | $ | (46,832,649 | ) | |
| | | | |
See accompanying notes to financial statements.
6
| STATEMENT OF CHANGES IN NET ASSETS |
| | | | | | | | |
| | | Year Ended December 31, |
| | | 2015 | | 2014 |
| From Operations | | | | |
| Net investment loss | | $ | (15,368,502 | ) | | $ | (23,499,065 | ) |
| Net realized gains (losses) on investments | | (23,324,917 | ) | | 208,091,563 |
|
| Net change in unrealized depreciation on investments | | (8,139,230 | ) | | (172,140,577 | ) |
| Change in net assets from operations | | (46,832,649 | ) | | 12,451,921 |
|
| | | | | |
| From Capital Share Transactions | | | | |
| Proceeds from sale of shares | | 57,335,810 |
| | 22,470,675 |
|
| Cost of shares redeemed | | (272,554,403 | ) | | (350,077,235 | ) |
| Change in net assets derived from capital share transactions | | (215,218,593 | ) | | (327,606,560 | ) |
| Total change in net assets | | (262,051,242 | ) | | (315,154,639 | ) |
| | | | | |
| Net Assets | | | | |
| Beginning of period | | 1,326,977,969 |
| | 1,642,132,608 |
|
| End of period | | $ | 1,064,926,727 |
| | $ | 1,326,977,969 |
|
| | | | | |
| Number of Shares of the Fund: | | | | |
| Issued from sale of shares | | 1,348,281 |
| | 568,953 |
|
| Redeemed | | (6,641,234 | ) | | (8,843,763 | ) |
| Net change | | (5,292,953 | ) | | (8,274,810 | ) |
| | | | | |
See accompanying notes to financial statements.
7
| FINANCIAL HIGHLIGHTS |
| | | | | | | | | | | | | | | | | | | | |
| | | For the Year Ended December 31, |
| | | 2015 | | 2014 | | 2013 | | 2012 | | 2011 |
| For a share of the Fund outstanding throughout each period: | | | | | | | | | | |
| Net asset value at beginning of period | | $ | 40.88 |
| | $ | 40.31 |
| | $ | 29.30 |
| | $ | 25.65 |
| | $ | 34.80 |
|
| Net investment loss (a)(b) | | (0.52 | ) | | (0.64 | ) | | (0.40 | ) | | (0.10 | ) | | (0.05 | ) |
| Net realized and unrealized gains (losses) on investments | | (1.16 | ) | | 1.21 |
| | 11.41 |
| | 3.75 |
| | (9.10 | ) |
| Total from investment operations | | (1.68 | ) | | 0.57 |
| | 11.01 |
| | 3.65 |
| | (9.15 | ) |
| | | | | | | | | | | |
| Net increase (decrease) in net asset value | | (1.68 | ) | | 0.57 |
| | 11.01 |
| | 3.65 |
| | (9.15 | ) |
| Net asset value at end of period | | $ | 39.20 |
| | $ | 40.88 |
| | $ | 40.31 |
| | $ | 29.30 |
| | $ | 25.65 |
|
| | | | | | | | | | | |
| Total return (%) | | (4.1 | ) | | 1.4 |
| | 37.6 |
| | 14.2 |
| | (26.3 | ) |
| | | | | | | | | | | |
| Ratios: | | | | | | | | | | |
| Operating expenses to average net assets (%) | | 1.13 |
| | 1.10 |
| | 1.09 |
| | 1.10 |
| | 1.05 |
|
| Dividends and interest on short positions to average net assets (%) | | 1.09 |
| | 1.16 |
| | 0.91 |
| | 0.24 |
| | — |
|
| Total expenses to average net assets (%) | | 2.22 |
| | 2.26 |
| | 2.00 |
| | 1.34 |
| | 1.05 |
|
| | | | | | | | | | | |
| Net investment loss to average net assets (%) | | (1.27 | ) | | (1.61 | ) | | (1.13 | ) | | (0.37 | ) | | (0.15 | ) |
| Portfolio turnover (%) | | 268 |
| (c) | 266 |
| (c) | 291 |
| (c) | 360 |
| | 496 |
|
| Net assets at end of period (in thousands) ($) | 1,064,927 | | 1,326,978 | | 1,642,133 | | 1,441,596 | | 1,718,500 | |
| | | | | | | | | | | |
| (a) Net investment loss per share excluding all related | | | | |
| short sale income and expenses ($) | | (0.07 | ) | | (0.18 | ) | | (0.08 | ) | | (0.04 | ) | | (0.05 | ) |
| |
| (b) | Per share net investment loss has been calculated using the average shares outstanding during the period. |
| |
| (c) | Includes short sale bond transactions. |
See accompanying notes to financial statements.
8
|
|
| |
| CGM FOCUS FUND |
| |
| NOTES TO FINANCIAL STATEMENTS — December 31, 2015 |
| |
1. Organization — CGM Focus Fund (the "Fund") is a non-diversified series of CGM Trust (the "Trust") which is organized as a Massachusetts business trust under the laws of Massachusetts pursuant to an Agreement and Declaration of Trust. The Trust is registered under the Investment Company Act of 1940 as an open-end management investment company and is following accounting and reporting guidance in the Financial Accounting Standards Board’s (“FASB”) Topic 946 “Financial Services—Investment Companies”. The Trust has two other funds whose financial statements are not presented herein. The Fund commenced operations on September 3, 1997. The Fund’s investment objective is long-term growth of capital. The Fund intends to pursue its objective by investing in a smaller number of companies, and/or in a more limited number of sectors than diversified mutual funds. In addition, should the investment outlook of the Fund’s investment adviser so warrant, the Fund may engage in a variety of investment techniques including short sales designed to capitalize on declines in the market price of specific securities of one or more companies, or declines in market indexes or government securities.
2. Significant accounting policies — Management has evaluated the events and transactions from December 31, 2015 through the date of issuance of the Fund’s financial statements. For the Fund, there were no material subsequent events that required disclosure in the financial statements or footnotes.
A. Security valuation — Equity securities are valued on the basis of valuations furnished by a pricing service, authorized by the Board of Trustees (the “Board”). Equity securities listed or regularly traded on a securities exchange or in the over-the-counter (“OTC”) market are valued at the last quoted sale price or, for certain markets, the official closing price at the time the valuations are made. A security that is listed or traded on more than one exchange is valued at the quotation on the exchange determined to be the primary market for such security. For securities with no sale reported, the last reported bid price is used for long positions and the last reported ask price for short positions. Corporate debt securities (other than short-term obligations purchased with an original or remaining maturity of sixty days or less) are valued on the basis of valuations furnished by a pricing service, authorized by the Board, which determines valuations for normal, institutional-size trading units of such securities using market information, transactions for comparable securities and various relationships between securities which are generally recognized by institutional traders. United States government debt securities held long are valued at the current closing bid and if held short are valued at the current closing ask, as last reported by a pricing service approved by the Board. Short-term investments purchased with an original or remaining maturity of sixty days or less are valued at amortized cost, which approximates value.
When current market prices or quotations are not readily available or do not accurately reflect fair value, valuations may be determined in accordance with procedures adopted by the Board. For example, when developments occur between the close of a market and the close of the New York Stock Exchange ("NYSE") that may materially affect the value of some or all of the securities, or when trading in a security is halted, these procedures may be used. The frequency with which these procedures are used is unpredictable. These valuation procedures may result in a change to a particular security’s assigned level within the fair value hierarchy described below. The value of securities used for net asset value (“NAV”) calculation under these procedures may differ from published prices for the same securities.
The Fund may use valuation techniques consistent with the market, income, and cost approach to measure fair value. The market approach uses prices and other relevant information generated by market transactions involving identical or comparable assets or liabilities. The income approach uses valuation techniques to convert future amounts (cash flows, earnings) to a single present amount. The cost approach is based on the amount that currently would be required to replace the service capacity of an asset. To increase consistency and comparability in fair value measurements and related disclosure, the Fund utilizes a fair value hierarchy which prioritizes the various inputs to valuation techniques used to measure fair value into three broad levels:
|
|
| |
| CGM FOCUS FUND |
| |
| NOTES TO FINANCIAL STATEMENTS (continued) |
| |
| |
| • | Level 1 - Prices determined using: quoted prices in active markets for identical securities that the Fund has the ability to access at the measurement date. Valuation adjustments are not applied to Level 1 investments. |
| |
| • | Level 2 - Prices determined using: other significant observable inputs (including quoted prices for similar securities, interest rates, prepayment spreads, credit risk, etc.). |
| |
| • | Level 3 - Prices determined using: significant unobservable inputs, including the Fund’s own assumptions and judgment in determining the fair value of investments. In situations where quoted prices or observable inputs are unavailable (for example, when there is little or no market activity for an investment at the end of the period), unobservable inputs may be used. Unobservable inputs reflect the Fund’s own assumptions about the factors market participants would use in pricing an investment, and would be based on the best information available in the circumstances. Investments falling into the Level 3 category are primarily supported by quoted prices from brokers and dealers participating in the market for those investments. However, these may be classified as Level 3 investments due to lack of market transparency and corroboration to support these quoted prices. Additionally, valuation models may be used as the pricing source for any remaining investments classified as Level 3. These models rely on one or more significant unobservable inputs and/or significant assumptions by Capital Growth Management Limited Partnership, the Fund’s investment adviser (“CGM”). Inputs used in valuations may include, but are not limited to, financial statement analysis, capital account balances, discount rates and estimated cash flows, and comparable company data. |
The inputs or methodology used for valuing securities are not necessarily an indication of the risk associated with investing in those securities. The following is a summary of the inputs used to value the Fund’s investments as of December 31, 2015:
|
| | | | | | | | | | | |
| | | | Valuation Inputs |
| | Classification | | Level 1 -
Quoted Prices | | Level 2 - Other Significant Observable Inputs | | Level 3 - Significant Unobservable Inputs |
| | Investments in Securities-Assets | | | | | | |
| | Common Stocks* | | $ | 1,130,548,387 |
| | $— | | $— |
| | Short-Term Investment | | | | | | |
| | Repurchase Agreement | | — | | 5,690,000 |
| | — |
| | Total | | $ | 1,130,548,387 |
| | $ | 5,690,000 |
| | $— |
| | | | | | | | |
| | Investments in Securities-Liabilities | | | | | | |
| | Bonds | | | | | | |
| | United States Treasury Bonds | | $— | | $ | 338,189,760 |
| | $— |
| | Total | | $— | | $ | 338,189,760 |
| | $— |
| | | | | | | | |
| * | All common stocks held in the Fund are Level 1 securities. For a detailed break-out of common stocks by major industry classification, please refer to the Schedule of Investments. |
| | | | | | | | |
| | For the twelve months ended December 31, 2015, there were no transfers among Levels 1, 2 and 3. |
B. Security transactions and related investment income — Security transactions are accounted for on the trade date plus one basis for daily NAV calculations. However, for financial reporting purposes, investment transactions are reported on the trade date (date the order to buy or sell is executed). Dividend income is recorded on the ex-dividend date net of applicable foreign taxes, a portion of which may be recoverable. The Fund will accrue such
|
|
| |
| CGM FOCUS FUND |
| |
| NOTES TO FINANCIAL STATEMENTS (continued) |
| |
taxes and recoveries as applicable based upon its current interpretations of the tax rules and regulations that exist in the markets in which it invests. Interest income is recorded on an accrual basis and includes amortization of premium and discount. Net gain or loss on securities sold is determined on the identified cost basis and may include proceeds from litigation. Non-cash dividend payments, if any, are recorded at the fair market value of the securities received.
C. Federal income taxes — It is the Fund’s policy to comply with the requirements of the Internal Revenue Code applicable to regulated investment companies, and to distribute to its shareholders all of its taxable income and net realized capital gains, within the prescribed time period.
Capital accounts within the financial statements are adjusted for permanent book/tax differences. These adjustments have no impact on the Fund's net assets or results of operations. Temporary book/tax differences, if any, will reverse in a subsequent period. Any difference between book basis and tax basis unrealized appreciation is attributable primarily to the temporary book/tax difference of tax deferral of losses on wash sales.
As of December 31, 2015, the components of distributable earnings on a tax basis were as follows:
|
| | | | |
| Undistributed Ordinary Income | | Undistributed Long-term Capital Gains | | Net Unrealized Appreciation/ (Depreciation) |
| $— | | $— | | $109,990,759 |
The identified cost of investments in securities held long, owned by the Fund for federal income tax purposes, and their respective gross unrealized appreciation and depreciation at December 31, 2015 was as follows:
|
| | | | | | |
| Identified Cost | | Gross Unrealized Appreciation | | Gross Unrealized Depreciation | | Net Unrealized Appreciation |
| $1,026,247,628 | | $139,904,578 | | $(29,913,819) | | $109,990,759 |
For the year ended December 31, 2015, the capital loss carryovers utilized or expired and the accumulated net realized loss on sales of investments for federal income tax purposes which are available to offset future taxable gains, prior to distributing such gains to shareholders, are shown in the table below:
|
| | | | | | | | | | |
| | | Capital Loss Carryovers Utilized | | Capital Loss Carryovers Expired | | Remaining Capital Loss Carryovers | | Expires December 31, |
| $— | | $— | | $ | 888,260,104 |
| | 2016 |
| — | | — | | 1,572,159,776 |
| | 2017 |
| Total | | $— | | $— | | $ | 2,460,419,880 |
| | |
Capital losses may be utilized to offset future capital gains until expiration. Under the Regulated Investment Company Modernization Act of 2010, the Fund will be permitted to carry forward capital losses incurred in taxable years beginning after December 22, 2010 for an unlimited period. Losses incurred during those future years will be required to be utilized prior to the losses incurred in pre-enactment taxable years. As a result of this ordering rule, pre-enactment capital loss carry forwards may more likely expire unused. Also, post-enactment capital losses that are carried forward will retain their character as either short-term or long-term capital losses rather than being considered all short-term as under previous law.
|
|
| |
| CGM FOCUS FUND |
| |
| NOTES TO FINANCIAL STATEMENTS (continued) |
| |
As of December 31, 2015, the post-enactment capital loss carryforwards were as follows:
|
| | | | |
Short-term Capital Loss Carryforward | | Long-term Capital Loss Carryforward | | Total |
| $28,643,443 | | $— | | $28,643,443 |
Management has concluded that there are no significant uncertain tax positions for the open tax years as of December 31, 2015 that would require recognition in the financial statements. However, management’s conclusion may be subject to review and adjustment at a later date based on factors including, but not limited to, new tax laws, regulations, and administrative interpretations (including relevant court decisions). Generally, the Fund's federal tax returns for the prior three fiscal years remain subject to examination by the Internal Revenue Service.
D. Dividends and distributions to shareholders — Dividends and distributions are recorded by the Fund on the ex-dividend date. The classification of income and capital gains distributions is determined in accordance with income tax regulations. Distributions from net investment income and short-term capital gains are treated as ordinary income for income tax purposes. Permanent book/tax differences relating to shareholder distributions may result in reclassifications to paid-in capital or accumulated realized gain/(loss). Permanent book/tax differences are primarily attributable to net operating losses. The Fund also may utilize earnings and profits distributed to shareholders on redemption of shares as a part of the dividend deduction for income tax purposes. Undistributed net investment income or accumulated net investment loss may include temporary book/tax differences such as tax deferral of losses on wash sales, which will reverse in a subsequent period. Any taxable income or gain remaining at fiscal year end is distributed in the following year. The tax characterization of distributions is determined on an annual basis.
E. Short sales — The Fund may sell securities short. A short sale is a transaction in which the Fund sells a security it does not own in anticipation that the market price of that security will decline. When the Fund makes a short sale, it must borrow the security sold short to make delivery to the buyer. The Fund then is obligated to replace the security borrowed by purchasing the security at the market price at the time of the replacement. The Fund is liable for any dividends or interest paid on securities sold short, which are recorded as expenses on the Statement of Operations. While the short sale is outstanding, the Fund is required to collateralize its obligations, which has the practical effect of limiting the extent to which the Fund may engage in short sales. Under certain market conditions, short sales can increase the volatility of the Fund and may lower the Fund’s return or result in losses, which potentially may be unlimited. The market value of securities held in a segregated account at December 31, 2015, was $205,726,000 and the value of cash held in a segregated account, a portion of which may have been restricted at December 31, 2015, was $268,590,174.
F. Guarantees and indemnifications — Under the Trust's organizational documents, its officers and trustees are indemnified against certain liabilities arising out of the performance of their duties for the Fund. Additionally, in the normal course of business, the Fund may enter into contracts with service providers that contain general indemnification clauses. The Fund's maximum exposure under these arrangements is unknown, as this would involve future claims that may be made against the Fund that have not yet occurred. The risk of material loss from such claims is considered remote.
G. Foreign currency translation — All assets and liabilities initially expressed in terms of foreign currencies are translated into U.S. dollars each day at the prevailing exchange rate. Transactions affecting Statement of Operations accounts and net realized gain or loss on investments are translated at the rates prevailing at the dates of the transactions. The Fund does not isolate that portion of the results of operations resulting from changes in foreign exchange rates on investments from the fluctuations arising from changes in market prices of securities held. Such fluctuations are included with the net realized and unrealized gain or loss from investments. Reported net realized
|
|
| |
| CGM FOCUS FUND |
| |
| NOTES TO FINANCIAL STATEMENTS (continued) |
| |
foreign exchange gains or losses arise from sales of foreign currency, currency gains or losses realized between the trade and settlement dates on securities transactions and the difference between the amounts of dividends, interest, and foreign withholding taxes recorded on the Fund’s books and the U.S. dollar equivalent of the amounts actually received or paid. Net unrealized foreign exchange gains or losses arise from changes in the value of assets and liabilities other than investments in securities at the end of the period, resulting from changes in the exchange rate.
H. Repurchase agreements — The Fund enters into repurchase agreements, under the terms of a Master Repurchase Agreement, secured by U.S. Government or Agency securities, which involve the purchase of securities from a counterparty with a simultaneous commitment to resell the securities at an agreed upon date and price. Certain repurchase agreements are tri-party arrangements whereby the collateral is held in a segregated account for the benefit of the Fund and on behalf of the counterparty. Repurchase agreements afford the Fund the opportunity to earn a return on temporarily available cash at minimal market risk. While the underlying security may be a bill, certificate of indebtedness, note or bond issued by an agency, authority or instrumentality of the U.S. Government, the obligation of the seller is not guaranteed by the U.S. Government and there is a risk that the seller may fail to repurchase the underlying security. Consequently, there may be possible delays or restrictions upon the Fund’s ability to dispose of the underlying securities. Upon an event of default under the Master Repurchase Agreement, the Fund would attempt to exercise its rights with respect to the underlying security, including taking possession of the cash and/or collateral provided by the seller.
At December 31, 2015, the Fund had an investment in a repurchase agreement with a gross value of $5,690,000 on the Statement of Assets and Liabilities which was not offset. The value of the related collateral consisting of cash and/or securities of $5,818,703 exceeded the value of the repurchase agreement at December 31, 2015 by $128,703.
I. Use of estimates — The preparation of financial statements in accordance with U.S. Generally Accepted Accounting Principles (“GAAP”) requires management to make certain estimates and assumptions that affect the reported amounts of assets and liabilities, the disclosure of contingent assets and liabilities at the date of the financial statements and the reported amounts of revenue and expenses during the reporting period. Actual results could differ from those estimates.
3. Risks and uncertainties
A. Non-diversification risk — The Fund is non-diversified, meaning it may invest a significant portion of its investments within a single industry or sector of the economy or may invest in fewer individual holdings than a diversified fund. Therefore, the Fund may be subject to greater price volatility and may be more adversely affected by the performance of particular industries, sectors, or individual holdings compared to the performance of a diversified fund.
B. Risks associated with foreign investments — The Fund may invest in securities issued by institutions, corporations, and governments established by or located in foreign countries, which may be developed or undeveloped countries. Investing in foreign securities may involve significant risks. For example, there is generally less publicly available information about foreign companies, particularly those not subject to the disclosure and reporting requirements of the U.S. securities laws. Foreign issuers are generally not bound by uniform accounting, auditing, and financial reporting requirements and standards of practice comparable to those applicable to domestic issuers. Investments in foreign securities also involve the risk of possible adverse changes in investment or exchange control regulations, expropriation or confiscatory taxation, political or financial instability or diplomatic and other developments which could affect such investments. Foreign stock markets, while growing in volume and sophistication, are generally not as developed as those in the United States, and securities of some foreign issuers (particularly those located in developing countries) may be less liquid and more volatile than securities
|
|
| |
| CGM FOCUS FUND |
| |
| NOTES TO FINANCIAL STATEMENTS (continued) |
| |
of comparable U.S. companies. In general, there is less overall governmental supervision and regulation of foreign securities markets, broker-dealers and issuers than in the United States. Additionally, because some foreign securities the Fund may acquire are purchased with and payable in foreign currencies, the value of these assets as measured in U.S. dollars may be affected favorably or unfavorably by changes in currency rates and exchange control regulations.
4. Purchases and sales of securities — For the period ended December 31, 2015, purchases and sales of securities other than United States Government or Agency obligations and short-term investments aggregated $4,132,829,392 and $4,349,672,714, respectively. Short sales and buys to cover for U.S. Treasury bonds for the period ended December 31, 2015 were $35,657,813 and $227,047,656, respectively.
5. Fees and expenses
A. Management fees — During the period ended December 31, 2015, the Fund incurred management fees of $11,656,535, paid or payable to CGM, certain officers and employees of which are also officers and trustees of the Fund. The management agreement provides for a fee at the annual rate of 1.00% on the first $500 million of the Fund’s average daily net assets, 0.95% of the next $500 million of the Fund's average daily net assets and 0.90% on amounts in excess of $1 billion of the Fund's average daily net assets.
B. Other expenses — The majority of expenses are directly attributable to the Fund. Expenses that are not readily attributable to the Fund are allocated among each of the three funds comprising the Trust in an equitable manner, taking into consideration, among other things, the nature and type of expense and the funds' respective net assets. CGM performs certain administrative, accounting, compliance and other services for the Fund. The expenses of those services, which are paid to CGM by the Fund, include the following: (i) expenses for personnel performing bookkeeping, accounting and financial reporting and clerical functions relating to the Fund; (ii) expenses for services required in connection with the preparation of registration statements and prospectuses, shareholder reports and notices, proxy solicitation material furnished to shareholders of the Fund or regulatory authorities and reports and questionnaires for SEC compliance; (iii) registration, filing and other fees in connection with requirements of regulatory authorities and (iv) compliance in connection to the Investment Company Act of 1940 and the Sarbanes-Oxley Act of 2002. The accounting, administration and compliance expenses of $606,720, for the period ended December 31, 2015, are shown separately in the Statement of Operations. These expenses include the reimbursement of a portion of the compensation expenses incurred by CGM for its employees who provide these administrative, accounting, compliance, and other services to the Fund, including $594,452 of the salaries of CGM employees who are officers of the Fund.
C. Trustees fees and expenses — The Fund does not pay any compensation directly to any trustees who are “interested persons” (as defined in the Investment Company Act of 1940) of CGM or any affiliate of CGM (other than registered investment companies). For the period ending December 31, 2015, each disinterested trustee will be compensated by the Trust with an annual fee of $70,000 plus travel expenses for each meeting attended. The disinterested trustees are responsible for the audit committee functions of the Trust’s Board and have designated a chairman to oversee those functions who receives an additional $30,000 annually. Of these amounts, the Fund is responsible for $10,000 per trustee annually, plus an annual variable fee calculated based on the proportion of the Fund’s average net assets relative to the aggregate average net assets of the Trust.
6. Line of credit — The Fund had a $40,000,000 committed secured line of credit with State Street Bank and Trust Company through October 9, 2015, which was not extended and expired. Borrowings under the line were charged interest at 1.25% over the higher of the Federal Funds Rate and the Overnight LIBOR Rate. The Fund incurred a commitment fee of 0.125% per annum on the unused portion of the line of credit, payable quarterly, through October 9, 2015. There were no borrowings under the line of credit during the period ended October 9, 2015.
|
|
| |
| CGM FOCUS FUND |
| |
| REPORT OF INDEPENDENT REGISTERED PUBLIC ACCOUNTING FIRM |
| |
To the Board of Trustees and Shareholders of CGM Focus Fund
In our opinion, the accompanying statement of assets and liabilities, including the schedule of investments, and the related statements of operations and of changes in net assets and the financial highlights present fairly, in all material respects, the financial position of the CGM Focus Fund (the “Fund”) at December 31, 2015, the results of its operations for the year then ended, the changes in its net assets for each of the two years in the period then ended and the financial highlights for each of the five years in the period then ended, in conformity with accounting principles generally accepted in the United States of America. These financial statements and financial highlights (hereafter referred to as "financial statements") are the responsibility of the Fund's management. Our responsibility is to express an opinion on these financial statements based on our audits. We conducted our audits of these financial statements in accordance with the standards of the Public Company Accounting Oversight Board (United States). Those standards require that we plan and perform the audit to obtain reasonable assurance about whether the financial statements are free of material misstatement. An audit includes examining, on a test basis, evidence supporting the amounts and disclosures in the financial statements, assessing the accounting principles used and significant estimates made by management, and evaluating the overall financial statement presentation. We believe that our audits, which included confirmation of securities at December 31, 2015 by correspondence with the custodian and brokers, provide a reasonable basis for our opinion.
PricewaterhouseCoopers LLP
Boston, Massachusetts
February 18, 2016
|
|
| |
| CGM FOCUS FUND |
| |
| ADDITIONAL INFORMATION |
| (unaudited) |
Availability of proxy voting information:
Proxy voting policies and information regarding how the Fund voted proxies relating to portfolio securities during the twelve month period ended June 30, 2015 are available without charge, by calling 800-345-4048. The policies also appear in the Fund’s Statement of Additional Information, which can be found on the CGM Funds' website, www.cgmfunds.com, and the SEC’s website, www.sec.gov. The voting records can also be found on the SEC’s website on the N-PX filing.
Portfolio holdings:
The Fund files its complete schedule of portfolio holdings with the SEC for the first and third quarters of each fiscal year on Form N-Q. The Fund’s Forms N-Q are available on the SEC’s website at www.sec.gov and may be reviewed and copied at the SEC’s Public Reference Room in Washington, D.C. Information on the operation of the Public Reference Room may be obtained by calling 800-SEC-0330.
The Fund’s Prospectus and Statement of Additional Information contain additional information on other risks and uncertainties relating to the Fund’s investments. The Fund’s Prospectus and Statement of Additional Information can be obtained on the CGM Funds' website, www.cgmfunds.com, and the SEC’s website, www.sec.gov or by calling 800-345-4048.
TAX INFORMATION FOR THE TAX YEAR ENDED December 31, 2015
(unaudited)
We are providing this information as required by the Internal Revenue Code.
The Fund did not make any distributions in 2015.
|
|
| |
| CGM FOCUS FUND |
| |
| FUND EXPENSES |
| (unaudited) |
As a shareholder of CGM Focus Fund, you incur two types of costs: (1) transaction costs, which could include, among other charges, wire fees and custodial maintenance fees for certain types of accounts and (2) ongoing costs, including management fees and other Fund expenses. This example is intended to help you understand your ongoing costs (in dollars) of investing in the Fund and to compare these costs with the ongoing costs of investing in other mutual funds.
The example is based on an investment of $1,000 invested at the beginning of the period and held for the entire period July 1, 2015 to December 31, 2015.
Actual return and expenses
The first line of the table below provides information about actual account values and actual expenses.
You may use the information in this line, together with the amount you invested, to estimate the expenses that you paid over the period. Simply divide your account value by $1,000 (for example, an $8,600 account value divided by $1,000 = 8.6), then multiply the result by the number in the first line under the heading entitled ‘‘Expenses Paid During Period’’ to estimate the expenses you paid on your account during this period.
Hypothetical example for comparison purposes
The second line of the table below provides information about hypothetical account values and hypothetical expenses based on the Fund’s actual expense ratio and an assumed rate of return of 5% per year before expenses, which is not the Fund’s actual return. The hypothetical account values and expenses may not be used to estimate the actual ending account balance or expenses you paid for the period.
You may use this information to compare the ongoing costs of investing in the Fund and other funds. To do so, compare this 5% hypothetical example with the 5% hypothetical examples that appear in the shareholder reports of the other funds.
Please note that the expenses shown in the table are meant to highlight your ongoing costs only and do not reflect any transactional costs such as any wire fees or custodial maintenance fees that may be payable. Therefore, the second line of the table is useful in comparing ongoing costs only, and will not help you determine the relative total costs of owning different funds. In addition, if these transactional costs were included, your costs would have been higher.
|
| | | |
| | Beginning Account Value 07/01/15 | Ending
Account Value
12/31/15 | Expenses Paid During Period* 07/01/15 - 12/31/15 |
| Actual | $1,000.00 | $909.93 | $10.73 |
Hypothetical
(5% return before expenses) | $1,000.00 | $1,013.96 | $11.32 |
* Expenses are equal to the Fund’s annualized expense ratio of 2.23%, which includes expenses related to short sales activity, multiplied by the average account value over the period, multiplied by 184/365 (to reflect the one-half year period).
|
|
| |
| CGM FOCUS FUND |
| |
| TRUSTEES AND OFFICERS |
The Fund is supervised by the Board of Trustees (the “Board”) of the Trust. The Board is responsible for the general oversight of the Fund, including general supervision and review of the Fund’s investment activities. The Board, in turn, elects the officers who are responsible for administering the Fund’s day-to-day operations.
An asterisk in the following table identifies those trustees and officers who are “interested persons” of the Trust as defined in the Investment Company Act of 1940. Each trustee and officer of the Trust noted as an interested person is interested by virtue of that individual’s position with CGM, as described in the table below. Each trustee serves during the continued lifetime of the Trust, until he or she earlier dies, resigns or is removed, or if sooner, until the election and qualification of his or her successor. Each officer serves until his or her successor is elected or qualified, or until the officer sooner dies, resigns, or is removed or becomes disqualified.
The trustees and officers of the Trust, their ages, their principal occupations during the past five years, the number of CGM Funds they oversee, and other directorships they hold are set forth below. Unless otherwise noted below, the address of each interested trustee and officer is One International Place, Boston, Massachusetts 02110. Correspondence intended for the trustees who are not “interested persons” of the Trust may be sent c/o Capital Growth Management, One International Place, Boston, Massachusetts 02110. The Statement of Additional Information for the Fund includes additional information about Fund trustees and is available on the CGM Funds' website, www.cgmfunds.com, or by calling 800-345-4048.
|
| | | | | | |
| Name, Address and Age | | Positions Held and Length of Time Served | | Principal Occupations and Other Directorships Held During Past 5 Years | | Number of Funds in the CGM Funds Complex Overseen |
| Interested Trustees | |
| |
| |
|
Ken Heebner*
age 75 | | Trustee since 1993 | | Co-founder and Employee, CGM; Controlling owner of Kenbob, Inc. (general partner of CGM) | | 3 |
Leslie A. Lake*
age 70 | | Trustee since 2013 | | Vice President and Secretary of CGM Trust (since 1992); Employee - Office Administrator, CGM | | 3 |
| Disinterested Trustees | |
| |
| |
|
Peter O. Brown
age 75 | | Trustee since 1993 | | Counsel (formerly, Partner), Harter, Secrest & Emery LLP (law firm); formerly Executive Vice President and Chief Operating Officer, The Glenmede Trust Company (from 1990 to 1993); formerly Senior Vice President, J.P. Morgan Chase Bank (from 1981 to 1990); formerly Trustee, TT International U.S.A. Master and Feeder Trusts (four mutual funds) (from 2000 to 2005) | | 3 |
Mark W. Holland
age 66 | | Trustee since 2004 | | President, Wellesley Financial Advisors, LLC (since 2003); formerly Vice President and Chief Operating Officer, Fixed Income Management, Loomis, Sayles & Company, L.P. (from 1999 to 2002); formerly Director, Loomis, Sayles & Company, L.P. (from 1993 to 2001) | | 3 |
|
| | | | | | |
| Name, Address and Age | | Positions Held and Length of Time Served | | Principal Occupations and Other Directorships Held During Past 5 Years | | Number of Funds in the CGM Funds Complex Overseen |
James Van Dyke Quereau, Jr.
age 67 | | Trustee since 1993 | | Senior Vice President and Chief Investment Officer (since 2008), Director (since 2006), Managing Partner (2006 to 2008), Stratton Management Company (investment management); formerly Director and Vice President, Semper Trust Co. (until 2006) | | 3 |
J. Baur Whittlesey
age 69 | | Trustee since 1990 | | Member, Ledgewood, P.C. (law firm) | | 3 |
| Officers | |
| |
| | |
Ken Heebner*
age 75 | | Vice President since 1990 | | Co-founder and Employee, CGM; Controlling owner of Kenbob, Inc. (general partner of CGM) | | 3 |
David C. Fietze*
age 46 | | President since 2015 and Chief Compliance Officer since 2004 | | Employee – Legal Counsel, CGM | | 3 |
Kathleen S. Haughton*
age 55
| | Vice President since
1992 and Anti-Money | | Employee – Investor Services Division, CGM | | 3 |
Address:
38 Newbury St., 8th Fl.,
Boston, MA 02116 | | Laundering Compliance Officer since 2002
| |
| |
|
Jem A. Hudgins*
age 52 | | Treasurer since 2004 | | Employee – CGM | | 3 |
Leslie A. Lake*
age 70 | | Vice President and Secretary since 1992 | | Employee – Office Administrator, CGM | | 3 |
Martha I. Maguire*
age 60 | | Vice President since
1994 | | Employee – Funds Marketing, CGM | | 3 |
Nicole M. Fembleaux*
age 36 | | Assistant Vice President since 2011 | | Employee – Operations, CGM | | 3 |
Kevin Ure*
age 44 | | Vice President since
2013 | | Employee – Accounts Admin, Operations, CGM | | 3 |
Tony Figueiredo*
age 55
| | Vice President since
2013 | | Employee – Investor Services Division, CGM | | 3 |
Address:
38 Newbury St., 8th Fl.,
Boston, MA 02116 | |
| |
| |
|
Deidra Hewardt*
age 43
| | Assistant Treasurer since 2014 | | Employee – CGM | | 3 |
Address:
38 Newbury St., 8th Fl.,
Boston, MA 02116 | |
| |
| |
|
ITEM 2. CODE OF ETHICS.
CGM Trust has adopted a code of ethics that applies to the registrant's principal executive officer and principal financial officer (the "Code"). The Code is filed herewith as exhibit EX99_CODE. There were no amendments to the Code required to be disclosed in response to this Item 2 during the fiscal year ended December 31, 2015. There were no waivers or implicit waivers from the Code granted by the registrant during the fiscal year ended December 31, 2015.
ITEM 3. AUDIT COMMITTEE FINANCIAL EXPERT.
The Trust's Board of Trustees has determined that it has at least one audit committee financial expert serving on its audit committee. The name of the audit committee financial expert is James Van Dyke Quereau, Jr. James Van Dyke Quereau, Jr. is "independent" as defined in Item 3(a)(2) of Form N-CSR.
ITEM 4. PRINCIPAL ACCOUNTANT FEES AND SERVICES.
| |
| (a) | Audit Fee: The aggregate fees billed for each of the last two fiscal years for professional services rendered by the principal accountant for the audit of CGM Trust’s annual financial statements or services that are normally provided by the accountant in connection with statutory and regulatory filings or engagements are the following: 2014 - $122,925 and 2015 - $126,615. |
| |
| (b) | Audit-Related Fees: The aggregate fees billed in each of the last two fiscal years for assurance and related services by the principal accountant that are reasonably related to the performance of the audit of CGM Trust’s financial statements and are not reported under paragraph (a) of this Item are the following: 2014 - $0 and 2015 - $0. |
| |
| (c) | Tax Fees: The aggregate fees billed in each of the last two fiscal years for professional services rendered by the principal accountant for tax compliance, tax advice, and tax planning are the following: 2014 - $17,700 and 2015 - $18,150. The nature of the services comprising the fees disclosed under this category is tax compliance services related to the preparation and review of federal income and excise tax returns and review of excise tax distribution requirements. |
| |
| (d) | All Other Fees: The aggregate fees billed in each of the last two fiscal years for products and services provided by the principal accountant, other than the services reported in paragraphs (a) through (c) of this Item are the following: 2014 - $0 and 2015 - $0. |
| |
| (e) | (1)The Trustees Committee of the Board of Trustees of the CGM Trust is required to pre-approve (i) all audit services, tax services and permitted non-audit services provided by PricewaterhouseCoopers LLP or any other independent public accountant engaged by the CGM Trust and (ii) any engagement of PricewaterhouseCoopers LLP to provide non-audit services to (a) Capital Growth Management Limited Partnership (“CGM”), and (b) any entity controlling, controlled by, or under common control with CGM that provides ongoing services to the Trust if the engagement relates directly to the operations and financial reporting of the Trust. The Trustees Committee generally reviews each necessary pre-approval on a case by case basis. However, the Trustees Committee has authorized the President or Treasurer of the CGM Trust, on behalf of its series (the “Funds”) to incur additional fees totaling in the aggregate not more than $7,500 for services relating to the audit of the Funds for the fiscal year ended December 31, 2015, the close-out of the 2015 accounts, calculation of year-end dividends, and/or related tax or accounting matters. |
(2) 0% of services described in each of paragraphs (b) through (d) of this Item were approved by the audit committee pursuant to paragraph (c)(7)(i)(C) of Rule 2-01 of Regulation S-X.
| |
| (g) | The aggregate non-audit fees billed by CGM Trust’s accountant for services rendered to (i) CGM Trust, (ii) CGM, and (iii) any entity controlling, controlled by, or under common control with CGM that provides ongoing services to the CGM Trust for each of the last two fiscal years of the CGM Trust are the following: 2014 - $17,700 and 2015 - $18,150. |
| |
| (h) | There were no non-audit services that were rendered to the CGM or any entity controlling, controlled by, or under common control with CGM that provides ongoing services to the CGM Trust that were not pre-approved pursuant to paragraph (c)(7)(ii) of Rule 2-01 of Regulation S-X, thus no consideration by the Trustees Committees was necessary to determine if services were compatible with maintaining the principal accountant's independence. |
ITEM 5. AUDIT COMMITTEE OF LISTED REGISTRANTS.
Not applicable.
ITEM 6. SCHEDULE OF INVESTMENTS.
Not applicable. Investments in securities of unaffiliated issuers as of December 31, 2015, as set forth in Section 210.12-12 of Regulation S-X, are included as part of the report to shareholders filed under Item 1 of this Form.
ITEM 7. DISCLOSURE OF PROXY VOTING POLICIES AND PROCEDURES FOR CLOSED-END MANAGEMENT INVESTMENT COMPANIES.
Not applicable.
ITEM 8. PORTFOLIO MANAGERS OF CLOSED-END MANAGEMENT INVESTMENT COMPANIES.
Not applicable.
ITEM 9. PURCHASES OF EQUITY SECURITIES BY CLOSED-END MANAGEMENT INVESTMENT COMPANY AND AFFILIATED PURCHASERS.
Not applicable.
ITEM 10. SUBMISSION OF MATTERS TO A VOTE OF SECURITY HOLDERS.
As described in the CGM Trust’s proxy statement on Schedule 14A filed on September 24, 2004, the CGM Trust does not have a formal policy for considering any trustee candidates recommended by shareholders.
ITEM 11. CONTROLS AND PROCEDURES.
(a) Based on their evaluation of the CGM Trust’s disclosure controls and procedures within 90 days of the filing of this Form N-CSR, the principal executive officer and principal financial officer of CGM Trust have concluded that the CGM Trust’s disclosure controls and procedures are effective to provide reasonable assurance that information required to be disclosed by the CGM Trust on Form N-CSR and Form N-Q is recorded, processed, summarized and reported within the time periods specified in Securities and Exchange Commission rules and forms.
(b) There were no changes in CGM Trust’s internal control over financial reporting (as defined in Rule 30a-3(d) under the Act) that occurred during the CGM Trust’s last fiscal quarter of the period covered by this report.
ITEM 12. EXHIBITS.
(a)(1) Code of ethics described in Item 2 is attached hereto as EX99_CODE.
(a)(2) Certifications for each principal executive officer and principal financial officer of the registrant as required by Rule 30a-2(a) under the Investment Company Act of 1940 are attached hereto as EX99_CERT.
(a)(3) Not Applicable.
(b) Certifications for each principal executive officer and principal financial officer of the registrant as required by Rule 30a-2(b) under the Investment Company Act of 1940 are attached hereto as EX99_906CERT.
SIGNATURES
Pursuant to the requirements of the Securities Exchange Act of 1934 and the Investment Company Act of 1940, the Registrant has duly caused this report to be signed on its behalf by the undersigned, thereunto duly authorized.
CGM Trust
By: /S/David C. Fietze
David C. Fietze
President
Principal Executive Officer
Date: February 18, 2016
Pursuant to the requirements of the Securities Exchange Act of 1934 and the Investment Company Act of 1940, this report has been signed below by the following persons on behalf of the Registrant and in the capacities and on the dates indicated.
By: /S/ David C. Fietze
David C. Fietze
President
Principal Executive Officer
Date: February 18, 2016
By: /S/ Jem A. Hudgins
Jem A. Hudgins
CFO & Treasurer
Principal Financial Officer
Date: February 18, 2016