UNITED STATES
SECURITIES AND EXCHANGE COMMISSION
Washington, D.C. 20549
FORM N-CSR
CERTIFIED SHAREHOLDER REPORT OF REGISTERED
MANAGEMENT INVESTMENT COMPANIES
Investment Company Act File Number: 811-02145
LORD ABBETT BOND-DEBENTURE FUND, INC.
(Exact name of Registrant as specified in charter)
90 Hudson Street, Jersey City, NJ 07302
(Address of principal executive offices) (Zip code)
John T. Fitzgerald, Esq., Vice President & Assistant Secretary
90 Hudson Street, Jersey City, NJ 07302
(Name and address of agent for service)
Registrant’s telephone number, including area code:(800) 201-6984
Date of fiscal year end: 12/31
Date of reporting period: 12/31/2018
| Item 1: | Report(s) to Shareholders. |

LORD ABBETT
ANNUAL REPORT
Lord Abbett
Bond Debenture Fund
For the fiscal year ended December 31, 2018
Important Information on Paperless Delivery
Beginning in February 2021, as permitted by regulations adopted by the Securities and Exchange Commission, paper copies of the Fund’s shareholder reports like this one will no longer be sent by mail, unless you specifically request paper copies of the reports from the Fund or from your financial intermediary, such as a broker-dealer, investment advisor or bank. Instead, the reports will be made available on Lord Abbett’s website and you will be notified by mail each time a report is posted and provided with a website link to access the report.
If you already elected to receive shareholder reports electronically, you will not be affected by this change and you need not take any action. Shareholders who hold accounts directly with the Fund may elect to receive shareholder reports and other communications from the Fund electronically by signing into your Lord Abbett online account at lordabbett.com and selecting “Log In.” For further information, you may also contact the Fund at (800) 821-5129. Shareholders who hold accounts through a financial intermediary should contact them directly.
You may elect to receive all future reports in paper free of charge by contacting the Fund at (800) 821-5129. Your election to receive reports in paper will apply to all funds held with Lord Abbett. If your fund shares are held through a financial intermediary please contact them directly. Your election applies to all funds held with that intermediary.
Table of Contents
Lord Abbett Bond Debenture Fund
Annual Report
For the fiscal year ended December 31, 2018

From left to right: James L.L. Tullis, Independent Chairman of the Lord Abbett Funds and Douglas B. Sieg, Director, President, and Chief Executive Officer of the Lord Abbett Funds.
Dear Shareholders:We are pleased to provide you with this overview of the performance of Lord Abbett Bond Debenture Fund for the fiscal year ended December 31, 2018. On this page and the following pages, we discuss the major factors that influenced fiscal year performance. For detailed and more timely information about the Fund, please visit our website at www.lordabbett.com, where you also can access quarterly commentaries that provide updates on the Fund’s performance and other portfolio related updates.
Thank you for investing in Lord Abbett mutual funds. We value the trust that you place in us and look forward to serving your investment needs in the years to come.
Best regards,

Douglas B. Sieg
Director, President and Chief Executive Officer
For the fiscal year ended December 31, 2018, the Fund returned -3.79%, reflecting performance at the net asset value (NAV) of Class A shares with all distributions reinvested, compared to its benchmark, the Bloomberg Barclays U.S. Aggregate Bond Index,1which returned 0.01% over the same period.
During the period, there were several market-moving events. In June 2018, the White House announced its intent to impose additional tariffs on $200 billion worth of Chinese goods, on top of the $50
billion previously announced. The aggressive U.S. trade posture continued into September with trade tensions mounting between the U.S. and China. While the impact has yet to fully be realized, many corporations anticipate that the retaliatory tariffs will weigh on profits. In 2018, the Fed raised its target for short-term interest rates by 0.25% at each of its March, June, September and December meetings, raising the target range to 2.25%-2.50%. As the Fed continued to raise rates, the U.S. Treasury yield curve
1
flattened throughout the year. The yield on 10-year U.S. Treasury securities (“Treasuries”) reached multi-year highs in November, and pulled back in December as risk averse sentiment roiled the markets and investors to flocked to safety. Amid rising concerns surrounding escalating trade tensions, slowing global growth, and increasing interest rates, the Nasdaq experienced the largest monthly drop since 2008 in October 2018. US equity markets were volatile to finish out the year, with the S&P 500® Index2suffering the largest December decline since the Great Depression, culminating in the worst year since the financial crisis. Additionally, leveraged credit segments of the market experienced a sharp sell-off, notably in December, due to concerns over slower growth, falling oil prices, year-end technical pressures and general risk averse sentiment. Despite the sell-off, the U.S. economy continued to expand by more than 2% during each quarter of the trailing 12-month period, with domestic GDP growth ranging between 2.2% to 4.2% from the third quarter of 2017 to the third quarter of 2018. The 4.2% GDP growth in the second quarter marked the strongest growth rate since the third quarter of 2014. Inflation, as measured by the Consumer Price Index (CPI), gained 1.9%, a decline of 0.1% year-over-year, mainly driven lower by falling energy prices. Oil prices suffered sharp declines due to oversupply concerns.
During the 12-month period the leveraged credit sectors of the U.S. fixed income market, including high yield bonds and loans, experienced mixed returns, with high yield bonds underperforming and bank loans outperforming investment grade bonds. High yield credit spreads widened during the period, most notably in December, as the fourth quarter risk averse sentiment took a toll on risk assets. Returns within the high yield market were driven lower primarily by the lower-rated issues, as ‘CCC’ rated bonds underperformed higher-rated issues over the 12-month period.
As it has in the past, the Fund maintained a significant allocation to high yield bonds, as we remained positive on the high yield market from a fundamental perspective. The Fund’s exposure to high yield bonds detracted from relative performance, as the high yield market significantly underperformed investment grade bonds, as represented by the Fund’s benchmark the Bloomberg Barclays US Aggregate Bond Index1.
The Fund maintained an allocation to equities throughout the period, which also detracted from relative performance, as the asset class came under pressure during the year, most notably in the fourth quarter, as general risk averse sentiment caused a broad-based sell-off.
The Fund’s modest allocation to bank loans contributed to relative performance during the period. Despite volatility late in the year, the asset class performed relatively well in relation to other risk assets.
2
The Fund’s portfolio is actively managed and, therefore, its holdings and the weightings of a particular issuer or
particular sector as a percentage of portfolio assets are subject to change. Sectors may include many industries.
1 The Bloomberg Barclays U.S. Aggregate Bond Index is an index of U.S dollar-denominated, investment-grade U.S. government and corporate securities, and mortgage pass-through securities, and asset-backed securities. Indexes are unmanaged, do not reflect the deduction of fees or expenses, and an investor cannot invest directly in an index.
2 The S&P 500®Index is widely regarded as the standard for measuring large cap U.S. stock market performance and includes a representative sample of leading companies in leading industries.
Unless otherwise specified, indexes reflect total return, with all dividends reinvested. Indexes are unmanaged, do not reflect the deduction of fees or expenses, and are not available for direct investment.
Important Performance and Other Information
Performance data quoted in the following pages reflect past performance and are no guarantee of future results. Current performance may be higher or lower than the performance quoted. The investment return and principal value of an investment in the Fund will fluctuate so that shares, on any given day or when redeemed, may be worth more or less than their original cost. You
can obtain performance data current to the most recent month end by calling Lord Abbett at 888-522-2388 or referring to www.lordabbett.com.
The annual commentary above discusses the views of the Fund’s management and various portfolio holdings of the Fund as of December 31, 2018. These views and portfolio holdings may have changed after this date. Information provided in the commentary is not a recommendation to buy or sell securities. Because the Fund’s portfolio is actively managed and may change significantly, the Fund may no longer own the securities described above or may have otherwise changed its position in the securities. For more recent information about the Fund’s portfolio holdings, please visit www.lordabbett.com.
A Note about Risk:See Notes to Financial Statements for a discussion of investment risks. For a more detailed discussion of the risks associated with the Fund, please see the Fund’s prospectus.
Mutual funds are not insured by the FDIC, are not deposits or other obligations of, or guaranteed by, banks, and are subject to investment risks including possible loss of principal amount invested.
3
Investment Comparison
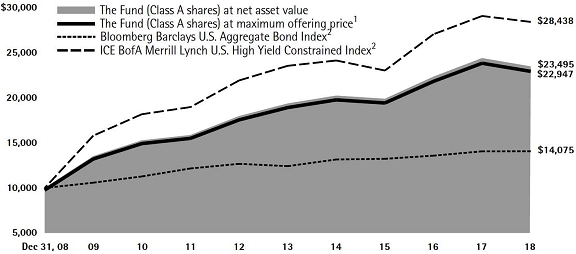
Below is a comparison of a $10,000 investment in Class A shares with the same investment in the Bloomberg Barclays U.S. Aggregate Bond Index and the ICE BofA Merrill Lynch U.S. High Yield Constrained Index, assuming reinvestment of all dividends and distributions. The performance of other classes will be greater than or less than the performance shown in the graph below due to different sales loads and expenses applicable to such classes. The graph and performance table below do not reflect the deduction of taxes that a shareholder would pay on Fund distributions or the redemption of Fund shares.Past performance is no guarantee of future results.
Average Annual Total Returns at Maximum Applicable
Sales Charge for the Periods Ended December 31, 2018
| | | 1 Year | | 5 Years | | | 10 Years | | | Life of Class | |
| Class A3 | | | –5.95% | | | 3.45% | | | | 8.66% | | | | – | |
| Class C4 | | | –5.28% | | | 3.28% | | | | 8.23% | | | | – | |
| Class F5 | | | –3.83% | | | 4.00% | | | | 9.10% | | | | – | |
| Class F36 | | | –3.57% | | | – | | | | – | | | | 1.56% | |
| Class I5 | | | –3.77% | | | 4.10% | | | | 9.21% | | | | – | |
| Class P5 | | | –4.00% | | | 3.85% | | | | 8.88% | | | | – | |
| Class R25 | | | –4.17% | | | 3.52% | | | | 8.59% | | | | – | |
| Class R35 | | | –4.21% | | | 3.60% | | | | 8.69% | | | | – | |
| Class R47 | | | –3.83% | | | – | | | | – | | | | 3.41% | |
| Class R57 | | | –3.63% | | | – | | | | – | | | | 3.66% | |
| Class R67 | | | –3.56% | | | – | | | | – | | | | 3.74% | |
1 Reflects the deduction of the maximum initial sales charge of 2.25%.
2 Performance of each unmanaged index does not reflect any fees or expenses. The performance of each index is not necessarily representative of the Fund’s performance.
3 Total return, which is the percentage change in net asset value, after deduction of the maximum initial sales charge of 2.25% applicable to Class A shares, with all dividends and distributions reinvested for the periods shown ended December 31, 2018 is calculated using the SEC-required uniform method to compute such return.
4 The 1% CDSC for Class C shares normally applies before the first anniversary of the purchase date. Performance for other periods is at net asset value.
5 Performance is at net asset value.
6 Commenced operations and performance for the Class began on April 4, 2017. Performance is at net asset value.
7 Commenced operations and performance for the Class began on June 30, 2015. Performance is at net asset value.
4
Expense Example
As a shareholder of the Fund, you incur two types of costs: (1) transaction costs, including sales charges (loads) on purchase payments (these charges vary among the share classes); and (2) ongoing costs, including management fees; distribution and service (12b-1) fees (these charges vary among the share classes); and other Fund expenses. This Example is intended to help you understand your ongoing costs (in dollars) of investing in the Fund and to compare these costs with the ongoing costs of investing in other mutual funds.
The Example is based on an investment of $1,000 invested at the beginning of the period and held for the entire period (July 1, 2018 through December 31, 2018).
Actual Expenses
For each class of the Fund, the first line of the table on the following page provides information about actual account values and actual expenses. You may use the information in this line, together with the amount you invested, to estimate the expenses that you paid over the period. Simply divide your account value by $1,000 (for example, an $8,600 account value divided by $1,000 = 8.6), then multiply the result by the number in the first line under the heading titled “Expenses Paid During Period 7/1/18 – 12/31/18” to estimate the expenses you paid on your account during this period.
Hypothetical Example for Comparison Purposes
For each class of the Fund, the second line of the table on the following page provides information about hypothetical account values and hypothetical expenses based on the Fund’s actual expense ratio and an assumed rate of return of 5% per year before expenses, which is not the Fund’s actual return. The hypothetical account values and expenses may not be used to estimate the actual ending account balance or expenses you paid for the period. You may use this information to compare the ongoing costs of investing in the Fund and other funds. To do so, compare this 5% hypothetical example with the 5% hypothetical examples that appear in the shareholder reports of the other funds.
| | See Notes to Financial Statements. | 5 |
Please note that the expenses shown in the table are meant to highlight your ongoing costs only and do not reflect any transactional costs, such as sales charges (loads). Therefore, the second line of the table is useful in comparing ongoing costs only, and will not help you determine the relative total costs of owning different funds. In addition, if these transactional costs were included, your costs would have been higher.
| | | Beginning
Account
Value | | Ending
Account
Value | | Expenses
Paid During
Period† |
| | | 7/1/18 | | 12/31/18 | | 7/1/18 – 12/31/18 |
| Class A | | | | | | |
| Actual | | $ | 1,000.00 | | | $ | 973.50 | | | $ | 3.98 | |
| Hypothetical (5% Return Before Expenses) | | $ | 1,000.00 | | | $ | 1,021.17 | | | $ | 4.08 | |
| Class C | | | | | | | | | | | | |
| Actual | | $ | 1,000.00 | | | $ | 969.20 | | | $ | 7.15 | |
| Hypothetical (5% Return Before Expenses) | | $ | 1,000.00 | | | $ | 1,017.95 | | | $ | 7.32 | |
| Class F | | | | | | | | | | | | |
| Actual | | $ | 1,000.00 | | | $ | 972.60 | | | $ | 3.48 | |
| Hypothetical (5% Return Before Expenses) | | $ | 1,000.00 | | | $ | 1,021.68 | | | $ | 3.57 | |
| Class F3 | | | | | | | | | | | | |
| Actual | | $ | 1,000.00 | | | $ | 973.30 | | | $ | 2.59 | |
| Hypothetical (5% Return Before Expenses) | | $ | 1,000.00 | | | $ | 1,022.58 | | | $ | 2.65 | |
| Class I | | | | | | | | | | | | |
| Actual | | $ | 1,000.00 | | | $ | 972.90 | | | $ | 2.98 | |
| Hypothetical (5% Return Before Expenses) | | $ | 1,000.00 | | | $ | 1,022.18 | | | $ | 3.06 | |
| Class P | | | | | | | | | | | | |
| Actual | | $ | 1,000.00 | | | $ | 970.90 | | | $ | 4.72 | |
| Hypothetical (5% Return Before Expenses) | | $ | 1,000.00 | | | $ | 1,019.91 | | | $ | 4.84 | |
| Class R2 | | | | | | | | | | | | |
| Actual | | $ | 1,000.00 | | | $ | 970.30 | | | $ | 5.96 | |
| Hypothetical (5% Return Before Expenses) | | $ | 1,000.00 | | | $ | 1,019.16 | | | $ | 6.11 | |
| Class R3 | | | | | | | | | | | | |
| Actual | | $ | 1,000.00 | | | $ | 970.70 | | | $ | 5.46 | |
| Hypothetical (5% Return Before Expenses) | | $ | 1,000.00 | | | $ | 1,019.66 | | | $ | 5.60 | |
| Class R4 | | | | | | | | | | | | |
| Actual | | $ | 1,000.00 | | | $ | 972.00 | | | $ | 4.22 | |
| Hypothetical (5% Return Before Expenses) | | $ | 1,000.00 | | | $ | 1,020.92 | | | $ | 4.33 | |
| Class R5 | | | | | | | | | | | | |
| Actual | | $ | 1,000.00 | | | $ | 973.00 | | | $ | 2.98 | |
| Hypothetical (5% Return Before Expenses) | | $ | 1,000.00 | | | $ | 1,022.18 | | | $ | 3.06 | |
| Class R6 | | | | | | | | | | | | |
| Actual | | $ | 1,000.00 | | | $ | 973.30 | | | $ | 2.59 | |
| Hypothetical (5% Return Before Expenses) | | $ | 1,000.00 | | | $ | 1,022.58 | | | $ | 2.65 | |
| † | For each class of the Fund, net expenses are equal to the annualized expense ratio for such class (0.80% for Class A, 1.44% for Class C, 0.70% for Class F, 0.52% for Class F3, 0.60% for Class I, 0.95% for Class P, 1.20% for Class R2, 1.10% for Class R3, 0.85% for Class R4, 0.60% for Class R5 and 0.52% for Class R6) multiplied by the average account value over the period, multiplied by 184/365 (to reflect one-half year period). |
| 6 | See Notes to Financial Statements. |
Portfolio Holdings Presented by Sector
December 31, 2018
| Sector* | | | %** | |
| Asset Backed | | | 1.23 | % |
| Automotive | | | 1.05 | % |
| Banking | | | 4.38 | % |
| Basic Industry | | | 5.12 | % |
| Capital Goods | | | 3.01 | % |
| Consumer Goods | | | 5.03 | % |
| Energy | | | 7.80 | % |
| Financial Services | | | 3.64 | % |
| Foreign Government | | | 6.50 | % |
| Healthcare | | | 8.59 | % |
| Insurance | | | 1.94 | % |
| Leisure | | | 3.67 | % |
| Media | | | 4.04 | % |
| Municipal | | | 3.54 | % |
| Real Estate | | | 1.18 | % |
| Retail | | | 7.69 | % |
| Services | | | 3.08 | % |
| Technology & Electronics | | | 5.64 | % |
| Telecommunications | | | 4.33 | % |
| Transportation | | | 3.04 | % |
| U.S. Government | | | 10.13 | % |
| Utility | | | 5.21 | % |
| Repurchase Agreement | | | 0.16 | % |
| Total | | | 100.00 | % |
| * | | A sector may comprise several industries. |
| ** | | Represents percent of total investments. |
| | See Notes to Financial Statements. | 7 |
Schedule of Investments
December 31, 2018
| Investments | | Interest
Rate | | Maturity
Date | | Principal
Amount
(000) | | | Fair
Value | |
| LONG-TERM INVESTMENTS 108.56% | | | | | | | | | | | | |
| | | | | | | | | | | | | |
| ASSET-BACKED SECURITIES 2.68% | | | | | | | | | | | | |
| | | | | | | | | | | | | |
| Automobiles 0.17% | | | | | | | | | | | | |
| ACC Trust 2018-1 B† | | 4.82% | | 5/20/2021 | | $ | 6,637 | | | $ | 6,656,851 | |
| ACC Trust 2018-1 C† | | 6.81% | | 2/21/2023 | | | 5,140 | | | | 5,160,437 | |
| TCF Auto Receivables Owner Trust 2016-1A B† | | 2.32% | | 6/15/2022 | | | 8,695 | | | | 8,556,775 | |
| Westlake Automobile Receivables Trust 2016-3A B† | | 2.07% | | 12/15/2021 | | | 416 | | | | 416,128 | |
| Total | | | | | | | | | | | 20,790,191 | |
| | | | | | | | | | | | | |
| Other 2.51% | | | | | | | | | | | | |
| ALM XIX Ltd. 2016-19A C† | | 6.786%
(3 Mo. LIBOR + 4.35% | )# | 7/15/2028 | | | 4,038 | | | | 4,045,420 | |
| AMMC CLO 15 Ltd. 2014-15A DRR† | | 5.727%
(3 Mo. LIBOR + 3.40% | )# | 1/15/2032 | | | 2,514 | | | | 2,454,889 | |
| AMMC CLO XII Ltd. 2013-12A DR† | | 5.318%
(3 Mo. LIBOR + 2.70% | )# | 11/10/2030 | | | 3,859 | | | | 3,515,593 | |
| Anchorage Capital CLO 9 Ltd. 2016-9A D† | | 6.436%
(3 Mo. LIBOR + 4.00% | )# | 1/15/2029 | | | 9,600 | | | | 9,469,286 | |
| Ascentium Equipment Receivables Trust 2016-2A B† | | 2.50% | | 9/12/2022 | | | 3,705 | | | | 3,684,796 | |
| Atrium XV-15A D† | | 5.776%
(3 Mo. LIBOR + 3.00% | )# | 1/23/2031 | | | 7,286 | | | | 6,802,358 | |
| Battalion CLO VII Ltd. 2014-7A CRR† | | 5.379%
(3 Mo. LIBOR + 2.93% | )# | 7/17/2028 | | | 1,831 | | | | 1,778,711 | |
| BlueMountain CLO XXIII Ltd. 2018-23A D† | | 5.365%
(3 Mo. LIBOR + 2.90% | )# | 10/20/2031 | | | 4,348 | | | | 4,076,922 | |
| Cedar Funding VI CLO Ltd. 2016-6A BR† | | 4.069%
(3 Mo. LIBOR + 1.60% | )# | 10/20/2028 | | | 2,600 | | | | 2,536,483 | |
| Cedar Funding VI CLO Ltd. 2016-6A DR† | | 5.469%
(3 Mo. LIBOR + 3.00% | )# | 10/20/2028 | | | 7,699 | | | | 7,211,757 | |
| Cent CLO 21 Ltd. 2014-21A CR2† | | 5.709%
(3 Mo. LIBOR + 3.20% | )# | 7/27/2030 | | | 4,936 | | | | 4,605,472 | |
| Conn’s Receivables Funding LLC 2017-B C† | | 5.95% | | 11/15/2022 | | | 23,832 | | | | 24,214,084 | |
| Galaxy XXI CLO Ltd. 2015-21A AR† | | 3.489%
(3 Mo. LIBOR + 1.02% | )# | 4/20/2031 | | | 5,311 | | | | 5,241,542 | |
| Halcyon Loan Advisors Funding Ltd. 2015-2A CR† | | 4.64%
(3 Mo. LIBOR + 2.15% | )# | 7/25/2027 | | | 5,476 | | | | 5,312,989 | |
| Harbor Park CLO 18-1 Ltd. 2018-1A D† | | 5.739%
(3 Mo. LIBOR + 2.90% | )# | 1/20/2031 | | | 4,560 | | | | 4,221,251 | |
| Hardee’s Funding LLC 2018-1A A2II† | | 4.959% | | 6/20/2048 | | | 38,186 | | | | 38,938,565 | |
| Jamestown CLO VII Ltd. 2015-7A BR† | | 4.14%
(3 Mo. LIBOR + 1.65% | )# | 7/25/2027 | | | 12,548 | | | | 11,893,323 | |
| KKR CLO 15 Ltd-15 DR† | | 5.592%
(3 Mo. LIBOR + 3.15% | )# | 1/18/2032 | | | 2,736 | | | | 2,615,473 | |
| 8 | See Notes to Financial Statements. | |
Schedule of Investments (continued)
December 31, 2018
| Investments | | Interest
Rate | | Maturity
Date | | Principal
Amount
(000) | | | Fair
Value | |
| Other (continued) | | | | | | | | | | | | |
| Madison Park Funding XIV Ltd. 2014-14A DRR† | | 5.419%
(3 Mo. LIBOR + 2.95% | )# | 10/22/2030 | | $ | 3,923 | | | $ | 3,693,748 | |
| Mariner CLO 2015-1 LLC 2015-1A DR† | | 6.119%
(3 Mo. LIBOR + 3.65% | )# | 4/20/2029 | | | 2,277 | | | | 2,218,896 | |
| Mariner CLO LLC 2017-4A D† | | 5.558%
(3 Mo. LIBOR + 3.05% | )# | 10/26/2029 | | | 6,254 | | | | 5,912,035 | |
| Mountain View CLO X Ltd. 2015-10A BR† | | 3.786%
(3 Mo. LIBOR + 1.35% | )# | 10/13/2027 | | | 13,725 | | | | 13,430,516 | |
| Octagon Investment Partners 39 Ltd. 2018-3A D† | | 5.415%
(3 Mo. LIBOR + 2.95% | )# | 10/20/2030 | | $ | 3,789 | | | $ | 3,566,070 | |
| Palmer Square Loan Funding Ltd. 2018-1A A1† | | 3.036%
(3 Mo. LIBOR + .60% | )# | 4/15/2026 | | | 25,600 | | | | 25,445,768 | |
| Palmer Square Loan Funding Ltd. 2018-1A A2† | | 3.486%
(3 Mo. LIBOR + 1.05% | )# | 4/15/2026 | | | 9,660 | | | | 9,250,845 | |
| Palmer Square Loan Funding Ltd. 2018-1A B† | | 3.836%
(3 Mo. LIBOR + 1.40% | )# | 4/15/2026 | | | 5,069 | | | | 4,745,568 | |
| Planet Fitness Master Issuer LLC 2018-1A A2I† | | 4.262% | | 9/5/2048 | | | 17,994 | | | | 18,111,901 | |
| Planet Fitness Master Issuer LLC 2018-1A A2II† | | 4.666% | | 9/5/2048 | | | 22,493 | | | | 22,821,515 | |
| Regatta VI Funding Ltd. 2016-1A DR† | | 5.169%
(3 Mo. LIBOR + 2.70% | )# | 7/20/2028 | | | 2,216 | | | | 2,086,252 | |
| Sound Point CLO XI Ltd. 2016-1A DR† | | 5.408%
(3 Mo. LIBOR + 2.95% | )# | 7/20/2028 | | | 6,840 | | | | 6,684,850 | |
| THL Credit Wind River CLO Ltd. 2018-3A D† | | 5.776%
(3 Mo. LIBOR + 2.95% | )# | 1/20/2031 | | | 7,164 | | | | 6,658,883 | |
| Voya CLO Ltd. 2016-2A C† | | 6.70%
(3 Mo. LIBOR + 4.25% | )# | 7/19/2028 | | | 5,250 | | | | 5,251,807 | |
| West CLO Ltd. 2014-2A BR† | | 4.186%
(3 Mo. LIBOR + 1.75% | )# | 1/16/2027 | | | 4,541 | | | | 4,420,961 | |
| Westcott Park CLO Ltd. 2016-1A D† | | 6.819%
(3 Mo. LIBOR + 4.35% | )# | 7/20/2028 | | | 8,150 | | | | 8,161,774 | |
| Wingstop Funding LLC 2018-1 A2† | | 4.97% | | 12/5/2048 | | | 19,747 | | | | 20,218,953 | |
| Total | | | | | | | | | | | 305,299,256 | |
| Total Asset-Backed Securities (cost $330,207,336) | | | | | | | | | | | 326,089,447 | |
| | | | | | | | | | | | | |
| | | | | | | Shares
(000) | | | | | |
| COMMON STOCKS 9.37% | | | | | | | | | | | | |
| | | | | | | | | | | | | |
| Aerospace/Defense 0.11% | | | | | | | | | | | | |
| HEICO Corp. | | | | | | | 170 | | | | 13,197,633 | |
| | | | | | | | | | | | | |
| Air Transportation 0.26% | | | | | | | | | | | | |
| Alaska Air Group, Inc. | | | | | | | 318 | | | | 19,346,527 | |
| Spirit Airlines, Inc.* | | | | | | | 217 | | | | 12,581,672 | |
| Total | | | | | | | | | | | 31,928,199 | |
| | See Notes to Financial Statements. | 9 |
Schedule of Investments (continued)
December 31, 2018
| Investments | | | | | | Shares
(000) | | | Fair
Value | |
| Auto Parts & Equipment 0.13% | | | | | | | | | | | | |
| Chassix Holdings, Inc. | | | | | | | 607 | | | $ | 15,176,425 | |
| | | | | | | | | | | | | |
| Banking 0.35% | | | | | | | | | | | | |
| American Express Co. | | | | | | | 249 | | | | 23,735,442 | |
| Western Alliance Bancorp* | | | | | | | 478 | | | | 18,863,544 | |
| Total | | | | | | | | | | | 42,598,986 | |
| | | | | | | | | | | | | |
| Beverages 0.10% | | | | | | | | | | | | |
| Pernod Ricard SA(a) | | | | | | EUR | 77 | | | | 12,577,204 | |
| | | | | | | | | | | | | |
| Building & Construction 0.10% | | | | | | | | | | | | |
| PulteGroup, Inc. | | | | | | | 478 | | | | 12,427,898 | |
| | | | | | | | | | | | | |
| Building Materials 0.21% | | | | | | | | | | | | |
| RPM International, Inc. | | | | | | | 210 | | | | 12,347,091 | |
| Vulcan Materials Co. | | | | | | | 134 | | | | 13,252,143 | |
| Total | | | | | | | | | | | 25,599,234 | |
| | | | | | | | | | | | | |
| Chemicals 0.10% | | | | | | | | | | | | |
| Ecolab, Inc. | | | | | | | 85 | | | | 12,473,030 | |
| | | | | | | | | | | | | |
| Discount Stores 0.12% | | | | | | | | | | | | |
| Amazon.com, Inc.* | | | | | | | 10 | | | | 14,893,535 | |
| | | | | | | | | | | | | |
| Diversified Capital Goods 0.11% | | | | | | | | | | | | |
| Dover Corp. | | | | | | | 183 | | | | 13,015,423 | |
| | | | | | | | | | | | | |
| Electric: Generation 0.10% | | | | | | | | | | | | |
| AES Corp. | | | | | | | 878 | | | | 12,691,976 | |
| | | | | | | | | | | | | |
| Electric: Integrated 0.52% | | | | | | | | | | | | |
| Ameren Corp. | | | | | | | 276 | | | | 18,007,263 | |
| Eneva SA*(a) | | | | | | BRL | 33 | | | | 117,832 | |
| OGE Energy Corp. | | | | | | | 628 | | | | 24,598,309 | |
| Portland General Electric Co. | | | | | | | 438 | | | | 20,073,267 | |
| Total | | | | | | | | | | | 62,796,671 | |
| | | | | | | | | | | | | |
| Electronics 0.17% | | | | | | | | | | | | |
| Zebra Technologies Corp. Class A* | | | | | | | 128 | | | | 20,398,955 | |
| | | | | | | | | | | | | |
| Energy: Exploration & Production 0.17% | | | | | | | | | | | | |
| Chaparral Energy, Inc. Class A* | | | | | | | 541 | | | | 2,662,350 | |
| MEG Energy Corp.*(a) | | | | | | CAD | 3,213 | | | | 18,143,050 | |
| Templar Energy LLC Class A Units | | | | | | | 417 | | | | 260,514 | |
| Total | | | | | | | | | | | 21,065,914 | |
| 10 | See Notes to Financial Statements. | |
Schedule of Investments (continued)
December 31, 2018
| Investments | | | | | | Shares
(000) | | | Fair
Value | |
| Food & Drug Retailers 0.16% | | | | | | | | | | |
| Kroger Co. (The) | | | | | | | 688 | | | $ | 18,926,298 | |
| | | | | | | | | | | | | |
| Food: Wholesale 0.35% | | | | | | | | | | | | |
| Lamb Weston Holdings, Inc. | | | | | | | 257 | | | | 18,940,155 | |
| McCormick & Co., Inc. | | | | | | | 172 | | | | 24,006,647 | |
| Total | | | | | | | | | | | 42,946,802 | |
| | | | | | | | | | | | | |
| Gas Distribution 0.15% | | | | | | | | | | | | |
| Dommo Energia SA*(a) | | | | | | BRL | 3,526 | | | | 757,898 | |
| ONE Gas, Inc. | | | | | | | 226 | | | | 18,024,385 | |
| Total | | | | | | | | | | | 18,782,283 | |
| | | | | | | | | | | | | |
| Health Facilities 0.25% | | | | | | | | | | | | |
| HCA Healthcare, Inc. | | | | | | | 242 | | | | 30,108,189 | |
| | | | | | | | | | | | | |
| Health Services 0.10% | | | | | | | | | | | | |
| PRA Health Sciences, Inc.* | | | | | | | 132 | | | | 12,162,446 | |
| | | | | | | | | | | | | |
| Insurance Brokerage 0.16% | | | | | | | | | | | | |
| Aon plc (United Kingdom)(b) | | | | | | | 133 | | | | 19,361,807 | |
| | | | | | | | | | | | | |
| Investments & Miscellaneous Financial Services 0.69% | | | | | | | | |
| Arthur J Gallagher & Co. | | | | | | | 342 | | | | 25,170,466 | |
| BlackRock, Inc. | | | | | | | 33 | | | | 13,002,342 | |
| CME Group, Inc. | | | | | | | 110 | | | | 20,738,349 | |
| FactSet Research Systems, Inc. | | | | | | | 65 | | | | 12,954,215 | |
| Thomson Reuters Corp. (Canada)(b) | | | | | | | 259 | | | | 12,515,623 | |
| Total | | | | | | | | | | | 84,380,995 | |
| | | | | | | | | | | | | |
| Machinery 0.11% | | | | | | | | | | | | |
| Roper Technologies, Inc. | | | | | | | 48 | | | | 12,766,841 | |
| | | | | | | | | | | | | |
| Media: Content 0.13% | | | | | | | | | | | | |
| AMC Networks, Inc. Class A* | | | | | | | 242 | | | | 13,304,613 | |
| ION Media Networks, Inc. | | | | | | | 4 | | | | 2,651,730 | (c) |
| Total | | | | | | | | | | | 15,956,343 | |
| | | | | | | | | | | | | |
| Media: Diversified 0.16% | | | | | | | | | | | | |
| Walt Disney Co. (The) | | | | | | | 182 | | | | 20,003,450 | |
| | | | | | | | | | | | | |
| Medical Products 0.16% | | | | | | | | | | | | |
| Edwards Lifesciences Corp.* | | | | | | | 127 | | | | 19,404,035 | |
| | See Notes to Financial Statements. | 11 |
Schedule of Investments (continued)
December 31, 2018
| Investments | | | | | | Shares
(000) | | | Fair
Value | |
| Packaging 0.20% | | | | | | | | | | | | |
| AptarGroup, Inc. | | | | | | | 265 | | | $ | 24,888,288 | |
| | | | | | | | | | | | | |
| Personal & Household Products 0.33% | | | | | | | | | | | | |
| Church & Dwight Co., Inc. | | | | | | | 226 | | | | 14,849,200 | |
| Gibson Brands, Inc. | | | | | | | 105 | | | | 10,527,700 | (d) |
| Procter & Gamble Co. (The) | | | | | | | 139 | | | | 12,811,809 | |
| Remington Outdoor Co., Inc.* | | | | | | | 164 | | | | 1,596,543 | |
| Total | | | | | | | | | | | 39,785,252 | |
| | | | | | | | | | | | | |
| Pharmaceuticals 0.36% | | | | | | | | | | | | |
| Amgen, Inc. | | | | | | | 67 | | | | 12,998,700 | |
| Canopy Growth Corp.*(a) | | | | | | CAD | 409 | | | | 10,974,204 | |
| Eli Lilly & Co. | | | | | | | 166 | | | | 19,196,212 | |
| Total | | | | | | | | | | | 43,169,116 | |
| | | | | | | | | | | | | |
| Real Estate Investment Trusts 0.26% | | | | | | | | | | | | |
| Americold Realty Trust | | | | | | | 733 | | | | 18,713,158 | |
| Medical Properties Trust, Inc. | | | | | | | 829 | | | | 13,337,427 | |
| Total | | | | | | | | | | | 32,050,585 | |
| | | | | | | | | | | | | |
| Restaurants 0.40% | | | | | | | | | | | | |
| Shake Shack, Inc. Class A* | | | | | | | 663 | | | | 30,122,272 | |
| Texas Roadhouse, Inc. | | | | | | | 320 | | | | 19,079,463 | |
| Total | | | | | | | | | | | 49,201,735 | |
| | | | | | | | | | | | | |
| Software/Services 0.77% | | | | | | | | | | | | |
| Atlassian Corp. plc Class A (Australia)*(b) | | | | | | | 388 | | | | 34,514,363 | |
| MongoDB, Inc.* | | | | | | | 172 | | | | 14,363,252 | |
| Tableau Software, Inc. Class A* | | | | | | | 164 | | | | 19,735,800 | |
| Trade Desk, Inc. (The) Class A* | | | | | | | 211 | | | | 24,481,929 | |
| Total | | | | | | | | | | | 93,095,344 | |
| | | | | | | | | | | | | |
| Specialty Retail 1.19% | | | | | | | | | | | | |
| Claires Holdings LLC | | | | | | | 15 | | | | 12,700,162 | |
| Columbia Sportswear Co. | | | | | | | 302 | | | | 25,415,194 | |
| Deckers Outdoor Corp.* | | | | | | | 256 | | | | 32,737,415 | |
| Etsy, Inc.* | | | | | | | 316 | | | | 15,053,003 | |
| Lululemon Athletica, Inc. (Canada)*(b) | | | | | | | 160 | | | | 19,398,011 | |
| NIKE, Inc. Class B | | | | | | | 358 | | | | 26,574,000 | |
| Ollie’s Bargain Outlet Holdings, Inc.* | | | | | | | 191 | | | | 12,688,179 | |
| Total | | | | | | | | | | | 144,565,964 | |
| 12 | See Notes to Financial Statements. | |
Schedule of Investments (continued)
December 31, 2018
| Investments | | | | | | Shares
(000) | | | Fair
Value | |
| Support: Services 0.26% | | | | | | | | | | | | |
| Bright Horizons Family Solutions, Inc.* | | | | | | | 174 | | | $ | 19,359,534 | |
| TripAdvisor, Inc.* | | | | | | | 234 | | | | 12,605,778 | |
| Total | | | | | | | | | | | 31,965,312 | |
| | | | | | | | | | | | | |
| Technology Hardware & Equipment 0.11% | | | | | | | | | | | | |
| Cisco Systems, Inc. | | | | | | | 298 | | | | 12,924,689 | |
| | | | | | | | | | | | | |
| Telecommunications: Wireless 0.25% | | | | | | | | | | | | |
| American Tower Corp. | | | | | | | 196 | | | | 30,955,094 | |
| | | | | | | | | | | | | |
| Theaters & Entertainment 0.27% | | | | | | | | | | | | |
| Live Nation Entertainment, Inc.* | | | | | | | 396 | | | | 19,515,460 | |
| Tencent Music Entertainment Group ADR* | | | | | | | 989 | | | | 13,072,624 | |
| Total | | | | | | | | | | | 32,588,084 | |
| Total Common Stocks (cost $1,207,813,193) | | | | | | | | | | | 1,140,830,035 | |
| | | | | | | | | | | | | |
| | | Interest
Rate | | Maturity
Date | | Principal
Amount
(000) | | | | | |
| CONVERTIBLE BONDS 0.49% | | | | | | | | | | | | |
| | | | | | | | | | | | | |
| Automakers 0.16% | | | | | | | | | | | | |
| Tesla, Inc. | | 1.25% | | 3/1/2021 | | $ | 17,223 | | | | 19,389,843 | |
| | | | | | | | | | | | | |
| Software/Services 0.33% | | | | | | | | | | | | |
| Twilio, Inc.† | | 0.25% | | 6/1/2023 | | | 14,414 | | | | 20,612,467 | |
| Weibo Corp. (China)†(b) | | 1.25% | | 11/15/2022 | | | 21,409 | | | | 19,559,904 | |
| Total | | | | | | | | | | | 40,172,371 | |
| Total Convertible Bonds (cost $59,167,563) | | | | | | | | | | | 59,562,214 | |
| | | | | | | | | | | | | |
| FLOATING RATE LOANS(e)6.61% | | | | | | | | | | | | |
| | | | | | | | | | | | | |
| Air Transportation 0.21% | | | | | | | | | | | | |
| American Airlines, Inc. 2018 Replacement Term Loan | 4.256%
(1 Mo. LIBOR + 1.75% | ) | 6/27/2025 | | | 27,044 | | | | 25,421,360 | |
| | | | | | | | | | | | | |
| Department Stores 0.25% | | | | | | | | | | | | |
| Belk, Inc. 1st Lien Closing Date Term Loan | 7.365%
(3 Mo. LIBOR + 4.75% | ) | 12/12/2022 | | | 15,577 | | | | 12,638,984 | |
| Neiman Marcus Group Ltd LLC Other Term Loan | 5.63%
(3 Mo. LIBOR + 3.25% | ) | 10/25/2020 | | | 21,160 | | | | 17,953,060 | |
| Total | | | | | | | | | | | 30,592,044 | |
| | See Notes to Financial Statements. | 13 |
Schedule of Investments (continued)
December 31, 2018
| Investments | | Interest
Rate | | Maturity
Date | | Principal
Amount
(000) | | | Fair
Value | |
| Diversified Capital Goods 0.07% | | | | | | | | | | | | |
| Graftech International Ltd. Initial Term Loan | | 6.022%
(1 Mo. LIBOR + 3.50% | ) | 2/12/2025 | | $ | 8,550 | | | $ | 8,111,344 | (f) |
| | | | | | | | | | | | | |
| Electric: Generation 0.71% | | | | | | | | | | | | |
| Astoria Energy LLC Advance Term Loan B | | 6.53%
(3 Mo. LIBOR + 4.00% | ) | 12/24/2021 | | | 16,262 | | | | 16,021,926 | |
| Frontera Generation Holdings LLC Initial Term Loan | | 6.629%
(3 Mo. LIBOR + 4.25% | ) | 5/2/2025 | | | 13,281 | | | | 12,816,085 | |
| Helix Gen Funding, LLC Term Loan | | – | (g) | 6/3/2024 | | | 2,762 | | | | 2,592,756 | |
| Lightstone Holdco LLC Refinancing Term Loan B | | 6.272%
(3 Mo. LIBOR + 3.75% | ) | 1/30/2024 | | | 23,196 | | | | 22,017,017 | |
| Lightstone Holdco LLC Refinancing Term Loan C | | 6.272%
(3 Mo. LIBOR + 3.75% | ) | 1/30/2024 | | | 1,246 | | | | 1,182,519 | |
| Longview Power, LLC Advance Term Loan B | | – | (g) | 4/13/2021 | | | 2,247 | | | | 1,904,484 | |
| Moxie Patriot LLC Construction Advances Term Loan B1 | | 8.553%
(3 Mo. LIBOR + 5.75% | ) | 12/19/2020 | | | 2,355 | | | | 2,311,223 | |
| Moxie Patriot LLC Construction Advances Term Loan B2 | | 8.553%
(3 Mo. LIBOR + 5.75% | ) | 12/19/2020 | | | 12,621 | | | | 12,384,578 | |
| Edgewater Generation, L.L.C. Term Loan | | 6.272%
(3 Mo. LIBOR + 3.75% | ) | 12/13/2025 | | | 15,043 | | | | 14,760,944 | |
| Total | | | | | | | | | | | 85,991,532 | |
| | | | | | | | | | | | | |
| Electronics 0.13% | | | | | | | | | | | | |
| EXC Holdings III Corp. 1st Lien Initial Dollar Term Loan | 6.303%
(3 Mo. LIBOR + 3.50% | ) | 12/2/2024 | | | 15,841 | | | | 15,326,361 | |
| | | | | | | | | | | | | |
| Food: Wholesale 0.39% | | | | | | | | | | | | |
| H-Food Holdings, LLC Initial Term Loan | | 6.21%
(3 Mo. LIBOR + 3.69% | ) | 5/23/2025 | | | 13,197 | | | | 12,695,223 | |
| Post Holdings, Inc. Incremental Term Loan | | – | (g) | 5/24/2024 | | | 36,053 | | | | 34,836,211 | |
| Total | | | | | | | | | | | 47,531,434 | |
| | | | | | | | | | | | | |
| Gaming 0.42% | | | | | | | | | | | | |
| MGM Growth Properties Operating Partnership LP Term Loan B | | – | (g) | 3/21/2025 | | | 26,975 | | | | 25,924,668 | |
| VICI Properties 1 LLC Term Loan B | | – | (g) | 12/20/2024 | | | 27,044 | | | | 25,915,859 | |
| Total | | | | | | | | | | | 51,840,527 | |
| | | | | | | | | | | | | |
| Gas Distribution 0.11% | | | | | | | | | | | | |
| NorthRiver Midstream Finance LP Initial Term Loan B (Canada) | | 5.646%
(3 Mo. LIBOR + 3.25% | ) | 10/1/2025 | | | 13,700 | | | | 13,408,886 | |
| 14 | See Notes to Financial Statements. | |
Schedule of Investments (continued)
December 31, 2018
| Investments | | Interest
Rate | | Maturity
Date | | Principal
Amount
(000) | | | Fair
Value | |
| Health Services 0.21% | | | | | | | | | | | | |
| Regionalcare Hospital Partners Holdings, Inc. 1st Lien Term Loan B | | 7.129%
(3 Mo. LIBOR + 4.50% | ) | 11/16/2025 | | $ | 27,086 | | | $ | 25,774,090 | |
| | | | | | | | | | | | | |
| Insurance Brokerage 0.14% | | | | | | | | | | | | |
| Hub International Limited Initial Term Loan | | 5.24%
(3 Mo. LIBOR + 3.00% | ) | 4/25/2025 | | | 18,164 | | | | 17,201,683 | |
| | | | | | | | | | | | | |
| Investments & Miscellaneous Financial Services 0.21% | | | | | | | | | | | | |
| Edelman Financial Center, LLC, (The) 1st Lien Initial Term Loan | | 5.686%
(3 Mo. LIBOR + 3.25% | ) | 7/21/2025 | | | 6,948 | | | | 6,714,721 | |
| Vertafore, Inc. 1st Lien Initial Term Loan | | 6.053%
(3 Mo. LIBOR + 3.25% | ) | 7/2/2025 | | | 19,457 | | | | 18,551,264 | |
| Total | | | | | | | | | | | 25,265,985 | |
| | | | | | | | | | | | | |
| Media: Content 0.02% | | | | | | | | | | | | |
| Univision Communications Inc. 2017 1st Lien Replacement Repriced Term Loan | | – | (g) | 3/15/2024 | | | 2,303 | | | | 2,095,659 | |
| | | | | | | | | | | | | |
| Oil Field Equipment & Services 0.13% | | | | | | | | | | | | |
| Apergy Corp. Initial Term Loan | | 5.063%
(1 Mo. LIBOR + 2.50% | ) | 5/9/2025 | | | 17,069 | | | | 16,087,616 | (f) |
| | | | | | | | | | | | | |
| Personal & Household Products 0.60% | | | | | | | | | | | | |
| Anastasia Parent, LLC Closing Date Term Loan | | 6.272%
(1 Mo. LIBOR + 3.75% | ) | 8/11/2025 | | | 26,412 | | | | 25,025,185 | (f) |
| Britax U.S. Holdings Inc. Initial Dollar Term Loan | 6.303%
(3 Mo. LIBOR + 3.50% | ) | 10/15/2020 | | | 15,264 | | | | 11,931,492 | |
| Energizer Holdings, Inc. Bridge Term Loan | | – | (g) | 6/30/2022 | | | 10,441 | | | | 10,441,000 | |
| FGI Operating Company, LLC Exit Term Loan | | 12.616%
(3 Mo. LIBOR + 10.00% | ) | 5/15/2022 | | | 1,005 | | | | 1,005,238 | (f) |
| Revlon Consumer Products Corp. Initial Term Loan B | | 6.207%
(3 Mo. LIBOR + 3.50% | ) | 9/7/2023 | | | 16,487 | | | | 11,805,922 | |
| TGP Holdings III LLC 1st Lien 2018 Refinancing Term Loan | | 7.053%
(3 Mo. LIBOR + 4.25% | ) | 9/25/2024 | | | 13,456 | | | | 12,934,566 | |
| Total | | | | | | | | | | | 73,143,403 | |
| | | | | | | | | | | | | |
| Recreation & Travel 0.42% | | | | | | | | | | | | |
| Intrawest Resorts Holdings, Inc. Initial Bluebird Term Loan | | 5.506%
(1 Mo. LIBOR + 3.00% | ) | 7/31/2024 | | | 27,486 | | | | 26,432,242 | |
| Kingpin Intermediate Holdings LLC 1st Lien Refinancing Term Loan | | 6.02%
(1 Mo. LIBOR + 3.50% | ) | 7/3/2024 | | | 12,746 | | | | 12,411,156 | |
| Silk Bidco AS Facility Term Loan B(a) | | 3.75%
(6 Mo. Euribor + 4.00% | ) | 2/22/2025 | | EUR | 10,916 | | | | 12,400,131 | |
| Total | | | | | | | | | | | 51,243,529 | |
| | See Notes to Financial Statements. | 15 |
Schedule of Investments (continued)
December 31, 2018
| Investments | | Interest
Rate | | Maturity
Date | | Principal
Amount
(000) | | | Fair
Value | |
| Restaurants 0.40% | | | | | | | | | | | | |
| CEC Entertainment, Inc. Term Loan B | | 5.772%
(1 Mo. LIBOR + 3.25% | ) | 2/12/2021 | | $ | 14,252 | | | $ | 13,230,178 | |
| IRB Holding Corp. Term Loan B | | 5.682%
(1 Mo. LIBOR + 3.25% | ) | 2/5/2025 | | | 19,501 | | | | 18,643,267 | |
| Panera Bread Co. Term Loan | | 4.25%
(1 Mo. LIBOR + 1.75% | ) | 7/18/2022 | | | 17,335 | | | | 16,749,687 | |
| Total | | | | | | | | | | | 48,623,132 | |
| | | | | | | | | | | | | |
| Specialty Retail 1.08% | | | | | | | | | | | | |
| Ascena Retail Group, Inc. Tranche B Term Loan | | 7.063%
(3 Mo. LIBOR + 4.50% | ) | 8/21/2022 | | | 12,286 | | | | 11,465,725 | |
| Bass Pro Group, LLC Initial Term Loan | | 7.522%
(1 Mo. LIBOR + 5.00% | ) | 9/25/2024 | | | 12,941 | | | | 12,436,530 | |
| BJ’s Wholesale Club, Inc. 1st Lien Tranche B Term Loan | | 5.432%
(1 Mo. LIBOR + 3.00% | ) | 2/3/2024 | | | 25,364 | | | | 24,726,542 | |
| Boardriders, Inc. Initial Term Loan | | 9.022%
(1 Mo. LIBOR + 6.50% | ) | 4/23/2024 | | | 15,604 | | | | 15,564,581 | |
| Claire’s Stores, Inc. Revolving Credit Term Loan | | – | (g) | 9/22/2022 | | | 720 | | | | 719,580 | (f) |
| Claire’s Stores, Inc. Term Loan | | 8.631%
(1 Mo. LIBOR + 6.25% | ) | 9/15/2038 | | | 2,399 | | | | 3,757,930 | |
| EG Group Limited Additional Facility Term Loan (United Kingdom)(b) | 6.813%
(3 Mo. LIBOR +4.00% | ) | 2/7/2025 | | | 9,932 | | | | 9,596,988 | |
| EG Group Limited Facility Term Loan B (United Kingdom)(b) | | 6.813%
(3 Mo. LIBOR + 4.00% | ) | 2/7/2025 | | | 7,916 | | | | 7,648,779 | |
| GOBP Holdings, Inc. 1st Lien Initial Term Loan | | – | (g) | 10/22/2025 | | | 15,812 | | | | 15,495,299 | |
| J. Crew Group, Inc. Amended Term Loan | | 5.742%
(3 Mo. LIBOR + 3.22%) - 6.023% | | 3/5/2021 | | | 16,873 | | | | 13,376,445 | |
| Mavis Tire Express Services Corp. 1st Lien Closing Date Term Loan | | 5.754%
(1 Mo. LIBOR + 3.25% | ) | 3/20/2025 | | | 14,975 | | | | 14,488,572 | |
| Mavis Tire Express Services Corp. 1st Lien Delayed Draw Term Loan | | 5.754%
(1 Mo. LIBOR + 3.25% | ) | 3/20/2025 | | | 2,413 | | | | 2,334,919 | |
| Total | | | | | | | | | | | 131,611,890 | |
| | | | | | | | | | | | | |
| Support: Services 0.55% | | | | | | | | | | | | |
| AVSC Holding Corp. 1st Lien Initial Term Loan | | 6.00%
(1 Mo. LIBOR +3.25%) - 6.053 | | 3/1/2025 | | | 12,815 | | | | 12,185,103 | |
| Pike Corp. Initial Term Loan | | 6.03%
(3 Mo. LIBOR + 3.50% | ) | 3/23/2025 | | | 18,633 | | | | 18,295,074 | |
| Southern Graphics Inc. 1st Lien Refinancing Term Loan | | 5.745%
(2 Mo. LIBOR + 3.25% | ) | 12/31/2022 | | | 18,187 | | | | 17,156,148 | |
| Trans Union LLC 2018 Incremental Term Loan B4 | | 4.522%
(1 Mo. LIBOR +2.00% | ) | 6/19/2025 | | | 19,749 | | | | 19,103,194 | |
| Total | | | | | | | | | | | 66,739,519 | |
| 16 | See Notes to Financial Statements. | |
Schedule of Investments (continued)
December 31, 2018
| Investments | | Interest
Rate | | Maturity
Date | | Principal
Amount
(000) | | | Fair
Value | |
| Telecommunications: Wireless 0.21% | | | | | | | | | | | | |
| Sprint Communications, Inc. Initial Term Loan | | 5.063%
(1 Mo. LIBOR + 2.50% | ) | 2/2/2024 | | $ | 26,975 | | | $ | 25,739,080 | |
| | | | | | | | | | | | | |
| Theaters & Entertainment 0.25% | | | | | | | | | | | | |
| SeaWorld Parks & Entertainment, Inc. Term Loan B5 | | 5.522%
(1 Mo. LIBOR + 3.00% | ) | 3/31/2024 | | | 32,247 | | | | 30,870,607 | |
| | | | | | | | | | | | | |
| Transportation: Infrastructure/Services 0.10% | | | | | | | | | | | | |
| Commercial Barge Line Co. Initial Term Loan | | 11.272%
(1 Mo. LIBOR + 8.75% | ) | 11/12/2020 | | | 16,686 | | | | 12,114,014 | |
| Total Floating Rate Loans (cost $832,075,829) | | | | | | | | | | | 804,733,695 | |
| | | | | | | | | | | | | |
| FOREIGN BONDS(a)0.20% | | | | | | | | | | | | |
| | | | | | | | | | | | | |
| France 0.10% | | | | | | | | | | | | |
| CMA CGM SA† | | 5.25% | | 1/15/2025 | | EUR | 13,210 | | | | 12,698,864 | |
| | | | | | | | | | | | | |
| Netherlands 0.10% | | | | | | | | | | | | |
| Hema Bondco I BV† | | 6.25%
(3 Mo. Euribor + 6.25% | )# | 7/15/2022 | | EUR | 12,774 | | | | 12,484,050 | |
| Total Foreign Bonds (cost $28,995,725) | | | | | | | | | | | 25,182,914 | |
| | | | | | | | | | | | | |
| FOREIGN GOVERNMENT OBLIGATIONS 7.18% | | | | | | | | | | | | |
| Abu Dhabi Government International†(b) | | 3.125% | | 5/3/2026 | | $ | 47,836 | | | | 46,341,843 | |
| Arab Republic of Egypt†(b) | | 5.577% | | 2/21/2023 | | | 39,734 | | | | 37,761,048 | |
| Australian Government(a) | | 4.25% | | 4/21/2026 | | AUD | 26,802 | | | | 21,479,956 | |
| Bahrain Government International Bond†(b) | | 6.75% | | 9/20/2029 | | $ | 21,000 | | | | 20,631,219 | |
| City of Buenos Aires†(b) | | 7.50% | | 6/1/2027 | | | 16,064 | | | | 13,694,560 | |
| Development Bank of Mongolia LLC†(b) | | 7.25% | | 10/23/2023 | | | 26,519 | | | | 26,069,238 | |
| Federal Republic of Brazil(b) | | 4.625% | | 1/13/2028 | | | 40,519 | | | | 39,030,332 | |
| Government of Bermuda† | | 4.138% | | 1/3/2023 | | | 14,720 | | | | 14,958,022 | |
| Government of Bermuda† | | 4.75% | | 2/15/2029 | | | 12,997 | | | | 13,256,940 | |
| Government of Bermuda† | | 4.854% | | 2/6/2024 | | | 6,410 | | | | 6,693,130 | |
| Government of Jamaica(b) | | 6.75% | | 4/28/2028 | | | 22,327 | | | | 23,889,890 | |
| Government of Jamaica(b) | | 8.00% | | 3/15/2039 | | | 23,326 | | | | 26,824,900 | |
| Hellenic Republic†(a) | | 4.375% | | 8/1/2022 | | EUR | 14,317 | | | | 17,080,597 | |
| Honduras Government†(b) | | 6.25% | | 1/19/2027 | | $ | 19,384 | | | | 19,240,558 | |
| Ivory Coast Bond†(b) | | 5.375% | | 7/23/2024 | | | 28,894 | | | | 26,572,945 | |
| Province of British Columbia Canada(a) | | 2.85% | | 6/18/2025 | | CAD | 44,800 | | | | 33,396,871 | |
| Province of Santa Fe†(b) | | 6.90% | | 11/1/2027 | | $ | 17,773 | | | | 13,196,452 | |
| Provincia de Cordoba†(b) | | 7.125% | | 6/10/2021 | | | 15,068 | | | | 13,335,180 | |
| Provincia de Cordoba†(b) | | 7.45% | | 9/1/2024 | | | 11,998 | | | | 9,838,360 | |
| Provincia de Mendoza†(b) | | 8.375% | | 5/19/2024 | | | 27,674 | | | | 22,554,310 | |
| | See Notes to Financial Statements. | 17 |
Schedule of Investments (continued)
December 31, 2018
| Investments | | Interest
Rate | | Maturity
Date | | Principal
Amount
(000) | | | Fair
Value | |
| Queensland Treasury Corp.†(a) | | 4.00% | | 6/21/2019 | | AUD | 22,400 | | | $ | 15,919,607 | |
| Republic of Ecuador†(b) | | 8.875% | | 10/23/2027 | | $ | 49,199 | | | | 42,495,636 | |
| Republic of Angola†(b) | | 8.25% | | 5/9/2028 | | | 12,699 | | | | 11,992,999 | |
| Republic of Argentina(b) | | 6.875% | | 4/22/2021 | | | 21,391 | | | | 19,407,199 | |
| Republic of Chile(b) | | 3.125% | | 1/21/2026 | | | 27,092 | | | | 26,211,104 | |
| Republic of EI Salvador†(b) | | 6.375% | | 1/18/2027 | | | 27,126 | | | | 24,949,138 | |
| Republic of Kenya†(b) | | 7.25% | | 2/28/2028 | | | 22,576 | | | | 20,239,881 | |
| Republic of Kenya†(b) | | 8.25% | | 2/28/2048 | | | 14,447 | | | | 12,352,416 | |
| Republic of Paraguay†(b) | | 5.60% | | 3/13/2048 | | | 27,485 | | | | 27,141,437 | |
| Republic of Senegal†(b) | | 6.25% | | 7/30/2024 | | | 18,776 | | | | 18,292,800 | |
| Republic of South Africa(b) | | 4.30% | | 10/12/2028 | | | 22,575 | | | | 20,159,475 | |
| Republic of Sri Lanka(b) | | 6.825% | | 7/18/2026 | | | 24,464 | | | | 22,694,103 | |
| Republic of Suriname†(b) | | 9.25% | | 10/26/2026 | | | 14,321 | | | | 13,855,567 | |
| Republic of Turkey(a) | | 3.25% | | 6/14/2025 | | EUR | 26,171 | | | | 27,413,056 | |
| Republic of Turkey(b) | | 7.25% | | 12/23/2023 | | $ | 39,978 | | | | 41,155,552 | |
| Republic of Uruguay†(a) | | 8.50% | | 3/15/2028 | | UYU | 472,059 | | | | 12,451,348 | |
| Socialist Republic of Vietnam†(b) | | 4.80% | | 11/19/2024 | | $ | 27,091 | | | | 27,387,186 | |
| State of Qatar†(b) | | 3.25% | | 6/2/2026 | | | 27,091 | | | | 26,233,624 | |
| Uruguay Monetary Regulation Bill(a) | | Zero Coupon | | 5/3/2019 | | UYU | 598,596 | | | | 17,916,441 | |
| Total Foreign Government Obligations (cost $896,287,046) | | | | | | | 874,114,920 | |
| | | | | | | | | | | | | |
| GOVERNMENT SPONSORED ENTERPRISES PASS-THROUGH 8.85% | | | | | | | | |
Federal National Mortgage Assoc.(h)
(cost $1,071,645,776) | | 4.50% | | TBA | | $ | 1,040,200 | | | | 1,077,800,203 | |
| | | | | | | | | | | | | |
| HIGH YIELD CORPORATE BONDS 66.23% | | | | | | | | | | | | |
| | | | | | | | | | | | | |
| Advertising 0.07% | | | | | | | | | | | | |
| Lamar Media Corp. | | 5.75% | | 2/1/2026 | | | 8,810 | | | | 8,953,163 | |
| | | | | | | | | | | | | |
| Aerospace/Defense 1.06% | | | | | | | | | | | | |
| BBA US Holdings, Inc.† | | 5.375% | | 5/1/2026 | | | 11,385 | | | | 10,815,636 | |
| Bombardier, Inc. (Canada)†(b) | | 7.50% | | 12/1/2024 | | | 23,093 | | | | 21,822,885 | |
| Bombardier, Inc.(Canada)†(b) | | 7.50% | | 3/15/2025 | | | 45,373 | | | | 42,934,201 | |
| Bombardier, Inc. (Canada)†(b) | | 8.75% | | 12/1/2021 | | | 10,395 | | | | 10,745,831 | |
| United Technologies Corp. | | 4.125% | | 11/16/2028 | | | 43,645 | | | | 43,425,133 | |
| Total | | | | | | | | | | | 129,743,686 | |
| | | | | | | | | | | | | |
| Air Transportation 0.58% | | | | | | | | | | | | |
| Air Canada (Canada)†(b) | | 7.75% | | 4/15/2021 | | | 10,183 | | | | 10,816,892 | |
| Air Canada 2013-1 Class A Pass Through Trust (Canada)†(b) | | 4.125% | | 11/15/2026 | | | 8,893 | | | | 8,831,854 | |
| 18 | See Notes to Financial Statements. | |
Schedule of Investments (continued)
December 31, 2018
| Investments | | Interest
Rate | | Maturity
Date | | Principal
Amount
(000) | | | Fair
Value | |
| Air Transportation (continued) | | | | | | | | | | | | |
| Azul Investments LLP† | | 5.875% | | 10/26/2024 | | $ | 35,600 | | | $ | 33,375,356 | |
| British Airways 2018-1 Class A Pass Through Trust (United Kingdom)†(b) | | 4.125% | | 3/20/2033 | | | 8,972 | | | | 8,880,038 | |
| British Airways 2018-1 Class AA Pass Through Trust (United Kingdom)†(b) | | 3.80% | | 3/20/2033 | | | 8,945 | | | | 8,794,427 | |
| Total | | | | | | | | | | | 70,698,567 | |
| | | | | | | | | | | | | |
| Auto Loans 0.10% | | | | | | | | | | | | |
| General Motors Financial Co., Inc. | | 3.85% | | 1/5/2028 | | | 14,047 | | | | 12,260,887 | |
| | | | | | | | | | | | | |
| Auto Parts & Equipment 0.11% | | | | | | | | | | | | |
| Allison Transmission, Inc.† | | 5.00% | | 10/1/2024 | | | 14,461 | | | | 13,936,789 | |
| | | | | | | | | | | | | |
| Automakers 0.77% | | | | | | | | | | | | |
| General Motors Co. | | 5.00% | | 10/1/2028 | | | 19,990 | | | | 18,987,954 | |
| General Motors Co. | | 8.375% | | 7/15/2049 | | | 15,000 | | | | 1,500 | (c) |
| Navistar International Corp.† | | 6.625% | | 11/1/2025 | | | 12,846 | | | | 12,460,620 | |
| Tesla, Inc.† | | 5.30% | | 8/15/2025 | | | 71,655 | | | | 62,518,987 | |
| Total | | | | | | | | | | | 93,969,061 | |
| | | | | | | | | | | | | |
| Banking 4.20% | | | | | | | | | | | | |
| ABN AMRO Bank NV (Netherlands)†(b) | | 4.75% | | 7/28/2025 | | | 31,461 | | | | 31,364,792 | |
| AIB Group plc (Ireland)†(b) | | 4.75% | | 10/12/2023 | | | 22,383 | | | | 22,183,496 | |
| Ally Financial, Inc. | | 4.625% | | 3/30/2025 | | | 22,002 | | | | 21,396,945 | |
| American Express Co. | | 3.40% | | 2/27/2023 | | | 17,804 | | | | 17,654,218 | |
| ANZ New Zealand Int’l Ltd. (United Kingdom)†(b) | | 2.125% | | 7/28/2021 | | | 14,890 | | | | 14,401,604 | |
| Associated Banc-Corp. | | 4.25% | | 1/15/2025 | | | 7,996 | | | | 8,051,343 | |
| Australia & New Zealand Banking Group Ltd. (United Kingdom)†(b) | | 6.75%
(USD Swap + 5.17% | )# | – | (i) | | 19,074 | | | | 18,764,047 | |
| Banco Mercantil del Norte SA† | 7.625%
(10 Yr Treasury CMT + 5.353% | )# | – | (i) | | 6,572 | | | | 6,391,336 | |
| Banco Safra SA† | | 4.125% | | 2/8/2023 | | | 19,821 | | | | 19,201,594 | |
| Bank of America Corp. | | 4.45% | | 3/3/2026 | | | 19,634 | | | | 19,455,776 | |
| Bank of Ireland Group plc (Ireland)†(b) | | 4.50% | | 11/25/2023 | | | 17,871 | | | | 17,526,036 | |
| BankUnited, Inc. | | 4.875% | | 11/17/2025 | | | 24,313 | | | | 24,834,023 | |
| BBVA Bancomer SA† | | 5.125% | #(j) | 1/18/2033 | | | 35,647 | | | | 31,057,805 | |
| CIT Group, Inc. | | 5.25% | | 3/7/2025 | | | 6,722 | | | | 6,587,560 | |
| CIT Group, Inc. | | 6.125% | | 3/9/2028 | | | 12,241 | | | | 12,210,398 | |
| Citigroup, Inc. | | 4.45% | | 9/29/2027 | | | 13,296 | | | | 12,834,297 | |
| Compass Bank | | 3.875% | | 4/10/2025 | | | 26,897 | | | | 25,830,579 | |
| Fifth Third Bancorp | | 8.25% | | 3/1/2038 | | | 8,042 | | | | 10,700,494 | |
| | See Notes to Financial Statements. | 19 |
Schedule of Investments (continued)
December 31, 2018
| Investments | | Interest
Rate | | Maturity
Date | | Principal
Amount
(000) | | | Fair
Value | |
| Banking (continued) | | | | | | | | | | | | |
| Goldman Sachs Group, Inc. (The) | | 3.50% | | 11/16/2026 | | $ | 13,667 | | | $ | 12,642,988 | |
| Goldman Sachs Group, Inc. (The) | | 3.618%
(3 Mo. LIBOR + 1.11% | )# | 4/26/2022 | | | 6,189 | | | | 6,122,211 | |
| Goldman Sachs Group, Inc. (The) | | 4.25% | | 10/21/2025 | | | 18,995 | | | | 18,214,209 | |
| Home BancShares, Inc. | | 5.625%
(3 Mo. LIBOR + 3.58% | )# | 4/15/2027 | | | 19,481 | | | | 19,914,778 | |
| Huntington Bancshares, Inc. | | 5.70% | #(j) | – | (i) | | 13,740 | | | | 12,220,013 | |
| JPMorgan Chase & Co. | | 3.54%
(3 Mo. LIBOR + 1.38% | )# | 5/1/2028 | | | 11,994 | | | | 11,454,966 | |
| JPMorgan Chase & Co. | | 3.90% | | 7/15/2025 | | | 17,386 | | | | 17,250,693 | |
| JPMorgan Chase & Co. | 6.10%
(3 Mo. LIBOR + 3.33% | )# | – | (i) | | 12,015 | | | | 11,954,925 | |
| Macquarie Bank Ltd. (United Kingdom)†(b) | 6.125%
(5 Yr Swap rate + 3.70% | )# | – | (i) | | 28,891 | | | | 24,737,919 | |
| Morgan Stanley | | 3.125% | | 7/27/2026 | | | 18,976 | | | | 17,531,932 | |
| Morgan Stanley | | 3.625% | | 1/20/2027 | | | 24,804 | | | | 23,610,672 | |
| Popular, Inc. | | 6.125% | | 9/14/2023 | | | 15,922 | | | | 15,832,518 | |
| Washington Mutual Bank(k) | | 6.875% | | 6/15/2011 | | | 22,500 | | | | 2,250 | (c) |
| Total | | | | | | | | | | | 511,936,417 | |
| | | | | | | | | | | | | |
| Beverages 1.06% | | | | | | | | | | | | |
| Bacardi Ltd.† | | 2.75% | | 7/15/2026 | | | 20,151 | | | | 17,357,711 | |
| Bacardi Ltd.† | | 4.70% | | 5/15/2028 | | | 28,786 | | | | 27,730,659 | |
| Becle SAB de CV (Mexico)†(b) | | 3.75% | | 5/13/2025 | | | 15,764 | | | | 15,060,444 | |
| Brown-Forman Corp. | | 3.50% | | 4/15/2025 | | | 8,956 | | | | 8,929,388 | |
| Brown-Forman Corp. | | 4.50% | | 7/15/2045 | | | 18,174 | | | | 19,179,448 | |
| Coca-Cola Icecek AS (Turkey)†(b) | | 4.215% | | 9/19/2024 | | | 28,540 | | | | 26,792,810 | |
| PepsiCo, Inc. | | 3.60% | | 3/1/2024 | | | 14,292 | | | | 14,516,492 | |
| Total | | | | | | | | | | | 129,566,952 | |
| | | | | | | | | | | | | |
| Building & Construction 1.16% | | | | | | | | | | | | |
| Ashton Woods USA LLC/Ashton Woods Finance Co.† | | 6.75% | | 8/1/2025 | | | 14,048 | | | | 12,292,000 | |
| Ashton Woods USA LLC/Ashton Woods Finance Co.† | | 6.875% | | 2/15/2021 | | | 9,653 | | | | 9,315,145 | |
| ITR Concession Co. LLC† | | 5.183% | | 7/15/2035 | | | 7,658 | | | | 7,443,342 | |
| Lennar Corp. | | 4.75% | | 11/15/2022 | | | 15,303 | | | | 14,901,296 | |
| Lennar Corp. | | 4.75% | | 5/30/2025 | | | 4,408 | | | | 4,149,030 | |
| Lennar Corp. | | 4.75% | | 11/29/2027 | | | 5,102 | | | | 4,623,688 | |
| PulteGroup, Inc. | | 5.00% | | 1/15/2027 | | | 17,108 | | | | 15,546,895 | |
| PulteGroup, Inc. | | 6.375% | | 5/15/2033 | | | 25,646 | | | | 23,530,205 | |
| Shea Homes LP/Shea Homes Funding Corp.† | | 6.125% | | 4/1/2025 | | | 14,448 | | | | 12,858,720 | |
| Toll Brothers Finance Corp. | | 5.625% | | 1/15/2024 | | | 14,213 | | | | 13,999,805 | |
| William Lyon Homes, Inc. | | 5.875% | | 1/31/2025 | | | 25,933 | | | | 22,172,715 | |
| Total | | | | | | | | | | | 140,832,841 | |
| 20 | See Notes to Financial Statements. |
Schedule of Investments (continued)
December 31, 2018
| Investments | | Interest
Rate | | Maturity
Date | | Principal
Amount
(000) | | | Fair
Value | |
| Building Materials 0.10% | | | | | | | | | | | | |
| Hillman Group, Inc. (The)† | | 6.375% | | 7/15/2022 | | $ | 14,608 | | | $ | 11,978,560 | |
| | | | | | | | | | | | | |
| Cable & Satellite Television 2.18% | | | | | | | | | | | | |
| Altice France SA (France)†(b) | | 7.375% | | 5/1/2026 | | | 46,103 | | | | 42,414,760 | |
| Altice France SA (France)†(b) | | 8.125% | | 2/1/2027 | | | 13,530 | | | | 12,785,850 | |
| CCO Holdings LLC/CCO Holdings Capital Corp.† | | 5.125% | | 5/1/2027 | | | 32,573 | | | | 30,419,925 | |
| CCO Holdings LLC/CCO Holdings Capital Corp.† | | 5.75% | | 2/15/2026 | | | 71,221 | | | | 69,974,632 | |
| CCO Holdings LLC/CCO Holdings Capital Corp.† | | 5.875% | | 4/1/2024 | | | 15,739 | | | | 15,699,653 | |
| CSC Holdings LLC† | | 10.875% | | 10/15/2025 | | | 16,727 | | | | 18,824,900 | |
| DISH DBS Corp. | | 7.75% | | 7/1/2026 | | | 41,950 | | | | 34,818,500 | |
| UPCB Finance IV Ltd.† | | 5.375% | | 1/15/2025 | | | 16,988 | | | | 15,928,289 | |
| Ziggo BV (Netherlands)†(b) | | 5.50% | | 1/15/2027 | | | 27,526 | | | | 24,704,585 | |
| Total | | | | | | | | | | | 265,571,094 | |
| | | | | | | | | | | | | |
| Chemicals 0.96% | | | | | | | | | | | | |
| CF Industries, Inc.† | | 4.50% | | 12/1/2026 | | | 26,420 | | | | 25,876,418 | |
| CF Industries, Inc. | | 4.95% | | 6/1/2043 | | | 3,074 | | | | 2,393,878 | |
| CF Industries, Inc. | | 5.15% | | 3/15/2034 | | | 5,096 | | | | 4,306,120 | |
| CNAC HK Finbridge Co. Ltd. (Hong Kong)(b) | | 4.125% | | 7/19/2027 | | | 2,784 | | | | 2,637,562 | |
| CVR Partners LP/CVR Nitrogen Finance Corp.† | | 9.25% | | 6/15/2023 | | | 13,118 | | | | 13,691,912 | |
| International Flavors & Fragrances, Inc. | | 5.00% | | 9/26/2048 | | | 21,585 | | | | 21,611,813 | |
| Mexichem SAB de CV (Mexico)†(b) | | 5.875% | | 9/17/2044 | | | 14,262 | | | | 12,897,840 | |
| OCI NV (Netherlands)†(b) | | 6.625% | | 4/15/2023 | | | 13,200 | | | | 13,035,000 | |
| Yingde Gases Investment Ltd. (Hong Kong)†(b) | | 6.25% | | 1/19/2023 | | | 21,196 | | | | 19,976,394 | |
| Total | | | | | | | | | | | 116,426,937 | |
| | | | | | | | | | | | | |
| Consumer/Commercial/Lease Financing 1.01% | | | | | | | | | | | | |
| Curo Group Holdings Corp.† | | 8.25% | | 9/1/2025 | | | 20,870 | | | | 16,487,300 | |
| Freedom Mortgage Corp.† | | 8.125% | | 11/15/2024 | | | 7,514 | | | | 6,480,825 | |
| Freedom Mortgage Corp.† | | 8.25% | | 4/15/2025 | | | 12,646 | | | | 10,875,560 | |
| Nationstar Mortgage Holdings, Inc.† | | 9.125% | | 7/15/2026 | | | 20,586 | | | | 20,071,350 | |
| Navient Corp. | | 6.125% | | 3/25/2024 | | | 22,447 | | | | 19,360,537 | |
| Navient Corp. | | 6.75% | | 6/25/2025 | | | 28,191 | | | | 24,103,305 | |
| Quicken Loans, Inc.† | | 5.25% | | 1/15/2028 | | | 28,288 | | | | 25,140,960 | |
| Total | | | | | | | | | | | 122,519,837 | |
| | | | | | | | | | | | | |
| Department Stores 0.36% | | | | | | | | | | | | |
| Kohl’s Corp. | | 5.55% | | 7/17/2045 | | | 27,768 | | | | 26,085,192 | |
| Seven & i Holdings Co. Ltd. (Japan)†(b) | | 3.35% | | 9/17/2021 | | | 17,869 | | | | 17,926,968 | |
| Total | | | | | | | | | | | 44,012,160 | |
| | See Notes to Financial Statements. | 21 |
Schedule of Investments (continued)
December 31, 2018
| Investments | | Interest
Rate | | Maturity
Date | | Principal
Amount
(000) | | | Fair
Value | |
| Discount Stores 1.03% | | | | | | | | | | | | |
| Amazon.com, Inc. | | 3.15% | | 8/22/2027 | | $ | 28,837 | | | $ | 27,871,510 | |
| Amazon.com, Inc. | | 4.25% | | 8/22/2057 | | | 20,632 | | | | 20,136,228 | |
| Amazon.com, Inc. | | 4.80% | | 12/5/2034 | | | 28,691 | | | | 30,812,905 | |
| Amazon.com, Inc. | | 5.20% | | 12/3/2025 | | | 41,869 | | | | 46,052,211 | |
| Total | | | | | | | | | | | 124,872,854 | |
| | | | | | | | | | | | | |
| Diversified Capital Goods 1.10% | | | | | | | | | | | | |
| BCD Acquisition, Inc.† | | 9.625% | | 9/15/2023 | | | 12,382 | | | | 12,784,415 | |
| General Electric Co. | | 2.70% | | 10/9/2022 | | | 39,891 | | | | 37,046,499 | |
| General Electric Co. | | 3.10% | | 1/9/2023 | | | 25,636 | | | | 23,941,986 | |
| Griffon Corp. | | 5.25% | | 3/1/2022 | | | 11,628 | | | | 10,566,945 | |
| KOC Holding AS (Turkey)†(b) | | 5.25% | | 3/15/2023 | | | 15,211 | | | | 14,268,724 | |
| Siemens Financieringsmaatschappij NV (Netherlands)†(b) | | 3.25% | | 5/27/2025 | | | 13,036 | | | | 12,791,990 | |
| SPX FLOW, Inc.† | | 5.625% | | 8/15/2024 | | | 8,609 | | | | 8,178,550 | |
| SPX FLOW, Inc.† | | 5.875% | | 8/15/2026 | | | 14,947 | | | | 13,975,445 | |
| Total | | | | | | | | | | | 133,554,554 | |
| | | | | | | | | | | | | |
| Electric: Distribution/Transportation 0.68% | | | | | | | | | | | | |
| Atlantic City Electric Co. | | 4.00% | | 10/15/2028 | | | 13,493 | | | | 13,903,824 | |
| Cemig Geracao e Transmissao SA (Brazil)†(b) | | 9.25% | | 12/5/2024 | | | 13,163 | | | | 14,058,084 | |
| Oklahoma Gas & Electric Co. | | 4.15% | | 4/1/2047 | | | 11,379 | | | | 11,069,163 | |
| State Grid Overseas Investment 2016 Ltd.† | | 3.50% | | 5/4/2027 | | | 45,150 | | | | 43,563,287 | |
| Total | | | | | | | | | | | 82,594,358 | |
| | | | | | | | | | | | | |
| Electric: Generation 1.32% | | | | | | | | | | | | |
| Acwa Power Management & Investments One Ltd. (Sounth Africa)†(b) | | 5.95% | | 12/15/2039 | | | 14,814 | | | | 13,967,084 | |
| Calpine Corp. | | 5.75% | | 1/15/2025 | | | 41,895 | | | | 38,438,662 | |
| Clearway Energy Operating LLC† | | 5.75% | | 10/15/2025 | | | 15,737 | | | | 15,087,849 | |
| NextEra Energy Operating Partners LP† | | 4.50% | | 9/15/2027 | | | 19,300 | | | | 17,249,375 | |
| NRG Energy, Inc. | | 5.75% | | 1/15/2028 | | | 32,817 | | | | 31,627,384 | |
| NSG Holdings LLC/NSG Holdings, Inc.† | | 7.75% | | 12/15/2025 | | | 14,893 | | | | 15,786,630 | |
| Rio Energy SA/UGEN SA/UENSA SA (Argentina)†(b) | | 6.875% | | 2/1/2025 | | | 17,545 | | | | 13,071,025 | |
| Talen Energy Supply LLC | | 4.60% | | 12/15/2021 | | | 198 | | | | 179,190 | |
| Vistra Operations Co. LLC† | | 5.50% | | 9/1/2026 | | | 15,758 | | | | 15,226,167 | |
| Total | | | | | | | | | | | 160,633,366 | |
| 22 | See Notes to Financial Statements. |
Schedule of Investments (continued)
December 31, 2018
| Investments | | Interest
Rate | | Maturity
Date | | Principal
Amount
(000) | | | Fair
Value | |
| Electric: Integrated 2.25% | | | | | | | | | | | | |
| Aegea Finance Sarl (Brazil)†(b) | | 5.75% | | 10/10/2024 | | $ | 20,480 | | | $ | 19,609,805 | |
| AES Corp. (The) | | 4.50% | | 3/15/2023 | | | 11,417 | | | | 11,174,389 | |
| AES Corp. (The) | | 5.125% | | 9/1/2027 | | | 802 | | | | 771,925 | |
| Arizona Public Service Co. | | 2.95% | | 9/15/2027 | | | 13,385 | | | | 12,697,180 | |
| Ausgrid Finance Pty Ltd. (Australia)†(b) | | 4.35% | | 8/1/2028 | | | 13,786 | | | | 13,775,547 | |
| Black Hills Corp. | | 4.35% | | 5/1/2033 | | | 13,491 | | | | 13,567,368 | |
| El Paso Electric Co. | | 5.00% | | 12/1/2044 | | | 20,062 | | | | 20,969,249 | |
| Entergy Arkansas LLC | | 4.00% | | 6/1/2028 | | | 18,151 | | | | 18,554,625 | |
| Entergy Arkansas LLC | | 4.95% | | 12/15/2044 | | | 16,883 | | | | 16,946,623 | |
| Entergy Louisiana LLC | | 4.00% | | 3/15/2033 | | | 10,745 | | | | 10,895,575 | |
| Entergy Mississippi LLC | | 2.85% | | 6/1/2028 | | | 19,150 | | | | 17,935,778 | |
| Indianapolis Power & Light Co.† | | 4.05% | | 5/1/2046 | | | 24,503 | | | | 22,464,482 | |
| Louisville Gas & Electric Co. | | 4.375% | | 10/1/2045 | | | 15,039 | | | | 15,095,873 | |
| Monongahela Power Co.† | | 3.55% | | 5/15/2027 | | | 13,657 | | | | 13,412,345 | |
| Ohio Power Co. | | 4.15% | | 4/1/2048 | | | 26,865 | | | | 26,616,398 | |
| Puget Sound Energy, Inc. | | 4.223% | | 6/15/2048 | | | 13,467 | | | | 13,521,462 | |
| Puget Sound Energy, Inc. | | 7.02% | | 12/1/2027 | | | 2,920 | | | | 3,592,888 | |
| Rochester Gas & Electric Corp.† | | 3.10% | | 6/1/2027 | | | 13,724 | | | | 13,114,589 | |
| Sierra Pacific Power Co. | | 2.60% | | 5/1/2026 | | | 9,730 | | | | 9,078,334 | |
| Total | | | | | | | | | | | 273,794,435 | |
| | | | | | | | | | | | | |
| Electronics 0.82% | | | | | | | | | | | | |
| Nokia OYJ (Finland)(b) | | 4.375% | | 6/12/2027 | | | 13,838 | | | | 12,903,935 | |
| NVIDIA Corp. | | 3.20% | | 9/16/2026 | | | 29,939 | | | | 28,474,191 | |
| QUALCOMM, Inc. | | 3.25% | | 5/20/2027 | | | 17,987 | | | | 16,827,335 | |
| Trimble, Inc. | | 4.75% | | 12/1/2024 | | | 27,261 | | | | 27,518,167 | |
| Xilinx, Inc. | | 2.95% | | 6/1/2024 | | | 15,096 | | | | 14,418,457 | |
| Total | | | | | | | | | | | 100,142,085 | |
| | | | | | | | | | | | | |
| Energy: Exploration & Production 3.01% | | | | | | | | | | | | |
| Alta Mesa Holdings LP/Alta Mesa Finance Services Corp. | | 7.875% | | 12/15/2024 | | | 15,686 | | | | 9,803,750 | |
| California Resources Corp.† | | 8.00% | | 12/15/2022 | | | 37,595 | | | | 25,564,600 | |
| Centennial Resource Production LLC† | | 5.375% | | 1/15/2026 | | | 12,041 | | | | 11,258,335 | |
| Chesapeake Energy Corp. | | 7.00% | | 10/1/2024 | | | 33,707 | | | | 29,325,090 | |
| Chesapeake Energy Corp. | | 7.50% | | 10/1/2026 | | | 13,490 | | | | 11,601,400 | |
| Denbury Resources, Inc.† | | 7.50% | | 2/15/2024 | | | 12,976 | | | | 10,510,560 | |
| Eclipse Resources Corp. | | 8.875% | | 7/15/2023 | | | 13,873 | | | | 11,965,462 | |
| Endeavor Energy Resources LP/EER Finance, Inc.† | | 5.50% | | 1/30/2026 | | | 12,585 | | | | 12,946,819 | |
| | See Notes to Financial Statements. | 23 |
Schedule of Investments (continued)
December 31, 2018
| Investments | | Interest
Rate | | Maturity
Date | | Principal
Amount
(000) | | | Fair
Value | |
| Energy: Exploration & Production (continued) | | | | | | | | | | | | |
| EP Energy LLC/Everest Acquisition Finance, Inc.† | | 8.00% | | 11/29/2024 | | $ | 11,547 | | | $ | 8,660,250 | |
| Gulfport Energy Corp. | | 6.375% | | 5/15/2025 | | | 6,742 | | | | 5,991,953 | |
| Gulfport Energy Corp. | | 6.375% | | 1/15/2026 | | | 6,913 | | | | 5,997,028 | |
| HighPoint Operating Corp. | | 7.00% | | 10/15/2022 | | | 9,822 | | | | 8,987,130 | |
| Hilcorp Energy I LP/Hilcorp Finance Co.† | | 5.00% | | 12/1/2024 | | | 19,212 | | | | 17,098,680 | |
| Hilcorp Energy I LP/Hilcorp Finance Co.† | | 5.75% | | 10/1/2025 | | | 8,125 | | | | 7,271,875 | |
| Hilcorp Energy I LP/Hilcorp Finance Co.† | | 6.25% | | 11/1/2028 | | | 12,846 | | | | 11,352,652 | |
| Hunt Oil Co. of Peru LLC Sucursal Del Peru (Peru)†(b) | | 6.375% | | 6/1/2028 | | | 26,408 | | | | 26,847,693 | |
| Indigo Natural Resources LLC† | | 6.875% | | 2/15/2026 | | | 13,837 | | | | 11,969,005 | |
| Jonah Energy LLC/Jonah Energy Finance Corp.† | | 7.25% | | 10/15/2025 | | | 21,795 | | | | 14,166,750 | |
| MEG Energy Corp. (Canada)†(b) | | 6.50% | | 1/15/2025 | | | 11,902 | | | | 12,125,162 | |
| MEG Energy Corp. (Canada)†(b) | | 7.00% | | 3/31/2024 | | | 23,708 | | | | 22,759,680 | |
| Murphy Oil Corp. | | 6.875% | | 8/15/2024 | | | 5,221 | | | | 5,205,481 | |
| OGX Austria GmbH (Brazil)†(b)(k) | | 8.50% | | 6/1/2018 | | | 20,000 | | | | 400 | |
| Range Resources Corp. | | 4.875% | | 5/15/2025 | | | 14,471 | | | | 11,938,575 | |
| SM Energy Co. | | 6.625% | | 1/15/2027 | | | 8,237 | | | | 7,372,115 | |
| SM Energy Co. | | 6.75% | | 9/15/2026 | | | 12,750 | | | | 11,475,000 | |
| Southwestern Energy Co. | | 7.75% | | 10/1/2027 | | | 12,722 | | | | 12,149,510 | |
| SRC Energy, Inc. | | 6.25% | | 12/1/2025 | | | 21,135 | | | | 17,647,725 | |
| Texaco Capital, Inc. | | 8.625% | | 11/15/2031 | | | 11,023 | | | | 16,215,042 | |
| WildHorse Resource Development Corp. | | 6.875% | | 2/1/2025 | | | 8,918 | | | | 8,472,100 | |
| Total | | | | | | | | | | | 366,679,822 | |
| | | | | | | | | | | | | |
| Environmental 0.27% | | | | | | | | | | | | |
| Darling Global Finance BV†(a) | | 3.625% | | 5/15/2026 | | EUR | 7,646 | | | | 8,698,860 | |
| Paprec Holding SA(a) | | 4.00% | | 3/31/2025 | | EUR | 12,427 | | | | 12,106,056 | |
| Waste Pro USA, Inc.† | | 5.50% | | 2/15/2026 | | $ | 13,660 | | | | 12,635,500 | |
| Total | | | | | | | | | | | 33,440,416 | |
| | | | | | | | | | | | | |
| Food & Drug Retailers 0.87% | | | | | | | | | | | | |
| Albertsons Cos LLC/Safeway, Inc./Albertsons LP/Albertson’s LLC | | 5.75% | | 3/15/2025 | | | 32,370 | | | | 28,485,600 | |
| Albertsons Cos LLC/Safeway, Inc./Albertsons LP/Albertson’s LLC | | 6.625% | | 6/15/2024 | | | 24,128 | | | | 22,499,360 | |
| CVS Health Corp. | | 4.30% | | 3/25/2028 | | | 25,242 | | | | 24,763,195 | |
| Ingles Markets, Inc. | | 5.75% | | 6/15/2023 | | | 19,550 | | | | 19,403,375 | |
| Kroger Co. (The) | | 2.65% | | 10/15/2026 | | | 8,094 | | | | 7,217,035 | |
| Kroger Co. (The) | | 4.65% | | 1/15/2048 | | | 4,496 | | | | 4,146,328 | |
| Total | | | | | | | | | | | 106,514,893 | |
| 24 | See Notes to Financial Statements. |
Schedule of Investments (continued)
December 31, 2018
| Investments | | Interest
Rate | | Maturity
Date | | Principal
Amount
(000) | | | Fair
Value | |
| Food: Wholesale 1.61% | | | | | | | | | | | | |
| Arcor SAIC (Argentina)†(b) | | 6.00% | | 7/6/2023 | | $ | 22,148 | | | $ | 20,484,685 | |
| B&G Foods, Inc. | | 5.25% | | 4/1/2025 | | | 14,068 | | | | 13,135,995 | |
| Campbell Soup Co. | | 4.15% | | 3/15/2028 | | | 23,370 | | | | 21,810,805 | |
| Chobani LLC/Chobani Finance Corp., Inc.† | | 7.50% | | 4/15/2025 | | | 15,174 | | | | 12,025,395 | |
| Conagra Brands, Inc. | | 4.60% | | 11/1/2025 | | | 16,978 | | | | 17,063,618 | |
| FAGE International SA/FAGE USA Dairy Industry, Inc. (Luxembourg)†(b) | | 5.625% | | 8/15/2026 | | | 13,976 | | | | 12,001,890 |
| JBS USA LUX SA/JBS USA Finance, Inc.† | | 5.875% | | 7/15/2024 | | | 13,559 | | | | 13,338,666 | |
| JBS USA LUX SA/JBS USA Finance, Inc.† | | 6.75% | | 2/15/2028 | | | 13,602 | | | | 13,312,957 | |
| Kernel Holding SA (Ukraine)†(b) | | 8.75% | | 1/31/2022 | | | 7,753 | | | | 7,455,192 | |
| Lamb Weston Holdings, Inc.† | | 4.625% | | 11/1/2024 | | | 12,447 | | | | 12,135,825 | |
| Lamb Weston Holdings, Inc.† | | 4.875% | | 11/1/2026 | | | 892 | | | | 860,780 | |
| McCormick & Co., Inc. | | 4.20% | | 8/15/2047 | | | 21,326 | | | | 20,024,424 | |
| MHP Lux SA (Luxembourg)†(b) | | 6.95% | | 4/3/2026 | | | 21,993 | | | | 19,015,148 | |
| Nvent Finance Sarl (Luxembourg)(b) | | 4.55% | | 4/15/2028 | | | 13,384 | | | | 13,145,373 | |
| Total | | | | | | | | | | | 195,810,753 | |
| | | | | | | | | | | | | |
| Forestry/Paper 0.56% | | | | | | | | | | | | |
| Norbord, Inc. (Canada)†(b) | | 6.25% | | 4/15/2023 | | | 18,438 | | | | 18,536,828 | |
| Rayonier AM Products, Inc.† | | 5.50% | | 6/1/2024 | | | 13,628 | | | | 12,060,780 | |
| Suzano Austria GmbH (Brazil)†(b) | | 5.75% | | 7/14/2026 | | | 14,057 | | | | 14,373,282 | |
| Suzano Austria GmbH (Brazil)†(b) | | 6.00% | | 1/15/2029 | | | 9,025 | | | | 9,232,575 | |
| West Fraser Timber Co. Ltd. (Canada)†(b) | | 4.35% | | 10/15/2024 | | | 14,594 | | | | 14,477,959 | |
| Total | | | | | | | | | | | 68,681,424 | |
| | | | | | | | | | | | | |
| Gaming 1.11% | | | | | | | | | | | | |
| Boyd Gaming Corp. | | 6.00% | | 8/15/2026 | | | 13,070 | | | | 12,269,463 | |
| Eldorado Resorts, Inc.† | | 6.00% | | 9/15/2026 | | | 13,521 | | | | 12,811,147 | |
| Eldorado Resorts, Inc. | | 6.00% | | 4/1/2025 | | | 5,376 | | | | 5,212,785 | |
| Everi Payments, Inc.† | | 7.50% | | 12/15/2025 | | | 13,419 | | | | 12,731,276 | |
| GLP Capital LP/GLP Financing II, Inc. | | 5.75% | | 6/1/2028 | | | 18,808 | | | | 19,066,610 | |
| Jacobs Entertainment, Inc.† | | 7.875% | | 2/1/2024 | | | 19,057 | | | | 19,676,352 | |
| Mohegan Gaming & Entertainment†(l) | | 7.875% | | 10/15/2024 | | | 13,557 | | | | 12,726,634 | |
| Penn National Gaming, Inc.† | | 5.625% | | 1/15/2027 | | | 20,104 | | | | 18,043,340 | |
| Stars Group Holdings BV/Stars Group US Co-Borrower LLC (Netherlands)†(b) | | 7.00% | | 7/15/2026 | | | 13,242 | | | | 12,910,950 | |
| Station Casinos LLC† | | 5.00% | | 10/1/2025 | | | 11,158 | | | | 10,125,885 | |
| Total | | | | | | | | | | | 135,574,442 | |
| | See Notes to Financial Statements. | 25 |
Schedule of Investments (continued)
December 31, 2018
| Investments | | Interest
Rate | | Maturity
Date | | Principal
Amount
(000) | | | Fair
Value | |
| Gas Distribution 2.32% | | | | | | | | | | | | |
| Cheniere Corpus Christi Holdings LLC | | 5.125% | | 6/30/2027 | | $ | 23,796 | | | $ | 22,553,849 | |
| Cheniere Corpus Christi Holdings LLC | | 5.875% | | 3/31/2025 | | | 14,002 | | | | 13,966,995 | |
| Cheniere Corpus Christi Holdings LLC | | 7.00% | | 6/30/2024 | | | 8,783 | | | | 9,288,022 | |
| Dominion Energy Gas Holdings LLC | | 3.60% | | 12/15/2024 | | | 12,050 | | | | 11,984,441 | |
| Florida Gas Transmission Co. LLC† | | 4.35% | | 7/15/2025 | | | 18,069 | | | | 18,478,952 | |
| IFM US Colonial Pipeline 2 LLC† | | 6.45% | | 5/1/2021 | | | 17,675 | | | | 18,463,243 | |
| LBC Tank Terminals Holding Netherlands BV (Belgium)†(b) | | 6.875% | | 5/15/2023 | | | 13,377 | | | | 12,039,300 | |
| NGPL PipeCo LLC† | | 4.875% | | 8/15/2027 | | | 31,233 | | | | 29,554,226 | |
| Northern Natural Gas Co.† | | 4.30% | | 1/15/2049 | | | 20,972 | | | | 20,520,266 | |
| ONE Gas, Inc. | | 4.50% | | 11/1/2048 | | | 13,497 | | | | 13,947,596 | |
| Plains All American Pipeline LP | | 6.125% | #(j) | – | (i) | | 13,888 | | | | 11,700,640 | |
| Rockies Express Pipeline LLC† | | 6.875% | | 4/15/2040 | | | 22,654 | | | | 23,786,700 | |
| Sabal Trail Transmission LLC† | | 4.246% | | 5/1/2028 | | | 20,166 | | | | 19,906,716 | |
| Southern Star Central Corp.† | | 5.125% | | 7/15/2022 | | | 10,145 | | | | 9,789,925 | |
| Targa Resources Partners LP/Targa Resources Partners Finance Corp. | | 4.25% | | 11/15/2023 | | | 8,725 | | | | 8,103,344 | |
| Targa Resources Partners LP/Targa Resources Partners Finance Corp.† | | 5.875% | | 4/15/2026 | | | 13,090 | | | | 12,795,475 | |
| Transportadora de Gas Internacional SA ESP (Colombia)†(b) | | 5.55% | | 11/1/2028 | | | 24,773 | | | | 25,113,629 | |
| Total | | | | | | | | | | | 281,993,319 | |
| | | | | | | | | | | | | |
| Health Facilities 3.62% | | | | | | | | | | | | |
| AHP Health Partners, Inc.† | | 9.75% | | 7/15/2026 | | | 13,727 | | | | 13,967,222 | |
| Ascension Health | | 3.945% | | 11/15/2046 | | | 8,881 | | | | 8,586,484 | |
| CHS/Community Health Systems, Inc. | | 8.00% | | 11/15/2019 | | | 27,328 | | | | 26,098,240 | |
| Dignity Health | | 3.812% | | 11/1/2024 | | | 7,500 | | | | 7,556,552 | |
| HCA, Inc. | | 4.75% | | 5/1/2023 | | | 8,609 | | | | 8,501,387 | |
| HCA, Inc. | | 5.25% | | 4/15/2025 | | | 13,995 | | | | 13,960,012 | |
| HCA, Inc. | | 5.25% | | 6/15/2026 | | | 11,878 | | | | 11,818,610 | |
| HCA, Inc. | | 5.375% | | 2/1/2025 | | | 6,146 | | | | 6,007,715 | |
| HCA, Inc. | | 5.50% | | 6/15/2047 | | | 50,449 | | | | 47,926,550 | |
| HCA, Inc. | | 5.875% | | 3/15/2022 | | | 13,139 | | | | 13,500,322 | |
| HCA, Inc. | | 5.875% | | 2/15/2026 | | | 1,735 | | | | 1,730,663 | |
| HCA, Inc. | | 7.05% | | 12/1/2027 | | | 3,490 | | | | 3,690,675 | |
| HCA, Inc. | | 7.50% | | 2/15/2022 | | | 23,489 | | | | 25,015,785 | |
| HCA, Inc. | | 7.58% | | 9/15/2025 | | | 5,778 | | | | 6,153,570 | |
| HCA, Inc. | | 7.69% | | 6/15/2025 | | | 12,776 | | | | 13,638,380 | |
| HCA, Inc. | | 8.36% | | 4/15/2024 | | | 2,295 | | | | 2,535,975 | |
| 26 | See Notes to Financial Statements. |
Schedule of Investments (continued)
December 31, 2018
| Investments | | Interest
Rate | | Maturity
Date | | Principal
Amount
(000) | | | Fair
Value | |
| Health Facilities (continued) | | | | | | | | | | | | |
| Memorial Sloan-Kettering Cancer Center | | 4.20% | | 7/1/2055 | | $ | 28,034 | | | $ | 28,272,552 | |
| MPT Operating Partnership LP/MPT Finance Corp. | | 5.00% | | 10/15/2027 | | | 14,011 | | | | 12,846,336 | |
| New York & Presbyterian Hospital (The) | | 4.063% | | 8/1/2056 | | | 16,078 | | | | 15,592,764 | |
| NYU Langone Hospitals | | 4.368% | | 7/1/2047 | | | 12,348 | | | | 12,325,753 | |
| Rede D’or Finance Sarl (Luxembourg)†(b) | | 4.95% | | 1/17/2028 | | | 25,738 | | | | 22,810,302 | |
| RegionalCare Hospital Partners Holdings, Inc.† | | 8.25% | | 5/1/2023 | | | 9,865 | | | | 10,000,644 | |
| RegionalCare Hospital Partners Holdings, Inc./LifePoint Health, Inc.† | | 9.75% | | 12/1/2026 | | | 26,103 | | | | 24,797,850 | |
| Tenet Healthcare Corp. | | 4.625% | | 7/15/2024 | | | 7,281 | | | | 6,798,634 | |
| Tenet Healthcare Corp. | | 5.125% | | 5/1/2025 | | | 65,257 | | | | 61,015,295 | |
| Tenet Healthcare Corp. | | 6.75% | | 6/15/2023 | | | 37,692 | | | | 35,524,710 | |
| Total | | | | | | | | | | | 440,672,982 | |
| | | | | | | | | | | | | |
| Health Services 1.12% | | | | | | | | | | | | |
| DaVita, Inc. | | 5.00% | | 5/1/2025 | | | 19,962 | | | | 18,190,373 | |
| DaVita, Inc. | | 5.125% | | 7/15/2024 | | | 13,935 | | | | 13,098,900 | |
| Eagle Holding Co. II LLC PIK 8.375%† | | 7.625% | | 5/15/2022 | | | 6,366 | | | | 6,095,445 | |
| Jaguar Holding Co. II/Pharmaceutical Product Development LLC† | | 6.375% | | 8/1/2023 | | | 13,280 | | | | 12,723,435 | |
| Montefiore Obligated Group | | 5.246% | | 11/1/2048 | | | 18,042 | | | | 17,514,369 | |
| MPH Acquisition Holdings LLC† | | 7.125% | | 6/1/2024 | | | 9,799 | | | | 9,162,065 | |
| NVA Holdings, Inc.† | | 6.875% | | 4/1/2026 | | | 12,875 | | | | 11,587,500 | |
| Syneos Health, Inc./inVentiv Health, Inc./inVentiv Health Clinical, Inc.† | | 7.50% | | 10/1/2024 | | | 5,736 | | | | 5,994,120 | |
| Verscend Escrow Corp.† | | 9.75% | | 8/15/2026 | | | 19,792 | | | | 18,678,700 | |
| West Street Merger Sub, Inc.† | | 6.375% | | 9/1/2025 | | | 25,648 | | | | 22,826,720 | |
| Total | | | | | | | | | | | 135,871,627 | |
| | | | | | | | | | | | | |
| Hotels 0.53% | | | | | | | | | | | | |
| ESH Hospitality, Inc.† | | 5.25% | | 5/1/2025 | | | 13,467 | | | | 12,557,978 | |
| Hilton Domestic Operating Co., Inc. | | 4.25% | | 9/1/2024 | | | 11,114 | | | | 10,530,515 | |
| Hilton Domestic Operating Co., Inc.† | | 5.125% | | 5/1/2026 | | | 22,390 | | | | 21,550,375 | |
| Wyndham Destinations, Inc. | | 5.75% | | 4/1/2027 | | | 8,665 | | | | 7,982,631 | |
| Wyndham Destinations, Inc. | | 6.35% | | 10/1/2025 | | | 12,105 | | | | 11,802,375 | |
| Total | | | | | | | | | | | 64,423,874 | |
| | | | | | | | | | | | | |
| Insurance Brokerage 0.53% | | | | | | | | | | | | |
| Acrisure LLC/Acrisure Finance, Inc.† | | 7.00% | | 11/15/2025 | | | 22,880 | | | | 19,619,600 | |
| Alliant Holdings Intermediate LLC/Alliant Holdings Co-Issuer† | | 8.25% | | 8/1/2023 | | | 18,536 | | | | 18,477,982 | |
| | See Notes to Financial Statements. | 27 |
Schedule of Investments (continued)
December 31, 2018
| Investments | | Interest
Rate | | Maturity
Date | | Principal
Amount
(000) | | | Fair
Value | |
| Insurance Brokerage (continued) | | | | | | | | | | | | |
| Farmers Insurance Exchange† | | 4.747%
(3 Mo. LIBOR + 3.23% | )# | 11/1/2057 | | $ | 14,130 | | | $ | 12,535,430 | |
| HUB International Ltd.† | | 7.00% | | 5/1/2026 | | | 14,796 | | | | 13,464,360 | |
| Total | | | | | | | | | | | 64,097,372 | |
| | | | | | | | | | | | | |
| Integrated Energy 0.84% | | | | | | | | | | | | |
| Cheniere Energy Partners LP | | 5.25% | | 10/1/2025 | | | 13,080 | | | | 12,246,150 | |
| Cheniere Energy Partners LP† | | 5.625% | | 10/1/2026 | | | 17,984 | | | | 16,860,000 | |
| Exxon Mobil Corp. | | 3.043% | | 3/1/2026 | | | 23,752 | | | | 23,205,379 | |
| Rio Oil Finance Trust Series 2018-1 (Brazil)†(b) | | 8.20% | | 4/6/2028 | | | 12,879 | | | | 13,522,950 | |
| Shell International Finance BV (Netherlands)(b) | | 6.375% | | 12/15/2038 | | | 28,912 | | | | 36,748,563 | |
| Total | | | | | | | | | | | 102,583,042 | |
| | | | | | | | | | | | | |
| Investments & Miscellaneous Financial Services 1.00% | | | | | |
| BrightSphere Investment Group plc (United Kingdom)(b) | | 4.80% | | 7/27/2026 | | | 11,448 | | | | 11,046,611 | |
| MSCI, Inc.† | | 5.375% | | 5/15/2027 | | | 2,745 | | | | 2,693,531 | |
| MSCI, Inc.† | | 5.75% | | 8/15/2025 | | | 16,165 | | | | 16,367,062 | |
| Neuberger Berman Group LLC/Neuberger Berman Finance Corp.† | | 4.50% | | 3/15/2027 | | | 17,785 | | | | 17,808,884 | |
| Neuberger Berman Group LLC/Neuberger Berman Finance Corp.† | | 4.875% | | 4/15/2045 | | | 39,054 | | | | 34,979,907 | |
| Power Finance Corp. Ltd. (India)†(b) | | 6.15% | | 12/6/2028 | | | 11,044 | | | | 10,862,779 | |
| S&P Global, Inc. | | 6.55% | | 11/15/2037 | | | 13,324 | | | | 16,649,550 | |
| VFH Parent LLC/Orchestra Co-Issuer, Inc.† | | 6.75% | | 6/15/2022 | | | 11,984 | | | | 11,659,713 | |
| Total | | | | | | | | | | | 122,068,037 | |
| | | | | | | | | | | | | |
| Life Insurance 0.53% | | | | | | | | | | | | |
| Northwestern Mutual Life Insurance Co. (The)† | | 3.85% | | 9/30/2047 | | | 28,610 | | | | 26,011,117 | |
| Nuveen Finance LLC† | | 4.125% | | 11/1/2024 | | | 7,927 | | | | 8,084,175 | |
| Teachers Insurance & Annuity Association of America† | | 4.27% | | 5/15/2047 | | | 17,804 | | | | 17,106,144 | |
| Teachers Insurance & Annuity Association of America† | | 4.90% | | 9/15/2044 | | | 12,705 | | | | 13,220,520 | |
| Total | | | | | | | | | | | 64,421,956 | |
| | | | | | | | | | | | | |
| Machinery 0.23% | | | | | | | | | | | | |
| Roper Technologies, Inc. | | 4.20% | | 9/15/2028 | | | 19,379 | | | | 19,235,688 | |
| Xylem, Inc. | | 3.25% | | 11/1/2026 | | | 8,884 | | | | 8,461,021 | |
| Total | | | | | | | | | | | 27,696,709 | |
| 28 | See Notes to Financial Statements. |
Schedule of Investments (continued)
December 31, 2018
| Investments | | Interest
Rate | | Maturity
Date | | Principal
Amount
(000) | | | Fair
Value | |
| Managed Care 1.21% | | | | | | | | | | | | |
| Anthem, Inc. | | 3.65% | | 12/1/2027 | | $ | 10,427 | | | $ | 9,986,774 | |
| Centene Corp. | | 4.75% | | 1/15/2025 | | | 26,345 | | | | 25,225,338 | |
| Centene Corp.† | | 5.375% | | 6/1/2026 | | | 29,900 | | | | 29,152,500 | |
| Centene Corp. | | 6.125% | | 2/15/2024 | | | 18,803 | | | | 19,296,579 | |
| Kaiser Foundation Hospitals | | 4.15% | | 5/1/2047 | | | 17,628 | | | | 17,463,450 | |
| Polaris Intermediate Corp. PIK 8.50%† | | 8.50% | | 12/1/2022 | | | 16,766 | | | | 15,355,476 | |
| WellCare Health Plans, Inc. | | 5.25% | | 4/1/2025 | | | 32,352 | | | | 31,260,120 | |
| Total | | | | | | | | | | | 147,740,237 | |
| | | | | | | | | | | | | |
| Media: Content 1.47% | | | | | | | | | | | | |
| Activision Blizzard, Inc. | | 4.50% | | 6/15/2047 | | | 19,496 | | | | 17,580,144 | |
| AMC Networks, Inc. | | 4.75% | | 8/1/2025 | | | 27,032 | | | | 24,599,120 | |
| Gray Television, Inc.† | | 5.125% | | 10/15/2024 | | | 6,740 | | | | 6,231,130 | |
| Gray Television, Inc.† | | 5.875% | | 7/15/2026 | | | 9,833 | | | | 9,191,888 | |
| Netflix, Inc.(a) | | 3.625% | | 5/15/2027 | | EUR | 33,484 | | | | 37,265,145 | |
| Netflix, Inc.† | | 4.625% | | 5/15/2029 | | $ | 11,287 | | | | 12,729,172 | |
| Netflix, Inc. | | 4.875% | | 4/15/2028 | | | 5,940 | | | | 5,435,100 | |
| Netflix, Inc. | | 5.50% | | 2/15/2022 | | | 5,323 | | | | 5,381,340 | |
| Netflix, Inc. | | 5.875% | | 2/15/2025 | | | 13,000 | | | | 13,146,250 | |
| Sirius XM Radio, Inc.† | | 5.00% | | 8/1/2027 | | | 11,533 | | | | 10,581,528 | |
| Sirius XM Radio, Inc.† | | 5.375% | | 7/15/2026 | | | 10,495 | | | | 9,852,181 | |
| Sirius XM Radio, Inc.† | | 6.00% | | 7/15/2024 | | | 9,524 | | | | 9,583,525 | |
| Univision Communications, Inc.† | | 5.125% | | 5/15/2023 | | | 11,389 | | | | 10,249,858 | |
| Univision Communications, Inc.† | | 5.125% | | 2/15/2025 | | | 8,026 | | | | 7,062,880 | |
| Total | | | | | | | | | | | 178,889,261 | |
| | | | | | | | | | | | | |
| Media: Diversified 0.21% | | | | | | | | | | | | |
| 21st Century Fox America, Inc. | | 7.75% | | 12/1/2045 | | | 16,950 | | | | 25,002,613 | |
| | | | | | | | | | | | | |
| Medical Products 0.67% | | | | | | | | | | | | |
| Boston Scientific Corp. | | 7.00% | | 11/15/2035 | | | 16,135 | | | | 20,249,321 | |
| Edwards Lifesciences Corp. | | 4.30% | | 6/15/2028 | | | 27,927 | | | | 28,305,232 | |
| Ortho-Clinical Diagnostics, Inc./Ortho-Clinical Diagnostics SA† | | 6.625% | | 5/15/2022 | | | 24,815 | | | | 22,457,575 | |
| Teleflex, Inc. | | 4.625% | | 11/15/2027 | | | 6,711 | | | | 6,249,619 | |
| Teleflex, Inc. | | 4.875% | | 6/1/2026 | | | 4,031 | | | | 3,869,760 | |
| Total | | | | | | | | | | | 81,131,507 | |
| | See Notes to Financial Statements. | 29 |
Schedule of Investments (continued)
December 31, 2018
| Investments | | Interest
Rate | | Maturity
Date | | Principal
Amount
(000) | | | Fair
Value | |
| Metals/Mining (Excluding Steel) 2.04% | | | | | | | | | | | | |
| Alcoa Nederland Holding BV (Netherlands)†(b) | | 6.75% | | 9/30/2024 | | $ | 21,682 | | | $ | 22,115,640 | |
| Baffinland Iron Mines Corp. (Canada)†(b) | | 8.75% | | 7/15/2026 | | | 13,211 | | | | 11,904,036 | |
| Cleveland-Cliffs, Inc. | | 5.75% | | 3/1/2025 | | | 34,181 | | | | 30,848,352 | |
| Eterna Capital Pte Ltd. PIK 8.00% (Singapore)(b) | | 8.00% | | 12/11/2022 | | | 27,104 | | | | 23,771,357 | |
| Freeport-McMoRan, Inc. | | 3.875% | | 3/15/2023 | | | 69,141 | | | | 64,128,277 | |
| Grinding Media, Inc./Moly-Cop AltaSteel Ltd.† | | 7.375% | | 12/15/2023 | | | 6,084 | | | | 5,916,690 | |
| Imperial Metals Corp. (Canada)†(b) | | 7.00% | | 3/15/2019 | | | 10,318 | | | | 6,964,650 | |
| Mirabela Nickel Ltd. (Australia)(b) | | 1.00% | | 9/10/2044 | | | 185 | | | | 19 | (c) |
| Nexa Resources SA (Brazil)†(b) | | 5.375% | | 5/4/2027 | | | 14,189 | | | | 13,781,066 | |
| Novelis Corp.† | | 5.875% | | 9/30/2026 | | | 8,892 | | | | 7,891,650 | |
| Novelis Corp.† | | 6.25% | | 8/15/2024 | | | 8,652 | | | | 8,154,510 | |
| Peabody Energy Corp.† | | 6.375% | | 3/31/2025 | | | 26,254 | | | | 24,481,855 | |
| Rain CII Carbon LLC/CII Carbon Corp.† | | 7.25% | | 4/1/2025 | | | 20,273 | | | | 18,448,430 | |
| Warrior Met Coal, Inc.† | | 8.00% | | 11/1/2024 | | | 10,469 | | | | 10,416,655 | |
| Total | | | | | | | | | | | 248,823,187 | |
| | | | | | | | | | | | | |
| Monoline Insurance 0.09% | | | | | | | | | | | | |
| MGIC Investment Corp. | | 5.75% | | 8/15/2023 | | | 10,670 | | | | 10,656,663 | |
| | | | | | | | | | | | | |
| Non-Electric Utilities 0.10% | | | | | | | | | | | | |
| Brooklyn Union Gas Co. (The)† | | 3.407% | | 3/10/2026 | | | 11,916 | | | | 11,690,100 | |
| | | | | | | | | | | | | |
| Oil Field Equipment & Services 1.42% | | | | | | | | | | | | |
| Abu Dhabi Crude Oil Pipeline LLC (United Arab Emirates)†(b) | | 4.60% | | 11/2/2047 | | | 28,472 | | | | 27,873,946 | |
| CSI Compressco LP/CSI Compressco Finance, Inc.† | | 7.50% | | 4/1/2025 | | | 15,663 | | | | 14,644,905 | |
| Ensco plc (United Kingdom)(b) | | 4.50% | | 10/1/2024 | | | 16,899 | | | | 11,068,845 | |
| Ensco plc (United Kingdom)(b) | | 5.20% | | 3/15/2025 | | | 33,214 | | | | 22,253,380 | |
| Forum Energy Technologies, Inc. | | 6.25% | | 10/1/2021 | | | 11,835 | | | | 10,473,975 | |
| Noble Holding International Ltd.† | | 7.875% | | 2/1/2026 | | | 24,835 | | | | 21,264,969 | |
| Pioneer Energy Services Corp. | | 6.125% | | 3/15/2022 | | | 7,266 | | | | 4,468,590 | |
| Precision Drilling Corp. (Canada)(b) | | 5.25% | | 11/15/2024 | | | 13,978 | | | | 11,671,630 | |
| Rowan Cos., Inc. | | 4.75% | | 1/15/2024 | | | 15,436 | | | | 11,731,360 | |
| Transocean Phoenix 2 Ltd.† | | 7.75% | | 10/15/2024 | | | 7,482 | | | | 7,482,400 | |
| Transocean Pontus Ltd.† | | 6.125% | | 8/1/2025 | | | 6,741 | | | | 6,538,770 | |
| Transocean Proteus Ltd.† | | 6.25% | | 12/1/2024 | | | 10,600 | | | | 10,202,500 | |
| Transocean, Inc.† | | 7.50% | | 1/15/2026 | | | 12,803 | | | | 11,298,647 | |
| Unit Corp. | | 6.625% | | 5/15/2021 | | | 2,445 | | | | 2,237,175 | |
| Total | | | | | | | | | | | 173,211,092 | |
| 30 | See Notes to Financial Statements. |
Schedule of Investments (continued)
December 31, 2018
| Investments | | Interest
Rate | | Maturity
Date | | Principal
Amount
(000) | | | Fair
Value | |
| Oil Refining & Marketing 0.32% | | | | | | | | | | | | |
| Citgo Holding, Inc.† | | 10.75% | | 2/15/2020 | | $ | 23,028 | | | $ | 23,546,130 | |
| Tupras Turkiye Petrol Rafinerileri AS (Turkey)†(b) | | 4.50% | | 10/18/2024 | | | 17,115 | | | | 15,021,151 | |
| Total | | | | | | | | | | | 38,567,281 | |
| | | | | | | | | | | | | |
| Packaging 0.30% | | | | | | | | | | | | |
| Crown Cork & Seal Co., Inc. | | 7.375% | | 12/15/2026 | | | 11,810 | | | | 12,636,700 | |
| Pactiv LLC | | 7.95% | | 12/15/2025 | | | 11,829 | | | | 11,592,420 | |
| Sealed Air Corp.† | | 6.875% | | 7/15/2033 | | | 12,427 | | | | 12,458,068 | |
| Total | | | | | | | | | | | 36,687,188 | |
| | | | | | | | | | | | | |
| Personal & Household Products 0.86% | | | | | | | | | | | | |
| Church & Dwight Co., Inc. | | 3.15% | | 8/1/2027 | | | 22,128 | | | | 20,865,102 | |
| Church & Dwight Co., Inc. | | 3.95% | | 8/1/2047 | | | 5,392 | | | | 4,932,154 | |
| Energizer Gamma Acquisition, Inc.† | | 6.375% | | 7/15/2026 | | | 12,362 | | | | 11,373,040 | |
| Gibson Brands, Inc.†(k) | | 8.88% | | 8/1/2018 | | | 19,905 | | | | 16,620,675 | |
| Mattel, Inc. | | 2.35% | | 8/15/2021 | | | 28,026 | | | | 24,943,140 | |
| Mattel, Inc.† | | 6.75% | | 12/31/2025 | | | 14,059 | | | | 12,578,447 | |
| SC Johnson & Son, Inc.† | | 4.75% | | 10/15/2046 | | | 12,635 | | | | 13,741,249 | |
| Total | | | | | | | | | | | 105,053,807 | |
| | | | | | | | | | | | | |
| Pharmaceuticals 1.65% | | | | | | | | | | | | |
| Bausch Health Cos., Inc.†(a) | | 4.50% | | 5/15/2023 | | EUR | 31,388 | | | | 34,095,782 | |
| Bausch Health Cos., Inc.† | | 5.50% | | 3/1/2023 | | $ | 22,796 | | | | 20,868,370 | |
| Bausch Health Cos., Inc.† | | 5.625% | | 12/1/2021 | | | 41,550 | | | | 40,952,719 | |
| Bausch Health Cos., Inc.† | | 5.875% | | 5/15/2023 | | | 20,719 | | | | 19,242,771 | |
| Bausch Health Cos., Inc.† | | 7.00% | | 3/15/2024 | | | 12,232 | | | | 12,384,900 | |
| Elanco Animal Health, Inc.† | | 4.90% | | 8/28/2028 | | | 13,882 | | | | 14,160,756 | |
| Teva Pharmaceutical Finance Netherlands II BV(a) | | 1.875% | | 3/31/2027 | | EUR | 13,100 | | | | 12,041,453 | |
| Teva Pharmaceutical Finance Netherlands III BV (Netherlands)(b) | | 3.15% | | 10/1/2026 | | $ | 20,877 | | | | 15,967,935 | |
| Valeant Pharmaceuticals International† | | 8.50% | | 1/31/2027 | | | 18,551 | | | | 18,040,847 | |
| Zoetis, Inc. | | 3.90% | | 8/20/2028 | | | 13,486 | | | | 13,246,873 | |
| Total | | | | | | | | | | | 201,002,406 | |
| | | | | | | | | | | | | |
| Printing & Publishing 0.15% | | | | | | | | | | | | |
| Meredith Corp.† | | 6.875% | | 2/1/2026 | | | 18,864 | | | | 18,486,720 | |
| | | | | | | | | | | | | |
| Property & Casualty 0.21% | | | | | | | | | | | | |
| Allstate Corp. (The) | | 3.28% | | 12/15/2026 | | | 12,471 | | | | 12,250,094 | |
| Arch Capital Finance LLC | | 4.011% | | 12/15/2026 | | | 13,319 | | | | 13,329,222 | |
| Total | | | | | | | | | | | 25,579,316 | |
| | See Notes to Financial Statements. | 31 |
Schedule of Investments (continued)
December 31, 2018
| Investments | | Interest
Rate | | Maturity
Date | | Principal
Amount
(000) | | | Fair
Value | |
| Rail 0.56% | | | | | | | | | | | | |
| Central Japan Railway Co. (Japan)†(b) | | 4.25% | | 11/24/2045 | | $ | 17,006 | | | $ | 17,836,052 | |
| China Railway Xunjie Co. Ltd. (China)(b) | | 3.25% | | 7/28/2026 | | | 4,608 | | | | 4,311,784 | |
| Rumo Luxembourg Sarl (Luxembourg)†(b) | | 5.875% | | 1/18/2025 | | | 20,674 | | | | 19,834,326 | |
| Rumo Luxembourg Sarl (Luxembourg)†(b) | | 7.375% | | 2/9/2024 | | | 14,853 | | | | 15,519,900 | |
| Watco Cos. LLC/Watco Finance Corp.† | | 6.375% | | 4/1/2023 | | | 10,514 | | | | 10,592,855 | |
| Total | | | | | | | | | | | 68,094,917 | |
| | | | | | | | | | | | | |
| Real Estate Development & Management 0.19% | | | | | | | | | | | | |
| Ontario Teachers’ Cadillac Fairview Properties Trust (Canada)†(b) | | 3.875% | | 3/20/2027 | | | 23,275 | | | | 23,201,997 | |
| | | | | | | | | | | | | |
| Real Estate Investment Trusts 0.83% | | | | | | | | | | | | |
| Alexandria Real Estate Equities, Inc. | | 3.95% | | 1/15/2028 | | | 14,750 | | | | 14,281,485 | |
| EPR Properties | | 4.50% | | 6/1/2027 | | | 13,546 | | | | 13,085,572 | |
| EPR Properties | | 4.75% | | 12/15/2026 | | | 9,030 | | | | 8,951,198 | |
| Goodman US Finance Four LLC† | | 4.50% | | 10/15/2037 | | | 11,486 | | | | 10,981,891 | |
| Goodman US Finance Three LLC† | | 3.70% | | 3/15/2028 | | | 7,763 | | | | 7,406,936 | |
| National Retail Properties, Inc. | | 4.30% | | 10/15/2028 | | | 20,243 | | | | 20,394,694 | |
| Prologis LP | | 3.875% | | 9/15/2028 | | | 8,980 | | | | 9,165,709 | |
| VEREIT Operating Partnership LP | | 4.875% | | 6/1/2026 | | | 17,065 | | | | 17,091,343 | |
| Total | | | | | | | | | | | 101,358,828 | |
| | | | | | | | | | | | | |
| Recreation & Travel 0.58% | | | | | | | | | | | | |
| eDreams ODIGEO SA†(a) | | 5.50% | | 9/1/2023 | | EUR | 11,565 | | | | 12,452,777 | |
| Royal Caribbean Cruises Ltd. | | 7.50% | | 10/15/2027 | | $ | 16,918 | | | | 20,146,117 | |
| Silversea Cruise Finance Ltd.† | | 7.25% | | 2/1/2025 | | | 18,091 | | | | 19,216,260 | |
| Six Flags Entertainment Corp.† | | 4.875% | | 7/31/2024 | | | 13,503 | | | | 12,760,335 | |
| Six Flags Entertainment Corp.† | | 5.50% | | 4/15/2027 | | | 6,860 | | | | 6,482,700 | |
| Total | | | | | | | | | | | 71,058,189 | |
| | | | | | | | | | | | | |
| Reinsurance 0.45% | | | | | | | | | | | | |
| AXIS Specialty Finance plc (United Kingdom)(b) | | 5.15% | | 4/1/2045 | | | 16,694 | | | | 16,087,210 | |
| Berkshire Hathaway, Inc. | | 2.75% | | 3/15/2023 | | | 7,903 | | | | 7,762,294 | |
| Berkshire Hathaway, Inc. | | 3.125% | | 3/15/2026 | | | 7,903 | | | | 7,671,064 | |
| Transatlantic Holdings, Inc. | | 8.00% | | 11/30/2039 | | | 17,809 | | | | 23,840,231 | |
| Total | | | | | | | | | | | 55,360,799 | |
| | | | | | | | | | | | | |
| Restaurants 0.55% | | | | | | | | | | | | |
| Darden Restaurants, Inc. | | 3.85% | | 5/1/2027 | | | 4,496 | | | | 4,335,155 | |
| Darden Restaurants, Inc. | | 4.55% | | 2/15/2048 | | | 8,095 | | | | 7,478,598 | |
| IRB Holding Corp.† | | 6.75% | | 2/15/2026 | | | 13,514 | | | | 11,858,535 | |
| 32 | See Notes to Financial Statements. | |
Schedule of Investments (continued)
December 31, 2018
| Investments | | Interest
Rate | | Maturity
Date | | Principal
Amount
(000) | | | Fair
Value | |
| Restaurants (continued) | | | | | | | | | | | | |
| KFC Holding Co./Pizza Hut Holdings LLC/Taco Bell of America LLC† | | 4.75% | | 6/1/2027 | | $ | 25,312 | | | $ | 23,603,440 | |
| KFC Holding Co./Pizza Hut Holdings LLC/Taco Bell of America LLC† | | 5.00% | | 6/1/2024 | | | 20,332 | | | | 19,671,210 | |
| Total | | | | | | | | | | | 66,946,938 | |
| | | | | | | | | | | | | |
| Software/Services 2.85% | | | | | | | | | | | | |
| Alibaba Group Holding Ltd. (China)(b) | | 3.125% | | 11/28/2021 | | | 18,436 | | | | 18,249,322 | |
| Autodesk, Inc. | | 3.50% | | 6/15/2027 | | | 27,008 | | | | 25,174,588 | |
| Banff Merger Sub, Inc.† | | 9.75% | | 9/1/2026 | | | 13,245 | | | | 12,152,288 | |
| Citrix Systems, Inc. | | 4.50% | | 12/1/2027 | | | 17,872 | | | | 17,122,755 | |
| First Data Corp.† | | 5.75% | | 1/15/2024 | | | 37,266 | | | | 36,533,350 | |
| j2 Cloud Services LLC/j2 Global Co-Obligor, Inc.† | | 6.00% | | 7/15/2025 | | | 13,134 | | | | 12,887,737 | |
| Match Group, Inc.† | | 5.00% | | 12/15/2027 | | | 28,090 | | | | 25,913,025 | |
| Microsoft Corp. | | 2.40% | | 8/8/2026 | | | 22,252 | | | | 20,844,932 | |
| Microsoft Corp. | | 3.125% | | 11/3/2025 | | | 33,202 | | | | 32,884,051 | |
| Microsoft Corp. | | 3.30% | | 2/6/2027 | | | 26,383 | | | | 26,174,460 | |
| Microsoft Corp. | | 4.50% | | 2/6/2057 | | | 21,428 | | | | 22,932,613 | |
| salesforce.com, Inc. | | 3.70% | | 4/11/2028 | | | 17,807 | | | | 17,932,266 | |
| Tencent Holdings Ltd. (China)†(b) | | 3.595% | | 1/19/2028 | | | 19,777 | | | | 18,613,929 | |
| Tencent Holdings Ltd. (China)†(b) | | 3.925% | | 1/19/2038 | | | 23,479 | | | | 20,984,168 | |
| VeriSign, Inc. | | 4.75% | | 7/15/2027 | | | 8,783 | | | | 8,269,634 | |
| VeriSign, Inc. | | 5.25% | | 4/1/2025 | | | 15,945 | | | | 15,845,344 | |
| Visa, Inc. | | 3.15% | | 12/14/2025 | | | 14,645 | | | | 14,411,821 | |
| Total | | | | | | | | | | | 346,926,283 | |
| | | | | | | | | | | | | |
| Specialty Retail 1.41% | | | | | | | | | | | | |
| Asbury Automotive Group, Inc. | | 6.00% | | 12/15/2024 | | | 13,310 | | | | 12,810,875 | |
| Best Buy Co., Inc. | | 4.45% | | 10/1/2028 | | | 26,980 | | | | 25,799,801 | |
| Claire’s Stores, Inc. | | 14.00% | | 3/15/2039 | | | 2,500 | | | | 4,020,825 | |
| Guitar Center Escrow Issuer, Inc.† | | 9.50% | | 10/15/2021 | | | 13,342 | | | | 12,374,705 | |
| Hot Topic, Inc.† | | 9.25% | | 6/15/2021 | | | 10,679 | | | | 10,518,815 | |
| Levi Strauss & Co.(a) | | 3.375% | | 3/15/2027 | | EUR | 11,100 | | | | 12,706,744 | |
| PetSmart, Inc.† | | 5.875% | | 6/1/2025 | | $ | 16,272 | | | | 11,837,880 | |
| PVH Corp.(a) | | 3.125% | | 12/15/2027 | | EUR | 11,316 | | | | 12,167,393 | |
| Tapestry, Inc. | | 4.125% | | 7/15/2027 | | $ | 16,634 | | | | 15,600,348 | |
| Tiffany & Co. | | 4.90% | | 10/1/2044 | | | 18,993 | | | | 17,093,876 | |
| Under Armour, Inc. | | 3.25% | | 6/15/2026 | | | 16,094 | | | | 13,430,084 | |
| Weight Watchers International, Inc.† | | 8.625% | | 12/1/2025 | | | 22,325 | | | | 22,855,219 | |
| Total | | | | | | | | | | | 171,216,565 | |
| | See Notes to Financial Statements. | 33 |
Schedule of Investments (continued)
December 31, 2018
| Investments | | Interest
Rate | | Maturity
Date | | Principal
Amount
(000) | | | Fair
Value | |
| Steel Producers/Products 0.33% | | | | | | | | | | | | |
| Allegheny Technologies, Inc. | | 7.875% | | 8/15/2023 | | $ | 17,595 | | | $ | 18,012,881 | |
| Joseph T Ryerson & Son, Inc.† | | 11.00% | | 5/15/2022 | | | 6,884 | | | | 6,952,840 | |
| Steel Dynamics, Inc. | | 4.125% | | 9/15/2025 | | | 10,927 | | | | 10,093,816 | |
| Steel Dynamics, Inc. | | 5.00% | | 12/15/2026 | | | 5,285 | | | | 5,020,750 | |
| Total | | | | | | | | | | | 40,080,287 | |
| | | | | | | | | | | | | |
| Support: Services 2.26% | | | | | | | | | | | | |
| AECOM | | 5.125% | | 3/15/2027 | | | 3,205 | | | | 2,756,300 | |
| Ahern Rentals, Inc.† | | 7.375% | | 5/15/2023 | | | 13,025 | | | | 10,485,125 | |
| Ashtead Capital, Inc.† | | 4.375% | | 8/15/2027 | | | 13,664 | | | | 12,365,920 | |
| Brand Industrial Services, Inc.† | | 8.50% | | 7/15/2025 | | | 19,863 | | | | 17,032,523 | |
| Brink’s Co. (The)† | | 4.625% | | 10/15/2027 | | | 18,978 | | | | 17,369,235 | |
| Cleveland Clinic Foundation (The) | | 4.858% | | 1/1/2114 | | | 8,223 | | | | 8,462,250 | |
| Cloud Crane LLC† | | 10.125% | | 8/1/2024 | | | 9,910 | | | | 10,207,300 | |
| Garda World Security Corp. (Canada)†(b) | | 8.75% | | 5/15/2025 | | | 13,762 | | | | 12,592,230 | |
| IHS Markit Ltd. (United Kingdom)†(b) | | 4.00% | | 3/1/2026 | | | 29,435 | | | | 27,448,137 | |
| IHS Markit Ltd. (United Kingdom)(b) | | 4.75% | | 8/1/2028 | | | 17,974 | | | | 17,570,124 | |
| Jurassic Holdings III, Inc.† | | 6.875% | | 2/15/2021 | | | 16,782 | | | | 14,264,700 | |
| Marble II Pte Ltd. (Singapore)†(b) | | 5.30% | | 6/20/2022 | | | 26,573 | | | | 25,719,528 | |
| Metropolitan Museum of Art (The) | | 3.40% | | 7/1/2045 | | | 23,378 | | | | 22,126,113 | |
| Monitronics International, Inc. | | 9.125% | | 4/1/2020 | | | 10,520 | | | | 2,722,050 | |
| Prime Security Services Borrower LLC/Prime Finance, Inc.† | | 9.25% | | 5/15/2023 | | | 13,503 | | | | 13,958,726 | |
| Ritchie Bros Auctioneers, Inc. (Canada)†(b) | | 5.375% | | 1/15/2025 | | | 13,118 | | | | 12,790,050 | |
| United Rentals North America, Inc. | | 4.625% | | 10/15/2025 | | | 11,437 | | | | 10,236,115 | |
| United Rentals North America, Inc. | | 4.875% | | 1/15/2028 | | | 21,596 | | | | 19,004,480 | |
| United Rentals North America, Inc. | | 5.875% | | 9/15/2026 | | | 6,713 | | | | 6,352,176 | |
| WeWork Cos., Inc.† | | 7.875% | | 5/1/2025 | | | 13,453 | | | | 12,006,803 | |
| Total | | | | | | | | | | | 275,469,885 | |
| | | | | | | | | | | | | |
| Technology Hardware & Equipment 0.96% | | | | | | | | | | | | |
| Banff Merger Sub, Inc.†(a) | | 8.375% | | 9/1/2026 | | EUR | 11,553 | | | | 12,287,473 | |
| CDW LLC/CDW Finance Corp. | | 5.50% | | 12/1/2024 | | $ | 15,000 | | | | 14,887,500 | |
| Dell International LLC/EMC Corp.† | | 6.02% | | 6/15/2026 | | | 20,895 | | | | 21,029,343 | |
| Dell International LLC/EMC Corp.† | | 7.125% | | 6/15/2024 | | | 30,859 | | | | 31,422,783 | |
| HP, Inc. | | 6.00% | | 9/15/2041 | | | 13,421 | | | | 13,405,781 | |
| Western Digital Corp. | | 4.75% | | 2/15/2026 | | | 27,985 | | | | 24,381,931 | |
| Total | | | | | | | | | | | 117,414,811 | |
| 34 | See Notes to Financial Statements. | |
Schedule of Investments (continued)
December 31, 2018
| Investments | | Interest
Rate | | Maturity
Date | | Principal
Amount
(000) | | | Fair
Value | |
| Telecommunications: Satellite 0.52% | | | | | | | | | | | | |
| Intelsat Connect Finance SA (Luxembourg)†(b) | | 9.50% | | 2/15/2023 | | $ | 14,157 | | | $ | 12,245,805 | |
| Intelsat Jackson Holdings SA (Luxembourg)(b) | | 5.50% | | 8/1/2023 | | | 28,802 | | | | 25,201,750 | |
| Intelsat Jackson Holdings SA (Luxembourg)†(b) | | 8.50% | | 10/15/2024 | | | 26,155 | | | | 25,501,125 | |
| Total | | | | | | | | | | | 62,948,680 | |
| | | | | | | | | | | | | |
| Telecommunications: Wireless 1.44% | | | | | | | | | | | | |
| Sprint Capital Corp. | | 6.875% | | 11/15/2028 | | | 100,288 | | | | 95,022,880 | |
| T-Mobile USA, Inc. | | 6.00% | | 4/15/2024 | | | 13,317 | | | | 13,350,293 | |
| T-Mobile USA, Inc. | | 6.375% | | 3/1/2025 | | | 27,346 | | | | 27,755,096 | |
| T-Mobile USA, Inc. | | 6.50% | | 1/15/2026 | | | 38,271 | | | | 39,132,097 | |
| Total | | | | | | | | | | | 175,260,366 | |
| | | | | | | | | | | | | |
| Telecommunications: Wireline Integrated & Services 2.28% | | | | | | | | |
| CenturyLink, Inc. | | 5.625% | | 4/1/2025 | | | 21,924 | | | | 19,347,930 | |
| CenturyLink, Inc. | | 7.50% | | 4/1/2024 | | | 55,045 | | | | 53,256,037 | |
| DKT Finance ApS (Denmark)†(b) | | 9.375% | | 6/17/2023 | | | 19,101 | | | | 19,626,278 | |
| Equinix, Inc.(a) | | 2.875% | | 2/1/2026 | | EUR | 37,001 | | | | 40,292,207 | |
| GCI LLC | | 6.875% | | 4/15/2025 | | $ | 13,026 | | | | 12,700,350 | |
| Hellas Telecommunications Luxembourg II SCA (Luxembourg)†(b)(k) | | Zero Coupon | | 1/15/2015 | | | 15,000 | | | | 1,500 | (c) |
| InterXion Holding NV†(a) | | 4.75% | | 6/15/2025 | | EUR | 16,771 | | | | 19,747,749 | |
| Level 3 Financing, Inc. | | 5.25% | | 3/15/2026 | | $ | 9,860 | | | | 9,046,550 | |
| Motorola Solutions, Inc. | | 4.60% | | 2/23/2028 | | | 13,419 | | | | 13,152,671 | |
| Uniti Group LP/Uniti Group Finance, Inc./CSL Capital LLC | | 8.25% | | 10/15/2023 | | | 21,109 | | | | 18,470,375 | |
| Verizon Communications, Inc. | | 2.625% | | 8/15/2026 | | | 64,987 | | | | 59,050,441 | |
| WTT Investment Ltd. (Hong Kong)†(b) | | 5.50% | | 11/21/2022 | | | 13,508 | | | | 13,213,776 | |
| Total | | | | | | | | | | | 277,905,864 | |
| | | | | | | | | | | | | |
| Theaters & Entertainment 0.07% | | | | | | | | | | | | |
| AMC Entertainment Holdings, Inc. | | 5.875% | | 11/15/2026 | | | 9,360 | | | | 8,049,600 | |
| | | | | | | | | | | | | |
| Tobacco 0.16% | | | | | | | | | | | | |
| Imperial Brands Finance PLC (United Kingdom)†(b) | | 4.25% | | 7/21/2025 | | | 19,446 | | | | 19,162,276 | |
| | | | | | | | | | | | | |
| Transportation: Infrastructure/Services 1.02% | | | | | | | | | | | | |
| Aeropuerto Internacional de Tocumen SA (Panama)†(b) | | 6.00% | | 11/18/2048 | | | 22,350 | | | | 22,265,070 | |
| Autopistas del Sol SA (Costa Rica)†(b) | | 7.375% | | 12/30/2030 | | | 12,537 | | | | 11,471,271 | |
| Autoridad del Canal de Panama (Panama)†(b) | | 4.95% | | 7/29/2035 | | | 8,750 | | | | 8,946,962 | |
| CH Robinson Worldwide, Inc. | | 4.20% | | 4/15/2028 | | | 20,351 | | | | 20,458,147 | |
| | See Notes to Financial Statements. | 35 |
Schedule of Investments (continued)
December 31, 2018
| Investments | | Interest
Rate | | Maturity
Date | | Principal
Amount
(000) | | | Fair
Value | |
| Transportation: Infrastructure/Services (continued) | | | | | | | | | | | | |
| Delhi International Airport Ltd. (India)†(b) | | 6.125% | | 10/31/2026 | | $ | 7,372 | | | $ | 7,169,639 | |
| Kirby Corp. | | 4.20% | | 3/1/2028 | | | 18,006 | | | | 17,653,116 | |
| Promontoria Holding BV†(a) | | 6.75% | | 8/15/2023 | | EUR | 11,540 | | | | 12,844,094 | |
| Stena AB (Sweden)†(b) | | 7.00% | | 2/1/2024 | | $ | 14,542 | | | | 13,305,930 | |
| XPO CNW, Inc. | | 6.70% | | 5/1/2034 | | | 12,256 | | | | 10,478,880 | |
| Total | | | | | | | | | | | 124,593,109 | |
| Total High Yield Corporate Bonds (cost $8,499,009,489) | | | | | | | | | | | 8,066,100,043 | |
| | | | | | | | | | | | | |
| MUNICIPAL BONDS 4.41% | | | | | | | | | | | | |
| | | | | | | | | | | | | |
| Air Transportation 0.31% | | | | | | | | | | | | |
| Los Angeles, CA | | 5.575% | | 5/15/2020 | | | 9,340 | | | | 9,666,713 | |
| Miami Dade Cnty, FL | | 3.982% | | 10/1/2041 | | | 9,660 | | | | 9,297,364 | |
| Miami-Dade Cnty, FL | | 4.28% | | 10/1/2041 | | | 18,040 | | | | 18,276,504 | |
| Total | | | | | | | | | | | 37,240,581 | |
| | | | | | | | | | | | | |
| Education 1.10% | | | | | | | | | | | | |
| California St Univ | | 3.899% | | 11/1/2047 | | | 33,030 | | | | 32,371,382 | |
| Ohio Univ | | 5.59% | | 12/1/2114 | | | 8,904 | | | | 10,176,916 | |
| Permanent University Fund - Texas A&M University System | | 3.66% | | 7/1/2047 | | | 78,015 | | | | 75,109,722 | |
| Univ of California Bd of Regents | | 6.548% | | 5/15/2048 | | | 12,463 | | | | 16,475,961 | |
| Total | | | | | | | | | | | 134,133,981 | |
| | | | | | | | | | | | | |
| General Obligation 1.30% | | | | | | | | | | | | |
| California | | 7.55% | | 4/1/2039 | | | 15,015 | | | | 21,561,390 | |
| Chicago Transit Auth, IL | | 6.899% | | 12/1/2040 | | | 8,926 | | | | 11,425,637 | |
| Chicago, IL | | 5.432% | | 1/1/2042 | | | 22,392 | | | | 19,898,651 | |
| Chicago, IL | | 6.314% | | 1/1/2044 | | | 22,402 | | | | 22,120,183 | |
| District of Columbia | | 5.591% | | 12/1/2034 | | | 14,130 | | | | 16,802,972 | |
| Honolulu City & Cnty, HI | | 5.418% | | 12/1/2027 | | | 6,620 | | | | 7,790,350 | |
| Los Angeles Unif Sch Dist, CA | | 5.75% | | 7/1/2034 | | | 8,927 | | | | 10,584,476 | |
| Massachusetts | | 4.20% | | 12/1/2021 | | | 7,355 | | | | 7,537,625 | |
| New York City | | 5.985% | | 12/1/2036 | | | 10,161 | | | | 12,310,763 | |
| Ohio St Univ | | 4.048% | | 12/1/2056 | | | 6,271 | | | | 6,250,807 | |
| Pennsylvania | | 5.45% | | 2/15/2030 | | | 12,190 | | | | 14,053,119 | |
| The Bd of Governors of the Univ of North Carolina | | 3.847% | | 12/1/2034 | | | 7,950 | | | | 8,294,076 | |
| Total | | | | | | | | | | | 158,630,049 | |
| 36 | See Notes to Financial Statements. | |
Schedule of Investments (continued)
December 31, 2018
| Investments | | Interest
Rate | | Maturity
Date | | Principal
Amount
(000) | | | Fair
Value | |
| Government Guaranteed 0.04% | | | | | | | | | | |
| City & County of San Francisco CA | | 5.45% | | 6/15/2025 | | $ | 4,540 | | | $ | 5,137,600 | |
| | | | | | | | | | | | | |
| Lease Obligation 0.05% | | | | | | | | | | | | |
| Wisconsin Gen Fund Annual | | 3.294% | | 5/1/2037 | | | 7,145 | | | | 6,487,017 | |
| | | | | | | | | | | | | |
| Miscellaneous 0.74% | | | | | | | | | | | | |
| Dallas Convention Center Hotel Dev Corp., TX | | 7.088% | | 1/1/2042 | | | 17,795 | | | | 22,936,865 | |
| New York City Indl Dev Agy† | | 11.00% | | 3/1/2029 | | | 22,198 | | | | 29,277,386 | |
| Pasadena Public Fing Auth | | 7.148% | | 3/1/2043 | | | 26,795 | | | | 37,568,198 | |
| Total | | | | | | | | | | | 89,782,449 | |
| | | | | | | | | | | | | |
| Tax Revenue 0.47% | | | | | | | | | | | | |
| Massachusetts Sch Bldg Auth | | 5.715% | | 8/15/2039 | | | 20,055 | | | | 24,613,902 | |
| Memphis-Shelby County Industrial Development Board, TN | | 7.00% | | 7/1/2045 | | | 12,890 | | | | 13,403,409 | |
| San Jose Redev Agy, CA | | 2.259% | | 8/1/2020 | | | 19,600 | | | | 19,430,852 | |
| Total | | | | | | | | | | | 57,448,163 | |
| | | | | | | | | | | | | |
| Transportation: Infrastructure/Services 0.26% | | | | | | | | | | | | |
| Chicago Transit Auth, IL | | 6.20% | | 12/1/2040 | | | 12,385 | | | | 15,072,545 | |
| Port of Seattle, WA | | 3.571% | | 5/1/2032 | | | 6,380 | | | | 6,261,396 | |
| Port of Seattle, WA | | 3.755% | | 5/1/2036 | | | 10,835 | | | | 10,656,764 | |
| Total | | | | | | | | | | | 31,990,705 | |
| | | | | | | | | | | | | |
| Utilities 0.14% | | | | | | | | | | | | |
| San Antonio, TX Elec & Gas | | 5.718% | | 2/1/2041 | | | 13,240 | | | | 16,491,612 | |
| Total Municipal Bonds (cost $539,585,571) | | | | | | | | | | | 537,342,157 | |
| | | | | | | | | | | | | |
| NON-AGENCY COMMERCIAL MORTGAGE-BACKED SECURITY 0.37% | | | | | | | | | |
Caesars Palace Las Vegas Trust 2017-VICI D†
(cost $45,508,794) | | 4.354% | #(m) | 10/15/2034 | | | 44,851 | | | | 44,940,841 | |
| | | | | | | | | | | | | |
| | | Dividend
Rate | | | | Shares
(000) | | | | | |
| PREFERRED STOCK 0.01% | | | | | | | | | | | | |
| | | | | | | | | | | | | |
| Energy: Exploration & Production | | | | | | | | | | | | |
Templar Energy LLC
(cost $3,769,749) | | Zero Coupon | | | | | 378 | | | | 1,135,289 | |
| | See Notes to Financial Statements. | 37 |
Schedule of Investments (continued)
December 31, 2018
| Investments | | Interest
Rate | | Maturity
Date | | Principal
Amount
(000) | | | Fair
Value | |
| U.S. TREASURY OBLIGATIONS 2.16% | | | | | | | | | | |
| | | | | | | | | | | |
| Government | | | | | | | | | | | | |
| U.S. Treasury Inflation Indexed Note(n) | | 0.50% | | 1/15/2028 | | $ | 141,520 | | | $ | 135,155,653 | |
| U.S. Treasury Note | | 2.75% | | 5/31/2023 | | | 109,121 | | | | 110,329,798 | |
| U.S. Treasury Note | | 3.125% | | 11/15/2028 | | | 17,265 | | | | 17,923,321 | |
| Total | | | | | | | | | | | 263,408,772 | |
Total U.S. Treasury Obligations
(cost $261,724,513) | | | | | | | | | | | 263,408,772 | |
| | | | | | | | | | | | | |
| WARRANT 0.00% | | | | | | | | | | | | |
| | | | | | | | | | | | | |
| | | Exercise
Price | | Expiration
Date | | Shares
(000) | | | | | |
| Personal & Household Products | | | | | | | | | | | | |
Remington Outdoor Co., Inc.
(cost $871,457) | | $35.05 | | 5/15/2022 | | | 165 | | | | 1,651 | (d) |
Total Long-Term Investments
(cost $13,776,662,041) | | | | | | | | | | | 13,221,242,181 | |
| | | | | | | | | | | | | |
| | | | | | | Principal
Amount
(000) | | | | | |
| SHORT-TERM INVESTMENT 0.17% | | | | | | | | | | | | |
| | | | | | | | | | | | | |
| REPURCHASE AGREEMENT | | | | | | | | | | | | |
Repurchase Agreement dated 12/31/2018, 1.45% due 1/2/2019 with Fixed Income Clearing Corp. collateralized by $20,280,000 of U.S. Treasury Note at 2.875% due 7/31/2025; $345,000 of U.S. Treasury Note at 2.00% due 8/15/2025; value: $21,143,406; proceeds: $20,727,245
(cost $20,725,575) | | | | | | $ | 20,726 | | | | 20,725,575 | |
| Total Investments in Securities 108.73% (cost $13,797,387,616) | | | | | | | | | 13,241,967,756 | |
| Less Unfunded Loan Commitments (0.11%) (cost $13,484,922) | | | | | | | | | (13,406,167 | ) |
| Net Investments in Securities 108.62% (cost $13,783,902,694) | | | | | | | | | 13,228,561,589 | |
| Liabilities in Excess of Cash and Other Assets(o)(8.62%) | | | | | | | | | (1,049,862,015 | ) |
| Net Assets 100.00% | | | | | | | | | | $ | 12,178,699,574 | |
| 38 | See Notes to Financial Statements. |
Schedule of Investments (continued)
December 31, 2018
| AUD | Australian dollar. |
| BRL | Brazilian real. |
| CAD | Canadian dollar. |
| EUR | Euro. |
| UYU | Uruguayan Peso. |
| ADR | American Depositary Receipt. |
| EURIBOR | Euro Interbank Offered Rate. |
| LIBOR | London Interbank Offered Rate. |
| PIK | Payment-in-kind. |
| Units | More than one class of securities traded together. |
| † | | Security was purchased pursuant to Rule 144A under the Securities Act of 1933 and, unless registered under such Act or exempted from registration, may only be resold to qualified institutional buyers. |
| # | | Variable rate security. The interest rate represents the rate in effect at December 31, 2018. |
| * | | Non-income producing security. |
| (a) | | Investment in non-U.S. dollar denominated securities. |
| (b) | | Foreign security traded in U.S. dollars. |
| (c) | | Level 3 Investment as described in Note 2(p) in the Notes to Financials. Security fair valued by the Pricing Committee. |
| (d) | | Level 3 Investment as described in Note 2(p) in the Notes to Financials. Security valued utilizing third party pricing information without adjustment. Such valuations are based on unobservable inputs. A significant change in third party information could result in a significantly lower or higher value of such Level 3 investments. |
| (e) | | Floating Rate Loans in which the Fund invests generally pay interest at rates which are periodically re-determined at a margin above the London Interbank Offered Rate (“LIBOR”) or the prime rate offered by major U.S. banks. The rate(s) shown is the rate(s) in effect at December 31, 2018. |
| (f) | | Level 3 Investment as described in Note 2(p) in the Notes to Financials. Floating Rate Loans categorized as Level 3 are valued based on a single quotation obtained from a dealer. Accounting principles generally accepted in the United States of America do not require the Fund to create quantitative unobservable inputs that were not developed by the Fund. Therefore, the Fund does not have access to unobservable inputs and cannot disclose such inputs in the valuation. |
| (g) | | Interest rate to be determined. |
| (h) | | To-be-announced (“TBA”). Security purchased on a forward commitment basis with an approximate principal and maturity date. Actual principal and maturity will be determined upon settlement when the specific mortgage pools are assigned. |
| (i) | | Security is perpetual in nature and has no stated maturity. |
| (j) | | Variable Rate is Fixed to Float: Rate remains fixed until a designated future date. |
| (k) | | Defaulted (non-income producing security). |
| (l) | | Security has been fully or partially segregated for open reverse repurchase agreements as of December 31, 2018 (See Note 2(n)). |
| (m) | | Interest rate is based on the weighted average interest rates of the underlying mortgages within the mortgage pool. |
| (n) | | Treasury Inflation Protected Security. A U.S. Treasury Note or Bond that offers protection from inflation by paying a fixed rate of interest on principal amount that is adjusted for inflation based on the Consumer Price Index. |
| (o) | | Liabilities in Excess of Cash, Foreign Cash and Other Assets include net unrealized appreciation/depreciation on forward foreign currency exchange contracts, futures contracts, reverse repurchase agreements and swaps as follows: |
| | See Notes to Financial Statements. | 39 |
Schedule of Investments (continued)
December 31, 2018
Centrally Cleared Credit Default Swaps on Indexes - Buy Protection at December 31, 2018(1):
Referenced
Index | Central
Clearing party | Fund Pays
(Quarterly) | Termination
Date | Notional
Amount | Notional
Value | Payments
Upfront(2) | Unrealized
Appreciation(3) |
| Markit CDX.NA.IG.31(4)(5) | Credit Suisse | 1.00% | 12/20/2023 | $954,831,000 | $960,154,660 | $(11,831,686) | $6,508,026 |
| (1) | | If the Fund is a buyer of protection and a credit event occurs, as defined under the terms of that particular swap agreement, the Fund will either (i) receive from the seller of protection an amount equal to the notional amount of the swap and take delivery of the referenced obligation or underlying securities comprising the referenced index or (ii) receive a net settlement amount in the form of cash or securities equal to the notional amount of the swap less the recovery value of the referenced obligation or underlying securities. |
| (2) | | Upfront payments received by Central Clearing Party are presented net of amortization (See Note 2(i)). |
| (3) | | Total unrealized appreciation on Credit Default Swaps on Indexes amounted to $6,508,026. Total unrealized depreciation on Credit Default Swaps on Indexes amounted to $0. |
| (4) | | Central Clearinghouse: Intercontinental Exchange (ICE). |
| (5) | | The Referenced Index is for the Centrally Cleared Credit Default Swaps on Indexes, which is comprised of a basket of investment grade securities. |
Credit Default Swaps on Indexes/Issuer - Sell Protection at December 31, 2018(1):
Referenced
Index/Issuer | | Swap
Counterparty | | Fund
Receives
(Quarterly) | | Termi-
nation
Date | | Notional
Amount | | | Notional
Value | | | Payments
Upfront(2) | | | Unrealized
Appreciation
(Depreciation)(3) | | | Credit
Default
Swap
Agreements
Payable at
Fair Value(4) | |
| Markit CMBX. NA.BBB.9* | | Credit Suisse | | 3.00% | | 9/17/2058 | | $ | 22,888,000 | | | $ | 20,108,539 | | | $ | (1,873,599 | ) | | $ | (905,862 | ) | | $ | (2,779,461 | ) |
| Markit CMBX. NA.BBB.10* | | Credit Suisse | | 3.00% | | 11/17/2059 | | | 50,333,000 | | | | 44,542,919 | | | | (3,593,591 | ) | | | (2,196,490 | ) | | | (5,790,081 | ) |
| Markit CMBX. NA.BBB.9* | | Deutsche Bank | | 3.00% | | 9/17/2058 | | | 36,637,000 | | | | 32,187,895 | | | | (2,999,085 | ) | | | (1,450,020 | ) | | | (4,449,105 | ) |
| Markit CMBX. NA.BBB.10* | | Deutsche Bank | | 3.00% | | 11/17/2059 | | | 9,149,000 | | | | 8,096,540 | | | | (653,205 | ) | | | (399,255 | ) | | | (1,052,460 | ) |
| Markit CMBX. NA.BBB.11* | | Deutsche Bank | | 3.00% | | 11/18/2054 | | | 9,162,000 | | | | 8,007,962 | | | | (603,616 | ) | | | (550,422 | ) | | | (1,154,038 | ) |
| Markit CMBX. NA.BBB.9* | | Goldman Sachs | | 3.00% | | 9/17/2058 | | | 13,539,000 | | | | 11,894,858 | | | | (1,108,295 | ) | | | (535,847 | ) | | | (1,644,142 | ) |
| Markit CMBX. NA.BBB.10* | | Goldman Sachs | | 3.00% | | 11/17/2059 | | | 38,427,000 | | | | 34,006,532 | | | | (2,743,546 | ) | | | (1,676,922 | ) | | | (4,420,468 | ) |
| Markit CMBX. NA.BBB.11* | | J.P.Morgan Chase | | 3.00% | | 11/18/2054 | | | 4,607,000 | | | | 4,026,706 | | | | (303,521 | ) | | | (276,773 | ) | | | (580,294 | ) |
| Markit CMBX. NA.BBB.9* | | Morgan Stanley | | 3.00% | | 9/17/2058 | | | 56,159,000 | | | | 49,339,193 | | | | (4,597,144 | ) | | | (2,222,663 | ) | | | (6,819,807 | ) |
| Markit CMBX. NA.BBB.10* | | Morgan Stanley | | 3.00% | | 11/17/2059 | | | 84,071,000 | | | | 74,399,852 | | | | (6,002,360 | ) | | | (3,668,788 | ) | | | (9,671,148 | ) |
| Markit CMBX. NA.BBB.11* | | Morgan Stanley | | 3.00% | | 11/18/2054 | | | 120,987,000 | | | | 105,747,581 | | | | (7,970,929 | ) | | | (7,268,490 | ) | | | (15,239,419 | ) |
| Tesla | | J.P.Morgan Chase | | 1.00% | | 6/20/2020 | | | 15,704,000 | | | | 15,110,452 | | | | (978,073 | ) | | | 384,525 | | | | (593,548 | ) |
| | | | | | | | | | | | | | | | | $ | (33,426,964 | ) | | $ | (20,767,007 | ) | | $ | (54,193,971 | ) |
| * | The Referenced Index is for Credit Default Swaps on Indexes, which is comprised of a basket of emerging market sovereign issuers. (See Note 2(i)). |
| 40 | See Notes to Financial Statements. |
Schedule of Investments (continued)
December 31, 2018
| (1) | | If the Fund is a seller of protection and a credit event occurs, as defined under the terms of that particular swap agreement, the Fund will either (i) pay to the buyer of protection an amount equal to the notional amount of the swap and take delivery of the referenced obligation or underlying securities comprising the referenced index or (ii) pay a net settlement amount in the form of cash or securities equal to the notional amount of the swap less the recovery value of the referenced obligation or underlying securities. |
| (2) | | Upfront payments received by Central Clearinghouse are presented net of amortization (See Note 2(i)). |
| (3) | | Total unrealized appreciation on Credit Default Swaps in Indexes amounted to $384,525. Total unrealized depreciation on Credit Default Swaps on Indexes amounted to $21,151,532. |
| (4) | | Includes upfront payments received. |
Total Return Swap Contracts at December 31, 2018:
Swap
Counterparty | | Referenced
Index* | | Referenced
Spread | | Units | | Position | | Termination
Date | Notional
Amount | Notional
Value | | Unrealized
Appreciation |
| Goldman Sachs | | IBXXLL | | 3 Mo. LIBOR + .00% | | 154,457 | | Short | | 3/20/2019 | | $ | 25,775,000 | | $ | 25,169,915 | | | $ | 605,085 |
| Morgan Stanley | | IBXXLL | | 3 Mo. LIBOR + .00% | | 82,373 | | Short | | 3/20/2019 | | | 13,571,000 | | | 13,423,345 | | | | 147,655 |
| J.P.Morgan Chase | | IBXXLL | | 3 Mo. LIBOR + .00% | | 148,505 | | Short | | 3/20/2019 | | | 24,429,000 | | | 24,199,932 | | | | 229,068 |
| | | | | | | | | | | | | $ | 63,775,000 | | $ | 62,793,192 | | | $ | 981,808 |
| * | iBoxx Leverage Loan Index. |
Open Forward Foreign Currency Exchange Contracts at December 31, 2018:
Forward
Foreign
Currency
Exchange
Contracts | | Transaction
Type | | Counterparty | | Expiration
Date | | Foreign
Currency | | U.S. $
Cost on
Origination
Date | | U.S. $
Current
Value | | Unrealized
Appreciation |
| euro | | Buy | | J.P. Morgan | | 2/19/2019 | | 3,350,000 | | | $3,818,172 | | $ | 3,853,335 | | | $ | 35,163 |
| euro | | Buy | | Toronto Dominion Bank | | 4/10/2019 | | 6,500,000 | | | 7,477,698 | | | 7,509,350 | | | | 31,652 |
| Unrealized Appreciation on Forward Foreign Currency Exchange Contracts | | | | $ | 66,815 |
| | | | | | | | | | | | | | | | | | |
Forward
Foreign
Currency
Exchange
Contracts | | Transaction
Type | | Counterparty | | Expiration
Date | | Foreign
Currency | | U.S. $
Cost on
Origination
Date | | | U.S. $
Current
Value | | Unrealized
Depreciation |
| euro | | Sell | | State Street Bank and Trust | | 2/19/2019 | | 95,000,000 | | | $108,495,738 | | $ | 109,273,672 | | | $ | (777,934) |
| euro | | Sell | | Toronto Dominion Bank | | 3/7/2019 | | 196,500,000 | | | 224,494,176 | | | 226,330,257 | | | | (1,836,081) |
| euro | | Sell | | State Street Bank and Trust | | 4/10/2019 | | 11,329,000 | | | 13,019,524 | | | 13,088,220 | | | | (68,696) |
| Unrealized Depreciation on Forward Foreign Currency Exchange Contracts | | | | | | $ | (2,682,711) |
| | See Notes to Financial Statements. | 41 |
Schedule of Investments (continued)
December 31, 2018
Open Futures Contracts at December 31, 2018:
| | | | | | | | | Notional | | | Notional | | | Unrealized | |
| Type | | Expiration | | Contracts | | Position | | Amount | | | Value | | | Appreciation | |
| U.S. 2-Year Treasury Note | | March 2019 | | 8,690 | | Long | | $ | 1,836,743,103 | | | $ | 1,844,995,625 | | | $ | 8,252,522 | |
| U.S. 5-Year Treasury Note | | March 2019 | | 12,408 | | Long | | | 1,401,414,983 | | | | 1,423,042,500 | | | | 21,627,517 | |
| Total Unrealized Appreciation on Open Futures Contracts | | | | | | | | | | | | $ | 29,880,039 | |
| | | | | | | | | | | | | | | | | | | |
| | | | | | | | | Notional | | | Notional | | | Unrealized | |
| Type | | Expiration | | Contracts | | Position | | Amount | | | Value | | | Depreciation | |
| Euro-Bobl | | March 2019 | | 56 | | Short | | EUR | (7,409,260) | | | EUR | (7,421,120) | | | $ | (13,588 | ) |
| U.S. 10-Year Treasury Note | | March 2019 | | 293 | | Short | | $ | (34,896,250 | ) | | $ | (35,750,578 | ) | | | (854,328 | ) |
| U.S. 10-Year Ultra Treasury Bond | | March 2019 | | 60 | | Short | | | (7,560,830 | ) | | | (7,804,688 | ) | | | (243,858 | ) |
| U.S. Long Bond | | March 2019 | | 8,386 | | Short | | | (1,167,997,300 | ) | | | (1,224,356,000 | ) | | | (56,358,700 | ) |
| Ultra Long U.S. Treasury Bond | | March 2019 | | 376 | | Short | | | (57,218,902 | ) | | | (60,406,750 | ) | | | (3,187,848 | ) |
| Total Unrealized Depreciation on Open Futures Contracts | | | | | | | | | | | | $ | (60,658,322 | ) |
Reverse Repurchase Agreement Payable as of December 31, 2018:
| Counterparty | | Principal | | | Collateral
Held by
Counterparty | | Interest
Rate(1) | | Trade
Date | | Maturity
Date(2) | | Fair
Value(3) | |
| J.P. Morgan Chase & Co | | $ | 1,867,331 | | | $2,400,000 principal, Mohegan Gaming & Entertainment at 7.875% due 10/15/2024, $2,253,000 fair value | | (6.00)% | | 4/6/2019 | | On Demand | | $ | 1,783,301 | |
| (1) | | The negative interest rate on the reverse repurchase agreement results in interest income to the Fund. |
| (2) | | This reverse repurchase agreement has no stated maturity and may be terminated by either party at any time. |
| (3) | | Total fair value of reverse repurchase agreements is presented net of interest receivable of $84,030. |
| 42 | See Notes to Financial Statements. |
Schedule of Investments (continued)
December 31, 2018
The following is a summary of the inputs used as of December 31, 2018 in valuing the Fund’s investments carried at fair value(1):
| Investment Type(2)(3) | | Level 1 | | | Level 2 | | | Level 3 | | | Total | |
| Long-Term Investments | | | | | | | | | | | | | | | | |
| Asset-Backed Securities | | $ | – | | | $ | 326,089,447 | | | $ | – | | | $ | 326,089,447 | |
| Common Stocks | | | | | | | | | | | | | | | | |
| Auto Parts & Equipment | | | – | | | | 15,176,425 | | | | – | | | | 15,176,425 | |
| Beverages | | | – | | | | 12,577,204 | | | | – | | | | 12,577,204 | |
| Electric: Integrated | | | 62,678,839 | | | | 117,832 | | | | – | | | | 62,796,671 | |
| Energy: Exploration & Production | | | 20,805,400 | | | | 260,514 | | | | – | | | | 21,065,914 | |
| Gas Distribution | | | 18,024,385 | | | | 757,898 | | | | – | | | | 18,782,283 | |
| Media: Content | | | 13,304,613 | | | | – | | | | 2,651,730 | | | | 15,956,343 | |
| Personal & Household Products | | | 27,661,009 | | | | 1,596,543 | | | | 10,527,700 | | | | 39,785,252 | |
| Specialty Retail | | | 131,865,802 | | | | 12,700,162 | | | | – | | | | 144,565,964 | |
| Remaining Industries | | | 810,123,979 | | | | – | | | | – | | | | 810,123,979 | |
| Convertible Bonds | | | – | | | | 59,562,214 | | | | – | | | | 59,562,214 | |
| Floating Rate Loans | | | | | | | | | | | | | | | | |
| Diversified Capital Goods | | | – | | | | – | | | | 8,111,344 | | | | 8,111,344 | |
| Oil Field Equipment & Services | | | – | | | | – | | | | 16,087,616 | | | | 16,087,616 | |
| Personal & Household Products | | | – | | | | 36,671,980 | | | | 26,030,423 | | | | 62,702,403 | |
| Specialty Retail | | | – | | | | 128,646,723 | | | | – | | | | 128,646,723 | |
| Remaining Industries | | | – | | | | 575,779,442 | | | | – | | | | 575,779,442 | |
| Foreign Bonds | | | – | | | | 25,182,914 | | | | – | | | | 25,182,914 | |
| Foreign Government Obligations | | | – | | | | 874,114,920 | | | | – | | | | 874,114,920 | |
| Government Sponsored Enterprises Pass-Through | | | – | | | | 1,077,800,203 | | | | – | | | | 1,077,800,203 | |
| High Yield Corporate Bonds | | | | | | | | | | | | | | | | |
| Automakers | | | – | | | | 93,967,561 | | | | 1,500 | | | | 93,969,061 | |
| Banking | | | – | | | | 511,934,167 | | | | 2,250 | | | | 511,936,417 | |
| Metals/Mining (Excluding Steel) | | | – | | | | 248,823,168 | | | | 19 | | | | 248,823,187 | |
| Telecommunications: Wireline Integrated & Services | | | – | | | | 277,904,364 | | | | 1,500 | | | | 277,905,864 | |
| Remaining Industries | | | – | | | | 6,933,465,514 | | | | – | | | | 6,933,465,514 | |
| Municipal Bonds | | | – | | | | 537,342,157 | | | | – | | | | 537,342,157 | |
| Non-Agency Commercial Mortgage-Backed Security | | | – | | | | 44,940,841 | | | | – | | | | 44,940,841 | |
| Preferred Stock | | | – | | | | 1,135,289 | | | | – | | | | 1,135,289 | |
| U.S. Treasury Obligations | | | – | | | | 263,408,772 | | | | – | | | | 263,408,772 | |
| Warrant | | | – | | | | – | | | | 1,651 | | | | 1,651 | |
| Short-Term Investment | | | | | | | | | | | | | | | | |
| Repurchase Agreement | | | – | | | | 20,725,575 | | | | – | | | | 20,725,575 | |
| Total | | $ | 1,084,464,027 | | | $ | 12,080,681,829 | | | $ | 63,415,733 | | | $ | 13,228,561,589 | |
| | See Notes to Financial Statements. | 43 |
Schedule of Investments (continued)
December 31, 2018
| Investment Type(2)(3) | | Level 1 | | | Level 2 | | | Level 3 | | | Total | |
| Other Financial Instruments | | | | | | | | | | | | | | | | |
| Centrally Cleared Credit Default Swap Contracts | | | | | | | | | | | | | | | | |
| Assets | | $ | – | | | $ | 6,508,026 | | | $ | – | | | $ | 6,508,026 | |
| Liabilities | | | – | | | | – | | | | – | | | | – | |
| Credit Default Swap Contracts | | | | | | | | | | | | | | | | |
| Assets | | | – | | | | – | | | | – | | | | – | |
| Liabilities | | | – | | | | (54,193,971 | ) | | | – | | | | (54,193,971 | ) |
| Forward Foreign Currency Exchange Contracts | | | | | | | | | | | | | | | | |
| Assets | | | – | | | | 66,815 | | | | – | | | | 66,815 | |
| Liabilities | | | – | | | | (2,682,711 | ) | | | – | | | | (2,682,711 | ) |
| Futures Contracts | | | | | | | | | | | | | | | | |
| Assets | | | 29,880,039 | | | | – | | | | – | | | | 29,880,039 | |
| Liabilities | | | (60,658,322 | ) | | | – | | | | – | | | | (60,658,322 | ) |
| Reverse Repurchase Agreement | | | | | | | | | | | | | | | | |
| Assets | | | – | | | | – | | | | – | | | | – | |
| Liabilities | | | – | | | | (1,783,301 | ) | | | – | | | | (1,783,301 | ) |
| Total Return Swaps Contracts | | | | | | | | | | | | | | | | |
| Assets | | | – | | | | 981,808 | | | | – | | | | 981,808 | |
| Liabilities | | | – | | | | – | | | | – | | | | – | |
| Unfunded Commitments | | | | | | | | | | | | | | | | |
| Assets | | | – | | | | – | | | | – | | | | – | |
| Liabilities | | | – | | | | (78,775 | ) | | | – | | | | (78,775 | ) |
| Total | | $ | (30,778,283 | ) | | $ | (51,182,109 | ) | | $ | – | | | $ | (81,960,392 | ) |
| (1) | | Refer to Note 2(p) for a description of fair value measurements and the three-tier hierarchy of inputs. |
| (2) | | See Schedule of Investments for fair values in each industry and identification of foreign issuers and/or geography. The table above is presented by Investment Type. Industries are presented within an Investment Type should such Investment Type include securities classified as two or more levels within the three-tier fair value hierarchy. Each Level 3 security is identified on the Schedule of Investments along with the valuation technique utilized. |
| (3) | | There were no Level 1/Level 2 transfers during the fiscal year ended December 31, 2018. |
| 44 | See Notes to Financial Statements. |
Schedule of Investments (concluded)
December 31, 2018
The following is a reconciliation of investments with unobservable inputs (Level 3) that were used in determining fair value:
| Investment Type | | Asset-Backed
Securities | | | Common
Stocks | | | Convertible
Bonds | | | Floating
Rate
Loans | | | High Yield
Corporate
Bonds | | | Warrant | |
| Balance as of January 1, 2018 | | $ | 24,081,974 | | | $ | 2,080,250 | | | $ | 172,761 | | | $ | 30,576,590 | | | $ | 3,428,378 | | | $ | – | |
| Accrued Discounts (Premiums) | | | – | | | | – | | | | – | | | | 187,215 | | | | (40,488 | ) | | | – | |
| Realized Gain (Loss) | | | – | | | | – | | | | 182,507 | | | | (48,634 | ) | | | (329,484 | ) | | | – | |
| Change in Unrealized Appreciation (Depreciation) | | | – | | | | 2,867,961 | | | | 1,264,361 | | | | (5,995,040 | ) | | | 656,325 | | | | (869,811 | ) |
| Purchases | | | – | | | | 8,231,219 | | | | – | | | | 96,862,936 | | | | 4,628,906 | | | | 871,462 | |
| Sales | | | – | | | | – | | | | (1,619,629 | ) | | | (71,353,684 | ) | | | (5,736,650 | ) | | | – | |
| Transfers into Level 3 | | | – | | | | – | | | | – | | | | – | | | | – | | | | – | |
| Transfers out of Level 3 | | | (24,081,974 | ) | | | – | | | | – | | | | – | | | | (2,601,718 | ) | | | – | |
| Balance as of December 31, 2018 | | $ | – | | | $ | 13,179,430 | | | $ | – | | | $ | 50,229,383 | | | $ | 5,269 | | | $ | 1,651 | |
| Change in unrealized appreciation/depreciation for the year ended December 31, 2018, related to Level 3 investments held at December 31, 2018 | | $ | – | | | $ | 2,867,961 | | | $ | – | | | $ | (2,572,324 | ) | | $ | – | | | $ | (869,806 | ) |
| | See Notes to Financial Statements. | 45 |
Statement of Assets and Liabilities
December 31, 2018
| ASSETS: | | | |
| Investments in securities, at fair value (cost $13,783,902,694) | | $ | 13,228,561,589 | |
| Cash | | | 10,401,380 | |
| Deposits with brokers for futures collateral | | | 20,470,178 | |
| Deposits with brokers for swaps collateral | | | 65,752,647 | |
| Receivables: | | | | |
| Interest and dividends | | | 152,362,414 | |
| Capital shares sold | | | 89,154,215 | |
| Investment securities sold | | | 61,165,121 | |
| Total return swap, at fair value | | | 981,808 | |
| Unrealized appreciation on forward foreign currency exchange contracts | | | 66,815 | |
| Prepaid expenses and other assets | | | 256,274 | |
| Total assets | | | 13,629,172,441 | |
| LIABILITIES: | | | | |
| Payables: | | | | |
| Investment securities purchased | | | 1,246,991,894 | |
| Capital shares reacquired | | | 77,313,459 | |
| Management fee | | | 4,716,923 | |
| Variation margin on futures contracts | | | 3,459,923 | |
| 12b-1 distribution plan | | | 2,422,428 | |
| Directors’ fees | | | 2,019,350 | |
| Fund administration | | | 427,103 | |
| Variation margin for centrally cleared credit default swap agreements | | | 976,992 | |
| Unrealized depreciation on forward foreign currency exchange contracts | | | 2,682,711 | |
| Reverse repurchase agreement payable, at fair value | | | 1,783,301 | |
| Credit default swap agreements payable, at fair value (including upfront payments of $33,426,964) | | | 54,193,971 | |
| Unrealized depreciation on unfunded commitments | | | 78,755 | |
| Distributions payable | | | 50,513,247 | |
| Accrued expenses and other liabilities | | | 2,892,810 | |
| Total liabilities | | | 1,450,472,867 | |
| NET ASSETS | | $ | 12,178,699,574 | |
| COMPOSITION OF NET ASSETS: | | | | |
| Paid-in capital | | $ | 12,932,270,435 | |
| Total distributable earnings (loss) | | | (753,570,861 | ) |
| Net Assets | | $ | 12,178,699,574 | |
| 46 | See Notes to Financial Statements. |
Statement of Assets and Liabilities (concluded)
December 31, 2018
| Net assets by class: | | | | |
| Class A Shares | | $ | 4,252,131,885 | |
| Class C Shares | | $ | 1,296,749,382 | |
| Class F Shares | | $ | 3,827,057,342 | |
| Class F3 Shares | | $ | 1,533,935,198 | |
| Class I Shares | | $ | 927,023,889 | |
| Class P Shares | | $ | 17,453,496 | |
| Class R2 Shares | | $ | 6,459,881 | |
| Class R3 Shares | | $ | 152,743,431 | |
| Class R4 Shares | | $ | 18,847,051 | |
| Class R5 Shares | | $ | 30,204,223 | |
| Class R6 Shares | | $ | 116,093,796 | |
| Outstanding shares by class: | | | | |
| Class A Shares (1.14 billion shares of common stock authorized, $.001 par value) | | | 569,428,784 | |
| Class C Shares (600 million shares of common stock authorized, $.001 par value) | | | 173,180,178 | |
| Class F Shares (1.2 billion shares of common stock authorized, $.001 par value) | | | 513,259,630 | |
| Class F3 Shares (300 million shares of common stock authorized, $.001 par value) | | | 206,367,862 | |
| Class I Shares (300 million shares of common stock authorized, $.001 par value) | | | 124,832,908 | |
| Class P Shares (160 million shares of common stock authorized, $.001 par value) | | | 2,284,787 | |
| Class R2 Shares (300 million shares of common stock authorized, $.001 par value) | | | 864,937 | |
| Class R3 Shares (300 million shares of common stock authorized, $.001 par value) | | | 20,488,210 | |
| Class R4 Shares (300 million shares of common stock authorized, $.001 par value) | | | 2,523,115 | |
| Class R5 Shares (300 million shares of common stock authorized, $.001 par value) | | | 4,062,448 | |
| Class R6 Shares (300 million shares of common stock authorized, $.001 par value) | | | 15,620,661 | |
| Net asset value, offering and redemption price per share (Net assets divided by outstanding shares): | | | | |
| Class A Shares-Net asset value | | | $7.47 | |
| Class A Shares-Maximum offering price (Net asset value plus sales charge of 2.25%) | | | $7.64 | |
| Class C Shares-Net asset value | | | $7.49 | |
| Class F Shares-Net asset value | | | $7.46 | |
| Class F3 Shares-Net asset value | | | $7.43 | |
| Class I Shares-Net asset value | | | $7.43 | |
| Class P Shares-Net asset value | | | $7.64 | |
| Class R2 Shares-Net asset value | | | $7.47 | |
| Class R3 Shares-Net asset value | | | $7.46 | |
| Class R4 Shares-Net asset value | | | $7.47 | |
| Class R5 Shares-Net asset value | | | $7.43 | |
| Class R6 Shares-Net asset value | | | $7.43 | |
| | See Notes to Financial Statements. | 47 |
Statement of Operations
For the Year Ended December 31, 2018
| Investment income: | | | | |
| Dividends (net of foreign withholding taxes of $296,296) | | $ | 17,437,801 | |
| Interest and other (net of foreign withholding taxes of $222,634) | | | 623,869,677 | |
| Total investment income | | | 641,307,478 | |
| Expenses: | | | | |
| Management fee | | | 57,707,822 | |
| 12b-1 distribution plan-Class A | | | 9,089,838 | |
| 12b-1 distribution plan-Class B | | | 11,001 | |
| 12b-1 distribution plan-Class C | | | 13,397,010 | |
| 12b-1 distribution plan-Class F | | | 4,181,915 | |
| 12b-1 distribution plan-Class P | | | 75,081 | |
| 12b-1 distribution plan-Class R2 | | | 45,645 | |
| 12b-1 distribution plan-Class R3 | | | 763,173 | |
| 12b-1 distribution plan-Class R4 | | | 34,867 | |
| 12b-1 distribution plan-Class T | | | 14 | |
| Shareholder servicing | | | 9,977,241 | |
| Fund administration | | | 5,245,782 | |
| Reports to shareholders | | | 1,207,070 | |
| Registration | | | 923,699 | |
| Directors’ fees | | | 454,986 | |
| Professional | | | 404,797 | |
| Custody | | | 372,695 | |
| Other | | | 272,014 | |
| Gross expenses | | | 104,164,650 | |
| Expense reductions (See Note 9) | | | (271,938 | ) |
| Net expenses | | | 103,892,712 | |
| Net investment income | | | 537,414,766 | |
| Net realized and unrealized gain (loss): | | | | |
| Net realized loss on investments | | | (69,214,851 | ) |
| Net realized gain on futures contracts | | | 71,052,013 | |
| Net realized gain on foreign currency exchange contracts | | | 18,439,734 | |
| Net realized gain on swap contracts | | | 5,856,417 | |
| Net realized gain on foreign currency related transactions | | | 1,344,190 | |
| Net change in unrealized appreciation/depreciation on investments | | | (1,046,999,577 | ) |
| Net change in unrealized appreciation/depreciation on futures contracts | | | (26,437,560 | ) |
| Net change in unrealized appreciation/depreciation on foreign currency exchange contracts | | | 880,506 | |
| Net change in unrealized appreciation/depreciation on swap contracts | | | (738,058 | ) |
| Net change in unrealized appreciation/depreciation on translation of assets and liabilities denominated in foreign currencies | | | (33,671 | ) |
| Net change in unrealized appreciation/depreciation on unfunded commitments | | | (78,755 | ) |
| Net realized and unrealized loss | | | (1,045,929,612 | ) |
| Net Decrease in Net Assets Resulting From Operations | | $ | (508,514,846 | ) |
| 48 | See Notes to Financial Statements. |
Statements of Changes in Net Assets
| INCREASE (DECREASE) IN NET ASSETS | | For the Year Ended
December 31, 2018 | | | For the Year Ended
December 31, 2017 | |
| Operations: | | | | | | | | |
| Net investment income | | $ | 537,414,766 | | | $ | 439,928,311 | |
| Net realized gain on investments, futures contracts, foreign currency exchange contracts, swaps and foreign currency related transactions | | | 27,477,503 | | | | 355,943,469 | |
| Net change in unrealized appreciation/depreciation on investments, futures contracts, foreign currency exchange contracts, swaps, unfunded commitments and translation of assets and liabilities denominated in foreign currencies | | | (1,073,407,115 | ) | | | 148,832,514 | |
| Net increase (decrease) in net assets resulting from operations | | | (508,514,846 | ) | | | 944,704,294 | |
| Distributions to shareholders:(1) | | | | | | | | |
| Class A | | | (273,541,757 | ) | | | (210,833,042 | ) |
| Class B | | | (36,443 | ) | | | (1,029,002 | ) |
| Class C | | | (82,853,966 | ) | | | (78,585,851 | ) |
| Class F | | | (255,883,833 | ) | | | (181,977,391 | ) |
| Class F3 | | | (89,827,609 | ) | | | (16,349,940 | ) |
| Class I | | | (65,360,758 | ) | | | (31,720,637 | ) |
| Class P | | | (1,192,680 | ) | | | (1,718,291 | ) |
| Class R2 | | | (416,429 | ) | | | (365,838 | ) |
| Class R3 | | | (8,820,786 | ) | | | (6,435,618 | ) |
| Class R4 | | | (909,635 | ) | | | (263,835 | ) |
| Class R5 | | | (1,918,387 | ) | | | (1,210,160 | ) |
| Class R6 | | | (6,994,963 | ) | | | (2,080,644 | ) |
| Class T | | | (249 | ) | | | (237 | ) |
| Total distributions to shareholders | | | (787,757,495 | ) | | | (532,570,486 | ) |
| Capital share transactions (Net of share conversions) (See Note 14): | | | | |
| Net proceeds from sales of shares | | | 4,366,086,058 | | | | 6,456,007,068 | |
| Reinvestment of distributions | | | 696,869,024 | | | | 464,691,431 | |
| Cost of shares reacquired | | | (4,183,622,590 | ) | | | (4,192,283,810 | ) |
| Net increase in net assets resulting from capital share transactions | | | 879,332,492 | | | | 2,728,414,689 | |
| Net increase (decrease) in net assets | | | (416,939,849 | ) | | | 3,140,548,497 | |
| NET ASSETS: | | | | | | | | |
| Beginning of year | | $ | 12,595,639,423 | | | $ | 9,455,090,926 | |
| End of year | | $ | 12,178,699,574 | | | $ | 12,595,639,423 | |
| Undistributed net investment income(2) | | $ | – | | | $ | – | |
| (1) | The SEC eliminated the requirement to disclose the source of distributions paid in 2018. For the year ended December 31, 2017, the source of distributions was net investment income as follows: Class A $(184,374,395), Class B $(977,132), Class C $(67,580,567), Class F $(159,926,082), Class F3 $(10,003,243), Class I $(25,599,464), Class P $(1,527,044), Class R2 $(312,078), Class R3 $(5,531,805), Class R4 $(216,101), Class R5 $(1,049,883), Class R6 $(1,694,324) and Class T $(176). Net realized gain - Class A $(26,458,647), Class B $(51,870), Class C $(11,005,284), Class F $(22,051,309), Class F3 $(6,346,697), Class I $(6,121,173), Class P $(191,247), Class R2 $(53,760), Class R3 $(903,813), Class R4 $(47,734), Class R5 $(160,277), Class R6 $(386,320) and Class T $(61). |
| (2) | The SEC eliminated the requirement to disclose undistributed net investment income in 2018. For the year ended December 31, 2017, the undistributed net investment income was $20,828,060. |
| | See Notes to Financial Statements. | 49 |
Financial Highlights
| | | | | Per Share Operating Performance: |
| | | | | Investment operations: | | Distributions to
shareholders from: |
| | | Net asset
value,
beginning
of period | | Net
invest-
ment
income(a) | | Net
realized
and
unrealized
gain (loss) | | Total
from
invest-
ment
oper-
ations | | Net
Investment
income | | Net
realized
gain | | Total
distri-
butions |
| Class A | | | | | | | | | | | | | | | | | | | | | | | | | | | | |
| 12/31/2018 | | $ | 8.25 | | | $ | 0.33 | | | $ | (0.63 | ) | | $ | (0.30 | ) | | $ | (0.36 | ) | | $ | (0.12 | ) | | $ | (0.48 | ) |
| 12/31/2017 | | | 7.93 | | | | 0.33 | | | | 0.39 | | | | 0.72 | | | | (0.35 | ) | | | (0.05 | ) | | | (0.40 | ) |
| 12/31/2016 | | | 7.40 | | | | 0.35 | | | | 0.54 | | | | 0.89 | | | | (0.36 | ) | | | – | | | | (0.36 | ) |
| 12/31/2015 | | | 7.93 | | | | 0.32 | | | | (0.44 | ) | | | (0.12 | ) | | | (0.35 | ) | | | (0.06 | ) | | | (0.41 | ) |
| 12/31/2014 | | | 8.15 | | | | 0.37 | | | | – | (c) | | | 0.37 | | | | (0.39 | ) | | | (0.20 | ) | | | (0.59 | ) |
| | | | | | | | | | | | | | | | | | | | | | | | | | | | | |
| Class C | | | | | | | | | | | | | | | | | | | | | | | | | | | | |
| 12/31/2018 | | | 8.27 | | | | 0.28 | | | | (0.63 | ) | | | (0.35 | ) | | | (0.31 | ) | | | (0.12 | ) | | | (0.43 | ) |
| 12/31/2017 | | | 7.95 | | | | 0.28 | | | | 0.39 | | | | 0.67 | | | | (0.30 | ) | | | (0.05 | ) | | | (0.35 | ) |
| 12/31/2016 | | | 7.42 | | | | 0.30 | | | | 0.55 | | | | 0.85 | | | | (0.32 | ) | | | – | | | | (0.32 | ) |
| 12/31/2015 | | | 7.95 | | | | 0.27 | | | | (0.44 | ) | | | (0.17 | ) | | | (0.30 | ) | | | (0.06 | ) | | | (0.36 | ) |
| 12/31/2014 | | | 8.17 | | | | 0.32 | | | | – | (c) | | | 0.32 | | | | (0.34 | ) | | | (0.20 | ) | | | (0.54 | ) |
| | | | | | | | | | | | | | | | | | | | | | | | | | | | | |
| Class F | | | | | | | | | | | | | | | | | | | | | | | | | | | | |
| 12/31/2018 | | | 8.24 | | | | 0.34 | | | | (0.64 | ) | | | (0.30 | ) | | | (0.36 | ) | | | (0.12 | ) | | | (0.48 | ) |
| 12/31/2017 | | | 7.92 | | | | 0.34 | | | | 0.39 | | | | 0.73 | | | | (0.36 | ) | | | (0.05 | ) | | | (0.41 | ) |
| 12/31/2016 | | | 7.39 | | | | 0.36 | | | | 0.54 | | | | 0.90 | | | | (0.37 | ) | | | – | | | | (0.37 | ) |
| 12/31/2015 | | | 7.91 | | | | 0.33 | | | | (0.44 | ) | | | (0.11 | ) | | | (0.35 | ) | | | (0.06 | ) | | | (0.41 | ) |
| 12/31/2014 | | | 8.14 | | | | 0.38 | | | | (0.01 | ) | | | 0.37 | | | | (0.40 | ) | | | (0.20 | ) | | | (0.60 | ) |
| | | | | | | | | | | | | | | | | | | | | | | | | | | | | |
| Class F3 | | | | | | | | | | | | | | | | | | | | | | | | | | | | |
| 12/31/2018 | | | 8.21 | | | | 0.35 | | | | (0.63 | ) | | | (0.28 | ) | | | (0.38 | ) | | | (0.12 | ) | | | (0.50 | ) |
| 4/4/2017 to 12/31/2017(d) | | 8.01 | | | | 0.25 | | | | 0.27 | | | | 0.52 | | | | (0.27 | ) | | | (0.05 | ) | | | (0.32 | ) |
| | | | | | | | | | | | | | | | | | | | | | | | | | | | | |
| Class I | | | | | | | | | | | | | | | | | | | | | | | | | | | | |
| 12/31/2018 | | | 8.21 | | | | 0.34 | | | | (0.63 | ) | | | (0.29 | ) | | | (0.37 | ) | | | (0.12 | ) | | | (0.49 | ) |
| 12/31/2017 | | | 7.89 | | | | 0.35 | | | | 0.38 | | | | 0.73 | | | | (0.36 | ) | | | (0.05 | ) | | | (0.41 | ) |
| 12/31/2016 | | | 7.36 | | | | 0.36 | | | | 0.55 | | | | 0.91 | | | | (0.38 | ) | | | – | | | | (0.38 | ) |
| 12/31/2015 | | | 7.89 | | | | 0.34 | | | | (0.45 | ) | | | (0.11 | ) | | | (0.36 | ) | | | (0.06 | ) | | | (0.42 | ) |
| 12/31/2014 | | | 8.11 | | | | 0.38 | | | | – | (c) | | | 0.38 | | | | (0.40 | ) | | | (0.20 | ) | | | (0.60 | ) |
| | | | | | | | | | | | | | | | | | | | | | | | | | | | | |
| Class P | | | | | | | | | | | | | | | | | | | | | | | | | | | | |
| 12/31/2018 | | | 8.44 | | | | 0.31 | | | | (0.64 | ) | | | (0.33 | ) | | | (0.35 | ) | | | (0.12 | ) | | | (0.47 | ) |
| 12/31/2017 | | | 8.11 | | | | 0.34 | | | | 0.39 | | | | 0.73 | | | | (0.35 | ) | | | (0.05 | ) | | | (0.40 | ) |
| 12/31/2016 | | | 7.57 | | | | 0.35 | | | | 0.56 | | | | 0.91 | | | | (0.37 | ) | | | – | | | | (0.37 | ) |
| 12/31/2015 | | | 8.10 | | | | 0.33 | | | | (0.45 | ) | | | (0.12 | ) | | | (0.35 | ) | | | (0.06 | ) | | | (0.41 | ) |
| 12/31/2014 | | | 8.33 | | | | 0.38 | | | | (0.01 | ) | | | 0.37 | | | | (0.40 | ) | | | (0.20 | ) | | | (0.60 | ) |
| 50 | See Notes to Financial Statements. | |
| | | | | Ratios to Average Net Assets: | | Supplemental Data: |
| | | | | | | | | | | |
Net
asset
value,
end of
period | | Total
return(b)
(%) | | Total
expenses
(%) | | Net
investment
income
(%) | | Net
assets, end
of period
(000) | | Portfolio
turnover
rate
(%) |
| | | | | | | | | | | | | | | | | | | | | | | |
| $ | 7.47 | | | | (3.79 | ) | | | 0.79 | | | | 4.11 | | | $ | 4,252,132 | | | | 147 | |
| | 8.25 | | | | 9.21 | | | | 0.81 | | | | 4.10 | | | | 4,491,809 | | | | 113 | |
| | 7.93 | | | | 12.35 | | | | 0.81 | | | | 4.57 | | | | 4,263,801 | | | | 119 | |
| | 7.40 | | | | (1.74 | ) | | | 0.82 | | | | 4.10 | | | | 4,183,669 | | | | 119 | |
| | 7.93 | | | | 4.51 | | | | 0.86 | | | | 4.50 | | | | 4,524,711 | | | | 88 | |
| | | | | | | | | | | | | | | | | | | | | | | |
| | 7.49 | | | | (4.38 | ) | | | 1.43 | | | | 3.46 | | | | 1,296,749 | | | | 147 | |
| | 8.27 | | | | 8.52 | | | | 1.43 | | | | 3.49 | | | | 1,872,830 | | | | 113 | |
| | 7.95 | | | | 11.63 | | | | 1.44 | | | | 3.95 | | | | 1,892,905 | | | | 119 | |
| | 7.42 | | | | (2.35 | ) | | | 1.46 | | | | 3.48 | | | | 1,882,589 | | | | 119 | |
| | 7.95 | | | | 3.85 | | | | 1.50 | | | | 3.86 | | | | 2,082,896 | | | | 88 | |
| | | | | | | | | | | | | | | | | | | | | | | |
| | 7.46 | | | | (3.83 | ) | | | 0.69 | | | | 4.20 | | | | 3,827,057 | | | | 147 | |
| | 8.24 | | | | 9.32 | | | | 0.71 | | | | 4.16 | | | | 3,793,021 | | | | 113 | |
| | 7.92 | | | | 12.46 | | | | 0.71 | | | | 4.65 | | | | 2,607,811 | | | | 119 | |
| | 7.39 | | | | (1.53 | ) | | | 0.72 | | | | 4.20 | | | | 1,893,642 | | | | 119 | |
| | 7.91 | | | | 4.53 | | | | 0.72 | | | | 4.59 | | | | 1,817,781 | | | | 88 | |
| | | | | | | | | | | | | | | | | | | | | | | |
| | 7.43 | | | | (3.57 | ) | | | 0.52 | | | | 4.37 | | | | 1,533,935 | | | | 147 | |
| | 8.21 | | | | 6.55 | (e) | | | 0.53 | (f) | | | 4.06 | (f) | | | 1,093,748 | | | | 113 | |
| | | | | | | | | | | | | | | | | | | | | | | |
| | 7.43 | | | | (3.77 | ) | | | 0.59 | | | | 4.30 | | | | 927,024 | | | | 147 | |
| | 8.21 | | | | 9.44 | | | | 0.61 | | | | 4.25 | | | | 1,039,534 | | | | 113 | |
| | 7.89 | | | | 12.62 | | | | 0.61 | | | | 4.77 | | | | 450,661 | | | | 119 | |
| | 7.36 | | | | (1.59 | ) | | | 0.62 | | | | 4.28 | | | | 382,854 | | | | 119 | |
| | 7.89 | | | | 4.76 | | | | 0.62 | | | | 4.68 | | | | 393,851 | | | | 88 | |
| | | | | | | | | | | | | | | | | | | | | | | |
| | 7.64 | | | | (4.00 | ) | | | 0.95 | | | | 3.94 | | | | 17,453 | | | | 147 | |
| | 8.44 | | | | 9.18 | | | | 0.86 | | | | 4.07 | | | | 32,370 | | | | 113 | |
| | 8.11 | | | | 12.27 | | | | 0.87 | | | | 4.53 | | | | 36,825 | | | | 119 | |
| | 7.57 | | | | (1.66 | ) | | | 0.87 | | | | 4.06 | | | | 35,632 | | | | 119 | |
| | 8.10 | | | | 4.39 | | | | 0.87 | | | | 4.51 | | | | 44,078 | | | | 88 | |
| | See Notes to Financial Statements. | 51 |
Financial Highlights (concluded)
| | | | | Per Share Operating Performance: |
| | | | | Investment operations: | | Distributions to
shareholders from: |
| | | Net asset
value,
beginning
of period | | Net
invest-
ment
income(a) | | Net
realized
and
unrealized
gain (loss) | | Total
from
invest-
ment
oper-
ations | | Net
investment
income | | Net
realized
gain | | Total
distri-
butions |
| Class R2 | | | | | | | | | | | | | | | | | | | | | | | | | | | | |
| 12/31/2018 | | $ | 8.25 | | | $ | 0.30 | | | $ | (0.64 | ) | | $ | (0.34 | ) | | $ | (0.32 | ) | | $ | (0.12 | ) | | $ | (0.44 | ) |
| 12/31/2017 | | | 7.93 | | | | 0.30 | | | | 0.39 | | | | 0.69 | | | | (0.32 | ) | | | (0.05 | ) | | | (0.37 | ) |
| 12/31/2016 | | | 7.40 | | | | 0.31 | | | | 0.55 | | | | 0.86 | | | | (0.33 | ) | | | – | | | | (0.33 | ) |
| 12/31/2015 | | | 7.93 | | | | 0.29 | | | | (0.44 | ) | | | (0.15 | ) | | | (0.32 | ) | | | (0.06 | ) | | | (0.38 | ) |
| 12/31/2014 | | | 8.15 | | | | 0.34 | | | | – | (c) | | | 0.34 | | | | (0.36 | ) | | | (0.20 | ) | | | (0.56 | ) |
| | | | | | | | | | | | | | | | | | | | | | | | | | | | | |
| Class R3 | | | | | | | | | | | | | | | | | | | | | | | | | | | | |
| 12/31/2018 | | | 8.24 | | | | 0.30 | | | | (0.63 | ) | | | (0.33 | ) | | | (0.33 | ) | | | (0.12 | ) | | | (0.45 | ) |
| 12/31/2017 | | | 7.92 | | | | 0.31 | | | | 0.38 | | | | 0.69 | | | | (0.32 | ) | | | (0.05 | ) | | | (0.37 | ) |
| 12/31/2016 | | | 7.39 | | | | 0.32 | | | | 0.55 | | | | 0.87 | | | | (0.34 | ) | | | – | | | | (0.34 | ) |
| 12/31/2015 | | | 7.91 | | | | 0.30 | | | | (0.44 | ) | | | (0.14 | ) | | | (0.32 | ) | | | (0.06 | ) | | | (0.38 | ) |
| 12/31/2014 | | | 8.14 | | | | 0.35 | | | | (0.01 | ) | | | 0.34 | | | | (0.37 | ) | | | (0.20 | ) | | | (0.57 | ) |
| | | | | | | | | | | | | | | | | | | | | | | | | | | | | |
| Class R4 | | | | | | | | | | | | | | | | | | | | | | | | | | | | |
| 12/31/2018 | | | 8.25 | | | | 0.33 | | | | (0.64 | ) | | | (0.31 | ) | | | (0.35 | ) | | | (0.12 | ) | | | (0.47 | ) |
| 12/31/2017 | | | 7.93 | | | | 0.33 | | | | 0.38 | | | | 0.71 | | | | (0.34 | ) | | | (0.05 | ) | | | (0.39 | ) |
| 12/31/2016 | | | 7.40 | | | | 0.34 | | | | 0.55 | | | | 0.89 | | | | (0.36 | ) | | | – | | | | (0.36 | ) |
| 6/30/2015 to 12/31/2015(g) | | 7.99 | | | | 0.16 | | | | (0.52 | ) | | | (0.36 | ) | | | (0.17 | ) | | | (0.06 | ) | | | (0.23 | ) |
| | | | | | | | | | | | | | | | | | | | | | | | | | | | | |
| Class R5 | | | | | | | | | | | | | | | | | | | | | | | | | | | | |
| 12/31/2018 | | | 8.21 | | | | 0.34 | | | | (0.63 | ) | | | (0.29 | ) | | | (0.37 | ) | | | (0.12 | ) | | | (0.49 | ) |
| 12/31/2017 | | | 7.86 | | | | 0.35 | | | | 0.41 | | | | 0.76 | | | | (0.36 | ) | | | (0.05 | ) | | | (0.41 | ) |
| 12/31/2016 | | | 7.36 | | | | 0.21 | | | | 0.67 | | | | 0.88 | | | | (0.38 | ) | | | – | | | | (0.38 | ) |
| 6/30/2015 to 12/31/2015(g) | | 7.95 | | | | 0.17 | | | | (0.52 | ) | | | (0.35 | ) | | | (0.18 | ) | | | (0.06 | ) | | | (0.24 | ) |
| | | | | | | | | | | | | | | | | | | | | | | | | | | | | |
| Class R6 | | | | | | | | | | | | | | | | | | | | | | | | | | | | |
| 12/31/2018 | | | 8.21 | | | | 0.35 | | | | (0.63 | ) | | | (0.28 | ) | | | (0.38 | ) | | | (0.12 | ) | | | (0.50 | ) |
| 12/31/2017 | | | 7.89 | | | | 0.35 | | | | 0.39 | | | | 0.74 | | | | (0.37 | ) | | | (0.05 | ) | | | (0.42 | ) |
| 12/31/2016 | | | 7.37 | | | | 0.37 | | | | 0.53 | | | | 0.90 | | | | (0.38 | ) | | | – | | | | (0.38 | ) |
| 6/30/2015 to 12/31/2015(g) | | 7.95 | | | | 0.17 | | | | (0.51 | ) | | | (0.34 | ) | | | (0.18 | ) | | | (0.06 | ) | | | (0.24 | ) |
| (a) | Calculated using average shares outstanding during the period. |
| (b) | Total return for Classes A and C does not consider the effects of sales loads and assumes the reinvestment of all distributions. Total return for all other classes assumes the reinvestment of all distributions. |
| (c) | Amount less than $0.01. |
| (d) | Commenced on April 4, 2017. |
| (e) | Not annualized. |
| (f) | Annualized. |
| (g) | Commenced on June 30, 2015. |
| 52 | See Notes to Financial Statements. | |
| | | | | Ratios to Average Net Assets: | | Supplemental Data: |
| | | | | | | | | | | |
Net
asset
value,
end of
period | | Total
return(b)
(%) | | Total
expenses
(%) | | Net
investment
income
(%) | | Net
assets, end
of period
(000) | | Portfolio
turnover
rate
(%) |
| | | | | | | | | | | | | | | | | | | | | | | |
| $ | 7.47 | | | | (4.17 | ) | | | 1.19 | | | | 3.71 | | | $ | 6,460 | | | | 147 | |
| | 8.25 | | | | 8.78 | | | | 1.21 | | | | 3.68 | | | | 9,066 | | | | 113 | |
| | 7.93 | | | | 11.91 | | | | 1.21 | | | | 4.05 | | | | 5,324 | | | | 119 | |
| | 7.40 | | | | (2.13 | ) | | | 1.22 | | | | 3.71 | | | | 4,075 | | | | 119 | |
| | 7.93 | | | | 4.15 | | | | 1.22 | | | | 4.13 | | | | 4,557 | | | | 88 | |
| | | | | | | | | | �� | | | | | | | | | | | | | |
| | 7.46 | | | | (4.21 | ) | | | 1.09 | | | | 3.81 | | | | 152,743 | | | | 147 | |
| | 8.24 | | | | 8.90 | | | | 1.10 | | | | 3.80 | | | | 151,842 | | | | 113 | |
| | 7.92 | | | | 12.03 | | | | 1.11 | | | | 4.19 | | | | 128,317 | | | | 119 | |
| | 7.39 | | | | (1.91 | ) | | | 1.12 | | | | 3.82 | | | | 107,581 | | | | 119 | |
| | 7.91 | | | | 4.13 | | | | 1.10 | | | | 4.24 | | | | 111,368 | | | | 88 | |
| | | | | | | | | | | | | | | | | | | | | | | |
| | 7.47 | | | | (3.83 | ) | | | 0.84 | | | | 4.09 | | | | 18,847 | | | | 147 | |
| | 8.25 | | | | 9.16 | | | | 0.86 | | | | 3.98 | | | | 8,420 | | | | 113 | |
| | 7.93 | | | | 12.29 | | | | 0.86 | | | | 4.40 | | | | 2,072 | | | | 119 | |
| | 7.40 | | | | (4.59 | )(e) | | | 0.87 | (f) | | | 4.27 | (f) | | | 207 | | | | 119 | |
| | | | | | | | | | | | | | | | | | | | | | | |
| | 7.43 | | | | (3.63 | ) | | | 0.59 | | | | 4.32 | | | | 30,204 | | | | 147 | |
| | 8.21 | | | | 9.46 | | | | 0.61 | | | | 4.29 | | | | 27,302 | | | | 113 | |
| | 7.86 | | | | 12.62 | | | | 0.61 | | | | 2.70 | | | | 386 | | | | 119 | |
| | 7.36 | | | | (4.50 | )(e) | | | 0.62 | (f) | | | 4.39 | (f) | | | 10 | | | | 119 | |
| | | | | | | | | | | | | | | | | | | | | | | |
| | 7.43 | | | | (3.56 | ) | | | 0.52 | | | | 4.39 | | | | 116,094 | | | | 147 | |
| | 8.21 | | | | 9.54 | | | | 0.52 | | | | 4.31 | | | | 69,028 | | | | 113 | |
| | 7.89 | | | | 12.56 | | | | 0.53 | | | | 4.83 | | | | 15,346 | | | | 119 | |
| | 7.37 | | | | (4.36 | )(e) | | | 0.54 | (f) | | | 4.49 | (f) | | | 10,994 | | | | 119 | |
| | See Notes to Financial Statements. | 53 |
Notes to Financial Statements
Lord Abbett Bond-Debenture Fund, Inc. (the “Fund”) is registered under the Investment Company Act of 1940, as amended (the “Act”), as a diversified, open-end management investment company. The Fund was organized in 1970 and incorporated under Maryland law on January 23, 1976.
The Fund’s investment objective is to seek high current income and the opportunity for capital appreciation to produce a high total return. The Fund has eleven active classes of shares: Class A, C, F, F3, I, P, R2, R3, R4, R5 and R6, each with different expenses and dividends. A front-end sales charge is normally added to the net asset value (“NAV”) for Class A shares. There is no front-end sales charge in the case of Class C, F, F3, I, P, R2, R3, R4, R5 and R6 shares, although there may be a contingent deferred sales charge (“CDSC”) in certain cases as follows: Class A shares purchased without a sales charge and redeemed before the first day of the month in which the one-year anniversary of the purchase falls (subject to certain exceptions as set forth in the Fund’s prospectus); Class C shares redeemed before the first anniversary of purchase. Effective April 30, 2018, Class C shares will convert automatically into Class A shares on the 25th day of the month (or, if the 25th day is not a business day, the next business day thereafter) following the tenth anniversary of the month on which the purchase order was accepted. The Fund’s Class P shares are closed to substantially all new investors, with certain exceptions as set forth in the Fund’s prospectus. On April 25, 2018, the Fund’s remaining Class B shares converted to Class A shares.
The preparation of the financial statements in conformity with accounting principles generally accepted in the United States of America (“U.S. GAAP”) requires management to make certain estimates and assumptions that affect the reported amounts of assets and liabilities and disclosure of contingent assets and liabilities at the date of the financial statements and the reported amounts of increases and decreases in net assets from operations during the reporting period. Actual results could differ from those estimates. The Fund is considered an investment company under U.S. GAAP and follows the accounting and reporting guidance applicable to investment companies.
| 2. | SIGNIFICANT ACCOUNTING POLICIES |
| (a) | Investment Valuation–Under procedures approved by the Fund’s Board of Directors (the “Board”), Lord, Abbett & Co. LLC (“Lord Abbett”), the Fund’s investment manager, has formed a Pricing Committee to administer the pricing and valuation of portfolio investments and to ensure that prices utilized reasonably reflect fair value. Among other things, these procedures allow the Fund to utilize independent pricing services, quotations from securities and financial instrument dealers and other market sources to determine fair value. |
| | |
| | Securities actively traded on any recognized U.S. or non-U.S. exchange or on The NASDAQ Stock Market LLC are valued at the last sale price or official closing price on the exchange or system on which they are principally traded. Events occurring after the close of trading on non-U.S. exchanges may result in adjustments to the valuation of foreign securities to reflect their fair value as of the close of regular trading on the New York Stock Exchange. The Fund may utilize an independent fair valuation service in adjusting the valuations of foreign securities. Unlisted equity securities are valued at the last quoted sale price or, if no sale price is available, at the mean between the most recently quoted bid and asked prices. Fixed income securities are valued based on evaluated prices supplied by independent pricing services, which reflect broker/dealer supplied valuations and the independent pricing services’ own electronic data processing techniques. Floating rate loans are valued at the average of bid and ask quotations obtained from dealers in loans on the basis of prices supplied by independent |
54
Notes to Financial Statements (continued)
| | pricing services. Exchange traded options and futures contracts are valued at the last quoted sale price in the market where they are principally traded. If no sale has occurred, the mean between the most recently quoted bid and asked prices is used. Forward foreign currency exchange contracts are valued using daily forward exchange rates. Swaps are valued daily using independent pricing services or quotations from broker/dealers to the extent available. |
| | |
| | Securities for which prices are not readily available are valued at fair value as determined by the Pricing Committee. The Pricing Committee considers a number of factors, including observable and unobservable inputs, when arriving at fair value. The Pricing Committee may use related or comparable assets or liabilities, recent transactions, market multiples, book values, yield curves, broker quotes, observable trading activity, option adjusted spread models and other relevant information to determine the fair value of portfolio investments. The Board or a designated committee thereof regularly reviews fair value determinations made by the Pricing Committee and may employ techniques such as reviewing related market activity, reviewing inputs and assumptions, and retrospectively comparing prices of subsequent purchases and sales transactions to fair value determinations made by the Pricing Committee. |
| | |
| | Short-term securities with 60 days or less remaining to maturity are valued using the amortized cost method, which approximates fair value. |
| | |
| (b) | Security Transactions–Security transactions are recorded as of the date that the securities are purchased or sold (trade date). Realized gains and losses on sales of portfolio securities are calculated using the identified-cost method. Realized and unrealized gains (losses) are allocated to each class of shares based upon the relative proportion of net assets at the beginning of the day. |
| | |
| (c) | Investment Income–Dividend income is recorded on the ex-dividend date. Interest income is recorded on the accrual basis as earned. Discounts are accreted and premiums are amortized using the effective interest method and are included in Interest and other income on the Statement of Operations. Withholding taxes on foreign dividends and interest have been provided for in accordance with the applicable country’s tax rules and rates. Investment income is allocated to each class of shares based upon the relative proportion of net assets at the beginning of the day. |
| | |
| (d) | Income Taxes–It is the policy of the Fund to meet the requirements of Subchapter M of the Internal Revenue Code applicable to regulated investment companies and to distribute substantially all taxable income and capital gains to its shareholders. Therefore, no income tax provision is required. |
| | |
| | The Fund files U.S. federal and various state and local tax returns. No income tax returns are currently under examination. The statute of limitations on the Fund’s filed U.S. federal tax returns remains open for the fiscal years ended December 31, 2015 through December 31, 2018. The statutes of limitations on the Fund’s state and local tax returns may remain open for an additional year depending upon the jurisdiction. |
| | |
| (e) | Expenses–Expenses, excluding class-specific expenses, are allocated to each class of shares based upon the relative proportion of net assets at the beginning of the day. Class A, C, F, P, R2, R3 and R4 shares bear their class-specific share of all expenses and fees relating to the Fund’s 12b-1 Distribution Plan. |
55
Notes to Financial Statements (continued)
| (f) | Foreign Transactions–The books and records of the Fund are maintained in U.S. dollars and transactions denominated in foreign currencies are recorded in the Fund’s records at the rate prevailing when earned or recorded. Asset and liability accounts that are denominated in foreign currencies are adjusted daily to reflect current exchange rates and any unrealized gain (loss), if applicable, is included in Net change in unrealized appreciation/depreciation on translation of assets and liabilities denominated in foreign currencies on the Fund’s Statement of Operations. The resultant exchange gains and losses upon settlement of such transactions, if applicable, are included in Net realized gain (loss) on foreign currency related transactions on the Fund’s Statement of Operations. The Fund does not isolate that portion of the results of operations arising as a result of changes in the foreign exchange rates from the changes in market prices of the securities. |
| | |
| | The Fund uses foreign currency exchange contracts to facilitate transactions in foreign-denominated securities. Losses from these transactions may arise from changes in the value of the foreign currency or if the counterparties do not perform under the contracts’ terms. |
| | |
| (g) | Forward Foreign Currency Exchange Contracts–The Fund may enter into forward foreign currency exchange contracts in order to reduce exposure to changes in foreign currency exchange rates on foreign portfolio holdings, or gain or reduce exposure to foreign currency solely for investment purposes. A forward foreign currency exchange contract is a commitment to purchase or sell a foreign currency at a future date at a negotiated rate. The contracts are valued daily at forward exchange rates and any unrealized gain (loss) is included in Net change in unrealized appreciation/depreciation on foreign currency exchange contracts on the Fund’s Statement of Operations. The gain (loss) arising from the difference between the U.S. dollar cost of the original contract and the value of the foreign currency in U.S. dollars upon closing of such contracts is included in Net realized gain (loss) on foreign currency exchange contracts on the Fund’s Statement of Operations. |
| | |
| (h) | Futures Contracts–The Fund may purchase and sell futures contracts to enhance returns, to attempt to economically hedge some of its investment risk, or as a substitute position in lieu of holding the underlying asset on which the instrument is based. At the time of entering into a futures transaction, an investor is required to deposit and maintain a specified amount of cash or eligible securities called “initial margin.” Subsequent payments made or received by the Fund called “variation margin” are made on a daily basis as the market price of the futures contract fluctuates. The Fund will record an unrealized gain (loss) based on the amount of variation margin. When a contract is closed, a realized gain (loss) is recorded equal to the difference between the opening and closing value of the contract. |
| | |
| (i) | Credit Default Swaps–The Fund may enter into credit default swap contracts in order to hedge credit risk or for speculation purposes. As a seller of a credit default swap contract (“seller of protection”), the Fund is required to pay the notional amount or other agreed-upon value of a referenced debt obligation to the counterparty in the event of a default by or other credit event involving the referenced issuer, obligation or index. In return, the Fund receives from the counterparty a periodic stream of payments over the term of the contract. |
| | |
| | As a purchaser of a credit default swap contract (“buyer of protection”), the Fund would receive the notional amount or other agreed upon value of a referenced debt obligation from the counterparty in the event of default by or other credit event involving the referenced issuer, obligation or index. In return, the Fund would make periodic payments to the counterparty over the term of the contracts, provided no event of default has occurred. |
56
Notes to Financial Statements (continued)
| | These credit default swaps may have as a reference obligation corporate or sovereign issuers or credit indexes. These credit indexes are comprised of a basket of securities representing a particular sector of the market. |
| | |
| | Credit default swaps are fair valued based upon quotations from counterparties, brokers or market-makers and the change in value, if any, is recorded as an unrealized appreciation or depreciation. For a credit default swap sold by the Fund, payment of the agreed-upon amount made by the Fund in the event of default of the referenced debt obligation is recorded as the cost of the referenced debt obligation purchased/received. For a credit default swap purchased by the Fund, the agreed-upon amount received by the Fund in the event of default of the referenced debt obligation is recorded as proceeds from sale/delivery of the referenced debt obligation and the resulting gain or loss realized on the referenced debt obligation is recorded as such by the Fund. |
| | |
| | Any upfront payments made or received upon entering a credit default swap contract would be amortized or accreted over the life of the swap and recorded as realized gains or losses. Collateral, in the form of cash or securities, may be required to be held in segregated accounts with the custodian bank or broker in accordance with the swap agreement. The value and credit rating of each credit default swap where the Fund is the seller of protection, are both measures of the current payment/performance risk of the swap. As the value of the swap changes as a positive or negative percentage of the total notional amount, the payment/performance risk may decrease or increase, respectively. The maximum potential amount of future payments (undiscounted) that the Fund as a seller of protection could be required to make under a credit default swap agreement would be an amount equal to the notional amount of the agreement. These potential amounts would be partially offset by any recovery values of the respective referenced obligations, upfront payments received upon entering into the agreement, or net amounts received from the settlement of buy protection credit default swap agreements entered into by the Fund for the same referenced entity or entities. |
| | |
| | Entering into credit default swaps involves credit and market risk. Such risks involve the possibility that there will be no liquid market for these agreements, that the counterparty to the agreements may default on its obligation to perform or disagree as to the meaning of the contractual terms in the agreements, and that there may be unfavorable changes in interest rates, and that Lord Abbett does not correctly predict the creditworthiness of the issuers of the reference obligation on which the credit default swap is based. For the centrally cleared credit default swaps, there was minimal counterparty risk to the Fund, since such credit default swaps entered into were traded through a central clearinghouse, which guarantees against default. |
| | |
| (j) | Mortgage Dollar Rolls–The Fund may enter into mortgage dollar rolls in which a Fund sells mortgage-backed securities for delivery in the current month and simultaneously contracts with the same counterparty to repurchase similar (same type, coupon and maturity) but not identical securities on a specified future date. During the roll period, the Fund loses the right to receive principal (including prepayments of principal) and interest paid on the securities sold. |
| | |
| (k) | Total Return Swaps–The Fund may enter into total return swap agreements to obtain exposure to a security or market without owning such security or investing directly in that market. The Fund may agree to make payments that are the equivalent of interest in exchange for the right to receive payments equivalent to any appreciation in the value of an underlying security, index or other asset, as well as receive payments equivalent to any distributions made on that asset, over the term of the swap. If the value of the asset underlying a total return |
57
Notes to Financial Statements (continued)
| | swap declines over the term of the swap, the Fund also may be required to pay an amount equal to that decline in value to their counterparty. |
| | |
| (l) | When-Issued, Forward Transactions or To-Be-Announced (“TBA”) Transactions–The Fund may purchase portfolio securities on a when-issued or forward basis. When-issued, forward transactions or TBA transactions involve a commitment by a fund to purchase securities, with payment and delivery (“settlement”) to take place in the future, in order to secure what is considered to be an advantageous price or yield at the time of entering into the transaction. During the period between purchase and settlement, the fair value of the securities will fluctuate and assets consisting of cash and/or marketable securities (normally short-term U.S. Government or U.S. Government sponsored enterprise securities) marked to market daily in an amount sufficient to make payment at settlement will be segregated at the Fund’s custodian in order to pay for the commitment. At the time the Fund makes the commitment to purchase a security on a when-issued basis, it will record the transaction and reflect the liability for the purchase and fair value of the security in determining its NAV. The Fund, generally, has the ability to close out a purchase obligation on or before the settlement date rather than take delivery of the security. Under no circumstances will settlement for such securities take place more than 120 days after the purchase date. |
| | |
| (m) | Repurchase Agreements–The Fund may enter into repurchase agreements with respect to securities. A repurchase agreement is a transaction in which a fund acquires a security and simultaneously commits to resell that security to the seller (a bank or securities dealer) at an agreed-upon price on an agreed-upon date. The Fund requires at all times that the repurchase agreement be collateralized by cash, or by securities of the U.S. Government, its agencies, its instrumentalities, or U.S. Government sponsored enterprises having a value equal to, or in excess of, the value of the repurchase agreement (including accrued interest). If the seller of the agreement defaults on its obligation to repurchase the underlying securities at a time when the fair value of these securities has declined, the Fund may incur a loss upon disposition of the securities. |
| | |
| (n) | Reverse Repurchase Agreements–The Fund may enter into reverse repurchase agreements. In a reverse repurchase agreement, the Fund sells a security to a securities dealer or bank for cash and also agrees to repurchase the same security later at a set price. Reverse repurchase agreements expose the Fund to credit risk (that is, the risk that the counterparty will fail to resell the security to the Fund). Engaging in reverse repurchase agreements also may involve the use of leverage, in that the Fund may reinvest the cash it receives in additional securities. Reverse repurchase agreements involve the risk that the market value of the securities to be repurchased by the Fund may decline below the repurchase price |
| | |
| | For the year ended December 31, 2018, the average interest rate, the amount of interest and the average principal amount for the days borrowed in the period were as follows: |
Interest
Rate | Average
Interest | Amount
Borrowed |
| 6.00% | $84,030 | $1,867,331 |
| (o) | Floating Rate Loans–The Fund may invest in floating rate loans, which usually take the form of loan participations and assignments. Loan participations and assignments are agreements to make money available to U.S. or foreign corporations, partnerships or other business entities (the “Borrower”) in a specified amount, at a specified rate and within a specified time. A loan is typically originated, negotiated and structured by a U.S. or foreign bank, insurance company or other financial institution (the “Agent”) for a group of loan investors (“Loan Investors”). The |
58
Notes to Financial Statements (continued)
Agent typically administers and enforces the loan on behalf of the other Loan Investors in the syndicate and may hold any collateral on behalf of the Loan Investors. Such loan participations and assignments are typically senior, secured and collateralized in nature. The Fund records an investment when the Borrower withdraws money and records interest as earned. These loans pay interest at rates which are periodically reset by reference to a base lending rate plus a spread. These base lending rates are generally the prime rate offered by a designated U.S. bank or London InterBank Offered Rate (“LIBOR”).
The loans in which the Fund invests may be subject to some restrictions on resale. For example, the Fund may be contractually obligated to receive approval from the Agent and/or Borrower prior to the sale of these investments. The Fund generally has no right to enforce compliance with the terms of the loan agreement with the Borrower. As a result, the Fund assumes the credit risk of the Borrower, the selling participant and any other persons interpositioned between the Fund and the Borrower (“Intermediate Participants”). In the event that the Borrower, selling participant or Intermediate Participants become insolvent or enter into bankruptcy, the Fund may incur certain costs and delays in realizing payment or may suffer a loss of principal and/or interest.
Unfunded commitments represent the remaining obligation of the Fund to the Borrower. At any point in time, up to the maturity date of the issue, the Borrower may demand the unfunded portion. Until demanded by the Borrower, unfunded commitments are not recognized as an asset on the Statement of Assets and Liabilities. Unrealized appreciation/depreciation on unfunded commitments if any on the Statement of Assets and Liabilities represents mark to market of the unfunded portion of the Fund’s floating rate notes. As of December 31, 2018 the Fund had the following unfunded loan commitments:
| Claire’s Store, Inc. Revolving Credit | | $ | 719,580 | |
| Energizer Holdings, Inc. Bridge Term Loan | | | 10,441,000 | |
| Mavis Tire Express Services Corp. 1st Lien Delayed Draw Term Loan | | | 2,321,020 | |
| Total | | $ | 13,481,600 | |
| (p) | Fair Value Measurements–Fair value is defined as the price that the Fund would receive upon selling an investment or transferring a liability in an orderly transaction to an independent buyer in the principal or most advantageous market of the investment. A three-tier hierarchy is used to maximize the use of observable market data and minimize the use of unobservable inputs and to establish classification of fair value measurements for disclosure purposes. Inputs refer broadly to the assumptions that market participants would use in pricing the asset or liability, including assumptions about risk—for example, the risk inherent in a particular valuation technique used to measure fair value (such as a pricing model) and/or the risk inherent in the inputs to the valuation technique. Inputs may be observable or unobservable. Observable inputs reflect the assumptions market participants would use in pricing the asset or liability. Observable inputs are based on market data obtained from sources independent of the reporting entity. Unobservable inputs reflect the reporting entity’s own assumptions about the assumptions market participants would use in pricing the asset or liability. Unobservable inputs are based on the best information available in the circumstances. The three-tier hierarchy classification is determined based on the lowest level of inputs that is significant to the fair value measurement, and is summarized in the three broad Levels listed below: |
59
Notes to Financial Statements (continued)
| | • | Level 1 – | unadjusted quoted prices in active markets for identical investments; |
| | | |
| | • | Level 2 – | other significant observable inputs (including quoted prices for similar investments, interest rates, prepayment speeds, credit risk, etc.); and |
| | | |
| | • | Level 3 – | significant unobservable inputs (including the Fund’s own assumptions in determining the fair value of investments). |
| | A summary of inputs used in valuing the Fund’s investments and other financial instruments as of December 31, 2018 and, if applicable, Level 1/Level 2 transfers and Level 3 rollforwards for the fiscal year then ended is included in the Fund’s Schedule of Investments. |
| | |
| | Changes in valuation techniques may result in transfers into or out of an assigned level within the three-tier hierarchy. All transfers between different levels within the three-tier hierarchy are deemed to have occurred as of the beginning of the reporting period. The inputs or methodology used for valuing securities are not necessarily an indication of the risk associated with investing in those securities. |
| 3. | MANAGEMENT FEE AND OTHER TRANSACTIONS WITH AFFILIATES |
Management Fee
The Fund has a management agreement with Lord Abbett, pursuant to which Lord Abbett supplies the Fund with investment management services and executive and other personnel, provides office space and pays for ordinary and necessary office and clerical expenses relating to research and statistical work and supervision of the Fund’s investment portfolio.
The management fee is based on the Fund’s average daily net assets at the following annual rate:
| First $500 million | | | .50 | % |
| Next $9.5 billion | | | .45 | % |
| Over $10 billion | | | .40 | % |
For the fiscal year ended December 31, 2018, the effective management fee was at an annualized rate of .44% of the Fund’s average daily net assets.
In addition, Lord Abbett provides certain administrative services to the Fund pursuant to an Administrative Services Agreement in return for a fee at an annual rate of .04% of the Fund’s average daily net assets.
12b-1 Distribution Plan
The Fund has adopted a distribution plan with respect to Class A, B, C, F, P, R2, R3, R4 and T shares pursuant to Rule 12b-1 under the Act, which provides for the payment of ongoing distribution and service fees to Lord Abbett Distributor LLC (the “Distributor”), an affiliate of Lord Abbett. The following annual rates have been authorized by the Board pursuant to the plan:
| Fees* | | Class A | | | Class B(1) | | | Class C(2) | | | Class F(3) | | | Class P | | | Class R2 | | | Class R3 | | | Class R4 | | | Class T(4) | |
| Service | | | .15% | | | | .25% | | | | .25% | | | | – | | | | .25% | | | | .25% | | | | .25% | | | | .25% | | | | .25% | |
| Distribution | | | .05% | | | | .75% | | | | .75% | | | | .10% | | | | .20% | | | | .35% | | | | .25% | | | | – | | | | – | |
| * | The Fund may designate a portion of the aggregate fee as attributable to service activities for purposes of calculating Financial Industry Regulatory Authority, Inc. (“FINRA”) sales charge limitations. |
| (1) | Class B closed on April 25, 2018. |
| (2) | The Rule 12b-1 fee the Fund pays on Class C shares is a blended rate based on 1.00% of the Fund’s average daily net assets attributable to Class C shares held for less than one year and .80% (.25% service, .55% distribution) of the Fund’s average daily net assets attributable to Class C shares held for one year or more. All Class C shareholders of the Fund will bear Rule 12b-1 fees at the same rate. |
60
Notes to Financial Statements (continued)
| (3) | The Class F share Rule 12b-1 fee may be designated as a service fee in limited circumstances as described in the Fund’s prospectus. |
| (4) | Class T shares closed on July 24, 2018. |
Class F3, I, R5 and R6 shares do not have a distribution plan.
Commissions
Distributor received the following commissions on sales of shares of the Fund, after concessions were paid to authorized dealers, for the fiscal year ended December 31, 2018:
Distributor
Commissions | Dealers’
Concessions |
| $478,139 | $3,132,603 |
Distributor received CDSCs of $126,286 and $184,126 for Class A and Class C shares, respectively, for the fiscal year ended December 31, 2018.
One Director and certain of the Fund’s officers have an interest in Lord Abbett.
| 4. | DISTRIBUTIONS AND CAPITAL LOSS CARRYFORWARDS |
Dividends from net investment income, if any, are declared daily and paid monthly. Taxable net realized gains from investment transactions, reduced by allowable capital loss carryforwards, if any, are declared and distributed to shareholders at least annually. The capital loss carryforward amount, if any, is available to offset future net capital gains. Dividends and distributions to shareholders are recorded on the ex-dividend date. The amounts of dividends and distributions from net investment income and net realized capital gains are determined in accordance with federal income tax regulations, which may differ from U.S. GAAP. These book/tax differences are either considered temporary or permanent in nature. To the extent these differences are permanent in nature, such amounts are reclassified within the components of net assets based on their federal tax basis treatment; temporary differences do not require reclassification. Dividends and distributions, which exceed earnings and profits for tax purposes, are reported as a tax return of capital.
The tax character of distributions paid during the fiscal years ended December 31, 2018 and 2017 were as follows:
| | | Year Ended 12/31/2018 | | | Year Ended 12/31/2017 | |
| Distributions paid from: | | | | | | | | |
| Ordinary income | | $ | 649,203,158 | | | $ | 532,570,486 | |
| Net long-term capital gains | | | 138,554,337 | | | | – | |
| Total distributions paid | | $ | 787,757,495 | | | $ | 532,570,486 | |
As of December 31, 2018, the components of accumulated losses on a tax-basis were as follows:
| Undistributed ordinary income – net | | $ | 9,437,213 | |
| Total undistributed earnings | | | 9,437,213 | |
| Temporary differences | | | (152,900,421 | ) |
| Unrealized losses – net | | | (610,107,653 | ) |
| Total accumulated losses – net | | $ | (753,570,861 | ) |
At the Fund’s election, certain losses incurred within the taxable year (Qualified Late-Year Losses) are deemed to arise on the first business day of the Fund’s next taxable year. The Fund incurred and will elect to defer post-October capital losses of $150,881,071 during the fiscal year ended December 31, 2018.
61
Notes to Financial Statements (continued)
As of December 31, 2018, the aggregate unrealized security gains and losses on investments and other financial instruments based on cost for U.S. federal income tax purposes were as follows:
| Tax cost | | $ | 13,791,901,223 | |
| Gross unrealized gain | | | 119,635,428 | |
| Gross unrealized loss | | | (729,725,169 | ) |
| Net unrealized security loss | | $ | (610,089,741 | ) |
The difference between book-basis and tax-basis unrealized gains (losses) is attributable to the tax treatment of certain securities, other financial instruments, amortization of premium and wash sales.
| 5. | PORTFOLIO SECURITIES TRANSACTIONS |
Purchases and sales of investment securities (excluding short-term investments) for the fiscal year ended December 31, 2018 were as follows:
U.S.
Government
Purchases* | Non-U.S.
Government
Purchases | U.S.
Government
Sales* | Non-U.S.
Government
Sales |
| $7,117,708,459 | $14,241,569,192 | $6,066,803,032 | $13,217,301,951 |
| * | Includes U.S. Government sponsored enterprises securities. |
The Fund is permitted to purchase and sell securities (“cross-trade”) from and to other Lord Abbett funds or client accounts pursuant to procedures approved by the Board in compliance with Rule 17a-7 under the Act (the “Rule”). Each cross-trade is executed at a fair market price in compliance with provisions of the Rule. For the fiscal year ended December 31, 2018, the Fund engaged in cross-trades purchases of $21,448,939 and sales of $122,967,593 which resulted in net realized gains of $727,810.
| 6. | DISCLOSURES ABOUT DERIVATIVE INSTRUMENTS AND HEDGING ACTIVITIES |
The Fund entered into forward foreign currency exchange contracts for the fiscal year ended December 31, 2018 (as described in note 2(g)). A forward foreign currency exchange contract reduces the Fund’s exposure to changes in the value of the currency it will deliver (or settle in cash) and increases its exposure to changes in the value of the currency it will receive (or settle in cash) for the duration of the contract. The Fund’s use of forward foreign currency exchange contracts involves the risk that Lord Abbett will not accurately predict currency movements, and the Fund’s returns could be reduced as a result. Forward foreign currency exchange contracts are subject to the risk that those currencies will decline in value relative to the U.S. dollar, or, in the case of hedged positions, that the U.S. dollar will decline relative to the currency being hedged. Currency rates in foreign countries may fluctuate significantly over short periods of time. The Fund’s risk of loss from counterparty credit risk is the unrealized appreciation on forward foreign currency exchange contracts.
The Fund entered into U.S. Treasury futures contracts for the fiscal year ended December 31, 2018 (as described in note 2(h)) to economically hedge against changes in interest rates. The Fund bears the risk of interest rates moving unexpectedly, in which case the Fund may not achieve the anticipated benefits of the futures contracts and realize a loss. There is minimal counterparty credit risk to the Fund since futures are exchange traded and the exchange’s clearinghouse, as counterparty to all exchange traded futures, guarantees futures against default.
The Fund entered into credit default swaps for the fiscal year ended December 31, 2018 (as described in note 2(i)) to economically hedge credit risk. Credit default swaps involve the exchange
62
Notes to Financial Statements (continued)
of a fixed rate premium for protection against the loss in value of an underlying security within the index in the event of a defined credit event, such as payment default or bankruptcy. Under a credit default swap one party acts as a guarantor by receiving the fixed periodic payment in exchange for the commitment to purchase the underlying security at par if the defined credit event occurs. The Fund’s maximum risk of loss from counterparty risk, either as the protection seller or as the protection buyer, is the fair value of the contract. For the centrally cleared credit default swaps, there is minimal counterparty credit risk to the Fund since these credit default swaps are traded through a central clearinghouse. As a counterparty to all centrally cleared credit default swaps, the clearinghouse guarantees credit default swaps against default.
As of December 31, 2018, the Fund had the following derivatives at fair value, grouped into appropriate risk categories that illustrate the Fund’s use of derivative instruments:
| Asset Derivatives | | Interest
Rate
Contracts | | | Foreign
Currency
Contracts | | | Credit
Contracts | | | Equity
Contracts | |
| Centrally Cleared Credit Default Swap Contracts(1) | | | – | | | | – | | | $ | 6,508,026 | | | | – | |
| Total Return Swap Contracts(2) | | | – | | | | – | | | | – | | | $ | 981,808 | |
| Forward Foreign Currency Exchange Contracts(3) | | | – | | | $ | 66,815 | | | | – | | | | – | |
| Futures Contracts(4) | | $ | 29,880,039 | | | | – | | | | – | | | | – | |
| | | | | | | | | | | | | | | | | |
| Liability Derivatives | | | | | | | | | | | | | | | | |
| Credit Default Swap Contracts(5) | | | – | | | | – | | | $ | 54,193,971 | | | | – | |
| Futures Contracts(4) | | $ | 60,658,322 | | | | – | | | | – | | | | – | |
| Forward Foreign Currency Exchange Contracts(6) | | | – | | | $ | 2,682,711 | | | | – | | | | – | |
| (1) | Statement of Assets and Liabilities location: Includes cumulative unrealized appreciation/depreciation of centrally cleared swap contracts as reported in the Schedule of Investments. Only current day’s variation margin is reported within the Statement of Assets and Liabilities. |
| (2) | Statement of Assets and Liabilities location: Total return swaps, at fair value. |
| (3) | Statement of Assets and Liabilities location: Unrealized appreciation on forward foreign currency exchange contracts. |
| (4) | Statement of Assets and Liabilities location: Includes cumulative unrealized appreciation/depreciation of futures contracts as reported in the Schedule of Investments. Only the current day’s variation margin is reported within the Statement of Assets and Liabilities. |
| (5) | Statement of Assets and Liabilities location: Credit default swap agreements payable, at fair value. |
| (6) | Statement of Assets and Liabilities location: Unrealized depreciation on forward foreign currency exchange contracts. |
63
Notes to Financial Statements (continued)
Transactions in derivative instruments for the fiscal year ended December 31, 2018, were as follows:
| | | Interest | | | Foreign | | | | | | | |
| | | Rate | | | Currency | | | Credit | | | Equity | |
| | | Contracts | | | Contracts | | | Contracts | | | Contracts | |
| Net Realized Gain (Loss) | | | | | | | | | | | | | | | | |
| Credit Default Swaps Contracts(1) | | | – | | | | – | | | $ | 5,856,417 | | | | – | |
| Forward Foreign Currency Exchange Contracts(2) | | | – | | | $ | 18,439,734 | | | | – | | | | – | |
| Futures Contracts(3) | | $ | 71,052,013 | | | | – | | | | – | | | | – | |
| Net Change in Unrealized Appreciation/Depreciation | | | | | | | | | | | | | | | | |
| Credit Default Swaps Contracts(4) | | | – | | | | – | | | $ | (1,719,866 | ) | | | – | |
| Forward Foreign Currency Exchange Contracts(5) | | | – | | | $ | 880,506 | | | | – | | | | – | |
| Futures Contracts(6) | | $ | (26,437,560 | ) | | | – | | | | – | | | | – | |
| Total Return Swaps Contracts(4) | | | – | | | | – | | | | – | | | $ | 981,808 | |
| Average Number of Contracts/Notional Amounts* | | | | | | | | | | | | | | | | |
| Credit Default Swaps Contracts(7) | | | – | | | | – | | | $ | 1,815,705,238 | | | | – | |
| Total Return Swap Contracts(7) | | | – | | | | – | | | | – | | | $ | 6,888,462 | |
| Forward Foreign Currency Exchange Contracts(7) | | | – | | | $ | 421,287,209 | | | | – | | | | – | |
| Futures Contracts(8) | | | 33,478 | | | | – | | | | – | | | | – | |
| * | Calculated based on the number of contracts or notional amounts for the year ended December 31, 2018. |
| (1) | Statements of Operations location: Net realized gain on swap contracts. |
| (2) | Statements of Operations location: Net realized gain on foreign currency exchange contracts. |
| (3) | Statements of Operations location: Net realized gain on futures contracts. |
| (4) | Statements of Operations location: Net change in unrealized appreciation/depreciation on swap contracts. |
| (5) | Statements of Operations location: Net change in unrealized appreciation/depreciation on foreign currency exchange contracts. |
| (6) | Statements of Operations location: Net change in unrealized appreciation/depreciation on futures contracts. |
| (7) | Amount represents notional amounts in U.S. dollars. |
| (8) | Amount represents number of contracts. |
| 7. | DISCLOSURES ABOUT OFFSETTING ASSETS AND LIABILITIES |
The Financial Accounting Standards Board (“FASB”) requires disclosures intended to help better assess the effect or potential effect of offsetting arrangements on a fund’s financial position. The following tables illustrate gross and net information about recognized assets and liabilities eligible for offset in the Statement of Assets and Liabilities; and disclose such amounts subject to an enforceable master netting agreement or similar agreement, by counterparty. A master netting agreement is an agreement between the Fund and a counterparty which provides for the net settlement of amounts owed under all contracts traded under that agreement, as well as cash collateral, through a single payment by one party to the other in the event of default on or termination of any one contract. The Fund’s accounting policy with respect to balance sheet offsetting is that, absent an event of default by the counterparty or a termination of the agreement, the master netting agreement does not result in an offset of reported amounts of financial assets and liabilities in the Statement of Assets and Liabilities across transactions between the Fund and the applicable counterparty:
64
Notes to Financial Statements (continued)
| Description | | Gross Amounts of
Recognized Assets | | | Gross Amounts
Offset in the
Statement of Assets
and Liabilities | | | Net Amounts of
Assets Presented
in the Statement of
Assets and Liabilities |
| Forward Foreign Currency Exchange Contracts | | $ | 66,815 | | | $ | – | | | $ | 66,815 |
| Total Return Swaps Contract | | | 981,808 | | | | – | | | | 981,808 |
| Repurchase Agreement | | | 20,725,575 | | | | – | | | | 20,725,575 |
| Total | | $ | 21,774,198 | | | $ | – | | | $ | 21,774,198 |
| | | Net Amounts | | | | | | | | | | | | |
| | | of Assets | | | Amounts Not Offset in the | | | |
| | | Presented in | | | Statement of Assets and Liabilities | | | |
| | | the Statement | | | | | | Cash | | | Securities | | | |
| | | of Assets and | | | Financial | | | Collateral | | | Collateral | | | Net |
| Counterparty | | Liabilities | | | Instruments | | | Received(a) | | | Received(a) | | | Amount(b) |
| Fixed Income Clearing Corp. | | $ | 20,725,575 | | | $ | – | | | $ | – | | | $ | (20,725,575 | ) | | $ | – |
| Goldman Sachs | | | 605,085 | | | | (605,085 | ) | | | – | | | | – | | | | – |
| J.P. Morgan Chase | | | 264,231 | | | | (264,231 | ) | | | – | | | | – | | | | – |
| Morgan Stanley | | | 147,655 | | | | (147,655 | ) | | | – | | | | – | | | | – |
| Toronto Dominion Bank | | | 31,652 | | | | (31,652 | ) | | | – | | | | – | | | | – |
| Total | | $ | 21,774,198 | | | $ | (1,048,623 | ) | | $ | – | | | $ | (20,725,575 | ) | | $ | – |
| Description | | Gross Amounts of Recognized Liabilities | | | Gross Amounts
Offset in the
Statement of Assets
and Liabilities | | | Net Amounts of
Liabilities Presented
in the Statement of
Assets and Liabilities |
| Credit Default Contracts | | $ | 54,193,971 | | | $ | – | | | $ | 54,193,971 |
| Forward Foreign Currency Exchange Contracts | | | 2,682,711 | | | | – | | | | 2,682,711 |
| Reverse Repurchase Agreement | | | 1,783,301 | | | | – | | | | 1,783,301 |
| Total | | $ | 58,659,983 | | | $ | – | | | $ | 58,659,983 |
| | | Net Amounts | | | | | | | | | | | | |
| | | of Liabilities | | | Amounts Not Offset in the | | | |
| | | Presented in | | | Statement of Assets and Liabilities | | | |
| | | the Statement | | | | | | Cash | | | Securities | | | |
| | | of Assets and | | | Financial | | | Collateral | | | Collateral | | | Net |
| Counterparty | | Liabilities | | | Instruments | | | Pledged(a) | | | Pledged(a) | | | Amount(c) |
| Credit Suisse | | $ | 8,569,542 | | | $ | – | | | $ | (8,569,542 | ) | | $ | – | | | $ | – |
| Deutsche Bank | | | 6,655,603 | | | | – | | | | (6,650,000 | ) | | | – | | | | 5,603 |
| Goldman Sachs | | | 6,064,610 | | | | (605,085 | ) | | | (5,459,525 | ) | | | – | | | | – |
| J.P. Morgan Chase | | | 2,957,143 | | | | (264,231 | ) | | | (1,060,000 | ) | | | – | | | | 1,632,912 |
| Morgan Stanley | | | 31,730,374 | | | | (147,655 | ) | | | (31,582,719 | ) | | | – | | | | – |
| State Street Bank and Trust | | | 846,630 | | | | – | | | | (510,000 | ) | | | – | | | | 336,630 |
| Toronto Dominion Bank | | | 1,836,081 | | | | (31,652 | ) | | | (1,570,000 | ) | | | – | | | | 234,429 |
| Total | | $ | 58,659,983 | | | $ | (1,048,623 | ) | | $ | (55,401,786 | ) | | $ | – | | | $ | 2,209,574 |
| (a) | Collateral disclosed is limited to an amount not to exceed 100% of the net amount of assets (liabilities) presented in the Statement of Assets and Liabilities, for each respective counterparty. |
| (b) | Net amount represents the amount owed to the Fund by the counterparty as of December 31, 2018. |
| (c) | Net amount represents the amount owed by the Fund to the counterparty as of December 31, 2018. |
65
Notes to Financial Statements (continued)
| 8. | DIRECTORS’ REMUNERATION |
The Fund’s officers and one Director, who are associated with Lord Abbett, do not receive any compensation from the Fund for serving in such capacities. Independent Directors’ fees are allocated among all Lord Abbett-sponsored funds based on the net assets of each fund. There is an equity-based plan available to all Independent Directors under which Independent Directors must defer receipt of a portion of, and may elect to defer receipt of an additional portion of Directors’ fees. The deferred amounts are treated as though equivalent dollar amounts had been invested in the funds. Such amounts and earnings accrued thereon are included in Directors’ fees on the Statement of Operations and in Directors’ fees payable on the Statement of Assets and Liabilities and are not deductible for U.S. federal income tax purposes until such amounts are paid.
The Fund has entered into an arrangement with its transfer agent and custodian, whereby credits realized as a result of uninvested cash balances are used to reduce a portion of the Fund’s expenses.
During the period ended August 8, 2018, the Fund and certain other funds managed by Lord Abbett (collectively, the “Participating Funds”) participated in a syndicated line of credit facility with various lenders for $600 million (the “Facility”), whereas State Street Bank and Trust Company (“SSB”) participates as a lender and as agent for the lenders. The Facility is to be used for temporary or emergency purposes as an additional source of liquidity to satisfy redemptions. The Participating Funds are subject to graduated borrowing limits of one-third of Fund assets (if Fund assets are less than $750 million), $250 million, $300 million, or $350 million, based on past borrowings and likelihood of future borrowings. During the period ended August 8, 2018, the Fund did not utilize the Facility.
For the period August 9, 2018 through December 20, 2018, the Participating Funds entered into an amended syndicated line of credit facility with various lenders for $1.06 billion (the “Syndicated Facility”), whereas SSB participates as a lender and as agent for the lenders. Under the Syndicated Facility, the Participating Funds are subject to graduated borrowing limits of one-third of Fund assets (if Fund assets are less than $750 million), $250 million, $300 million, $350 million, or $1 billion, based on past borrowings and likelihood of future borrowings. Effective December 21, 2018, the Participating Funds entered into an amended Syndicated Facility with various lenders for $1.1 billion based on the same terms as described above.
Effective August 9, 2018, the Participating Funds entered into an additional line of credit facility with SSB for $250 million (the “Bilateral Facility,” and together with the Syndicated Facility, the “Facilities”). Under the Bilateral Facility, each Participating Fund may borrow up to the lesser of $250 million or one- third of Fund assets. The Facilities are to be used for temporary or emergency purposes to satisfy redemption requests and manage liquidity.
For the period from August 9, 2018 through December 31, 2018, the Fund did not utilize the Facilities.
| 11. | INTERFUND LENDING PROGRAM |
Pursuant to an exemptive order issued by the U.S. Securities and Exchange Commission (“SEC exemptive order”), certain registered open-end management investment companies managed by Lord Abbett, including the Fund, participate in a joint lending and borrowing program (the “Interfund
66
Notes to Financial Statements (continued)
Lending Program”). The SEC exemptive order allows the Fund to borrow money from and lend money to each other for temporary or emergency purposes subject to the limitations and conditions.
During the fiscal year ended December 31, 2018, the Fund did not participate as a borrower or lender in the Interfund Lending Program.
| 12. | CUSTODIAN AND ACCOUNTING AGENT |
SSB is the Fund’s custodian and accounting agent. SSB performs custodial, accounting and recordkeeping functions relating to portfolio transactions and calculating the Fund’s NAV.
The Fund is subject to the general risks and considerations associated with investing in debt securities and to the changing prospects of individual companies and/or sectors in which the Fund invests. The value of an investment will change as interest rates fluctuate and in response to market movements. When interest rates rise, the prices of debt securities are likely to decline; when rates fall, such prices tend to rise. Longer-term debt securities are usually more sensitive to interest rate changes. There is also the risk that an issuer of a debt security will fail to make timely payments of principal or interest to the Fund, a risk that is greater with high-yield securities (sometimes called “lower-rated bonds” or “junk bonds”), in which the Fund may substantially invest. Some issuers, particularly of high-yield securities, may default as to principal and/or interest payments after the Fund purchases its securities. A default, or concerns in the market about an increase in risk of default, may result in losses to the Fund. High-yield securities are subject to greater price fluctuations, as well as additional risks. The market for below investment grade securities may be less liquid, which may make such securities more difficult to sell at an acceptable price, especially during periods of financial distress, increased market volatility, or significant market decline.
The Fund is subject to the risk of investing in securities issued or guaranteed by the U.S. Government or its agencies and instrumentalities (such as the Government National Mortgage Association (“Ginnie Mae”), the Federal National Mortgage Association (“Fannie Mae”), or the Federal Home Loan Mortgage Corporation (“Freddie Mac”)). Unlike Ginnie Mae securities, securities issued or guaranteed by U.S. Government-related organizations such as Fannie Mae and Freddie Mac are not backed by the full faith and credit of the U.S. Government and no assurance can be given that the U.S. Government would provide financial support to its agencies and instrumentalities if not required to do so by law. Consequently, the Fund may be required to look principally to the agency issuing or guaranteeing the obligation.
The mortgage-related and asset-backed securities in which the Fund may invest may be particularly sensitive to changes in prevailing interest rates, and economic conditions, including delinquencies and/or defaults. These changes can affect the value, income, and/or liquidity of such positions. When interest rates are declining, the value of these securities with prepayment features may not increase as much as other fixed income securities. Early principal repayment may deprive the Fund of income payments above current market rates. Alternatively, rising interest rates may cause prepayments to occur at a slower-than-expected rate, extending the duration of a security and typically reducing its value. The payment rate will thus affect the price and volatility of a mortgage-related security. In addition, the Fund may invest in non-agency asset backed and mortgage related securities, which are issued by private institutions, not by government-sponsored enterprises.
67
Notes to Financial Statements (continued)
The Fund may invest up to 20% of its net assets in equity securities, the value of which fluctuates in response to movements in the equity securities markets in general, the changing prospects of individual companies in which the Fund invests, or an individual company’s financial condition.
The Fund may invest in convertible securities, which have both equity and fixed income risk characteristics, including market, credit, liquidity, and interest rate risks. Generally, convertible securities offer lower interest or dividend yields than non-convertible securities of similar quality and less potential for gains or capital appreciation in a rising equity securities market than equity securities. They tend to be more volatile than other fixed income securities and the market for convertible securities may be less liquid than the markets for stocks or bonds. A significant portion of convertible securities have below investment grade credit ratings and are subject to increased credit and liquidity risks.
Due to the Fund’s investment exposure to foreign companies and American Depositary Receipts, the Fund may experience increased market, industry and sector, liquidity, currency, political, information, and other risks. The securities of foreign companies also may be subject to inadequate exchange control regulations, the imposition of economic sanctions or other government restrictions, higher transaction and other costs, and delays in settlement to the extent they are traded on non-U.S. exchanges or markets.
The Fund is subject to the risks associated with derivatives, which may be different from and greater than the risks associated with directly investing in securities. Derivatives may be subject to risks such as liquidity risk, leveraging risk, interest rate risk, market risk, and credit risk. Illiquid securities may lower the Fund’s returns since the Fund may be unable to sell these securities at their desired time or price. Derivatives also may involve the risk of mispricing or improper valuation and the risk that changes in the value of the derivative may not correlate perfectly with the value of the underlying asset, rate or index. Whether the Fund’s use of derivatives is successful will depend on, among other things, the Fund’s ability to correctly forecast market movements and other factors. Losses may also arise from the failure of a derivative counterparty to meet its contractual obligations. If the Fund incorrectly forecasts these and other factors, the Fund’s performance could suffer. The Fund’s use of derivatives could result in a loss exceeding the amount of the Fund’s investment in these instruments.
The Fund may invest up to 15% of its net assets in floating rate or adjustable rate senior loans, including bridge loans, novations, assignments, and participations, which are subject to increased credit and liquidity risks. Senior loans are business loans made to borrowers that may be U.S. or foreign corporations, partnerships or other business entities. The senior loans in which the Fund invests may consist primarily of senior loans that are rated below investment grade or, if unrated, deemed by Lord Abbett to be equivalent to below investment grade securities. Below investment grade senior loans, as in the case of high-yield debt securities, or junk bonds, are usually more credit sensitive than interest rate sensitive, although the value of these instruments may be impacted by broader interest rate swings in the overall fixed income market. In addition, senior loans may be subject to structural subordination.
These factors can affect the Fund’s performance.
68
Notes to Financial Statements (continued)
| 14. | SUMMARY OF CAPITAL TRANSACTIONS |
Transactions in shares of beneficial interest were as follows:
| | | Year Ended
December 31, 2018 | | | Year Ended
December 31, 2017 | |
| Class A Shares | | Shares | | | Amount | | | Shares | | | Amount | |
| Shares sold | | | 89,042,771 | | | $ | 715,517,851 | | | | 130,421,720 | | | $ | 1,062,666,423 | |
| Converted from Class B* | | | 725,710 | | | | 5,954,085 | | | | 5,005,101 | | | | 40,753,976 | |
| Converted from Class C** | | | 42,540,947 | | | | 341,584,436 | | | | – | | | | – | |
| Reinvestment of distributions | | | 32,122,488 | | | | 253,143,937 | | | | 23,671,425 | | | | 193,498,676 | |
| Shares reacquired | | | (139,461,180 | ) | | | (1,109,191,945 | ) | | | (152,458,116 | ) | | | (1,239,565,300 | ) |
| Increase | | | 24,970,736 | | | $ | 207,008,364 | | | | 6,640,130 | | | $ | 57,353,775 | |
| | | | | | | | | | | | | | | | | |
| Class B Shares | | | | | | | | | | | | | | | | |
| Shares sold | | | 350 | | | $ | 1,372 | | | | 157,434 | | | $ | 1,272,177 | |
| Reinvestment of distributions | | | 3,780 | | | | 31,162 | | | | 109,093 | | | | 889,855 | |
| Shares reacquired | | | (84,851 | ) | | | (694,589 | ) | | | (966,972 | ) | | | (7,862,216 | ) |
| Converted to Class A* | | | (723,417 | ) | | | (5,954,085 | ) | | | (4,987,084 | ) | | | (40,753,976 | ) |
| Decrease | | | (804,138 | ) | | $ | (6,616,140 | ) | | | (5,687,529 | ) | | $ | (46,454,160 | ) |
| | | | | | | | | | | | | | | | | |
| Class C Shares | | | | | | | | | | | | | | | | |
| Shares sold | | | 31,268,208 | | | $ | 251,885,686 | | | | 41,611,419 | | | $ | 340,570,323 | |
| Reinvestment of distributions | | | 9,385,524 | | | | 74,297,016 | | | | 8,313,336 | | | | 68,129,835 | |
| Shares reacquired | | | (51,447,004 | ) | | | (411,326,771 | ) | | | (61,659,318 | ) | | | (502,939,276 | ) |
| Converted to Class A** | | | (42,435,232 | ) | | | (341,584,436 | ) | | | – | | | | – | |
| Decrease | | | (53,228,504 | ) | | $ | (426,728,505 | ) | | | (11,734,563 | ) | | $ | (94,239,118 | ) |
| | | | | | | | | | | | | | | | | |
| Class F Shares | | | | | | | | | | | | | | | | |
| Shares sold | | | 253,719,826 | | | $ | 2,036,261,266 | | | | 376,928,985 | | | $ | 3,064,862,711 | |
| Reinvestment of distributions | | | 25,443,252 | | | | 200,126,782 | | | | 17,965,603 | | | | 146,757,467 | |
| Shares reacquired | | | (226,304,503 | ) | | | (1,785,567,950 | ) | | | (263,911,211 | ) | | | (2,168,609,611 | ) |
| Increase | | | 52,858,575 | | | $ | 450,820,098 | | | | 130,983,377 | | | $ | 1,043,010,567 | |
| | | | | | | | | | | | | | | | | |
| Class F3 Shares(a) | | | | | | | | | | | | | | | | |
| Shares sold | | | 94,593,905 | | | $ | 756,207,322 | | | | 134,987,915 | | | $ | 1,110,817,647 | |
| Reinvestment of distributions | | | 11,496,201 | | | | 89,940,220 | | | | 2,005,568 | | | | 16,481,862 | |
| Shares reacquired | | | (32,893,600 | ) | | | (259,525,702 | ) | | | (3,822,127 | ) | | | (31,457,352 | ) |
| Increase | | | 73,196,506 | | | $ | 586,621,840 | | | | 133,171,356 | | | $ | 1,095,842,157 | |
| | | | | | | | | | | | | | | | | |
| Class I Shares | | | | | | | | | | | | | | | | |
| Shares sold | | | 54,051,383 | | | $ | 431,982,693 | | | | 86,548,200 | | | $ | 710,918,084 | |
| Reinvestment of distributions | | | 7,780,452 | | | | 61,042,373 | | | | 3,413,127 | | | | 27,821,715 | |
| Shares reacquired | | | (63,691,245 | ) | | | (502,420,870 | ) | | | (20,418,964 | ) | | | (166,070,091 | ) |
| Increase (decrease) | | | (1,859,410 | ) | | $ | (9,395,804 | ) | | | 69,542,363 | | | $ | 572,669,708 | |
| | | | | | | | | | | | | | | | | |
| Class P Shares | | | | | | | | | | | | | | | | |
| Shares sold | | | 249,640 | | | $ | 2,045,598 | | | | 567,197 | | | $ | 4,718,360 | |
| Reinvestment of distributions | | | 146,936 | | | | 1,187,883 | | | | 204,932 | | | | 1,711,749 | |
| Shares reacquired | | | (1,948,530 | ) | | | (16,225,112 | ) | | | (1,478,406 | ) | | | (12,360,600 | ) |
| Decrease | | | (1,551,954 | ) | | $ | (12,991,631 | ) | | | (706,277 | ) | | $ | (5,930,491 | ) |
69
Notes to Financial Statements (concluded)
| | | Year Ended
December 31, 2018 | | | Year Ended
December 31, 2017 | |
| Class R2 Shares | | Shares | | | Amount | | | Shares | | | Amount | |
| Shares sold | | | 365,702 | | | $ | 2,951,667 | | | | 716,109 | | | $ | 5,790,307 | |
| Reinvestment of distributions | | | 30,106 | | | | 237,641 | | | | 24,247 | | | | 198,610 | |
| Shares reacquired | | | (629,724 | ) | | | (5,053,425 | ) | | | (313,038 | ) | | | (2,547,617 | ) |
| Increase (decrease) | | | (233,916 | ) | | $ | (1,864,117 | ) | | | 427,318 | | | $ | 3,441,300 | |
| | | | | | | | | | | | | | | | | |
| Class R3 Shares | | | | | | | | | | | | | | | | |
| Shares sold | | | 4,877,246 | | | $ | 39,068,672 | | | | 6,926,590 | | | $ | 56,141,762 | |
| Reinvestment of distributions | | | 1,121,177 | | | | 8,808,906 | | | | 784,980 | | | | 6,408,309 | |
| Shares reacquired | | | (3,945,159 | ) | | | (31,669,016 | ) | | | (5,488,388 | ) | | | (44,396,572 | ) |
| Increase | | | 2,053,264 | | | $ | 16,208,562 | | | | 2,223,182 | | | $ | 18,153,499 | |
| | | | | | | | | | | | | | | | | |
| Class R4 Shares | | | | | | | | | | | | | | | | |
| Shares sold | | | 2,255,095 | | | $ | 18,064,121 | | | | 931,435 | | | $ | 7,342,108 | |
| Reinvestment of distributions | | | 84,687 | | | | 662,989 | | | | 19,728 | | | | 161,790 | |
| Shares reacquired | | | (837,046 | ) | | | (6,630,028 | ) | | | (192,083 | ) | | | (1,554,649 | ) |
| Increase | | | 1,502,736 | | | $ | 12,097,082 | | | | 759,080 | | | $ | 5,949,249 | |
| | | | | | | | | | | | | | | | | |
| Class R5 Shares | | | | | | | | | | | | | | | | |
| Shares sold | | | 1,820,043 | | | $ | 14,564,194 | | | | 3,759,364 | | | $ | 30,034,372 | |
| Reinvestment of distributions | | | 243,244 | | | | 1,907,052 | | | | 148,299 | | | | 1,207,888 | |
| Shares reacquired | | | (1,324,437 | ) | | | (10,494,608 | ) | | | (633,158 | ) | | | (5,143,854 | ) |
| Increase | | | 738,850 | | | $ | 5,976,638 | | | | 3,274,505 | | | $ | 26,098,406 | |
| | | | | | | | | | | | | | | | | |
| Class R6 Shares | | | | | | | | | | | | | | | | |
| Shares sold | | | 12,151,378 | | | $ | 97,535,616 | | | | 7,495,631 | | | $ | 60,862,794 | |
| Reinvestment of distributions | | | 701,225 | | | | 5,482,843 | | | | 174,435 | | | | 1,423,439 | |
| Shares reacquired | | | (5,638,275 | ) | | | (44,812,345 | ) | | | (1,208,481 | ) | | | (9,776,672 | ) |
| Increase | | | 7,214,328 | | | $ | 58,206,114 | | | | 6,461,585 | | | $ | 52,509,561 | |
| | | | | | | | | | | | | | | | | |
| Class T Shares(b) | | | | | | | | | | | | | | | | |
| Shares sold | | | – | | | $ | – | | | | 1,218 | | | $ | 10,000 | |
| Reinvestment of distributions | | | 27 | | | | 220 | | | | 29 | | | | 236 | |
| Shares reacquired | | | (1,274 | ) | | | (10,229 | ) | | | – | | | | – | |
| Increase (decrease) | | | (1,247 | ) | | $ | (10,009 | ) | | | 1,247 | | | $ | 10,236 | |
| * | Automatic conversion of Class B shares occurred on the 25th day of the month (or, if the 25th day was not a business day, the next business day thereafter) following the eighth anniversary of the day on which the purchase order was accepted. Class B shares were closed on April 25, 2018. |
| ** | Automatic conversion of Class C shares occurs on the 25th day of the month (or, if the 25th day is not a business day, the next business day thereafter) following the tenth anniversary of the day on which the purchase order was accepted. |
| (a) | Shares commenced on April 4, 2017. |
| (b) | Shares commenced on July 28, 2017. |
70
Report of Independent Registered Public Accounting Firm
To the shareholders and Board of Directors of Lord Abbett Bond-Debenture Fund, Inc.:
Opinion on the Financial Statements and Financial Highlights
We have audited the accompanying statement of assets and liabilities of Lord Abbett Bond-Debenture Fund, Inc. (the “Fund”), including the schedule of investments, as of December 31, 2018, the related statements of operations for the year then ended, the statements of changes in net assets for each of the two years in the period then ended, the financial highlights for each of the five years in the period then ended, and the related notes. In our opinion, the financial statements and financial highlights present fairly, in all material respects, the financial position of the Fund as of December 31, 2018, and the results of its operations for the year then ended, the changes in its net assets for each of the two years in the period then ended, and the financial highlights for each of the five years in the period then ended in conformity with accounting principles generally accepted in the United States of America.
Basis for Opinion
These financial statements and financial highlights are the responsibility of the Fund’s management. Our responsibility is to express an opinion on the Fund’s financial statements and financial highlights based on our audits. We are a public accounting firm registered with the Public Company Accounting Oversight Board (United States) (PCAOB) and are required to be independent with respect to the Fund in accordance with the U.S. federal securities laws and the applicable rules and regulations of the Securities and Exchange Commission and the PCAOB.
We conducted our audits in accordance with the standards of the PCAOB. Those standards require that we plan and perform the audit to obtain reasonable assurance about whether the financial statements and financial highlights are free of material misstatement, whether due to error or fraud. The Fund is not required to have, nor were we engaged to perform, an audit of its internal control over financial reporting. As part of our audits we are required to obtain an understanding of internal control over financial reporting but not for the purpose of expressing an opinion on the effectiveness of the Fund’s internal control over financial reporting. Accordingly, we express no such opinion.
Our audits included performing procedures to assess the risks of material misstatement of the financial statements and financial highlights, whether due to error or fraud, and performing procedures that respond to those risks. Such procedures included examining, on a test basis, evidence regarding the amounts and disclosures in the financial statements and financial highlights. Our audits also included evaluating the accounting principles used and significant estimates made by management, as well as evaluating the overall presentation of the financial statements and financial highlights. Our procedures included confirmation of securities owned as of December 31, 2018, by correspondence with the custodian and brokers; when replies were not received from brokers, we performed other auditing procedures. We believe that our audits provide a reasonable basis for our opinion.
DELOITTE & TOUCHE LLP
New York, New York
February 28, 2019
We have served as the auditor of one or more Lord Abbett Family of Funds’ investment companies since 1932.
71
Basic Information About Management
The Board is responsible for the management of the business and affairs of the Fund in accordance with the laws of the State of Maryland. The Board elects officers who are responsible for the day-to-day operations of the Fund and who execute policies authorized by the Board. The Board also approves an investment adviser to each Fund and continues to monitor the cost and quality of the services the investment adviser provides, and annually considers whether to renew the contract with the adviser. Generally, each Director holds office until his/her successor is elected and qualified or until his/her earlier resignation or removal, as provided in the Fund’s organizational documents.
Lord Abbett, a Delaware limited liability company, is the Fund’s investment adviser. Designated Lord Abbett personnel are responsible for the day-to-day management of the Fund.
Interested Directors
Mr. Sieg is affiliated with Lord Abbett and is an “interested person” of the Fund as defined in the Act. Mr. Sieg is director/trustee of each of the 13 investment companies in the Lord Abbett Family of Funds, which consist of 61 investment portfolios. Mr. Sieg is an officer of the Lord Abbett Family of Funds.
Name, Address and
Year of Birth | | Current Position and
Length of Service
with the Fund | | Principal Occupation and Other Directorships
During the Past Five Years |
Douglas B. Sieg
Lord, Abbett & Co. LLC
90 Hudson Street
Jersey City, NJ 07302
(1969) | | Director since 2016; President and Chief Executive Officer since 2018 | | Principal Occupation:Managing Partner (since 2018) and was formerly Head of Client Services, joined Lord Abbett in 1994. Other Directorships:None. |
Independent Directors
The following Independent Directors also are directors/trustees of each of the 13 investment companies in the Lord Abbett Family of Funds, which consist of 61 investment portfolios.
Name, Address and
Year of Birth | | Current Position and
Length of Service
with the Fund | | Principal Occupation and Other Directorships
During the Past Five Years |
Eric C. Fast
Lord, Abbett & Co. LLC
c/o Legal Dept.
90 Hudson Street
Jersey City, NJ 07302
(1949) | | Director since 2014 | | Principal Occupation:Chief Executive Officer of Crane Co., an industrial products company (2001–2014). Other Directorships:Currently serves as director of Automatic Data Processing, Inc. (since 2007) and Regions Financial Corporation (since 2010). Previously served as a director of Crane Co. (1999–2014). |
| | | | | |
Evelyn E. Guernsey
Lord, Abbett & Co. LLC
c/o Legal Dept.
90 Hudson Street
Jersey City, NJ 07302
(1955) | | Director since 2011 | | Principal Occupation:None. Other Directorships:None. |
72
Basic Information About Management (continued)
Name, Address and
Year of Birth | | Current Position and
Length of Service
with the Fund | | Principal Occupation and Other Directorships
During the Past Five Years |
Julie A. Hill
Lord, Abbett & Co. LLC
c/o Legal Dept.
90 Hudson Street
Jersey City, NJ 07302
(1946) | | Director since 2004 | | Principal Occupation:Owner and CEO of The Hill Company, a business consulting firm (since 1998). Other Directorships:Currently serves as director of Anthem, Inc., a health benefits company (since 1994). |
| | | | | |
Kathleen M. Lutito
Lord, Abbett & Co. LLC
c/o Legal Dept.
90 Hudson Street
Jersey City, NJ 07302
(1963) | | Director since 2017 | | Principal Occupation:President and Chief Investment Officer of CenturyLink Investment Management Company (since 2006). Other Directorships:None |
| | | | | |
James M. McTaggart
Lord, Abbett & Co. LLC
c/o Legal Dept.
90 Hudson Street
Jersey City, NJ 07302
(1947) | | Director since 2012 | | Principal Occupation:Independent management advisor and consultant (since 2012). Other Directorships:Blyth, Inc., a home products company (2004–2015). |
| | | | | |
Karla M. Rabusch
Lord, Abbett & Co. LLC
c/o Legal Dept.
90 Hudson Street
Jersey City, NJ 07302
(1959) | | Director since 2017 | | Principal Occupation:President and Director of Wells Fargo Funds Management, LLC (2003–2017); President of Wells Fargo Funds (2003–2016). Other Directorships:None. |
| | | | | |
Mark A. Schmid
Lord, Abbett & Co. LLC
c/o Legal Dept.
90 Hudson Street
Jersey City, NJ 07302
(1959) | | Director since 2016 | | Principal Occupation:Vice President and Chief Investment Officer of the University of Chicago (since 2009). Other Directorships:None. |
| | | | | |
James L.L. Tullis
Lord, Abbett & Co. LLC
c/o Legal Dept.
90 Hudson Street
Jersey City, NJ 07302
(1947) | | Director since 2006; Chairman since 2017 | | Principal Occupation:CEO of Tullis-Dickerson and Co. Inc., a venture capital management firm (1990–2016); CEO of Tullis Health Investors-FL LLC. (since 2012). Other Directorships:Currently serves as director of Crane Co. (since 1998), Alphatec Spine, Inc. (since 2018), and electroCore, Inc. (since 2018). |
Officers
None of the officers listed below have received compensation from the Fund. All of the officers of the Fund also may be officers of the other Lord Abbett Funds and maintain offices at 90 Hudson Street, Jersey City, NJ 07302. Unless otherwise indicated, the position(s) and title(s) listed under the “Principal Occupation During the Past Five Years” column indicate each officer’s position(s) and title(s) with Lord Abbett. Each officer serves for an indefinite term (i.e., until his or her death, resignation, retirement, or removal).
73
Basic Information About Management (continued)
Name and
Year of Birth | | Current Position
with the Fund | | Length of Service
of Current
Position | | Principal Occupation
During the Past Five Years |
Douglas B. Sieg
(1969) | | President and Chief Executive Officer | | Elected as President and Chief Executive Officer in 2018 | | Managing Partner of Lord Abbett (since 2018) and was formerly Head of Client Services, joined Lord Abbett in 1994. |
| | | | | | | |
Robert A. Lee
(1969) | | Executive Vice President | | Elected in 2016 | | Partner and Chief Investment Officer, and was formerly Deputy Chief Investment Officer and Director of Taxable Fixed Income, joined Lord Abbett in 1997. |
| | | | | | | |
Steven F. Rocco
(1979) | | Executive Vice President | | Elected in 2014 | | Partner and Director of Taxable Fixed Income, joined Lord Abbett in 2004. |
| | | | | | | |
Pamela P. Chen
(1978) | | Vice President, Assistant Secretary and Privacy Officer | | Elected in 2018 | | Associate General Counsel, joined Lord Abbett in 2017 and was formerly Special Counsel at Schulte, Roth & Zabel LLP (2005–2017). |
| | | | | | | |
Robert S. Clark
(1975) | | Vice President | | Elected in 2018 | | Portfolio Manager, joined Lord Abbett in 2010. |
| | | | | | | |
John T. Fitzgerald
(1975) | | Vice President and Assistant Secretary | | Elected in 2018 | | Deputy General Counsel, joined Lord Abbett in 2018 and was formerly Deputy Head of U.S. Funds Legal, Executive Director and Assistant General Counsel at JPMorgan Chase (2005–2018). |
| | | | | | | |
Christopher J. Gizzo
(1986) | | Vice President | | Elected in 2018 | | Managing Director and Portfolio Manager, joined Lord Abbett in 2008. |
| | | | | | | |
Bernard J. Grzelak
(1971) | | Chief Financial Officer and Vice President | | Elected in 2017 | | Partner, Chief Operating Officer, Global Funds and Risk, joined Lord Abbett in 2003. |
| | | | | | | |
Linda Y. Kim
(1980) | | Vice President and Assistant Secretary | | Elected in 2016 | | Counsel, joined Lord Abbett in 2015 and was formerly an Associate at Stroock & Stroock & Lavan LLP (2007–2015). |
74
Basic Information About Management (concluded)
Name and
Year of Birth | | Current Position
with the Fund | | Length of Service
of Current
Position | | Principal Occupation
During the Past Five Years |
Joseph M. McGill
(1962) | | Chief Compliance Officer | | Elected in 2014 | | Partner and Chief Compliance Officer, joined Lord Abbett in 2014 and was formerly Managing Director and the Chief Compliance Officer at UBS Global Asset Management (2003–2013). |
| | | | | | | |
A. Edward Oberhaus, III
(1959) | | Vice President | | Elected in 1996 | | Partner and Director, joined Lord Abbett in 1983. |
| | | | | | | |
Andrew H. O’Brien
(1973) | | Vice President | | Elected in 2016 | | Partner and Portfolio Manager, joined Lord Abbett in 1998. |
| | | | | | | |
Amanda S. Ryan
(1978) | | Vice President and Assistant Secretary | | Elected in 2018 | | Counsel, joined Lord Abbett in 2016 and was formerly a Director and Corporate Counsel at PGIM Investments (2012–2016). |
| | | | | | | |
Lawrence B. Stoller
(1963) | | Vice President, Secretary and Chief Legal Officer | | Elected in 2007 | | Partner and General Counsel, joined Lord Abbett in 2007. |
| | | | | | | |
Leah G. Traub
(1979) | | Vice President | | Elected in 2016 | | Partner and Portfolio Manager, joined Lord Abbett in 2007. |
| | | | | | | |
Kewjin Yuoh
(1971) | | Vice President | | Elected in 2016 | | Partner and Portfolio Manager, joined Lord Abbett in 2010. |
| | | | | | | |
Jackson C. Chan
(1964) | | AML Compliance Officer | | Elected in 2018 | | Deputy Chief Compliance Officer and Director of Regulatory Affairs, joined Lord Abbett in 2014 and was formerly Director at UBS Global Asset Management (2005–2014). |
| | | | | | | |
Vito A. Fronda
(1969) | | Treasurer | | Elected in 2018 | | Partner and Director of Taxation, joined Lord Abbett in 2003. |
Please call 888–522–2388 for a copy of the statement of additional information, which contains further information about the Fund’s Directors. It is available free upon request.
75
Approval of Advisory Contract
The Board, including all of the Directors who are not “interested persons” of the Fund or of Lord Abbett, as defined in the Investment Company Act of 1940, as amended (the “Independent Directors”), annually considers whether to approve the continuation of the existing management agreement between the Fund and Lord Abbett (the “Agreement”). In connection with its most recent approval, the Board reviewed materials relating specifically to the Agreement, as well as numerous materials received throughout the course of the year, including information about the Fund’s investment performance compared to the performance of its benchmarks. Before making its decision as to the Fund, the Board had the opportunity to ask questions and request further information, taking into account its knowledge of Lord Abbett gained through its meetings and discussions. These meetings and discussions included reviews of Fund performance conducted by members of the Contract Committee, the deliberations of the Contract Committee, and discussions between the Contract Committee and Lord Abbett’s management. The Independent Directors also met with their independent legal counsel in various private sessions at which no representatives of management were present.
The materials received by the Board included, but were not limited to: (1) information provided by Broadridge Financial Solutions (“Broadridge”) regarding the investment performance of the Fund compared to the investment performance of certain funds with similar investment styles as determined by Broadridge, based, in part, on the Fund’s Morningstar category (the “performance peer group”), and the investment performance of two appropriate benchmarks; (2) information provided by Broadridge regarding the expense ratios, contractual and actual management fee rates, and other expense components for the Fund and certain funds in the same Morningstar category, with generally the same or similar share classes and operational characteristics, including asset size (the “expense peer group”); (3) certain supplemental investment performance information provided by Lord Abbett; (4) information provided by Lord Abbett on the expense ratios, management fee rates, and other expense components for the Fund; (5) sales and redemption information for the Fund; (6) information regarding Lord Abbett’s financial condition; (7) an analysis of the relative profitability of the Agreement to Lord Abbett; (8) information provided by Lord Abbett regarding the investment management fee schedules for Lord Abbett’s other advisory clients maintaining accounts with a similar investment strategy as the Fund; and (9) information regarding the personnel and other resources devoted by Lord Abbett to managing the Fund.
Investment Management and Related Services Generally.The Board considered the services provided by Lord Abbett to the Fund, including investment research, portfolio management, and trading, and Lord Abbett’s commitment to compliance with all applicable legal requirements. The Board also observed that Lord Abbett was solely engaged in the investment management business and accordingly did not experience the conflicts of interest that may result from being engaged in other lines of business. The Board considered the investment advisory services provided by Lord Abbett to other clients, the fees charged for the services, and the differences in the nature of the services provided to the Fund and other Lord Abbett Funds, on the one hand, and the services provided to other clients, on the other. After reviewing these and related factors, the Board concluded that the Fund was likely to continue to benefit from the nature, extent and quality of the investment services provided by Lord Abbett under the Agreement.
Investment Performance.The Board reviewed the Fund’s investment performance in relation to that of the performance peer group and two appropriate benchmarks as of various periods ended August 31, 2018. The Board observed that the Fund’s investment performance was above the median of the performance peer group for the one-, three-, five-, and ten-year periods. The Board
76
Approval of Advisory Contract (continued)
further considered Lord Abbett’s performance and reputation generally, the performance of other Lord Abbett-managed funds overseen by the Board, and the willingness of Lord Abbett to take steps intended to improve performance when appropriate. After reviewing these and related factors, the Board concluded that the Fund’s Agreement should be continued.
Lord Abbett’s Personnel and Methods.The Board considered the qualifications of the personnel providing investment management services to the Fund, in light of its investment objective and discipline, and other services provided to the Fund by Lord Abbett. Among other things, the Board considered the size, experience, and turnover of Lord Abbett’s staff, Lord Abbett’s investment methodology and philosophy, and Lord Abbett’s approach to recruiting, training, and retaining personnel.
Nature and Quality of Other Services.The Board considered the nature, quality, and extent of compliance, administrative, and other services performed by Lord Abbett and the nature and extent of Lord Abbett’s supervision of third party service providers, including the Fund’s transfer agent and custodian.
Expenses.The Board considered the expense level of the Fund, including the contractual and actual management fee rates, and the expense levels of the Fund’s expense peer group. It also considered how the expense level of the Fund related to those of the expense peer group and the amount and nature of the fees paid by shareholders. The Board observed that the net total expense ratio of the Fund was below the median of the expense peer group. After reviewing these and related factors, the Board concluded, within the context of its overall approval of the Agreement, that the expense level of the Fund was reasonable and supported the continuation of the Agreement.
Profitability.The Board considered the level of Lord Abbett’s operating margin in managing the Fund, including a review of Lord Abbett’s methodology for allocating its costs to its management of the Fund. It considered whether the Fund was profitable to Lord Abbett in connection with the Fund’s operation, including the fee that Lord Abbett receives from the Fund for providing administrative services to the Fund. The Board also considered the profits realized from other business segments of Lord Abbett, which may benefit from or be related to the Fund’s business. The Board considered Lord Abbett’s profit margins excluding Lord Abbett’s marketing and distribution expenses. The Board also considered Lord Abbett’s profit margins, without those exclusions, in comparison with available industry data and how those profit margins could affect Lord Abbett’s ability to recruit and retain personnel. The Board recognized that Lord Abbett’s overall profitability was a factor in enabling it to attract and retain qualified personnel to provide services to the Fund. After reviewing these and related factors, the Board concluded, within the context of its overall approval of the Agreement, that Lord Abbett’s profitability with respect to the Fund was not excessive.
Economies of Scale.The Board considered the extent to which there had been economies of scale in managing the Fund, whether the Fund’s shareholders had appropriately benefited from such economies of scale, and whether there was potential for realization of any further economies of scale. The Board concluded that the existing management fee schedule, with its breakpoints in the level of the management fee, adequately addressed any economies of scale in managing the Fund.
Other Benefits to Lord Abbett.The Board considered the amount and nature of the fees paid by the Fund and the Fund’s shareholders to Lord Abbett and the Distributor for services other than investment advisory services, such as the fee that Lord Abbett receives from the Fund for providing administrative services to the Fund. The Board also considered the revenues and profitability of Lord Abbett’s investment advisory business apart from its mutual fund business, and the intangible benefits enjoyed by Lord Abbett by virtue of its relationship with the Fund. The Board observed that
77
Approval of Advisory Contract (concluded)
the Distributor receives 12b-1 fees from certain of the Lord Abbett Funds as to shares held in accounts for which there is no other broker of record, may retain a portion of the 12b-1 fees it receives, and receives a portion of the sales charges on sales and redemptions of some classes of shares of the Lord Abbett Funds. In addition, the Board observed that Lord Abbett accrues certain benefits for its business of providing investment advice to clients other than the Lord Abbett Funds, but that business also benefits the Funds. The Board also noted that Lord Abbett, as disclosed in the prospectus of the Fund, has entered into revenue sharing arrangements with certain entities that distribute shares of the Lord Abbett Funds. The Board also took into consideration the investment research that Lord Abbett receives as a result of client brokerage transactions.
Alternative Arrangements.The Board considered whether, instead of approving continuation of the Agreement, it might be in the best interests of the Fund to implement one or more alternative arrangements, such as continuing to employ Lord Abbett, but on different terms. After considering all of the relevant factors, the Board unanimously found that continuation of the Agreement was in the best interests of the Fund and its shareholders and voted unanimously to approve the continuation of the Agreement. In considering whether to approve the continuation of the Agreement, the Board did not identify any single factor as paramount or controlling. Individual Directors may have evaluated the information presented differently from one another, giving different weights to various factors. This summary does not discuss in detail all matters considered.
78
Householding
The Fund has adopted a policy that allows it to send only one copy of the Fund’s prospectus, proxy material, annual report and semiannual report to certain shareholders residing at the same “household.” This reduces Fund expenses, which benefits you and other shareholders. If you need additional copies or do not want your mailings to be “householded,” please call Lord Abbett at 888-522-2388 or send a written request with your name, the name of your fund or funds and your account number or numbers to Lord Abbett Family of Funds, P.O. Box 219336, Kansas City, MO 64121.
Proxy Voting Policies, Procedures and Records
A description of the policies and procedures that Lord Abbett uses to vote proxies related to the Fund’s portfolio securities, and information on how Lord Abbett voted the Fund’s proxies during the 12-month period ended June 30 are available without charge, upon request, (i) by calling 888-522-2388; (ii) on Lord Abbett’s Website at www.lordabbett.com; and (iii) on the Securities and Exchange Commission’s (“SEC”) Website at www.sec.gov.
Shareholder Reports and Quarterly Portfolio Disclosure
The Fund is required to file its complete schedule of portfolio holdings with the SEC for its first and third fiscal quarters on Form N-Q. Copies of the filings are available without charge, upon request on the SEC’s Website at www.sec.gov and may be available by calling Lord Abbett at 888-522-2388.
Tax Information
3% of the ordinary income distributions paid by the Fund during the year ended December 31, 2018 is qualified dividend income. For corporate shareholders, 3% of the Fund’s ordinary income distributions qualified for the dividend received deduction.
Additionally, of the distribution paid to the shareholders during the fiscal year ended December 31, 2018, $66,246,138 and $138,554,337, respectively, represent short-term capital gains and long-term capital gains.
For foreign shareholders, 96% of the net investment income distributions paid by the Fund during the fiscal year ended December 31, 2018 represents interest-related dividends.
79


| This report, when not used for the general information of shareholders of the Fund, is to be distributed only if preceded or accompanied by a current fund prospectus. | | | |
| | | | |
| Lord Abbett mutual fund shares are distributed by | | | LABD-2 |
| LORD ABBETT DISTRIBUTOR LLC. | | Lord Abbett Bond-Debenture Fund, Inc. | (2/19) |
| (a) | In accordance with applicable requirements, the Registrant adopted a Sarbanes-Oxley Code of Ethics on June 19, 2003 that applies to the principal executive officer and senior financial officers of the Registrant (“Code of Ethics”). The Code of Ethics was in effect during the fiscal year ended December 31, 2018 (the “Period”). |
| (c) | The Registrant has not amended the Code of Ethics as described in Form N-CSR during the Period. |
| (d) | The Registrant has not granted any waiver, including an implicit waiver, from a provision of the Code of Ethics as described in Form N-CSR during the Period. |
| (f) | See Item 12(a)(1) concerning the filing of the Code of Ethics. |
| Item 3: | Audit Committee Financial Expert. |
The Registrant’s board of directors has determined that each of the following independent directors who are members of the audit committee is an audit committee financial expert: Evelyn E. Guernsey, Karla M. Rabusch and Mark A. Schmid. Each of these persons is independent within the meaning of the Form N-CSR.
| Item 4: | Principal Accountant Fees and Services. |
In response to sections (a), (b), (c) and (d) of Item 4, the aggregate fees billed to the Registrant for the fiscal years ended December 31, 2018 and 2017 by the Registrant’s principal accounting firm, Deloitte & Touche LLP, the member firms of Deloitte Touche Tohmatsu and their respective affiliates (collectively, “Deloitte”) were as follows:
| | | Fiscal year ended: |
| | | 2018 | | 2017 |
| Audit Fees {a} | | $ | 76,800 | | | $ | 76,800 | |
| Audit-Related Fees | | | - 0 - | | | | - 0 - | |
| Total audit and audit-related fees | | | 76,800 | | | | 76,800 | |
| | | | | | | | | |
| Tax Fees {b} | | | 12,046 | | | | 12,014 | |
| All Other Fees | | | - 0 - | | | | - 0 - | |
| | | | | | | | | |
| Total Fees | | $ | 88,846 | | | $ | 88,814 | |
| | {a} Consists of fees for audits of the Registrant’s annual financial statements. |
| | |
| | {b} Fees for the fiscal year ended December 31, 2018 and 2017 consist of fees for preparing the U.S. Income Tax Return for Regulated Investment Companies, New Jersey Corporation Business Tax Return, New Jersey Annual Report Form, U.S. Return of Excise Tax on Undistributed Income of Investment Companies, IRS Forms 1099-MISC and 1096 Annual Summary and Transmittal of U.S. Information Returns. |
(e) (1) Pursuant to Rule 2-01(c) (7) of Regulation S-X, the Registrant’s Audit Committee has adopted pre-approval policies and procedures. Such policies and procedures generally provide that the Audit Committee must pre-approve:
| · | any audit, audit-related, tax, and other services to be provided to the Lord Abbett Funds, including the Registrant, and |
| · | any audit-related, tax, and other services to be provided to the Registrant’s investment adviser and any entity controlling, controlled by or under common control with the investment adviser that provides ongoing services to one or more Funds comprising the Registrant if the engagement relates directly to operations and financial reporting of a Fund, by the independent auditor to assure that the provision of such services does not impair the auditor’s independence. |
The Audit Committee has delegated pre-approval authority to its Chairman, subject to a fee limit of $10,000 per event, and not to exceed $25,000 annually. The Chairman will report any pre-approval decisions to the Audit Committee at its next scheduled meeting. Unless a type of service to be provided by the independent auditor has received general pre-approval, it must be pre-approved by the Audit Committee. Any proposed services exceeding pre-approved cost levels will require specific pre-approval by the Audit Committee.
(e) (2) The Registrant’s Audit Committee has approved 100% of the services described in this Item 4 (b) through (d).
(f) Not applicable.
(g) The aggregate non-audit fees billed by Deloitte for services rendered to the Registrant are shown above in the response to Item 4 (a), (b), (c) and (d) as “All Other Fees”.
The aggregate non-audit fees billed by Deloitte for services rendered to the Registrant’s investment adviser, Lord, Abbett & Co. LLC (“Lord Abbett”), for the fiscal years ended December 31, 2018 and 2017 were:
| | Fiscal year ended: |
| | 2018 | 2017 |
| All Other Fees {a} | $200,339 | $201,416 |
| | {a} Consist of fees for Independent Services Auditors’ Report on Controls Placed in Operation and Tests of Operating Effectiveness related to Lord Abbett’s Asset Management Services (“SOC-1 Report”). |
The aggregate non-audit fees billed by Deloitte for services rendered to entities under the common control of Lord Abbett for the fiscal years ended December 31, 2018 and 2017 were:
| | Fiscal year ended: |
| | 2018 | 2017 |
| All Other Fees | $ - 0 - | $ - 0 - |
(h) The Registrant’s Audit Committee has considered the provision of non-audit services that were rendered to the Registrant’s investment adviser, and any entity controlling, controlled by or under common control with the investment adviser that provides ongoing services to the Registrant, that were not pre-approved pursuant to Rule 2-01 (c)(7)(ii) of Regulation S-X and has determined that the provision of such services is compatible with maintaining Deloitte’s independence.
| Item 5: | Audit Committee of Listed Registrants. |
| | |
| | Not applicable. |
| | |
| Item 6: | Investments. |
| | |
| | Not applicable. |
| | |
| Item 7: | Disclosure of Proxy Voting Policies and Procedures for Closed-End Management Investment Companies. |
| | |
| | Not applicable. |
| | |
| Item 8: | Portfolio Managers of Closed-End Management Investment Companies. |
| | |
| | Not applicable. |
| | |
| Item 9: | Purchases of Equity Securities by Closed-End Management Investment Company and Affiliated Purchasers. |
| | Not applicable. |
| | |
| Item 10: | Submission of Matters to a Vote of Security Holders. |
| | |
| | Not applicable. |
| | |
| Item 11: | Controls and Procedures. |
| | |
| | (a) | Based on their evaluation of the Registrant’s disclosure controls and procedures (as defined in Rule 30a-3(c) under the Investment Company Act of 1940) as of a date within 90 days prior to the filing date of this report, the Chief Executive Officer and Chief Financial Officer of the Registrant have concluded that such disclosure controls and procedures are reasonably designed and effective to ensure that material information relating to the Registrant, including its consolidated subsidiaries, is made known to them by others within those entities. |
| | |
| | (b) | There were no changes in the Registrant’s internal control over financial reporting (as defined in Rule 30a-3(d) under the Investment Company Act of 1940) that occurred during the second fiscal quarter of the period covered by this report that have materially affected, or are reasonably likely to materially affect, the Registrant’s internal control over financial reporting. |
| (a)(1) | The Lord Abbett Family of Funds Sarbanes Oxley Code of Ethics for the Principal Executive Officer and Senior Financial Officers is attached hereto as part of Ex-99. CODEETH. |
| (a)(2) | Certification of each Principal Executive Officer and Principal Financial Officer of the Registrant as required by Rule 30a-2 under the Investment Company Act of 1940 is attached hereto as a part of EX-99.CERT. |
| (b) | Certification of each Principal Executive Officer and Principal Financial Officer of the Registrant as required by Section 906 of the Sarbanes-Oxley Act of 2002 is provided as a part of EX-99.906CERT. |
SIGNATURES
Pursuant to the requirements of the Securities Exchange Act of 1934 and the Investment Company Act of 1940, the Registrant has duly caused this report to be signed on its behalf by the undersigned, thereunto duly authorized.
| | LORD ABBETT BOND-DEBENTURE FUND, INC. |
| | | |
| | By: | /s/ Douglas B. Sieg | |
| | | Douglas B. Sieg |
| | | President and Chief Executive Officer |
Date: February 28, 2019
| By: | /s/ Bernard J. Grzelak | |
| | Bernard J. Grzelak | |
| | Chief Financial Officer and Vice President |
Date: February 28, 2019
Pursuant to the requirements of the Securities Exchange Act of 1934 and the Investment Company Act of 1940, this report has been signed below by the following persons on behalf of the Registrant and in the capacities and on the dates indicated.
| By: | /s/ Douglas B. Sieg | |
| | Douglas B. Sieg |
| | President and Chief Executive Officer |
Date: February 28, 2019
| By: | /s/ Bernard J. Grzelak | |
| | Bernard J. Grzelak |
| | Chief Financial Officer and Vice President |
Date: February 28, 2019