UNITED STATES
SECURITIES AND EXCHANGE COMMISSION
Washington, D.C. 20549
FORM N-CSR
CERTIFIED SHAREHOLDER REPORT OF REGISTERED
MANAGEMENT INVESTMENT COMPANIES
Investment Company Act File Number: 811-02145
LORD ABBETT BOND-DEBENTURE FUND, INC.
(Exact name of Registrant as specified in charter)
90 Hudson Street, Jersey City, NJ 07302
(Address of principal executive offices) (Zip code)
John T. Fitzgerald, Esq., Vice President & Assistant Secretary
90 Hudson Street, Jersey City, NJ 07302
(Name and address of agent for service)
Registrant’s telephone number, including area code: (888) 522-2388
Date of fiscal year end: 12/31
Date of reporting period: 12/31/21
| Item 1: | Report(s) to Shareholders. |
![]()
LORD ABBETT
ANNUAL REPORT
Lord Abbett
Bond Debenture Fund
For the fiscal year ended December 31, 2021
Table of Contents
Lord Abbett Bond Debenture Fund
Annual Report
For the fiscal year ended December 31, 2021

From left to right: James L.L. Tullis, Independent Chairman of the Lord Abbett Funds and Douglas B. Sieg, Director, President, and Chief Executive Officer of the Lord Abbett Funds.
Dear Shareholders: We are pleased to provide you with this overview of the performance of Lord Abbett Bond Debenture Fund for the fiscal year ended December 31, 2021. On this page and the following pages, we discuss the major factors that influenced fiscal year performance. For detailed and more timely information about the Fund, please visit our website at www.lordabbett.com, where you also can access quarterly commentaries that provide updates on the Fund’s performance and other portfolio related updates.
Thank you for investing in Lord Abbett mutual funds. We value the trust that you place in us and look forward to serving your investment needs in the years to come.
Best regards,

Douglas B. Sieg
Director, President, and Chief Executive Officer
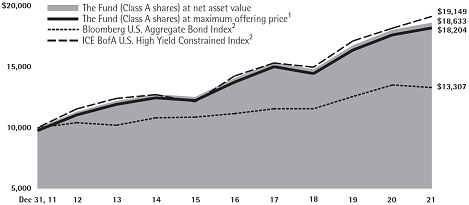
For the fiscal year ended December 31, 2021, the Fund returned 3.26%, reflecting performance at the net asset value (“NAV”) of Class A shares with all distributions reinvested, compared to its benchmark, the Bloomberg U.S. Aggregate Bond Index,1 which returned -1.54% over the same period.
The twelve-month period brought heightened market volatility as the U.S. continued its steady recovery from the onset of the COVID-19 pandemic. However, U.S. risk assets generally exhibited positive
performance, despite stretches of instability throughout the year. U.S. equities performed the best, highlighted by the three major U.S. equity indices, which all gained over 20% for the year. Within credit, lower quality credit outperformed higher quality tiers. High yield bonds, as represented by the ICE BofA U.S. High Yield Constrained Index2, returned 5.35% for the period, compared to investment grade bonds, as represented by the ICE BofA U.S. Corporate Index3, which returned -0.95%. Other asset classes also exhibited solid
1
performance throughout the year. Convertible bonds, represented by the ICE BofA U.S. Convertible Index4, and leveraged loans, as represented by the Credit Suisse Leveraged Loan Index5, posted returns of 6.35% and 5.41%, respectively.
While U.S. markets performed well, COVID-19 remained a significant headwind across all global markets throughout the year. However, the development and acceleration of access to COVID-19 vaccinations created a more positive sentiment around the virus, as both infections and hospitalization trends improved throughout much of the first quarter of 2021. The decline in cases was short-lived, however, as the emergence of new variants of the COVID-19 virus throughout the year posed significant obstacles to the ongoing recovery of the U.S. economy. The Delta variant caused new waves of positive cases and increased hospitalizations around the world and weighed directly on global growth in the third quarter of 2021. This was evident in equity markets in September, as the three major U.S. indices faced their largest monthly pullbacks since the onset of the pandemic in March 2020. U.S. markets succumbed to another COVID-19 related sell-off towards the end of the year due to emergence of the Omicron variant. Given its high rate of transmission and ability to evade immunity from standard vaccination dosages, this variant caused a major risk-off shift in investor sentiment. Major indices experienced one of their worst
performing trading sessions of the year on November 26th, highlighted by the Dow Jones Industrial Average having its worst session since October 2020.
While the emergence of these new variants dampened the global growth outlook, U.S. markets continued to be bolstered by ongoing support from the U.S. Federal Reserve (“Fed”) via central bank liquidity. The Fed remained extremely accommodative throughout the year, keeping the Federal Fund’s rate near zero to boost U.S. economic recovery. Notably, the Fed’s balance sheet ballooned to almost $9 trillion in the latter part of the year, up from $4.4 trillion prior to the start of the pandemic. U.S. markets were also bolstered by ongoing fiscal stimulus. After having passed an approximately $1.9 trillion stimulus bill in March featuring direct payments to households affected by the pandemic, Congress later passed an approximately $1.2 trillion physical infrastructure package that featured more than $550 billion in new spending.
Although this increased stimulus benefited U.S. markets, it also contributed to concerns of increasing inflation in the U.S. economy by boosting post-lockdown consumer demand. Following a relatively modest increase in the first quarter of 2021, consumer prices accelerated higher throughout the remainder of the year, averaging gains of approximately 5.3% year-over-year from April to September, the fastest annual increase since 2008. Inflation concerns were truly manifested in
2
the November Consumer Price Index (CPI) report, which revealed headline consumer prices up 6.8% year-over-year, the highest levels since June 1982. In addition to stimulative policy, supply chain constraints also played an integral part in driving inflation higher. Many industries were unable to consistently meet pent up consumer demand, and production bottlenecks caused by the pandemic led to shortages of goods and, therefore, heavy price increases from supply and demand imbalances.
Despite this upward pressure, the Fed remained mostly consistent in its messaging on inflationary expectations throughout the spring and summer of 2021 in that it was mostly transitory. It was not until the fourth quarter that the Fed pivoted to a more hawkish stance on inflation. Despite the lack of surprises from the early November Federal Open Market Committee (FOMC) meeting, there was a notable shift in tone from the Fed, as Chairman Jerome Powell indicated that it may be appropriate for the central bank to consider wrapping up its taper a few months sooner than initially envisioned. Shortly thereafter, the FOMC announced at its December meeting that it would accelerate its tapering of asset purchases by $30 billion per month, up from the original $15 billion. In the post-meeting press conference, Chairman Powell indicated that the accelerated taper would put the bank in a better position to address issues, including high inflation. While this
adjustment was widely expected, the December meeting did also reveal the new median Fed projection for three interest rate hikes in 2022, up from the September forecast in which the median projection called for one rate hike in 2022. These new projections were aimed towards curbing inflation, which Chairman Powell said may be more persistent. Looking forward, however, some economists noted that the rate path was only increased by a cumulative one hike through 2024 and indicated that the core personal consumption expenditures (PCE) outlook still suggested transitory inflation, despite the Fed removing its reference to “transitory”.
The Fund takes a flexible, multi-sector approach, which emphasizes credit sensitive sectors of the market, compared to its benchmark, which is largely comprised of U.S. Treasuries and government-related securities. This approach helped the Fund outperform its benchmark by over 400 bps during the twelve-month period ending December 31, 2021. Exposure to several asset classes contributed to this performance, including high-yield bonds, bank loans and U.S. equities. High yield bonds were the most significant contributor to relative performance for the Fund. Overall, high yield bonds benefited from the continued global economic recovery and corporate earnings beats, which led to tighter credit spreads to offset the headwinds of rising U.S. Treasury yields. Many of the Fund’s
3
high yield investments were in the energy sector which was supported in 2021 by higher global energy demand and rising oil prices. Bank loans also provided solid returns for the period as the asset class benefited from improving credit conditions and robust retail demand, while their floating rate nature provided protection from rising rates. U.S equity markets also benefited from several tailwinds throughout the year, including continued supportive financial conditions and expansion of central bank balance sheets, as well as record corporate earnings beats. The Fund’s exposure to growth-oriented equities, particularly in the software sector, contributed to relative performance in the period as growth outperformed value despite the broader economic normalization trend and rising rates.
The Fund held a slight allocation to mortgage-backed securities which detracted from performance, as the sector underperformed more credit-sensitive assets due to increased interest rate volatility. The Fund held a modest allocation to sovereign bonds which also detracted from relative performance in 2021. Some of these investments were in nations considered to be emerging markets which experienced increased sensitivity throughout the year due to economic disruptions caused by the different COVID-19 variant surges.
The Fund’s portfolio is actively managed and, therefore, its holdings and the weightings of a particular issuer or particular sector as a percentage of portfolio assets are subject to change. Sectors may include many industries.
4
1 The Bloomberg U.S. Aggregate Bond Index is an index of U.S dollar-denominated, investment-grade U.S. government and corporate securities, and mortgage pass-through securities, and asset-backed securities.
2 The ICE BofA U.S. High Yield Constrained Index is a capitalization-weighted index of all US dollar denominated below investment grade corporate debt publicly issued in the US domestic market.
3 The ICE BofA U.S. Corporate Index tracks the performance of US dollar denominated investment grade corporate debt publicly issued in the US domestic market.
4 The ICE BofA U.S. Convertible Index contains issues that are U.S. dollar-denominated, sold into the U.S. market and publicly traded in the United States.
5 The Credit Suisse Leveraged Loan Index is designed to mirror the investable universe of the U.S. dollar-denominated leveraged loan market.
Unless otherwise specified, indexes reflect total return, with all dividends reinvested. Indexes are unmanaged, do not reflect the deduction of fees or expenses, and are not available for direct investment.
Important Performance and Other Information
Performance data quoted in the following pages reflect past performance and are no guarantee of future results. Current performance may be higher or lower than the performance quoted. The investment return and principal value of an investment in the Fund will fluctuate so that shares, on any given day or when redeemed, may be worth more or less than their original cost. You can obtain performance data current to the most recent month end by calling Lord Abbett at 888-522-2388 or referring to www.lordabbett.com.
Except where noted, comparative Fund performance
does not account for the deduction of sales charges and would be different if sales charges were included. The Fund offers classes of shares with distinct pricing options. For a full description of the differences in pricing alternatives, please see the Fund’s prospectus.
During certain periods shown, expense waivers and reimbursements were in place. Without such expense waivers and reimbursements, the Fund’s returns would have been lower.
The annual commentary above discusses the views of the Fund’s management and various portfolio holdings of the Fund as of December 31, 2021. These views and portfolio holdings may have changed after this date. Information provided in the commentary is not a recommendation to buy or sell securities. Because the Fund’s portfolio is actively managed and may change significantly, the Fund may no longer own the securities described above or may have otherwise changed its position in the securities. For more recent information about the Fund’s portfolio holdings, please visit www.lordabbett.com.
A Note about Risk: See Notes to Financial Statements for a discussion of investment risks. For a more detailed discussion of the risks associated with the Fund, please see the Fund’s prospectus.
Mutual funds are not insured by the FDIC, are not deposits or other obligations of, or guaranteed by, banks, and are subject to investment risks including possible loss of principal amount invested.
5
Below is a comparison of a $10,000 investment in Class A shares with the same investment in the Bloomberg U.S. Aggregate Bond Index and the ICE BofA U.S. High Yield Constrained Index, assuming reinvestment of all dividends and distributions. The performance of other classes will be greater than or less than the performance shown in the graph below due to different sales loads and expenses applicable to such classes. The graph and performance table below do not reflect the deduction of taxes that a shareholder would pay on Fund distributions or the redemption of Fund shares. During certain periods, expenses of the Fund have been waived or reimbursed by Lord Abbett; without such waiver or reimbursement of expenses, the Fund’s returns would have been lower. Past performance is no guarantee of future results.
| Average Annual Total Returns at Maximum Applicable Sales Charge for the Periods Ended December 31, 2021 | ||||||||||||||||
| 1 Year | 5 Years | 10 Years | Life of Class | |||||||||||||
| Class A3 | 0.98% | 5.29% | 6.17% | – | ||||||||||||
| Class C4 | 1.60% | 5.09% | 5.74% | – | ||||||||||||
| Class F5 | 3.48% | 5.87% | 6.56% | – | ||||||||||||
| Class F36 | 3.53% | – | – | 5.78% | ||||||||||||
| Class I5 | 3.46% | 5.95% | 6.65% | – | ||||||||||||
| Class P5 | 3.01% | 5.55% | 6.32% | – | ||||||||||||
| Class R25 | 2.85% | 5.35% | 6.04% | – | ||||||||||||
| Class R35 | 3.07% | 5.46% | 6.15% | – | ||||||||||||
| Class R47 | 3.21% | 5.72% | – | 5.48% | ||||||||||||
| Class R57 | 3.47% | 5.99% | – | 5.75% | ||||||||||||
| Class R67 | 3.53% | 6.06% | – | 5.82% | ||||||||||||
1 Reflects the deduction of the maximum initial sales charge of 2.25%.
2 Performance of each unmanaged index does not reflect any fees or expenses. The performance of each index is not necessarily representative of the Fund’s performance.
3 Total return, which is the percentage change in net asset value, after deduction of the maximum initial sales charge of 2.25% applicable to Class A shares, with all dividends and distributions reinvested for the periods shown ended December 31, 2021 is calculated using the SEC-required uniform method to compute such return.
4 The 1% CDSC for Class C shares normally applies before the first anniversary of the purchase date. Performance for other periods is at net asset value.
5 Performance is at net asset value.
6 Commenced operations and performance for the Class began on April 4, 2017. Performance is at net asset value.
7 Commenced operations and performance for the Class began on June 30, 2015. Performance is at net asset value.
6
As a shareholder of the Fund, you incur two types of costs: (1) transaction costs, including sales charges (loads) on purchase payments (these charges vary among the share classes); and (2) ongoing costs, including management fees; distribution and service (12b-1) fees (these charges vary among the share classes); and other Fund expenses. This Example is intended to help you understand your ongoing costs (in dollars) of investing in the Fund and to compare these costs with the ongoing costs of investing in other mutual funds.
The Example is based on an investment of $1,000 invested at the beginning of the period and held for the entire period (July 1, 2021 through December 31, 2021).
Actual Expenses
For each class of the Fund, the first line of the table on the following page provides information about actual account values and actual expenses. You may use the information in this line, together with the amount you invested, to estimate the expenses that you paid over the period. Simply divide your account value by $1,000 (for example, an $8,600 account value divided by $1,000 = 8.6), then multiply the result by the number in the first line under the heading titled “Expenses Paid During Period 7/1/21 – 12/31/21” to estimate the expenses you paid on your account during this period.
Hypothetical Example for Comparison Purposes
For each class of the Fund, the second line of the table on the following page provides information about hypothetical account values and hypothetical expenses based on the Fund’s actual expense ratio and an assumed rate of return of 5% per year before expenses, which is not the Fund’s actual return. The hypothetical account values and expenses may not be used to estimate the actual ending account balance or expenses you paid for the period. You may use this information to compare the ongoing costs of investing in the Fund and other funds. To do so, compare this 5% hypothetical example with the 5% hypothetical examples that appear in the shareholder reports of the other funds.
7
Please note that the expenses shown in the table are meant to highlight your ongoing costs only and do not reflect any transactional costs, such as sales charges (loads). Therefore, the second line of the table is useful in comparing ongoing costs only, and will not help you determine the relative total costs of owning different funds. In addition, if these transactional costs were included, your costs would have been higher.
| Beginning | Ending | Expenses | |||||
| Account | Account | Paid During | |||||
| Value | Value | Period† | |||||
| 7/1/21 - | |||||||
| 7/1/21 | 12/31/21 | 12/31/21 | |||||
| Class A | |||||||
| Actual | $1,000.00 | $1,002.20 | $3.84 | ||||
| Hypothetical (5% Return Before Expenses) | $1,000.00 | $1,021.37 | $3.87 | ||||
| Class C | |||||||
| Actual | $1,000.00 | $ 999.00 | $7.05 | ||||
| Hypothetical (5% Return Before Expenses) | $1,000.00 | $1,018.15 | $7.12 | ||||
| Class F | |||||||
| Actual | $1,000.00 | $1,003.90 | $3.33 | ||||
| Hypothetical (5% Return Before Expenses) | $1,000.00 | $1,021.88 | $3.36 | ||||
| Class F3 | |||||||
| Actual | $1,000.00 | $1,003.50 | $2.47 | ||||
| Hypothetical (5% Return Before Expenses) | $1,000.00 | $1,022.74 | $2.50 | ||||
| Class I | |||||||
| Actual | $1,000.00 | $1,003.10 | $2.83 | ||||
| Hypothetical (5% Return Before Expenses) | $1,000.00 | $1,022.38 | $2.85 | ||||
| Class P | |||||||
| Actual | $1,000.00 | $1,001.30 | $5.15 | ||||
| Hypothetical (5% Return Before Expenses) | $1,000.00 | $1,020.06 | $5.19 | ||||
| Class R2 | |||||||
| Actual | $1,000.00 | $1,000.20 | $5.85 | ||||
| Hypothetical (5% Return Before Expenses) | $1,000.00 | $1,019.36 | $5.90 | ||||
| Class R3 | |||||||
| Actual | $1,000.00 | $1,001.90 | $5.35 | ||||
| Hypothetical (5% Return Before Expenses) | $1,000.00 | $1,019.86 | $5.40 | ||||
| Class R4 | |||||||
| Actual | $1,000.00 | $1,002.00 | $4.09 | ||||
| Hypothetical (5% Return Before Expenses) | $1,000.00 | $1,021.12 | $4.13 | ||||
| Class R5 | |||||||
| Actual | $1,000.00 | $1,003.20 | $2.88 | ||||
| Hypothetical (5% Return Before Expenses) | $1,000.00 | $1,022.33 | $2.91 | ||||
| Class R6 | |||||||
| Actual | $1,000.00 | $1,003.50 | $2.47 | ||||
| Hypothetical (5% Return Before Expenses) | $1,000.00 | $1,022.74 | $2.50 |
| † | For each class of the Fund, net expenses are equal to the annualized expense ratio for such class (0.76% for Class A, 1.40% for Class C, 0.66% for Class F, 0.49% for Class F3, 0.56% for Class I, 1.02% for Class P, 1.16% for Class R2, 1.06% for Class R3, 0.81% for Class R4, 0.57% for Class R5 and 0.49% for Class R6) multiplied by the average account value over the period, multiplied by 184/365 (to reflect one-half year period). |
8
Portfolio Holdings Presented by Sector
December 31, 2021
| Sector* | %** | |||
| Asset Backed Securities | 6.32 | % | ||
| Automotive | 0.02 | % | ||
| Basic Materials | 3.18 | % | ||
| Capital Goods | 0.02 | % | ||
| Communications | 7.85 | % | ||
| Consumer Goods | 0.06 | % | ||
| Consumer, Cyclical | 13.77 | % | ||
| Consumer, Non-cyclical | 12.84 | % | ||
| Energy | 13.13 | % | ||
| Financial | 12.61 | % | ||
| Government | 4.87 | % | ||
| Industrial | 7.53 | % | ||
| Media | 0.10 | % | ||
| Mortgage Securities | 5.53 | % | ||
| Retail | 0.02 | % | ||
| Service | 0.01 | % | ||
| Technology | 8.29 | % | ||
| Transportation | 0.04 | % | ||
| Utilities | 3.01 | % | ||
| Repurchase Agreements | 0.52 | % | ||
| Money Market Funds(a) | 0.25 | % | ||
| Time Deposits(a) | 0.03 | % | ||
| Total | 100.00 | % | ||
| * | A sector may comprise several industries. | |
| ** | Represents percent of total investments. | |
| (a) | Securities were purchased with the cash collateral from loaned securities. |
9
December 31, 2021
| Investments | Interest Rate | Maturity Date | Principal Amount (000) | Fair Value | ||||||||
| LONG-TERM INVESTMENTS 98.24% | ||||||||||||
| ASSET-BACKED SECURITIES 6.25% | ||||||||||||
| Automobiles 0.54% | ||||||||||||
| Avis Budget Rental Car Funding AESOP LLC 2021-2A D† | 4.08% | 2/20/2028 | $ | 16,000 | $ | 15,908,286 | ||||||
| Carvana Auto Receivables Trust NP1 2020-N1A E† | 5.20% | 7/15/2027 | 5,750 | 6,032,907 | ||||||||
| Exeter Automobile Receivables Trust 2021-2A E† | 2.90% | 7/17/2028 | 23,776 | 23,531,509 | ||||||||
| Hertz Vehicle Financing III LP 2021-2A D† | 4.34% | 12/27/2027 | 20,000 | 20,005,712 | ||||||||
| Hertz Vehicle Financing LLC 2021-1A D† | 3.98% | 12/26/2025 | 30,000 | 29,875,452 | ||||||||
| Westlake Automobile Receivables Trust 2021-1A F† | 3.91% | 9/15/2027 | 58,047 | 57,734,063 | ||||||||
| Total | 153,087,929 | |||||||||||
| Credit Card 0.23% | ||||||||||||
| Genesis Sales Finance Master Trust 2021-AA A† | 1.20% | 12/21/2026 | 25,102 | 24,785,544 | ||||||||
| Perimeter Master Note Business Trust 2019-2A A† | 4.23% | 5/15/2024 | 40,297 | 41,339,927 | ||||||||
| Total | 66,125,471 | |||||||||||
| Other 5.48% | ||||||||||||
| AMMC CLO Ltd. 2021-24A C† | 2.434% (3 Mo. LIBOR + 2.20% | )# | 1/20/2035 | 17,180 | 17,197,051 | |||||||
| AMMC CLO Ltd. 2021-24A D† | 3.634% (3 Mo. LIBOR + 3.40% | )# | 1/20/2035 | 10,800 | 10,854,174 | |||||||
| AMMC CLO XII Ltd. 2013-12A DR† | 2.846% (3 Mo. LIBOR + 2.70% | )# | 11/10/2030 | 3,859 | 3,771,430 | |||||||
| AMMC CLO XIII Ltd. 2013-13A A2LR† | 1.824% (3 Mo. LIBOR + 1.70% | )# | 7/24/2029 | 3,440 | 3,442,625 | |||||||
| AMMC CLO XIII Ltd. 2013-13A B1LR† | 3.724% (3 Mo. LIBOR + 3.60% | )# | 7/24/2029 | 5,000 | 4,981,534 | |||||||
| Apidos CLO XXIII 2015-23A AR† | 1.344% (3 Mo. LIBOR + 1.22% | )# | 4/15/2033 | 4,000 | 4,002,570 | |||||||
| Apidos CLO XXXV 2021-35A D† | 2.782% (3 Mo. LIBOR + 2.65% | )# | 4/20/2034 | 12,070 | 12,012,166 | |||||||
| Applebee’s Funding LLC/IHOP Funding LLC 2019-1A A2I† | 4.194% | 6/5/2049 | 29,519 | 29,968,113 | ||||||||
| Applebee’s Funding LLC/IHOP Funding LLC 2019-1A A2II† | 4.723% | 6/5/2049 | 19,986 | 20,628,504 | ||||||||
| Arbor Realty Commercial Real Estate Notes Ltd. 2021-FL4 D† | 2.99% (1 Mo. LIBOR + 2.90% | )# | 11/15/2036 | 46,980 | 46,940,946 | |||||||
| Ares XLII CLO Ltd. 2017-42A D† | 3.578% (3 Mo. LIBOR + 3.45% | )# | 1/22/2028 | 6,250 | 6,258,943 | |||||||
| 10 | See Notes to Financial Statements. |
Schedule of Investments (continued)
December 31, 2021
| Investments | Interest Rate | Maturity Date | Principal Amount (000) | Fair Value | ||||||||
| Other (continued) | ||||||||||||
| Avant Loans Funding Trust 2021-REV1 A† | 1.21% | 7/15/2030 | $ | 26,440 | $ | 26,245,603 | ||||||
| Bain Capital Credit CLO Ltd. 2021-2A C† | 2.222% (3 Mo. LIBOR + 2.10% | )# | 7/16/2034 | 9,000 | 9,022,601 | |||||||
| Bain Capital Credit CLO Ltd. 2021-6A C† | 2.273% (3 Mo. LIBOR + 2.05% | )# | 10/21/2034 | 14,280 | 14,280,082 | |||||||
| Bain Capital Credit CLO Ltd. 2021-6A D† | 3.323% (3 Mo. LIBOR + 3.10% | )# | 10/21/2034 | 15,910 | 15,910,865 | |||||||
| Barings CLO III Ltd. 2019-3A DR† | 2.932% (3 Mo. LIBOR + 2.80% | )# | 4/20/2031 | 11,750 | 11,735,600 | |||||||
| Benefit Street Partners CLO XIX Ltd. 2019-19A B† | 2.124% (3 Mo. LIBOR + 2.00% | )# | 1/15/2033 | 7,922 | 7,928,860 | |||||||
| BlueMountain CLO XXVIII Ltd. 2021-28A D† | 3.024% (3 Mo. LIBOR + 2.90% | )# | 4/15/2034 | 17,280 | 17,194,748 | |||||||
| Carlyle US CLO Ltd. 2019-4A B† | 2.824% (3 Mo. LIBOR + 2.70% | )# | 1/15/2033 | 15,609 | 15,617,329 | |||||||
| Carlyle US CLO Ltd. 2021-10A C† | 2.172% (3 Mo. LIBOR + 2.05% | )# | 10/20/2034 | 10,970 | 10,788,747 | |||||||
| Carlyle US CLO Ltd. 2021-10A D† | 3.422% (3 Mo. LIBOR + 3.30% | )# | 10/20/2034 | 18,780 | 18,872,651 | |||||||
| Carlyle US CLO Ltd. 2021-1A B† | 1.924% (3 Mo. LIBOR + 1.80% | )# | 4/15/2034 | 13,250 | 13,168,615 | |||||||
| Carlyle US CLO Ltd. 2021-1A C† | 2.924% (3 Mo. LIBOR + 2.80% | )# | 4/15/2034 | 17,030 | 16,963,687 | |||||||
| Cedar Funding XIV CLO Ltd. 2021-14A C† | 1.974% (3 Mo. LIBOR + 1.85% | )# | 7/15/2033 | 11,400 | 11,401,026 | |||||||
| CIFC Funding Ltd. 2021-1A D† | 3.074% (3 Mo. LIBOR + 2.95% | )# | 4/25/2033 | 16,080 | 16,140,126 | |||||||
| Dryden 30 Senior Loan Fund 2013-30A DR† | 2.756% (3 Mo. LIBOR + 2.60% | )# | 11/15/2028 | 18,138 | 17,288,468 | |||||||
| Dryden 61 CLO Ltd. 2018-61A CR† | 1.872% (3 Mo. LIBOR + 1.75% | )# | 1/17/2032 | 9,478 | 9,465,979 | |||||||
| Dryden 61 CLO Ltd. 2018-61A DR† | 3.222% (3 Mo. LIBOR + 3.10% | )# | 1/17/2032 | 20,190 | 20,190,552 | |||||||
| Dryden 72 CLO Ltd. 2019-72A DR† | 3.156% (3 Mo. LIBOR + 3.00% | )# | 5/15/2032 | 7,000 | 6,957,051 | |||||||
| Dryden 90 CLO Ltd. 2021-90A D† | 3.16% (3 Mo. LIBOR + 3.00% | )# | 2/20/2035 | 11,450 | 11,509,627 | |||||||
| Eaton Vance CLO Ltd. 2013-1A C3R† | 3.524% (3 Mo. LIBOR + 3.40% | )# | 1/15/2034 | 14,190 | 14,313,511 | |||||||
| Elmwood CLO VIII Ltd. 2021-1A C1† | 2.082% (3 Mo. LIBOR + 1.95% | )# | 1/20/2034 | 18,920 | 18,856,223 | |||||||
| See Notes to Financial Statements. | 11 |
Schedule of Investments (continued)
December 31, 2021
| Investments | Interest Rate | Maturity Date | Principal Amount (000) | Fair Value | ||||||||
| Other (continued) | ||||||||||||
| Elmwood CLO VIII Ltd. 2021-1A D1† | 3.132% (3 Mo. LIBOR + 3.00% | )# | 1/20/2034 | $ | 14,190 | $ | 14,166,077 | |||||
| Galaxy XXI CLO Ltd. 2015-21A AR† | 1.152% (3 Mo. LIBOR + 1.02% | )# | 4/20/2031 | 5,311 | 5,314,148 | |||||||
| Greywolf CLO III Ltd. 2020-3RA A1R† | 1.418% (3 Mo. LIBOR + 1.29% | )# | 4/15/2033 | 20,101 | 20,120,808 | |||||||
| Greywolf CLO VII Ltd. 2018-2A A1† | 1.312% (3 Mo. LIBOR + 1.18% | )# | 10/20/2031 | 10,000 | 9,995,319 | |||||||
| Halcyon Loan Advisors Funding Ltd. 2015-2A CR† | 2.274% (3 Mo. LIBOR + 2.15% | )# | 7/25/2027 | 5,476 | 5,402,937 | |||||||
| Halcyon Loan Advisors Funding Ltd. 2017-2A A2† | 1.822% (3 Mo. LIBOR + 1.70% | )# | 1/17/2030 | 9,320 | 9,336,429 | |||||||
| Harbor Park CLO Ltd. 2018-1A D† | 3.032% (3 Mo. LIBOR + 2.90% | )# | 1/20/2031 | 4,560 | 4,564,715 | |||||||
| Hardee’s Funding LLC 2018-1A A2II† | 4.959% | 6/20/2048 | 30,410 | 32,055,557 | ||||||||
| Invesco CLO Ltd. 2021-3A C† | 2.118% (3 Mo. LIBOR + 2.00% | )# | 10/22/2034 | 13,640 | 13,640,182 | |||||||
| Kayne CLO 10 Ltd. 2021-10A D† | Zero Coupon | #(a) | 4/23/2034 | 6,630 | 6,589,624 | |||||||
| Kayne CLO Ltd. 2018 1A DR† | 2.774% (3 Mo. LIBOR + 2.65% | )# | 7/15/2031 | 7,340 | 7,244,116 | |||||||
| Kayne CLO Ltd. 2020-7A A1† | 1.322% (3 Mo. LIBOR + 1.20% | )# | 4/17/2033 | 47,944 | 47,997,163 | |||||||
| KKR CLO 29 Ltd. 29A C† | 2.124% (3 Mo. LIBOR + 2.00% | )# | 1/15/2032 | 6,150 | 6,129,343 | |||||||
| KKR CLO 33 Ltd. 33A C† | 2.132% (3 Mo. LIBOR + 2.00% | )# | 7/20/2034 | 10,000 | 10,000,682 | |||||||
| KKR CLO 33 Ltd. 33A D† | 3.232% (3 Mo. LIBOR + 3.10% | )# | 7/20/2034 | 8,000 | 7,910,104 | |||||||
| KKR CLO Ltd.18 D† | 3.722% (3 Mo. LIBOR + 3.60% | )# | 7/18/2030 | 7,110 | 7,123,140 | |||||||
| Lendmark Funding Trust 2021-1A A† | 1.90% | 11/20/2031 | 28,528 | 28,284,414 | ||||||||
| LOGAN CLO I Ltd. 2021-1A C† | 2.052% (3 Mo. LIBOR + 1.90% | )# | 7/20/2034 | 11,000 | 11,018,797 | |||||||
| Marble Point CLO XVII Ltd. 2020-1A A† | 1.432% (3 Mo. LIBOR + 1.30% | )# | 4/20/2033 | 29,415 | 29,415,475 | |||||||
| Marble Point CLO XVII Ltd. 2020-1A B† | 1.902% (3 Mo. LIBOR + 1.77% | )# | 4/20/2033 | 9,348 | 9,355,737 | |||||||
| Mariner Finance Issuance Trust 2021-AA A† | 1.86% | 3/20/2036 | 46,827 | 46,102,633 | ||||||||
| Mountain View CLO LLC 2016-1A DR† | 3.827% (3 Mo. LIBOR + 3.70% | )# | 4/14/2033 | 9,470 | 9,355,570 | |||||||
| Neuberger Berman Loan Advisers CLO Ltd. 2019-35A A1† | 1.464% (3 Mo. LIBOR + 1.34% | )# | 1/19/2033 | 12,300 | 12,316,354 | |||||||
| 12 | See Notes to Financial Statements. |
Schedule of Investments (continued)
December 31, 2021
| Investments | Interest Rate | Maturity Date | Principal Amount (000) | Fair Value | ||||||||
| Other (continued) | ||||||||||||
| Neuberger Berman Loan Advisers CLO Ltd. 2021-45A C† | 2.12% (3 Mo. LIBOR + 2.00% | )# | 10/14/2035 | $ | 19,540 | $ | 19,540,745 | |||||
| Newark BSL CLO 2 Ltd. 2017-1A CR† | 3.274% (3 Mo. LIBOR + 3.15% | )# | 7/25/2030 | 21,000 | 21,000,553 | |||||||
| Oaktree CLO 2019-4 Ltd. BR† | 3.618% (3 Mo. LIBOR + 1.70% | )# | 10/20/2032 | 29,790 | 29,790,981 | |||||||
| Oaktree CLO Ltd. 2020-1A DR† | 3.274% (3 Mo. LIBOR + 3.15% | )# | 7/15/2034 | 18,130 | 17,901,836 | |||||||
| Oaktree CLO Ltd. 2021-1A D† | 3.374% (3 Mo. LIBOR + 3.25% | )# | 7/15/2034 | 8,280 | 8,219,593 | |||||||
| OCP CLO Ltd. 2019-16A DR† | 3.271% (3 Mo. LIBOR + 3.15% | )# | 4/10/2033 | 8,300 | 8,277,869 | |||||||
| OCP CLO Ltd. 2021-21A C† | 2.032% (3 Mo. LIBOR + 1.90% | )# | 7/20/2034 | 11,880 | 11,844,635 | |||||||
| OCP CLO Ltd. 2021-22A B1† | 1.816% (3 Mo. LIBOR + 1.70% | )# | 12/2/2034 | 38,140 | 38,218,189 | |||||||
| OCP CLO Ltd. 2021-22A D† | 3.216% (3 Mo. LIBOR + 3.10% | )# | 12/2/2034 | 9,500 | 9,480,950 | |||||||
| Octagon 57 Ltd. 2021-1A D† | 3.215% (3 Mo. LIBOR + 3.10% | )# | 10/15/2034 | 9,530 | 9,493,762 | |||||||
| Octagon Investment Partners XXI Ltd. 2014-1A CR3† | 2.906% (3 Mo. LIBOR + 2.75% | )# | 2/14/2031 | 16,100 | 15,928,953 | |||||||
| OHA Credit Funding 8 Ltd. 2021-8A C† | 2.022% (3 Mo. LIBOR + 1.90% | )# | 1/18/2034 | 14,190 | 14,153,910 | |||||||
| OHA Credit Funding 8 Ltd. 2021-8A D† | 2.972% (3 Mo. LIBOR + 2.85% | )# | 1/18/2034 | 11,450 | 11,411,545 | |||||||
| OHA Credit Funding 9 Ltd. 2021-9A C† | 2.084% (3 Mo. LIBOR + 1.90% | )# | 7/19/2035 | 13,780 | 13,776,731 | |||||||
| OHA Credit Funding 9 Ltd. 2021-9A D† | 3.134% (3 Mo. LIBOR + 2.95% | )# | 7/19/2035 | 12,360 | 12,269,140 | |||||||
| OneMain Financial Issuance Trust 2020-2A D† | 3.45% | 9/14/2035 | 28,012 | 29,185,804 | ||||||||
| Palmer Square CLO Ltd. 2021-1A C† | 2.832% (3 Mo. LIBOR + 2.70% | )# | 4/20/2034 | 8,990 | 8,958,588 | |||||||
| Parallel Ltd. 2017-1A A1R† | 1.162% (3 Mo. LIBOR + 1.03% | )# | 7/20/2029 | 4,894 | 4,895,687 | |||||||
| Planet Fitness Master Issuer LLC 2018-1A A2I† | 4.262% | 9/5/2048 | 17,453 | 17,520,086 | ||||||||
| Planet Fitness Master Issuer LLC 2018-1A A2II† | 4.666% | 9/5/2048 | 21,816 | 22,343,218 | ||||||||
| Planet Fitness Master Issuer LLC 2019-1A A2† | 3.858% | 12/5/2049 | 13,945 | 14,361,918 | ||||||||
| Rad CLO 15 Ltd. 2021-15A B† | 1.897% (3 Mo. LIBOR + 1.65% | )# | 1/20/2034 | 32,460 | 32,460,208 | |||||||
| See Notes to Financial Statements. | 13 |
Schedule of Investments (continued)
December 31, 2021
| Investments | Interest Rate | Maturity Date | Principal Amount (000) | Fair Value | ||||||||
| Other (continued) | ||||||||||||
| Regata XII Funding Ltd. 2019-1A CR† | Zero Coupon | #(a) | 10/15/2032 | $ | 22,880 | $ | 22,711,480 | |||||
| Regatta XVIII Funding Ltd. 2021-1A B† | 1.574% (3 Mo. LIBOR + 1.45% | )# | 1/15/2034 | 18,940 | 18,812,218 | |||||||
| Regatta XVIII Funding Ltd. 2021-1A D† | 2.874% (3 Mo. LIBOR + 2.75% | )# | 1/15/2034 | 18,940 | 18,844,590 | |||||||
| SEB Funding LLC 2021-1A A2† | 4.969% | 1/30/2052 | 6,893 | 6,912,680 | ||||||||
| Signal Peak CLO Ltd. 2021-10A B† | 2.004% (3 Mo. LIBOR + 1.75% | )# | 1/24/2035 | 24,820 | 24,820,000 | |||||||
| Signal Peak CLO Ltd. 2021-10A C† | 2.404% (3 Mo. LIBOR + 2.15% | )# | 1/24/2035 | 8,590 | 8,590,000 | |||||||
| Signal Peak CLO Ltd. 2021-10A D† | 3.454% (3 Mo. LIBOR + 3.20% | )# | 1/24/2035 | 11,460 | 11,460,000 | |||||||
| Sunrun Demeter Issuer 2021-2A A† | 2.27% | 1/30/2057 | 29,588 | 29,473,672 | ||||||||
| TCI-Flatiron CLO Ltd. 2018-1A BR† | 1.529% (3 Mo. LIBOR + 1.40% | )# | 1/29/2032 | 4,500 | 4,457,275 | |||||||
| TCI-Flatiron CLO Ltd. 2018-1A DR† | 2.879% (3 Mo. LIBOR + 2.75% | )# | 1/29/2032 | 7,000 | 6,972,958 | |||||||
| THL Credit Wind River CLO Ltd. 2018-3A D† | 3.082% (3 Mo. LIBOR + 2.95% | )# | 1/20/2031 | 1,264 | 1,251,244 | |||||||
| TICP CLO XIV Ltd. 2019-14A BR† | Zero Coupon | #(a) | 10/20/2032 | 7,000 | 7,000,137 | |||||||
| TICP CLO XIV Ltd. 2019-14A A2R† | Zero Coupon | #(a) | 10/20/2032 | 21,315 | 21,315,304 | |||||||
| TICP CLO XIV Ltd. 2019-14A CR† | Zero Coupon | #(a) | 10/20/2032 | 13,500 | 13,500,380 | |||||||
| TRP - TRIP Rail Master Funding LLC 2021-2 A† | 2.15% | 6/19/2051 | 29,832 | 29,729,371 | ||||||||
| TRP LLC 2021-1 A† | 2.07% | 6/19/2051 | 21,225 | 21,049,113 | ||||||||
| VERDE CLO Ltd. 2019-1A CR† | 2.124% (3 Mo. LIBOR + 2.00% | )# | 4/15/2032 | 5,000 | 5,004,445 | |||||||
| Voya CLO Ltd. 2019-3A BR† | 1.763% (3 Mo. LIBOR + 1.65% | )# | 10/17/2032 | 36,000 | 36,000,530 | |||||||
| Wellman Park CLO Ltd. 2021-1A B† | 1.724% (3 Mo. LIBOR + 1.60% | )# | 7/15/2034 | 14,000 | 13,998,708 | |||||||
| Wellman Park CLO Ltd. 2021-1A D† | 3.074% (3 Mo. LIBOR + 2.95% | )# | 7/15/2034 | 24,250 | 24,125,629 | |||||||
| Wind River CLO Ltd. 2021-2A D† | 3.282% (3 Mo. LIBOR + 3.15% | )# | 7/20/2034 | 7,610 | 7,516,401 | |||||||
| Wind River CLO Ltd. 2021-4A D† | 3.416% (3 Mo. LIBOR + 3.20% | )# | 1/20/2035 | 19,090 | 18,865,700 | |||||||
| Zaxby’s Funding LLC 2021-1A A2† | 3.238% | 7/30/2051 | 22,713 | 23,173,947 | ||||||||
| Total | 1,563,970,014 | |||||||||||
| Total Asset-Backed Securities (cost $1,787,608,086) | 1,783,183,414 | |||||||||||
| 14 | See Notes to Financial Statements. |
Schedule of Investments (continued)
December 31, 2021
| Investments | Shares (000) | Fair Value | ||||||
| COMMON STOCKS 11.99% | ||||||||
| Air Freight & Logistics 0.25% | ||||||||
| Expeditors International of Washington, Inc. | 522 | $ | 70,059,227 | |||||
| Auto Components 0.02% | ||||||||
| Chassix Holdings, Inc. | 607 | 4,552,928 | ||||||
| Automobiles 0.48% | ||||||||
| BYD Co. Ltd.(b) | HKD | 1,241 | 41,960,569 | |||||
| Ford Motor Co. | 4,601 | 95,561,607 | ||||||
| Total | 137,522,176 | |||||||
| Banks 0.53% | ||||||||
| Popular, Inc. | 541 | 44,419,656 | ||||||
| Signature Bank | 140 | 45,259,599 | ||||||
| SVB Financial Group* | 90 | 61,324,426 | ||||||
| Total | 151,003,681 | |||||||
| Beverages 0.20% | ||||||||
| Boston Beer Co., Inc. (The) Class A* | 110 | 55,737,785 | ||||||
| Biotechnology 0.18% | ||||||||
| BioNTech SE ADR* | 204 | 52,597,387 | ||||||
| Building Products 0.35% | ||||||||
| Trex Co., Inc.* | 747 | 100,806,917 | ||||||
| Capital Markets 0.23% | ||||||||
| Allfunds Group plc*(b) | EUR | 1,634 | 32,182,195 | |||||
| Blackstone Group, Inc. (The) | 251 | 32,521,141 | ||||||
| Total | 64,703,336 | |||||||
| Commercial Services & Supplies 0.10% | ||||||||
| Tetra Tech, Inc. | 168 | 28,510,609 | ||||||
| Communications Equipment 0.33% | ||||||||
| Arista Networks, Inc.* | 662 | 95,184,063 | ||||||
| Electrical Equipment 0.45% | ||||||||
| Generac Holdings, Inc.* | 163 | 57,480,501 | ||||||
| Rockwell Automation, Inc. | 206 | 71,703,676 | ||||||
| Total | 129,184,177 | |||||||
| See Notes to Financial Statements. | 15 |
Schedule of Investments (continued)
December 31, 2021
| Investments | Shares (000) | Fair Value | ||||||
| Electric-Generation 0.00% | ||||||||
| Frontera Generation Holdings LLC | 126 | $ | 275,612 | |||||
| Electronic Equipment, Instruments & Components 0.26% | ||||||||
| Littelfuse, Inc. | 142 | 44,789,034 | ||||||
| Omron Corp.(b) | JPY | 286 | 28,546,760 | |||||
| Total | 73,335,794 | |||||||
| Entertainment 0.21% | ||||||||
| ROBLOX Corp. Class A* | 569 | 58,696,905 | ||||||
| Equity Real Estate Investment Trusts 0.51% | ||||||||
| Camden Property Trust | 411 | 73,412,465 | ||||||
| CubeSmart | 1,251 | 71,167,491 | ||||||
| Total | 144,579,956 | |||||||
| Food & Staples Retailing 0.16% | ||||||||
| Albertsons Cos., Inc. Class A(c) | 1,556 | 46,969,602 | ||||||
| Food Products 0.67% | ||||||||
| Bunge Ltd. | 310 | 28,981,091 | ||||||
| Hershey Co. (The) | 454 | 87,748,512 | ||||||
| McCormick & Co., Inc. | 779 | 75,243,926 | ||||||
| Total | 191,973,529 | |||||||
| Health Care Equipment & Supplies 0.25% | ||||||||
| Abbott Laboratories | 514 | 72,279,983 | ||||||
| Health Care Providers & Services 0.21% | ||||||||
| AMN Healthcare Services, Inc.* | 492 | 60,232,111 | ||||||
| Hotels, Restaurants & Leisure 0.10% | ||||||||
| Hilton Worldwide Holdings, Inc.* | 184 | 28,762,684 | ||||||
| Household Durables 0.37% | ||||||||
| NVR, Inc.* | 5 | 30,135,237 | ||||||
| TopBuild Corp.* | 271 | 74,748,985 | ||||||
| Total | 104,884,222 | |||||||
| Household Products 0.15% | ||||||||
| Church & Dwight Co., Inc. | 427 | 43,743,208 | ||||||
| 16 | See Notes to Financial Statements. |
Schedule of Investments (continued)
December 31, 2021
| Investments | Shares (000) | Fair Value | ||||||
| Information Technology Services 0.78% | ||||||||
| Adyen NV†*(b) | EUR | 11 | $ | 30,182,245 | ||||
| Cloudflare, Inc. Class A* | 335 | 44,019,888 | ||||||
| Marqeta, Inc. Class A* | 836 | 14,349,175 | ||||||
| Snowflake, Inc. Class A* | 307 | 104,008,445 | ||||||
| Toast, Inc. Class A*(c) | 826 | 28,656,229 | ||||||
| Total | 221,215,982 | |||||||
| Internet & Direct Marketing Retail 0.10% | ||||||||
| Etsy, Inc.* | 134 | 29,344,528 | ||||||
| Machinery 0.26% | ||||||||
| Illinois Tool Works, Inc. | 296 | 72,945,195 | ||||||
| Marine 0.12% | ||||||||
| Orient Overseas International Ltd.(b) | HKD | 1,385 | 34,035,602 | |||||
| Miscellaneous Financials 0.02% | ||||||||
| UTEX Industries, Inc. | 114 | 6,005,060 | ||||||
| Multi-Line Retail 0.15% | ||||||||
| Dollar Tree, Inc.* | 311 | 43,754,977 | ||||||
| Oil, Gas & Consumable Fuels 0.26% | ||||||||
| Cheniere Energy, Inc. | 304 | 30,785,737 | ||||||
| Continental Resources, Inc. | 955 | 42,753,275 | ||||||
| Total | 73,539,012 | |||||||
| Personal Products 0.21% | ||||||||
| Gibson Brands, Inc. | 107 | 16,035,300 | ||||||
| L’Oreal SA(b) | EUR | 93 | 44,273,486 | |||||
| Revlon, Inc. Class A | 1,798 | 358,193 | ||||||
| Total | 60,666,979 | |||||||
| Pharmaceuticals 0.10% | ||||||||
| Merck KGaA(b) | EUR | 115 | 29,486,546 | |||||
| Professional Services 0.15% | ||||||||
| Equifax, Inc. | 146 | 42,614,999 | ||||||
| Road & Rail 0.55% | ||||||||
| CSX Corp. | 1,590 | 59,795,355 | ||||||
| Old Dominion Freight Line, Inc. | 273 | 97,735,602 | ||||||
| Total | 157,530,957 | |||||||
| See Notes to Financial Statements. | 17 |
Schedule of Investments (continued)
December 31, 2021
| Investments | Shares (000) | Fair Value | ||||||
| Semiconductors & Semiconductor Equipment 1.08% | ||||||||
| Advanced Micro Devices, Inc.* | 225 | $ | 32,366,132 | |||||
| ASML Holding NV (Netherlands)(d) | 78 | 62,335,374 | ||||||
| Entegris, Inc. | 215 | 29,836,967 | ||||||
| Lasertec Corp.(b) | JPY | 112 | 34,367,020 | |||||
| NVIDIA Corp. | 203 | 59,579,333 | ||||||
| SolarEdge Technologies, Inc. (Israel)*(d) | 192 | 53,867,757 | ||||||
| Synaptics, Inc.* | 120 | 34,874,664 | ||||||
| Total | 307,227,247 | |||||||
| Software 1.08% | ||||||||
| Datadog, Inc. Class A* | 256 | 45,633,207 | ||||||
| Intuit, Inc. | 159 | 102,202,512 | ||||||
| Oracle Corp. | 612 | 53,374,613 | ||||||
| Samsara, Inc. Class A*(c) | 1,210 | 34,021,477 | ||||||
| Trade Desk, Inc. (The) Class A* | 782 | 71,688,047 | ||||||
| Total | 306,919,856 | |||||||
| Specialty Retail 0.49% | ||||||||
| Claires Holdings LLC | 15 | 4,966,332 | (e) | |||||
| Home Depot, Inc. (The) | 105 | 43,590,990 | ||||||
| O’Reilly Automotive, Inc.* | 64 | 45,104,792 | ||||||
| Tractor Supply Co. | 187 | 44,648,264 | ||||||
| Total | 138,310,378 | |||||||
| Technology Hardware, Storage & Peripherals 0.21% | ||||||||
| Apple, Inc. | 330 | 58,637,698 | ||||||
| Textiles, Apparel & Luxury Goods 0.15% | ||||||||
| Moncler SpA(b) | EUR | 604 | 43,638,591 | |||||
| Trading Companies & Distributors 0.27% | ||||||||
| SiteOne Landscape Supply, Inc.* | 192 | 46,541,261 | ||||||
| WESCO International, Inc.* | 226 | 29,727,497 | ||||||
| Total | 76,268,758 | |||||||
| Transportation Infrastructure 0.00% | ||||||||
| ACBL Holdings Corp. | 45 | 1,234,668 | ||||||
| Total Common Stocks (cost $3,311,587,297) | 3,418,972,925 | |||||||
| 18 | See Notes to Financial Statements. |
Schedule of Investments (continued)
December 31, 2021
| Investments | Interest Rate | Maturity Date | Principal Amount (000) | Fair Value | ||||||||
| CONVERTIBLE BONDS 0.39% | ||||||||||||
| Auto Manufacturers 0.29% | ||||||||||||
| Tesla, Inc. | 2.00% | 5/15/2024 | $ | 4,875 | $ | 82,978,837 | ||||||
| Pharmaceuticals 0.10% | ||||||||||||
| Sarepta Therapeutics, Inc. | 1.50% | 11/15/2024 | 19,419 | 28,487,790 | ||||||||
| Total Convertible Bonds (cost $99,227,828) | 111,466,627 | |||||||||||
| CORPORATE BONDS 63.63% | ||||||||||||
| Advertising 0.29% | ||||||||||||
| Clear Channel Outdoor Holdings, Inc.† | 7.50% | 6/1/2029 | 18,588 | 19,874,661 | ||||||||
| Clear Channel Outdoor Holdings, Inc.† | 7.75% | 4/15/2028 | 28,424 | 30,457,169 | ||||||||
| Midas OpCo Holdings LLC† | 5.625% | 8/15/2029 | 32,936 | 33,770,434 | ||||||||
| Total | 84,102,264 | |||||||||||
| Aerospace/Defense 1.08% | ||||||||||||
| Bombardier, Inc. (Canada)†(d) | 6.00% | 2/15/2028 | 65,388 | 65,678,976 | ||||||||
| Bombardier, Inc. (Canada)†(d) | 7.125% | 6/15/2026 | 44,140 | 45,848,439 | ||||||||
| Raytheon Technologies Corp. | 4.125% | 11/16/2028 | 23,649 | 26,476,001 | ||||||||
| TransDigm, Inc. | 4.625% | 1/15/2029 | 27,177 | 27,135,963 | ||||||||
| TransDigm, Inc. | 5.50% | 11/15/2027 | 83,082 | 85,721,930 | ||||||||
| TransDigm, Inc.† | 6.25% | 3/15/2026 | 36,017 | 37,480,731 | ||||||||
| TransDigm, Inc. | 6.375% | 6/15/2026 | 19,375 | 19,932,031 | ||||||||
| Total | 308,274,071 | |||||||||||
| Agriculture 0.29% | ||||||||||||
| Viterra Finance BV (Netherlands)†(d) | 2.00% | 4/21/2026 | 44,671 | 44,429,256 | ||||||||
| Viterra Finance BV (Netherlands)†(d) | 3.20% | 4/21/2031 | 37,600 | 37,923,712 | ||||||||
| Total | 82,352,968 | |||||||||||
| Airlines 0.94% | ||||||||||||
| Air Canada (Canada)†(d) | 3.875% | 8/15/2026 | 28,196 | 28,796,998 | ||||||||
| Alaska Airlines 2020-1 Class A Pass Through Trust† | 4.80% | 2/15/2029 | 23,485 | 25,714,693 | ||||||||
| American Airlines, Inc./AAdvantage Loyalty IP Ltd.† | 5.75% | 4/20/2029 | 31,026 | 33,221,245 | ||||||||
| Azul Investments LLP† | 5.875% | 10/26/2024 | 27,618 | 25,797,145 | ||||||||
| Delta Air Lines, Inc.† | 7.00% | 5/1/2025 | 44,594 | 51,028,609 | ||||||||
| Hawaiian Brand Intellectual Property Ltd./HawaiianMiles Loyalty Ltd.† | 5.75% | 1/20/2026 | 21,092 | 22,096,106 | ||||||||
| JetBlue 2019-1 Class A Pass Through Trust | 2.95% | 11/15/2029 | 12,318 | 12,330,828 | ||||||||
| JetBlue 2019-1 Class B Pass Through Trust | 8.00% | 11/15/2027 | 8,696 | 10,009,984 | ||||||||
| See Notes to Financial Statements. | 19 |
Schedule of Investments (continued)
December 31, 2021
| Investments | Interest Rate | Maturity Date | Principal Amount (000) | Fair Value | ||||||||
| Airlines (continued) | ||||||||||||
| Mileage Plus Holdings LLC/Mileage Plus | ||||||||||||
| Intellectual Property Assets Ltd.† | 6.50% | 6/20/2027 | $ | 36,232 | $ | 38,732,189 | ||||||
| United Airlines 2020-1 Class A Pass Through Trust | 5.875% | 4/15/2029 | 17,602 | 19,313,727 | ||||||||
| Total | 267,041,524 | |||||||||||
| Apparel 0.30% | ||||||||||||
| Crocs, Inc.† | 4.125% | 8/15/2031 | 30,298 | 29,660,985 | ||||||||
| Crocs, Inc.† | 4.25% | 3/15/2029 | 17,653 | 17,458,640 | ||||||||
| Levi Strauss & Co.† | 3.50% | 3/1/2031 | 37,377 | 38,164,347 | ||||||||
| Total | 85,283,972 | |||||||||||
| Auto Manufacturers 1.46% | ||||||||||||
| Allison Transmission, Inc.† | 3.75% | 1/30/2031 | 44,553 | 43,518,257 | ||||||||
| BMW US Capital LLC† | 4.15% | 4/9/2030 | 32,668 | 37,027,895 | ||||||||
| Ford Motor Co. | 3.25% | 2/12/2032 | 62,114 | 63,728,964 | ||||||||
| Ford Motor Co. | 4.75% | 1/15/2043 | 76,482 | 84,552,763 | ||||||||
| Ford Motor Co. | 5.291% | 12/8/2046 | 23,963 | 28,200,018 | ||||||||
| Ford Motor Credit Co. LLC | 4.00% | 11/13/2030 | 45,275 | 48,785,171 | ||||||||
| General Motors Co. | 6.125% | 10/1/2025 | 22,600 | 25,983,448 | ||||||||
| General Motors Financial Co., Inc. | 2.70% | 6/10/2031 | 36,578 | 36,486,637 | ||||||||
| General Motors Financial Co., Inc. | 5.25% | 3/1/2026 | 24,966 | 28,023,054 | ||||||||
| Volkswagen Group of America Finance LLC† | 3.75% | 5/13/2030 | 17,706 | 19,379,395 | ||||||||
| Total | 415,685,602 | |||||||||||
| Auto Parts & Equipment 0.32% | ||||||||||||
| Adient Global Holdings Ltd.† | 4.875% | 8/15/2026 | 19,500 | 19,915,155 | ||||||||
| Clarios Global LP/Clarios US Finance Co.† | 8.50% | 5/15/2027 | 25,080 | 26,617,028 | ||||||||
| Lear Corp. | 4.25% | 5/15/2029 | 17,051 | 18,822,088 | ||||||||
| Lear Corp. | 5.25% | 5/15/2049 | 19,893 | 25,177,542 | ||||||||
| Total | 90,531,813 | |||||||||||
| Banks 3.93% | ||||||||||||
| ABN AMRO Bank NV (Netherlands)†(d) | 3.324% (5 Yr. Treasury CMT + 1.90% | )# | 3/13/2037 | 26,600 | 26,606,398 | |||||||
| ABN AMRO Bank NV (Netherlands)†(d) | 4.75% | 7/28/2025 | 31,461 | 34,315,094 | ||||||||
| AIB Group plc (Ireland)†(d) | 4.263% (3 Mo. LIBOR + 1.87% | )# | 4/10/2025 | 19,998 | 21,070,212 | |||||||
| Alfa Bank AO Via Alfa Bond Issuance plc (Ireland)†(d) | 5.50% (5 Yr. Treasury CMT + 4.55% | )# | 10/26/2031 | 51,057 | 50,890,554 | |||||||
| 20 | See Notes to Financial Statements. |
Schedule of Investments (continued)
December 31, 2021
| Investments | Interest Rate | Maturity Date | Principal Amount (000) | Fair Value | ||||||||
| Banks (continued) | ||||||||||||
| Australia & New Zealand Banking Group Ltd. (United Kingdom)†(d) | 6.75% (USD ICE 5 Yr. Swap rate + 5.17% | )# | – | (f) | $ | 19,074 | $ | 21,688,760 | ||||
| Banco Mercantil del Norte SA† | 7.625% (10 Yr. Treasury CMT + 5.35% | )# | – | (f) | 20,928 | 22,495,507 | ||||||
| Banco Nacional de Comercio Exterior SNC† | 2.72% (5 Yr. Treasury CMT + 2.00% | )# | 8/11/2031 | 19,026 | 18,835,930 | |||||||
| Bangkok Bank pcl (Hong Kong)†(d) | 5.00% (5 Yr. Treasury CMT + 4.73% | )# | – | (f) | 34,604 | 35,954,594 | ||||||
| Bank Hapoalim BM (Israel)†(d) | 3.255% (5 Yr. Treasury CMT + 2.16% | )# | 1/21/2032 | 21,420 | 21,312,900 | |||||||
| Bank of America Corp. | 4.45% | 3/3/2026 | 19,634 | 21,637,192 | ||||||||
| Bank of Ireland Group plc (Ireland)†(d) | 2.029% (1 Yr. Treasury CMT + 1.10% | )# | 9/30/2027 | 24,345 | 23,934,148 | |||||||
| Bank of Ireland Group plc (Ireland)†(d) | 4.50% | 11/25/2023 | 31,384 | 33,242,444 | ||||||||
| Bank OZK | 2.75% (SOFR + 2.09% | )# | 10/1/2031 | 41,658 | 41,699,956 | |||||||
| BankUnited, Inc. | 4.875% | 11/17/2025 | 24,313 | 26,750,233 | ||||||||
| CIT Group, Inc. | 6.125% | 3/9/2028 | 55,745 | 67,389,016 | ||||||||
| Citigroup, Inc. | 4.45% | 9/29/2027 | 49,487 | 55,220,582 | ||||||||
| Fifth Third Bancorp | 8.25% | 3/1/2038 | 8,042 | 13,211,527 | ||||||||
| Global Bank Corp. (Panama)†(d) | 5.25% (3 Mo. LIBOR + 3.30% | )# | 4/16/2029 | 33,093 | 34,312,146 | |||||||
| Goldman Sachs Group, Inc. (The) | 3.50% | 11/16/2026 | 13,667 | 14,572,545 | ||||||||
| Goldman Sachs Group, Inc. (The) | 4.25% | 10/21/2025 | 18,995 | 20,734,392 | ||||||||
| Home BancShares, Inc. | 5.625% (3 Mo. LIBOR + 3.58% | )# | 4/15/2027 | 20,631 | 20,891,048 | |||||||
| Huntington Bancshares, Inc. | 5.70% (3 Mo. LIBOR + 2.88% | )# | – | (f) | 26,581 | 27,112,620 | ||||||
| ING Groep NV (Netherlands)(d) | 5.75% (5 Yr. Treasury CMT + 4.34% | )# | – | (f) | 52,547 | 56,597,586 | ||||||
| Intesa Sanpaolo SpA (Italy)†(d) | 4.198% (1 Yr. Treasury CMT + 2.60% | )# | 6/1/2032 | 35,367 | 35,710,296 | |||||||
| JPMorgan Chase & Co. | 3.54% (3 Mo. LIBOR + 1.38% | )# | 5/1/2028 | 24,994 | 27,164,260 | |||||||
| JPMorgan Chase & Co. | 6.10% (3 Mo. LIBOR + 3.33% | )# | – | (f) | 12,752 | 13,461,330 | ||||||
| Kookmin Bank (South Korea)†(d) | 1.75% | 5/4/2025 | 22,600 | 22,812,682 | ||||||||
| Macquarie Bank Ltd. (United Kingdom)†(d) | 6.125% (USD 5 Yr. Swap rate + 3.70% | )# | – | (f) | 42,384 | 45,262,509 | ||||||
| Morgan Stanley | 3.125% | 7/27/2026 | 18,976 | 20,121,158 | ||||||||
| Popular, Inc. | 6.125% | 9/14/2023 | 15,922 | 16,961,707 | ||||||||
| See Notes to Financial Statements. | 21 |
Schedule of Investments (continued)
December 31, 2021
| Investments | Interest Rate | Maturity Date | Principal Amount (000) | Fair Value | ||||||||
| Banks (continued) | ||||||||||||
| SVB Financial Group | 3.125% | 6/5/2030 | $ | 19,534 | $ | 20,523,928 | ||||||
| SVB Financial Group | 4.10% (10 Yr. Treasury CMT + 3.06% | )# | – | (f) | 38,763 | 38,530,422 | ||||||
| SVB Financial Group | 4.25% (5 Yr. Treasury CMT + 3.07% | )# | – | (f) | 39,258 | 39,881,221 | ||||||
| UniCredit SpA (Italy)†(d) | 5.459% (5 Yr. Treasury CMT + 4.75% | )# | 6/30/2035 | 10,631 | 11,594,852 | |||||||
| UniCredit SpA (Italy)†(d) | 5.861% (USD ICE 5 Yr. Swap rate + 3.70% | )# | 6/19/2032 | 27,137 | 29,791,845 | |||||||
| United Overseas Bank Ltd. (Singapore)†(d) | 2.00% (5 Yr. Treasury CMT + 1.23% | )# | 10/14/2031 | 26,650 | 26,487,905 | |||||||
| US Bancorp | 3.00% | 7/30/2029 | 13,452 | 14,220,694 | ||||||||
| Webster Financial Corp. | 4.10% | 3/25/2029 | 27,684 | 30,407,257 | ||||||||
| Western Alliance Bancorp | 3.00% (SOFR + 2.25% | )# | 6/15/2031 | 17,415 | 17,731,930 | |||||||
| Total | 1,121,139,380 | |||||||||||
| Beverages 0.45% | ||||||||||||
| Bacardi Ltd.† | 2.75% | 7/15/2026 | 23,151 | 23,828,908 | ||||||||
| Bacardi Ltd.† | 4.70% | 5/15/2028 | 32,381 | 36,653,112 | ||||||||
| Brown-Forman Corp. | 4.50% | 7/15/2045 | 18,174 | 23,303,540 | ||||||||
| Suntory Holdings Ltd. (Japan)†(d) | 2.25% | 10/16/2024 | 44,835 | 45,731,611 | ||||||||
| Total | 129,517,171 | |||||||||||
| Biotechnology 0.07% | ||||||||||||
| Regeneron Pharmaceuticals, Inc. | 2.80% | 9/15/2050 | 22,574 | 21,217,585 | ||||||||
| Building Materials 0.77% | ||||||||||||
| Builders FirstSource, Inc.† | 4.25% | 2/1/2032 | 40,496 | 41,994,757 | ||||||||
| Carrier Global Corp. | 2.70% | 2/15/2031 | 25,447 | 25,877,274 | ||||||||
| Masonite International Corp.† | 5.375% | 2/1/2028 | 15,053 | 15,808,134 | ||||||||
| Owens Corning, Inc. | 4.30% | 7/15/2047 | 26,681 | 30,613,216 | ||||||||
| Owens Corning, Inc. | 4.40% | 1/30/2048 | 15,778 | 18,523,455 | ||||||||
| SRM Escrow Issuer LLC† | 6.00% | 11/1/2028 | 11,365 | 12,149,810 | ||||||||
| Standard Industries, Inc.† | 3.375% | 1/15/2031 | 25,287 | 24,401,955 | ||||||||
| Standard Industries, Inc.† | 4.375% | 7/15/2030 | 20,176 | 20,625,521 | ||||||||
| Vulcan Materials Co. | 4.50% | 6/15/2047 | 24,595 | 30,274,085 | ||||||||
| Total | 220,268,207 | |||||||||||
| 22 | See Notes to Financial Statements. |
Schedule of Investments (continued)
December 31, 2021
| Investments | Interest Rate | Maturity Date | Principal Amount (000) | Fair Value | ||||||||
| Chemicals 1.06% | ||||||||||||
| Braskem Idesa SAPI (Mexico)†(d) | 6.99% | 2/20/2032 | $ | 22,528 | $ | 22,649,651 | ||||||
| CF Industries, Inc.† | 4.50% | 12/1/2026 | 23,920 | 26,681,163 | ||||||||
| Chemours Co. (The)† | 5.75% | 11/15/2028 | 21,661 | 22,703,327 | ||||||||
| EverArc Escrow Sarl (Luxembourg)†(d) | 5.00% | 10/30/2029 | 28,683 | 28,747,393 | ||||||||
| FMC Corp. | 3.45% | 10/1/2029 | 13,468 | 14,355,172 | ||||||||
| Ingevity Corp.† | 3.875% | 11/1/2028 | 24,547 | 23,939,830 | ||||||||
| NOVA Chemicals Corp. (Canada)†(d) | 4.25% | 5/15/2029 | 27,282 | 27,433,142 | ||||||||
| OCP SA (Morocco)†(d) | 3.75% | 6/23/2031 | 38,159 | 37,191,288 | ||||||||
| Rain CII Carbon LLC/CII Carbon Corp.† | 7.25% | 4/1/2025 | 16,648 | 17,037,230 | ||||||||
| SCIH Salt Holdings, Inc.† | 4.875% | 5/1/2028 | 35,878 | 34,499,029 | ||||||||
| SCIH Salt Holdings, Inc.† | 6.625% | 5/1/2029 | 16,314 | 15,276,511 | ||||||||
| Sociedad Quimica y Minera de Chile SA (Chile)†(d) | 3.50% | 9/10/2051 | 32,028 | 31,073,406 | ||||||||
| Total | 301,587,142 | |||||||||||
| Coal 0.11% | ||||||||||||
| Warrior Met Coal, Inc.† | 7.875% | 12/1/2028 | 30,754 | 31,566,059 | ||||||||
| Commercial Services 2.18% | ||||||||||||
| Adani Ports & Special Economic Zone Ltd. (India)†(d) | 3.828% | 2/2/2032 | 27,442 | 27,266,586 | ||||||||
| Adani Ports & Special Economic Zone Ltd. (India)†(d) | 4.375% | 7/3/2029 | 35,831 | 37,419,854 | ||||||||
| Ahern Rentals, Inc.† | 7.375% | 5/15/2023 | 20,365 | 19,474,031 | ||||||||
| Avis Budget Car Rental LLC/Avis Budget Finance, Inc.† | 4.75% | 4/1/2028 | 16,878 | 17,282,903 | ||||||||
| Avis Budget Car Rental LLC/Avis Budget Finance, Inc.† | 5.375% | 3/1/2029 | 39,452 | 41,672,753 | ||||||||
| Brink’s Co. (The)† | 4.625% | 10/15/2027 | 27,395 | 28,247,943 | ||||||||
| Cleveland Clinic Foundation (The) | 4.858% | 1/1/2114 | 20,223 | 30,270,651 | ||||||||
| CoStar Group, Inc.† | 2.80% | 7/15/2030 | 17,267 | 17,291,481 | ||||||||
| Georgetown University (The) | 2.943% | 4/1/2050 | 17,968 | 18,121,129 | ||||||||
| Global Payments, Inc. | 2.90% | 5/15/2030 | 41,296 | 42,092,123 | ||||||||
| Global Payments, Inc. | 4.15% | 8/15/2049 | 22,442 | 25,667,158 | ||||||||
| Hertz Corp. (The)† | 4.625% | 12/1/2026 | 14,696 | 14,807,469 | ||||||||
| Hertz Corp. (The)† | 5.00% | 12/1/2029 | 21,211 | 21,267,421 | ||||||||
| Hertz Corp. (The)† | 5.50% | 10/15/2024 | 16,775 | 230,656 | ||||||||
| Hertz Corp. (The)† | 6.00% | 1/15/2028 | 33,436 | 1,253,850 | ||||||||
| ITR Concession Co. LLC† | 5.183% | 7/15/2035 | 7,658 | 8,674,026 | ||||||||
| Johns Hopkins University | 2.813% | 1/1/2060 | 20,869 | 21,457,825 | ||||||||
| Mersin Uluslararasi Liman Isletmeciligi AS (Turkey)†(d) | 5.375% | 11/15/2024 | 30,508 | 30,990,789 | ||||||||
| Metropolitan Museum of Art (The) | 3.40% | 7/1/2045 | 26,471 | 30,201,549 | ||||||||
| Quanta Services, Inc. | 2.90% | 10/1/2030 | 15,040 | 15,312,691 | ||||||||
| See Notes to Financial Statements. | 23 |
Schedule of Investments (continued)
December 31, 2021
| Investments | Interest Rate | Maturity Date | Principal Amount (000) | Fair Value | ||||||||
| Commercial Services (continued) | ||||||||||||
| Square, Inc.† | 3.50% | 6/1/2031 | $ | 45,331 | $ | 46,542,698 | ||||||
| Triton Container International Ltd.† | 2.05% | 4/15/2026 | 31,623 | 31,405,567 | ||||||||
| Triton Container International Ltd.† | 3.15% | 6/15/2031 | 18,102 | 18,275,007 | ||||||||
| United Rentals North America, Inc. | 3.875% | 2/15/2031 | 15,107 | 15,359,589 | ||||||||
| United Rentals North America, Inc. | 4.00% | 7/15/2030 | 21,994 | 22,630,397 | ||||||||
| United Rentals North America, Inc. | 4.875% | 1/15/2028 | 21,596 | 22,731,950 | ||||||||
| Verisk Analytics, Inc. | 3.625% | 5/15/2050 | 15,070 | 16,433,302 | ||||||||
| Total | 622,381,398 | |||||||||||
| Computers 1.39% | ||||||||||||
| Apple, Inc. | 3.00% | 6/20/2027 | 26,927 | 28,870,267 | ||||||||
| CA Magnum Holdings (Mauritius)†(d) | 5.375% | 10/31/2026 | 23,999 | 24,868,964 | ||||||||
| Crowdstrike Holdings, Inc. | 3.00% | 2/15/2029 | 185,638 | 183,606,192 | ||||||||
| Dell International LLC/EMC Corp.† | 3.45% | 12/15/2051 | 36,343 | 34,956,106 | ||||||||
| Presidio Holdings, Inc.† | 4.875% | 2/1/2027 | 16,307 | 16,813,495 | ||||||||
| Teledyne FLIR LLC | 2.50% | 8/1/2030 | 18,054 | 18,114,471 | ||||||||
| Western Digital Corp. | 3.10% | 2/1/2032 | 52,151 | 52,630,528 | ||||||||
| Western Digital Corp. | 4.75% | 2/15/2026 | 32,314 | 35,375,913 | ||||||||
| Total | 395,235,936 | |||||||||||
| Distribution/Wholesale 0.22% | ||||||||||||
| Ferguson Finance plc (United Kingdom)†(d) | 3.25% | 6/2/2030 | 30,527 | 32,122,991 | ||||||||
| H&E Equipment Services, Inc.† | 3.875% | 12/15/2028 | 30,483 | 30,308,485 | ||||||||
| Total | 62,431,476 | |||||||||||
| Diversified Financial Services 2.26% | ||||||||||||
| AerCap Ireland Capital DAC/AerCap Global Aviation Trust (Ireland)(d) | 3.30% | 1/30/2032 | 19,010 | 19,382,795 | ||||||||
| AG Issuer LLC† | 6.25% | 3/1/2028 | 24,203 | 25,144,860 | ||||||||
| Ally Financial, Inc. | 8.00% | 11/1/2031 | 27,043 | 38,326,175 | ||||||||
| Blackstone Holdings Finance Co. LLC† | 2.00% | 1/30/2032 | 31,661 | 30,515,012 | ||||||||
| Blackstone Private Credit Fund† | 2.625% | 12/15/2026 | 36,221 | 35,333,123 | ||||||||
| Blue Owl Finance LLC† | 4.125% | 10/7/2051 | 27,160 | 27,337,582 | ||||||||
| Charles Schwab Corp. (The) | 5.375% (5 Yr. Treasury CMT + 4.97% | )# | – | (f) | 23,820 | 26,023,350 | ||||||
| Coinbase Global, Inc.† | 3.375% | 10/1/2028 | 44,843 | 41,965,425 | ||||||||
| Coinbase Global, Inc.† | 3.625% | 10/1/2031 | 50,108 | 46,190,055 | ||||||||
| Global Aircraft Leasing Co. Ltd. PIK 7.25%† (Cayman Islands)†(d) | 6.50% | 9/15/2024 | 34,976 | 33,109,109 | ||||||||
| 24 | See Notes to Financial Statements. |
Schedule of Investments (continued)
December 31, 2021
| Investments | Interest Rate | Maturity Date | Principal Amount (000) | Fair Value | ||||||||
| Diversified Financial Services (continued) | ||||||||||||
| Hellas Telecommunications Luxembourg II SCA (Luxembourg)†(d)(g) | 6.054% (3 Mo. LIBOR + 5.75 % | )# | 1/15/2015 | $ | 15,000 | $ | 1,500 | (h) | ||||
| Nationstar Mortgage Holdings, Inc.† | 5.125% | 12/15/2030 | 15,239 | 15,070,457 | ||||||||
| Navient Corp. | 4.875% | 3/15/2028 | 19,101 | 19,081,995 | ||||||||
| Navient Corp. | 6.125% | 3/25/2024 | 31,847 | 33,988,870 | ||||||||
| Navient Corp. | 6.75% | 6/25/2025 | 33,898 | 37,321,698 | ||||||||
| Navient Corp. | 6.75% | 6/15/2026 | 22,924 | 25,363,801 | ||||||||
| Neuberger Berman Group LLC/Neuberger Berman Finance Corp.† | 4.875% | 4/15/2045 | 26,061 | 30,952,671 | ||||||||
| OneMain Finance Corp. | 4.00% | 9/15/2030 | 68,238 | 67,217,842 | ||||||||
| OneMain Finance Corp. | 7.125% | 3/15/2026 | 37,963 | 43,333,815 | ||||||||
| PennyMac Financial Services, Inc.† | 4.25% | 2/15/2029 | 3,734 | 3,595,525 | ||||||||
| PennyMac Financial Services, Inc.† | 5.75% | 9/15/2031 | 24,334 | 24,611,529 | ||||||||
| USAA Capital Corp.† | 2.125% | 5/1/2030 | 19,271 | 19,307,308 | ||||||||
| Total | 643,174,497 | |||||||||||
| Electric 2.60% | ||||||||||||
| AES Corp. (The) | 2.45% | 1/15/2031 | 37,063 | 36,149,133 | ||||||||
| Alfa Desarrollo SpA (Chile)†(d) | 4.55% | 9/27/2051 | 33,895 | 33,509,275 | ||||||||
| Atlantic City Electric Co. | 4.00% | 10/15/2028 | 13,493 | 15,093,846 | ||||||||
| Ausgrid Finance Pty Ltd. (Australia)†(d) | 4.35% | 8/1/2028 | 13,786 | 15,455,369 | ||||||||
| Black Hills Corp. | 4.35% | 5/1/2033 | 13,491 | 15,389,074 | ||||||||
| Calpine Corp.† | 3.75% | 3/1/2031 | 22,848 | 22,055,860 | ||||||||
| Calpine Corp.† | 4.625% | 2/1/2029 | 39,661 | 39,175,748 | ||||||||
| Calpine Corp.† | 5.00% | 2/1/2031 | 47,418 | 47,491,261 | ||||||||
| Calpine Corp.† | 5.125% | 3/15/2028 | 19,268 | 19,591,317 | ||||||||
| Clearway Energy Operating LLC† | 4.75% | 3/15/2028 | 23,241 | 24,466,265 | ||||||||
| El Paso Electric Co. | 5.00% | 12/1/2044 | 20,062 | 24,560,787 | ||||||||
| Electricite de France SA (France)†(d) | 3.625% | 10/13/2025 | 13,500 | 14,415,297 | ||||||||
| Electricite de France SA (France)†(d) | 4.50% | 9/21/2028 | 14,507 | 16,412,575 | ||||||||
| Empresa de Transmision Electrica SA (Panama)†(d) | 5.125% | 5/2/2049 | 21,680 | 23,966,156 | ||||||||
| Enel Finance International NV (Netherlands)†(d) | 3.50% | 4/6/2028 | 39,848 | 42,622,242 | ||||||||
| Entergy Arkansas LLC | 4.00% | 6/1/2028 | 18,151 | 20,164,441 | ||||||||
| Entergy Arkansas LLC | 4.95% | 12/15/2044 | 16,883 | 18,516,620 | ||||||||
| FirstEnergy Corp. | 4.40% | 7/15/2027 | 50,740 | 54,690,028 | ||||||||
| Indianapolis Power & Light Co.† | 4.05% | 5/1/2046 | 24,503 | 28,742,962 | ||||||||
| Louisville Gas & Electric Co. | 4.375% | 10/1/2045 | 15,039 | 17,544,030 | ||||||||
| Monongahela Power Co.† | 3.55% | 5/15/2027 | 26,657 | 28,531,358 | ||||||||
| NextEra Energy Operating Partners LP† | 3.875% | 10/15/2026 | 46,654 | 49,531,152 | ||||||||
| See Notes to Financial Statements. | 25 |
Schedule of Investments (continued)
December 31, 2021
| Investments | Interest Rate | Maturity Date | Principal Amount (000) | Fair Value | ||||||||
| Electric (continued) | ||||||||||||
| NextEra Energy Operating Partners LP† | 4.50% | 9/15/2027 | $ | 19,300 | $ | 20,863,300 | ||||||
| NSG Holdings LLC/NSG Holdings, Inc.† | 7.75% | 12/15/2025 | 11,722 | 12,580,054 | ||||||||
| Pattern Energy Operations LP/Pattern Energy Operations, Inc.† | 4.50% | 8/15/2028 | 10,681 | 11,098,200 | ||||||||
| Perusahaan Perseroan Persero PT Perusahaan Listrik Negara (Indonesia)†(d) | 4.875% | 7/17/2049 | 31,878 | 34,197,284 | ||||||||
| Perusahaan Perseroan Persero PT Perusahaan Listrik Negara (Indonesia)†(d) | 5.25% | 10/24/2042 | 7,085 | 7,950,610 | ||||||||
| Puget Energy, Inc. | 4.10% | 6/15/2030 | 26,265 | 28,427,323 | ||||||||
| Union Electric Co. | 2.625% | 3/15/2051 | 17,622 | 16,940,341 | ||||||||
| Total | 740,131,908 | |||||||||||
| Electronics 0.40% | ||||||||||||
| Allegion plc (Ireland)(d) | 3.50% | 10/1/2029 | 11,813 | 12,567,803 | ||||||||
| Amphenol Corp. | 2.05% | 3/1/2025 | 13,443 | 13,706,679 | ||||||||
| Amphenol Corp. | 2.80% | 2/15/2030 | 31,417 | 32,408,754 | ||||||||
| Flex Ltd. | 4.875% | 5/12/2030 | 28,778 | 32,851,882 | ||||||||
| II-VI, Inc.† | 5.00% | 12/15/2029 | 21,193 | 21,686,797 | ||||||||
| Total | 113,221,915 | |||||||||||
| Energy-Alternate Sources 0.43% | ||||||||||||
| TerraForm Power Operating LLC† | 4.75% | 1/15/2030 | 23,615 | 24,792,916 | ||||||||
| TerraForm Power Operating LLC† | 5.00% | 1/31/2028 | 24,169 | 25,634,246 | ||||||||
| Topaz Solar Farms LLC† | 5.75% | 9/30/2039 | 61,305 | 73,159,610 | ||||||||
| Total | 123,586,772 | |||||||||||
| Engineering & Construction 0.36% | ||||||||||||
| Aeropuerto Internacional de Tocumen SA (Panama)†(d) | 5.125% | 8/11/2061 | 32,350 | 33,981,572 | ||||||||
| Cellnex Finance Co. S.A. (Spain)†(d) | 3.875% | 7/7/2041 | 27,082 | 25,940,088 | ||||||||
| Fluor Corp. | 4.25% | 9/15/2028 | 40,545 | 42,587,454 | ||||||||
| Total | 102,509,114 | |||||||||||
| Entertainment 1.78% | ||||||||||||
| Caesars Entertainment, Inc.† | 4.625% | 10/15/2029 | 40,106 | 40,190,022 | ||||||||
| Caesars Entertainment, Inc.† | 8.125% | 7/1/2027 | 62,097 | 68,843,529 | ||||||||
| Caesars Resort Collection LLC/CRC Finco, Inc.† | 5.75% | 7/1/2025 | 13,522 | 14,138,468 | ||||||||
| Churchill Downs, Inc.† | 4.75% | 1/15/2028 | 21,420 | 22,206,435 | ||||||||
| Churchill Downs, Inc.† | 5.50% | 4/1/2027 | 36,639 | 37,774,809 | ||||||||
| Cinemark USA, Inc.† | 5.25% | 7/15/2028 | 25,403 | 24,811,364 | ||||||||
| Live Nation Entertainment, Inc.† | 3.75% | 1/15/2028 | 23,295 | 23,178,525 | ||||||||
| Merlin Entertainments Ltd. (United Kingdom)†(d) | 5.75% | 6/15/2026 | 15,129 | 15,750,726 | ||||||||
| 26 | See Notes to Financial Statements. |
Schedule of Investments (continued)
December 31, 2021
| Investments | Interest Rate | Maturity Date | Principal Amount (000) | Fair Value | ||||||||
| Entertainment (continued) | ||||||||||||
| Midwest Gaming Borrower LLC/Midwest Gaming Finance Corp† | 4.875% | 5/1/2029 | $ | 38,279 | $ | 38,528,579 | ||||||
| Mohegan Gaming & Entertainment† | 7.875% | 10/15/2024 | 21,238 | 22,215,267 | ||||||||
| Mohegan Gaming & Entertainment† | 8.00% | 2/1/2026 | 57,507 | 60,451,071 | ||||||||
| Resorts World Las Vegas LLC/RWLV Capital, Inc.† | 4.625% | 4/16/2029 | 25,600 | 25,781,917 | ||||||||
| Scientific Games International, Inc.† | 7.00% | 5/15/2028 | 24,412 | 26,039,304 | ||||||||
| SeaWorld Parks & Entertainment, Inc.† | 5.25% | 8/15/2029 | 27,181 | 27,718,096 | ||||||||
| WMG Acquisition Corp.† | 3.00% | 2/15/2031 | 22,789 | 21,853,170 | ||||||||
| WMG Acquisition Corp.† | 3.75% | 12/1/2029 | 38,192 | 38,158,582 | ||||||||
| Total | 507,639,864 | |||||||||||
| Environmental Control 0.35% | ||||||||||||
| Madison IAQ LLC† | 4.125% | 6/30/2028 | 40,548 | 40,709,178 | ||||||||
| Madison IAQ LLC† | 5.875% | 6/30/2029 | 27,192 | 27,233,598 | ||||||||
| Waste Pro USA, Inc.† | 5.50% | 2/15/2026 | 31,999 | 31,872,284 | ||||||||
| Total | 99,815,060 | |||||||||||
| Food 2.10% | ||||||||||||
| Albertsons Cos, Inc./Safeway, Inc./New Albertsons LP/Albertsons LLC† | 4.625% | 1/15/2027 | 10,224 | 10,741,028 | ||||||||
| Albertsons Cos, Inc./Safeway, Inc./New Albertsons LP/Albertsons LLC† | 4.875% | 2/15/2030 | 51,071 | 55,221,029 | ||||||||
| Albertsons Cos., Inc./Safeway, Inc./New Albertsons LP/Albertsons LLC† | 3.50% | 3/15/2029 | 60,406 | 60,628,898 | ||||||||
| Arcor SAIC (Argentina)†(d) | 6.00% | 7/6/2023 | 9,286 | 9,156,460 | ||||||||
| Chobani LLC/Chobani Finance Corp., Inc.† | 7.50% | 4/15/2025 | 25,074 | 25,839,885 | ||||||||
| FAGE International SA/FAGE USA Dairy Industry, Inc. (Luxembourg)†(d) | 5.625% | 8/15/2026 | 13,900 | 14,261,609 | ||||||||
| JBS USA LUX SA/JBS USA Finance, Inc.† | 6.75% | 2/15/2028 | 50,781 | 54,865,824 | ||||||||
| Kraft Heinz Foods Co. | 4.375% | 6/1/2046 | 72,003 | 84,499,094 | ||||||||
| Kraft Heinz Foods Co. | 4.875% | 10/1/2049 | 84,081 | 105,823,740 | ||||||||
| Kraft Heinz Foods Co. | 5.00% | 6/4/2042 | 28,714 | 35,796,725 | ||||||||
| Kraft Heinz Foods Co. | 5.20% | 7/15/2045 | 20,277 | 25,841,565 | ||||||||
| McCormick & Co., Inc. | 2.50% | 4/15/2030 | 15,431 | 15,625,866 | ||||||||
| McCormick & Co., Inc. | 4.20% | 8/15/2047 | 21,326 | 25,668,506 | ||||||||
| SEG Holding LLC/SEG Finance Corp.† | 5.625% | 10/15/2028 | 22,666 | 23,776,067 | ||||||||
| Smithfield Foods, Inc.† | 5.20% | 4/1/2029 | 28,272 | 32,321,334 | ||||||||
| Sysco Corp. | 2.40% | 2/15/2030 | 17,926 | 17,994,736 | ||||||||
| Total | 598,062,366 | |||||||||||
| See Notes to Financial Statements. | 27 |
Schedule of Investments (continued)
December 31, 2021
| Investments | Interest Rate | Maturity Date | Principal Amount (000) | Fair Value | ||||||||
| Gas 0.07% | ||||||||||||
| Brooklyn Union Gas Co. (The)† | 3.407% | 3/10/2026 | $ | 18,916 | $ | 19,909,935 | ||||||
| Health Care-Products 0.37% | ||||||||||||
| Alcon Finance Corp.† | 2.60% | 5/27/2030 | 23,575 | 23,818,148 | ||||||||
| Boston Scientific Corp. | 6.75% | 11/15/2035 | 16,135 | 22,415,649 | ||||||||
| Edwards Lifesciences Corp. | 4.30% | 6/15/2028 | 20,927 | 23,531,541 | ||||||||
| Mozart Debt Merger Sub, Inc.† | 3.875% | 4/1/2029 | 35,514 | 35,459,663 | ||||||||
| Total | 105,225,001 | |||||||||||
| Health Care-Services 2.57% | ||||||||||||
| Anthem, Inc. | 2.25% | 5/15/2030 | 26,990 | 26,923,024 | ||||||||
| Catalent Pharma Solutions, Inc.† | 3.125% | 2/15/2029 | 28,864 | 28,512,869 | ||||||||
| Centene Corp. | 2.50% | 3/1/2031 | 23,806 | 23,215,135 | ||||||||
| Centene Corp. | 3.00% | 10/15/2030 | 24,346 | 24,790,071 | ||||||||
| Centene Corp. | 4.625% | 12/15/2029 | 31,215 | 33,718,131 | ||||||||
| Charles River Laboratories International, Inc.† | 3.75% | 3/15/2029 | 22,666 | 22,925,186 | ||||||||
| Hadrian Merger Sub, Inc.† | 8.50% | 5/1/2026 | 24,836 | 25,667,385 | ||||||||
| HCA, Inc. | 5.50% | 6/15/2047 | 78,221 | 102,601,003 | ||||||||
| HCA, Inc. | 7.69% | 6/15/2025 | 12,776 | 15,108,738 | ||||||||
| Kaiser Foundation Hospitals | 4.15% | 5/1/2047 | 17,628 | 21,784,695 | ||||||||
| Legacy LifePoint Health LLC† | 4.375% | 2/15/2027 | 35,115 | 35,415,936 | ||||||||
| Memorial Sloan-Kettering Cancer Center | 4.20% | 7/1/2055 | 28,034 | 35,549,638 | ||||||||
| Molina Healthcare, Inc.† | 3.875% | 11/15/2030 | 18,940 | 19,677,429 | ||||||||
| Montefiore Obligated Group | 5.246% | 11/1/2048 | 18,042 | 19,591,659 | ||||||||
| Mount Sinai Hospitals Group, Inc. | 3.737% | 7/1/2049 | 21,163 | 23,086,007 | ||||||||
| New York & Presbyterian Hospital (The) | 4.063% | 8/1/2056 | 16,078 | 20,835,764 | ||||||||
| NYU Langone Hospitals | 4.368% | 7/1/2047 | 12,348 | 14,393,277 | ||||||||
| Providence St. Joseph Health Obligated Group | 2.532% | 10/1/2029 | 14,960 | 15,448,669 | ||||||||
| Quest Diagnostics, Inc. | 2.80% | 6/30/2031 | 13,505 | 13,961,147 | ||||||||
| Rede D’or Finance Sarl (Luxembourg)†(d) | 4.95% | 1/17/2028 | 20,352 | 20,723,729 | ||||||||
| RegionalCare Hospital Partners Holdings, Inc./LifePoint Health, Inc.† | 9.75% | 12/1/2026 | 20,282 | 21,457,849 | ||||||||
| Seattle Children’s Hospital | 2.719% | 10/1/2050 | 18,062 | 17,756,850 | ||||||||
| Tenet Healthcare Corp.† | 4.875% | 1/1/2026 | 19,784 | 20,351,108 | ||||||||
| Tenet Healthcare Corp.† | 6.125% | 10/1/2028 | 36,407 | 38,527,890 | ||||||||
| Tenet Healthcare Corp.† | 6.25% | 2/1/2027 | 42,711 | 44,263,760 | ||||||||
| Tenet Healthcare Corp. | 6.75% | 6/15/2023 | 19,692 | 21,069,652 | ||||||||
| Universal Health Services, Inc.† | 2.65% | 1/15/2032 | 27,147 | 26,706,939 | ||||||||
| Total | 734,063,540 | |||||||||||
| 28 | See Notes to Financial Statements. |
Schedule of Investments (continued)
December 31, 2021
| Investments | Interest Rate | Maturity Date | Principal Amount (000) | Fair Value | ||||||||
| Home Builders 0.40% | ||||||||||||
| Beazer Homes USA, Inc. | 7.25% | 10/15/2029 | $ | 15,808 | $ | 17,644,415 | ||||||
| NVR, Inc. | 3.00% | 5/15/2030 | 51,660 | 53,737,835 | ||||||||
| PulteGroup, Inc. | 6.375% | 5/15/2033 | 21,316 | 27,747,464 | ||||||||
| Toll Brothers Finance Corp. | 4.875% | 3/15/2027 | 12,916 | 14,462,691 | ||||||||
| Total | 113,592,405 | |||||||||||
| Home Furnishings 0.12% | ||||||||||||
| Leggett & Platt, Inc. | 4.40% | 3/15/2029 | 31,431 | 35,213,389 | ||||||||
| Household Products/Wares 0.08% | ||||||||||||
| SC Johnson & Son, Inc.† | 4.75% | 10/15/2046 | 17,621 | 23,509,656 | ||||||||
| Housewares 0.29% | ||||||||||||
| Newell Brands, Inc. | 4.70% | 4/1/2026 | 58,683 | 64,068,926 | ||||||||
| Newell Brands, Inc. | 5.875% | 4/1/2036 | 15,478 | 19,097,994 | ||||||||
| Total | 83,166,920 | |||||||||||
| Insurance 1.22% | ||||||||||||
| AIA Group Ltd. (Hong Kong)†(d) | 3.20% | 9/16/2040 | 18,831 | 19,379,754 | ||||||||
| AIA Group Ltd. (Hong Kong)†(d) | 3.375% | 4/7/2030 | 17,824 | 19,286,180 | ||||||||
| Arch Capital Finance LLC | 4.011% | 12/15/2026 | 13,319 | 14,624,106 | ||||||||
| Assurant, Inc. | 2.65% | 1/15/2032 | 30,158 | 29,617,616 | ||||||||
| Assurant, Inc. | 3.70% | 2/22/2030 | 14,558 | 15,467,393 | ||||||||
| AXIS Specialty Finance plc (United Kingdom)(d) | 5.15% | 4/1/2045 | 21,094 | 25,696,782 | ||||||||
| Brown & Brown, Inc. | 2.375% | 3/15/2031 | 22,560 | 22,002,005 | ||||||||
| Farmers Insurance Exchange† | 4.747% (3 Mo. LIBOR + 3.23% | )# | 11/1/2057 | 15,790 | 18,272,497 | |||||||
| Fidelity National Financial, Inc. | 4.50% | 8/15/2028 | 26,914 | 30,443,123 | ||||||||
| Northwestern Mutual Life Insurance Co. (The)† | 3.85% | 9/30/2047 | 28,610 | 32,385,657 | ||||||||
| PartnerRe Finance B LLC | 3.70% | 7/2/2029 | 26,944 | 29,377,928 | ||||||||
| Selective Insurance Group, Inc. | 5.375% | 3/1/2049 | 19,241 | 25,441,950 | ||||||||
| Teachers Insurance & Annuity Association of America† | 4.27% | 5/15/2047 | 17,804 | 21,573,376 | ||||||||
| Teachers Insurance & Annuity Association of America† | 4.90% | 9/15/2044 | 12,705 | 16,361,178 | ||||||||
| Transatlantic Holdings, Inc. | 8.00% | 11/30/2039 | 17,809 | 28,062,082 | ||||||||
| Total | 347,991,627 | |||||||||||
| Internet 2.82% | ||||||||||||
| Alibaba Group Holding Ltd. (China)(d) | 2.125% | 2/9/2031 | 69,673 | 67,335,642 | ||||||||
| See Notes to Financial Statements. | 29 |
Schedule of Investments (continued)
December 31, 2021
| Investments | Interest Rate | Maturity Date | Principal Amount (000) | Fair Value | ||||||||
| Internet (continued) | ||||||||||||
| Amazon.com, Inc. | 3.15% | 8/22/2027 | $ | 28,837 | $ | 31,165,080 | ||||||
| Amazon.com, Inc. | 4.25% | 8/22/2057 | 20,632 | 26,494,239 | ||||||||
| Amazon.com, Inc. | 4.80% | 12/5/2034 | 28,691 | 36,695,911 | ||||||||
| Amazon.com, Inc. | 5.20% | 12/3/2025 | 53,869 | 61,348,341 | ||||||||
| Arches Buyer, Inc.† | 4.25% | 6/1/2028 | 23,790 | 23,820,689 | ||||||||
| Arches Buyer, Inc.† | 6.125% | 12/1/2028 | 22,666 | 22,839,395 | ||||||||
| Go Daddy Operating Co. LLC/GD Finance Co., Inc.† | 5.25% | 12/1/2027 | 24,475 | 25,335,663 | ||||||||
| GrubHub Holdings, Inc.† | 5.50% | 7/1/2027 | 14,272 | 14,186,368 | ||||||||
| Match Group Holdings II LLC† | 4.125% | 8/1/2030 | 50,236 | 50,810,448 | ||||||||
| Netflix, Inc.(b) | 3.625% | 5/15/2027 | EUR | 65,197 | 85,381,260 | |||||||
| Netflix, Inc.†(b) | 3.625% | 6/15/2030 | EUR | 13,504 | 18,353,561 | |||||||
| Netflix, Inc. | 4.875% | 4/15/2028 | $ | 41,959 | 47,905,639 | |||||||
| Netflix, Inc.† | 4.875% | 6/15/2030 | 33,484 | 39,108,475 | ||||||||
| Netflix, Inc.† | 5.375% | 11/15/2029 | 19,637 | 23,352,517 | ||||||||
| Tencent Holdings Ltd. (China)†(d) | 3.595% | 1/19/2028 | 25,479 | 27,065,986 | ||||||||
| Tencent Holdings Ltd. (China)†(d) | 3.925% | 1/19/2038 | 51,079 | 54,379,263 | ||||||||
| Uber Technologies, Inc.† | 4.50% | 8/15/2029 | 46,882 | 47,829,720 | ||||||||
| Uber Technologies, Inc.† | 6.25% | 1/15/2028 | 18,570 | 19,960,707 | ||||||||
| Uber Technologies, Inc.† | 8.00% | 11/1/2026 | 20,289 | 21,637,914 | ||||||||
| VeriSign, Inc. | 2.70% | 6/15/2031 | 11,907 | 11,983,622 | ||||||||
| VeriSign, Inc. | 4.75% | 7/15/2027 | 13,815 | 14,366,011 | ||||||||
| Weibo Corp. (China)(d) | 3.375% | 7/8/2030 | 31,846 | 31,568,171 | ||||||||
| Total | 802,924,622 | |||||||||||
| Investment Companies 0.11% | ||||||||||||
| Temasek Financial I Ltd. (Singapore)†(d) | 2.50% | 10/6/2070 | 32,855 | 30,729,480 | ||||||||
| Iron-Steel 0.32% | ||||||||||||
| Baffinland Iron Mines Corp./Baffinland Iron Mines LP (Canada)†(d) | 8.75% | 7/15/2026 | 18,211 | 18,958,380 | ||||||||
| CSN Resources SA (Brazil)†(d) | 4.625% | 6/10/2031 | 25,368 | 24,174,055 | ||||||||
| United States Steel Corp. | 6.875% | 3/1/2029 | 44,615 | 48,088,724 | ||||||||
| Total | 91,221,159 | |||||||||||
| Leisure Time 1.10% | ||||||||||||
| Carnival Corp.† | 4.00% | 8/1/2028 | 68,824 | 68,447,877 | ||||||||
| Carnival Corp.† | 5.75% | 3/1/2027 | 33,388 | 33,438,082 | ||||||||
| Carnival Corp.† | 9.875% | 8/1/2027 | 18,736 | 21,429,300 | ||||||||
| Life Time, Inc.† | 5.75% | 1/15/2026 | 47,298 | 49,009,005 | ||||||||
| NCL Corp. Ltd.† | 5.875% | 3/15/2026 | 47,133 | 46,985,709 | ||||||||
| Pinnacle Bidco plc†(b) | 5.50% | 2/15/2025 | EUR | 18,919 | 22,063,174 | |||||||
| 30 | See Notes to Financial Statements. |
Schedule of Investments (continued)
December 31, 2021
| Investments | Interest Rate | Maturity Date | Principal Amount (000) | Fair Value | ||||||||
| Leisure Time (continued) | ||||||||||||
| Royal Caribbean Cruises Ltd. | 3.70% | 3/15/2028 | $ | 25,345 | $ | 23,794,900 | ||||||
| Royal Caribbean Cruises Ltd.† | 9.125% | 6/15/2023 | 22,649 | 23,979,742 | ||||||||
| Royal Caribbean Cruises Ltd.† | 11.50% | 6/1/2025 | 21,054 | 23,607,114 | ||||||||
| Total | 312,754,903 | |||||||||||
| Lodging 0.71% | ||||||||||||
| Boyd Gaming Corp. | 4.75% | 12/1/2027 | 25,833 | 26,395,772 | ||||||||
| Genting New York LLC/GENNY Capital, Inc.† | 3.30% | 2/15/2026 | 22,980 | 22,778,178 | ||||||||
| Hilton Domestic Operating Co., Inc. | 4.875% | 1/15/2030 | 36,017 | 38,548,635 | ||||||||
| Marriott International, Inc. | 3.50% | 10/15/2032 | 27,083 | 28,401,928 | ||||||||
| Travel + Leisure Co. | 6.00% | 4/1/2027 | 24,188 | 26,377,498 | ||||||||
| Wynn Las Vegas LLC/Wynn Las Vegas Capital Corp.† | 5.25% | 5/15/2027 | 24,798 | 25,379,389 | ||||||||
| Wynn Las Vegas LLC/Wynn Las Vegas Capital Corp.† | 5.50% | 3/1/2025 | 32,800 | 33,828,280 | ||||||||
| Total | 201,709,680 | |||||||||||
| Machinery: Construction & Mining 0.09% | ||||||||||||
| Terex Corp.† | 5.00% | 5/15/2029 | 24,472 | 25,182,177 | ||||||||
| Machinery-Diversified 0.38% | ||||||||||||
| Dover Corp. | 2.95% | 11/4/2029 | 17,664 | 18,666,202 | ||||||||
| IDEX Corp. | 3.00% | 5/1/2030 | 16,199 | 16,858,291 | ||||||||
| nVent Finance Sarl (Luxembourg)(d) | 2.75% | 11/15/2031 | 18,081 | 18,025,722 | ||||||||
| TK Elevator Holdco GmbH†(b) | 6.625% | 7/15/2028 | EUR | 9,453 | 11,386,074 | |||||||
| Westinghouse Air Brake Technologies Corp. | 3.45% | 11/15/2026 | $ | 17,989 | 19,045,671 | |||||||
| Xylem, Inc. | 3.25% | 11/1/2026 | 23,531 | 25,149,701 | ||||||||
| Total | 109,131,661 | |||||||||||
| Media 1.31% | ||||||||||||
| AMC Networks, Inc. | 4.75% | 8/1/2025 | 27,032 | 27,639,814 | ||||||||
| Cable Onda SA (Panama)†(d) | 4.50% | 1/30/2030 | 24,283 | 24,969,602 | ||||||||
| Cable One, Inc.† | 4.00% | 11/15/2030 | 34,910 | 34,264,689 | ||||||||
| Clear Channel Worldwide Holdings, Inc.† | 5.125% | 8/15/2027 | 18,997 | 19,680,892 | ||||||||
| Diamond Sports Group LLC/Diamond Sports | ||||||||||||
| Finance Co.† | 5.375% | 8/15/2026 | 39,006 | 19,547,857 | ||||||||
| Gray Escrow II, Inc.† | 5.375% | 11/15/2031 | 38,090 | 39,253,459 | ||||||||
| LCPR Senior Secured Financing DAC (Ireland)†(d) | 6.75% | 10/15/2027 | 13,567 | 14,258,917 | ||||||||
| News Corp.† | 3.875% | 5/15/2029 | 29,380 | 29,724,627 | ||||||||
| Nexstar Media, Inc.† | 4.75% | 11/1/2028 | 25,397 | 25,919,543 | ||||||||
| Nexstar Media, Inc.† | 5.625% | 7/15/2027 | 23,661 | 24,971,938 | ||||||||
| Radiate Holdco LLC/Radiate Finance, Inc.† | 4.50% | 9/15/2026 | 10,439 | 10,556,126 | ||||||||
| Radiate Holdco LLC/Radiate Finance, Inc.† | 6.50% | 9/15/2028 | 22,978 | 23,117,017 | ||||||||
| See Notes to Financial Statements. | 31 |
Schedule of Investments (continued)
December 31, 2021
| Investments | Interest Rate | Maturity Date | Principal Amount (000) | Fair Value | ||||||||
| Media (continued) | ||||||||||||
| UPC Broadband Finco BV (Netherlands)†(d) | 4.875% | 7/15/2031 | $ | 54,021 | $ | 55,188,664 | ||||||
| Urban One, Inc.† | 7.375% | 2/1/2028 | 22,601 | 23,311,914 | ||||||||
| Total | 372,405,059 | |||||||||||
| Metal Fabricate-Hardware 0.10% | ||||||||||||
| Roller Bearing Co. of America, Inc.† | 4.375% | 10/15/2029 | 29,284 | 29,906,285 | ||||||||
| Mining 1.55% | ||||||||||||
| Alcoa Nederland Holding BV (Netherlands)†(d) | 4.125% | 3/31/2029 | 32,661 | 33,687,699 | ||||||||
| Anglo American Capital plc (United Kingdom)†(d) | 3.95% | 9/10/2050 | 18,109 | 19,273,171 | ||||||||
| Anglo American Capital plc (United Kingdom)†(d) | 5.625% | 4/1/2030 | 17,340 | 20,562,244 | ||||||||
| Corp. Nacional del Cobre de Chile (Chile)†(d) | 3.75% | 1/15/2031 | 16,720 | 17,836,869 | ||||||||
| FMG Resources August 2006 Pty Ltd. (Australia)†(d) | 4.375% | 4/1/2031 | 85,126 | 89,529,568 | ||||||||
| Freeport-McMoRan, Inc. | 4.125% | 3/1/2028 | 19,839 | 20,611,431 | ||||||||
| Freeport-McMoRan, Inc. | 4.25% | 3/1/2030 | 31,315 | 33,082,262 | ||||||||
| Freeport-McMoRan, Inc. | 4.375% | 8/1/2028 | 17,287 | 18,154,548 | ||||||||
| Freeport-McMoRan, Inc. | 4.625% | 8/1/2030 | 20,241 | 21,742,073 | ||||||||
| Freeport-McMoRan, Inc. | 5.25% | 9/1/2029 | 26,700 | 29,281,489 | ||||||||
| Glencore Funding LLC† | 3.875% | 4/27/2051 | 18,133 | 18,986,511 | ||||||||
| Hecla Mining Co. | 7.25% | 2/15/2028 | 17,694 | 18,981,946 | ||||||||
| Kaiser Aluminum Corp.† | 4.50% | 6/1/2031 | 29,542 | 29,106,699 | ||||||||
| Mirabela Nickel Ltd. | 1.00% | 9/10/2044 | 185 | 19 | (h) | |||||||
| Newmont Corp. | 2.25% | 10/1/2030 | 31,484 | 31,078,996 | ||||||||
| Novelis Corp.† | 4.75% | 1/30/2030 | 27,118 | 28,554,712 | ||||||||
| Teck Resources Ltd. (Canada)(d) | 3.90% | 7/15/2030 | 10,828 | 11,646,112 | ||||||||
| Total | 442,116,349 | |||||||||||
| Office/Business Equipment 0.10% | ||||||||||||
| CDW LLC/CDW Finance Corp. | 3.569% | 12/1/2031 | 27,258 | 28,409,923 | ||||||||
| Oil & Gas 8.52% | ||||||||||||
| Antero Resources Corp.† | 5.375% | 3/1/2030 | 22,664 | 24,266,005 | ||||||||
| Apache Corp. | 4.25% | 1/15/2030 | 56,277 | 61,152,558 | ||||||||
| Apache Corp. | 4.375% | 10/15/2028 | 25,022 | 27,259,592 | ||||||||
| Apache Corp. | 4.75% | 4/15/2043 | 12,369 | 13,605,962 | ||||||||
| Apache Corp. | 5.10% | 9/1/2040 | 32,064 | 36,282,981 | ||||||||
| California Resources Corp.† | 7.125% | 2/1/2026 | 33,958 | 35,319,886 | ||||||||
| Callon Petroleum Co. | 6.125% | 10/1/2024 | 19,780 | 19,503,871 | ||||||||
| Callon Petroleum Co. | 6.375% | 7/1/2026 | 39,782 | 37,834,273 | ||||||||
| Callon Petroleum Co.† | 8.00% | 8/1/2028 | 35,941 | 36,351,446 | ||||||||
| Cenovus Energy, Inc. (Canada)(d) | 2.65% | 1/15/2032 | 15,162 | 14,850,859 | ||||||||
| 32 | See Notes to Financial Statements. |
Schedule of Investments (continued)
December 31, 2021
| Investments | Interest Rate | Maturity Date | Principal Amount (000) | Fair Value | ||||||||
| Oil & Gas (continued) | ||||||||||||
| Cenovus Energy, Inc. (Canada)(d) | 3.75% | 2/15/2052 | $ | 16,297 | $ | 16,374,428 | ||||||
| Cenovus Energy, Inc. (Canada)(d) | 5.40% | 6/15/2047 | 50,417 | 62,912,053 | ||||||||
| Centennial Resource Production LLC† | 5.375% | 1/15/2026 | 31,260 | 30,742,647 | ||||||||
| Centennial Resource Production LLC† | 6.875% | 4/1/2027 | 59,083 | 60,323,743 | ||||||||
| Comstock Resources, Inc.† | 5.875% | 1/15/2030 | 25,400 | 26,077,037 | ||||||||
| Comstock Resources, Inc.† | 6.75% | 3/1/2029 | 21,722 | 23,596,826 | ||||||||
| Continental Resources, Inc. | 4.375% | 1/15/2028 | 24,755 | 26,804,219 | ||||||||
| Continental Resources, Inc.† | 5.75% | 1/15/2031 | 34,812 | 41,053,792 | ||||||||
| CrownRock LP/CrownRock Finance, Inc.† | 5.00% | 5/1/2029 | 22,690 | 23,575,364 | ||||||||
| Diamondback Energy, Inc. | 3.50% | 12/1/2029 | 41,408 | 43,954,546 | ||||||||
| Diamondback Energy, Inc. | 4.40% | 3/24/2051 | 55,492 | 63,749,867 | ||||||||
| Encino Acquisition Partners Holdings LLC† | 8.50% | 5/1/2028 | 24,502 | 25,486,245 | ||||||||
| Endeavor Energy Resources LP/EER Finance, Inc.† | 5.75% | 1/30/2028 | 32,182 | 34,354,285 | ||||||||
| EQT Corp.† | 3.625% | 5/15/2031 | 12,175 | 12,650,495 | ||||||||
| EQT Corp. | 6.625% | 2/1/2025 | 28,591 | 32,272,663 | ||||||||
| Exxon Mobil Corp. | 3.043% | 3/1/2026 | 23,752 | 25,150,854 | ||||||||
| Helmerich & Payne, Inc.† | 2.90% | 9/29/2031 | 34,825 | 34,213,507 | ||||||||
| Hilcorp Energy I LP/Hilcorp Finance Co.† | 5.75% | 2/1/2029 | 19,006 | 19,616,568 | ||||||||
| Hilcorp Energy I LP/Hilcorp Finance Co.† | 6.00% | 2/1/2031 | 26,585 | 27,548,706 | ||||||||
| Hilcorp Energy I LP/Hilcorp Finance Co.† | 6.25% | 11/1/2028 | 21,789 | 22,936,300 | ||||||||
| Kosmos Energy Ltd.† | 7.75% | 5/1/2027 | 27,286 | 26,104,516 | ||||||||
| Laredo Petroleum, Inc.† | 7.75% | 7/31/2029 | 22,572 | 22,039,414 | ||||||||
| Laredo Petroleum, Inc. | 10.125% | 1/15/2028 | 70,788 | 74,325,984 | ||||||||
| Lukoil Capital DAC (Ireland)†(d) | 3.60% | 10/26/2031 | 35,271 | 34,422,203 | ||||||||
| Lukoil Securities BV (Netherlands)†(d) | 3.875% | 5/6/2030 | 45,000 | 45,901,350 | ||||||||
| Matador Resources Co. | 5.875% | 9/15/2026 | 28,043 | 28,922,288 | ||||||||
| MC Brazil Downstream Trading Sarl (Luxembourg)†(d) | 7.25% | 6/30/2031 | 29,276 | 29,194,174 | ||||||||
| Murphy Oil Corp. | 5.875% | 12/1/2027 | 20,084 | 20,768,162 | ||||||||
| Murphy Oil Corp. | 6.375% | 7/15/2028 | 28,679 | 30,524,780 | ||||||||
| Occidental Petroleum Corp. | 3.50% | 8/15/2029 | 58,245 | 59,935,852 | ||||||||
| Occidental Petroleum Corp. | 4.10% | 2/15/2047 | 16,190 | 15,890,728 | ||||||||
| Occidental Petroleum Corp. | 4.30% | 8/15/2039 | 11,697 | 11,682,788 | ||||||||
| Occidental Petroleum Corp. | 4.40% | 8/15/2049 | 27,212 | 27,593,377 | ||||||||
| Occidental Petroleum Corp. | 6.125% | 1/1/2031 | 98,708 | 120,096,049 | ||||||||
| Occidental Petroleum Corp. | 6.625% | 9/1/2030 | 20,011 | 24,797,231 | ||||||||
| Occidental Petroleum Corp. | 7.50% | 5/1/2031 | 11,056 | 14,561,194 | ||||||||
| Occidental Petroleum Corp. | 8.875% | 7/15/2030 | 15,000 | 20,255,700 | ||||||||
| OGX Austria GmbH (Brazil)†(d)(g) | 8.50% | 6/1/2018 | 20,000 | 400 | ||||||||
| OQ SAOC (Oman)†(d) | 5.125% | 5/6/2028 | 36,296 | 36,990,597 | ||||||||
| See Notes to Financial Statements. | 33 |
Schedule of Investments (continued)
December 31, 2021
| Investments | Interest Rate | Maturity Date | Principal Amount (000) | Fair Value | ||||||||
| Oil & Gas (continued) | ||||||||||||
| Ovintiv, Inc. | 5.15% | 11/15/2041 | $ | 19,333 | $ | 21,169,625 | ||||||
| Ovintiv, Inc. | 6.50% | 8/15/2034 | 13,421 | 17,293,559 | ||||||||
| Ovintiv, Inc. | 6.50% | 2/1/2038 | 35,742 | 46,451,727 | ||||||||
| Parsley Energy LLC/Parsley Finance Corp.† | 5.625% | 10/15/2027 | 11,076 | 11,356,278 | ||||||||
| Patterson-UTI Energy, Inc. | 3.95% | 2/1/2028 | 23,904 | 24,040,097 | ||||||||
| Patterson-UTI Energy, Inc. | 5.15% | 11/15/2029 | 30,064 | 30,537,862 | ||||||||
| PDC Energy, Inc. | 5.75% | 5/15/2026 | 52,334 | 54,147,635 | ||||||||
| Pertamina Persero PT (Indonesia)†(d) | 4.175% | 1/21/2050 | 28,114 | 29,007,430 | ||||||||
| Pertamina Persero PT (Indonesia)†(d) | 4.70% | 7/30/2049 | 11,884 | 13,004,172 | ||||||||
| Petroleos Mexicanos (Mexico)†(d) | 6.70% | 2/16/2032 | 45,132 | 45,672,456 | ||||||||
| Precision Drilling Corp. (Canada)†(d) | 6.875% | 1/15/2029 | 25,394 | 25,917,751 | ||||||||
| Qatar Petroleum (Qatar)†(d) | 3.30% | 7/12/2051 | 78,408 | 80,997,581 | ||||||||
| Range Resources Corp. | 4.875% | 5/15/2025 | 31,064 | 32,113,653 | ||||||||
| Range Resources Corp. | 5.00% | 3/15/2023 | 16,995 | 17,395,402 | ||||||||
| Range Resources Corp. | 8.25% | 1/15/2029 | 25,079 | 28,006,848 | ||||||||
| Saudi Arabian Oil Co. (Saudi Arabia)†(d) | 4.375% | 4/16/2049 | 30,522 | 35,446,908 | ||||||||
| Shell International Finance BV (Netherlands)(d) | 6.375% | 12/15/2038 | 28,912 | 42,175,435 | ||||||||
| SM Energy Co. | 5.625% | 6/1/2025 | 19,646 | 19,839,906 | ||||||||
| SM Energy Co. | 6.625% | 1/15/2027 | 49,126 | 50,650,871 | ||||||||
| SM Energy Co. | 6.75% | 9/15/2026 | 36,652 | 37,698,049 | ||||||||
| Southwestern Energy Co. | 5.375% | 2/1/2029 | 15,763 | 16,691,677 | ||||||||
| Southwestern Energy Co. | 5.375% | 3/15/2030 | 36,200 | 38,851,288 | ||||||||
| Southwestern Energy Co. | 6.45% | 1/23/2025 | 10,020 | 11,023,854 | ||||||||
| Southwestern Energy Co. | 8.375% | 9/15/2028 | 26,583 | 29,709,958 | ||||||||
| Tengizchevroil Finance Co. International Ltd. (Kazakhstan)†(d) | 3.25% | 8/15/2030 | 26,988 | 27,021,060 | ||||||||
| Texaco Capital, Inc. | 8.625% | 11/15/2031 | 11,023 | 16,605,780 | ||||||||
| Viper Energy Partners LP† | 5.375% | 11/1/2027 | 20,779 | 21,487,980 | ||||||||
| Total | 2,428,143,207 | |||||||||||
| Oil & Gas Services 0.41% | ||||||||||||
| Oceaneering International, Inc. | 4.65% | 11/15/2024 | 17,688 | 17,776,440 | ||||||||
| Oceaneering International, Inc. | 6.00% | 2/1/2028 | 30,959 | 30,417,372 | ||||||||
| TechnipFMC plc (United Kingdom)†(d) | 6.50% | 2/1/2026 | 20,325 | 21,765,467 | ||||||||
| Weatherford International Ltd.† | 8.625% | 4/30/2030 | 45,822 | 47,645,945 | ||||||||
| Total | 117,605,224 | |||||||||||
| Packaging & Containers 1.64% | ||||||||||||
| Ball Corp. | 2.875% | 8/15/2030 | 57,404 | 55,781,189 | ||||||||
| Centene Corp. | 3.375% | 2/15/2030 | 45,763 | 46,680,777 | ||||||||
| 34 | See Notes to Financial Statements. |
Schedule of Investments (continued)
December 31, 2021
| Investments | Interest Rate | Maturity Date | Principal Amount (000) | Fair Value | ||||||||
| Packaging & Containers (continued) | ||||||||||||
| CHS/Community Health Systems, Inc.† | 4.75% | 2/15/2031 | $ | 45,323 | $ | 45,792,999 | ||||||
| Crown Cork & Seal Co., Inc. | 7.375% | 12/15/2026 | 11,810 | 14,257,800 | ||||||||
| Delta Air Lines, Inc./SkyMiles IP Ltd.† | 4.75% | 10/20/2028 | 29,268 | 31,983,537 | ||||||||
| Match Group Holdings II LLC† | 5.00% | 12/15/2027 | 22,260 | 23,182,120 | ||||||||
| MEG Energy Corp. (Canada)†(d) | 5.875% | 2/1/2029 | 41,876 | 43,900,705 | ||||||||
| MEG Energy Corp. (Canada)†(d) | 7.125% | 2/1/2027 | 91,152 | 97,207,227 | ||||||||
| Morgan Stanley | 3.625% | 1/20/2027 | 25,804 | 27,995,004 | ||||||||
| Rocket Mortgage LLC/Rocket Mortgage Co-Issuer, Inc.† | 3.625% | 3/1/2029 | 28,365 | 28,512,073 | ||||||||
| Scientific Games International, Inc.† | 7.25% | 11/15/2029 | 16,014 | 17,882,113 | ||||||||
| Sealed Air Corp.† | 6.875% | 7/15/2033 | 12,427 | 15,797,824 | ||||||||
| Southwestern Energy Co. | 7.75% | 10/1/2027 | 16,397 | 17,704,661 | ||||||||
| Total | 466,678,029 | |||||||||||
| Pharmaceuticals 0.42% | ||||||||||||
| AbbVie, Inc. | 3.20% | 11/21/2029 | 26,942 | 28,836,021 | ||||||||
| AbbVie, Inc. | 4.25% | 11/21/2049 | 14,179 | 17,090,211 | ||||||||
| CVS Health Corp. | 3.625% | 4/1/2027 | 15,780 | 17,135,444 | ||||||||
| Owens & Minor, Inc.† | 4.50% | 3/31/2029 | 14,003 | 14,373,309 | ||||||||
| Pfizer, Inc. | 2.625% | 4/1/2030 | 26,408 | 27,851,414 | ||||||||
| Zoetis, Inc. | 3.90% | 8/20/2028 | 13,486 | 14,981,914 | ||||||||
| Total | 120,268,313 | |||||||||||
| Pipelines 2.16% | ||||||||||||
| Abu Dhabi Crude Oil Pipeline LLC | ||||||||||||
| (United Arab Emirates)†(d) | 4.60% | 11/2/2047 | 28,472 | 33,757,741 | ||||||||
| AI Candelaria Spain SLU (Spain)†(d) | 5.75% | 6/15/2033 | 21,166 | 20,507,843 | ||||||||
| AI Candelaria Spain SLU (Spain)†(d) | 7.50% | 12/15/2028 | 18,965 | 20,297,386 | ||||||||
| Buckeye Partners LP | 6.375% (3 Mo. LIBOR + 4.02%)# | 1/22/2078 | 49,548 | 43,890,609 | ||||||||
| Cheniere Energy Partners LP† | 3.25% | 1/31/2032 | 29,175 | 29,525,100 | ||||||||
| Colonial Enterprises, Inc.† | 3.25% | 5/15/2030 | 11,253 | 11,879,878 | ||||||||
| CQP Holdco LP/BIP-V Chinook Holdco LLC† | 5.50% | 6/15/2031 | 41,314 | 43,186,351 | ||||||||
| Energy Transfer LP | 6.50% (5 Yr. Treasury CMT + 5.69% | )# | – | (f) | 25,692 | 26,205,840 | ||||||
| Florida Gas Transmission Co. LLC† | 4.35% | 7/15/2025 | 18,069 | 19,529,591 | ||||||||
| Galaxy Pipeline Assets Bidco Ltd. (United Arab Emirates)†(d) | 3.25% | 9/30/2040 | 45,094 | 45,686,016 | ||||||||
| NGPL PipeCo LLC† | 3.25% | 7/15/2031 | 23,375 | 23,773,696 | ||||||||
| NGPL PipeCo LLC† | 4.875% | 8/15/2027 | 25,138 | 27,997,984 | ||||||||
| Northern Natural Gas Co.† | 4.30% | 1/15/2049 | 20,972 | 24,597,796 | ||||||||
| See Notes to Financial Statements. | 35 |
Schedule of Investments (continued)
December 31, 2021
| Investments | Interest Rate | Maturity Date | Principal Amount (000) | Fair Value | ||||||||
| Pipelines (continued) | ||||||||||||
| Sabal Trail Transmission LLC† | 4.246% | 5/1/2028 | $ | 20,166 | $ | 22,474,447 | ||||||
| Sabine Pass Liquefaction LLC | 4.50% | 5/15/2030 | 58,643 | 66,207,422 | ||||||||
| Transportadora de Gas Internacional SA ESP (Colombia)†(d) | 5.55% | 11/1/2028 | 24,773 | 27,346,667 | ||||||||
| Venture Global Calcasieu Pass LLC† | 3.875% | 8/15/2029 | 17,510 | 18,195,779 | ||||||||
| Venture Global Calcasieu Pass LLC† | 3.875% | 11/1/2033 | 24,230 | 25,492,868 | ||||||||
| Venture Global Calcasieu Pass LLC† | 4.125% | 8/15/2031 | 17,510 | 18,590,892 | ||||||||
| Western Midstream Operating LP | 5.30% | 2/1/2030 | 60,400 | 66,501,910 | ||||||||
| Total | 615,645,816 | |||||||||||
| Real Estate 0.72% | ||||||||||||
| Canary Wharf Group Investment Holdings plc†(b) | 3.375% | 4/23/2028 | GBP | 17,076 | 23,398,666 | |||||||
| Corp. Inmobiliaria Vesta SAB de CV (Mexico)†(d) | 3.625% | 5/13/2031 | $ | 23,073 | 22,644,650 | |||||||
| Hunt Cos., Inc.† | 5.25% | 4/15/2029 | 71,989 | 71,012,829 | ||||||||
| Kennedy-Wilson, Inc. | 4.75% | 3/1/2029 | 18,781 | 19,232,026 | ||||||||
| Kennedy-Wilson, Inc. | 4.75% | 2/1/2030 | 29,968 | 30,424,113 | ||||||||
| Kennedy-Wilson, Inc. | 5.00% | 3/1/2031 | 36,849 | 38,009,928 | ||||||||
| Total | 204,722,212 | |||||||||||
| REITS 2.26% | ||||||||||||
| Alexandria Real Estate Equities, Inc. | 2.00% | 5/18/2032 | 17,993 | 17,204,579 | ||||||||
| Alexandria Real Estate Equities, Inc. | 3.95% | 1/15/2028 | 14,750 | 16,298,455 | ||||||||
| Alexandria Real Estate Equities, Inc. | 4.90% | 12/15/2030 | 19,794 | 23,803,167 | ||||||||
| American Campus Communities Operating Partnership LP | 2.25% | 1/15/2029 | 22,298 | 22,072,967 | ||||||||
| American Campus Communities Operating Partnership LP | 3.875% | 1/30/2031 | 37,586 | 41,679,969 | ||||||||
| American Homes 4 Rent LP | 3.375% | 7/15/2051 | 34,377 | 34,625,070 | ||||||||
| American Homes 4 Rent LP | 4.90% | 2/15/2029 | 17,598 | 20,359,106 | ||||||||
| Crown Castle International Corp. | 4.15% | 7/1/2050 | 33,779 | 38,087,817 | ||||||||
| CyrusOne LP/CyrusOne Finance Corp. | 2.15% | 11/1/2030 | 22,556 | 22,353,109 | ||||||||
| EPR Properties | 3.60% | 11/15/2031 | 19,346 | 19,160,703 | ||||||||
| GLP Capital LP/GLP Financing II, Inc. | 3.25% | 1/15/2032 | 26,936 | 27,124,956 | ||||||||
| GLP Capital LP/GLP Financing II, Inc. | 4.00% | 1/15/2031 | 19,903 | 21,264,863 | ||||||||
| GLP Capital LP/GLP Financing II, Inc. | 5.75% | 6/1/2028 | 18,808 | 21,742,424 | ||||||||
| Goodman US Finance Four LLC† | 4.50% | 10/15/2037 | 12,258 | 14,248,776 | ||||||||
| HAT Holdings I LLC/HAT Holdings II LLC† | 6.00% | 4/15/2025 | 12,008 | 12,500,328 | ||||||||
| Invitation Homes Operating Partnership LP | 2.00% | 8/15/2031 | 22,608 | 21,314,231 | ||||||||
| Ladder Capital Finance Holdings LLLP/Ladder Capital Finance Corp.† | 4.75% | 6/15/2029 | 39,887 | 40,952,182 | ||||||||
| 36 | See Notes to Financial Statements. |
Schedule of Investments (continued)
December 31, 2021
| Investments | Interest Rate | Maturity Date | Principal Amount (000) | Fair Value | ||||||||
| REITS (continued) | ||||||||||||
| MGM Growth Properties Operating Partnership LP/MGP Finance Co-Issuer, Inc.† | 4.625% | 6/15/2025 | $ | 13,662 | $ | 14,581,862 | ||||||
| MPT Operating Partnership LP/MPT Finance Corp. | 4.625% | 8/1/2029 | 27,257 | 28,803,290 | ||||||||
| Park Intermediate Holdings LLC/PK Domestic Property LLC/PK Finance Co-Issuer† | 5.875% | 10/1/2028 | 18,793 | 19,572,440 | ||||||||
| Prologis LP | 4.375% | 2/1/2029 | 15,050 | 17,235,603 | ||||||||
| Rayonier LP | 2.75% | 5/17/2031 | 32,382 | 32,342,124 | ||||||||
| SBA Communications Corp. | 3.875% | 2/15/2027 | 40,849 | 42,128,595 | ||||||||
| STORE Capital Corp. | 2.70% | 12/1/2031 | 36,312 | 35,548,733 | ||||||||
| Vornado Realty LP | 3.40% | 6/1/2031 | 23,546 | 24,105,026 | ||||||||
| Weyerhaeuser Co. | 7.375% | 3/15/2032 | 11,362 | 16,004,366 | ||||||||
| Total | 645,114,741 | |||||||||||
| Retail 2.58% | ||||||||||||
| Asbury Automotive Group, Inc.† | 4.625% | 11/15/2029 | 14,617 | 14,915,479 | ||||||||
| Asbury Automotive Group, Inc.† | 5.00% | 2/15/2032 | 17,504 | 18,190,244 | ||||||||
| AutoNation, Inc. | 4.75% | 6/1/2030 | 10,463 | 11,964,644 | ||||||||
| Bath & Body Works, Inc. | 6.875% | 11/1/2035 | 54,475 | 67,770,713 | ||||||||
| Best Buy Co., Inc. | 1.95% | 10/1/2030 | 22,556 | 21,665,261 | ||||||||
| Best Buy Co., Inc. | 4.45% | 10/1/2028 | 15,806 | 17,848,455 | ||||||||
| Carvana Co.† | 5.625% | 10/1/2025 | 18,774 | 18,797,467 | ||||||||
| Carvana Co.† | 5.875% | 10/1/2028 | 33,481 | 33,402,487 | ||||||||
| Costco Wholesale Corp. | 1.75% | 4/20/2032 | 22,489 | 21,872,666 | ||||||||
| Dollar General Corp. | 3.50% | 4/3/2030 | 19,674 | 21,283,880 | ||||||||
| Dollar Tree, Inc. | 3.375% | 12/1/2051 | 45,426 | 45,840,327 | ||||||||
| eG Global Finance plc (United Kingdom)†(d) | 8.50% | 10/30/2025 | 22,482 | 23,320,354 | ||||||||
| Gap, Inc. (The)† | 3.875% | 10/1/2031 | 26,269 | 25,950,882 | ||||||||
| Kohl’s Corp. | 5.55% | 7/17/2045 | 28,574 | 33,391,499 | ||||||||
| Macy’s Retail Holdings LLC | 4.50% | 12/15/2034 | 27,122 | 26,824,065 | ||||||||
| Macy’s Retail Holdings LLC† | 5.875% | 4/1/2029 | 16,290 | 17,396,091 | ||||||||
| Murphy Oil USA, Inc.† | 3.75% | 2/15/2031 | 18,750 | 18,659,719 | ||||||||
| Murphy Oil USA, Inc. | 4.75% | 9/15/2029 | 15,790 | 16,641,634 | ||||||||
| PetSmart, Inc./PetSmart Finance Corp.† | 4.75% | 2/15/2028 | 25,668 | 26,388,372 | ||||||||
| PetSmart, Inc./PetSmart Finance Corp.† | 7.75% | 2/15/2029 | 27,141 | 29,529,815 | ||||||||
| Sonic Automotive, Inc.† | 4.625% | 11/15/2029 | 19,450 | 19,667,743 | ||||||||
| Sonic Automotive, Inc.† | 4.875% | 11/15/2031 | 22,784 | 23,039,295 | ||||||||
| Staples, Inc.† | 7.50% | 4/15/2026 | 37,112 | 38,180,826 | ||||||||
| Starbucks Corp. | 4.45% | 8/15/2049 | 32,350 | 39,924,513 | ||||||||
| Stonegate Pub Co. Financing 2019 plc(b) | 8.00% | 7/13/2025 | GBP | 17,255 | 23,813,856 | |||||||
| See Notes to Financial Statements. | 37 |
Schedule of Investments (continued)
December 31, 2021
| Investments | Interest Rate | Maturity Date | Principal Amount (000) | Fair Value | ||||||||
| Retail (continued) | ||||||||||||
| Stonegate Pub Co. Financing 2019 plc(b) | 8.25% | 7/31/2025 | GBP | 33,093 | $ | 45,626,851 | ||||||
| Tiffany & Co. | 4.90% | 10/1/2044 | $ | 24,318 | 32,879,115 | |||||||
| Total | 734,786,253 | |||||||||||
| Savings & Loans 0.00% | ||||||||||||
| Washington Mutual Bank(g) | 6.875% | 6/15/2011 | 22,500 | 2,250 | (h) | |||||||
| Semiconductors 1.08% | ||||||||||||
| KLA Corp. | 4.10% | 3/15/2029 | 29,229 | 33,022,481 | ||||||||
| Lam Research Corp. | 4.875% | 3/15/2049 | 17,958 | 24,436,220 | ||||||||
| Microchip Technology, Inc. | 4.25% | 9/1/2025 | 19,750 | 20,515,020 | ||||||||
| Micron Technology, Inc. | 5.327% | 2/6/2029 | 25,257 | 29,956,066 | ||||||||
| NVIDIA Corp. | 3.20% | 9/16/2026 | 29,939 | 32,189,004 | ||||||||
| NXP BV/NXP Funding LLC/NXP USA, Inc. (Netherlands)†(d) | 3.25% | 11/30/2051 | 27,302 | 27,352,321 | ||||||||
| NXP BV/NXP Funding LLC/NXP USA, Inc. (Netherlands)†(d) | 3.40% | 5/1/2030 | 16,808 | 17,932,317 | ||||||||
| ON Semiconductor Corp.† | 3.875% | 9/1/2028 | 29,897 | 30,687,327 | ||||||||
| SK Hynix, Inc. (South Korea)†(d) | 2.375% | 1/19/2031 | 23,537 | 22,679,725 | ||||||||
| TSMC Arizona Corp. | 3.25% | 10/25/2051 | 64,145 | 67,734,449 | ||||||||
| Total | 306,504,930 | |||||||||||
| Software 2.04% | ||||||||||||
| Autodesk, Inc. | 3.50% | 6/15/2027 | 27,008 | 29,060,112 | ||||||||
| Intuit, Inc. | 1.65% | 7/15/2030 | 18,048 | 17,426,437 | ||||||||
| Microsoft Corp. | 3.30% | 2/6/2027 | 26,383 | 28,769,585 | ||||||||
| MSCI, Inc.† | 3.25% | 8/15/2033 | 24,244 | 24,554,444 | ||||||||
| MSCI, Inc.† | 3.875% | 2/15/2031 | 47,798 | 49,843,515 | ||||||||
| MSCI, Inc.† | 4.00% | 11/15/2029 | 34,026 | 35,613,653 | ||||||||
| Oracle Corp. | 4.50% | 7/8/2044 | 11,251 | 12,733,236 | ||||||||
| Playtika Holding Corp. (Israel)†(d) | 4.25% | 3/15/2029 | 15,508 | 15,221,335 | ||||||||
| PTC, Inc.† | 3.625% | 2/15/2025 | 12,218 | 12,398,888 | ||||||||
| PTC, Inc.† | 4.00% | 2/15/2028 | 22,263 | 22,688,557 | ||||||||
| ROBLOX Corp.† | 3.875% | 5/1/2030 | 74,851 | 76,049,364 | ||||||||
| Roper Technologies, Inc. | 1.75% | 2/15/2031 | 30,818 | 28,975,943 | ||||||||
| salesforce.com, Inc. | 3.70% | 4/11/2028 | 17,807 | 19,774,746 | ||||||||
| ServiceNow, Inc. | 1.40% | 9/1/2030 | 33,835 | 31,532,699 | ||||||||
| Twilio, Inc. | 3.625% | 3/15/2029 | 97,266 | 98,276,594 | ||||||||
| Twilio, Inc. | 3.875% | 3/15/2031 | 54,634 | 55,242,350 | ||||||||
| Veritas US, Inc./Veritas Bermuda Ltd.† | 7.50% | 9/1/2025 | 23,039 | 23,875,431 | ||||||||
| Total | 582,036,889 | |||||||||||
| 38 | See Notes to Financial Statements. |
Schedule of Investments (continued)
December 31, 2021
| Investments | Interest Rate | Maturity Date | Principal Amount (000) | Fair Value | ||||||||
| Telecommunications 2.17% | ||||||||||||
| Altice France Holding SA (Luxembourg)†(d) | 6.00% | 2/15/2028 | $ | 13,128 | $ | 12,560,870 | ||||||
| Altice France Holding SA (Luxembourg)†(d) | 10.50% | 5/15/2027 | 31,171 | 33,552,776 | ||||||||
| Connect Finco SARL/Connect US Finco LLC (Luxembourg)†(d) | 6.75% | 10/1/2026 | 29,167 | 30,701,184 | ||||||||
| Frontier Communications Holdings LLC† | 5.00% | 5/1/2028 | 26,116 | 26,946,750 | ||||||||
| Frontier Communications Holdings LLC† | 5.875% | 10/15/2027 | 14,606 | 15,468,411 | ||||||||
| Frontier Communications Holdings LLC† | 6.75% | 5/1/2029 | 27,815 | 28,970,157 | ||||||||
| Hughes Satellite Systems Corp. | 5.25% | 8/1/2026 | 21,000 | 22,990,485 | ||||||||
| Motorola Solutions, Inc. | 4.60% | 2/23/2028 | 15,034 | 16,987,665 | ||||||||
| Motorola Solutions, Inc. | 4.60% | 5/23/2029 | 17,963 | 20,542,666 | ||||||||
| Sprint Capital Corp. | 6.875% | 11/15/2028 | 108,783 | 137,793,250 | ||||||||
| Switch Ltd.† | 3.75% | 9/15/2028 | 18,979 | 19,148,577 | ||||||||
| T-Mobile USA, Inc. | 3.375% | 4/15/2029 | 45,095 | 46,027,114 | ||||||||
| T-Mobile USA, Inc. | 3.875% | 4/15/2030 | 16,027 | 17,545,177 | ||||||||
| T-Mobile USA, Inc. | 4.50% | 4/15/2050 | 11,073 | 12,978,564 | ||||||||
| Vmed O2 UK Financing I plc (United Kingdom)†(d) | 4.25% | 1/31/2031 | 60,933 | 59,813,051 | ||||||||
| Vmed O2 UK Financing I plc (United Kingdom)†(d) | 4.75% | 7/15/2031 | 42,074 | 42,676,079 | ||||||||
| Windstream Escrow LLC/Windstream Escrow Finance Corp.† | 7.75% | 8/15/2028 | 19,090 | 20,273,200 | ||||||||
| Xiaomi Best Time International Ltd. (Hong Kong)†(d) | 4.10% | 7/14/2051 | 52,407 | 53,307,100 | ||||||||
| Total | 618,283,076 | |||||||||||
| Toys/Games/Hobbies 0.37% | ||||||||||||
| Hasbro, Inc. | 3.90% | 11/19/2029 | 44,903 | 49,558,670 | ||||||||
| Hasbro, Inc. | 5.10% | 5/15/2044 | 24,241 | 30,241,134 | ||||||||
| Mattel, Inc.† | 5.875% | 12/15/2027 | 24,502 | 26,372,483 | ||||||||
| Total | 106,172,287 | |||||||||||
| Transportation 0.41% | ||||||||||||
| Autoridad del Canal de Panama (Panama)†(d) | 4.95% | 7/29/2035 | 13,240 | 16,146,973 | ||||||||
| Central Japan Railway Co. (Japan)†(d) | 4.25% | 11/24/2045 | 17,006 | 21,262,571 | ||||||||
| CH Robinson Worldwide, Inc. | 4.20% | 4/15/2028 | 20,351 | 22,944,147 | ||||||||
| FedEx Corp. 2020-1 Class AA Pass Through Trust | 1.875% | 8/20/2035 | 29,906 | 29,554,082 | ||||||||
| XPO Logistics, Inc.† | 6.25% | 5/1/2025 | 26,723 | 27,992,744 | ||||||||
| Total | 117,900,517 | |||||||||||
| Total Corporate Bonds (cost $17,406,893,748) | 18,139,785,579 | |||||||||||
| See Notes to Financial Statements. | 39 |
Schedule of Investments (continued)
December 31, 2021
| Investments | Interest Rate | Maturity Date | Principal Amount (000) | Fair Value | ||||||||
| FLOATING RATE LOANS(i) 5.52% | ||||||||||||
| Aerospace/Defense 0.08% | ||||||||||||
| Alloy Finco Limited 2020 USD Term Loan B2 (Jersey)(d) | 8.50% (3 Mo. LIBOR + 6.50% | ) | 3/6/2024 | $ | 8,103 | $ | 8,074,085 | |||||
| Alloy Finco Limited USD Holdco PIK Term Loan 13.50% (Jersey)(d) | 0.50% | 3/6/2025 | 14,038 | 14,185,429 | ||||||||
| Total | 22,259,514 | |||||||||||
| Auto Parts & Equipment 0.06% | ||||||||||||
| Truck Hero, Inc. 2021 Term Loan B | 4.00% (1 Mo. LIBOR + 3.25% | ) | 1/31/2028 | 16,575 | 16,519,496 | |||||||
| Automakers 0.09% | ||||||||||||
| Drive Chassis HoldCo, LLC 2019 2nd Lien Term Loan | 6.874% (3 Mo. LIBOR + 6.00% | ) | 4/10/2026 | 26,707 | 26,874,291 | |||||||
| Banking 0.08% | ||||||||||||
| Blackhawk Network Holdings, Inc 2018 1st Lien Term Loan | 3.104% (1 Mo. LIBOR + 3.00% | ) | 6/15/2025 | 22,186 | 22,076,607 | |||||||
| Building & Construction 0.16% | ||||||||||||
| Centuri Group, Inc Term Loan B | 3.00% (3 Mo. LIBOR + 2.50% | ) | 8/27/2028 | 24,896 | 24,902,523 | |||||||
| USIC Holdings, Inc. 2021 Term Loan | 4.25% (1 Mo. LIBOR + 3.50% | ) | 5/12/2028 | 19,655 | 19,655,428 | |||||||
| Total | 44,557,951 | |||||||||||
| Building Materials 0.12% | ||||||||||||
| ACProducts, Inc. 2021 Term Loan B | 4.75% (6 Mo. LIBOR + 4.25% | ) | 5/17/2028 | 33,545 | 33,125,332 | |||||||
| Chemicals 0.22% | ||||||||||||
| LSF11 A5 Holdco LLC Term Loan | 4.25% (3 Mo. LIBOR + 3.75% | ) | 10/15/2028 | 23,083 | 23,092,382 | |||||||
| Messer Industries GmbH 2018 USD Term Loan | 2.724% (3 Mo. LIBOR + 2.50% | ) | 3/2/2026 | 19,379 | 19,255,962 | |||||||
| Starfruit Finco B.V 2018 USD Term Loan B (Netherlands)(d) | 3.102% (1 Mo. LIBOR + 3.00% | ) | 10/1/2025 | 19,411 | 19,368,738 | |||||||
| Total | 61,717,082 | |||||||||||
| Discount Stores 0.09% | ||||||||||||
| BJ’s Wholesale Club, Inc. 2017 1st Lien Term Loan | 2.105% (1 Mo. LIBOR + 2.00% | ) | 2/3/2024 | 13,177 | 13,195,282 | |||||||
| 40 | See Notes to Financial Statements. |
Schedule of Investments (continued)
December 31, 2021
| Investments | Interest Rate | Maturity Date | Principal Amount (000) | Fair Value | ||||||||
| Discount Stores (continued) | ||||||||||||
| Claire’s Stores, Inc. 2019 Term Loan B | 6.604% (1 Mo. LIBOR + 6.50% | ) | 12/18/2026 | $ | 11,558 | $ | 11,526,277 | |||||
| Total | 24,721,559 | |||||||||||
| Diversified Capital Goods 0.00% | ||||||||||||
| UTEX Industries Inc. 2020 Second Out Term Loan PIK 5.75% | 5.25% (1 Mo. LIBOR + 3.75% | ) | 12/3/2025 | 696 | 686,520 | |||||||
| Electric: Generation 0.15% | ||||||||||||
| Astoria Energy LLC 2020 Term Loan B | 4.50% (3 Mo. LIBOR + 3.50% | ) | 12/10/2027 | 22,758 | 22,735,789 | |||||||
| EFS Cogen Holdings I LLC 2020 Term Loan B | 4.50% (3 Mo. LIBOR + 3.50% | ) | 10/1/2027 | 18,069 | 17,842,911 | |||||||
| Frontera Generation Holdings LLC 2021 2nd Lien Term Loan | 1.72% (3 Mo. LIBOR + 1.50% | ) | 7/28/2028 | 1,721 | 976,638 | |||||||
| Frontera Generation Holdings LLC 2021 Term Loan | 14.00% (3 Mo. LIBOR + 13.00% | ) | 7/28/2026 | 1,782 | 1,888,904 | (j) | ||||||
| Total | 43,444,242 | |||||||||||
| Electric: Integrated 0.09% | ||||||||||||
| Helix Gen Funding, LLC Term Loan B | 4.75% (1 Mo. LIBOR + 3.75% | ) | 6/3/2024 | 26,985 | 26,248,511 | |||||||
| Electronics 0.10% | ||||||||||||
| Altar Bidco, Inc. 2021 Term Loan | – | (k) | 11/17/2028 | 27,308 | 27,256,315 | |||||||
| Gas Distribution 0.37% | ||||||||||||
| CQP Holdco LP 2021 Term Loan B | 4.25% (3 Mo. LIBOR + 3.75% | ) | 6/5/2028 | 36,113 | 36,074,919 | |||||||
| Lucid Energy Group II Borrower, LLC 2021 Term Loan | 5.00% (3 Mo. LIBOR + 4.25% | ) | 11/24/2028 | 45,020 | 44,547,747 | |||||||
| Oryx Midstream Services Permian Basin LLC Term Loan B | 3.75% (3 Mo. LIBOR + 3.25% | ) | 10/5/2028 | 24,182 | 24,059,259 | |||||||
| Total | 104,681,925 | |||||||||||
| Health Facilities 0.58% | ||||||||||||
| Da Vinci Purchaser Corp. 2019 Term Loan | 5.00% (3 Mo. LIBOR + 4.00% | ) | 1/8/2027 | 18,724 | 18,770,459 | |||||||
| Electron BidCo Inc. 2021 Term Loan | 3.75% (3 Mo. LIBOR + 3.25% | ) | 11/1/2028 | 27,701 | 27,668,682 | |||||||
| Global Medical Response, Inc. 2020 Term Loan B | 4.474% - 5.25% (3 Mo. LIBOR + 4.25% | ) | 10/2/2025 | 26,797 | 26,723,277 | |||||||
| See Notes to Financial Statements. | 41 |
Schedule of Investments (continued)
December 31, 2021
| Investments | Interest Rate | Maturity Date | Principal Amount (000) | Fair Value | ||||||||
| Health Facilities (continued) | ||||||||||||
| Heartland Dental, LLC 2018 1st Lien Term Loan | 3.604% (1 Mo. LIBOR + 3.50% | ) | 4/30/2025 | $ | 22,071 | $ | 21,895,228 | |||||
| RegionalCare Hospital Partners Holdings, Inc. 2018 Term Loan B | 3.852% (1 Mo. LIBOR + 5.75% | ) | 11/16/2025 | 37,872 | 37,891,084 | |||||||
| Select Medical Corporation 2017 Term Loan B | 2.36% (1 Mo. LIBOR + 2.25% | ) | 3/6/2025 | 33,463 | 33,316,663 | |||||||
| Total | 166,265,393 | |||||||||||
| Health Services 0.12% | ||||||||||||
| National Mentor Holdings, Inc. 2021 Delayed Draw Term Loan(l) | – | (k) | 3/2/2028 | 1,493 | 1,478,593 | |||||||
| National Mentor Holdings, Inc. 2021 Term Loan C | 4.50% (1 Mo. LIBOR + 3.75% | ) | 3/2/2028 | 1,013 | 1,003,116 | |||||||
| National Mentor Holdings, Inc. 2021 Term Loan | 4.50% (3 Mo. LIBOR + 3.75% | ) | 3/2/2028 | 31,999 | 31,698,944 | |||||||
| Total | 34,180,653 | |||||||||||
| Insurance Brokerage 0.06% | ||||||||||||
| Hub International Limited 2018 Term Loan B | 2.875% (3 Mo. LIBOR + 2.75% | ) | 4/25/2025 | 16,658 | 16,487,678 | |||||||
| Investments & Miscellaneous Financial Services 0.30% | ||||||||||||
| HighTower Holdings LLC 2021 Term Loan B | 4.75% (3 Mo. LIBOR + 4.00% | ) | 4/21/2028 | 50,552 | 50,588,558 | |||||||
| Hudson River Trading LLC 2021 Term Loan | 3.104% (1 Mo. LIBOR + 3.00% | ) | 3/20/2028 | 35,906 | 35,688,246 | |||||||
| Total | 86,276,804 | |||||||||||
| Machinery 0.17% | ||||||||||||
| II-VI Incorporated 2021 Bridge Term Loan B | – | (k) | 12/1/2028 | 27,314 | 27,319,626 | |||||||
| Vertical US Newco Inc Term Loan B | 4.00% (6 Mo. LIBOR + 3.50% | ) | 7/30/2027 | 22,354 | 22,397,126 | |||||||
| Total | 49,716,752 | |||||||||||
| Managed Care 0.07% | ||||||||||||
| Bella Holding Company, LLC 2021 Term Loan B | 4.50% (1 Mo. LIBOR + 3.75% | ) | 5/10/2028 | 18,732 | 18,745,738 | |||||||
| Media: Content 0.25% | ||||||||||||
| AppLovin Corporation 2021 Term Loan B | 3.50% (1 Mo. LIBOR + 3.00% | ) | 10/25/2028 | 27,472 | 27,463,605 | |||||||
| Nexstar Broadcasting, Inc. 2018 Term Loan B3 | 2.354% (1 Mo. LIBOR + 2.25% | ) | 1/17/2024 | 15,374 | 15,370,086 | |||||||
| 42 | See Notes to Financial Statements. |
Schedule of Investments (continued)
December 31, 2021
| Investments | Interest Rate | Maturity Date | Principal Amount (000) | Fair Value | ||||||||
| Media: Content (continued) | ||||||||||||
| Univision Communications Inc. 2021 Term Loan B | – | (k) | 5/5/2028 | $ | 28,368 | $ | 28,362,549 | |||||
| Total | 71,196,240 | |||||||||||
| Medical Products 0.04% | ||||||||||||
| MedAssets Software Intermediate Holdings, Inc. 2021 Term Loan | 4.50% (3 Mo. LIBOR + 4.00% | ) | 12/18/2028 | 12,408 | 12,427,676 | |||||||
| Personal & Household Products 0.09% | ||||||||||||
| FGI Operating Company, LLC Exit Term Loan | 10.22% (3 Mo. LIBOR + 10.00% | ) | 5/16/2022 | 835 | 104,809 | (j) | ||||||
| Revlon Consumer Products Corporation 2020 Additional Term Loan B2 | 4.25% (3 Mo. LIBOR + 3.50% | ) | 6/30/2025 | 79 | 58,381 | |||||||
| Springs Windows Fashions, LLC 2021 Term Loan B | 4.75% (3 Mo. LIBOR + 4.00% | ) | 10/6/2028 | 27,069 | 26,883,315 | |||||||
| Total | 27,046,505 | |||||||||||
| Rail 0.08% | ||||||||||||
| Genesee & Wyoming Inc. (New) Term Loan | 2.224% (3 Mo. LIBOR + 2.00% | ) | 12/30/2026 | 23,001 | 22,886,003 | |||||||
| Real Estate Investment Trusts 0.09% | ||||||||||||
| Washington Prime Group, L.P. 2021 Take-back Exit Term Loan | – | (k) | 6/11/2025 | 25,580 | 25,887,331 | |||||||
| Recreation & Travel 0.13% | ||||||||||||
| Delta 2 (LUX) S.a.r.l. 2018 USD Term Loan (Luxembourg)(d) | 3.50% (1 Mo. LIBOR + 2.50% | ) | 2/1/2024 | 16,211 | 16,217,439 | |||||||
| Motion Finco Sarl Delayed Draw Term Loan B2 (Luxembourg)(d) | 3.474% (3 Mo. LIBOR + 3.25% | ) | 11/12/2026 | 2,468 | 2,419,903 | |||||||
| Motion Finco Sarl USD Term Loan B1 (Luxembourg)(d) | 3.474% (3 Mo. LIBOR + 3.25% | ) | 11/12/2026 | 18,677 | 18,311,917 | |||||||
| Total | 36,949,259 | |||||||||||
| Software/Services 0.59% | ||||||||||||
| Magenta Buyer LLC 2021 USD 1st Lien Term Loan | 5.75% (3 Mo. LIBOR + 5.00% | ) | 7/27/2028 | 25,836 | 25,807,246 | |||||||
| Peraton Corp. Term Loan B | 4.50% (1 Mo. LIBOR + 3.75% | ) | 2/1/2028 | 25,088 | 25,141,356 | |||||||
| Polaris Newco LLC USD Term Loan B | 4.50% (3 Mo. LIBOR + 4.00% | ) | 6/2/2028 | 29,410 | 29,445,261 | |||||||
| RealPage, Inc 1st Lien Term Loan | 3.75% (1 Mo. LIBOR + 3.25% | ) | 4/24/2028 | 25,022 | 24,978,952 | |||||||
| See Notes to Financial Statements. | 43 |
Schedule of Investments (continued)
December 31, 2021
| Investments | Interest Rate | Maturity Date | Principal Amount (000) | Fair Value | ||||||||
| Software/Services (contents) | ||||||||||||
| Tibco Software Inc. 2020 Term Loan B3 | 3.852% (1 Mo. LIBOR + 3.75% | ) | 6/30/2026 | $ | 30,760 | $ | 30,567,847 | |||||
| Ultimate Software Group Inc (The) Term Loan B | 3.854% (1 Mo. LIBOR + 3.75% | ) | 5/4/2026 | 15,896 | 15,869,876 | |||||||
| WEX Inc. 2021 Term Loan | 2.354% (1 Mo. LIBOR + 2.25% | ) | 3/31/2028 | 15,726 | 15,664,058 | |||||||
| Total | 167,474,596 | |||||||||||
| Specialty Retail 0.50% | ||||||||||||
| Birkenstock GmbH & Co. KG USD Term Loan B (Germany)(d) | 3.75% (6 Mo. LIBOR + 3.25% | ) | 4/28/2028 | 16,850 | 16,829,265 | |||||||
| Foundation Building Materials Holding Company LLC 2021 Term Loan | 3.75% (3 Mo. LIBOR + 3.25% | ) | 2/3/2028 | 11,957 | 11,889,266 | |||||||
| Harbor Freight Tools USA, Inc. 2021 Term Loan B | 3.25% (1 Mo. LIBOR + 2.75% | ) | 10/19/2027 | 14,992 | 14,979,556 | |||||||
| Mavis Tire Express Services Corp. 2021 Term Loan B | 4.75% (1 Mo. LIBOR + 4.00% | ) | 5/4/2028 | 27,124 | 27,183,668 | |||||||
| Petco Health and Wellness Company, Inc. 2021 Term Loan B | 4.00% (3 Mo. LIBOR + 3.25% | ) | 3/3/2028 | 28,340 | 28,342,400 | |||||||
| Restoration Hardware, Inc. Term Loan B | 3.00% (3 Mo. LIBOR + 2.50% | ) | 10/20/2028 | 25,829 | 25,810,087 | |||||||
| Winterfell Financing Sarl EUR Term Loan B (Luxembourg)(d) | 3.50% (3 Mo. EURIBOR + 3.50% | ) | 5/4/2028 | EUR | 14,427 | 16,270,666 | ||||||
| Total | 141,304,908 | |||||||||||
| Support: Services 0.43% | ||||||||||||
| Avis Budget Car Rental, LLC 2020 Term Loan B | 1.86% (1 Mo. LIBOR + 1.75% | ) | 8/6/2027 | $ | 22,530 | 22,273,027 | ||||||
| Brown Group Holding, LLC Term Loan B | 3.00% (3 Mo. LIBOR + 2.50% | ) | 6/7/2028 | 26,334 | 26,317,549 | |||||||
| CoreLogic, Inc. Term Loan | 4.00% (1 Mo. LIBOR + 3.50% | ) | 6/2/2028 | 34,385 | 34,402,416 | |||||||
| Pike Corporation 2021 Incremental Term Loan B | 3.11% (1 Mo. LIBOR + 3.00% | ) | 1/21/2028 | 19,618 | 19,584,134 | |||||||
| Team Health Holdings, Inc. 1st Lien Term Loan | 3.75% (1 Mo. LIBOR + 2.75% | ) | 2/6/2024 | 22,378 | 21,460,639 | |||||||
| Total | 124,037,765 | |||||||||||
| Technology Hardware & Equipment 0.41% | ||||||||||||
| Atlas CC Acquisition Corp Term Loan B | 5.00% (3 Mo. LIBOR + 4.25% | ) | 5/25/2028 | 24,209 | 24,293,980 | |||||||
| 44 | See Notes to Financial Statements. |
Schedule of Investments (continued)
December 31, 2021
| Principal | ||||||||||||
| Interest | Maturity | Amount | Fair | |||||||||
| Investments | Rate | Date | (000) | Value | ||||||||
| Technology Hardware & Equipment (continued) | ||||||||||||
| Atlas CC Acquisition Corp Term Loan C | 5.00% (3 Mo. LIBOR + 4.25% | ) | 5/25/2028 | $ | 4,924 | $ | 4,941,149 | |||||
| Delta TopCo, Inc. 2020 Term Loan B | 4.50% (6 Mo. LIBOR + 3.75% | ) | 12/1/2027 | 24,017 | 24,073,125 | |||||||
| LogMeIn, Inc. Term Loan B | 4.839% (3 Mo. LIBOR + 4.75% | ) | 8/31/2027 | 64,199 | 63,931,319 | |||||||
| Total | 117,239,573 | |||||||||||
| Theaters & Entertainment 0.00% | ||||||||||||
| AMC Entertainment Holdings, Inc. 2019 Term Loan B | 3.103% (1 Mo. LIBOR + 3.00% | ) | 4/22/2026 | 31 | 28,362 | |||||||
| Total Floating Rate Loans (cost $1,559,753,504) | 1,572,320,581 | |||||||||||
| FOREIGN GOVERNMENT OBLIGATIONS 2.54% | ||||||||||||
| Angola 0.20% | ||||||||||||
| Angolan Government International Bond†(d) | 9.125% | 11/26/2049 | 31,472 | 30,292,681 | ||||||||
| Angolan Government International Bond †(d) | 9.375% | 5/8/2048 | 27,128 | 26,638,069 | ||||||||
| Total | 56,930,750 | |||||||||||
| Australia 0.10% | ||||||||||||
| Australian Government Bond(b) | 4.25% | 4/21/2026 | AUD | 33,642 | 27,527,957 | |||||||
| Bermuda 0.10% | ||||||||||||
| Bermuda Government International Bond† | 2.375% | 8/20/2030 | $ | 14,545 | 14,581,363 | |||||||
| Bermuda Government International Bond† | 3.375% | 8/20/2050 | 12,887 | 12,935,326 | ||||||||
| Total | 27,516,689 | |||||||||||
| Colombia 0.18% | ||||||||||||
| Colombia Government International Bond(d) | 5.20% | 5/15/2049 | 54,429 | 50,082,844 | ||||||||
| Costa Rica 0.29% | ||||||||||||
| Costa Rica Government International Bond†(d) | 7.158% | 3/12/2045 | 83,332 | 82,707,843 | ||||||||
| Ecuador 0.16% | ||||||||||||
| Ecuador Government International Bond†(d) | 5.00% | 7/31/2030 | 54,470 | 45,278,104 | ||||||||
| El Salvador 0.19% | ||||||||||||
| El Salvador Government International Bond†(d) | 7.65% | 6/15/2035 | 48,159 | 27,631,226 | ||||||||
| El Salvador Government International Bond†(d) | 8.25% | 4/10/2032 | 42,714 | 26,482,680 | ||||||||
| Total | 54,113,906 | |||||||||||
| Gabon 0.13% | ||||||||||||
| Gabon Government International Bond†(d) | 7.00% | 11/24/2031 | 37,742 | 37,081,515 | ||||||||
| See Notes to Financial Statements. | 45 |
Schedule of Investments (continued)
December 31, 2021
| Investments | Interest Rate | Maturity Date | Principal Amount (000) | Fair Value | ||||||||
| Ivory Coast 0.09% | ||||||||||||
| Ivory Coast Government International Bond†(b) | 5.875% | 10/17/2031 | EUR | 22,313 | $ | 26,158,253 | ||||||
| Kenya 0.37% | ||||||||||||
| Republic of Kenya Government International Bond†(d) | 7.25% | 2/28/2028 | $ | 40,576 | 43,775,012 | |||||||
| Republic of Kenya Government International Bond†(d) | 8.25% | 2/28/2048 | 61,972 | 63,141,411 | ||||||||
| Total | 106,916,423 | |||||||||||
| Mongolia 0.12% | ||||||||||||
| Development Bank of Mongolia LLC†(d) | 7.25% | 10/23/2023 | 31,219 | 32,939,251 | ||||||||
| Oman 0.09% | ||||||||||||
| Oman Sovereign Sukuk Co.†(d) | 4.875% | 6/15/2030 | 25,254 | 26,895,510 | ||||||||
| Senegal 0.11% | ||||||||||||
| Senegal Government International Bond†(b) | 5.375% | 6/8/2037 | EUR | 28,360 | 30,723,826 | |||||||
| South Africa 0.15% | ||||||||||||
| Republic of South Africa Government International Bond(d) | 5.75% | 9/30/2049 | $ | 45,375 | 43,752,844 | |||||||
| Sri Lanka 0.11% | ||||||||||||
| Sri Lanka Government International Bond†(d)(m) | 5.875% | 7/25/2022 | 45,243 | 30,867,037 | ||||||||
| United Arab Emirates 0.15% | ||||||||||||
| Abu Dhabi Government International†(d) | 3.125% | 5/3/2026 | 40,836 | 43,512,432 | ||||||||
| Total Foreign Government Obligations (cost $753,325,963) | 723,005,184 | |||||||||||
| MUNICIPAL BONDS 2.40% | ||||||||||||
| Air Transportation 0.12% | ||||||||||||
| County of Miami-Dade FL Aviation Revenue | 3.982% | 10/1/2041 | 13,915 | 14,902,936 | ||||||||
| County of Miami-Dade FL Aviation Revenue | 4.28% | 10/1/2041 | 18,040 | 19,796,432 | ||||||||
| Total | 34,699,368 | |||||||||||
| Education 0.44% | ||||||||||||
| California State University | 3.899% | 11/1/2047 | 33,030 | 38,068,581 | ||||||||
| Ohio University | 5.59% | 12/1/2114 | 11,104 | 17,320,785 | ||||||||
| Permanent University Fund - Texas A&M University S | 3.66% | 7/1/2047 | 36,015 | 38,962,428 | ||||||||
| Regents of the University of California Medical Ce | 3.006% | 5/15/2050 | 12,835 | 13,230,866 | ||||||||
| 46 | See Notes to Financial Statements. |
Schedule of Investments (continued)
December 31, 2021
| Investments | Interest Rate | Maturity Date | Principal Amount (000) | Fair Value | ||||||||
| Education (continued) | ||||||||||||
| Regents of the University of California Medical Ce | 6.548% | 5/15/2048 | $ | 12,463 | $ | 19,309,478 | ||||||
| Total | 126,892,138 | |||||||||||
| General Obligation 0.67% | ||||||||||||
| Chicago Transit Authority Sales & Transfer Tax Rec | 6.899% | 12/1/2040 | 11,826 | 16,670,596 | ||||||||
| City & County of Honolulu HI | 5.418% | 12/1/2027 | 6,620 | 8,000,323 | ||||||||
| Commonwealth of Pennsylvania | 5.45% | 2/15/2030 | 12,190 | 14,863,008 | ||||||||
| District of Columbia | 5.591% | 12/1/2034 | 14,130 | 17,780,288 | ||||||||
| Los Angeles Unified School District/CA | 5.75% | 7/1/2034 | 12,497 | 16,280,548 | ||||||||
| State of California | 7.55% | 4/1/2039 | 15,015 | 25,086,646 | ||||||||
| State of Illinois | 5.10% | 6/1/2033 | 69,845 | 80,785,130 | ||||||||
| University of North Carolina at Chapel Hill | 3.847% | 12/1/2034 | 9,595 | 11,172,397 | ||||||||
| Total | 190,638,936 | |||||||||||
| Lease Obligation 0.03% | ||||||||||||
| State of Wisconsin | 3.294% | 5/1/2037 | 7,145 | 7,788,241 | ||||||||
| Miscellaneous 0.36% | ||||||||||||
| County of Miami-Dade FL | 2.786% | 10/1/2037 | 9,690 | 9,496,526 | ||||||||
| Dallas Convention Center Hotel Development Corp | 7.088% | 1/1/2042 | 17,795 | 25,182,607 | ||||||||
| New York City Industrial Development Agency† | 11.00% | 3/1/2029 | 18,478 | 24,558,295 | ||||||||
| Pasadena Public Financing Authority | 7.148% | 3/1/2043 | 26,795 | 43,288,710 | ||||||||
| Total | 102,526,138 | |||||||||||
| Revenue - Utilities - Other 0.06% | ||||||||||||
| City of San Antonio TX Electric & Gas Systems Reve | 5.718% | 2/1/2041 | 13,240 | 18,384,671 | ||||||||
| Tax Revenue 0.29% | ||||||||||||
| Dallas Area Rapid Transit | 2.613% | 12/1/2048 | 22,730 | 22,325,022 | ||||||||
| Massachusetts School Building Authority | 5.715% | 8/15/2039 | 20,055 | 27,746,855 | ||||||||
| Memphis-Shelby County Industrial Development Board(g) | 7.00% | 7/1/2045 | 22,085 | 19,802,460 | ||||||||
| New York State Dormitory Authority | 3.19% | 2/15/2043 | 5,345 | 5,646,712 | ||||||||
| Regional Transportation District Sales Tax Revenue | 2.387% | 11/1/2037 | 8,125 | 7,718,722 | ||||||||
| Total | 83,239,771 | |||||||||||
| Taxable Revenue - Water & Sewer 0.04% | ||||||||||||
| City & County Honolulu HI Wastewater System Revenu | 1.623% | 7/1/2031 | 6,635 | 6,499,171 | ||||||||
| See Notes to Financial Statements. | 47 |
Schedule of Investments (continued)
December 31, 2021
| Principal | ||||||||||||
| Interest | Maturity | Amount | Fair | |||||||||
| Investments | Rate | Date | (000) | Value | ||||||||
| Taxable Revenue - Water & Sewer (continued) | ||||||||||||
| City & County Honolulu HI Wastewater System Revenu | 2.574% | 7/1/2041 | $ | 4,520 | $ | 4,541,103 | ||||||
| Total | 11,040,274 | |||||||||||
| Transportation 0.25% | ||||||||||||
| Foothill-Eastern Transportation Corridor Agency | 4.094% | 1/15/2049 | 10,790 | 11,621,708 | ||||||||
| Metropolitan Transportation Authority | 5.175% | 11/15/2049 | 18,010 | 24,775,572 | ||||||||
| Metropolitan Transportation Authority | 6.668% | 11/15/2039 | 9,045 | 12,887,664 | ||||||||
| New Jersey Transportation Trust Fund Authority | 4.131% | 6/15/2042 | 18,845 | 21,187,681 | ||||||||
| Total | 70,472,625 | |||||||||||
| Transportation: Infrastructure/Services 0.14% | ||||||||||||
| Chicago Transit Authority Sales Tax Receipts Fund | 6.20% | 12/1/2040 | 12,385 | 16,949,752 | ||||||||
| Port of Seattle WA | 3.571% | 5/1/2032 | 7,305 | 7,933,913 | ||||||||
| Port of Seattle WA | 3.755% | 5/1/2036 | 13,905 | 15,158,829 | ||||||||
| Total | 40,042,494 | |||||||||||
| Total Municipal Bonds (cost $628,313,864) | 685,724,656 | |||||||||||
| NON-AGENCY COMMERCIAL MORTGAGE-BACKED SECURITIES 5.48% | ||||||||||||
| Angel Oak Mortgage Trust 2020-1 A1† | 2.466% | #(n) | 12/25/2059 | 3,374 | 3,375,814 | |||||||
| Atrium Hotel Portfolio Trust 2018-ATRM A† | 1.06% (1 Mo. LIBOR + .95% | )# | 6/15/2035 | 35,420 | 35,397,044 | |||||||
| BBCMS Mortgage Trust 2018-C2 C | 4.969% | #(n) | 12/15/2051 | 15,628 | 17,280,477 | |||||||
| BBCMS Mortgage Trust 2019-BWAY A† | 1.066% (1 Mo. LIBOR + .96% | )# | 11/15/2034 | 25,000 | 24,950,990 | |||||||
| Benchmark Mortgage Trust 2019-B12 WMA† | 4.246% | #(n) | 8/15/2052 | 35,544 | 35,258,582 | |||||||
| BHMS 2018-ATLS A† | 1.36% (1 Mo. LIBOR + 1.25% | )# | 7/15/2035 | 61,190 | 61,236,651 | |||||||
| BX 2021-MFM1 B† | 1.06% (1 Mo. LIBOR + .95% | )# | 1/15/2034 | 7,100 | 7,052,558 | |||||||
| BX 2021-MFM1 C† | 1.31% (1 Mo. LIBOR + 1.20% | )# | 1/15/2034 | 4,250 | 4,223,429 | |||||||
| BX Commercial Mortgage Trust 2020-VIV4 A† | 2.843% | 3/9/2044 | 14,171 | 14,578,959 | ||||||||
| BX Commercial Mortgage Trust 2021-VOLT A† | 0.81% (1 Mo. LIBOR + .70% | )# | 9/15/2036 | 53,040 | 52,932,419 | |||||||
| BX Trust 2021-ARIA F† | 2.704% (1 Mo. LIBOR + 2.59% | )# | 10/15/2036 | 107,730 | 107,376,085 | |||||||
| CF Trust 2019-BOSS A1 | 4.75% (1 Mo. LIBOR + 3.25% | )# | 12/15/2021 | 18,200 | 16,852,836 | |||||||
| Citigroup Commercial Mortgage Trust 2016-GC36 C | 4.75% | #(n) | 2/10/2049 | 8,580 | 8,780,113 | |||||||
| Citigroup Commercial Mortgage Trust 2016-P3 D† | 2.804% | #(n) | 4/15/2049 | 9,991 | 8,251,895 | |||||||
| COMM Mortgage Trust 2014-UBS5 AM | 4.193% | #(n) | 9/10/2047 | 17,906 | 18,808,190 | |||||||
| COMM Mortgage Trust 2020-SBX C† | 2.056% | #(n) | 1/10/2038 | 5,900 | 5,773,466 | |||||||
| COMM Mortgage Trust 2020-SBX D† | 2.321% | #(n) | 1/10/2038 | 8,000 | 7,787,544 | |||||||
| 48 | See Notes to Financial Statements. |
Schedule of Investments (continued)
December 31, 2021
| Principal | ||||||||||||
| Interest | Maturity | Amount | Fair | |||||||||
| Investments | Rate | Date | (000) | Value | ||||||||
| NON-AGENCY COMMERCIAL MORTGAGE-BACKED SECURITIES (continued) | ||||||||||||
| Commercial Mortgage Pass-Through Certificates 2020-SBX A† | 1.67% | 1/10/2038 | $ | 7,500 | $ | 7,464,537 | ||||||
| Connecticut Avenue Securities Trust 2021-R01 1B1† | 3.15% (1 Mo. SOFR + 3.10% | )# | 10/25/2041 | 41,314 | 41,803,059 | |||||||
| Connecticut Avenue Securities Trust 2021-R03 1B1† | 2.80% (1 Mo. SOFR + 2.75% | )# | 12/25/2041 | 27,550 | 27,594,835 | |||||||
| Credit Suisse Mortgage Capital Certificates 2019-ICE4 C† | 1.54% (1 Mo. LIBOR + 1.43% | )# | 5/15/2036 | 52,000 | 51,910,622 | |||||||
| Credit Suisse Mortgage Capital Certificates 2019-ICE4 D† | 1.71% (1 Mo. LIBOR + 1.60% | )# | 5/15/2036 | 14,076 | 14,043,815 | |||||||
| Credit Suisse Mortgage Capital Certificates 2021-BRIT A† | 3.709% (1 Mo. LIBOR + 3.46% | )# | 5/15/2023 | 86,900 | 86,755,537 | |||||||
| CS Master Trust 2021-AHP A† | 4.449% (1 Mo. LIBOR + 3.95% | )# | 4/15/2025 | 34,200 | 34,269,831 | |||||||
| CS Master Trust 2021-BLUF A† | 4.527% (1 Mo. LIBOR + 4.18% | )# | 4/15/2023 | 19,500 | 19,681,642 | |||||||
| CSMC 2020-AFC1 Trust A1† | 2.24% | #(n) | 2/25/2050 | 9,437 | 9,477,045 | |||||||
| CSMC 2021-BHAR D† | 2.86% (1 Mo. LIBOR + 2.75% | )# | 11/15/2038 | 8,826 | 8,838,149 | |||||||
| CSMC 2021-BHAR E† | 3.61% (1 Mo. LIBOR + 3.50% | )# | 11/15/2038 | 12,920 | 12,929,913 | |||||||
| CSMC 2021-BHAR F† | 4.36% (1 Mo. LIBOR + 4.25% | )# | 11/15/2038 | 10,223 | 10,230,715 | |||||||
| CSMC 2021-BPNY A† | 3.824% (1 Mo. LIBOR + 3.71% | )# | 8/15/2023 | 47,580 | 47,566,792 | |||||||
| Deephaven Residential Mortgage Trust 2020-1 A1† | 2.339% | #(n) | 1/25/2060 | 4,455 | 4,460,254 | |||||||
| Fannie Mae Connecticut Avenue Securities 2021-R02 2B1† | 3.35% (1 Mo. SOFR + 3.30% | )# | 11/25/2041 | 11,740 | 11,848,459 | |||||||
| Fontainebleau Miami Beach Trust 2019-FBLU A† | 3.144% | 12/10/2036 | 13,540 | 13,850,808 | ||||||||
| Fontainebleau Miami Beach Trust 2019-FBLU B† | 3.447% | 12/10/2036 | 13,500 | 13,792,521 | ||||||||
| Freddie Mac STACR REMIC Trust 2021-DNA6 B1† | 3.45% (1 Mo. SOFR + 3.40% | )# | 10/25/2041 | 66,590 | 67,129,113 | |||||||
| Freddie Mac Structured Agency Credit Risk Debt Notes 2021-DNA7 B1† | 3.70% (1 Mo. SOFR + 3.65% | )# | 11/25/2041 | 48,390 | 49,235,935 | |||||||
| GCAT Trust 2020-NQM1 A1† | 2.247% | 1/25/2060 | 2,465 | 2,471,135 | ||||||||
| Great Wolf Trust 2019-WOLF A† | 1.144% (1 Mo. LIBOR + 1.03% | )# | 12/15/2036 | 53,981 | 53,973,184 | |||||||
| Great Wolf Trust 2019-WOLF D† | 2.043% (1 Mo. LIBOR + 1.93% | )# | 12/15/2036 | 50,508 | 49,959,039 | |||||||
| GS Mortgage Securities Corp. II 2021-ARDN C† | 2.16% (1 Mo. LIBOR + 2.05% | )# | 11/15/2036 | 15,930 | 15,959,869 | |||||||
| GS Mortgage Securities Corp. II 2021-ARDN D† | 2.86% (1 Mo. LIBOR + 2.75% | )# | 11/15/2036 | 27,860 | 27,912,237 | |||||||
| See Notes to Financial Statements. | 49 |
Schedule of Investments (continued)
December 31, 2021
| Principal | ||||||||||||
| Interest | Maturity | Amount | Fair | |||||||||
| Investments | Rate | Date | (000) | Value | ||||||||
| NON-AGENCY COMMERCIAL MORTGAGE-BACKED SECURITIES (continued) | ||||||||||||
| GS Mortgage Securities Corp. Trust 2021-RENT E† | 2.853% (1 Mo. LIBOR + 2.75% | )# | 11/21/2035 | $ | 11,567 | $ | 11,527,908 | |||||
| GS Mortgage Securities Corp. Trust 2021-RENT F† | 3.753% (1 Mo. LIBOR + 3.65% | )# | 11/21/2035 | 8,500 | 8,474,355 | |||||||
| GS Mortgage Securities Corp. Trust 2021-RENT G† | 5.803% (1 Mo. LIBOR + 5.70% | )# | 11/21/2035 | 600 | 606,231 | |||||||
| GS Mortgage Securities Corp. Trust 2021-RSMZ MZ† | 9.61% (1 Mo. LIBOR + 9.50% | )# | 6/15/2026 | 70,375 | 70,544,723 | |||||||
| GS Mortgage Securities Trust 2020-GSA2 E† | 2.25% | 12/12/2053 | 9,450 | 7,661,427 | ||||||||
| Hilton Orlando Trust 2018-ORL A† | 1.03% (1 Mo. LIBOR + .92% | )# | 12/15/2034 | 9,443 | 9,441,545 | |||||||
| HPLY Trust 2019-HIT A† | 1.11% (1 Mo. LIBOR + 1.00% | )# | 11/15/2036 | 17,133 | 17,118,120 | |||||||
| JPMCC Commercial Mortgage Securities Trust 2017-JP5 C | 3.85% | #(n) | 3/15/2050 | 11,612 | 11,860,049 | |||||||
| JPMorgan Chase Commercial Mortgage Securities Trust 2017-MARK A† | 3.392% | 6/5/2032 | 18,000 | 18,068,638 | ||||||||
| JPMorgan Chase Commercial Mortgage Securities Trust 2020-ACE A† | 3.287% | 1/10/2037 | 10,530 | 10,741,265 | ||||||||
| JPMorgan Chase Commercial Mortgage Securities Trust 2020-ACE B† | 3.64% | 1/10/2037 | 8,690 | 8,770,217 | ||||||||
| JPMorgan Chase Commercial Mortgage Securities Trust 2021-BOLT D† | 6.81% (1 Mo. LIBOR + 6.70% | )# | 8/15/2033 | 42,015 | 42,067,099 | |||||||
| KIND Trust 2021-KIND E† | 3.36% (1 Mo. LIBOR + 3.25% | )# | 8/15/2038 | 47,580 | 47,269,640 | |||||||
| KKR Industrial Portfolio Trust 2021-KDIP D† | 1.36% (1 Mo. LIBOR + 1.25% | )# | 12/15/2037 | 4,598 | 4,550,249 | |||||||
| KKR Industrial Portfolio Trust 2021-KDIP E† | 1.66% (1 Mo. LIBOR + 1.55% | )# | 12/15/2037 | 7,433 | 7,343,456 | |||||||
| KKR Industrial Portfolio Trust 2021-KDIP F† | 2.16% (1 Mo. LIBOR + 2.05% | )# | 12/15/2037 | 8,148 | 8,013,524 | |||||||
| Life Mortgage Trust 2021-BMR E† | 1.86% (1 Mo. LIBOR + 1.75% | )# | 3/15/2038 | 22,900 | 22,715,224 | |||||||
| New Residential Mortgage Loan Trust 2020-NQM1 A1† | 2.464% | #(n) | 1/26/2060 | 2,969 | 2,978,495 | |||||||
| One New York Plaza Trust 2020-1NYP B† | 1.61% (1 Mo. LIBOR + 1.50% | )# | 1/15/2036 | 9,400 | 9,378,594 | |||||||
| One New York Plaza Trust 2020-1NYP C† | 2.31% (1 Mo. LIBOR + 2.20% | )# | 1/15/2036 | 23,620 | 23,624,634 | |||||||
| One New York Plaza Trust 2020-1NYP D† | 2.86% (1 Mo. LIBOR + 2.75% | )# | 1/15/2036 | 8,500 | 8,521,501 | |||||||
| PFP Ltd. 2019-6 A† | 1.158% (1 Mo. LIBOR + 1.05% | )# | 4/14/2037 | 7,793 | 7,786,299 | |||||||
| 50 | See Notes to Financial Statements. |
Schedule of Investments (continued)
December 31, 2021
| Dividend | Maturity | Shares | Fair | |||||||||
| Investments | Rate | Date | (000) | Value | ||||||||
| NON-AGENCY COMMERCIAL MORTGAGE-BACKED SECURITIES (continued) | ||||||||||||
| PFP Ltd. 2019-6 C† | 2.208% (1 Mo. LIBOR + 2.10% | )# | 4/14/2037 | 27,054 | $ | 26,985,804 | ||||||
| Residential Mortgage Loan Trust 2020-1 A1† | 2.376% | #(n) | 1/26/2060 | 2,492 | 2,505,053 | |||||||
| SLG Office Trust 2021-OVA E† | 2.851% | 7/15/2041 | 44,590 | 42,409,660 | ||||||||
| Starwood Mortgage Residential Trust 2020-1 A1† | 2.275% | #(n) | 2/25/2050 | 3,727 | 3,743,743 | |||||||
| Verus Securitization Trust 2020-1 A1† | 2.417% | 1/25/2060 | 3,336 | 3,347,592 | ||||||||
| Wells Fargo Commercial Mortgage Trust 2020-SDAL A† | 1.12% (1 Mo. LIBOR + 1.01% | )# | 2/15/2037 | 9,878 | 9,822,826 | |||||||
| Total Non-Agency Commercial Mortgage-Backed Securities (cost $1,557,115,980) | 1,560,953,969 | |||||||||||
| PREFERRED STOCKS 0.04% | ||||||||||||
| Transportation Infrastructure | ||||||||||||
| ACBL Holdings Corp. Series A | Zero Coupon | 167 | 4,594,095 | |||||||||
| ACBL Holdings Corp. Series B | Zero Coupon | 205 | 5,639,398 | |||||||||
| Total Preferred Stocks (cost $9,303,175) | 10,233,493 | |||||||||||
| Total Long-Term Investments (cost $27,113,129,445) | 28,005,646,428 | |||||||||||
| Principal | ||||||||||||
| Amount | ||||||||||||
| (000) | ||||||||||||
| SHORT-TERM INVESTMENTS 0.79% | ||||||||||||
| REPURCHASE AGREEMENTS 0.51% | ||||||||||||
| Repurchase Agreement dated 12/31/2021, 0.00% due 1/3/2022 with Fixed Income Clearing Corp. collateralized by $43,917,700 of U.S. Treasury Note at 1.375% due 10/31/2028; $95,339,700 of U.S. Treasury Note at 3.125% due 11/15/2028; value: $150,275,880; proceeds: $147,329,234 (cost $147,329,234) | $ | 147,329 | 147,329,234 | |||||||||
| Shares | ||||||||||||
| Money Market Funds 0.25% | ||||||||||||
| Fidelity Government Portfolio(o) (cost $71,062,642) | 71,062,642 | 71,062,642 | ||||||||||
| Time Deposits 0.03% | ||||||||||||
| CitiBank N.A.(o) (cost $7,895,850) | 7,895,850 | 7,895,850 | ||||||||||
| Total Short-Term Investments (cost $226,287,726) | 226,287,726 | |||||||||||
| Total Investments in Securities 99.03% (cost $27,339,417,171) | 28,231,934,154 | |||||||||||
| Less Unfunded Loan Commitments (0.01%) (cost $1,492,586)(p) | (1,478,593 | ) | ||||||||||
| See Notes to Financial Statements. | 51 |
Schedule of Investments (continued)
December 31, 2021
| Fair | ||||||||||||
| Investments | Value | |||||||||||
| Net Investments in Securities 99.02% (cost $27,337,924,585) | $ | 28,230,455,561 | ||||||||||
| Other Assets and Liabilities – Net(q) 0.98% | 277,017,415 | |||||||||||
| Net Assets 100.00% | $ | 28,507,472,976 | ||||||||||
| AUD | Australian Dollar. | ||
| EUR | Euro. | ||
| GBP | British Pound. | ||
| HKD | Hong Kong Dollar. | ||
| JPY | Japanese Yen. | ||
| ADR | American Depositary Receipt. | ||
| CMT | Constant Maturity Rate. | ||
| EURIBOR | Euro Interbank Offered Rate. | ||
| ICE | Intercontinental Exchange. | ||
| LIBOR | London Interbank Offered Rate. | ||
| PIK | Payment-in-kind. | ||
| SOFR | Secured Over Night Financing Rate. | ||
| † | Security was purchased pursuant to Rule 144A under the Securities Act of 1933 and, unless registered under such Act or exempted from registration, may only be resold to qualified institutional buyers. At December 31, 2021, the total value of Rule 144A securities was $13,302,718,913, which represents 46.67% of net assets. | |
| # | Variable rate security. The interest rate represents the rate in effect at December 31, 2021. | |
| * | Non-income producing security. | |
| (a) | Variable Rate is Fixed to Float: Rate remains fixed or at Zero Coupon until designated future date. | |
| (b) | Investment in non-U.S. dollar denominated securities. | |
| (c) | All or a portion of this security is temporarily on loan to unaffiliated broker/dealers. | |
| (d) | Foreign security traded in U.S. dollars. | |
| (e) | Level 3 Investment as described in Note 2(p) in the Notes to Schedule of Investments. Security valued utilizing third party pricing information without adjustment. Such valuations are based on unobservable inputs. A significant change in third party information could result in a significantly lower or higher value of such Level 3 investments. | |
| (f) | Security is perpetual in nature and has no stated maturity. | |
| (g) | Defaulted (non-income producing security). | |
| (h) | Level 3 Investment as described in Note 2(p) in the Notes to Financials. Security fair valued by the Pricing Committee. | |
| (i) | Floating Rate Loans in which the Fund invests generally pay interest at rates which are periodically re-determined at a margin above the London Interbank Offered Rate (“LIBOR”) or the prime rate offered by major U.S. banks. The rate(s) shown is the rate(s) in effect at December 31, 2021. | |
| (j) | Level 3 Investment as described in Note 2(p) in the Notes to Financials. Floating Rate Loans categorized as Level 3 are valued based on a single quotation obtained from a dealer. Accounting principles generally accepted in the United States of America do not require the Fund to create quantitative unobservable inputs that were not developed by the Fund. Therefore, the Fund does not have access to unobservable inputs and cannot disclose such inputs in the valuation. | |
| (k) | Interest rate to be determined. | |
| (l) | Security partially/fully unfunded. See Note 2(n). | |
| (m) | Security has been fully or partially segregated for open reverse repurchase agreements as of December 31, 2021. See Note 2(m). | |
| (n) | Interest rate is based on the weighted average interest rates of the underlying mortgages within the mortgage pool. | |
| (o) | Security was purchased with the cash collateral from loaned securities. | |
| (p) | See Note 2(n). | |
| (q) | Other Assets and Liabilities – Net include net unrealized appreciation/depreciation on forward foreign currency exchange contracts, futures contracts and swaps as follows: |
| 52 | See Notes to Financial Statements. |
Schedule of Investments (continued)
December 31, 2021
Centrally Cleared Credit Default Swaps on Index/Issuer - Buy Protection at December 31, 2021(1):
| Referenced | Central | Fund Pays | Termination | Notional | Payments | Unrealized | ||||||||||||
| Index/Issuer | Clearing Party | (Quarterly) | Date | Amount | Upfront(2) | Appreciation(3) | ||||||||||||
| Markit CDX.NA.EM.36(4)(5) | Bank of America | 1.000% | 12/20/2026 | $1,123,718,000 | $43,646,696 | $1,714,698 | ||||||||||||
| Referenced | Central | Fund Pays | Termination | Notional | Payments | Unrealized | ||||||||||||
| Index/Issuer | Clearing Party | (Quarterly) | Date | Amount | Upfront(2) | Depreciation(3) | ||||||||||||
| Republic of Brazil(4)(6) | Bank of America | 1.000% | 12/20/2026 | $116,477,805 | $7,250,053 | $(1,629,687 | ) | |||||||||||
| (1) | If the Fund is a buyer of protection and a credit event occurs, as defined under the terms of that particular swap agreement, the Fund will either (i) receive from the seller of protection an amount equal to the notional amount of the swap and take delivery of the referenced obligation or underlying securities comprising the referenced index or (ii) receive net settlement amount in the form of cash or securities equal to the notional amount of the swap less the recovery value of the referenced obligation or underlying securities. | |
| (2) | Upfront payments paid/received by Central Clearing Party are presented net of amortization. | |
| (3) | Total unrealized appreciation on Credit Default Swaps on Indexes/Issuers amounted to $1,714,698. Total unrealized depreciation on Credit Default Swaps on Indexes/Issuers amounted to $1,629,687. | |
| (4) | Central Clearinghouse: Intercontinental Exchange (ICE). | |
| (5) | The Referenced Index is for the Centrally Cleared Credit Default Swaps on Indexes, which is comprised of a basket of emerging markets sovereign issuers. | |
| (6) | Moody’s Credit Rating Ba2. |
Credit Default Swaps on Indexes - Sell Protection at December 31, 2021(1):
| Credit | ||||||||||||||||||||||
| Default | ||||||||||||||||||||||
| Swap | ||||||||||||||||||||||
| Fund | Unrealized | Agreements | ||||||||||||||||||||
| Referenced | Swap | Receives | Termination | Notional | Payments | Appreciation/ | Receivable at | |||||||||||||||
| Index* | Counterparty | (Quarterly) | Date | Amount | Upfront(2) | (Depreciation) | (3) | Fair Value(4) | ||||||||||||||
| Markit MBX.NA.AA.8 | Citibank | 1.500% | 10/17/2057 | $18,980,000 | $95,072 | $37,042 | $132,114 | |||||||||||||||
| Credit | ||||||||||||||||||||||
| Default | ||||||||||||||||||||||
| Swap | ||||||||||||||||||||||
| Fund | Unrealized | Agreements | ||||||||||||||||||||
| Referenced | Swap | Receives | Termination | Notional | Payments | Appreciation/ | Payable at | |||||||||||||||
| Index* | Counterparty | (Quarterly) | Date | Amount | Upfront(2) | (Depreciation) | (3) | Fair Value(4) | ||||||||||||||
| Markit MBX.NA.AA.7 | Citibank | 1.500% | 1/17/2047 | $ | 9,490,000 | $ | (115,297 | ) | $ | (31,608) | $ | (146,905 | ) | |||||||||
| Markit CMBX.NA.BBB-.9 | Citibank | 3.000% | 9/17/2058 | 100,000,000 | (9,749,751 | ) | 353,235 | (9,396,516 | ) | |||||||||||||
| Markit CMBX.NA.BBB-.9 | Citibank | 3.000% | 9/17/2058 | 23,760,000 | (2,515,901 | ) | 283,289 | (2,232,612 | ) | |||||||||||||
| Markit CMBX.NA.BBB-.9 | Morgan Stanley | 3.000% | 9/17/2058 | 35,000,000 | (2,933,856 | ) | (354,925) | (3,288,781 | ) | |||||||||||||
| Markit CMBX.NA.BBB-.10 | Citibank | 3.000% | 11/17/2059 | 10,000,000 | (865,649 | ) | (28,614) | (894,263 | ) | |||||||||||||
| Markit CMBX.NA.BBB-.10 | Morgan Stanley | 3.000% | 11/17/2059 | 14,950,000 | (1,294,145 | ) | (42,779) | (1,336,924 | ) | |||||||||||||
| Markit CMBX.NA.BBB-.10 | Morgan Stanley | 3.000% | 11/17/2059 | 22,050,000 | (2,737,114 | ) | 765,263 | (1,971,851 | ) | |||||||||||||
| See Notes to Financial Statements. | 53 |
Schedule of Investments (continued)
December 31, 2021
| Credit | ||||||||||||||||||||||
| Default | ||||||||||||||||||||||
| Swap | ||||||||||||||||||||||
| Fund | Unrealized | Agreements | ||||||||||||||||||||
| Referenced | Swap | Receives | Termination | Notional | Payments | Appreciation/ | Payable at | |||||||||||||||
| Index* | Counterparty | (Quarterly) | Date | Amount | Upfront(2) | (Depreciation) | (3) | Fair Value(4) | ||||||||||||||
| Markit CMBX.NA.BBB-.12 | Citibank | 3.000% | 8/17/2061 | 30,000,000 | $ | (1,382,502 | ) | $ | (165,353 | ) | $ | (1,547,855 | ) | |||||||||
| Markit CMBX.NA.BBB-.12 | Morgan Stanley | 3.000% | 8/17/2061 | 22,000,000 | (1,499,370 | ) | 364,276 | (1,135,094 | ) | |||||||||||||
| $ | (23,093,585 | ) | $ | 1,142,784 | $ | (21,950,801 | ) | |||||||||||||||
| Total Credit Default Swaps on Indexes - Sell Protection | $ | (22,998,513 | ) | $ | 1,179,826 | $ | (21,818,687 | ) | ||||||||||||||
| * | The Referenced Index is for the Credit Default Swaps on Indexes, which is comprised of a basket of commercial mortgage-backed securities. | |
| (1) | If the Fund is a seller of protection and a credit event occurs, as defined under the terms of that particular swap agreement, the Fund will either (i) pay to the buyer of protection an amount equal to the notional amount of the swap and take delivery of the referenced obligation or underlying securities comprising the referenced index or (ii) pay a net settlement amount in the form of cash or securities equal to the notional amount of the swap less the recovery value of the referenced obligation or underlying securities. | |
| (2) | Upfront payments paid/received are presented net of amortization. See Note 2(i). | |
| (3) | Total unrealized appreciation on Credit Default Swaps on Indexes amounted to $1,803,105. Total unrealized depreciation on Credit Default Swaps on Indexes amounted to $623,279. | |
| (4) | Includes upfront payments received. |
Open Forward Foreign Currency Exchange Contracts at December 31, 2021:
| Forward | ||||||||||||||||||||
| Foreign | U.S. $ | |||||||||||||||||||
| Currency | Cost on | U.S. $ | ||||||||||||||||||
| Exchange | Transaction | Expiration | Foreign | Origination | Current | Unrealized | ||||||||||||||
| Contracts | Type | Counterparty | Date | Currency | Date | Value | Appreciation | |||||||||||||
| Euro | Buy | Standard Chartered Bank | 3/10/2022 | 7,501,000 | $ | 8,463,131 | $ | 8,551,210 | $ | 88,079 | ||||||||||
| Japanese yen | Sell | Morgan Stanley | 2/8/2022 | 3,405,000,000 | 29,976,389 | 29,608,401 | 367,988 | |||||||||||||
| Japanese yen | Sell | Standard Chartered Bank | 2/8/2022 | 3,307,000,000 | 29,010,243 | 28,756,236 | 254,007 | |||||||||||||
| Unrealized Appreciation on Forward Foreign Currency Exchange Contracts | $ | 710,074 | ||||||||||||||||||
| Forward | ||||||||||||||||||||
| Foreign | U.S. $ | |||||||||||||||||||
| Currency | Cost on | U.S. $ | ||||||||||||||||||
| Exchange | Transaction | Expiration | Foreign | Origination | Current | Unrealized | ||||||||||||||
| Contracts | Type | Counterparty | Date | Currency | Date | Value | Depreciation | |||||||||||||
| Australian dollar | Sell | State Street Bank and Trust | 3/1/2022 | 39,833,000 | $ | 28,413,648 | $ | 28,984,235 | $ | (570,587 | ) | |||||||||
| British pound | Sell | Goldman Sachs | 3/7/2022 | 71,111,000 | 94,181,186 | 96,227,615 | (2,046,429 | ) | ||||||||||||
| Euro | Sell | Credit Agricole | 3/10/2022 | 15,457,000 | 17,461,159 | 17,621,124 | (159,965 | ) | ||||||||||||
| Euro | Sell | Morgan Stanley | 3/10/2022 | 282,486,000 | 321,324,153 | 322,036,665 | (712,512 | ) | ||||||||||||
| Euro | Sell | Morgan Stanley | 3/10/2022 | 14,540,000 | 16,422,879 | 16,575,735 | (152,856 | ) | ||||||||||||
| Euro | Sell | State Street Bank and Trust | 3/10/2022 | 37,300,000 | 42,207,307 | 42,522,347 | (315,040 | ) | ||||||||||||
| Unrealized Depreciation on Forward Foreign Currency Exchange Contracts | $ | (3,957,389 | ) | |||||||||||||||||
| 54 | See Notes to Financial Statements. |
Schedule of Investments (continued)
December 31, 2021
Open Futures Contracts at December 31, 2021:
| Notional | Notional | Unrealized | ||||||||||||||||
| Type | Expiration | Contracts | Position | Amount | Value | Appreciation | ||||||||||||
| U.S. Long Bond | March 2022 | 2,576 | Short | $ | (413,943,511) | $ | (413,287,000 | ) | $ | 656,511 | ||||||||
| Notional | Notional | Unrealized | ||||||||||||||||
| Type | Expiration | Contracts | Position | Amount | Value | Depreciation | ||||||||||||
| U.S. 2-Year Treasury Note | March 2022 | 3,157 | Short | $ | (688,572,570) | $ | (688,768,613 | ) | $ | (196,043 | ) | |||||||
| U.S. 5-Year Treasury Note | March 2022 | 13,214 | Long | 1,605,193,748 | 1,598,584,303 | (6,609,445 | ) | |||||||||||
| U.S. 10-Year Treasury Note | March 2022 | 3,118 | Short | (402,167,295) | (406,801,563 | ) | (4,634,268 | ) | ||||||||||
| U.S. 10-Year Ultra Treasury Bond | March 2022 | 979 | Long | 143,668,724 | 143,362,313 | (306,411 | ) | |||||||||||
| U.S. Ultra Treasury Bond | March 2022 | 1,072 | Short | (210,215,491) | (211,318,000 | ) | (1,102,509 | ) | ||||||||||
| Total Unrealized Depreciation on Open Futures Contracts | $ | (12,848,676 | ) | |||||||||||||||
Reverse Repurchase Agreement Payable as of December 31, 2021:
| Collateral | ||||||||||||||||
| Held by | Interest | Trade | Maturity | Fair | ||||||||||||
| Counterparty | Principal | Counterparty | Rate(1) | Date | Date(2) | Value(3) | ||||||||||
| Barclays Bank PLC | $3,880,070 | $6,310,000 principal, Sri Lanka Government International Bond at 5.875% due 7/25/2022, $4,304,998 fair value | (10.00%) | 12/10/2021 | On Demand | $3,854,284 | ||||||||||
| (1) | The negative interest rate on the reverse repurchase agreement results in interest income to the Fund. | |
| (2) | This reverse repurchase agreement has no stated maturity and may be terminated by either party at any time. | |
| (3) | Total fair value of reverse repurchase agreement is presented net of interest receivable of $25,786. |
| See Notes to Financial Statements. | 55 |
Schedule of Investments (continued)
December 31, 2021
The following is a summary of the inputs used as of December 31, 2021 in valuing the Fund’s investments carried at fair value(1):
| Investment Type(2) | Level 1 | Level 2 | Level 3 | Total | ||||||||||||
| Long-Term Investments | ||||||||||||||||
| Asset-Backed Securities | $ | – | $ | 1,783,183,414 | $ | – | $ | 1,783,183,414 | ||||||||
| Common Stocks | ||||||||||||||||
| Auto Components | – | 4,552,928 | – | 4,552,928 | ||||||||||||
| Automobiles | 95,561,607 | 41,960,569 | – | 137,522,176 | ||||||||||||
| Electric-Generation | – | 275,612 | – | 275,612 | ||||||||||||
| Electronic Equipment, Instruments & Components | 44,789,034 | 28,546,760 | – | 73,335,794 | ||||||||||||
| Information Technology Services | 191,033,737 | 30,182,245 | – | 221,215,982 | ||||||||||||
| Marine | – | 34,035,602 | – | 34,035,602 | ||||||||||||
| Miscellaneous Financials | – | 6,005,060 | – | 6,005,060 | ||||||||||||
| Personal Products | – | 60,666,979 | – | 60,666,979 | ||||||||||||
| Pharmaceuticals | – | 29,486,546 | – | 29,486,546 | ||||||||||||
| Semiconductors & Semiconductor Equipment | 272,860,227 | 34,367,020 | – | 307,227,247 | ||||||||||||
| Specialty Retail | 133,344,046 | – | 4,966,332 | 138,310,378 | ||||||||||||
| Textiles, Apparel & Luxury Goods | – | 43,638,591 | – | 43,638,591 | ||||||||||||
| Transportation Infrastructure | – | 1,234,668 | – | 1,234,668 | ||||||||||||
| Remaining Industries | 2,361,465,362 | – | – | 2,361,465,362 | ||||||||||||
| Convertible Bonds | – | 111,466,627 | – | 111,466,627 | ||||||||||||
| Corporate Bonds | ||||||||||||||||
| Diversified Financial Services | – | 643,172,997 | 1,500 | 643,174,497 | ||||||||||||
| Mining | – | 442,116,330 | 19 | 442,116,349 | ||||||||||||
| Savings & Loans | – | – | 2,250 | 2,250 | ||||||||||||
| Remaining Industries | – | 17,054,492,483 | – | 17,054,492,483 | ||||||||||||
| Floating Rate Loans | ||||||||||||||||
| Electric: Generation | – | 41,555,338 | 1,888,904 | 43,444,242 | ||||||||||||
| Personal & Household Products | – | 26,941,696 | 104,809 | 27,046,505 | ||||||||||||
| Remaining Industries | – | 1,501,829,834 | – | 1,501,829,834 | ||||||||||||
| Less Unfunded Commitments | – | (1,478,593 | ) | – | (1,478,593 | ) | ||||||||||
| Foreign Government Obligations | – | 723,005,184 | – | 723,005,184 | ||||||||||||
| Municipal Bonds | – | 685,724,656 | – | 685,724,656 | ||||||||||||
| Non-Agency Commercial Mortgage-Backed Securities | – | 1,560,953,969 | – | 1,560,953,969 | ||||||||||||
| Preferred Stocks | – | 10,233,493 | – | 10,233,493 | ||||||||||||
| Short-Term Investments | ||||||||||||||||
| Repurchase Agreements | – | 147,329,234 | – | 147,329,234 | ||||||||||||
| Money Market Funds | 71,062,642 | – | – | 71,062,642 | ||||||||||||
| Time Deposits | – | 7,895,850 | – | 7,895,850 | ||||||||||||
| Total | $ | 3,170,116,655 | $ | 25,053,375,092 | $ | 6,963,814 | $ | 28,230,455,561 | ||||||||
| 56 | See Notes to Financial Statements. |
Schedule of Investments (concluded)
December 31, 2021
| Investment Type(2) | Level 1 | Level 2 | Level 3 | Total | ||||||||||||
| Other Financial Instruments | ||||||||||||||||
| Centrally Cleared Credit Default Swaps Contracts | ||||||||||||||||
| Assets | $ | – | $ | 1,714,698 | $ | – | $ | 1,714,698 | ||||||||
| Liabilities | – | (1,629,687 | ) | – | (1,629,687 | ) | ||||||||||
| Credit Default Swaps Contracts | ||||||||||||||||
| Assets | – | 132,114 | – | 132,114 | ||||||||||||
| Liabilities | – | (21,950,801 | ) | – | (21,950,801 | ) | ||||||||||
| Forward Foreign Currency Exchange Contracts | ||||||||||||||||
| Assets | – | 710,074 | – | 710,074 | ||||||||||||
| Liabilities | – | (3,957,389 | ) | – | (3,957,389 | ) | ||||||||||
| Futures Contracts | ||||||||||||||||
| Assets | 656,511 | – | – | 656,511 | ||||||||||||
| Liabilities | (12,848,676 | ) | – | – | (12,848,676 | ) | ||||||||||
| Reverse Repurchase Agreements | ||||||||||||||||
| Assets | – | – | – | – | ||||||||||||
| Liabilities | – | (3,854,284 | ) | – | (3,854,284 | ) | ||||||||||
| Total | $ | (12,192,165 | ) | $ | (28,835,275 | ) | $ | – | $ | (41,027,440 | ) | |||||
| (1) | Refer to Note 2(p) for a description of fair value measurements and the three-tier hierarchy of inputs. | |
| (2) | See Schedule of Investments for fair values in each industry and identification of foreign issuers and/or geography. The table above is presented by Investment Type. Industries are presented within an Investment Type should such Investment Type include securities classified as two or more levels within the three-tier fair value hierarchy. When applicable each Level 3 security is identified on the Schedule of Investments along with the valuation technique utilized. |
A reconciliation of Level 3 investments is presented when the Fund has a material amount of Level 3 investments at the beginning or end of the year in relation to the Fund’s net assets. Management has determined not to provide a reconciliation as the balance of Level 3 investments was not considered to be material to the Fund’s net assets at the beginning or end of the year.
| See Notes to Financial Statements. | 57 |
Statement of Assets and Liabilities
December 31, 2021
| ASSETS: | ||||
| Investments in securities, at fair value including $76,846,398 of securities loaned (cost $27,337,924,585) | $ | 28,230,455,561 | ||
| Cash | 46,502,718 | |||
| Deposits with brokers for futures collateral | 12,735,525 | |||
| Deposit with brokers for forwards and swaps collateral | 69,671,694 | |||
| Receivables: | ||||
| Interest and dividends | 264,151,768 | |||
| Investment securities sold | 186,508,620 | |||
| Capital shares sold | 177,333,267 | |||
| Securities lending income receivable | 30,780 | |||
| Credit default swap agreements receivable, at fair value (including upfront payments of $95,072) | 132,114 | |||
| Unrealized appreciation on forward foreign currency exchange contracts | 710,074 | |||
| Prepaid expenses and other assets | 763,206 | |||
| Total assets | 28,988,995,327 | |||
| LIABILITIES: | ||||
| Payables: | ||||
| Investment securities purchased | 218,055,862 | |||
| Capital shares reacquired | 55,377,354 | |||
| Management fee | 9,997,205 | |||
| 12b-1 distribution plan | 3,439,343 | |||
| Directors’ fees | 2,501,068 | |||
| Variation margin for futures contracts | 2,001,459 | |||
| Fund administration | 955,131 | |||
| Variation margin for centrally cleared credit default swap agreements | 100,485 | |||
| Credit default swap agreements payable, at fair value (including upfront payments of $23,093,585) | 21,950,801 | |||
| Reverse repurchase agreement payable, at fair value | 3,854,284 | |||
| Payable for collateral due to broker for securities lending | 78,958,492 | |||
| Unrealized depreciation on forward foreign currency exchange contracts | 3,957,389 | |||
| Unrealized depreciation on unfunded commitments | 13,993 | |||
| Distributions payable | 77,278,643 | |||
| Accrued expenses | 3,080,842 | |||
| Total liabilities | 481,522,351 | |||
| Commitments and contingent liabilities | ||||
| NET ASSETS | $ | 28,507,472,976 | ||
| COMPOSITION OF NET ASSETS: | ||||
| Paid-in capital | $ | 27,653,865,044 | ||
| Total distributable earnings (loss) | 853,607,932 | |||
| Net Assets | $ | 28,507,472,976 |
| 58 | See Notes to Financial Statements. |
Statement of Assets and Liabilities (concluded)
December 31, 2021
| Net assets by class: | ||||
| Class A Shares | $ | 6,750,572,031 | ||
| Class C Shares | $ | 1,269,001,209 | ||
| Class F Shares | $ | 11,596,040,576 | ||
| Class F3 Shares | $ | 5,134,497,490 | ||
| Class I Shares | $ | 2,962,943,144 | ||
| Class P Shares | $ | 12,452,509 | ||
| Class R2 Shares | $ | 4,699,789 | ||
| Class R3 Shares | $ | 264,066,102 | ||
| Class R4 Shares | $ | 74,933,560 | ||
| Class R5 Shares | $ | 30,538,203 | ||
| Class R6 Shares | $ | 407,728,363 | ||
| Outstanding shares by class: | ||||
| Class A Shares (1.8 billion shares of common stock authorized, $.001 par value) | 806,572,817 | |||
| Class C Shares (600 million shares of common stock authorized, $.001 par value) | 151,227,235 | |||
| Class F Shares (2.25 billion shares of common stock authorized, $.001 par value) | 1,387,690,480 | |||
| Class F3 Shares (900 million shares of common stock authorized, $.001 par value) | 616,362,041 | |||
| Class I Shares (900 million shares of common stock authorized, $.001 par value) | 355,983,333 | |||
| Class P Shares (160 million shares of common stock authorized, $.001 par value) | 1,454,299 | |||
| Class R2 Shares (478 million shares of common stock authorized, $.001 par value) | 561,501 | |||
| Class R3 Shares (478 million shares of common stock authorized, $.001 par value) | 31,602,785 | |||
| Class R4 Shares (478 million shares of common stock authorized, $.001 par value) | 8,950,473 | |||
| Class R5 Shares (478 million shares of common stock authorized, $.001 par value) | 3,664,453 | |||
| Class R6 Shares (478 million shares of common stock authorized, $.001 par value) | 48,950,277 | |||
| Net asset value, offering and redemption price per share (Net assets divided by outstanding shares): | ||||
| Class A Shares-Net asset value | $8.37 | |||
| Class A Shares-Maximum offering price (Net asset value plus sales charge of 2.25%) | $8.56 | |||
| Class C Shares-Net asset value | $8.39 | |||
| Class F Shares-Net asset value | $8.36 | |||
| Class F3 Shares-Net asset value | $8.33 | |||
| Class I Shares-Net asset value | $8.32 | |||
| Class P Shares-Net asset value | $8.56 | |||
| Class R2 Shares-Net asset value | $8.37 | |||
| Class R3 Shares-Net asset value | $8.36 | |||
| Class R4 Shares-Net asset value | $8.37 | |||
| Class R5 Shares-Net asset value | $8.33 | |||
| Class R6 Shares-Net asset value | $8.33 |
| See Notes to Financial Statements. | 59 |
For the Year Ended December 31, 2021
| Investment income: | ||||
| Dividends (net of foreign withholding taxes of $648,738) | $ | 28,958,613 | ||
| Securities lending net income | 1,215,687 | |||
| Interest and other | 942,660,473 | |||
| Interest earned from Interfund Lending (See Note 11) | 413 | |||
| Total investment income | 972,835,186 | |||
| Expenses: | ||||
| Management fee | 103,966,413 | |||
| 12b-1 distribution plan–Class A | 12,780,919 | |||
| 12b-1 distribution plan–Class C | 10,489,753 | |||
| 12b-1 distribution plan–Class F | 9,881,228 | |||
| 12b-1 distribution plan–Class P | 59,656 | |||
| 12b-1 distribution plan–Class R2 | 28,064 | |||
| 12b-1 distribution plan–Class R3 | 1,269,937 | |||
| 12b-1 distribution plan–Class R4 | 177,296 | |||
| Shareholder servicing | 16,242,500 | |||
| Fund administration | 9,871,641 | |||
| Registration | 1,782,144 | |||
| Directors’ fees | 1,046,089 | |||
| Reports to shareholders | 894,504 | |||
| Professional | 388,085 | |||
| Custody | 194,950 | |||
| Other | 288,625 | |||
| Gross expenses | 169,361,804 | |||
| Expense reductions (See Note 9) | (18,206 | ) | ||
| Fees waived and expenses reimbursed (See Note 3) | (194,950 | ) | ||
| Net expenses | 169,148,648 | |||
| Net investment income | 803,686,538 | |||
| Net realized and unrealized gain (loss): | ||||
| Net realized gain (loss) on investments | 671,545,928 | |||
| Net realized gain (loss) on futures contracts | 108,216,407 | |||
| Net realized gain (loss) on forward foreign currency exchange contracts | 36,391,147 | |||
| Net realized gain (loss) on swap contracts | (23,009,051 | ) | ||
| Net realized gain (loss) on foreign currency related transactions | (3,255,612 | ) | ||
| Net change in unrealized appreciation/depreciation on investments | (834,300,107 | ) | ||
| Net change in unrealized appreciation/depreciation on futures contracts | (26,971,753 | ) | ||
| Net change in unrealized appreciation/depreciation on forward foreign currency exchange contracts | 1,071,810 | |||
| Net change in unrealized appreciation/depreciation on swap contracts | 6,615,873 | |||
| Net change in unrealized appreciation/depreciation on translation of assets and liabilities denominated in foreign currencies | (126,696 | ) | ||
| Net change in unrealized appreciation/depreciation on unfunded commitments | (13,993 | ) | ||
| Net realized and unrealized gain (loss) | (63,836,047 | ) | ||
| Net Increase in Net Assets Resulting From Operations | $ | 739,850,491 |
| 60 | See Notes to Financial Statements. |
Statements of Changes in Net Assets
For the Year Ended December 31, 2021
| INCREASE IN NET ASSETS | For the Year Ended December 31, 2021 | For the Year Ended December 31, 2020 | ||||||
| Operations: | ||||||||
| Net investment income | $ | 803,686,538 | $ | 643,566,576 | ||||
| Net realized gain (loss) on investments, futures contracts, forward foreign currency exchange contracts, swaps and foreign currency related transactions | 789,888,819 | (311,504,642 | ) | |||||
| Net change in unrealized appreciation/depreciation on investments, futures contracts, forward foreign currency exchange contracts, swaps, unfunded commitments and translation of assets and liabilities denominated in foreign currencies | (853,724,866 | ) | 1,032,002,360 | |||||
| Net increase in net assets resulting from operations | 739,850,491 | 1,364,064,294 | ||||||
| Distributions to shareholders: | ||||||||
| Class A | (236,202,061 | ) | (205,376,467 | ) | ||||
| Class C | (37,879,702 | ) | (40,107,893 | ) | ||||
| Class F | (377,911,492 | ) | (257,451,494 | ) | ||||
| Class F3 | (162,949,620 | ) | (103,182,409 | ) | ||||
| Class I | (94,383,042 | ) | (62,022,180 | ) | ||||
| Class P | (451,545 | ) | (536,264 | ) | ||||
| Class R2 | (153,692 | ) | (199,665 | ) | ||||
| Class R3 | (8,624,486 | ) | (7,457,428 | ) | ||||
| Class R4 | (2,591,688 | ) | (2,344,872 | ) | ||||
| Class R5 | (1,078,303 | ) | (858,625 | ) | ||||
| Class R6 | (13,996,676 | ) | (9,237,267 | ) | ||||
| Total distributions to shareholders | (936,222,307 | ) | (688,774,564 | ) | ||||
| Capital share transactions (Net of share conversions) (See Note 16): | ||||||||
| Net proceeds from sales of shares | 12,553,674,283 | 8,046,302,557 | ||||||
| Reinvestment of distributions | 838,741,127 | 610,268,377 | ||||||
| Cost of shares reacquired | (4,989,703,717 | ) | (5,516,859,033 | ) | ||||
| Net increase in net assets resulting from capital share transactions | 8,402,711,693 | 3,139,711,901 | ||||||
| Net increase in net assets | 8,206,339,877 | 3,815,001,631 | ||||||
| NET ASSETS: | ||||||||
| Beginning of year | $ | 20,301,133,099 | $ | 16,486,131,468 | ||||
| End of year | $ | 28,507,472,976 | $ | 20,301,133,099 | ||||
| See Notes to Financial Statements. | 61 |
| Per Share Operating Performance: | ||||||||||||||||||||||||||||
| Investment Operations: | Distributions to shareholders from: | |||||||||||||||||||||||||||
| Net asset value, beginning of period | Net invest- ment income(a) | Net realized and unrealized gain (loss) | Total from invest- ment opera- tions | Net investment income | Net realized gain | Total distri- butions | ||||||||||||||||||||||
| Class A | ||||||||||||||||||||||||||||
| 12/31/2021 | $ | 8.41 | $ | 0.27 | $ | – | $ | 0.27 | $ | (0.28 | ) | $ | (0.03 | ) | $ | (0.31 | ) | |||||||||||
| 12/31/2020 | 8.13 | 0.29 | 0.30 | 0.59 | (0.31 | ) | – | (0.31 | ) | |||||||||||||||||||
| 12/31/2019 | 7.47 | 0.31 | 0.68 | 0.99 | (0.33 | ) | – | (0.33 | ) | |||||||||||||||||||
| 12/31/2018 | 8.25 | 0.33 | (0.63 | ) | (0.30 | ) | (0.36 | ) | (0.12 | ) | (0.48 | ) | ||||||||||||||||
| 12/31/2017 | 7.93 | 0.33 | 0.39 | 0.72 | (0.35 | ) | (0.05 | ) | (0.40 | ) | ||||||||||||||||||
| Class C | ||||||||||||||||||||||||||||
| 12/31/2021 | 8.43 | 0.22 | – | 0.22 | (0.23 | ) | (0.03 | ) | (0.26 | ) | ||||||||||||||||||
| 12/31/2020 | 8.16 | 0.24 | 0.29 | 0.53 | (0.26 | ) | – | (0.26 | ) | |||||||||||||||||||
| 12/31/2019 | 7.49 | 0.26 | 0.69 | 0.95 | (0.28 | ) | – | (0.28 | ) | |||||||||||||||||||
| 12/31/2018 | 8.27 | 0.28 | (0.63 | ) | (0.35 | ) | (0.31 | ) | (0.12 | ) | (0.43 | ) | ||||||||||||||||
| 12/31/2017 | 7.95 | 0.28 | 0.39 | 0.67 | (0.30 | ) | (0.05 | ) | (0.35 | ) | ||||||||||||||||||
| Class F | ||||||||||||||||||||||||||||
| 12/31/2021 | 8.40 | 0.28 | – | 0.28 | (0.29 | ) | (0.03 | ) | (0.32 | ) | ||||||||||||||||||
| 12/31/2020 | 8.12 | 0.29 | 0.31 | 0.60 | (0.32 | ) | – | (0.32 | ) | |||||||||||||||||||
| 12/31/2019 | 7.46 | 0.32 | 0.67 | 0.99 | (0.33 | ) | – | (0.33 | ) | |||||||||||||||||||
| 12/31/2018 | 8.24 | 0.34 | (0.64 | ) | (0.30 | ) | (0.36 | ) | (0.12 | ) | (0.48 | ) | ||||||||||||||||
| 12/31/2017 | 7.92 | 0.34 | 0.39 | 0.73 | (0.36 | ) | (0.05 | ) | (0.41 | ) | ||||||||||||||||||
| Class F3 | ||||||||||||||||||||||||||||
| 12/31/2021 | 8.37 | 0.29 | – | 0.29 | (0.30 | ) | (0.03 | ) | (0.33 | ) | ||||||||||||||||||
| 12/31/2020 | 8.10 | 0.31 | 0.29 | 0.60 | (0.33 | ) | – | (0.33 | ) | |||||||||||||||||||
| 12/31/2019 | 7.43 | 0.33 | 0.69 | 1.02 | (0.35 | ) | – | (0.35 | ) | |||||||||||||||||||
| 12/31/2018 | 8.21 | 0.35 | (0.63 | ) | (0.28 | ) | (0.38 | ) | (0.12 | ) | (0.50 | ) | ||||||||||||||||
| 04/04/2017 to 12/31/2017(c) | 8.01 | 0.25 | 0.27 | 0.52 | (0.27 | ) | (0.05 | ) | (0.32 | ) | ||||||||||||||||||
| Class I | ||||||||||||||||||||||||||||
| 12/31/2021 | 8.36 | 0.28 | 0.01 | (d) | 0.29 | (0.30 | ) | (0.03 | ) | (0.33 | ) | |||||||||||||||||
| 12/31/2020 | 8.09 | 0.30 | 0.29 | 0.59 | (0.32 | ) | – | (0.32 | ) | |||||||||||||||||||
| 12/31/2019 | 7.43 | 0.32 | 0.68 | 1.00 | (0.34 | ) | – | (0.34 | ) | |||||||||||||||||||
| 12/31/2018 | 8.21 | 0.34 | (0.63 | ) | (0.29 | ) | (0.37 | ) | (0.12 | ) | (0.49 | ) | ||||||||||||||||
| 12/31/2017 | 7.89 | 0.35 | 0.38 | 0.73 | (0.36 | ) | (0.05 | ) | (0.41 | ) | ||||||||||||||||||
| Class P | ||||||||||||||||||||||||||||
| 12/31/2021 | 8.60 | 0.26 | – | 0.26 | (0.27 | ) | (0.03 | ) | (0.30 | ) | ||||||||||||||||||
| 12/31/2020 | 8.32 | 0.28 | 0.30 | 0.58 | (0.30 | ) | – | (0.30 | ) | |||||||||||||||||||
| 12/31/2019 | 7.64 | 0.30 | 0.69 | 0.99 | (0.31 | ) | – | (0.31 | ) | |||||||||||||||||||
| 12/31/2018 | 8.44 | 0.31 | (0.64 | ) | (0.33 | ) | (0.35 | ) | (0.12 | ) | (0.47 | ) | ||||||||||||||||
| 12/31/2017 | 8.11 | 0.34 | 0.39 | 0.73 | (0.35 | ) | (0.05 | ) | (0.40 | ) | ||||||||||||||||||
| 62 | See Notes to Financial Statements. |
| Ratios to Average Net Assets: | Supplemental Data: | |||||||||||||||||||||||||
| Net asset value, end of period | Total return(b) (%) | Total expenses after waivers and/or reim- bursements (%) | Total expenses (%) | Net investment income (%) | Net assets, end of period (000) | Portfolio turnover rate (%) | ||||||||||||||||||||
| $ | 8.37 | 3.26 | 0.76 | 0.76 | 3.19 | $ | 6,750,572 | 81 | ||||||||||||||||||
| 8.41 | 7.60 | 0.78 | 0.78 | 3.65 | 5,877,018 | 109 | ||||||||||||||||||||
| 8.13 | 13.37 | 0.79 | 0.79 | 3.90 | 5,246,570 | 217 | ||||||||||||||||||||
| 7.47 | (3.79 | ) | 0.79 | 0.79 | 4.11 | 4,252,132 | 147 | |||||||||||||||||||
| 8.25 | 9.21 | 0.81 | 0.81 | 4.10 | 4,491,809 | 113 | ||||||||||||||||||||
| 8.39 | 2.60 | 1.40 | 1.40 | 2.55 | 1,269,001 | 81 | ||||||||||||||||||||
| 8.43 | 6.77 | 1.42 | 1.42 | 3.02 | 1,197,178 | 109 | ||||||||||||||||||||
| 8.16 | 12.77 | 1.42 | 1.42 | 3.28 | 1,328,321 | 217 | ||||||||||||||||||||
| 7.49 | (4.38 | ) | 1.43 | 1.43 | 3.46 | 1,296,749 | 147 | |||||||||||||||||||
| 8.27 | 8.52 | 1.43 | 1.43 | 3.49 | 1,872,830 | 113 | ||||||||||||||||||||
| 8.36 | 3.48 | 0.66 | 0.66 | 3.28 | 11,596,041 | 81 | ||||||||||||||||||||
| 8.40 | 7.57 | 0.68 | 0.68 | 3.73 | 7,838,614 | 109 | ||||||||||||||||||||
| 8.12 | 13.64 | 0.69 | 0.69 | 3.97 | 5,743,483 | 217 | ||||||||||||||||||||
| 7.46 | (3.83 | ) | 0.69 | 0.69 | 4.20 | 3,827,057 | 147 | |||||||||||||||||||
| 8.24 | 9.32 | 0.71 | 0.71 | 4.16 | 3,793,021 | 113 | ||||||||||||||||||||
| 8.33 | 3.53 | 0.49 | 0.49 | 3.44 | 5,134,497 | 81 | ||||||||||||||||||||
| 8.37 | 7.77 | 0.50 | 0.50 | 3.91 | 2,989,747 | 109 | ||||||||||||||||||||
| 8.10 | 13.86 | 0.52 | 0.52 | 4.14 | 2,290,420 | 217 | ||||||||||||||||||||
| 7.43 | (3.57 | ) | 0.52 | 0.52 | 4.37 | 1,533,935 | 147 | |||||||||||||||||||
| 8.21 | 6.55 | (e) | 0.53 | (f) | 0.53 | (f) | 4.06 | (e) | 1,093,748 | 113 | ||||||||||||||||
| 8.32 | 3.46 | 0.56 | 0.56 | 3.38 | 2,962,943 | 81 | ||||||||||||||||||||
| 8.36 | 7.69 | 0.58 | 0.58 | 3.84 | 1,782,404 | 109 | ||||||||||||||||||||
| 8.09 | 13.80 | 0.59 | 0.59 | 4.07 | 1,401,118 | 217 | ||||||||||||||||||||
| 7.43 | (3.77 | ) | 0.59 | 0.59 | 4.30 | 927,024 | 147 | |||||||||||||||||||
| 8.21 | 9.44 | 0.61 | 0.61 | 4.25 | 1,039,534 | 113 | ||||||||||||||||||||
| 8.56 | 3.01 | 1.01 | 1.01 | 2.95 | 12,453 | 81 | ||||||||||||||||||||
| 8.60 | 7.25 | 1.03 | 1.03 | 3.42 | 14,104 | 109 | ||||||||||||||||||||
| 8.32 | 13.16 | 1.04 | 1.04 | 3.67 | 16,727 | 217 | ||||||||||||||||||||
| 7.64 | (4.00 | ) | 0.95 | 0.95 | 3.94 | 17,453 | 147 | |||||||||||||||||||
| 8.44 | 9.18 | 0.86 | 0.86 | 4.07 | 32,370 | 113 | ||||||||||||||||||||
| See Notes to Financial Statements. | 63 |
Financial Highlights (concluded)
| Per Share Operating Performance: | ||||||||||||||||||||||||||||
| Investment Operations: | Distributions to shareholders from: | |||||||||||||||||||||||||||
| Net asset value, beginning of period | Net invest- ment income(a) | Net realized and unrealized gain (loss) | Total from invest- ment opera- tions | Net investment income | Net realized gain | Total distri- butions | ||||||||||||||||||||||
| Class R2 | ||||||||||||||||||||||||||||
| 12/31/2021 | $ | 8.41 | $ | 0.24 | $ | – | $ | 0.24 | $ | (0.25 | ) | $ | (0.03 | ) | $ | (0.28 | ) | |||||||||||
| 12/31/2020 | 8.13 | 0.26 | 0.30 | 0.56 | (0.28 | ) | – | (0.28 | ) | |||||||||||||||||||
| 12/31/2019 | 7.47 | 0.28 | 0.67 | 0.95 | (0.29 | ) | – | (0.29 | ) | |||||||||||||||||||
| 12/31/2018 | 8.25 | 0.30 | (0.64 | ) | (0.34 | ) | (0.32 | ) | (0.12 | ) | (0.44 | ) | ||||||||||||||||
| 12/31/2017 | 7.93 | 0.30 | 0.39 | 0.69 | (0.32 | ) | (0.05 | ) | (0.37 | ) | ||||||||||||||||||
| Class R3 | ||||||||||||||||||||||||||||
| 12/31/2021 | 8.39 | 0.25 | 0.01 | (d) | 0.26 | (0.26 | ) | (0.03 | ) | (0.29 | ) | |||||||||||||||||
| 12/31/2020 | 8.12 | 0.27 | 0.29 | 0.56 | (0.29 | ) | – | (0.29 | ) | |||||||||||||||||||
| 12/31/2019 | 7.46 | 0.29 | 0.67 | 0.96 | (0.30 | ) | – | (0.30 | ) | |||||||||||||||||||
| 12/31/2018 | 8.24 | 0.30 | (0.63 | ) | (0.33 | ) | (0.33 | ) | (0.12 | ) | (0.45 | ) | ||||||||||||||||
| 12/31/2017 | 7.92 | 0.31 | 0.38 | 0.69 | (0.32 | ) | (0.05 | ) | (0.37 | ) | ||||||||||||||||||
| Class R4 | ||||||||||||||||||||||||||||
| 12/31/2021 | 8.41 | 0.27 | – | 0.27 | (0.28 | ) | (0.03 | ) | (0.31 | ) | ||||||||||||||||||
| 12/31/2020 | 8.14 | 0.29 | 0.29 | 0.58 | (0.31 | ) | – | (0.31 | ) | |||||||||||||||||||
| 12/31/2019 | 7.47 | 0.30 | 0.69 | 0.99 | (0.32 | ) | – | (0.32 | ) | |||||||||||||||||||
| 12/31/2018 | 8.25 | 0.33 | (0.64 | ) | (0.31 | ) | (0.35 | ) | (0.12 | ) | (0.47 | ) | ||||||||||||||||
| 12/31/2017 | 7.93 | 0.33 | 0.38 | 0.71 | (0.34 | ) | (0.05 | ) | (0.39 | ) | ||||||||||||||||||
| Class R5 | ||||||||||||||||||||||||||||
| 12/31/2021 | 8.37 | 0.29 | – | 0.29 | (0.30 | ) | (0.03 | ) | (0.33 | ) | ||||||||||||||||||
| 12/31/2020 | 8.10 | 0.30 | 0.29 | 0.59 | (0.32 | ) | – | (0.32 | ) | |||||||||||||||||||
| 12/31/2019 | 7.43 | 0.33 | 0.68 | 1.01 | (0.34 | ) | – | (0.34 | ) | |||||||||||||||||||
| 12/31/2018 | 8.21 | 0.34 | (0.63 | ) | (0.29 | ) | (0.37 | ) | (0.12 | ) | (0.49 | ) | ||||||||||||||||
| 12/31/2017 | 7.86 | 0.35 | 0.41 | 0.76 | (0.36 | ) | (0.05 | ) | (0.41 | ) | ||||||||||||||||||
| Class R6 | ||||||||||||||||||||||||||||
| 12/31/2021 | 8.37 | 0.29 | – | 0.29 | (0.30 | ) | (0.03 | ) | (0.33 | ) | ||||||||||||||||||
| 12/31/2020 | 8.09 | 0.31 | 0.30 | 0.61 | (0.33 | ) | – | (0.33 | ) | |||||||||||||||||||
| 12/31/2019 | 7.43 | 0.33 | 0.68 | 1.01 | (0.35 | ) | – | (0.35 | ) | |||||||||||||||||||
| 12/31/2018 | 8.21 | 0.35 | (0.63 | ) | (0.28 | ) | (0.38 | ) | (0.12 | ) | (0.50 | ) | ||||||||||||||||
| 12/31/2017 | 7.89 | 0.35 | 0.39 | 0.74 | (0.37 | ) | (0.05 | ) | (0.42 | ) | ||||||||||||||||||
| (a) | Calculated using average shares outstanding during the period. |
| (b) | Total return for Classes A and C does not consider the effects of sales loads and assumes the reinvestment of all distributions. Total return for all other classes assumes the reinvestment of all distributions. |
| (c) | Commenced on April 4, 2017. |
| (d) | Realized and unrealized gain (loss) per share does not correlate to the aggregate of the net realized and unrealized gain (loss) in the Statement of Operations for the year ended December 31, 2021, primarily due to the timing of the sales and repurchases of the Fund’s shares in relation to fluctuating market values of the Fund’s portfolio. |
| (e) | Not annualized. |
| (f) | Annualized. |
| 64 | See Notes to Financial Statements. |
| Ratios to Average Net Assets: | Supplemental Data: | |||||||||||||||||||||||||
| Net asset value, end of period | Total return(b) (%) | Total expenses after waivers and/or reim- bursements (%) | Total expenses (%) | Net investment income (%) | Net assets, end of period (000) | Portfolio turnover rate (%) | ||||||||||||||||||||
| $ | 8.37 | 2.85 | 1.16 | 1.16 | 2.80 | $ | 4,700 | 81 | ||||||||||||||||||
| 8.41 | 7.17 | 1.18 | 1.18 | 3.28 | 5,222 | 109 | ||||||||||||||||||||
| 8.13 | 12.93 | 1.19 | 1.19 | 3.52 | 6,688 | 217 | ||||||||||||||||||||
| 7.47 | (4.17 | ) | 1.19 | 1.19 | 3.71 | 6,460 | 147 | |||||||||||||||||||
| 8.25 | 8.78 | 1.21 | 1.21 | 3.68 | 9,066 | 113 | ||||||||||||||||||||
| 8.36 | 3.07 | 1.06 | 1.06 | 2.90 | 264,066 | 81 | ||||||||||||||||||||
| 8.39 | 7.16 | 1.08 | 1.08 | 3.36 | 232,103 | 109 | ||||||||||||||||||||
| 8.12 | 13.20 | 1.09 | 1.09 | 3.60 | 201,289 | 217 | ||||||||||||||||||||
| 7.46 | (4.21 | ) | 1.09 | 1.09 | 3.81 | 152,743 | 147 | |||||||||||||||||||
| 8.24 | 8.90 | 1.10 | 1.10 | 3.80 | 151,842 | 113 | ||||||||||||||||||||
| 8.37 | 3.21 | 0.81 | 0.81 | 3.15 | 74,934 | 81 | ||||||||||||||||||||
| 8.41 | 7.41 | 0.83 | 0.83 | 3.61 | 61,183 | 109 | ||||||||||||||||||||
| 8.14 | 13.46 | 0.84 | 0.84 | 3.80 | 48,229 | 217 | ||||||||||||||||||||
| 7.47 | (3.83 | ) | 0.84 | 0.84 | 4.09 | 18,847 | 147 | |||||||||||||||||||
| 8.25 | 9.16 | 0.86 | 0.86 | 3.98 | 8,420 | 113 | ||||||||||||||||||||
| 8.33 | 3.47 | 0.56 | 0.56 | 3.39 | 30,538 | 81 | ||||||||||||||||||||
| 8.37 | 7.70 | 0.58 | 0.58 | 3.85 | 22,722 | 109 | ||||||||||||||||||||
| 8.10 | 13.79 | 0.59 | 0.59 | 4.13 | 16,505 | 217 | ||||||||||||||||||||
| 7.43 | (3.63 | ) | 0.59 | 0.59 | 4.32 | 30,204 | 147 | |||||||||||||||||||
| 8.21 | 9.46 | 0.61 | 0.61 | 4.29 | 27,302 | 113 | ||||||||||||||||||||
| 8.33 | 3.53 | 0.49 | 0.49 | 3.46 | 407,728 | 81 | ||||||||||||||||||||
| 8.37 | 7.91 | 0.50 | 0.50 | 3.92 | 280,839 | 109 | ||||||||||||||||||||
| 8.09 | 13.73 | 0.52 | 0.52 | 4.16 | 186,784 | 217 | ||||||||||||||||||||
| 7.43 | (3.56 | ) | 0.52 | 0.52 | 4.39 | 116,094 | 147 | |||||||||||||||||||
| 8.21 | 9.54 | 0.52 | 0.52 | 4.31 | 69,028 | 113 | ||||||||||||||||||||
| See Notes to Financial Statements. | 65 |
| 1. | ORGANIZATION |
Lord Abbett Bond-Debenture Fund, Inc. (the “Fund”) is registered under the Investment Company Act of 1940, as amended (the “Act”), as a diversified, open-end management investment company. The Fund was organized in 1970 and incorporated under Maryland law on January 23, 1976.
The Fund’s investment objective is to seek high current income and the opportunity for capital appreciation to produce a high total return. The Fund has eleven active classes of shares: Class A, C, F, F3, I, P, R2, R3, R4, R5 and R6, each with different expenses and dividends. A front-end sales charge is normally added to the net asset value (“NAV”) for Class A shares. There is no front-end sales charge in the case of Class C, F, F3, I, P, R2, R3, R4, R5 and R6 shares, although there may be a contingent deferred sales charge (“CDSC”) in certain cases as follows: Class A shares purchased without a sales charge and redeemed before the first day of the month in which the one-year anniversary of the purchase falls (subject to certain exceptions as set forth in the Fund’s prospectus); Class C shares redeemed before the first anniversary of purchase. Class C shares automatically convert to Class A shares on the 25th day of the month (or, if the 25th day is not a business day, the next business day thereafter) following the eighth anniversary of the month on which the purchase order was accepted, provided that the Fund or financial intermediary through which a shareholder purchased Class C shares has records verifying that the C shares have been held at least eight years. The Fund’s Class P shares are closed to substantially all new investors, with certain exceptions as set forth in the Fund’s prospectus.
The preparation of the financial statements in conformity with accounting principles generally accepted in the United States of America (“U.S. GAAP”) requires management to make certain estimates and assumptions that affect the reported amounts of assets and liabilities and disclosure of contingent assets and liabilities at the date of the financial statements and the reported amounts of increases and decreases in net assets from operations during the reporting period. Actual results could differ from those estimates. The Fund is considered an investment company under U.S. GAAP and follows the accounting and reporting guidance applicable to investment companies.
| 2. | SIGNIFICANT ACCOUNTING POLICIES |
| (a) | Investment Valuation–Under procedures approved by the Fund’s Board of Directors (the “Board”), Lord, Abbett & Co. LLC (“Lord Abbett”), the Fund’s investment manager, has formed a Pricing Committee to administer the pricing and valuation of portfolio investments and to ensure that prices utilized reasonably reflect fair value. Among other things, these procedures allow the Fund to utilize independent pricing services, quotations from securities and financial instrument dealers and other market sources to determine fair value. |
| Securities actively traded on any recognized U.S. or non-U.S. exchange or on The NASDAQ Stock Market LLC are valued at the last sale price or official closing price on the exchange or system on which they are principally traded. Events occurring after the close of trading on non-U.S. exchanges may result in adjustments to the valuation of foreign securities to reflect their fair value as of the close of regular trading on the New York Stock Exchange. When valuing foreign equity securities that meet certain criteria, the Board has approved the use of an independent fair valuation service that values such securities to reflect market trading that occurs after the close of the applicable foreign markets of comparable securities or other instruments that correlate to the fair-valued securities. Unlisted equity securities are valued at the last quoted sale price or, if no sale price is available, at the mean between the most recently |
66
Notes to Financial Statements (continued)
| quoted bid and asked prices. Fixed income securities are valued based on evaluated prices supplied by independent pricing services, which reflect broker/dealer supplied valuations and the independent pricing services’ own electronic data processing techniques. Floating rate loans are valued at the average of bid and ask quotations obtained from dealers in loans on the basis of prices supplied by independent pricing services. Forward foreign currency exchange contracts are valued using daily forward exchange rates. Exchange traded options and futures contracts are valued at the last quoted sale price in the market where they are principally traded. If no sale has occurred, the mean between the most recently quoted bid and asked prices is used. Swaps are valued daily using independent pricing services or quotations from broker/dealers to the extent available. | |
| Securities for which prices are not readily available are valued at fair value as determined by the Pricing Committee. The Pricing Committee considers a number of factors, including observable and unobservable inputs, when arriving at fair value. The Pricing Committee may use related or comparable assets or liabilities, recent transactions, market multiples, book values, yield curves, broker quotes, observable trading activity, option adjusted spread models and other relevant information to determine the fair value of portfolio investments. The Board or a designated committee thereof regularly reviews fair value determinations made by the Pricing Committee and may employ techniques such as reviewing related market activity, reviewing inputs and assumptions, and retrospectively comparing prices of subsequent purchases and sales transactions to fair value determinations made by the Pricing Committee. | |
| Investments in open-end money market mutual funds are valued at their NAV as of the close of each business day. Short-term securities with 60 days or less remaining to maturity are valued using the amortized cost method, which approximates fair value. | |
| (b) | Security Transactions–Security transactions are recorded as of the date that the securities are purchased or sold (trade date). Realized gains and losses on sales of portfolio securities are calculated using the identified-cost method. Realized and unrealized gains (losses) are allocated to each class of shares based upon the relative proportion of net assets at the beginning of the day. |
| (c) | Investment Income–Dividend income is recorded on the ex-dividend date. Interest income is recorded on the accrual basis as earned. Discounts are accreted and premiums are amortized using the effective interest method and are included in Interest and other, if applicable, on the Statement of Operations. Withholding taxes on foreign dividends have been provided for in accordance with the applicable country’s tax rules and rates. Investment income is allocated to each class of shares based upon the relative proportion of net assets at the beginning of the day. |
| (d) | Income Taxes–It is the policy of the Fund to meet the requirements of Subchapter M of the Internal Revenue Code applicable to regulated investment companies and to distribute substantially all taxable income and capital gains to its shareholders. Therefore, no income tax provision is required. |
| The Fund files U.S. federal and various state and local tax returns. No income tax returns are currently under examination. The statute of limitations on the Fund’s filed U.S. federal tax returns remains open for the fiscal years ended December 31, 2018 through December 31, 2021. The statutes of limitations on the Fund’s state and local tax returns may remain open for an additional year depending upon the jurisdiction. |
67
Notes to Financial Statements (continued)
| (e) | Expenses–Expenses, excluding class-specific expenses, are allocated to each class of shares based upon the relative proportion of net assets at the beginning of the day. In addition, Class F3 and R6 bear only their class specific shareholder servicing expenses. Class A, C, F, P, R2, R3 and R4 shares bear their class-specific share of all expenses and fees relating to the Fund’s 12b-1 Distribution Plan. |
| (f) | Foreign Transactions–The books and records of the Fund are maintained in U.S. dollars and transactions denominated in foreign currencies are recorded in the Fund’s records at the rate prevailing when earned or recorded. Asset and liability accounts that are denominated in foreign currencies are adjusted daily to reflect current exchange rates and any unrealized gain (loss) if applicable, is included in Net change in unrealized appreciation/depreciation on translation of assets and liabilities denominated in foreign currencies on the Fund’s Statement of Operations. The resultant exchange gains and losses upon settlement of such transactions, if applicable, are included in Net realized gain (loss) on foreign currency related transactions on the Fund’s Statement of Operations. The Fund does not isolate that portion of the results of operations arising as a result of changes in the foreign exchange rates from the changes in market prices of the securities. |
| The Fund uses foreign currency exchange contracts to facilitate transactions in foreign-denominated securities. Losses from these transactions may arise from changes in the value of the foreign currency or if the counterparties do not perform under the contracts’ terms. | |
| (g) | Forward Foreign Currency Exchange Contracts–The Fund may enter into forward foreign currency exchange contracts in order to reduce exposure to changes in foreign currency exchange rates on foreign portfolio holdings, or gain or reduce exposure to foreign currency solely for investment purposes. A forward foreign currency exchange contract is a commitment to purchase or sell a foreign currency at a future date at a negotiated rate. The contracts are valued daily at forward exchange rates and any unrealized gain (loss), if applicable, is included in Net change in unrealized appreciation/depreciation on forward foreign currency exchange contracts on the Fund’s Statement of Operations. The gain (loss) arising from the difference between the U.S. dollar cost of the original contract and the value of the forward foreign currency in U.S. dollars upon closing of such contracts is included, if applicable, in Net realized gain (loss) on forward foreign currency exchange contracts on the Fund’s Statement of Operations. |
| (h) | Futures Contracts–The Fund may purchase and sell futures contracts to enhance returns, to attempt to economically hedge some of its investment risk, or as a substitute position in lieu of holding the underlying asset on which the instrument is based. At the time of entering into a futures transaction, an investor is required to deposit and maintain a specified amount of cash or eligible securities called “initial margin.” Subsequent payments made or received by the Fund called “variation margin” are made on a daily basis as the market price of the futures contract fluctuates. The Fund will record an unrealized gain (loss) based on the amount of variation margin. When a contract is closed, a realized gain (loss) is recorded equal to the difference between the opening and closing value of the contract. |
| (i) | Credit Default Swaps–The Fund may enter into credit default swap contracts in order to hedge credit risk or for speculation purposes. As a seller of a credit default swap contract (“seller of protection”), the Fund is required to pay the notional amount or other agreed-upon value of a referenced debt obligation to the counterparty in the event of a default by or other credit event involving the referenced issuer, obligation or index. In return, the Fund receives from the counterparty a periodic stream of payments over the term of the contract. |
68
Notes to Financial Statements (continued)
| As a purchaser of a credit default swap contract (“buyer of protection”), the Fund would receive the notional amount or other agreed upon value of a referenced debt obligation from the counterparty in the event of default by or other credit event involving the referenced issuer, obligation or index. In return, the Fund would make periodic payments to the counterparty over the term of the contracts, provided no event of default has occurred. | |
| These credit default swaps may have as a reference obligation corporate or sovereign issuers or credit indexes. These credit indexes are comprised of a basket of securities representing a particular sector of the market. | |
| Credit default swaps are fair valued based upon quotations from counterparties, brokers or market-makers and the change in value, if any, is recorded as an unrealized appreciation or depreciation. For a credit default swap sold by the Fund, payment of the agreed-upon amount made by the Fund in the event of default of the referenced debt obligation is recorded as the cost of the referenced debt obligation purchased/received. For a credit default swap purchased by the Fund, the agreed-upon amount received by the Fund in the event of default of the referenced debt obligation is recorded as proceeds from sale/delivery of the referenced debt obligation and the resulting gain or loss realized on the referenced debt obligation is recorded as such by the Fund. | |
| Any upfront payments made or received upon entering a credit default swap contract would be amortized or accreted over the life of the swap and recorded as realized gains or losses. Collateral, in the form of cash or securities, may be required to be held in segregated accounts with the custodian bank or broker in accordance with the swap agreement. The value and credit rating of each credit default swap where the Fund is the seller of protection, are both measures of the current payment/performance risk of the swap. As the value of the swap changes as a positive or negative percentage of the total notional amount, the payment/performance risk may decrease or increase, respectively. The maximum potential amount of future payments (undiscounted) that the Fund as a seller of protection could be required to make under a credit default swap agreement would be an amount equal to the notional amount of the agreement. These potential amounts would be partially offset by any recovery values of the respective referenced obligations, upfront payments received upon entering into the agreement, or net amounts received from the settlement of buy protection credit default swap agreements entered into by the Fund for the same referenced entity or entities. | |
| Entering into credit default swaps involves credit and market risk. Such risks involve the possibility that there will be no liquid market for these agreements, that the counterparty to the agreements may default on its obligation to perform or disagree as to the meaning of the contractual terms in the agreements, and that there may be unfavorable changes in interest rates, and that Lord Abbett does not correctly predict the creditworthiness of the issuers of the reference obligation on which the credit default swap is based. For the centrally cleared credit default swaps, there was minimal counterparty risk to the Fund, since such credit default swaps entered into were traded through a central clearinghouse, which guarantees against default. | |
| (j) | Repurchase Agreements–The Fund may enter into repurchase agreements with respect to securities. A repurchase agreement is a transaction in which a fund acquires a security and simultaneously commits to resell that security to the seller (a bank or securities dealer) at an agreed-upon price on an agreed-upon date. The Fund requires at all times that the repurchase |
69
Notes to Financial Statements (continued)
| agreement be collateralized by cash, or by securities of the U.S. Government, its agencies, its instrumentalities, or U.S. Government sponsored enterprises having a value equal to, or in excess of, the value of the repurchase agreement (including accrued interest). If the seller of the agreement defaults on its obligation to repurchase the underlying securities at a time when the fair value of these securities has declined, the Fund may incur a loss upon disposition of the securities. | |
| (k) | Mortgage Dollar Rolls–The Fund may enter into mortgage dollar rolls in which the Fund sells mortgage-backed securities for delivery in the current month and simultaneously contracts with the same counterparty to repurchase similar (same type, coupon and maturity) but not identical securities on a specified future date. During the roll period, the Fund loses the right to receive principal (including prepayments of principal) and interest paid on the securities sold. |
| (l) | When-Issued, Forward Transactions or To-Be-Announced (“TBA”) Transactions–The Fund may purchase portfolio securities on a when-issued or forward basis. When-issued, forward transactions or TBA transactions involve a commitment by the Fund to purchase securities, with payment and delivery (“settlement”) to take place in the future, in order to secure what is considered to be an advantageous price or yield at the time of entering into the transaction. During the period between purchase and settlement, the fair value of the securities will fluctuate and assets consisting of cash and/or marketable securities (normally short-term U.S. Government or U.S. Government sponsored enterprise securities) marked to market daily in an amount sufficient to make payment at settlement will be segregated at the Fund’s custodian in order to pay for the commitment. At the time the Fund makes the commitment to purchase a security on a when-issued basis, it will record the transaction and reflect the liability for the purchase and fair value of the security in determining its NAV. The Fund, generally, has the ability to close out a purchase obligation on or before the settlement date rather than take delivery of the security. Under no circumstances will settlement for such securities take place more than 120 days after the purchase date. |
| (m) | Reverse Repurchase Agreements–The Fund may enter into reverse repurchase agreements. In a reverse repurchase agreement, the Fund sells a security to a securities dealer or bank for cash and also agrees to repurchase the same security later at a set price. Reverse repurchase agreements expose the Fund to credit risk (that is, the risk that the counterparty will fail to resell the security to the Fund). Engaging in reverse repurchase agreements also may involve the use of leverage, in that the Fund may reinvest the cash it receives in additional securities. Reverse repurchase agreements involve the risk that the market value of the securities to be repurchased by the Fund may decline below the repurchase price. |
| For the fiscal year ended December 31, 2021, the average interest rate, the amount of interest received and the average principal amount for the days borrowed in the period were as follows: |
| Interest Rate | Interest Income | Average Amount Borrowed | ||||
| (10)% | $25,786 | $3,880,070 |
| (n) | Floating Rate Loans–The Fund may invest in floating rate loans, which usually take the form of loan participations and assignments. Loan participations and assignments are agreements to make money available to U.S. or foreign corporations, partnerships or other business entities (the “Borrower”) in a specified amount, at a specified rate and within a specified time. A loan |
70
Notes to Financial Statements (continued)
| is typically originated, negotiated and structured by a U.S. or foreign bank, insurance company or other financial institution (the “Agent”) for a group of loan investors (“Loan Investors”). The Agent typically administers and enforces the loan on behalf of the other Loan Investors in the syndicate and may hold any collateral on behalf of the Loan Investors. Such loan participations and assignments are typically senior, secured and collateralized in nature. The Fund records an investment when the Borrower withdraws money and records interest as earned. These loans pay interest at rates which are periodically reset by reference to a base lending rate plus a spread. These base lending rates are generally the prime rate offered by a designated U.S. bank or London InterBank Offered Rate (“LIBOR”). | |
| The loans in which the Fund invests may be subject to some restrictions on resale. For example, the Fund may be contractually obligated to receive approval from the Agent and/or Borrower prior to the sale of these investments. The Fund generally has no right to enforce compliance with the terms of the loan agreement with the Borrower. As a result, the Fund assumes the credit risk of the Borrower, the selling participant and any other persons interpositioned between the Fund and the Borrower (“Intermediate Participants”). In the event that the Borrower, selling participant or Intermediate Participants become insolvent or enter into bankruptcy, the Fund may incur certain costs and delays in realizing payment or may suffer a loss of principal and/or interest. | |
| Unfunded commitments represent the remaining obligation of the Fund to the Borrower. At any point in time, up to the maturity date of the issue, the Borrower may demand the unfunded portion. Until demanded by the Borrower, unfunded commitments are not recognized as an asset on the Statement of Assets and Liabilities. Unrealized appreciation/depreciation on unfunded commitments presented on the Statement of Assets and Liabilities represents mark to market of the unfunded portion of the Fund’s floating rate notes. As of December 31, 2021, the Fund had the following unfunded loan commitments: |
| Borrower | Principal Amount | Market Value | Cost | Unrealized Appreciation/ Depreciation | ||||||
| National Mentor Holdings, Inc. | ||||||||||
| 2021 Delayed Draw Term Loan | $1,492,586 | $1,478,593 | $1,492,586 | $(13,993 | ) |
| (o) | Total Return Swaps–The Fund may enter into total return swap agreements to obtain exposure to a security or market without owning such security or investing directly in that market. The Fund may agree to make payments that are the equivalent of interest in exchange for the right to receive payments equivalent to any appreciation in the value of an underlying security, index or other asset, as well as receive payments equivalent to any distributions made on that asset, over the term of the swap. If the value of the asset underlying a total return swap declines over the term of the swap, the Fund also may be required to pay an amount equal to that decline in value to its counterparty. |
| (p) | Fair Value Measurements–Fair value is defined as the price that the Fund would receive upon selling an investment or transferring a liability in an orderly transaction to an independent buyer in the principal or most advantageous market of the investment. A three-tier hierarchy is used to maximize the use of observable market data and minimize the use of unobservable inputs and to establish classification of fair value measurements for disclosure purposes. Inputs refer broadly to the assumptions that market participants would use in pricing the asset or liability, including assumptions about risk - for example, the risk inherent in a particular valuation |
71
Notes to Financial Statements (continued)
| technique used to measure fair value (such as a pricing model) and/or the risk inherent in the inputs to the valuation technique. Inputs may be observable or unobservable. Observable inputs reflect the assumptions market participants would use in pricing the asset or liability. Observable inputs are based on market data obtained from sources independent of the reporting entity. Unobservable inputs reflect the reporting entity’s own assumptions about the assumptions market participants would use in pricing the asset or liability. Unobservable inputs are based on the best information available in the circumstances. The three-tier hierarchy classification is determined based on the lowest level of inputs that is significant to the fair value measurement, and is summarized in the three broad Levels listed below: |
| • | Level 1 – | unadjusted quoted prices in active markets for identical investments; | |
| • | Level 2 – | other significant observable inputs (including quoted prices for similar investments, interest rates, prepayment speeds, credit risk, etc.); and | |
| • | Level 3 – | significant unobservable inputs (including the Fund’s own assumptions in determining the fair value of investments). |
| A summary of inputs used in valuing the Fund’s investments and other financial instruments as of December 31, 2021 and, if applicable, Level 3 rollforwards for the fiscal year then ended is included in the Fund’s Schedule of Investments. | |
| Changes in valuation techniques may result in transfers into or out of an assigned level within the three-tier hierarchy. The inputs or methodology used for valuing securities are not necessarily an indication of the risk associated with investing in those securities. |
| 3. | MANAGEMENT FEE AND OTHER TRANSACTIONS WITH AFFILIATES |
Management Fee
The Fund has a management agreement with Lord Abbett, pursuant to which Lord Abbett supplies the Fund with investment management services and executive and other personnel, provides office space and pays for ordinary and necessary office and clerical expenses relating to research and statistical work and supervision of the Fund’s investment portfolio.
The management fee is based on the Fund’s average daily net assets at the following annual rate of:
| First $500 million | .50% |
| Next $9.5 billion | .45% |
| Over $10 billion | .40% |
For the fiscal year ended December 31, 2021, the effective management fee was at an annualized rate of .42% of the Fund’s average daily net assets.
In addition, Lord Abbett provides certain administrative services to the Fund pursuant to an Administrative Services Agreement in return for a fee at an annual rate of .04% of the Fund’s average daily net assets. Lord Abbett voluntarily waived $194,950 of fund administration fees during the fiscal year ended December 31, 2021.
72
Notes to Financial Statements (continued)
12b-1 Distribution Plan
The Fund has adopted a distribution plan with respect to Class A, C, F, P, R2, R3 and R4 shares pursuant to Rule 12b-1 under the Act, which provides for the payment of ongoing distribution and service fees to Lord Abbett Distributor LLC (the “Distributor”), an affiliate of Lord Abbett. The following annual rates have been authorized by the Board pursuant to the plan:
| Fees* | Class A | Class C(1) | Class F(2) | Class P | Class R2 | Class R3 | Class R4 | |||||||
| Service | .15% | .25% | – | .25% | .25% | .25% | .25% | |||||||
| Distribution | .05% | .75% | .10% | .20% | .35% | .25% | – |
| * | The Fund may designate a portion of the aggregate fee as attributable to service activities for purposes of calculating Financial Industry Regulatory Authority, Inc. (“FINRA”) sales charge limitations. |
| (1) | The Rule 12b-1 fee the Fund pays on Class C shares is a blended rate based on 1.00% of the Fund’s average daily net assets attributable to Class C shares held for less than one year and .80% (.25% service, .55% distribution) of the Fund’s average daily net assets attributable to Class C shares held for one year or more. All Class C shareholders of the Fund will bear Rule 12b-1 fees at the same rate. |
| (2) | The Class F Share Rule 12b-1 fee may be designated as a service fee in limited circumstances as described in the Fund’s prospectus. |
Class F3, I, R5 and R6 shares do not have a distribution plan.
Commissions
Distributor received the following commissions on sales of shares of the Fund, after concessions were paid to authorized dealers for the fiscal year ended December 31, 2021:
| Distributor Commissions | Dealers’ Concessions | |
| $964,775 | $5,833,743 |
Distributor received CDSCs of $214,657 and $129,077 for Class A and Class C shares, respectively, for the fiscal year ended December 31, 2021.
| 4. | DISTRIBUTIONS AND CAPITAL LOSS CARRYFORWARDS |
Dividends from net investment income, if any, are declared daily and paid monthly. Taxable net realized gains from investment transactions, reduced by allowable capital loss carryforwards, if any, are declared and distributed to shareholders at least annually. The capital loss carryforward amount, if any, is available to offset future net capital gains. Dividends and distributions to shareholders are recorded on the ex-dividend date. The amounts of dividends and distributions from net investment income and net realized capital gains are determined in accordance with federal income tax regulations, which may differ from U.S. GAAP. These book/tax differences are either considered temporary or permanent in nature. To the extent these differences are permanent in nature, such amounts are reclassified within the components of net assets based on their federal tax basis treatment; temporary differences do not require reclassification. Dividends and distributions, which exceed earnings and profits for tax purposes, are reported as a tax return of capital.
The tax character of distributions paid during the fiscal years ended December 31, 2021 and 2020 was as follows:
| Year Ended 12/31/2021 | Year Ended 12/31/2020 | |||||||
| Distributions paid from: | ||||||||
| Ordinary income | $936,222,307 | $688,774,564 | ||||||
| Total distributions paid | $936,222,307 | $688,774,564 | ||||||
73
Notes to Financial Statements (continued)
As of December 31, 2021, the components of accumulated gains on a tax-basis were as follows:
| Undistributed ordinary income – net | $ | 38,101,961 | ||
| Total undistributed earnings | 38,101,961 | |||
| Temporary differences | (2,501,068 | ) | ||
| Unrealized gains – net | 818,007,039 | |||
| Total accumulated gains – net | $ | 853,607,932 |
As of December 31, 2021, the aggregate unrealized security gains and losses on investments and other financial instruments based on cost for U.S. federal income tax purposes were as follows:
| Tax cost | $ | 27,398,228,088 | ||
| Gross unrealized gain | 1,158,650,091 | |||
| Gross unrealized loss | (340,611,254 | ) | ||
| Net unrealized security gain | $ | 818,038,837 |
The difference between book-basis and tax-basis unrealized gains (losses) is attributable to the tax treatment of certain distributions received, oither financial instruments, amortization of premium and wash sales.
| 5. | PORTFOLIO SECURITIES TRANSACTIONS |
Purchases and sales of investment securities (excluding short-term investments) for the fiscal year ended December 31, 2021 were as follows:
| U.S. Government Purchases* | Non-U.S. Government Purchases | U.S. Government Sales* | Non-U.S. Government Sales | |||||||||||
| $195,584,313 | $27,969,983,229 | $ – | $(19,818,644,422 | ) | ||||||||||
| * | Includes U.S. Government sponsored enterprises securities |
The Fund is permitted to purchase and sell securities (“cross-trade”) from and to other Lord Abbett funds or client accounts pursuant to procedures approved by the Board in compliance with Rule 17a-7 under the Act (the “Rule”). Each cross-trade is executed at a fair market price in compliance with provisions of the Rule. For the fiscal year ended December 31, 2021, the Fund engaged in cross-trade purchases of $53,895,794 and sales of $157,672,860 which resulted in a net realized gain of $8,949,698.
| 6. | DISCLOSURES ABOUT DERIVATIVE INSTRUMENTS AND HEDGING ACTIVITIES |
The Fund entered into forward foreign currency exchange contracts for the fiscal year ended December 31, 2021 (as described in Note 2(g)). A forward foreign currency exchange contract reduces the Fund’s exposure to changes in the value of the currency it will deliver (or settle in cash) and increases its exposure to changes in the value of the currency it will receive (or settle in cash) for the duration of the contract. The Fund’s use of forward foreign currency exchange contracts involves the risk that Lord Abbett will not accurately predict currency movements, and the Fund’s returns could be reduced as a result. Forward foreign currency exchange contracts are subject to the risk that those currencies will decline in value relative to the U.S. dollar, or, in the case of hedged positions, that the U.S. dollar will decline relative to the currency being hedged. Currency rates in foreign countries may fluctuate significantly over short periods of time. The Fund’s risk of loss from counterparty credit risk is the unrealized appreciation on forward foreign currency exchange contracts.
74
Notes to Financial Statements (continued)
The Fund entered into U.S. Treasury futures contracts for the fiscal year ended December 31, 2021 (as described in Note 2(h)) to economically hedge against changes in interest rates. The Fund bears the risk of interest rates moving unexpectedly, in which case the Fund may not achieve the anticipated benefits of the futures contracts and realize a loss. There is minimal counterparty credit risk to the Fund since futures are exchange traded and the exchange’s clearinghouse, as counterparty to all exchange traded futures, guarantees futures against default.
The Fund entered into credit default swaps for the fiscal year ended December 31, 2021 (as described in Note 2(i)) to economically hedge credit risk. Credit default swaps involve the exchange of a fixed rate premium for protection against the loss in value of an underlying security within the index in the event of a defined credit event, such as payment default or bankruptcy. Under a credit default swap one party acts as a guarantor by receiving the fixed periodic payment in exchange for the commitment to purchase the underlying security at par if the defined credit event occurs. The Fund’s maximum risk of loss from counterparty risk, either as the protection seller or as the protection buyer, is the fair value of the contract. For the centrally cleared credit default swaps, there is minimal counterparty credit risk to the Fund since these credit default swaps are traded through a central clearinghouse. As a counterparty to all centrally cleared credit default swaps, the clearinghouse guarantees credit default swaps against default.
As of December 31, 2021, the Fund had the following derivatives at fair value, grouped into appropriate risk categories that illustrate the Fund’s use of derivative instruments:
| Asset Derivatives | Interest Rate Contracts | Foreign Currency Contracts | Credit Contracts | |||||||||
| Centrally Cleared Credit Default Swap Contracts(1) | – | – | $ | 1,714,698 | ||||||||
| Credit Default Swap Contracts(2) | – | – | $ | 132,114 | ||||||||
| Forward Foreign Currency Exchange Contracts(3) | – | $ | 710,074 | – | ||||||||
| Futures Contracts(4) | $ | 656,511 | – | – | ||||||||
| Liability Derivatives | ||||||||||||
| Centrally Cleared Credit Default Swap Contracts(1) | – | – | $ | 1,629,687 | ||||||||
| Credit Default Swap Contracts(5) | – | – | $ | 21,950,801 | ||||||||
| Forward Foreign Currency Exchange Contract(6) | – | $ | 3,957,389 | – | ||||||||
| Futures Contracts(4) | 12,848,676 | – | – | |||||||||
| (1) | Statement of Assets and Liabilities location: Includes cumulative unrealized appreciation/depreciation of centrally cleared swap contracts as reported in the Schedule of Investments. Only current day’s variation margin is reported within the Statement of Assets and Liabilities. |
| (2) | Statement of Assets and Liabilities location: Credit default swap agreements receivable, at fair value. |
| (3) | Statement of Assets and Liabilities location: Unrealized appreciation on forward foreign currency exchange contracts. |
| (4) | Statement of Assets and Liabilities location: Includes cumulative unrealized appreciation/depreciation on futures contracts as reported in the Schedule of Investments. Only current day’s variation margin is reported within the Statement of Assets and Liabilities. |
| (5) | Statement of Assets and Liabilities location: Credit default swap agreements payable, at fair value. |
| (6) | Statement of Assets and Liabilities location: Unrealized depreciation on forward foreign currency exchange contracts. |
75
Notes to Financial Statements (continued)
Transactions in derivative investments for the fiscal year ended December 31, 2021 were as follows:
| Inflation | ||||||||||||||||
| Linked/ | ||||||||||||||||
| Interest | Foreign | |||||||||||||||
| Equity | Rate | Currency | Credit | |||||||||||||
| Contracts | Contracts | Contracts | Contracts | |||||||||||||
| Net Realized Gain (Loss) | ||||||||||||||||
| Credit Default Swap Contracts(1) | – | – | – | $ | (23,009,051 | ) | ||||||||||
| Forward Foreign Currency Exchange Contracts(2) | – | – | $ | 36,391,147 | – | |||||||||||
| Futures Contracts(3) | $ | (14,322,741 | ) | $ | 122,539,148 | – | – | |||||||||
| Net Change in Unrealized Appreciation/Depreciation | ||||||||||||||||
| Credit Default Swap Contracts(4) | – | – | – | $ | 6,615,873 | |||||||||||
| Forward Foreign Currency Exchange Contracts(5) | – | – | $ | 1,071,810 | – | |||||||||||
| Futures Contracts(6) | – | $ | (26,971,753 | ) | – | – | ||||||||||
| Average Number of Contracts/Notional Amounts* | ||||||||||||||||
| Credit Default Swap Contracts(7) | – | – | – | 1,574,157,131 | ||||||||||||
| Forward Foreign Currency Exchange Contracts(8) | – | – | $ | 516,439,891 | – | |||||||||||
| Futures Contracts(7) | 337 | 50,709 | – | – | ||||||||||||
| * | Calculated based on the number of contracts or notional amounts for the fiscal year ended December 31, 2021. |
| (1) | Statement of Operations location: Net realized gain (loss) on swap contracts. |
| (2) | Statement of Operations location: Net realized gain (loss) on forward foreign currency exchange contracts. |
| (3) | Statement of Operations location: Net realized gain (loss) on futures contracts. |
| (4) | Statement of Operations location: Net change in unrealized appreciation/depreciation on swap contracts. |
| (5) | Statement of Operations location: Net change in unrealized appreciation/depreciation on forward foreign currency exchange contracts. |
| (6) | Statement of Operations location: Net change in unrealized appreciation/depreciation on futures contracts. |
| (7) | Amount represents number of contracts. |
| (8) | Amount represents notional amounts in U.S. dollars. |
| 7. | DISCLOSURES ABOUT OFFSETTING ASSETS AND LIABILITIES |
The Financial Accounting Standards Board (“FASB”) requires disclosures intended to help better assess the effect or potential effect of offsetting arrangements on a fund’s financial position. The following tables illustrate gross and net information about recognized assets and liabilities eligible for offset in the Statement of Assets and Liabilities; and disclose such amounts subject to an enforceable master netting agreement or similar agreement, by the counterparty. A master netting agreement is an agreement between the Fund and a counterparty which provides for the net settlement of amounts owed under all contracts traded under that agreement, as well as cash collateral, through a single payment by one party to the other in the event of default on or termination of any one contract. The Fund’s accounting policy with respect to balance sheet offsetting is that, absent an event of default by the counterparty or a termination of the agreement, the master netting agreement does not result in an offset of reported amounts of financial assets and liabilities in the Statement of Assets and Liabilities across transactions between the Fund and the applicable counterparty:
76
Notes to Financial Statements (continued)
| Gross Amounts | Net Amounts of | |||||||||||
| Offset in the | Assets Presented | |||||||||||
| Gross Amounts of | Statement of Assets | in the Statement of | ||||||||||
| Description | Recognized Assets | and Liabilities | Assets and Liabilities | |||||||||
| Credit Default Swaps Contracts | $ | 132,114 | $ | – | $ | 132,114 | ||||||
| Forward Foreign Currency Exchange Contracts | 710,074 | – | 710,074 | |||||||||
| Repurchase Agreements | 147,329,234 | – | 147,329,234 | |||||||||
| Total | $ | 148,171,422 | $ | – | $ | 148,171,422 | ||||||
| Net Amount | ||||||||||||||||||||
| of Assets | Amounts Not Offset in the | |||||||||||||||||||
| Presented in | Statement of Assets and Liabilities | |||||||||||||||||||
| the Statement | Cash | Securities | ||||||||||||||||||
| of Assets and | Financial | Collateral | Collateral | Net | ||||||||||||||||
| Counterparty | Liabilities | Instruments | Received(a) | Received(a) | Amount(b) | |||||||||||||||
| Citibank | $ | 132,114 | $ | (132,114 | ) | $ | – | $ | – | $ | – | |||||||||
| Morgan Stanley | 367,988 | (367,988 | ) | – | – | – | ||||||||||||||
| Standard Chartered Bank | 342,086 | – | (270,000 | ) | – | 72,086 | ||||||||||||||
| Fixed Income Clearing Corp. | 147,329,234 | – | – | (147,329,234 | ) | – | ||||||||||||||
| Total | $ | 148,171,422 | $ | (500,102 | ) | $ | (270,000 | ) | $ | (147,329,234 | ) | $ | 72,086 | |||||||
| Gross Amounts | Net Amounts of | |||||||||||
| Offset in the | Liabilities Presented | |||||||||||
| Gross Amounts of | Statement of Assets | in the Statement of | ||||||||||
| Description | Recognized Liabilities | and Liabilities | Assets and Liabilities | |||||||||
| Credit Default Swap Contracts | $ | 21,950,801 | $ | – | $ | 21,950,801 | ||||||
| Forward Foreign Currency Exchange Contracts | 3,957,389 | – | 3,957,389 | |||||||||
| Reverse Repurchase Agreements | 3,854,284 | – | 3,854,284 | |||||||||
| Total | $ | 29,762,474 | $ | – | $ | 29,762,474 | ||||||
| Net Amounts | ||||||||||||||||||||
| of Liabilities | Amounts Not Offset in the | |||||||||||||||||||
| Presented in | Statement of Assets and Liabilities | |||||||||||||||||||
| the Statement | Cash | Securities | ||||||||||||||||||
| of Assets and | Financial | Collateral | Collateral | Net | ||||||||||||||||
| Counterparty | Liabilities | Instruments | Pledged(a) | Pledged(a) | Amount(c) | |||||||||||||||
| Barclays Bank plc | $ | 3,854,284 | $ | – | $ | – | $ | (3,854,284 | ) | $ | – | |||||||||
| Citibank | 14,218,151 | (132,114 | ) | (14,026,824 | ) | – | 59,213 | |||||||||||||
| Credit Agricole | 159,965 | – | – | – | 159,965 | |||||||||||||||
| Goldman Sachs | 2,046,429 | – | (1,710,000 | ) | – | 336,429 | ||||||||||||||
| Morgan Stanley | 8,598,018 | (367,988 | ) | (6,490,000 | ) | – | 1,740,030 | |||||||||||||
| State Street Bank and Trust | 885,627 | – | (480,000 | ) | – | 405,627 | ||||||||||||||
| Total | $ | 29,762,474 | $ | (500,102 | ) | $ | (22,706,824 | ) | $ | (3,854,284 | ) | $ | 2,701,264 | |||||||
| (a) | Collateral disclosed is limited to an amount not to exceed 100% of the net amount of assets (liabilities) presented in the Statement of Assets and Liabilities, for each respective counterparty |
| (b) | Net amount represents the amount owed to the Fund by the counterparty as of December 31, 2021. |
| (c) | Net amount represents the amount owed by the Fund to the counterparty as of December 31, 2021. |
77
Notes to Financial Statements (continued)
| 8. | DIRECTORS’ REMUNERATION |
The Fund’s officers and one Director, who are associated with Lord Abbett do not receive any compensation from the Fund for serving in such capacities. Independent Directors’ fees are allocated among all Lord Abbett-sponsored funds based on the net assets of each fund. There is an equity-based plan available to all Independent Directors under which Independent Directors must defer receipt of a portion of and may elect to defer receipt of an additional portion of, Directors’ fees. The deferred amounts are treated as though equivalent dollar amounts had been invested in the Fund. Such amounts and earnings accrued thereon are included in Directors’ fees on the Statement of Operations and in Directors’ fees payable on the Statement of Assets and Liabilities and are not deductible for U.S. federal income tax purposes until such amounts are paid.
| 9. | EXPENSE REDUCTIONS |
The Fund has entered into an arrangement with its transfer agent and custodian, whereby credits realized as a result of uninvested cash balances are used to reduce a portion of the Fund’s expenses.
| 10. | LINE OF CREDIT |
For the period ended August 4, 2021, the Fund and certain other funds managed by Lord Abbett (collectively, the “Participating Funds”) entered into a syndicated line of credit facility with various lenders for $1.17 billion (the “Syndicated Facility”) whereas State Street Bank and Trust Company (“SSB”) participated as a lender and as agent for the lenders. The Participating Funds were subject to graduated borrowing limits of one-third of Fund net assets (if Fund net assets are less than $750 million), $250 million, $300 million, $600 million, or $900 million, based on past borrowings and likelihood of future borrowings, among other factors.
Effective August 5, 2021, the Participating Funds entered into a Syndicated Facility with various lenders for $1.275 billion whereas SSB participates as a lender and as agent for the lenders. The Participating Funds are subject to graduated borrowing limits of one-third of Fund net assets (if Fund net assets are less than $750 million), $250 million, $300 million, $700 million, or $1 billion, based on past borrowings and likelihood of future borrowings, among other factors.
For the fiscal year ended December 31, 2021, the Participating Funds were party to an additional line of credit facility with SSB for $330 million (the “Bilateral Facility”), $250 million committed and $80 million uncommitted. Under the Bilateral Facility, the Participating Funds are subject to graduated borrowing limits of one-third of Fund net assets (if net assets are less than $750 million), $250 million, $300 million, or $330 million, based on past borrowings and likelihood of future borrowings, among other factors.
The Syndicated Facility and the Bilateral Facility are to be used for temporary or emergency purposes as additional sources of liquidity to satisfy redemptions.
The Fund utilized the Facility for the period December 10, 2021 through December 13, 2021 with an average borrowing amount of $38,062,420. The average interest rate during the period was 1.33% and total interest paid amounted to $4,322.
| 11. | INTERFUND LENDING PROGRAM |
Pursuant to an exemptive order issued by the U.S. Securities and Exchange Commission (“SEC exemptive order”), certain registered open-end management investment companies managed by Lord Abbett, including the Fund, participate in a joint lending and borrowing program (the
78
Notes to Financial Statements (continued)
“Interfund Lending Program”). The SEC exemptive order allows the Fund to borrow money from and lend money to each other for temporary or emergency purposes subject to the limitations and conditions.
For the fiscal year ended December 31, 2021, the Fund participated as a lender in the Interfund Lending Program. For the period in which the loan was outstanding, the average amount loaned, interest rate and interest income were as follows:
| Average | Average | Interest | |
| Amount Loaned | Interest Rate | Income | |
| $28,205,000 | 0.54% | $413 |
| 12. | CUSTODIAN AND ACCOUNTING AGENT |
SSB is the Fund’s custodian and accounting agent. SSB performs custodial, accounting and recordkeeping functions relating to portfolio transactions and calculating the Fund’s NAV.
| 13. | TRANSACTIONS WITH AFFILIATED ISSUERS |
An affiliated issuer is one in which a fund has ownership of at least 5% of the outstanding voting securities of the underlying issuer at any point during the fiscal year or any company which is under common ownership or control. Bond Debenture Fund had the following transactions with affiliated issuers during the fiscal year ended December 31, 2021:
| Net | ||||||||||||||||
| Proceeds | Net | Change in | Shares | |||||||||||||
| Affiliated | Value at | Purchases | from | Realized | Appreciation | Value at | as of | Dividend | ||||||||
| Issuer | 12/31/2020 | at Cost | Sales | Gain(Loss) | (Depreciation) | 12/31/2021 | 12/31/2021 | Income | ||||||||
| Hawaiian Holdings Inc(a)(b) | $32,674,501 | $34,361,677 | $(71,037,771) | $(121,717) | $4,123,310 | $ – | $– | $– | ||||||||
| (a) | Not affiliated at the beginning of the period. |
| (b) | Not affiliated at the end of the period. |
| 14. | SECURITIES LENDING AGREEMENT |
The Fund has established a securities lending agreement with Citibank, N.A. for the lending of securities to qualified brokers in exchange for securities or cash collateral equal to at least the market value of securities loaned, plus interest, if applicable. Cash collateral is invested in an approved money market fund. In accordance with the Fund’s securities lending agreement, the market value of securities on loan is determined each day at the close of business and any additional collateral required to cover the value of securities on loan is delivered to the Fund on the next business day. As with other extensions of credit, the Fund may experience a delay in the recovery of its securities or incur a loss should the borrower of the securities breach its agreement with the Fund or the borrower becomes insolvent at a time when the collateral is insufficient to cover the cost of repurchasing securities on loan. Any income earned from securities lending is included in Securities lending net income on the Statement of Operations.
The initial collateral received by the Fund is required to have a value equal to at least 100% of the market value of the securities loaned. The collateral must be marked-to-market daily to cover increases in the market value of the securities loaned (or potentially a decline in the value of the collateral). In general, the risk of borrower default will be borne by Citibank, N.A.; the Fund will bear the risk of loss with respect to the investment of the cash collateral. The advantage of such loans is that the Fund continues to receive income on loaned securities while receiving a portion of any
79
Notes to Financial Statements (continued)
securities lending fees and earning returns on the cash amounts which may be reinvested for the purchase of investments in securities.
As of December 31, 2021, the market value of securities loaned and collateral received for the Fund were as follows:
| Market Value of | Collateral |
| Securities Loaned | Received(1) |
| $76,846,398 | $78,958,492 |
| (1) | Statement of Assets and Liabilities location: Payable for collateral due to broker for securities lending. |
| 15. | INVESTMENT RISKS |
The Fund is subject to the general risks and considerations associated with investing in debt securities and to the changing prospects of individual companies and/or sectors in which the Fund invests. The value of an investment will change as interest rates fluctuate and in response to market movements. When interest rates rise, the prices of debt securities are likely to decline; when rates fall, such prices tend to rise. Longer-term debt securities are usually more sensitive to interest rate changes. There is also the risk that an issuer of a debt security will fail to make timely payments of principal or interest to the Fund, a risk that is greater with high-yield securities (sometimes called “lower-rated bonds” or “junk bonds”), in which the Fund may substantially invest. Some issuers, particularly of high-yield securities, may default as to principal and/or interest payments after the Fund purchases its securities. A default, or concerns in the market about an increase in risk of default, may result in losses to the Fund. High-yield securities are subject to greater price fluctuations, as well as additional risks. The market for below investment grade securities may be less liquid, which may make such securities more difficult to sell at an acceptable price, especially during periods of financial distress, increased market volatility, or significant market decline.
Certain instruments in which the Fund may invest may rely in some fashion upon LIBOR. On March 5, 2021 the United Kingdom Financial Conduct Authority (FCA) and LIBOR’s administrator, ICE Benchmark Administration (IBA), announced that most LIBOR settings will no longer be published after the end of 2021 and a majority of U.S. dollar LIBOR setting will no longer be published after June 30, 2023. Abandonment of or modification to LIBOR could have adverse impacts on newly issued financial instruments and existing financial instruments which reference LIBOR and lead to significant short-term and long-term uncertainty and market instability.
The Fund is subject to the risk of investing in securities issued or guaranteed by the U.S. Government or its agencies and instrumentalities (such as the Government National Mortgage Association (“Ginnie Mae”), the Federal National Mortgage Association (“Fannie Mae”), or the Federal Home Loan Mortgage Corporation (“Freddie Mac”)). Unlike Ginnie Mae securities, securities issued or guaranteed by U.S. Government-related organizations such as Fannie Mae and Freddie Mac are not backed by the full faith and credit of the U.S. Government and no assurance can be given that the U.S. Government would provide financial support to its agencies and instrumentalities if not required to do so by law. Consequently, the Fund may be required to look principally to the agency issuing or guaranteeing the obligation.
The mortgage-related and asset-backed securities in which the Fund may invest may be particularly sensitive to changes in prevailing interest rates, and economic conditions, including delinquencies and/or defaults. These changes can affect the value, income, and/or liquidity of such positions. When interest rates are declining, the value of these securities with prepayment features may not increase as much as other fixed income securities. Early principal repayment may deprive the Fund
80
Notes to Financial Statements (continued)
of income payments above current market rates. Alternatively, rising interest rates may cause prepayments to occur at a slower-than-expected rate, extending the duration of a security and typically reducing its value. The payment rate will thus affect the price and volatility of a mortgage-related security. In addition, the Fund may invest in non-agency asset backed and mortgage related securities, which are issued by private institutions, not by government-sponsored enterprises.
The Fund may invest up to 20% of its net assets in equity securities, the value of which fluctuates in response to movements in the equity securities markets in general, the changing prospects of individual companies in which the Fund invests, or an individual company’s financial condition.
The Fund may invest in convertible securities, which have both equity and fixed income risk characteristics, including market, credit, liquidity, and interest rate risks. Generally, convertible securities offer lower interest or dividend yields than non-convertible securities of similar quality and less potential for gains or capital appreciation in a rising equity securities market than equity securities. They tend to be more volatile than other fixed income securities and the market for convertible securities may be less liquid than the markets for stocks or bonds. A significant portion of convertible securities have below investment grade credit ratings and are subject to increased credit and liquidity risks.
Due to the Fund’s investment exposure to foreign companies and American Depositary Receipts, the Fund may experience increased market, industry and sector, liquidity, currency, political, information, and other risks. The securities of foreign companies also may be subject to inadequate exchange control regulations, the imposition of economic sanctions or other government restrictions, higher transaction and other costs, and delays in settlement to the extent they are traded on non-U.S. exchanges or markets.
The Fund is subject to the risks associated with derivatives, which may be different from and greater than the risks associated with directly investing in securities. Derivatives may be subject to risks such as liquidity risk, leveraging risk, interest rate risk, market risk, and credit risk. Illiquid securities may lower the Fund’s returns since the Fund may be unable to sell these securities at their desired time or price. Derivatives also may involve the risk of mispricing or improper valuation and the risk that changes in the value of the derivative may not correlate perfectly with the value of the underlying asset, rate or index. Whether the Fund’s use of derivatives is successful will depend on, among other things, the Fund’s ability to correctly forecast market movements and other factors. Losses may also arise from the failure of a derivative counterparty to meet its contractual obligations. If the Fund incorrectly forecasts these and other factors, the Fund’s performance could suffer. The Fund’s use of derivatives could result in a loss exceeding the amount of the Fund’s investment in these instruments.
The Fund may invest up to 15% of its net assets in floating rate or adjustable rate senior loans, including bridge loans, novations, assignments, and participations, which are subject to increased credit and liquidity risks. Senior loans are business loans made to borrowers that may be U.S. or foreign corporations, partnerships or other business entities. The senior loans in which the Fund invests may consist primarily of senior loans that are rated below investment grade or, if unrated, deemed by Lord Abbett to be equivalent to below investment grade securities. Below investment grade senior loans, as in the case of high-yield debt securities, or junk bonds, are usually more credit sensitive than interest rate sensitive, although the value of these instruments may be impacted by broader interest rate swings in the overall fixed income market. In addition, senior loans may be subject to structural subordination.
Geopolitical and other events (e.g., wars, terrorism, natural disasters, epidemics or pandemics such as the COVID 19 outbreak which began in late 2019) may disrupt securities markets and adversely
81
Notes to Financial Statements (continued)
affect global economies and markets, thereby decreasing the value of the Fund’s investments. Market disruptions can also prevent the Fund from implementing its investment strategies and achieving its investment objective.
The transmission of COVID-19 and efforts to contain its spread have resulted in, among other things, border closings and other significant travel restrictions and disruptions, significant disruptions to business operations, supply chains and customer activity, lower consumer demand for goods and services, event cancellations and restrictions, service cancellations, reductions and other changes, significant challenges in healthcare service preparation and delivery, and prolonged quarantines, as well as general concern and uncertainty. The impact of the COVID-19 outbreak could negatively affect the global economy, the economies of individual countries, and the financial performance of individual issuers, sectors, industries, asset classes, and markets in significant and unforeseen ways.
The COVID-19 pandemic and its effects may last for an extended period of time, and in either case could result in significant market volatility, exchange trading suspensions and closures, declines in global financial markets, higher default rates, and a substantial economic downturn or recession. The foregoing could disrupt the operations of the Fund and its service providers, adversely affect the value and liquidity of the Fund’s investments, and negatively impact the Fund’s performance and your investment in the Fund.
These factors and others can affect the Fund’s performance.
| 16. | SUMMARY OF CAPITAL TRANSACTIONS |
Transactions in shares of capital stock were as follows:
| Year Ended | Year Ended | |||||||||||||||
| December 31, 2021 | December 31, 2020 | |||||||||||||||
| Class A Shares | Shares | Amount | Shares | Amount | ||||||||||||
| Shares sold | 206,402,323 | $ | 1,748,549,646 | 157,828,188 | $ | 1,247,429,407 | ||||||||||
| Converted from Class C* | 469,146 | 3,971,581 | 27,104,298 | 215,045,790 | ||||||||||||
| Reinvestment of distributions | 25,670,930 | 216,975,284 | 23,977,523 | 188,807,761 | ||||||||||||
| Shares reacquired | (124,990,630 | ) | (1,058,579,414 | ) | (154,975,281 | ) | (1,201,109,809 | ) | ||||||||
| Increase | 107,551,769 | $ | 910,917,097 | 53,934,728 | $ | 450,173,149 | ||||||||||
| Class C Shares | ||||||||||||||||
| Shares sold | 39,302,649 | $ | 333,880,452 | 37,621,637 | $ | 299,231,798 | ||||||||||
| Reinvestment of distributions | 4,050,570 | 34,312,333 | 4,567,428 | 35,936,774 | ||||||||||||
| Shares reacquired | (33,680,789 | ) | (285,954,342 | ) | (36,038,524 | ) | (280,575,914 | ) | ||||||||
| Converted to Class A* | (467,994 | ) | (3,971,581 | ) | (27,009,701 | ) | (215,045,790 | ) | ||||||||
| Increase (decrease) | 9,204,436 | $ | 78,266,862 | (20,859,160 | ) | $ | (160,453,132 | ) | ||||||||
| Class F Shares | ||||||||||||||||
| Shares sold | 718,872,319 | $ | 6,079,659,681 | 552,538,189 | $ | 4,318,157,677 | ||||||||||
| Reinvestment of distributions | 36,410,599 | 307,140,384 | 26,035,953 | 205,019,920 | ||||||||||||
| Shares reacquired | (301,307,439 | ) | (2,545,419,316 | ) | (352,095,601 | ) | (2,712,535,592 | ) | ||||||||
| Increase | 453,975,479 | $ | 3,841,380,749 | 226,478,541 | $ | 1,810,642,005 | ||||||||||
| Class F3 Shares | ||||||||||||||||
| Shares sold | 290,585,175 | $ | 2,450,723,936 | 126,591,883 | $ | 999,521,576 | ||||||||||
| Reinvestment of distributions | 19,397,721 | 163,140,582 | 13,162,579 | 103,289,531 | ||||||||||||
| Shares reacquired | (50,869,047 | ) | (428,524,098 | ) | (65,428,154 | ) | (502,039,709 | ) | ||||||||
| Increase | 259,113,849 | $ | 2,185,340,420 | 74,326,308 | $ | 600,771,398 | ||||||||||
82
Notes to Financial Statements (concluded)
| Year Ended | Year Ended | |||||||||||||||
| December 31, 2021 | December 31, 2020 | |||||||||||||||
| Class I Shares | Shares | Amount | Shares | Amount | ||||||||||||
| Shares sold | 193,011,609 | $ | 1,626,218,838 | 118,039,562 | $ | 916,994,059 | ||||||||||
| Reinvestment of distributions | 11,126,567 | 93,484,913 | 7,546,014 | 59,201,144 | ||||||||||||
| Shares reacquired | (61,320,377 | ) | (516,114,345 | ) | (85,647,931 | ) | (656,056,441 | ) | ||||||||
| Increase | 142,817,799 | $ | 1,203,589,406 | 39,937,645 | $ | 320,138,762 | ||||||||||
| Class P Shares | ||||||||||||||||
| Shares sold | 145,209 | $ | 1,260,351 | 196,791 | $ | 1,597,987 | ||||||||||
| Reinvestment of distributions | 51,930 | 448,944 | 66,369 | 533,363 | ||||||||||||
| Shares reacquired | (382,642 | ) | (3,323,899 | ) | (633,738 | ) | (5,060,755 | ) | ||||||||
| Decrease | (185,503 | ) | $ | (1,614,604 | ) | (370,578 | ) | $ | (2,929,405 | ) | ||||||
| Class R2 Shares | ||||||||||||||||
| Shares sold | 225,137 | $ | 1,909,831 | 275,486 | $ | 2,139,183 | ||||||||||
| Reinvestment of distributions | 16,438 | 138,900 | 19,221 | 151,092 | ||||||||||||
| Shares reacquired | (301,118 | ) | (2,550,909 | ) | (495,836 | ) | (3,930,282 | ) | ||||||||
| Decrease | (59,543 | ) | $ | (502,178 | ) | (201,129 | ) | $ | (1,640,007 | ) | ||||||
| Class R3 Shares | ||||||||||||||||
| Shares sold | 7,245,529 | $ | 61,241,724 | 6,611,968 | $ | 52,550,660 | ||||||||||
| Reinvestment of distributions | 1,021,610 | 8,618,480 | 948,942 | 7,452,905 | ||||||||||||
| Shares reacquired | (4,316,643 | ) | (36,470,385 | ) | (4,698,977 | ) | (36,107,907 | ) | ||||||||
| Increase | 3,950,496 | $ | 33,389,819 | 2,861,933 | $ | 23,895,658 | ||||||||||
| Class R4 Shares | ||||||||||||||||
| Shares sold | 4,245,023 | $ | 35,996,735 | 5,324,778 | $ | 42,217,803 | ||||||||||
| Reinvestment of distributions | 216,804 | 1,832,681 | 197,209 | 1,551,816 | ||||||||||||
| Shares reacquired | (2,786,214 | ) | (23,603,740 | ) | (4,174,784 | ) | (33,204,398 | ) | ||||||||
| Increase | 1,675,613 | $ | 14,225,676 | 1,347,203 | $ | 10,565,221 | ||||||||||
| Class R5 Shares | ||||||||||||||||
| Shares sold | 1,478,465 | $ | 12,473,875 | 1,533,274 | $ | 12,080,926 | ||||||||||
| Reinvestment of distributions | 125,286 | 1,054,204 | 106,943 | 838,962 | ||||||||||||
| Shares reacquired | (653,471 | ) | (5,512,519 | ) | (964,294 | ) | (7,618,343 | ) | ||||||||
| Increase | 950,280 | $ | 8,015,560 | 675,923 | $ | 5,301,545 | ||||||||||
| Class R6 Shares | ||||||||||||||||
| Shares sold | 23,931,077 | $ | 201,759,214 | 19,643,874 | $ | 154,381,481 | ||||||||||
| Reinvestment of distributions | 1,378,285 | 11,594,422 | 953,284 | 7,485,109 | ||||||||||||
| Shares reacquired | (9,922,185 | ) | (83,650,750 | ) | (10,110,583 | ) | (78,619,883 | ) | ||||||||
| Increase | 15,387,177 | $ | 129,702,886 | 10,486,575 | $ | 83,246,707 | ||||||||||
| * | Automatic conversion of Class C shares occurs on the 25th day of the month (or, if the 25th day was not a business day, the next business day thereafter) following the eighth anniversary of the day on which the purchase order was accepted. Prior to June 30, 2020, conversion occurred following the tenth anniversary of the day on which the purchase was accepted. |
83
Report of Independent Registered Public Accounting Firm
To the shareholders and the Board of Directors of Lord Abbett Bond-Debenture Fund, Inc.
Opinion on the Financial Statements and Financial Highlights
We have audited the accompanying statement of assets and liabilities of Lord Abbett Bond-Debenture Fund, Inc. (the “Fund”), including the schedule of investments, as of December 31, 2021, the related statement of operations for the year then ended, the statements of changes in net assets for each of the two years in the period then ended, the financial highlights for each of the five years in the period then ended, and the related notes. In our opinion, the financial statements and financial highlights present fairly, in all material respects, the financial position of the Fund as of December 31, 2021, and the results of its operations for the year then ended, the changes in its net assets for each of the two years in the period then ended, and the financial highlights for each of the five years in the period then ended in conformity with accounting principles generally accepted in the United States of America.
Basis for Opinion
These financial statements and financial highlights are the responsibility of the Fund’s management. Our responsibility is to express an opinion on the Fund’s financial statements and financial highlights based on our audits. We are a public accounting firm registered with the Public Company Accounting Oversight Board (United States) (PCAOB) and are required to be independent with respect to the Fund in accordance with the U.S. federal securities laws and the applicable rules and regulations of the Securities and Exchange Commission and the PCAOB.
We conducted our audits in accordance with the standards of the PCAOB. Those standards require that we plan and perform the audit to obtain reasonable assurance about whether the financial statements and financial highlights are free of material misstatement, whether due to error or fraud. The Fund is not required to have, nor were we engaged to perform, an audit of its internal control over financial reporting. As part of our audits we are required to obtain an understanding of internal control over financial reporting but not for the purpose of expressing an opinion on the effectiveness of the Fund’s internal control over financial reporting. Accordingly, we express no such opinion.
Our audits included performing procedures to assess the risks of material misstatement of the financial statements and financial highlights, whether due to error or fraud, and performing procedures that respond to those risks. Such procedures included examining, on a test basis, evidence regarding the amounts and disclosures in the financial statements and financial highlights. Our audits also included evaluating the accounting principles used and significant estimates made by management, as well as evaluating the overall presentation of the financial statements and financial highlights. Our procedures included confirmation of securities owned as of December 31, 2021, by correspondence with the custodian, brokers and selling or agent banks; when replies were not received from brokers and selling or agent banks, we performed other auditing procedures. We believe that our audits provide a reasonable basis for our opinion.
DELOITTE & TOUCHE LLP
New York, New York
February 25, 2022
We have served as the auditor of one or more Lord Abbett Family of Funds’ investment companies since 1932.
84
Basic Information About Management
The Board is responsible for the management of the business and affairs of the Fund in accordance with the laws of the state of organization. The Board elects officers who are responsible for the day-to-day operations of the Fund and who execute policies authorized by the Board. The Board also approves an investment adviser to the Fund and continues to monitor the cost and quality of the services the investment adviser provides, and annually considers whether to renew the contract with the investment adviser. Generally, each Board member holds office until his/her successor is elected and qualified or until his/her earlier resignation or removal, as provided in the Fund’s organizational documents.
Lord, Abbett & Co. LLC (“Lord Abbett”), a Delaware limited liability company, is the Fund’s investment adviser. Designated Lord Abbett personnel are responsible for the day-to-day management of the Fund.
Independent Board Members
The following Independent Board Members also are board members of each of the 14 investment companies in the Lord Abbett Family of Funds, which consist of 63 investment portfolios.
| Name, Address and Year of Birth | Current Position and Length of Service with the Fund | Principal Occupation and Other Directorships During the Past Five Years | ||
| Evelyn E. Guernsey Lord, Abbett & Co. LLC c/o Legal Dept. 90 Hudson Street Jersey City, NJ 07302 (1955) | Board member since 2011 | Principal Occupation: None.
Other Directorships: None. | ||
| Julie A. Hill Lord, Abbett & Co. LLC c/o Legal Dept. 90 Hudson Street Jersey City, NJ 07302 (1946) | Board member since 2004 | Principal Occupation: Owner and CEO of The Hill Company, a business consulting firm (since 1998).
Other Directorships: Currently serves as director of Anthem, Inc., a health benefits company (since 1994). | ||
| Kathleen M. Lutito Lord, Abbett & Co. LLC c/o Legal Dept. 90 Hudson Street Jersey City, NJ 07302 (1963) | Board member since 2017 | Principal Occupation: President and Chief Investment Officer of CenturyLink Investment Management Company (since 2006).
Other Directorships: None. | ||
| James M. McTaggart Lord, Abbett & Co. LLC c/o Legal Dept. 90 Hudson Street Jersey City, NJ 07302 (1947) | Board member since 2012 | Principal Occupation: Independent management advisor and consultant (since 2012).
Other Directorships: Blyth, Inc., a home products company (2004–2015). | ||
| Charles O. Prince Lord, Abbett & Co. LLC c/o Legal Dept. 90 Hudson Street Jersey City, NJ 07302 (1950) | Board member since 2019 | Principal Occupation: None. Formerly Chairman and Chief Executive Officer, Citigroup, Inc. (Retired 2007).
Other Directorships: Currently serves as director of Johnson & Johnson (2006–Present). Previously served as director of Xerox Corporation (2008–2018). |
85
Basic Information About Management (continued)
| Name, Address and Year of Birth | Current Position and Length of Service with the Fund | Principal Occupation and Other Directorships During the Past Five Years | ||
| Karla M. Rabusch Lord, Abbett & Co. LLC c/o Legal Dept. 90 Hudson Street Jersey City, NJ 07302 (1959) | Board member since 2017 | Principal Occupation: President and Director of Wells Fargo Funds Management, LLC (2003–2017); President of Wells Fargo Funds (2003–2016).
Other Directorships: None. | ||
| Lorin Patrick Taylor Radtke Lord, Abbett & Co. LLC c/o Legal Dept. 90 Hudson Street Jersey City, NJ 07302 (1968) | Board member since 2021 | Principal Occupation: Partner and Co-Founder of M Seven 8 Partners LLC, a venture capital firm (since 2016). Formerly partner, Goldman Sachs.
Other Directorships: Currently serves as director of Assured Guaranty (2021–Present). | ||
| Leah Song Richardson Lord, Abbett & Co. LLC c/o Legal Dept. 90 Hudson Street Jersey City, NJ 07302 (1966) | Board member since 2021 | Principal Occupation: President of Colorado College (since 2021) and was formerly Dean at University of California, Irvine–School of Law (2017–2021) and formerly Professor of Law at University of California, Irvine (2014–2017).
Other Directorships: None. | ||
| Mark A. Schmid Lord, Abbett & Co. LLC c/o Legal Dept. 90 Hudson Street Jersey City, NJ 07302 (1959) | Board member since 2016 | Principal Occupation: None.
Other Directorships: None. | ||
| James L.L. Tullis Lord, Abbett & Co. LLC c/o Legal Dept. 90 Hudson Street Jersey City, NJ 07302 (1947) | Board member since 2006; Chairman since 2017 | Principal Occupation: Chairman of Tullis Health Investors – FL LLC (since 2018); CEO of Tullis–Dickerson and Co. Inc., a venture capital management firm (1990–2016).
Other Directorships: Currently serves as director of Crane Co. (since 1998), Alphatec Spine (since 2018), electroCore, Inc. (since 2018), and Exagen Inc. (since 2019). |
Interested Board Members
Mr. Sieg is affiliated with Lord Abbett and is an “interested person” of the Fund as defined in the Act. Mr. Sieg is a board member of each of the 14 investment companies in the Lord Abbett Family of Funds, which consist of 63 investment portfolios. Mr. Sieg is an officer of the Lord Abbett Family of Funds.
| Name, Address and Year of Birth | Current Position and Length of Service with the Fund | Principal Occupation and Other Directorships During the Past Five Years | ||
| Douglas B. Sieg Lord, Abbett & Co. LLC 90 Hudson Street Jersey City, NJ 07302 (1969) | Board member since 2016; President and Chief Executive Officer since 2018 | Principal Occupation: Managing Partner (since 2018) and was formerly Head of Client Services, joined Lord Abbett in 1994.
Other Directorships: None. |
86
Basic Information About Management (continued)
Officers
None of the officers listed below have received compensation from the Fund. All of the officers of the Fund also may be officers of the other Lord Abbett Funds and maintain offices at 90 Hudson Street, Jersey City, NJ 07302. Unless otherwise indicated, the position(s) and title(s) listed under the “Principal Occupation During the Past Five Years” column indicate each officer’s position(s) and title(s) with Lord Abbett. Each officer serves for an indefinite term (i.e., until his or her death, resignation, retirement, or removal).
| Name and Year of Birth | Current Position with the Fund | Length of Service of Current Position | Principal Occupation During the Past Five Years | |||
| Douglas B. Sieg (1969) | President and Chief Executive Officer | Elected as President and Chief Executive Officer in 2018 | Managing Partner of Lord Abbett (since 2018) and was formerly Head of Client Services, joined Lord Abbett in 1994. | |||
| Jackson C. Chan (1964) | AML Compliance Officer | Elected in 2018 | Deputy Chief Compliance Officer and Director of Regulatory Affairs, joined Lord Abbett in 2014. | |||
| Pamela P. Chen (1978) | Vice President, Assistant Secretary and Privacy Officer | Elected as Vice President and Assistant Secretary in 2018 and Privacy Officer in 2019 | Associate General Counsel, joined Lord Abbett in 2017 and was formerly Special Counsel at Schulte, Roth & Zabel LLP (2005–2017). | |||
| John T. Fitzgerald (1975) | Vice President and Assistant Secretary | Elected in 2018 | Deputy General Counsel, joined Lord Abbett in 2018 and was formerly Deputy Head of U.S. Funds Legal, Executive Director and Assistant General Counsel at JPMorgan Chase (2005–2018). | |||
| Vito A. Fronda (1969) | Vice President and Assistant Treasurer | Elected as Vice President and Assistant Treasurer in 2021 | Partner and Director of U.S. Fund Treasury & Global Taxation, joined Lord Abbett in 2003. | |||
| Michael J. Hebert (1976) | Chief Financial Officer and Treasurer | Elected as Chief Financial Officer and Treasurer in 2021 | Head of Global Fund Finance, joined Lord Abbett in 2021 and was formerly Vice President at Eaton Vance Management (EVM) (2014-2021) and Calvert Research & Management (CRM) (2016-2021), and Assistant Treasurer of registered investment companies managed, advised or administered by EVM and CRM during such years. |
87
Basic Information About Management (concluded)
| Name and Year of Birth | Current Position with the Fund | Length of Service of Current Position | Principal Occupation During the Past Five Years | |||
| Linda Y. Kim (1980) | Vice President and Assistant Secretary | Elected in 2016 | Counsel, joined Lord Abbett in 2015. | |||
| Joseph M. McGill (1962) | Chief Compliance Officer | Elected in 2014 | Partner and Chief Compliance Officer, joined Lord Abbett in 2014. | |||
| Amanda S. Ryan (1978) | Vice President and Assistant Secretary | Elected in 2018 | Counsel, joined Lord Abbett in 2016. | |||
| Lawrence B. Stoller (1963) | Vice President, Secretary and Chief Legal Officer | Elected as Vice President and Secretary in 2007 and Chief Legal Officer in 2019 | Partner and General Counsel, joined Lord Abbett in 2007. |
Please call 888-522-2388 for a copy of the statement of additional information, which contains further information about the Fund’s Board members. It is available free upon request.
88
Approval of Advisory Contract
The Board, including all of the Directors who are not “interested persons” of the Fund or of Lord Abbett, as defined in the Investment Company Act of 1940, as amended (the “Independent Directors”), annually considers whether to approve the continuation of the existing management agreement between the Fund and Lord Abbett (the “Agreement”). In connection with its most recent approval, the Board reviewed materials relating specifically to the Agreement, as well as numerous materials received throughout the course of the year, including information about the Fund’s investment performance compared to the performance of an appropriate benchmark. Before making its decision as to the Fund, the Board had the opportunity to ask questions and request further information, taking into account its knowledge of Lord Abbett gained through its meetings and discussions. These meetings and discussions included reviews of Fund performance conducted by members of the Contract Committee, the deliberations of the Contract Committee, and discussions between the Contract Committee and Lord Abbett’s management. The Independent Directors also met with their independent legal counsel in various private sessions at which no representatives of management were present.
The materials received by the Board included, but were not limited to: (1) information provided by Broadridge Financial Solutions (“Broadridge”) regarding the investment performance of the Fund compared to the investment performance of certain funds with similar investment styles as determined by Broadridge, based, in part, on the Fund’s Morningstar category (the “performance peer group”), and the investment performance of two appropriate benchmarks; (2) information provided by Broadridge regarding the expense ratios, contractual and actual management fee rates, and other expense components for the Fund and certain funds in the same Morningstar category, with generally the same or similar share classes and operational characteristics, including asset size (the “expense peer group”); (3) certain supplemental investment performance information provided by Lord Abbett; (4) information provided by Lord Abbett on the expense ratios, management fee rates, and other expense components for the Fund; (5) sales and redemption information for the Fund; (6) information regarding Lord Abbett’s financial condition; (7) an analysis of the relative profitability of the Agreement to Lord Abbett; (8) information provided by Lord Abbett regarding the investment management fee schedules for Lord Abbett’s other advisory clients maintaining accounts with a similar investment strategy as the Fund; and (9) information regarding the personnel and other resources devoted by Lord Abbett to managing the Fund.
Investment Management and Related Services Generally. The Board considered the services provided by Lord Abbett to the Fund, including investment research, portfolio management, and trading, and Lord Abbett’s commitment to compliance with all applicable legal requirements. The Board also observed that Lord Abbett was solely engaged in the investment management business and accordingly did not experience the conflicts of interest that may result from being engaged in other lines of business. The Board considered the investment advisory services provided by Lord Abbett to other clients, the fees charged for the services, and the differences in the nature of the services provided to the Fund and other Lord Abbett Funds, on the one hand, and the services provided to other clients, on the other. After reviewing these and related factors, the Board concluded that the Fund was likely to continue to benefit from the nature, extent and quality of the investment services provided by Lord Abbett under the Agreement.
Investment Performance. The Board reviewed the Fund’s investment performance in relation to that of the performance peer group and two appropriate benchmarks as of various periods ended June 30, 2021. The Board observed that the Fund’s investment performance was above the median of the performance peer group for the one-, three-, five-, and ten-year periods. The Board further
89
Approval of Advisory Contract (continued)
considered Lord Abbett’s performance and reputation generally, the performance of other Lord Abbett-managed funds overseen by the Board, and the willingness of Lord Abbett to take steps intended to improve performance when appropriate. After reviewing these and other factors, including those described below, the Board concluded that the Fund’s Agreement should be continued.
Lord Abbett’s Personnel and Methods. The Board considered the qualifications of the personnel providing investment management services to the Fund, in light of its investment objective and discipline, and other services provided to the Fund by Lord Abbett. Among other things, the Board considered the size, experience, and turnover of Lord Abbett’s staff, Lord Abbett’s investment methodology and philosophy, and Lord Abbett’s approach to recruiting, training, and retaining personnel.
Nature and Quality of Other Services. The Board considered the nature, quality, and extent of compliance, administrative, and other services performed by Lord Abbett and the nature and extent of Lord Abbett’s supervision of third party service providers, including the Fund’s transfer agent and custodian.
Expenses. The Board considered the expense level of the Fund, including the contractual and actual management fee rates, and the expense levels of the Fund’s expense peer group. It also considered how the expense level of the Fund related to those of the expense peer group and the amount and nature of the fees paid by shareholders. The Board observed that the net total expense ratio of the Fund was below the median of the expense peer group. After reviewing these and related factors, the Board concluded, within the context of its overall approval of the Agreement, that the management fees paid by, and expense level of, the Fund were reasonable in light of all of the factors it considered and supported the continuation of the Agreement.
Profitability. The Board considered the level of Lord Abbett’s operating margin in managing the Fund, including a review of Lord Abbett’s methodology for allocating its costs to its management of the Fund. It considered whether the Fund was profitable to Lord Abbett in connection with the Fund’s operation, including the fee that Lord Abbett receives from the Fund for providing administrative services to the Fund. The Board considered Lord Abbett’s profit margins excluding Lord Abbett’s marketing and distribution expenses. The Board also considered Lord Abbett’s profit margins, without those exclusions, in comparison with available industry data and how those profit margins could affect Lord Abbett’s ability to recruit and retain personnel. The Board recognized that Lord Abbett’s overall profitability was a factor in enabling it to attract and retain qualified personnel to provide services to the Fund. After reviewing these and related factors, the Board concluded, within the context of its overall approval of the Agreement, that Lord Abbett’s profitability with respect to the Fund was not excessive.
Economies of Scale. The Board considered the extent to which there had been economies of scale in managing the Fund, whether the Fund’s shareholders had appropriately benefited from such economies of scale, and whether there was potential for realization of any further economies of scale. The Board also considered information provided by Lord Abbett regarding how it shares any potential economies of scale through its investments in its businesses supporting the Funds. The Board also considered the Fund’s existing management fee schedule, with its breakpoints in the level of the management fee. Based on these considerations, the Board concluded that economies of scale were adequately addressed in respect of the Fund.
90
Approval of Advisory Contract (concluded)
Other Benefits to Lord Abbett. The Board considered the amount and nature of the fees paid by the Fund and the Fund’s shareholders to Lord Abbett and the Distributor for services other than investment advisory services, such as the fee that Lord Abbett receives from the Fund for providing administrative services to the Fund. The Board also considered the revenues and profitability of Lord Abbett’s investment advisory business apart from its mutual fund business, and the intangible benefits enjoyed by Lord Abbett by virtue of its relationship with the Fund. The Board observed that the Distributor receives 12b-1 fees from certain of the Lord Abbett Funds as to shares held in accounts for which there is no other broker of record, may retain a portion of the 12b-1 fees it receives, and receives a portion of the sales charges on sales and redemptions of some classes of shares of the Lord Abbett Funds. In addition, the Board observed that Lord Abbett accrues certain benefits for its business of providing investment advice to clients other than the Lord Abbett Funds, but that business also benefits the Funds. The Board also noted that Lord Abbett, as disclosed in the prospectus of the Fund, has entered into revenue sharing arrangements with certain entities that distribute shares of the Lord Abbett Funds. The Board also took into consideration the investment research that Lord Abbett receives as a result of client brokerage transactions.
Alternative Arrangements. The Board considered whether, instead of approving continuation of the Agreement, it might be in the best interests of the Fund to implement one or more alternative arrangements, such as continuing to employ Lord Abbett, but on different terms. After considering all of the relevant factors, the Board unanimously found that continuation of the Agreement was in the best interests of the Fund and its shareholders and voted unanimously to approve the continuation of the Agreement. In considering whether to approve the continuation of the Agreement, the Board did not identify any single factor as paramount or controlling. Individual Directors may have evaluated the information presented differently from one another, giving different weights to various factors. This summary does not discuss in detail all matters considered.
91
Householding
The Fund has adopted a policy that allows it to send only one copy of the Fund’s prospectus, proxy material, annual report and semiannual report (or related notice of internet availability of annual report and semiannual report) to certain shareholders residing at the same “household.” This reduces Fund expenses, which benefits you and other shareholders. If you need additional copies or do not want your mailings to be “householded,” please call Lord Abbett at 888-522-2388 or send a written request with your name, the name of your fund or funds and your account number or numbers to Lord Abbett Family of Funds, P.O. Box 219336, Kansas City, MO 64121.
Proxy Voting Policies, Procedures and Records
A description of the policies and procedures that Lord Abbett uses to vote proxies related to the Fund’s portfolio securities, and information on how Lord Abbett voted the Fund’s proxies during the 12-month period ended June 30 are available without charge, upon request, (i) by calling 888-522-2388; (ii) on Lord Abbett’s Website at www.lordabbett.com; and (iii) on the Securities and Exchange Commission’s (“SEC”) Website at www.sec.gov.
Shareholder Reports and Quarterly Portfolio Disclosure
The Fund is required to file its complete schedule of portfolio holdings with the SEC for its first and third fiscal quarters as an attachment to Form N-PORT. Copies of the filings are available without charge, upon request on the SEC’s Website at www.sec.gov and may be available by calling Lord Abbett at 888-522-2388.
Tax Information (unaudited)
For foreign shareholders, 99% of the net investment income distributions paid by the Fund during the year ended December 31, 2021 represent interest-related dividends.
3% of the ordinary income distributions paid by the Fund during the fiscal year ended December 31, 2021 is qualified dividend income. For corporate shareholders, 3% of the Fund’s ordinary income distributions qualified for the dividend received deduction.
Additionally, of the distributions paid to the shareholders during the fiscal year ended December 31, 2021, $100,340,151 represent short-term capital gains.
|
92


| This report, when not used for the general information of shareholders of the Fund, is to be distributed only if preceded or accompanied by a current fund prospectus. | |||
| Lord Abbett mutual fund shares are distributed by LORD ABBETT DISTRIBUTOR LLC. | Lord Abbett Bond-Debenture Fund, Inc. | LABD-2 (2/22) |
| Item 2: | Code of Ethics. |
| (a) | In accordance with applicable requirements, the Registrant adopted a Sarbanes-Oxley Code of Ethics on June 19, 2003 that applies to the principal executive officer and senior financial officers of the Registrant (“Code of Ethics”). The Code of Ethics was in effect during the fiscal year ended December 31, 2021 (the “Period”). |
| (b) | Not applicable. |
| (c) | The Registrant has not amended the Code of Ethics as described in Form N-CSR during the Period. |
| (d) | The Registrant has not granted any waiver, including an implicit waiver, from a provision of the Code of Ethics as described in Form N-CSR during the Period. |
| (e) | Not applicable. |
| (f) | See Item 12(a)(1) concerning the filing of the Code of Ethics. |
| Item 3: | Audit Committee Financial Expert. |
The Registrant’s board of directors has determined that each of the following independent directors who are members of the audit committee is an audit committee financial expert: Evelyn E. Guernsey, Karla M. Rabusch and Mark A. Schmid. Each of these persons is independent within the meaning of the Form N-CSR.
| Item 4: | Principal Accountant Fees and Services. |
In response to sections (a), (b), (c) and (d) of Item 4, the aggregate fees billed to the Registrant for the fiscal years ended December 31, 2021 and 2020 by the Registrant’s principal accounting firm, Deloitte & Touche LLP, the member firms of Deloitte Touche Tohmatsu and their respective affiliates (collectively, “Deloitte”) were as follows:
| Fiscal year ended: | ||
| 2021 | 2020 | |
| Audit Fees {a} | $73,000 | $73,000 |
| Audit-Related Fees | - 0 - | - 0 - |
| Total audit and audit-related fees | 73,000 | 73,000 |
| Tax Fees {b} | 7,671 | 7,597 |
| All Other Fees | - 0 - | - 0 - |
| Total Fees | $80,671 | $80,597 |
{a} Consists of fees for audits of the Registrant’s annual financial statements.
{b} Fees for the fiscal year ended December 31, 2021 and 2020 consist of fees for preparing the U.S. Income Tax Return for Regulated Investment Companies, New Jersey Corporation Business Tax Return, New Jersey Annual Report Form, U.S. Return of Excise Tax on Undistributed Income of Investment Companies, IRS Forms 1099-MISC and 1096 Annual Summary and Transmittal of U.S. Information Returns.
(e) (1) Pursuant to Rule 2-01(c) (7) of Regulation S-X, the Registrant’s Audit Committee has adopted pre-approval policies and procedures. Such policies and procedures generally provide that the Audit Committee must pre-approve:
| · | any audit, audit-related, tax, and other services to be provided to the Lord Abbett Funds, including the Registrant, and |
| · | any audit-related, tax, and other services to be provided to the Registrant’s investment adviser and any entity controlling, controlled by or under common control with the investment adviser that provides ongoing services to one or more Funds comprising the Registrant if the engagement relates directly to operations and financial reporting of a Fund, by the independent auditor to assure that the provision of such services does not impair the auditor’s independence. |
The Audit Committee has delegated pre-approval authority to its Chairman, subject to a fee limit of $10,000 per event, and not to exceed $25,000 annually. The Chairman will report any pre-approval decisions to the Audit Committee at its next scheduled meeting. Unless a type of service to be provided by the independent auditor has received general pre-approval, it must be pre-approved by the Audit Committee. Any proposed services exceeding pre-approved cost levels will require specific pre-approval by the Audit Committee.
(e) (2) The Registrant’s Audit Committee has approved 100% of the services described in this Item 4 (b) through (d).
(f) Not applicable.
(g) The aggregate non-audit fees billed by Deloitte for services rendered to the Registrant are shown above in the response to Item 4 (a), (b), (c) and (d) as “All Other Fees”.
The aggregate non-audit fees billed by Deloitte for services rendered to the Registrant’s investment adviser, Lord, Abbett & Co. LLC (“Lord Abbett”), for the fiscal years ended December 31, 2021 and 2020 were:
| Fiscal year ended: | ||
| 2021 | 2020 | |
| All Other Fees {a} | $220,000 | $214,142 |
{a} Consist of fees for Independent Services Auditors’ Report on Controls Placed in Operation and Tests of Operating Effectiveness related to Lord Abbett’s Asset Management Services (“SOC-1 Report”).
The aggregate non-audit fees billed by Deloitte for services rendered to entities under the common control of Lord Abbett for the fiscal years ended December 31, 2021 and 2020 were:
| Fiscal year ended: | ||
| 2021 | 2020 | |
| All Other Fees | $ - 0 - | $ - 0- |
(h) The Registrant’s Audit Committee has considered the provision of non-audit services that were rendered to the Registrant’s investment adviser, and any entity controlling, controlled by or under common control with the investment adviser that provides ongoing services to the Registrant, that were not pre-approved pursuant to Rule 2-01 (c)(7)(ii) of Regulation S-X and has determined that the provision of such services is compatible with maintaining Deloitte’s independence.
| Item 5: | Audit Committee of Listed Registrants. |
| Not applicable. | |
| Item 6: | Investments. |
| Not applicable. | |
| Item 7: | Disclosure of Proxy Voting Policies and Procedures for Closed-End Management Investment Companies. |
| Not applicable. | |
| Item 8: | Portfolio Managers of Closed-End Management Investment Companies. |
| Not applicable. | |
| Item 9: | Purchases of Equity Securities by Closed-End Management Investment Company and Affiliated Purchasers. |
| Not applicable. | |
| Item 10: | Submission of Matters to a Vote of Security Holders. |
| Not applicable. | |
| Item 11: | Controls and Procedures. |
| (a) | The principal executive officer and principal financial & accounting officer have concluded as of a date within 90 days of the filing date of this report, based on |
| their evaluation of the Registrant’s disclosure controls and procedures (as defined in Rule 30a-3(c) under the Investment Company Act of 1940), that the design of such procedures is effective to provide reasonable assurance that material information required to be disclosed by the Registrant on Form N-CSR is recorded, processed, summarized and reported within the time periods specified in the Commission’s rules and forms. |
| (b) | There were no changes in the Registrant’s internal control over financial reporting (as defined in Rule 30a-3(d) under the Investment Company Act of 1940) that occurred during the period covered by this report that have materially affected, or are reasonably likely to materially affect, the Registrant’s internal control over financial reporting. |
| Item 12: | Disclosure of Securities Lending Activities for Closed-End Management Investment Companies. |
| Not applicable. | |
| Item 13: | Exhibits. |
| (a)(1) | The Lord Abbett Family of Funds Sarbanes-Oxley Code of Ethics for the Principal Executive Officer and Senior Financial Officers is attached hereto as part of EX-99.CODEETH. |
SIGNATURES
Pursuant to the requirements of the Securities Exchange Act of 1934 and the Investment Company Act of 1940, the Registrant has duly caused this report to be signed on its behalf by the undersigned, thereunto duly authorized.
| LORD ABBETT BOND-DEBENTURE FUND, INC. | |||
| By: | /s/ Douglas B. Sieg | ||
| Douglas B. Sieg | |||
| President and Chief Executive Officer | |||
Date: February 25, 2022
Pursuant to the requirements of the Securities Exchange Act of 1934 and the Investment Company Act of 1940, this report has been signed below by the following persons on behalf of the Registrant and in the capacities and on the dates indicated.
| By: | /s/ Douglas B. Sieg | ||
| Douglas B. Sieg | |||
| President and Chief Executive Officer | |||
Date: February 25, 2022
| By: | /s/ Michael J. Hebert | ||
| Michael J. Hebert | |||
| Chief Financial Officer and Treasurer |
Date: February 25, 2022