UNITED STATES
SECURITIES AND EXCHANGE COMMISSION
Washington, D.C. 20549
FORM N-CSR
CERTIFIED SHAREHOLDER REPORT OF REGISTERED
MANAGEMENT INVESTMENT COMPANIES
Investment Company Act file number | 811-02145 | ||||||||
| |||||||||
LORD ABBETT BOND-DEBENTURE FUND, INC. | |||||||||
(Exact name of registrant as specified in charter) | |||||||||
| |||||||||
90 Hudson Street, Jersey City, NJ |
| 07302 | |||||||
(Address of principal executive offices) |
| (Zip code) | |||||||
| |||||||||
Christina T. Simmons, Vice President & Assistant Secretary 90 Hudson Street, Jersey City, NJ 07302 | |||||||||
(Name and address of agent for service) | |||||||||
| |||||||||
Registrant’s telephone number, including area code: | (800) 201-6984 |
| |||||||
| |||||||||
Date of fiscal year end: | 12/31 |
| |||||||
| |||||||||
Date of reporting period: | 12/31/06 |
| |||||||
Item 1: Report to Shareholders.
LORD ABBETT

2006
Annual
Report
Lord Abbett
Bond Debenture Fund
For the fiscal year ended December 31, 2006
Lord Abbett Bond Debenture Fund
Annual Report
For the fiscal year ended December 31, 2006
Dear Shareholders: We are pleased to provide you with this overview of the Lord Abbett Bond Debenture Fund's performance for the year ended December 31, 2006. On this page and the following pages, we discuss the major factors that influenced performance. For detailed and more timely information about the Fund, please visit our Website at www.lordabbett.com, where you also can access the quarterly commentaries by the Fund's portfolio managers.
General information about Lord Abbett mutual funds, as well as in-depth discussion of market trends and investment strategies, is also provided in Lord Abbett Insights, a newsletter accompanying your quarterly account statements. We also encourage you to call Lord Abbett at 800-821-5129 and speak to one of our professionals if you would like more information.
Thank you for investing in Lord Abbett mutual funds. We value the trust that you place in us and look forward to serving your investment needs in the years to come.

From left to right: Robert S. Dow, Director and Chairman of the Lord Abbett Funds; E. Thayer Bigelow, Independent Lead Director of the Lord Abbett Funds; and Daria L. Foster, Director and President of the Lord Abbett Funds.
Best regards,
Robert S. Dow
Chairman

Q. What were the overall market conditions during the year ended December 31, 2006?
A. The Federal Reserve Board (the Fed) ended its string of 17 consecutive interest rate increases with its final quarter-point hike on June 29, 2006. This round of tightening, which began in June 2004, brought the fed funds target rate to 5.25%, from the 1.00% level it had been at since the last round of easing ended in June 2003. Of the 17 interest rate increases, four of them took place in 2006.
Over the year, the yield curve inverted. Rates on the six-month Treasury rose 71 basis points, to 5.08%, while rates on the long-term 10-year Treasury rose 31 basis points, to finish the year at 4.70%. During the year, the Merrill Lynch High Yield Master II Index1 posted an 11.77% total return, the Lehman Brothers U.S. Aggregate Bond Index2 posted a 4.33% gain for the
1
year, and the Merrill Lynch All Convertibles Index3 returned 12.83%. Convertibles captured approximately 80% of the upside of equities, with the S&P 500® Index4 up 15.80%.
In 2006, investors showed a preference for riskier, lower-rated securities. Within the high yield market, CCC-rated bonds outperformed B- and BB-rated bonds, with the Merrill Lynch CCC-Rated High Yield Index5 up 18.60%, the Merrill Lynch B-Rated High Yield Index5 up 11.40%, and the Merrill Lynch BB-Rated High Yield Index5 up 9.88%. In the convertible market, speculative-grade issues beat investment-grade issues as well. The Merrill Lynch All Speculative Grade Convertibles Index6 was up 17.65% for the year, while the Merrill Lynch All Investment Grade Convertibles Index7 was up 8.57%. Even in the high-grade portion of the market, mortgages and corporates outperformed Treasuries.
Q. How did the Bond Debenture Fund perform over the year ended December 31, 2006?
A. The Fund returned 9.9%, reflecting performance at the net asset value (NAV) of Class A shares with all distributions reinvested, compared with its benchmark, the Lehman Brothers U.S. Aggregate Bond Index, which returned 4.3% over the same period. (For complete annualized performance of the Fund, please see chart on page 6.)
Q. What were the most significant factors affecting performance?
A. The Fund invests in a broad range of fixed-income securities and, depending on market opportunities, also may invest in the equity market. In the year ended December 31, 2006, the Fund's performance benefited from participation in all of its key markets: high-yield bonds, convertible securities, investment-grade bonds, and equities.
The high-yield bond market made the greatest contribution to relative performance. Within that market, the top performing individual securities held in the portfolio were automotive holding General Motors; media cable holdings Frontiervision (acquired by Adelphia in 1999 and sold in a second buyout in 2006) and Century Communications, a digital cable, Internet, and home security provider; auto parts and equipment holding Stanadyne Corp., a manufacturer of fuel injectors and pumps for diesel engines; and Level 3 Communications, a telecommunications/fixed line holding that provides wholesale dial-up service and broadband Internet connectivity for high-speed Internet users.
Detracting from performance in the high-yield bond market were automotive firm Venture Holdings Co., whose assets were sold off in bankruptcy in 2005–06; health services
2
holdings HCA, Inc., an operator of acute care, psychiatric, and rehabilitation hospitals, and Angiotech Pharmaceuticals, Inc., a developer of anti-cancer drugs and surgical products; gaming holding Station Casinos, Inc., an owner/operator of 10 Las Vegas casinos; and forestry/paper holding Ainsworth Lumber Co., a producer of lumber and wood products such as plywood and flooring.
In the convertible securities market, the Fund benefited from portfolio positions in pharmaceuticals holding Celgene Corp., a manufacturer of cancer and other drugs; Hilton Hotels Corp., owner and operator of 2,800 hotels and resorts in more than 80 countries; electronics holding FLIR Systems, Inc., a maker of thermal imaging systems for commercial and military operations; health services holding SFBC International (re-named PharmaNet Development Group, Inc.), a contract research firm for early and late-stage clinical trials and bio-analytic lab services; and Ford Motor Co. Capital Trust II securities issued by the Ford Motor Co.
Detracting from performance in the convertible securities market were pharmaceutical holdings Teva Pharmaceuticals (a generic drug manufacturer), CV Therapeutics, Inc. (a developer of small-molecule drugs to treat chronic cardiovascular diseases), and Watson Pharmaceuticals, Inc. (a maker of branded and generic drugs); software services holding Openwave Systems Inc., a provider of software and services that wireless operators use to provide customers Internet access from their mobile phones; and Morgan Stanley (VLO) securities that are convertible into the stock of VLO (Valero Energy Corp.), an oil refining firm.
In the equity market, the Fund benefited from portfolio positions in electronics holding Mentor Graphics, a provider of electronic design automation software and systems; electric-integrated holding Northeast Utilities, a New England utility supplying power to 1.9 million customers; pharmaceutical holding Merck & Co., Inc., a manufacturer of a wide variety of drugs including those for the treatment of high cholesterol, hypertension, and heart failure; food wholesaler holding ConAgra Foods, Inc., a producer of packaged and frozen foods; and telecommunications/integrated services holding Qwest Communications International Inc., a provider of high-capacity broadband fiber-optic network.
Detracting from performance in the equity market were telecommunications equipment holding Comverse Technology, Inc., a manufacturer of communications systems and software for phone
3
companies; pharmaceutical holdings Amgen Inc., which treats cancer, metabolic and other disorders using cellular biology and medicinal chemistry, and CV Therapeutics, Inc., a developer of small-molecule drugs to treat chronic cardiovascular diseases; aerospace defense holding EDO Corp., a manufacturer of airborne electronic warfare systems and other defense-related products; and telecommunications/integrated services holding Sprint Nextel Corp., operator of a nationwide digital wireless network.
In the investment-grade securities market, the Fund benefited from portfolio positions in telecommunications wireless holding UbiquiTel Operating Co., a provider of wireless phone service (acquired by Sprint Nextel in April 2006); energy exploration and production holding Kerr-McGee, a provider of electricity and natural gas; telecommunications-wireless holding Alamosa Delaware, Inc., a provider of personal communications services and part of the Sprint PCS network; and Federal National Mortgage agency bonds.
Detracting from performance in the investment-grade securities market were gaming holding Harrah's Operating Co., Inc., a provider of branded casino entertainment through operating subsidiaries; Clear Channel Communications, Inc., a radio station owner; and a Federal National Mortgage agency bond.
The Fund's portfolio is actively managed and, therefore, its holdings and weightings of a particular issuer or particular sector as a percentage of portfolio assets are subject to change. Sectors may include many industries.
4
A prospectus contains important information about a fund, including its investment objectives, risks, charges, and ongoing expenses, which an investor should carefully consider before investing. To obtain a prospectus on any Lord Abbett mutual fund, please contact your investment professional or Lord Abbett Distributor LLC at 800-874-3733 or visit our Website at www.lordabbett.com. Read the prospectus carefully before investing.
1 The Merrill Lynch High Yield Master II Index tracks the performance of below-investment-grade U.S. dollar-denominated corporate bonds publicly issued in the U.S. domestic market (includes Yankee bonds).
2 The Lehman Brothers U.S. Aggregate Bond Index represents securities that are U.S. domestic, taxable, nonconvertible, and dollar denominated. The index covers the investment-grade, fixed-rate bond market, with index components for government and corporate securities, mortgage pass-through securities, and asset-backed securities.
3 The Merrill Lynch All Convertibles Index contains issues that have an aggregate market value of greater than $50 million. The issues are U.S. dollar-denominated, sold into the U.S. market, and are publicly traded in the United States.
4 The S&P 500® Index is widely regarded as the standard for measuring large-cap U.S. stock market performance and includes a representative sample of leading companies in leading industries.
5 The Merrill Lynch High Yield Index tracks the performance of U.S. dollar-denominated below investment-grade corporate debt publicly issued in the U.S. domestic market. The indexes for CCC, B, and BB are part of the Merrill Lynch High Yield Index, with the only difference being the addition of a ratings filter.
6 The Merrill Lynch All Speculative Grade Convertibles Index consists of speculative-grade publicly traded U.S. issues convertible into shares, including traditional and mandatory convertibles.
7 The Merrill Lynch All Investment Grade Convertibles Index consists of investment-grade publicly traded U.S. issues convertible into shares, including traditional and mandatory convertibles.
Indexes are unmanaged, do not reflect the deduction of fees or expenses, and are not available for direct investment.
Important Performance and Other Information
Performance data quoted reflect past performance and are no guarantee of future results. Current performance may be higher or lower than the performance quoted. The investment return and principal value of an investment in the Fund will fluctuate so that shares, on any given day or when redeemed, may be worth more or less than their original cost. You can obtain performance data current to the most recent month-end by calling Lord Abbett at 800-821-5129 or referring to our Website at www.lordabbett.com.
Except where noted, comparative Fund performance does not account for the deduction of sales charges and would be different if sales charges were included. The Fund offers additional classes of shares with distinct pricing options. For a full description of the differences in pricing alternatives, please see the Fund's prospectus.
The views of the Fund's management and the portfolio holdings described in this report are as of December 31, 2006; these views and portfolio holdings may have changed subsequent to this date and they do not guarantee the future performance of the markets or the Fund. Information provided in this report should not be considered a recommendation to purchase or sell securities.
A Note about Risk: See Notes to Financial Statements for a discussion of investment risks. For a more detailed discussion of the risks associated with the Fund, please see the Fund's prospectus.
Mutual funds are not insured by the FDIC, are not deposits or other obligations of, or guaranteed by banks, and are subject to investment risks including possible loss of principal amount invested.
5
Investment Comparison
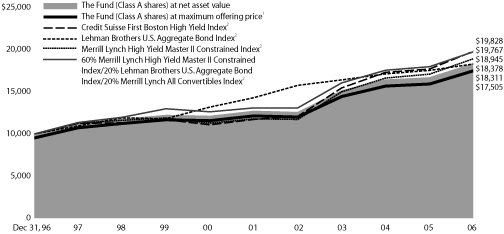
Below is a comparison of a $10,000 investment in Class A shares with the same investment in the Credit Suisse First Boston High Yield Index, Lehman Brothers U.S. Aggregate Bond Index, Merrill Lynch High Yield Master II Constrained Index, and the 60% Merrill Lynch High Yield Master II Constrained Index/20% Lehman Brothers U.S. Aggregate Bond Index/20% Merrill Lynch All Convertibles Index, assuming reinvestment of all dividends and distributions. The Fund believes that the Merrill Lynch High Yield Master II Constrained Index is a more appropriate benchmark for the Fund and therefore will remove the Credit Suisse First Boston High Yield Index from the next Annual Report. The performance of other classes will be greater than or less than the performance shown in the graph below due to different sales loads and expenses applicable to such classes. The graph and performance table below do not reflect the deduction of taxes that a shareholder would pay on Fund distributions or the redemption of Fund shares. Past performance is no guarantee of future results.
Average Annual Total Return at Maximum Applicable
Sales Charge for the Periods Ended December 31, 2006
| 1 Year | 5 Years | 10 Years | Life of Class | ||||||||||||||||
| Class A3 | 4.64 | % | 6.56 | % | 5.76 | % | — | ||||||||||||
| Class B4 | 5.26 | % | 6.75 | % | 5.59 | % | — | ||||||||||||
| Class C5 | 9.13 | % | 6.90 | % | 5.58 | % | — | ||||||||||||
| Class P6 | 9.86 | % | 7.47 | % | — | 5.70 | % | ||||||||||||
| Class Y7 | 10.29 | % | 7.97 | % | — | 5.60 | % | ||||||||||||
1 Reflects the deduction of the maximum initial sales charge of 4.75%.
2 Performance for each unmanaged index does not reflect transaction costs, management fees or sales charges. The performance of each index is not necessarily representative of the Fund's performance.
3 Total return, which is the percentage change in net asset value, after deduction of the maximum initial sales charge of 4.75% applicable to Class A shares, with all dividends and distributions reinvested for the periods shown ended December 31, 2006, is calculated using the SEC-required uniform method to compute such return.
4 Performance reflects the deduction of a CDSC of 4% for 1 year, 1% for 5 years and 0% for 10 years.
5 The 1% CDSC for Class C shares normally applies before the first anniversary of the purchase date. Performance is at net asset value.
6 Class P shares commenced operations on August 21, 1998. Performance is at net asset value.
7 Class Y shares commenced operations on March 27, 1998. Performance is at net asset value.
6
Expense Example
As a shareholder of the Fund, you incur two types of costs: (1) transaction costs, including sales charges on purchase payments (these charges vary among the share classes); and (2) ongoing costs, including management fees; distribution and service (12b-1) fees (these charges vary among the share classes); and other Fund expenses. This Example is intended to help you understand your ongoing costs (in dollars) of investing in the Fund and to compare these costs with the ongoing costs of investing in other mutual funds.
The Example is based on an investment of $1,000 invested at the beginning of the period and held for the entire period (July 1, 2006 through December 31, 2006).
Actual Expenses
For each class of the Fund, the first line of the table on the following page provides information about actual account values and actual expenses. You may use the information in this line, together with the amount you invested, to estimate the expenses that you paid over the period. Simply divide your account value by $1,000 (for example, an $8,600 account value divided by $1,000 = 8.6), then multiply the result by the number in the first line under the heading entitled "Expenses Paid During the Period 7/1/06 – 12/31/06" to estimate the expenses you paid on your account during this period.
Hypothetical Example for Comparison Purposes
For each class of the Fund, the second line of the table on the following page provides information about hypothetical account values and hypothetical expenses based on the Fund's actual expense ratio and an assumed rate of return of 5% per year before expenses, which is not the Fund's actual return. The hypothetical account values and expenses may not be used to estimate the actual ending account balance or expenses you paid for the period. You may use this information to compare the ongoing costs of investing in the Fund and other funds. To do so, compare this 5% hypothetical example with the 5% hypothetical examples that appear in the shareholder reports of the other funds.
7
Please note that the expenses shown in the table are meant to highlight your ongoing costs only and do not reflect any transactional costs, such as sales charges. Therefore, the second line of the table is useful in comparing ongoing costs only, and will not help you determine the relative total costs of owning different funds. In addition, if these transactional costs were included, your costs would have been higher.
| Beginning Account Value | Ending Account Value | Expenses Paid During the Period† | |||||||||||||
| 7/1/06 | 12/31/06 | 7/1/06 – 12/31/06 | |||||||||||||
| Class A | |||||||||||||||
| Actual | $ | 1,000.00 | $ | 1,075.30 | $ | 5.18 | |||||||||
| Hypothetical (5% Return Before Expenses) | $ | 1,000.00 | $ | 1,020.23 | $ | 5.04 | |||||||||
| Class B | |||||||||||||||
| Actual | $ | 1,000.00 | $ | 1,071.60 | $ | 8.56 | |||||||||
| Hypothetical (5% Return Before Expenses) | $ | 1,000.00 | $ | 1,016.95 | $ | 8.34 | |||||||||
| Class C | |||||||||||||||
| Actual | $ | 1,000.00 | $ | 1,070.20 | $ | 8.56 | |||||||||
| Hypothetical (5% Return Before Expenses) | $ | 1,000.00 | $ | 1,016.95 | $ | 8.34 | |||||||||
| Class P | |||||||||||||||
| Actual | $ | 1,000.00 | $ | 1,074.70 | $ | 5.70 | |||||||||
| Hypothetical (5% Return Before Expenses) | $ | 1,000.00 | $ | 1,019.72 | $ | 5.55 | |||||||||
| Class Y | |||||||||||||||
| Actual | $ | 1,000.00 | $ | 1,077.40 | $ | 3.35 | |||||||||
| Hypothetical (5% Return Before Expenses) | $ | 1,000.00 | $ | 1,021.99 | $ | 3.26 | |||||||||
† For each class of the Fund, expenses are equal to the annualized expense ratio for such class (0.99% for Class A, 1.64% for Classes B and C, 1.09% for Class P and 0.64% for Class Y) multiplied by the average account value over the period, multiplied by 184/365 (to reflect one-half year period).
Portfolio Holdings Presented by Sector
December 31, 2006
| Sector* | %** | ||||||
| Agency | 7.66 | % | |||||
| Banking | 1.32 | % | |||||
| Basic Industry | 7.15 | % | |||||
| Brokerage | 0.30 | % | |||||
| Capital Goods | 5.36 | % | |||||
| Communications | 0.15 | % | |||||
| Consumer Cyclical | 5.76 | % | |||||
| Consumer Non-Cyclical | 6.92 | % | |||||
| Energy | 8.87 | % | |||||
| Finance & Investment | 0.45 | % | |||||
| Government Guaranteed | 0.95 | % | |||||
| Sector* | %** | ||||||
| Insurance | 0.41 | % | |||||
| Media | 9.59 | % | |||||
| Mortgage Backed | 1.33 | % | |||||
| Services Cyclical | 11.01 | % | |||||
| Services Non-Cyclical | 4.95 | % | |||||
| Technology & Electronics | 4.58 | % | |||||
| Telecommunications | 5.82 | % | |||||
| Utility | 5.64 | % | |||||
| Short-Term Investment | 11.78 | % | |||||
| Total | 100.00 | % | |||||
* A sector may comprise several industries.
** Represents percent of total investments.
8
Schedule of Investments
December 31, 2006
| Investments | Shares (000) | Value | |||||||||
| LONG-TERM INVESTMENTS 96.50% | |||||||||||
| COMMON STOCKS 5.56% | |||||||||||
| Aerospace/Defense 0.11% | |||||||||||
| EDO Corp. | 350 | $ | 8,309,000 | ||||||||
| Agriculture 0.10% | |||||||||||
| Archer Daniels Midland Co. | 250 | 7,990,000 | |||||||||
| Automotive 0.16% | |||||||||||
| Oshkosh Truck Corp. | 250 | 12,105,000 | |||||||||
| Banking 0.42% | |||||||||||
| Bank of America Corp. | 150 | 8,008,500 | |||||||||
| Bank of New York Co., Inc. (The) | 150 | 5,905,500 | |||||||||
| Wachovia Corp. | 325 | 18,508,750 | |||||||||
| Total | 32,422,750 | ||||||||||
| Beverage 0.50% | |||||||||||
| Coca-Cola Co. (The) | 150 | 7,237,500 | |||||||||
| Constellation Brands, Inc., Class A* | 439 | 12,743,843 | |||||||||
| PepsiCo, Inc. | 300 | 18,765,000 | |||||||||
| Total | 38,746,343 | ||||||||||
| Chemicals 0.41% | |||||||||||
| Lyondell Chemical Co. | 325 | 8,310,250 | |||||||||
| Praxair, Inc. | 400 | 23,732,000 | |||||||||
| Total | 32,042,250 | ||||||||||
| Diversified Capital Goods 0.10% | |||||||||||
| 3M Co. | 100 | 7,793,000 | |||||||||
| Electric: Integrated 0.81% | |||||||||||
| NiSource Inc. | 600 | 14,460,000 | |||||||||
| Northeast Utilities System Co. | 1,000 | 28,160,000 | |||||||||
| TECO Energy, Inc. | 1,200 | 20,676,000 | |||||||||
| Total | 63,296,000 | ||||||||||
| Electronics 0.23% | |||||||||||
| Emerson Electric Co. | 400 | 17,636,000 | |||||||||
See Notes to Financial Statements.
9
Schedule of Investments (continued)
December 31, 2006
| Investments | Shares (000) | Value | |||||||||
| Energy: Exploration & Production 0.22% | |||||||||||
| Devon Energy Corp. | 250 | $ | 16,770,000 | ||||||||
| Food - Wholesale 0.33% | |||||||||||
| ConAgra Foods, Inc. | 400 | 10,800,000 | |||||||||
| Kellogg Co. | 300 | 15,018,000 | |||||||||
| Total | 25,818,000 | ||||||||||
| Machinery 0.18% | |||||||||||
| Roper Industries, Inc. | 275 | 13,816,000 | |||||||||
| Media - Broadcast 0.11% | |||||||||||
| Clear Channel Communications, Inc. | 250 | 8,885,000 | |||||||||
| Non-Electric Utilities 0.19% | |||||||||||
| National Fuel Gas Co. | 300 | 11,562,000 | |||||||||
| SEMCO Energy, Inc.* | 489 | 2,981,564 | |||||||||
| Total | 14,543,564 | ||||||||||
| Pharmaceuticals 0.58% | |||||||||||
| Amgen, Inc.* | 250 | 17,077,500 | |||||||||
| CV Therapeutics, Inc.* | 100 | 1,396,000 | |||||||||
| Merck & Co., Inc. | 375 | 16,350,000 | |||||||||
| Pfizer Inc. | 400 | 10,360,000 | |||||||||
| Total | 45,183,500 | ||||||||||
| Printing & Publishing 0.30% | |||||||||||
| Idearc, Inc.* | 12 | 358,125 | |||||||||
| Interpublic Group of Cos., Inc. (The)* | 1,852 | 22,666,644 | |||||||||
| Total | 23,024,769 | ||||||||||
| Restaurants 0.17% | |||||||||||
| McDonald's Corp. | 300 | 13,299,000 | |||||||||
| Software/Services 0.06% | |||||||||||
| BEA Systems, Inc.* | 400 | 5,032,000 | |||||||||
| Support: Services 0.15% | |||||||||||
| CRA Int'l., Inc.* | 125 | 6,550,000 | |||||||||
| FTI Consulting, Inc.* | 186 | 5,181,962 | |||||||||
| Total | 11,731,962 | ||||||||||
See Notes to Financial Statements.
10
Schedule of Investments (continued)
December 31, 2006
| Investments | Shares (000) | Value | |||||||||||||||||
| Telecommunications Equipment 0.19% | |||||||||||||||||||
| Avaya Inc.* | 750 | $ | 10,485,000 | ||||||||||||||||
| Comverse Technology, Inc.* | 200 | 4,222,000 | |||||||||||||||||
| Total | 14,707,000 | ||||||||||||||||||
| Telecommunications: Integrated/Services 0.24% | |||||||||||||||||||
| Sprint Nextel Corp. | 500 | 9,445,000 | |||||||||||||||||
| Verizon Communications Inc. | 250 | 9,310,000 | |||||||||||||||||
| Total | 18,755,000 | ||||||||||||||||||
| Total Common Stocks (cost $369,719,876) | 431,906,138 | ||||||||||||||||||
| Interest Rate | Maturity Date | Principal Amount (000) | |||||||||||||||||
| CONVERTIBLE BONDS 10.13% | |||||||||||||||||||
| Aerospace/Defense 1.19% | |||||||||||||||||||
| Alliant Techsystems, Inc.^ | 2.75 | % | 2/15/2024 | $ | 15,000 | 16,556,250 | |||||||||||||
| EDO Corp. | 4.00 | % | 11/15/2025 | 15,000 | 14,512,500 | ||||||||||||||
| L-3 Communications Corp.^ | 3.00 | % | 8/1/2035 | 20,000 | 21,100,000 | ||||||||||||||
| Lockheed Martin Corp.^ | 5.124 | %# | 8/15/2033 | 30,000 | 39,960,300 | ||||||||||||||
| Total | 92,129,050 | ||||||||||||||||||
| Building & Construction 0.50% | |||||||||||||||||||
| Fluor Corp.^ | 1.50 | % | 2/15/2024 | 26,000 | 38,967,500 | ||||||||||||||
| Computer Hardware 0.24% | |||||||||||||||||||
| Intel Corp.^ | 2.95 | % | 12/15/2035 | 20,000 | 18,200,000 | ||||||||||||||
| Electronics 0.67% | |||||||||||||||||||
| Cypress Semiconductor Corp.^ | 1.25 | % | 6/15/2008 | 7,500 | 9,384,375 | ||||||||||||||
| FLIR Systems, Inc.^ | 3.00 | % | 6/1/2023 | 12,500 | 19,281,250 | ||||||||||||||
| Millipore Corp.^ | 3.75 | % | 6/1/2026 | 15,000 | 15,506,250 | ||||||||||||||
| RF Micro Devices, Inc.^ | 1.50 | % | 7/1/2010 | 7,195 | 7,635,694 | ||||||||||||||
| Total | 51,807,569 | ||||||||||||||||||
| Foods 0.23% | |||||||||||||||||||
| Morgan Stanley (convertible into Nestle S.A.)† | 1.00 | % | 3/30/2012 | 15,000 | 18,039,000 | ||||||||||||||
| Food & Drug Retailers 0.11% | |||||||||||||||||||
| BNP Paribas (convertible into CVS Corp.) (France)†(a) | 6.70 | % | 12/14/2007 | 8,000 | 8,137,600 | ||||||||||||||
See Notes to Financial Statements.
11
Schedule of Investments (continued)
December 31, 2006
| Investments | Interest Rate | Maturity Date | Principal Amount (000) | Value | |||||||||||||||
| Gas Distribution 0.05% | |||||||||||||||||||
| NorthernStar Natural Gas LLC† | 5.00 | %# | 5/15/2013 | $ | 4,139 | $ | 4,077,133 | ||||||||||||
| Health Services 0.89% | |||||||||||||||||||
| American Medical Systems Holdings, Inc.^ | 3.25 | % | 7/1/2036 | 5,000 | 5,856,250 | ||||||||||||||
| Fisher Scientific Int'l., Inc.^ | 3.25 | % | 3/1/2024 | 10,000 | 12,987,500 | ||||||||||||||
| Invitrogen Corp.^ | 1.50 | % | 2/15/2024 | 20,000 | 17,175,000 | ||||||||||||||
| Invitrogen Corp.^ | 3.25 | % | 6/15/2025 | 10,000 | 9,462,500 | ||||||||||||||
| Manor Care, Inc.^ | 2.125 | % | 8/1/2035 | 11,500 | 13,052,500 | ||||||||||||||
| SFBC Int'l., Inc. | 2.25 | % | 8/15/2024 | 11,500 | 10,666,250 | ||||||||||||||
| Total | 69,200,000 | ||||||||||||||||||
| Hotels 0.35% | |||||||||||||||||||
| Hilton Hotels Corp.^ | 3.375 | % | 4/15/2023 | 17,000 | 26,902,500 | ||||||||||||||
| Media: Broadcast 0.36% | |||||||||||||||||||
| Sinclair Broadcast Group, Inc. | 4.875 | % | 7/15/2018 | 10,000 | 9,187,500 | ||||||||||||||
| Sinclair Broadcast Group, Inc. | 6.00 | % | 9/15/2012 | 20,545 | 18,901,400 | ||||||||||||||
| Total | 28,088,900 | ||||||||||||||||||
| Media: Diversified 1.16% | |||||||||||||||||||
| Lehman Brothers Holdings, Inc. (convertible into News Corp., Class A) | 0.45 | % | 12/27/2013 | 25,000 | 24,997,500 | ||||||||||||||
| Liberty Media LLC (convertible into Viacom Inc., Class B and CBS Corp.) | 3.25 | % | 3/15/2031 | 45,000 | 37,743,750 | ||||||||||||||
| Walt Disney Co. (The)^ | 2.125 | % | 4/15/2023 | 22,500 | 27,450,000 | ||||||||||||||
| Total | 90,191,250 | ||||||||||||||||||
| Miscellaneous: Financial Services 0.17% | |||||||||||||||||||
| Lehman Brothers Holdings, Inc. (linked to the S&P 500 Index) | 0.25 | % | 7/7/2011 | 11,000 | 13,282,500 | ||||||||||||||
| Oil Field Equipment & Services 0.64% | |||||||||||||||||||
| Hanover Compressor Co. | 4.75 | % | 1/15/2014 | 10,000 | 14,337,500 | ||||||||||||||
| Schlumberger Ltd. (Netherlands)(a) | 1.50 | % | 6/1/2023 | 20,000 | 35,375,000 | ||||||||||||||
| Total | 49,712,500 | ||||||||||||||||||
| Pharmaceuticals 1.43% | |||||||||||||||||||
| Celgene Corp. | 1.75 | % | 6/1/2008 | 2,000 | 9,510,000 | ||||||||||||||
| CV Therapeutics, Inc.^ | 3.25 | % | 8/16/2013 | 15,000 | 13,256,250 | ||||||||||||||
| Genzyme Corp.^ | 1.25 | % | 12/1/2023 | 15,000 | 15,675,000 | ||||||||||||||
See Notes to Financial Statements.
12
Schedule of Investments (continued)
December 31, 2006
| Investments | Interest Rate | Maturity Date | Principal Amount (000) | Value | |||||||||||||||
| MGI PHARMA, Inc. | 1.682 | % | 3/2/2024 | $ | 25,000 | $ | 16,687,500 | ||||||||||||
| Teva Pharmaceutical Finance B.V. (Israel)^(a) | 0.25 | % | 2/1/2026 | 7,750 | 7,430,313 | ||||||||||||||
| Teva Pharmaceutical Finance B.V. (Israel)(a) | 0.375 | % | 11/15/2022 | 18,050 | 26,149,937 | ||||||||||||||
| Wyeth^ | 5.109 | %# | 1/15/2024 | 20,650 | 22,520,890 | ||||||||||||||
| Total | 111,229,890 | ||||||||||||||||||
| Printing & Publishing 0.17% | |||||||||||||||||||
| Omnicom Group Inc.^ | Zero Coupon | 7/1/2038 | 12,000 | 13,020,000 | |||||||||||||||
| Railroads 0.28% | |||||||||||||||||||
| CSX Corp.^ | Zero Coupon | 10/30/2021 | 17,500 | 21,678,125 | |||||||||||||||
| Software/Services 0.79% | |||||||||||||||||||
| DST Systems, Inc. | 4.125 | % | 8/15/2023 | 20,000 | 27,900,000 | ||||||||||||||
| Openwave Systems, Inc. | 2.75 | % | 9/9/2008 | 12,500 | 12,062,500 | ||||||||||||||
| Symantec Corp.† | 0.75 | % | 6/15/2011 | 17,500 | 21,175,000 | ||||||||||||||
| Total | 61,137,500 | ||||||||||||||||||
| Support: Services 0.28% | |||||||||||||||||||
| Charles River Assoc., Inc. | 2.875 | % | 6/15/2034 | 15,000 | 22,050,000 | ||||||||||||||
| Telecommunications Equipment 0.33% | |||||||||||||||||||
| LSI Logic Corp.^ | 4.00 | % | 5/15/2010 | 25,000 | 25,781,250 | ||||||||||||||
| Telecommunications: Wireless 0.29% | |||||||||||||||||||
| Liberty Media LLC, Class A (convertible into Motorola, Inc.)^ | 3.50 | % | 1/15/2031 | 12,561 | 12,592,162 | ||||||||||||||
| Nextel Communications, Inc. | 5.25 | % | 1/15/2010 | 10,000 | 9,887,500 | ||||||||||||||
| Total | 22,479,662 | ||||||||||||||||||
| Total Convertible Bonds (cost $716,168,857) | 786,111,929 | ||||||||||||||||||
| Shares (000) | |||||||||||||||||||
| CONVERTIBLE PREFERRED STOCKS 3.26% | |||||||||||||||||||
| Agency 0.13% | |||||||||||||||||||
| Federal National Mortgage Assoc. | 5.375 | % | - | (c) | 10,001,463 | ||||||||||||||
| Automotive 0.08% | |||||||||||||||||||
| Ford Motor Co. Capital Trust II | 6.50 | % | 175 | 5,985,000 | |||||||||||||||
See Notes to Financial Statements.
13
Schedule of Investments (continued)
December 31, 2006
| Investments | Interest Rate | Shares (000) | Value | ||||||||||||
| Banking 0.35% | |||||||||||||||
| Marshall & Ilsley Corp. | 6.50 | % | 1,000 | $ | 27,270,000 | ||||||||||
| Electric: Generation 0.53% | |||||||||||||||
| NRG Energy, Inc. | 5.75 | % | 70 | 18,972,212 | |||||||||||
| PNM Resources, Inc. | 6.75 | % | 425 | 22,457,000 | |||||||||||
| Total | 41,429,212 | ||||||||||||||
| Engineering 0.09% | |||||||||||||||
| Morgan Stanley (convertible into ABB Ltd.)† | 7.30 | % | 420 | 7,301,700 | |||||||||||
| Food & Drug Retailers 0.10% | |||||||||||||||
| Albertson's, Inc. | 7.25 | % | 300 | 7,614,000 | |||||||||||
| Food: Wholesale 0.10% | |||||||||||||||
| Bunge Ltd. (Bermuda)(a) | 4.875 | % | 75 | 7,875,000 | |||||||||||
| Gas Distribution 0.26% | |||||||||||||||
| El Paso Corp. | 4.99 | % | 15 | 19,912,500 | |||||||||||
| Integrated Energy 0.48% | |||||||||||||||
| Williams Cos., Inc. (The) | 5.50 | % | 300 | 36,825,000 | |||||||||||
| Life Insurance 0.38% | |||||||||||||||
| MetLife, Inc. | 6.375 | % | 960 | 29,356,800 | |||||||||||
| Oil Refining & Marketing 0.10% | |||||||||||||||
| Morgan Stanley (convertible into Valero Energy Corp.)† | 9.50 | % | 150 | 8,063,250 | |||||||||||
| Pharmaceuticals 0.44% | |||||||||||||||
| Schering-Plough Corp. | 6.00 | % | 600 | 34,134,000 | |||||||||||
| Property & Casualty 0.07% | |||||||||||||||
| XL Capital Ltd. (Cayman Islands)(a) | 7.00 | % | 200 | 5,300,000 | |||||||||||
| Tobacco 0.15% | |||||||||||||||
| Morgan Stanley (convertible into Altria Group, Inc.)† | 7.60 | % | 143 | 11,962,433 | |||||||||||
| Total Convertible Preferred Stocks (cost $225,916,897) | 253,030,358 | ||||||||||||||
See Notes to Financial Statements.
14
Schedule of Investments (continued)
December 31, 2006
| Investments | Interest Rate | Maturity Date | Principal Amount (000) | Value | |||||||||||||||
| GOVERNMENT SPONSORED | |||||||||||||||||||
| ENTERPRISES BOND 0.97% | |||||||||||||||||||
| Federal Home Loan Mortgage Corp. (cost $76,140,772) | 5.75 | % | 4/15/2008 | $ | 75,000 | $ | 75,577,500 | ||||||||||||
| GOVERNMENT SPONSORED ENTERPRISES PASS-THROUGHS 8.49% | |||||||||||||||||||
| Federal Home Loan Mortgage Corp. | 6.00 | % | 9/1/2036 | 19,599 | 19,737,331 | ||||||||||||||
| Federal National Mortgage Assoc. | 5.50 | % | 2/1/2033 | 35,577 | 35,232,548 | ||||||||||||||
| Federal National Mortgage Assoc. | 5.50 | % | 7/1/2033 | 41,998 | 41,583,075 | ||||||||||||||
| Federal National Mortgage Assoc. | 6.00 | % | 10/1/2033 | 5,822 | 5,872,594 | ||||||||||||||
| Federal National Mortgage Assoc. | 6.00 | % | 1/1/2034 | 16,074 | 16,214,072 | ||||||||||||||
| Federal National Mortgage Assoc. | 6.00 | % | 2/1/2034 | 30,944 | 31,214,221 | ||||||||||||||
| Federal National Mortgage Assoc. | 6.00 | % | 8/1/2034 | 22,046 | 22,238,737 | ||||||||||||||
| Federal National Mortgage Assoc. | 6.00 | % | 11/1/2034 | 49,190 | 49,573,850 | ||||||||||||||
| Federal National Mortgage Assoc. | 6.00 | % | 2/1/2035 | 24,120 | 24,308,686 | ||||||||||||||
| Federal National Mortgage Assoc. | 6.00 | % | 4/1/2035 | 19,348 | 19,499,438 | ||||||||||||||
| Federal National Mortgage Assoc. | 6.00 | % | 4/1/2036 | 92,850 | 93,507,638 | ||||||||||||||
| Federal National Mortgage Assoc. | 6.00 | % | 12/1/2035 | 22,366 | 22,528,873 | ||||||||||||||
| Federal National Mortgage Assoc. | 6.00 | % | 1/1/2036 | 20,931 | 21,079,285 | ||||||||||||||
| Federal National Mortgage Assoc. | 6.00 | % | 3/1/2036 | 23,301 | 23,471,515 | ||||||||||||||
| Federal National Mortgage Assoc. | 6.00 | % | 10/1/2036 | 29,695 | 29,905,143 | ||||||||||||||
| Federal National Mortgage Assoc. | 6.50 | % | 9/1/2035 | 30,908 | 31,530,060 | ||||||||||||||
| Federal National Mortgage Assoc. | 6.50 | % | 12/1/2035 | 29,501 | 30,094,630 | ||||||||||||||
| Federal National Mortgage Assoc. | 6.50 | % | 2/1/2036 | 15,033 | 15,324,484 | ||||||||||||||
| Federal National Mortgage Assoc. | 6.50 | % | 6/1/2036 | 44,915 | 45,775,802 | ||||||||||||||
| Federal National Mortgage Assoc. | 6.625 | % | 10/15/2007 | 75,000 | 75,793,725 | ||||||||||||||
| Federal National Mortgage Assoc. | 7.00 | % | 3/1/2032 | 4,191 | 4,312,645 | ||||||||||||||
| Total Government Sponsored Enterprises Pass-Throughs (cost $661,882,074) | 658,798,352 | ||||||||||||||||||
| HIGH YIELD CORPORATE BONDS 66.80% | |||||||||||||||||||
| Aerospace/Defense 1.17% | |||||||||||||||||||
| Armor Holdings, Inc. | 8.25 | % | 8/15/2013 | 10,000 | 10,450,000 | ||||||||||||||
| DRS Technologies, Inc.^ | 6.875 | % | 11/1/2013 | 30,000 | 30,375,000 | ||||||||||||||
| Esterline Technologies Corp. | 7.75 | % | 6/15/2013 | 16,000 | 16,400,000 | ||||||||||||||
| L-3 Communications Corp. | 6.125 | % | 1/15/2014 | 14,000 | 13,755,000 | ||||||||||||||
| L-3 Communications Corp.^ | 6.375 | % | 10/15/2015 | 11,850 | 11,790,750 | ||||||||||||||
| Moog Inc., Class A | 6.25 | % | 1/15/2015 | 8,000 | 7,800,000 | ||||||||||||||
| Total | 90,570,750 | ||||||||||||||||||
See Notes to Financial Statements.
15
Schedule of Investments (continued)
December 31, 2006
| Investments | Interest Rate | Maturity Date | Principal Amount (000) | Value | |||||||||||||||
| Apparel/Textiles 0.42% | |||||||||||||||||||
| Hanesbrands Inc.†^ | 8.735 | %# | 12/15/2014 | $ | 5,050 | $ | 5,163,625 | ||||||||||||
| Levi Strauss & Co.^ | 8.875 | % | 4/1/2016 | 7,500 | 7,875,000 | ||||||||||||||
| Quiksilver, Inc.^ | 6.875 | % | 4/15/2015 | 20,000 | 19,750,000 | ||||||||||||||
| Total | 32,788,625 | ||||||||||||||||||
| Auto Loans 2.35% | |||||||||||||||||||
| Ford Motor Credit Co. | 7.25 | % | 10/25/2011 | 45,000 | 44,111,160 | ||||||||||||||
| Ford Motor Credit Co.^ | 7.375 | % | 10/28/2009 | 28,875 | 28,954,637 | ||||||||||||||
| General Motors Acceptance Corp. | 7.25 | % | 3/2/2011 | 105,000 | 109,290,510 | ||||||||||||||
| Total | 182,356,307 | ||||||||||||||||||
| Auto Parts & Equipment 1.05% | |||||||||||||||||||
| Accuride Corp.^ | 8.50 | % | 2/1/2015 | 10,050 | 9,723,375 | ||||||||||||||
| Cooper-Standard Automotive, Inc. | 8.375 | % | 12/15/2014 | 20,000 | 15,850,000 | ||||||||||||||
| Lear Corp.†^ | 8.50 | % | 12/1/2013 | 15,150 | 14,771,250 | ||||||||||||||
| Stanadyne Corp. (12.00% after 8/15/2009)** | Zero Coupon | 2/15/2015 | 15,000 | 10,275,000 | |||||||||||||||
| Stanadyne Corp. | 10.00 | % | 8/15/2014 | 10,000 | 10,325,000 | ||||||||||||||
| Tenneco Inc.^ | 8.625 | % | 11/15/2014 | 20,000 | 20,500,000 | ||||||||||||||
| Total | 81,444,625 | ||||||||||||||||||
| Automotive 0.64% | |||||||||||||||||||
| Ford Capital BV (Netherlands)^(a) | 9.50 | % | 6/1/2010 | 6,125 | 6,125,000 | ||||||||||||||
| General Motors Corp.^ | 7.20 | % | 1/15/2011 | 44,825 | 43,592,312 | ||||||||||||||
| Venture Holdings Trust(b) | 9.50 | % | 7/1/2005 | 10,000 | 50,000 | ||||||||||||||
| Total | 49,767,312 | ||||||||||||||||||
| Banking 0.57% | |||||||||||||||||||
| Regions Financial Corp.^ | 4.50 | % | 8/8/2008 | 25,000 | 24,694,950 | ||||||||||||||
| Wells Fargo & Co. | 5.35 | % | 5/6/2018 | 20,000 | 19,394,180 | ||||||||||||||
| Total | 44,089,130 | ||||||||||||||||||
| Building & Construction 0.55% | |||||||||||||||||||
| Beazer Homes USA, Inc.^ | 6.50 | % | 11/15/2013 | 10,000 | 9,800,000 | ||||||||||||||
| Beazer Homes USA, Inc. | 8.375 | % | 4/15/2012 | 7,000 | 7,227,500 | ||||||||||||||
| Standard Pacific Corp.^ | 7.00 | % | 8/15/2015 | 16,600 | 16,060,500 | ||||||||||||||
| William Lyon Homes, Inc.^ | 10.75 | % | 4/1/2013 | 10,000 | 9,575,000 | ||||||||||||||
| Total | 42,663,000 | ||||||||||||||||||
| Building Materials 0.16% | |||||||||||||||||||
| Ply Gem Industries, Inc.^ | 9.00 | % | 2/15/2012 | 14,550 | 12,440,250 | ||||||||||||||
See Notes to Financial Statements.
16
Schedule of Investments (continued)
December 31, 2006
| Investments | Interest Rate | Maturity Date | Principal Amount (000) | Value | |||||||||||||||
| Chemicals 2.75% | |||||||||||||||||||
| Airgas, Inc.^ | 6.25 | % | 7/15/2014 | $ | 10,000 | $ | 9,700,000 | ||||||||||||
| Equistar Chemicals, L.P. | 7.55 | % | 2/15/2026 | 26,000 | 24,830,000 | ||||||||||||||
| Hercules, Inc. | 6.75 | % | 10/15/2029 | 25,000 | 24,625,000 | ||||||||||||||
| Huntsman Int'l. LLC† | 7.875 | % | 11/15/2014 | 5,000 | 5,062,500 | ||||||||||||||
| Huntsman LLC | 11.50 | % | 7/15/2012 | 5,181 | 5,867,482 | ||||||||||||||
| Ineos Group Holdings plc (United Kingdom)†^(a) | 8.50 | % | 2/15/2016 | 15,175 | 14,568,000 | ||||||||||||||
| INVISTA† | 9.25 | % | 5/1/2012 | 25,000 | 26,937,500 | ||||||||||||||
| Lyondell Chemical Co.^ | 8.00 | % | 9/15/2014 | 4,725 | 4,925,812 | ||||||||||||||
| Lyondell Chemical Co.^ | 8.25 | % | 9/15/2016 | 12,125 | 12,791,875 | ||||||||||||||
| Mosaic Co.†^ | 7.375 | % | 12/1/2014 | 2,275 | 2,346,094 | ||||||||||||||
| Mosaic Co.† | 7.625 | % | 12/1/2016 | 3,500 | 3,644,375 | ||||||||||||||
| Nalco Co.^ | 8.875 | % | 11/15/2013 | 10,425 | 11,089,594 | ||||||||||||||
| NOVA Chemicals Corp. (Canada)^(a) | 6.50 | % | 1/15/2012 | 10,000 | 9,525,000 | ||||||||||||||
| Rhodia S.A. (France)^(a) | 8.875 | % | 6/1/2011 | 21,031 | 22,292,860 | ||||||||||||||
| Rockwood Specialties Group, Inc.^ | 7.50 | % | 11/15/2014 | 18,250 | 18,478,125 | ||||||||||||||
| Rockwood Specialties Group, Inc. | 10.625 | % | 5/15/2011 | 2,916 | 3,120,120 | ||||||||||||||
| Terra Capital, Inc. | 11.50 | % | 6/1/2010 | 13,000 | 14,040,000 | ||||||||||||||
| Total | 213,844,337 | ||||||||||||||||||
| Consumer Products 0.72% | |||||||||||||||||||
| Elizabeth Arden, Inc.^ | 7.75 | % | 1/15/2014 | 25,000 | 25,312,500 | ||||||||||||||
| Playtex Products, Inc. | 9.375 | % | 6/1/2011 | 17,000 | 17,807,500 | ||||||||||||||
| Spectrum Brands, Inc. | 7.375 | % | 2/1/2015 | 15,000 | 13,050,000 | ||||||||||||||
| Total | 56,170,000 | ||||||||||||||||||
| Diversified Capital Goods 0.45% | |||||||||||||||||||
| Park-Ohio Industries, Inc.^ | 8.375 | % | 11/15/2014 | 15,000 | 14,062,500 | ||||||||||||||
| Sensus Metering Systems, Inc. | 8.625 | % | 12/15/2013 | 21,000 | 21,105,000 | ||||||||||||||
| Total | 35,167,500 | ||||||||||||||||||
| Electric: Generation 2.52% | |||||||||||||||||||
| AES Corp. (The) | 9.50 | % | 6/1/2009 | 10,000 | 10,750,000 | ||||||||||||||
| Dynegy Holdings, Inc.^ | 6.875 | % | 4/1/2011 | 3,315 | 3,331,575 | ||||||||||||||
| Dynegy Holdings, Inc.^ | 8.375 | % | 5/1/2016 | 26,500 | 27,957,500 | ||||||||||||||
| Edison Mission Energy^ | 7.75 | % | 6/15/2016 | 37,850 | 40,310,250 | ||||||||||||||
| Mission Energy Holding Co. | 13.50 | % | 7/15/2008 | 16,000 | 17,720,000 | ||||||||||||||
| NRG Energy, Inc.^ | 7.25 | % | 2/1/2014 | 10,000 | 10,100,000 | ||||||||||||||
| NRG Energy, Inc.^ | 7.375 | % | 2/1/2016 | 17,500 | 17,631,250 | ||||||||||||||
See Notes to Financial Statements.
17
Schedule of Investments (continued)
December 31, 2006
| Investments | Interest Rate | Maturity Date | Principal Amount (000) | Value | |||||||||||||||
| NRG Energy, Inc. | 7.375 | % | 1/15/2017 | $ | 9,750 | $ | 9,798,750 | ||||||||||||
| Reliant Energy, Inc. | 6.75 | % | 12/15/2014 | 17,500 | 17,193,750 | ||||||||||||||
| Reliant Energy, Inc.^ | 9.50 | % | 7/15/2013 | 38,200 | 41,160,500 | ||||||||||||||
| Total | 195,953,575 | ||||||||||||||||||
| Electric: Integrated 1.93% | |||||||||||||||||||
| Duke Energy Corp.^ | 5.375 | % | 1/1/2009 | 12,000 | 11,981,148 | ||||||||||||||
| Midwest Generation, LLC^ | 8.75 | % | 5/1/2034 | 25,000 | 27,250,000 | ||||||||||||||
| Mirant Americas Generation LLC^ | 9.125 | % | 5/1/2031 | 25,000 | 26,625,000 | ||||||||||||||
| Mirant North America LLC^ | 7.375 | % | 12/31/2013 | 15,225 | 15,529,500 | ||||||||||||||
| Nevada Power Co. | 5.875 | % | 1/15/2015 | 15,000 | 15,005,565 | ||||||||||||||
| PG&E Corp.^ | 4.80 | % | 3/1/2014 | 10,000 | 9,599,510 | ||||||||||||||
| PPL Energy Supply LLC | 6.40 | % | 11/1/2011 | 12,000 | 12,435,972 | ||||||||||||||
| PSEG Energy Holdings LLC | 8.50 | % | 6/15/2011 | 22,500 | 24,300,000 | ||||||||||||||
| PSEG Energy Holdings LLC | 8.625 | % | 2/15/2008 | 6,695 | 6,895,850 | ||||||||||||||
| Total | 149,622,545 | ||||||||||||||||||
| Electronics 1.28% | |||||||||||||||||||
| Avago Technologies Fin (Singapore)†(a) | 10.125 | % | 12/1/2013 | 10,000 | 10,725,000 | ||||||||||||||
| Freescale Semiconductor, Inc.†^ | 8.875 | % | 12/15/2014 | 40,000 | 40,050,000 | ||||||||||||||
| Freescale Semiconductor, Inc.† | 9.244 | %# | 12/15/2014 | 5,000 | 4,981,250 | ||||||||||||||
| NXP BV/NXP Funding LLC (Netherlands)†^(a) | 8.118 | %# | 10/15/2013 | 12,500 | 12,750,000 | ||||||||||||||
| NXP BV/NXP Funding LLC (Netherlands)†^(a) | 9.50 | % | 10/15/2015 | 30,000 | 30,900,000 | ||||||||||||||
| Total | 99,406,250 | ||||||||||||||||||
| Energy: Exploration & Production 3.74% | |||||||||||||||||||
| Chesapeake Energy Corp.^ | 6.25 | % | 1/15/2018 | 50,000 | 48,375,000 | ||||||||||||||
| Chesapeake Energy Corp.^ | 6.50 | % | 8/15/2017 | 14,000 | 13,755,000 | ||||||||||||||
| Chesapeake Energy Corp.^ | 7.00 | % | 8/15/2014 | 31,750 | 32,424,687 | ||||||||||||||
| El Paso Production Holding Co.^ | 7.75 | % | 6/1/2013 | 35,000 | 36,793,750 | ||||||||||||||
| Energy Partners, Ltd. | 8.75 | % | 8/1/2010 | 10,000 | 10,325,000 | ||||||||||||||
| Forest Oil Corp.^ | 7.75 | % | 5/1/2014 | 7,000 | 7,157,500 | ||||||||||||||
| Forest Oil Corp. | 8.00 | % | 6/15/2008 | 15,000 | 15,431,250 | ||||||||||||||
| Houston Exploration Co. | 7.00 | % | 6/15/2013 | 27,095 | 26,553,100 | ||||||||||||||
| KCS Energy Services, Inc. | 7.125 | % | 4/1/2012 | 25,000 | 24,437,500 | ||||||||||||||
| Kerr-McGee Corp. | 6.95 | % | 7/1/2024 | 7,850 | 8,381,853 | ||||||||||||||
| Magnum Hunter Resources Corp. | 9.60 | % | 3/15/2012 | 4,500 | 4,741,875 | ||||||||||||||
| Pogo Producing Co.^ | 6.625 | % | 3/15/2015 | 27,700 | 26,522,750 | ||||||||||||||
| Quicksilver Resources Inc.^ | 7.125 | % | 4/1/2016 | 12,325 | 12,109,313 | ||||||||||||||
| Range Resources Corp.^ | 7.375 | % | 7/15/2013 | 22,925 | 23,612,750 | ||||||||||||||
| Total | 290,621,328 | ||||||||||||||||||
See Notes to Financial Statements.
18
Schedule of Investments (continued)
December 31, 2006
| Investments | Interest Rate | Maturity Date | Principal Amount (000) | Value | |||||||||||||||
| Environmental 1.14% | |||||||||||||||||||
| Allied Waste North America, Inc.^ | 6.125 | % | 2/15/2014 | $ | 35,000 | $ | 33,425,000 | ||||||||||||
| Allied Waste North America, Inc.^ | 7.125 | % | 5/15/2016 | 20,000 | 19,900,000 | ||||||||||||||
| Allied Waste North America, Inc.^ | 7.25 | % | 3/15/2015 | 35,000 | 35,218,750 | ||||||||||||||
| Total | 88,543,750 | ||||||||||||||||||
| Food: Wholesale 0.68% | |||||||||||||||||||
| Corn Products Int'l., Inc. | 8.25 | % | 7/15/2007 | 15,000 | 15,173,955 | ||||||||||||||
| Dole Food Co., Inc.^ | 8.75 | % | 7/15/2013 | 22,500 | 21,937,500 | ||||||||||||||
| Land O'Lakes, Inc. | 9.00 | % | 12/15/2010 | 15,000 | 15,993,750 | ||||||||||||||
| Total | 53,105,205 | ||||||||||||||||||
| Food & Drug Retailers 1.72% | |||||||||||||||||||
| Ingles Markets, Inc.^ | 8.875 | % | 12/1/2011 | 25,000 | 26,187,500 | ||||||||||||||
| Rite Aid Corp. | 6.875 | % | 8/15/2013 | 34,000 | 30,345,000 | ||||||||||||||
| Rite Aid Corp. | 8.125 | % | 5/1/2010 | 35,150 | 36,072,688 | ||||||||||||||
| Stater Bros. Holdings, Inc.^ | 8.125 | % | 6/15/2012 | 25,000 | 25,500,000 | ||||||||||||||
| SUPERVALU INC.^ | 7.50 | % | 11/15/2014 | 14,375 | 15,060,716 | ||||||||||||||
| Total | 133,165,904 | ||||||||||||||||||
| Forestry/Paper 3.30% | |||||||||||||||||||
| Abitibi-Consolidated, Inc. (Canada)^(a) | 8.55 | % | 8/1/2010 | 27,906 | 26,650,230 | ||||||||||||||
| Ainsworth Lumber Co. Ltd. (Canada)(a) | 7.25 | % | 10/1/2012 | 9,170 | 7,267,225 | ||||||||||||||
| Bowater, Inc. | 6.50 | % | 6/15/2013 | 25,000 | 22,937,500 | ||||||||||||||
| Buckeye Technologies, Inc.^ | 8.00 | % | 10/15/2010 | 21,000 | 21,105,000 | ||||||||||||||
| Domtar Inc. (Canada)(a) | 7.875 | % | 10/15/2011 | 20,000 | 20,850,000 | ||||||||||||||
| Graphic Packaging Int'l., Corp.^ | 9.50 | % | 8/15/2013 | 17,500 | 18,550,000 | ||||||||||||||
| Jefferson Smurfit Corp.^ | 7.50 | % | 6/1/2013 | 20,000 | 18,900,000 | ||||||||||||||
| Jefferson Smurfit Corp.^ | 8.25 | % | 10/1/2012 | 10,000 | 9,800,000 | ||||||||||||||
| JSG Funding plc (Ireland)^(a) | 7.75 | % | 4/1/2015 | 18,000 | 17,370,000 | ||||||||||||||
| MDP Acquisitions plc (Ireland)^(a) | 9.625 | % | 10/1/2012 | 14,500 | 15,442,500 | ||||||||||||||
| Norske Skog Canada Ltd. (Canada)^(a) | 7.375 | % | 3/1/2014 | 18,925 | 18,026,062 | ||||||||||||||
| Rock-Tenn Co., Class A^ | 8.20 | % | 8/15/2011 | 12,450 | 13,197,000 | ||||||||||||||
| Stone Container Corp. | 8.375 | % | 7/1/2012 | 10,000 | 9,850,000 | ||||||||||||||
| Stone Container Corp. | 9.75 | % | 2/1/2011 | 17,186 | 17,808,993 | ||||||||||||||
| Tembec Industries, Inc. (Canada)(a) | 7.75 | % | 3/15/2012 | 5,000 | 2,950,000 | ||||||||||||||
| Tembec Industries, Inc. (Canada)(a) | 8.625 | % | 6/30/2009 | 22,325 | 15,404,250 | ||||||||||||||
| Total | 256,108,760 | ||||||||||||||||||
See Notes to Financial Statements.
19
Schedule of Investments (continued)
December 31, 2006
| Investments | Interest Rate | Maturity Date | Principal Amount (000) | Value | |||||||||||||||
| Gaming 4.56% | |||||||||||||||||||
| Aztar Corp. | 7.875 | % | 6/15/2014 | $ | 10,000 | $ | 10,912,500 | ||||||||||||
| Boyd Gaming Corp.^ | 7.125 | % | 2/1/2016 | 8,500 | 8,500,000 | ||||||||||||||
| Boyd Gaming Corp.^ | 8.75 | % | 4/15/2012 | 10,150 | 10,657,500 | ||||||||||||||
| Hard Rock Hotel, Inc.^ | 8.875 | % | 6/1/2013 | 32,000 | 34,920,000 | ||||||||||||||
| Isle of Capri Casinos, Inc.^ | 7.00 | % | 3/1/2014 | 35,550 | 35,550,000 | ||||||||||||||
| Isle of Capri Casinos, Inc. | 9.00 | % | 3/15/2012 | 15,000 | 15,750,000 | ||||||||||||||
| Las Vegas Sands Corp.^ | 6.375 | % | 2/15/2015 | 35,000 | 34,081,250 | ||||||||||||||
| Mandalay Resort Group^ | 9.375 | % | 2/15/2010 | 20,000 | 21,500,000 | ||||||||||||||
| MGM Mirage, Inc.^ | 6.75 | % | 9/1/2012 | 24,000 | 23,760,000 | ||||||||||||||
| Park Place Entertainment Corp.^ | 8.125 | % | 5/15/2011 | 10,000 | 10,512,500 | ||||||||||||||
| Park Place Entertainment Corp. | 9.375 | % | 2/15/2007 | 23,500 | 23,588,125 | ||||||||||||||
| Premier Entertainment Biloxi LLC(b) | 10.75 | % | 2/1/2012 | 7,785 | 8,057,475 | ||||||||||||||
| River Rock Entertainment Authority | 9.75 | % | 11/1/2011 | 15,700 | 16,720,500 | ||||||||||||||
| Scientific Games Corp.^ | 6.25 | % | 12/15/2012 | 10,000 | 9,825,000 | ||||||||||||||
| Seneca Gaming Corp.^ | 7.25 | % | 5/1/2012 | 10,000 | 10,225,000 | ||||||||||||||
| Station Casinos, Inc.^ | 6.50 | % | 2/1/2014 | 27,000 | 24,131,250 | ||||||||||||||
| Turning Stone Casino Resort† | 9.125 | % | 12/15/2010 | 15,000 | 15,450,000 | ||||||||||||||
| Turning Stone Casino Resort† | 9.125 | % | 9/15/2014 | 10,000 | 10,275,000 | ||||||||||||||
| Wynn Las Vegas LLC/Wynn Las Vegas Capital Corp.^ | 6.625 | % | 12/1/2014 | 30,000 | 29,962,500 | ||||||||||||||
| Total | 354,378,600 | ||||||||||||||||||
| Gas Distribution 3.20% | |||||||||||||||||||
| El Paso Corp. | 7.00 | % | 5/15/2011 | 72,500 | 75,581,250 | ||||||||||||||
| El Paso Corp.^ | 7.75 | % | 1/15/2032 | 28,250 | 31,075,000 | ||||||||||||||
| Ferrellgas Partners, L.P. | 6.75 | % | 5/1/2014 | 15,950 | 15,591,125 | ||||||||||||||
| Ferrellgas Partners, L.P.^ | 8.75 | % | 6/15/2012 | 15,625 | 16,093,750 | ||||||||||||||
| Inergy L.P.^ | 8.25 | % | 3/1/2016 | 12,000 | 12,660,000 | ||||||||||||||
| MarkWest Energy Partners, L.P.^ | 6.875 | % | 11/1/2014 | 23,050 | 22,358,500 | ||||||||||||||
| MarkWest Energy Partners, L.P.† | 8.50 | % | 7/15/2016 | 3,775 | 3,944,875 | ||||||||||||||
| Sonat, Inc.^ | 7.625 | % | 7/15/2011 | 18,000 | 19,170,000 | ||||||||||||||
| Williams Cos., Inc. (The)^ | 7.875 | % | 9/1/2021 | 36,550 | 39,382,625 | ||||||||||||||
| Williams Partners L.P.† | 7.25 | % | 2/1/2017 | 12,225 | 12,530,625 | ||||||||||||||
| Total | 248,387,750 | ||||||||||||||||||
| Health Services 3.15% | |||||||||||||||||||
| Alliance Imaging, Inc.^ | 7.25 | % | 12/15/2012 | 10,150 | 9,693,250 | ||||||||||||||
| AmeriPath, Inc. | 10.50 | % | 4/1/2013 | 23,000 | 25,012,500 | ||||||||||||||
See Notes to Financial Statements.
20
Schedule of Investments (continued)
December 31, 2006
| Investments | Interest Rate | Maturity Date | Principal Amount (000) | Value | |||||||||||||||
| Bio-Rad Laboratories, Inc. | 6.125 | % | 12/15/2014 | $ | 13,700 | $ | 13,323,250 | ||||||||||||
| CDRV Investors, Inc. (9.625% after 1/1/2010)**^ | Zero Coupon | 1/1/2015 | 23,250 | 18,135,000 | |||||||||||||||
| DaVita, Inc.^ | 7.25 | % | 3/15/2015 | 10,500 | 10,762,500 | ||||||||||||||
| Fresenius Medical Capital Trust II | 7.875 | % | 2/1/2008 | 15,000 | 15,300,000 | ||||||||||||||
| Hanger Orthopedic Group, Inc.^ | 10.25 | % | 6/1/2014 | 11,700 | 12,138,750 | ||||||||||||||
| HCA Inc.^ | 6.375 | % | 1/15/2015 | 22,250 | 18,912,500 | ||||||||||||||
| HCA Inc.† | 9.125 | % | 11/15/2014 | 5,425 | 5,811,531 | ||||||||||||||
| HCA Inc.† | 9.25 | % | 11/15/2016 | 10,000 | 10,737,500 | ||||||||||||||
| Omnicare, Inc.^ | 6.875 | % | 12/15/2015 | 7,000 | 6,947,500 | ||||||||||||||
| Select Medical Corp.^ | 7.625 | % | 2/1/2015 | 9,525 | 7,953,375 | ||||||||||||||
| Tenet Healthcare Corp. | 7.375 | % | 2/1/2013 | 30,775 | 28,428,406 | ||||||||||||||
| Tenet Healthcare Corp.^ | 9.25 | % | 2/1/2015 | 23,700 | 23,818,500 | ||||||||||||||
| Tenet Healthcare Corp.^ | 9.875 | % | 7/1/2014 | 10,000 | 10,225,000 | ||||||||||||||
| Vanguard Health Holdings Co. II LLC^ | 9.00 | % | 10/1/2014 | 26,750 | 27,218,125 | ||||||||||||||
| Total | 244,417,687 | ||||||||||||||||||
| Hotels 1.27% | |||||||||||||||||||
| FelCor Lodging L.P.^ | 8.50 | % | 6/1/2011 | 15,000 | 16,050,000 | ||||||||||||||
| Gaylord Entertainment Co.^ | 6.75 | % | 11/15/2014 | 15,000 | 14,962,500 | ||||||||||||||
| Gaylord Entertainment Co.^ | 8.00 | % | 11/15/2013 | 31,000 | 32,317,500 | ||||||||||||||
| Host Marriott L.P.^ | 6.375 | % | 3/15/2015 | 15,000 | 14,868,750 | ||||||||||||||
| Host Marriott L.P.^ | 7.00 | % | 8/15/2012 | 20,000 | 20,400,000 | ||||||||||||||
| Total | 98,598,750 | ||||||||||||||||||
| Household & Leisure Products 0.10% | |||||||||||||||||||
| ACCO Brands Corp.^ | 7.625 | % | 8/15/2015 | 8,075 | 7,974,062 | ||||||||||||||
| Leisure 0.22% | |||||||||||||||||||
| Six Flags, Inc.^ | 9.625 | % | 6/1/2014 | 8,750 | 8,159,375 | ||||||||||||||
| Universal City Development Partners, Ltd. | 11.75 | % | 4/1/2010 | 8,000 | 8,610,000 | ||||||||||||||
| Total | 16,769,375 | ||||||||||||||||||
| Machinery 0.55% | |||||||||||||||||||
| Briggs & Stratton Corp. | 8.875 | % | 3/15/2011 | 10,000 | 10,875,000 | ||||||||||||||
| Case New Holland, Inc.^ | 9.25 | % | 8/1/2011 | 10,000 | 10,637,500 | ||||||||||||||
| Gardner Denver, Inc. | 8.00 | % | 5/1/2013 | 18,665 | 19,504,925 | ||||||||||||||
| Manitowoc Co., Inc.^ | 7.125 | % | 11/1/2013 | 1,575 | 1,598,625 | ||||||||||||||
| Total | 42,616,050 | ||||||||||||||||||
See Notes to Financial Statements.
21
Schedule of Investments (continued)
December 31, 2006
| Investments | Interest Rate | Maturity Date | Principal Amount (000) | Value | |||||||||||||||
| Media: Broadcast 1.66% | |||||||||||||||||||
| Allbritton Communications Co. | 7.75 | % | 12/15/2012 | $ | 65,000 | $ | 65,975,000 | ||||||||||||
| LIN TV Corp.^ | 6.50 | % | 5/15/2013 | 10,075 | 9,646,812 | ||||||||||||||
| Paxson Communications Corp.+^ | 11.624 | %# | 1/15/2013 | 10,000 | 10,175,000 | ||||||||||||||
| Radio One, Inc.^ | 6.375 | % | 2/15/2013 | 10,000 | 9,400,000 | ||||||||||||||
| Sinclair Broadcast Group, Inc.^ | 8.00 | % | 3/15/2012 | 22,032 | 22,858,200 | ||||||||||||||
| Sinclair Broadcast Group, Inc.^ | 8.75 | % | 12/15/2011 | 10,000 | 10,462,500 | ||||||||||||||
| Total | 128,517,512 | ||||||||||||||||||
| Media: Cable 4.11% | |||||||||||||||||||
| Century Communications Corp.(b) | 8.375 | % | 12/15/2007 | 8,000 | 9,640,000 | ||||||||||||||
| Century Communications Corp.(b) | 9.50 | % | 3/1/2005 | 40,000 | 48,600,000 | ||||||||||||||
| Charter Communications Holdings, LLC I | 11.00 | % | 10/1/2015 | 65,225 | 67,263,281 | ||||||||||||||
| Charter Communications Holdings, LLC II^ | 10.25 | % | 9/15/2010 | 20,000 | 21,025,000 | ||||||||||||||
| DirecTV Holdings LLC^ | 6.375 | % | 6/15/2015 | 25,000 | 24,093,750 | ||||||||||||||
| DirecTV Holdings LLC^ | 8.375 | % | 3/15/2013 | 12,000 | 12,540,000 | ||||||||||||||
| Echostar DBS Corp.^ | 6.375 | % | 10/1/2011 | 15,000 | 14,943,750 | ||||||||||||||
| Echostar DBS Corp.^ | 7.125 | % | 2/1/2016 | 25,000 | 25,125,000 | ||||||||||||||
| Frontiervision L.P.(b) | 11.875 | % | 9/15/2007 | 20,000 | 26,600,000 | ||||||||||||||
| Frontiervision L.P., Series B(b) | 11.875 | % | 9/15/2007 | 10,000 | 13,300,000 | ||||||||||||||
| Mediacom Broadband LLC^ | 8.50 | % | 10/15/2015 | 11,550 | 11,752,125 | ||||||||||||||
| Mediacom Communications Corp.^ | 9.50 | % | 1/15/2013 | 42,500 | 43,987,500 | ||||||||||||||
| Total | 318,870,406 | ||||||||||||||||||
| Media: Services 1.34% | |||||||||||||||||||
| Affinion Group, Inc. | 11.50 | % | 10/15/2015 | 10,500 | 11,156,250 | ||||||||||||||
| Idearc, Inc.† | 8.00 | % | 11/15/2016 | 48,000 | 48,960,000 | ||||||||||||||
| Interpublic Group of Cos. (The) | 6.25 | % | 11/15/2014 | 14,820 | 13,856,700 | ||||||||||||||
| Warner Music Group Corp.^ | 7.375 | % | 4/15/2014 | 30,000 | 29,850,000 | ||||||||||||||
| Total | 103,822,950 | ||||||||||||||||||
| Metals/Mining (Excluding Steel) 0.83% | |||||||||||||||||||
| Aleris Int'l., Inc.† | 9.00 | % | 12/15/2014 | 7,500 | 7,575,000 | ||||||||||||||
| Aleris Int'l., Inc.† | 10.00 | % | 12/15/2016 | 10,700 | 10,780,250 | ||||||||||||||
| Foundation PA Coal Co.^ | 7.25 | % | 8/1/2014 | 10,000 | 10,225,000 | ||||||||||||||
| Novelis Inc. (Canada)†(a) | 8.25 | % | 2/15/2015 | 15,000 | 14,587,500 | ||||||||||||||
| Peabody Energy Corp.^ | 5.875 | % | 4/15/2016 | 15,000 | 14,700,000 | ||||||||||||||
| Peabody Energy Corp. | 7.375 | % | 11/1/2016 | 6,350 | 6,794,500 | ||||||||||||||
| Total | 64,662,250 | ||||||||||||||||||
See Notes to Financial Statements.
22
Schedule of Investments (continued)
December 31, 2006
| Investments | Interest Rate | Maturity Date | Principal Amount (000) | Value | |||||||||||||||
| Non-Electric Utilities 0.18% | |||||||||||||||||||
| SEMCO Energy, Inc. | 7.75 | % | 5/15/2013 | $ | 14,050 | $ | 14,252,503 | ||||||||||||
| Non-Food & Drug Retailers 0.80% | |||||||||||||||||||
| Bon-Ton Department Stores Inc.^ | 10.25 | % | 3/15/2014 | 10,850 | 11,148,375 | ||||||||||||||
| Brookstone Company, Inc.^ | 12.00 | % | 10/15/2012 | 8,600 | 8,449,500 | ||||||||||||||
| Linens 'n Things, Inc.^ | 10.999 | %# | 1/15/2014 | 12,000 | 11,700,000 | ||||||||||||||
| Michaels Stores, Inc.†^ | 10.00 | % | 11/1/2014 | 8,625 | 9,013,125 | ||||||||||||||
| Neiman Marcus Group, Inc. (The) PIK^ | 9.00 | % | 10/15/2015 | 7,150 | 7,838,188 | ||||||||||||||
| Toys "R" Us, Inc.^ | 7.625 | % | 8/1/2011 | 15,000 | 13,875,000 | ||||||||||||||
| Total | 62,024,188 | ||||||||||||||||||
| Oil Field Equipment & Services 0.88% | |||||||||||||||||||
| Complete Production Services, Inc.†^ | 8.00 | % | 12/15/2016 | 20,000 | 20,600,000 | ||||||||||||||
| Grant Prideco, Inc.^ | 6.125 | % | 8/15/2015 | 10,000 | 9,800,000 | ||||||||||||||
| Hanover Compressor Co.^ | 7.50 | % | 4/15/2013 | 4,925 | 4,998,875 | ||||||||||||||
| Hanover Compressor Co.^ | 8.625 | % | 12/15/2010 | 12,075 | 12,678,750 | ||||||||||||||
| Hanover Compressor Co. | 9.00 | % | 6/1/2014 | 6,150 | 6,672,750 | ||||||||||||||
| Pride Int'l., Inc.^ | 7.375 | % | 7/15/2014 | 13,000 | 13,487,500 | ||||||||||||||
| Total | 68,237,875 | ||||||||||||||||||
| Oil Refining & Marketing 0.14% | |||||||||||||||||||
| Tesoro Corp.^ | 6.25 | % | 11/1/2012 | 10,625 | 10,625,000 | ||||||||||||||
| Packaging 1.96% | |||||||||||||||||||
| Berry Plastics Holdings Corp.†^ | 8.875 | % | 9/15/2014 | 27,500 | 28,050,000 | ||||||||||||||
| Crown Cork & Seal, Inc. | 7.375 | % | 12/15/2026 | 47,425 | 44,579,500 | ||||||||||||||
| Owens-Brockway Glass Container Inc.^ | 7.75 | % | 5/15/2011 | 25,000 | 25,812,500 | ||||||||||||||
| Owens-Brockway Glass Container Inc.^ | 8.875 | % | 2/15/2009 | 30,763 | 31,608,983 | ||||||||||||||
| Owens Illinois, Inc.^ | 7.50 | % | 5/15/2010 | 15,200 | 15,333,000 | ||||||||||||||
| Vitro Envases NorteAmerica S.A. de C.V. (Mexico)†(a) | 10.75 | % | 7/23/2011 | 6,000 | 6,600,000 | ||||||||||||||
| Total | 151,983,983 | ||||||||||||||||||
| Pharmaceuticals 0.81% | |||||||||||||||||||
| Angiotech Pharmaceuticals, Inc. (Canada)†(a) | 7.75 | % | 4/1/2014 | 15,750 | 13,781,250 | ||||||||||||||
| Mylan Laboratories Inc. | 6.375 | % | 8/15/2015 | 20,000 | 19,900,000 | ||||||||||||||
| Warner Chilcott Corp.^ | 8.75 | % | 2/1/2015 | 28,009 | 28,849,270 | ||||||||||||||
| Total | 62,530,520 | ||||||||||||||||||
See Notes to Financial Statements.
23
Schedule of Investments (continued)
December 31, 2006
| Investments | Interest Rate | Maturity Date | Principal Amount (000) | Value | |||||||||||||||
| Printing & Publishing 1.61% | |||||||||||||||||||
| Clarke American Corp. | 11.75 | % | 12/15/2013 | $ | 10,000 | $ | 10,750,000 | ||||||||||||
| Dex Media West^ | 9.875 | % | 8/15/2013 | 25,394 | 27,806,430 | ||||||||||||||
| Dex Media, Inc. (9.00% after 11/15/2008)**^ | Zero Coupon | 11/15/2013 | 15,000 | 13,462,500 | |||||||||||||||
| PRIMEDIA, Inc.^ | 8.875 | % | 5/15/2011 | 14,000 | 14,350,000 | ||||||||||||||
| R.H. Donnelley Corp.^ | 6.875 | % | 1/15/2013 | 22,150 | 21,347,063 | ||||||||||||||
| R.H. Donnelley Corp.^ | 8.875 | % | 1/15/2016 | 24,675 | 26,032,125 | ||||||||||||||
| R.H. Donnelley Finance Inc. | 10.875 | % | 12/15/2012 | 10,000 | 10,950,000 | ||||||||||||||
| Total | 124,698,118 | ||||||||||||||||||
| Restaurants 0.53% | |||||||||||||||||||
| Denny's Corp./Denny's Holdings Inc.^ | 10.00 | % | 10/1/2012 | 15,500 | 16,430,000 | ||||||||||||||
| Friendly Ice Cream Corp.^ | 8.375 | % | 6/15/2012 | 14,000 | 13,265,000 | ||||||||||||||
| Landry's Restaurants, Inc.^ | 7.50 | % | 12/15/2014 | 12,000 | 11,790,000 | ||||||||||||||
| Total | 41,485,000 | ||||||||||||||||||
| Software/Services 1.22% | |||||||||||||||||||
| Electronic Data Systems Corp.(e) | 6.50 | % | 8/1/2013 | 20,000 | 20,161,340 | ||||||||||||||
| SERENA Software, Inc.^ | 10.375 | % | 3/15/2016 | 11,000 | 11,728,750 | ||||||||||||||
| SunGard Data Systems, Inc.^ | 9.125 | % | 8/15/2013 | 25,000 | 26,375,000 | ||||||||||||||
| SunGard Data Systems, Inc.^ | 10.25 | % | 8/15/2015 | 25,000 | 26,812,500 | ||||||||||||||
| Unisys Corp. | 8.00 | % | 10/15/2012 | 10,000 | 9,937,500 | ||||||||||||||
| Total | 95,015,090 | ||||||||||||||||||
| Steel Producers/Products 0.66% | |||||||||||||||||||
| AK Steel Holding Corp. | 7.75 | % | 6/15/2012 | 25,000 | 25,312,500 | ||||||||||||||
| Allegheny Ludlum Corp. | 6.95 | % | 12/15/2025 | 15,000 | 15,375,000 | ||||||||||||||
| Century Aluminum Co.^ | 7.50 | % | 8/15/2014 | 10,000 | 10,187,500 | ||||||||||||||
| Total | 50,875,000 | ||||||||||||||||||
| Support: Services 2.61% | |||||||||||||||||||
| Ashtead Capital Inc.† | 9.00 | % | 8/15/2016 | 15,200 | 16,340,000 | ||||||||||||||
| Avis Budget Car Rental†^ | 7.625 | % | 5/15/2014 | 17,750 | 17,395,000 | ||||||||||||||
| FTI, Inc.† | 7.75 | % | 10/1/2016 | 10,300 | 10,737,750 | ||||||||||||||
| Hertz Corp. (The)† | 8.875 | % | 1/1/2014 | 20,000 | 21,050,000 | ||||||||||||||
| Hertz Corp. (The)†^ | 10.50 | % | 1/1/2016 | 8,000 | 8,840,000 | ||||||||||||||
| Iron Mountain Inc.^ | 6.625 | % | 1/1/2016 | 37,000 | 35,705,000 | ||||||||||||||
| Iron Mountain Inc. | 7.75 | % | 1/15/2015 | 25,000 | 25,625,000 | ||||||||||||||
| Iron Mountain Inc. | 8.625 | % | 4/1/2013 | 10,000 | 10,375,000 | ||||||||||||||
See Notes to Financial Statements.
24
Schedule of Investments (continued)
December 31, 2006
| Investments | Interest Rate | Maturity Date | Principal Amount (000) | Value | |||||||||||||||
| Rental Service Corp.† | 9.50 | % | 12/1/2014 | $ | 15,250 | $ | 15,821,875 | ||||||||||||
| United Rentals North America, Inc.^ | 7.75 | % | 11/15/2013 | 18,580 | 18,742,575 | ||||||||||||||
| Williams Scotsman, Inc. | 8.50 | % | 10/1/2015 | 20,900 | 21,918,875 | ||||||||||||||
| Total | 202,551,075 | ||||||||||||||||||
| Telecommunications: Fixed Line 0.13% | |||||||||||||||||||
| Level 3 Communications, Inc. | 11.25 | % | 3/15/2010 | 10,000 | 10,300,000 | ||||||||||||||
| Telecommunications: Integrated/Services 3.48% | |||||||||||||||||||
| Cincinnati Bell, Inc.^ | 8.375 | % | 1/15/2014 | 61,400 | 63,395,500 | ||||||||||||||
| Hughes Network Systems, LLC^ | 9.50 | % | 4/15/2014 | 10,000 | 10,487,500 | ||||||||||||||
| Intelsat, Ltd. (Bermuda)(a) | 8.25 | % | 1/15/2013 | 22,750 | 23,205,000 | ||||||||||||||
| Intelsat, Ltd. (Bermuda)†(a) | 9.25 | % | 6/15/2016 | 5,000 | 5,400,000 | ||||||||||||||
| Intelsat, Ltd. (Bermuda)†(a) | 11.25 | % | 6/15/2016 | 11,000 | 12,127,500 | ||||||||||||||
| Nordic Telephone Holdings Co. (Denmark)†(a) | 8.875 | % | 5/1/2016 | 25,000 | 26,875,000 | ||||||||||||||
| Qwest Capital Funding, Inc. | 7.90 | % | 8/15/2010 | 75,000 | 78,468,750 | ||||||||||||||
| Qwest Communications Int'l., Inc.^ | 7.25 | % | 2/15/2011 | 37,000 | 38,017,500 | ||||||||||||||
| Syniverse Technologies Inc. | 7.75 | % | 8/15/2013 | 12,000 | 12,030,000 | ||||||||||||||
| Total | 270,006,750 | ||||||||||||||||||
| Telecommunications: Wireless 2.39% | |||||||||||||||||||
| Alamosa Delaware, Inc. | 11.00 | % | 7/31/2010 | 15,000 | 16,211,010 | ||||||||||||||
| Centennial Communications Corp.^ | 10.00 | % | 1/1/2013 | 12,750 | 13,626,562 | ||||||||||||||
| Centennial Communications Corp.^ | 10.125 | % | 6/15/2013 | 10,000 | 10,825,000 | ||||||||||||||
| Dobson Communications Corp. | 8.875 | % | 10/1/2013 | 27,500 | 28,153,125 | ||||||||||||||
| Hellas II (Luxembourg)†(a) | 11.115 | %# | 1/15/2015 | 16,850 | 16,997,438 | ||||||||||||||
| Nextel Communications, Inc. | 7.375 | % | 8/1/2015 | 10,000 | 10,264,110 | ||||||||||||||
| Nextel Partners, Inc.^ | 8.125 | % | 7/1/2011 | 27,200 | 28,458,000 | ||||||||||||||
| Rogers Wireless, Inc. (Canada)(a) | 7.25 | % | 12/15/2012 | 6,500 | 6,922,500 | ||||||||||||||
| Rural Cellular Corp., Class A | 9.75 | % | 1/15/2010 | 25,225 | 26,044,813 | ||||||||||||||
| UbiquiTel Operating Co.^ | 9.875 | % | 3/1/2011 | 15,000 | 16,275,000 | ||||||||||||||
| Wind Acquisition Finance S.A. (Luxembourg)†(a) | 10.75 | % | 12/1/2015 | 10,000 | 11,425,000 | ||||||||||||||
| Total | 185,202,558 | ||||||||||||||||||
| Theaters & Entertainment 0.64% | |||||||||||||||||||
| AMC Entertainment, Inc.^ | 8.00 | % | 3/1/2014 | 25,000 | 24,937,500 | ||||||||||||||
| AMC Entertainment, Inc.^ | 11.00 | % | 2/1/2016 | 10,000 | 11,275,000 | ||||||||||||||
| Cinemark USA, Inc. | 9.00 | % | 2/1/2013 | 12,900 | 13,738,500 | ||||||||||||||
| Total | 49,951,000 | ||||||||||||||||||
See Notes to Financial Statements.
25
Schedule of Investments (continued)
December 31, 2006
| Investments | Interest Rate | Maturity Date | Principal Amount (000) | Value | |||||||||||||||
| Transportation Excluding Air/Rail 0.63% | |||||||||||||||||||
| Bristow Group Inc.^ | 6.125 | % | 6/15/2013 | $ | 20,150 | $ | 19,142,500 | ||||||||||||
| CHC Helicopter Corp., Class A (Canada)^(a) | 7.375 | % | 5/1/2014 | 15,000 | 14,531,250 | ||||||||||||||
| Hornbeck Offshore Services, Inc.^ | 6.125 | % | 12/1/2014 | 15,790 | 15,138,663 | ||||||||||||||
| Total | 48,812,413 | ||||||||||||||||||
| Total High Yield Corporate Bonds (cost $5,084,858,964) | 5,185,395,618 | ||||||||||||||||||
| NON-AGENCY COMMERCIAL MORTGAGE-BACKED SECURITY 0.25% | |||||||||||||||||||
| Credit Suisse First Boston Mortgage Securities Corp., Series 1998-C2, Class A2 (cost $18,392,320) | 6.30 | % | 11/15/2030 | 18,835 | 19,104,658 | ||||||||||||||
| U.S. TREASURY OBLIGATION 1.04% | |||||||||||||||||||
| U.S. Treasury Note (cost $82,340,292) | 5.00 | % | 2/15/2011 | 80,000 | 81,025,040 | ||||||||||||||
| Total Long-Term Investments (cost $7,235,420,052) | 7,490,949,593 | ||||||||||||||||||
| Shares (000) | |||||||||||||||||||
| SHORT-TERM INVESTMENTS 12.88% | |||||||||||||||||||
| Collateral for Securities on Loan 10.95% | |||||||||||||||||||
| State Street Navigator Securities Lending Prime Portfolio 5.245%(d) | 850,492 | 850,491,617 | |||||||||||||||||
| Principal Amount (000) | |||||||||||||||||||
| Repurchase Agreement 1.93% | |||||||||||||||||||
| Repurchase Agreement dated 12/29/2006, 4.61% due 1/2/2007 with State Street Bank & Trust Co. collateralized by $152,330,000 of Federal National Mortgage Assoc. at Zero Coupon to 5.25% due from 3/14/2007 to 11/20/2009; value: $152,851,738; proceeds: $149,924,391 | $149,848 | 149,847,636 | |||||||||||||||||
| Total Short-Term Investments (cost $1,000,339,253) | 1,000,339,253 | ||||||||||||||||||
| Total Investments in Securities 109.38% (cost $8,235,759,305) | 8,491,288,846 | ||||||||||||||||||
| Liabilities in Excess of Other Assets(f) (9.38%) | (728,293,035 | ) | |||||||||||||||||
| Net Assets 100.00% | $ | 7,762,995,811 | |||||||||||||||||
See Notes to Financial Statements.
26
Schedule of Investments (concluded)
December 31, 2006
PIK Payment-in-kind, at 9.75%.
* Non-income producing security.
** Deferred-interest debentures pay no interest for a stipulated number of years, after which they pay a predetermined interest rate.
† Security was purchased pursuant to Rule 144A under the Securities Act of 1933 or is a private placement and, unless registered under the Act or exempted from registration, may only be resold to qualified institutional investors. Unless otherwise noted, 144A securities are deemed to be liquid.
^ All (or a portion of security) on loan. See Note 2(g).
# Variable rate security. The interest rate represents the rate at December 31, 2006.
(a) Foreign security traded in U.S. dollars.
(b) Defaulted security. Maturity date shown represents original maturity date.
(c) Amount represents less than 1,000 shares.
(d) Rate shown reflects 7-day yield as of December 31, 2006.
(e) Security has been pledged as collateral for swap contracts as of December 31, 2006.
(f) Liabilities in excess of other assets include net unrealized depreciation on credit default swap agreements, as follows:
Credit default swap agreements outstanding at December 31, 2006:
| Counterparty | Reference Entity | Protection | Pay Fixed Rate | Termination Date | Notional Amount (000) | Unrealized Depreciation | |||||||||||||||||||||
| Morgan Stanley | Electronic Data | ||||||||||||||||||||||||||
| Capital Services, Inc. | Systems Corp. | ||||||||||||||||||||||||||
| 6.50% due 8/1/2013 | Buy | 0.73 | % | 9/20/2011 | $ | 10,000 | $ | (109,779 | ) | ||||||||||||||||||
See Notes to Financial Statements.
27
Statement of Assets and Liabilities
December 31, 2006
| ASSETS: | |||||||
| Investment in securities, at value (cost $8,235,759,305) | $ | 8,491,288,846 | |||||
| Cash | 26,255,643 | ||||||
| Foreign cash, at value (cost $87) | 86 | ||||||
| Receivables: | |||||||
| Interest and dividends | 116,220,564 | ||||||
| Capital shares sold | 13,171,215 | ||||||
| Investment securities sold | 3,292,789 | ||||||
| Prepaid expenses and other assets | 182,256 | ||||||
| Total assets | 8,650,411,399 | ||||||
| LIABILITIES: | |||||||
| Payable upon return of securities on loan | 850,491,617 | ||||||
| Payables: | |||||||
| Capital shares reacquired | 13,566,482 | ||||||
| Investment securities purchased | 12,124,018 | ||||||
| 12b-1 distribution fees | 4,357,482 | ||||||
| Management fee | 2,976,063 | ||||||
| Directors' fees | 1,250,086 | ||||||
| Fund administration | 264,778 | ||||||
| To affiliate (See Note 3) | 51,233 | ||||||
| Unrealized depreciation on credit default swap agreements | 109,779 | ||||||
| Accrued expenses and other liabilities | 2,224,050 | ||||||
| Total liabilities | 887,415,588 | ||||||
| NET ASSETS | $ | 7,762,995,811 | |||||
| COMPOSITION OF NET ASSETS: | |||||||
| Paid-in capital | $ | 8,011,420,856 | |||||
| Distributions in excess of net investment income | (33,091,587 | ) | |||||
| Accumulated net realized loss on investments, credit default swap agreements and foreign currency related transactions | (470,762,728 | ) | |||||
| Net unrealized appreciation on investments, credit default swap agreements and translation of assets and liabilities denominated in foreign currency | 255,429,270 | ||||||
| Net Assets | $ | 7,762,995,811 | |||||
| Net assets by class: | |||||||
| Class A Shares | $ | 4,731,544,825 | |||||
| Class B Shares | $ | 1,269,913,728 | |||||
| Class C Shares | $ | 1,312,439,819 | |||||
| Class P Shares | $ | 106,734,422 | |||||
| Class Y Shares | $ | 342,363,017 | |||||
| Outstanding shares by class: | |||||||
| Class A Shares (740 million shares of common shares authorized, $.001 par value) | 590,169,814 | ||||||
| Class B Shares (500 million shares of common shares authorized, $.001 par value) | 158,244,688 | ||||||
| Class C Shares (300 million shares of common shares authorized, $.001 par value) | 163,469,891 | ||||||
| Class P Shares (160 million shares of common shares authorized, $.001 par value) | 13,104,012 | ||||||
| Class Y Shares (300 million shares of common shares authorized, $.001 par value) | 42,822,135 | ||||||
| Net asset value, offering and redemption price per share (Net assets divided by outstanding shares): | |||||||
| Class A Shares–Net asset value | $ | 8.02 | |||||
| Class A Shares–Maximum offering price (Net asset value plus sales charge of 4.75%) | $ | 8.42 | |||||
| Class B Shares–Net asset value | $ | 8.03 | |||||
| Class C Shares–Net asset value | $ | 8.03 | |||||
| Class P Shares–Net asset value | $ | 8.15 | |||||
| Class Y Shares–Net asset value | $ | 8.00 | |||||
See Notes to Financial Statements.
28
Statement of Operations
For the Year Ended December 31, 2006
| Investment income: | |||||||
| Dividends | $ | 24,664,483 | |||||
| Interest and other | 484,588,441 | ||||||
| Securities lending–net | 1,205,232 | ||||||
| Total investment income | 510,458,156 | ||||||
| Expenses: | |||||||
| Management fee | 35,451,710 | ||||||
| 12b-1 distribution plan–Class A | 16,398,072 | ||||||
| 12b-1 distribution plan–Class B | 13,586,073 | ||||||
| 12b-1 distribution plan–Class C | 13,391,913 | ||||||
| 12b-1 distribution plan–Class P | 497,255 | ||||||
| Shareholder servicing | 9,217,348 | ||||||
| Fund administration | 3,129,041 | ||||||
| Reports to shareholders | 926,327 | ||||||
| Subsidy (See Note 3) | 561,741 | ||||||
| Directors' fees | 307,816 | ||||||
| Custody | 254,512 | ||||||
| Registration | 245,827 | ||||||
| Professional | 119,990 | ||||||
| Other | 177,103 | ||||||
| Gross expenses | 94,264,728 | ||||||
| Expense reductions (See Note 7) | (296,688 | ) | |||||
| Net expenses | 93,968,040 | ||||||
| Net investment income | 416,490,116 | ||||||
| Net realized and unrealized gain: | |||||||
| Net realized gain on investments, credit default swap agreements and foreign currency related transactions | 119,061,223 | ||||||
| Net change in unrealized appreciation on investments, credit default swap agreements and translation of assets and liabilities denominated in foreign currencies | 182,112,110 | ||||||
| Net realized and unrealized gain | 301,173,333 | ||||||
| Net Increase in Net Assets Resulting From Operations | $ | 717,663,449 | |||||
See Notes to Financial Statements.
29
Statements of Changes in Net Assets
| DECREASE IN NET ASSETS | For the Year Ended December 31, 2006 | For the Year Ended December 31, 2005 | |||||||||
| Operations: | |||||||||||
| Net investment income | $ | 416,490,116 | $ | 446,882,211 | |||||||
| Net realized gain on investments, credit default swap agreements and foreign currency related transactions | 119,061,223 | 131,223,692 | |||||||||
| Net change in unrealized appreciation (depreciation) on investments,credit default swap agreements and translation of assets and liabilities denominated in foreign currencies | 182,112,110 | (475,701,766 | ) | ||||||||
| Net increase in net assets resulting from operations | 717,663,449 | 102,404,137 | |||||||||
| Distributions to shareholders from: | |||||||||||
| Net investment income | |||||||||||
| Class A | (311,396,758 | ) | (325,559,605 | ) | |||||||
| Class B | (81,028,361 | ) | (95,747,886 | ) | |||||||
| Class C | (79,852,914 | ) | (92,010,995 | ) | |||||||
| Class P | (7,102,111 | ) | (8,006,271 | ) | |||||||
| Class Y | (22,129,189 | ) | (20,020,997 | ) | |||||||
| Total distributions to shareholders | (501,509,333 | ) | (541,345,754 | ) | |||||||
| Capital share transactions (See Note 11): | |||||||||||
| Net proceeds from sales of shares | 838,539,549 | 1,206,658,233 | |||||||||
| Reinvestment of distributions | 383,628,714 | 405,952,005 | |||||||||
| Cost of shares reacquired | (1,826,823,551 | ) | (2,020,188,152 | ) | |||||||
| Net decrease in net assets resulting from capital share transactions | (604,655,288 | ) | (407,577,914 | ) | |||||||
| Net decrease in net assets | (388,501,172 | ) | (846,519,531 | ) | |||||||
| NET ASSETS: | |||||||||||
| Beginning of year | $ | 8,151,496,983 | $ | 8,998,016,514 | |||||||
| End of year | $ | 7,762,995,811 | $ | 8,151,496,983 | |||||||
| Distributions in excess of net investment income | $ | (33,091,587 | ) | $ | (25,173,806 | ) | |||||
See Notes to Financial Statements.
30
Financial Highlights
| Class A Shares | |||||||||||||||||||||||
| Year Ended 12/31 | |||||||||||||||||||||||
| 2006 | 2005 | 2004 | 2003 | 2002 | |||||||||||||||||||
| Per Share Operating Performance | |||||||||||||||||||||||
| Net asset value, beginning of year | $ | 7.80 | $ | 8.20 | $ | 8.06 | $ | 7.19 | $ | 7.91 | |||||||||||||
| Investment operations: | |||||||||||||||||||||||
| Net investment income(a) | .43 | .43 | .46 | .48 | .55 | ||||||||||||||||||
| Net realized and unrealized gain (loss) | .31 | (.31 | ) | .20 | .92 | (.64 | ) | ||||||||||||||||
| Total from investment operations | .74 | .12 | .66 | 1.40 | (.09 | ) | |||||||||||||||||
| Distributions to shareholders from: | |||||||||||||||||||||||
| Net investment income | (.52 | ) | (.52 | ) | (.52 | ) | (.50 | ) | (.58 | ) | |||||||||||||
| Paid-in capital | – | - | – | (.03 | ) | (.05 | ) | ||||||||||||||||
| Total distributions | (.52 | ) | (.52 | ) | (.52 | ) | (.53 | ) | (.63 | ) | |||||||||||||
| Net asset value, end of year | $ | 8.02 | $ | 7.80 | $ | 8.20 | $ | 8.06 | $ | 7.19 | |||||||||||||
| Total Return(b) | 9.87 | % | 1.56 | % | 8.56 | % | 20.28 | % | (1.08 | )% | |||||||||||||
| Ratios to Average Net Assets: | |||||||||||||||||||||||
| Expenses, including expense reductions | .99 | % | .99 | % | .99 | % | 1.00 | % | 1.00 | % | |||||||||||||
| Expenses, excluding expense reductions | .99 | % | 1.00 | % | .99 | % | 1.00 | % | 1.00 | % | |||||||||||||
| Net investment income | 5.54 | % | 5.45 | % | 5.71 | % | 6.31 | % | 7.51 | % | |||||||||||||
| Supplemental Data: | |||||||||||||||||||||||
| Net assets, end of year (000) | $ | 4,731,545 | $ | 4,815,148 | $ | 5,093,236 | $ | 4,497,233 | $ | 3,048,301 | |||||||||||||
| Portfolio turnover rate | 32.40 | % | 46.63 | % | 42.02 | % | 40.96 | % | 37.03 | % | |||||||||||||
See Notes to Financial Statements.
31
Financial Highlights (continued)
| Class B Shares | |||||||||||||||||||||||
| Year Ended 12/31 | |||||||||||||||||||||||
| 2006 | 2005 | 2004 | 2003 | 2002 | |||||||||||||||||||
| Per Share Operating Performance | |||||||||||||||||||||||
| Net asset value, beginning of year | $ | 7.80 | $ | 8.20 | $ | 8.06 | $ | 7.20 | $ | 7.92 | |||||||||||||
| Investment operations: | |||||||||||||||||||||||
| Net investment income(a) | .38 | .38 | .41 | .43 | .51 | ||||||||||||||||||
| Net realized and unrealized gain (loss) | .32 | (.31 | ) | .20 | .92 | (.65 | ) | ||||||||||||||||
| Total from investment operations | .70 | .07 | .61 | 1.35 | (.14 | ) | |||||||||||||||||
| Distributions to shareholders from: | |||||||||||||||||||||||
| Net investment income | (.47 | ) | (.47 | ) | (.47 | ) | (.46 | ) | (.53 | ) | |||||||||||||
| Paid-in capital | – | – | – | (.03 | ) | (.05 | ) | ||||||||||||||||
| Total distributions | (.47 | ) | (.47 | ) | (.47 | ) | (.49 | ) | (.58 | ) | |||||||||||||
| Net asset value, end of year | $ | 8.03 | $ | 7.80 | $ | 8.20 | $ | 8.06 | $ | 7.20 | |||||||||||||
| Total Return(b) | 9.26 | % | .88 | % | 7.86 | % | 19.43 | % | (1.67 | )% | |||||||||||||
| Ratios to Average Net Assets: | |||||||||||||||||||||||
| Expenses, including expense reductions | 1.64 | % | 1.64 | % | 1.64 | % | 1.64 | % | 1.65 | % | |||||||||||||
| Expenses, excluding expense reductions | 1.64 | % | 1.64 | % | 1.64 | % | 1.64 | % | 1.65 | % | |||||||||||||
| Net investment income | 4.88 | % | 4.80 | % | 5.07 | % | 5.67 | % | 6.86 | % | |||||||||||||
| Supplemental Data: | |||||||||||||||||||||||
| Net assets, end of year (000) | $ | 1,269,914 | $ | 1,473,891 | $ | 1,803,609 | $ | 1,861,920 | $ | 1,294,955 | |||||||||||||
| Portfolio turnover rate | 32.40 | % | 46.63 | % | 42.02 | % | 40.96 | % | 37.03 | % | |||||||||||||
See Notes to Financial Statements.
32
Financial Highlights (continued)
| Class C Shares | |||||||||||||||||||||||
| Year Ended 12/31 | |||||||||||||||||||||||
| 2006 | 2005 | 2004 | 2003 | 2002 | |||||||||||||||||||
| Per Share Operating Performance | |||||||||||||||||||||||
| Net asset value, beginning of year | $ | 7.81 | $ | 8.21 | $ | 8.07 | $ | 7.21 | $ | 7.93 | |||||||||||||
| Investment operations: | |||||||||||||||||||||||
| Net investment income(a) | .38 | .38 | .41 | .43 | .51 | ||||||||||||||||||
| Net realized and unrealized gain (loss) | .31 | (.31 | ) | .20 | .92 | (.64 | ) | ||||||||||||||||
| Total from investment operations | .69 | .07 | .61 | 1.35 | (.13 | ) | |||||||||||||||||
| Distributions to shareholders from: | |||||||||||||||||||||||
| Net investment income | (.47 | ) | (.47 | ) | (.47 | ) | (.46 | ) | (.54 | ) | |||||||||||||
| Paid-in capital | – | – | – | (.03 | ) | (.05 | ) | ||||||||||||||||
| Total distributions | (.47 | ) | (.47 | ) | (.47 | ) | (.49 | ) | (.59 | ) | |||||||||||||
| Net asset value, end of year | $ | 8.03 | $ | 7.81 | $ | 8.21 | $ | 8.07 | $ | 7.21 | |||||||||||||
| Total Return(b) | 9.13 | % | .89 | % | 7.86 | % | 19.43 | % | (1.58 | )% | |||||||||||||
| Ratios to Average Net Assets: | |||||||||||||||||||||||
| Expenses, including expense reductions | 1.64 | % | 1.64 | % | 1.64 | % | 1.64 | % | 1.59 | % | |||||||||||||
| Expenses, excluding expense reductions | 1.64 | % | 1.64 | % | 1.64 | % | 1.64 | % | 1.59 | % | |||||||||||||
| Net investment income | 4.88 | % | 4.80 | % | 5.07 | % | 5.67 | % | 6.92 | % | |||||||||||||
| Supplemental Data: | |||||||||||||||||||||||
| Net assets, end of year (000) | $ | 1,312,440 | $ | 1,423,141 | $ | 1,703,329 | $ | 1,593,650 | $ | 905,629 | |||||||||||||
| Portfolio turnover rate | 32.40 | % | 46.63 | % | 42.02 | % | 40.96 | % | 37.03 | % | |||||||||||||
See Notes to Financial Statements.
33
Financial Highlights (continued)
| Class P Shares | |||||||||||||||||||||||
| Year Ended 12/31 | |||||||||||||||||||||||
| 2006 | 2005 | 2004 | 2003 | 2002 | |||||||||||||||||||
| Per Share Operating Performance | |||||||||||||||||||||||
| Net asset value, beginning of year | $ | 7.91 | $ | 8.31 | $ | 8.17 | $ | 7.29 | $ | 8.02 | |||||||||||||
| Investment operations: | |||||||||||||||||||||||
| Net investment income(a) | .43 | .43 | .45 | .48 | .55 | ||||||||||||||||||
| Net realized and unrealized gain (loss) | .32 | (.32 | ) | .20 | .93 | (.65 | ) | ||||||||||||||||
| Total from investment operations | .75 | .11 | .65 | 1.41 | (.10 | ) | |||||||||||||||||
| Distributions to shareholders from: | |||||||||||||||||||||||
| Net investment income | (.51 | ) | (.51 | ) | (.51 | ) | (.50 | ) | (.58 | ) | |||||||||||||
| Paid-in capital | – | – | – | (.03 | ) | (.05 | ) | ||||||||||||||||
| Total distributions | (.51 | ) | (.51 | ) | (.51 | ) | (.53 | ) | (.63 | ) | |||||||||||||
| Net asset value, end of year | $ | 8.15 | $ | 7.91 | $ | 8.31 | $ | 8.17 | $ | 7.29 | |||||||||||||
| Total Return(b) | 9.86 | % | 1.45 | % | 8.37 | % | 20.10 | % | (1.19 | )% | |||||||||||||
| Ratios to Average Net Assets: | |||||||||||||||||||||||
| Expenses, including expense reductions | 1.09 | % | 1.09 | % | 1.09 | % | 1.09 | % | 1.10 | % | |||||||||||||
| Expenses, excluding expense reductions | 1.09 | % | 1.09 | % | 1.09 | % | 1.09 | % | 1.10 | % | |||||||||||||
| Net investment income | 5.43 | % | 5.35 | % | 5.62 | % | 6.22 | % | 7.41 | % | |||||||||||||
| Supplemental Data: | |||||||||||||||||||||||
| Net assets, end of year (000) | $ | 106,734 | $ | 134,592 | $ | 113,216 | $ | 60,848 | $ | 18,736 | |||||||||||||
| Portfolio turnover rate | 32.40 | % | 46.63 | % | 42.02 | % | 40.96 | % | 37.03 | % | |||||||||||||
See Notes to Financial Statements.
34
Financial Highlights (concluded)
| Class Y Shares | |||||||||||||||||||||||
| Year Ended 12/31 | |||||||||||||||||||||||
| 2006 | 2005 | 2004 | 2003 | 2002 | |||||||||||||||||||
| Per Share Operating Performance | |||||||||||||||||||||||
| Net asset value, beginning of year | $ | 7.78 | $ | 8.18 | $ | 8.04 | $ | 7.18 | $ | 7.90 | |||||||||||||
| Investment operations: | |||||||||||||||||||||||
| Net investment income(a) | .46 | .46 | .48 | .51 | .58 | ||||||||||||||||||
| Net realized and unrealized gain (loss) | .31 | (.31 | ) | .21 | .91 | (.64 | ) | ||||||||||||||||
| Total from investment operations | .77 | .15 | .69 | 1.42 | (.06 | ) | |||||||||||||||||
| Distributions to shareholders from: | |||||||||||||||||||||||
| Net investment income | (.55 | ) | (.55 | ) | (.55 | ) | (.53 | ) | (.61 | ) | |||||||||||||
| Paid-in capital | – | – | – | (.03 | ) | (.05 | ) | ||||||||||||||||
| Total distributions | (.55 | ) | (.55 | ) | (.55 | ) | (.56 | ) | (.66 | ) | |||||||||||||
| Net asset value, end of year | $ | 8.00 | $ | 7.78 | $ | 8.18 | $ | 8.04 | $ | 7.18 | |||||||||||||
| Total Return(b) | 10.29 | % | 1.93 | % | 8.97 | % | 20.58 | % | (.66 | )% | |||||||||||||
| Ratios to Average Net Assets: | |||||||||||||||||||||||
| Expenses, including expense reductions | .64 | % | .64 | % | .64 | % | .64 | % | .65 | % | |||||||||||||
| Expenses, excluding expense reductions | .64 | % | .64 | % | .64 | % | .64 | % | .65 | % | |||||||||||||
| Net investment income | 5.89 | % | 5.80 | % | 6.07 | % | 6.67 | % | 7.86 | % | |||||||||||||
| Supplemental Data: | |||||||||||||||||||||||
| Net assets, end of year (000) | $ | 342,363 | $ | 304,725 | $ | 284,627 | $ | 181,603 | $ | 68,691 | |||||||||||||
| Portfolio turnover rate | 32.40 | % | 46.63 | % | 42.02 | % | 40.96 | % | 37.03 | % | |||||||||||||
(a) Calculated using average shares outstanding during the year.
(b) Total return does not consider the effects of sales loads and assumes the reinvestment of all distributions.
See Notes to Financial Statements.
35
Notes to Financial Statements
1. ORGANIZATION
Lord Abbett Bond-Debenture Fund, Inc. (the "Fund") is registered under the Investment Company Act of 1940 (the "Act") as a diversified open-end management investment company. The Fund was incorporated under Maryland law on January 23, 1976.
The Fund's investment objective is to seek high current income and the opportunity for capital appreciation to produce a high total return. The Fund offers five classes of shares: Classes A, B, C, P and Y, each with different expenses and dividends. A front-end sales charge is normally added to the Net Asset Value ("NAV") for Class A shares. There is no front-end sales charge in the case of the Classes B, C, P and Y shares, although there may be a contingent deferred sales charge ("CDSC") as follows: certain redemptions of Class A shares made within 12 months (24 months if shares were purchased prior to November 1, 2004) following certain purchases made without a sales charge; Class B shares redeemed before the sixth anniversary of purchase; and Class C shares redeemed before the first anniversary of purchase. Class B shares will convert to Class A shares on the eighth anniversary of the original purchase of Class B shares.
The preparation of financial statements in conformity with accounting principles generally accepted in the United States of America requires management to make certain estimates and assumptions that affect the reported amounts of assets and liabilities and disclosure of contingent assets and liabilities at the date of the financial statements and the reported amounts of increases and decreases in net assets from operations during the reporting period. Actual results could differ from those estimates.
2. SIGNIFICANT ACCOUNTING POLICIES
(a) Investment Valuation–Securities traded on any recognized U.S. or non-U.S. exchange or on NASDAQ, Inc. are valued at the last sale price or official closing price on the exchange or system on which they are principally traded. Events occuring after the close of trading on non-U.S. exchanges may result in adjustments to the valuation of foreign securities to more accurately reflect their fair value as of the close of regular trading on the New York Stock Exchange. The Fund may rely on an independent fair valuation service in adjusting the valuation of foreign securities. Unlisted equity securities are valued at the last quoted sale price or, if no sale price is available, at the mean between the most recently quoted bid and asked prices. Fixed income securities are valued at the mean between the bid and asked prices on the basis of prices supplied by independent pricing services, which reflect broker/dealer supplied valuations and electronic data processing techniques. Exchange-traded options and futures contracts are valued at the last sale price in the market where they are principally traded. If no sale has occurred, the mean between the most recently quoted bid and asked prices is used. Securities for which market quotations are not readily available are valued at fair value as determined by management and approved in good faith by the Board of Directors. Short-term securities with 60 days or less remaining to maturity are valued using the amortized cost method, which approximates current market value.
(b) Security Transactions–Security transactions are recorded as of the date that the securities are purchased or sold (trade date). Realized gains and losses on sales of portfolio securities are calculated using the identified-cost method. Realized and unrealized gains (losses) are allocated to each class of shares based upon the relative proportion of net assets at the beginning of the day.
36
Notes to Financial Statements (continued)
(c) Investment Income–Dividend income is recorded on the ex-dividend date. Interest income is recorded on the accrual basis. Discounts are accreted and premiums are amortized using the effective interest method. Investment income is allocated to each class of shares based upon the relative proportion of net assets at the beginning of the day.
(d) Federal Taxes–It is the policy of the Fund to meet the requirements of Subchapter M of the Internal Revenue Code applicable to regulated investment companies and to distribute substantially all taxable income and capital gains to its shareholders. Therefore, no Federal income tax provision is required.
(e) Expenses–Expenses, excluding class specific-expenses, are allocated to each class of shares based upon the relative proportion of net assets at the beginning of the day. Class A, B, C, and P shares bear their class-specific share of all expenses and fees relating to the Fund's 12b-1 Distribution Plan.
(f) Foreign Transactions–The books and records of the Fund are maintained in U.S. dollars and transactions denominated in foreign currencies are recorded in the Fund's records at the rate prevailing when earned or recorded. Asset and liability accounts that are denominated in foreign currencies are adjusted to reflect current exchange rates. The resultant exchange gains and losses are included as Net realized gain on investments, credit default swap agreements and foreign currency related transactions on the Statement of Operations. The Fund does not isolate that portion of the results of operations arising as a result of changes in the foreign exchange rates from the changes in market prices of the securities.
(g) Securities Lending–The Fund may lend its securities to member banks of the Federal Reserve System and to registered broker/dealers approved by the Fund. The loans are collateralized at all times by cash and/or U.S. Government securities in an amount at least equal to 102% of the market value of domestic securities loaned (105% in the case of foreign securities loaned) as determined at the close of business on the preceding business day. The dividend and interest income earned on the securities loaned is accounted for in the same manner as other dividend and interest income. Lending portfolio securities could result in a loss or delay in recovering the Fund's securities if the borrower defaults. As of December 31, 2006, the value of securities loaned was $833,840,819. These loans are collateralized by cash of $850,491,617, which is invested in a restricted money market account. State Street Bank & Trust Company ("SSB") received fees of $516,528 for the year ended December 31, 2006, which are netted against Securities lending income on the Statement of Operations.
(h) Repurchase Agreements–The Fund may enter into repurchase agreements with respect to securities. A repurchase agreement is a transaction in which the Fund acquires a security and simultaneously commits to resell that security to the seller (a bank or securities dealer) at an agreed-upon price on an agreed-upon date. The Fund requires at all times that the repurchase agreement be collateralized by cash, or by securities of the U.S. Government, its agencies, its instrumentalities, or U.S. Government sponsored enterprises having a value equal to, or in excess of, the value of the repurchase agreement (including accrued interest). If the seller of the agreement defaults on its obligation to repurchase the underlying securities at a time when the value of those securities has dec lined, the Fund may incur a loss upon disposition of the securities.
(i) Structured Securities–The Fund may invest in structured securities. Structured securities are a type of derivative security whose value is determined by reference to changes in the value of specific underlying securities, currencies, interest rates, commodities, indices, credit default swaps, or other indicators (the "Reference"), or to relative changes in two or more
37
Notes to Financial Statements (continued)
References. The interest rate or principal amount payable upon maturity or redemption may be increased (decreased) depending upon changes in the applicable Reference or certain specified events. Structured securities may be positively or negatively indexed with the result that the appreciation of the Reference may produce an increase (decrease) in the interest rate or the value of the security at maturity.
(j) When-Issued or Forward Transactions–The Fund may purchase portfolio securities on a when-issued or forward basis. When-issued, forward transactions or to-be-announced ("TBA") transactions involve a commitment by the Fund to purchase securities, with payment and delivery ("settlement") to take place in the future, in order to secure what is considered to be an advantageous price or yield at the time of entering into the transaction. During the period between purchase and settlement, the value of the securities will fluctuate and assets consisting of cash and/or marketable securities (normally short-term U.S. Government or U.S. Government sponsored enterprise securities) marked to market daily in an amount sufficient to make payment at settlement will be segregated at a Fund' s custodian in order to pay for the commitment. At the time the Fund makes the commitment to purchase a security on a when-issued basis, it will record the transaction and reflect the liability for the purchase and value of the security in determining its net asset value. The Fund, generally, has the ability to close out a purchase obligation on or before the settlement date rather than take delivery of the security. Under no circumstances will settlement for such securities take place more than 120 days after the purchase date.
(k) Credit Default Swaps—The Fund may enter into credit default swap contracts ("swaps") for investment purposes to hedge credit risk and also for speculative purposes.
As a seller in the credit default swap contract, the Fund is required to pay the notional amount or other agreed-upon value of a referenced debt obligation to the counterparty in the event of a default by a third party, such as a U.S. or foreign corporate issuer, on the referenced debt obligation. In return, the Fund would receive from the counterparty a periodic stream of payments over the term of the contract provided that no event of default has occurred. If no default occurs, the Fund would keep the stream of payments and would have no payment obligations. Such periodic payments are accrued daily and recorded as a realized gain.
The Fund may also purchase credit default swap contracts in order to hedge against the risk of default of debt securities held, in which case the Fund would function as the counterparty referenced in the preceding paragraph. As a purchaser of a credit default swap contract, the Fund would receive the notional amount or other agreed upon value of a referenced debt obligation from the counterparty in the event of default by a third party, such as a U.S. or foreign corporate issuer on the referenced obligation. In return, the Fund would make periodic payments to the counterparty over the term of the contract provided no event of default has occurred. Such periodic payments are accrued daily and recorded as a realized loss.
Swaps are marked to market daily based upon quotations from counterparties, brokers or market makers and the change in value, if any, is recorded as an unrealized appreciation or depreciation. For a credit default swap sold by the Fund, payment of the agreed upon amount made by the Fund in the event of default of the referenced debt obligation is recorded as the cost of the referenced debt obligation purchased/received. For a credit default swap purchased by the fund, the agreed upon amount received by the Fund in the event of default of the referenced debt obligation is recorded as proceeds from sale/delivery
38
Notes to Financial Statements (continued)
of the referenced debt obligation and the resulting gain or loss realized on the referenced debt obligation is recorded as such by the Fund.
Entering into swaps involves, to varying degrees, elements of credit, market and documentation risk. Such risks involve the possibility that there will be no liquid market for these agreements, that the counterparty to the agreements may default on its obligation to perform or disagree as to the meaning of the contractual terms in the agreements, and that there may be unfavorable changes in net interest rates.
3. MANAGEMENT FEE AND OTHER TRANSACTIONS WITH AFFILIATES
Management Fee
The Fund has a management agreement with Lord, Abbett & Co. LLC ("Lord Abbett") pursuant to which Lord Abbett supplies the Fund with investment management services and executive and other personnel, pays the remuneration of officers, provides office space and pays for ordinary and necessary office and clerical expenses relating to research and statistical work and supervision of the Fund's investment portfolio.
The management fee is based on the Fund's average daily net assets at the following annual rates:
| First $500 million | .50 | % | |||||
| Next $9.5 billion | .45 | % | |||||
| Over $10 billion | .40 | % | |||||
For the fiscal year ended December 31, 2006, the effective management fee paid to Lord Abbett was at a rate of .45% of the Fund's average daily net assets.
Lord Abbett provides certain administrative services to the Fund pursuant to an Administrative Services Agreement at an annual rate of .04% of the Fund's average daily net assets.
The Fund, along with certain other funds managed by Lord Abbett (the "Underlying Funds") has entered into a Servicing Arrangement with Lord Abbett Balanced Strategy Fund of Lord Abbett Investment Trust (the "Balanced Strategy Fund"), pursuant to which each Underlying Fund pays a portion of the expenses (excluding management fees and distribution and service fees) of Balanced Strategy Fund in proportion to the average daily value of Underlying Fund shares owned by Balanced Strategy Fund. Amounts paid pursuant to the Servicing Arrangement are included in Subsidy expense on the Fund's Statement of Operations and Payable to affiliate on the Fund's Statement of Assets and Liabilities.
12b-1 Distribution Plan
The Fund has adopted a distribution plan with respect to Class A, B, C and P shares pursuant to Rule 12b-1 under the Act, which provides for the payment of ongoing distribution and service fees to Lord Abbett Distributor LLC ("Distributor"), an affiliate of Lord Abbett. The fees are accrued daily at annual rates based upon average daily net assets as follows:
| Fee | Class A | Class B | Class C | Class P | |||||||||||||||
| Service | .25 | %(1) | .25 | % | .25 | % | .20 | % | |||||||||||
| Distribution | .10 | %(2) | .75 | % | .75 | % | .25 | % | |||||||||||
(1) Annual service fee on shares sold prior to June 1, 1990 is .15% of the average daily net asset value.
(2) The amount of CDSC collected by the Fund for the year ended December 31, 2006 was $18,138.
Class Y does not have a distribution plan.
39
Notes to Financial Statements (continued)
Commissions
Distributor received the following commissions on sales of shares of the Fund, after concessions were paid to authorized dealers, for the fiscal year ended December 31, 2006:
| Distributor Commissions | Dealers' Concessions | ||||||
| $ | 1,776,611 | $ | 9,005,513 | ||||
Distributor received CDSCs of $4,526 and $50,803 for Class A and Class C shares, respectively, for the fiscal year ended December 31, 2006.
Two Directors and certain of the Fund's officers have an interest in Lord Abbett.
4. DISTRIBUTIONS AND CAPITAL LOSS CARRYFORWARD
Dividends from net investment income, if any, are declared and paid monthly. Taxable net realized gains from investment transactions, reduced by capital loss carryforwards, if any, are declared and distributed to shareholders at least annually. The capital loss carryforward amount, if any, is available to offset future net capital gains. Dividends and distributions to shareholders are recorded on the ex-dividend date. The amount of dividends and distributions from net investment income and net realized capital gains are determined in accordance with Federal income tax regulations which may differ from accounting principles generally accepted in the United States of America. These book/tax differences are either considered temporary or permanent in nature. To the extent these differences are permanent in nature, such amounts are reclassified within the components of net assets based on their federal tax basis treatment; temporary differences do not require reclassification. Dividends and distributions, which exceed earnings and profits for tax purposes, are reported as a tax return of capital.
The tax character of distributions paid during the fiscal years ended December 31, 2006 and 2005 are as follows:
| 12/31/2006 | 12/31/2005 | ||||||||||
| Distributions paid from: | |||||||||||
| Ordinary income | $ | 501,509,333 | $ | 541,345,754 | |||||||
| Total distributions paid | $ | 501,509,333 | $ | 541,345,754 | |||||||
As of December 31, 2006, the components of accumulated losses on a tax-basis are as follows:
| Capital loss carryforwards* | $ | (435,840,141 | ) | ||||
| Temporary differences | (1,250,086 | ) | |||||
| Unrealized gains – net | 188,665,182 | ||||||
| Total accumulated losses – net | $ | (248,425,045 | ) | ||||
* As of December 31, 2006, the capital loss carryforwards, along with the related expiration dates, are as follows:
| 2009 | 2010 | Total | |||||||||
| $ | 132,654,329 | $ | 303,185,812 | $ | 435,840,141 | ||||||
40
Notes to Financial Statements (continued)
As of December 31, 2006, the aggregate unrealized security gains and losses based on cost for U.S. Federal income tax purposes are as follows:
| Tax cost | $ | 8,302,523,393 | |||||
| Gross unrealized gain | 310,600,772 | ||||||
| Gross unrealized loss | (121,835,319 | ) | |||||
| Net unrealized security gain | $ | 188,765,453 | |||||
The difference between book-basis and tax-basis unrealized gains (losses) is primarily attributable to the tax treatment of amortization and certain securities.
Permanent items identified during the year ended December 31, 2006 have been reclassified among the components of net assets based on their tax-basis treatment as follows:
| Distributions in Excess of Net Investment Income | Accumulated Net Realized Loss | Paid-in Capital | |||||||||
| $ | 77,101,436 | $ | (31,214,318 | ) | $ | (45,887,118 | ) | ||||
The permanent differences are primarily attributable to the tax treatment of amortization, certain securities, certain distributions, and paydown gains and losses.
5. PORTFOLIO SECURITIES TRANSACTIONS
Purchases and sales of investment securities (excluding short-term investments) for the fiscal year ended December 31, 2006 are as follows:
| U.S. Government Purchases* | Non-U.S. Government Purchases | U.S. Government Sales* | Non-U.S. Government Sales | ||||||||||||
| $ | 546,646,480 | $ | 1,923,548,383 | $ | 483,894,225 | $ | 2,466,140,971 | ||||||||
* Includes U.S. Government sponsored enterprises securities
6. DIRECTORS' REMUNERATION
The Fund's officers and the two Directors who are associated with Lord Abbett do not receive any compensation from the Fund for serving in such capacities. Outside Directors' fees are allocated among all Lord Abbett-sponsored funds based on the net assets of each fund. There is an equity based plan available to all outside Directors under which outside Directors must defer receipt of a portion of, and may elect to defer receipt of an additional portion of Directors' fees. The deferred amounts are treated as though equivalent dollar amounts have been invested proportionately in the funds. Such amounts and earnings accrued thereon are included in Directors' fees on the Statement of Operations and in Directors' fees payable on the Statement of Assets and Liabilities and are not deductible for U.S. Federal income tax purposes until such amounts are paid.
7. EXPENSE REDUCTIONS
The Fund has entered into arrangements with its transfer agent and custodian, whereby credits realized as a result of uninvested cash balances are used to reduce a portion of the Fund's expenses.
41
Notes to Financial Statements (continued)
8. LINE OF CREDIT
The Fund, along with certain other funds managed by Lord Abbett, has available a $250,000,000 unsecured revolving credit facility ("Facility") from a consortium of banks, to be used for temporary or emergency purposes as an additional source of liquidity to fund redemptions of investor shares. Any borrowings under this Facility will bear interest at current market rates as defined in the agreement. The fee for this Facility is at an annual rate of .08%. As of December 31, 2006, there were no loans outstanding pursuant to this Facility nor was the Facility utilized at any time during the fiscal year ended December 31, 2006.
9. CUSTODIAN AND ACCOUNTING AGENT
State Street Bank & Trust Company ("SSB") is the Fund's custodian and accounting agent. SSB performs custodial, accounting and recordkeeping functions relating to portfolio transactions and calculating the Fund's NAV.
10. INVESTMENT RISKS
The Fund is subject to the general risks and considerations associated with investing in debt securities. The value of an investment will change as interest rates fluctuate and in response to market movements. When interest rates rise, the prices of debt securities are likely to decline; when rates fall, such prices tend to rise. Longer-term securities are usually more sensitive to interest rate changes. There is also the risk that an issuer of a debt security will fail to make timely payments of principal or interest to the Fund, a risk that is greater with high yield securities (sometimes called "lower-rated debt securities" or "junk bonds") in which the Fund may invest. Some issuers, particularly of high yield securities, may default as to principal and/or interest payments after the Fund purchases its securities. A default, or concerns in the market about an increase in risk of default, may result in losses to the Fund. High yield bonds are subject to greater price fluctuations, as well as additional risks.
The mortgage-related securities in which the Fund may invest may be particularly sensitive to changes in prevailing interest rates. When interest rates are declining, the value of these securities with prepayment features may not increase as much as other fixed income securities. Early principal repayment may deprive the Fund of income payments above current market rates. The prepayment rate also will affect the price and volatility of a mortgage-related security. Some of these securities may be those of such Government sponsored enterprises as Federal Home Loan Mortgage Corporation and Federal National Mortgage Association. Such securities are guaranteed with respect to the timely payment of interest and principal by the particular Government sponsored enterprise involved, not by the U.S. Government.
The Fund may invest up to 5% of its net assets in structured securities. The Fund typically may use these securities as a substitute for taking a position in the underlying asset and/or as part of a strategy designed to reduce exposure to other risk, such as interest rate or currency risk. Structured securities may present additional risks that are different from those associated with a direct investment in fixed-income or equity securities; they may be volatile, less liquid and more difficult to price accurately and subject to additional credit risks. Changes in the value of structured securities may not correlate perfectly with the underlying asset, rate or index. The Fund that invests in structured securities could lose more than the principal amount invested.
42
Notes to Financial Statements (continued)
The Fund may invest up to 20% of its net assets in equity securities which may subject it to the general risks and considerations associated with investing in equity securities. The value of an investment will fluctuate in response to movements in the stock market in general and to the changing prospects of individual companies in which the Fund invests.
The Fund may invest up to 20% of its net assets in foreign securities which may present market liquidity, currency, political, information, and other risks.
Swap contracts are bi-lateral agreements between the Fund and its counterparty, each party is exposed to the risk of default by the other. In addition, they may involve a small investment of cash compared to the risk assumed with the result that small changes may produce disproportionate and substantial gains or losses to the Fund.
These factors can affect the Fund's performance.
11. SUMMARY OF CAPITAL TRANSACTIONS
Transactions in shares of capital stock are as follows:
| Year Ended December 31, 2006 | Year Ended December 31, 2005 | ||||||||||||||||||
| Class A Shares | Shares | Amount | Shares | Amount | |||||||||||||||
| Shares sold | 74,889,797 | $ | 587,199,641 | 103,259,218 | $ | 819,704,525 | |||||||||||||
| Reinvestment of distributions | 33,202,530 | 259,415,299 | 34,107,371 | 269,758,179 | |||||||||||||||
| Shares reacquired | (135,487,318 | ) | (1,060,719,552 | ) | (141,074,199 | ) | (1,115,061,375 | ) | |||||||||||
| Decrease | (27,394,991 | ) | $ | (214,104,612 | ) | (3,707,610 | ) | $ | (25,598,671 | ) | |||||||||
| Class B Shares | |||||||||||||||||||
| Shares sold | 8,089,435 | $ | 63,456,194 | 12,056,362 | $ | 95,866,400 | |||||||||||||
| Reinvestment of distributions | 6,793,381 | 53,144,149 | 7,695,860 | 60,953,657 | |||||||||||||||
| Shares reacquired | (45,548,794 | ) | (356,941,220 | ) | (50,763,239 | ) | (402,099,341 | ) | |||||||||||
| Decrease | (30,665,978 | ) | $ | (240,340,877 | ) | (31,011,017 | ) | $ | (245,279,284 | ) | |||||||||
| Class C Shares | |||||||||||||||||||
| Shares sold | 18,567,011 | $ | 145,783,503 | 26,173,200 | $ | 208,457,988 | |||||||||||||
| Reinvestment of distributions | 5,628,055 | 44,055,090 | 6,274,518 | 49,726,801 | |||||||||||||||
| Shares reacquired | (43,012,082 | ) | (337,419,233 | ) | (57,703,905 | ) | (456,751,182 | ) | |||||||||||
| Decrease | (18,817,016 | ) | $ | (147,580,640 | ) | (25,256,187 | ) | $ | (198,566,393 | ) | |||||||||
| Class P Shares | |||||||||||||||||||
| Shares sold | 3,200,014 | $ | 25,473,754 | 7,799,188 | $ | 62,802,730 | |||||||||||||
| Reinvestment of distributions | 777,573 | 6,170,393 | 759,442 | 6,086,105 | |||||||||||||||
| Shares reacquired | (7,880,372 | ) | (62,747,608 | ) | (5,169,067 | ) | (41,599,722 | ) | |||||||||||
| Increase (decrease) | (3,902,785 | ) | $ | (31,103,461 | ) | 3,389,563 | $ | 27,289,113 | |||||||||||
| Class Y Shares | |||||||||||||||||||
| Shares sold | 2,106,797 | $ | 16,626,457 | 2,511,586 | $ | 19,826,590 | |||||||||||||
| Reinvestment of distributions | 2,676,012 | 20,843,783 | 2,463,768 | 19,427,263 | |||||||||||||||
| Shares reacquired | (1,152,083 | ) | (8,995,938 | ) | (593,696 | ) | (4,676,532 | ) | |||||||||||
| Increase | 3,630,726 | $ | 28,474,302 | 4,381,658 | $ | 34,577,321 | |||||||||||||
43
Notes to Financial Statements (concluded)
12. RECENT ACCOUNTING PRONOUNCEMENTS
In July 2006, the Financial Accounting Standards Board (FASB) issued Interpretation 48, Accounting for Uncertainty in Income Taxes – an interpretation of FASB Statement 109 (FIN 48). FIN 48 clarifies the accounting for income taxes by prescribing the minimum recognition threshold a tax position must meet before being recognized in the financial statements. The Fund will adopt FIN 48 no later than June 29, 2007 and the impact to the Fund's financial statements, if any, is currently being assessed.
In September 2006, Statement of Financial Accounting Standards No.157, Fair Value Measurements (SFAS 157), was issued and is effective for fiscal years beginning after November 15, 2007. SFAS 157 defines fair value, establishes a framework for measuring fair value and expands disclosures about fair value measurements. Management is currently evaluating the impact the adoption of SFAS 157 will have on the Fund's financial statement disclosures.
44
Report of Independent Registered Public Accounting Firm
The Board of Directors and Shareholders,
Lord Abbett Bond-Debenture Fund, Inc.:
We have audited the accompanying statement of assets and liabilities, including the schedule of investments, of Lord Abbett Bond-Debenture Fund, Inc. (the "Fund") as of December 31, 2006, and the related statement of operations for the year then ended, the statements of changes in net assets for each of the two years in the period then ended, and the financial highlights for each of the five years in the period then ended. These financial statements and financial highlights are the responsibility of the Fund's management. Our responsibility is to express an opinion on these financial statements and financial highlights based on our audits.
We conducted our audits in accordance with standards of the Public Company Accounting Oversight Board (United States). Those standards require that we plan and perform the audit to obtain reasonable assurance about whether the financial statements and financial highlights are free of material misstatement. The Fund is not required to have, nor were we engaged to perform, an audit of its internal control over financial reporting. Our audits included consideration of internal control over financial reporting as a basis for designing audit procedures that are appropriate in the circumstances, but not for the purpose of expressing an opinion on the effectiveness of the Fund's internal control over financial reporting. Accordingly, we express no such opinion. An audit also includes examining, on a test basis, evidence supporting the amounts and disclosures in the financial statements, assessing the accounting principles used and significant estim ates made by management, as well as evaluating the overall financial statement presentation. Our procedures included confirmation of securities owned as of December 31, 2006 by correspondence with the custodian and brokers; where replies were not received from brokers, we performed other auditing procedures. We believe that our audits provide a reasonable basis for our opinion.
In our opinion, the financial statements and financial highlights referred to above present fairly, in all material respects, the financial position of Lord Abbett Bond-Debenture Fund, Inc. as of December 31, 2006, the results of its operations for the year then ended, the changes in its net assets for each of the two years in the period then ended, and the financial highlights for each of the five years in the period then ended, in conformity with accounting principles generally accepted in the United States of America.
Deloitte & Touche LLP
New York, New York
February 26, 2007
45
Supplemental Proxy Information (unaudited)
A meeting of the Fund's shareholders was held on December 18, 2006. The meeting was held for the purpose of approving the election of the nine (9) Directors:
• E. Thayer Bigelow
• William H.T. Bush
• Robert B. Calhoun, Jr.
• Robert S. Dow
• Daria L. Foster
• Julie A. Hill
• Franklin W. Hobbs
• Thomas J. Neff
• James L.L. Tullis
The results of the proxy solicitation on the preceding matter were as follows:
| Matter | Votes For | Votes Against | Votes Withheld | Abstentions | |||||||||||||||
| E. Thayer Bigelow | 855,499,728.302 | 5,379,353.616 | – | – | |||||||||||||||
| William H.T. Bush | 855,519,859.105 | 5,359,222.813 | – | – | |||||||||||||||
| Robert B. Calhoun, Jr. | 855,805,070.715 | 5,074,011.203 | – | – | |||||||||||||||
| Robert S. Dow | 855,751,578.103 | 5,127,503.815 | – | – | |||||||||||||||
| Daria L. Foster | 855,767,654.326 | 5,111,427.592 | – | – | |||||||||||||||
| Julie A. Hill | 855,694,278.034 | 5,187,803.884 | – | – | |||||||||||||||
| Franklin W. Hobbs | 855,761,195.831 | 5,117,886.087 | – | – | |||||||||||||||
| Thomas J. Neff | 855,704,264.941 | 5,174,816.977 | – | – | |||||||||||||||
| James L.L. Tullis | 855,780,943.483 | 5,098,138.435 | – | – | |||||||||||||||
46
Basic Information About Management
The Board of Directors (the "Board") is responsible for the management of the business and affairs of the Fund in accordance with the laws of the State of Maryland. The Board appoints officers who are responsible for the day-to-day operations of the Fund and who execute policies authorized by the Board. The Board also approves an investment adviser to the Fund and continues to monitor the cost and quality of the services provided by the investment adviser, and annually considers whether to renew the contract with the adviser. Generally, each Director holds office until his/her successor is elected and qualified or until his/her earlier resignation or removal, as provided in the Fund's organizational documents.
Lord, Abbett & Co. LLC ("Lord Abbett"), a Delaware limited liability company, is the Fund's investment adviser.
Interested Directors
The following Directors are Partners of Lord Abbett and are "interested persons" of the Fund as defined in the Act. Mr. Dow and Ms. Foster are officers, directors, or trustees of each of the fourteen Lord Abbett-sponsored funds, which consist of 55 portfolios or series.
| Name, Address and Year of Birth | Current Position Length of Service with Fund | Principal Occupation During Past Five Years | Other Directorships | ||||||||||||
| Robert S. Dow Lord, Abbett & Co. LLC 90 Hudson Street Jersey City, NJ 07302 (1945) | Director since 1989; Chairman since 1996 | Managing Partner and Chief Executive Officer of Lord Abbett since 1996. | N/A | ||||||||||||
| Daria L. Foster Lord, Abbett & Co. LLC 90 Hudson Street Jersey City, NJ 07302 (1954) | Director since 2006 | Partner and Director of Marketing and Client Service of Lord Abbett since 1990. | N/A | ||||||||||||
Independent Directors
The following independent or outside Directors are also directors or trustees of each of the fourteen Lord Abbett-sponsored funds, which consist of 55 portfolios or series.
| Name, Address and Year of Birth | Current Position Length of Service with Fund | Principal Occupation During Past Five Years | Other Directorships | ||||||||||||
| E. Thayer Bigelow Lord, Abbett & Co. LLC c/o Legal Dept. 90 Hudson Street Jersey City, NJ 07302 (1941) | Director since 1994 | Managing General Partner, Bigelow Media, LLC (since 2000); Senior Adviser, Time Warner Inc. (1998 - 2000); Acting Chief Executive Officer of Courtroom Television Network (1997 – 1998); President and Chief Executive Officer of Time Warner Cable Programming, Inc. (1991 – 1997). | Currently serves as director of Crane Co. and Huttig Building Products Inc. | ||||||||||||
47
Basic Information About Management (continued)
| Name, Address and Year of Birth | Current Position Length of Service with Fund | Principal Occupation During Past Five Years | Other Directorships | ||||||||||||
| William H.T. Bush Lord, Abbett & Co. LLC c/o Legal Dept. 90 Hudson Street Jersey City, NJ 07302 (1938) | Director since 1998 | Co-founder and Chairman of the Board of the financial advisory firm of Bush-O'Donnell & Company (since 1986). | Currently serves as director of WellPoint, Inc. (since 2002). | ||||||||||||
| Robert B. Calhoun, Jr. Lord, Abbett & Co. LLC c/o Legal Dept. 90 Hudson Street Jersey City, NJ 07302 (1942) | Director since 1998 | Managing Director of Monitor Clipper Partners (since 1997) and President of Clipper Asset Management Corp. (since 1991), both private equity investment funds. | Currently serves as director of Avondale, Inc. and Interstate Bakeries Corp. | ||||||||||||
| Julie A. Hill Lord, Abbett & Co. LLC c/o Legal Dept. 90 Hudson Street Jersey City, NJ 07302 (1946) | Director since 2004 | Owner and CEO of The Hill Company, a business consulting firm (since 1998); Founder, President and Owner of the Hiram-Hill and Hillsdale Development Company, a residential real estate development firm (1998 - 2000). | Currently serves as director of WellPoint, Inc.; Resources Connection Inc.; Holcim (U.S.) Inc. (a subsidiary of Holcim Ltd.); and Lend Lease Corporation Limited. | ||||||||||||
| Franklin W. Hobbs Lord, Abbett & Co. LLC c/o Legal Dept. 90 Hudson Street Jersey City, NJ 07302 (1947) | Director since 2000 | Advisor of One Equity Partners, a private equity firm (since 2004); Chief Executive Officer of Houlihan Lokey Howard & Zukin, an investment bank (2002 - 2003); Chairman of Warburg Dillon Read, an investment bank (1999 - 2001); Global Head of Corporate Finance of SBC Warburg Dillon Read (1997 - 1999); Chief Executive Officer of Dillon, Read & Co. (1994 - 1997). | Currently serves as director of Molson Coors Brewing Company. | ||||||||||||
| Thomas J. Neff Lord, Abbett & Co. LLC c/o Legal Dept. 90 Hudson Street Jersey City, NJ 07302 (1937) | Director since 1982 | Chairman of Spencer Stuart (U.S.), an executive search consulting firm (since 1996); President of Spencer Stuart (1979-1996). | Currently serves as director of Ace, Ltd. (since 1997) and Hewitt Associates, Inc. | ||||||||||||
| James L.L. Tullis Lord, Abbett & Co. LLC c/o Legal Dept. 90 Hudson Street Jersey City, NJ 07302 (1947) | Director since 2006 | CEO of Tullis-Dickerson and Co. Inc, a venture capital management firm (since 1990). | Currently serves as director of Crane Co. (since 1998) and Viacell Inc. (since 2002). | ||||||||||||
48
Basic Information About Management (continued)
Officers
None of the officers listed below have received compensation from the Fund. All the officers of the Fund may also be officers of the other Lord Abbett-sponsored funds and maintain offices at 90 Hudson Street, Jersey City, NJ 07302.
| Name and Year of Birth | Current Position with Fund | Length of Service of Current Position | Principal Occupation During Past Five Years | ||||||||||||
| Robert S. Dow (1945) | Chief Executive Officer and Chairman | Elected in 1996 | Managing Partner and Chief Executive Officer of Lord Abbett (since 1996). | ||||||||||||
| Daria L. Foster (1954) | President | Elected in 2006 | Partner and Director of Marketing and Client Service of Lord Abbett (since 1990). | ||||||||||||
| Christopher J. Towle (1957) | Executive Vice President | Elected in 1995 | Partner and Investment Manager, joined Lord Abbett in 1987. | ||||||||||||
| James Bernaiche (1956) | Chief Compliance Officer | Elected in 2004 | Chief Compliance Officer, joined Lord Abbett in 2001. | ||||||||||||
| Joan A. Binstock (1954) | Chief Financial Officer and Vice President | Elected in 1999 | Partner and Chief Operations Officer, joined Lord Abbett in 1999. | ||||||||||||
| John K. Forst (1960) | Vice President and Assistant Secretary | Elected in 2005 | Deputy General Counsel, joined Lord Abbett in 2004; Managing Director and Associate General Counsel at New York Life Investment Management LLC (2002-2003); attorney at Dechert LLP (2000-2002). | ||||||||||||
| Michael S. Goldstein (1968) | Vice President | Elected in 1998 | Partner and Investment Manager, joined Lord Abbett in 1997. | ||||||||||||
| Ellen G. Itskovitz (1957) | Vice President | Elected in 2001 | Partner and Senior Research Analyst, joined Lord Abbett in 1998. | ||||||||||||
| Lawrence H. Kaplan (1957) | Vice President and Secretary | Elected in 1997 | Partner and General Counsel, joined Lord Abbett in 1997. | ||||||||||||
| Maren Lindstrom (1962) | Vice President | Elected in 2000 | Partner and Investment Manager, joined Lord Abbett in 2000. | ||||||||||||
| Robert G. Morris (1944) | Vice President | Elected in 1995 | Partner and Chief Investment Officer, joined Lord Abbett in 1991. | ||||||||||||
| A. Edward Oberhaus, III (1959) | Vice President | Elected in 1996 | Partner and Manager of Equity Trading, joined Lord Abbett in 1983. | ||||||||||||
49
Basic Information About Management (concluded)
| Name and Year of Birth | Current Position with Fund | Length of Service of Current Position | Principal Occupation During Past Five Years | ||||||||||||
| Christina T. Simmons (1957) | Vice President and Assistant Secretary | Elected in 2001 | Assistant General Counsel, joined Lord Abbett in 1999. | ||||||||||||
| Bernard J. Grzelak (1971) | Treasurer | Elected in 2003 | Director of Fund Administration, joined Lord Abbett in 2003; formerly Vice President, Lazard Asset Management LLC (2000-2003). | ||||||||||||
Please call 888-522-2388 for a copy of the Statement of Additional Information (SAI), which contains further information about the Fund's Directors. It is available free upon request.
50
Approval of Advisory Contract
At meetings on December 11 and 12, 2006, the Board, including all of the Directors who are not interested persons, considered whether to approve the continuation of the existing management agreement between the Fund and Lord Abbett. In addition to the materials the Board had reviewed throughout the course of the year, the Board received materials relating to the management agreement before the meeting and had the opportunity to ask questions and request further information in connection with its consideration. The Board also took into account its familiarity with Lord Abbett gained through its previous meetings and discussions, and the examination of the portfolio management team conducted by members of the Contracts Committee during the year.
The materials received by the Board included, but were not limited to, (1) information provided by Lipper, Inc. regarding the investment performance of the Fund compared to the investment performance of one or more groups of funds with substantially similar investment objectives (the "performance universe") and to the investment performance of an appropriate securities index (if such an index existed), for various time periods each ending September 30, 2006, (2) information on the effective management fee rates and expense ratios for one or more groups of funds with similar objectives and similar size (the "peer expense group"), (3) sales and redemption information for the Fund, (4) information regarding Lord Abbett's financial condition, (5) an analysis of the relative profitability of the management agreement to Lord Abbett, (6) information regarding the distribution arrangements of the Fund, and (7) information regarding the personnel and other resources devoted by Lord Abbett to managing the Fund.
Investment Management Services Generally. The Board considered the investment management services provided by Lord Abbett to the Fund, including investment research, portfolio management, and trading, and Lord Abbett's commitment to compliance with all relevant legal requirements. The Board also observed that Lord Abbett was solely engaged in the investment management business and accordingly did not experience the conflicts of interest resulting from being engaged in other lines of business. The Board noted that Lord Abbett did not use brokerage commissions to purchase third-party research. The Board considered the investment advisory services provided by Lord Abbett to other clients, the fees charged for the services, and the differences in the nature of the services provided to the Fund and other Lord Abbett Funds, on the one hand, and the services provided to other clients, on the other.
Investment Performance and Compliance. The Board reviewed the Fund's investment performance versus that of the performance universe, both in terms of total return and in terms of other statistical measures. The Board observed that the Fund's performance was in the third quintile of its performance universe for the nine-month period, in the fourth quintile for the one-year, three-year, and five-year periods, and in the second quintile for the ten-year period. The Board also observed that the investment performance was above that of the Lipper High Current Yield Bond Index for the nine-month and ten-year periods and below that of the Index for the one-year, three-year, and five-year periods. The Board also observed that the utility of the comparisons to the performance universe and the Index was limited, because the Bond-Debenture Fund differed from many of the fund s in the performance universe and the Index in some material aspects, particularly in that it required to keep at least 20% of its assets in a combination of investment grade securities, U.S. government securities, and cash. In addition, the Board observed that historically the Lord Abbett Funds, in investing in below investment-grade debt, have invested in relatively higher quality bonds compared to many other funds that invest
51
in below investment-grade debt, and that in recent years such bonds have not performed as well as lower quality bonds.
Lord Abbett's Personnel and Methods. The Board considered the qualifications of the personnel providing investment management services to the Fund, in light of its investment objective and discipline. Among other things, they considered the size, experience, and turnover rates of Lord Abbett's investment management staff, Lord Abbett's investment methodology and philosophy, and Lord Abbett's approach to recruiting, training, and retaining investment management personnel. The Board determined that Lord Abbett had the expertise and resources to manage the Fund effectively.
Nature and Quality of Other Services. The Board considered the nature, quality, costs, and extent of compliance, administrative, and other services performed by Lord Abbett and Lord Abbett Distributor and the nature and extent of Lord Abbett's supervision of third party service providers, including the Fund's transfer agent and custodian.
Expenses. The Board considered the expense ratio of the Fund and the expense ratios of the peer expense groups. It also considered the amount and nature of the fees paid by shareholders. The Board observed that the contractual and actual management and administrative services fees were approximately seven basis points below the median of the peer group. The Board also observed that the total expense ratio of Class A was approximately the same as the median of the peer group, the total expense ratios of Class B and Class C were approximately eight basis points below the median of the peer group, the total expense ratio of Class P was approximately four basis points below the median of the peer group, and the total expense ratio of Class Y was approximately four basis points below the median of the peer group.
Profitability. The Board considered the level of Lord Abbett's profits in managing the Fund, including a review of Lord Abbett's methodology for allocating its costs to its management of the Fund. The Board concluded that the allocation methodology had a reasonable basis and was appropriate. It considered the profits realized by Lord Abbett in connection with the operation of the Fund and whether the amount of profit was fair for the management of the Fund. The Board also considered the profits realized from other businesses of Lord Abbett, which may benefit from or be related to the Fund's business. The Board considered Lord Abbett's profit margins in comparison with available industry data, both accounting for and ignoring marketing and distribution expenses, and how those profit margins could affect Lord Abbett's ability to recruit and retain investment personn el. The Board recognized that Lord Abbett's profitability was a factor in enabling it to attract and retain qualified investment management personnel to provide services to the Fund. The Board noted that Lord Abbett's profitability had increased in recent years, in part due to an increase in assets under management, but concluded that Lord Abbett's profitability overall and as to the Fund was not excessive.
Economies of Scale. The Board considered whether there had been any economies of scale in managing the Fund, whether the Fund had appropriately benefited from any such economies of scale, and whether there was potential for realization of any further economies of scale. The Board concluded that the existing advisory fee schedule, with its breakpoints in the level of the advisory fee, adequately addressed any economies of scale in managing the Fund.
Other Benefits to Lord Abbett. The Board considered the character and amount of fees paid by the Fund and the Fund's shareholders to Lord Abbett and Lord Abbett Distributor for services other than investment advisory services. The Board also considered the revenues and profitability of Lord Abbett's investment advisory business apart from its mutual fund business, and the
52
intangible benefits enjoyed by Lord Abbett by virtue of its relationship with the Fund. The Board observed that Lord Abbett Distributor receives 12b-1 fees from certain of the Lord Abbett Funds as to shares held in accounts for which there is no other broker of record, may retain a portion of the 12b-1 fees from the Funds, and receives a portion of the sales charges on sales and redemptions of some classes of shares. In addition, Lord Abbett accrues certain benefits for its business of providing investment advice to clients other than the Lord Abbett Funds, but that that business also benefits the Funds. The Board also noted that Lord Abbett, as disclosed in the prospectus of the Fund, has entered into revenue sharing arrangements with certain entities that distribute shares of the Fund.
Alternative Arrangements. The Board considered whether, instead of approving continuation of the management agreement, employing one or more alternative arrangements might be in the best interests of the Fund, such as continuing to employ Lord Abbett, but on different terms.
In considering whether to approve the continuation of the management agreement, the Board did not identify any single factor as paramount or controlling. This summary does not discuss in detail all matters considered. After considering all of the relevant factors, the Board unanimously found that continuation of the existing management agreement was in the best interests of the Fund and its shareholders and voted unanimously to approve the continuation of the management agreement.
53
Householding
The Fund has adopted a policy that allows it to send only one copy of the Fund's Prospectus, proxy material, annual report and semiannual report to certain shareholders residing at the same "household." This reduces Fund expenses, which benefits you and other shareholders. If you need additional copies or do not want your mailings to be "householded," please call Lord Abbett at 800-821-5129 or send a written request with your name, the name of your fund or funds, and your account number or numbers to Lord Abbett Family of Funds, P.O. Box 219336, Kansas City, MO 64121.
Proxy Voting Policies, Procedures and Record
A description of the policies and procedures that Lord Abbett uses to vote proxies related to the Fund's portfolio securities, and information on how Lord Abbett voted the Fund's proxies during the 12-month period ended June 30, 2006, are available without charge, upon request, (i) by calling 888-522-2388; (ii) on Lord Abbett's website at www.LordAbbett.com; and (iii) on the Securities and Exchange Commission's ("SEC") website at www.sec.gov.
Shareholder Reports and Quarterly Portfolio Disclosure
The Fund is required to file its complete schedule of portfolio holdings with the SEC for its first and third fiscal quarters on Form N-Q. Copies of the filings are available without charge, upon request on the SEC's website at www.sec.gov and may be available by calling Lord Abbett at 800-821-5129. You can also obtain copies of Form N-Q by (i) visiting the SEC's Public Reference Room in Washington, DC (information on the operation of the Public Reference Room may be obtained by calling 1-800-SEC-0330); (ii) sending your request and duplicating fee to the SEC's Public Reference Room, Washington, DC 20549-0102; or (iii) sending your request electronically to publicinfo@sec.gov.
Tax Information
2.75% of the ordinary income distribution paid by the Fund during fiscal 2006 is qualified dividend income. For corporate shareholders, only 2.75% of the Fund's ordinary income distribution qualified for the dividends received deduction.
Additionally, for foreign shareholders, of the distributions paid by the Fund to shareholders during the fiscal year ended December 31, 2006, $416,831,784 represents interest-related dividends.
54
Lord Abbett Bond-Debenture Fund, Inc.
LABD-2-1206
(2/07)

This report, when not used for the general
information of shareholders of the Fund, is to
be distributed only if preceded or accompanied
by a current fund prospectus.
Lord Abbett mutual fund shares are distributed by
LORD ABBETT DISTRIBUTOR LLC.
Item 2: |
| Code of Ethics. |
|
|
|
(a) |
| In accordance with applicable requirements, the Registrant adopted a Sarbanes-Oxley Code of Ethics on June 19, 2003 that applies to the principal executive officer and senior financial officers of the Registrant (“Code of Ethics”). The Code of Ethics was in effect during the fiscal year ended December 31, 2006 (the “Period”). |
|
|
|
(b) |
| Not applicable. |
|
|
|
(c) |
| The Registrant has not amended the Code of Ethics as described in Form N-CSR during the Period. |
|
|
|
(d) |
| The Registrant has not granted any waiver, including an implicit waiver, from a provision of the Code of Ethics as described in Form N-CSR during the Period. |
|
|
|
(e) |
| Not applicable. |
|
|
|
(f) |
| See Item 12(a)(1) concerning the filing of the Code of Ethics. The Registrant will provide a copy of the Code of Ethics to any person without charge, upon request. To obtain a copy, please call Lord Abbett at 800-821-5129. |
|
|
|
Item 3: |
| Audit Committee Financial Expert. |
|
|
|
|
| The Registrant’s Board of Directors has determined that each of the following independent Directors who are members of the audit committee are audit committee financial experts: E. Thayer Bigelow, Robert B. Calhoun, and Franklin W. Hobbs. Each of these persons is independent within the meaning of Form N-CSR. |
|
|
|
Item 4: |
| Principal Accountant Fees and Services. |
In response to sections (a), (b), (c) and (d) of Item 4, the aggregate fees billed to the Registrant for the fiscal years ended December 31, 2006 and 2005 by the Registrant’s principal accounting firm, Deloitte & Touche LLP, the member firms of Deloitte Touche Tohmatsu and their respective affiliates (collectively, “Deloitte”) were as follows:
| Fiscal year ended: |
| |||||
|
| 2006 |
| 2005 |
| ||
Audit Fees {a} |
| $ | 61,000 |
| $ | 59,000 |
|
Audit-Related Fees {b} |
| 767 |
| 1,123 |
| ||
Total audit and audit-related fees |
| 61,767 |
| 60,123 |
| ||
|
|
|
|
|
| ||
Tax Fees {c} |
| 8,869 |
| 9,177 |
| ||
All Other Fees |
| - 0 - |
| - 0 - |
| ||
Total Fees |
| $ | 70,636 |
| $ | 69,300 |
|
{a} Consists of fees for audits of the Registrant’s annual financial statements.
{b} Consists of the Registrant’s proportionate share of fees for performing certain agreed-upon procedures regarding compliance with the provisions of Rule 17a-7 of the Investment Company Act of 1940 and related Board approved procedures.
{c} Fees for the fiscal year ended December 31, 2006 and 2005 consist of fees for preparing the U.S. Income Tax Return for Regulated Investment Companies, New Jersey Corporation Business Tax Return, New Jersey Annual Report Form, U.S. Return of Excise Tax on Undistributed Income of Investment Companies, IRS Forms 1099-MISC and 1096 Annual Summary and Transmittal of U.S. Information Returns.
(e) (1) Pursuant to Rule 2-01(c) (7) of Regulation S-X, the Registrant’s Audit Committee has adopted pre-approval policies and procedures. Such policies and procedures generally provide that the Audit Committee must pre-approve:
· any audit, audit-related, tax, and other services to be provided to the Lord Abbett Funds, including the Registrant, and
· any audit-related, tax, and other services to be provided to the Registrant’s investment adviser and any entity controlling, controlled by or under common control with the investment adviser that provides ongoing services to one or more Funds comprising the Registrant if the engagement relates directly to operations and financial reporting of a Fund, by the independent auditor to assure that the provision of such services does not impair the auditor’s independence.
The Audit Committee has delegated pre-approval authority to its Chairman, subject to a fee limit of $10,000 per event, and not to exceed $25,000 annually. The Chairman will report any pre-approval decisions to the Audit Committee at its next scheduled meeting. Unless a type of service to be provided by the independent auditor has received general pre-approval, it must be pre-approved by the Audit Committee. Any proposed services exceeding pre-approved cost levels will require specific pre-approval by the Audit Committee.
(e) (2) The Registrant’s Audit Committee has approved 100% of the services described in this Item 4 (b) through (d).
(f) Not applicable.
(g) The aggregate non-audit fees billed by Deloitte for services rendered to the Registrant are shown above in the response to Item 4 (a), (b), (c) and (d) as “All Other Fees”.
The aggregate non-audit fees billed by Deloitte for services rendered to the Registrant’s investment adviser, Lord, Abbett & Co. LLC (“Lord Abbett”), for the fiscal years ended December 31, 2006 and 2005 were:
| Fiscal year ended: |
| |||||
|
| 2006 |
| 2005 |
| ||
All Other Fees {a} |
| $ | 100,000 |
| $ | 105,500 |
|
{a} Consist of fees for Independent Services Auditors’ Report on Controls Placed in Operation and Tests of Operating Effectiveness related to Lord Abbett’s Asset Management Services (“SAS 70 Report”).
The aggregate non-audit fees billed by Deloitte for services rendered to entities under the common control of Lord Abbett (i.e., Lord Abbett Distributor LLC, the Registrant’s principal underwriter) for the fiscal years ended December 31, 2006 and 2005 were:
| Fiscal year ended: |
| |||||
|
| 2006 |
| 2005 |
| ||
All Other Fees |
| $ | - 0 - |
| $ | - 0- |
|
(h) The Registrant’s Audit Committee has considered the provision of non-audit services that were rendered to the Registrant’s investment adviser, and any entity controlling, controlled by or under common control with the investment adviser that provides ongoing services to the Registrant, that were not pre-approved pursuant to Rule 2-01 (c)(7)(ii) of Regulation S-X and has determined that the provision of such services is compatible with maintaining Deloitte’s independence.
Item 5: |
| Audit Committee of Listed Registrants. |
|
|
|
|
| Not applicable. |
Item 6: |
| Schedule of Investments. | |
|
|
| |
|
| Not applicable. | |
|
|
| |
Item 7: |
| Disclosure of Proxy Voting Policies and Procedures for Closed-End Management Investment Companies. | |
|
|
| |
|
| Not applicable. | |
|
|
| |
Item 8: |
| Portfolio Managers of Closed-End Management Investment Companies. | |
|
|
| |
|
| Not applicable. | |
|
|
| |
Item 9: |
| Purchases of Equity Securities by Closed-End Management Investment Company and Affiliated Purchasers. | |
|
|
| |
|
| Not applicable. | |
|
|
| |
Item 10: |
| Submission of Matters to a Vote of Security Holders. | |
|
|
| |
|
| Not applicable. | |
|
|
| |
Item 11: |
| Controls and Procedures. | |
|
|
| |
| (a) |
| Based on their evaluation of the Registrant’s disclosure controls and procedures (as defined in Rule 30a-3(c) under the Investment Company Act of 1940) as of a date within 90 days prior to the filing date of this report, the Chief Executive Officer and Chief Financial Officer of the Registrant have concluded that such disclosure controls and procedures are reasonably designed and effective to ensure that material information relating to the Registrant, including its consolidated subsidiaries, is made known to them by others within those entities. |
|
|
|
|
| (b) |
| There were no significant changes in the Registrant’s internal control over financial reporting (as defined in Rule 30a-3(d) under the Investment Company Act of 1940) that occurred during the second fiscal quarter of the period covered by this report that have materially affected, or are reasonably likely to materially affect, the Registrant’s internal control over financial reporting. |
|
|
| |
Item 12: |
| Exhibits. | |
|
|
| |
| (a)(1) |
| Amendments to Code of Ethics – Not applicable. |
|
|
|
|
| (a)(2) |
| Certification of each principal executive officer and principal financial officer of the Registrant as required by Rule 30a-2 under the Act (17 CFR 270.30a-2) is attached hereto as a part of EX-99.CERT. |
(a)(3) |
| Not applicable. | |
|
|
|
|
| (b) |
| Certification of each principal executive officer and principal financial officer of the Registrant as required by Section 906 of the Sarbanes-Oxley Act of 2002 is attached hereto as a part of EX-99.906CERT. |
SIGNATURES
Pursuant to the requirements of the Securities Exchange Act of 1934 and the Investment Company Act of 1940, the Registrant has duly caused this report to be signed on its behalf by the undersigned, thereunto duly authorized.
LORD ABBETT BOND-DEBENTURE FUND, INC. | |||
|
| ||
|
| ||
|
| /s/ Robert S. Dow |
|
|
| Robert S. Dow | |
|
| Chief Executive Officer and Chairman | |
|
|
| |
|
| /s/ Joan A. Binstock |
|
|
| Joan A. Binstock | |
|
| Chief Financial Officer and Vice President | |
|
| ||
Date: February 26, 2007
Pursuant to the requirements of the Securities Exchange Act of 1934 and the Investment Company Act of 1940, this report has been signed below by the following persons on behalf of the Registrant and in the capacities and on the dates indicated.
LORD ABBETT BOND-DEBENTURE FUND, INC. | |||
|
|
| |
|
|
| |
|
| /s/ Robert S. Dow |
|
|
| Robert S. Dow | |
|
| Chief Executive Officer and Chairman | |
| /s/ Joan A. Binstock |
| |
|
| Joan A. Binstock | |
|
| Chief Financial Officer and Vice President | |
|
|
| |
|
|
| |
Date: February 26, 2007 |
|
| |