UNITED STATES
SECURITIES AND EXCHANGE COMMISSION
Washington, D. C. 20549
FORM 10-K
(Mark One) |
ý | | ANNUAL REPORT PURSUANT TO SECTION 13 OR 15(d) OF THE |
| | SECURITIES EXCHANGE ACT OF 1934 (NO FEE REQUIRED) |
| | |
For the fiscal year ended December 31, 2005 |
| | |
OR |
| | |
o | | TRANSITION REPORT PURSUANT TO SECTION 13 OR 15(d) OF THE |
| | SECURITIES EXCHANGE ACT OF 1934 (NO FEE REQUIRED) |
Commission | | Registrant, State of Incorporation, | | IRS Employer |
File Number | | Address, and Telephone Number | | Identification Number |
| | | | |
1-2893 | | Louisville Gas and Electric Company | | 61-0264150 |
| | (A Kentucky Corporation) | | |
| | 220 West Main Street | | |
| | P. O. Box 32010 | | |
| | Louisville, Kentucky 40232 | | |
| | (502) 627-2000 | | |
| | | | |
1-3464 | | Kentucky Utilities Company | | 61-0247570 |
| | (A Kentucky and Virginia Corporation) | | |
| | One Quality Street | | |
| | Lexington, Kentucky 40507-1428 | | |
| | (859) 255-2100 | | |
| | | | |
| | Securities registered pursuant to section 12(g) of the Act: | | |
Louisville Gas and Electric Company |
5% Cumulative Preferred Stock, $25 Par Value |
$5.875 Cumulative Preferred Stock, Without Par Value |
Auction Rate Series A Preferred Stock, Without Par Value |
|
Kentucky Utilities Company |
none |
Indicate by check mark if the registrant is a well-known seasoned issuer, as defined in Rule 405 of the Securities Act. Yes o No ý
Indicate by check mark if the registrant is not required to file reports pursuant to Section 13 or Section 15(d) of the Act. Yes o No ý
Indicate by check mark whether the registrants (1) have filed all reports required to be filed by Section 13 or 15(d) of the Securities Exchange Act of 1934 during the preceding 12 months (or for such shorter period that the registrants were required to file such reports), and (2) have been subject to such filing requirements for the past 90 days. Yes ý No o
Indicate by check mark if disclosure of delinquent filers pursuant to Item 405 of Regulation S-K is not contained herein, and will not be contained, to the best of registrant’s knowledge, in definitive proxy or information statements incorporated by reference in Part III of this Form 10-K or any amendment to this Form 10-K. ý
Indicate by check mark whether the registrant is a large accelerated filer, an accelerated filer, or a non-accelerated filer. See definition of “accelerated filer and large accelerated filer” in Rule 12-b2 of the Exchange Act. (Check one):
Large accelerated filer o | Accelerated filer o | Non-accelerated filer ý |
Indicate by check mark whether the registrant is a shell company (as defined in Exchange Act Rule 12b-2). Yes o No ý
As of June 30, 2005, the aggregate market value of the common stock of each of Louisville Gas and Electric Company and Kentucky Utilities Company held by non-affiliates was $0. As of February 28, 2006, Louisville Gas and Electric Company had 21,294,223 shares of common stock outstanding, all held by E.ON U.S. LLC. Kentucky Utilities Company had 37,817,878 shares of common stock outstanding, all held by E.ON U.S. LLC.
This combined Form 10-K is separately filed by Louisville Gas and Electric Company and Kentucky Utilities Company. Information contained herein related to any individual registrant is filed by such registrant on its own behalf. Each registrant makes no representation as to information relating to the other registrant.
DOCUMENTS INCORPORATED BY REFERENCE
Not applicable.
INDEX OF ABBREVIATIONS
AEP | | American Electric Power Company, Inc. |
AFUDC | | Allowance for Funds Used During Construction |
AG | | Attorney General of Kentucky |
APBO | | Accumulated Postretirement Benefit Obligation |
ARO | | Asset Retirement Obligation |
CAIR | | Clean Air Interstate Rule |
CAMR | | Clean Air Mercury Rule |
Capital Corp. | | E.ON U.S. Capital Corp. (formerly LG&E Capital Corp.) |
CAVR | | Clean Air Visibility Rule |
Clean Air Act | | The Clean Air Act, as amended in 1990 |
CCN | | Certificate of Public Convenience and Necessity |
CO2 | | Carbon Dioxide |
Company | | LG&E or KU, as applicable |
Companies | | LG&E and KU |
CT | | Combustion Turbines |
CWIP | | Construction Work in Progress |
DOE | | Department of Energy |
DOJ | | Department of Justice |
DSM | | Demand Side Management |
ECAR | | East Central Area Reliability Region |
ECR | | Environmental Cost Recovery |
EEI | | Electric Energy, Inc. |
EITF | | Emerging Issues Task Force Issue |
E.ON | | E.ON AG |
E.ON U.S. | | E.ON U.S. LLC. (formerly LG&E Energy LLC and LG&E Energy Corp.) |
E.ON U.S. Services | | E.ON U.S. Services Inc. (formerly LG&E Energy Services Inc.) |
EPA | | U.S. Environmental Protection Agency |
EPAct 2005 | | Energy Policy Act of 2005 |
ERISA | | Employee Retirement Income Security Act of 1974, as amended |
ESM | | Earnings Sharing Mechanism |
Fidelia | | Fidelia Corporation (an E.ON affiliate) |
FAC | | Fuel Adjustment Clause |
FASB | | Financial Accounting Standards Board |
FERC | | Federal Energy Regulatory Commission |
FGD | | Flue Gas Desulfurization |
FIN | | FASB Interpretation |
FPA | | Federal Power Act |
FGD | | Flue Gas Desulfurization |
FIN | | FASB Interpretation |
FPA | | Federal Power Act |
FSP | | FASB Staff Position |
FT and FT-A | | Firm Transportation |
FTR | | Financial Transmission Right |
GSC | | Gas Supply Clause |
GFA | | Grandfathered Transmission Agreement |
IBEW | | International Brotherhood of Electrical Workers |
IMEA | | Illinois Municipal Electric Agency |
IMPA | | Indiana Municipal Power Agency |
IRC | | Internal Revenue Code of 1986, as amended |
IRP | | Integrated Resource Plan |
ITP | | Independent Transmission Provider |
Kentucky Commission | | Kentucky Public Service Commission |
KIUC | | Kentucky Industrial Utility Consumers, Inc. |
KU | | Kentucky Utilities Company |
KU Energy | | KU Energy Corporation |
KU R | | KU Receivables LLC |
Kv | | Kilovolts |
Kw | | Kilowatts |
Kwh | | Kilowatt hours |
LEM | | LG&E Energy Marketing Inc. |
LG&E | | Louisville Gas and Electric Company |
LG&E Energy | | LG&E Energy LLC (now E.ON U.S. LLC) |
LG&E R | | LG&E Receivables LLC |
LG&E Services | | LG&E Energy Services Inc. (now E.ON U.S. Services Inc.) |
LMP | | Locational Marginal Pricing |
LNG | | Liquefied Natural Gas |
Mcf | | Thousand Cubic Feet |
MGP | | Manufactured Gas Plant |
MISO | | Midwest Independent Transmission System Operator, Inc. |
MMBtu | | Million British thermal units |
Moody’s | | Moody’s Investor Services, Inc. |
Mva | | Megavolt-ampere |
Mw | | Megawatts |
Mwh | | Megawatt hours |
NNS | | No-Notice Service |
NOPR | | Notice of Proposed Rulemaking |
NOx | | Nitrogen Oxide |
OATT | | Open Access Transmission Tariff |
OMU | | Owensboro Municipal Utilities |
OVEC | | Ohio Valley Electric Corporation |
PBR | | Performance-Based Ratemaking |
PJM | | Pennsylvania, New Jersey, Maryland Interconnection |
Powergen | | Powergen Limited (formerly Powergen plc) |
PUHCA 1935 | | Public Utility Holding Company Act of 1935 |
PUHCA 2005 | | Public Utility Holding Company Act of 2005 |
ROE | | Return on Equity |
RTO | | Regional Transmission Organization |
RTOR | | Regional Through and Out Rates |
S&P | | Standard & Poor’s Rating Services |
SCR | | Selective Catalytic Reduction |
SEC | | Securities and Exchange Commission |
SERP | | Supplemental Executive Retirement Plan |
SFAS | | Statement of Financial Accounting Standards |
SIP | | State Implementation Plan |
SMD | | Standard Market Design |
SO2 | | Sulfur Dioxide |
SPP | | Southwest Power Pool, Inc. |
TEMT | | Transmission and Energy Markets Tariff |
Tennessee Gas | | Tennessee Gas Pipeline Company |
Texas Gas | | Texas Gas Transmission LLC |
Trimble County | | LG&E’s Trimble County Unit 1 |
TVA | | Tennessee Valley Authority |
USWA | | United Steelworkers of America |
Utility Operations | | Operations of LG&E and KU |
VDT | | Value Delivery Team Process |
Virginia Commission | | Virginia State Corporation Commission |
Virginia Staff | | Virginia State Corporation Commission Staff |
WNA | | Weather Normalization Adjustment |
PART I
Item 1. Business.
LG&E and KU are each subsidiaries of E.ON U.S. LLC (E.ON U.S.). Prior to December 1, 2005, E.ON U.S. LLC was known as LG&E Energy LLC. Previously, effective December 30, 2003, LG&E Energy LLC had become the successor, by assignment and subsequent merger, to all the assets and liabilities of LG&E Energy Corp. E.ON U.S. is a subsidiary of E.ON AG (E.ON), a German corporation. E.ON acquired LG&E Energy through its July 1, 2002 acquisition of Powergen plc, now Powergen Limited (Powergen), a United Kingdom company and holding company for E.ON UK plc, E.ON’s United Kingdom market unit operating parent. As contemplated in their regulatory filings in connection with the E.ON acquisition, E.ON, Powergen and E.ON U.S. completed an administrative reorganization to move the E.ON U.S. group from an indirect Powergen subsidiary to an indirect E.ON subsidiary. This reorganization was effective in March 2003. In early 2004, E.ON U.S. began direct reporting arrangements to E.ON.
LG&E and KU are now indirect subsidiaries of E.ON. As a result of these acquisitions and otherwise, E.ON and E.ON U.S. anticipate registering as holding companies under PUHCA 2005 and were formerly registered holding companies under PUHCA 1935.
In order to comply with PUHCA 1935, E.ON U.S. Services (formerly LG&E Energy Services), which was formed as a subsidiary service company of E.ON U. S., provides services to affiliated entities, including LG&E and KU, at cost as permitted under PUHCA 1935 and PUHCA 2005.
E.ON, its utility subsidiaries, including LG&E and KU, and certain of its non-utility subsidiaries are subject to certain regulation by the FERC under the FPA, PUHCA 2005 and the EPAct 2005, including with respect to record-keeping and reporting, acquisitions and sales of utility securities and properties, financial matters, and intra-system sales of goods and services. LG&E and KU believe that they have adequate authority (including financing authority) under existing FERC orders and regulations to conduct their business. LG&E and KU will seek additional authorization when necessary.
The utility operations (LG&E and KU) of E.ON U.S. have continued their separate identities as LG&E and KU. The preferred stock and debt securities of LG&E and KU were not affected by these transactions.
1
LOUISVILLE GAS AND ELECTRIC COMPANY
General
LG&E, incorporated in 1913 in Kentucky, is a regulated public utility that supplies natural gas to approximately 321,000 customers and electricity to approximately 394,000 customers in Louisville and adjacent areas in Kentucky. LG&E’s service area covers approximately 700 square miles in 17 counties and has an estimated population of one million. Included in this area is the Fort Knox Military Reservation, to which LG&E transports natural gas and provides electric service, but does not provide any distribution services. LG&E also provides natural gas service in limited additional areas. LG&E’s coal-fired electric generating plants, all equipped with systems to reduce SO2 emissions, produce most of LG&E’s electricity. The remainder is generated by a hydroelectric power plant and combustion turbines. Underground natural gas storage fields help LG&E provide economical and reliable natural gas service to customers. See Item 2, Properties.
Operating Revenues
For the year ended December 31, 2005, 69% of total operating revenues were derived from electric operations and 31% from natural gas operations. Electric and gas operating revenues and the percentages by class of service on a combined basis for this period were as follows:
(in millions) | | Electric | | Gas | | Combined | | % Combined | |
Residential | | $ | 276 | | $ | 265 | | $ | 541 | | 49 | % |
Commercial | | 221 | | 108 | | 329 | | 30 | % |
Industrial | | 128 | | 19 | | 147 | | 13 | % |
Public authorities | | 66 | | 19 | | 85 | | 8 | % |
Total retail | | 691 | | 411 | | 1,102 | | 100 | % |
Wholesale sales | | 259 | | 19 | | 278 | | | |
Gas transported | | — | | 5 | | 5 | | | |
Miscellaneous | | 37 | | 2 | | 39 | | | |
Total | | $ | 987 | | $ | 437 | | $ | 1,424 | | | |
See Note 12 of LG&E’s Notes to Financial Statements under Item 8 for financial information concerning segments of business for the three years ended December 31, 2005.
Electric Operations
The sources of LG&E’s electric operating revenues and the volumes of sales for the three years ended December 31, 2005, were as follows:
(in millions) | | 2005 | | 2004 | | 2003 | |
ELECTRIC OPERATING REVENUES | | | | | | | |
Residential | | $ | 276 | | $ | 241 | | $ | 223 | |
Commercial | | 221 | | 202 | | 188 | |
Industrial | | 128 | | 120 | | 112 | |
Public authorities | | 66 | | 62 | | 58 | |
Total retail | | 691 | | 625 | | 581 | |
Wholesale sales | | 259 | | 185 | | 170 | |
Provision for rate collections (refunds) | | — | | (11 | ) | (1 | ) |
Miscellaneous | | 37 | | 17 | | 18 | |
Total | | $ | 987 | | $ | 816 | | $ | 768 | |
2
(Thousands of Mwh) | | | | | | | |
ELECTRIC SALES | | | | | | | |
Residential | | 4,265 | | 3,923 | | 3,835 | |
Commercial | | 3,682 | | 3,534 | | 3,482 | |
Industrial | | 3,077 | | 3,019 | | 2,936 | |
Public authorities | | 1,268 | | 1,248 | | 1,251 | |
Total retail | | 12,292 | | 11,724 | | 11,504 | |
Wholesale sales | | 8,704 | | 7,819 | | 7,678 | |
Total | | 20,996 | | 19,543 | | 19,182 | |
LG&E set an annual peak load of 2,754 Mw on July 25, 2005, when the temperature reached 98 degrees Fahrenheit in Louisville. This was the highest hourly customer demand in LG&E’s history.
The electric utility business is affected by seasonal weather patterns. As a result, operating revenues (and associated operating expenses) are not generated evenly throughout the year. See LG&E’s Results of Operations under Item 7.
LG&E and KU currently maintain a 12% - 14% reserve margin range. At December 31, 2005, LG&E owned steam and combustion turbine generating facilities with a net summer capability of 3,105 Mw and an 80 Mw nameplate-rated hydroelectric facility on the Ohio River with a net summer capability of 48 Mw. See Item 2, Properties. LG&E also obtains power from other utilities under bulk power purchase and interchange contracts. At December 31, 2005, LG&E’s system net summer capability, including purchases from others and excluding the hydroelectric facility, was 3,259 Mw.
LG&E uses efficient coal-fired boilers, fully equipped with SO2 removal systems, to generate most of its electricity. LG&E’s weighted-average system-wide emission rate for SO2 in 2005 was approximately 0.54 lbs./MMBtu of heat input, with every generating unit below its emission limit established by the Kentucky Division for Air Quality.
LG&E and 11 other electric utilities are participating owners of OVEC, located in Piketon, Ohio. OVEC owns and operates two power plants that burn coal to generate electricity, Kyger Creek Station in Ohio and Clifty Creek Station in Indiana. LG&E owns 5.63% of OVEC’s common stock. Through March 2006, LG&E is entitled to receive 7% of OVEC’s output, and thereafter is entitled to receive 5.63%, representing approximately 124 Mw. In April 2004, OVEC and its shareholders, including LG&E and KU, entered into an Amended and Restated Inter-Company Power Agreement, to be effective beginning March 2006, upon the expiration of the current power contract among the parties. The parties received SEC approval under PUHCA 1935 of the Amended and Restated Inter-Company Power Agreement in February 2005.
LG&E is a member of the MISO, a non-profit independent transmission system operator that serves the electrical transmission needs of much of the Midwest. Membership was obtained when the MISO was formed in 1998 in response to and consistent with federal energy policy initiatives at that time. The MISO began commercial operations in February 2002. As a result, LG&E turned over operational control of its 100 Kv and above transmission facilities, but continues to control and operate the lower voltage transmission system subject to the terms and conditions of the MISO. As a transmission-owning member of the MISO, LG&E incurs costs under the MISO OATT. In April 2005, the MISO implemented its day-ahead real-time market (MISO Day 2), including a congestion management system. At the present time, LG&E is involved in regulatory proceedings at the Kentucky Commission and the FERC seeking authority to exit the MISO. On March 17, 2006, the FERC issued an order conditionally approving the request of LG&E and KU to exit the MISO. For further discussion, see Note 16 of LG&E’s Notes to Financial Statements under Item 8.
3
Gas Operations
The sources of LG&E’s gas operating revenues and the volumes of sales for the three years ended December 31, 2005, were as follows:
(in millions) | | 2005 | | 2004 | | 2003 | |
GAS OPERATING REVENUES | | | | | | | |
Residential | | $ | 265 | | $ | 223 | | $ | 199 | |
Commercial | | 108 | | 89 | | 78 | |
Industrial | | 19 | | 15 | | 14 | |
Public authorities | | 19 | | 15 | | 14 | |
Total retail | | 411 | | 342 | | 305 | |
Wholesale sales | | 19 | | 7 | | 12 | |
Gas transported | | 5 | | 6 | | 6 | |
Miscellaneous | | 2 | | 2 | | 2 | |
Total | | $ | 437 | | $ | 357 | | $ | 325 | |
| | | | | | | |
(Millions of cu. ft.) | | | | | | | |
GAS SALES | | | | | | | |
Residential | | 20,801 | | 21,402 | | 23,192 | |
Commercial | | 9,131 | | 9,144 | | 9,652 | |
Industrial | | 1,711 | | 1,736 | | 1,880 | |
Public authorities | | 1,574 | | 1,646 | | 1,746 | |
Total retail | | 33,217 | | 33,928 | | 36,470 | |
Wholesale sales | | 2,652 | | 1,221 | | 2,119 | |
Gas transported | | 12,549 | | 13,692 | | 13,683 | |
Total | | 48,418 | | 48,841 | | 52,272 | |
The natural gas utility business is affected by seasonal weather patterns. As a result, operating revenues (and associated operating expenses) are not generated evenly throughout the year. While natural gas usage patterns are seasonal, LG&E received approval from the Kentucky Commission for a WNA mechanism. The WNA mechanism adjusts the distribution cost recovery component of the natural gas billings of residential and commercial customers to normal temperatures during the heating season months of November through April, somewhat mitigating the effect of weather extremes. LG&E requested, and the Kentucky Commission approved, an extension of the current WNA mechanism through April 30, 2006. LG&E expects to file for another extension of the WNA before the next heating season begins in November 2006. See LG&E’s Results of Operations under Item 7.
LG&E has five underground natural gas storage fields that help provide economical and reliable natural gas service to ultimate consumers. By using natural gas storage facilities, LG&E avoids the costs associated with typically more expensive pipeline transportation capacity to serve peak winter space-heating loads. LG&E stores natural gas in the summer season for withdrawal in the subsequent winter heating season. Without its storage capacity, LG&E would be forced to buy additional natural gas and pipeline transportation services during the winter months when customer demand increases and when the prices for natural gas supply and transportation services are typically at their highest. Currently, LG&E buys competitively priced natural gas from several large suppliers under contracts of varying duration. LG&E’s underground storage facilities, in combination with its purchasing practices, enable it to offer natural gas sales service at rates generally lower than state and national averages. At December 31, 2005, LG&E had an inventory balance of gas stored underground of approximately 12.1 million Mcf of working gas valued at approximately $124.9 million.
4
A number of industrial customers purchase their natural gas requirements directly from alternate suppliers for delivery through LG&E’s distribution system. These large industrial customers account for approximately one-fourth of LG&E’s annual throughput.
During 2005, the maximum daily gas sendout was approximately 444,000 Mcf, occurring on January 17, 2005, when the average temperature for the day was 16 degrees Fahrenheit. Supply on that day consisted of approximately 221,000 Mcf from purchases, approximately 166,000 Mcf delivered from underground storage, and approximately 57,000 Mcf transported for industrial customers. For a further discussion, see Gas Supply under Item 1.
Rates and Regulation
Historically, E.ON, LG&E’s ultimate parent, has been a registered holding company under PUHCA 1935, and anticipates registering under PUHCA 2005. As a registered holding company, E.ON, its utility subsidiaries, including LG&E, and certain of its non-utility subsidiaries have been subject to extensive regulation by the SEC and the FERC with respect to numerous matters, including: electric utility facilities and operations, wholesale sales of power and related transactions, accounting practices, issuances and sales of securities, acquisitions and sales of utility properties, payments of dividends out of capital and surplus, financial matters and inter-system sales of non-power goods and services. In addition, PUHCA 2005 generally limited the ability of registered holding companies to acquire additional public utility systems and to acquire and retain businesses unrelated to the utility operations of the holding company. LG&E believes that it has adequate authority (including financing authority) under existing FERC orders and regulations to conduct its business and will seek additional authorization when necessary.
In August 2005, President Bush signed into law the EPAct 2005, significantly changing many federal statutes, repealing PUHCA 1935 as of February 8, 2006 and enacting PUHCA 2005. As part of the repeal of PUHCA 1935, the FERC was given more authority over the merger and acquisition of public utilities and more authority over the books and records of public utilities. Despite these increases in the FERC’s authority, LG&E believes that the repeal of PUHCA 1935 will lessen its regulatory burdens and provide more flexibility in the event of expansion.
Besides repealing PUHCA 1935, the EPAct 2005 is also expected to have substantial long-term effects on energy markets, energy investment and regulation of public utilities and holding company systems by the FERC and the DOE. The FERC and the DOE are in various stages of rulemaking in implementing the EPAct 2005. The precise impact of these rulemakings cannot be determined at this time.
The Kentucky Commission has regulatory jurisdiction over LG&E’s retail rates and service, and over the issuance of certain of its securities. The Kentucky Commission has the ability to examine the rates LG&E charges its retail customers at any time.
Pursuant to Kentucky law, the Kentucky Commission has established the boundaries of the service territory or area of each retail electric supplier in Kentucky (including LG&E), other than municipal corporations. Within this service territory, each such supplier has the exclusive right to render retail electric service.
5
LG&E’s retail electric rates contain an FAC, whereby increases and decreases in the cost of fuel for electric generation are reflected in the rates charged to retail electric customers. The Kentucky Commission requires public hearings at six-month intervals to examine past fuel adjustments, and at two-year intervals to review past operations of the fuel clause and transfer of the then current fuel adjustment charge or credit to the base charges. The Kentucky Commission also requires that electric utilities, including LG&E, file documents relating to fuel procurement and the purchase of power and energy from other utilities.
Prior to 2004, LG&E’s retail electric rates were subject to an ESM. LG&E and the Kentucky Commission agreed to a termination of the ESM relating to all periods after 2003. The ESM, initially in place for three years beginning in 2000, set an upper (12.5%) and lower (10.5%) limit for rate of return on equity. If earnings were above the upper limit, the excess earnings were shared 40% with ratepayers and 60% with shareholders; if earnings were below the lower limit, the earnings deficiency was recovered 40% from ratepayers and 60% from shareholders. By order of the Kentucky Commission, rate changes prompted by the ESM filing went into effect in April of each year subject to a balancing adjustment in successive periods. For discussion of current ESM matters, see Note 3 of LG&E’s Notes to Financial Statements under Item 8.
In June 2001, LG&E filed an application (“VDT case”) with the Kentucky Commission to create a regulatory asset relating to first quarter 2001 charges for a workforce reduction program. In December 2001, the Kentucky Commission approved a settlement in the VDT case and allowed LG&E to set up a regulatory asset of $141 million for the workforce reduction costs and begin amortizing these costs over a five year period starting in April 2001. The settlement reduced revenues by approximately $26 million through a surcredit on bills to ratepayers over the same five-year period. The surcredit represented net savings stipulated by LG&E. For discussion of current VDT matters, see Note 3 and Note 16 of LG&E’s Notes to Financial Statements under Item 8.
LG&E’s retail rates contain an ECR surcharge which recovers costs incurred by LG&E that are required to comply with the Clean Air Act and other environmental regulations. See Note 3 of LG&E’s Notes to Financial Statements under Item 8.
LG&E’s natural gas rates contain a GSC, whereby increases or decreases in the cost of natural gas supply are reflected in LG&E’s rates, subject to approval by the Kentucky Commission. The GSC procedure prescribed by order of the Kentucky Commission provides for quarterly rate adjustments to reflect the expected cost of natural gas supply in that quarter. In addition, the GSC contains a mechanism whereby any over- or under-recoveries of natural gas supply cost from prior quarters is to be refunded to or recovered from customers through the adjustment factor determined for subsequent quarters. In late 2005, as wholesale natural gas prices began to decrease, a monthly adjustment in the GSC was requested by LG&E and approved by the Kentucky Commission to pass the lower natural gas costs to the customers on a more timely basis.
Integrated resource planning regulations in Kentucky require LG&E and the other major utilities to make triennial filings with the Kentucky Commission of various historical and forecasted information relating to load, capacity margins and demand-side management techniques. LG&E filed its most recent IRP in April 2005. The AG and KIUC were granted intervention in the IRP proceeding. The Kentucky Commission issued its staff report on February 15, 2006, with no substantive issues noted and closed the case by Order dated February 24, 2006.
In December 2003, LG&E filed an application with the Kentucky Commission requesting adjustments in LG&E’s electric and natural gas rates. LG&E asked for general adjustments in electric and natural gas rates based on the twelve month test period ended September 30, 2003. The revenue increases requested were
6
approximately $64 million for electric and $19 million for gas. In June 2004, the Kentucky Commission issued an order approving increases in LG&E’s annual electric base rates of approximately $43 million (7.7%) and annual gas base rates of approximately $12 million (3.4%). The rate increases took effect on July 1, 2004.
Subsequently during 2004 and 2005, the AG conducted an investigation regarding the proceedings resulting in the rate increases. The AG requested information from LG&E and the Kentucky Commission and its staff regarding alleged improper communications between LG&E and the Kentucky Commission related to the rate proceedings. The AG also requested rehearing of the rate increase orders on the basis of these allegations, as well as calculational aspects of the increased rates. In February 2005, the AG submitted a confidential report on its investigation with the Kentucky Commission and filed a motion summarizing the report as containing evidence of improper communications and record-keeping errors by LG&E in respect of its activities with state governmental agencies, including the Kentucky Commission.
In December 2005, the Kentucky Commission issued an order noting completion of its inquiry, including review of the AG’s investigative report. The order concluded that no improper communications occurred during the rate proceedings. The order further established a procedural schedule through the first quarter of 2006 for considering the sole issue for which rehearing was granted: state income tax rates used in calculating the granted rate increases. This issue is estimated at less than $1 million annually. Upon resolution of this issue on rehearing, the initial rate increase orders could be subject to judicial appeal.
For a further discussion of regulatory matters, see Note 3 of LG&E’s Notes to Financial Statements under Item 8.
Construction Program and Financing
LG&E’s construction program is designed to ensure that there will be adequate capacity and reliability to meet the electric and natural gas needs of its service area. These needs are continually being reassessed and appropriate revisions are made, when necessary, in construction schedules. LG&E’s estimates of its construction expenditures can vary substantially due to numerous items beyond LG&E’s control, such as changes in interest rates, economic conditions, construction costs, and new environmental or other governmental laws and regulations.
During the five years ended December 31, 2005, gross property additions amounted to approximately $1 billion. Internally generated funds and external financings for the five-year period were utilized to provide for these gross additions. The gross additions during this period amounted to approximately 24% of total utility plant at December 31, 2005, and consisted of $807 million for electric properties and $164 million for natural gas properties. Gross retirements during the same period were $108 million, consisting of $81 million for electric properties and $27 million for natural gas properties.
Capital expenditures during the three years ending December 31, 2008, are estimated to be approximately $530 million. The major expenditures during this period relate to the development and construction of Trimble County Unit 2, of which LG&E’s portion totals approximately $120 million, and approximately $26 million for the redevelopment of the Ohio Falls hydro facility.
Coal Supply
Coal-fired generating units provided approximately 97% of LG&E’s net kilowatt-hour generation for 2005.
7
The remaining net generation for 2005 was provided by natural gas and oil-fueled combustion turbine peaking units and a hydroelectric plant. Coal is expected to be the predominant fuel used by LG&E in the foreseeable future, with natural gas and oil being used for peaking capacity and flame stabilization in coal-fired boilers or in emergencies. LG&E has no nuclear generating units and has no plans to build any in the foreseeable future.
LG&E maintains its fuel inventory at levels estimated to be necessary to avoid operational disruptions at its coal-fired generating units. Reliability of coal deliveries can be affected from time to time by a number of factors, including fluctuations in demand, coal mine production issues and other supplier or transporter operating difficulties.
LG&E has entered into coal supply agreements with various suppliers for coal deliveries for 2006 and beyond and normally augments its coal supply agreements with spot market purchases. LG&E has a coal inventory policy which it believes provides adequate protection under most contingencies. It had a coal inventory of approximately 1.1 million tons, or a 50-day supply, on hand at December 31, 2005.
LG&E expects to continue purchasing most of its coal, which has a sulfur content in the 2% - 4.5% range, from western Kentucky, southern Indiana, southern Illinois, Ohio and West Virginia for the foreseeable future. This supply is relatively low-priced coal, and in combination with its sulfur dioxide removal systems, is expected to enable LG&E to continue to provide electric service in compliance with existing environmental laws and regulations.
Coal is delivered to LG&E’s Mill Creek plant by rail and barge, Trimble County plant by barge and Cane Run plant by rail.
The historical average delivered cost of coal purchased and the percentage of spot coal purchases were as follows:
| | 2005 | | 2004 | | 2003 | |
Per ton | | $ | 30.37 | | $ | 26.25 | | $ | 25.56 | |
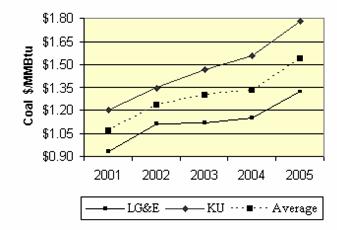
Per MMBtu | | $ | 1.32 | | $ | 1.15 | | $ | 1.12 | |
Spot purchases as % of all sources | | 14 | % | 7 | % | 1 | % |
The delivered cost of coal is expected to increase in 2006 due to the start of new contracts for 2006 and market conditions. LG&E increased spot purchases in 2005 and 2004 due to supply and transportation issues in the market.
Gas Supply
LG&E purchases natural gas supplies from multiple sources under contracts for varying periods of time, while transportation services are purchased from Texas Gas and Tennessee Gas.
LG&E transports natural gas on the Texas Gas system under Rate Schedules NNS and FT service. Effective November 1, 2005, LG&E’s winter season NNS levels are 184,900 MMBtu/day and its winter season FT levels are 36,000 MMBtu/day. LG&E’s summer season NNS levels are 60,000 MMBtu/day and its summer season FT levels are 36,000 MMBtu/day. LG&E provided Texas Gas with notice to terminate a portion of its FT agreement in the amount of 8,000 MMBtu/day effective November 1, 2006. As a result, LG&E will have FT service in the amount of 28,000 MMBtu/day, effective November 1, 2006. Each of the NNS agreements with Texas Gas is subject to termination by LG&E in equal portions during 2008, 2010 and 2011. Each of the FT
8
agreements with Texas Gas is subject to termination by LG&E during 2008 and 2011. LG&E also transports on the Tennessee Gas system under Tennessee Gas’ Rate Schedule FT-A. LG&E’s contract levels with Tennessee Gas are 51,000 MMBtu/day throughout the year. The FT-A agreement with Tennessee Gas is subject to termination by LG&E during 2007.
LG&E participates in rate and other proceedings affecting the regulated interstate natural gas pipelines that provide service to LG&E. Both Texas Gas and Tennessee Gas have several active proceedings in which LG&E is participating at the FERC. One of those proceedings is an application filed by Texas Gas with the FERC to increase its base rates. LG&E is participating in this proceeding with other interested parties. The rates of Texas Gas are, therefore, being billed subject to refund, and LG&E will refund to its customers any amounts which may be refunded to it as the result of the resolution of this proceeding before the FERC. The rates of Tennessee Gas are not being billed subject to refund.
LG&E also has a portfolio of supply arrangements of various terms with a number of suppliers designed to meet its firm sales obligations. These natural gas supply arrangements include pricing provisions that are market-responsive. These firm natural gas supplies, in tandem with pipeline transportation services, provide the reliability and flexibility necessary to serve LG&E’s natural gas customers.
LG&E owns and operates five underground natural gas storage fields with a current working gas capacity of approximately 15.1 million Mcf. Natural gas is purchased and injected into storage during the summer season when natural gas prices are typically lower, and is then withdrawn to supplement pipeline supplies to meet the gas-system load requirements during the winter heating season. See Gas Operations under Item 1.
The estimated maximum deliverability from storage during the early part of the heating season is expected to be in excess of 370,000 Mcf/day. Under mid-winter design conditions, LG&E expects to be able to withdraw in excess of 350,000 Mcf/day from its storage facilities. The deliverability of natural gas from LG&E’s storage facilities decreases as storage inventory levels are reduced by seasonal withdrawals.
LG&E relies upon its significant underground storage to mitigate the price volatility to which customers might otherwise be exposed. In 2000, the Kentucky Commission issued an order establishing Administrative Case No. 384 – “An Investigation of Increasing Wholesale Natural Gas Prices and the Impacts of such Increase on the Retail Customers Served by Kentucky’s Jurisdictional Natural Gas Distribution Companies”. Subsequent to this investigation, the Kentucky Commission issued an order on July 17, 2001, encouraging the natural gas distribution companies in Kentucky to take various actions, among them to propose a natural gas hedge plan. LG&E currently operates under a hedge plan proposed by LG&E beginning with the 2004/2005 winter heating season. This hedge plan relies upon LG&E’s underground natural gas storage to mitigate customer exposure to price volatility. In 2004, the Kentucky Commission approved LG&E’s proposed hedge plan, validating the effectiveness of storage to mitigate potential volatility associated with high winter natural gas prices by approving this natural gas hedge plan. The Kentucky Commission also ordered that LG&E need not file hedge plans in the future unless it intended to utilize financial hedging instruments.
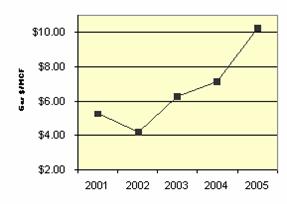
The average cost per Mcf of natural gas purchased by LG&E was $10.23 in 2005, $7.18 in 2004, and $6.30 in 2003. Natural gas prices in the unregulated wholesale market generally have increased significantly over the last few years beginning in 2000. For further discussion of wholesale natural gas prices, see Note 3 of LG&E’s Notes to Financial Statements under Item 8.
9
Environmental Matters
Protection of the environment is a major priority for LG&E. Federal, state, and local regulatory agencies have issued LG&E permits for various activities subject to air quality, water quality, and waste management laws and regulations. For the five-year period ending with 2005, expenditures for pollution control facilities represented $233 million or 24% of total construction expenditures. LG&E estimates that construction expenditures for environmental protection equipment from 2006 through 2008 will be approximately $40 million. For a discussion of environmental matters, see Note 10 of LG&E’s Notes to Financial Statements under Item 8.
Competition
At this time, neither the Kentucky General Assembly nor the Kentucky Commission has adopted or approved a plan or timetable for retail electric industry competition in Kentucky. The nature or timing of the ultimate legislative or regulatory actions regarding industry restructuring and their impact on LG&E, which may be significant, cannot currently be predicted. Some states that have already deregulated have begun discussions that could lead to re-regulation.
In February 2005, Kentucky’s Governor signed an executive order directing the Kentucky Commission, in conjunction with the Commerce Cabinet and the Environmental and Public Protection Cabinet, to ‘develop a Strategic Blueprint for the continued use and development of electric energy.’ This Strategic Blueprint is designed to promote future investment in electric infrastructure for the Commonwealth of Kentucky, to protect Kentucky’s low-cost electric advantage, to maintain affordable rates for all Kentuckians, and to preserve Kentucky’s commitment to environmental protection. In March 2005, the Kentucky Commission established Administrative Case No. 2005-00090 to collect information from all jurisdictional utilities in Kentucky, including LG&E, pertaining to Kentucky electric generation, transmission and distribution systems. LG&E responded to the Kentucky Commission’s first set of data requests at the end of March 2005 and to a second set of data requests in May 2005. The Commission held a Technical Conference in June 2005, in which all parties participated in a panel discussion. A final report was provided in August 2005 from the Kentucky Commission to the Governor. The Kentucky Commission issued an order and closed this proceeding on September 15, 2005. Some of the key findings from the report are:
• Kentucky’s electric utilities currently have adequate infrastructure as well as adequate planning to serve the needs of customers through 2025;
• Kentucky will need 7,000 megawatts of additional generating capacity by 2025;
• Kentucky’s electric transmission is reliable but intrastate power transfers are limited;
• Additional incentives to use renewable energy and educate the public on the benefits of renewables are needed;
• Financial incentives should be available for coal purification and other clean air technologies;
• A cautious approach should be taken toward deregulation; and
• Kentucky must be involved in federal decisions that impact its status as a low cost energy provider.
Over the last several years, LG&E has taken many steps to keep its rates low while maintaining high levels of customer satisfaction, including: an increase in focus on commercial, industrial and residential customers; an increase in employee involvement and training; and continuous modifications of its organizational structure. LG&E also strives to control costs through competitive bidding and process improvements. LG&E’s performance in national customer satisfaction surveys continues to be high.
10
KENTUCKY UTILITIES COMPANY
General
KU, incorporated in Kentucky in 1912 and incorporated in Virginia in 1991, is a regulated public utility that provides electricity to approximately 495,000 customers in over 600 communities and adjacent suburban and rural areas in 77 counties in central, southeastern and western Kentucky, to approximately 30,000 customers in 5 counties in southwestern Virginia and 5 customers in Tennessee. KU’s coal-fired electric generating plants produce most of KU’s electricity, the remainder is generated by hydroelectric power plants and combustion turbines. In Virginia, KU operates under the name Old Dominion Power Company. KU operates under appropriate franchises in substantially all of the 160 Kentucky incorporated municipalities served. No franchises are required in unincorporated Kentucky or Virginia communities. The lack of franchises is not expected to have a material adverse effect on KU’s operations. KU also sells wholesale electric energy to 12 municipalities. See Item 2, Properties.
Electric Operations
The sources of KU’s electric operating revenues and the volumes of sales for the three years ended December 31, 2005, were as follows:
(in millions) | | 2005 | | 2004 | | 2003 | |
ELECTRIC OPERATING REVENUES | | | | | | | |
Residential | | $ | 364 | | $ | 304 | | $ | 278 | |
Commercial | | 241 | | 207 | | 189 | |
Industrial | | 220 | | 190 | | 176 | |
Mine power | | 38 | | 32 | | 30 | |
Public authorities | | 83 | | 72 | | 66 | |
Total retail | | 946 | | 805 | | 739 | |
Wholesale sales | | 210 | | 160 | | 138 | |
Provision for rate collections (refunds) | | — | | 5 | | (8 | ) |
Miscellaneous | | 51 | | 25 | | 23 | |
Total | | $ | 1,207 | | $ | 995 | | $ | 892 | |
(Thousands of Mwh) | | | | | | | |
ELECTRIC SALES | | | | | | | |
Residential | | 6,599 | | 6,160 | | 6,001 | |
Commercial | | 4,466 | | 4,323 | | 4,210 | |
Industrial | | 5,459 | | 5,400 | | 5,110 | |
Mine power | | 803 | | 732 | | 722 | |
Public authorities | | 1,649 | | 1,597 | | 1,551 | |
Total retail | | 18,976 | | 18,212 | | 17,594 | |
Wholesale sales | | 5,781 | | 5,707 | | 5,591 | |
Total | | 24,757 | | 23,919 | | 23,185 | |
KU set an annual peak load of 4,079 Mw on July 25, 2005, when the temperature reached 94 degrees Fahrenheit. This was the highest hourly customer demand in KU’s history.
11
The electric utility business is affected by seasonal weather patterns. As a result, operating revenues (and associated operating expenses) are not generated evenly throughout the year. See KU’s Results of Operations under Item 7.
KU and LG&E currently maintain a 12% - 14% reserve margin range. At December 31, 2005, KU owned steam and combustion turbine generating facilities with a net summer capability of 4,433 Mw and a 28 Mw nameplate-rated hydroelectric facility with a summer capability of 24 Mw. See Item 2, Properties. KU also obtains power from other utilities under bulk power purchase and interchange contracts. At December 31, 2005, KU’s system net summer capability, including purchases from others and excluding the hydroelectric facility, was 4,678 Mw.
KU’s weighted-average system-wide emission rate for SO2 in 2005 was approximately 1.25 lbs./MMBtu of heat input, with every generating unit below its emission limit established by the Kentucky Division for Air Quality.
Under a contract expiring in 2020 with OMU, KU has agreed to purchase from OMU the surplus output of the 142-Mw and 265-Mw generating units at OMU’s Elmer Smith station. Purchases under the contract are made under a contractual formula resulting in costs which are expected to be comparable to the cost of other power purchased or generated by KU. Such power equated to approximately 8% of KU’s net generation system output during 2005. See Note 10 of KU’s Notes to Financial Statements under Item 8.
KU owns 20% of the common stock of EEI, which owns and operates a 1,000-Mw generating station in southern Illinois. Previously, KU was entitled to take 20% of the available capacity of the station under a pricing formula comparable to the cost of other power generated by KU. Such power equated to approximately 9% of KU’s net generation system output in 2005. The contract governing the purchases from EEI terminated on December 31, 2005. Subsequent to December 31, 2005, EEI has sold power under general market-based pricing and terms. KU has not contracted with EEI for power under the new arrangements, but maintains its 20% ownership in the common stock of EEI. Replacement power for the EEI capacity has been largely provided by KU generation.
KU and 11 other electric utilities are participating owners of OVEC, located in Piketon, Ohio. OVEC owns and operates two power plants that burn coal to generate electricity, Kyger Creek Station in Ohio and Clifty Creek Station in Indiana. KU owns 2.5% of OVEC’s common stock. KU’s share of OVEC’s output is 2.5%, approximately 55 Mw of generation capacity. In April 2004, OVEC and its shareholders, including KU and LG&E, entered into an Amended and Restated Inter-Company Power Agreement, to be effective beginning March 2006, upon the expiration of the current power contract among the parties. The parties received SEC approval under PUHCA 1935 of the Amended and Restated Inter-Company Power Agreement in February 2005.
KU is a member of the MISO, a non-profit independent transmission system operator that serves the electrical transmission needs of much of the Midwest. Membership was obtained when the MISO was formed in 1998 in response to and consistent with federal energy policy initiatives at that time. The MISO began commercial operations in February 2002. As a result, KU turned over operational control of its 100 Kv and above transmission facilities, but continues to control and operate the lower voltage transmission system subject to the terms and conditions of the MISO. As a transmission-owning member of the MISO, KU incurs costs under the MISO OATT. In April 2005, the MISO implemented its day-ahead real-time market (MISO Day 2), including a congestion management system. At the present time, KU is involved in regulatory proceedings at the Kentucky Commission and the FERC seeking authority to exit the MISO. On March 17, 2006, the FERC issued an order conditionally approving the request of KU and LG&E to exit the MISO. For further discussion, see
12
Note 15 of KU’s Notes to Financial Statements under Item 8.
Rates and Regulation
Historically, E.ON, KU’s ultimate parent, has been a registered holding company under PUHCA 1935, and anticipates registering under PUHCA 2005. As a registered holding company, E.ON, its utility subsidiaries, including KU, and certain of its non-utility subsidiaries have been subject to extensive regulation by the SEC and the FERC with respect to numerous matters, including: electric utility facilities and operations, wholesale sales of power and related transactions, accounting practices, issuances and sales of securities, acquisitions and sales of utility properties, payments of dividends out of capital and surplus, financial matters and inter-system sales of non-power goods and services. In addition, PUHCA 1935 generally limited the ability of registered holding companies to acquire additional public utility systems and to acquire and retain businesses unrelated to the utility operations of the holding company. KU believes that it has adequate authority (including financing authority) under existing FERC orders and regulations to conduct its business and will seek additional authorization when necessary.
In August 2005, President Bush signed into law the EPAct 2005, significantly changing many federal statutes, repealing PUHCA 1935 as of February 8, 2006 and enacting PUHCA 2005. As part of the repeal of PUHCA 1935, the FERC was given more authority over the merger and acquisition of public utilities and more authority over the books and records of public utilities. Despite these increases in the FERC’s authority, KU believes that the repeal of PUHCA 1935 will lessen its regulatory burdens and provide more flexibility in the event of expansion.
Besides repealing PUHCA 1935, the EPAct 2005 is also expected to have substantial long-term effects on energy markets, energy investment and regulation of public utilities and holding company systems by the FERC and the DOE. The FERC and the DOE are in various stages of rulemaking in implementing the EPAct 2005. While the precise impact of these rulemakings cannot be determined at this time, KU generally views the EPAct 2005 as legislation that will enhance the utility industry going forward.
The Kentucky Commission and the Virginia Commission have regulatory jurisdiction over KU’s retail rates and service, and over the issuance of certain of its securities. By reason of owning and operating a small amount of electric utility property in one county in Tennessee (having a gross book value of approximately $0.3 million) from which KU served 5 customers at December 31, 2005, KU is subject to the jurisdiction of the Tennessee Regulatory Authority. The Kentucky Commission, the Virginia Commission and the Tennessee Regulatory Authority have the ability to examine the rates KU charges its retail customers at any time.
Pursuant to Kentucky law, the Kentucky Commission has established the boundaries of the service territory or area of each retail electric supplier in Kentucky (including KU), other than municipal corporations. Within this service territory each such supplier has the exclusive right to render retail electric service.
KU’s Kentucky retail electric rates contain an FAC, whereby increases and decreases in the cost of fuel for electric generation are reflected in the rates charged to retail electric customers. The Kentucky Commission
13
requires public hearings at six-month intervals to examine past fuel adjustments, and at two-year intervals to review past operations of the fuel clause and transfer of the then current fuel adjustment charge or credit to the base charges. The Kentucky Commission also requires that electric utilities, including KU, file documents relating to fuel procurement and the purchase of power and energy from other utilities. The FAC mechanism for Virginia customers uses an average fuel cost factor based primarily on projected fuel costs. The fuel cost factor may be adjusted annually for over or under collections of fuel costs from the previous year.
Prior to 2004, KU’s Kentucky retail electric rates were subject to an ESM. KU and the Kentucky Commission agreed to a termination of the ESM relating to all periods after 2003. The ESM, initially in place for three years beginning in 2000, set an upper (12.5%) and lower (10.5%) limit for rate of return on equity. If earnings were above the upper limit, the excess earnings were shared 40% with ratepayers and 60% with shareholders; if earnings were below the lower limit, the earnings deficiency was recovered 40% from ratepayers and 60% from shareholders. By order of the Kentucky Commission, rate changes prompted by the ESM filing went into effect in April of each year subject to a balancing adjustment in successive periods. There is no ESM for Virginia retail electric rates. For discussion of current ESM matters, see Note 3 of KU’s Notes to Financial Statements under Item 8.
In June 2001, KU filed an application (“VDT case”) with the Kentucky Commission to create a regulatory asset relating to first quarter 2001 charges for a workforce reduction program. In December 2001, the Kentucky Commission approved a settlement in the VDT and allowed KU to set up a regulatory asset of $54 million for the workforce reduction costs and begin amortizing these costs over a five year period starting in April 2001. The settlement reduced revenues by approximately $11 million through a surcredit on bills to ratepayers over the same five-year period. The surcredit represented net savings stipulated by KU. For discussion of current VDT matters, see Note 3 and Note 15 of KU’s Notes to Financial Statements under Item 8.
KU’s Kentucky retail rates contain an ECR surcharge which recovers costs incurred by KU that are required to comply with the Clean Air Act and other environmental regulations. See Note 3 of KU’s Notes to Financial Statements under Item 8.
Integrated resource planning regulations in Kentucky require KU and the other major utilities to make triennial filings with the Kentucky Commission of various historical and forecasted information relating to load, capacity margins and demand-side management techniques. KU filed its most recent IRP in April 2005. The AG and KIUC were granted intervention in the IRP proceeding. The Kentucky Commission issued its staff report on February 15, 2006, with no substantive issues noted and closed the case by Order dated February 24, 2006.
The Commonwealth of Virginia passed the Virginia Electric Utility Restructuring Act in 1999. This act gave Virginia customers the ability to choose their electric supplier. Rates are capped at current levels through December 2010. The Virginia Commission will continue to require each Virginia utility to make annual filings of either a base rate change or an Annual Informational Filing consisting of a set of standard financial schedules. The Virginia Staff will issue a Staff Report regarding the individual utility’s financial performance during the historic 12-month period. The Staff Report can lead to an adjustment in rates, but through December 2010 rates are subject to the capped rate period and essentially “frozen”. However, KU may petition the Virginia Commission for a one-time adjustment in rates during the capped rate period. Effective July 1, 2003, the General Assembly of Virginia amended and reenacted Section 56-580 of the Code of Virginia with language that effectively exempts all KU Virginia service territory from retail choice until such time as retail choice is offered to customers in KU’s other service territories.
14
In December 2003, KU filed an application with the Kentucky Commission requesting an adjustment in KU’s electric rates. KU asked for a general adjustment in electric rates based on the twelve month test period ended September 30, 2003. The revenue increase requested was approximately $58 million. In June 2004, the Kentucky Commission issued an order approving an increase in KU’s annual electric base rates of approximately $46 million (6.8%). The rate increase took effect on July 1, 2004.
Subsequently during 2004 and 2005, the AG conducted an investigation regarding the proceedings resulting in the rate increase. The AG requested information from KU and the Kentucky Commission and its staff regarding alleged improper communications between KU and the Kentucky Commission related to the rate proceeding. The AG also requested rehearing of the rate increase order on the basis of these allegations, as well as calculational aspects of the increased rates. In February, 2005 the AG submitted a confidential report on its investigation with the Kentucky Commission and filed a motion summarizing the report as containing evidence of improper communications and record-keeping errors by KU in respect of its activities with state governmental agencies, including the Kentucky Commission.
In December 2005, the Kentucky Commission issued an order noting completion of its inquiry, including review of the AG’s investigative report. The order concluded that no improper communications occurred during the rate proceedings. The order further established a procedural schedule through the first quarter of 2006 for considering the sole issue for which rehearing was granted: state income tax rates used in calculating the granted rate increase. This issue is estimated at less than $1 million annually. Upon resolution of this issue on rehearing, the initial rate increase order could be subject to judicial appeal.
For a further discussion of regulatory matters, see Note 3 of KU’s Notes to the Financial Statements under Item 8.
Construction Program and Financing
KU’s construction program is designed to ensure that there will be adequate capacity and reliability to meet the electric needs of its service area. These needs are continually being reassessed and appropriate revisions are made, when necessary, in construction schedules. KU’s estimates of its construction expenditures can vary substantially due to numerous items beyond KU’s control, such as changes in interest rates, economic conditions, construction costs, and new environmental or other governmental laws and regulations.
During the five years ended December 31, 2005, gross property additions amounted to approximately $1 billion. Internally generated funds and external financings for the five-year period were utilized to provide for these gross additions. The gross additions during this period amounted to approximately 26% of total utility plant at December 31, 2005. Gross retirements during the same period were $106 million.
Capital expenditures during the three years ending December 31, 2008 are estimated to be approximately $1.5 billion. The major expenditures during this period relate to the development and construction of Trimble County Unit 2, of which KU’s portion totals approximately $510 million, and the installation of FGDs on Ghent and Brown units, totaling approximately $560 million.
Coal Supply
Coal-fired generating units provided approximately 97% of KU’s net kilowatt-hour generation for 2005. The remaining net generation for 2005 was provided by natural gas and oil-fueled combustion turbine peaking units
15
and hydroelectric plants. Coal is expected to be the predominant fuel used by KU in the foreseeable future, with natural gas and oil being used for peaking capacity and flame stabilization in coal-fired boilers or in emergencies. KU has no nuclear generating units and has no plans to build any in the foreseeable future.
KU maintains its fuel inventory at levels estimated to be necessary to avoid operational disruptions at its coal-fired generating units. Reliability of coal deliveries can be affected from time to time by a number of factors, including fluctuations in demand, coal mine production issues and other supplier or transporter operating difficulties.
KU has entered into coal supply agreements with various suppliers for coal deliveries for 2006 and beyond and normally augments its coal supply agreements with spot market purchases. KU has a coal inventory policy which it believes provides adequate protection under most contingencies. It had a coal inventory of approximately 1.1 million tons, or a 51-day supply, on hand at December 31, 2005.
KU expects to continue purchasing most of its coal, which has a sulfur content in the 0.7% - 3.5% range, from western and eastern Kentucky, West Virginia, southern Indiana, southern Illinois, Ohio, Wyoming and Colorado for the foreseeable future.
Coal is delivered to KU’s Ghent plant by barge, Tyrone and Green River plants by truck, and E.W. Brown plant by rail and truck.
The historical average delivered cost of coal purchased and the percentage of spot coal purchases were as follows:
| | 2005 | | 2004 | | 2003 | |
| | | | | | | |
Per ton | | $ | 42.45 | | $ | 37.69 | | $ | 34.57 | |
Per MMBtu | | $ | 1.78 | | $ | 1.56 | | $ | 1.47 | |
Spot purchases as % of all sources | | 15 | % | 14 | % | 11 | % |
KU’s historical average cost of coal purchased is higher than LG&E’s due to the lower sulfur content of the coal KU purchases for use at its Ghent plant and higher cost to transport coal to the E.W. Brown plant. The delivered cost of coal for 2006 is expected to increase due to the start of new contracts and market conditions.
Environmental Matters
Protection of the environment is a major priority for KU. Federal, state, and local regulatory agencies have issued KU permits for various activities subject to air quality, water quality, and waste management laws and regulations. For the five-year period ending with 2005, expenditures for pollution control facilities represented $269 million or 26% of total construction expenditures. KU estimates that construction expenditures for environmental control equipment from 2006 through 2008, will be approximately $680 million, of which approximately $560 million is related to the installation of FGDs at Ghent and Brown. For a discussion of environmental matters, see Note 10 of KU’s Notes to Financial Statements under Item 8.
Competition
At this time, neither the Kentucky General Assembly nor the Kentucky Commission has adopted or approved a plan or timetable for retail electric industry competition in Kentucky. The nature or timing of the ultimate
16
legislative or regulatory actions regarding industry restructuring and their impact on KU, which may be significant, cannot currently be predicted. Some states that have already deregulated have begun discussions that could lead to re-regulation.
In February 2005, Kentucky’s Governor signed an executive order directing the Kentucky Commission, in conjunction with the Commerce Cabinet and the Environmental and Public Protection Cabinet, to ‘develop a Strategic Blueprint for the continued use and development of electric energy.’ This Strategic Blueprint is designed to promote future investment in electric infrastructure for the Commonwealth of Kentucky, to protect Kentucky’s low-cost electric advantage, to maintain affordable rates for all Kentuckians, and to preserve Kentucky’s commitment to environmental protection. In March 2005, the Kentucky Commission established Administrative Case No. 2005-00090 to collect information from all jurisdictional utilities in Kentucky, including KU, pertaining to Kentucky electric generation, transmission and distribution systems. KU responded to the Kentucky Commission’s first set of data requests at the end of March 2005 and to a second set of data requests in May 2005. The Commission held a Technical Conference in June 2005, in which all parties participated in a panel discussion. A final report was provided in August 2005 from the Kentucky Commission to the Governor. The Kentucky Commission issued an order and closed this proceeding on September 15, 2005. Some of the key findings from the report are:
• Kentucky’s electric utilities currently have adequate infrastructure as well as adequate planning to serve the needs of customers through 2025;
• Kentucky will need 7,000 megawatts of additional generating capacity by 2025;
• Kentucky’s electric transmission is reliable but intrastate power transfers are limited;
• Additional incentives to use renewable energy and educate the public on the benefits of renewables are needed;
• Financial incentives should be available for coal purification and other clean air technologies;
• A cautious approach should be taken toward deregulation; and
• Kentucky must be involved in federal decisions that impact its status as a low cost energy provider.
Virginia has enacted a phase-in of customer choice through the Virginia Electric Restructuring Act, however, KU’s service territory has been effectively exempted from retail choice until such time as retail choice is offered to customers in KU’s other service territories.
Over the last several years, KU has taken many steps to keep its rates low while maintaining high levels of customer satisfaction, including: an increase in focus on commercial, industrial and residential customers; an increase in employee involvement and training; and continuous modifications of its organizational structure. KU also strives to control costs through competitive bidding and process improvements. KU’s performance in national customer satisfaction surveys continues to be high.
17
EMPLOYEES AND LABOR RELATIONS
LG&E had approximately 895 full-time regular employees and KU had approximately 925 full-time regular employees at February 28, 2006. Of the LG&E total, 621 operating, maintenance, and construction employees were represented by IBEW Local 2100. LG&E and employees represented by IBEW Local 2100 signed a three-year collective bargaining agreement in November 2005 with annual benefits re-openers. Of the KU total, approximately 150 operating, maintenance, and construction employees were represented by IBEW Local 2100 and USWA Local 9447-01. In August 2003, KU and employees represented by IBEW Local 2100 entered into a three-year collective bargaining agreement. KU and employees represented by USWA Local 9447-01 entered into a three-year collective bargaining agreement in August 2005 with authorized annual wage re-openers.
E.ON U.S. Services provides services to affiliated entities, including LG&E and KU, at cost as permitted under PUHCA 2005. On February 28, 2006, approximately 1,022 employees worked for E.ON U.S. Services.
18
Executive Officers of LG&E and KU at February 28, 2006:
| | | | | | Effective Date of | |
| | | | | | Election to Present | |
Name | | Age | | Position | | Position | |
| | | | | | | |
Victor A. Staffieri | | 50 | | Chairman of the Board, | | May 1, 2001 | |
| | | | President and Chief | | | |
| | | | Executive Officer | | | |
| | | | | | | |
John R. McCall | | 62 | | Executive Vice President, | | July 1, 1994 | |
| | | | General Counsel and | | | |
| | | | Corporate Secretary | | | |
| | | | | | | |
S. Bradford Rives | | 47 | | Chief Financial Officer | | September 15, 2003 | |
| | | | | | | |
Paul W. Thompson | | 49 | | Senior Vice President - | | June 7, 2000 | |
| | | | Energy Services | | | |
| | | | | | | |
Chris Hermann | | 58 | | Senior Vice President - | | February 14, 2003 | |
| | | | Energy Delivery | | | |
| | | | | | | |
Wendy C. Welsh | | 52 | | Senior Vice President - | | December 11, 2000 | |
| | | | Information Technology | | | |
| | | | | | | |
Martyn Gallus | | 41 | | Senior Vice President - | | December 11, 2000 | |
| | | | Energy Marketing | | | |
| | | | | | | |
Paula H. Pottinger | | 49 | | Senior Vice President - | | January 2, 2006 | |
| | | | Human Resources | | | |
Other Officers of LG&E and KU at February 28, 2006:
David A. Vogel | | 40 | | Vice President - Retail | | March 1, 2003 | |
| | | | and Gas Storage Operations | | | |
| | | | | | | |
Daniel K. Arbough | | 44 | | Treasurer | | December 11, 2000 | |
| | | | | | | |
Michael S. Beer | | 47 | | Vice President | | September 27, 2004 | |
| | | | Federal Regulation and Policy | | | |
| | | | | | | |
George R. Siemens | | 56 | | Vice President - External | | January 11, 2001 | |
| | | | Affairs | | | |
| | | | | | | |
D. Ralph Bowling | | 48 | | Vice President - | | August 1, 2002 | |
| | | | Power Operations WKE | | | |
| | | | | | | |
R. W. Chip Keeling | | 49 | | Vice President - | | March 18, 2002 | |
| | | | Communications | | | |
| | | | | | | |
John N. Voyles, Jr. | | 51 | | Vice President - | | June 16, 2003 | |
| | | | Regulated Generation | | | |
| | | | | | | |
Valerie L. Scott | | 49 | | Controller | | January 1, 2005 | |
19
The present term of office of each of the above executive and other officers extends to the meeting of the Board of Directors following the 2006 Annual Meeting of Shareholders.
There are no family relationships between or among executive and other officers of LG&E and KU. The above tables indicate officers serving as executive officers of both LG&E and KU at February 28, 2006. Each of the above officers serves in the same capacity for LG&E and KU.
Before he was elected to his current positions, Mr. Staffieri was Chief Financial Officer of LG&E Energy (now E.ON U.S.) and LG&E from May 1997 to February 1999 (including Chief Financial Officer of KU from May 1998 to February 1999) and President and Chief Operating Officer of LG&E Energy (now E.ON U.S.) from March 1999 to April 2001 (including President of LG&E and KU from June 2000 to April 2001).
Mr. McCall has been Executive Vice President, General Counsel and Corporate Secretary of LG&E Energy (now E.ON U.S.) and LG&E since July 1994. He became Executive Vice President, General Counsel and Corporate Secretary of KU in May 1998.
Before he was elected to his current positions, Mr. Rives was Senior Vice President - Finance and Business Development from February 1999 to December 2000 and Senior Vice President - Finance and Controller of LG&E Energy (now E.ON U.S.), LG&E and KU from December 2000 to September 2003.
Before he was elected to his current positions, Mr. Thompson was Group Vice President for LG&E Energy Marketing, Inc. from June 1998 to August 1999; Vice President, Retail Electric Business for LG&E from December 1998 to August 1999; and Senior Vice President - Energy Services for LG&E Energy (now E.ON U.S.) from August 1999 to June 2000.
Before he was elected to his current positions, Mr. Hermann was Vice President, Power Generation and Engineering Services, of LG&E from May 1998 to December 1999; Vice President Supply Chain and Operating Services from December 1999 to December 2000; and Senior Vice President - Distribution Operations, from December 2000 to February 2003.
Before she was elected to her current positions, Ms. Welsh was Vice President - Information Technology from February 1998 to December 2000 for LG&E Energy (now E.ON U.S.).
Before he was elected to his current positions, Mr. Gallus was Vice President, Energy Marketing from August 1998 to December 2000 for LG&E Energy (now E.ON U.S.).
Before she was elected to her current positions, Ms. Pottinger was Director, Human Resources from June 1997 to June 2002; and Vice President - Human Resources from June 2002 to January 2006.
Before he was elected to his current positions, Mr. Vogel was Vice President - Retail Services from December 2000 to March 2003.
In addition to being elected to his current positions, Mr. Arbough has held the positions of Director, Corporate Finance of LG&E Energy (now E.ON U.S.), LG&E and KU from May 1998 to present.
20
Before he was elected to his current positions, Mr. Beer was Senior Counsel Specialist, Regulatory from February 2000 to February 2001, and Vice President – Rates and Regulatory from February 2001 to September 2004.
Before he was elected to his current positions, Mr. Siemens held the position of Director of External Affairs for LG&E Energy (now E.ON U.S.) from August 1982 to January 2001.
Before he was elected to his current positions, Mr. Bowling was Plant General Manager at Western Kentucky Energy from July 1998 to December 2001; and General Manager Black Fossil Operations for E.ON U.K. in the United Kingdom from January 2002 to August 2002.
Before he was elected to his current positions, Mr. Keeling was Director, Corporate Communications for LG&E Energy (now E.ON U.S.) from February 2000 to March 2002.
Before he was elected to his current positions, Mr. Voyles was General Manager, Cane Run, Ohio Falls and Combustion Turbines, November 1998 to February 2003; and Director, Generation Services, February 2003 to June 2003.
Before she was elected to her current positions, Ms. Scott was Director, Trading Controls and Energy Marketing Accounting from February 1999 to September 2002, and Director, Financial Planning and Accounting – Utility Operations from September 2002 to December 2004.
Item 1A. Risk Factors
In addition to the other information in this Form 10-K and other documents furnished to or filed by LG&E and KU with the SEC from time to time, the following factors should be carefully considered in evaluating the Companies. Such factors could affect actual results and cause results to differ materially from those expressed in any forward-looking statements made by, or on behalf of, the Companies. Some or all of these factors may apply to LG&E or KU or both.
The electric and gas rates that LG&E and KU charge customers, as well as other aspects of the business, are subject to significant state and FERC regulation.
The rates that the Companies are allowed to charge for their services are a primary item influencing the results of operations, financial position, and liquidity of the Companies. The regulation of the rates that are collected from customers is determined, in large part, by governmental organizations outside the Companies’ control, including the Kentucky Commission, and for KU, the Virginia Commission and the Tennessee Regulatory Authority. These commissions regulate many aspects of utility operations, including financial and capital structure matters, siting and construction of facilities, terms and conditions of service, safety and operations, accounting and cost allocation methodologies and other matters. While rate regulation is premised on recovery of prudently incurred costs and reasonable rate of return on capital, such cannot be assured. Regulatory proceedings regarding all matters of operations can thus significantly affect the earnings, liquidity and business activities of the Companies.
Base rate increases of LG&E and KU approved during 2004 and currently being collected by the Companies in Kentucky remain the subject of continuing proceedings by the Kentucky Commission and the Attorney General. Proceedings regarding the expiration of VDT charges formerly included in the Companies’ rates in Kentucky
21
are also the subject of on-going proceedings.
Transmission and interstate market activities of LG&E and KU, as well as other aspects of the business, are subject to significant FERC regulation.
The Companies’ businesses are subject to regulation under the FERC covering matters including rates charged to transmission users and wholesale customers, interstate market structure and design, construction and operation of transmission facilities, acquisition and disposal of utility assets and securities, standards of conduct, cost allocations and financial matters. Existing FERC regulation, changes thereto or issuance of new rules in these areas, can affect the earnings, operations and other activities of the Companies.
LG&E’s and KU’s continued participation in the MISO, as well as changes in transmission and wholesale power market structures, could increase costs or reduce revenues.
LG&E and KU are members of the MISO and have transferred functional control of their transmission systems to the MISO. The Companies must incur MISO membership-related costs and charges established by the MISO and can be required to incur other expenses or make transmission and generation operating decisions as directed by the MISO. The MISO Day 2 markets, which began operation in April 2005, have represented a significant change in the wholesale power market structure and operation. Until the market matures, the effects on results of operations, financial position, or liquidity will remain difficult to predict.
LG&E and KU have commenced proceedings at the Kentucky Commission and the FERC seeking authority to exit the MISO. On March 17, 2006, the FERC issued an order conditionally approving the request of KU and LG&E to exit the MISO. For further discussion see Note 16 of LG&E’s Notes to Financial Statements and Note 15 of KU's Notes to Financial Statements under Item 8.
LG&E and KU undertake significant capital projects and are subject to unforeseen costs, delays or failures in such projects, as well as risk of full recovery of such costs.
In the ordinary course of business, the Companies are continually developing, permitting and constructing new generation and transmission facilities, as well as maintaining and improving existing facilities. The completion of these facilities without delays or cost overruns is subject to risks in many areas, including approval and licensing, permitting, construction problems or delays, contractor performance, weather and geological issues, and political, labor and regulatory developments. Delays, additional costs or unsatisfactory regulatory treatment can result in reduced earnings. Further, if construction projects are not completed according to specifications, the Companies may incur reduced plant efficiency, higher operating costs or continued capital costs.
Projects underway at LG&E and KU include plans to construct a new base-load generating plant, Trimble County Unit 2, and associated transmission facilities; the upgrade or construction of other transmission facilities; and the installation of significant on-going emissions reduction equipment. These projects are in varying stages of construction, planning or regulatory approval.
22
LG&E’s and KU’s costs of compliance with environmental laws are significant and are subject to continuing changes.
LG&E and KU are subject to extensive federal, state and local environmental requirements which, among other things, regulate air emissions, water discharges and the management of hazardous and solid waste in order to adequately protect the environment. Compliance by the Companies requires significant expenditures for installation of pollution control equipment, environmental monitoring, emission fees and permits at all of their facilities. If the Companies fail to comply with environmental laws and regulations, even if caused by factors beyond their control, civil or criminal penalties and fines can result. Revised or additional laws and regulations could result in significant additional expense and operating restrictions on LG&E’s or KU’s facilities or increased compliance costs which may not be fully recoverable from customers. The cost impact of such changes would depend upon the specific requirements enacted and cannot be determined at this time.
LG&E and KU are undertaking significant emissions construction projects relating to upcoming compliance with the Clean Air Act, CAIR and CAMR standards, among others. Rate recovery and other regulatory proceedings regarding these matters occur periodically and will continue for some time.
LG&E’s and KU’s operating results are affected by weather conditions, including storms and seasonal temperature variations, as well as by significant man-made or accidental disturbances.
Customer demand for electricity and natural gas is seasonal and can cause extreme variability in load due to higher or lower than normal temperatures. Generally, demand for electricity peaks during the summer and demand for natural gas peaks during the winter. As a result, LG&E’s and KU’s overall operating results can fluctuate substantially on a seasonal basis. LG&E and KU maintain adequate generating and natural gas supply resources to accommodate system demands for electricity and natural gas. In addition, the Companies have generally sold less electricity or natural gas, as applicable, and consequently earned lower revenues, when weather conditions have been milder. However, the natural gas rates contain a WNA mechanism which adjusts the distribution cost recovery component of the natural gas billings of residential and commercial customers to normal temperatures during the heating season months of November through April, somewhat mitigating the effect of weather extremes. Severe weather, such as tornadoes, ice storms, thunderstorms, high wind or floods could also significantly affect the Companies’ operations by causing power outages, damaging infrastructure and requiring significant repair costs. Terrorism, explosions or fires pose similar risks. LG&E and KU maintain a comprehensive storm management plan for efficient and timely restoration of service to customers after major storm events.
LG&E’s and KU’s businesses are concentrated in the Midwest United States, specifically Kentucky.
The operations of the Companies are concentrated in Kentucky and are therefore impacted by changes in the Midwest United States economy in general, and the Kentucky economy in particular. General economic conditions, such as population growth, industrial growth or expansion and economic development, as well as the operational or financial performance of major industries or customers in the Companies’ service territories can affect the demand for electricity and natural gas.
LG&E and KU are subject to operational risks relating to their generating plants, transmission facilities and distribution equipment.
Operation of power plants, transmission and distribution facilities subject LG&E and KU to many risks, including the breakdown or failure of equipment, accidents, labor disputes, delivery/transportation problems, disruptions of fuel supply and performance below expected levels. Because LG&E’s and KU’s transmission facilities are interconnected with those of third parties, the operation of their facilities may be
23
adversely affected by unexpected or uncontrollable events occurring on the systems of such third parties. Operation of the Companies’ power plants below expected capacity levels could result in lost revenues or increased expenses, including higher maintenance costs that may not be recovered from customers. Unplanned outages may result in significant replacement power costs. While LG&E and KU believe appropriate prevention or mitigation measures are in place, where possible, with respect to these potential business disruptions, no assurances can be given that such events will not occur in the future or will not negatively affect their financial condition or results of operations.
LG&E and KU could be negatively affected by downgrades to credit ratings or other negative developments in their ability to access capital markets.
In the ordinary course of business, the Companies have significant long-term and short-term financing requirements to fund their capital expenditures, debt interest or maturities and operating needs. If rating agencies were to downgrade the Companies’ credit ratings, particularly below investment grade, or withdraw such ratings, it could significantly limit access to the capital market and the Companies’ borrowing costs could increase. In addition, the Companies’ financing costs can also be affected by financial matters involving their parent holding company, including its overall credit rating, its provision of intra-company financing and the terms and rates of such financing.
LG&E and KU are subject to commodity price risk, credit risk, counterparty risk and other risks associated with the energy business.
LG&E and KU are exposed to purchase and sales market operating and financial risks common to utility operations. Although the Companies operate largely in regulated markets, increases in the cost of power and fuel, such as coal or natural gas, as well as other major inputs and supplies, can affect their margins because authorized rate structures and pass-through cost mechanisms may include timing lags or regulatory discretion which do not lead to full cost recovery. Changes in the wholesale market price for electricity can impact LG&E’s and KU’s financial results by altering the revenues from off-system sales of excess power from period to period. LG&E and KU are also exposed to risk that counterparties could fail to perform their obligations to provide energy, fuel, goods, services or payments resulting in potential increased costs to the Companies.
LG&E and KU are subject to risks associated with defined benefit retirement plans, health care plans, wages and other employee-related benefits.
The Companies’ funding obligations concerning defined benefit and postretirement plans are subject to risks relating to developments in future costs, returns on investments, interest rates and other actuarial matters which may differ from assumptions currently in effect for the plans and may lead to higher required funding outlays. Further, higher wage levels, whether related to collective bargaining agreements or employment market conditions, and costs of providing health care benefits to employee may adversely affect LG&E’s and KU’s results of operations, financial position or liquidity.
Item 1B. Unresolved Staff Comments.
None.
24
ITEM 2. Properties.
LG&E’s power generating system consists of the coal-fired units operated at its three steam generating stations. Combustion turbines supplement the system during peak or emergency periods. LG&E owns and operates the following electric generating stations unless otherwise stated:
| | Summer Capability
Rating (Kw) | |
Steam Stations: | | | |
Mill Creek – Jefferson County, KY | | | |
Unit 1 | | 303,000 | |
Unit 2 | | 301,000 | |
Unit 3 | | 391,000 | |
Unit 4 | | 477,000 | |
Total Mill Creek | | 1,472,000 | |
| | | |
Cane Run – Jefferson County, KY | | | |
Unit 4 | | 155,000 | |
Unit 5 | | 168,000 | |
Unit 6 | | 240,000 | |
Total Cane Run | | 563,000 | |
| | | |
Trimble County – Trimble County, KY (a) | | | |
Unit 1 | | 383,000 | |
| | | |
Combustion Turbine Generators (Peaking capability): | | | |
Zorn Run – Jefferson County, KY | | 14,000 | |
Paddy’s Run – Jefferson County, KY (b) | | 119,000 | |
Cane Run – Jefferson County, KY | | 14,000 | |
Waterside – Jefferson County, KY | | 22,000 | |
E.W. Brown – Mercer County, KY (Units 5,6,7) (c) | | 190,000 | |
Trimble County – Trimble County, KY (d) | | 328,000 | |
Total combustion turbine generators | | 687,000 | |
| | | |
Total capability rating | | 3,105,000 | |
(a) Amount shown represents LG&E’s 75% interest in Trimble County 1. See Notes 10 and 11 of LG&E’s Notes to Financial Statements under Item 8 for further discussion on ownership.
(b) Amount shown represents LG&E’s 53% interest in Paddy’s Run Unit 13 and 100% ownership of Paddy’s Run Units 11 and 12. See Notes 10 and 11 of LG&E’s Notes to Financial Statement, under Item 8 for further discussion on ownership.
(c) Amount shown represents LG&E’s 53% interest in Unit 5, 38% interest in Units 6 and 7 at E.W. Brown and 10% of the Inlet Air Cooling system, attributable to Brown Unit 5. See Notes 10 and 11 of LG&E’s Notes to Financial Statements, under Item 8 for further discussion on ownership. KU operates these units on behalf of LG&E.
(d) Amount shown represents LG&E’s 29% interest in Units 5 and 6 and LG&E’s 37% interest in Units 7, 8, 9 and 10 at Trimble County. See Notes 10 and 11 of LG&E’s Notes to Financial Statements, under Item 8 for further discussion on ownership.
LG&E also owns an 80 Mw nameplate-rated hydroelectric generating station located in Jefferson County, Kentucky (Ohio Falls), with an expected summer capability rating of 48 Mw, operated under a license issued by the FERC.
25
At December 31, 2005, LG&E’s electric transmission system included 21 substations dedicated solely to transmission and an additional 20 substations shared with the distribution system with a total capacity of approximately 12,000 Mva and approximately 899 miles of lines. The electric distribution system included 93 substations (20 of which are shared by the transmission system) with a total capacity of approximately 4,865 Mva, 3,934 miles of overhead lines and 2,035 miles of underground conduit.
LG&E’s natural gas transmission system includes 257 miles of transmission mains, and the natural gas distribution system includes 4,133 miles of distribution mains.
LG&E operates underground natural gas storage facilities with a current working gas capacity of approximately 15.1 million Mcf. See Gas Supply under Item 1.
In 1990, LG&E entered into an operating lease for its corporate office building located in downtown Louisville, Kentucky. The lease was renegotiated in 2002 and is scheduled to expire July 31, 2015.
Other properties owned by LG&E include office buildings, service centers, warehouses, garages and other structures and equipment, the use of which is common to both the electric and gas departments.
The trust indenture securing LG&E’s first mortgage bonds constitutes a direct first mortgage lien upon much of the property owned by LG&E. In addition, Fidelia has a second secured lien on the property subject to the first mortgage bond lien.
26
KU’s power generating system consists of the coal-fired units operated at its four steam generating stations. Combustion turbines supplement the system during peak or emergency periods. KU owns and operates the following electric generating stations unless otherwise stated:
| | Summer Capability
Rating (Kw) | |
Steam Stations: | | | |
Tyrone – Woodford County, KY | | | |
Unit 1 | | 27,000 | |
Unit 2 | | 31,000 | |
Unit 3 | | 71,000 | |
Total Tyrone | | 129,000 | |
| | | |
Green River – Muhlenberg County, KY | | | |
Unit 3 | | 68,000 | |
Unit 4 | | 95,000 | |
Total Green River | | 163,000 | |
| | | |
E.W. Brown – Mercer County, KY | | | |
Unit 1 | | 101,000 | |
Unit 2 | | 167,000 | |
Unit 3 | | 429,000 | |
Total E.W. Brown | | 697,000 | |
| | | |
Ghent – Carroll County, KY | | | |
Unit 1 | | 475,000 | |
Unit 2 | | 484,000 | |
Unit 3 | | 493,000 | |
Unit 4 | | 493,000 | |
Total Ghent | | 1,945,000 | |
| | | |
Combustion Turbine Generators (Peaking capability): | | | |
E.W. Brown – Mercer County, KY (Units 5-11) (a) | | 757,000 | |
Haefling – Fayette County, KY | | 36,000 | |
Paddy’s Run – Jefferson County, KY (b) | | 74,000 | |
Trimble County – Trimble County, KY (c) | | 632,000 | |
Total combustion turbine generators | | 1,499,000 | |
| | | |
Total capability rating | | 4,433,000 | |
(a) Amount shown represents KU’s 47% interest in Unit 5, 62% interest in Units 6 and 7, 100% of units 8-11 at E.W. Brown and 90% of the Inlet Air Cooling system, attributable to E.W. Brown CT Unit 5 and Units 8 to 11. See Notes 10 and 11 of KU’s Notes to Financial Statements, under Item 8 for further discussion on ownership.
(b) Amount shown represents KU’s 47% interest in Unit 13 at Paddy’s Run. See Notes 10 and 11 of KU’s Notes to Financial Statements, under Item 8 for further discussion on ownership. LG&E operates this unit on behalf of KU.
(c) Amount shown represents KU’s 71% interest in Units 5 and 6 and KU’s 63% interest in Units 7, 8, 9 and 10 at Trimble County. See Notes 10 and 11 of KU’s Notes to Financial Statements, under Item 8 for further discussion on ownership. LG&E operates these units on behalf of KU.
KU also owns a 28 Mw nameplate-rated hydroelectric generating station located in Mercer County, Kentucky (Dix Dam), with an expected summer capability rating of 24 Mw, operated under a license issued by the FERC.
At December 31, 2005, KU’s electric transmission system included 110 substations with a total capacity of
27
approximately 16,978 Mva and approximately 4,031 miles of lines. The electric distribution system included 492 substations with a total capacity of approximately 6,322 Mva, 13,746 miles of overhead lines and 1,704 miles of underground conduit.
Other properties owned by KU include office buildings, service centers, warehouses, garages and other structures and equipment.
The trust indenture securing KU’s first mortgage bonds constitutes a direct first mortgage lien upon much of the property owned by KU. In addition, Fidelia has a second secured lien on the property subject to the first mortgage bond lien.
ITEM 3. Legal Proceedings.
Rates and Regulatory Matters
For a discussion of current rate and regulatory matters, including electric and natural gas base rate increase proceedings, the Kentucky attorney general investigation, VDT proceedings, Trimble County Unit 2 proceedings, Kentucky Commission, FERC and MISO proceedings, and other rate or regulatory matters affecting LG&E and KU, see Rates and Regulation for LG&E and KU under Item 1 and Note 3 of LG&E’s and KU’s Notes to Financial Statements under Item 8.
Environmental
For a discussion of environmental matters including additional reductions in SO2, NOx and other emissions mandated by recent regulations; items regarding LG&E’s Mill Creek generating plant, KU’s E.W. Brown plant and LG&E’s and KU’s manufactured gas plant sites; and other environmental items affecting LG&E and KU, see Executive Summary (Environmental Matters) and Note 10 of LG&E’s and KU’s Notes to Financial Statements under Item 8.
LG&E Employment Discrimination Case
In October 2001, approximately 30 employees or former employees filed a complaint against LG&E claiming past and current instances of employment discrimination against LG&E. LG&E has removed the case to the U.S. District Court for the Western District of Kentucky and filed an answer denying all plaintiffs’ claims. To date, the U.S. Equal Employment Opportunity Commission has declined to proceed to litigation on any claims reviewed. Through continuing mediation, settlements have been reached with the majority of plaintiffs, including the lead plaintiff. Negotiations continue with six plaintiffs. The complaint contains a claimed damage amount of $100 million as well as requests for injunctive relief, however, all prior settlements have been for non-material amounts and LG&E does not anticipate that the remaining outcome will have a material impact on its operations or financial condition.
Owensboro Contract Litigation
In May 2004, the City of Owensboro, Kentucky and Owensboro Municipal Utilities (collectively “OMU”), commenced a suit now removed to the U.S. District Court for the Western District of Kentucky, against KU concerning a long-term power supply contract (the “OMU Agreement”) with KU. The dispute involves interpretational differences regarding issues under the OMU Agreement, including various payments or charges
28
between KU and OMU and rights concerning excess power, termination and emissions allowances, respectively. The complaint seeks approximately $6 million in damages for periods prior to 2004 and OMU is expected to claim further amounts for later-occurring periods. OMU has additionally requested injunctive and other relief, including a declaration that KU is in material breach of the contract. KU has filed an answer in that court denying the OMU claims and presenting counterclaims. During 2005, the FERC declined KU’s application to exercise exclusive jurisdiction on matters. In July 2005, the district court resolved a summary judgment motion of KU in OMU’s favor, ruling that a contractual provision grants OMU the ability to terminate the contract without cause upon four years’ prior notice, which ruling is not yet final. At this time, the district court case is in the discovery stage and a trial schedule has not yet been established.
Other
In the normal course of business, other lawsuits, claims, environmental actions, and other governmental proceedings arise against LG&E and KU. To the extent that damages are assessed in any of these lawsuits, LG&E and KU believe that their insurance coverage is adequate. Management, after consultation with legal counsel, does not anticipate that liabilities arising out of other currently pending or threatened lawsuits and claims will have a material adverse effect on LG&E’s or KU’s financial position or results of operations, respectively.
ITEM 4. Submission of Matters to a Vote of Security Holders.
None.
PART II.
ITEM 5. Market for the Registrant’s Common Equity, Related Stockholder Matters and Issuer Purchases of Equity Securities.
LG&E:
All LG&E common stock, 21,294,223 shares, is held by E.ON U.S. Therefore, there is no public market for LG&E’s common stock.
The following table sets forth LG&E’s cash distributions on common stock paid to E.ON U.S. during 2005:
(in millions) | | | |
First quarter | | $ | 29 | |
Second quarter | | 10 | |
Third quarter | | — | |
Fourth quarter | | — | |
| | | | |
LG&E paid cash distributions on common stock to E.ON U.S. in the amount of $57 million in 2004 and $0 in 2003.
KU:
All KU common stock, 37,817,878 shares, is held by E.ON U.S. Therefore, there is no public market for KU’s common stock.
The following table sets forth KU’s cash distributions on common stock paid to E.ON U.S. during 2005:
29
(in millions) | | | |
First quarter | | $ | 30 | |
Second quarter | | 10 | |
Third quarter | | 10 | |
Fourth quarter | | — | |
| | | | |
KU paid cash distributions on common stock to E.ON U.S. in the amount of $63 million in 2004 and $0 in 2003.
30
ITEM 6. Selected Financial Data.
LG&E’s Management’s Discussion and Analysis of Financial Condition and Results of Operation and LG&E’s Notes to Financial Statements should be read in conjunction with the above information.
| | Years Ended December 31 | |
(in millions) | | 2005 | | 2004 | | 2003 | | 2002 | | 2001 | |
| | | | | | | | | | | |
KU: | | | | | | | | | | | |
Operating revenues | | $ | 1,207 | | $ | 995 | | $ | 892 | | $ | 862 | | $ | 821 | |
| | | | | | | | | | | |
Net operating income | | $ | 202 | | $ | 228 | | $ | 162 | | $ | 163 | | $ | 179 | |
| | | | | | | | | | | |
Net income | | $ | 112 | | $ | 134 | | $ | 91 | | $ | 93 | | $ | 96 | |
| | | | | | | | | | | |
Total assets | | $ | 2,756 | | $ | 2,610 | | $ | 2,505 | | $ | 2,252 | | $ | 1,827 | |
| | | | | | | | | | | |
Long-term obligations (including amounts due within one year) | | $ | 747 | | $ | 726 | | $ | 688 | | $ | 501 | | $ | 489 | |
KU’s Management’s Discussion and Analysis of Financial Condition and Results of Operation and KU’s Notes to Financial Statements should be read in conjunction with the above information.
31
ITEM 7. Management’s Discussion and Analysis of Financial Condition and Results of Operations.
GENERAL
The following discussion and analysis by management focuses on those factors that had a material effect on LG&E and KU’s financial results of operations and financial condition during 2005, 2004 and 2003 and should be read in connection with the financial statements and notes thereto.
Some of the following discussion may contain forward-looking statements that are subject to risks, uncertainties and assumptions. Such forward-looking statements are intended to be identified in this document by the words “anticipate,” “expect,” “estimate,” “objective,” “possible,” “potential” and similar expressions. Actual results may materially vary. Factors that could cause actual results to materially differ include: general economic conditions; business and competitive conditions in the energy industry; changes in federal or state legislation; unusual weather; actions by state or federal regulatory agencies; actions by credit rating agencies; and other factors described from time to time in LG&E’s and KU’s reports to the SEC, including Risk Factors in Item 1A of this report on Form 10-K and in Exhibit No. 99.01 to this report on Form 10-K.
EXECUTIVE SUMMARY
Our Business
LG&E and KU are each subsidiaries of E.ON U.S., which is an indirect subsidiary of E.ON, a German company. LG&E and KU maintain separate corporate identities and serve customers in Kentucky, Virginia and Tennessee under their respective names.
LG&E, incorporated in 1913 in Kentucky, is a regulated public utility that supplies natural gas to approximately 321,000 customers and electricity to approximately 394,000 customers in Louisville and adjacent areas in Kentucky. LG&E’s service area covers approximately 700 square miles in 17 counties and has an estimated population of one million. LG&E also provides natural gas service in limited additional areas. LG&E’s coal-fired electric generating plants, all equipped with systems to reduce SO2 emissions, produce most of LG&E’s electricity. The remainder is generated by a hydroelectric power plant and combustion turbines. Underground natural gas storage fields help LG&E provide economical and reliable natural gas service to customers.
KU, incorporated in Kentucky in 1912 and incorporated in Virginia in 1991, is a regulated public utility that provides electricity to approximately 495,000 customers in over 600 communities and adjacent suburban and rural areas in 77 counties in central, southeastern and western Kentucky, to approximately 30,000 customers in 5 counties in southwestern Virginia and 5 customers in Tennessee. KU’s coal-fired electric generating plants produce most of KU’s electricity, the remainder is generated by hydroelectric power plants and combustion turbines. In Virginia, KU operates under the name Old Dominion Power Company. KU also sells wholesale electric energy to 12 municipalities.
32
Our Customers
The following table provides statistics regarding LG&E and KU retail customers:
Customers (in thousands)
| | LG&E | | KU | | 2005% Retail Revenues | |
| | Electric | | Gas | | Electric | | LG&E | | KU | |
Retail Customer Data | | 2005 | | 2004 | | 2003 | | 2005 | | 2004 | | 2003 | | 2005 | | 2004 | | 2003 | | Electric | | Gas | | Electric | |
| | | | | | | | | | | | | | | | | | | | | | | | | |
Residential | | 347 | | 343 | | 337 | | 296 | | 293 | | 287 | | 433 | | 426 | | 421 | | 40 | % | 64 | % | 38 | % |
Industrial & Commercial | | 41 | | 41 | | 41 | | 24 | | 24 | | 24 | | 82 | | 82 | | 82 | | 50 | % | 31 | % | 49 | % |
Other | | 6 | | 6 | | 6 | | 1 | | 1 | | 1 | | 10 | | 10 | | 9 | | 10 | % | 5 | % | 13 | % |
Total Retail | | 394 | | 390 | | 384 | | 321 | | 318 | | 312 | | 525 | | 518 | | 512 | | 100 | % | 100 | % | 100 | % |
Our Mission
The mission of LG&E and KU is to build on our tradition and achieve world-class status providing reliable, low-cost energy services and superior customer satisfaction; and to promote safety, financial success and quality of life for our employees, communities and other stakeholders.
Our Strategy
LG&E’s and KU’s strategy focuses on the following:
• Achieve scale as an integrated U.S. electric and gas business through organic growth;
• Maintain excellent customer satisfaction;
• Maintain best-in-class cost position versus U.S. utility companies;
• Develop and transfer best practices throughout the company;
• Invest in infrastructure to meet expanding load and comply with increasing environmental requirements;
• Achieve appropriate regulated returns on all investment;
• Attract, retain and develop the best people; and
• Act with a commitment to corporate social responsibility that enhances the well being of our employees, demonstrates environmental stewardship, promotes quality of life in our communities and reflects the diversity of the society we serve.
Low Rates
LG&E and KU believe they are well positioned in the regulated Kentucky market. LG&E and KU continue to sustain high customer satisfaction, ranking first among all large Midwest utilities for the 6th time in 7 years in the J.D. Power and Associates 2005 survey of residential electric customers. This excellent performance is balanced with cost control. The customer benefits of the LG&E and KU culture of cost management are evident in rate comparisons among U.S. utilities. The following chart compares the total residential average rate per thousand Kwh of U.S. investor-owned utilities as of July 1, 2005:
33

Source: Edison Electric Institute, Summer 2005 Typical Bills and Average Rates Report; Residential rates in effect July 1, 2005, based on 1,000 kWh monthly usage.
LG&E and KU must continue to address new cost pressures. The Kentucky Commission accepted the settlement agreements reached by the majority of the parties in the rate cases filed by LG&E and KU in December 2003. New rates, implemented in July 2004, produced approximately $55 million of revenue for LG&E and approximately $46 million of revenue for KU for a full year. Under the settlement agreements, the LG&E utility base electric rates have increased approximately $43 million (7.7%) and base natural gas rates have increased approximately $12 million (3.4%) annually. Base electric rates at KU have increased approximately 6.8% annually. The 2004 increases were the first increases in electric base rates for LG&E and KU in 13 and 20 years, respectively; the last natural gas rate increase for the LG&E natural gas utility took effect in September 2000. Competitors also face these same cost pressures that caused LG&E and KU to initiate rate cases (e.g., pensions, benefits and reliability expenditures) and many other utility companies already have rate cases in process. Despite these increases, LG&E and KU rates remain significantly lower than the national average.
Commodity Prices: Fuel and Electricity
Natural gas prices have risen dramatically in 2005, averaging over $8/MMBtu and spiking as high as $15/MMBtu in late September following the hurricanes that interrupted natural gas production activities in the Gulf of Mexico. Although the supply problems created by the hurricanes have improved significantly, the underlying and fundamental U.S. supply-demand imbalance shows no sign of easing. While U.S. natural gas reserves are in structural decline, natural gas demand is increasing. The natural gas outlook is projected to maintain this pattern until significant new supply, in the form of LNG or new discoveries, enters the marketplace.
Coal price increases continued during 2005, up nearly 60% overall since the beginning of 2004, with modest increases projected over the near term. The rise in oil and natural gas prices, combined with the supply of coal not keeping pace with demand, have resulted in substantially higher coal prices over the last two years.
34
The graph displays the LG&E, KU and combined utility average utility natural gas and coal purchase prices.
Actual natural gas costs are recovered from customers through the GSC. The GSC also contains an incentive component, the PBR component, which is determined for each 12-month period ending October 31.
Actual fuel costs associated with retail electric sales are recovered from customers through the FAC. The Utilities’ base rates contain an embedded fuel cost component. The FAC reconciles the difference between this fuel cost component and the actual fuel cost, including transportation costs. Refunds to customers occur if the actual costs are below the embedded cost component. Additional charges to customers occur if the actual costs exceed the embedded cost component.
With respect to wholesale electricity prices, generation over-capacity in the Midwest United States is forecasted to persist, with reserve margins over 23% for ECAR in 2006. However, the over-capacity results largely from the construction of natural gas-fired units. High natural gas prices have supported higher wholesale electricity prices, providing advantages to coal-fired generation. While the regional reserve margin is expected to decline over time as new capacity construction slows and demand grows, natural gas-fired generation is expected to set prices, particularly during times of higher loads. This expectation, combined with the expectation that natural gas prices will remain high, indicates that peak electricity prices are expected to remain high.
Generation Reliability
Generation reliability also remains a key aspect to meeting the Companies’ strategy. LG&E and KU believe that they have maintained good performance and reliability in the key area of utility generation operation. While maintaining low cost levels, LG&E and KU have also been able to generate increasing volumes and expect to continue high levels of availability and low outage levels. This performance is also important to maintaining margins from off-system sales.
Generation Capacity
The installation of Trimble County Units 7-10, completed in 2004, increased total system capability by 9%. However, the IRP submitted by LG&E and KU to the Kentucky Commission in 2005, outlining the least cost alternative to meet Kentucky’s needs, indicated the requirement for additional base-load capacity by 2010. Consequently, LG&E and KU have begun development efforts for another base-load coal-fired unit at the Trimble County site. LG&E and KU believe this is the least cost alternative to meet the future needs of
35
customers. Trimble County Unit 2, with a 750 MW capacity rating, is expected to be jointly owned by LG&E and KU (75% owners of the unit) and IMEA and IMPA (25% owners). Trimble County Unit 2 is expected to cost $1.1 billion and be completed by 2010. LG&E’s and KU’s aggregate 75% share of the total Trimble County Unit 2 capital cost is approximately $885 million and is estimated to be approximately $120 million and $510 million, respectively, through 2008.
An application for a construction CCN was filed with the Kentucky Commission in December 2004 and initial CCN applications for three transmission lines were filed in early 2005, with further applications submitted in December 2005. The proposed air permit was filed with the Kentucky Division for Air Quality in December 2004. In November 2005, the Kentucky Commission approved the application of LG&E and KU to expand the Trimble County generating plant. Kentucky Commission approval for one transmission line CCN was granted in September 2005 and a ruling that a second transmission line was not subject to the CCN process was received in February 2006. LG&E and KU hope to obtain approval for the remaining transmission line CCN during 2006. The transmission lines are also subject to routine regulatory filings and the right-of-way acquisition process. In November 2005, the Kentucky Division for Air Quality issued the final air permit, which was challenged in December 2005 by an environmental advocacy group. Administrative proceedings with respect to the challenge are expected to commence during the first quarter of 2006.
In October 2005, LG&E received from the FERC a new license to upgrade, operate and maintain the Ohio Falls Hydroelectric Project. The license is for a period of 40 years, effective November 2005. LG&E intends to spend approximately $76 million to refurbish the facility and add approximately 20 Mw of generating capacity over the next seven years.
Environmental Matters
In addition to the Trimble County Unit 2 project, the second major area of utility investment is environmental expenditures. LG&E and KU are subject to SO2 and NOx emission limits on their electric generating units pursuant to the Clean Air Act. LG&E and KU placed into operation significant NOx controls for their generating units prior to the 2004 summer ozone season. As of December 31, 2005, LG&E and KU have incurred total capital costs of approximately $188 million and $217 million, respectively, since 2000 to reduce their NOx emissions below required levels. In addition, LG&E and KU have incurred additional operating and maintenance costs in operating the new NOx controls.
In March 2005, the EPA issued the final CAIR which requires substantial additional reductions in SO2 and NOx emissions from electric generating units. The CAIR provides for a two-phased reduction program with Phase I reductions in NOx and SO2 emissions in 2009 and 2010, respectively, and Phase II reductions in 2015. On March 15, 2005, the EPA issued a related regulation, the final CAMR, which requires substantial mercury reductions from electric generating units. CAMR also provides for a two-phased reduction, with the Phase I target in 2010 achieved as a “co-benefit” of the controls installed to meet CAIR. Additional control measures will be required to meet the Phase II target in 2018. Both CAIR and CAMR establish a cap and trade framework, in which limits are set on total emissions and allowances can be bought or sold on the open market, to be used for compliance, unless the state chooses another approach.
In order to meet these new regulatory requirements, KU has implemented a plan for adding significant additional SO2 controls to its generating units. Installation of additional SO2 controls will proceed on a phased basis, with construction of controls (i.e., FGDs) having commenced in September 2005, and continuing through the final installation and operation in 2009. KU estimates that it will incur approximately $560 million in capital costs related to the construction of the FGDs over the next three years to achieve compliance with current emission limits on a company-wide basis. In addition, KU will incur additional operating and maintenance costs
36
in operating the new SO2 controls. LG&E currently has FGDs on all its units but will continue to evaluate improvements to further reduce SO2 emissions.
Kentucky law permits LG&E and KU to recover the costs of complying with the Federal Clean Air Act, including a return of operating expenses, and a return of and on capital invested, through the ECR mechanism. Approximately 80% of the applicable environmental costs, including investment and operating costs, are recoverable through the ECR. The remaining 20%, attributable to off-system and non-Kentucky jurisdictional sales, are not recoverable through the ECR.
COMPANY STRUCTURE
As contemplated in their regulatory filings in connection with the E.ON acquisition of Powergen in 2002, E.ON, Powergen and E.ON U.S. completed an administrative reorganization to move the LG&E Energy Corp. group from an indirect Powergen subsidiary to an indirect E.ON subsidiary. This reorganization was effective in March 2003. In early 2004, E.ON U.S. began direct reporting arrangements to E.ON.
Effective December 30, 2003, LG&E Energy LLC became the successor, by assignment and subsequent merger, to all the assets and liabilities of LG&E Energy Corp.
Effective December 1, 2005, LG&E Energy LLC was renamed E.ON U.S. LLC.
The utility operations of E.ON U.S. have continued their separate identities as LG&E and KU. The preferred stock and debt securities of LG&E and KU were not affected by these transactions.
37
RESULTS OF OPERATIONS
LG&E
Net Income
LG&E’s net income in 2005 increased $33.3 million (34.8%) compared to 2004. The increase resulted primarily from higher electric revenues due to increased retail sales volumes resulting from warmer summer weather and increased base rates implemented for service rendered on and after July 1, 2004. Wholesale revenues also increased due to higher volumes and higher prices. These increases were partially offset by increased fuel and power purchased costs largely due to MISO Day 2 costs.
LG&E’s net income in 2005 related to the electric business increased $32.2 million (36.9%) compared to 2004. Electric operating revenues increased $171.7 million (21.0%), partially offset by higher fuel for electric generation and power purchased of $122.6 million (40.8%). Income tax and depreciation expense increased $11.7 million (24.2%) and $6.2 million (6.2%), respectively.
LG&E’s net income in 2005 related to the natural gas business increased $1.1 million (13.1%) compared to 2004. Natural gas operating revenues increased $79.8 million (22.3%) offset by higher natural gas supply expenses of $73.4 million (27.6%). Other natural gas operations and maintenance expenses increased $3.6 million (7.2%) and depreciation expense increased $1.3 million (7.8%).
During 2005, LG&E made out-of-period adjustments for estimated over/under collection of ECR revenues to be billed in subsequent periods. The adjustments related to the reporting periods of March 2003 through December 2004. As a result, LG&E revenues for 2005 increased by $5.3 million and net income for 2005 increased by $3.2 million. LG&E revenues for 2004 and 2003 were understated by $2.4 million and $2.9 million, respectively, and net income was understated by $1.4 million and $1.8 million, respectively.
LG&E’s net income in 2004 increased $4.8 million (5.3%) compared to 2003. The increase resulted primarily from higher electric revenues due to increased base rates implemented for service rendered on and after July 1, 2004, following the electric rate case order and higher wholesale revenues, somewhat offset by higher maintenance expenses related to storm restoration costs. Operating expenses for 2004 reflect $12.7 million in expenses related to severe May and July storms.
LG&E’s net income in 2004 related to the electric business increased $6.6 million (8.2%) compared to 2003. Electric operating revenues increased $47.5 million (6.2%), offset by higher fuel for electric generation and power purchased of $22.8 million (8.2%). Other electric operations and maintenance expenses increased $11.1 million (4.9%). Electric depreciation expense increased $3.5 million (3.6%). Interest expense increased $1.6 million (6.2%).
LG&E’s net income in 2004 related to the natural gas business decreased $1.8 million (17.6%) compared to 2003. Natural gas operating revenues increased $31.8 million (9.8%) offset by higher natural gas supply expenses of $32.4 million (13.9%). Other natural gas operations and maintenance expenses increased $2.0 million (4.2%).
38
Revenues
The following table presents a comparison of operating revenues for the years 2005 and 2004 with the immediately preceding year.
(in millions) | | | |
| | | |
| | Increase (Decrease) From Prior Period | |
| | Electric Revenues | | Gas Revenues | |
Cause | | 2005 | | 2004 | | 2005 | | 2004 | |
Retail sales: | | | | | | | | | |
Fuel and gas supply adjustments | | $ | 23.3 | | $ | 5.8 | | $ | 66.6 | | $ | 33.6 | |
LG&E/KU Merger surcredit | | (1.0 | ) | (2.3 | ) | — | | — | |
Environmental cost recovery surcharge | | 10.0 | | 7.3 | | — | | — | |
Earnings sharing mechanism | | (5.6 | ) | (5.8 | ) | — | | — | |
Demand side management | | (0.3 | ) | 0.4 | | — | | (0.6 | ) |
VDT surcredit | | (0.9 | ) | (1.1 | ) | (0.6 | ) | 0.1 | |
Weather normalization adjustment | | — | | — | | (2.7 | ) | 3.2 | |
Rate changes | | 24.8 | | 16.8 | | 4.9 | | 7.0 | |
Variation in sales volumes and other | | 27.5 | | 11.8 | | (0.1 | ) | (5.8 | ) |
Total retail sales | | 77.8 | | 32.9 | | 68.1 | | 37.5 | |
Wholesale | | 73.7 | | 15.8 | | 11.8 | | (5.1 | ) |
MISO Day 2 | | 18.2 | | — | | — | | — | |
Gas transportation-net | | — | | — | | (0.7 | ) | 0.1 | |
Other | | 2.0 | | (1.2 | ) | 0.6 | | (0.7 | ) |
Total | | $ | 171.7 | | $ | 47.5 | | $ | 79.8 | | $ | 31.8 | |
Electric revenues increased in 2005 primarily due to higher wholesale sales and MISO related revenues, higher fuel costs billed to the customer through the fuel adjustment clause and new rates implemented in July 2004. These increases were partially offset by the discontinuation of the ESM in the second quarter of 2005. Retail revenues increased 5.4% due to higher sales volume, primarily due to warmer summer weather than experienced in 2004. Cooling degree days increased 13% compared to 2004 and were 14% higher than the 20-year average. Wholesale revenues increased due to the combination of a 29% increase in prices and 11% higher volumes. The price increase was largely due to higher fuel prices and the volume increase was primarily due to increased demand for LG&E generation in the region.
Electric revenues increased in 2004 primarily due to new rates implemented in July 2004. Retail revenues increased 2.0% due to higher sales volume, primarily due to warmer summer weather than 2003. Cooling degree days increased 21% compared to 2003 and were 2% higher than the 20-year average.
Natural gas revenues in 2005 increased due to higher gas supply cost billed to customers through the gas supply clause and increased natural gas rates. New natural gas rates took effect in July 2004 increasing revenues by 1.3% in 2005. Despite remaining 1% lower than the 20-year average, the number of heating degree days in 2005 increased 6% as compared to 2004. This increase in heating degree days was offset by the effect of higher natural gas prices which curtailed natural gas usage and resulted in slightly lower natural gas sales volumes.
Natural gas revenues in 2004 increased due to higher gas supply cost billed to customers through the gas supply clause and increased gas rates. New natural gas rates took effect in July 2004 increasing revenues by 2.3% in 2004. These increases were partially offset by lower retail sales due to warmer winter weather and lower wholesale sales. Heating degree days decreased 8% as compared to 2003 and were 8% lower than the 20-year average.
39
Expenses
Fuel for electric generation and natural gas supply expenses comprise a large component of LG&E’s total operating costs. The retail electric rates contain an FAC and natural gas rates contain a GSC, whereby increases or decreases in the cost of fuel and natural gas supply are reflected in the FAC and GSC factors, subject to approval by the Kentucky Commission, and passed through to LG&E’s retail customers.
Fuel for electric generation increased $74.1 million (35.6%) in 2005 primarily due to:
• Increased cost of fuel burned ($61.8 million) due to the MISO’s dispatch of natural gas-fired units and higher coal and natural gas prices
• Increased generation ($12.3 million) due to increased demand and the dispatch of units for MISO Day 2
Fuel for electric generation increased $10.3 million (5.2%) in 2004 primarily due to:
• Increased cost of fuel burned ($6.4 million) due to higher fuel prices
• Increased generation ($3.7 million) due to increased demand
Power purchased increased $48.5 million (52.7%) in 2005 primarily due to:
• Increased unit cost per Mwh of purchases ($40.7 million) due to higher fuel prices
• Increased volumes purchased ($7.7 million) due to increased demand and unit outages
• Purchased power costs from the MISO due to unit outages totaled $9.8 million
Power purchased increased $12.5 million (15.7%) in 2004 primarily due to:
• Increased unit cost per Mwh of purchases ($9.0 million) due to higher fuel prices
• Increased volumes purchased ($3.4 million) due to increased demand and unit outages
Gas supply expenses increased $73.4 million (27.6%) in 2005 primarily due to:
• Increased cost of net gas supply ($61.7 million) due to the increase in natural gas prices in 2005
• Increased volumes of natural gas delivered to the distribution system ($11.7 million)
Gas supply expenses increased $32.4 million (13.9%) in 2004 primarily due to:
• Increased cost of net gas supply ($52.2 million) due to the increase in natural gas prices in 2004
• Decreased volumes of natural gas delivered to the distribution system ($19.8 million)
Other operation and maintenance expenses increased $3.1 million (1.0%) in 2005 primarily due to higher other operation expense ($10.6 million) and higher property taxes ($1.7 million), partially offset by lower maintenance expense ($9.2 million).
Other operation expenses increased $10.6 million (4.9%) in 2005 primarily due to:
• Increased other power supply costs ($17.2 million) due largely to MISO Day 2 costs ($18.2 million) for administrative and allocated charges from the MISO for Day 2 operations
• Increased steam generation expenses ($3.5 million) primarily for scrubber reactant and waste disposal
• Increased employee benefit costs ($3.3 million)
• Increased customer service and collection expenses ($2.0 million)
• Decreased transmission costs ($10.5 million), due largely to MISO Day 2 ($13.4 million). Prior to the MISO Day 2 market, most bilateral transactions required the purchase of transmission; however, with the Day 2 market, most transactions are handled directly with the MISO and no additional transmission is necessary
• Decreased distribution operating costs ($5.0 million) due to fewer storms in 2005
40
Maintenance expenses decreased $9.2 million (12.7%) in 2005 primarily due to:
• Decreased distribution maintenance ($8.5 million) due to fewer storms in 2005
• Decreased steam generation expense ($2.1 million)
• Increased administrative and general maintenance expenses ($1.3 million)
Other operation and maintenance expenses increased $14.6 million (5.0%) in 2004 primarily due to higher maintenance expenses ($15.6 million) and higher property and other taxes ($1.6 million), partially offset by lower operation expenses ($2.5 million).
Maintenance expenses increased $15.6 million (27.3%) in 2004 primarily due to:
• Increased distribution maintenance expense ($10.0 million) primarily due to restoration costs related to severe May and July storms
• Increased natural gas system maintenance and administrative and general expenses ($2.6 million)
• Increased steam generation expense due to timing of scheduled maintenance ($1.4 million)
• Increased combustion turbine and hydro generation maintenance ($1.6 million)
Other operation expenses decreased $2.5 million (1.2%) in 2004 primarily due to:
• The KU/LG&E merger costs and the One Utility initiative costs were fully amortized in 2003, resulting in $2.8 million lower expense in 2004
• Decreased benefits expense ($1.7 million), primarily due to lower pension expense ($2.1 million) as a result of the $34.5 million pension funding in January 2004, partially offset by higher medical insurance expense
• Decreased steam generation expense ($1.2 million)
• Increased operations expense due to storm restoration costs related to severe storms in May and July 2004 ($3.1 million)
Depreciation and amortization increased $7.5 million (6.4%) in 2005 and $3.3 million (2.9%) in 2004 due to additional plant in service.
Other income (expense) - net increased $4.0 million (121.2%) in 2005 primarily due to:
• Increased non-operating income ($2.3 million)
• Decreased income deductions ($1.3 million)
• Increased interest income ($0.3 million)
Other income (expense) - net increased $3.9 million (54.2%) in 2004 primarily due to:
• Decreased income deductions ($3.0 million) primarily for 2003 write-offs of terminated projects
• Increased other income ($0.9 million)
Interest expense increased $4.0 million (12.2%) in 2005 primarily due to:
• Increased interest rates on variable-rate debt ($6.4 million)
• Increased borrowing from the money pool ($1.5 million)
• Decreased cost of interest rate swaps ($3.2 million)
• Decreased costs due to refinancing fixed rate debt with variable rate debt ($0.8 million)
Interest expense increased $2.1 million (6.8%) in 2004 primarily due to:
• Increased borrowing from Fidelia ($6.9 million)
41
• Increased cost of interest rate swaps ($3.0 million)
• Increased cost of variable-rate debt ($0.8 million)
• Decreased cost due to lower first mortgage debt ($7.2 million)
• Decreased borrowing from the money pool ($1.4 million)
Details of LG&E’s exposure to variable interest rates on long-term debt are shown in the table below:
| | 2005 | | 2004 | | 2003 | |
Unswapped variable rate debt ($ in millions) | | $ | 363.0 | | $ | 306.0 | | $ | 306.0 | |
Percentage of unswapped variable rate debt to total long-term debt | | 44.2 | % | 35.1 | % | 38.3 | % |
Weighted average interest rate on variable rate debt for the year | | 2.49 | % | 1.28 | % | 1.10 | % |
Weighted average interest rate on total long-term debt at year-end, including expense amortization and interest rate swaps | | 4.13 | % | 3.92 | % | 3.58 | % |
| | | | | | | | | | |
See Note 8 of LG&E’s Notes to the Financial Statements under Item 8.
Variations in income tax expenses are largely attributable to changes in pre-tax income. LG&E’s 2005 effective income tax rate decreased to 33.5% from the 35.8% rate in 2004 primarily due to the reduction in tax accruals after the conclusion of IRS audits. See Note 7 of LG&E’s Notes to Financial Statements under Item 8.
The rate of inflation may have a significant impact on LG&E’s operations, its ability to control costs and the need to seek timely and adequate rate adjustments. However, relatively low rates of inflation in the past few years have moderated the impact on current operating results.
CRITICAL ACCOUNTING POLICIES/ESTIMATES
Preparation of financial statements and related disclosures in compliance with generally accepted accounting principles requires the application of appropriate technical accounting rules and guidance, as well as the use of estimates. The application of these policies necessarily involves judgments regarding future events, including legal and regulatory challenges and anticipated recovery of costs. These judgments, in and of themselves, could materially impact the financial statements and disclosures based on varying assumptions, which may be appropriate to use. In addition, the financial and operating environment also may have a significant effect, not only on the operation of the business, but on the results reported through the application of accounting measures used in preparing the financial statements and related disclosures, even if the nature of the accounting policies applied has not changed. Specific risks for these critical accounting policies are described in the following paragraphs. Each of these has a higher likelihood of resulting in materially different reported amounts under different conditions or using different assumptions. Events rarely develop exactly as forecasted and the best estimates routinely require adjustment. See also Note 1 of LG&E’s Notes to Financial Statements under Item 8.
Unbilled Revenue – At each month end LG&E prepares a financial estimate that projects electric and natural gas usage by customers that has not been billed. The estimated usage is based on allocating the daily system net deliveries between billed volumes and unbilled volumes. The allocation is based on a daily ratio of the number of meter reading cycles remaining in the month to the total number of meter reading cycles in each month. Each day’s ratio is then multiplied by each day’s system net deliveries to determine an estimated billed and unbilled volume for each day of the accounting period. At December 31, 2005, a 10% change in these estimated quantities would cause revenue and accounts receivable to change by approximately $8.2 million, including $3.2 million for electric usage and $5.0 million for natural gas usage. See also Note 1 of LG&E’s Notes to Financial Statements under Item 8.
42
Allowance for Doubtful Accounts – At December 31, 2005 and 2004, the LG&E allowance for doubtful accounts was $1.1 million and $0.8 million, respectively. The allowance is based on the ratio of the amounts charged-off during the last twelve months to the retail revenues billed over the same period multiplied by the retail revenues billed over the last four months. Accounts with no payment activity are charged-off after four months, although collection efforts continue thereafter.
Pension and Post-retirement Benefits – LG&E has both funded and unfunded non-contributory defined benefit pension and post-retirement benefit plans that together cover substantially all of its employees. The plans are accounted for under SFAS No. 87, Employers’ Accounting for Pensions, and SFAS No. 106, Employers’ Accounting for Postretirement Benefits Other than Pensions.
The pension and other post-retirement benefit plan costs and liabilities are determined on an actuarial basis and are dependent upon numerous economic assumptions, such as discount rates, rates of compensation increases, estimates of the expected return on plan assets and health care cost trend rates and demographic and economic assumptions. The actuarial assumptions used may differ materially from actual results due to changing market and economic conditions, higher or lower health care costs or turnover, or longer or shorter life spans of participants. These differences may result in a significant impact on the amount of expenses recorded in future periods. The underlying assumptions and estimates related to the pension and post-retirement benefit plan costs and liabilities are reviewed annually.
The assumed discount rate, expected return on assets and rate of compensation increases generally have the most significant impact on the pension costs and liabilities. The discount rate is used to calculate the actuarial present value of the benefits provided by the plans. LG&E bases its discount rate assumption on Moody’s Aa Corporate Bond Rate rounded to the nearest 25 basis points, which has a duration comparable to the weighted average duration of the plans.
The expected long-term rate of return on assets is used to calculate the net periodic pension costs for the plans. To develop the expected long-term rate of return on assets assumption, consideration is given to the current level of expected returns on risk free investments (primarily government bonds), the historical performance of the asset managers versus their respective benchmarks, the historical level of the risk premium associated with the other asset classes in which the portfolio is invested and the expectations for future returns of each asset class. The expected return for each asset class is then weighted based on a target asset allocation. For 2005, the actual return on pension assets was comparable to the assumed expected rate of return.
The following describes the effects on pension benefits by changing the major actuarial assumptions discussed above:
• A 1% change in the assumed discount rate could have an approximate $48.8 million positive or negative impact to the 2005 accumulated benefit obligation of LG&E.
• A 25 basis point change in the expected rate of return on assets would have an approximate $0.8 million positive or negative impact on 2005 pension expense.
Compensation rate increases are used to calculate service costs and the projected benefit obligation. Such rates are based on a review of LG&E’s actual historical salaries, promotion and bonus increases. For 2005 net periodic pension benefit costs, LG&E used an assumption of 4.50%. Based on plan experience, the rate was increased to 5.25% for the projected benefit obligation at December 31, 2005.
43
When the plan experience differs from the actuarial assumptions, a portion of the difference may be deferred and is subject to amortization at rates based on the estimated average years of participants’ future service. LG&E’s deferred losses on these assumptions were $24.4 million (35%) higher in 2005 than 2004 and $14.0 million (25%) higher in 2004 than 2003, primarily due to declining discount rate assumptions during these years.
The assumptions related to the discount rate, retirement, turnover and healthcare cost trends, which represent expected rates of increase in health care claim payments, generally have the most significant impact on LG&E’s post-retirement benefit plan costs and liabilities. Unlike pensions, however, assumptions about per capita claims cost by age and participation rates also significantly impact post-retirement liability computations. A 1% change in the healthcare cost trend rates could have a positive or negative impact on the 2005 post-retirement benefit obligation and post-retirement expense of approximately $3.0 million and $0.3 million, respectively.
Additionally, demographic and other economic assumptions affect the pension and post-retirement computations. Beginning with the December 31, 2005 liability, LG&E replaced the 1983 Group Annuity Mortality tables for males and females with the RP 2000 combined tables for males and females projected to 2006. These updated healthy mortality tables will be used for the 2006 expense.
The benefit obligation is compared with the plan asset values to determine a net position. Asset values are increased primarily by actual rates of return on plan assets and by employer contributions. For explanation of the investment policy including targeted asset allocations, see Note 6 of LG&E’s Notes to Financial Statements under Item 8.
The pension plans are funded in accordance with all applicable requirements of the ERISA and the IRC. In accordance with the ERISA guidelines, LG&E made discretionary contributions to the pension plans of $89.1 million in 2003 and $34.5 million in 2004. No contributions were made in 2005. LG&E made a discretionary contribution of $17.5 million during 2006 and anticipates making additional contributions as deemed necessary. Additionally, LG&E made a contribution of $0.7 million to the post-retirement plan in 2005, representing the maximum employer contribution under IRC Section 401(h) requirements for all plan years through 2004. LG&E may continue to make subsequent contributions in accordance with the maximum funding limitation governed by tax laws.
As prescribed by SFAS No. 87, LG&E was required to recognize an additional minimum pension liability of $19.2 million and $10.2 million during 2005 and 2004, respectively, since the fair value of the plan assets was less than the accumulated benefit obligation at that time. This additional minimum pension liability was recorded as a reduction to other comprehensive income and did not affect net income. Historically low corporate bond rates, used to determine the discount rate, significantly increased the potential value of the pension liabilities above the actual value of the plan assets. If the fair value of the plan assets exceeds the accumulated benefit obligation, the recorded liability will be reduced and other comprehensive income will be restored in the balance sheet. In 2003, LG&E recognized a reduction of the minimum pension liability of $3.1 million.
Should poor market conditions return or should interest rates decline further, LG&E’s unfunded accumulated benefit obligations and future pension expense could increase. The Company believes that such increases are recoverable in whole or in part under future rate proceedings or mechanisms.
See also Note 6 and Note 14 of LG&E’s Notes to Financial Statements under Item 8.
44
Regulatory Mechanisms – Judgments and uncertainties include future regulatory decisions, the impact of deregulation and competition on ratemaking process, and external regulatory decisions. Regulatory assets represent incurred costs that have been deferred because they are probable of future recovery in customer rates based upon Kentucky Commission orders. Regulatory liabilities generally represent obligations to make refunds to customers for previous collections based upon orders by the Kentucky Commission. Management believes, based on orders, the existing regulatory assets and liabilities are probable of recovery. This determination reflects the current regulatory climate in the state. If future recovery of costs ceases to be probable the assets and liabilities would be required to be recognized in current period earnings.
See also Note 3 of LG&E’s Notes to Financial Statements under Item 8.
Income Taxes - Income taxes are accounted for under SFAS No. 109, Accounting for Income Taxes. In accordance with this statement, deferred tax assets and liabilities are recognized for the future tax consequences attributable to differences between the financial statement carrying amounts of existing assets and liabilities and their respective tax bases, as measured by enacted tax rates that are expected to be in effect in the periods when the deferred tax assets and liabilities are expected to be settled or realized. Significant judgment is required in determining the provision for income taxes, and there are transactions for which the ultimate tax outcome is uncertain.
To provide for these uncertainties or exposures, an allowance is maintained for tax contingencies based on management’s best estimate of probable loss. Tax contingencies are analyzed periodically and adjustments are made when events occur to warrant a change. On September 19, 2005, LG&E received notice from the Congressional Joint Committee on Taxation approving the Internal Revenue Service’s audit of LG&E’s income tax returns for the periods December 1999 through December 2003. As a result of resolving numerous tax matters during these periods, LG&E reduced income tax accruals by $3.8 million during 2005.
H. R. 4520, known as the “American Jobs Creation Act of 2004” allows electric utilities to take a deduction of up to 3% of their qualified production activities income in 2005. This deduction reduced LG&E’s effective tax rate by less than 1% for 2005.
Kentucky House Bill 272, also known as “Kentucky’s Tax Modernization Plan,” was signed into law in March 2005. This bill contains a number of changes in Kentucky’s tax system, including the reduction of the Corporate income tax rate from 8.25% to 7% effective January 1, 2005, and a further reduction to 6% effective January 1, 2007. As a result of the income tax rate change, LG&E’s deferred tax reserve amount will exceed its actual deferred tax liability attributable to existing temporary differences since the new statutory rates are lower than the rates were when the deferred tax liability originated. This excess amount is referred to as excess deferred income taxes. In June 2005, LG&E received approval from the Kentucky Commission to establish and amortize a regulatory liability ($16.3 million) for its net excess deferred income tax balances. Under this accounting treatment, LG&E will amortize its depreciation-related excess deferred income tax balances under the average rate assumption method. The average rate assumption method matches the amortization of the excess deferred income taxes with the life of the timing differences to which it relates. Excess deferred income tax balances related to non-depreciation timing differences will be expensed in the current year due to their immaterial amount.
LG&E expects to have adequate levels of taxable income to realize its recorded deferred taxes.
For further discussion of income tax issues, see Note 1 and Note 7 of LG&E’s Notes to Financial Statements
45
under Item 8.
NEW ACCOUNTING PRONOUNCEMENTS
The following recent accounting pronouncements affected LG&E in 2005 and 2004:
FIN 47
LG&E adopted Financial Accounting Standards Board Interpretation No. 47, Accounting for Conditional Asset Retirement Obligations, an interpretation of FASB Statement No. 143 (FIN 47) effective December 31, 2005. FIN 47 expands the term “conditional asset retirement obligation” as used in SFAS No. 143, Accounting for Asset Retirement Obligations, to refer to a legal obligation to perform an asset retirement activity in which the timing and/or method of settlement are conditional on a future event that may or may not be within the control of the entity. The obligation to perform the asset retirement activity is unconditional even though uncertainty exists about the timing and/or method of settlement. An entity is required to recognize a liability for the fair value of a conditional asset retirement obligation if the fair value of the liability can be reasonably estimated. The fair value of a liability for the conditional asset retirement obligation should be recognized when incurred; generally, upon acquisition, construction, or development and through the normal operation of the asset.
As a result of the implementation of FIN 47, LG&E recorded additional ARO net assets and liabilities during the fourth quarter of 2005 in the amount of $1.0 million and $15.7 million, respectively. LG&E also recorded a cumulative effect adjustment in the amount of $12.3 million to reflect the accumulated depreciation and accretion of ARO assets at the transition date less amounts previously accrued under regulatory depreciation. A $2.4 million reduction in the accumulated cost of removal regulatory liability was also recorded for this previously accrued cost of removal. LG&E recorded offsetting regulatory assets of $12.3 million, pursuant to regulatory treatment prescribed under SFAS No. 71, Accounting for the Effects of Certain Types of Regulation, as the costs of removal are allowed under Kentucky Commission ratemaking.
Had FIN 47 been in effect at the beginning of the 2004 reporting period, LG&E would have established asset retirement obligations as described in the following table (in millions):
| | 2005 | | 2004 | |
Provision at beginning of the year | | $ | 14.8 | | $ | 14.0 | |
Accretion expense | | 0.9 | | 0.8 | |
Provision at end of the year | | $ | 15.7 | | $ | 14.8 | |
See Note 1 of LG&E’s Notes to Financial Statements under Item 8 for further discussion of FIN 47.
LIQUIDITY AND CAPITAL RESOURCES
LG&E uses net cash generated from its operations and external financing (including financing from affiliates) to fund construction of plant and equipment and the payment of dividends. LG&E believes that such sources of funds will be sufficient to meet the needs of its business in the foreseeable future.
As of December 31, 2005, LG&E is in a negative working capital position in part because of the classification of certain variable-rate pollution control bonds totaling $246.2 million that are subject to tender for purchase at the option of the holder as current portion of long-term debt. Backup credit facilities totaling $185 million are in place to fund such tenders if necessary. LG&E has never needed to access these facilities. LG&E expects to cover any working capital deficiencies with cash flow from operations, money pool borrowings and borrowings
46
from Fidelia.
Operating Activities
Cash provided by operations was $150.4 million, $171.6 million and $163.3 million in 2005, 2004 and 2003, respectively.
The 2005 decrease of $21.2 million was primarily the result of changes in:
• Inventory ($60.6 million) largely the result of increased coal and gas prices
• Deferred income taxes ($19.8 million)
• Accounts receivable ($18.1 million) primarily due to colder December weather
• Gas supply recovery ($13.5 million) primarily due to higher natural gas prices
• Prepayments and other ($9.3 million)
• ESM recovery ($8.1 million) due to termination of the ESM program
These decreases were partially offset by changes in:
• Accounts payable ($48.8 million) primarily from the increase in natural gas prices
• Earnings ($33.3 million)
• Pension funding ($24.7 million)
The 2004 increase of $8.3 million was primarily the result of changes in:
• Pension funding ($54.6 million)
• Gas supply cost recovery ($15.0 million)
• ESM ($10.1 million)
• Prepayments and other ($5.9 million)
• Receipt of a litigation settlement ($7.0 million)
These increases were partially offset by changes in:
• Accounts receivable ($66.3 million) including the termination of the accounts receivable securitization program
• Accrued income taxes ($22.4 million)
See Note 4 of LG&E’s Notes to Financial Statements under Item 8 for a discussion of accounts receivable securitization.
Investing Activities
LG&E’s primary use of funds for investing activities continues to be for capital expenditures. Capital expenditures were $138.9 million, $148.3 million and $213.0 million in 2005, 2004 and 2003, respectively. LG&E expects its capital expenditures for the three-year period ending December 31, 2008, to total approximately $530 million, which consists primarily of construction estimates associated with the redevelopment of the Ohio Falls hydro facility totaling approximately $26 million, construction of Trimble County Unit 2 totaling approximately $120 million and on-going construction related to generation and distribution assets.
Net cash used for investing activities decreased $21.1 million in 2005 compared to 2004 and $53.7 million in 2004 compared to 2003, primarily due to the level of construction expenditures.
47
Financing Activities
Net cash inflows (outflows) for financing activities were $(12.1) million, $(7.4) million and $34.2 million in 2005, 2004 and 2003, respectively.
Redemptions and maturities of long-term debt for 2005, 2004 and 2003 are summarized below:
($ in millions) | | | | | | | | | |
| | | | | | | | | |
Year | | Description | | Principal
Amount | | Rate | | Secured/
Unsecured | | Maturity | |
| | | | | | | | | | | |
2005 | | Pollution control bonds | | $ | 40.0 | | 5.90 | % | Secured | | Apr 2023 | |
2005 | | Due to Fidelia | | $ | 50.0 | | 1.53 | % | Secured | | Jan 2005 | |
2005 | | Mandatorily Redeemable Preferred Stock | | $ | 1.3 | | 5.875 | % | Unsecured | | Jul 2005 | |
2004 | | Due to Fidelia | | $ | 50.0 | | 1.53 | % | Secured | | Jan 2005 | |
2004 | | Mandatorily Redeemable Preferred Stock | | $ | 1.3 | | 5.875 | % | Unsecured | | Jul 2004 | |
2003 | | Pollution control bonds | | $ | 102.0 | | 5.625 | % | Secured | | Aug 2019 | |
2003 | | Pollution control bonds | | $ | 26.0 | | 5.45 | % | Secured | | Oct 2020 | |
2003 | | First Mortgage Bonds | | $ | 42.6 | | 6.00 | % | Secured | | Aug 2003 | |
2003 | | Mandatorily Redeemable Preferred Stock | | $ | 1.3 | | 5.875 | % | Unsecured | | Jul 2003 | |
Issuances of long-term debt for 2005, 2004 and 2003 are summarized below:
($ in millions) | | | | | | | | | |
| | | | | | | | | |
Year | | Description | | Principal
Amount | | Rate | | Secured/
Unsecured | | Maturity | |
| | | | | | | | | | | |
2005 | | Pollution control bonds | | $ | 40.0 | | Variable | | Secured | | Feb 2035 | |
2004 | | Due to Fidelia | | $ | 25.0 | | 4.33 | % | Secured | | Jan 2012 | |
2004 | | Due to Fidelia | | $ | 100.0 | | 1.53 | % | Secured | | Jan 2005 | |
2003 | | Pollution control bonds | | $ | 128.0 | | Variable | | Secured | | Oct 2033 | |
2003 | | Due to Fidelia | | $ | 100.0 | | 4.55 | % | Unsecured | | Apr 2013 | |
2003 | | Due to Fidelia | | $ | 100.0 | | 5.31 | % | Secured | | Aug 2013 | |
Future Capital Requirements
Future capital requirements may be affected in varying degrees by factors such as electric energy demand load growth, changes in construction expenditure levels, rate actions by regulatory agencies, new legislation, market entry of competing electric power generators, changes in environmental regulations and other regulatory requirements. LG&E anticipates funding future capital requirements through operating cash flow, debt, and/or infusions of capital from its parent.
LG&E has a variety of funding alternatives available to meet its capital requirements. LG&E maintains a series of bilateral credit facilities with banks totaling $185 million. Several intercompany financing arrangements are also available. LG&E participates in an intercompany money pool agreement wherein E.ON U.S. and/or KU make funds available to LG&E at market-based rates up to $400 million. Fidelia also provides long-term intercompany funding to LG&E. See Note 9 of LG&E’s Notes to Financial Statements under Item 8.
Regulatory approvals are required for LG&E to incur additional debt. The FERC authorizes the issuance of short-term debt while the Kentucky Commission authorizes issuance of long-term debt. In February 2006,
48
LG&E received a two-year authorization from the FERC to borrow up to $400 million in short-term funds.
LG&E’s debt ratings as of December 31, 2005, were:
| | Moody’s | | S&P | |
| | | | | |
First mortgage bonds | | A1 | | A- | |
Preferred stock | | Baa1 | | BBB- | |
Commercial paper | | P-1 | | A-2 | |
These ratings reflect the views of Moody’s and S&P. A security rating is not a recommendation to buy, sell or hold securities and is subject to revision or withdrawal at any time by the rating agency.
Contractual Obligations
The following is provided to summarize LG&E’s contractual cash obligations for periods after December 31, 2005. LG&E anticipates cash from operations and external financing will be sufficient to fund future obligations. Future interest obligations cannot be quantified because most of LG&E’s debt is variable rate. (See LG&E’s Statements of Capitalization)
(in millions)
| | Payments Due by Period | |
Contractual Cash Obligations | | 2006 | | 2007 | | 2008 | | 2009 | | 2010 | | Thereafter | | Total | |
Short-term debt (a) | | $ | 141.2 | | $ | — | | $ | — | | $ | — | | $ | — | | $ | — | | $ | 141.2 | |
Long-term debt | | 1.3 | | 1.3 | | 18.7 | | — | | — | | 799.3 | (b) | 820.6 | |
Operating lease (c) | | 3.5 | | 3.6 | | 3.7 | | 3.8 | | 3.8 | | 18.5 | | 36.9 | |
Unconditional power purchase obligations (d) | | 11.1 | | 10.9 | | 11.0 | | 11.3 | | 11.5 | | 215.1 | | 270.9 | |
Coal and gas purchase obligations (e) | | 248.0 | | 197.6 | | 201.2 | | 174.2 | | 188.6 | | 199.8 | | 1,209.4 | |
Retirement obligations (f) | | 36.7 | | 36.3 | | 35.7 | | 35.0 | | 34.3 | | 166.1 | | 344.1 | |
Other obligations (g) | | 23.0 | | — | | — | | — | | — | | — | | 23.0 | |
Total contractual cash obligations | | $ | 464.8 | | $ | 249.7 | | $ | 270.3 | | $ | 224.3 | | $ | 238.2 | | $ | 1,398.8 | | $ | 2,846.1 | |
(a) Represents borrowings from affiliated company due within one year.
(b) Includes long-term debt of $246.2 million classified as current liabilities because these bonds are subject to tender for purchase at the option of the holder and to mandatory tender for purchase upon the occurrence of certain events. Maturity dates for these bonds range from 2013 to 2027. LG&E does not expect to pay these amounts in 2006.
(c) Operating lease represents the lease of LG&E’s administrative office building.
(d) Represents future minimum payments under OVEC purchased power agreements through 2024.
(e) Represents contracts to purchase coal and natural gas.
(f) Represents currently projected cash flows for pension plans and other post-employment benefits as calculated by the actuary.
(g) Represents construction commitments.
Off-Balance Sheet Arrangements
In the ordinary course of business LG&E has operating leases for various vehicles, equipment and real estate. See Note 10 of LG&E’s Notes to Financial Statements under Item 8 for further discussion of leases.
49
Sale and Leaseback Transaction
LG&E is a participant in a sale and leaseback transaction involving its 38% interest in two jointly-owned CTs at KU’s E.W. Brown generating station (Units 6 and 7). Commencing in December 1999, LG&E and KU entered into a tax-efficient, 18-year lease of the CTs. LG&E and KU have provided funds to fully defease the lease, and have executed an irrevocable notice to exercise an early purchase option contained in the lease after 15.5 years. The financial statement treatment of this transaction is no different than if LG&E had retained its ownership. The leasing transaction was entered into following receipt of required state and federal regulatory approvals.
In case of default under the lease, LG&E is obligated to pay to the lessor its share of certain fees or amounts. Primary events of default include loss or destruction of the CTs, failure to insure or maintain the CTs and unwinding of the transaction due to governmental actions. No events of default currently exist with respect to the lease. Upon any termination of the lease, whether by default or expiration of its term, title to the CTs reverts jointly to LG&E and KU.
At December 31, 2005, the maximum aggregate amount of default fees or amounts, which decrease over the term of the lease, was $8.2 million, of which LG&E would be responsible for $3.1 million (38%). LG&E has made arrangements with E.ON U.S., via guarantee and regulatory commitment, for E.ON U.S. to pay LG&E’s full portion of any default fees or amounts.
MARKET RISKS
LG&E is exposed to market risks from changes in interest rates and commodity prices. To mitigate changes in cash flows attributable to these exposures, LG&E uses various financial instruments including derivatives. Derivative positions are monitored using techniques that include market value and sensitivity analysis. See Note 1 and Note 4 of LG&E’s Notes to Financial Statements under Item 8.
Interest Rate Sensitivity
LG&E has short-term and long-term variable-rate debt obligations outstanding. At December 31, 2005, the potential change in interest expense associated with a 1% change in base interest rates of LG&E’s unhedged debt is estimated at $3.6 million.
Interest rate swaps are used to hedge LG&E’s underlying variable-rate debt obligations. These swaps hedge specific debt issuances and, consistent with management’s designation, are accorded hedge accounting treatment. See Note 4 of LG&E’s Notes to Financial Statements under Item 8.
As of December 31, 2005, LG&E had swaps with a combined notional value of $211.3 million. The swaps exchange floating-rate interest payments for fixed rate interest payments to reduce the impact of interest rate changes on LG&E’s pollution control bonds. The potential loss in fair value resulting from a hypothetical 1% adverse movement in base interest rates is estimated at approximately $17.6 million as of December 31, 2005. This estimate is derived from third-party valuations. Changes in the market value of these swaps if held to maturity, as LG&E intends to do, will have no effect on LG&E’s net income or cash flow. See Note 4 of LG&E’s Notes to Financial Statements under Item 8.
In February 2005, an LG&E interest rate swap with a notional amount of $17.0 million matured. The swap was fully effective upon expiration. As a result, the impact on earnings and other comprehensive income from the swap maturity was less than $0.1 million.
50
Commodity Price Sensitivity
LG&E is exposed to the market price volatility of coal, natural gas and oil (the fuels used to generate electricity) in its wholesale activities. It has limited exposure to such market price volatility as the result of its retail FAC and GSC commodity price pass-through mechanisms.
Energy & Risk Management Activities
LG&E conducts energy trading and risk management activities to maximize the value of power sales from physical assets it owns. Certain energy trading activities are accounted for on a mark-to-market basis in accordance with SFAS No. 133, Accounting for Derivative Instruments and Hedging Activities, as amended. Wholesale sales of excess asset capacity are treated as normal sales under SFAS No. 133, as amended, and are not marked to market.
Since the inception of the MISO Day 2 market in April 2005, LG&E has been eligible to receive FTRs from the MISO. FTRs are assigned by the MISO to market participants for a twelve-month period of time beginning June 1, 2006, for off-peak and peak periods based on each market participant’s share of generation. FTRs are utilized to manage price risk associated with transmission congestion. The value of FTRs is determined by the transmission congestion charges that arise when the transmission grid is congested in the day-ahead market. FTRs are obtained through an allocation from the MISO at zero cost, however, they can also be bought and sold. FTRs are derivatives and their fair value is insignificant due to the lack of liquidity in the forward market.
The fair value of LG&E’s energy trading and risk management contracts as of December 31, 2005 and 2004, was less than $1.0 million. No changes to valuation techniques for energy trading and risk management activities occurred during 2005 or 2004. Changes in market pricing, interest rate and volatility assumptions were made during both years. The outstanding mark-to-market value is sensitive to changes in prices, price volatilities, and interest rates. The Company estimates that a movement in prices of $1 and a change in interest and volatilities of 1% would result in a change of less than $0.1 million. All contracts outstanding at December 31, 2005, have a maturity of less than one year and are valued using prices actively quoted for proposed or executed transactions or quoted by brokers.
LG&E maintains policies intended to minimize credit risk and revalues credit exposures daily to monitor compliance with those policies. At December 31, 2005, 100% of the trading and risk management commitments were with counterparties rated BBB-/Baa3 equivalent or better.
Accounts Receivable Securitization
LG&E terminated its accounts receivable securitization program in January 2004, and in May 2004, dissolved its inactive accounts receivable securitization-related subsidiary, LG&E R. No material pre-tax gains or losses resulted from the sale of the receivables in 2004 and 2003. LG&E’s net cash flows from LG&E R were reduced by $58.1 million and $6.2 million for 2004 and 2003, respectively. The allowance for doubtful accounts associated with the eligible securitized receivables at December 31, 2003 was $1.4 million. This allowance was based on historical experience of LG&E. Each securitization facility contained a fully funded reserve for
51
uncollectible receivables.
RATES AND REGULATION
LG&E is subject to the jurisdiction of the Kentucky Commission in virtually all matters related to electric and natural gas utility regulation, and as such, its accounting is subject to SFAS No. 71. Given LG&E’s competitive position in the marketplace and the status of regulation in Kentucky, LG&E has no plans or intentions to discontinue its application of SFAS No. 71. See Note 3 and Note 10 of LG&E’s Notes to Financial Statements under Item 8 for a discussion of rates and regulation.
FUTURE OUTLOOK
Competition and Customer Choice
At this time, neither the Kentucky General Assembly nor the Kentucky Commission has adopted or approved a plan or timetable for retail electric industry competition in Kentucky. The nature or timing of the ultimate legislative or regulatory actions regarding industry restructuring and their impact on LG&E, which may be significant, cannot currently be predicted. Some states that have already deregulated have begun discussions that could lead to re-regulation.
In February 2005, Kentucky’s Governor signed an executive order directing the Kentucky Commission, in conjunction with the Commerce Cabinet and the Environmental and Public Protection Cabinet, to ‘develop a Strategic Blueprint for the continued use and development of electric energy.’ This Strategic Blueprint is designed to promote future investment in electric infrastructure for the Commonwealth of Kentucky, to protect Kentucky’s low-cost electric advantage, to maintain affordable rates for all Kentuckians, and to preserve Kentucky’s commitment to environmental protection.
Over the last several years, LG&E has taken many steps to keep its rates low while maintaining high levels of customer satisfaction, including: an increase in focus on commercial, industrial and residential customers; an increase in employee involvement and training; and continuous modifications of its organizational structure. LG&E also strives to control costs through competitive bidding and process improvements. LG&E’s performance in national customer satisfaction surveys continues to be high.
52
RESULTS OF OPERATIONS
KU
Net Income
KU’s net income in 2005 decreased $21.4 million (16.0%) compared to 2004. The decrease resulted primarily from higher fuel, power purchased and other operation and maintenance expenses. These cost increases were largely due to MISO Day 2 requirements and KU operating unit outages during the year. The increases in costs were partially offset by increased retail revenues resulting from increased electricity demand and increased base rates, effective July 1, 2004. Wholesale revenues also increased due to higher volumes and higher prices.
During 2005, KU made out-of-period adjustments for estimated over/under collection of ECR revenues to be billed in subsequent periods. The adjustments were related to the reporting periods of May 2003 through December 2004. As a result, 2005 revenues for KU were reduced by $2.9 million and net income was reduced by $1.7 million. KU revenues and net income for 2004 were overstated by $3.2 million and $1.9 million, respectively, and KU revenues and net income for 2003 were understated by $0.3 million and $0.2 million, respectively.
KU’s net income in 2004 increased $42.1 million (46.1%) compared to 2003. The increase resulted primarily from higher revenues, primarily in the retail sector, due to increased base rates resulting from the rate case order and higher volumes due to a warmer summer. Operating expenses of $2.7 million related to severe May and July storms in 2004 partially offset the increase.
Revenues
The following table presents a comparison of operating revenues for the years 2005 and 2004 with the immediately preceding year.
(in millions) | | | |
| | | |
| | Increase (Decrease) From Prior Period | |
Cause | | 2005 | | 2004 | |
Retail sales: | | | | | |
Fuel clause adjustments | | $ | 90.3 | | $ | 15.3 | |
KU/LG&E Merger surcredit | | (1.6 | ) | (2.6 | ) |
Environmental cost recovery surcharge | | 0.7 | | 20.6 | |
Earnings sharing mechanism | | (9.0 | ) | (1.0 | ) |
Demand side management | | (0.6 | ) | 1.0 | |
VDT surcredit | | (0.7 | ) | (0.5 | ) |
Rate and rate structure | | 24.1 | | 21.7 | |
Variation in sales volumes and other | | 33.2 | | 24.6 | |
Total retail sales | | 136.4 | | 79.1 | |
Wholesale sales | | 49.9 | | 22.0 | |
MISO Day 2 | | 24.9 | | — | |
Other | | — | | 2.5 | |
Total | | $ | 211.2 | | $ | 103.6 | |
Electric revenues increased in 2005 primarily due to higher fuel costs cost billed to customers through the fuel adjustment clause, an increase in wholesale sales and MISO related revenue, higher rates and a change in the rate structure. New rates implemented in July 2004 and the elimination of a volume dependent step rate structure, increased revenues by 3.0% in 2005. These increases were partially offset by the elimination of the
53
ESM in the second quarter of 2005. Retail volumes increased 4.7% due to weather. The KU service area experienced a warmer summer in 2005, with cooling degree days for 2005 46% above 2004 and 18% above the 20-year average while heating degree days were 3% above 2004 and 1% below the 20-year average. Wholesale revenues increased due to a 31% increase in prices.
Electric revenues increased in 2004 primarily due to an increase in rates and a change in the rate structure. New rates, implemented in July 2004 and the elimination of a volume dependent step rate structure, increased revenues by 3.1% in 2004. Retail volumes increased 3.3% due to a 1.4% increase in the customer base and 2.6% increase in demand due to weather. The KU service area experienced a warmer summer in 2004, partially offset by a milder winter. Cooling degree days for 2004 increased 2.9% from 2003 and were 20% below the 20-year average while heating degree days decreased 6.8% from 2003 and were 4% below the 20-year average. Wholesale revenues increased due to a combination of a 14.2% increase in prices and 1.7% higher volumes. The price increase was largely due to higher fuel prices and the volume increase was primarily due to increased electricity demand in the region.
Expenses
Fuel for electric generation comprises a large component of KU’s total operating expenses. KU’s Kentucky jurisdictional electric rates are subject to an FAC whereby increases or decreases are reflected in the FAC factor, subject to the approval of the Kentucky Commission and passed through to KU’s retail customers. KU’s municipal and Virginia jurisdictional electric rates contain a fuel adjustment clause whereby increases or decreases in the cost of fuel are reflected in rates, subject to the approval of the FERC and the Virginia Commission, respectively.
Fuel for electric generation increased $91.6 million (31.3%) in 2005 primarily due to:
• Increased cost of fuel burned ($87.4 million) due to the MISO’s dispatch of natural gas-fired units and higher coal and natural gas prices
• Increased generation ($4.2 million) due to increased demand and the dispatch of units for MISO Day 2
Fuel for electric generation increased $26.1 million (9.8%) in 2004 primarily due to:
• Increased cost of fuel burned ($16.8 million) due to higher fuel prices
• Increased generation ($9.3 million) due to increased demand
Power purchased expense increased $74.7 million (51.8%) in 2005 primarily due to:
• Increased unit cost of purchases ($61.3 million) due to higher fuel prices
• Increased volumes purchased ($13.4 million) due to increased demand and unit outages
• Purchased power costs from the MISO due to unit outages totaled $22.0 million
Power purchased expense increased $4.1 million (2.9%) in 2004 primarily due to:
• Increased volumes purchased ($5.1 million) due to increased demand and unit outages
• Decreased unit cost of purchases ($0.9 million)
Other operation and maintenance expenses increased $64.7 million (29.1%) in 2005 primarily due to higher other operation expenses ($53.8 million) and higher maintenance expenses ($11.4 million), partially offset by lower property and other taxes ($0.5 million).
54
Other operation expenses increased $53.8 million (37.0%) in 2005 primarily due to:
• Increased other power supply expenses primarily due to MISO Day 2 costs ($43.1 million) for administrative and allocated charges from the MISO for Day 2 operations
• Increased employee welfare expenses ($4.3 million)
• Increased transmission expenses ($2.5 million) primarily due to increased costs associated with MISO Day 1. The increase was partially offset by lower transmission costs resulting from MISO Day 2 ($2.9 million). Prior to the MISO Day 2 market, most bilateral transactions required the purchase of transmission; however, with the Day 2 market, most transactions are handled directly with the MISO and no additional transmission is necessary
• Increased customer service and collections expense ($2.1 million)
• Increased distribution costs ($1.5 million)
Maintenance expenses increased $11.4 million (18.7%) in 2005 primarily due to:
• Increased steam generation expenses ($5.9 million) primarily due to unit outages
• Increased distribution maintenance ($3.9 million) due to increased line repairs and tree trimming costs
• Increased administrative and general maintenance ($1.1 million)
• Increased transmission line maintenance ($0.3 million)
Other operation and maintenance expenses increased $0.8 million (0.4%) in 2004 primarily due to higher property and other taxes ($0.8 million) and higher maintenance expenses ($0.6 million), partially offset by lower other operation expenses ($0.4 million).
Maintenance expenses increased $0.6 million (1.0%) in 2004 primarily due to:
• Increased maintenance expense due to storm restoration costs related to severe May and July storms ($2.2 million)
• Increased combustion turbine maintenance ($2.3 million)
• Decreased expense due to reclassification of maintenance expense to a regulatory asset ($4.0 million) of costs related to the 2003 ice storm based on an order from the Kentucky Commission, to be amortized through June 2009. KU earns a return of these amortized costs, which are included in KU’s jurisdictional operating expenses.
Other operation expenses decreased $0.4 million (0.3%) in 2004 primarily due to:
• Decreased benefits expense ($3.7 million), primarily due to lower pension expense
• The KU/LG&E merger costs and the One Utility initiative costs were fully amortized in 2003, resulting in $2.9 million lower expense in 2004
• Increased emission allowance expense ($4.5 million)
• Increased combustion turbine operations expense ($0.9 million)
• Increased operations expense due to storm restoration costs related to severe storms in May and July 2004 ($0.5 million)
Depreciation and amortization increased $6.0 million (5.5%) in 2005 and $6.9 million (6.8%) in 2004 primarily due to additional plant in service.
Other income - net decreased $2.5 million (33.3%) in 2005 primarily due to:
• Increased income deductions ($3.7 million)
• Decreased AFUDC equity ($1.1 million)
• Decreased gain on disposition of property ($0.5 million)
55
• Increased miscellaneous non-operating income ($2.9 million)
Other income - net increased $3.0 million (66.7%) in 2004 primarily due to:
• Decreased income deductions ($3.1 million)
• Increased miscellaneous non-operating income ($0.6 million)
• Increased gain on disposition of property ($0.4 million)
• Decreased equity in earnings – subsidiary company ($1.1 million)
Interest expense increased $5.5 million (21.6%) in 2005 primarily due to:
• Increased cost of interest rate swaps ($2.9 million)
• Increased cost of variable-rate debt ($2.4 million)
• Increased marked to market of interest rate swaps ($1.6 million)
• Decreased cost from refinancing fixed rate bonds with variable rate bonds ($1.5 million)
Interest expense increased $0.3 million (1.2%) in 2004 primarily due to:
• Increased borrowing from Fidelia ($9.0 million)
• Decreased cost from retired first mortgage debt ($4.4 million)
• Decreased cost of interest rate swaps ($3.5 million)
• Decreased borrowing from the money pool ($0.8 million)
Details of KU’s exposure to variable interest rates on long-term debt are shown in the table below:
| | 2005 | | 2004 | | 2003 | |
Variable rate debt, including fixed rate debt swapped to variable rate debt ($ in millions) | | $ | 325.6 | | $ | 349.0 | | $ | 368.6 | |
Percentage of variable rate debt to total long-term debt, including fixed rate debt swapped to variable rate debt | | 43.7 | % | 48.6 | % | 53.6 | % |
Weighted average interest rate on variable rate debt for the year | | 2.52 | % | 1.32 | % | 1.07 | % |
Weighted average interest rate on total long-term debt at year-end, including expense amortization and interest rate swaps | | 4.50 | % | 3.43 | % | 2.96 | % |
| | | | | | | | | | |
See Note 8 of KU’s Notes to the Financial Statements under Item 8.
Variations in income tax expense are largely attributable to changes in pre-tax income. KU’s 2005 effective income tax rate was 36.3%, a slight decrease from 36.4% in 2004. See Note 7 of KU’s Notes to Financial Statements under Item 8.
The rate of inflation may have a significant impact on KU’s operations, its ability to control costs and the need to seek timely and adequate rate adjustments. However, relatively low rates of inflation in the past few years have moderated the impact on current operating results.
CRITICAL ACCOUNTING POLICIES/ESTIMATES
Preparation of financial statements and related disclosures in compliance with generally accepted accounting principles requires the application of appropriate technical accounting rules and guidance, as well as the use of estimates. The application of these policies necessarily involves judgments regarding future events, including legal and regulatory challenges and anticipated recovery of costs. These judgments, in and of themselves, could materially impact the financial statements and disclosures based on varying assumptions, which may be appropriate to use. In addition, the financial and operating environment also may have a significant effect, not only on the
56
operation of the business, but on the results reported through the application of accounting measures used in preparing the financial statements and related disclosures, even if the nature of the accounting policies applied has not changed. Specific risks for these critical accounting policies are described in the following paragraphs. Each of these has a higher likelihood of resulting in materially different reported amounts under different conditions or using different assumptions. Events rarely develop exactly as forecasted and the best estimates routinely require adjustment. See also Note 1 of KU’s Notes to Financial Statements under Item 8.
Unbilled Revenue – At each month end KU prepares a financial estimate that projects electric usage by customers that has not been billed. The estimated usage is based on allocating the daily system net deliveries between billed volumes and unbilled volumes. The allocation is based on a daily ratio of the number of meter reading cycles remaining in the month to the total number of meter reading cycles in each month. Each day’s ratio is then multiplied by each day’s system net deliveries to determine an estimated billed and unbilled volume for each day of the accounting period. At December 31, 2005, a 10% change in these estimated quantities would cause revenue and accounts receivable to change by approximately $4.4 million. See also Note 1 of KU’s Notes to Financial Statements under Item 8.
Allowance for Doubtful Accounts – At December 31, 2005 and 2004, the KU allowance for doubtful accounts was $1.5 million and $0.6 million, respectively. The allowance is based on the ratio of the amounts charged-off during the last twelve months to the retail revenues billed over the same period multiplied by the retail revenues billed over the last four months. Accounts with no payment activity are charged-off after four months, although collection efforts continue thereafter.
Pension and Post-retirement Benefits – KU has both funded and unfunded non-contributory defined benefit pension and post-retirement benefit plans that together cover substantially all of its employees. The plans are accounted for under SFAS No. 87 and SFAS No. 106.
The pension and other post-retirement benefit plan costs and liabilities are determined on an actuarial basis and are dependent upon numerous economic assumptions, such as discount rates, rates of compensation increases, estimates of the expected return on plan assets and health care cost trend rates and demographic and economic assumptions. The actuarial assumptions used may differ materially from actual results due to changing market and economic conditions, higher or lower health care costs or turnover, or longer or shorter life spans of participants. These differences may result in a significant impact on the amount of expenses recorded in future periods. The underlying assumptions and estimates related to the pension and post-retirement benefit plan costs and liabilities are reviewed annually.
The assumed discount rate, expected return on assets and rate of compensation increases generally have the most significant impact on the pension costs and liabilities. The discount rate is used to calculate the actuarial present value of the benefits provided by the plans. KU bases its discount rate assumption on Moody’s Aa Corporate Bond Rate rounded to the nearest 25 basis points, which has a duration comparable to the weighted average duration of the plans.
The expected long-term rate of return on assets is used to calculate the net periodic pension costs for the plans. To develop the expected long-term rate of return on assets assumption, consideration is given to the current level of expected returns on risk free investments (primarily government bonds), the historical performance of the asset managers versus their respective benchmarks, the historical level of the risk premium associated with the other asset classes in which the portfolio is invested and the expectations for future returns of each asset class. The expected return for each asset class is then weighted based on a target asset allocation. For 2005, the actual return on pension assets was comparable to the assumed expected rate of return.
57
The following describes the effects on pension benefits by changing the major actuarial assumptions discussed above:
• A 1% change in the assumed discount rate could have an approximate $32.6 million positive or negative impact to the 2005 accumulated benefit obligation of KU.
• A 25 basis point change in the expected rate of return on assets would have an approximate $0.6 million positive or negative impact on 2005 pension expense.
Compensation rate increases are used to calculate service costs and the projected benefit obligation. Such rates are based on a review of KU’s historical salaries, promotion and bonus increases. For 2005 net periodic pension benefit costs, KU used an assumption of 4.50%. Based on plan experience, the rate was increased to 5.25% for the projected benefit obligation at December 31, 2005.
When the plan experience differs from the actuarial assumptions, a portion of the difference may be deferred and is subject to amortization at rates based on the estimated average years of participants’ future service. KU’s deferred losses on these assumptions were $24.6 million (44%) higher in 2005 than 2004 and $28.3 million (101%) higher in 2004 than 2003, primarily due to declining discount rate assumptions during these years.
The assumptions related to the discount rate, retirement, turnover and healthcare cost trends, which represent expected rates of increase in health care claim payments, generally have the most significant impact on post-retirement benefit plan costs and liabilities. Unlike pensions, however, assumptions about per capita claims cost by age and participation rates also significantly impact post-retirement liability computations. A 1% change in the healthcare cost trend rates could have a positive or negative impact on the 2005 post-retirement benefit obligation and post-retirement expense of approximately $6.0 million and $0.4 million, respectively.
Additionally, demographic and other economic assumptions affect the pension and post-retirement computations. Beginning with the December 31, 2005 liability, KU replaced the 1983 Group Annuity Mortality tables for males and females with the RP 2000 combined tables for males and females projected to 2006. These updated healthy mortality tables will be used for the 2006 expense.
The benefit obligation is compared with the plan asset values to determine a net position. Asset values are increased primarily by actual rates of return on plan assets and by employer contributions. For explanation of the investment policy including targeted asset allocations, see Note 6 of KU’s Notes to Financial Statements under Item 8.
The pension plans are funded in accordance with all applicable requirements of the ERISA and the IRC. In accordance with the ERISA guidelines, KU made discretionary contributions to the pension plans of $10.2 million in 2003 and $43.4 million in 2004. No contributions were made in 2005. KU anticipates making additional contributions as deemed necessary. Additionally, KU made a contribution of $3.0 million to the post-retirement plan in 2005, representing the maximum employer contribution under IRC Section 401(h) requirements for all plan years through 2004. KU may continue to make subsequent contributions in accordance with the maximum funding limitation governed by tax laws.
As prescribed by SFAS No. 87, KU was required to recognize an additional minimum pension liability of $9.5 million and $12.4 million during 2005 and 2004, respectively, since the fair value of the plan assets was less than the accumulated benefit obligation at that time. This additional minimum pension liability was recorded as a
58
reduction to other comprehensive income and did not affect net income. Historically low corporate bond rates, used to determine the discount rate, significantly increased the potential value of the pension liabilities above the actual value of the plan assets. If the fair value of the plan assets exceeds the accumulated benefit obligation, the recorded liability will be reduced and other comprehensive income will be restored in the balance sheet. In 2003, KU recognized a reduction of the minimum pension liability of $7.7 million.
Should poor market conditions return or should interest rates decline further, KU’s unfunded accumulated benefit obligations and future pension expense could increase. The Company believes that such increases are recoverable in whole or in part under future rate proceedings or mechanisms. See also Note 6 and Note 13 of KU’s Notes to Financial Statements under Item 8.
Regulatory Mechanisms – Judgments and uncertainties include future regulatory decisions, the impact of deregulation and competition on the ratemaking process and external regulatory decisions. Regulatory assets represent incurred costs that have been deferred because they are probable of future recovery in customer rates based upon Kentucky Commission, Virginia Commission and FERC orders. Regulatory liabilities generally represent obligations to make refunds to customers for previous collections based upon orders by the Kentucky Commission, Virginia Commission and FERC. Management believes, based on orders, the existing regulatory assets and liabilities are probable of recovery. This determination reflects the current regulatory climate in the state. If future recovery of costs ceases to be probable the assets and liabilities would be required to be recognized in current period earnings. See also Note 3 of KU’s Notes to Financial Statements under Item 8.
Income Taxes – Income taxes are accounted for under SFAS No. 109. In accordance with this statement, deferred tax assets and liabilities are recognized for the future tax consequences attributable to differences between the financial statement carrying amounts of existing assets and liabilities and their respective tax bases, as measured by enacted tax rates that are expected to be in effect in the periods when the deferred tax assets and liabilities are expected to be settled or realized. Significant judgment is required in determining the provision for income taxes, and there are transactions for which the ultimate tax outcome is uncertain.
To provide for these uncertainties or exposures, an allowance is maintained for tax contingencies based on management’s best estimate of probable loss. Tax contingencies are analyzed periodically and adjustments are made when events occur to warrant a change. On September 19, 2005, KU received notice from the Congressional Joint Committee on Taxation approving the Internal Revenue Service’s audit of KU’s income tax returns for the periods December 1999 through December 2003. As a result of resolving numerous tax matters during these periods, KU reduced income tax accruals by $4.6 million during 2005.
The company recognized additional deferred income tax expense in the third quarter of 2005 ($3.1 million) related to the undistributed earnings of its EEI unconsolidated investment. Recent EEI management decisions regarding changes in the distribution of EEI’s earnings led to the decision to provide deferred taxes for all book and tax temporary differences related to this investment.
H. R. 4520, known as the “American Jobs Creation Act of 2004” allows electric utilities to take a deduction of up to 3% of their qualified production activities income in 2005. This deduction reduced KU’s effective tax rate by less than 1% for 2005.
59
Kentucky House Bill 272, also known as “Kentucky’s Tax Modernization Plan,” was signed into law in March 2005. This bill contains a number of changes in Kentucky’s tax system, including the reduction of the Corporate income tax rate from 8.25% to 7% effective January 1, 2005, and a further reduction to 6% effective January 1, 2007. As a result of the income tax rate change, KU’s deferred tax reserve amount will exceed its actual deferred tax liability attributable to existing temporary differences since the new statutory rates are lower than the rates were when the deferred tax liability originated. This excess amount is referred to as excess deferred income taxes. In June 2005, KU received approval from the Kentucky Commission to establish and amortize a regulatory liability ($11.0 million) for its net excess deferred income tax balances. Under this accounting treatment, KU will amortize its depreciation-related excess deferred income tax balances under the average rate assumption method. The average rate assumption method matches the amortization of the excess deferred income taxes with the life of the timing differences to which it relates. Excess deferred income tax balances related to non-depreciation timing differences will be expensed in the current year due to their immaterial amount.
KU expects to have adequate levels of taxable income to realize its recorded deferred taxes.
For further discussion of income tax issues, see Note 1 and Note 7 of KU’s Notes to Financial Statements under Item 8.
NEW ACCOUNTING PRONOUNCEMENTS
The following recent accounting pronouncements affected KU in 2005 and 2004:
FIN 47
KU adopted FIN 47 effective December 31, 2005. FIN 47 expands the term “conditional asset retirement obligation” as used in SFAS No. 143 to refer to a legal obligation to perform an asset retirement activity in which the timing and/or method of settlement are conditional on a future event that may or may not be within the control of the entity. The obligation to perform the asset retirement activity is unconditional even though uncertainty exists about the timing and/or method of settlement. An entity is required to recognize a liability for the fair value of a conditional asset retirement obligation if the fair value of the liability can be reasonably estimated. The fair value of a liability for the conditional asset retirement obligation should be recognized when incurred; generally, upon acquisition, construction, or development and through the normal operation of the asset.
As a result of the implementation of FIN 47, KU recorded additional ARO net assets and liabilities during the fourth quarter of 2005 in the amount of $0.5 million and $4.6 million, respectively. KU also recorded a cumulative effect adjustment in the amount of $4.1 million to reflect the accumulated depreciation and accretion of ARO assets at the transition date less amounts previously accrued under regulatory depreciation. KU recorded offsetting regulatory assets of $4.1 million, pursuant to regulatory treatment prescribed under SFAS No. 71, as the costs of removal are allowed under Kentucky Commission ratemaking.
Had FIN 47 been in effect at the beginning of the 2004 reporting period, KU would have established asset retirement obligations as described in the following table (in millions):
| | 2005 | | 2004 | |
Provision at beginning of the year | | $ | 4.3 | | $ | 4.1 | |
Accretion expense | | 0.3 | | 0.2 | |
Provision at end of the year | | $ | 4.6 | | $ | 4.3 | |
60
See Note 1 of KU’s Notes to Financial Statements under Item 8 for a further discussion of FIN 47.
LIQUIDITY AND CAPITAL RESOURCES
KU uses net cash generated from its operations and external financing (including financing from affiliates) to fund construction of plant and equipment and the payment of dividends. KU believes that such sources of funds will be sufficient to meet the needs of its business in the foreseeable future.
As of December 31, 2005, KU is in a negative working capital position in part because of the classification of certain variable-rate pollution control bonds totaling $87.1 million that are subject to tender for purchase at the option of the holder as current portion of long-term debt. KU expects to cover any working capital deficiencies with cash flow from operations, money pool borrowings and borrowings from Fidelia.
Operating Activities
Cash provided by operations was $220.7 million, $185.9 million and $233.4 million in 2005, 2004 and 2003, respectively.
The 2005 increase of $34.8 million was primarily the result of changes in:
• Pension funding ($35.9 million)
• Accounts payable ($16.2 million) largely due to the increase in power purchased resulting from increased fuel costs
• Accounts receivable ($8.9 million)
These increases were partially offset by:
• Lower earnings ($21.4 million)
The 2004 decrease of $47.5 million was primarily due to the change in:
• Accounts receivable ($63.0 million), including the termination of the accounts receivable securitization program
• Additional pension funding ($33.2 million)
• Lower environmental cost recovery ($14.2 million)
These decreases were partially offset by:
• Higher earnings ($42.1 million)
• Higher accounts payable ($13.3 million)
• Receipt of a litigation settlement ($11.4 million)
See Note 4 of KU’s Notes to Financial Statements under Item 8 for a discussion of accounts receivable securitization.
Investing Activities
KU’s primary use of funds for investing activities continues to be for capital expenditures. Capital expenditures were $140.0 million, $157.6 million and $341.8 million in 2005, 2004 and 2003, respectively. KU expects its capital expenditures for the three-year period ending December 2008, to total approximately $1.5 billion, which consists primarily of construction estimates associated with installation of FGDs on Ghent and Brown units totaling approximately $560 million, as described in the section titled “Environmental Matters,” the construction of Trimble County Unit 2 totaling approximately $510 million and on-going construction on generation and
61
distribution assets.
Net cash used for investing activities increased $4.0 million in 2005 compared to 2004 primarily due to the increase in restricted cash in 2005, partially offset by lower capital expenditures. Restricted cash is the escrowed proceeds of the Pollution Control Bonds issued in 2005 which will be disbursed as qualifying costs are incurred. Net cash used for investing activities decreased $184.1 million in 2004 compared to 2003 primarily due to the level of construction expenditures. NOx expenditures were zero in 2005 and approximately $45.0 million in 2004, while CT expenditures were approximately $8.1 million in 2005 and $13.7 million in 2004.
Financing Activities
Net cash inflows (outflows) from financing activities were $(57.0) million, $(28.6) million and $107.8 million in 2005, 2004 and 2003, respectively.
Redemptions and maturities of long-term debt for 2005, 2004 and 2003 are summarized below:
($ in millions) | | | | | | | | | |
| | | | | | | | | |
Year | | Description | | Principal
Amount | | Rate | | Secured/
Unsecured | | Maturity | |
2005 | | First mortgage bonds | | $ | 50.0 | | 7.55 | % | Secured | | Jun 2025 | |
2005 | | Due to Fidelia | | $ | 75.0 | | 2.29 | % | Secured | | Dec 2005 | |
2004 | | Pollution control bonds | | $ | 4.8 | | Variable | | Secured | | Feb 2032 | |
2004 | | Pollution control bonds | | $ | 50.0 | | 5.75 | % | Secured | | Dec 2023 | |
2003 | | First mortgage bonds | | $ | 62.0 | | 6.32 | % | Secured | | Jun 2003 | |
2003 | | First mortgage bonds | | $ | 33.0 | | 8.55 | % | Secured | | May 2027 | |
Issuances of long-term debt for 2005, 2004 and 2003 are summarized below:
($ in millions) | | | | | | | | | |
| | | | | | | | | |
Year | | Description | | Principal
Amount | | Rate | | Secured/
Unsecured | | Maturity | |
2005 | | Pollution control bonds | | $ | 13.3 | | Variable | | Secured | | Jun 2035 | |
2005 | | Pollution control bonds | | $ | 13.3 | | Variable | | Secured | | Jun 2035 | |
2005 | | Due to Fidelia | | $ | 50.0 | | 4.735 | % | Unsecured | | Jul 2015 | |
2005 | | Due to Fidelia | | $ | 75.0 | | 5.36 | % | Unsecured | | Dec 2015 | |
2004 | | Due to Fidelia | | $ | 50.0 | | 4.39 | % | Unsecured | | Jan 2012 | |
2004 | | Pollution control bonds | | $ | 50.0 | | Variable | | Secured | | Oct 2034 | |
2003 | | Due to Fidelia | | $ | 100.0 | | 4.55 | % | Unsecured | | Apr 2013 | |
2003 | | Due to Fidelia | | $ | 75.0 | | 5.31 | % | Secured | | Aug 2013 | |
2003 | | Due to Fidelia | | $ | 33.0 | | 4.24 | % | Secured | | Nov 2010 | |
2003 | | Due to Fidelia | | $ | 75.0 | | 2.29 | % | Secured | | Dec 2005 | |
In May 2005, KU repaid a $26.7 million loan against the cash surrender value of life insurance policies.
In October 2005, KU redeemed all of its outstanding shares of preferred stock for $40.8 million. KU paid $101 per share for the 4.75% Series and $102.939 per share for the 6.53% Series.
62
Future Capital Requirements
Future capital requirements may be affected in varying degrees by factors such as electric energy demand load growth, changes in construction expenditure levels, rate actions by regulatory agencies, new legislation, market entry of competing electric power generators, changes in environmental regulations and other regulatory requirements. KU anticipates funding future capital requirements through operating cash flow, debt, and/or infusion of capital from its parent.
KU has a variety of intercompany funding alternatives available to meet its capital requirements. KU participates in an intercompany money pool agreement wherein E.ON U.S. and/or LG&E make funds available to KU at market-based rates up to $400 million. Fidelia also provides long-term intercompany funding to KU. See Note 9 of KU’s Notes to Financial Statements under Item 8.
Regulatory approvals are required for KU to incur additional debt. The Virginia Commission and the FERC authorize the issuance of short-term debt while the Kentucky Commission, the Virginia Commission and the Tennessee Regulatory Authority authorize the issuance of long-term debt. In February 2006, KU received approvals from the Virginia Commission and from the FERC to borrow up to $400 million in short-term funds.
KU’s debt ratings as of December 31, 2005, were:
| | Moody’s | | S&P | |
| | | | | |
First mortgage bonds | | A1 | | A | |
Preferred stock | | Baa1 | | BBB- | |
Commercial paper | | P-1 | | A-2 | |
These ratings reflect the views of Moody’s and S&P. A security rating is not a recommendation to buy, sell or hold securities and is subject to revision or withdrawal at any time by the rating agency.
Contractual Obligations
The following is provided to summarize KU’s contractual cash obligations for periods after December 31, 2005. KU anticipates cash from operations and external financing will be sufficient to fund future obligations. Future interest obligations cannot be quantified because most of KU’s debt is variable rate. (See KU’s Statements of Capitalization)
(in millions) | | | |
| | | |
| | Payments Due by Period | |
Contractual Cash Obligations | | 2006 | | 2007 | | 2008 | | 2009 | | 2010 | | Thereafter | | Total | |
Short-term debt (a) | | $ | 69.7 | | $ | — | | $ | — | | $ | — | | $ | — | | $ | — | | $ | 69.7 | |
Long-term debt | | 36.0 | | 55.0 | | — | | — | | 33.0 | | 622.6 (b | ) | 746.6 | |
Unconditional power purchase obligations (c) | | 24.2 | | 24.5 | | 23.3 | | 24.7 | | 24.9 | | 358.2 | | 479.8 | |
Coal purchase obligations (d) | | 307.6 | | 203.7 | | 109.4 | | 6.4 | | — | | — | | 627.1 | |
Retirement obligations (e) | | 26.1 | | 26.0 | | 25.6 | | 25.4 | | 25.2 | | 126.7 | | 255.0 | |
Other obligations (f) | | 120.2 | | — | | — | | — | | — | | — | | 120.2 | |
Total contractual cash obligations | | $ | 583.8 | | $ | 309.2 | | $ | 158.3 | | $ | 56.5 | | $ | 83.1 | | $ | 1,107.5 | | $ | 2,298.4 | |
(a) Represents borrowings from affiliated company due within one year.
(b) Includes long-term debt of $87.1 million classified as current liabilities because these bonds are subject to tender for
63
purchase at the option of the holder and to mandatory tender for purchase upon the occurrence of certain events. Maturity dates for these bonds range from 2024 to 2032. KU does not expect to pay these amounts in 2006.
(c) Represents future minimum payments under OVEC and OMU purchased power agreements through 2024.
(d) Represents contracts to purchase coal.
(e) Represents currently projected cash flows for pension plans and other post-employment benefits as calculated by the actuary.
(f) Represents construction commitments.
Off-Balance Sheet Arrangements
In the ordinary course of business KU has operating leases for various vehicles, equipment and real estate. See Note 10 of KU’s Notes to Financial Statements under Item 8 for further discussion of leases.
Sale and Leaseback Transaction
KU is a participant in a sale and leaseback transaction involving its 62% interest in two jointly-owned CTs at KU’s E.W. Brown generating station (Units 6 and 7). Commencing in December 1999, LG&E and KU entered into a tax-efficient, 18-year lease of the CTs. KU and LG&E have provided funds to fully defease the lease, and have executed an irrevocable notice to exercise an early purchase option contained in the lease after 15.5 years. The financial statement treatment of this transaction is no different than if KU had retained its ownership. The leasing transaction was entered into following receipt of required state and federal regulatory approvals.
In case of default under the lease, KU is obligated to pay to the lessor its share of certain fees or amounts. Primary events of default include loss or destruction of the CTs, failure to insure or maintain the CTs and unwinding of the transaction due to governmental actions. No events of default currently exist with respect to the lease. Upon any termination of the lease, whether by default or expiration of its term, title to the CTs reverts jointly to KU and LG&E.
At December 31, 2005, the maximum aggregate amount of default fees or amounts, which decrease over the term of the lease, was $8.2 million, of which KU would be responsible for $5.1 million (62%). KU has made arrangements with E.ON U.S., via guarantee and regulatory commitment, for E.ON U.S. to pay KU’s full portion of any default fees or amounts.
MARKET RISKS
KU is exposed to market risks from changes in interest rates and commodity prices. To mitigate changes in cash flows attributable to these exposures, KU uses various financial instruments including derivatives. Derivative positions are monitored using techniques that include market value and sensitivity analysis. See Note 1 and Note 4 of KU’s Notes to Financial Statements under Item 8.
Interest Rate Sensitivity
KU has short-term and long-term variable-rate debt obligations outstanding. At December 31, 2005, the potential change in interest expense associated with a 1% change in base interest rates of KU’s variable-rate debt is estimated at $3.3 million.
An interest rate swap is used to hedge KU’s underlying debt obligations. The swap hedges specific debt issuances and, consistent with management’s designation, are accorded hedge accounting treatment. See Note 4
64
of KU’s Notes to Financial Statements under Item 8.
As of December 31, 2005, KU has a swap with a notional value of $53.0 million. The swap exchanged fixed-rate interest payments for floating rate interest payments on KU’s Series P first mortgage bonds. The potential loss in fair value resulting from a hypothetical 1% adverse movement in base interest rates is estimated at $0.6 million as of December 31, 2005. This estimate is derived from third-party valuations. Changes in the market value of these swaps, if held to maturity, will have no effect on KU’s net income or cash flow. See Note 4 of KU’s Notes to Financial Statements under Item 8.
In June 2005, a KU interest rate swap with a notional amount of $50.0 million was terminated by the counterparty pursuant to the terms of the swap agreement. KU received a payment of $1.9 million in consideration for the termination of the agreement. KU also called the underlying debt (First Mortgage Bond Series R) and paid a call premium of $1.9 million. The swap was fully effective upon termination. No impact on earnings occurred as a result of the bond call and related swap termination.
In February 2004, KU terminated the swaps it had in place at December 31, 2003, related to the Series 9 pollution control bonds. The notional amount of the terminated swap was $50.0 million and KU received a payment of $2.0 million as part of the termination. The swap was terminated because it was no longer an effective hedge of the underlying bond.
Commodity Price Sensitivity
KU is exposed to the market price volatility of coal, natural gas and oil (the fuels used to generate electricity) in its wholesale activities. It has limited exposure to such market price volatility as the result of its retail FAC commodity price pass-through mechanism.
Energy & Risk Management Activities
KU conducts energy trading and risk management activities to maximize the value of power sales from physical assets it owns. Certain energy trading activities are accounted for on a mark-to-market basis in accordance with SFAS No. 133, as amended. Wholesale sales of excess asset capacity are treated as normal sales under SFAS No. 133, as amended, and are not marked to market.
Since the inception of the MISO Day 2 market in April 2005, KU has been eligible to receive FTRs from the MISO. FTRs are assigned by the MISO to market participants for a twelve-month period of time beginning June 1, 2006, for off-peak and peak periods based on each market participant’s share of generation. FTRs are utilized to manage price risk associated with transmission congestion. The value of FTRs is determined by the transmission congestion charges that arise when the transmission grid is congested in the day-ahead market. FTRs are obtained through an allocation from the MISO at zero cost, however, they can also be bought and sold. FTRs are derivatives and their fair value is insignificant due to the lack of liquidity in the forward market.
The fair value of KU’s energy trading and risk management contracts as of December 31, 2005 and 2004, was less than $1.0 million. No changes to valuation techniques for energy trading and risk management activities
65
occurred during 2005. Changes in market pricing, interest rate and volatility assumptions were made during both years. The outstanding mark-to-market value is sensitive to changes in prices, price volatilities, and interest rates. The Company estimates that a movement in prices of $1 and a change in interest and volatilities of 1% would result in a change of less than $0.1 million. All contracts outstanding at December 31, 2005 have a maturity of less than one year and are valued using prices actively quoted for proposed or executed transactions or quoted by brokers.
KU maintains policies intended to minimize credit risk and revalues credit exposures daily to monitor compliance with those policies. At December 31, 2005, 100% of the trading and risk management commitments were with counterparties rated BBB-/Baa3 equivalent or better.
Accounts Receivable Securitization
KU terminated its accounts receivable securitization program in January 2004, and in May 2004, dissolved its inactive accounts receivable securitization-related subsidiary, KU R. No material pre-tax gains or losses resulted from the sale of the receivables in 2004 and 2003. KU’s net cash flows from KU R were reduced by $50.1 million and $0.1 million for 2004 and 2003, respectively. The allowance for doubtful accounts associated with the eligible securitized receivables at December 31, 2003 was $0.5 million. This allowance was based on historical experience of KU. Each securitization facility contained a fully funded reserve for uncollectible receivables.
RATES AND REGULATION
KU is subject to the jurisdiction of the Kentucky Commission, the Virginia Commission, the Tennessee Regulatory Authority and the FERC in virtually all matters related to electric utility regulation, and as such, its accounting is subject to SFAS No. 71. Given KU’s competitive position in the marketplace and the status of regulation in Kentucky and Virginia, KU has no plans or intentions to discontinue its application of SFAS No. 71. See Note 3 and Note 10 of KU’s Notes to Financial Statements under Item 8.
FUTURE OUTLOOK
Competition and Customer Choice
At this time, neither the Kentucky General Assembly nor the Kentucky Commission has adopted or approved a plan or timetable for retail electric industry competition in Kentucky. The nature or timing of the ultimate legislative or regulatory actions regarding industry restructuring and their impact on KU, which may be significant, cannot currently be predicted. Some states that have already deregulated have begun discussions that could lead to re-regulation.
In February 2005, Kentucky’s Governor signed an executive order directing the Kentucky Commission, in conjunction with the Commerce Cabinet and the Environmental and Public Protection Cabinet, to ‘develop a Strategic Blueprint for the continued use and development of electric energy.’ This Strategic Blueprint is designed to promote future investment in electric infrastructure for the Commonwealth of Kentucky, to protect Kentucky’s low-cost electric advantage, to maintain affordable rates for all Kentuckians, and to preserve Kentucky’s commitment to environmental protection.
Virginia has enacted a phase-in of customer choice through the Virginia Electric Restructuring Act, however,
66
KU’s service territory has been effectively exempted from retail choice until such time as retail choice is offered to customers in KU’s other service territories.
Over the last several years, KU has taken many steps to keep its rates low while maintaining high levels of customer satisfaction, including: an increase in focus on commercial, industrial and residential customers; an increase in employee involvement and training; and continuous modifications of its organizational structure. KU also strives to control costs through competitive bidding and process improvements. KU’s performance in national customer satisfaction surveys continues to be high.
ITEM 7A. Quantitative and Qualitative Disclosures About Market Risk.
See LG&E’s and KU’s Management’s Discussion and Analysis of Financial Condition and Results of Operations, Market Risks, under Item 7.
67
ITEM 8. Financial Statements and Supplementary Data.
INDEX OF ABBREVIATIONS
AEP | | American Electric Power Company, Inc. |
AFUDC | | Allowance for Funds Used During Construction |
AG | | Attorney General of Kentucky |
APBO | | Accumulated Postretirement Benefit Obligation |
ARO | | Asset Retirement Obligation |
CAIR | | Clean Air Interstate Rule |
CAMR | | Clean Air Mercury Rule |
Capital Corp. | | E.ON U.S. Capital Corp. (formerly LG&E Capital Corp.) |
CAVR | | Clean Air Visibility Rule |
Clean Air Act | | The Clean Air Act, as amended in 1990 |
CCN | | Certificate of Public Convenience and Necessity |
Company | | LG&E or KU, as applicable |
Companies | | LG&E and KU |
CO2 | | Carbon Dioxide |
CT | | Combustion Turbines |
CWIP | | Construction Work in Progress |
DOE | | Department of Energy |
DOJ | | Department of Justice |
DSM | | Demand Side Management |
ECAR | | East Central Area Reliability Region |
ECR | | Environmental Cost Recovery |
EEI | | Electric Energy, Inc. |
EITF | | Emerging Issues Task Force Issue |
E.ON | | E.ON AG |
E.ON U.S. | | E.ON U.S. LLC (formerly LG&E Energy LLC and LG&E Energy Corp.) |
E.ON U.S. Services | | E.ON U.S. Services Inc. (formerly LG&E Energy Services Inc.) |
EPA | | U.S. Environmental Protection Agency |
EPAct 2005 | | Energy Policy Act of 2005 |
ERISA | | Employee Retirement Income Security Act of 1974, as amended |
ESM | | Earnings Sharing Mechanism |
Fidelia | | Fidelia Corporation (an E.ON affiliate) |
FAC | | Fuel Adjustment Clause |
FASB | | Financial Accounting Standards Board |
FERC | | Federal Energy Regulatory Commission |
FGD | | Flue Gas Desulfurization |
FIN | | FASB Interpretation |
FPA | | Federal Power Act |
FSP | | FASB Staff Position |
FT and FT-A | | Firm Transportation |
FTR | | Financial Transmission Right |
GSC | | Gas Supply Clause |
GFA | | Grandfathered Transmission Agreement |
IBEW | | International Brotherhood of Electrical Workers |
IMEA | | Illinois Municipal Electric Agency |
IMPA | | Indiana Municipal Power Agency |
IRC | | Internal Revenue Code of 1986, as amended |
IRP | | Integrated Resource Plan |
ITP | | Independent Transmission Provider |
Kentucky Commission | | Kentucky Public Service Commission |
KIUC | | Kentucky Industrial Utility Consumers, Inc. |
KU | | Kentucky Utilities Company |
KU Energy | | KU Energy Corporation |
KU R | | KU Receivables LLC |
68
Kv | | Kilovolts |
Kw | | Kilowatts |
Kwh | | Kilowatt hours |
LEM | | LG&E Energy Marketing Inc. |
LG&E | | Louisville Gas and Electric Company |
LG&E Energy | | LG&E Energy LLC (now E.ON U.S. LLC) |
LG&E R | | LG&E Receivables LLC |
LG&E Services | | LG&E Energy Services Inc. (now E.ON U.S. Services) |
LMP | | Locational Marginal Pricing |
LNG | | Liquefied Natural Gas |
Mcf | | Thousand Cubic Feet |
MGP | | Manufactured Gas Plant |
MISO | | Midwest Independent Transmission System Operator, Inc. |
MMBtu | | Million British thermal units |
Moody’s | | Moody’s Investor Services, Inc. |
Mva | | Megavolt-ampere |
Mw | | Megawatts |
Mwh | | Megawatt hours |
NNS | | No-Notice Service |
NOPR | | Notice of Proposed Rulemaking |
NOx | | Nitrogen Oxide |
OATT | | Open Access Transmission Tariff |
OMU | | Owensboro Municipal Utilities |
OVEC | | Ohio Valley Electric Corporation |
PBR | | Performance-Based Ratemaking |
PJM | | Pennsylvania, New Jersey, Maryland Interconnection |
Powergen | | Powergen Limited (formerly Powergen plc) |
PUHCA 1935 | | Public Utility Holding Company Act of 1935 |
PUHCA 2005 | | Public Utility Holding Company Act of 2005 |
ROE | | Return on Equity |
RTO | | Regional Transmission Organization |
RTOR | | Regional Through and Out Rates |
S&P | | Standard & Poor’s Rating Services |
SCR | | Selective Catalytic Reduction |
SEC | | Securities and Exchange Commission |
SERP | | Supplemental Executive Retirement Plan |
SFAS | | Statement of Financial Accounting Standards |
SIP | | State Implementation Plan |
SMD | | Standard Market Design |
SO2 | | Sulfur Dioxide |
SPP | | Southwest Power Pool, Inc. |
TEMT | | Transmission and Energy Markets Tariff |
Tennessee Gas | | Tennessee Gas Pipeline Company |
Texas Gas | | Texas Gas Transmission LLC |
Trimble County | | LG&E’s Trimble County Unit 1 |
TVA | | Tennessee Valley Authority |
USWA | | United Steelworkers of America |
Utility Operations | | Operations of LG&E and KU |
VDT | | Value Delivery Team Process |
Virginia Commission | | Virginia State Corporation Commission |
Virginia Staff | | Virginia State Corporation Commission Staff |
WNA | | Weather Normalization Adjustment |
69
Louisville Gas and Electric Company
Statements of Income
(Millions of $)
| | Years Ended December 31 | |
| | 2005 | | 2004 | | 2003 | |
OPERATING REVENUES: | | | | | | | |
Electric (Note 13) | | $ | 987.4 | | $ | 815.7 | | $ | 768.2 | |
Gas | | 436.9 | | 357.1 | | 325.3 | |
Total operating revenues | | 1,424.3 | | 1,172.8 | | 1,093.5 | |
| | | | | | | |
OPERATING EXPENSES: | | | | | | | |
Fuel for electric generation | | 282.4 | | 208.3 | | 198.0 | |
Power purchased (Notes 10 and 13) | | 140.6 | | 92.1 | | 79.6 | |
Gas supply expenses | | 339.4 | | 266.0 | | 233.6 | |
Other operation and maintenance expenses | | 307.9 | | 304.8 | | 290.2 | |
Depreciation and amortization (Note 1) | | 124.1 | | 116.6 | | 113.3 | |
Total operating expenses | | 1,194.4 | | 987.8 | | 914.7 | |
| | | | | | | |
Net operating income | | 229.9 | | 185.0 | | 178.8 | |
| | | | | | | |
Other (income) expense - net | | (0.7 | ) | 3.3 | | 7.2 | |
Interest expense (Notes 8 and 9) | | 24.1 | | 20.6 | | 23.9 | |
Interest expense to affiliated companies (Note 13) | | 12.7 | | 12.2 | | 6.8 | |
| | | | | | | |
Income before income taxes | | 193.8 | | 148.9 | | 140.9 | |
| | | | | | | |
Federal and state income taxes (Note 7) | | 64.9 | | 53.3 | | 50.1 | |
| | | | | | | |
Net income | | $ | 128.9 | | $ | 95.6 | | $ | 90.8 | |
The accompanying notes are an integral part of these financial statements.
Statements of Retained Earnings
(Millions of $)
| | Years Ended December 31 | |
| | 2005 | | 2004 | | 2003 | |
| | | | | | | |
Balance January 1 | | $ | 534.0 | | $ | 497.4 | | $ | 409.3 | |
Add net income | | 128.9 | | 95.6 | | 90.8 | |
| | | | | | | |
| | 662.9 | | 593.0 | | 500.1 | |
Deduct: Cash dividends declared on stock: | | | | | | | |
5% cumulative preferred | | 1.1 | | 1.1 | | 1.1 | |
Auction rate cumulative preferred | | 1.8 | | 0.9 | | 0.9 | |
$5.875 cumulative preferred | | — | | — | | 0.7 | |
Common | | 39.0 | | 57.0 | | — | |
| | | | | | | |
| | 41.9 | | 59.0 | | 2.7 | |
| | | | | | | |
Balance December 31 | | $ | 621.0 | | $ | 534.0 | | $ | 497.4 | |
The accompanying notes are an integral part of these financial statements.
70
Louisville Gas and Electric Company
Statements of Comprehensive Income
(Millions of $)
| | Years Ended December 31 | |
| | 2005 | | 2004 | | 2003 | |
Net income | | $ | 128.9 | | $ | 95.6 | | $ | 90.8 | |
| | | | | | | |
Gain (loss) on derivative instruments and hedging activities, net of tax benefit (expense) of $0, $0.9 and $(0.4) for 2005, 2004 and 2003, respectively (Notes 1 and 4) | | (0.1 | ) | (1.4 | ) | 0.5 | |
| | | | | | | |
Additional minimum pension liability adjustment, net of tax benefit (expense) of $6.7, $4.1 and $(1.2) for 2005, 2004 and 2003, respectively (Note 6) | | (12.5 | ) | (6.1 | ) | 1.9 | |
| | | | | | | |
Other comprehensive income (loss), net of tax (Note 14) | | (12.6 | ) | (7.5 | ) | 2.4 | |
| | | | | | | |
Comprehensive income | | $ | 116.3 | | $ | 88.1 | | $ | 93.2 | |
The accompanying notes are an integral part of these financial statements.
71
Louisville Gas and Electric Company
Balance Sheets
(Millions of $)
| | December 31 | |
| | 2005 | | 2004 | |
| | | | | |
ASSETS: | | | | | |
Current assets: | | | | | |
Cash and cash equivalents (Note 1) | | $ | 7.1 | | $ | 6.8 | |
Accounts receivable - less reserve of $1.1 million in 2005 and $0.8 million in 2004 (Note 4) | | 267.5 | | 167.0 | |
Materials and supplies (Note 1): | | | | | |
Fuel (predominantly coal) | | 38.7 | | 21.8 | |
Gas stored underground | | 124.9 | | 77.5 | |
Other materials and supplies | | 27.7 | | 26.1 | |
Prepayments and other current assets | | 5.8 | | 3.9 | |
Total current assets | | 471.7 | | 303.1 | |
| | | | | |
Other property and investments – less reserve of $0.1 million in 2005 and 2004 (Note 1) | | 0.7 | | 0.5 | |
| | | | | |
Utility plant, at original cost (Note 1): | | | | | |
Electric | | 3,179.9 | | 3,113.7 | |
Gas | | 511.6 | | 487.8 | |
Common | | 198.8 | | 177.5 | |
Total utility plant, at original cost | | 3,890.3 | | 3,779.0 | |
| | | | | |
Less: reserve for depreciation | | 1,508.7 | | 1,396.3 | |
Total utility plant, net | | 2,381.6 | | 2,382.7 | |
| | | | | |
Construction work in progress | | 158.8 | | 136.8 | |
Total utility plant and construction work in progress | | 2,540.4 | | 2,519.5 | |
| | | | | |
Deferred debits and other assets: | | | | | |
Restricted cash (Note 1) | | 9.8 | | 10.9 | |
Unamortized debt expense (Note 1) | | 8.6 | | 8.4 | |
Regulatory assets (Note 3) | | 84.5 | | 91.9 | |
Other assets | | 30.7 | | 32.2 | |
Total deferred debits and other assets | | 133.6 | | 143.4 | |
| | | | | |
Total Assets | | $ | 3,146.4 | | $ | 2,966.5 | |
The accompanying notes are an integral part of these financial statements.
72
Louisville Gas and Electric Company
Balance Sheets (continued)
(Millions of $)
| | December 31 | |
| | 2005 | | 2004 | |
| | | | | |
LIABILITIES AND EQUITY: | | | | | |
Current liabilities: | | | | | |
Current portion of long-term debt: | | | | | |
Long-term bonds (Note 8) | | $ | 247.5 | | $ | 247.4 | |
Long-term notes to affiliated company (Note 8) | | — | | 50.0 | |
Total current portion of long term debt | | 247.5 | | 297.4 | |
| | | | | |
Notes payable to affiliated company (Notes 9 and 13) | | 141.2 | | 58.2 | |
Accounts payable | | 140.5 | | 106.1 | |
Accounts payable to affiliated companies (Note 13) | | 52.4 | | 31.7 | |
Accrued income taxes | | 6.2 | | 6.2 | |
Customer deposits | | 16.7 | | 14.0 | |
Other current liabilities | | 15.2 | | 18.6 | |
Total current liabilities | | 619.7 | | 532.2 | |
| | | | | |
Long-term debt: | | | | | |
Long-term bonds (Note 8) | | 328.1 | | 328.1 | |
Long-term notes to affiliated company (Note 8) | | 225.0 | | 225.0 | |
Mandatorily redeemable preferred stock (Note 8) | | 20.0 | | 21.3 | |
Total long term debt | | 573.1 | | 574.4 | |
| | | | | |
Deferred credits and other liabilities: | | | | | |
Accumulated deferred income taxes (Note 7) | | 321.7 | | 347.2 | |
Investment tax credit, in process of amortization | | 42.1 | | 46.2 | |
Accumulated provision for pensions and related benefits (Note 6) | | 143.5 | | 120.6 | |
Asset retirement obligations | | 26.6 | | 10.3 | |
Regulatory liabilities (Note 3): | | | | | |
Accumulated cost of removal of utility plant | | 218.9 | | 220.2 | |
Regulatory liability deferred income taxes | | 41.7 | | 37.2 | |
Other regulatory liabilities | | 20.2 | | 14.9 | |
Other liabilities | | 41.3 | | 40.1 | |
Total deferred credits and other liabilities | | 856.0 | | 836.7 | |
| | | | | |
Commitments and contingencies (Note 10) | | | | | |
| | | | | |
Cumulative preferred stock | | 70.4 | | 70.4 | |
| | | | | |
COMMON EQUITY: | | | | | |
Common stock, without par value - Authorized 75,000,000 shares, outstanding 21,294,223 shares | | 424.4 | | 424.4 | |
Additional paid-in capital | | 40.0 | | 40.0 | |
Accumulated other comprehensive income (Note 14) | | (58.2 | ) | (45.6 | ) |
Retained earnings | | 621.0 | | 534.0 | |
Total common equity | | 1,027.2 | | 952.8 | |
| | | | | |
Total Liabilities and Equity | | $ | 3,146.4 | | $ | 2,966.5 | |
The accompanying notes are an integral part of these financial statements.
73
Louisville Gas and Electric Company
Statements of Cash Flows
(Millions of $)
| | Years Ended December 31 | |
| | 2005 | | 2004 | | 2003 | |
CASH FLOWS FROM OPERATING ACTIVITIES: | | | | | | | |
Net income | | $ | 128.9 | | $ | 95.6 | | $ | 90.8 | |
Items not requiring cash currently: | | | | | | | |
Depreciation and amortization | | 119.3 | | 116.6 | | 113.3 | |
Deferred income taxes - net | | (14.3 | ) | 5.5 | | 20.1 | |
Investment tax credit - net | | (4.1 | ) | (4.1 | ) | (4.2 | ) |
VDT amortization | | 30.2 | | 30.1 | | 30.4 | |
Unrealized gain (loss) on derivatives | | — | | 2.6 | | (1.1 | ) |
Other | | 7.8 | | (2.0 | ) | 10.8 | |
Change in certain current assets and liabilities: | | | | | | | |
Accounts receivable | | (100.5 | ) | (82.4 | ) | (16.1 | ) |
Materials and supplies | | (65.9 | ) | (5.3 | ) | (7.6 | ) |
Accounts payable | | 55.1 | | 6.3 | | 8.7 | |
Accrued income taxes | | — | | (5.3 | ) | 17.2 | |
Prepayments and other | | (2.5 | ) | 6.8 | | 0.9 | |
Pension funding | | (9.8 | ) | (34.5 | ) | (89.1 | ) |
Gas supply clause receivable, net | | (3.2 | ) | 10.3 | | (4.7 | ) |
Litigation settlement | | — | | 7.0 | | — | |
Earnings sharing mechanism receivable | | 2.1 | | 10.2 | | 0.1 | |
Other | | 7.3 | | 14.2 | | (6.2 | ) |
Net cash provided by operating activities | | 150.4 | | 171.6 | | 163.3 | |
| | | | | | | |
CASH FLOWS FROM INVESTING ACTIVITIES: | | | | | | | |
Construction expenditures | | (138.9 | ) | (148.3 | ) | (213.0 | ) |
Change in restricted cash | | 1.1 | | (10.9 | ) | — | |
Other | | (0.2 | ) | 0.1 | | 0.2 | |
Net cash used for investing activities | | (138.0 | ) | (159.1 | ) | (212.8 | ) |
| | | | | | | |
CASH FLOWS FROM FINANCING ACTIVITIES: | | | | | | | |
Long-term borrowings from affiliated company | | — | | 125.0 | | 200.0 | |
Repayment of long-term borrowings from affiliated company | | (50.0 | ) | (50.0 | ) | — | |
Short-term borrowings from affiliated company | | 788.6 | | 552.8 | | 602.7 | |
Repayment of short-term borrowings from affiliated company | | (705.6 | ) | (574.9 | ) | (715.4 | ) |
Retirement of first mortgage bonds | | — | | — | | (42.6 | ) |
Issuance of pollution control bonds | | 40.0 | | — | | 128.0 | |
Issuance expense on pollution control bonds | | (1.9 | ) | (0.1 | ) | (5.9 | ) |
Retirement of pollution control bonds | | (40.0 | ) | — | | (128.0 | ) |
Retirement of mandatorily redeemable preferred stock | | (1.3 | ) | (1.3 | ) | (1.3 | ) |
Payment of dividends | | (41.9 | ) | (58.9 | ) | (3.3 | ) |
Net cash (used for) provided by financing activities | | (12.1 | ) | (7.4 | ) | 34.2 | |
| | | | | | | |
Change in cash and cash equivalents | | 0.3 | | 5.1 | | (15.3 | ) |
| | | | | | | |
Cash and cash equivalents at beginning of year | | 6.8 | | 1.7 | | 17.0 | |
| | | | | | | |
Cash and cash equivalents at end of year | | $ | 7.1 | | $ | 6.8 | | $ | 1.7 | |
| | | | | | | |
Supplemental disclosures of cash flow information: | | | | | | | |
| | | | | | | |
Cash paid during the year for: | | | | | | | |
Income taxes | | $ | 83.3 | | $ | 52.1 | | $ | 24.9 | |
Interest on borrowed money | | 20.9 | | 18.1 | | 23.8 | |
Interest to affiliated companies on borrowed money | | 12.7 | | 11.3 | | 4.2 | |
The accompanying notes are an integral part of these financial statements.
74
Louisville Gas and Electric Company
Statements of Capitalization
(Millions of $)
| | December 31 | |
| | 2005 | | 2004 | |
| | | | | |
LONG-TERM DEBT (Note 8): | | | | | |
Pollution control series: | | | | | |
S due September 1, 2017, variable % | | $ | 31.0 | | $ | 31.0 | |
T due September 1, 2017, variable % | | 60.0 | | 60.0 | |
U due August 15, 2013, variable % | | 35.2 | | 35.2 | |
X due April 15, 2023, 5.90% | | — | | 40.0 | |
Y due May 1, 2027, variable % | | 25.0 | | 25.0 | |
Z due August 1, 2030, variable % | | 83.3 | | 83.3 | |
AA due September 1, 2027, variable % | | 10.1 | | 10.1 | |
BB due September 1, 2026, variable % | | 22.5 | | 22.5 | |
CC due September 1, 2026, variable % | | 27.5 | | 27.5 | |
DD due November 1, 2027, variable % | | 35.0 | | 35.0 | |
EE due November 1, 2027, variable % | | 35.0 | | 35.0 | |
FF due October 1, 2032, variable % | | 41.7 | | 41.7 | |
GG due October 1, 2033, variable % | | 128.0 | | 128.0 | |
HH due February 1, 2035, variable % | | 40.0 | | — | |
Notes payable to Fidelia: | | | | | |
Due January 6, 2005, 1.53%, secured | | — | | 50.0 | |
Due January 16, 2012, 4.33%, secured | | 25.0 | | 25.0 | |
Due April 30, 2013, 4.55%, unsecured | | 100.0 | | 100.0 | |
Due August 15, 2013, 5.31%, secured | | 100.0 | | 100.0 | |
Mandatorily redeemable preferred stock: | | | | | |
$5.875 series, outstanding shares of 212,500 in 2005 and 225,000 in 2004 | | 21.3 | | 22.5 | |
| | | | | |
Total long-term debt outstanding | | 820.6 | | 871.8 | |
| | | | | |
Less current portion of long-term debt | | 247.5 | | 297.4 | |
| | | | | |
Long-term debt | | 573.1 | | 574.4 | |
| | | | | | | |
CUMULATIVE PREFERRED STOCK:
| | Shares | | Current | | | | | |
| | Outstanding | | Redemption Price | | | | | |
$25 par value, 1,720,000 shares authorized - 5% series | | 860,287 | | $ | 28.00 | | 21.5 | | 21.5 | |
Without par value, 6,750,000 shares authorized - Auction rate | | 500,000 | | $ | 100.00 | | 50.0 | | 50.0 | |
Preferred stock expense, net | | | | | | (1.1 | ) | (1.1 | ) |
| | | | | | | | | |
| | | | | | 70.4 | | 70.4 | |
COMMON EQUITY:
Common stock, without par value - Authorized 75,000,000 shares, outstanding 21,294,223 shares | | 425.2 | | 425.2 | |
Common stock expense | | (0.8 | ) | (0.8 | ) |
Additional paid-in capital | | 40.0 | | 40.0 | |
Accumulated other comprehensive income (Note 14) | | (58.2 | ) | (45.6 | ) |
Retained earnings | | 621.0 | | 534.0 | |
Total common equity | | 1,027.2 | | 952.8 | |
Total capitalization | | $ | 1,670.7 | | $ | 1,597.6 | |
| | | | | | | |
The accompanying notes are an integral part of these financial statements.
75
Louisville Gas and Electric Company
Notes to Financial Statements
Note 1 - Summary of Significant Accounting Policies
LG&E, a subsidiary of E.ON U.S. (formerly LG&E Energy) and an indirect subsidiary of E.ON, is a regulated public utility engaged in the generation, transmission, distribution and sale of electric energy and the storage, distribution and sale of natural gas in Louisville and adjacent areas in Kentucky. E.ON U.S. is a public utility holding company with wholly owned subsidiaries including LG&E, KU, Capital Corp., LEM and E.ON U.S. Services. All of LG&E’s common stock is held by E.ON U.S. In May 2004, LG&E dissolved its accounts receivable securitization-related subsidiary, LG&E R. Prior to May 2004, the consolidated financial statements included the accounts of LG&E and LG&E R with the elimination of intercompany accounts and transactions.
Effective December 30, 2003, LG&E Energy LLC became the successor, by assignment and subsequent merger, to all assets and liabilities of LG&E Energy Corp. Effective December 1, 2005, LG&E Energy LLC was renamed E.ON U.S. LLC.
Certain reclassification entries have been made to the previous years’ financial statements to conform to the 2005 presentation with no impact on net assets, liabilities and capitalization or previously reported net income and cash flows.
During 2005, LG&E made out-of-period adjustments for estimated over/under collection of ECR revenues to be billed in subsequent periods. The adjustments were related to the reporting periods of March 2003 through December 2004. As a result, LG&E revenues for 2005 were increased $5.3 million and net income for 2005 was increased $3.2 million. LG&E revenues for 2004 and 2003 were understated by $2.4 million and $2.9 million, respectively, and net income was understated by $1.4 million and $1.8 million, respectively.
Regulatory Accounting. LG&E is subject to SFAS No. 71 under which costs that would otherwise be charged to expense are deferred as regulatory assets based on expected recovery from customers in future rates. Likewise, credits that would otherwise be reflected as income are deferred as regulatory liabilities based on expected return to customers in future rates. LG&E’s current or expected recovery of deferred costs and expected return of deferred credits is based on specific ratemaking decisions or precedent for each item as prescribed by the FERC or the Kentucky Commission. See Note 3, Rates and Regulatory Matters, for additional detail regarding regulatory assets and liabilities.
Cash and Cash Equivalents. LG&E considers all debt instruments purchased with an original maturity of three months or less to be cash equivalents.
Allowance for Doubtful Accounts. The allowance for doubtful accounts is based on the ratio of the amounts charged-off during the last twelve months to the retail revenues billed over the same period multiplied by the retail revenues billed over the last four months. Accounts with no payment activity are charged-off after four months, although collection efforts continue thereafter.
Materials and Supplies. Fuel, gas stored underground and other materials and supplies inventories are accounted for using the average-cost method. Emission allowances are included in inventory at cost and are not currently traded by LG&E. At December 31, 2005 and 2004, the emission allowances inventory was less than $0.1 million.
Other Property and Investments. Other property and investments on the balance sheet consists of LG&E’s investment in OVEC and non-utility plant. LG&E and 11 other electric utilities are participating owners of OVEC, located in Piketon, Ohio. OVEC owns and operates two power plants that burn coal to generate
76
electricity, Kyger Creek Station in Ohio and Clifty Creek Station in Indiana. Through March 2006, LG&E is entitled to receive 7% of OVEC’s output, and thereafter is entitled to receive 5.63%, representing approximately 124 Mw.
As of December 31, 2005 and 2004, LG&E’s investment in OVEC totaled $0.6 and $0.5 million, respectively. LG&E is not the primary beneficiary of OVEC, and, therefore, it is not consolidated into the financial statements of LG&E and is accounted for under the cost method of accounting. LG&E’s maximum exposure to loss as a result of its involvement with OVEC is limited to the value of its investment. In the event of the inability of OVEC to fulfill its power provision requirements, LG&E would substitute such power supply with either owned generation or market purchases and would generally recover associated incremental costs through regulatory rate mechanisms. See Note 10, Commitments and Contingencies, for further discussion of developments regarding LG&E’s ownership interest and power purchase rights.
Utility Plant. LG&E’s utility plant is stated at original cost, which includes payroll-related costs such as taxes, fringe benefits, and administrative and general costs. Construction work in progress has been included in the rate base for determining retail customer rates. LG&E has not recorded any allowance for funds used during construction, in accordance with Kentucky Commission regulations.
The cost of plant retired or disposed of in the normal course of business is deducted from plant accounts and such cost, plus removal expense less salvage value, is charged to the reserve for depreciation. When complete operating units are disposed of, appropriate adjustments are made to the reserve for depreciation and gains and losses, if any, are recognized.
Depreciation and Amortization. Depreciation is provided on the straight-line method over the estimated service lives of depreciable plant. The amounts provided were approximately 3.2% in 2005 (3.0% electric, 2.4% gas, and 8.0% common); 3.1% in 2004 (2.9% electric, 2.8% gas and 7.6% common); and 3.3% for 2003 (2.9% electric, 2.8% gas and 9.4% common), of average depreciable plant. Of the amount provided for depreciation, at December 31, 2005, approximately 0.4% electric, 0.8% gas and 0.02% common were related to the retirement, removal and disposal costs of long lived assets. Of the amount provided for depreciation, at December 31, 2004, approximately 0.4% electric, 0.9% gas and 0.04% common were related to the retirement, removal and disposal costs of long lived assets.
Restricted Cash. A deposit in the amount of $9.8 million, used as collateral for an $83.3 million interest rate swap expiring in 2020, is classified as restricted cash on LG&E’s balance sheet.
Unamortized Debt Expense. Debt expense is capitalized in deferred debits and amortized over the lives of the related bond issues.
Income Taxes. Income taxes are accounted for under SFAS No.109. In accordance with this statement,
77
deferred tax assets and liabilities are recognized for the future tax consequences attributable to differences between the financial statement carrying amounts of existing assets and liabilities and their respective tax bases, as measured by enacted tax rates that are expected to be in effect in the periods when the deferred tax assets and liabilities are expected to be settled or realized. Significant judgment is required in determining the provision for income taxes, and there are transactions for which the ultimate tax outcome is uncertain. To provide for these uncertainties or exposures, an allowance is maintained for tax contingencies based on management’s best estimate of probable loss. Tax contingencies are analyzed periodically and adjustments are made when events occur to warrant a change. See Note 7, Income Taxes.
Deferred Income Taxes. Deferred income taxes are recognized at currently enacted tax rates for all material temporary differences between the financial reporting and income tax bases of assets and liabilities.
Investment Tax Credits. Investment tax credits resulted from provisions of the tax law that permitted a reduction of LG&E’s tax liability based on credits for construction expenditures. Deferred investment tax credits are being amortized to income over the estimated lives of the related property that gave rise to the credits.
Revenue Recognition. Revenues are recorded based on service rendered to customers through month-end. LG&E accrues an estimate for unbilled revenues from each meter reading date to the end of the accounting period based on allocating the daily system net deliveries between billed volumes and unbilled volumes. The allocation is based on a daily ratio of the number of meter reading cycles remaining in the month to the total number of meter reading cycles in each month. Each day’s ratio is then multiplied by each day’s system net deliveries to determine an estimated billed and unbilled volume for each day of the accounting period. The unbilled revenue estimates included in accounts receivable were approximately $81.8 million and $63.0 million at December 31, 2005 and 2004, respectively.
Fuel and Gas Costs. The cost of fuel for electric generation is charged to expense as used, and the cost of natural gas supply is charged to expense as delivered to the distribution system. LG&E implemented a Kentucky Commission-approved performance-based ratemaking mechanism related to natural gas procurement activity. See Note 3, Rates and Regulatory Matters.
Management’s Use of Estimates. The preparation of financial statements in conformity with generally accepted accounting principles requires management to make estimates and assumptions that affect the reported assets and liabilities and disclosure of contingent items at the date of the financial statements and the reported amounts of revenues and expenses during the reporting period. Accrued liabilities, including legal and environmental, are recorded when they are probable and estimable. Actual results could differ from those estimates.
New Accounting Pronouncements. The following accounting pronouncement was issued that affected LG&E in 2005:
FIN 47
LG&E adopted FIN 47, effective December 31, 2005. FIN 47 expands the term “conditional asset retirement obligation” as used in SFAS No. 143, to refer to a legal obligation to perform an asset retirement activity in which the timing and/or method of settlement are conditional on a future event that may or may not be within the control of the entity. The obligation to perform the asset retirement activity is unconditional even though uncertainty exists about the timing and/or method of settlement. An entity is required to recognize a liability for the fair value of a conditional asset retirement obligation if the fair value of the liability can be reasonably estimated. The fair value of a liability for the conditional asset retirement obligation should be recognized when
78
incurred; generally, upon acquisition, construction or development and through the normal operation of the asset.
As a result of the implementation of FIN 47, LG&E recorded additional ARO net assets and liabilities during the fourth quarter of 2005 in the amount of $1.0 million and $15.7 million, respectively. LG&E also recorded a cumulative effect adjustment in the amount of $12.3 million to reflect the accumulated depreciation and accretion of ARO assets at the transition date less amounts previously accrued under regulatory depreciation. A $2.4 million reduction in the accumulated cost of removal regulatory liability was also recorded for this previously accrued cost of removal. LG&E recorded offsetting regulatory assets of $12.3 million, pursuant to regulatory treatment prescribed under SFAS No. 71 as the costs of removal are allowed under Kentucky Commission ratemaking.
Had FIN 47 been in effect at the beginning of the 2004 reporting period, LG&E would have established asset retirement obligations as described in the following table (in millions):
| | 2005 | | 2004 | |
Provision at beginning of the year | | $ | 14.8 | | $ | 14.0 | |
Accretion expense | | 0.9 | | 0.8 | |
Provision at end of the year | | $ | 15.7 | | $ | 14.8 | |
Note 2 – Company Structure
On July 1, 2002, E.ON completed its acquisition of Powergen, including E.ON U.S. (formerly LG&E Energy), for approximately £5.1 billion ($7.3 billion). As a result of the acquisition, E.ON U.S. became a wholly owned subsidiary of E.ON and, as a result, LG&E also became an indirect subsidiary of E.ON. LG&E has continued its separate identity and serves customers in Kentucky under its existing name. The preferred stock and debt securities of LG&E were not affected by this transaction and the Company continues to file SEC reports.
Note 3 - Rates and Regulatory Matters
Electric and Gas Rate Cases
In December 2003, LG&E filed an application with the Kentucky Commission requesting adjustments in LG&E’s electric and natural gas rates. LG&E asked for general adjustments in electric and natural gas rates based on the twelve month test period ended September 30, 2003. The revenue increases requested were $63.8 million for electric and $19.1 million for natural gas. In June 2004, the Kentucky Commission issued an order approving increases in LG&E’s annual electric base rates of approximately $43.4 million (7.7%) and annual natural gas base rates of approximately $11.9 million (3.4%). The rate increases took effect on July 1, 2004.
During 2004 and 2005, the AG conducted an investigation of LG&E, as well as of the Kentucky Commission and its staff, requesting information regarding allegedly improper communications between LG&E and the Kentucky Commission, particularly during the period covered by the rate cases. Concurrently, the AG had filed pleadings with the Kentucky Commission requesting rehearing of the rate cases on computational components of the increased rates, including income taxes, cost of removal and depreciation amounts. In August 2004, the Kentucky Commission denied the AG’s rehearing request on the cost of removal and depreciation issues and granted rehearing on the income tax component. The Kentucky Commission further agreed to hold in abeyance further proceedings in the rate case, until the AG filed its investigative report regarding the allegations of improper communication.
In January 2005 and February 2005, the AG filed a motion summarizing its investigative report as containing evidence of improper communications and record-keeping errors by LG&E in its conduct of activities before
79
the Kentucky Commission or other state governmental entities and forwarded such report to the Kentucky Commission under continued confidential treatment to allow it to consider the report, including its impact, if any, on completing its investigation and any remaining steps in the rate case. To date, LG&E has neither seen nor requested copies of the report or its contents.
In December 2005, the Kentucky Commission issued an order noting completion if its inquiry, including review of the AG’s investigative report. The order concludes no improper communications occurred during the rate proceedings. The order further established a procedural schedule through the first quarter of 2006 for considering the sole issue for which rehearing was granted: state income tax rates used in calculating the granted rate increases. This issue is estimated at less than $1 million annually. Upon resolution of this issue on rehearing, the initial rate increase order could be subject to judicial appeal.
LG&E believes no improprieties have occurred in its communications with the Kentucky Commission and has cooperated with the proceedings before the AG and the Kentucky Commission. LG&E is currently unable to determine the ultimate impact, if any, of, or any possible future actions of the AG or the Kentucky Commission arising out of, the AG’s report and investigation, including whether there will be further actions to appeal, review or otherwise challenge the granted increases in rates.
Regulatory Assets and Liabilities
The following regulatory assets and liabilities were included in LG&E’s Balance Sheets as of December 31:
(in millions) | | 2005 | | 2004 | |
| | | | | |
VDT Costs | | $ | 7.5 | | $ | 37.7 | |
Unamortized loss on bonds | | 20.6 | | 20.3 | |
ARO | | 20.0 | | 6.9 | |
Gas supply adjustments | | 25.4 | | 13.3 | |
Merger surcredit | | 3.5 | | 4.8 | |
Other | | 7.5 | | 8.9 | |
Total regulatory assets | | $ | 84.5 | | $ | 91.9 | |
| | | | | |
Accumulated cost of removal of utility plant | | $ | 218.9 | | $ | 220.2 | |
Deferred income taxes - net | | 41.7 | | 37.2 | |
Gas supply adjustments | | 17.3 | | 8.4 | |
ECR | | — | | 4.0 | |
Other | | 2.9 | | 2.5 | |
Total regulatory liabilities | | $ | 280.8 | | $ | 272.3 | |
LG&E currently earns a return on all regulatory assets except for gas supply adjustments, FAC, gas performance based ratemaking and DSM, all of which are separate rate mechanisms with recovery within twelve months. Additionally, no current return is earned on the ARO regulatory asset. This regulatory asset will be offset against the associated regulatory liability, ARO asset, and ARO liability at the time the underlying asset is retired. See Note 1, Summary of Significant Accounting Policies.
VDT. During the first quarter of 2001, LG&E recorded a $144.0 million charge for a workforce reduction program. Primary components of the charge were separation benefits, enhanced early retirement benefits and healthcare benefits. The result of this workforce reduction was the elimination of approximately 700 positions, accomplished primarily through a voluntary enhanced severance program.
In December 2001, the Kentucky Commission issued an order approving a settlement agreement allowing LG&E to set up a regulatory asset of $141.0 million for the workforce reduction costs and begin amortizing
80
these costs over a five-year period starting in April 2001. Some employees rescinded their participation in the voluntary enhanced severance program, which thereby decreased the charge to the regulatory asset from $144.0 million to $141.0 million. The order reduced revenues by approximately $26.0 million through a surcredit on bills to ratepayers over the same five-year period. The surcredit represents savings, net of the amortization of the costs, stipulated by LG&E and shared 40% with ratepayers and with LG&E retaining 60% of the net savings.
The five-year VDT amortization period is scheduled to expire in March 2006. As part of the settlement agreements in the electric and natural gas rate cases, LG&E was required to file, and did file on September 30, 2005, with the Kentucky Commission a plan for the future ratemaking treatment of the VDT surcredit and costs. The surcredit will remain in effect until the Commission enters an order on the future disposition of VDT-related issues.
On February 27, 2006, the AG, KIUC, LG&E and KU reached a settlement agreement on the future ratemaking treatment of the VDT surcredits and costs and subsequently submitted a joint motion to the Kentucky Commission to approve the unanimous settlement agreement. Under the terms of the settlement agreement, the VDT surcredit will continue at the current level until such time as LG&E files for a change in electric or gas base rates. The Kentucky Commission held a public hearing in the proceeding on March 21, 2006 and issued an order thereafter approving the settlement agreement.
Unamortized Loss on Bonds. The costs of early extinguishment of debt, including call premiums, legal and other expenses, and any unamortized balance of debt expense are amortized over the life of either replacement debt (in the case of re-financing) or the original life of the extinguished debt.
ARO. A summary of LG&E’s net ARO assets, regulatory assets, liabilities and cost of removal established under FIN 47 and SFAS No. 143 follows:
| | ARO Net | | ARO | | Regulatory | | Regulatory | | Accumulated | | Cost of Removal | |
(in millions) | | Assets | | Liabilities | | Assets | | Liabilities | | Cost of Removal | | Depreciation | |
| | | | | | | | | | | | | |
As of December 31, 2003 | | $ | 3.5 | | $ | (9.7 | ) | $ | 6.0 | | $ | (0.1 | ) | $ | 0.5 | | $ | — | |
ARO accretion | | — | | (0.7 | ) | 0.7 | | — | | — | | — | |
ARO depreciation | | (0.2 | ) | — | | 0.2 | | — | | — | | — | |
Removal cost incurred | | — | | 0.1 | | — | | — | | — | | — | |
Cost of removal depreciation | | — | | — | | — | | — | | — | | — | |
As of December 31, 2004 | | 3.3 | | (10.3 | ) | 6.9 | | (0.1 | ) | 0.5 | | — | |
FIN 47 net asset additions | | 1.0 | | (15.7 | ) | 12.3 | | — | | 2.4 | | — | |
ARO accretion | | — | | (0.7 | ) | 0.7 | | — | | — | | — | |
ARO depreciation | | (0.1 | ) | — | | 0.1 | | — | | — | | — | |
Removal cost incurred | | — | | 0.1 | | — | | — | | — | | — | |
Cost of removal depreciation | | — | | — | | — | | (0.1 | ) | — | | 0.1 | |
As of December 31, 2005 | | $ | 4.2 | | $ | (26.6 | ) | $ | 20.0 | | $ | (0.2 | ) | $ | 2.9 | | $ | 0.1 | |
Pursuant to regulatory treatment prescribed under SFAS No. 71, an offsetting regulatory credit was recorded in Depreciation and amortization in the income statement of $0.8 million in 2005 and $0.9 million in 2004 for the ARO accretion and depreciation expense. LG&E AROs are primarily related to the final retirement of assets associated with generating units and natural gas wells. For assets associated with AROs, the removal cost accrued through depreciation under regulatory accounting is established as a regulatory asset or liability pursuant to regulatory treatment prescribed under SFAS No. 71. For the years ended December 31, 2005 and 2004, LG&E recorded less than $0.1 million of depreciation expense related to the cost of removal of ARO related assets. An offsetting regulatory liability was established pursuant to regulatory treatment prescribed under SFAS No. 71.
LG&E transmission and distribution lines largely operate under perpetual property easement agreements which
81
do not generally require restoration upon removal of the property. Therefore, under SFAS No. 143, no material asset retirement obligations are recorded for transmission and distribution assets.
Merger Surcredit. As part of the LG&E Energy merger with KU Energy in 1998, LG&E estimated non-fuel savings over a ten-year period following the merger. Costs to achieve these savings were deferred and amortized over a five-year period pursuant to regulatory orders. In approving the merger, the Kentucky Commission adopted LG&E’s proposal to reduce its retail customers’ bills based on one-half of the estimated merger-related savings, net of deferred and amortized amounts, over a five-year period. The surcredit mechanism provides that 50% of the net non-fuel cost savings estimated to be achieved from the merger be provided to ratepayers through a monthly bill credit, and 50% be retained by LG&E and KU, over a five-year period. The surcredit was allocated 53% to KU and 47% to LG&E. In that same order, the Commission required LG&E and KU, after the end of the five-year period, to present a plan for sharing with ratepayers the then-projected non-fuel savings associated with the merger. The Companies submitted this filing in January 2003, proposing to continue to share with ratepayers, on a 50%/50% basis, the estimated fifth-year gross level of non-fuel savings associated with the merger. In October 2003, the Kentucky Commission issued an order approving a settlement agreement reached with the parties in the case. LG&E’s merger surcredit will remain in place for another five-year term beginning July 1, 2003 and the merger savings will continue to be shared 50% with ratepayers and 50% with shareholders.
ESM. Prior to 2004, LG&E’s retail electric rates were subject to an ESM. The ESM, initially in place for three years beginning in 2000, set an upper (12.5%) and lower (10.5%) limit for rate of return on equity. If earnings were above the upper limit, the excess earnings were shared 40% with ratepayers and 60% with shareholders; if earnings were below the lower limit, the earnings deficiency was recovered 40% from ratepayers and 60% from shareholders. By order of the Kentucky Commission, rate changes prompted by the ESM filing went into effect in April of each year subject to a balancing adjustment in successive periods.
In November 2002, LG&E filed a revised ESM tariff which proposed continuance of the existing ESM through December 2005. In addition, the Kentucky Commission initiated a focused management audit to review the ESM plan and reassess its reasonableness. LG&E filed its final 2003 ESM calculations with the Kentucky Commission on March 1, 2004, and applied for recovery of $13.0 million. Based upon estimates, LG&E previously accrued $8.9 million for the 2003 ESM as of December 31, 2003. In June 2004, the Kentucky Commission issued an order largely accepting proposed settlement agreements by LG&E and all intervenors regarding the ESM. Under the ESM settlements, LG&E continued to collect approximately $13.0 million of previously requested 2003 ESM revenue amounts through March 2005. As part of the settlement, the parties agreed to a termination of the ESM mechanism relating to all periods after 2003.
FAC. LG&E’s retail electric rates contain an FAC, whereby increases and decreases in the cost of fuel for electric generation are reflected in the rates charged to retail electric customers. In January 2003, the Kentucky Commission reviewed KU’s FAC and, as part of the order in that case, required that an independent audit be conducted to examine operational and management aspects of both LG&E’s and KU’s fuel procurement functions. The final report was issued in February 2004. The report’s recommendations related to documentation and process improvements. Management Audit Action Plans were agreed upon by LG&E and the Kentucky Commission Staff in the second quarter of 2004. LG&E filed its first Audit Progress Report with the Kentucky Commission Staff in November 2004. A second Audit Progress Report was filed May 2005. The third Audit Progress Report was filed in December 2005. In January 2006, the Kentucky Commission staff informed LG&E and KU that reporting on all of the original recommendations, but one, has been concluded. LG&E and KU are to file another Audit Progress Report on the remaining open recommendation on August 15, 2006.
82
The Kentucky Commission requires public hearings at six-month intervals to examine past fuel adjustments, and at two-year intervals to review past operations of the fuel clause and transfer of the then current fuel adjustment charge or credit to the base charges. No significant issues have been identified as a result of these reviews.
In December 2004, the Kentucky Commission initiated a two-year review of LG&E’s past operations of the fuel clause and transfer of fuel costs from the fuel adjustment clause to base rates. A public hearing on the matter was held on March 17, 2005. An order by the Kentucky Commission was issued in May 2005 approving LG&E’s base fuel component of 13.49 mills/kwh as filed. Revised tariff schedules for LG&E were filed to reflect the change in the base fuel component.
On July 7, 2005, the Kentucky Commission initiated the six-month review of the LG&E fuel adjustment clause for the period of November 2004 through April 2005. During November 2005, the Kentucky Commission approved the charges and credits billed and the fuel procurement practices of LG&E.
On December 27, 2005, the Kentucky Commission initiated the six-month review of the LG&E fuel adjustment clause for the period of May 2005 through October 2005. Initial discovery was completed on January 17, 2006, and a hearing was held on March 16, 2006. LG&E anticipates Kentucky Commission approval of the charges and credits billed and the fuel procurement practices of LG&E during the second quarter of 2006.
DSM. LG&E’s rates contain a DSM provision. The provision includes a rate mechanism that provides for concurrent recovery of DSM costs and provides an incentive for implementing DSM programs. The provision allows LG&E to recover revenues from lost sales associated with the DSM programs based on program plan engineering estimates and post-implementation evaluations.
Gas Supply Adjustments. Since November 1, 1997, LG&E has operated under an experimental PBR mechanism related to its natural gas procurement activities. LG&E’s rates are adjusted annually to recover (or refund) its portion of the savings (or expenses) incurred during each PBR year (12 months ending October 31). During the PBR year ending in 2005, LG&E achieved $10.8 million in savings. Of that total savings amount, LG&E’s portion was $2.7 million and the ratepayers’ portion was $8.1 million. Pursuant to the extension of LG&E’s natural gas supply cost PBR mechanism effective November 1, 2001, the sharing mechanism under the PBR requires savings (and expenses) to be shared 25% with shareholders and 75% with ratepayers up to 4.5% of the benchmarked natural gas costs. Savings (and expenses) in excess of 4.5% of the benchmarked natural gas costs are shared 50% with shareholders and 50% with ratepayers. LG&E filed a report and assessment with the Kentucky Commission in December 2004, seeking modification and extension of the mechanism. Following a review by the Kentucky Commission, the current natural gas supply cost PBR mechanism was extended through 2010 without further modification.
Accumulated Cost of Removal of Utility Plant. As of December 31, 2005 and 2004, LG&E has segregated the cost of removal, embedded in accumulated depreciation, of $218.9 million and $220.2 million, respectively, in accordance with FERC Order No. 631. For reporting purposes in the balance sheets, LG&E has presented this cost of removal as a regulatory liability pursuant to SFAS No. 71.
Deferred Income Taxes – Net. Deferred income taxes represent the future income tax effects of recognizing the regulatory assets and liabilities in the income statement. Deferred income taxes are recognized at currently enacted tax rates for all material temporary differences between the financial reporting and income tax bases of assets and liabilities.
83
ECR. LG&E’s retail rates contain an ECR surcharge which recovers costs incurred by LG&E that are required to comply with the Clean Air Act and other environmental regulations. In January 2003, the Kentucky Commission initiated a six-month review of LG&E’s environmental surcharge. A final order was issued in April 2003, in which LG&E was ordered to refund $2.9 million it had previously over-collected from customers. In July 2003, the Kentucky Commission initiated a two-year review of LG&E’s environmental surcharge. A final order was issued in December 2003 in which LG&E was ordered to roll $15.2 million of environmental assets into base rates and make corresponding adjustments to the monthly environmental surcharge filings to reflect that portion of environmental rate base now included in base rates going forward. Additionally, LG&E was ordered to collect $0.2 million to correct for amounts under-collected from customers. The rates of return for LG&E’s 1995 and post-1995 plans were reset to 3.32% and 10.92%, respectively.
In June 2004, the Kentucky Commission issued an order approving a settlement agreement that, among other things, revised the rate of return for LG&E’s post-1995 plan to 10.72%, with an 11% return on common equity. The order also approved the elimination of LG&E’s 1995 plan from its ECR billing mechanism, with all remaining costs associated with that plan to be included in their entirety in base rates.
In December 2004, LG&E filed an application with the Kentucky Commission to amend its compliance plan to allow recovery of costs associated with new and additional environmental compliance facilities, including the expansion of the landfill facility at the Mill Creek station. The estimated capital cost of the additional facilities for the next three years is approximately $40.0 million. LG&E requested an overall rate of return of 10.72%, including an 11% return on common equity. Hearings in these cases occurred during May 2005 and final orders were issued in June 2005, granting approval of the amendments to LG&E’s compliance plans.
Other Regulatory Matters
MISO. The MISO is a non-profit independent transmission system operator that controls approximately 97,000 miles of transmission lines over 947,000 square miles in 15 northern Midwest states and one Canadian province. The MISO operates the regional power grid and wholesale electricity market in an effort to optimize efficiency and safeguard reliability in accordance with federal energy policy.
LG&E is now involved in proceedings with the Kentucky Commission and the FERC seeking the authority to exit the MISO. A timeline of events regarding the MISO and various proceedings is as follows:
• September 1998 – The FERC granted conditional approval for the formation of the MISO. LG&E was a founding member.
• October 2001 – The FERC ordered that all bundled retail loads and grandfathered wholesale loads of each member transmission owner be included in the calculation of the MISO “cost adder,” the Schedule 10 charges designed to recover the MISO’s cost of operation, including start-up capital (debt) costs. LG&E and several owners opposed the FERC order and filed suit with the United States Court of Appeals.
• February 2002 – The MISO began commercial operations.
• February 2003 – The FERC reaffirmed its position on the Schedule 10 charges and the order was subsequently upheld by the U.S. Court of Appeals.
84
• July 2003 – The Kentucky Commission opened an investigation into LG&E’s MISO membership. Testimony was filed by LG&E that supported an exit from the MISO, under certain conditions. This proceeding remains open.
• August 2004 – The MISO filed its FERC-required TEMT. LG&E and other owners filed opposition to certain conditions of the TEMT and sought to delay the implementation. Such opposition was denied by the FERC.
• December 2004 – LG&E provided the MISO its required one-year notice of intent to exit the grid.
• April 2005 – The MISO implemented its day-ahead and real-time market (MISO Day 2), including a congestion management system.
• October 2005 – LG&E filed documents with the FERC seeking authority to exit the MISO. This proceeding remains open.
• November 2005 – LG&E requested a Kentucky Commission order authorizing the transfer of functional control of its transmission facilities from the MISO to LG&E, for the purpose of exiting the MISO. The request stated that the TVA would have control to the extent necessary to act as LG&E’s Reliability Coordinator and for the SPP to perform its function as LG&E’s Independent Transmission Organization. This proceeding remains open.
Based on various financial analyses performed internally, in response to the July 2003 Kentucky Commission investigation into MISO membership, and particularly in light of the financial impacts following MISO’s implementation of the new day-ahead and real-time markets, LG&E determined that the costs of MISO membership, both now and in the future, outweigh the benefits.
Should LG&E be allowed to exit the MISO, an aggregate exit fee of up to $41.0 million (approximately $16.0 million for LG&E and approximately $25.0 million for KU) could be imposed, depending on the timing and circumstances of the actual exit. LG&E estimates that, over time, such fee could be more than offset by savings resulting from exit from the MISO. Conversely, should LG&E be ordered to remain in the MISO, costs are expected to continue to exceed benefits, currently without mechanisms for immediate recovery.
On March 17, 2006, the FERC issued an order conditionally approving the request of LG&E and KU to exit the MISO. For further discussion, see Note 16, Subsequent Events.
Market-Based Rate Authority. Since April 2004, the FERC has initiated proceedings to modify its methods which assess generation market power and has established more stringent interim market screen tests. During 2005, in connection with LG&E’s and KU’s tri-annual market-based rate tariff renewals, although disputed by LG&E and KU, the FERC continued to contend that LG&E and KU failed such market screens in certain regions. In January 2006, in order to resolve the matter, LG&E and KU submitted proposed tariff schedules to the FERC containing a mitigation mechanism with respect to applicable power sales into an adjacent western Kentucky control area where a non-utility affiliate company is active. Prices for such sales will be capped at a relevant MISO power pool index price. Should LG&E and KU exit the MISO, they could additionally be deemed to have market power in their own joint control area, potentially requiring a similar mitigation mechanism for power sales into such region. LG&E and KU cannot predict the ultimate impact of the current or potential mitigation mechanisms on their future wholesale power revenues.
85
IRP. In April 2005, LG&E and KU filed their 2005 Joint IRP with the Kentucky Commission. The IRP provides historical and projected demand, resource and financial data, and other operating performance and system information. The AG and the KIUC were granted intervention in the IRP proceeding. The Kentucky Commission issued its staff report on February 15, 2006, with no substantive issues noted and closed the case by Order dated February 24, 2006.
Kentucky Commission Administrative Case for System Adequacy. In June 2001, Kentucky’s Governor issued Executive Order 2001-771, which directed the Kentucky Commission to review and study issues relating to the need for and development of new electric generating capacity in Kentucky. In response to that Executive Order, in July 2001 the Kentucky Commission opened Administrative Case No. 387 to review the adequacy of Kentucky’s generation capacity and transmission system. Specifically, the items reviewed were the appropriate level of reliance on purchased power, the appropriate reserve margins to meet existing and future electric demand, the impact of spikes in natural gas prices on electric utility planning strategies, and the adequacy of Kentucky’s electric transmission facilities. In December 2001, the Kentucky Commission issued an order in which it noted that LG&E is responsibly addressing the long-term supply needs of native load customers and that current reserve margins are appropriate. However, due to the rapid pace of change in the industry, the order also requires LG&E to provide an annual assessment of supply resources, future demand, reserve margin and the need for new resources.
Regarding the transmission system, the Kentucky Commission concluded that the transmission system within Kentucky can reliably serve native load and a significant portion of the proposed new unregulated power plants. However, it will not be able to handle the volume of transactions envisioned by the FERC without future upgrades, the costs of which should be borne by those for whom the upgrades are required.
The Kentucky Commission pledged to continue to monitor all relevant issues and advocate Kentucky’s interests at all opportunities.
EPAct 2005. The EPAct 2005 was enacted on August 8, 2005. Among other matters, this comprehensive legislation contains provisions mandating improved electric reliability standards and performance; providing economic and other incentives relating to transmission, pollution control and renewable generation assets; increasing funding for clean coal generation incentives; repealing PUHCA 1935; enacting PUHCA 2005 and expanding FERC jurisdiction over public utility holding companies and related matters via the FPA and PUHCA 2005.
The FERC was directed by the EPAct 2005 to adopt rules to address many areas previously regulated by the other agencies under other statutes, including PUHCA 1935. The FERC is in various stages of rulemaking on these issues and LG&E is monitoring these rulemaking activities and actively participating in these and other rulemaking proceedings. LG&E is still evaluating the potential impacts of the EPAct 2005 and the associated rulemakings and cannot predict what impact the EPAct 2005, and any such rulemakings, will have on its operations or financial position.
Kentucky Commission Strategic Blueprint. In February 2005, Kentucky’s Governor signed an executive order directing the Kentucky Commission, in conjunction with the Commerce Cabinet and the Environmental and Public Protection Cabinet, to ‘develop a Strategic Blueprint for the continued use and development of electric energy.’ This Strategic Blueprint is designed to promote future investment in electric infrastructure for the Commonwealth of Kentucky, to protect Kentucky’s low-cost electric advantage, to maintain affordable rates for all Kentuckians and to preserve Kentucky’s commitment to environmental protection. In March 2005, the Kentucky Commission established Administrative Case No. 2005-00090 to collect information from all
86
jurisdictional utilities in Kentucky, including LG&E, pertaining to Kentucky electric generation, transmission and distribution systems. LG&E responded to the Kentucky Commission’s first set of data requests at the end of March 2005 and to a second set of data requests in May 2005. The Commission held a Technical Conference on June 14, 2005, in which all parties participated in a panel discussion. A final report was provided on August 22, 2005 from the Kentucky Commission to the Governor. The Kentucky Commission issued an order and closed this proceeding on September 15, 2005. Some of the key findings from the report are:
• Kentucky’s electric utilities currently have adequate infrastructure as well as adequate planning to serve the needs of customers through 2025;
• Kentucky will need 7,000 megawatts of additional generating capacity by 2025;
• Kentucky’s electric transmission is reliable but intrastate power transfers are limited;
• Additional incentives to use renewable energy and educate the public on the benefits of renewables are needed;
• Financial incentives should be available for coal purification and other clean air technologies;
• A cautious approach should be taken toward deregulation; and
• Kentucky must be involved in federal decisions that impact its status as a low cost energy provider.
Note 4 - Financial Instruments
The cost and estimated fair values of LG&E’s non-trading financial instruments as of December 31, 2005, and 2004 follow:
| | 2005 | | 2004 | |
| | Carrying | | Fair | | Carrying | | Fair | |
(in millions) | | Value | | Value | | Value | | Value | |
Preferred stock subject to mandatory redemption | | $ | 21.3 | | $ | 21.4 | | $ | 22.5 | | $ | 22.8 | |
Long-term debt (including current portion) | | $ | 574.3 | | $ | 574.3 | | $ | 574.3 | | $ | 575.4 | |
Long-term debt from affiliate | | $ | 225.0 | | $ | 224.8 | | $ | 275.0 | | $ | 280.7 | |
Interest-rate swaps - liability | | $ | (18.6 | ) | $ | (18.6 | ) | $ | (18.5 | ) | $ | (18.5 | ) |
All of the above valuations reflect prices quoted by exchanges except for the swaps and intercompany loans. The fair values of the swaps and intercompany loans reflect price quotes from dealers or amounts calculated using accepted pricing models. The fair values of cash and cash equivalents, accounts receivable, accounts payable and notes payable are substantially the same as their carrying values.
Interest Rate Swaps. LG&E uses over-the-counter interest rate swaps to hedge exposure to market fluctuations in certain of its debt instruments. Pursuant to Company policy, use of these financial instruments is intended to mitigate risk, earnings and cash flow volatility and is not speculative in nature. Management has designated all of the interest rate swaps as hedge instruments. Financial instruments designated as cash flow hedges have resulting gains and losses recorded within other comprehensive income and stockholders’ equity. See Note 14, Accumulated Other Comprehensive Income. Financial instruments designated as fair value hedges and the underlying hedged items are periodically marked to market with the resulting net gains and losses recorded directly into net income. Upon termination of any fair value hedge, the resulting gain or loss is recorded into net income.
87
LG&E was party to various interest rate swap agreements with aggregate notional amounts of $211.3 million and $228.3 million as of December 31, 2005 and 2004. Under these swap agreements, LG&E paid fixed rates averaging 4.38% and received variable rates based on LIBOR or the Bond Market Association’s municipal swap index averaging 3.15% and 1.74% at December 31, 2005 and 2004, respectively. The swap agreements in effect at December 31, 2005 have been designated as cash flow hedges and mature on dates ranging from 2020 to 2033. The cash flow designation was assigned because the underlying variable rate debt has variable future cash flows. The hedges have been deemed to be fully effective resulting in a pretax loss of $0.1 million for 2005 and $2.3 million in 2004, recorded in other comprehensive income. Upon expiration of these hedges, the amount recorded in other comprehensive income will be reclassified into earnings. The amount expected to be reclassified from other comprehensive income to earnings in the next twelve months is less than $0.1 million. A deposit in the amount of $9.8 million, used as collateral for one of the interest rate swaps, is classified as restricted cash on LG&E’s Balance Sheet. The amount of the deposit required is tied to the market value of the swap.
Energy Risk Management Activities. LG&E conducts energy trading and risk management activities to maximize the value of power sales from physical assets it owns. Certain energy trading activities are accounted for on a mark-to-market basis in accordance with SFAS No. 133, as amended. Wholesale sales of excess asset capacity are treated as normal sales under SFAS No. 133, as amended and are not marked to market.
No changes to valuation techniques for energy trading and risk management activities occurred during 2005 and 2004. Changes in market pricing, interest rate and volatility assumptions were made during both years. All contracts outstanding at December 31, 2005, have a maturity of less than one year and are valued using prices actively quoted for proposed or executed transactions or quoted by brokers.
LG&E maintains policies intended to minimize credit risk and revalues credit exposures daily to monitor compliance with those policies. At December 31, 2005, 100% of the trading and risk management commitments were with counterparties rated BBB-/Baa3 equivalent or better.
LG&E hedges the price volatility of its forecasted electric off-system sales with the sales of market-traded electric forward contracts for periods of less than one year. These electric forward sales have been designated as cash flow hedges and are not speculative in nature. Gains or losses on these instruments, to the extent that the hedging relationship has been effective, are deferred in other comprehensive income. Gains and losses resulting from ineffectiveness are shown in LG&E’s Statements of Income in other (income) expense – net. Upon completion of the underlying hedge transaction, the amount recorded in other comprehensive income is recorded in earnings. No material pre-tax gains and losses resulted from these cash flow hedges in 2005, 2004 and 2003. See Note 14, Accumulated Other Comprehensive Income.
Accounts Receivable Securitization. LG&E terminated its accounts receivable securitization program in January 2004, and in May 2004, LG&E dissolved its inactive accounts receivable securitization-related subsidiary, LG&E R. No material pre-tax gains and losses resulted from the sale of the receivables in 2004 and 2003. LG&E’s net cash flows from LG&E R were reduced by $58.1 million and $6.2 million for 2004 and 2003, respectively. The allowance for doubtful accounts associated with the eligible securitized receivables at December 31, 2003, was $1.4 million. This allowance was based on historical experience of LG&E. Each securitization facility contained a fully funded reserve for uncollectible receivables. LG&E was able to terminate this program at any time without penalty.
88
Note 5 - Concentrations of Credit and Other Risk
Credit risk represents the accounting loss that would be recognized at the reporting date if counterparties failed to perform as contracted. Concentrations of credit risk (whether on- or off-balance sheet) relate to groups of customers or counterparties that have similar economic or industry characteristics that would cause their ability to meet contractual obligations to be similarly affected by changes in economic or other conditions.
LG&E’s customer receivables and gas and electric revenues arise from deliveries of natural gas to approximately 321,000 customers and electricity to approximately 394,000 customers in Louisville and adjacent areas in Kentucky. For the year ended December 31, 2005, 69% of total revenue was derived from electric operations and 31% from natural gas operations. For the year ended December 31, 2004, 70% of total revenue was derived from electric operations and 30% from natural gas operations.
In November 2005, LG&E and IBEW Local 2100 employees, that represent approximately 69% of LG&E’s workforce, entered into a three-year collective bargaining agreement with annual benefits re-openers.
Note 6 - Pension and Other Post Retirement Benefit Plans
LG&E has both funded and unfunded non-contributory defined benefit pension plans and other post-retirement benefit plans that together cover substantially all of its employees. The healthcare plans are contributory with participants’ contributions adjusted annually. LG&E uses December 31 as the measurement date for its plans.
Obligations and Funded Status. The following tables provide a reconciliation of the changes in the plan’s benefit obligations and fair value of assets over the three-year period ending December 31, 2005, and a statement of the funded status as of December 31, 2005, 2004 and 2003 for LG&E’s sponsored defined benefit plan:
(in millions) | | 2005 | | 2004 | | 2003 | |
Pension Plans: | | | | | | | |
Change in projected benefit obligation | | | | | | | |
Projected benefit obligation at beginning of year | | $ | 402.4 | | $ | 378.7 | | $ | 364.8 | |
Service cost | | 3.7 | | 2.8 | | 1.7 | |
Interest cost | | 22.3 | | 22.7 | | 23.2 | |
Plan amendments | | 3.2 | | 3.3 | | 4.0 | |
Change due to transfers | | 0.3 | | (1.1 | ) | (2.8 | ) |
Benefits paid | | (29.9 | ) | (30.5 | ) | (33.5 | ) |
Actuarial (gain) or loss and other | | 24.7 | | 26.5 | | 21.3 | |
Projected benefit obligation at end of year | | $ | 426.7 | | $ | 402.4 | | $ | 378.7 | |
| | | | | | | |
Change in plan assets | | | | | | | |
Fair value of plan assets at beginning of year | | $ | 338.2 | | $ | 297.8 | | $ | 196.3 | |
Actual return on plan assets | | 26.6 | | 39.3 | | 47.2 | |
Employer contributions | | — | | 34.5 | | 89.1 | |
Change due to transfers | | — | | (1.1 | ) | 0.2 | |
Benefits paid | | (29.9 | ) | (30.5 | ) | (33.5 | ) |
Administrative expenses | | (1.8 | ) | (1.8 | ) | (1.5 | ) |
Fair value of plan assets at end of year | | $ | 333.1 | | $ | 338.2 | | $ | 297.8 | |
| | | | | | | |
Reconciliation of funded status | | | | | | | |
Funded status | | $ | (93.6 | ) | $ | (64.2 | ) | $ | (80.9 | ) |
Unrecognized actuarial (gain) or loss | | 94.7 | | 70.3 | | 56.2 | |
Unrecognized transition (asset) or obligation | | (0.7 | ) | (1.5 | ) | (2.2 | ) |
Unrecognized prior service cost | | 30.4 | | 31.5 | | 32.3 | |
Net amount recognized at end of year | | $ | 30.8 | | $ | 36.1 | | $ | 5.4 | |
89
Other Benefits: | | | | | | | |
Change in benefit obligation | | | | | | | |
Benefit obligation at beginning of year | | $ | 113.0 | | $ | 108.0 | | $ | 93.2 | |
Service cost | | 1.0 | | 0.9 | | 0.6 | |
Interest cost | | 5.6 | | 6.5 | | 6.9 | |
Plan amendments | | 2.2 | | 0.4 | | 7.4 | |
Benefits paid | | (8.1 | ) | (7.1 | ) | (9.3 | ) |
Actuarial (gain) or loss | | (7.5 | ) | 4.3 | | 9.2 | |
Benefit obligation at end of year | | $ | 106.2 | | $ | 113.0 | | $ | 108.0 | |
| | | | | | | |
Change in plan assets | | | | | | | |
Fair value of plan assets at beginning of year | | $ | 0.8 | | $ | 0.7 | | $ | 1.5 | |
Actual return on plan assets | | 0.2 | | (2.0 | ) | 2.1 | |
Employer contributions | | 9.8 | | 9.3 | | 6.4 | |
Change due to transfers | | — | | (0.1 | ) | — | |
Benefits paid | | (8.1 | ) | (7.1 | ) | (9.3 | ) |
Fair value of plan assets at end of year | | $ | 2.7 | | $ | 0.8 | | $ | 0.7 | |
| | | | | | | |
Reconciliation of funded status | | | | | | | |
Funded status | | $ | (103.5 | ) | $ | (112.2 | ) | $ | (107.3 | ) |
Unrecognized actuarial (gain) or loss | | 21.5 | | 29.4 | | 23.7 | |
Unrecognized transition (asset) or obligation | | 4.7 | | 5.4 | | 6.0 | |
Unrecognized prior service cost | | 10.4 | | 10.0 | | 11.5 | |
Net amount recognized at end of year | | $ | (66.9 | ) | $ | (67.4 | ) | $ | (66.1 | ) |
Amounts Recognized in Statement of Financial Position. The following tables provide the amounts recognized in the balance sheet and information for plans with benefit obligations in excess of plan assets as of December 31, 2005, 2004 and 2003:
(in millions) | | 2005 | | 2004 | | 2003 | |
Pension Plans: | | | | | | | |
Amounts recognized in the balance sheet consisted of: | | | | | | | |
Accrued benefit liability | | $ | (76.6 | ) | $ | (53.2 | ) | $ | (74.5 | ) |
Intangible asset | | 30.4 | | 31.5 | | 32.3 | |
Accumulated other comprehensive income | | 77.0 | | 57.8 | | 47.6 | |
Net amount recognized at year-end | | $ | 30.8 | | $ | 36.1 | | $ | 5.4 | |
| | | | | | | | | | |
Increase (decrease) in minimum liability included in other comprehensive income | | $ | 19.2 | | $ | 10.2 | | $ | (3.1 | ) |
| | | | | | | |
Additional year-end information for plans with accumulated benefit obligations in excess of plan assets: | | | | | | | |
Projected benefit obligation | | $ | 426.7 | | $ | 402.4 | | $ | 378.7 | |
Accumulated benefit obligation | | 409.7 | | 391.4 | | 372.3 | |
Fair value of plan assets | | 333.1 | | 338.2 | | 297.8 | |
| | | | | | | |
Other Benefits: | | | | | | | |
Amounts recognized in the balance sheet consisted of: | | | | | | | |
Accrued benefit liability | | $ | (66.9 | ) | $ | (67.4 | ) | $ | (66.1 | ) |
| | | | | | | |
Additional year-end information for plans with benefit obligations in excess of plan assets: | | | | | | | |
Benefit obligation | | $ | 106.2 | | $ | 113.0 | | $ | 108.0 | |
Fair value of plan assets | | 2.7 | | 0.8 | | 0.7 | |
Components of Net Periodic Benefit Cost. The following table provides the components of net periodic
90
benefit cost for the plans for 2005, 2004 and 2003:
(in millions) | | 2005 | | 2004 | | 2003 | |
Pension Plans: | | | | | | | |
Components of net periodic benefit cost | | | | | | | |
Service cost | | $ | 3.7 | | $ | 2.8 | | $ | 1.8 | |
Interest cost | | 22.3 | | 22.7 | | 23.2 | |
Expected return on plan assets | | (26.5 | ) | (27.0 | ) | (22.8 | ) |
Amortization of prior service cost | | 4.3 | | 4.1 | | 3.8 | |
Amortization of transition (asset) or obligation | | (0.7 | ) | (0.7 | ) | (1.0 | ) |
Amortization of actuarial (gain) or loss | | 2.3 | | 1.9 | | 2.2 | |
Net periodic benefit cost | | $ | 5.4 | | $ | 3.8 | | $ | 7.2 | |
| | | | | | | |
Other Benefits: | | | | | | | |
Components of net periodic benefit cost | | | | | | | |
Service cost | | $ | 1.0 | | $ | 0.9 | | $ | 0.6 | |
Interest cost | | 5.6 | | 6.5 | | 6.9 | |
Expected return on plan assets | | — | | — | | (0.1 | ) |
Amortization of prior service cost | | 1.8 | | 1.8 | | 1.8 | |
Amortization of transition (asset) or obligation | | 0.7 | | 0.7 | | 0.7 | |
Amortization of actuarial (gain) or loss | | 0.3 | | 0.7 | | 0.5 | |
Net periodic benefit cost | | $ | 9.4 | | $ | 10.6 | | $ | 10.4 | |
The assumptions used in the measurement of LG&E’s pension benefit obligation are shown in the following table:
| | 2005 | | 2004 | | 2003 | |
| | | | | | | |
Weighted-average assumptions as of December 31: | | | | | | | |
Discount rate | | 5.50 | % | 5.75 | % | 6.25 | % |
Rate of compensation increase | | 5.25 | % | 4.50 | % | 3.00 | % |
The assumptions used in the measurement of LG&E’s net periodic benefit cost are shown in the following table:
| | 2005 | | 2004 | | 2003 | |
| | | | | | | |
Discount rate | | 5.75 | % | 6.25 | % | 6.75 | % |
Expected long-term return on plan assets | | 8.25 | % | 8.50 | % | 9.00 | % |
Rate of compensation increase | | 4.50 | % | 3.50 | % | 3.75 | % |
To develop the expected long-term rate of return on assets assumption, LG&E considered the current level of expected returns on risk free investments (primarily government bonds), the historical level of the risk premium associated with the other asset classes in which the portfolio is invested and the expectations for future returns of each asset class. The expected return for each asset class was then weighted based on the target asset allocation to develop the expected long-term rate of return on assets assumption for the portfolio.
Assumed Healthcare Cost Trend Rates. For measurement purposes, an 11.0% annual increase in the per capita cost of covered healthcare benefits was assumed for 2005. The rate was assumed to decrease gradually to 5.0% by 2015 and remain at that level thereafter.
Assumed healthcare cost trend rates have a significant effect on the amounts reported for the healthcare plans. A 1% change in assumed healthcare cost trend rates would have the following effects:
91
(in millions) | | 1% Decrease | | 1% Increase | |
Effect on total of service and interest cost components for 2005 | | $ | (0.2 | ) | $ | 0.3 | |
Effect on year-end 2005 postretirement benefit obligations | | $ | (2.8 | ) | $ | 3.1 | |
Expected Future Benefit Payments. The following list provides the amount of expected future benefit payments, which reflect expected future service, as appropriate:
| | Pension | | Other | |
(in millions) | | Plans | | Benefits | |
2006 | | $ | 29.0 | | $ | 7.7 | |
2007 | | $ | 28.3 | | $ | 8.0 | |
2008 | | $ | 27.6 | | $ | 8.1 | |
2009 | | $ | 26.7 | | $ | 8.3 | |
2010 | | $ | 25.9 | | $ | 8.4 | |
2011-2015 | | $ | 123.4 | | $ | 42.7 | |
Plan Assets. The following table shows LG&E’s weighted-average asset allocation by asset category at December 31:
| | Target Range | | 2005 | | 2004 | | 2003 | |
Pension Plans: | | | | | | | | | |
Equity securities | | 45% - 75 | % | 57 | % | 66 | % | 66 | % |
Debt securities | | 30% - 50 | % | 42 | % | 33 | % | 33 | % |
Other | | 0% - 10 | % | 1 | % | 1 | % | 1 | % |
Totals | | | | 100 | % | 100 | % | 100 | % |
| | | | | | | | | |
Other Benefits: | | | | | | | | | |
Equity securities | | — | % | — | % | — | % | — | % |
Debt securities | | 100 | % | 100 | % | 100 | % | 100 | % |
| | 100 | % | 100 | % | 100 | % | 100 | % |
The investment policy of the pension plans was developed in conjunction with financial consultants, investment advisors and legal counsel. The goal of the investment policy is to preserve the capital of the fund and maximize investment earnings. The return objective is to exceed the benchmark return for the policy index comprised of the following: Russell 3000 Index, MSCI-EAFE Index, Lehman Aggregate, and Lehman Long Duration Gov/Corporate Bond Index in proportions equal to the targeted asset allocation.
Evaluation of performance focuses on a long-term investment time horizon of at least three to five years or a complete market cycle. The assets of the pension plans are broadly diversified within different asset classes (equities, fixed income securities and cash equivalents).
To minimize the risk of large losses in a single asset class, no more than 5% of the portfolio will be invested in the securities of any one issuer with the exclusion of the U.S. government and its agencies. The equity portion of the fund is diversified among the market’s various subsections to diversify risk, maximize returns and avoid undue exposure to any single economic sector, industry group or individual security. The equity subsectors include, but are not limited to, growth, value, small capitalization and international.
In addition, the overall fixed income portfolio holdings may have an average weighted duration, or interest rate sensitivity which is within +/- 20% of the duration of the overall fixed income benchmark. Foreign bonds in the aggregate shall not exceed 10% of the total fund. The portfolio may include a limited investment of up to 20% in below investment grade securities provided that the overall average portfolio quality remains “AA” or better. The below investment grade securities include, but are not limited to, medium-term notes, corporate debt, non-dollar and emerging market debt and asset backed securities. The cash investments should be in securities that
92
either are of short maturities (not to exceed 180 days) or readily marketable with modest risk.
Derivative securities are permitted only to improve the portfolio’s risk/return profile, modify the portfolio’s duration or to reduce transaction costs and must be used in conjunction with underlying physical assets in the portfolio. Derivative securities that involve speculation, leverage, interest rate anticipation, or any undue risk whatsoever are not deemed appropriate investments.
The investment objective for the post retirement benefit plan is to provide current income consistent with stability of principal and liquidity while maintaining a stable net asset value of $1.00 per share. The post retirement funds are invested in a prime cash money market fund that invests primarily in a portfolio of short-term, high-quality fixed income securities issued by banks, corporations and the U.S. government.
Contributions. LG&E made discretionary contributions to the pension plan of $89.1 million during 2003 and $34.5 million in January 2004. LG&E made a discretionary contribution to the pension plan for $17.5 million in January 2006. There were no contributions during 2005.
FSP 106-2. FSP 106-2, which provided guidance on accounting for subsidies provided under the Medicare Act, was effective for the first interim or annual period beginning after June 15, 2004. The following table reflects the impact of the subsidy in 2004:
(in millions) | | | |
Reduction in APBO | | $ | 3.2 | |
| |
Effect of the subsidy on the measurement of the net periodic postretirement benefit cost: | |
| |
Amortization of the actuarial experience gain/(loss) | | $ | 0.2 | |
Reduction in service cost due to the subsidy | | — | |
Resulting reduction in interest cost on the APBO | | 0.2 | |
Total | | $ | 0.4 | |
Thrift Savings Plans. LG&E has a thrift savings plan under section 401(k) of the Internal Revenue Code. Under the plan, eligible employees may defer and contribute to the plan a portion of current compensation in order to provide future retirement benefits. LG&E makes contributions to the plan by matching a portion of the employee contributions. The costs of this matching were approximately $1.3 million for 2005, $1.4 million for 2004 and $1.8 million for 2003.
Note 7 - Income Taxes
Components of income tax expense are shown in the table below:
(in millions) | | 2005 | | 2004 | | 2003 | |
| | | | | | | |
Current - federal | | $ | 73.2 | | $ | 33.9 | | $ | 25.8 | |
- state | | 10.1 | | 13.0 | | 10.0 | |
Deferred - federal – net | | (12.6 | ) | 11.4 | | 16.8 | |
- state – net | | (1.7 | ) | (0.8 | ) | 1.7 | |
Amortization of investment tax credit | | (4.1 | ) | (4.2 | ) | (4.2 | ) |
Total income tax expense | | $ | 64.9 | | $ | 53.3 | | $ | 50.1 | |
Deferred federal income tax expense during 2003 and 2004 included significant deductions attributable to federal bonus depreciation that ended after December 2004.
93
Components of net deferred tax liabilities included in the balance sheet are shown below:
(in millions) | | 2005 | | 2004 | |
Deferred tax liabilities: | | | | | |
Depreciation and other plant-related items | | $ | 390.9 | | $ | 397.8 | |
Regulatory assets and other | | 22.5 | | 33.3 | |
Total deferred tax liabilities | | 413.4 | | 431.1 | |
| | | | | |
Deferred tax assets: | | | | | |
Investment tax credit | | 16.6 | | 18.6 | |
Income taxes due to customers | | 16.5 | | 15.0 | |
Pensions and related benefits | | 39.2 | | 32.2 | |
Liabilities and other | | 19.4 | | 18.1 | |
Total deferred tax assets | | 91.7 | | 83.9 | |
| | | | | |
Net deferred income tax liability | | $ | 321.7 | | $ | 347.2 | |
A reconciliation of differences between the statutory U.S. federal income tax rate and LG&E’s effective income tax rate follows:
| | 2005 | | 2004 | | 2003 | |
Statutory federal income tax rate | | 35.0 | % | 35.0 | % | 35.0 | % |
State income taxes, net of federal benefit | | 4.1 | | 5.3 | | 5.4 | |
Reduction of income tax accruals | | (1.9 | ) | (0.7 | ) | (0.4 | ) |
Investment and other credits | | (2.1 | ) | (3.6 | ) | (3.0 | ) |
Other differences | | (1.6 | ) | (0.2 | ) | (1.5 | ) |
Effective income tax rate | | 33.5 | % | 35.8 | % | 35.5 | % |
On September 19, 2005, LG&E received notice from the Congressional Joint Committee on Taxation approving the Internal Revenue Service’s audit of LG&E’s income tax returns for the periods December 1999 through December 2003. As a result of resolving numerous tax matters during these periods, LG&E reduced income tax accruals by $3.8 million during 2005.
Kentucky House Bill 272, also known as “Kentucky’s Tax Modernization Plan”, was signed into law in March 2005. This bill contains a number of changes in Kentucky’s tax system, including the reduction of the Corporate income tax rate from 8.25% to 7% effective January 1, 2005, and a further reduction to 6% effective January 1, 2007. As a result of the income tax rate change, LG&E’s deferred tax reserve amount will exceed its actual deferred tax liability attributable to existing temporary differences since the new statutory rates are lower than the rates were when the deferred tax liability originated. This excess amount is referred to as excess deferred income taxes. In June 2005, LG&E received approval from the Kentucky Commission to establish and amortize a regulatory liability ($16.3 million) for its net excess deferred income tax balances. Under the accounting treatment, LG&E will amortize its depreciation-related excess deferred income tax balances under the average rate assumption method. The average rate assumption method matches the amortization of the excess deferred income taxes with the life of the timing differences to which they relate. Excess deferred income tax balances related to non-depreciation timing differences will be expensed in the current year due to their immaterial amount.
LG&E expects to have adequate levels of taxable income to realize its recorded deferred taxes.
94
Note 8 - Long-Term Debt
As of December 31, 2005, long-term debt and the current portion of long-term debt consist primarily of pollution control bonds and long-term loans from affiliated companies as summarized below.
(in millions) | | Stated
Interest Rates | | Maturities | | Principal
Amounts | |
Outstanding at December 31, 2005: | | | | | | | |
Noncurrent portion | | Variable - 5.90% | | 2008-2035 | | $ | 573.1 | |
Current portion | | Variable | | 2006-2027 | | 247.5 | |
| | | | | | | |
Outstanding at December 31, 2004: | | | | | | | |
Noncurrent portion | | Variable - 5.90% | | 2008-2033 | | $ | 574.4 | |
Current portion | | Variable | | 2005-2027 | | 297.4 | |
Under the provisions for LG&E’s variable-rate pollution control bonds, Series S, T, U, BB, CC, DD and EE, the bonds are subject to tender for purchase at the option of the holder and to mandatory tender for purchase upon the occurrence of certain events, causing the bonds to be classified as current portion of long-term debt in the balance sheets. The average annualized interest rate for these bonds during 2005 and 2004 was 2.50% and 1.29%, respectively.
Pollution control series bonds are first mortgage bonds that have been issued by LG&E in connection with tax-exempt pollution control revenue bonds issued by various governmental entities, principally counties in Kentucky. A loan agreement obligates LG&E to make debt service payments to the county that equate to the debt service due from the county on the related pollution control revenue bonds. The county’s debt is also secured by an equal amount of LG&E’s first mortgage bonds (the pollution control series bonds) that are pledged to the trustee for the pollution control revenue bonds, and that match the terms and conditions of the county’s debt, but require no payment of principal and interest unless LG&E defaults on the loan agreement.
Substantially all of LG&E’s utility assets are pledged as security for its first mortgage bonds. LG&E’s first mortgage bond indenture, as supplemented, provides that portions of retained earnings will not be available for the payment of dividends on common stock, under certain specified conditions. No portion of retained earnings was restricted by this provision as of either December 31, 2005 or 2004.
Interest rate swaps are used to hedge LG&E’s underlying variable-rate debt obligations. These swaps hedge specific debt issuances and, consistent with management’s designation, are accorded hedge accounting treatment. The swaps exchange floating-rate interest payments for fixed rate interest payments to reduce the impact of interest rate changes on LG&E’s pollution control bonds. As of December 31, 2005 and 2004, LG&E had swaps with a combined notional value of $211.3 million and $228.3 million, respectively. See Note 4, Financial Instruments.
Redemptions and maturities of long-term debt for 2005, 2004 and 2003 are summarized below:
($ in millions) | | | | | | | | | | | |
| | | | | | | | | | | |
| | | | Principal | | | | Secured/ | | | |
Year | | Description | | Amount | | Rate | | Unsecured | | Maturity | |
2005 | | Pollution control bonds | | $ | 40.0 | | 5.90 | % | Secured | | Apr 2023 | |
2005 | | Due to Fidelia | | $ | 50.0 | | 1.53 | % | Secured | | Jan 2005 | |
2005 | | Mandatorily Redeemable Preferred Stock | | $ | 1.3 | | 5.875 | % | Unsecured | | Jul 2005 | |
2004 | | Due to Fidelia | | $ | 50.0 | | 1.53 | % | Secured | | Jan 2005 | |
2004 | | Mandatorily Redeemable Preferred Stock | | $ | 1.3 | | 5.875 | % | Unsecured | | Jul 2004 | |
2003 | | Pollution control bonds | | $ | 102.0 | | 5.625 | % | Secured | | Aug 2019 | |
2003 | | Pollution control bonds | | $ | 26.0 | | 5.45 | % | Secured | | Oct 2020 | |
2003 | | First mortgage bonds | | $ | 42.6 | | 6.00 | % | Secured | | Aug 2003 | |
2003 | | Mandatorily Redeemable Preferred Stock | | $ | 1.3 | | 5.875 | % | Unsecured | | Jul 2003 | |
95
Issuances of long-term debt for 2005, 2004 and 2003 are summarized below:
($ in millions) | | | | | | | | | |
| | | | | | | | | | | |
| | | | Principal | | | | Secured/ | | | |
Year | | Description | | Amount | | Rate | | Unsecured | | Maturity | |
2005 | | Pollution control bonds | | $ | 40.0 | | Variable | | Secured | | Feb 2035 | |
2004 | | Due to Fidelia | | $ | 25.0 | | 4.33 | % | Secured | | Jan 2012 | |
2004 | | Due to Fidelia | | $ | 100.0 | | 1.53 | % | Secured | | Jan 2005 | |
2003 | | Pollution control bonds | | $ | 128.0 | | Variable | | Secured | | Oct 2033 | |
2003 | | Due to Fidelia | | $ | 100.0 | | 4.55 | % | Unsecured | | Apr 2013 | |
2003 | | Due to Fidelia | | $ | 100.0 | | 5.31 | % | Secured | | Aug 2013 | |
LG&E has existing $5.875 series mandatorily redeemable preferred stock outstanding having a current redemption price of $100 per share. The preferred stock has a sinking fund requirement sufficient to retire a minimum of 12,500 shares on July 15 of each year commencing with July 15, 2003, and the remaining 187,500 shares on July 15, 2008 at $100 per share. LG&E redeemed 12,500 shares in accordance with these provisions on July 15, 2005, 2004 and 2003, leaving 212,500 shares currently outstanding. Beginning with the three months ended September 30, 2003, LG&E reclassified its $5.875 series preferred stock as long-term debt with the minimum shares mandatorily redeemable within one year classified as current.
Long-term debt maturities for LG&E are shown in the following table:
(in millions) | | | |
2006 | | $ | 1.3 | |
2007 | | | 1.3 | |
2008 | | | 18.7 | |
2009 | | | — | |
2010 | | | — | |
Thereafter | | | 799.3 | (a) |
Total | | $ | 820.6 | |
(a) Includes long-term debt of $246.2 million classified as current liabilities because these bonds are subject to tender for purchase at the option of the holder and to mandatory tender for purchase upon the occurrence of certain events. Maturity dates for these bonds range from 2013 to 2027. LG&E does not expect to pay these amounts in 2006.
Note 9 - Notes Payable and Other Short-Term Obligations
LG&E participates in an intercompany money pool agreement wherein E.ON U.S. and/or KU make funds available to LG&E at market-based rates (based on an index of highly rated commercial paper issues) up to $400.0 million.
| | Total Money | | Amount | | Balance | | Average | |
($ in millions) | | Pool Available | | Outstanding | | Available | | Interest Rate | |
December 31, 2005 | | $ | 400.0 | | $ | 141.2 | | $ | 258.8 | | 4.21 | % |
December 31, 2004 | | $ | 400.0 | | $ | 58.2 | | $ | 341.8 | | 2.22 | % |
E.ON U.S. maintains a revolving credit facility totaling $200.0 million with an affiliated company, E.ON North America, Inc., to ensure funding availability for the money pool. The balance outstanding on this facility at December 31, 2005, was $104.7 million, leaving $95.3 million available. At December 31, 2004, the facility totaled $150.0 million with a balance of $65.4 million outstanding, leaving $84.6 million available.
During June 2005, LG&E renewed five revolving lines of credit with banks totaling $185.0 million. These credit facilities expire in June 2006, and there was no outstanding balance under any of these facilities at December 31, 2005.
The covenants under these revolving lines of credit include:
96
• The debt/total capitalization ratio must be less than 70%;
• E.ON AG must own at least 66.667% of voting stock of LG&E directly or indirectly;
• The corporate credit rating of the company must be at or above BBB- and Baa3; and
• A limitation on disposing of assets aggregating more than 15% of total assets as of December 31, 2004.
Note 10 - Commitments and Contingencies
Operating Leases. LG&E leases office space, office equipment and vehicles and accounts for these leases as operating leases. Total lease expense for 2005, 2004 and 2003, less amounts contributed by affiliated companies occupying a portion of the office space leased by LG&E, was $3.0 million, $2.8 million and $2.2 million, respectively. The future minimum annual lease payments under LG&E’s office space lease agreement for years subsequent to December 31, 2005, are shown in the following table:
(in millions) | | | |
2006 | | $ | 3.5 | |
2007 | | | 3.6 | |
2008 | | | 3.7 | |
2009 | | | 3.8 | |
2010 | | | 3.8 | |
Thereafter | | | 18.5 | |
Total | | $ | 36.9 | |
Sale and Leaseback Transaction. LG&E is a participant in a sale and leaseback transaction involving its 38% interest in two jointly-owned CTs at KU’s E.W. Brown generating station (Units 6 and 7). Commencing in December 1999, LG&E and KU entered into a tax-efficient, 18-year lease of the CTs. LG&E and KU have provided funds to fully defease the lease, and have executed an irrevocable notice to exercise an early purchase option contained in the lease after 15.5 years. The financial statement treatment of this transaction is no different than if LG&E had retained its ownership. The leasing transaction was entered into following receipt of required state and federal regulatory approvals.
In case of default under the lease, LG&E is obligated to pay to the lessor its share of
97
certain fees or amounts. Primary events of default include loss or destruction of the CTs, failure to insure or maintain the CTs and unwinding of the transaction due to governmental actions. No events of default currently exist with respect to the lease. Upon any termination of the lease, whether by default or expiration of its term, title to the CTs reverts jointly to LG&E and KU.
At December 31, 2005, the maximum aggregate amount of default fees or amounts, which decrease over the term of the lease, was $8.2 million, of which LG&E would be responsible for $3.1 million (38%). LG&E has made arrangements with E.ON U.S., via guarantee and regulatory commitment, for E.ON U.S. to pay LG&E’s full portion of any default fees or amounts.
Letters of Credit. LG&E has provided letters of credit totaling $3.0 million to support certain obligations related to landfill reclamation.
Purchased Power. LG&E has a contract for purchased power with OVEC for various Mw capacities. LG&E has an investment of 5.63% ownership in OVEC’s common stock, which is accounted for on the cost method of accounting. In March 2005, LG&E purchased from AEP an additional 0.73% interest in OVEC for a purchase price of approximately $0.1 million, which resulted in the increase in LG&E ownership in OVEC from 4.9% to 5.63%. Through March 2006, LG&E is entitled to purchase 7% of OVEC’s output, and thereafter is entitled to purchase 5.63%, representing approximately 124 Mw of generation capacity. In April 2004, OVEC and its shareholders, including LG&E, entered into an Amended and Restated Inter-Company Power Agreement, to be effective beginning March 2006, upon the expiration of the current power contract among the parties. The parties received SEC approval under PUHCA 1935 of the Amended and Restated Inter-Company Power Agreement in February 2005. Future obligations for power purchases are shown in the following table:
(in millions) | | | |
2006 | | $ | 11.1 | |
2007 | | | 10.9 | |
2008 | | | 11.0 | |
2009 | | | 11.3 | |
2010 | | | 11.5 | |
Thereafter | | | 215.1 | |
Total | | $ | 270.9 | (a) |
(a) Represents future minimum payments under OVEC purchased power agreements through 2024.
Construction Program. LG&E had approximately $23.0 million of commitments in connection with its construction program at December 31, 2005. Construction expenditures for the three year period ending December 31, 2008, are estimated to total approximately $530.0 million, although all of this amount is not currently committed, including future expenditures related to the construction of Trimble County Unit 2.
Environmental Matters. LG&E is subject to SO2 and NOx emission limits on its electric generating units pursuant to the Clean Air Act. LG&E was exempt from Phase I SO2 requirements due to its low emission rates. LG&E opted into the Phase I NOx program to take advantage of the less stringent requirements and installed burner modifications as needed to meet these limitations. LG&E’s strategy for Phase II SO2 reductions, which commenced January 1, 2000, is to increase FGD removal efficiency to delay additional capital expenditures and may also include fuel switching or upgrading FGDs. LG&E met the initial NOx emission requirements of the Act through installation of low-NOx burner systems. LG&E’s compliance plans are subject to many factors including developments in the emission allowance and fuel markets, future regulatory and legislative initiatives, and advances in clean air control technology. LG&E will continue to monitor these developments to ensure that its environmental obligations are met in the most efficient and cost-effective manner.
In September 1998, the EPA announced its final “NOx SIP Call” rule requiring states to impose significant additional reductions in NOx emissions by May 2003, in order to mitigate alleged ozone transport impacts on the Northeast region. The Commonwealth of Kentucky SIP, which was approved by the EPA on June 24, 2003, requires reductions in NOx emissions from coal-fired generating units to the 0.15 lb./MMBtu level on a system-wide basis. In related proceedings in response to petitions filed by various Northeast states, in December 1999, the EPA issued a final rule pursuant to Section 126 of the Clean Air Act directing similar NOx reductions from a number of specifically targeted generating units including all LG&E units. As a result of appeals to both rules, the compliance date was extended to May 31, 2004. All LG&E generating units are in compliance with these NOx emissions reduction rules.
98
LG&E has added significant NOx controls to its generating units through the installation of SCR systems, advanced low-NOx burners and neural networks. The NOx control project commenced in late 2000 with the controls being placed into operation prior to the 2004 summer ozone season. As of December 31, 2005, LG&E incurred total capital costs of approximately $188.0 million to reduce its NOx emissions below the 0.15 lb./MMBtu level on a company-wide basis. In addition, LG&E will incur additional operating and maintenance costs in operating new NOx controls. LG&E believes its costs in this regard to be comparable to those of similarly situated utilities with like generation assets. LG&E anticipated that such capital and operating costs are the type of costs that are eligible for recovery from customers under its environmental surcharge mechanism and believed that a significant portion of such costs could be recovered. In April 2001, the Kentucky Commission granted recovery of these costs for LG&E.
On March 10, 2005, the EPA issued the final CAIR which requires substantial additional reductions in SO2 and NOx emissions from electric generating units. The CAIR provides for a two-phased reduction program with Phase I reductions in NOx and SO2 emissions in 2009 and 2010, respectively, and Phase II reductions in 2015. On March 15, 2005, the EPA issued a related regulation, the final CAMR, which requires substantial mercury reductions from electric generating units. CAMR also provides for a two-phased reduction, with the Phase I target in 2010 achieved as a “co-benefit” of the controls installed to meet CAIR. Additional control measures will be required to meet the Phase II target in 2018. Both CAIR and CAMR establish a cap and trade framework, in which a limit is set on total emissions and allowances can be bought or sold on the open market to be used for compliance, unless the state chooses another approach. LG&E currently has FGDs on all its units but will continue to evaluate improvements to further reduce SO2 emissions.
LG&E is also monitoring several other air quality issues which may potentially impact coal-fired power plants, including EPA’s revised air quality standards for ozone and particulate matter and measures to implement the EPA’s CAVR. From time to time, LG&E has conducted negotiations with the relevant regulatory authorities to address various environmental matters, including remedial measures aimed at controlling particulate matter emissions from its Mill Creek plant. LG&E previously settled a number of property damage claims from residents adjacent to the plant and completed significant remedial measures as part of its ongoing capital construction program. LG&E has converted the Mill Creek Station to wet stack operation in an effort to resolve all outstanding issues related to particulate matter emissions. In addition, LG&E has periodically conducted negotiations with the relevant regulatory authorities to resolve potential liability for cleanup of off-site facilities that allegedly handled materials associated with company operations.
LG&E owns or formerly owned three properties which are the location of past MGP operations. Various contaminants are typically found at such former MGP sites and environmental remediation measures are frequently required. With respect to the sites, LG&E has substantially completed cleanups, obtained regulatory approval of site management plans, or reached agreements for other parties to assume responsibility for cleanup. Based on currently available information, management estimates that it could incur additional costs of $0.4 million for additional cleanup. Accordingly, an accrual for this amount has been recorded in the accompanying financial statements at December 31, 2005 and 2004.
Note 11 - Jointly Owned Electric Utility Plant
LG&E owns a 75% undivided interest in Trimble County Unit 1 which the Kentucky Commission has allowed to be reflected in customer rates. Of the remaining 25% of the Unit, IMEA owns a 12.12% undivided interest, and IMPA owns a 12.88% undivided interest. Each company is responsible for its proportionate ownership share of fuel cost, operation and maintenance expenses, and incremental assets. The following data represent shares of the jointly owned property:
99
Trimble County
| | LG&E | | IMPA | | IMEA | | Total | |
Ownership interest | | 75 | % | 12.88 | % | 12.12 | % | 100 | % |
Mw capacity | | 383 | | 66 | | 62 | | 511 | |
| | | | | | | | | |
LG&E’s 75% ownership: | | | | | | | | | |
| | | | | | | | | |
(in millions) | | | | | | | | | |
Cost | | $ | 599.2 | | | | | | | |
Accumulated depreciation | | (221.1 | ) | | | | | | |
Net book value | | $ | 378.1 | | | | | | | |
| | | | | | | | | |
Construction work in progress (included above) | | $ | 9.1 | | | | | | | |
LG&E and KU jointly own the following combustion turbines:
($ in millions) | | | | LG&E | | KU | | Total | |
Paddy’s Run 13 | | Ownership % | | 53 | % | 47 | % | 100 | % |
| | Mw capacity | | 84 | | 74 | | 158 | |
| | Cost | | $ | 34.0 | | $ | 30.1 | | $ | 64.1 | |
| | Depreciation | | (5.2 | ) | (4.6 | ) | (9.8 | ) |
| | Net book value | | $ | 28.8 | | $ | 25.5 | | $ | 54.3 | |
| | | | | | | | | |
E.W. Brown 5 | | Ownership % | | 53 | % | 47 | % | 100 | % |
| | Mw capacity | | 62 | | 55 | | 117 | |
| | Cost | | $ | 24.0 | | $ | 20.2 | | $ | 44.2 | |
| | Depreciation | | (3.5 | ) | (3.0 | ) | (6.5 | ) |
| | Net book value | | $ | 20.5 | | $ | 17.2 | | $ | 37.7 | |
| | | | | | | | | |
E.W. Brown 6 | | Ownership % | | 38 | % | 62 | % | 100 | % |
| | Mw capacity | | 59 | | 95 | | 154 | |
| | Cost | | $ | 25.3 | | $ | 38.9 | | $ | 64.2 | |
| | Depreciation | | (4.2 | ) | (7.9 | ) | (12.1 | ) |
| | Net book value | | $ | 21.1 | | $ | 31.0 | | $ | 52.1 | |
| | | | | | | | | |
E.W. Brown 7 | | Ownership % | | 38 | % | 62 | % | 100 | % |
| | Mw capacity | | 59 | | 95 | | 154 | |
| | Cost | | $ | 24.9 | | $ | 39.7 | | $ | 64.6 | |
| | Depreciation | | (6.4 | ) | (8.2 | ) | (14.6 | ) |
| | Net book value | | $ | 18.5 | | $ | 31.5 | | $ | 50.0 | |
| | | | | | | | | |
Trimble 5 | | Ownership % | | 29 | % | 71 | % | 100 | % |
| | Mw capacity | | 46 | | 114 | | 160 | |
| | Cost | | $ | 16.4 | | $ | 39.7 | | $ | 56.1 | |
| | Depreciation | | (1.9 | ) | (4.7 | ) | (6.6 | ) |
| | Net book value | | $ | 14.5 | | $ | 35.0 | | $ | 49.5 | |
| | | | | | | | | |
Trimble 6 | | Ownership % | | 29 | % | 71 | % | 100 | % |
| | Mw capacity | | 46 | | 114 | | 160 | |
| | Cost | | $ | 16.2 | | $ | 39.7 | | $ | 55.9 | |
| | Depreciation | | (1.9 | ) | (4.7 | ) | (6.6 | ) |
| | Net book value | | $ | 14.3 | | $ | 35.0 | | $ | 49.3 | |
| | | | | | | | | |
Trimble 7 | | Ownership % | | 37 | % | 63 | % | 100 | % |
| | Mw capacity | | 59 | | 101 | | 160 | |
| | Cost | | $ | 19.3 | | $ | 33.3 | | $ | 52.6 | |
| | Depreciation | | (1.0 | ) | (1.7 | ) | (2.7 | ) |
| | Net book value | | $ | 18.3 | | $ | 31.6 | | $ | 49.9 | |
100
Trimble 8 | | Ownership % | | 37 | % | 63 | % | 100 | % |
| | Mw capacity | | 59 | | 101 | | 160 | |
| | Cost | | $ | 19.2 | | $ | 32.8 | | $ | 52.0 | |
| | Depreciation | | (1.0 | ) | (1.7 | ) | (2.7 | ) |
| | Net book value | | $ | 18.2 | | $ | 31.1 | | $ | 49.3 | |
| | | | | | | | | |
Trimble 9 | | Ownership % | | 37 | % | 63 | % | 100 | % |
| | Mw capacity | | 59 | | 101 | | 160 | |
| | Cost | | $ | 19.2 | | $ | 32.8 | | $ | 52.0 | |
| | Depreciation | | (1.0 | ) | (1.6 | ) | (2.6 | ) |
| | Net book value | | $ | 18.2 | | $ | 31.2 | | $ | 49.4 | |
| | | | | | | | | |
Trimble 10 | | Ownership % | | 37 | % | 63 | % | 100 | % |
| | Mw capacity | | 59 | | 101 | | 160 | |
| | Cost | | $ | 19.1 | | $ | 32.8 | | $ | 51.9 | |
| | Depreciation | | (0.9 | ) | (1.6 | ) | (2.5 | ) |
| | Net book value | | $ | 18.2 | | $ | 31.2 | | $ | 49.4 | |
| | | | | | | | | |
Trimble CT Pipeline | | Ownership % | | 29 | % | 71 | % | 100 | % |
| | Cost | | $ | 2.0 | | $ | 4.9 | | $ | 6.9 | |
| | Depreciation | | (0.2 | ) | (0.6 | ) | (0.8 | ) |
| | Net book value | | $ | 1.8 | | $ | 4.3 | | $ | 6.1 | |
| | | | | | | | | |
Trimble CT Substation | | Ownership % | | 29 | % | 71 | % | 100 | % |
5 & 6 | | Cost | | $ | 1.5 | | $ | 3.6 | | $ | 5.1 | |
| | Depreciation | | (0.1 | ) | (0.3 | ) | (0.4 | ) |
| | Net book value | | $ | 1.4 | | $ | 3.3 | | $ | 4.7 | |
| | | | | | | | | |
Trimble CT Substation | | Ownership % | | 37 | % | 63 | % | 100 | % |
7 - 10 | | Cost | | $ | 3.1 | | $ | 4.9 | | $ | 8.0 | |
| | Depreciation | | (0.1 | ) | (0.2 | ) | (0.3 | ) |
| | Net book value | | $ | 3.0 | | $ | 4.7 | | $ | 7.7 | |
In addition to these generating units, LG&E and KU share joint ownership in the Brown Inlet Air Cooling system. LG&E owns 10% of the system, attributable to Brown Unit 5, which provides an additional 10 Mw of capacity.
Note 12 - Segments of Business and Related Information
LG&E is a regulated public utility engaged in the generation, transmission, distribution and sale of electricity and the storage, distribution and sale of natural gas. LG&E is regulated by the Kentucky Commission and files electric and natural gas financial information separately with the Kentucky Commission. The Kentucky Commission establishes rates specifically for the electric and natural gas businesses. Therefore, management reports and analyzes financial performance based on the electric and natural gas segments of the business. Financial data for business segments follow:
101
(in millions) | | Electric | | Gas | | Total | |
2005 | | | | | | | |
Operating revenues | | $ | 987.4 | | $ | 436.9 | | $ | 1,424.3 | |
Depreciation and amortization | | 106.2 | | 17.9 | | 124.1 | |
Income taxes | | 60.0 | | 4.9 | | 64.9 | |
Interest income | | 0.5 | | 0.1 | | 0.6 | |
Interest expense | | 30.3 | | 6.5 | | 36.8 | |
Net income | | 119.4 | | 9.5 | | 128.9 | |
Total assets | | 2,475.0 | | 671.4 | | 3,146.4 | |
Construction expenditures | | 96.5 | | 42.4 | | 138.9 | |
| | | | | | | |
2004 | | | | | | | |
Operating revenues | | $ | 815.7 | | $ | 357.1 | | $ | 1,172.8 | |
Depreciation and amortization | | 100.0 | | 16.6 | | 116.6 | |
Income taxes | | 48.3 | | 5.0 | | 53.3 | |
Interest income | | 0.2 | | — | | 0.2 | |
Interest expense | | 27.3 | | 5.5 | | 32.8 | |
Net income | | 87.2 | | 8.4 | | 95.6 | |
Total assets | | 2,416.5 | | 550.0 | | 2,966.5 | |
Construction expenditures | | 113.4 | | 34.9 | | 148.3 | |
| | | | | | | |
2003 | | | | | | | |
Operating revenues | | $ | 768.2 | | $ | 325.3 | | $ | 1,093.5 | |
Depreciation and amortization | | 96.5 | | 16.8 | | 113.3 | |
Income taxes | | 44.7 | | 5.4 | | 50.1 | |
Interest income | | — | | — | | — | |
Interest expense | | 25.7 | | 5.0 | | 30.7 | |
Net income | | 80.6 | | 10.2 | | 90.8 | |
Total assets | | 2,338.9 | | 543.2 | | 2,882.1 | |
Construction expenditures | | 178.0 | | 35.0 | | 213.0 | |
Note 13 - Related Party Transactions
LG&E, subsidiaries of E.ON U.S. and other subsidiaries of E.ON engage in related party transactions. Transactions between LG&E and its subsidiary LG&E R are eliminated upon consolidation with LG&E. Transactions between LG&E and E.ON U.S. subsidiaries are eliminated upon consolidation of E.ON U.S. Transactions between LG&E and E.ON subsidiaries are eliminated upon consolidation of E.ON. These transactions are generally performed at cost and are in accordance with the prior SEC regulations under PUHCA 1935 and the applicable FERC and Kentucky Commission regulations. Amounts payable to and receivable from related parties are netted and presented as accounts payable to affiliated companies on the balance sheet of LG&E, as allowed due to the right of offset. Obligations related to intercompany debt arrangements with E.ON U.S. and Fidelia are presented as separate line items on the balance sheet, as appropriate. The significant related party transactions are disclosed below.
Electric Purchases
LG&E and KU purchase energy from each other in order to effectively manage the load of their retail and off-system customers. In addition, LG&E sells energy to LEM, a subsidiary of E.ON U.S. These sales and purchases are included in the Statements of Income as Electric Operating Revenues and Purchased Power Operating Expense. LG&E intercompany electric revenues and purchased power expense for the years ended December 31, 2005, 2004 and 2003 were as follows:
(in millions) | | 2005 | | 2004 | | 2003 | |
Electric operating revenues from KU | | $ | 91.6 | | $ | 58.7 | | $ | 53.7 | |
Electric operating revenues from LEM | | — | | 0.4 | | 9.4 | |
Purchased power from KU | | 95.5 | | 61.7 | | 46.7 | |
| | | | | | | | | | |
Interest Charges
See Note 9, Notes Payable and Other Short-Term Obligations, for details of intercompany borrowing arrangements. Intercompany agreements do not require interest payments for receivables related to services provided when settled within 30 days.
102
LG&E’s intercompany interest income and expense for the years ended December 31, 2005, 2004 and 2003 were as follows:
(in millions) | | 2005 | | 2004 | | 2003 | |
Interest on money pool loans | | $ | 1.8 | | $ | 0.3 | | $ | 1.8 | |
Interest on Fidelia loans | | 10.9 | | 11.9 | | 5.0 | |
| | | | | | | | | | |
Other Intercompany Billings
E.ON U.S. Services provides LG&E with a variety of centralized administrative, management and support services. These charges include payroll taxes paid by E.ON U.S. on behalf of LG&E, labor and burdens of E.ON U.S. Services employees performing services for LG&E and vouchers paid by E.ON U.S. Services on behalf of LG&E. The cost of these services are directly charged to LG&E, or for general costs which cannot be directly attributed, charged based on predetermined allocation factors, including the following ratios: number of customers, total assets, revenues, number of employees and other statistical information. These costs are charged on an actual cost basis.
In addition, LG&E and KU provide services to each other and to E.ON U.S. Services. Billings between LG&E and KU relate to labor and overheads associated with union employees performing work for the other utility, charges related to jointly-owned combustion turbines, and other miscellaneous charges. Billings from LG&E to E.ON U.S. Services related to information technology-related services provided by LG&E employees, cash received by E.ON U.S. Services on behalf of LG&E and services provided by LG&E to other non-regulated businesses which are paid through E.ON U.S. Services.
Intercompany billings to and from LG&E for the years ended December 31, 2005, 2004 and 2003 were as follows:
(in millions) | | 2005 | | 2004 | | 2003 | |
E.ON U.S. Services billings to LG&E | | $ | 208.4 | | $ | 190.7 | | $ | 196.1 | |
LG&E billings to KU | | 100.5 | | 59.5 | | 77.2 | |
KU billings to LG&E | | 28.6 | | 7.2 | | 16.6 | |
LG&E billings to E.ON U.S. Services | | 8.2 | | 12.5 | | 23.7 | |
| | | | | | | | | | |
The increase in 2005 billings between LG&E and KU is largely due to the increase in the unit cost of purchased power resulting from the 2005 increases in fuel costs.
Note 14 – Accumulated Other Comprehensive Income
Accumulated other comprehensive income (loss) consisted of the following:
| | Minimum | | | | | | | | | |
| | Pension | | Accumulated | | | | | | | |
| | Liability | | Derivative | | | | Income | | | |
(in millions) | | Adjustment | | Gain or Loss | | Pre-Tax | | Taxes | | Net | |
Balance at December 31, 2002 | | $ | (50.7 | ) | $ | (17.2 | ) | $ | (67.9 | ) | $ | 27.4 | | $ | (40.5 | ) |
| | | | | | | | | | | |
Minimum pension liability adjustment | | 3.1 | | — | | 3.1 | | (1.2 | ) | 1.9 | |
Gains (losses) on derivative instruments designated and qualifying as cash flow hedging instruments | | — | | 0.9 | | 0.9 | | (0.4 | ) | 0.5 | |
Balance at December 31, 2003 | | (47.6 | ) | (16.3 | ) | (63.9 | ) | 25.8 | | (38.1 | ) |
Minimum pension liability adjustment | | (10.2 | ) | — | | (10.2 | ) | 4.1 | | (6.1 | ) |
Gains (losses) on derivative instruments designated and qualifying as cash flow hedging instruments | | — | | (2.3 | ) | (2.3 | ) | 0.9 | | (1.4 | ) |
Balance at December 31, 2004 | | $ | (57.8 | ) | $ | (18.6 | ) | $ | (76.4 | ) | $ | 30.8 | | $ | (45.6 | ) |
| | | | | | | | | | | |
Minimum pension liability adjustment | | (19.2 | ) | — | | (19.2 | ) | 6.7 | | (12.5 | ) |
Gains (losses) on derivative instruments designated and qualifying as cash flow hedging instruments | | — | | (0.1 | ) | (0.1 | ) | — | | (0.1 | ) |
Balance at December 31, 2005 | | $ | (77.0 | ) | $ | (18.7 | ) | $ | (95.7 | ) | $ | 37.5 | | $ | (58.2 | ) |
103
Note 15 - Selected Quarterly Data (Unaudited)
Selected financial data for the four quarters of 2005 and 2004 are shown below. Because of seasonal fluctuations in temperature and other factors, results for quarters may fluctuate throughout the year.
| | Quarters Ended | |
(in millions) | | March | | June | | September | | December | |
2005 | | | | | | | | | |
Operating revenues | | $ | 402.4 | | $ | 280.7 | | $ | 318.6 | | $ | 422.6 | |
Net operating income | | 61.6 | | 52.5 | | 65.9 | | 49.9 | |
Net income | | 33.9 | | 28.0 | | 42.0 | | 25.0 | |
| | | | | | | | | |
2004 | | | | | | | | | |
Operating revenues | | $ | 362.0 | | $ | 236.2 | | $ | 261.8 | | $ | 312.8 | |
Net operating income | | 47.6 | | 34.6 | | 62.8 | | 40.0 | |
Net income | | 24.2 | | 17.1 | | 32.5 | | 21.8 | |
Note 16 - Subsequent Events
On January 20, 2006, LG&E made a discretionary contribution to the pension plan in the amount of $17.5 million.
On February 27, 2006, the AG, KIUC, LG&E and KU reached a settlement agreement on the future ratemaking treatment of the VDT surcredits and costs and subsequently submitted a joint motion to the Kentucky Commission to approve the unanimous settlement agreement. Under the terms of the settlement agreement, the VDT surcredit will continue at the current level until such time as LG&E files for a change in electric or gas base rates. The Kentucky Commission held a public hearing in the proceeding on March 21, 2006 and issued an order thereafter approving the settlement agreement.
On March 17, 2006 the FERC issued an order conditionally approving the request of LG&E and KU to exit the MISO.
The Companies must satisfy a number of conditions to effect their exit from the MISO including:
• Submission of various compliance filings addressing:
• the Companies’ hold-harmless obligations under the MISO Transmission Owners’ Agreement, and the amount of the MISO exit fee to be paid by the Companies as calculated under the approved methodology;
• the Companies’ anticipated arrangements with SPP and TVA, including revisions to address certain independence and transmission planning considerations, and reciprocity arrangements to ensure certain KU requirements customers do not incur pancaked rates for transmission and ancillary services;
• the Companies’ proposed OATT, as revised to address possible capacity hoarding, available transmission calculation methodology, curtailment priority and pricing, among other matters; and
• the Companies’ finalized arrangements with the SPP and TVA.
• The Companies must also file an application of the proposed OATT under Section 205 of the Federal Power Act including a proposed return on equity.
While LG&E and KU believe they can reasonably achieve all of the conditions imposed by the FERC order, completion of a number of the conditions is dependent upon the actions or agreement of third parties. There is also a risk that the FERC decision will be challenged by intervenors with a request for rehearing, which could happen within 30 days of the decision. The Companies are currently unable to estimate the time period, if any, in which the conditions of the FERC order might be satisfied, the Companies might receive Kentucky Commission approval and, thereafter, exit the MISO.
104
Louisville Gas and Electric Company
REPORT OF MANAGEMENT
The management of Louisville Gas and Electric Company (“LG&E”) is responsible for the preparation and integrity of the financial statements and related information included in this Annual Report. These statements have been prepared in accordance with accounting principles generally accepted in the United States applied on a consistent basis and, necessarily, include amounts that reflect the best estimates and judgment of management.
LG&E’s financial statements for the three years ended December 31, 2005, have been audited by PricewaterhouseCoopers LLP, an independent registered public accounting firm. Management made available to PricewaterhouseCoopers LLP all LG&E’s financial records and related data as well as the minutes of shareholders’ and directors’ meetings.
Management has established and maintains a system of internal controls that provides reasonable assurance that transactions are completed in accordance with management’s authorization, that assets are safeguarded and that financial statements are prepared in conformity with generally accepted accounting principles. Management believes that an adequate system of internal controls is maintained through the selection and training of personnel, appropriate division of responsibility, establishment and communication of policies and procedures and by regular reviews of internal accounting controls by LG&E’s internal auditors. Management reviews and modifies its system of internal controls in light of changes in conditions and operations, as well as in response to recommendations from the internal and external auditors. These recommendations for the year ended December 31, 2005, did not identify any material weaknesses in the design and operation of LG&E’s internal control structure.
LG&E is not an accelerated filer under the Sarbanes-Oxley Act of 2002 and associated rules (the “Act”) and consequently anticipates issuing Management’s Report on Internal Controls over Financial Reporting pursuant to Section 404 of the Act in its first periodic report covering the fiscal year ended December 31, 2007, as permitted by SEC rulemaking.
In carrying out its oversight role for the financial reporting and internal controls of LG&E, the Board of Directors meets regularly with LG&E’s independent registered public accounting firm, internal auditors and management. The Board of Directors reviews the results of the independent registered public accounting firm’s audit of the financial statements and their audit procedures, and discusses the adequacy of internal accounting controls. The Board of Directors also approves the annual internal auditing program and reviews the activities and results of the internal auditing function. Both the independent registered public accounting firm and the internal auditors have access to the Board of Directors at any time.
LG&E maintains and internally communicates a written code of business conduct and a senior financial officer code of ethics which address, among other items, potential conflicts of interest, compliance with laws, including those relating to financial disclosure, and the confidentiality of proprietary information.
S. Bradford Rives
Chief Financial Officer
Louisville Gas and Electric Company
Louisville, Kentucky
Date: March 29, 2006
105
Report of Independent Registered Public Accounting Firm
To the Shareholder of Louisville Gas and Electric Company:
In our opinion, the accompanying balance sheet and the related statement of capitalization, income, retained earnings, cash flows and comprehensive income present fairly, in all material respects, the financial position of Louisville Gas and Electric Company at December 31, 2005 and December 31, 2004, and the results of its operations and its cash flows for each of the three years in the period ended December 31, 2005 in conformity with accounting principles generally accepted in the United States of America. In addition, in our opinion, the financial statement schedule listed in the index appearing under Item 15(a)(2) present fairly, in all material respects, the information set forth therein when read in conjunction with the related financial statements. These financial statements and financial statement schedule are the responsibility of the Company’s management. Our responsibility is to express an opinion on these financial statements and financial statement schedule based on our audits. We conducted our audits of these statements in accordance with the standards of the Public Company Accounting Oversight Board (United States). Those standards require that we plan and perform the audit to obtain reasonable assurance about whether the financial statements are free of material misstatement. An audit includes examining, on a test basis, evidence supporting the amounts and disclosures in the financial statements, assessing the accounting principles used and significant estimates made by management, and evaluating the overall financial statement presentation. We believe that our audits provide a reasonable basis for our opinion.
As discussed in Note 1 to the financial statements, effective December 31, 2005, Louisville Gas and Electric Company adopted Statement of Financial Accounting Standards Board Interpretation No. 47, Accounting for Conditional Asset Retirement Obligations.
/s/ PricewaterhouseCoopers LLP
Louisville, Kentucky
February 8, 2006
106
INDEX OF ABBREVIATIONS
AEP | | American Electric Power Company, Inc. |
AFUDC | | Allowance for Funds Used During Construction |
AG | | Attorney General of Kentucky |
APBO | | Accumulated Postretirement Benefit Obligation |
ARO | | Asset Retirement Obligation |
CAIR | | Clean Air Interstate Rule |
CAMR | | Clean Air Mercury Rule |
Capital Corp. | | E.ON U.S. Capital Corp. (formerly LG&E Capital Corp.) |
CAVR | | Clean Air Visibility Rule |
Clean Air Act | | The Clean Air Act, as amended in 1990 |
CCN | | Certificate of Public Convenience and Necessity |
Company | | LG&E or KU, as applicable |
Companies | | LG&E and KU |
CO2 | | Carbon Dioxide |
CT | | Combustion Turbines |
CWIP | | Construction Work in Progress |
DOE | | Department of Energy |
DOJ | | Department of Justice |
DSM | | Demand Side Management |
ECAR | | East Central Area Reliability Region |
ECR | | Environmental Cost Recovery |
EEI | | Electric Energy, Inc. |
EITF | | Emerging Issues Task Force Issue |
E.ON | | E.ON AG |
E.ON U.S. | | E.ON U.S. LLC (formerly LG&E Energy LLC and LG&E Energy Corp.) |
E.ON U.S. Services | | E.ON U.S. Services Inc. (formerly LG&E Energy Services Inc.) |
EPA | | U.S. Environmental Protection Agency |
EPAct 2005 | | Energy Policy Act of 2005 |
ESM | | Earnings Sharing Mechanism |
ERISA | | Employee Retirement Income Security Act of 1974, as amended |
Fidelia | | Fidelia Corporation (an E.ON affiliate) |
FAC | | Fuel Adjustment Clause |
FASB | | Financial Accounting Standards Board |
FERC | | Federal Energy Regulatory Commission |
FGD | | Flue Gas Desulfurization |
FIN | | FASB Interpretation |
FPA | | Federal Power Act |
FSP | | FASB Staff Position |
FT and FT-A | | Firm Transportation |
FTR | | Financial Transmission Right |
GSC | | Gas Supply Clause |
GFA | | Grandfathered Transmission Agreement |
IBEW | | International Brotherhood of Electrical Workers |
IMEA | | Illinois Municipal Electric Agency |
IMPA | | Indiana Municipal Power Agency |
IRC | | Internal Revenue Code of 1986, as amended |
IRP | | Integrated Resource Plan |
ITP | | Independent Transmission Provider |
Kentucky Commission | | Kentucky Public Service Commission |
KIUC | | Kentucky Industrial Utility Consumers, Inc. |
KU | | Kentucky Utilities Company |
KU Energy | | KU Energy Corporation |
KU R | | KU Receivables LLC |
Kv | | Kilovolts |
Kva | | Kilovolt-ampere |
Kw | | Kilowatts |
Kwh | | Kilowatt hours |
LEM | | LG&E Energy Marketing Inc. |
107
LG&E | | Louisville Gas and Electric Company |
LG&E Energy | | LG&E Energy LLC (now E.ON U.S. LLC) |
LG&E R | | LG&E Receivables LLC |
LG&E Services | | LG&E Energy Services Inc. (now E.ON U.S. Services Inc.) |
LMP | | Locational Marginal Pricing |
LNG | | Liquefied Natural Gas |
Mcf | | Thousand Cubic Feet |
MGP | | Manufactured Gas Plant |
MISO | | Midwest Independent Transmission System Operator, Inc. |
MMBtu | | Million British thermal units |
Moody’s | | Moody’s Investor Services, Inc. |
Mva | | Megavolt-ampere |
Mw | | Megawatts |
Mwh | | Megawatt hours |
NNS | | No-Notice Service |
NOPR | | Notice of Proposed Rulemaking |
NOx | | Nitrogen Oxide |
OATT | | Open Access Transmission Tariff |
OMU | | Owensboro Municipal Utilities |
OVEC | | Ohio Valley Electric Corporation |
PBR | | Performance-Based Ratemaking |
PJM | | Pennsylvania, New Jersey, Maryland Interconnection |
Powergen | | Powergen Limited (formerly Powergen plc) |
PUHCA 1935 | | Public Utility Holding Company Act of 1935 |
PUHCA 2005 | | Public Utility Holding Company Act of 2005 |
ROE | | Return on Equity |
RTO | | Regional Transmission Organization |
RTOR | | Regional Through and Out Rates |
S&P | | Standard & Poor’s Rating Services |
SCR | | Selective Catalytic Reduction |
SEC | | Securities and Exchange Commission |
SERP | | Supplemental Executive Retirement Plan |
SFAS | | Statement of Financial Accounting Standards |
SIP | | State Implementation Plan |
SMD | | Standard Market Design |
SO2 | | Sulfur Dioxide |
SPP | | Southwest Power Pool, Inc. |
TEMT | | Transmission and Energy Markets Tariff |
Tennessee Gas | | Tennessee Gas Pipeline Company |
Texas Gas | | Texas Gas Transmission LLC |
Trimble County | | LG&E’s Trimble County Unit 1 |
TVA | | Tennessee Valley Authority |
USWA | | United Steelworkers of America |
Utility Operations | | Operations of LG&E and KU |
VDT | | Value Delivery Team Process |
Virginia Commission | | Virginia State Corporation Commission |
Virginia Staff | | Virginia State Corporation Commission Staff |
WNA | | Weather Normalization Adjustment |
108
Kentucky Utilities Company
Statements of Income
(Millions of $)
| | Years Ended December 31 | |
| | 2005 | | 2004 | | 2003 | |
| | | | | | | |
OPERATING REVENUES: | | | | | | | |
Total operating revenues (Note 12) | | $ | 1,206.6 | | $ | 995.4 | | $ | 891.8 | |
| | | | | | | |
OPERATING EXPENSES: | | | | | | | |
Fuel for electric generation | | 384.1 | | 292.5 | | 266.4 | |
Power purchased (Notes 10 and 12) | | 218.9 | | 144.2 | | 140.1 | |
Other operation and maintenance expenses | | 286.8 | | 222.1 | | 221.3 | |
Depreciation and amortization (Note 1) | | 114.7 | | 108.7 | | 101.8 | |
Total operating expenses | | 1,004.5 | | 767.5 | | 729.6 | |
| | | | | | | |
Net operating income | | 202.1 | | 227.9 | | 162.2 | |
| | | | | | | |
Other (income) – net | | (5.0 | ) | (7.5 | ) | (4.5 | ) |
Interest expense (Notes 8 and 9) | | 15.0 | | 11.3 | | 19.3 | |
Interest expense to affiliated companies (Note 12) | | 16.0 | | 14.2 | | 5.9 | |
| | | | | | | |
Net income before income taxes | | 176.1 | | 209.9 | | 141.5 | |
| | | | | | | |
Federal and state income taxes (Note 7) | | 64.0 | | 76.4 | | 50.1 | |
| | | | | | | |
Net income | | $ | 112.1 | | $ | 133.5 | | $ | 91.4 | |
The accompanying notes are an integral part of these financial statements.
Statements of Retained Earnings
(Millions of $)
| | Years Ended December 31 | |
| | 2005 | | 2004 | | 2003 | |
| | | | | | | |
Balance January 1 | | $ | 659.4 | | $ | 591.2 | | $ | 502.0 | |
Add net income | | 112.1 | | 133.5 | | 91.4 | |
| | 771.5 | | 724.7 | | 593.4 | |
| | | | | | | |
Deduct: Cash dividends declared on stock and other: | | | | | | | |
4.75% cumulative preferred | | 0.8 | | 1.0 | | 0.9 | |
6.53% cumulative preferred | | 1.0 | | 1.3 | | 1.3 | |
Common | | 50.0 | | 63.0 | | — | |
Call premium and expenses | | 1.1 | | — | | — | |
| | 52.9 | | 65.3 | | 2.2 | |
| | | | | | | |
Balance December 31 | | $ | 718.6 | | $ | 659.4 | | $ | 591.2 | |
The accompanying notes are an integral part of these financial statements.
109
Kentucky Utilities Company
Statements of Comprehensive Income
(Millions of $)
| | Years Ended December 31 | |
| | 2005 | | 2004 | | 2003 | |
| | | | | | | |
Net income | | $ | 112.1 | | $ | 133.5 | | $ | 91.4 | |
| | | | | | | |
Gain (loss) on derivative instruments and hedging activities, net of tax benefit (expense) of $0, $(0.1) and $0.1 for 2005, 2004 and 2003, respectively (Notes 1 and 4) | | — | | 0.2 | | (0.2 | ) |
| | | | | | | |
Additional minimum pension liability adjustment, net of tax benefit (expense) of $3.5, $5.0 and $(3.1) for 2005, 2004 and 2003, respectively (Note 6) | | (6.0 | ) | (7.4 | ) | 4.6 | |
| | | | | | | |
Other comprehensive income (loss), net of tax (Note 13) | | (6.0 | ) | (7.2 | ) | 4.4 | |
| | | | | | | |
Comprehensive income | | $ | 106.1 | | $ | 126.3 | | $ | 95.8 | |
The accompanying notes are an integral part of these financial statements.
110
Kentucky Utilities Company
Balance Sheets
(Millions of $)
| | December 31 | |
| | 2005 | | 2004 | |
| | | | | |
ASSETS: | | | | | |
Current assets: | | | | | |
Cash and cash equivalents (Note 1) | | $ | 6.7 | | $ | 4.6 | |
Restricted cash (Note 1) | | 21.6 | | — | |
Accounts receivable - less reserve of $1.5 million in 2005 and $0.6 million in 2004 (Note 4) | | 167.0 | | 112.6 | |
Materials and supplies (Note 1): | | | | | |
Fuel (predominantly coal) | | 55.6 | | 52.2 | |
Other materials and supplies | | 32.3 | | 31.7 | |
Prepayments and other current assets | | 5.0 | | 6.2 | |
Total current assets | | 288.2 | | 207.3 | |
| | | | | |
Other property and investments - less reserve of $0.1 million in 2005 and 2004 (Note 1) | | 22.8 | | 20.5 | |
| | | | | |
Utility plant, at original cost (Note 1) | | 3,649.9 | | 3,571.1 | |
| | | | | |
Less: reserve for depreciation | | 1,508.2 | | 1,415.0 | |
Total utility plant, net | | 2,141.7 | | 2,156.1 | |
| | | | | |
Construction work in progress | | 197.0 | | 141.0 | |
Total utility plant and construction work in progress | | 2,338.7 | | 2,297.1 | |
| | | | | |
Deferred debits and other assets: | | | | | |
Unamortized debt expense (Note 1) | | 5.0 | | 4.7 | |
Regulatory assets (Note 3) | | 58.2 | | 61.4 | |
Long-term derivative asset | | 0.8 | | 6.1 | |
Cash surrender value of key man life insurance (Note 8) | | 32.5 | | 3.6 | |
Other assets | | 10.1 | | 9.7 | |
Total deferred debits and other assets | | 106.6 | | 85.5 | |
| | | | | |
Total Assets | | $ | 2,756.3 | | $ | 2,610.4 | |
The accompanying notes are an integral part of these financial statements.
111
Kentucky Utilities Company
Balance Sheets (continued)
(Millions of $)
| | December 31 | |
| | 2005 | | 2004 | |
| | | | | |
LIABILITIES AND EQUITY: | | | | | |
Current liabilities: | | | | | |
Current portion of long-term debt: | | | | | |
Current portion of long-term bonds (Note 8) | | $ | 123.1 | | $ | 87.1 | |
Current portion of long-term notes to affiliated company | | — | | 75.0 | |
Total current portion of long-term debt | | 123.1 | | 162.1 | |
| | | | | |
Notes payable to affiliated company (Notes 9 and 12) | | 69.7 | | 34.8 | |
Accounts payable | | 88.6 | | 77.9 | |
Accounts payable to affiliated companies (Note 12) | | 52.6 | | 32.8 | |
Accrued income taxes | | 12.9 | | 5.9 | |
Customer deposits | | 17.3 | | 15.0 | |
Other current liabilities | | 18.5 | | 15.4 | |
Total current liabilities | | 382.7 | | 343.9 | |
| | | | | |
Long-term debt: | | | | | |
Long-term bonds (Note 8) | | 240.5 | | 306.1 | |
Long-term notes to affiliated company (Note 8) | | 383.0 | | 258.0 | |
Total long-term debt | | 623.5 | | 564.1 | |
| | | | | |
Deferred credits and other liabilities: | | | | | |
Accumulated deferred income taxes (Note 7) | | 273.8 | | 282.6 | |
Investment tax credit, in process of amortization | | 2.1 | | 3.8 | |
Accumulated provision for pensions and related benefits (Note 6) | | 91.7 | | 77.9 | |
Asset retirement obligations | | 26.8 | | 21.0 | |
Regulatory liabilities (Note 3): | | | | | |
Accumulated cost of removal of utility plant | | 280.9 | | 266.8 | |
Regulatory liability deferred income taxes | | 23.0 | | 19.3 | |
Other regulatory liabilities | | 11.3 | | 5.4 | |
Other liabilities | | 18.4 | | 17.0 | |
Total deferred credits and other liabilities | | 728.0 | | 693.8 | |
| | | | | |
Commitments and contingencies (Note 10) | | | | | |
| | | | | |
Cumulative preferred stock | | — | | 39.7 | |
| | | | | |
COMMON EQUITY: | | | | | |
Common stock, without par value - Authorized 80,000,000 shares, outstanding 37,817,878 shares | | 307.8 | | 307.8 | |
Additional paid-in-capital | | 15.0 | | 15.0 | |
Accumulated other comprehensive income (Note 13) | | (19.3 | ) | (13.3 | ) |
Retained earnings | | 704.2 | | 647.3 | |
Undistributed subsidiary earnings | | 14.4 | | 12.1 | |
Total retained earnings | | 718.6 | | 659.4 | |
Total common equity | | 1,022.1 | | 968.9 | |
| | | | | |
Total Liabilities and Equity | | $ | 2,756.3 | | $ | 2,610.4 | |
The accompanying notes are an integral part of these financial statements.
112
Kentucky Utilities Company
Statements of Cash Flows
(Millions of $)
| | Years Ended December 31 | |
| | 2005 | | 2004 | | 2003 | |
CASH FLOWS FROM OPERATING ACTIVITIES: | | | | | | | |
Net income | | $ | 112.1 | | $ | 133.5 | | $ | 91.4 | |
Items not requiring cash currently: | | | | | | | |
Depreciation and amortization | | 114.7 | | 108.7 | | 101.8 | |
Deferred income taxes - net | | (1.6 | ) | 16.6 | | 15.3 | |
Investment tax credit - net | | (1.7 | ) | (2.1 | ) | (2.6 | ) |
VDT amortization | | 11.8 | | 11.7 | | 12.0 | |
Deferred storm costs | | — | | (3.6 | ) | — | |
Other | | 0.1 | | (4.2 | ) | 16.1 | |
Change in certain current assets and liabilities: | | | | | | | |
Accounts receivable | | (54.4 | ) | (63.3 | ) | 0.3 | |
Materials and supplies | | (4.0 | ) | (3.1 | ) | (8.3 | ) |
Accounts payable | | 30.5 | | 14.3 | | 1.0 | |
Accrued income taxes | | 7.0 | | (1.2 | ) | 3.9 | |
Prepayments and other | | 6.6 | | 1.3 | | 5.3 | |
Pension funding | | (7.5 | ) | (43.4 | ) | (10.2 | ) |
Earnings sharing mechanism receivable | | 3.1 | | 9.3 | | 1.1 | |
Environmental cost recovery mechanism refundable | | — | | (8.0 | ) | 6.2 | |
Litigation settlement | | — | | 11.4 | | — | |
Other | | 4.0 | | 8.0 | | 0.1 | |
Net cash provided by operating activities | | 220.7 | | 185.9 | | 233.4 | |
| | | | | | | |
CASH FLOWS FROM INVESTING ACTIVITIES: | | | | | | | |
Construction expenditures | | (140.0 | ) | (157.6 | ) | (341.8 | ) |
Change in restricted cash | | (21.6 | ) | — | | — | |
Other | | — | | — | | 0.1 | |
Net cash used for investing activities | | (161.6 | ) | (157.6 | ) | (341.7 | ) |
| | | | | | | |
CASH FLOWS FROM FINANCING ACTIVITIES: | | | | | | | |
Long-term borrowings from affiliated company | | 125.0 | | 50.0 | | 283.0 | |
Short-term borrowings from affiliated company | | 716.0 | | 497.8 | | 655.2 | |
Repayment of short-term borrowings from affiliated company | | (681.1 | ) | (506.2 | ) | (731.5 | ) |
Retirement of first mortgage bonds | | (50.0 | ) | — | | (95.0 | ) |
Repayment of long-term borrowings from affiliated company | | (75.0 | ) | — | | — | |
Issuance of pollution control bonds | | 26.5 | | 50.0 | | — | |
Retirement of pollution control bonds | | — | | (54.8 | ) | — | |
Retirement of preferred stock (Note 8) | | (40.8 | ) | — | | — | |
Repayment of life insurance loans (Note 8) | | (26.7 | ) | — | | — | |
Payment of dividends | | (51.8 | ) | (65.3 | ) | (2.3 | ) |
Other | | 0.9 | | (0.1 | ) | (1.6 | ) |
Net cash (used for) provided by financing activities | | (57.0 | ) | (28.6 | ) | 107.8 | |
| | | | | | | |
Change in cash and cash equivalents | | 2.1 | | (0.3 | ) | (0.5 | ) |
Cash and cash equivalents at beginning of year | | 4.6 | | 4.9 | | 5.4 | |
| | | | | | | |
Cash and cash equivalents at end of year | | $ | 6.7 | | $ | 4.6 | | $ | 4.9 | |
| | | | | | | |
Supplemental disclosures of cash flow information: | | | | | | | |
Cash paid during the year for: | | | | | | | |
Income taxes | | $ | 59.3 | | $ | 58.2 | | $ | 37.2 | |
Interest on borrowed money | | 11.7 | | 15.6 | | 20.2 | |
Interest to affiliated companies on borrowed money | | 14.6 | | 13.2 | | 3.5 | |
The accompanying notes are an integral part of these financial statements.
113
Kentucky Utilities Company
Statements of Capitalization
(Millions of $)
| | December 31 | |
| | 2005 | | 2004 | |
| | | | | |
LONG-TERM DEBT (Note 8): | | | | | |
First mortgage bonds: | | | | | |
S due January 15, 2006, 5.99% | | $ | 36.0 | | $ | 36.0 | |
P due May 15, 2007, 7.92% | | 53.0 | | 53.0 | |
R due June 1, 2025, 7.55% | | — | | 50.0 | |
Pollution control series: | | | | | |
10, due November 1, 2024, variable % | | 54.0 | | 54.0 | |
11, due May 1, 2023, variable % | | 12.9 | | 12.9 | |
12, due February 1, 2032, variable % | | 20.9 | | 20.9 | |
13, due February 1, 2032, variable % | | 2.4 | | 2.4 | |
14, due February 1, 2032, variable % | | 2.4 | | 2.4 | |
15, due February 1, 2032, variable % | | 7.4 | | 7.4 | |
16, due October 1, 2032, variable % | | 96.0 | | 96.0 | |
17, due October 1, 2034, variable % | | 50.0 | | 50.0 | |
18, due June 1, 2035, variable % | | 13.3 | | — | |
19, due June 1, 2035, variable % | | 13.3 | | — | |
Notes payable to Fidelia: | | | | | |
Due December 19, 2005, 2.29%, secured | | — | | 75.0 | |
Due November 24, 2010, 4.24%, secured | | 33.0 | | 33.0 | |
Due January 16, 2012, 4.39%, unsecured | | 50.0 | | 50.0 | |
Due April 30, 2013, 4.55%, unsecured | | 100.0 | | 100.0 | |
Due August 15, 2013, 5.31%, secured | | 75.0 | | 75.0 | |
Due July 8, 2015, 4.735%, unsecured | | 50.0 | | — | |
Due December 21, 2015, 5.36%, unsecured | | 75.0 | | — | |
Long-term debt marked to market (Note 4) | | 2.0 | | 8.2 | |
| | | | | |
Total long-term debt outstanding | | 746.6 | | 726.2 | |
| | | | | |
Less current portion of long-term debt | | 123.1 | | 162.1 | |
| | | | | |
Long-term debt | | 623.5 | | 564.1 | |
| | | | | | | |
CUMULATIVE PREFERRED STOCK (Note 8):
| | Shares | | Current | | | | | |
| | Outstanding | | Redemption Price | | | | | |
| | | | | | | | | |
Without par value, 5,300,000 shares authorized - 4.75% series, $100 stated value redeemable 30 days notice by KU | | — | | — | | — | | 20.0 | |
6.53% series, $100 stated value | | — | | — | | — | | 20.0 | |
Preferred stock expense | | | | | | — | | (0.3 | ) |
| | | | | | — | | 39.7 | |
COMMON EQUITY: | | | | | |
Common stock, without par value - Authorized 80,000,000 shares, outstanding 37,817,878 shares | | 308.1 | | 308.1 | |
Common stock expense | | (0.3 | ) | (0.3 | ) |
Additional paid-in-capital | | 15.0 | | 15.0 | |
Accumulated other comprehensive income (Note 13) | | (19.3 | ) | (13.3 | ) |
| | | | | |
Retained earnings | | 704.2 | | 647.3 | |
Undistributed subsidiary earnings | | 14.4 | | 12.1 | |
Total retained earnings | | 718.6 | | 659.4 | |
Total common equity | | 1,022.1 | | 968.9 | |
Total capitalization | | $ | 1,645.6 | | $ | 1,572.7 | |
| | | | | | | |
The accompanying notes are an integral part of these financial statements.
114
Kentucky Utilities Company
Notes to Financial Statements
Note 1 - Summary of Significant Accounting Policies
KU, a subsidiary of E.ON U.S. (formerly LG&E Energy) and an indirect subsidiary of E.ON, is a regulated public utility engaged in the generation, transmission, distribution and sale of electric energy. E.ON U.S. is a public utility holding company with wholly owned subsidiaries including LG&E, KU, Capital Corp., LEM and E.ON U.S. Services. All of KU’s common stock is held by E.ON U.S. In May 2004, KU dissolved its accounts receivable securitization-related subsidiary, KU R. Prior to May 2004, the consolidated financial statements included the accounts of KU and KU R with the elimination of intercompany accounts and transactions.
Effective December 30, 2003, LG&E Energy LLC became the successor, by assignment and subsequent merger, to all the assets and liabilities of LG&E Energy Corp. Effective December 1, 2005, LG&E Energy LLC was renamed E.ON U.S. LLC.
Certain reclassification entries have been made to the previous years’ financial statements to conform to the 2005 presentation with no impact on net assets, liabilities and capitalization or previously reported net income and cash flows.
During 2005, KU made out-of-period adjustments for estimated over/under collection of ECR revenues to be billed in subsequent periods. The adjustments were related to the reporting periods of May 2003 through December 2004. As a result, 2005 revenues for KU were reduced $2.9 million and net income was reduced $1.7 million. KU revenues and net income for 2004 were overstated by $3.2 million and $1.9 million, respectively, and KU revenues and net income for 2003 were understated by $0.3 million and $0.2 million, respectively.
Regulatory Accounting. KU is subject to SFAS No. 71, under which costs that would otherwise be charged to expense are deferred as regulatory assets based on expected recovery from customers in future rates. Likewise, credits that would otherwise be reflected as income are deferred as regulatory liabilities based on expected return to customers in future rates. KU’s current or expected recovery of deferred costs and expected return of deferred credits is based on specific ratemaking decisions or precedent for each item as prescribed by the FERC, the Kentucky Commission and the Virginia Commission. See Note 3, Rates and Regulatory Matters, for additional detail regarding regulatory assets and liabilities.
Cash and Cash Equivalents. KU considers all debt instruments purchased with an original maturity of three months or less to be cash equivalents.
Restricted Cash. Proceeds from two bond issuances for environmental equipment (primarily related to the installation of FGDs) are held in trust pending expenditure for qualifying assets which is expected to occur during 2006. The amount held in trust at December 31, 2005, was $21.6 million and is classified as restricted cash on KU’s Balance Sheet.
Allowance for Doubtful Accounts. The allowance for doubtful accounts is based on the ratio of the amounts charged-off during the last twelve months to the retail revenues billed over the same period multiplied by the retail revenues billed over the last four months. Accounts with no payment activity are charged-off after four months, although collection efforts continue thereafter.
Materials and Supplies. Fuel and other materials and supplies inventories are accounted for using the average-cost method. Emission allowances are included in inventory at cost and are not currently traded by KU. At December 31, 2005 and 2004, the emission allowances inventory was approximately $1.5 million and $3.7 million, respectively.
115
Other Property and Investments. Other property and investments on the balance sheet consists of KU’s investment in EEI, economic development loans provided to various communities in KU’s service territory, KU’s investment in OVEC, funds related to KU’s long-term purchased power contract with OMU and non-utility plant.
Although KU holds investment interests in OVEC and EEI, it is not the primary beneficiary of OVEC or EEI, and, therefore, neither are consolidated into the financial statements of KU. KU and 11 other electric utilities are participating owners of OVEC, located in Piketon, Ohio. OVEC owns and operates two power plants that burn coal to generate electricity, Kyger Creek Station in Ohio and Clifty Creek Station in Indiana. KU’s share is 2.5%, representing approximately 55 Mw of generation capacity.
As of December 31, 2005 and 2004, KU’s investment in OVEC totaled $0.3 million and is accounted for under the cost method of accounting. KU’s maximum exposure to loss as a result of its involvement with OVEC is limited to the value of its investment. In the event of the inability of OVEC to fulfill its power provision requirements, KU would substitute such power supply with either owned generation or market purchases and would generally recover associated incremental costs through regulatory rate mechanisms. See Note 10, Commitments and Contingencies, for further discussion of developments regarding KU’s ownership interests and power purchase rights.
KU owns 20% of the common stock of EEI, which owns and operates a 1,000-Mw generating station in southern Illinois. Previously, KU was entitled to take 20% of the available capacity of the station under a pricing formula comparable to the cost of other power generated by KU. Such power equated to approximately 9% of KU’s net generation system output in 2005. This contract governing the purchases from EEI terminated on December 31, 2005. Subsequent to December 31, 2005, EEI has sold power under general market-based pricing and terms. KU has not contracted with EEI for power under the new arrangements, but maintains its 20% ownership in the common stock of EEI. Replacement power for the EEI capacity has been largely provided by KU generation. See Note 10, Commitments and Contingencies.
KU’s investment in EEI is accounted for under the equity method of accounting and, as of December 31, 2005 and 2004 totaled $15.6 million and $13.4 million, respectively. KU’s portion of equity in EEI earnings for the last three years was $2.3 million in 2005, $2.6 million in 2004 and $3.7 million in 2003. KU’s direct exposure to loss as a result of its involvement with EEI is generally limited to the value of its investment.
Utility Plant. KU’s utility plant is stated at original cost, which includes payroll-related costs such as taxes, fringe benefits, and administrative and general costs. Construction work in progress has been included in the rate base for determining retail customer rates in Kentucky. KU has not recorded a significant allowance for funds used during construction.
The cost of plant retired or disposed of in the normal course of business is deducted from plant accounts and such cost, plus removal expense less salvage value, is charged to the reserve for depreciation. When complete operating units are disposed of, appropriate adjustments are made to the reserve for depreciation and gains and losses, if any, are recognized.
Depreciation and Amortization. Depreciation is provided on the straight-line method over the estimated service lives of depreciable plant. The amounts provided were approximately 3.2% in 2005, 3.1% in 2004 and 3.1% in 2003, of average depreciable plant. Of the amount provided for depreciation at December 31, 2005 and 2004, approximately 0.5% was related to the retirement, removal and disposal costs of long lived assets.
116
Unamortized Debt Expense. Debt expense is capitalized in deferred debits and amortized over the lives of the related bond issues.
Income Taxes. Income taxes are accounted for under SFAS No. 109. In accordance with this statement, deferred tax assets and liabilities are recognized for the future tax consequences attributable to differences between the financial statement carrying amounts of existing assets and liabilities and their respective tax bases, as measured by enacted tax rates that are expected to be in effect in the periods when the deferred tax assets and liabilities are expected to be settled or realized. Significant judgment is required in determining the provision for income taxes, and there are transactions for which the ultimate tax outcome is uncertain. To provide for these uncertainties or exposures, an allowance is maintained for tax contingencies based on management’s best estimate of probable loss. Tax contingencies are analyzed periodically and adjustments are made when events occur to warrant a change. See Note 7, Income Taxes.
Deferred Income Taxes. Deferred income taxes are recognized at currently enacted tax rates for all material temporary differences between the financial reporting and income tax bases of assets and liabilities.
Investment Tax Credits. Investment tax credits resulted from provisions of the tax law that permitted a reduction of KU’s tax liability based on credits for construction expenditures. Deferred investment tax credits are being amortized to income over the estimated lives of the related property that gave rise to the credits.
Revenue Recognition. Revenues are recorded based on service rendered to customers through month-end. KU accrues an estimate for unbilled revenues from each meter reading date to the end of the accounting period based on allocating the daily system net deliveries between billed volumes and unbilled volumes. The allocation is based on a daily ratio of the number of meter reading cycles remaining in the month to the total number of meter reading cycles in each month. Each day’s ratio is then multiplied by each day’s system net deliveries to determine an estimated billed and unbilled volume for each day of the accounting period. The unbilled revenue estimates included in accounts receivable were approximately $47.6 million and $47.5 million at December 31, 2005, and 2004, respectively.
Fuel Costs. The cost of fuel for electric generation is charged to expense as used.
Management’s Use of Estimates. The preparation of financial statements in conformity with generally accepted accounting principles requires management to make estimates and assumptions that affect the reported assets and liabilities and disclosure of contingent items at the date of the financial statements and the reported amounts of revenues and expenses during the reporting period. Accrued liabilities, including legal and environmental, are recorded when they are probable and estimable. Actual results could differ from those estimates.
New Accounting Pronouncements. The following accounting pronouncement was issued that affected KU in 2005:
117
FIN 47
KU adopted FIN 47, effective December 31, 2005. FIN 47 expands the term “conditional asset retirement obligation” as used in SFAS No. 143, to refer to a legal obligation to perform an asset retirement activity in which the timing and/or method of settlement are conditional on a future event that may or may not be within the control of the entity. The obligation to perform the asset retirement activity is unconditional even though uncertainty exists about the timing and/or method of settlement. An entity is required to recognize a liability for the fair value of a conditional asset retirement obligation if the fair value of the liability can be reasonably estimated. The fair value of a liability for the conditional asset retirement obligation should be recognized when incurred; generally, upon acquisition, construction or development and through the normal operation of the asset.
As a result of the implementation of FIN 47, KU recorded additional ARO net assets and liabilities during the fourth quarter of 2005 in the amount of $0.5 million and $4.6 million, respectively. KU also recorded a cumulative effect adjustment in the amount of $4.1 million to reflect the accumulated depreciation and accretion of ARO assets at the transition date less amounts previously accrued under regulatory depreciation. KU recorded offsetting regulatory assets of $4.1 million, pursuant to regulatory treatment prescribed under SFAS No. 71 as the costs of removal are allowed under Kentucky Commission ratemaking.
Had FIN 47 been in effect at the beginning of the 2004 reporting period, KU would have established asset retirement obligations as described in the following table (in millions):
| | 2005 | | 2004 | |
Provision at beginning of the year | | $ | 4.3 | | $ | 4.1 | |
Accretion expense | | 0.3 | | 0.2 | |
Provision at end of the year | | $ | 4.6 | | $ | 4.3 | |
Note 2 – Company Structure
On July 1, 2002, E.ON completed its acquisition of Powergen, including E.ON U.S. (formerly LG&E Energy), for approximately £5.1 billion ($7.3 billion). As a result of the acquisition, E.ON U.S. became a wholly owned subsidiary of E.ON and, as a result, KU also became an indirect subsidiary of E.ON. KU has continued its separate identity and serves customers in Kentucky, Virginia and Tennessee under its existing name. The preferred stock and debt securities of KU were not affected by this transaction and the Company continues to file SEC reports.
Note 3 - Rates and Regulatory Matters
Electric Rate Case
In December 2003, KU filed an application with the Kentucky Commission requesting an adjustment in KU’s electric rates. KU asked for a general adjustment in electric rates based on the twelve month test period ended September 30, 2003. The revenue increase requested was $58.3 million. In June 2004, the Kentucky Commission issued an order approving an increase in the electric base rates of KU of approximately $46.1 million (6.8%). The rate increase took effect on July 1, 2004.
During 2004 and 2005, the AG conducted an investigation of KU, as well as of the Kentucky Commission and its staff, requesting information regarding allegedly improper communications between KU and the Kentucky Commission, particularly during the period covered by the rate case. Concurrently, the AG had filed pleadings with the Kentucky Commission requesting rehearing of the rate case on computational components of the increased rates, including income taxes, cost of removal and depreciation amounts. In August 2004, the
118
Kentucky Commission denied the AG’s rehearing request on the cost of removal and depreciation issues and granted rehearing on the income tax component. The Kentucky Commission further agreed to hold in abeyance further proceedings in the rate case, until the AG filed its investigative report regarding the allegations of improper communication.
In January 2005 and February 2005, the AG filed a motion summarizing its investigative report as containing evidence of improper communications and record-keeping errors by KU in its conduct of activities before the Kentucky Commission or other state governmental entities and forwarded such report to the Kentucky Commission under continued confidential treatment to allow it to consider the report, including its impact, if any, on completing its investigation and any remaining steps in the rate case. To date, KU has neither seen nor requested copies of the report or its contents.
In December 2005, the Kentucky Commission issued an order noting completion of its inquiry, including review of the AG’s investigative report. The order concludes no improper communications occurred during the rate proceeding. The order further established a procedural schedule through the first quarter of 2006 for considering the sole issue for which rehearing was granted: state income tax rates used in calculating the granted rate increase. This issue is estimated at less than $1 million annually. Upon resolution of this issue on rehearing, the initial rate increase order could be subject to judicial appeal.
KU believes no improprieties have occurred in its communications with the Kentucky Commission and has cooperated with the proceedings before the AG and the Kentucky Commission. KU is currently unable to determine the ultimate impact, if any, of, or any possible future actions of the AG or the Kentucky Commission arising out of, the AG’s report and investigation, including whether there will be further actions to appeal, review or otherwise challenge the granted increase in rates.
Regulatory Assets and Liabilities
The following regulatory assets and liabilities were included in KU’s Balance Sheets as of December 31:
(in millions) | | 2005 | | 2004 | |
| | | | | |
VDT costs | | $ | 2.9 | | $ | 14.7 | |
Unamortized loss on bonds | | 11.0 | | 11.4 | |
ARO | | 20.0 | | 12.8 | |
Merger surcredit | | 2.7 | | 3.7 | |
ESM | | — | | 3.1 | |
FAC | | 12.2 | | 9.4 | |
ECR | | 4.2 | | — | |
Deferred storm costs | | 2.8 | | 3.6 | |
Other | | 2.4 | | 2.7 | |
Total regulatory assets | | $ | 58.2 | | $ | 61.4 | |
| | | | | |
Accumulated cost of removal of utility plant | | $ | 280.9 | | $ | 266.8 | |
Deferred income taxes - net | | 23.0 | | 19.3 | |
ECR | | 6.5 | | 1.2 | |
DSM | | 2.1 | | 1.6 | |
Other | | 2.7 | | 2.6 | |
Total regulatory liabilities | | $ | 315.2 | | $ | 291.5 | |
KU currently earns a return on all regulatory assets except for DSM and FAC, both of which are separate recovery mechanisms with recovery within twelve months. Additionally, no current return is earned on the ARO regulatory asset. This regulatory asset will be offset against the associated regulatory liability, ARO asset,
119
and ARO liability at the time the underlying asset is retired. See Note 1, Summary of Significant Accounting Policies.
VDT. During the first quarter of 2001, KU recorded a $64.0 million charge for a workforce reduction program. Primary components of the charge were separation benefits, enhanced early retirement benefits and healthcare benefits. The result of this workforce reduction was the elimination of approximately 300 positions, accomplished primarily through a voluntary enhanced severance program.
In December 2001, the Kentucky Commission issued an order approving a settlement agreement allowing KU to set up a regulatory asset of $54.0 million for the workforce reduction costs and begin amortizing these costs over a five-year period starting in April 2001. Some employees rescinded their participation in the voluntary enhanced severance program and, along with the non-recurring charge of $6.9 million for FERC and Virginia jurisdictions, which thereby decreased the original charge to the regulatory asset from $64.0 million to $54.0 million. The order reduced revenues by approximately $11.0 million through a surcredit on bills to ratepayers over the same five-year period. The surcredit represents savings, net of the amortization of the costs, stipulated by KU and shared 40% with ratepayers, with KU retaining 60% of the net savings.
The five-year VDT amortization period is scheduled to expire in March 2006. As part of the settlement agreements in the rate case, KU was required to file, and did file on September 30, 2005, with the Kentucky Commission a plan for the future ratemaking treatment of the VDT surcredit and costs. The surcredit will remain in effect until the Commission enters an order on the future disposition of VDT-related issues.
On February 27, 2006, the AG, KIUC, LG&E and KU reached a settlement agreement on the future ratemaking treatment of the VDT surcredits and costs and subsequently submitted a joint motion to the Kentucky Commission to approve the unanimous settlement agreement. Under the terms of the settlement agreement, the VDT surcredit will continue at the current level until such time as KU files for a change in electric base rates. The Kentucky Commission held a public hearing in the proceeding on March 21, 2006 and issued an order thereafter approving the settlement agreement.
Unamortized Loss on Bonds. The costs of early extinguishment of debt, including call premiums, legal and other expenses, and any unamortized balance of debt expense are amortized over the life of either replacement debt (in the case of re-financing) or the original life of the extinguished debt.
ARO. A summary of KU’s net ARO assets, regulatory assets, liabilities and cost of removal established under FIN 47 and SFAS No. 143 follows:
(in millions) | | ARO Net
Assets | | ARO
Liabilities | | Regulatory
Assets | | Regulatory
Liabilities | | Accumulated
Cost of Removal | | Cost of Removal
Depreciation | |
As of December 31, 2003 | | $ | 6.9 | | $ | (19.7 | ) | $ | 11.3 | | $ | (1.2 | ) | $ | 2.4 | | $ | 0.3 | |
ARO accretion | | — | | (1.3 | ) | 1.3 | | — | | — | | — | |
ARO depreciation | | (0.2 | ) | — | | 0.2 | | — | | — | | — | |
Removal cost incurred | | — | | — | | — | | — | | — | | — | |
Cost of removal depreciation | | — | | — | | — | | (0.2 | ) | — | | 0.2 | |
As of December 31, 2004 | | 6.7 | | (21.0 | ) | 12.8 | | (1.4 | ) | 2.4 | | 0.5 | |
FIN 47 net asset additions | | 0.5 | | (4.6 | ) | 4.1 | | — | | — | | — | |
ARO accretion | | — | | (1.4 | ) | 1.4 | | — | | — | | — | |
ARO depreciation | | (1.7 | ) | — | | 1.7 | | — | | — | | — | |
Removal cost incurred | | — | | 0.2 | | — | | — | | — | | — | |
Cost of removal depreciation | | — | | — | | — | | (0.3 | ) | — | | 0.3 | |
As of December 31, 2005 | | $ | 5.5 | | $ | (26.8 | ) | $ | 20.0 | | $ | (1.7 | ) | $ | 2.4 | | $ | 0.8 | |
Pursuant to regulatory treatment prescribed under SFAS No. 71, an offsetting regulatory credit was recorded in
120
Depreciation and amortization in the income statement of $3.1 million in 2005 and $1.5 million in 2004 for the ARO accretion and depreciation expense. KU AROs are primarily related to the final retirement of assets associated with generating units. For assets associated with AROs, the removal cost accrued through depreciation under regulatory accounting is established as a regulatory asset or liability pursuant to regulatory treatment prescribed under SFAS No. 71. For the years ended December 31, 2005 and 2004, KU recorded $0.3 million and $0.2 million, respectively, in depreciation expense related to the cost of removal of ARO related assets. An offsetting regulatory liability was established pursuant to regulatory treatment prescribed under SFAS No. 71.
KU transmission and distribution lines largely operate under perpetual property easement agreements which do not generally require restoration upon removal of the property. Therefore, under SFAS No. 143, no material asset retirement obligations are recorded for transmission and distribution assets.
Merger Surcredit. As part of the LG&E Energy merger with KU Energy in 1998, KU estimated non-fuel savings over a ten-year period following the merger. Costs to achieve these savings were deferred and amortized over a five-year period pursuant to regulatory orders. In approving the merger, the Kentucky Commission adopted KU’s proposal to reduce its retail customers’ bills based on one-half of the estimated merger-related savings, net of deferred and amortized amounts, over a five-year period. The surcredit mechanism provides that 50% of the net non-fuel cost savings estimated to be achieved from the merger be provided to ratepayers through a monthly bill credit, and 50% be retained by KU and LG&E, over a five-year period. The surcredit was allocated 53% to KU and 47% to LG&E. In that same order, the Commission required LG&E and KU, after the end of the five-year period, to present a plan for sharing with ratepayers the then-projected non-fuel savings associated with the merger. The Companies submitted this filing in January 2003, proposing to continue to share with ratepayers, on a 50%/50% basis, the estimated fifth-year gross level of non-fuel savings associated with the merger. In October 2003, the Kentucky Commission issued an order approving a settlement agreement reached with the parties in the case. KU’s merger surcredit will remain in place for another five-year term beginning July 1, 2003 and the merger savings will continue to be shared 50% with ratepayers and 50% with shareholders.
ESM. Prior to 2004, KU’s Kentucky retail electric rates were subject to an ESM. The ESM, initially in place for three years beginning in 2000, set an upper (12.5%) and lower (10.5%) limit for rate of return on equity. If earnings were above the upper limit, the excess earnings were shared 40% with ratepayers and 60% with shareholders; if earnings were below the lower limit, the earnings deficiency was recovered 40% from ratepayers and 60% from shareholders. By order of the Kentucky Commission, rate changes prompted by the ESM filing went into effect in April of each year subject to a balancing adjustment in successive periods. There is no ESM for Virginia retail electric rates.
In November 2002, KU filed a revised ESM tariff which proposed continuance of the existing ESM through December 2005. In addition, the Kentucky Commission initiated a focused management audit to review the ESM plan and reassess its reasonableness. KU filed its final 2003 ESM calculations with the Kentucky Commission on March 1, 2004, and applied for recovery of $16.2 million. Based upon estimates, KU previously accrued $9.3 million for the 2003 ESM as of December 31, 2003. In June 2004, the Kentucky Commission issued an order largely accepting proposed settlement agreements by KU and all intervenors regarding the ESM. Under the ESM settlements, KU continued to collect approximately $16.2 million of previously requested 2003 ESM revenue amounts through March 2005. As part of the settlement, the parties agreed to a termination of the ESM mechanism relating to all periods after 2003.
FAC. KU’s retail electric rates contain an FAC, whereby increases or decreases in the cost of fuel for electric
121
generation are reflected in the rates charged to retail electric customers. In January 2003, the Kentucky Commission reviewed KU’s FAC for the six month period ended October 31, 2001. The Kentucky Commission ordered KU to reduce its fuel costs for purposes of calculating its FAC by $0.7 million. At issue was the purchase of approximately 102,000 tons of coal from Western Kentucky Energy Corporation, a non-regulated affiliate, for use at KU’s Ghent facility. The Kentucky Commission further ordered that an independent audit be conducted to examine operational and management aspects of both KU’s and LG&E’s fuel procurement functions. A final report was issued in February 2004. The report’s recommendations related to documentation and process improvements. Management Audit Action Plans were agreed upon by KU and the Kentucky Commission Staff in the second quarter of 2004. KU filed its first Audit Progress Report with the Kentucky Commission Staff in November 2004. A second Audit Progress Report was filed in May 2005. The third Audit Progress Report was filed in December 2005. In January 2006, the Kentucky Commission staff informed KU and LG&E that reporting on all of the original recommendations, but one, has been concluded. KU and LG&E are to file another Audit Progress Report on the remaining open recommendation on August 15, 2006.
The Kentucky Commission requires public hearings at six-month intervals to examine past fuel adjustments, and at two-year intervals to review past operations of the fuel clause and transfer of the then current fuel adjustment charge or credit to the base charges. KU also employs an FAC mechanism for Virginia customers that uses an average fuel cost factor based primarily on projected fuel costs. The fuel cost factor may be adjusted annually for over or under collections of fuel costs from the previous year. No significant issues have been identified as a result of these reviews.
In December 2004, the Kentucky Commission initiated a two-year review of KU’s past operations of the fuel clause and transfer of fuel costs from the fuel adjustment clause to base rates. A public hearing on the matter was held on March 17, 2005. An order by the Kentucky Commission was issued in May 2005 approving KU’s base fuel component of 18.10 mills/kwh as filed. Revised tariff schedules for KU were filed to reflect the change in the base fuel component.
KU employs a Levelized Fuel Factor mechanism for Virginia customers that uses an average fuel cost factor based primarily on projected fuel costs. The fuel cost factor may be adjusted annually for over- or under- collections of fuel costs from the previous year. In February 2005, KU filed with the Virginia Commission an application seeking approval of an increase in its fuel cost factor to reflect higher fuel costs incurred. KU implemented the increased fuel cost factor with April 2005 billings and the Virginia Commission issued its final order approving the increase on April 29, 2005.
On February 15, 2006, KU filed with the Virginia Commission an application seeking approval of an increase in its fuel cost factor to reflect higher fuel costs incurred during 2005 and anticipated to be incurred in 2006.
On July 7, 2005, the Kentucky Commission initiated the six-month review of the KU fuel adjustment clause for the period of November 2004 through April 2005. During November 2005, the Kentucky Commission approved the charges and credits billed and the fuel procurement practices of KU.
On December 27, 2005, the Kentucky Commission initiated the six-month review of the KU fuel adjustment clause for the period of May 2005 through October 2005. Initial discovery was completed on January 17, 2006, and a hearing was held March 16, 2006. KU anticipates Kentucky Commission approval of the charges and credits billed and the fuel procurement practices of KU during the second quarter of 2006.
DSM. KU’s rates contain a DSM provision. The provision includes a rate mechanism that provides for concurrent recovery of DSM costs and provides an incentive for implementing DSM programs. The provision allows KU to recover revenues from lost sales associated with the DSM programs based on program plan
122
engineering estimates and post-implementation evaluation.
Deferred Storm Costs. Based on an order from the Kentucky Commission in September 2004, KU reclassified from maintenance expense to a regulatory asset, $4.0 million related to costs not reimbursed from the 2003 ice storm. These costs will be amortized through June 2009. KU earns a return of these amortized costs, which are included in KU’s jurisdictional operating expenses.
Accumulated Cost of Removal of Utility Plant. As of December 31, 2005 and 2004, KU has segregated the cost of removal, embedded in accumulated depreciation, of $280.9 million and $266.8 million, respectively, in accordance with FERC Order No. 631. For reporting purposes in the balance sheets, KU has presented this cost of removal as a regulatory liability pursuant to SFAS No. 71.
Deferred Income Taxes - Net. Deferred income taxes represent the future income tax effects of recognizing the regulatory assets and liabilities in the income statement. Deferred income taxes are recognized at currently enacted tax rates for all material temporary differences between the financial reporting and income tax bases of assets and liabilities.
ECR. KU’s retail rates contain an ECR surcharge which recovers costs incurred by KU that are required to comply with the Clean Air Act and other environmental regulations. In March 2003, the Kentucky Commission initiated a series of six-month and two-year reviews of the operation of KU’s Environmental Surcharge. A final order was issued in October 2003, resolving all outstanding issues related to over-recovery from customers and under-recovery of allowed O&M expense. The Commission found that KU had over-collected a net $6.0 million from customers and ordered the refund to occur through adjustments to the calculation of the monthly surcharge billing factor over the subsequent 12-month period. The Kentucky Commission further ordered KU to roll $17.9 million of environmental assets into base rates and make corresponding adjustments to the monthly environmental surcharge filings to reflect that portion of environmental rate base now included in base rates going forward. The rates of return for KU’s 1994 and post-1994 plans were reset to 1.24% and 12.60%, respectively.
In June 2004, the Kentucky Commission issued an order approving a settlement agreement that, among other things, revised the rate of return for KU’s post-1994 plan to 11.19%, with an 11% return on common equity. The order also approved the elimination of KU’s 1994 Plan for its ECR billing mechanism, with all remaining costs associated with that plan to be included in their entirety in base rates.
In December 2004, KU filed an application with the Kentucky Commission for approval of a CCN to construct new SO2 control technology (FGDs) at the Ghent and Brown stations, and to amend its compliance plan to allow recovery of costs associated with new and additional environmental compliance facilities. The estimated capital cost of the additional facilities over the next three years is approximately $680.0 million, of which approximately $560.0 million is related to the FGDs at Ghent and Brown. Hearings in these cases occurred in May 2005 and final orders were issued in June 2005, granting approval of the CCN and amendments to KU’s compliance plan.
Other Regulatory Matters
MISO. The MISO is a non-profit independent transmission system operator that controls approximately 97,000 miles of transmission lines over 947,000 square miles in 15 northern Midwest states and one Canadian province. The MISO operates the regional power grid and wholesale electricity market in an effort to optimize efficiency and safeguard reliability in accordance with federal energy policy.
123
KU is now involved in proceedings with the Kentucky Commission and the FERC seeking the authority to exit the MISO. A timeline of events regarding the MISO and various proceedings is as follows:
• September 1998 – The FERC granted conditional approval for the formation of the MISO. KU was a founding member.
• October 2001 – The FERC ordered that all bundled retail loads and grandfathered wholesale loads of each member transmission owner be included in the calculation of the MISO “cost adder,” the Schedule 10 charges designed to recover the MISO’s cost of operation, including start-up capital (debt) costs. KU and several owners opposed the FERC order and filed suit with the United States Court of Appeals.
• February 2002 – The MISO began commercial operations.
• February 2003 – The FERC reaffirmed its position on the Schedule 10 charges and the order was subsequently upheld by the U.S. Court of Appeals.
• July 2003 – The Kentucky Commission opened an investigation into KU’s MISO membership. Testimony was filed by KU that supported an exit from the MISO, under certain conditions. This proceeding remains open.
• August 2004 – The MISO filed its FERC-required TEMT. KU and other owners filed opposition to certain conditions of the TEMT and sought to delay the implementation. Such opposition was denied by the FERC.
• December 2004 – KU provided the MISO its required one-year notice of intent to exit the grid.
• April 2005 – The MISO implemented its day-ahead and real-time market (MISO Day 2), including a congestion management system.
• October 2005 – KU filed documents with the FERC seeking authority to exit the MISO. This proceeding remains open.
• November 2005 – KU requested a Kentucky Commission order authorizing the transfer of functional control of its transmission facilities from the MISO to KU, for the purpose of exiting the MISO. The request stated that the TVA would have control to the extent necessary to act as the Company’s Reliability Coordinator and for the SPP to perform its function as the Company’s Independent Transmission Organization. This proceeding remains open.
Based on various financial analyses performed internally, in response to the July 2003 Kentucky Commission investigation into MISO membership, and particularly in light of the financial impacts following MISO’s implementation of the new day-ahead and real-time markets, KU determined that the costs of MISO membership, both now and in the future, outweigh the benefits.
Should KU be allowed to exit the MISO, an aggregate exit fee of up to $41.0 million (approximately $25.0 million for KU and $16.0 million for LG&E) could be imposed, depending on the timing and circumstances of the actual exit. KU estimates that, over time, such fee could be more than offset by savings resulting from exit from the MISO. Conversely, should KU be ordered to remain in the MISO, costs are expected to continue to exceed benefits, currently without mechanisms for immediate recovery.
124
On March 17, 2006, the FERC issued an order conditionally approving the request of KU and LG&E to exit the MISO. For further discussion, see Note 15, Subsequent Events.
Market-Based Rate Authority. Since April 2004, the FERC has initiated proceedings to modify its methods which assess generation market power and has established more stringent interim market screen tests. During 2005, in connection with KU’s and LG&E’s tri-annual market-based rate tariff renewals, although disputed by KU and LG&E, the FERC continued to contend that KU and LG&E failed such market screens in certain regions. In January 2006, in order to resolve the matter, KU and LG&E submitted proposed tariff schedules to the FERC containing a mitigation mechanism with respect to applicable power sales into an adjacent western Kentucky control area where a non-utility affiliate company is active. Prices for such sales will be capped at a relevant MISO power pool index price. Should KU and LG&E exit the MISO, they could additionally be deemed to have market power in their own joint control area, potentially requiring a similar mitigation mechanism for power sales into such region. KU and LG&E cannot predict the ultimate impact of the current or potential mitigation mechanisms on their future wholesale power revenues.
IRP. In April 2005, KU and LG&E filed their 2005 Joint IRP with the Kentucky Commission. The IRP provides historical and projected demand, resource and financial data, and other operating performance and system information. The AG and the KIUC were granted intervention in the IRP proceeding. The Kentucky Commission issued its staff report on February 15, 2006, with no substantive issues noted and closed the case by Order dated February 24, 2006.
Kentucky Commission Administrative Case for System Adequacy. In June 2001, Kentucky’s Governor issued Executive Order 2001-771, which directed the Kentucky Commission to review and study issues relating to the need for and development of new electric generating capacity in Kentucky. In response to that Executive Order, in July 2001, the Kentucky Commission opened Administrative Case No. 387 to review the adequacy of Kentucky’s generation capacity and transmission system. Specifically, the items reviewed were the appropriate level of reliance on purchased power, the appropriate reserve margins to meet existing and future electric demand, the impact of spikes in natural gas prices on electric utility planning strategies, and the adequacy of Kentucky’s electric transmission facilities. In December 2001, the Kentucky Commission issued an order in which it noted that KU is responsibly addressing the long-term supply needs of native load customers and that current reserve margins are appropriate. However, due to the rapid pace of change in the industry, the order also requires KU to provide an annual assessment of supply resources, future demand, reserve margin and the need for new resources.
Regarding the transmission system, the Kentucky Commission concluded that the transmission system within Kentucky can reliably serve native load and a significant portion of the proposed new unregulated power plants. However, it will not be able to handle the volume of transactions envisioned by the FERC without future upgrades, the costs of which should be borne by those for whom the upgrades are required.
The Kentucky Commission pledged to continue to monitor all relevant issues and advocate Kentucky’s interests at all opportunities.
EPAct 2005. The EPAct 2005 was enacted on August 8, 2005. Among other matters, this comprehensive legislation contains provisions mandating improved electric reliability standards and performance; providing economic and other incentives relating to transmission, pollution control and renewable generation assets; increasing funding for clean coal generation incentives; repealing PUHCA 1935; enacting PUHCA 2005 and expanding FERC jurisdiction over public utility holding companies and related matters via the FPA and PUHCA 2005.
125
The FERC was directed by the EPAct 2005 to adopt rules to address many areas previously regulated by the other agencies under other statutes, including PUHCA 1935. The FERC is in various stages of rulemaking on these issues and KU is monitoring these rulemaking activities and actively participating in these and other rulemaking proceedings. KU is still evaluating the potential impacts of the EPAct 2005 and the associated rulemakings and cannot predict what impact the EPAct 2005, and any such rulemakings, will have on its operations or financial position.
Kentucky Commission Strategic Blueprint. In February 2005, Kentucky’s Governor signed an executive order directing the Kentucky Commission, in conjunction with the Commerce Cabinet and the Environmental and Public Protection Cabinet, to ‘develop a Strategic Blueprint for the continued use and development of electric energy.’ This Strategic Blueprint is designed to promote future investment in electric infrastructure for the Commonwealth of Kentucky, to protect Kentucky’s low-cost electric advantage, to maintain affordable rates for all Kentuckians and to preserve Kentucky’s commitment to environmental protection. In March 2005, the Kentucky Commission established Administrative Case No. 2005-00090 to collect information from all jurisdictional utilities in Kentucky, including KU, pertaining to Kentucky electric generation, transmission and distribution systems. KU responded to the Kentucky Commission’s first set of data requests at the end of March 2005 and to a second set of data requests in May 2005. The Commission held a Technical Conference on June 14, 2005, in which all parties participated in a panel discussion. A final report was provided on August 22, 2005 from the Kentucky Commission to the Governor. The Kentucky Commission issued an order and closed this proceeding on September 15, 2005. Some of the key findings from the report are:
• Kentucky’s electric utilities currently have adequate infrastructure as well as adequate planning to serve the needs of customers through 2025;
• Kentucky will need 7,000 megawatts of additional generating capacity by 2025;
• Kentucky’s electric transmission is reliable but intrastate power transfers are limited;
• Additional incentives to use renewable energy and educate the public on the benefits of renewables are needed;
• Financial incentives should be available for coal purification and other clean air technologies;
• A cautious approach should be taken toward deregulation; and
• Kentucky must be involved in federal decisions that impact its status as a low cost energy provider.
Lock 7. On September 27, 2005, KU filed an application with the FERC seeking authority to transfer the operating license for the Lock 7 Hydroelectric Station, a 2.04 Mw facility, to the Lock 7 Hydro Partners, LLC, an unaffiliated third party, for less than $1 million. On September 28, 2005, KU filed an application with the Kentucky Commission seeking: 1) a determination that Kentucky Commission approval is not required for the transfer of the Lock 7 Hydroelectric Station or 2) Kentucky Commission approval, pursuant to a Kentucky Commission order in case No. 2005-00405, to sell any real property associated with the Lock 7 Hydroelectric Station to Lock 7 Hydro Partners, LLC. Approval from the FERC to transfer the license was received on November 23, 2005. Authority from the Kentucky Commission to transfer the license was granted on December 22, 2005. The license was transferred to the Lock 7 Hydro Partners, LLC on December 29, 2005.
Note 4 - Financial Instruments
The cost and estimated fair values of KU’s non-trading financial instruments as of December 31, 2005, and 2004 follow:
126
| | 2005 | | 2004 | |
(in millions) | | Carrying
Value | | Fair
Value | | Carrying
Value | | Fair
Value | |
| | | | | | | | | |
Long-term debt (including current portion) | | $ | 363.6 | | $ | 363.5 | | $ | 393.2 | | $ | 393.5 | |
Long-term debt from affiliate (including current portion) | | $ | 383.0 | | $ | 382.4 | | $ | 333.0 | | $ | 337.0 | |
Interest-rate swaps - asset | | $ | 0.8 | | $ | 0.8 | | $ | 6.1 | | $ | 6.1 | |
| | | | | | | | | | | | | | | |
All of the above valuations reflect prices quoted by exchanges except for the swaps and intercompany loans. The fair values of the swaps and intercompany loans reflect price quotes from dealers or amounts calculated using accepted pricing models. The fair values of cash and cash equivalents, accounts receivable, accounts payable and notes payable are substantially the same as their carrying values.
Interest Rate Swaps. KU uses over-the-counter interest rate swaps to hedge exposure to market fluctuations in certain of its debt instruments. Pursuant to Company policy, use of these financial instruments is intended to mitigate risk, earnings and cash flow volatility and is not speculative in nature. Management has designated all of the interest rate swaps as hedge instruments. Financial instruments designated as fair value hedges and the underlying hedged items are periodically marked to market with the resulting net gains and losses recorded directly into net income. Upon termination of any fair value hedge, the resulting gain or loss is recorded into net income. Financial instruments designated as cash flow hedges have resulting gains and losses recorded within other comprehensive income and stockholders’ equity.
KU was party to various interest rate swap agreements with aggregate notional amounts of $53.0 million and $103.0 million as of December 31, 2005 and December 31, 2004, respectively. Under these swap agreements, KU paid variable rates based on LIBOR averaging 6.41% and 3.29%, and received fixed rates averaging 7.92% and 7.74% at December 31, 2005 and 2004, respectively. The swap agreement in effect at December 31, 2005 has been designated as a fair value hedge and matures in 2007. The fair value designation was assigned because the underlying fixed rate debt has a firm future commitment. For 2005 and 2004, the effect of marking these financial instruments and the underlying debt to market resulted in pre-tax gains of $0.8 million and $2.5 million, respectively, recorded in interest expense.
Interest rate swaps hedge interest rate risk on the underlying debt under SFAS No. 133, as amended, in addition to swaps being marked to market, the item being hedged must also be marked to market, consequently at December 31, 2005 and 2004, KU’s debt reflects a mark-to-market adjustment of $2.0 million and $8.2 million, respectively.
In June 2005, a KU interest rate swap with a notional amount of $50.0 million was terminated by the counterparty pursuant to the terms of the swap agreement. KU received a payment of $1.9 million in consideration for the termination of the agreement. KU also called the underlying debt (First Mortgage Bond Series R) and paid a call premium of $1.9 million. No impact on earnings occurred as a result of the bond call and related swap termination.
In February 2004, KU terminated the swap it had in place at December 31, 2003 related to the Series 9 pollution control bonds. The notional amount of the terminated swap was $50.0 million and KU received a payment of $2.0 million as part of the termination. The swap was terminated because it was no longer an effective hedge of the underlying bond.
127
Energy Risk Management Activities. KU conducts energy trading and risk management activities to maximize the value of power sales from physical assets it owns. Certain energy trading activities are accounted for on a mark-to-market basis in accordance with SFAS No. 133, as amended. Wholesale sales of excess asset capacity are treated as normal sales under SFAS No. 133, as amended and are not marked to market.
No changes to valuation techniques for energy trading and risk management activities occurred during 2005 or 2004. Changes in market pricing, interest rate and volatility assumptions were made during both years. All contracts outstanding at December 31, 2005, have a maturity of less than one year and are valued using prices actively quoted for proposed or executed transactions or quoted by brokers.
KU maintains policies intended to minimize credit risk and revalues credit exposures daily to monitor compliance with those policies. At December 31, 2005, 100% of the trading and risk management commitments were with counterparties rated BBB-/Baa3 equivalent or better.
KU hedges the price volatility of its forecasted electric off-system sales with the sales of market-traded electric forward contracts for periods of less than one year. These electric forward sales have been designated as cash flow hedges and are not speculative in nature. Gains or losses on these instruments, to the extent that the hedging relationship has been effective, are deferred in other comprehensive income. Gains and losses resulting from ineffectiveness are shown in KU’s Statements of Income in other (income) – net. Upon completion of the underlying hedge transaction, the amount recorded in other comprehensive income is recorded in earnings. No material pre-tax gains and losses resulted from these cash flow hedges in 2005, 2004 and 2003. See Note 13, Accumulated Other Comprehensive Income.
Accounts Receivable Securitization. KU terminated its accounts receivable securitization program in January 2004, and in May 2004, KU dissolved its inactive accounts receivable securitization-related subsidiary, KU R. No material pre-tax gains and losses resulted from the sale of the receivables in 2004 and 2003. KU’s net cash flows from KU R were reduced by $50.1 million and $0.1 million for 2004 and 2003, respectively. The allowance for doubtful accounts associated with the eligible securitized receivables at December 31, 2003, was $0.5 million. This allowance was based on historical experience of KU. Each securitization facility contained a fully funded reserve for uncollectible receivables. KU was able to terminate this program at any time without penalty.
Note 5 - Concentrations of Credit and Other Risk
Credit risk represents the accounting loss that would be recognized at the reporting date if counterparties failed to perform as contracted. Concentrations of credit risk (whether on- or off-balance sheet) relate to groups of customers or counterparties that have similar economic or industry characteristics that would cause their ability to meet contractual obligations to be similarly affected by changes in economic or other conditions.
KU’s customer receivables and revenues arise from deliveries of electricity to approximately 495,000 customers in over 600 communities and adjacent suburban and rural areas in 77 counties in central, southeastern and western Kentucky, to approximately 30,000 customers in five counties in southwestern Virginia and 5 customers in Tennessee. For the years ended December 31, 2005 and 2004, 100% of total utility revenue was derived from electric operations.
In August 2003, KU and its employees represented by IBEW Local 2100 entered into a three-year collective bargaining agreement. KU and its employees represented by USWA Local 9447-01 entered into a three-year collective bargaining agreement effective August 2005 with authorized annual wage reopeners. The employees represented by these two bargaining units comprise approximately 16% of KU’s workforce.
128
Note 6 - Pension Plans and Other Postretirement Benefit Plans
KU has both funded and unfunded non-contributory defined benefit pension plans and other post-retirement benefit plans that together cover substantially all of its employees. The healthcare plans are contributory with participants’ contributions adjusted annually. KU uses December 31 as the measurement date for its plans.
Obligations and Funded Status. The following table provides a reconciliation of the changes in the plan’s benefit obligations and fair value of assets over the three-year period ending December 31, 2005, and a statement of the funded status as of December 31, 2005, 2004 and 2003 for KU’s sponsored defined benefit:
(in millions) | | 2005 | | 2004 | | 2003 | |
| | | | | | | |
Pension Plans: | | | | | | | |
Change in projected benefit obligation | | | | | | | |
Projected benefit obligation at beginning of year | | $ | 290.7 | | $ | 257.7 | | $ | 247.7 | |
Service cost | | 5.1 | | 3.7 | | 3.0 | |
Interest cost | | 16.2 | | 16.0 | | 15.9 | |
Plan amendment | | — | | — | | 0.1 | |
Change due to transfers | | (0.5 | ) | 0.1 | | (0.3 | ) |
Benefits paid | | (19.6 | ) | (19.6 | ) | (22.6 | ) |
Actuarial (gain) or loss and other | | 26.6 | | 32.8 | | 13.9 | |
Projected benefit obligation at end of year | | $ | 318.5 | | $ | 290.7 | | $ | 257.7 | |
| | | | | | | |
Change in plan assets | | | | | | | |
Fair value of plan assets at beginning of year | | $ | 248.2 | | $ | 201.1 | | $ | 178.6 | |
Actual return on plan assets | | 20.7 | | 24.6 | | 36.5 | |
Employer contributions | | — | | 43.4 | | 10.2 | |
Change due to transfers | | (0.4 | ) | — | | (0.2 | ) |
Benefits paid | | (19.6 | ) | (19.6 | ) | (22.6 | ) |
Administrative expenses | | (1.4 | ) | (1.3 | ) | (1.4 | ) |
Fair value of plan assets at end of year | | $ | 247.5 | | $ | 248.2 | | $ | 201.1 | |
| | | | | | | |
Reconciliation of funded status | | | | | | | |
Funded status | | $ | (71.0 | ) | $ | (42.5 | ) | $ | (56.6 | ) |
Unrecognized actuarial (gain) or loss | | 80.8 | | 56.2 | | 27.9 | |
Unrecognized transition (asset) or obligation | | (0.1 | ) | (0.2 | ) | (0.4 | ) |
Unrecognized prior service cost | | 7.5 | | 8.3 | | 9.2 | |
Net amount recognized at end of year | | $ | 17.2 | | $ | 21.8 | | $ | (19.9 | ) |
| | | | | | | |
Other Benefits: | | | | | | | |
Change in benefit obligation | | | | | | | |
Benefit obligation at beginning of year | | $ | 100.3 | | $ | 105.8 | | $ | 104.6 | |
Service cost | | 1.5 | | 1.2 | | 0.8 | |
Interest cost | | 4.9 | | 5.8 | | 6.3 | |
Plan amendments | | 0.8 | | — | | — | |
Benefits paid net of retiree contributions | | (5.2 | ) | (6.1 | ) | (7.3 | ) |
Actuarial (gain) or loss | | (7.7 | ) | (6.4 | ) | 1.4 | |
Benefit obligation at end of year | | $ | 94.6 | | $ | 100.3 | | $ | 105.8 | |
| | | | | | | |
Change in plan assets | | | | | | | |
Fair value of plan assets at beginning of year | | $ | 5.9 | | $ | 5.4 | | $ | 8.0 | |
Actual return on plan assets | | 0.7 | | 2.5 | | (0.8 | ) |
Employer contributions | | 7.5 | | 4.4 | | 5.5 | |
Change due to transfers | | — | | (0.2 | ) | — | |
Benefits paid net of retiree contributions | | (5.2 | ) | (6.2 | ) | (7.3 | ) |
Fair value of plan assets at end of year | | $ | 8.9 | | $ | 5.9 | | $ | 5.4 | |
| | | | | | | | | | | |
129
Reconciliation of funded status | | | | | | | |
Funded status | | $ | (85.7 | ) | $ | (94.4 | ) | $ | (100.4 | ) |
Unrecognized actuarial (gain) or loss | | 6.7 | | 14.8 | | 24.0 | |
Unrecognized transition (asset) or obligation | | 7.8 | | 9.0 | | 10.1 | |
Unrecognized prior service cost | | 1.6 | | 1.4 | | 2.2 | |
Net amount recognized at end of year | | $ | (69.6 | ) | $ | (69.2 | ) | $ | (64.1 | ) |
| | | | | | | | | | | |
Amounts Recognized in Statement of Financial Position. The following tables provide the amounts recognized in the balance sheet and information for plans with benefit obligations in excess of plan assets as of December 31, 2005, 2004 and 2003:
(in millions) | | 2005 | | 2004 | | 2003 | |
| | | | | | | |
Pension Plans: | | | | | | | |
Amounts recognized in the balance sheet consisted of: | | | | | | | |
Accrued benefit liability | | $ | (22.0 | ) | $ | (8.7 | ) | $ | (39.0 | ) |
Intangible asset | | 7.5 | | 8.3 | | 9.2 | |
Accumulated other comprehensive income | | 31.7 | | 22.2 | | 9.9 | |
Net amount recognized at year-end | | $ | 17.2 | | $ | 21.8 | | $ | (19.9 | ) |
| | | | | | | |
Increase (decrease) in minimum liability included in other comprehensive income | | $ | 9.5 | | $ | 12.4 | | $ | (7.7 | ) |
| | | | | | | |
Additional year-end information for plans with accumulated benefit obligations in excess of plan assets: | | | | | | | |
Projected benefit obligation | | $ | 318.5 | | $ | 290.7 | | $ | 257.7 | |
Accumulated benefit obligation | | 269.5 | | 256.9 | | 240.1 | |
Fair value of plan assets | | 247.5 | | 248.2 | | 201.1 | |
| | | | | | | |
Other Benefits: | | | | | | | |
Amounts recognized in the balance sheet consisted of: | | | | | | | |
Accrued benefit liability | | $ | (69.6 | ) | $ | (69.2 | ) | $ | (64.1 | ) |
| | | | | | | |
Additional year-end information for plans with benefit obligations in excess of plan assets: | | | | | | | |
Benefit obligation | | $ | 94.6 | | $ | 100.3 | | $ | 105.8 | |
Fair value of plan assets | | 8.9 | | 5.9 | | 5.4 | |
| | | | | | | | | | | |
Components of Net Periodic Benefit Cost. The following table provides the components of net periodic benefit cost for the plans for 2005, 2004 and 2003:
(in millions) | | 2005 | | 2004 | | 2003 | |
| | | | | | | |
Pension Plans: | | | | | | | |
Components of net periodic benefit cost | | | | | | | |
Service cost | | $ | 5.1 | | $ | 3.7 | | $ | 3.0 | |
Interest cost | | 16.2 | | 16.0 | | 15.9 | |
Expected return on plan assets | | (19.6 | ) | (19.6 | ) | (14.9 | ) |
Amortization of transition (asset) or obligation | | (0.1 | ) | (0.1 | ) | (0.1 | ) |
Amortization of prior service cost | | 0.8 | | 0.9 | | 0.9 | |
Amortization of actuarial (gain) or loss | | 2.2 | | 0.8 | | 1.2 | |
Net periodic benefit cost | | $ | 4.6 | | $ | 1.7 | | $ | 6.0 | |
| | | | | | | |
Other Benefits: | | | | | | | |
Components of net periodic benefit cost | | | | | | | |
| | | | | | | | | | | |
130
Service cost | | $ | 1.5 | | $ | 1.2 | | $ | 0.8 | |
Interest cost | | 4.9 | | 5.8 | | 6.3 | |
Expected return on plan assets | | (0.6 | ) | (0.4 | ) | (0.3 | ) |
Amortization of prior service cost | | 0.7 | | 0.7 | | 0.7 | |
Amortization of transitional (asset) or obligation | | 1.1 | | 1.1 | | 1.1 | |
Amortization of actuarial (gain) or loss | | 0.3 | | 1.0 | | 1.2 | |
Net periodic benefit cost | | $ | 7.9 | | $ | 9.4 | | $ | 9.8 | |
The assumptions used in the measurement of KU’s pension benefit obligation are shown in the following table:
| | 2005 | | 2004 | | 2003 | |
| | | | | | | |
Weighted-average assumptions as of December 31: | | | | | | | |
Discount rate | | 5.50 | % | 5.75 | % | 6.25 | % |
Rate of compensation increase | | 5.25 | % | 4.50 | % | 3.00 | % |
The assumptions used in the measurement of KU’s net periodic benefit cost are shown in the following table:
| | 2005 | | 2004 | | 2003 | |
| | | | | | | |
Discount rate | | 5.75 | % | 6.25 | % | 6.75 | % |
Expected long-term return on plan assets | | 8.25 | % | 8.50 | % | 9.00 | % |
Rate of compensation increase | | 4.50 | % | 3.50 | % | 3.75 | % |
To develop the expected long-term rate of return on assets assumption, KU considered the current level of expected returns on risk free investments (primarily government bonds), the historical level of the risk premium associated with the other asset classes in which the portfolio is invested and the expectations for future returns of each asset class. The expected return for each asset class was then weighted based on the target asset allocation to develop the expected long-term rate of return on assets assumption for the portfolio.
Assumed Healthcare Cost Trend Rates. For measurement purposes, an 11.0% annual increase in the per capita cost of covered healthcare benefits was assumed for 2005. The rate was assumed to decrease gradually to 5.0% by 2015 and remain at that level thereafter.
Assumed healthcare cost trend rates have a significant effect on the amounts reported for the healthcare plans. A 1% change in assumed healthcare cost trend rates would have the following effects:
(in millions) | | 1% Decrease | | 1% Increase | |
| | | | | |
Effect on total of service and interest cost components for 2005 | | $ | (0.4 | ) | $ | 0.4 | |
Effect on year-end 2005 postretirement benefit obligations | | $ | (5.6 | ) | $ | 6.4 | |
Expected Future Benefit Payments. The following list provides the amount of expected future benefit payments, which reflect expected future service, as appropriate:
(in millions) | | Pension
Plans | | Other
Benefits | |
| | | | | |
2006 | | $ | 19.3 | | $ | 6.8 | |
2007 | | $ | 18.8 | | $ | 7.2 | |
2008 | | $ | 18.2 | | $ | 7.4 | |
2009 | | $ | 17.7 | | $ | 7.7 | |
2010 | | $ | 17.3 | | $ | 7.9 | |
2011-2015 | | $ | 85.3 | | $ | 41.4 | |
131
Estimated Gross Amount of Medicare Subsidy Receipts. The following list provides the amount of subsidy receipts which are expected to be received.
(in millions) | | Other
Benefits | |
2006 | | $ | 0.5 | |
2007 | | $ | 0.5 | |
2008 | | $ | 0.6 | |
2009 | | $ | 0.6 | |
2010 | | $ | 0.6 | |
2011-2015 | | $ | 3.3 | |
Plan Assets. The following table shows KU’s weighted-average asset allocation by asset category at December 31:
| | Target Range | | 2005 | | 2004 | | 2003 | |
Pension Plans: | | | | | | | | | |
Equity securities | | 45% - 75 | % | 57 | % | 66 | % | 66 | % |
Debt securities | | 30% - 50 | % | 42 | % | 33 | % | 33 | % |
Other | | 0% - 10 | % | 1 | % | 1 | % | 1 | % |
Totals | | | | 100 | % | 100 | % | 100 | % |
| | | | | | | | | |
Other Benefits: | | | | | | | | | |
Equity securities | | — | % | — | % | — | % | — | % |
Debt securities | | 100 | % | 100 | % | 100 | % | 100 | % |
| | 100 | % | 100 | % | 100 | % | 100 | % |
The investment policy of the pension plans was developed in conjunction with financial consultants, investment advisors and legal counsel. The goal of the investment policy is to preserve the capital of the fund and maximize investment earnings. The return objective is to exceed the benchmark return for the policy index comprised of the following: Russell 3000 Index, MSCI-EAFE Index, Lehman Aggregate, and Lehman Long Duration Gov/Corporate Bond Index in proportions equal to the targeted asset allocation.
Evaluation of performance focuses on a long-term investment time horizon of at least three to five years or a complete market cycle. The assets of the pension plans are broadly diversified within different asset classes (equities, fixed income securities and cash equivalents).
To minimize the risk of large losses in a single asset class, no more than 5% of the portfolio will be invested in the securities of any one issuer with the exclusion of the U.S. government and its agencies. The equity portion of the fund is diversified among the market’s various subsections to diversify risk, maximize returns and avoid undue exposure to any single economic sector, industry group or individual security. The equity subsectors include, but are not limited to, growth, value, small capitalization and international.
In addition, the overall fixed income portfolio may have an average weighted duration, or interest rate sensitivity which is within +/- 20% of the duration of overall fixed income benchmark. Foreign bonds in the aggregate shall not exceed 10% of the total fund. The portfolio may include a limited investment of up to 20% in below investment grade securities provided that the overall average portfolio quality remains “AA” or better. The below investment grade securities include, but are not limited to, medium-term notes, corporate debt, non-dollar and emerging market debt and asset backed securities. The cash investments should be in securities that either are of short maturities (not to exceed 180 days) or readily marketable with modest risk.
Derivative securities are permitted only to improve the portfolio’s risk/return profile, to modify the portfolio’s duration or to reduce transaction costs and must be used in conjunction with underlying physical assets in the
132
portfolio. Derivative securities that involve speculation, leverage, interest rate anticipation, or any undue risk whatsoever are not deemed appropriate investments.
The investment objective for the post retirement benefit plan is to provide current income consistent with stability of principal and liquidity while maintaining a stable net asset value of $1.00 per share. The post retirement funds are invested in a prime cash money market fund that invests primarily in a portfolio of short-term, high-quality fixed income securities issued by banks, corporations and the U.S. government.
Contributions. KU made discretionary contributions to the pension plan of $10.2 million in 2003 and $43.4 million in 2004. KU did not make a contribution to the pension plan in 2005.
FSP 106-2. FSP 106-2, which provided guidance on accounting for subsidies provided under the Medicare Act, was effective for the first interim or annual period beginning after June 15, 2004. The following table reflects the impact of the subsidy in 2004:
(in millions) | | | |
Reduction in APBO | | $ | 3.3 | |
| | | |
Effect of the subsidy on the measurement of the net periodic postretirement benefit cost: | | | |
| | | |
Amortization of the actuarial experience gain/(loss) | | $ | 0.3 | |
Reduction in service cost due to the subsidy | | — | |
Resulting reduction in interest cost on the APBO | | 0.2 | |
Total | | $ | 0.5 | |
Thrift Savings Plans. KU has a thrift savings plan under section 401(k) of the Internal Revenue Code. Under the plan, eligible employees may defer and contribute to the plan a portion of current compensation in order to provide future retirement benefits. KU makes contributions to the plan by matching a portion of the employee contributions. The costs of this matching were approximately $1.5 million for 2005, $1.5 million for 2004 and $1.9 million for 2003.
Note 7 - Income Taxes
Components of income tax expense are shown in the table below:
(in millions) | | 2005 | | 2004 | | 2003 | |
| | | | | | | |
Current | - federal | | $ | 56.8 | | $ | 39.3 | | $ | 29.1 | |
| - state | | 10.6 | | 17.7 | | 11.4 | |
Deferred | - federal – net | | (1.9 | ) | 22.0 | | 11.4 | |
| - state – net | | 0.2 | | (0.5 | ) | 0.9 | |
Amortization of investment tax credit | | (1.7 | ) | (2.1 | ) | (2.7 | ) |
Total income tax expense | | $ | 64.0 | | $ | 76.4 | | $ | 50.1 | |
Deferred federal income tax expense during 2003 and 2004 included significant deductions attributable to federal bonus depreciation which ended after December 2004.
Components of net deferred tax liabilities included in the balance sheet are shown below:
133
(in millions) | | 2005 | | 2004 | |
| | | | | |
Deferred tax liabilities: | | | | | |
Depreciation and other plant-related items | | $ | 300.7 | | $ | 304.7 | |
Regulatory assets and other | | 26.4 | | 25.9 | |
Total deferred tax liabilities | | 327.1 | | 330.6 | |
| | | | | |
Deferred tax assets: | | | | | |
Investment tax credit | | 0.8 | | 1.5 | |
Income taxes due to customers | | 9.1 | | 7.8 | |
Pensions and related benefits | | 23.3 | | 21.2 | |
Liabilities and other | | 20.1 | | 17.5 | |
Total deferred tax assets | | 53.3 | | 48.0 | |
| | | | | |
Net deferred income tax liability | | $ | 273.8 | | $ | 282.6 | |
A reconciliation of differences between the statutory U.S. federal income tax rate and KU’s effective income tax rate follows:
| | 2005 | | 2004 | | 2003 | |
| | | | | | | |
Statutory federal income tax rate | | 35.0 | % | 35.0 | % | 35.0 | % |
State income taxes, net of federal benefit | | 3.8 | | 5.4 | | 5.8 | |
Reduction of income tax accruals | | (2.5 | ) | (0.5 | ) | (1.0 | ) |
EEI undistributed earnings adjustment | | 1.8 | | — | | — | |
Change in tax rate | | 0.1 | | — | | — | |
Amortization of investment tax credit & R&D | | (1.0 | ) | (1.2 | ) | (1.9 | ) |
Other differences | | (0.9 | ) | (2.3 | ) | (2.5 | ) |
Effective income tax rate | | 36.3 | % | 36.4 | % | 35.4 | % |
Other differences for 2005 include excess deferred taxes which reflect the benefits of deferred taxes reversing at higher tax rates than the current statutory rate (1.0%) and various other permanent differences 0.1%. Other differences for 2004 include excess deferred taxes (1.4%) and various other permanent differences (0.9%). Other differences for 2003 include excess deferred taxes (1.9%) and various other permanent differences (0.6%).
KU recognized additional deferred income tax expense in the third quarter of 2005 ($3.1 million) related to the undistributed earnings of its EEI unconsolidated investment. Recent EEI management decisions regarding changes in the distribution of EEI’s earnings led to the decision to provide deferred taxes for all book and tax temporary differences in this investment.
On September 19, 2005, KU received notice from the Congressional Joint Committee on Taxation approving the Internal Revenue Service’s audit of KU’s income tax returns for the periods December 1999 through December 2003. As a result of resolving numerous tax matters during these periods, KU reduced income tax accruals by $4.6 million during 2005.
Kentucky House Bill 272, also known as “Kentucky’s Tax Modernization Plan”, was signed into law in March 2005. This bill contains a number of changes in Kentucky’s tax system, including the reduction of the Corporate income tax rate from 8.25% to 7% effective January 1, 2005, and a further reduction to 6% effective January 1, 2007. As a result of the income tax rate change, KU’s deferred tax reserve amount will exceed its actual deferred tax liability attributable to existing temporary differences since the new statutory rates are lower than the rates were when the deferred tax liability originated. This excess amount is referred to as excess deferred income taxes. In June 2005, KU received approval from the Kentucky Commission to establish and amortize a regulatory liability ($11.0 million) for its net excess deferred income tax balances. Under this accounting treatment, KU will amortize its depreciation-related excess deferred income tax balances under the average rate assumption method. The average rate assumption method matches the amortization of the excess
134
deferred income taxes with the life of the timing differences to which they relate. Excess deferred income tax balances related to non-depreciation timing differences will be expensed in the current year due to their immaterial amount.
KU expects to have adequate levels of taxable income to realize its recorded deferred taxes.
Note 8 - Long-Term Debt
As of December 31, 2005, long-term debt and the current portion of long-term debt consist of first mortgage bonds, pollution control bonds and long-term loans from affiliated companies as summarized below.
(in millions) | | Stated
Interest Rates | | Maturities | | Principal
Amounts | |
Outstanding at December 31, 2005: | | | | | | | |
Noncurrent portion | | | Variable – 7.92 | % | 2007-2035 | | $ | 623.5 | |
Current portion | | | Variable – 5.99 | % | 2006-2032 | | $ | 123.1 | |
| | | | | | | | |
Outstanding at December 31, 2004: | | | | | | | | |
Noncurrent portion | | | Variable – 7.92 | % | 2006-2032 | | $ | 564.1 | |
Current portion | | | Variable | | 2005-2032 | | $ | 162.1 | |
Under the provisions for KU’s variable-rate pollution control bonds, Series 10, 12, 13, 14 and 15, the bonds are subject to tender for purchase at the option of the holder and to mandatory tender for purchase upon the occurrence of certain events, causing the bonds to be classified as current portion of long-term debt in the balance sheets. The average annualized interest rate for these bonds during 2005 and 2004 was 2.55% and 1.37%, respectively.
Pollution control series bonds are first mortgage bonds that have been issued by KU in connection with tax-exempt pollution control revenue bonds issued by various governmental entities, principally counties in Kentucky. A loan agreement obligates KU to make debt service payments to the county that equate to the debt service due from the county on the related pollution control revenue bonds. The county’s debt is also secured by an equal amount of KU’s first mortgage bonds (the pollution control series bonds) that are pledged to the trustee for the pollution control revenue bonds, and that match the terms and conditions of the county’s debt, but require no payment of principal and interest unless KU defaults on the loan agreement.
Substantially all of KU’s assets are pledged as security for its first mortgage bonds.
Interest rate swaps are used to hedge KU’s underlying debt obligations. These swaps hedge specific debt issuances and, consistent with management’s designation, are accorded hedge accounting treatment. The swaps effectively convert fixed rate obligations on KU’s first mortgage bonds Series P to variable-rate obligations. As of December 31, 2005 and 2004, KU had swaps with a combined notional value of $53.0 million and $103.0 million, respectively. See Note 4, Financial Instruments.
Redemptions and maturities of long-term debt for 2005, 2004 and 2003 are summarized below:
135
($ in millions)
Year | | Description | | Principal
Amount | | Rate | | Secured/
Unsecured | | Maturity | |
2005 | | First mortgage bonds | | $ | 50.0 | | 7.55 | % | Secured | | Jun 2025 | |
2005 | | Due to Fidelia | | $ | 75.0 | | 2.29 | % | Secured | | Dec 2005 | |
2004 | | Pollution control bonds | | $ | 4.8 | | Variable | | Secured | | Feb 2032 | |
2004 | | Pollution control bonds | | $ | 50.0 | | 5.75 | % | Secured | | Dec 2023 | |
2003 | | First mortgage bonds | | $ | 62.0 | | 6.32 | % | Secured | | Jun 2003 | |
2003 | | First mortgage bonds | | $ | 33.0 | | 8.55 | % | Secured | | May 2027 | |
Issuances of long-term debt for 2005, 2004 and 2003 are summarized below:
($ in millions)
Year | | Description | | Principal
Amount | | Rate | | Secured/
Unsecured | | Maturity | |
2005 | | Pollution control bonds | | $ | 13.3 | | Variable | | Secured | | Jun 2035 | |
2005 | | Pollution control bonds | | $ | 13.3 | | Variable | | Secured | | Jun 2035 | |
2005 | | Due to Fidelia | | $ | 50.0 | | 4.735 | % | Unsecured | | Jul 2015 | |
2005 | | Due to Fidelia | | $ | 75.0 | | 5.36 | % | Unsecured | | Dec 2015 | |
2004 | | Due to Fidelia | | $ | 50.0 | | 4.39 | % | Unsecured | | Jan 2012 | |
2004 | | Pollution control bonds | | $ | 50.0 | | Variable | | Secured | | Oct 2034 | |
2003 | | Due to Fidelia | | $ | 100.0 | | 4.55 | % | Unsecured | | Apr 2013 | |
2003 | | Due to Fidelia | | $ | 75.0 | | 5.31 | % | Secured | | Aug 2013 | |
2003 | | Due to Fidelia | | $ | 33.0 | | 4.24 | % | Secured | | Nov 2010 | |
2003 | | Due to Fidelia | | $ | 75.0 | | 2.29 | % | Secured | | Dec 2005 | |
In May 2005, KU repaid a $26.7 million loan against the cash surrender value of life insurance policies.
In October 2005, KU redeemed all of its outstanding shares of preferred stock for $40.8 million. KU paid $101 per share for the 4.75% Series and $102.939 per share for the 6.53% Series.
Long-term debt maturities for KU are shown in the following table:
(in millions) | | | |
2006 | | $ | 36.0 | |
2007 | | 55.0 | |
2008 | | — | |
2009 | | — | |
2010 | | 33.0 | |
Thereafter | | | 622.6 | (a) |
Total | | $ | 746.6 | |
(a) Includes long-term debt of $87.1 million classified as current liabilities because these bonds are subject to tender for purchase at the option of the holder and to mandatory tender for purchase upon the occurrence of certain events. Maturity dates for these bonds range from 2024 to 2032. KU does not expect to pay these amounts in 2006.
Note 9 - Notes Payable and Other Short-Term Obligations
KU participates in an intercompany money pool agreement wherein E.ON U.S. and/or LG&E make funds available to KU at market-based rates (based on an index of highly rated commercial paper issues) up to $400.0 million.
($ in millions) | | Total Money
Pool Available | | Amount
Outstanding | | Balance
Available | | Average
Interest Rate | |
December 31, 2005 | | $ | 400.0 | | $ | 69.7 | | $ | 330.3 | | 4.21 | % |
December 31, 2004 | | $ | 400.0 | | $ | 34.8 | | $ | 365.2 | | 2.22 | % |
E.ON U.S. maintains a revolving credit facility totaling $200.0 million with an affiliated company, E.ON North America, Inc., to ensure funding availability for the money pool. The balance outstanding on this facility at December 31, 2005 was $104.7 million, leaving $95.3 million available. At December 31, 2004, the facility totaled $150.0 million with a balance of $65.4 million outstanding, leaving $84.6 million available.
136
Note 10 - Commitments and Contingencies
Operating Leases. KU leases office space, office equipment and vehicles and accounts for these leases as operating leases. In addition, KU reimburses LG&E for a portion of the lease expense paid by LG&E for KU’s usage of office space leased by LG&E. Total lease expense for 2005, 2004 and 2003, was $3.3 million, $2.8 million and $2.2 million, respectively.
Sale and Leaseback Transaction. KU is a participant in a sale and leaseback transaction involving its 62% interest in two jointly-owned CTs at KU’s E.W. Brown generating station (Units 6 and 7). Commencing in December 1999, KU and LG&E entered into a tax-efficient, 18-year lease of the CTs. KU and LG&E have provided funds to fully defease the lease, and have executed an irrevocable notice to exercise an early purchase option contained in the lease after 15.5 years. The financial statement treatment of this transaction is no different than if KU had retained its ownership. The leasing transaction was entered into following receipt of required state and federal regulatory approvals.
In case of default under the lease, KU is obligated to pay to the lessor its share of certain fees or amounts. Primary events of default include loss or destruction of the CTs, failure to insure or maintain the CTs and unwinding of the transaction due to governmental actions. No events of default currently exist with respect to the lease. Upon any termination of the lease, whether by default or expiration of its term, title to the CTs reverts jointly to KU and LG&E.
At December 31, 2005, the maximum aggregate amount of default fees or amounts, which decrease over the term of the lease, was $8.2 million, of which KU would be responsible for $5.1 million (62%). KU has made arrangements with E.ON U.S., via guarantee and regulatory commitment, for E.ON U.S. to pay KU’s full portion of any default fees or amounts.
Letter of Credit. KU has provided a letter of credit totaling $0.8 million to support certain obligations related to barge unloading.
Purchased Power. KU has purchased power arrangements with OMU and OVEC. Under the OMU
137
agreement, which could last through January 1, 2020, KU purchases all of the output of a 400-Mw (approximate) coal-fired generating station not required by OMU. The amount of purchased power available to KU during 2006-2010, which is expected to be approximately 7% of KU’s total Kwh native load energy requirements, is dependent upon a number of factors including the OMU units’ availability, maintenance schedules, fuel costs and OMU requirements. Payments are based on the total costs of the station allocated per terms of the OMU agreement. Included in the total costs is KU’s proportionate share of debt service requirements on $287.0 million of OMU bonds outstanding at December 31, 2005. The debt service is allocated to KU based on its annual allocated share of capacity, which averaged approximately 43% in 2005. KU does not guarantee the OMU bonds, or any requirements therein, in the event of default by OMU.
KU has a 20% equity ownership in EEI, which is accounted for on the equity method of accounting. Previously, KU was entitled to take 20% of the available capacity of the station under a pricing formula comparable to the cost of other power generated by KU. Such power equated to approximately 9% of KU’s net generation system output in 2005. This contract governing the purchases from EEI terminated on December 31, 2005. Subsequent to December 31, 2005, EEI has sold power under general market-based pricing and terms. KU has not contracted with EEI for power under the new arrangements, but maintains its 20% ownership in the common stock of EEI. Replacement power for the EEI capacity has been largely provided by KU generation.
KU has an investment of 2.5% ownership in OVEC’s common stock, which is accounted for on the cost method of accounting. KU is entitled to purchase 2.5% of OVEC’s output, approximately 55 Mw of generation capacity. In April 2004, OVEC and its shareholders, including KU, entered into an Amended and Restated Inter-Company Power Agreement, to be effective beginning March 2006, upon the expiration of the current power contract among the parties. The parties received SEC approval under PUHCA 1935 of the Amended and Restated Inter-Company Power Agreement during February 2005.
Future obligations for power purchases are shown in the following table:
(in millions) | | | |
2006 | | $ | 24.2 | |
2007 | | | 24.5 | |
2008 | | | 23.3 | |
2009 | | | 24.7 | |
2010 | | | 24.9 | |
Thereafter | | | 358.2 | |
Total | | $ | 479.8 | (a) |
(a) Represents future minimum payments under OVEC and OMU purchased power agreements through 2024.
Construction Program. KU had approximately $120.2 million of commitments in connection with its construction program at December 31, 2005. Construction expenditures for the three-year period ending December 31, 2008, are estimated to total approximately $1.5 billion, although all of this is not currently committed, including future expenditures related to the construction of Trimble County Unit 2 and the installation of FGDs at Ghent and Brown.
Environmental Matters. KU is subject to SO2 and NOx emission limits on its electric generating units pursuant to the Clean Air Act. KU met its Phase I SO2 requirements primarily through installation of FGD equipment on Ghent Unit 1 and through the consumption of emission allowances granted under the Clean Air Act. KU’s strategy for Phase II SO2 reductions, which commenced January 1, 2000, has been to use accumulated emissions allowances to delay additional capital expenditures and will include fuel switching and the installation of additional FGDs as necessary. KU decided in December 2004 that additional FGDs will be necessary to maintain compliance with Phase II SO2 reductions. Those installations are currently scheduled for completion in 2007-2009. KU met the initial NOx emission requirements of the Act through installation of low-NOx burner systems. KU’s compliance plans are subject to many factors including developments in the emission allowance and fuel markets, future regulatory and legislative initiatives, and advances in clean air control technology. KU will continue to monitor these developments to ensure that its environmental obligations are met in the most efficient and cost-effective manner.
In September 1998, the EPA announced its final “NOx SIP Call” rule requiring states to impose significant additional reductions in NOx emissions by May 2003, in order to mitigate alleged ozone transport impacts on the Northeast region. The Commonwealth of Kentucky SIP, which was approved by the EPA on June 24, 2003, requires reductions in NOx emissions from coal-fired generating units to the 0.15 lb./MMBtu level on a system-wide basis. In related proceedings in response to petitions filed by various Northeast states, in December 1999,
138
the EPA issued a final rule pursuant to Section 126 of the Clean Air Act directing similar NOx reductions from a number of specifically targeted generating units including all KU units in the eastern half of Kentucky. Additional petitions currently pending before the EPA may potentially result in rules encompassing KU’s remaining generating units. As a result of appeals to both rules, the compliance date was extended to May 31, 2004. All KU generating units are in compliance with these NOx emissions reduction rules.
KU has added significant NOx controls to its generating units through the installation of SCR systems, advanced low-NOx burners and neural networks. The NOx controls project commenced in late 2000 with the controls being placed into operation prior to the 2004 summer ozone season. As of December 31, 2005, KU incurred total capital costs of approximately $217.0 million to reduce its NOx emissions below the 0.15 lb./MMBtu level on a company-wide basis. In addition, KU will incur additional operating and maintenance costs in operating new NOx controls. KU believes its costs in this regard to be comparable to those of similarly situated utilities with like generation assets. KU anticipated that such capital and operating costs are the type of costs that are eligible for recovery from customers under its environmental surcharge mechanism and believed that a significant portion of such costs could be recovered. In April 2001, the Kentucky Commission granted recovery of these costs for KU.
On March 10, 2005, the EPA issued the final CAIR which requires substantial additional reductions in SO2 and NOx emissions from electric generating units. The CAIR provides for a two-phased reduction program with Phase I reductions in NOx and SO2 emissions in 2009 and 2010, respectively, and Phase II reductions in 2015. On March 15, 2005, the EPA issued a related regulation, the final CAMR, which requires substantial mercury reductions from electric generating units. CAMR also provides for a two-phased reduction, with the Phase I target in 2010 achieved as a “co-benefit” of the controls installed to meet CAIR. Additional control measures will be required to meet the Phase II target in 2018. Both CAIR and CAMR establish a cap and trade framework, in which a limit is set on total emissions and allowances can be bought or sold on the open market, to be used for compliance, unless the state chooses another approach.
In order to meet these new regulatory requirements, KU has implemented a plan for adding significant additional SO2 controls to its generating units. Installation of additional SO2 controls will proceed on a phased basis, with construction of controls (i.e., FGDs) having commenced in September 2005 and continuing through the final installation and operation in 2009. KU estimates that it will incur $658.9 million in capital costs related to the construction of the FGDs to achieve compliance with current emission limits on a company-wide basis. In addition, KU will incur additional operating and maintenance costs in operating the new SO2 controls.
KU is also monitoring several other air quality issues which may potentially impact coal-fired power plants, including EPA’s revised air quality standards for ozone and particulate matter and measures to implement EPA’s CAVR.
KU owns or formerly owned several properties that were used for company or company-predecessor operations, including MGP’s, power production facilities and substations. While KU has completed a cleanup of one MGP site in 1995, and has conducted limited cleanups at other sites, evaluations of these types of properties generally have not identified issues of significance. With regard to these properties, KU is unaware of any imminent exposure or liability.
In October 1999, approximately 38,000 gallons of diesel fuel leaked from a cracked valve in an underground pipeline at KU’s E.W. Brown Station. KU commenced immediate spill containment and recovery measures which continued under the oversight of the EPA and state officials and prevented the spill from reaching the Kentucky River. KU ultimately recovered approximately 34,000 gallons of diesel fuel. In November 1999, the Kentucky Division of Water issued a notice of violation for the incident. KU has resolved all outstanding issues
139
for this incident with the Commonwealth of Kentucky. KU incurred spill response and cleanup costs of approximately $1.8 million and received insurance reimbursement of $1.2 million. In December 2002, the DOJ demanded a civil penalty to resolve alleged violations relating to the spill and failure to timely submit a facility response plan. After extensive negotiations between KU, the EPA and the DOJ, the government entered into a consent decree resolving all alleged violations. Under the terms of the settlement, KU is required to pay a civil penalty of $0.2 million (which has been accrued), construct a supplemental environmental project at a cost of $0.8 million, and maintain that project for ten years at a cost of $0.4 million. The consent decree was entered by the judge of the U.S. District Court for the Eastern District of Kentucky on December 23, 2005.
In April 2002, the EPA sent correspondence to KU and other potentially responsible parties demanding recovery of remediation costs associated with a transformer scrap-yard, with such cost currently being in excess of $1.7 million. The Kentucky Division of Waste Management subsequently demanded additional cleanup measures at the site. KU and the other potentially responsible parties have entered into settlement discussions with the EPA and the Kentucky Division of Waste Management in an effort to resolve this matter.
In January 2005, approximately 1,000 gallons of fuel oil leaked from a cracked weld in a storage tank at KU’s Green River Generating Station. KU commenced immediate spill containment, recovery and remediation actions and has received satisfactory inspections from state regulators to date. The cost related to the cleanup of the oil spill was less than $0.2 million and no penalties or fines are anticipated.
Note 11 – Jointly Owned Electric Utility Plant
LG&E and KU jointly own the following combustion turbines:
($ in millions) | | | | LG&E | | KU | | Total | |
Paddy’s Run 13 | | Ownership % | | 53 | % | 47 | % | 100 | % |
| | Mw capacity | | 84 | | 74 | | 158 | |
| | Cost | | $ | 34.0 | | $ | 30.1 | | $ | 64.1 | |
| | Depreciation | | (5.2 | ) | (4.6 | ) | (9.8 | ) |
| | Net book value | | $ | 28.8 | | $ | 25.5 | | $ | 54.3 | |
| | | | | | | | | |
E.W. Brown 5 | | Ownership % | | 53 | % | 47 | % | 100 | % |
| | Mw capacity | | 62 | | 55 | | 117 | |
| | Cost | | $ | 24.0 | | $ | 20.2 | | $ | 44.2 | |
| | Depreciation | | (3.5 | ) | (3.0 | ) | (6.5 | ) |
| | Net book value | | $ | 20.5 | | $ | 17.2 | | $ | 37.7 | |
| | | | | | | | | |
E.W. Brown 6 | | Ownership % | | 38 | % | 62 | % | 100 | % |
| | Mw capacity | | 59 | | 95 | | 154 | |
| | Cost | | $ | 25.3 | | $ | 38.9 | | $ | 64.2 | |
| | Depreciation | | (4.2 | ) | (7.9 | ) | (12.1 | ) |
| | Net book value | | $ | 21.1 | | $ | 31.0 | | $ | 52.1 | |
| | | | | | | | | |
E.W. Brown 7 | | Ownership % | | 38 | % | 62 | % | 100 | % |
| | Mw capacity | | 59 | | 95 | | 154 | |
| | Cost | | $ | 24.9 | | $ | 39.7 | | $ | 64.6 | |
| | Depreciation | | (6.4 | ) | (8.2 | ) | (14.6 | ) |
| | Net book value | | $ | 18.5 | | $ | 31.5 | | $ | 50.0 | |
| | | | | | | | | |
Trimble 5 | | Ownership % | | 29 | % | 71 | % | 100 | % |
| | Mw capacity | | 46 | | 114 | | 160 | |
| | Cost | | $ | 16.4 | | $ | 39.7 | | $ | 56.1 | |
| | Depreciation | | (1.9 | ) | (4.7 | ) | (6.6 | ) |
| | Net book value | | $ | 14.5 | | $ | 35.0 | | $ | 49.5 | |
140
Trimble 6 | | Ownership % | | 29 | % | 71 | % | 100 | % |
| | Mw capacity | | 46 | | 114 | | 160 | |
| | Cost | | $ | 16.2 | | $ | 39.7 | | $ | 55.9 | |
| | Depreciation | | (1.9 | ) | (4.7 | ) | (6.6 | ) |
| | Net book value | | $ | 14.3 | | $ | 35.0 | | $ | 49.3 | |
| | | | | | | | | |
Trimble 7 | | Ownership % | | 37 | % | 63 | % | 100 | % |
| | Mw capacity | | 59 | | 101 | | 160 | |
| | Cost | | $ | 19.3 | | $ | 33.3 | | $ | 52.6 | |
| | Depreciation | | (1.0 | ) | (1.7 | ) | (2.7 | ) |
| | Net book value | | $ | 18.3 | | $ | 31.6 | | $ | 49.9 | |
| | | | | | | | | |
Trimble 8 | | Ownership % | | 37 | % | 63 | % | 100 | % |
| | Mw capacity | | 59 | | 101 | | 160 | |
| | Cost | | $ | 19.2 | | $ | 32.8 | | $ | 52.0 | |
| | Depreciation | | (1.0 | ) | (1.7 | ) | (2.7 | ) |
| | Net book value | | $ | 18.2 | | $ | 31.1 | | $ | 49.3 | |
| | | | | | | | | |
Trimble 9 | | Ownership % | | 37 | % | 63 | % | 100 | % |
| | Mw capacity | | 59 | | 101 | | 160 | |
| | Cost | | $ | 19.2 | | $ | 32.8 | | $ | 52.0 | |
| | Depreciation | | (1.0 | ) | (1.6 | ) | (2.6 | ) |
| | Net book value | | $ | 18.2 | | $ | 31.2 | | $ | 49.4 | |
| | | | | | | | | |
Trimble 10 | | Ownership % | | 37 | % | 63 | % | 100 | % |
| | Mw capacity | | 59 | | 101 | | 160 | |
| | Cost | | $ | 19.1 | | $ | 32.8 | | $ | 51.9 | |
| | Depreciation | | (0.9 | ) | (1.6 | ) | (2.5 | ) |
| | Net book value | | $ | 18.2 | | $ | 31.2 | | $ | 49.4 | |
| | | | | | | | | |
Trimble CT Pipeline | | Ownership % | | 29 | % | 71 | % | 100 | % |
| | Cost | | $ | 2.0 | | $ | 4.9 | | $ | 6.9 | |
| | Depreciation | | (0.2 | ) | (0.6 | ) | (0.8 | ) |
| | Net book value | | $ | 1.8 | | $ | 4.3 | | $ | 6.1 | |
| | | | | | | | | |
Trimble CT Substation | | Ownership % | | 29 | % | 71 | % | 100 | % |
5 & 6 | | Cost | | $ | 1.5 | | $ | 3.6 | | $ | 5.1 | |
| | Depreciation | | (0.1 | ) | (0.3 | ) | (0.4 | ) |
| | Net book value | | $ | 1.4 | | $ | 3.3 | | $ | 4.7 | |
| | | | | | | | | |
Trimble CT Substation | | Ownership % | | 37 | % | 63 | % | 100 | % |
7 - 10 | | Cost | | $ | 3.1 | | $ | 4.9 | | $ | 8.0 | |
| | Depreciation | | (0.1 | ) | (0.2 | ) | (0.3 | ) |
| | Net book value | | $ | 3.0 | | $ | 4.7 | | $ | 7.7 | |
In addition to these generating units, KU and LG&E share joint ownership in the Brown Inlet Air Cooling system. KU owns 90% of the system, attributable to Brown Unit 5 and Units 8-11, which provides an additional 88 Mw of capacity.
Note 12 - Related Party Transactions
KU, subsidiaries of E.ON U.S. and other subsidiaries of E.ON engage in related party transactions. Transactions between KU and its subsidiary KU R are eliminated upon consolidation with KU. Transactions between KU and E.ON U.S. subsidiaries are eliminated upon consolidation of E.ON U.S. Transactions between KU and E.ON subsidiaries are eliminated upon consolidation of E.ON. These transactions are generally performed at cost and are
141
in accordance with the prior SEC regulations under PUHCA 1935 and the applicable FERC, Kentucky Commission and Virginia Commission regulations. Amounts payable to and receivable from related parties are netted and presented as accounts payable to affiliated companies on the balance sheet of KU, as allowed due to the right of offset. Obligations related to intercompany debt arrangements with E.ON U.S. and Fidelia are presented as separate line items on the balance sheet, as appropriate. The significant related party transactions are disclosed below.
Electric Purchases
KU and LG&E purchase energy from each other in order to effectively manage the load of their retail and off-system customers. In addition, KU sells energy to LEM, a subsidiary of E.ON U.S. These sales and purchases are included in the Statements of Income as Electric Operating Revenues and Purchased Power Operating Expense. KU intercompany electric revenues and purchased power expense for the years ended December 31, 2005, 2004 and 2003 were as follows:
(in millions) | | 2005 | | 2004 | | 2003 | |
Electric operating revenues from LG&E | | $ | 95.5 | | $ | 61.7 | | $ | 46.7 | |
Electric operating revenues from LEM | | — | | 0.2 | | 2.4 | |
Purchased power from LG&E | | 91.6 | | 58.7 | | 53.7 | |
| | | | | | | | | | |
Interest Charges
See Note 9, Notes Payable and Other Short-Term Obligations, for details of intercompany borrowing arrangements. Intercompany agreements do not require interest payments for receivables related to services provided when settled within 30 days.
KU’s intercompany interest income and expense for the years ended December 31, 2005, 2004 and 2003 were as follows:
(in millions) | | 2005 | | 2004 | | 2003 | |
Interest on money pool loans | | $ | 1.0 | | $ | 0.4 | | $ | 1.2 | |
Interest on Fidelia loans | | 15.0 | | 13.8 | | 4.7 | |
| | | | | | | | | | |
Other Intercompany Billings
E.ON U.S. Services provides KU with a variety of centralized administrative, management and support services. These charges include payroll taxes paid by E.ON U.S. on behalf of KU, labor and burdens of E.ON U.S. Services employees performing services for KU and vouchers paid by E.ON U.S. Services on behalf of KU. The cost of these services are directly charged to KU, or for general costs which cannot be directly attributed, charged based on predetermined allocation factors, including the following ratios: number of customers, total assets, revenues, number of employees and other statistical information. These costs are charged on an actual cost basis.
In addition, KU and LG&E provide services to each other and to E.ON U.S. Services. Billings between LG&E and KU relate to labor and overheads associated with union employees performing work for the other utility, charges related to jointly-owned combustion turbines, and other miscellaneous charges. Billings from KU to E.ON U.S. Services related to information technology-related services provided by KU employees, cash received by E.ON U.S. Services on behalf of KU and services provided by KU to other non-regulated businesses which are paid through E.ON U.S. Services.
142
Intercompany billings to and from KU for the years ended December 31, 2005, 2004 and 2003 were as follows:
(in millions) | | 2005 | | 2004 | | 2003 | |
E.ON U.S. Services billings to KU | | $ | 184.9 | | $ | 170.6 | | $ | 202.5 | |
KU billings to LG&E | | 28.6 | | 7.2 | | 16.6 | |
LG&E billings to KU | | 100.5 | | 59.5 | | 77.2 | |
KU billings to E.ON U.S. Services | | 7.2 | | 5.0 | | 16.1 | |
| | | | | | | | | | |
The increase in 2005 billings between LG&E and KU is largely due to the increase in the unit cost of purchased power resulting from the 2005 increases in fuel costs.
Note 13 – Accumulated Other Comprehensive Income
Accumulated other comprehensive income (loss) consisted of the following:
(in millions) | | Minimum
Pension
Liability
Adjustment | | Accumulated
Derivative
Gain or Loss | | Pre-Tax | | Income
Taxes | | Net | |
Balance at December 31, 2002 | | $ | (17.6 | ) | $ | �� | | $ | (17.6 | ) | $ | 7.1 | | $ | (10.5 | ) |
| | | | | | | | | | | |
Minimum pension liability adjustment | | 7.7 | | — | | 7.7 | | (3.1 | ) | 4.6 | |
Gains (losses) on derivative instruments designated and qualifying as cash flow hedging instruments | | — | | (0.3 | ) | (0.3 | ) | 0.1 | | (0.2 | ) |
Balance at December 31, 2003 | | (9.9 | ) | (0.3 | ) | (10.2 | ) | 4.1 | | (6.1 | ) |
| | | | | | | | | | | |
Minimum pension liability adjustment | | (12.4 | ) | — | | (12.4 | ) | 5.0 | | (7.4 | ) |
Gains (losses) on derivative instruments designated and qualifying as cash flow hedging instruments | | — | | 0.3 | | 0.3 | | (0.1 | ) | 0.2 | |
Balance at December 31, 2004 | | $ | (22.3 | ) | $ | — | | $ | (22.3 | ) | $ | 9.0 | | $ | (13.3 | ) |
| | | | | | | | | | | |
Minimum pension liability adjustment | | (9.5 | ) | — | | (9.5 | ) | 3.5 | | (6.0 | ) |
Gains (losses) on derivative instruments designated and qualifying as cash flow hedging instruments | | — | | — | | — | | — | | — | |
Balance at December 31, 2005 | | $ | (31.8 | ) | $ | — | | $ | (31.8 | ) | $ | 12.5 | | $ | (19.3 | ) |
Note 14 - Selected Quarterly Data (Unaudited)
Selected financial data for the four quarters of 2005 and 2004 are shown below. Because of seasonal fluctuations in temperature and other factors, results for quarters may fluctuate throughout the year.
| | Quarters Ended | |
(in millions) | | March | | June | | September | | December | |
2005 | | | | | | | | | |
Operating revenues | | $ | 287.5 | | $ | 265.2 | | $ | 347.2 | | $ | 306.7 | |
Net operating income | | 65.6 | | 34.2 | | 55.4 | | 46.9 | |
Net income | | 37.5 | | 17.7 | | 31.7 | | 25.2 | |
| | | | | | | | | |
2004 | | | | | | | | | |
Operating revenues | | $ | 247.4 | | $ | 232.4 | | $ | 252.6 | | $ | 263.0 | |
Net operating income | | 56.4 | | 50.3 | | 57.9 | | 63.3 | |
Net income | | 32.4 | | 27.6 | | 34.8 | | 38.7 | |
143
Note 15 – Subsequent Events
On January 17, 2006, KU repaid its $36.0 million First Mortgage Bonds, Series S at maturity.
On February 27, 2006, the AG, KIUC, LG&E and KU reached a settlement agreement on the future ratemaking treatment of the VDT surcredits and costs and subsequently submitted a joint motion to the Kentucky Commission to approve the unanimous settlement agreement. Under the terms of the settlement agreement, the VDT surcredit will continue at the current level until such time as KU files for a change in electric base rates. The Kentucky Commission held a public hearing in the proceeding on March 21, 2006 and issued an order thereafter approving the settlement agreement.
On March 17, 2006, the FERC issued an order conditionally approving the request of KU and LGE to exit the MISO.
The Companies must satisfy a number of conditions to effect their exit from the MISO including:
• Submission of various compliance filings addressing:
• the Companies’ hold-harmless obligations under the MISO Transmission Owners’ Agreement, and the amount of the MISO exit fee to be paid by the Companies as calculated under the approved methodology;
• the Companies’ anticipated arrangements with SPP and TVA, including revisions to address certain independence and transmission planning considerations, and reciprocity arrangements to ensure certain KU requirements customers do not incur pancaked rates for transmission and ancillary services;
• the Companies’ proposed OATT, as revised to address possible capacity hoarding available transmission calculation methodology, curtailment priority and pricing, among other matters; and
• the Companies’ finalized arrangements with the SPP and TVA.
• The Companies must also file an application of the proposed OATT under Section 205 of the Federal Power Act including a proposed return on equity.
While KU and LG&E believe they can reasonably achieve all of the conditions imposed by the FERC order, completion of a number of the conditions is dependent upon the actions or agreement of third parties. There is also a risk that the FERC decision will be challenged by intervenors with a request for rehearing, which could happen within 30 days of the decision. The Companies are currently unable to estimate the time period, if any, in which the conditions of the FERC order might be satisfied, the Companies might receive Kentucky Commission approval and, thereafter, exit the MISO.
144
Kentucky Utilities Company
REPORT OF MANAGEMENT
The management of Kentucky Utilities Company (“KU”) is responsible for the preparation and integrity of the financial statements and related information included in this Annual Report. These statements have been prepared in accordance with accounting principles generally accepted in the United States applied on a consistent basis and, necessarily, include amounts that reflect the best estimates and judgment of management.
KU’s financial statements for the three years ended December 31, 2005, have been audited by PricewaterhouseCoopers LLP, an independent registered public accounting firm. Management made available to PricewaterhouseCoopers LLP all KU’s financial records and related data as well as the minutes of shareholders’ and directors’ meetings.
Management has established and maintains a system of internal controls that provide reasonable assurance that transactions are completed in accordance with management’s authorization, that assets are safeguarded and that financial statements are prepared in conformity with generally accepted accounting principles. Management believes that an adequate system of internal controls is maintained through the selection and training of personnel, appropriate division of responsibility, establishment and communication of policies and procedures and by regular reviews of internal accounting controls by KU’s internal auditors. Management reviews and modifies its system of internal controls in light of changes in conditions and operations, as well as in response to recommendations from the internal and external auditors. These recommendations for the year ended December 31, 2005, did not identify any material weaknesses in the design and operation of KU’s internal control structure.
KU is not an accelerated filer under the Sarbanes-Oxley Act of 2002 and associated rules (the “Act”) and consequently anticipates issuing Management’s Report on Internal Controls over Financial Reporting pursuant to Section 404 of the Act in its first periodic report covering the fiscal year ended December 31, 2007, as permitted by SEC rulemaking.
In carrying out its oversight role for the financial reporting and internal controls of KU, the Board of Directors meets regularly with KU’s independent registered public accounting firm, internal auditors and management. The Board of Directors reviews the results of the independent registered public accounting firm’s audit of the financial statements and their audit procedures, and discusses the adequacy of internal accounting controls. The Board of Directors also approves the annual internal auditing program, and reviews the activities and results of the internal auditing function. Both the independent registered public accounting firm and the internal auditors have access to the Board of Directors at any time.
KU maintains and internally communicates a written code of business conduct and a senior financial officer code of ethics which address, among other items, potential conflicts of interest, compliance with laws, including those relating to financial disclosure, and the confidentiality of proprietary information.
S. Bradford Rives
Chief Financial Officer
Kentucky Utilities Company
Louisville, Kentucky
Date: March 29, 2006
145
Report of Independent Registered Public Accounting Firm
To the Shareholder of Kentucky Utilities Company:
In our opinion, the accompanying balance sheet and the related statement of capitalization, income, retained earnings, cash flows and comprehensive income present fairly, in all material respects, the financial position of Kentucky Utilities Company at December 31, 2005 and December 31, 2004, and the results of its operations and its cash flows for each of the three years in the period ended December 31, 2005 in conformity with accounting principles generally accepted in the United States of America. In addition, in our opinion, the financial statement schedule listed in the index appearing under Item 15(a)(2) present fairly, in all material respects, the information set forth therein when read in conjunction with the related financial statements. These financial statements and financial statement schedule are the responsibility of the Company’s management. Our responsibility is to express an opinion on these financial statements and financial statement schedule based on our audits. We conducted our audits of these statements in accordance with the standards of the Public Company Accounting Oversight Board (United States). Those standards require that we plan and perform the audit to obtain reasonable assurance about whether the financial statements are free of material misstatement. An audit includes examining, on a test basis, evidence supporting the amounts and disclosures in the financial statements, assessing the accounting principles used and significant estimates made by management, and evaluating the overall financial statement presentation. We believe that our audits provide a reasonable basis for our opinion.
As discussed in Note1 to the financial statements, effective December 31, 2005, Kentucky Utilities Company adopted Statement of Financial Accounting Standards Board Interpretation No. 47, Accounting for Conditional Asset Retirement Obligations.
/s/ PricewaterhouseCoopers LLP
Louisville, Kentucky
February 8, 2006
146
ITEM 9. Changes in and Disagreements with Accountants on Accounting and Financial Disclosure.
Not applicable.
ITEM 9A. Controls and Procedures.
Disclosure Controls
LG&E and KU maintain a system of disclosure controls and procedures designed to ensure that information required to be disclosed by the companies in reports they file or submit under the Securities Exchange Act of 1934 is recorded, processed, summarized and reported, within the time periods specified in the Securities and Exchange Commission rules and forms. LG&E and KU conducted an evaluation of such controls and procedures under the supervision and with the participation of the Companies’ Management, including the Chairman, President and Chief Executive Officer (“CEO”) and the Chief Financial Officer (“CFO”). Based upon that evaluation, the CEO and CFO are of the conclusion that the Companies’ disclosure controls and procedures are effective as of the end of the period covered by this report.
In preparation for required reporting under Section 404 of the Sarbanes-Oxley Act of 2002, the Companies are conducting a thorough review of their internal control over financial reporting, including disclosure controls and procedures. Based on this review, the Companies have made internal control enhancements and will continue to make future enhancements to their internal control over financial reporting. There has been no change in the Companies’ internal control over financial reporting that occurred during the fiscal year ended December 31, 2005, that has materially affected, or is reasonably likely to materially affect, the Companies’ internal control over financial reporting.
LG&E and KU are not accelerated filers under the Sarbanes-Oxley Act of 2002 and associated rules (the “Act”) and consequently anticipate issuing Management’s Report on Internal Controls over Financial Reporting pursuant to Section 404 of the Act in their first periodic reports covering the fiscal year ended December 31, 2007, as permitted by SEC rulemaking.
ITEM 9B. Other Information.
Filed as Exhibits 4.28, 4.29 and 10.47 hereto is information relating to an intercompany long-term borrowing of KU and annual salary increases of certain executive officers of LG&E and KU, both of which items occurred during the fourth quarter of 2005 in the ordinary course of business.
PART III
ITEM 10. Directors and Executive Officers of LG&E and KU.
Information regarding directors who are standing for reelection is set forth in Exhibit 99.02 filed herewith, which information is incorporated herein by reference. Information regarding executive officers of LG&E and KU has been included in Part I of this Form 10-K.
Audit Committee Independence and Financial Expert
As wholly-owned subsidiaries of a common parent, LG&E and KU each have a five-person board of directors. Due to the small size of this board, the board as a whole performs the functions associated with audit
147
committees. The Boards of Directors of LG&E and KU have determined that each of Victor A. Staffieri and S. Bradford Rives is an audit committee financial expert as defined by Item 401(h) of Regulation S-K. All of the members of the boards of LG&E and KU are officers or employees of the companies, or their ultimate parent, E.ON AG, and therefore are not independent within the meaning of Item 7(d)(3)(iv) of Schedule 14A of the Exchange Act. Nevertheless, LG&E and KU believe the structure and composition of their boards of directors and the qualifications and attributes of their members to be fully able and competent to perform their duties in the areas associated with audit committees.
Code of Ethics
LG&E and KU have adopted a code of ethics for senior financial officers (including principal executive officer, principal financial officer, principal accounting officer and controller or other employees performing similar functions). The Senior Financial Officer Code of Ethics is available on their corporate website at http://www.eon-us.com. LG&E and KU intend to satisfy the disclosure requirement under Item 5.05 of Form 8-K regarding an amendment to, or waiver from, a provision of the Code of Ethics by posting such information on our website at the location specified above.
Section 16(a) Beneficial Ownership Reporting Compliance
Information regarding Section 16(a) beneficial ownership reporting compliance is included in Exhibit 99.02 filed herewith, which information is incorporated herein by reference.
ITEM 11. Executive Compensation.
Information regarding compensation of named executive officers and of directors is set forth in Exhibit 99.02 filed herewith, which information is incorporated herein by reference.
ITEM 12. Security Ownership of Certain Beneficial Owners and Management and Related Stockholder Matters.
Information regarding security ownership of certain beneficial owners, directors and executive officers is set forth in Exhibit 99.02 filed herewith, which information is incorporated herein by reference.
Information regarding equity compensation plans, including non-stockholder approved plans, is set forth in Exhibit 99.02 filed herewith, which information is incorporated herein by reference.
ITEM 13. Certain Relationships and Related Transactions.
Information regarding certain relationships and related transactions, if applicable, is set forth in Exhibit 99.02 filed herewith, which information is incorporated herein by reference.
ITEM 14. Principal Accountant Fees and Services.
Information regarding principal accountant fees and services is set forth in Exhibit 99.02 filed herewith, which information is incorporated herein by reference.
PART IV
ITEM 15. Exhibits and Financial Statement Schedules.
148
(a) | 1. | Financial Statements (included in Item 8): |
| | |
| | LG&E: |
| | Statements of Income for the three years ended December 31, 2005 (page 70). |
| | Statements of Retained Earnings for the three years ended December 31, 2005 (page 70). |
| | Statements of Comprehensive Income for the three years ended December 31, 2005 (page 71). |
| | Balance Sheets-December 31, 2005, and 2004 (page 72). |
| | Statements of Cash Flows for the three years ended December 31, 2005 (page 74). |
| | Statements of Capitalization-December 31, 2005, and 2004 (page 75). |
| | Notes to Financial Statements (pages 76-104). |
| | Report of Management (page 105). |
| | Report of Independent Registered Public Accounting Firm (page 106). |
| | |
| | KU: |
| | Statements of Income for the three years ended December 31, 2005 (page 109). |
| | Statements of Retained Earnings for the three years ended December 31, 2005 (page 109). |
| | Statements of Comprehensive Income for the three years ended December 31, 2005 (page 110). |
| | Balance Sheets-December 31, 2005, and 2004 (page 111). |
| | Statements of Cash Flows for the three years ended December 31, 2005 (page 113). |
| | Statements of Capitalization-December 31, 2005, and 2004 (page 114). |
| | Notes to Financial Statements (pages 115-144). |
| | Report of Management (page 145). |
| | Report of Independent Registered Public Accounting Firm (page 146). |
2. Financial Statement Schedules (included in Part IV): |
| | |
Schedule II | | Valuation and Qualifying Accounts for the three years ended December 31, 2005, for LG&E (page 161), and KU (page 162). |
All other schedules have been omitted as not applicable or not required or because the information required to be shown is included in the Financial Statements or the accompanying Notes to Financial Statements.
3. Exhibits
| | Applicable | | |
| | to | | |
| | Form | | |
Exhibit | | 10-K of | | |
No. | | LG&E | | KU | | Description |
| | | | | | |
2.01 | | X | | X | | Copy of Agreement and Plan of Merger, dated as of February 27, 2000, by and among Powergen plc, LG&E Energy Corp., US Subholdco2 and Merger Sub, including certain exhibits thereto. [Filed as Exhibit 1 to LG&E’s and KU’s Current Report on Form 8-K filed February 29, 2000 and incorporated by reference herein] |
| | | | | | |
2.02 | | X | | X | | Amendment No. 1 to Agreement and Plan of Merger, dated as of December 8, 2000, among LG&E Energy Corp., Powergen plc, Powergen US Investments Corp. and Powergen Acquisition Corp. [Filed as Exhibit 2.01 to LG&E’s and KU’s Current Report on Form 8-K filed December 11, 2000 and incorporated by reference herein] |
| | | | | | |
2.03 | | X | | X | | Copy of Agreement and Plan of Merger, dated as of May 20, 1997, by and between LG&E Energy and KU Energy, including certain exhibits thereto. [Filed as Exhibit 2 to LG&E’s and KU’s Current Report on Form 8-K filed May 30, 1997 and incorporated by reference herein] |
| | | | | | |
3.01 | | X | | | | Copy of Restated Articles of Incorporation of LG&E, dated November 6, 1996. [Filed as Exhibit 3.06 to LG&E’s Quarterly Report on Form 10-Q for the quarter ended September 30, 1996, and incorporated by reference herein] |
| | | | | | |
3.02 | | X | | | | Copy of Amendment to Articles of Incorporation of LG&E, dated February 6, 2004. [Filed as Exhibit 3.02 to LG&E’s and KU’s Annual Report on Form 10-K for the year ended December 31, 2003, and incorporated by reference herein] |
| | | | | | |
3.03 | | X | | | | Copy of By-Laws of LG&E, as amended through December 16, 2003. [Filed as Exhibit 3.03 to LG&E’s and KU’s Annual Report on Form 10-K for the year ended December 31, 2003, and incorporated by reference herein] |
| | | | | | |
3.04 | | | | X | | Copy of Amended and Restated Articles of Incorporation of KU [Filed as Exhibits 4.03 and 4.04 to Form 8-K Current Report of KU, dated December 10, 1993, and incorporated by reference herein] |
| | | | | | |
3.05 | | | | X | | Copy of Amendment to Articles of Incorporation of KU, dated February 6, 2004. [Filed as Exhibit 3.05 to LG&E’s and KU’s Annual Report on Form 10-K for the year ended December 31, 2003, and incorporated by reference herein] |
149
3.06 | | | | X | | Copy of By-Laws of KU, as amended through December 16, 2003. [Filed as Exhibit 3.06 to LG&E’s and KU’s Annual Report on Form 10-K for the year ended December 31, 2003, and incorporated by reference herein] |
| | | | | | |
4.01 | | X | | | | Copy of Trust Indenture dated November 1, 1949, from LG&E to Harris Trust and Savings Bank, Trustee. [Filed as Exhibit 7.01 to LG&E’s Registration Statement 2-8283 and incorporated by reference herein] |
| | | | | | |
4.02 | | X | | | | Copy of Supplemental Indenture dated September 1, 1992, which is a supplemental instrument to Exhibit 4.01 hereto. [Filed as Exhibit 4.32 to LG&E’s Annual Report on Form 10-K for the year ended December 31, 1992, and incorporated by reference herein] |
| | | | | | |
4.03 | | X | | | | Copy of Supplemental Indenture dated September 2, 1992, which is a supplemental instrument to Exhibit 4.01 hereto. [Filed as Exhibit 4.33 to LG&E’s Annual Report on Form 10-K for the year ended December 31, 1992, and incorporated by reference herein] |
| | | | | | |
4.04 | | X | | | | Copy of Supplemental Indenture dated August 16, 1993, which is a supplemental instrument to Exhibit 4.01 hereto. [Filed as Exhibit 4.35 to LG&E’s Annual Report on Form 10-K for the year ended December 31, 1993, and incorporated by reference herein] |
| | | | | | |
4.05 | | X | | | | Copy of Supplemental Indenture dated May 1, 2000, which is a supplemental instrument to Exhibit 4.01 hereto. [Filed as Exhibit 4.37 to LG&E’s Annual Report on Form 10-K/A for the year ended December 31, 2000, and incorporated by reference herein] |
| | | | | | |
4.06 | | X | | | | Copy of Supplemental Indenture dated August 1, 2000, which is a supplemental instrument to Exhibit 4.01 hereto. [Filed as Exhibit 4.38 to LG&E’s Annual Report on Form 10-K/A for the year ended December 31, 2000, and incorporated by reference herein] |
| | | | | | |
4.07 | | X | | | | Copy of Supplemental Indenture dated March 1, 2002, which is a supplemental instrument to Exhibit 4.01 hereto. [Filed as Exhibit 4.39 to LG&E’s Annual Report on Form 10-K for the year ended December 31, 2002, and incorporated by reference herein] |
| | | | | | |
4.08 | | X | | | | Copy of Supplemental Indenture dated March 15, 2002, which is a supplemental instrument to Exhibit 4.01 hereto. [Filed as Exhibit 4.40 to LG&E’s Annual Report on Form 10-K for the year ended December 31, 2002, and incorporated by reference herein] |
150
4.09 | | X | | | | Copy of Supplemental Indenture dated October 1, 2002, which is a supplemental instrument to Exhibit 4.01 hereto. [Filed as Exhibit 4.41 to LG&E’s Annual Report on Form 10-K for the year ended December 31, 2002, and incorporated by reference herein] |
| | | | | | |
4.10 | | X | | | | Copy of Supplemental Indenture dated October 1, 2003, which is a supplemental instrument to Exhibit 4.01 hereto. [Filed as Exhibit 4.22 to LG&E’s Annual Report on Form 10-K for the year ended December 31, 2003, and incorporated by reference herein] |
| | | | | | |
4.11 | | X | | | | Supplemental Indenture dated as of April 1, 2005, from Louisville Gas and Electric Company to BNY Midwest Trust Company, as Trustee, which is a supplemental instrument to Exhibit 4.01 hereto. [Filed as Exhibit 4.1 to LG&E’s Form 8-K filed on April 13, 2005, and incorporated by reference herein] |
| | | | | | |
4.12 | | | | X | | Indenture of Mortgage or Deed of Trust dated May 1, 1947, between KU and First Trust National Association (successor Trustee) and a successor individual co-trustee, as Trustees (the Trustees) (Amended Exhibit 7(a) in File No. 2-7061), and Supplemental Indentures thereto dated, respectively, January 1, 1949 (Second Amended Exhibit 7.02 in File No. 2-7802), July 1, 1950 (Amended Exhibit 7.02 in File No. 2-8499), June 15, 1951 (Exhibit 7.02(a) in File No. 2-8499), June 1, 1952 (Amended Exhibit 4.02 in File No. 2-9658), April 1, 1953 (Amended Exhibit 4.02 in File No. 2-10120), April 1, 1955 (Amended Exhibit 4.02 in File No. 2-11476), April 1, 1956 (Amended Exhibit 2.02 in File No. 2-12322) May 1, 1969 (Amended Exhibit 2.02 in File No. 2-32602), April 1, 1970 (Amended Exhibit 2.02 in File No. 2-36410), September 1, 1971 (Amended Exhibit 2.02 in File No. 2-41467), December 1, 1972 (Amended Exhibit 2.02 in File No. 2-46161), April 1, 1974 (Amended Exhibit 2.02 in File No. 2-50344), September 1, 1974 (Exhibit 2.04 in File No. 2-59328), July 1, 1975 (Exhibit 2.05 in File No. 2-59328), May 15, 1976 (Amended Exhibit 2.02 in File No. 2-56126), April 15, 1977 (Exhibit 2.06 in File No. 2-59328), August 1, 1979 (Exhibit 2.04 in File No. 2-64969), May 1, 1980 (Exhibit 2 to Form 10-Q Quarterly Report of KU for the quarter ended June 30, 1980), September 15, 1982 (Exhibit 4.04 in File No. 2-79891), August 1, 1984 (Exhibit 4B to Form 10-K Annual Report of KU for the year ended December 31, 1984), June 1, 1985 (Exhibit 4 to Form 10-Q Quarterly Report of KU for the quarter ended June 30, 1985), May 1, 1990 (Exhibit 4 to Form 10-Q Quarterly Report of KU for the quarter ended June 30, 1990), May 1, 1991 (Exhibit 4 to Form 10-Q Quarterly Report of KU for the quarter ended June 30, 1991), May 15, 1992 (Exhibit 4.02 to Form 8-K of KU dated May 14, 1992), August 1, 1992 (Exhibit 4 to Form 10-Q Quarterly Report of KU for |
151
| | | | | | the quarter ended September 30, 1992), June 15, 1993 (Exhibit 4.02 to Form 8-K of KU dated June 15, 1993) and December 1, 1993 (Exhibit 4.01 to Form 8-K of KU dated December 10, 1993), November 1, 1994 (Exhibit 4.C to Form 10-K Annual Report of KU for the year ended December 31, 1994), June 1, 1995 (Exhibit 4 to Form 10-Q Quarterly Report of KU for the quarter ended June 30, 1995) and January 15, 1996 [Filed as Exhibit 4.E to Form 10-K Annual Report of KU for the year ended December 31, 1995, and incorporated by reference herein] |
| | | | | | |
4.13 | | | | X | | Copy of Supplemental Indenture dated March 1, 1992 between KU and the Trustees, providing for the conveyance of properties formerly held by Old Dominion Power Company [Filed as Exhibit 4B to Form 10-K Annual Report of KU for the year ended December 31, 1992, and incorporated by reference herein] |
| | | | | | |
4.14 | | | | X | | Copy of Supplemental Indenture dated May 1, 2000, which is a supplemental instrument to Exhibit 4.12 hereto. [Filed as Exhibit 4.41 to KU’s Annual Report on Form 10-K for the year ended December 31, 2000, and incorporated by reference herein] |
| | | | | | |
4.15 | | | | X | | Copy of Supplemental Indenture dated September 1, 2001, which is a supplemental instrument to Exhibit 4.12hereto. [Filed as Exhibit 4.42 to KU’s Annual Report on Form 10-K for the year ended December 31, 2001, and incorporated by reference herein] |
| | | | | | |
4.16 | | | | X | | Copy of Supplemental Indenture dated May 1, 2002, which is a supplemental instrument to Exhibit 4.12 hereto. [Filed as Exhibit 4.50 to KU’s Annual Report on Form 10-K for the year ended December 31, 2002, and incorporated by reference herein] |
| | | | | | |
4.17 | | | | X | | Copy of Supplemental Indenture dated September 1, 2002, which is a supplemental instrument to Exhibit 4.12 hereto. [Filed as Exhibit 4.51 to KU’s Annual Report on Form 10-K for the year ended December 31, 2002, and incorporated by reference herein] |
| | | | | | |
4.18 | | | | X | | Supplemental Indenture dated as of October 1, 2004 from Kentucky Utilities Company to U.S. Bank National Association and Richard Prokosch, as Trustees [Filed as Exhibit 4.1 to KU’s Form 8-K filed on October 22, 2004, and incorporated by reference herein] |
| | | | | | |
4.19 | | | | X | | Supplemental Indenture dated as of June 15, 2005, from Kentucky Utilities Company to U.S. Bank National Association and Richard Prokosch, as Trustees, which is a supplemental instrument to Exhibit |
152
| | | | | | 4.12 hereto, [Filed as Exhibit 4.1 to KU’s Form 8-K filed on July 7, 2005, and incorporated by reference herein] |
| | | | | | |
4.19a | | | | X | | Copy of Supplemental Indenture dated November 1, 2005, from Kentucky Utilities Company to U.S. Bank National Association, which is a supplemental instrument to Exhibit 4.12 hereto. [Filed as Exhibit 4.1 to KU’s Form 8-K filed on November 17, 2005, and incorporated by reference herein] |
| | | | | | |
4.20 | | | | X | | Copy of Loan Agreement between KU and Fidelia Corporation, dated April 30, 2003. [Filed as Exhibit 4.23 to KU’s Annual Report on Form 10-K for the year ended December 31, 2003, and incorporated by reference herein] |
| | | | | | |
4.21 | | X | | | | Copy of Loan Agreement between LG&E and Fidelia Corporation, dated April 30, 2003. [Filed as Exhibit 4.24 to LG&E’s Annual Report on Form 10-K for the year ended December 31, 2003, and incorporated by reference herein] |
| | | | | | |
4.22 | | X | | | | Copy of Loan Agreement between LG&E and Fidelia Corporation, dated January 15, 2004. [Filed as Exhibit 4.27 to LG&E's Annual Report on Form 10-K for the year ended December 31, 2004, and incorporated by reference herein] |
| | | | | | |
4.23 | | | | X | | Copy of Loan and Security Agreement between KU and Fidelia Corporation, dated as of August 15, 2003. [Filed as Exhibit 4.26 to KU’s Annual Report on Form 10-K for the year ended December 31, 2003, and incorporated by reference herein] |
| | | | | | |
4.24 | | X | | | | Copy of Loan and Security Agreement between LG&E and Fidelia Corporation, dated as of August 15, 2003. [Filed as Exhibit 4.27 to LG&E’s Annual Report on Form 10-K for the year ended December 31, 2003, and incorporated by reference herein] |
| | | | | | |
4.25 | | | | X | | Copy of Promissory Note from KU to Fidelia Corporation, dated as of November 24, 2003, in the amount of $33 million. [Filed as Exhibit 4.23 to KU’s Annual Report on Form 10-K for the year ended December 31, 2004, and incorporated by reference herein] |
| | | | | | |
4.26 | | | | X | | Copy of Promissory Note from KU to Fidelia Corporation, dated as of July 8, 2005. [Filed as Exhibit 4.4 to KU’s Current Report on Form 8-K dated July 7, 2005, and incorporated by reference herein] |
| | | | | | |
4.26a | | | | X | | Copy of Loan Agreement between KU and Fidelia Corporation dated July 8, 2005 [Filed as Exhibit 4.3 to KU's Current Report on Form 8-K dated July 7, 2005, and incorporated by reference herein.] |
| | | | | | |
4.27 | | | | X | | Copy of Loan Agreement between KU and Fidelia Corporation, dated as of January 15, 2004 [Filed as Exhibit 4.25 to KU’s Annual Report on Form 10-K for the year ended December 31, 2004, and incorporated by reference herein] |
153
4.28 | | | | X | | Copy of Loan Agreement between KU and Fidelia Corporation, dated as of December 19, 2005. |
| | | | | | |
4.29 | | | | X | | Copy of Promissory Note from KU to Fidelia Corporation, dated as of December 19, 2005, in the amount of $75 million. |
| | | | | | |
10.01 | | X | | X | | Copies of (i) Inter-Company Power Agreement, dated July 10, 1953, between Ohio Valley Electric Corporation and Sponsoring Companies (which Agreement includes as Exhibit A the Power Agreement, dated July 10, 1953, between Ohio Valley Electric Corporation and Indiana-Kentucky Electric Corporation); (ii) First Supplementary Transmission Agreement, dated July 10, 1953, between Ohio Valley Electric Corporation and Sponsoring Companies; (iii) Inter-Company Bond Agreement, dated July 10, 1953, between Ohio Valley Electric Corporation and Sponsoring Companies; (iv) Inter-Company Bank Credit Agreement, dated July 10, 1953, between Ohio Valley Electric Corporation and Sponsoring Companies. [Filed as Exhibit 5.02f to LG&E’s Registration Statement 2-61607 and incorporated by reference herein] |
| | | | | | |
10.02 | | X | | X | | Copy of Modification No. 1 and No. 2 dated June 3, 1966 and January 7, 1967, respectively, to Inter-Company Power Agreement dated July 10, 1953. [Filed as Exhibits 4(a)(8) and 4(a)(10) to LG&E’s Registration Statement 2-26063 and incorporated by reference herein] |
| | | | | | |
10.03 | | X | | X | | Copies of Amendments to Agreements (iii) and (iv) referred to under 10.01above as follows: (i) Amendment to Inter-Company Bond Agreement and (ii) Amendment to Inter-Company Bank Credit Agreement. [Filed as Exhibit 5.02h to LG&E’s Registration Statement 2-61607 and incorporated by reference herein] |
| | | | | | |
10.04 | | X | | X | | Copy of Modification No. 1, dated August 20, 1958, to First Supplementary Transmission Agreement, dated July 10, 1953, among Ohio Valley Electric Corporation and the Sponsoring Companies. [Filed as Exhibit 5.02i to LG&E’s Registration Statement 2-61607 and incorporated by reference herein] |
| | | | | | |
10.05 | | X | | X | | Copy of Modification No. 2, dated April 1, 1965, to the First Supplementary Transmission Agreement, dated July 10, 1953, among Ohio Valley Electric Corporation and the Sponsoring Companies. [Filed as Exhibit 5.02j to LG&E’s Registration Statement 2-61607 and incorporated by reference herein] |
| | | | | | |
10.06 | | X | | X | | Copy of Modification No. 3, dated January 20, 1967, to First |
154
| | | | | | Supplementary Transmission Agreement, dated July 10, 1953, among Ohio Valley Electric Corporation and the Sponsoring Companies. [Filed as Exhibit 4(a)(7) to LG&E’s Registration Statement 2-26063 and incorporated by reference herein] |
| | | | | | |
10.07 | | X | | X | | Copy of Modification No. 3 dated November 15, 1967, to the Inter-Company Power Agreement dated July 10, 1953. [Filed as Exhibit 4.02m to LG&E’s Registration Statement 2-37368 and incorporated by reference herein] |
| | | | | | |
10.08 | | X | | X | | Copy of Modification No. 4 dated November 5, 1975, to the Inter-Company Power Agreement dated July 10, 1953. [Filed as Exhibit 5.02o to LG&E’s Registration Statement 2-56357 and incorporated by reference herein] |
| | | | | | |
10.09 | | X | | X | | Copy of Modification No. 4 dated April 30, 1976, to First Supplementary Transmission Agreement, dated July 10, 1953, among Ohio Valley Electric Corporation and the Sponsoring Companies. [Filed as Exhibit 5.02p to LG&E’s Registration Statement 2-61607 and incorporated by reference herein] |
| | | | | | |
10.10 | | X | | X | | Copy of Modification No. 5 dated September 1, 1979, to Inter-Company Power Agreement dated July 5, 1953, among Ohio Valley Electric Corporation and Sponsoring Companies. [Filed as Exhibit 4 to LG&E’s Annual Report on Form 10-K for the year ended December 31, 1979, and incorporated by reference herein] |
| | | | | | |
10.11 | | X | | X | | Copy of Modification No. 6 dated August 1, 1981, to Inter-Company Power Agreement dated July 5, 1953, among Ohio Valley Electric Corporation and Sponsoring Companies. [Filed as Exhibit 10.26 to LG&E’s Annual Report on Form 10-K for the year ended December 31, 1981, and incorporated by reference herein] |
| | | | | | |
10.12 | | X | | X | | * Copy of Non-Qualified Savings Plan covering officers of the Company, effective January 1, 1992. [Filed as Exhibit 10.43 to the Company’s Annual Report on Form 10-K for the year ended December 31, 1992, and incorporated by reference herein] |
| | | | | | |
10.13 | | X | | X | | Copy of Modification No. 7 dated January 15, 1992, to Inter-Company Power Agreement dated July 10, 1953, among Ohio Valley Electric Corporation and Sponsoring Companies. [Filed as Exhibit 10.44 to LG&E’s Annual Report on Form 10-K for the year ended December 31, 1993, and incorporated by reference herein] |
| | | | | | |
10.14 | | X | | X | | Copy of Modification No. 8 dated January 19, 1994, to Inter-Company Power Agreement, dated July 10, 1953, among Ohio Valley Electric |
155
| | | | | | Corporation and the Sponsoring Companies. [Filed as Exhibit 10.43 to LG&E’s Annual Report on Form 10-K for the year ended December 31, 1995, and incorporated by reference herein] |
| | | | | | |
10.15 | | X | | X | | Copy of Modification No. 9, dated August 17, 1995, to the Inter-Company Power Agreement dated July 10, 1953, among Ohio Valley Electric Corporation and the Sponsoring Companies. [Filed as Exhibit 10.39 to LG&E’s Annual Report on Form 10-K for the year ended December 31, 1996, and incorporated by reference herein] |
| | | | | | |
10.16 | | X | | X | | * Copy of Amendment to the Non-Qualified Savings Plan, effective January 1, 1992. [Filed as Exhibit 10.55 to LG&E’s Annual Report on Form 10-K for the year ended December 31, 1995, and incorporated by reference herein] |
| | | | | | |
10.17 | | X | | X | | * Copy of Amendment to the Non-Qualified Savings Plan, effective January 1, 1995. [Filed as Exhibit 10.56 to LG&E’s Annual Report on Form 10-K for the year ended December 31, 1995, and incorporated by reference herein] |
| | | | | | |
10.18 | | X | | X | | * Copy of Amendment to the Non-Qualified Savings Plan, effective January 1, 1995. [Filed as Exhibit 10.57 to LG&E’s Annual Report on Form 10-K for the year ended December 31, 1995, and incorporated by reference herein] |
| | | | | | |
10.19 | | X | | X | | * Copy of Supplemental Executive Retirement Plan as amended through January 1, 1998, covering officers of LG&E Energy. [Filed as Exhibit 10.74 to LG&E Energy’s Annual Report on Form 10-K for the year ended December 31, 1997, and incorporated by reference herein] |
| | | | | | |
10.20 | | X | | X | | * Copy of Amendment to LG&E Energy’s Supplemental Executive Retirement Plan, effective September 2, 1998. [Filed as Exhibit 10.90 to LG&E Energy’s Annual Report on Form 10-K for the year ended December 31, 1998 and incorporated by reference herein] |
| | | | | | |
10.21 | | X | | X | | * Copy of Employment and Severance Agreement, dated as of February 25, 2000, by and among LG&E Energy, Powergen plc and an executive officer of the Company. [Filed as Exhibit 10.54 to LG&E’s Annual Report on Form 10-K for the year ended December 31, 2002, and incorporated by reference herein.] |
| | | | | | |
10.22 | | X | | X | | * Copy of Amendment, effective October 1, 1999, to LG&E Energy’s Non-Qualified Savings Plan. [Filed as Exhibit 10.96 to LG&E’s and KU’s Annual Report on Form 10-K for the year ended December 31, 1999, and incorporated by reference herein] |
156
10.23 | | X | | X | | * Copy of Amendment, effective December 1, 1999, to LG&E Energy’s Non-Qualified Savings Plan. [Filed as Exhibit 10.97 to LG&E’s and KU’s Annual Report on Form 10-K for the year ended December 31, 1999, and incorporated by reference herein] |
| | | | | | |
10.24 | | X | | X | | Copy of Modification No. 10, dated January 1, 1998, to the Inter-Company Power Agreement dated July 10, 1953, among Ohio Valley Electric Corporation and the Sponsoring Companies. [Filed as Exhibit 10.102 to LG&E’s and KU’s Annual Report on Form 10-K for the year ended December 31, 1999, and incorporated by reference herein] |
| | | | | | |
10.25 | | X | | X | | Copy of Modification No. 11, dated April 1, 1999, to the Inter-Company Power Agreement dated July 10, 1953, among Ohio Valley Electric Corporation and the Sponsoring Companies. [Filed as Exhibit 10.103 to LG&E’s and KU’s Annual Report on Form 10-K for the year ended December 31, 1999, and incorporated by reference herein] |
| | | | | | |
10.26 | | X | | X | | * Copy of Powergen Short-Term Incentive Plan, effective January 1, 2001, applicable to certain employees of LG&E Energy Corp. and its subsidiaries. [Filed as Exhibit 10.109 to LG&E’s Annual Report on Form 10-K for the year ended December 31, 2000, and incorporated herein by reference] |
| | | | | | |
10.27 | | X | | X | | * Copy of two forms of Change-In-Control Agreement applicable to certain employees of LG&E Energy Corp. and its subsidiaries. [Filed as Exhibit 10.110 to LG&E’s Annual Report on Form 10-K for the year ended December 31, 2000, and incorporated by reference herein] |
| | | | | | |
10.28 | | X | | X | | * Copy of Employment and Severance Agreement, dated as of February 25, 2000, and amendments thereto dated December 8, 2000 and April 30, 2001, by and among LG&E Energy, Powergen plc and Victor A. Staffieri. [Filed as Exhibit 10.74 to LG&E’s and KU’s Annual Report on Form 10-K/A for the year ended December 31, 2001, and incorporated by reference herein] |
| | | | | | |
10.29 | | X | | X | | * Copy of Amendment, dated as of December 8, 2000, to Employment and Severance Agreement dated as of February 25, 2000, by and among LG&E Energy, Powergen plc and an executive officer of the Company. [Filed as Exhibit 10.63 to LG&E’s and KU’s Annual Report on Form 10-K for the year ended December 31, 2002, and incorporated by reference herein] |
| | | | | | |
10.30 | | X | | X | | *Copy of Third Amendment, dated July 1, 2002, to Employment and Severance Agreement dated as of February 25, 2000 by and among E.ON AG, LG&E Energy, Powergen and Victor A. Staffieri. [Filed as Exhibit 10.74 to LG&E’s and KU’s Annual Report on Form 10-K for |
157
| | | | | | the year ended December 31, 2002, and incorporated by reference herein] |
| | | | | | |
10.31 | | X | | X | | *Copy of form of Retention and Severance Agreement dated April/May, 2002 by and among LG&E Energy, E.ON AG and certain executive officers of the Companies. [Filed as Exhibit 10.75 to LG&E’s and KU’s Annual Report on Form 10-K for the year ended December 31, 2002, and incorporated by reference herein] |
| | | | | | |
10.32 | | X | | X | | *Copy of Second Amendment, dated May 20, 2002, to Employment and Severance Agreement, dated February 25, 2000, by and among E.ON AG, LG&E Energy Corp., Powergen plc and an executive of the Companies. [Filed as Exhibit 10.76 to LG&E’s and KU’s Annual Report on Form 10-K for the year ended December 31, 2002, and incorporated by reference herein] |
| | | | | | |
10.33 | | X | | X | | *Copy of Representative Terms and Conditions for Stock Appreciation Rights Issued as part of E.ON Group’s Stock Appreciation Rights Programs, applicable to certain executive officers of the Companies. [Filed as Exhibit 10.79 to LG&E’s and KU’s Annual Report on Form 10-K for the year ended December 31, 2002, and incorporated by reference herein] |
| | | | | | |
10.34 | | X | | X | | *Copy of LG&E Energy Corp. Long-Term Performance Unit Plan, adopted April 25, 2003, effective January 1, 2003. [Filed as Exhibit 10.65 to LG&E and KU’s Annual Report on Form 10-K for the year ended December 31, 2003, and incorporated by reference herein] |
| | | | | | |
10.35 | | X | | X | | Copy of Modification No. 12 dated as of November 1, 1999, to Inter-Company Power Agreement dated July 10, 1953 among Ohio Valley Electric Corporation and Sponsoring Companies. [Filed as Exhibit 10.69 to LG&E and KU’s Annual Report on Form 10-K for the year ended December 31, 2003, and incorporated by reference herein] |
| | | | | | |
10.36 | | X | | X | | Copy of Modification No. 13 dated as of May 24, 2000, to Inter-Company Power Agreement dated July 10, 1953 among Ohio Valley Electric Corporation and Sponsoring Companies. [Filed as Exhibit 10.70 to LG&E and KU’s Annual Report on Form 10-K for the year ended December 31, 2003, and incorporated by reference herein] |
| | | | | | |
10.37 | | X | | X | | Copy of Modification No. 14 dated as of April 1, 2001, to Inter-Company Power Agreement dated July 10, 1953 among Ohio Valley Electric Corporation and Sponsoring Companies. [Filed as Exhibit 10.71 to LG&E and KU’s Annual Report on Form 10-K for the year ended December 31, 2003, and incorporated by reference herein] |
158
10.38 | | X | | X | | Copy of Amended and Restated Inter-company Power Agreement dated as of March 13, 2006, among Ohio Valley Electric Corporation and sponsoring companies, including LG&E and KU [Filed as Exhibit 10.1 to LG&E and KU’s Form 10-Q for the period ended June 30, 2004 and incorporated by reference herein] |
| | | | | | |
10.39 | | X | | X | | *Copy of Fourth Amendment dated as of February 1, 2004 to Employment and Severance Agreement dated as of February 25, 2000 by and among E.ON AG, LG&E Energy, Powergen and Victor A. Staffieri [Filed as Exhibit 10.02 to LG&E and KU’s Form 10-Q for the period ended June 30, 2004 and incorporated by reference herein] |
| | | | | | |
10.40 | | X | | X | | Copy of Modification No. 15, dated as of April 30, 2004, to Inter-Company Power Agreement dated July 10, 1953 among Ohio Valley Electric Corporation and Sponsoring Companies [Filed as Exhibit 10.03 to LG&E and KU’s Form 10-Q for the period ended June 30, 2004 and incorporated by reference herein] |
| | | | | | |
10.41 | | X | | | | Participation Agreement between LG&E and Illinois Municipal Electric Agency, dated as of September 24, 1990. [Filed as Exhibit 10.42 to LG&E’s Annual Report on Form 10-K for the year ended December 31, 2004 and incorporated by reference herein] |
| | | | | | |
10.42 | | X | | | | Participation Agreement between LG&E and Indiana Municipal Power Agency, dated as of February 1, 1993. [Filed as Exhibit 10.43 to LG&E’s Annual Report on Form 10-K for the year ended December 31, 2004, and incorporated by reference herein] |
| | | | | | |
10.43 | | X | | X | | Participation Agreement by and among LG&E and KU and Illinois Municipal Electric Agency and Indiana Municipal Power Agency, dated as of February 9, 2004. [Filed as Exhibit 10.44 to LG&E and KU’s Annual Report on Form 10-K for the year ended December 31, 2004, and incorporated by reference herein] |
| | | | | | |
10.44 | | X | | X | | Copy of Barge Transportation Agreement between LG&E, effective January 1, 2002, and KU, effective July 1, 2002, and Crounse Corporation. [Filed as Exhibit 10.45 to LG&E and KU’s Annual Report on Form 10-K for the year ended December 31, 2004, and incorporated by reference herein] |
| | | | | | |
10.45 | | X | | X | | Amendment No. 1 to Barge Transportation Agreement between |
159
| | | | | | Louisville Gas and Electric Company and Kentucky Utilities Company and Crounse Corporation, dated as of January 1, 2005. |
| | | | | | |
10.46 | | X | | X | | * Copy of LG&E Energy LLC Nonqualified Savings Plan, effective January 1, 2005 |
| | | | | | |
10.47 | | X | | X | | * Executive Officer Salary Information. |
| | | | | | |
10.48 | | X | | X | | * Form of Representative Specimen Award under LG&E Energy Long-Term Performance Unit Plan [Filed as Exhibit 10.47 to LG&E and KU’s Annual Report on Form 10-K for the year ended December 31, 2004, and incorporated by reference herein] |
| | | | | | |
10.49 | | X | | X | | * Form of Representative Specimen Award under E.ON Group Stock Appreciation Rights Program [Filed as Exhibit 10.48 to LG&E and KU’s Annual Report on Form 10-K for the year ended December 31, 2004, and incorporated by reference herein] |
| | | | | | |
12 | | X | | X | | Computation of Ratio of Earnings to Fixed Charges for LG&E and KU. |
| | | | | | |
21 | | X | | X | | Subsidiaries of the Registrants. |
| | | | | | |
24 | | X | | X | | Powers of Attorney. |
| | | | | | |
31.1 | | X | | | | Certification of Chief Executive Officer, Pursuant to Section 302 of Sarbanes-Oxley Act of 2002. |
| | | | | | |
31.2 | | X | | | | Certification of Chief Financial Officer, Pursuant to Section 302 of Sarbanes-Oxley Act of 2002. |
| | | | | | |
31.3 | | | | X | | Certification of Chief Executive Officer, Pursuant to Section 302 of Sarbanes-Oxley Act of 2002. |
| | | | | | |
31.4 | | | | X | | Certification of Chief Financial Officer, Pursuant to Section 302 of Sarbanes-Oxley Act of 2002. |
| | | | | | |
32 | | X | | X | | Certifications pursuant to Section 906 of the Sarbanes-Oxley Act of 2002. |
| | | | | | |
99.01 | | X | | X | | Cautionary Statement for purposes of the “Safe Harbor” provisions of the Private Securities Litigation Reform Act of 1995. |
| | | | | | |
99.02 | | X | | X | | LG&E and KU Director and Officer Information. |
Executive Compensation Plans and Arrangements
Exhibits preceded by an asterisk (“*”) above are management contracts, compensation plans or arrangements required to be identified pursuant to Item 15(a)(3) of form 10-K.
Certain Available Instruments
Pursuant to Item 601(b)(4)(iii)(A) of Regulation S-K, certain instruments defining the rights of holders of certain long-term debt of LG&E or KU have not been filed with the Securities and Exchange Commission but will be furnished to the Commission upon request.
160
Schedule II
Louisville Gas and Electric Company
Schedule II - Valuation and Qualifying Accounts
For the Three Years Ended December 31, 2005
(Millions of $)
| | Other
Property
and
Investments | | Accounts
Receivable
(Uncollectible
Accounts) | |
| | | | | |
Balance December 31, 2002 | | $ | 0.1 | | $ | 2.1 | |
| | | | | |
Additions: | | | | | |
Charged to costs and expenses | | — | | 5.5 | |
| | | | | |
Deductions: | | | | | |
Net charges of nature for which reserves were created | | — | | 4.1 | |
| | | | | |
Balance December 31, 2003 | | 0.1 | | 3.5 | |
| | | | | |
Additions: | | | | | |
Charged to costs and expenses | | — | | 1.9 | |
| | | | | |
Deductions: | | | | | |
Net charges of nature for which reserves were created | | — | | 4.6 | |
| | | | | |
Balance December 31, 2004 | | 0.1 | | 0.8 | |
| | | | | |
Additions: | | | | | |
Charged to costs and expenses | | — | | 3.1 | |
| | | | | |
Deductions: | | | | | |
Net charges of nature for which reserves were created | | — | | 2.8 | |
| | | | | |
Balance December 31, 2005 | | $ | 0.1 | | $ | 1.1 | |
161
Schedule II
Kentucky Utilities Company
Schedule II - Valuation and Qualifying Accounts
For the Three Years Ended December 31, 2005
(Millions of $)
| | Other
Property
and
Investments | | Accounts
Receivable
(Uncollectible
Accounts) | |
| | | | | |
Balance December 31, 2002 | | $ | 0.1 | | $ | 0.8 | |
| | | | | |
Additions: | | | | | |
Charged to costs and expenses | | — | | 1.5 | |
| | | | | |
Deductions: | | | | | |
Net charges of nature for which reserves were created | | — | | 1.6 | |
| | | | | |
Balance December 31, 2003 | | 0.1 | | 0.7 | |
| | | | | |
Additions: | | | | | |
Charged to costs and expenses | | — | | 1.2 | |
| | | | | |
Deductions: | | | | | |
Net charges of nature for which reserves were created | | — | | 1.3 | |
| | | | | |
Balance December 31, 2004 | | 0.1 | | 0.6 | |
| | | | | |
Additions: | | | | | |
Charged to costs and expenses | | — | | 2.3 | |
| | | | | |
Deductions: | | | | | |
Net charges of nature for which reserves were created | | — | | 1.4 | |
| | | | | |
Balance December 31, 2005 | | $ | 0.1 | | $ | 1.5 | |
162
SIGNATURES – LOUISVILLE GAS AND ELECTRIC COMPANY
Pursuant to the requirements of Section 13 or 15(d) of the Securities Exchange Act of 1934, the registrant has duly caused this report to be signed on its behalf by the undersigned, thereunto duly authorized.
| LOUISVILLE GAS AND ELECTRIC COMPANY |
| Registrant |
| |
March 29, 2006 | /s/ S. Bradford Rives | |
(Date) | S. Bradford Rives |
| Chief Financial Officer |
Pursuant to the requirements of the Securities Exchange Act of 1934, this report has been signed below by the following persons on behalf of the registrant and in the capacities and on the date indicated.
Signature | | Title | | Date |
| | | | |
Victor A. Staffieri | | Chairman of the Board, | | |
| | President and Chief Executive Officer | | |
| | (Principal Executive Officer); | | |
| | | | |
S. Bradford Rives | | Director and Chief Financial Officer | | |
| | (Principal Financial Officer and Principal Accounting Officer); | | |
| | | | |
John R. McCall | | Director and Executive Vice President, | | |
| | General Counsel and Corporate Secretary | | |
| | | | |
Chris Hermann | | Director and Senior Vice President, Energy Delivery | | |
| | | | |
Paul W. Thompson | | Director and Senior Vice President, Energy Services | | |
| | | | |
| | | | |
By | /s/ S. Bradford Rives | | | | | March 29, 2006 |
| (Attorney-In-Fact) | | | | |
| | | | | | |
163
SIGNATURES – KENTUCKY UTILITIES COMPANY
Pursuant to the requirements of Section 13 or 15(d) of the Securities Exchange Act of 1934, the registrant has duly caused this report to be signed on its behalf by the undersigned, thereunto duly authorized.
| KENTUCKY UTILITIES COMPANY |
| Registrant |
| |
March 29, 2006 | /s/ S. Bradford Rives | |
(Date) | S. Bradford Rives |
| Chief Financial Officer |
Pursuant to the requirements of the Securities Exchange Act of 1934, this report has been signed below by the following persons on behalf of the registrant and in the capacities and on the date indicated.
Signature | | Title | | Date |
| | | | |
Victor A. Staffieri | | Chairman of the Board, | | |
| | President and Chief Executive Officer | | |
| | (Principal Executive Officer); | | |
| | | | |
S. Bradford Rives | | Director and Chief Financial Officer | | |
| | (Principal Financial Officer and Principal Accounting Officer); | | |
| | | | |
John R. McCall | | Director and Executive Vice President, | | |
| | General Counsel and Corporate Secretary | | |
| | | | |
Chris Hermann | | Director and Senior Vice President, Energy Delivery | | |
| | | | |
Paul W. Thompson | | Director and Senior Vice President, Energy Services | | |
| | | | |
| | | | |
| | | | |
| | | | |
By | /s/ S. Bradford Rives | | | | | March 29, 2006 |
| (Attorney-In-Fact) | | | | |
| | | | | | |
164