UNITED STATES
SECURITIES AND EXCHANGE COMMISSION
WASHINGTON, D.C. 20549
FORM 10-K
(Mark One)
| |
☒ | ANNUAL REPORT PURSUANT TO SECTION 13 OR 15(d) OF THE SECURITIES EXCHANGE ACT OF 1934 |
For the fiscal year ended December 31, 2024
Or
| |
☐ | TRANSITION REPORT PURSUANT TO SECTION 13 OR 15(d) OF THE SECURITIES EXCHANGE ACT OF 1934 |
For the transition period from __________ to __________
Commission File Number: 1-7677
LSB INDUSTRIES, INC.
(Exact Name of Registrant as Specified in its Charter)
| | |
Delaware | | 73-1015226 |
(State of or other Jurisdiction Incorporation or Organization) | | (I.R.S. Employer Identification No.) |
| | |
3503 NW 63rd Street, Suite 500, Oklahoma City, Oklahoma | | 73116 |
(Address of Principal Executive Offices) | | (Zip Code) |
Registrant's Telephone Number, Including Area Code: (405) 235-4546
Securities registered pursuant to Section 12(b) of the Act:
| | | | |
Title of each class | | Trading Symbol(s) | | Name of each exchange on which registered |
Common Stock, Par Value $.10 Preferred Stock Purchase Rights | | LXU N/A | | New York Stock Exchange New York Stock Exchange |
Securities registered pursuant to Section 12(g) of the Act: None
Indicate by check mark if the Registrant is a well-known seasoned issuer, as defined in Rule 405 of the Securities Act. ☐ Yes ☒ No
Indicate by check mark if the Registrant is not required to file reports pursuant to Section 13 or Section 15(d) of the Act. ☐ Yes ☒ No
Indicate by check mark whether the Registrant (1) has filed all reports required to be filed by Section 13 or 15(d) of the Securities Exchange Act of 1934 during the preceding 12 months (or for such shorter period that the Registrant was required to file such reports), and (2) has been subject to such filing requirements for the past 90 days. ☒ Yes ☐ No
Indicate by check mark whether the Registrant has submitted electronically every Interactive Data File required to be submitted pursuant to Rule 405 of Regulation S-T (§ 232.405 of this chapter) during the preceding 12 months (or for such shorter period that the Registrant was required to file such reports submit such files). ☒ Yes ☐ No
Indicate by check mark whether the Registrant is a large accelerated filer, an accelerated filer, a non-accelerated filer, a smaller reporting company or an emerging growth company. See the definitions of “large accelerated filer,” “accelerated filer,” “smaller reporting company,” and “emerging growth company” in Rule 12b-2 of the Exchange Act.
| | | | | | |
Large accelerated filer |
| ☐ |
| Accelerated filer |
| ☒ |
| | | |
Non-accelerated filer |
| ☐ |
| Smaller reporting company |
| ☐ |
| | | | | | |
| | | | Emerging growth company | | ☐ |
If an emerging growth company, indicate by check mark if the registrant has elected not to use the extended transition period for complying with any new or revised financial accounting standards provided pursuant to Section 13(a) of the Exchange Act. ☐
Indicate by check mark whether the registrant has filed a report on and attestation to its management’s assessment of the effectiveness of its internal control over financial reporting under Section 404(b) of the Sarbanes-Oxley Act (15 U.S.C. 7262(b)) by the registered public accounting firm that prepared or issued its audit report. ☒
If securities are registered pursuant to Section 12(b) of the Act, indicate by check mark whether the financial statements of the registrant included in the filing reflect the correction of an error to previously issued financial statements. ☐ Yes ☒ No
Indicate by check mark whether any of those error corrections are restatements that required a recovery analysis of incentive-based compensation received by any of the registrant’s executive officers during the relevant recovery period pursuant to § 240.10D-1(b). ☐
Indicate by check mark whether the Registrant is a shell company (as defined in Rule 12b-2 of the Act). ☐ Yes ☒ No
The aggregate market value of the Registrant’s voting common equity held by non-affiliates of the Registrant, computed by reference to the price at which the voting common stock was last sold as of June 28, 2024, was approximately $415 million. As a result, the Registrant is an accelerated filer as of December 31, 2024. For purposes of this computation, shares of the Registrant’s common stock beneficially owned by each executive officer and director of the Registrant and by TLB-LSB, LLC were deemed to be owned by affiliates of the Registrant as of June 28, 2024. Such determination should not be deemed an admission that such executive officers, directors or entity of our common stock are, in fact, affiliates of the Registrant or affiliates as of the date of this Form 10-K.
As of February 21, 2025, the Registrant had 71,849,398 shares of common stock outstanding.
DOCUMENTS INCORPORATED BY REFERENCE
Portions of the Registrant’s proxy statement for its 2025 annual meeting of stockholders will be filed with the Securities and Exchange Commission within 120 days after the end of its 2024 fiscal year, are incorporated by reference in Part III.
| | | | | |
Auditor Firm Id: | 00042 | Auditor Name: | Ernst & Young LLP | Auditor Location: | Oklahoma City, OK, United States |
SPECIAL NOTE REGARDING FORWARD-LOOKING STATEMENTS
Certain statements contained within this report may be deemed “Forward-Looking Statements.” within the meaning of United States federal securities laws. All statements in this report other than statements of historical fact are Forward-Looking Statements that are subject to known and unknown risks, uncertainties and other factors, many of which are difficult to predict or outside of the Company’s control, which could cause actual results and performance of the Company to differ materially from those expressed in, or implied or projected by, such statements. Any such Forward-Looking Statements are not guarantees of future performance. The words “believe,” “expect,” “anticipate,” “intend,” “plan,” “may,” “could,” and similar expressions identify Forward-Looking Statements. All Forward-Looking Statements speak only as of the date on which they are made. Forward-Looking Statements contained herein, and the associated risks, uncertainties, assumptions and other important factors include, but are not limited to, the following:
•our ability to invest in projects that will generate the best returns for our stockholders;
•our future liquidity outlook;
•the outlook of our chemical products and related markets;
•our ability to successfully leverage our existing business platform and portfolio of assets to produce low carbon products and execute our strategy to become a leader in the energy transition in the chemical industry;
•the amount, timing and effect on the nitrogen market from current nitrogen expansion projects;
•the effect from the lack of non-seasonal volume;
•our belief that competition is based upon service, price, location of production and distribution sites, and product quality and performance;
•the outlook for the industrial end markets;
•the availability of raw materials;
•our ability to broaden the distribution of our products, including our ability to leverage our nitric acid production capacity at our El Dorado Facility;
•our ongoing initiatives to increase the distribution of our products within our industrial end markets;
•the execution and success of our advanced low carbon ammonia initiatives;
•our expectations regarding future ammonia pricing;
•the result of our product and market diversification strategy;
•changes in domestic fertilizer production;
•the increasing output and capacity of our existing production facilities;
•production volumes at our production facilities;
•our ability to moderate risk inherent in agricultural markets;
•the sources to fund our cash needs and how this cash will be used;
•the ability to enter into the additional borrowings;
•the anticipated cost and timing of our capital projects;
•certain costs covered under warranty provisions;
•our ability to pass to our customers cost increases in the form of higher prices;
•our belief as to whether we have sufficient sources for materials and components;
•our beliefs regarding our estimates and contingencies with respect claims and legal actions in the ordinary course of our business and their effect on our business, financial condition, results of operations or cash flows;
•annual natural gas requirements;
•the development of the market and demand for low carbon ammonia;
•compliance by our facilities with the terms of our permits;
•the costs of compliance with environmental laws, health laws, security regulations and transportation regulations;
•our belief as to when Turnarounds will be performed and completed;
•expenses in connection with environmental projects;
•the effect of litigation and other contingencies, including the potential financial penalties associated with the NOV from ADEQ regarding wastewater discharges from our El Dorado Facility;
•the increase in interest expense;
•our ability to comply with debt servicing and covenants;
•our ability to meet debt maturities or redemption obligations when due;
•the impact of our repurchase program on our stock price and cash reserves; and
•our beliefs as to whether we can meet all required covenant tests for the next twelve months.
While we believe, the expectations reflected in such Forward-Looking Statements are reasonable, we can give no assurance such expectations will prove to have been correct. There are a variety of factors which could cause future outcomes to differ materially from those described in this report, including, but not limited to, the following:
•changes in general economic conditions, both domestic and foreign;
•material reductions in revenues;
•material changes in interest rates;
•our ability to collect in a timely manner a material amount of receivables;
•increased competitive pressures;
•adverse effects of increases in prices of raw materials;
•changes in federal, state and local laws and regulations, or in the interpretation of such laws and regulations;
•changes in laws, regulations or other issues related to climate change;
•releases of pollutants into the environment exceeding our permitted limits;
•material increases in equipment, maintenance, operating or labor costs not presently anticipated by us;
•the requirement to use internally generated funds for purposes not presently anticipated;
•the inability to secure additional financing for planned capital expenditures or financing obligations due in the near future;
•our substantial existing indebtedness;
•material changes in the cost of natural gas and certain precious metals;
•limitations due to financial covenants;
•the loss of any significant customer;
•increases in cost to maintain internal controls over financial reporting;
•changes in operating strategy or development plans;
•an inability to fund the working capital and expansion of our businesses;
•changes in the production efficiency of our facilities;
•adverse results in our contingencies including pending litigation;
•unplanned downtime at one or more of our chemical facilities;
•changes in production rates at any of our chemical plants;
•an inability to obtain necessary raw materials and purchased components;
•material increases in cost of raw materials;
•material changes in our accounting estimates;
•significant problems within our production equipment;
•fire or natural disasters;
•an inability to obtain or retain our insurance coverage;
•difficulty obtaining necessary permits;
•difficulty obtaining third-party financing;
•risks associated with proxy contests initiated by dissident stockholders;
•changes in fertilizer production;
•reduction in acres planted for crops requiring fertilizer;
•decreases in duties for products we sell resulting in an increase in imported products into the United States;
•adverse effects from regulatory policies, including tariffs;
•volatility of natural gas prices;
•price increases resulting from increased inflation;
•weather conditions, including the effects of climate change;
•increases in imported agricultural products;
•global supply chain disruptions;
•other factors described in Item 7. Management’s Discussion and Analysis of Financial Condition and Results of Operations contained in this report; and
•other factors described in Item 1A. Risk Factors contained in this report.
Given these uncertainties, all parties are cautioned not to place undue reliance on such Forward-Looking Statements. Except to the extent required by law, we disclaim any obligation to update any such factors or to publicly announce the result of any revisions to any of the Forward-Looking Statements contained herein to reflect future events or developments.
PART I
ITEM 1. BUSINESS
Overview
All references to “LSB Industries,” “LSB,” the “Company,” “we,” “us,” and “our” refer to LSB Industries, Inc. and its subsidiaries on a consolidated basis, except where the context makes clear that the reference is only to LSB Industries, Inc. itself and not its subsidiaries. Notes referenced throughout this document refer to consolidated financial statement footnote disclosures that are found in Item 8. Financial Statements and Supplementary Data of this report. Capitalized terms not otherwise defined herein shall have the meanings ascribed thereto under the heading “Special Note Regarding Forward-Looking Statements – Defined Terms.”
LSB is a Delaware corporation, formed in 1968, and headquartered in Oklahoma City, Oklahoma. LSB is committed to playing a leadership role in the energy transition through the production of low and no carbon products that build, feed and power the world. We seek to accomplish this goal through the manufacture and marketing of essential products for the agricultural and industrial markets, and in the future, energy markets, all with an emphasis on a culture of excellence in customer experience. The Company manufactures ammonia and ammonia-related products in El Dorado, Arkansas (the “El Dorado Facility”), Cherokee, Alabama (the “Cherokee Facility”), and Pryor, Oklahoma (the “Pryor Facility”), and operates a facility on behalf of Covestro LLC (“Covestro”) in Baytown, Texas (the “Baytown Facility”). Our products are sold through distributors and directly to end customers, such as farmers, ranchers, and fertilizer dealers, throughout the United States and parts of Canada, and to explosives manufacturers in the United States and other parts of North America.
Our Business
Our business manufactures products for two principal markets: (a) Agricultural and (b) Industrial. The chart below highlights representative products and applications in each of our end markets.
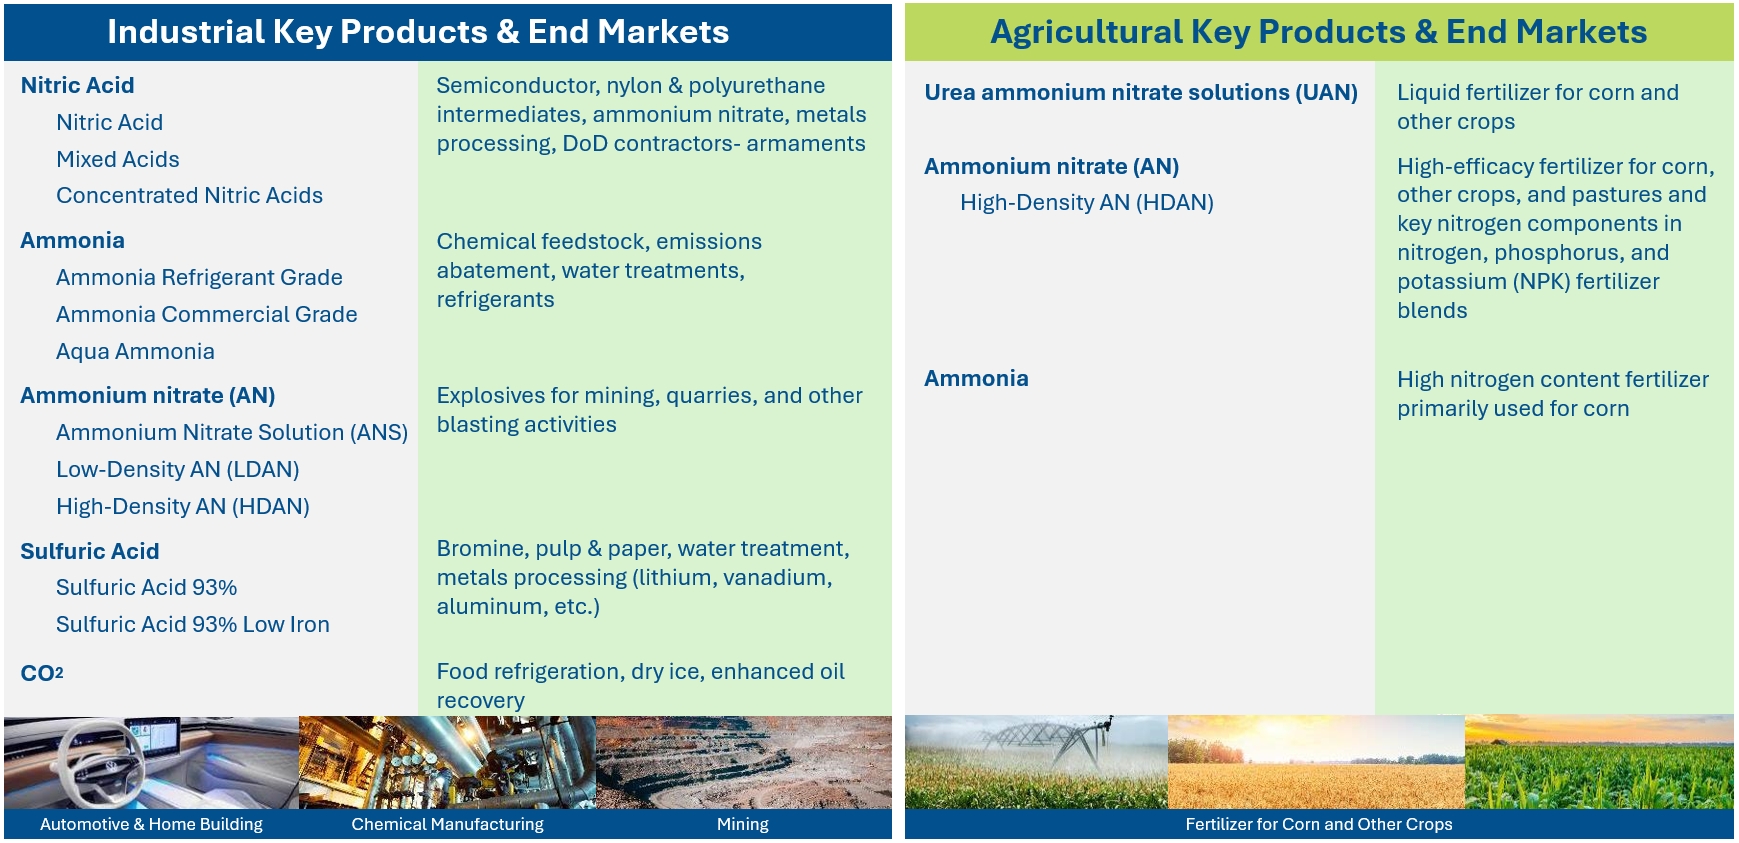
The products we manufacture at our facilities are primarily derived from natural gas (a raw material). Our facilities and production processes have been designed to produce products that are marketable at nearly each stage of production. This design has allowed us to develop and deploy a business model optimizing the mix of products to capture the value opportunities in the end markets we serve with a focus on balancing our production.
The following table summarizes net sales information relating to our products:
| | | | | | | | |
| | 2024 | | | 2023 | |
Percentage of consolidated net sales: | | | | | | |
AN & Nitric acid | | | 41 | % | | | 37 | % |
Urea ammonium nitrate (UAN) | | | 27 | % | | | 26 | % |
Ammonia | | | 26 | % | | | 28 | % |
Other | | | 6 | % | | | 9 | % |
| | | 100 | % | | | 100 | % |
For additional information regarding our net sales, operating results and total assets for the past three fiscal years, see the Consolidated Financial Statements included in this report.
Our Strategy
We aim to be a leader in the energy transition in the chemical industry through the production of low and no carbon products that build, feed and power the world. We plan to accomplish this goal by leveraging our existing business platform and portfolio of assets to produce low carbon products, utilizing our significant manufacturing expertise and experience in ammonia and hydrogen plant operations, optimizing our liquidity and free cash flows to generate growth, and creating a network of partners that bring additional knowledge, expertise and relationships.
With respect to our current portfolio of products, we pursue a strategy of balancing the sale of product as fertilizer into the agriculture markets at spot prices or short duration pre-sales and developing industrial customers that purchase substantial quantities of products, primarily under contractual obligations and/or pricing arrangements that generally provide for the pass through of some raw material and other manufacturing costs. We believe this product and market diversification strategy allows us to have more consistent levels of production compared to some of our competitors and helps reduce the volatility risk inherent in the prices of our raw material and/or the changes in demand for our products.
The strategy of developing industrial customers helps to moderate the risk inherent in the agricultural markets where spot sales prices of our agricultural products may not have a correlation to natural gas raw material costs but rather reflect market conditions for like and competing nitrogen sources. This volatility of sales pricing in our agricultural products may, from time to time, compromise our ability to recover our full cost to produce the product. Additionally, the lack of sufficient non-seasonal agricultural sales volume to operate our manufacturing facilities at optimum levels can preclude us from balancing production and storage capabilities. Looking forward, we remain focused on upgrading margins by maximizing downstream production. Our strategy calls for further development of industrial customers who assume the volatility risk associated with the raw material costs and mitigate the effects of seasonality in the agricultural sector.
Our strategy also includes evaluating further investments in low carbon opportunities, potential acquisitions of strategic assets or companies, joint ventures with other companies and investments in additional production capacity where we believe those acquisitions, joint ventures or expansion of production capacity will enhance the value of the Company and provide appropriate returns.
Key Operating Initiatives for 2025
As discussed in more detail under “Item 7. Management’s Discussion and Analysis of Financial Condition and Results of Operations–Key Operating Initiatives,” we believe our future results of operations and financial condition will depend significantly on our ability to successfully implement the following key initiatives:
•Investing to Improve Environmental, Health & Safety and Reliability at our Facilities while Supplying our Customers with Products of the Highest Quality;
•Continue Optimization and Increase the Breadth of Distribution of our Product Mix;
•Development of Low Carbon Ammonia and Clean Energy Projects;
•Evaluate and Pursue Organic Capacity Expansion; and
•Evaluate Acquisitions of Strategic Assets or Companies.
As for our liquidity, we had approximately $221 million of combined cash and cash equivalents, short-term investments and borrowing capacity at the end of 2024, which we believe provides us with ample liquidity to fund our operations and meet our current obligations. Also see discussions in “Item 7. Management’s Discussion and Analysis of Financial Condition and Results of Operations–Liquidity and Capital Resources”.
Our Competitive Strengths
Strategically Located Chemical Assets
Our business benefits from highly advantageous locations with logistical and distribution benefits. We have access to the Nustar ammonia pipeline from the Gulf Coast of the United States at our El Dorado Facility, which provides low-cost transportation to distribution points. The El Dorado Facility also has rail access providing favorable freight logistics to our industrial and agricultural customers and cost advantages when selling a number of our products west of the Mississippi River. Our Cherokee Facility is located east of the Mississippi River, allowing it to reach customers that are not freight logical for our competitors. Our Cherokee Facility sits adjacent to the Tennessee River, providing barge receipt and shipping access, in addition to truck and rail delivery access. Our Pryor Facility is located in the heart of the Southern Plains with strategic rail and truck delivery access.
Advantaged Raw Material Cost Position
We have access to low-cost (relative to international markets) natural gas in the United States, which allows for significant cost advantages as compared to comparable production facilities in Europe and other parts of the world.
Diversified Sources of Revenue
Our business serves a broad range of agricultural and industrial end markets, which we believe diminishes the cyclicality of our financial performance. The flexible nature of our production process and storage capability allows us the ability to shift our product mix based on end market demand.
Agricultural Market Conditions
As discussed in more detail under “Item 7. Management’s Discussion and Analysis of Financial Condition and Results of Operations–Key Industry Factors”, the price at which our agricultural products are ultimately sold depends on numerous factors, including the supply and demand for nitrogen fertilizers which, in turn, depends upon world grain demand and production levels, the cost and availability of transportation and storage, weather conditions, competitive pricing and the availability of imports, all of which impact competition. Additionally, expansions or upgrades of competitors’ facilities and international and domestic political and economic developments continue to play an important role in the global nitrogen fertilizer industry economics. These factors can affect, in addition to selling prices, the level of inventories in the market which can cause price volatility and affect product margins.
We sell our agricultural products at the current spot market price for either immediate shipment or as part of forward sales commitments, depending on fertilizer seasonality and our forward pricing point of view.
Looking forward to 2025, we expect ammonia pricing to moderate for a variety of reasons, including: the anticipated start-up of new production capacity in both the United States and internationally; an increase in Russian exports; and continued muted demand for nitrogen products from the global industrial sector, particularly in Asia. Upside to our pricing expectations could be driven by a variety of factors, including: a continued increase in energy prices; a strengthening Chinese economy driving increased industrial market demand; further delays in new production capacity coming online; gas curtailments in regions exporting ammonia; a lower interest rate environment; the potential impact of United States import tariffs; and supportive weather dynamics.
Agricultural Products
We produce and sell UAN, HDAN and ammonia, all of which are nitrogen-based fertilizers. We sell these agricultural products to farmers, ranchers, fertilizer dealers and distributors primarily in the ranch land and grain production markets in the United States. Our nitrogen-based fertilizers are used to grow food crops, biofuel feedstock crops, and pasture forage for grazing livestock and forage production. We maintain long-term relationships with wholesale agricultural distributors and retailers and also sell directly to agricultural end-users through our wholesale and retail distribution centers.
The demand for nitrogen fertilizer products in the agricultural industry is seasonal. If seasonal demand is less than we expect, we may be left with excess inventory that will have to be stored (in which case our results of operations will be negatively affected by any related increased storage costs) or liquidated (in which case the selling price may be below our production, procurement and storage costs).
Industrial Market Conditions
As discussed in more detail in “Item 7. Management’s Discussion and Analysis of Financial Condition and Results of Operations–Key Industry Factors,” in our industrial markets, our sales volumes are typically driven by changes in general economic conditions, energy prices, metals market prices and our contractual arrangements with certain large customers. For our other products, our sales volumes are typically driven by changes in the overall North American consumption levels of mining products, which can be impacted by weather. Additionally, changes in natural gas prices and demand in renewable power sources, such as wind and solar in the electrical generation sector, will impact demand for our other products and impact competition within the other sectors of this market.
Our industrial business competes based upon service, price and location of production and distribution sites, product quality and performance as part of the value-added services offered to certain customers.
Looking forward to 2025, we expect demand for our industrial products to be stable, despite persistent global economic challenges. We anticipate that nitric acid demand will remain steady, reflecting the strength of the United States economy and robust consumer spending levels. Demand for AN for use in mining applications should continue to benefit from positive exposure to copper, gold and iron ore mining, as well as continued attractive market fundamentals for aggregate production relating to infrastructure construction. While some degree of economic uncertainty persists, we believe that we have a meaningful degree of downside protection in our industrial business given our diverse customer base, the nature of our contracts and our ability to shift our production mix to products where demand and pricing are strongest.
Industrial Products
We manufacture and sell industrial acids and other chemical products primarily to the polyurethane intermediates, paper, fibers, emission control, and electronics industries. In addition, we produce and sell blended and regular nitric acid and industrial and high purity ammonia for many specialty applications, including the reduction of air emissions from power plants.
Sales of our industrial products are generally made to customers pursuant to sales contracts or pricing arrangements on terms that include the cost of the primary raw materials as a pass-through component in the sales price. These contractual sales stabilize the effect of commodity cost changes and fluctuations in demand for these products due to the cyclicality of the end markets.
We operate the Baytown Facility on behalf of Covestro and we believe it is one of the largest and most technologically advanced nitric acid manufacturing units in the United States. We operate and maintain this facility pursuant to a long-term operating contract in exchange for a management fee, which is not significant to our results of operations. The term of this agreement runs until October 2029 with options for renewal by mutual agreement between us and Covestro.
Our industrial products sales volumes are dependent upon general economic conditions, primarily in the housing, automotive, and paper industries. Our sale prices generally vary with the market price of ammonia, sulfur or natural gas, as applicable, in our pricing arrangements with customers.
We also produce and sell LDAN, HDAN and AN solution for use in other applications, which are primarily used as AN fuel oil and specialty emulsions for usage in the quarry and the construction industries and for metals mining. We have signed long-term contracts with certain customers that provide for the annual sale of LDAN mostly under natural gas cost pass through pricing arrangements. One of our customers has a plant located at our El Dorado Facility.
Raw Materials
The products we manufacture at our facilities are primarily derived from natural gas. This raw material is a commodity and subject to price fluctuations. Natural gas is the primary raw material for producing ammonia, UAN, nitric acid and acid blends and other products at our El Dorado, Cherokee and Pryor Facilities. During 2024, we purchased approximately 28.4 million MMBtus of natural gas.
The chemical facilities’ natural gas requirements are generally purchased at spot market price. Periodically, we enter into volume purchase commitments and/or forward contracts to fix the cost of certain expected natural gas requirements primarily to match quantities needed to produce product that have been sold forward. At December 31, 2024, we had natural gas contracts of approximately 0.6 million MMBtus, at an average cost of $3.70 per MMBtu. These contracts extend through March 2025.
See further discussion relating to the outlook for our business under “Item 7. Management’s Discussion and Analysis of Financial Condition and Results of Operations–Key Industry Factors.”
Competition
We operate in a highly competitive market with many other larger chemical companies, such as CF Industries Holdings, Inc., CVR Partners, Dyno Nobel, a subsidiary of Incitec Pivot Limited, Eurochem North America, Helm AG, Koch Industries, Macro-Source L.L.C., Nutrien, Orica Limited, and Yara International (some of whom are our customers), many of whom have greater financial and other resources than we do. We believe that competition within the markets we serve is primarily based upon service, price, location of production and distribution sites, and product quality and performance.
Customers
The principal customers for our products are distributors and end customers, such as farmers, ranchers, and fertilizer dealers and industrial users. Sales are generated by our internal marketing and sales force. For 2024, five customers accounted for approximately 30% of our consolidated net sales.
NOL Rights Agreement
We are party to an Amended and Restated Section 382 Rights Agreement (as amended, the “NOL Rights Agreement”) with Computershare Trust Company, N.A., as rights agent.
The purpose of the NOL Rights Agreement is to facilitate our ability to preserve our NOLs and other tax attributes in order to be able to offset potential future income taxes for federal income tax purposes. Our ability to use these NOLs and other tax attributes would be substantially limited if we experience an “ownership change,” as defined in Section 382 of the Internal Revenue Code of 1986, as amended (the “Code”). A company generally experiences an ownership change if the percentage of the value of its stock owned by certain 5% stockholders, as defined in Section 382 of the Code, increases by more than 50% points over a rolling three-year period. The NOL Rights Agreement is intended to reduce the likelihood of an ownership change under Section 382 of the Code by deterring any person (as defined in the NOL Rights Agreement) or group of affiliated or associated persons from acquiring beneficial ownership of 4.9% or more of our outstanding shares of common stock.
The rights issued under the NOL Rights Agreement will expire on the earliest to occur of (i) the date on which our Board of Directors (the “Board”) determines in its sole discretion that (x) the NOL Rights Agreement is no longer necessary for the preservation of material valuable NOLs or tax attributes or (y) the NOLs and tax attributes have been fully utilized and may no longer be carried forward and (ii) the close of business on August 22, 2026.
Our Board may, in its discretion, determine that a person, entity or a certain transaction is exempt from the operation of the NOL Rights Agreement or amend the terms of the rights.
Human Capital Resources
As of December 31, 2024, we employed 583 persons, 164 of whom are represented by unions under collective bargaining agreements. We have three union contracts, one of which was ratified in 2024 and the remaining two of which were last ratified in 2022 and are scheduled to be considered for ratification in 2025.
Oversight & Management
Our success depends on the capabilities and strength of our workforce. Our Chief Human Resources Officer (“CHRO”) is responsible for developing and executing our human capital strategy. This strategy includes the acquisition, development, and retention of talent as well as the enhancement of benefits and employee experience to deliver on our overall strategy. Our CHRO regularly updates our Board on the operation and status of these human capital activities including:
•Training & Development– We are committed to the continued development of our employees through training opportunities, annual reviews and development action plans. We provide formal training to our frontline supervisors focusing on foundational leadership capabilities. Annual reviews of talent occur across all operational business units and corporate functions. It is the responsibility of the CEO, CHRO and the executive staff to review talent data on an annual basis and plan development actions to ensure succession and continuous improvement and growth.
•Engagement – We believe that we have favorable relations with our employees. We take proactive measures, such as conducting employee surveys and focus groups, to help us understand employee engagement. We then implement programs, based on the results, such as employee recognition and operationally-focused communications, that are specifically directed at improving engagement. Additionally, we conduct annual benefit benchmarking studies in an effort to ensure that any changes to benefits are improvements or add value for employees. Each of our business units conducts roundtable discussions to develop action plans to improve the work environment and culture.
•Health and Safety – Our Health and Safety Management System continues to build to establish a consistent and robust approach to enhance safety and a culture of compliance at each business unit. This system is guided by an executive committee that provides focus and priority to compliance and industry best practices that protect our employees while performing work within our operations. Each business team is responsible for evaluating its unique operations and applying the defined controls to engage employees and manage risk. We use leading and lagging metrics, such as near miss tracking, assigning potential risk consequences to events, incident tracking, and releases to monitor our performance and effectiveness across our operations and individual business teams. Events are investigated based on risk using root cause analysis tools and corrective actions are tracked to ensure prevention. In addition, the management system includes periodic third-party audits and internal self-assessment to continuously improve.
Government Regulation
Our facilities and operations are subject to numerous federal, state and local laws and regulations regarding environmental, health and safety, including laws and regulations relating to the generation and handling of hazardous substances and wastes, the introduction of new chemicals or substances to the market, the investigation and remediation of contamination, spills or releases and the discharge or emissions of regulated substances to the air, water or soils. These laws and regulations provide for certain performance obligations and in some cases require us to obtain and maintain permits for our operations. The failure to comply with these laws and regulations can result in substantial administrative, civil and criminal fines, injunctive relief and criminal sanctions. Compliance with and changes to these laws and regulations may adversely affect our business, results or operations and financial condition.
Certain of these laws and regulations impose strict liability as well as joint and several liability for costs required to remediate and restore sites that we own or operate or that we have formerly owned or operated, as well as sites where hazardous substances,
hydrocarbons, solid wastes or other materials from our operations have been stored, disposed or released, regardless of whether such contamination resulted from the conduct of others or from consequences of our own actions that were in compliance with all applicable laws at the time those actions were taken.
We may incur material costs or liabilities in complying with such laws and pay fines or penalties for violation of such laws. Our insurance may not cover all environmental risks and costs or may not provide sufficient coverage if an environmental claim is made against us. These laws and regulations (including enforcement policies thereunder) have in the past resulted, and could in the future result, in significant compliance expenses, cleanup costs (for our sites or third-party sites where we disposed our wastes), penalties or other liabilities relating to the handling, manufacture, use, emission, discharge or disposal of materials at or from our facilities or the use or disposal of certain of its chemical products. Historically, we have incurred significant expenditures in order to comply with these laws and regulations and are reasonably expected to do so in the future. Changes in these laws and regulations, and changes in the interpretations of such laws and regulations by the regulatory bodies impact the costs of compliance and may impact the demands for our products. We will also be obligated to manage certain discharge water outlets and monitor groundwater contaminants at our chemical facilities should we discontinue the operations of a facility.
We have obtained and maintain numerous environmental permits and approvals in connection with the operations of our facilities. Changes to our facilities or new facilities or operations may require new or amended permits, and many of our existing permits require periodic renewal. If the regulatory body were to deny or delay issuing a permit or permit amendment or were to modify an existing permit or approval, we could experience a material adverse impact on our ability to operate or the costs of our operations. The requirement to obtain permits and authorizations may also impact our ability to construct new operations or to make changes to existing operations.
Also see discussions concerning our risk factors under “Item 1A. Risk Factors” of this report.
Available Information
We make available free of charge through our Internet website (www.lsbindustries.com) or by calling Investor Relations (405) 510-3550 our Annual Reports on Form 10-K, Quarterly Reports on Form 10-Q, Current Reports on Form 8-K and, if applicable, amendments to those reports filed or furnished pursuant to Section 13(a) of the Exchange Act of 1934, as amended (the “Exchange Act”) as soon as reasonably practicable after we electronically file such material with, or furnish it to, the Securities and Exchange Commission (the “SEC”). In addition to the reports filed or furnished with the SEC, we publicly disclose material information from time to time in press releases, at annual meetings of stockholders, in publicly accessible conferences and investor presentations, and through our website. The information included on our website does not constitute part of this Annual Report on Form 10-K.
ITEM 1A. RISK FACTORS
Risks Relating to Our Business
Cost and the lack of availability of raw materials could materially affect our profitability.
Our sales and profits are heavily affected by the costs and availability of primary raw materials. These primary raw materials are typically subject to considerable price volatility, and recent global supply chain disruptions and increased inflation in the United States have led to further heightened volatility. Historically, when there have been rapid increases in the cost of these primary raw materials, we have sometimes been unable to timely increase our sales prices to cover all of the higher costs incurred. While we periodically enter into futures/forward contracts to economically hedge against price increases in certain of these raw materials, we may not effectively manage against price fluctuations in those raw materials.
Natural gas represents the primary raw material in the production of most of our chemical products. Although we enter into contracts with certain customers that provide for the pass-through of raw material costs, we have a substantial amount of sales that do not provide for the pass-through of raw material costs. Also, the spot sales prices of our agricultural products may not correlate to the cost of natural gas but rather reflect market conditions for similar and competing nitrogen sources. This lack of correlation can compromise our ability to recover our full cost to produce the products in this market. As a result, in the future, we may not be able to pass along to all of our customers the full amount of any increases in raw material costs. Future price fluctuations in our raw materials may have an adverse effect on our business, financial condition, liquidity and results of operations.
Additionally, we depend on certain vendors to deliver natural gas and other key components that are required in the production of our products. Any disruption in the supply of natural gas and other key components could result in lost production or delayed shipments.
The price of natural gas in North America and worldwide has been volatile in recent years and had declined on average due in part to the development of significant natural gas reserves, including shale gas, and the rapid improvement in shale gas extraction techniques, such as hydraulic fracturing and horizontal drilling. However, recent disruptions in the global supply chain may continue to have an impact in the near term in fiscal year 2025. Future production of natural gas from shale formations could be reduced by regulatory changes that restrict drilling or hydraulic fracturing or increase its cost or by reduction in oil exploration and development prompted by lower oil prices and resulting in production of less associated natural gas. Additionally, increased demand for natural gas, particularly in the Gulf Coast Region, due to increased industrial demand and increased natural gas exports could result in increased natural gas prices.
We have suspended in the past, and could suspend in the future, production at our chemical facilities due to, among other things, the high cost or lack of availability of natural gas and other key components, which could adversely affect our competitiveness in the markets we serve. Accordingly, our business, financial condition, liquidity and results of operations could be materially affected in the future by the lack of availability of natural gas and other key components and increase costs relating to the purchase of natural gas and other key components.
We are reliant on a limited number of key facilities.
We manufacture products at four facilities. Operational disruptions could occur for many reasons, including natural disaster, weather, unplanned maintenance and other manufacturing problems, disease, strikes or other labor unrest or transportation interruptions. Extreme weather events, including temperature extremes, depending on the severity and location, have the potential not only to damage our facilities and disrupt our operations, but also to affect adversely the distribution of our products. Moreover, our facilities may be subject to failure of equipment that may be difficult to replace or have long delivery lead times, due in part to a limited number of suppliers and could result in operational disruptions. The suspension of operations at any of these facilities, or significant impacts on any of their operations as a result of supply chain disruption, could adversely affect our ability to produce our products and fulfill our commitments and could have a material adverse effect on our liquidity, financial condition, results of operations and business.
The age of our chemical manufacturing facilities increases the risk for unplanned downtime, which may be significant.
Our business is comprised of operating units of various ages and levels of automated control. While we have continued to make significant annual capital improvements, potential age or control-related issues have occurred in the past and may occur in the future, which could cause damage to the equipment and ancillary facilities. As a result, we have experienced and may continue to experience additional downtime at our chemical facilities in the future.
The equipment required for the manufacture of our products is specialized, and the time for replacement of such equipment can be lengthy, resulting in extended downtime in the affected unit. In addition, the cost for such equipment could be influenced by changes in regulatory policies (including tariffs) of foreign governments, as well as the U.S. laws and policies affecting foreign trade and investment. Although we use various reliability and inspection programs and maintain a significant inventory of spare equipment, which are intended to mitigate the extent of production losses, unplanned outages may still occur. As a result, these planned and unplanned downtime events at our chemical facilities have in the past and could in the future adversely affect our liquidity, operating results and financial condition.
Our operations and the production and handling of our products involve significant risks and hazards.
Our operations are subject to hazards inherent in the manufacture, transportation, storage and distribution of chemical products, including some products that are highly toxic and corrosive. These hazards include, among other things, explosions; fires; severe weather and natural disasters; train derailments, collisions, vessel groundings and other transportation and maritime incidents; leaks and ruptures involving storage tanks, pipelines and rail cars; spills, discharges and releases of toxic or hazardous substances or gases; deliberate sabotage and terrorist incidents; mechanical failures; unscheduled plant downtime; labor difficulties and other risks. Some of these hazards can cause bodily injury and loss of life, severe damage to or destruction of property and equipment and environmental damage and may result in suspension of operations for an extended period of time and/or the imposition of civil or criminal penalties and liabilities. We periodically experience minor releases of ammonia related to leaks from our equipment. Similar events may occur in the future. As a result, such events could have a material adverse effect on our results of operations and financial condition.
Our transportation and distribution activities rely on third-party providers, which subject us to risks and uncertainties beyond our control that may adversely affect our operations.
We rely on railroad, trucking, pipeline and other transportation service providers to transport raw materials to our manufacturing facilities, to coordinate and deliver finished products to our storage and distribution system and our retail centers and to ship finished products to our customers. These transportation operations, equipment and services are subject to various hazards, including adverse operating conditions, extreme weather conditions, system failures, work stoppages, equipment and personnel shortages, delays, accidents such as spills and derailments and other accidents and operating hazards.
In the event of a disruption of existing transportation or terminaling facilities for our products or raw materials, alternative transportation and terminaling facilities may not have sufficient capacity to fully serve all of our customers or facilities. An extended interruption in the delivery of our products to our customers or the supply of natural gas, ammonia or sulfur to our production facilities could adversely affect sales volumes and margins.
These transportation operations, equipment and services are also subject to environmental, safety, and regulatory oversight. Due to concerns related to accidents, terrorism or increasing concerns regarding transportation of potentially hazardous substances, local, provincial, state and federal governments could implement new regulations affecting the transportation of raw materials or our finished products. If transportation of our products is delayed or we are unable to obtain raw materials as a result of any third party’s failure to operate properly or the other hazards described above, or if new and more stringent regulatory requirements are implemented affecting transportation operations or equipment, or if there are significant increases in the cost of these services or equipment, our revenues and cost of operations could be adversely affected. In addition, we may experience increases in our transportation costs, or changes in such costs relative to transportation costs incurred by our competitors.
We may not be successful in the development and implementation of our low carbon ammonia projects in a timely or economic manner, or at all.
We are currently evaluating and developing projects and other investments that could enable us to become a producer and marketer of low carbon ammonia and other derivative products. The success of these projects is dependent on a number of factors, many of which are beyond our control.
For example, the market for low carbon ammonia remains nascent, and is continuing to develop and evolve. We cannot be certain that the market will grow to the size or at the rate we expect. The demand for low carbon ammonia is dependent in part on the developing market for low carbon hydrogen, for which ammonia can serve as a transport and storage molecule. These markets are heavily influenced by demand for clean energy, technology advancement and a range of domestic and international laws, regulations and policies related to carbon emissions, clean energy, tax benefits and other incentives and corporate accountability.
Recently, many other proposed low carbon ammonia projects have been announced or considered, and future hydrogen, energy, or environmental/carbon policies may support development of additional nitrogen production in locations outside North America, including Europe, Australia, and the Middle East. In the event that the growth in supply of low carbon ammonia and low carbon hydrogen exceeds the growth in demand for those products, the resulting unfavorable supply and demand balance could lead to lower selling prices than we expect, which could negatively affect our business, financial condition, results of operations and cash flows. The recognition and acceptance of low carbon ammonia as a transport and storage molecule for low carbon hydrogen, the use of low carbon ammonia as a fuel in its own right, and the development and growth of end market demand and applications for hydrogen and ammonia are uncertain. Such matters depend on many factors outside of our control, such as the extent and rate at which cost competitive global renewable energy capacity increases, the price of traditional and alternative sources of energy, the implementation of taxes on carbon emissions, the realization of technological improvements required to increase the efficiency and lower the costs of production of ammonia, the regulatory environment, and the success of the projects described above to provide ammonia offerings cost-effectively. In addition, further development of alternative decarbonization technologies may result in viable alternatives to the use of low carbon ammonia for many potential decarbonization applications, resulting in lower than expected market demand growth relative to our current expectations.
The success of our low carbon ammonia projects also depends on the realization of certain technical improvements required to increase the efficiency and lower the costs of production of low carbon ammonia. Over time, we may face operational difficulties and
execution risks related to design, development and construction. If our assumptions about the engineering and project execution requirements necessary to successfully build or convert the facility capacity that we are contemplating and to scale up to larger production quantities prove to be incorrect, we may be unable to produce substantial quantities of low carbon ammonia, and the cost to construct such low carbon ammonia facilities, or the production costs associated with the operation of such facilities, may be higher than we project. The production of low carbon ammonia depends to a large extent upon the ability of third parties to develop class VI carbon sequestration wells, which currently do not exist at large scale and are subject to a permitting process and operational risks, which may result in delays, impact viability in some or all situations, or create long-term liabilities.
There is intense competition in the markets we serve.
Substantially all of the markets in which we participate are highly competitive with respect to product quality, price, distribution, service, and reliability. We compete with many companies, domestic and foreign, that have greater financial, marketing and other resources. Competitive factors could require us to reduce prices or increase spending on product development, marketing and sales, which could have a material adverse effect on our business, results of operation and financial condition.
We compete with many U.S. producers and producers in other countries, including state-owned and government-subsidized entities. Some competitors have greater total resources and are less dependent on earnings from chemical sales, which makes them less vulnerable to industry downturns and better positioned to pursue new expansion and development opportunities. Our competitive position could suffer to the extent we are not able to expand our own resources sufficiently either through investments in new or existing operations or through acquisitions, joint ventures or partnerships. An inability to compete successfully could result in the loss of customers, which could adversely affect our sales and profitability.
In addition, future technological innovation, such as the development of seeds that require less crop nutrients, or developments in the application of crop nutrients, if they occur, could have the potential to adversely affect the demand for our products and results of operations.
A major factor underlying the current high level of demand for our nitrogen-based fertilizer products is the production of ethanol. A decrease in ethanol production or an increase in ethanol imports could have a material adverse effect on our results of operations and financial condition.
A major factor underlying the solid level of demand for our nitrogen-based fertilizer products is the production of ethanol in the United States and the use of corn in ethanol production. Ethanol production in the United States is highly dependent upon a myriad of federal statutes and regulations and is made significantly more competitive by various federal and state incentives and mandated usage of renewable fuels pursuant to the federal renewable fuel standards (“RFS”). To date, the RFS has been satisfied primarily with fuel ethanol blended into gasoline. However, a number of factors, including the continuing “food versus fuel” debate and studies showing that expanded ethanol usage may increase the level of greenhouse gases in the environment as well as be unsuitable for small engine use, have resulted in calls to reduce subsidies for ethanol, allow increased ethanol imports and to repeal or waive (in whole or in part) the current RFS, any of which could have an adverse effect on corn-based ethanol production, planted corn acreage and fertilizer demand. Therefore, ethanol incentive programs may not be renewed, or if renewed, they may be renewed on terms significantly less favorable to ethanol producers when compared with current incentive programs. Consequently, a decrease in ethanol production or an increase in ethanol imports could have a material adverse effect on our overall business, results of operations, financial condition and liquidity.
Seasonality can adversely affect our business.
Demand for nitrogen fertilizer products in the agricultural industry is seasonal. If seasonal demand is less than we expect, we may be left with excess inventory that will have to be stored (in which case our results of operations will be negatively affected by any related increased storage costs) or liquidated (in which case the selling price may be below our production, procurement and storage costs). The risks associated with excess inventory and product shortages are exacerbated by the volatility of natural gas and nitrogen fertilizer prices and the relatively brief periods during which farmers can apply nitrogen fertilizers. If prices for our products rapidly decrease, we may be subject to inventory write-downs, adversely affecting our operating results. If seasonal demand is greater than we expect, we may experience product shortages, and customers of ours may turn to our competitors for products that they would otherwise have purchased from us.
A substantial portion of our sales is dependent upon a limited number of customers.
For 2024, five customers accounted for approximately 30% of our consolidated net sales. The loss of, or a material reduction in purchase levels by, one or more of these customers could have a material adverse effect on our business, results of operations, financial condition and liquidity if we are unable to replace one or more customers with other sales on substantially similar terms.
A change in the volume of products that our customers purchase on a forward basis, or the percentage of our sales volume that is sold to our customers on a forward basis, could increase our exposure to fluctuations in our profit margins and materially adversely affect our business, financial condition, results of operations and cash flows.
From time-to-time, we offer our customers the opportunity to purchase products from us on a forward basis at prices and delivery dates we propose. Under our forward sales programs, customers generally make an initial cash down payment at the time of order and pay the remaining portion of the contract sales under their usual invoice terms when the performance obligation is satisfied. Forward sales improve our liquidity due to the cash payments received from customers in advance of shipment of the product and allow us to improve our production scheduling and planning and the utilization of our manufacturing and distribution assets. Any cash payments received in advance from customers in connection with forward sales are reflected on our consolidated balance sheets as a current liability until the related performance obligations are satisfied, which can take up to several months. We believe the ability to purchase products on a forward basis is most appealing to our customers during periods of generally increasing prices for nitrogen fertilizers. Our customers may be less willing, or even unwilling, to purchase products on a forward basis during periods of generally decreasing or stable prices or during periods of relatively high fertilizer prices due to the expectation of lower prices in the future or limited capital resources. In periods of rising fertilizer prices, selling our nitrogen fertilizers on a forward basis may result in lower profit margins than if we had not sold fertilizer on a forward basis. Conversely, in periods of declining fertilizer prices, selling our nitrogen fertilizers on a forward basis may result in higher profit margins than if we had not sold fertilizer on a forward basis. In addition, fixing the selling prices of our products, often months in advance of their ultimate delivery to customers, typically causes our reported selling prices and margins to differ from spot market prices and margins available at the time the performance obligation is satisfied.
Our business is subject to risks involving derivatives and the risk that our hedging activities might not be effective.
From time to time, we may utilize natural gas derivatives to economically hedge our financial exposure to the price volatility of natural gas, the principal raw material used in the production of nitrogen-based products. We use futures, financial swaps and option contracts traded in the over-the-counter markets or on exchanges to hedge our risk. Our use of derivatives can result in volatility in reported earnings due to the unrealized mark-to-market adjustments that occur from changes in the value of the derivatives that do not qualify for, or to which we do not apply, hedge accounting. To the extent that our derivative positions lose value, we may be required to post collateral with our counterparties, adversely affecting our liquidity. We have also used fixed-price, physical purchase and sales contracts to hedge our exposure to natural gas price volatility. Hedging arrangements are imperfect and unhedged risks will always exist. In addition, our hedging activities may themselves give rise to various risks that could adversely affect us. For example, we are exposed to counterparty credit risk when our derivatives are in a net asset position. The counterparties to our derivatives are multi-national commercial banks, major financial institutions or large energy companies. Our liquidity could be negatively impacted by a counterparty default on settlement of one or more of our derivative financial instruments or by the trigger of any cross-default provisions or credit support requirements. Additionally, the International Swaps and Derivative Association master netting arrangements for most of our derivative instruments contain credit-risk-related contingent features, such as cross-default and/or acceleration provisions and credit support requirements. In the event of certain defaults or a credit ratings downgrade, our counterparty may request early termination and net settlement of certain derivative trades or may require us to collateralize derivatives in a net liability position. At other times we may not utilize derivatives or derivative strategies to hedge certain risks or to reduce the financial exposure of price volatility. As a result, we may not prevent certain material adverse impacts that could have been mitigated through the use of derivative strategies.
Cybersecurity risks could adversely affect our business.
As we continue to increase our dependence on information technologies to conduct our operations the risks associated with cybersecurity also increase. Cybersecurity breaches may be the result of, among other things, negligent or unauthorized activity by our employees or by third parties who use cyber-attack techniques involving malware, ransomware, hacking and phishing. Such cyber-attacks continue to increase in frequency and potential harm, and the methods used to gain unauthorized access evolve, making it increasingly difficult to anticipate, prevent, and detect incidents. We rely on our enterprise resource planning software and other information systems, among other things, to manage our manufacturing, supply chain, accounting and financial functions. Additionally, third parties on whose systems we place significant reliance for the conduct of our business are also subject to cybersecurity risks. We are significantly dependent upon internet connectivity and a third-party cloud hosting vendor. We have implemented security procedures and measures in order to protect our information from being vulnerable to theft, loss, damage or interruption from a number of potential sources or events. Although we believe these measures and procedures are appropriate, we may not have the resources or technical sophistication to anticipate, prevent, or recover from rapidly evolving types of cyber-attacks. Compromises to our information systems could have an adverse effect on our business, results of operations, liquidity and financial condition.
We may engage in certain strategic transactions which may adversely affect our financial condition.
An important part of our business strategy is the acquisition of strategic assets or companies. Our management is currently evaluating and pursuing certain such opportunities, and from time to time separately provides indications of interest in respect of similar transactions, which may be significant. Any such discussions may or may not result in the consummation of a transaction, and we may not be able to identify or complete any of these potential acquisitions. We cannot predict the effect, if any, that any announcement or
consummation of a transaction would have on the price of our securities. While the documents governing our indebtedness include certain restrictions on our ability to finance any acquisitions of new assets, such restrictions contain various exceptions and limitations.
There is no guarantee that any such transactions will be successful or, even if consummated, improve our operating results. We may incur costs, breakage fees or other expenses in connection with any such transactions or may not be able to obtain the necessary financing for such transactions on acceptable terms. Accordingly, any such transactions may ultimately have a material adverse effect on our operating results.
In addition, any future acquisitions could present a number of risks, including:
•the risk of using management time and resources to pursue acquisitions that are not successfully completed;
•the risk of incorrect assumptions regarding the future results of acquired operations or business;
•the risk of failing to integrate the operations or management of any acquired operations or assets successfully and timely; and
•the risk of diversion of management’s attention from existing operations or other priorities.
If we are unsuccessful in integrating acquisitions in a timely and cost-effective manner, our financial condition and results of operations could be adversely affected.
Risks Relating to Our Industry and Markets
Our business and customers are sensitive to adverse economic cycles and a prolonged deterioration of global market and economic conditions could have a material adverse effect on our business, financial condition, results of operations and cash flow.
From time to time, our business is affected by cyclical factors such as inflation, currency exchange rates, global energy policy and costs, regulatory policies (including tariffs), global market conditions and economic downturns in specific industries. Certain sales are sensitive to the level of activity in the agricultural, mining, automotive and housing industries. Therefore, substantial changes in these factors could adversely affect our operating results, liquidity, financial condition and capital resources.
A slowdown of, or persistent weakness in, economic activity caused by a deterioration of global market and economic conditions could adversely affect our business in the following ways, among others: conditions in the credit markets could impact the ability of our customers and their customers to obtain sufficient credit to support their operations; the failure of our customers to fulfill their purchase obligations could result in increases in bad debts and affect our working capital; and the failure of certain key suppliers could increase our exposure to disruptions in supply or to financial losses. We also may experience declining demand and falling prices for some of our products due to our customers’ reluctance to replenish inventories. The overall impact of a global economic downturn or reduced overall global trade on us is difficult to predict, and our business could be materially adversely impacted.
In addition, conditions in the international market for nitrogen fertilizer significantly influence our operating results. The international market for fertilizers is influenced by such factors as the relative value of the U.S. currency and its impact on the importation of fertilizers, foreign agricultural policies, the existence of, or changes in, import or foreign currency exchange barriers in certain foreign markets and other regulatory policies (including tariffs) of foreign governments, as well as the U.S. laws and policies affecting foreign trade and investment.
An increase of imported agricultural products could adversely affect our business.
Russia, Ukraine and Trinidad have substantial capacity to produce and export fertilizers. Producers in these countries also benefit from below-market prices for natural gas, due to government regulation and other factors.
In addition, producers in China have substantial capacity to produce and export urea. Depending on various factors, including prevailing prices from other exporters, the price of coal and regulatory policies, including the price of China’s export tariff, higher volumes of urea from China could be imported into the U.S. at prices that could have an adverse effect on the selling prices of other nitrogen products, including the nitrogen products we manufacture and sell.
Domestic and regional inflation trends, increased interest rates and other factors could lead to the erosion of economies and adversely impact us.
Both the U.S. and many other countries are experiencing inflation, which, in turn, is leading to increased costs in multiple industry segments, including agriculture and related industries. The persistence of inflation has led central bankers to increase interest rates within their regions. There is no guarantee that these measures will arrest the inflationary trend. Further, these factors, taken together with reduced productivity and constraints on the labor supply could lead to recessionary periods in the regions in which the Company does business. While we will take measures within our control to manage the effects of inflation, higher interest rates and other factors, ultimately, they are outside of our control. Further, the persistence and/or severity of one or more of them could adversely affect our financial performance and/or operations.
Adverse weather conditions and climate change could adversely affect our business.
The products (primarily agricultural) produced and sold by us have been in the past, and could be in the future, materially affected by adverse weather conditions (such as excessive rain or drought) in the primary markets for our fertilizer and related agricultural products. In addition, weather can cause an interruption to the operations of our chemical facilities. Over the course of the past several years, global climate conditions have become increasingly inconsistent, volatile and unpredictable. Many of the regions in which we do business have variously experienced excessive moisture, cold, drought and/or heat of an unprecedented nature at various times of the year. In some cases, these conditions have either reduced or obviated the need for our products, particularly in the agriculture space, whether pre-plant, at-plant, post-emergent or at harvest. Due to the unpredictable nature of these conditions, we have observed growers and distributors becoming increasingly conservative in procurement practices and the accumulation of inventory. Further, the unpredictable nature of climactic change has made it increasingly difficult to forecast market demand and, consequently, financial performance, from year-to-year. There is no guarantee that climate change or its impacts will abate in the near future, and it is possible that such change will continue to hinder, or significantly further hinder, our ability to forecast sales performance with accuracy and otherwise adversely affect our financial performance.
Some scientists have concluded that increasing concentrations of greenhouse gases in the Earth’s atmosphere may produce climate changes that have significant physical effects, such as increased frequency and severity of storms, droughts and floods and other climatic events. If any such effects, whether anthropogenic or otherwise, were to occur in areas where we or our clients operate, they could have an adverse effect on our business, financial condition and results of operations. These climate changes might also occur as the result of other phenomena that human activity is unable to influence, including changes in solar activity and volcanic activity. Regardless of the cause, if any of these adverse weather events occur, or occur with greater frequency, during the primary seasons for sales of our agricultural products (March-June and September-November), this could have a material adverse effect on our agricultural sales and our financial condition and results of operations.
Natural disasters may also directly affect our physical facilities, especially our chemical facilities, or those of our suppliers or customers and could affect our sales, our production capability and our ability to deliver products to our customers. In the past, hurricanes affecting the Gulf Coast of the U.S. have negatively affected our operations and those of our customers. Any future natural disasters affecting the areas in which we or our suppliers or customers operation could negatively affect our business operations and financial performance.
Geopolitical conditions, including political turmoil and volatility, regional conflicts, terrorism and war have negatively affected and could negatively affect U.S. and foreign companies, the financial markets, the industries where we operate, our operations and our profitability.
Geopolitical events, instability and terrorist attacks in the United States and elsewhere, including events like Russia’s occupation of Ukraine and ongoing conflict in the Middle East, have in the past and can in the future negatively affect our operations. While the occupation of Ukraine has had an effect on commodity prices and fertilizer supply (primarily ammonia and urea from Russia), there is no guarantee that the current conflict will not draw military intervention from other countries or further retaliation from Russia, which, in turn, could lead to a much larger conflict. It is possible that supply chain, trade routes and the markets we currently serve could be further adversely affected, which, in turn, could materially, adversely affect our business operations and financial performance.
Like other companies with major industrial facilities, we may be targets of terrorist activities. Many of our plants and facilities store significant quantities of ammonia and other materials that can be dangerous if mishandled. Any damage to infrastructure facilities, such as electric generation, transmission and distribution facilities, or injury to employees, who could be direct targets or indirect casualties of an act of terrorism, may affect our operations. Any disruption of our ability to produce or distribute our products could result in a significant decrease in revenues and significant additional costs to replace, repair or insure our assets, which could have a material adverse effect on our business, financial condition, results of operations and cash flows.
Risks Relating to Our Liquidity and Debt
We may not be able to generate sufficient cash to service our debt and may be required to take other actions to satisfy the obligations under our debt agreements, which may not be successful.
Our ability to make scheduled payments on our debt obligations depends on our financial condition and operating performance, prevailing economic and competitive conditions, and certain financial, business and other factors, some of which may be beyond our control.
For example, we may not be able to maintain a level of cash flows sufficient to pay the principal and interest on our debt, including the $478 million principal amount of our 6.25% senior secured notes due 2028 (the “Senior Secured Notes”). In addition, if we were to draw on our Revolving Credit Facility, such borrowings would be at variable rates of interest and expose us to interest rate risk.
If cash flows and capital resources are insufficient to fund our debt obligations, we could face substantial liquidity problems and will need to seek additional capital through the issuance of debt, the issuance of equity, asset sales or a combination of the foregoing. If we are unsuccessful, we will need to reduce or delay investments and capital expenditures, dispose of other assets or operations, seek
additional capital, or restructure or refinance debt. These alternative measures may not be successful, may not be completed on economically attractive terms, or may not be adequate for us to meet our debt obligations when due. Additionally, our debt agreements limit the use of the proceeds from many dispositions of assets or operations. As a result, we may not be permitted to use the proceeds from these dispositions to satisfy our debt obligations. If we cannot make scheduled payments on our debt, we will be in default and the outstanding principal and interest on our debt could be declared to be due and payable, in which case we could be forced into bankruptcy or liquidation or required to substantially restructure or alter our business operations or debt obligations. In such an event, we may not have sufficient assets to repay all of our debt.
Further, if we suffer or appear to suffer from a lack of available liquidity, the evaluation of our creditworthiness by counterparties and rating agencies and the willingness of third parties to do business with us could be materially and adversely affected. In particular, our credit ratings could be lowered, suspended or withdrawn entirely at any time by the rating agencies. Downgrades in long-term debt ratings generally cause borrowing costs to increase and the potential pool of investors and funding sources to decrease and could trigger liquidity demands pursuant to the terms of contracts, leases or other agreements. Any future transactions by us, including the issuance of additional debt, the sale of any operating assets, or any other transaction to manage our liquidity, could result in temporary or permanent downgrades of our credit ratings.
Our substantial indebtedness level could limit our financial and operating activities, and adversely affect our ability to incur additional debt to fund future needs.
We currently have a substantial amount of indebtedness. As a result, this level could, among other things:
•require us to dedicate a substantial portion of our cash flow to the payment of principal and interest, thereby reducing the funds available for operations and future business opportunities;
•make it more difficult for us to satisfy our obligations, including our repurchase obligations;
•limit our ability to borrow additional money if needed for other purposes, including working capital, capital expenditures, debt service requirements, acquisitions and general corporate or other purposes, on satisfactory terms or at all;
•limit our ability to adjust to changing economic, business and competitive conditions;
•place us at a competitive disadvantage with competitors who may have less indebtedness or greater access to financing;
•make us more vulnerable to an increase in interest rates, a downturn in our operating performance or a decline in general economic conditions; and
•make us more susceptible to changes in credit ratings, which could affect our ability to obtain financing in the future and increase the cost of such financing.
Any of the foregoing could adversely affect our liquidity, operating results and financial condition.
Our debt agreements and the Exchange Agreement contain covenants and impose restrictions on our business operations, and any breach of these covenants or restrictions could result in an event of default under one or more of our debt agreements or contracts at different entities within our capital structure, including as a result of cross acceleration or default provisions.
Our debt agreements and the Exchange Agreement contain various covenants and other restrictions that, among other things, limit flexibility in operating our businesses. These covenants and other restrictions limit our ability to, among other things:
•incur additional debt or issue preferred shares;
•pay dividends on, repurchase or make distributions in respect of capital stock, or make other restricted payments;
•make investments or certain capital expenditures;
•sell or transfer assets;
•create liens on assets to secure debt;
•engage in certain fundamental corporate changes or changes to our business activities;
•make certain material acquisitions;
•consolidate, merge, sell or otherwise dispose of all or substantially all of our assets;
•enter into transactions with affiliates;
•designate subsidiaries as unrestricted subsidiaries; and
•repay, repurchase or modify certain subordinated and other material debt.
The Revolving Credit Facility also contains certain affirmative covenants and requires the borrowers to comply with a fixed charge coverage ratio (as defined in the Revolving Credit Facility) if their excess availability (as defined in the Revolving Credit Facility) falls below a certain level.
These covenants and restrictions could affect our ability to operate our business and may limit our ability to react to market conditions or take advantage of potential business opportunities as they arise. Additionally, our ability to comply with these covenants may be affected by events beyond our control, including general economic and credit conditions and industry downturns. A breach of any of these covenants or restrictions could result in a significant portion of our debt becoming due and payable or could result in significant contractual liability.
In addition, certain failures to make payments when due on, or the acceleration of, significant indebtedness constitutes a default under some of our debt instruments, including the Indenture governing the Senior Secured Notes. Further, a breach of any of the covenants or restrictions in a debt instrument could result in an event of default under such debt instrument. Upon the occurrence of an event of default under one of these debt instruments, our lenders or noteholders could elect to declare all amounts outstanding under such debt instrument to be immediately due and payable and/or terminate all commitments to extend further credit. Such actions by those lenders or noteholders could cause cross defaults or accelerations under our other debt. If we were unable to repay those amounts, the lenders or noteholders could proceed against any collateral granted to them to secure such debt. In the case of a default under debt that is guaranteed, holders of such debt could also seek to enforce the guarantees. If lenders or noteholders accelerate the repayment of all borrowings, we would likely not have sufficient assets and funds to repay those borrowings. Such occurrence could result in our or our applicable subsidiary going into bankruptcy, liquidation or insolvency.
Despite our current levels of debt, we may still incur more debt ranking senior or equal in right of payment with our existing obligations, including secured debt, which would increase the risks described herein.
The agreements relating to our debt, including the Indenture governing the Senior Secured Notes and the credit agreement governing our Revolving Credit Facility, limit but do not prohibit our ability to incur additional debt, including additional secured debt. Notwithstanding the fact that the Indenture governing the Senior Secured Notes and the credit agreement governing our Revolving Credit Facility limit our ability to incur additional debt or grant certain liens on our assets, the restrictions on the incurrence of additional indebtedness and liens are subject to a number of important qualifications and exceptions, and the additional indebtedness and liens incurred in compliance with these restrictions could be substantial. If new debt is added to our current debt levels, the related risks that we now face could intensify.
Risks Relating to Legal, Regulatory and Compliance Matters
Current and future legislative or regulatory requirements affecting our business may result in increased costs and decreased revenues, cash flows and liquidity or could have other negative effects on our business.
Our business is subject to numerous health, safety, security and environmental laws and regulations. The manufacture and distribution of chemical products and our other activities entail health, safety and environmental risks and impose obligations under health, safety and environmental laws and regulations, many of which provide for substantial fines, injunctive relief and potential criminal sanctions for violations. Although we believe we have established processes to monitor, review and manage our businesses to comply with the numerous health, safety and environmental laws and regulations, we previously were, and in the future, may be, subject to fines, penalties, sanctions and injunctive relief for violations and substantial expenditures for cleanup costs and other liabilities relating to the handling, manufacture, use, emission, discharge or disposal of wastes, effluents, emission and other materials at or from our present and former chemical facilities. Further, a number of our facilities are dependent on environmental permits to operate, the loss, or inability to renew or modification of which could have a material adverse effect on their operations and our results of operation and financial condition. These operating permits are subject to modification, renewal and revocation. In addition, third parties may contest our ability to receive or renew certain permits that we need to operate, which can lengthen the application process or even prevent us from obtaining necessary permits. Delays in obtaining permits or unanticipated permit conditions could delay projects, increase the costs of operations or make operations unfeasible. We regularly monitor and review our operations, procedures and policies for compliance with permits, laws and regulations. Despite these compliance efforts, risk of noncompliance, the risk of loss or modification of permits or changing regulatory or permit interpretation is inherent in the operation of our business.
There can be no assurance as to the amount or timing of future expenditures for environmental compliance or remediation, and actual future expenditures may be different from the amounts we currently anticipate. Environmental requirements change frequently and are subject to interpretation. New requirements or interpretations along with the expanding scope of regulation may increase our future expenditures to comply with environmental requirements. We try to anticipate future regulatory requirements that might be imposed and plan accordingly to remain in compliance with changing environmental laws and regulations and to minimize the costs of compliance.
Changes to the production equipment at our chemical facilities that are required in order to comply with health, safety and environmental regulations may require substantial capital expenditures.
Explosions and/or losses at other chemical facilities that we do not own (such as the April 2013 explosion in West, Texas) could also result in new or additional legislation or regulatory changes, particularly relating to public health, safety or any of the products manufactured and/or sold by us or the inability on the part of our customers to obtain or maintain insurance as to certain products manufactured and/or sold by us, which could have a negative effect on our revenues, cash flow and liquidity.
In summary, new or changed laws and regulations or the inability of our customers to obtain or maintain insurance in connection with any of our chemical products could have an adverse effect on our operating results, liquidity and financial condition.
Additionally, under CERCLA or similar state statutes, we may be required to conduct environmental investigation and remediation (and pay for natural resource damages) at presently or formerly owned or operated sites or at sites at which materials from our operations have been disposed or released. Such liability is often strict and joint and several, meaning that we may be required to pay a
disproportionate share of remediation costs if other responsible parties are unable to pay. Additionally, we could be required to conduct additional cleanup at sites where we previously participated in remediation efforts in response to new information or new regulatory requirements. Although we cannot presently provide a precise estimate of the ultimate cost of the exposure with respect to investigation and remediation obligations, we make accruals as warranted and we do not believe that the reasonably possible range of loss in excess of accruals would be material to our operations. However, given the uncertainties inherent to any estimation of remediation costs, potential changing regulations, the uncertainties of litigation and other factors, the ultimate amounts that we pay or expend could vary significantly from the amount we accrue and have a material impact on our business and operations.
We may not have adequate insurance.
While we maintain liability, property and business interruption insurance, including certain coverage for environmental contamination, it is subject to coverage limits and policies that may exclude coverage for some types of damages. Although there may currently be sources from which such coverage may be obtained, the coverage may not continue to be available to us on commercially reasonable terms or the possible types of liabilities that may be incurred by us may not be covered by our insurance. In addition, our insurance carriers may not be able to meet their obligations under the policies, or the dollar amount of the liabilities may exceed our policy limits. Even a partially uninsured claim, if successful and of significant magnitude, could have a material adverse effect on our business, results of operations, financial condition and liquidity.
Furthermore, we are subject to litigation for which we could be obligated to bear legal, settlement and other costs, which may be in excess of any available insurance coverage. If we are required to incur all or a portion of the costs arising out of any litigation or investigation as a result of inadequate insurance proceeds, if any, our business, results of operations, financial condition and liquidity could be materially adversely affected. For further discussion of our litigation, please see “Other Pending, Threatened or Settled Litigation” in Note 7 – Commitments and Contingencies to the Consolidated Financial Statements included in this report.
We may be required to modify or expand our operating, sales and reporting procedures and to install additional equipment in order to comply with current and possible future government regulations.
The chemical industry in general, and producers and distributors of ammonia and AN specifically, are scrutinized by the government, industry and public on security issues. Under current and proposed regulations, we may be required to incur substantial additional costs relating to security at our chemical facilities and distribution centers, as well as in the transportation of our products. These costs could have a material effect on our results of operations, financial condition, and liquidity. The cost of such regulatory changes, if significant, could lead some of our customers to choose other products over ammonia and AN, which may have a significant adverse effect on our business.
The “Secure Handling of Ammonium Nitrate Act of 2007” was enacted by the U.S. Congress, and subsequently the U.S. Department of Homeland Security (“DHS”) published a notice of proposed rulemaking in 2011. This regulation proposes to require sellers, buyers, their agents and transporters of solid AN and certain solid mixtures containing AN to possess a valid registration issued by DHS, keep certain records, report the theft or unexplained loss of regulated materials, and comply with certain other new requirements. We and others affected by this proposal have submitted appropriate comments to DHS regarding the proposed regulation. It is possible that DHS could significantly revise the requirements currently being proposed. Depending on the provisions of the final regulation to be promulgated by DHS and on our ability to pass these costs to our customers, these requirements may have a negative effect on the profitability of our AN business and may result in fewer distributors who are willing to handle the product. DHS has not finalized this rule, and has indicated that its next action, and the timing of such an action, is undetermined.
On August 1, 2013, U.S. President Obama issued an executive order addressing the safety and security of chemical facilities in response to recent incidents involving chemicals such as the explosion at West, Texas. The President directed federal agencies to enhance existing regulations and make recommendations to the U.S. Congress to develop new laws that may affect our business. In January 2016, the U.S. Chemical Safety and Hazard Investigation Board (“CSB”) released its final report on the West, Texas incident. The CSB report identifies several federal and state regulations and standards that could be strengthened to reduce the risk of a similar incident occurring in the future. While the CSB does not have authority to directly regulate our business, the findings in this report, and other activities taken in response to the West, Texas incident by federal, state, and local regulators may result in additional regulation of our processes and products.
In 2024, the U.S. EPA finalized revisions to its Risk Management Program (“RMP”) under Section 112(r) of the Clean Air Act. The revisions are the results of many years of back-and-forth among changing administrations. The current RMP rule includes requirements for certain facilities to perform hazard analyses including a safer technologies and alternatives analysis, an analysis of natural hazards, third-party auditing in certain circumstances, increased transparency (including incident reports and making certain information publicly available), and new emergency response requirements. Although the new rule was effective in 2024, many of the new requirements have a 2027 implementation timeline. The Occupational Safety and Health Administration is likewise considering changes to its Process Safety Management standards. In addition, DHS, the EPA, and the Bureau of Alcohol, Tobacco, Firearms and Explosives updated a joint chemical advisory on the safe storage, handling, and management of AN. While these actions may result in additional regulatory requirements or changes to our operators, it is difficult to predict at this time how these and any other possible regulations, if and when adopted, will affect our business, operations, liquidity or financial results.
Proposed and existing governmental laws and regulations relating to greenhouse gas and other air emissions may subject certain of our operations and customers to significant new costs and restrictions on their operations and may reduce sales of our products.
Our chemical manufacturing facilities use significant amounts of electricity, natural gas and other raw materials necessary for the production of their chemical products that result, or could result, in certain greenhouse gas emissions into the environment. Federal and state legislatures and administrative agencies, including the EPA, are considering the scope and scale of greenhouse gas or other air emission regulation. Legislation and administrative actions have been considered that would regulate greenhouse gas emissions at some point in the future for our facilities, and existing and possible actions have already affected certain of our customers, leading to closure or rate reductions of certain facilities.
In response to findings that emissions of carbon dioxide, methane and other greenhouse gases present an endangerment to public health and the environment, the EPA adopted regulations pursuant to the federal Clean Air Act to reduce greenhouse gas emissions from various sources. For example, the EPA requires certain large stationary sources to obtain preconstruction and operating permits for pollutants regulated under the Prevention of Significant Deterioration and Title V programs of the Clean Air Act. Facilities required to obtain preconstruction permits for such pollutants are also required to meet “best available control technology” standards that are being established by the states. These regulatory requirements could adversely affect our operations and restrict or delay our ability to obtain air permits for new or modified sources. The Trump administration has directed EPA to reevaluate its endangerment finding relating to greenhouse gases and has generally signaled a desire to engage in less regulation targeted at climate change. The ultimate outcome of the new administration’s position and its impact on our operations or the operations of our customers cannot be predicted at this time.
Greenhouse gas regulation could: increase the price of the electricity and other energy sources purchased by our chemical facilities; increase costs for natural gas and other raw materials (such as ammonia); potentially restrict access to or the use of certain raw materials necessary to produce our chemical products; and require us to incur substantial expenditures to retrofit our chemical facilities to comply with the proposed new laws and regulations regulating greenhouse gas emissions. Federal, state and local governments may also pass laws mandating the use of alternative energy sources, such as wind power and solar energy, which may increase the cost of energy use in certain of our chemical and other manufacturing operations. For example, over time, the EPA has promulgated rules seeking to limit greenhouse gases from electric power plants. Various of these rules have been either struck down in court or repealed with changes in administration. The EPA’s most recent attempt to limit greenhouse gasses from power plants was finalized in 2024 and was subject to immediate legal challenge. Should the rule be upheld, it could result in increased electricity costs.
Laws, regulations or other issues related to climate change could have a material adverse effect on us.
If we, or other companies with which we do business become subject to laws or regulations related to climate change, it could have a material adverse effect on us. The United States may enact new laws, regulations and interpretations relating to climate change, including potential cap-and-trade systems, carbon taxes and other requirements relating to reduction of carbon footprints and/or greenhouse gas emissions. Other countries have enacted climate change laws and regulations, and the United States has been involved in discussions regarding international climate change treaties, although the continued commitment to such treaties is uncertain under the Trump administration. The federal government and some of the states and localities in which we operate have considered or have enacted certain climate change laws and regulations relating to greenhouse gas emissions or requiring disclosure of greenhouse gas emissions. Although these laws and regulations have not had any known material adverse effect on us to date, they could result in substantial costs, including compliance costs, monitoring and reporting costs and capital. Furthermore, our reputation could be damaged if we violate climate change laws or regulations. We cannot predict how future laws and regulations, or future interpretations of current laws and regulations, related to climate change will affect our business, results of operations, liquidity and financial condition. Lastly, the potential physical impacts of climate change on our operations are highly uncertain and would be particular to the geographic circumstances in areas in which we operate. These may include changes in rainfall and storm patterns and intensities, water shortages and changing temperatures. Any of these matters could have a material adverse effect on us.
Risks Relating to Human Capital
Loss of key personnel and other employees, including those with engineering and technical expertise, could negatively affect our business.
Our performance has been and will continue to be dependent upon the efforts of our executive officers. We cannot ensure that our executive officers will continue to be available. Although we have employment agreements with certain of our executive officers, including Mark T. Behrman and Cheryl A. Maguire, we do not have employment agreements with all of our key personnel. The loss of any of our executive officers could have a material adverse effect on us. We believe that our future success will depend in large part on our continued ability to attract and retain highly skilled and qualified personnel.
In addition, our success depends upon our attracting and retaining skilled engineering personnel and others with technical expertise. Competition for such skilled personnel in our industry is high, especially for engineers and project managers who must reside in proximity to our facilities, which are in rural and less populated areas. As a result, we may experience higher than anticipated levels of
employee attrition and may not be able to hire sufficiently qualified personnel in adequate numbers to meet our needs. Employee turnover and associated costs of rehiring, the loss of human capital and expertise through attrition and the reduced ability to attract talent could impair our ability to operate our business.
We are subject to collective bargaining agreements with certain employees.
Approximately 28% of our employees are covered by collective bargaining agreements. We may not be able to renew our collective bargaining agreements on terms similar to current terms or renegotiate collective bargaining agreements on terms acceptable to us. The prolonged failure to renew or renegotiate a collective bargaining agreement could result in work stoppages. Additionally, if a collective bargaining agreement is negotiated at higher-than-anticipated cost, absorbing those costs or passing them through to customers in the form of higher prices may make us less competitive.
Risks Relating to Stockholders
Todd Boehly (“Boehly”), through an affiliate, has a significant influence over us, which could limit other stockholders’ ability to influence the outcome of key transactions, including a change of control.
TLB-LSB, LLC (“TLB-LSB”), which is an affiliate of Boehly, beneficially owns, in the aggregate approximately 21% of our outstanding common stock as of December 31, 2024. Additionally, pursuant to the Board Representation and Standstill Agreement, as amended, TLB-LSB has certain board member nomination rights based on the size of our Board and TLB-LSB’s holdings. For as long as TLB-LSB continues to beneficially own a substantial percentage of the voting power of our outstanding common stock, Boehly and his affiliates will continue to have significant influence over us. For example, they will be able to strongly influence the election of all of the members of our Board and our business and affairs, including certain determinations with respect to mergers or other business combinations, the acquisition or disposition of assets, the incurrence of additional indebtedness, the issuance of additional shares of common stock or other equity securities, the repurchase or redemption of shares of our common stock and the payment of dividends.
Additionally, Boehly and his affiliates manage businesses across a range of industries and may acquire and hold interests in businesses that compete directly or indirectly with us. Boehly and his affiliates may also pursue acquisition opportunities that may be complementary to our business, and, as a result, those acquisition opportunities may not be available to us.
There can be no assurance that we will repurchase shares of common stock or that we will repurchase shares at favorable prices.
In May 2023, our Board authorized a $150 million stock repurchase program. Total repurchase authority remaining under the repurchase program was $109 million as of December 31, 2024. The repurchase program may be suspended, terminated or modified at any time for any reason, including market conditions, the cost of repurchasing securities, the availability of alternative investment opportunities, liquidity, and other factors deemed appropriate. Under the repurchase program, we are authorized to purchase shares from time to time through open market or privately negotiated transactions. Such purchases may be made pursuant to Rule 10b5-1 plans or other means as determined by our management and in accordance with the requirements of the SEC. The repurchase program does not obligate us to purchase any particular number or type of securities. During 2024, we repurchased approximately 1.5 million shares of common stock at an average cost of $8.13 per share.
Our stock repurchases will depend upon, among other factors, our cash balances and potential future capital requirements, results of operations, financial condition, and other factors that we may deem relevant. We can provide no assurance that we will repurchase stock at favorable prices, if at all.
We are subject to a variety of factors that could discourage other parties from attempting to acquire us.
Our certificate of incorporation provides for a staggered Board and, except in limited circumstances, a two-thirds vote of outstanding voting shares to approve a merger, consolidation or sale of all, or substantially all, of our assets. In addition, we have entered into severance agreements with our executive officers and some of the executive officers of certain subsidiaries that provide, among other things, that if, within a specified period of time after the occurrence of a change in control of LSB, these officers are terminated, other than for cause, or the officer terminates his employment for good reason, the officer would be entitled to certain severance benefits. Certain of our debt instruments also provide special rights in a change of control, including in some cases the ability to be repaid in full or redeemed.
We have authorized and unissued (including shares held in treasury) approximately 78.4 million shares of common stock and approximately 5.2 million shares of preferred stock as of December 31, 2024. These unissued shares could be used by our management to make it more difficult, and thereby discourage an attempt to acquire control of us.
The foregoing provisions and agreements may discourage a third-party tender offer, proxy contest, or other attempts to acquire control of us and could have the effect of making it more difficult to remove incumbent management. In addition, Boehly, through his affiliates, has significant voting power and the Golsen Holders and Boehly, through his affiliates, have rights to designate board representatives, all of which may further discourage a third-party tender offer, proxy contest, or other attempts to acquire control of us.
Delaware has adopted an anti-takeover law which, among other things, will delay for three years business combinations with acquirers of 15% or more of the outstanding voting stock of publicly-held companies (such as us), unless:
•prior to such time the Board of the corporation approved the business combination that results in the stockholder becoming an invested stockholder;
•the acquirer owned at least 85% of the outstanding voting stock of such company prior to commencement of the transaction;
•two-thirds of the stockholders, other than the acquirer, vote to approve the business combination after approval thereof by the Board; or
•the stockholders of the corporation amend its articles of incorporation or by-laws electing not to be governed by this provision.
Future issuances or potential issuances of our common stock or preferred stock could adversely affect the price of our common stock and our ability to raise funds in new stock offerings and could dilute the percentage ownership or voting power of our common stockholders.
Future sales of substantial amounts of our common stock, preferred stock or equity-related securities in the public market, or the perception that such sales could occur, could adversely affect prevailing trading prices of our common stock and could dilute the value of common stock held by our existing stockholders. No prediction can be made as to the effect, if any, that future sales of common stock, preferred stock, or equity-related securities, or the availability of shares of common stock for future sale will have on the trading price of our common stock. Such future sales could also significantly reduce the percentage ownership and voting power of our existing common stockholders.
Defined Terms
The following is a list of terms used in this report.
| | |
| | |
Board | - | The Board of Directors of the Company. |
| | |
Board Representation and Standstill Agreement | - | Board Representation and Standstill Agreement by and among LSB Industries, Inc., LSB Funding LLC, Security Benefit Corporation, Todd Boehly and the Golsen Holders. |
| | |
EDA | - | El Dorado Ammonia L.L.C. (now merged into LSB Chemical, L.L.C. a subsidiary of LSB Industries, Inc.). |
| | |
EDC | - | El Dorado Chemical Company (now merged into LSB Chemical, L.L.C. a subsidiary of LSB Industries, Inc.). |
| | |
EPA | - | The United States Environmental Protection Agency. |
| | |
Exchange Agreement | - | A Securities Exchange Agreement between LSB Funding L.L.C. and affiliate of Eldridge Industries, L.L.C. and LSB. |
| | |
Global | - | Global Industrial, Inc., a subcontractor asserting mechanics liens for work rendered to LSB and EDC. |
| | |
Golsen Holders | - | Jack E. Golsen, Barry H. Golsen and certain of their related parties, as defined in the Board Representation and Standstill Agreement, as amended. |
| | |
Indenture | - | The agreement governing the Senior Secured Notes, dated as of October 14, 2021, by and among LSB, the subsidiary guarantors which includes all of LSB’s consolidated subsidiaries named therein, and Wilmington Trust, National Association, a national banking association, as trustee and collateral agent. |
| | |
J. Golsen | - | Jack E. Golsen. |
| | |
Revolving Credit Facility | - | Our secured revolving credit facility entered into during December 2023 that provides for a secured revolving credit facility in an initial maximum principal amount of up to $75 million, with an option to increase the maximum principal amount by up to $25 million (which amount is uncommitted). |
| | |
NOL | - | Net Operating Loss. |
| | |
PBRSU | - | Performance-based restricted stock unit. |
| | |
PCC | - | Pryor Chemical Company (now merged into LSB Chemical, L.L.C. a subsidiary of LSB Industries, Inc.). |
| | |
RSU | - | Restricted stock unit. |
| | |
SEC | - | The United States Securities and Exchange Commission. |
| | |
Secured Financing Agreement due 2025 | - | A secured financing arrangement between EDA and an affiliate of LSB Funding which matures in August 2025. |
| | |
Senior Secured Notes | - | The senior secured notes issued on October 14, 2021 and March 8, 2022, with an interest rate of 6.25%, which mature in October 2028. |
| | |
Turnaround | - | A planned major maintenance activity. |
| | |
USDA | - | United States Department of Agriculture. |
| | |
2005 Agreement | - | A death benefit agreement with Jack E. Golsen. |
| | |
2016 Plan | - | The 2016 Long Term Incentive Plan. |
None.
ITEM 1C. CYBERSECURITY
We recognize the importance of developing, implementing, and maintaining robust cybersecurity measures to maintain the security, confidentiality, integrity, and availability of our business systems and commercially sensitive or confidential information. Our business depends on the proper functioning and availability of our information technology platforms, including communications and data processing systems. We are also required to effect electronic transmissions with third parties including clients, vendors and others with whom we do business, and with our Board. We also recognize that, as we continue to increase our dependence on information technologies to conduct our operations the risks associated with cybersecurity also increase.
We utilize an enterprise-wide risk management process to identify, assess, track and manage risks faced by our organization. The Company’s Enterprise Risk Management Committee (“ERM Committee”), is designated with the responsibility to direct our risk management program and to execute our risk management strategy, including cyber, technology, and third-party risk. To protect our information systems and operations from risks and to execute our cyber strategy, we use various security processes and technology tools that help identify, investigate, assess, prevent, and resolve potential vulnerabilities and security incidents in a timely manner. These include, but are not limited to, detection, monitoring and reporting processes and tools. Our team uses widely adopted methods and models to identify, evaluate, prioritize, and manage cyber and technology risks and develop and implement related information security safeguards. In partnership with third party advisors and consultants, we conduct regular reviews and tests of our program and leverage audits, penetration and vulnerability testing, cyber risk tabletops and security awareness trainings, and other business resilience exercises to evaluate the effectiveness of our program and improve our security measures. Our information security policies are designed to address current applicable legal requirements and to align with industry-recognized frameworks for cyber risk management. These standards cover physical, administrative, and technical safeguards and address a wide range of current cyber threats, including from third-party service providers. These policies and standards are reviewed and updated on a regular basis in order to respond to the constantly changing threat landscape.
Our Board of Directors considers cybersecurity to be a business risk and oversees enterprise-wide risks through the Audit Committee. The Audit Committee is designated by the Board with the responsibility for monitoring and reporting on management’s cybersecurity and risk management processes. The ERM Committee is the management-entity designated by the Chief Executive Officer with the responsibility to direct and execute our risk governance and strategy, including cyber risk. This ERM Committee is composed of the Company’s Executive Vice Presidents and each of the Company’s Senior Vice Presidents. Our Senior Vice President and Treasurer chairs the ERM Committee. The Vice President for Information Technology (“IT”) leads the information security program, manages cyber governance and incident management. The Vice President of IT and the Director of Infrastructure and Security have over forty-five years of combined information technology experience and over a decade of cybersecurity experience. The ERM Committee and Vice President for IT assess cyber risk and provide recommendations for management. The Chair of the ERM Committee and the Vice President for IT brief the Audit Committee regularly. These updates include an overview of cyber risk management activities, cyber threats, and key information security processes and mitigation efforts. The Chair of the Audit Committee provides regular reports to the Board on critical cyber risk and security topics presented to the Audit Committee by management. In addition, informal and ad hoc conversations about cyber risk and industry developments frequently occur among Board members and management.
Incident Management
We have implemented security procedures and measures in order to protect our information from theft, loss, damage or interruption from a number of potential sources or events. LSB maintains and tests an incident response plan that outlines steps for the containment, investigation of, response to and recovery from cybersecurity incidents. The plan also includes information pertaining to roles, responsibilities, and reporting process. This plan is a part of our formal, enterprise-wide crisis management process, which outlines a communication plan with executive leadership as well as guidelines for communication with the Board. During 2024, we did not experience a cybersecurity incident that resulted in a material adverse effect on our business strategy, results of operations, or financial condition; however, there can be no guarantee that we will not experience such an incident in the future. Although we make extensive efforts to maintain the security and integrity of our information systems and technology operations, these systems are subject to the cyber risk of incident or disruption, and there can be no assurance that our security safeguards, and those of our third-party providers, will prevent incidents to our or our third-party providers’ systems that could adversely affect our business. For a discussion of these risks, see “Item 1A. Risk Factors—General Risk Factors.”
ITEM 2. PROPERTIES
Our owned properties consist primarily of production facilities and wholesale and retail distribution facilities. The following table presents our significant production facilities as of December 31, 2024:
| | | | | | | | | | | | |
Facility | | El Dorado Facility | | | Cherokee Facility | | | Pryor Facility | |
Location | | El Dorado, AR | | | Cherokee, AL | | | Pryor, OK | |
Plant Area (acres) | | | 150 | | | | 160 | | | | 47 | |
Site Area (acres) | | | 1,400 | | | | 1,300 | | | | 104 | |
Site Status | | Owned | | | Owned | | | Owned | |
Annual Ammonia Production Capacity (tons) | | 493,000 (A) | | | 188,000 (B) | | | 246,000 (C) | |
_____________________________
(A)The ammonia production capacity is based on 1,350 tons per day of production for the year. The El Dorado Facility did not perform a Turnaround during 2024.
(B)The ammonia production capacity is based on 515 tons per day of production for the year but excludes 40 Turnaround days during 2024.
(C)The ammonia production capacity is based on 675 tons per day of production for the year but excludes 42 Turnaround days during 2024.
For 2024, our facilities produced approximately 757,000 tons of ammonia, a decrease from the prior year as a result of two Turnarounds in 2024.
We distribute our agricultural products through two owned wholesale and retail distribution centers, with one located in Texas and one located in Missouri.
In addition, we currently lease the office space housing our headquarters in Oklahoma City, Oklahoma.
Most of our real property and equipment located at our chemical facilities are pledged as collateral to secure our long-term debt. All of the properties utilized by our businesses are suitable and adequate to meet the current needs of that business and relate to domestic operations.
ITEM 3. LEGAL PROCEEDINGS
See “Legal Matters” under Note 7 – Commitments and Contingencies to the Consolidated Financial Statements included in this report.
ITEM 4. MINE SAFETY DISCLOSURES
Not applicable
PART II
ITEM 5. MARKET FOR REGISTRANT’S COMMON EQUITY, RELATED STOCKHOLDER MATTERS AND ISSUER PURCHASES OF EQUITY SECURITIES
Market Information
Our common stock is trading on the New York Stock Exchange under the symbol “LXU.”
Stockholders
As of February 21, 2025, we had approximately 303 record holders of our common stock. This number is based on the actual number of holders registered at such date and does not include holders whose shares are held in “street name” by brokers and other nominees.
Equity Compensation Plans
Discussions relating to our equity compensation plans under Item 12 of Part III are incorporated by reference to our definitive proxy statement which we intend to file with the SEC no later than 120 days after the end of the fiscal year covered by this Annual Report on Form 10-K.
Dividends
We have not paid cash dividends on our outstanding common stock in many years, and we do not currently anticipate paying cash dividends on our outstanding common stock in the near future. Our Board has not made a decision whether or not to pay dividends on our common stock in 2025.
Sales of Unregistered Securities
There were no sales of unregistered securities during the year ended December 31, 2024 that were not previously reported on a Quarterly Report on Form 10-Q or a Current Report on Form 8-K.
Purchases of Equity Securities
The were no repurchases of our common stock during the three months ended December 31, 2024.
ITEM 6. [RESERVED]
ITEM 7. MANAGEMENT’S DISCUSSION AND ANALYSIS OF FINANCIAL CONDITION AND RESULTS OF OPERATIONS
This discussion is intended to provide a reader of our financial statements with management’s perspective on our financial condition, results of operations, liquidity, and certain other factors that may affect our future results. Investors should read the following discussion and analysis in conjunction with the consolidated financial statements and related notes included in “Item 8. Financial Statements and Supplementary Data.” Notes referenced in this discussion and analysis refer to the notes to consolidated financial statements that are found in “Item 8. Financial Statements and Supplementary Data—Notes to Consolidated Financial Statements.” Certain statements contained in this discussion may be deemed to be forward-looking statements. See “Special Note Regarding Forward-Looking Statements.” Actual results could differ materially from those discussed in or implied by forward-looking statements as a result of various factors, including those discussed below and elsewhere in this Annual Report on Form 10-K, particularly in the section entitled “Risk Factors.” Unless we state otherwise or the context otherwise requires, the terms “we,” “us,” “our” and the “Company” refer to LSB Industries, Inc. and its consolidated subsidiaries.
Overview
LSB is headquartered in Oklahoma City, Oklahoma and we manufacture and sell chemical products for the agricultural and industrial markets. We own and operate three multi-plant facilities in Cherokee, Alabama, El Dorado, Arkansas and Pryor, Oklahoma, and operate a facility on behalf of Covestro LLC in Baytown, Texas. Our products are sold through distributors and directly to end customers, primarily throughout the United States and parts of Canada, and to explosives manufacturers in the United States and other parts of North America.
Key Operating Initiatives for 2025
We expect our future results of operations and financial condition to benefit from the following key initiatives:
•Investing to improve Environmental, Health & Safety and Reliability at our Facilities while Supplying our Customers with Products of the Highest Quality.
▪We believe that our operational progress over the past several years represents proof that high safety standards not only enable us to protect what matters, which is the well-being of our employees, but also translates into improved plant performance. In 2025, we remain focused on our efforts to further the progress we have made with our safety programs to move closer to attaining zero injuries. We have been investing and plan to continue to invest additional capital at all three of our facilities during 2025 to build upon the success we have had in implementing enhanced safety programs during the last several years.
▪We have multiple initiatives underway focused on continuing to improve the reliability of our plants as we advance towards our ammonia on-stream operating rate target and increase our production volumes of ammonia and other downstream products. Progress towards these targets would enable us to produce greater volumes of product for sale while lowering our unit cost of production thereby increasing our overall profitability. Additionally, our product quality program continues to focus on providing products to our customers that meet our quality standards.
•Continued Optimization and Increase the Breadth of Distribution of our Product Mix. We have initiatives underway to increase the distribution of our products within our industrial end markets, among other product mix optimization strategies. We believe that these initiatives and strategies, combined with continued expansion of our customer relationships, the robust market analysis capabilities we have developed, and the establishment of in-market tank storage and distribution terminals, will make us more effective in identifying and capitalizing on the most profitable distribution opportunities for our products, while making our financial results more stable and predictable. Additionally, we have completed and are advancing several capital improvement projects with the intention of increasing our sales volumes of higher value downstream products resulting in improvements in our overall profit margins.
•Development of Low Carbon Ammonia and Clean Energy Projects. The reduction of greenhouse gas emissions, particularly related to carbon dioxide, has been and we expect will increasingly become a global environmental priority. Ammonia has continued to emerge as one of the more viable alternatives to serve as a hydrogen-based energy source for a variety of applications due to its higher energy density and ease of storage relative to hydrogen gas. Low carbon ammonia can be used as a coal and natural gas substitute in power generation, a zero-carbon fuel in the maritime sector, and as a carbon free fertilizer. If low carbon ammonia were to be adopted for these and other energy needs globally, some studies have indicated that future demand could increase from current levels of global annual production of ammonia.
Low carbon ammonia is produced using natural gas and conventional processes but includes an additional stage where the carbon dioxide emissions are captured and permanently stored in deep underground rock formations. We believe that the resulting low carbon emission product can be sold at a premium to conventional ammonia to customers seeking to reduce their carbon footprint, particularly in the power generation, marine, industrial, mining and agricultural end markets. Additionally, we believe that producers of low carbon ammonia will be eligible for government incentives aimed at promoting carbon capture and sequestration (CCS).
We believe we are well-positioned to capitalize on this opportunity and become a market leader given our potential to retrofit our existing plants, which we believe can reduce our time to market for low carbon ammonia and also reduce the upfront capital expenditures necessary to enable us to produce this product. Additionally, we are collaborating with other energy-related companies to develop greenfield projects where we expect to mitigate risk through shared investment of capital as well as by negotiating potential offtake agreements from customers for the output of these plants. We are currently continuing to evaluate and develop projects that could enable us to become a producer and marketer of low carbon ammonia and other derivative products. These include a low carbon ammonia project at our El Dorado Facility in collaboration with Lapis Energy and a low carbon ammonia project on the Houston Ship Channel in conjunction with INPEX Corporation (“INPEX”), Air Liquide Group (“Air Liquide”) and Vopak Exolum Houston LLC (f/k/a Vopak Moda Houston LLC), a joint venture between Royal Vopak and Exolum (“Vopak Exolum”).
•Evaluate and Pursue Organic Capacity Expansion. We have been evaluating opportunities across all our facilities to increase production capacity through the implementation of several potential debottlenecking projects, particularly at our El Dorado Facility. Initial feasibility studies have pointed to potentially attractive returns for some of these projects. However, given the current high-cost environment and limited resources, coupled with our outlook for moderating selling prices, during 2024 we elected to put the El Dorado expansion projects on hold. We plan to reevaluate these projects over the course of 2025 to determine our prospects of moving forward with one or more of them in the future.
•During 2024, we undertook several smaller projects that we expect to enhance our profitability during 2025. These projects include:
▪Construction of additional AN solution storage and new AN solution rail loading capability at our El Dorado Facility to significantly increase the volume of AN solution sales and increase product optionality at the site. We expect this project to be completed in the third quarter of 2025;
▪Construction of 5,000 tons of additional nitric acid storage at our El Dorado Facility was completed in the latter part of 2024 to help us optimize our product sales mix; and
▪Expansion of our urea capacity at our Pryor Facility, to enable to use a portion of the facility’s ammonia output to upgrade to approximately 75,000 additional tons of UAN per year. This project was completed in late 2024 and we expect it to lead to increased UAN sales volumes during 2025.
•Evaluate Acquisitions of Strategic Assets or Companies. We may evaluate opportunities to acquire strategic assets or companies where we believe those acquisitions will enhance the value of the Company and provide attractive returns. We may consider assets and companies that can provide us with geographic expansion, extend an existing product line, add one or more new product lines, leverage our existing ammonia production capabilities, or complement our existing business lines, among other accretive opportunities.
Recent Business Developments
Advanced Low Carbon Ammonia Initiatives
In May 2024, we announced an agreement to supply, for a five-year period commencing January 1, 2025, up to 150,000 short tons per year of low carbon ammonium nitrate solution (“ANS”) to Freeport Minerals Corporation (“Freeport”). In early 2025 we began supplying conventional ANS to Freeport from our El Dorado Facility, and expect to phase in the low carbon contracted volume in the next year. Freeport intends to use the low carbon ANS purchased from us for its United States copper mining operations.
In October 2023, we announced a collaboration with INPEX, Air Liquide and Vopak Exolum to conduct a pre-FEED for the development of a large-scale, low carbon ammonia production and export project on the Houston Ship Channel. If the development proceeds, the project’s first phase is targeted to produce more than 1.1 million metric tons per year of low carbon ammonia by early 2029, with options for future production expansions. The pre-FEED study was completed in the fourth quarter of 2024. The next phase consists of a FEED study with a goal to commence in 2025, pending the outcome of conversations with potential customers regarding off-take from the proposed facility. A final investment decision is expected by mid-2026.
The parties completed a feasibility study on the project during the first quarter of 2023 and the proposed facility’s location on the Houston Ship Channel, the second largest petrochemical corridor in the world, leverages existing infrastructure assets. Vopak Exolum has invested in storage and handling infrastructure for bulk liquid products and currently operates an ammonia terminal that includes storage tanks and a newbuild dock with multiple deep-water berths. The project also has access to utilities and would be near multiple pipelines that could supply raw materials like natural gas and water.
The project partners will bring complementary expertise to the production, operation, storage and export for the advancement of low carbon ammonia production in the United States:
•Air Liquide, a world leader in industrial gas production, and INPEX, Japan’s largest energy exploration and production company, would collaborate on low carbon hydrogen production. Air Liquide would supply its Autothermal Reforming
(“ATR”) technology, an ideal solution for large-scale hydrogen production projects, combined with its proprietary carbon capture technology. The combination of ATR technology with carbon capture aims to capture at least 95% of direct CO2 emissions from hydrogen production with approximately 1.6 million metric tons per year of CO2 captured and permanently sequestered from this project. Air Liquide would also be responsible for onsite nitrogen and oxygen production, using its proprietary Air Separation Unit technology.
•INPEX and LSB would collaborate on low carbon ammonia production. We led the selection of KBR Inc. as the ammonia loop technology provider, and led or will lead the pre-FEED study, engineering, procurement and construction of the facility. We would also be responsible for the day-to-day operation of the ammonia loop.
•INPEX and LSB would sell the low carbon ammonia and finalize off-take agreements with the numerous parties that have expressed interest and could also further partner in the project. The ammonia from this facility is intended to be used as a clean fuel for power generation, a hydrogen carrier, an industrial chemical feedstock, and as a marine fuel in a variety of domestic and international markets. INPEX, with stakes in both hydrogen and ammonia production, will likely be the largest investor in the overall project across the entire value chain, from production to export.
•Vopak Exolum currently operates ammonia storage and handling infrastructure from its Very Large Gas Carriers-capable deepwater berth located in the deepest part of the Houston Ship Channel. Vopak Exolum will maintain its ownership of the existing infrastructure and plans to build additional storage capacity as required to handle the low carbon ammonia production from the proposed new facility.
In May 2023, we entered into a non-binding memorandum of understanding (the "MOU") with Amogy Inc. (“Amogy”) aimed at developing the adoption of low carbon ammonia as a marine fuel, initially for the United States inland waterways transportation sector. Through joint efforts, we and Amogy will focus on advancing the understanding, utilization, and advocacy of low carbon ammonia as a sustainable fuel. Pursuant to the MOU, the companies will collaborate on the evaluation and development of a pilot program that integrates our low carbon ammonia and Amogy’s ammonia-to-power solution. Upon successful completion of the evaluation and pilot program, the companies expect to further collaborate at a larger-scale, including exploration of opportunities for development of an end-to-end supply chain of low carbon ammonia and deployment of Amogy technology across multiple applications, including maritime vessels. The evaluation and pilot program includes potential engagement with other parties across the ammonia value chain. Amogy successfully completed a pilot program test retrofitting a tugboat with a power unit using ammonia as a fuel source during the third quarter of 2024. We will also collaborate on various advocacy, education, and outreach efforts regarding the use of ammonia as a fuel.
In April 2022, we entered into an agreement with Lapis Energy to develop a project to capture and sequester CO2 at our El Dorado Facility. Lapis, backed by Cresta Fund Management, a Dallas-based middle-market infrastructure investment firm, will invest the majority of the capital required for project development. The project is expected to be completed and operational in 2026, subject to the approval of a Class VI permit, at which time CO2 injections are expected to begin. Once operational, the project at the El Dorado site will initially capture and sequester approximately 400,000 to 500,000 metric tons of CO2 per year in underground saline aquifers. The sequestered CO2 generated from the facility’s ammonia production is expected to qualify for federal tax credits under Internal Revenue Code Section 45Q, which are $85 per metric ton of CO2 captured and sequestered. Lapis, as the majority owner of the carbon capture and sequestration equipment, will earn the 45Q tax credits and will pay us a fee for each ton of CO2 captured and sequestered beginning in 2026. Once in operation, the sequestered CO2 is expected to reduce our overall scope 1 GHG emissions by approximately 25% from current levels. In addition, sequestering approximately 400,000 to 500,000 metric tons of CO2 annually is expected to enable us to produce approximately 305,000 to 380,000 metric tons of low carbon ammonia annually, a product that could potentially be sold at higher price levels than conventional ammonia. In February 2023, a key milestone was achieved in the advancement of our low carbon ammonia project at El Dorado by filing a pre-construction Class VI permit application with the United States Environmental Protection Agency (the “EPA”). The EPA recognized the application as complete in March 2023 and is currently in the review process.
2024 Sales Volumes Down Only Slightly Despite Two Turnarounds and Lower Selling Prices But Results Partially Offset by Lower Natural Gas Costs
Total sales volumes of our products were down only slightly in 2024 as compared to 2023 despite the turnarounds we performed at our Pryor and Cherokee facilities in 2024, while we had no significant turnarounds in 2023. These results reflect the improved operating performance of our downstream plants, including the expansion of our UAN capacity at our Pryor Facility. Average selling prices for full year 2024 were lower than average selling prices for full year 2023, largely due to first quarter pricing. Pricing in the first quarter of 2024 was down significantly from the first quarter of 2023 when prices were coming down off 2022 record highs resulting predominantly from elevated natural gas prices in Europe. The impact of slightly lower sales volumes and lower average selling prices was partially offset by lower natural gas raw material costs throughout 2024 versus 2023.
Ammonia prices strengthened during the second half of 2024, supported by a combination of global factors, including: tight United States and West-of-Suez canal supply-demand dynamics driven by global supply disruptions; geopolitical concerns over conflict in the Middle East leading to higher natural gas raw material costs for European ammonia producers; extended turnarounds, outages and
limited spot availability across the Middle East, North Africa and Trinidad that reduced global inventories; ongoing disruptions in the Suez Canal limiting ammonia imports into Europe from the Middle East; and the delayed startup of new production capacity in the United States Gulf and export terminal in Russia.
Ammonia pricing could be challenged in 2025 for a variety of reasons, including: the anticipated start-up of new production capacity in both the United States and internationally; an increase in Russian exports; and continued muted demand for nitrogen products from the global industrial sector, particularly in Asia; however, we could see upside to ammonia pricing driven by a variety of factors, including: a continued increase in energy prices; a strengthening Chinese economy driving increased industrial market demand; further delays in new production capacity coming online; gas curtailments in regions exporting ammonia; a lower interest rate environment; the potential impact of United States import tariffs; and supportive weather dynamics.
Demand for our industrial products is stable despite persistent global economic challenges. Nitric acid demand has been steady, reflecting the strength of the United States economy and robust consumer spending levels. Demand for AN for use in mining applications has been bolstered by positive exposure to copper, gold and iron ore, as well as continued attractive market fundamentals for aggregate production relating to infrastructure construction. While some degree of economic uncertainty persists, we believe that we have a meaningful degree of downside protection in our industrial business given our diverse customer base, the nature of our contracts and our ability to shift our production mix to products where demand and pricing are strongest.
With respect to trends in our agricultural markets, corn prices have rebounded from August 2024 levels reflecting recent revisions by the United States Department of Agriculture (“USDA”) for smaller than previously estimated United States corn supplies and a decline in ending stocks and production challenges in certain international growing regions. While currently above average 2024 levels, corn prices sit below 2023 levels due largely to the impact on corn supply of the multi-year high United States corn harvest in 2023. The USDA is currently estimating that United States farmers planted approximately 90.6 million acres of corn during the Spring 2024 planting season, down from 2023.
See a more detailed discussion below under “Key Industry Factors” below.
Key Industry Factors
Supply and Demand
Fertilizer. The price at which our agricultural products are ultimately sold depends on numerous factors, including the supply and demand for nitrogen fertilizers which, in turn, depends upon world grain demand and production levels, the cost and availability of transportation and storage, weather conditions, competitive pricing and the availability of imports. Additionally, expansions or upgrades of competitors’ facilities and international and domestic political and economic developments continue to play an important role in the global nitrogen fertilizer industry economics. These factors can affect, in addition to selling prices, the level of inventories in the market which can cause price volatility and affect product margins.
From a farmers’ perspective, the demand for fertilizer is affected by the aggregate crop planting decisions and farm economics, weather and fertilizer application rate decisions of individual farmers. Individual farmers make planting decisions based largely on prospective profitability of a harvest, while the specific varieties and amounts of fertilizer they apply depend on factors such as their financial resources, soil conditions, weather patterns and the types of crops planted.
Additionally, changes in corn, soybean, cotton and wheat prices can affect the number of acres of corn planted in a given year, and the number of acres planted will drive the level of nitrogen fertilizer consumption, likely affecting prices.
According to the World Agricultural Supply and Demand Estimates Report (“WASDE Report”) dated February 11, 2025 (the “February Report”), farmers planted approximately 90.6 million acres of corn in 2024, down 4.2% compared to the 2023 planting season. According to the February Report, the USDA estimates the United States ending stocks for the 2024 Harvest will be approximately 39.1 million metric tons, a 12.7% decrease from the 2023 Harvest. The USDA's expected yield for the 2024 Harvest is 179.3, up approximately 1.1% from a year ago.
The following February 2025 estimates are associated with the corn market:
| | | | | | | | | | | | | | | | | | | | |
| | 2025 Crop | | | 2024 Crop | | | | | | 2023 Crop | | | | |
| | (2024 Harvest) | | | (2023 Harvest) | | | Percentage | | | (2022 Harvest) | | | Percentage | |
| | February Report (1) | | | February Report (1) | | | Change (2) | | | February Report (1) | | | Change (3) | |
U.S. Area Planted (Million acres) | | | 90.6 | | | | 94.6 | | | | (4.2 | %) | | | 88.2 | | | | 2.7 | % |
U.S. Yield per Acre (Bushels) | | | 179.3 | | | | 177.3 | | | | 1.1 | % | | | 173.4 | | | | 3.4 | % |
U.S. Production (Million bushels) | | | 14,867 | | | | 15,341 | | | | (3.1 | %) | | | 13,651 | | | | 8.9 | % |
U.S. Ending Stocks (Million metric tons) | | | 39.1 | | | | 44.8 | | | | (12.7 | %) | | | 34.6 | | | | 13.0 | % |
World Ending Stocks (Million metric tons) | | | 290.3 | | | | 315.8 | | | | (8.1 | %) | | | 304.8 | | | | (4.8 | %) |
_____________________________
(1)Information obtained from the February Report for the 2024/2025 (“2025 Crop”), 2023/2024 (“2024 Crop”) and 2022/2023 (“2023 Crop”) corn marketing years. The marketing year is the twelve-month period during which a crop normally is marketed. For example, the marketing year for the current corn crop is from September 1 of the current year to August 31 of the next year. The year begins at the harvest and continues until just before harvest of the following year.
(2)Represents the percentage change between the 2025 Crop amounts compared to the 2024 Crop amounts.
(3)Represents the percentage change between the 2025 Crop amounts compared to the 2023 Crop amounts.
According to the February Report, the USDA corn outlook for the United States is for supply and use to remain unchanged from the prior month report and projected season-average farm price to increase from the prior month by 10 cents to $4.35 per bushel, based on lower global supplies. The USDA reduced foreign exports and lowered ending stocks based on reduced production, trimming 1.8 million tons in global corn production citing weather-related yield declines in both Argentina and Brazil. From a demand perspective, we believe that corn prices will remain at a level that will further support demand for fertilizers during 2025.
Industrial Products. Our industrial products sales volumes are dependent upon general economic conditions primarily in the housing, automotive, and paper industries. According to the American Chemistry Council, the United States economic indicators for 2024 were largely flat as compared to 2023 but are expected to ramp up to an annual growth rate of 3% during 2025. Our sales prices generally vary with the market price of ammonia or natural gas, as applicable, in our pricing arrangements with customers.
Our LDAN and AN solution are primarily used as AN fuel oil and specialty emulsions for usage in the quarry and the construction industries, for metals mining and to a lesser extent, for coal. Demand for AN for use in mining applications is robust due to attractive market fundamentals for quarrying and aggregate production and United States metals.
While economic concerns persist for 2025, we believe that for our industrial products we have a meaningful degree of downside protection from the potential impacts of a recession given the nature of our contracts and our ability to shift our production mix to products where demand and pricing are strongest.
Natural Gas Prices
Natural gas is the primary resource for conversion and manufacturing production of our nitrogen products. In recent years, United States natural gas reserves have increased significantly due to, among other factors, advances in extracting shale gas, which has reduced and stabilized natural gas prices, providing North America with a cost advantage over certain imports. As a result, our competitive position and that of other North American nitrogen fertilizer producers has been positively affected.
Historically, we have purchased natural gas either on the spot market, through forward purchase contracts, or a combination of both and have used forward purchase contracts to lock in pricing for a portion of our natural gas requirements. These forward purchase contracts are generally either fixed-price or index-price, short-term in nature and for a fixed supply quantity. We are able to purchase natural gas at competitive prices due to our connections to large distribution systems and their proximity to interstate pipeline systems. At December 31, 2024, we had natural gas contracts of approximately 0.6 million MMBtus, at an average cost of $3.70 per MMBtu. These contracts extend through March 2025. The following table shows the annual volume of natural gas we purchased and the average cost per MMBtu:
| | | | | | | | |
| | 2024 | | | 2023 | |
Natural gas volumes (MMBtu in millions) | | | 28.4 | | | | 29.8 | |
Natural gas average cost per MMBtu | | $ | 2.30 | | | $ | 4.16 | |
Transportation Costs
Costs for transporting nitrogen-based products can be significant relative to their selling price. We continue to evaluate the rising costs of freight domestically. As a result of increases in demand for available rail, truck and barge options to transport product, primarily during the spring and fall planting seasons, higher transportation costs have and could continue to impact our margins, where we are unable to fully pass through these costs to our customers. Additionally, truck driver shortages could impact our ability to fulfill customer demand. As a result, we continue to evaluate supply chain efficiencies to reduce or counter the impact of higher logistics costs.
Key Operational Factors
Facility Reliability
Consistent, reliable and safe operations at our chemical plants are critical to our financial performance and results of operations. The financial effects of planned downtime at our plants, including Turnarounds is mitigated through a diligent planning process that considers the availability of resources to perform the needed maintenance and other factors. Unplanned downtime of our plants typically results in lost contribution margin from lost sales of our products, lost fixed cost absorption from lower production of our products and increased costs related to repairs and maintenance. All Turnarounds result in lost contribution margin from lost sales of our products, lost fixed cost absorption from lower production of our products and increased costs related to repairs and maintenance, which repair and maintenance costs are expensed as incurred.
Our El Dorado Facility is currently on a three-year ammonia plant Turnaround cycle with the next ammonia plant Turnaround planned in the third quarter of 2025. However, we planned and completed a short plant outage in July 2024 to perform a catalyst change to return to maximum production rates.
Our Pryor Facility completed its scheduled full plant Turnaround, which commenced during the third quarter of 2024. Our Cherokee Facility completed its scheduled ammonia plant Turnaround during the fourth quarter of 2024. Following those Turnarounds, the Pryor Facility and the Cherokee Facility are expected to be on a two-year and three-year ammonia plant Turnaround cycle, respectively.
Ammonia Production
Ammonia is the basic product used to produce all of our upgraded products. The ammonia production rates of our plants affect the total cost per ton of each product produced and the overall sales of our products.
Total ammonia production in 2024 was 757,000 tons which was lower due to significant planned turnaround activity at both our Pryor and Cherokee facilities. For 2025, we are targeting total ammonia production of approximately 790,000 tons to 820,000 tons which reflects planned turnaround work at our El Dorado Facility in the third quarter of 2025.
We believe that our focus on continuous improvement in reliability as discussed in our key operating initiatives underscores our focused goal of achieving a 95% ammonia on-stream operating rate goal and increasing our production volumes of downstream products.
Forward Sales Contracts
In certain instances, we may use forward sales of our fertilizer products to optimize our asset utilization, planning process and production scheduling. These sales are made by offering customers the opportunity to purchase product on a forward basis at prices and delivery dates that are agreed upon, with dates typically occurring within 12 months. We use this program to varying degrees during the year depending on market conditions and our view of changing price environments. Fixing the selling prices of our products months in advance of their ultimate delivery to customers typically causes our reported selling prices and margins to differ from spot market prices and margins available at the time of shipment.
Consolidated Results for 2024
Our consolidated net sales for 2024 were $522.4 million compared to $593.7 million for 2023. Our consolidated operating loss for 2024 was $5.5 million compared to consolidated operating income of $51.8 million for 2023. The items affecting our operating results are discussed below and under “Results of Operations.”
Items Affecting Comparability of Results
Selling Prices
Our 2024 average selling prices for our ammonia, AN & Nitric Acid, and UAN decreased compared to 2023. As discussed above under “Recent Business Developments,” the decrease was largely due to first quarter pricing, which was down significantly from the first quarter of 2023 when prices were coming down off 2022 record highs resulting predominantly from elevated natural gas prices in Europe.
Our 2024 average selling prices for most of our industrial products were also lower compared to 2023, primarily driven by lower natural gas prices in 2024 as many of our industrial contracts are indexed to the NYMEX natural gas benchmark price.
Turnaround Activities (2024 only)
As discussed above, we performed major Turnaround activities at our Pryor Facility in the third quarter of 2024 and at our Cherokee Facility in the fourth quarter of 2024. Additionally, we planned and executed a minor planned outage at our El Dorado Facility in July 2024 to change the catalyst in the ammonia plant to maximize production rates. When such activities are performed, overall results are negatively impacted. This impact includes lost contribution margin from lost sales, lost fixed cost absorption from lower production, and increased costs associated with repairs and maintenance. In addition, Turnaround related costs may be incurred in periods earlier than the actual outage of the plant for activities such as planning and procurement of materials.
Plant, Property and Equipment Write-off and Disposals
During 2024 and 2023, we recorded asset write-downs primarily related to assets no longer in use of $11.7 million and $3.6 million, respectively. These asset write-downs are included in Other expense (income), net on our consolidated statements of operations.
Other Income from Railcar Sublease
During 2024 and 2023, we subleased on a short-term basis certain railcars and recognized the corresponding revenue as a component of “Other (income) expense, net” on our consolidated statement of operations, which we discuss in Note 14 – Leases.
Gain on Extinguishment of Senior Secured Notes
During 2024, we repurchased $96.6 million of our Senior Secured Notes through open market transactions for approximately $92.2 million. As a result, we recognized a gain on extinguishment of debt, net of issuance costs, of approximately $3.0 million.
During 2023, we repurchased $125.0 million of our Senior Secured Notes through open market transactions for approximately $114.3 million. As a result, we recognized a gain on extinguishment of debt, net of issuance costs, of approximately $8.6 million. Both the 2023 and 2024 repurchase transactions also serve to reduce our interest expense.
Results of Operations
The following is a discussion and analysis of our consolidated results of operations for the year ended December 31, 2024 compared to the year ended December 31, 2023. For a discussion and analysis of our consolidated results of operations for the year ended December 31, 2023 compared to the year ended December 31, 2022, see Item 7, Management’s Discussion and Analysis and Results of Operations in our 2023 Form 10-K filed with the SEC on March 6, 2024.
Net sales to unaffiliated customers are reported in the consolidated financial statements and gross profit represents net sales less cost of sales. Net sales are reported on a gross basis with the cost of freight being recorded in cost of sales.
Year Ended December 31, 2024 Compared to Year Ended December 31, 2023
The following table sets forth certain financial information, the increase or decrease between those periods, the percentage increase or decrease between those periods with respect to each line item:
| | | | | | | | | | | | | | | | |
| | | | | | | | | | | | |
| | | | | | | | Percentage | |
| | 2024 | | | 2023 | | | Change | | | Change | |
| | (Dollars In Thousands) | | | | |
Net sales: | | | | | | | | | | | | |
AN & Nitric Acid | | $ | 212,478 | | | $ | 221,818 | | | $ | (9,340 | ) | | | (4 | )% |
Urea ammonium nitrate (UAN) | | | 139,435 | | | | 154,206 | | | | (14,771 | ) | | | (10 | )% |
Ammonia | | | 136,662 | | | | 166,581 | | | | (29,919 | ) | | | (18 | )% |
Other | | | 33,825 | | | | 51,104 | | | | (17,279 | ) | | | (34 | )% |
Total net sales | | $ | 522,400 | | | $ | 593,709 | | | $ | (71,309 | ) | | | (12 | )% |
| | | | | | | | | | | | |
Gross profit: | | | | | | | | | | | | |
Adjusted gross profit (1) | | | 159,838 | | | | 157,075 | | | | 2,763 | | | | 2 | % |
Depreciation and amortization (2) | | | (74,260 | ) | | | (68,385 | ) | | | (5,875 | ) | | | 9 | % |
Turnaround expense | | | (37,781 | ) | | | (2,430 | ) | | | (35,351 | ) | | NM | |
Total gross profit | | | 47,797 | | | | 86,260 | | | | (38,463 | ) | | | (45 | )% |
Selling, general and administrative expense | | | 41,767 | | | | 36,580 | | | | 5,187 | | | | 14 | % |
Other expense (income), net | | | 11,535 | | | | (2,097 | ) | | | 13,632 | | | NM | |
Operating (loss) income | | | (5,505 | ) | | | 51,777 | | | | (57,282 | ) | | | (111 | )% |
Interest expense, net | | | 34,452 | | | | 41,136 | | | | (6,684 | ) | | | (16 | )% |
Gain on extinguishments of debt | | | (3,013 | ) | | | (8,644 | ) | | | 5,631 | | | | (65 | )% |
Non-operating other income, net | | | (10,907 | ) | | | (14,611 | ) | | | 3,704 | | | | (25 | )% |
(Benefit) provision for income taxes | | | (6,684 | ) | | | 5,973 | | | | (12,657 | ) | | | (212 | )% |
Net (loss) income | | $ | (19,353 | ) | | $ | 27,923 | | | $ | (47,276 | ) | | | (169 | )% |
| | | | | | | | | | | | |
Other information: | | | | | | | | | | | | |
Gross profit percentage (3) | | | 9.1 | % | | | 14.5 | % | | | (5.4 | )% | | | |
Adjusted gross profit percentage (1)(3) | | | 30.6 | % | | | 26.5 | % | | | 4.1 | % | | | |
Property, plant and equipment expenditures | | $ | 92,294 | | | $ | 67,603 | | | $ | 24,691 | | | | 37 | % |
_____________________________
N/M Not meaningful.
(1)Represents a non-GAAP measure. The amounts exclude unallocated depreciation and amortization and Turnaround expenses, which we believe are not reflective of our operating performance in a given period.
(2)Represents amount classified as cost of sales.
(3)As a percentage of total net sales.
The following tables provide key operating metrics for the fertilizer and major industrial products, the increase or decrease between those periods, and the percentage increase or decrease between those periods with respect to each line item:
| | | | | | | | | | | | | | | | |
| | | | | | | | Percentage | |
Product (tons sold) | | 2024 | | | 2023 | | | Change | | | Change | |
AN & Nitric Acid | | | 553,613 | | | | 528,895 | | | | 24,718 | | | | 5 | % |
Urea ammonium nitrate (UAN) | | | 482,775 | | | | 483,139 | | | | (364 | ) | | | 0 | % |
Ammonia | | | 321,300 | | | | 375,478 | | | | (54,178 | ) | | | (14 | )% |
Total | | | 1,357,688 | | | | 1,387,512 | | | | (29,824 | ) | | | (2 | )% |
| | | | | | | | | | | | | | | | |
| | | | | | | | Percentage | |
Gross Average Selling Prices (price per ton) | | 2024 | | | 2023 | | | Change | | | Change | |
AN & Nitric Acid | | $ | 384 | | | $ | 419 | | | $ | (35 | ) | | | (8 | )% |
Urea ammonium nitrate (UAN) | | $ | 289 | | | $ | 319 | | | $ | (30 | ) | | | (9 | )% |
Ammonia | | $ | 425 | | | $ | 444 | | | $ | (19 | ) | | | (4 | )% |
| | | | | | | | | | | | | | | | |
| | | | | | | | Percentage | |
Average Benchmark Prices (price per ton) | | 2024 | | | 2023 | | | Change | | | Change | |
Tampa Ammonia Benchmark | | $ | 488 | | | $ | 510 | | | $ | (22 | ) | | | (4 | )% |
NOLA UAN | | $ | 233 | | | $ | 263 | | | $ | (30 | ) | | | (11 | )% |
Net Sales
As noted in the table above, we recorded net sales of $522.4 million in 2024, compared to $593.7 million for 2023, or a $71.3 million reduction. Net sales of our primary products decreased during 2024 compared to 2023 driven by the impact of lower selling prices relative to 2023 for most of our products and lower ammonia sales volumes partially offset by higher AN and acids sales volumes. The increase in sales volume of AN and acids products was driven largely by stronger production at our facilities reflecting the investments made in plant reliability over the past several years and enhanced by our strategic commercial efforts.
Gross Profit
As noted in the table above, we recognized a gross profit of $47.8 million for 2024 compared to $86.3 million for 2023, or a $38.5 million reduction. Overall, our gross profit percentage was 9% for 2024 compared to 15% for 2023. Our adjusted gross profit percentage increased to 31% for 2024 from 27% for 2023.
The decrease in gross profit in 2024 was primarily driven by lower overall sales prices for our products and higher planned Turnaround expenses partially offset by lower natural gas costs.
Selling, General and Administrative (“SG&A”)
Our selling, general and administrative expenses were $41.8 million for 2024, an increase of $5.2 million compared to 2023. The net increase was primarily driven by increases in payroll related costs as well as professional service fees.
Other Expense (income), net
Other expense, net for 2024 consists primarily of asset write-downs primarily related to assets no longer in use, partially offset by short-term rental income from railcar subleases. The write-downs were higher and rental income was lower in 2024 compared to 2023.
Interest Expense, net
Interest expense, net for 2024 was $34.5 million compared to $41.1 million for 2023. The decrease primarily relates to reduced interest expense as a result of repurchases of our Senior Secured Notes made beginning in the second quarter of 2023 and during 2024, along with a lower outstanding principal balance of our Secured Financing due 2025, partially offset by the reversal of interest accrued from a previous judgment awarded to Global Industrial, Inc. in the litigation discussed in Note 7 – Commitments and Contingencies, which included an interest component.
Gain on Extinguishment of Debt
In 2024, we repurchased $96.6 million of our Senior Secured Notes through open market transactions for approximately $92.2 million. As a result, we recognized a gain on extinguishment of debt, net of issuance costs, of approximately $3.0 million.
In 2023, we repurchased $125.0 million of our Senior Secured Notes through open market transactions for approximately $114.3 million. As a result, we recognized a gain on extinguishment of debt net of issuance costs of approximately $8.6 million.
Non-operating Other Income, net
Non-operating other income for 2024 was $10.9 million compared to $14.6 million for 2023, primarily relating to interest income earned during both periods from our short-term investments.
(Benefit) provision for Income Taxes
The benefit for income taxes for 2024 was $6.7 million compared to the provision for income taxes of $6.0 million for 2023. The resulting effective tax rate for 2024 was 25.7% on pre-tax loss compared to 17.7% for 2023 on pre-tax income. For 2024, the effective tax rate was higher than the statutory rate primarily due to changes to valuation allowances and remeasurement of state deferred balances as a result of changes to state apportionment. For 2023, the effective tax rate was less than the statutory rate primarily due to the impact of state tax law changes and the remeasurement of state deferred balances. Also see discussion in Note 6 – Income Taxes.
Liquidity and Capital Resources
The following table summarizes our cash flow activities for 2024 and 2023:
| | | | | | | | | | | | |
| | 2024 | | | 2023 | | | Change | |
| | (In Thousands) | |
Net cash flows - operating activities | | $ | 86,576 | | | $ | 137,521 | | | $ | (50,945 | ) |
| | | | | | | | | |
Net cash flows - investing activities | | $ | (53,080 | ) | | $ | 57,400 | | | $ | (110,480 | ) |
| | | | | | | | | |
Net cash flows - financing activities | | $ | (114,298 | ) | | $ | (157,658 | ) | | $ | 43,360 | |
Net Cash Flow from Operating Activities
Net cash provided by operating activities was $86.6 million for 2024 compared to $137.5 million for 2023, a decrease of $50.9 million. The decrease was a result of a reduction in net sales and interest income from short term investments partially offset by lower cost of sales, sublease income received in 2024, and working capital changes.
Net Cash Flow from Investing Activities
Net cash used by investing activities was $53.1 million for 2024 compared to $57.4 million provided by investing activities for 2023, a change of $110.5 million.
For 2024, the net cash used primarily relates to purchases of short-term investments of $270.9 million and expenditures for plant, property and equipment of $92.3 million partially offset by proceeds from maturities of short-term investments of $310.3 million.
For 2023, the net cash provided primarily relates to proceeds from maturities of short-term investments of $389.9 million, partially offset by purchases of short-term investments of $264.4 million and expenditures for plant, property and equipment of $67.6 million.
Net Cash Flow from Financing Activities
Net cash used by financing activities was $114.3 million for 2024 compared to $157.7 million used for 2023, a change of $43.4 million.
For 2024, the net cash used primarily consists of repurchases of our Senior Secured Notes of $92.2 million, payments on other long-term debt and short-term financing of $23.4 million and repurchases of $11.9 million of common stock partially offset by proceeds from short-term financing of $16.1 million.
For 2023, the net cash used primarily consists of repurchases of our Senior Secured Notes of $114.3 million, payments on other long-term debt and short-term financing of $30.1 million, payments of $28.3 million for the purchase of treasury stock and other payments of $2.8 million, partially offset by proceeds from short-term financing of $17.8 million.
Capitalization
The following table summarizes our total current cash, cash equivalents and short-term investments long-term debt and stockholders’ equity:
| | | | | | | | |
| | December 31, | |
| | 2024 | | | 2023 | |
| | (In Millions) | |
Cash and cash equivalents | | $ | 20.2 | | | $ | 98.5 | |
Short-term investments | | | 164.0 | | | | 207.4 | |
Total cash and cash equivalents and short-term investments | | $ | 184.2 | | | $ | 305.9 | |
| | | | | | |
Revolving credit facility and long-term debt: | | | | | | |
Revolving Credit Facility | | $ | — | | | $ | — | |
Senior Secured Notes due 2028 (1) | | | 478.4 | | | | 575.0 | |
Secured Financing Agreement due 2025 | | | 8.5 | | | | 14.1 | |
Finance Leases | | | 3.9 | | | | 1.0 | |
Unamortized debt issuance costs (2) | | | (5.6 | ) | | | (8.4 | ) |
Total long-term debt, including current portion, net | | $ | 485.2 | | | $ | 581.7 | |
Total stockholders' equity | | $ | 491.6 | | | $ | 518.3 | |
_____________________________
(1)See discussion below relating to the debt repurchases.
(2)Debt issuance costs as of December 31, 2024 and 2023 of approximately $0.6 million and $0.5 million, respectively, relating to our Revolving Credit Facility are not included in Unamortized debt issuance cost. These costs are included in our consolidated balance sheet in Intangible and other assets, net.
Revolving Credit Facility – In December 2023, we entered into a secured revolving credit facility (the “Revolving Credit Facility”) with the lenders identified on the signature pages thereof and JPMorgan Chase Bank, N.A, as administrative agent. The Revolving Credit Facility provides for borrowings up to an initial maximum of $75 million, with an option to increase the maximum by an additional $25 million (which amount is uncommitted). Availability under the Revolving Credit Facility is subject to a borrowing base and is subject to an availability block of $7.5 million, which is applied against the $75 million initially reducing the maximum (which can be removed by us at our sole discretion, subject to the satisfaction of certain conditions) (the “Availability Block”). The Revolving Credit Facility provides for a sub-facility for the issuance of letters of credit in an aggregate amount not to exceed $10 million, with the outstanding amount of any such letters of credit reducing availability for borrowings. As of December 31, 2024 our Revolving Credit Facility was undrawn and had approximately $37.2 million of availability.
The Revolving Credit Facility contains one financial covenant, which requires that, solely if we elect to remove the Availability Block, then we must maintain a minimum fixed charge coverage ratio of not less than 1.00:1.00. The financial covenant, if triggered, is tested monthly. The financial covenant was not triggered as of December 31, 2024.
Senior Secured Notes due 2028 – As of December 31, 2024, we had $478.4 million outstanding in aggregate principal amount of Senior Secured Notes, which originated from the issuance at par of two tranches of $500 million and $200 million in aggregate principal of such notes in October 2021 and March 2022, respectively. During 2024, we repurchased $96.6 million of Senior Secured Notes through open market transactions for approximately $92.2 million. As a result, we recognized a gain on extinguishment of debt, net of issuance costs, of approximately $3.0 million. During 2023, we repurchased $125.0 million of Senior Secured Notes through open market transactions for approximately $114.3 million. As a result, we recognized a gain on extinguishment of debt, net of issuance costs, of approximately $8.6 million. The Senior Secured Notes have an interest rate of 6.25%, to be paid semiannually in arrears on May 15th and October 15th, and mature on October 15, 2028.
Secured Financing Agreement due 2025 – We are party to a $30 million secured financing arrangement with an affiliate of Eldridge Industries, L.L.C. (“Eldridge”). Principal and interest are payable in 60 equal monthly installments with a final balloon payment of approximately $5 million due in August 2025.
Finance Leases – Our finance leases consist primarily of leases on railcars. Most of our railcar leases are classified as operating leases.
Capital Expenditures – Our capital expenditures during 2024 relating to plant, property and equipment were $92.3 million compared to $67.6 million in 2023. Of the expenditures in 2024, approximately $67 million was spent on projects to sustain our production capacity while approximately $25 million was spent on growth initiatives. Our capital expenditures were funded primarily from cash
and working capital. We expect capital expenditures to be approximately $80 million - $90 million for 2025 of which $60 million - $65 million is expected to be spent on sustaining production with the remainder spent on growth initiatives.
Liquidity – We believe that the combination of our cash and cash equivalents, short-term investments, the availability on our Revolving Credit Facility and our cash flow from operations will be sufficient to fund our anticipated liquidity needs for the next 12 months.
As of December 31, 2024, we had approximately $184.2 million in cash and cash equivalents and short-term investments. Our capital allocation strategy includes, from time to time, seeking to deploy capital through additional share repurchases or the retirement or purchase of outstanding debt. Such repurchases, those of which we describe below for 2024, may be made in open market purchases, privately negotiated transactions or otherwise and will depend on prevailing market conditions, our liquidity requirements, contractual restrictions and other factors.
Equity and Debt Repurchases – In May 2023, our Board authorized a $150 million stock repurchase program. The program is intended as a means to maximize stockholder value by returning capital to stockholders. Under the repurchase program, we are authorized to purchase shares from time to time through open market or privately negotiated transactions. Such purchases may be made pursuant to Rule 10b5-1 plans or other means as determined by our management and in accordance with the requirements of the SEC. The repurchase program does not obligate us to purchase any particular number or type of securities.
During 2024, we repurchased approximately 1.5 million shares of common stock at an average cost of $8.13 per share for a total of $12.1 million. During our fiscal quarter ended December 31, 2024, we did not repurchase any of our outstanding common stock. Total repurchase authority remaining under the repurchase program was $109 million as of December 31, 2024. The repurchase program does not have a set expiration date, but may be suspended, terminated or modified at any time for any reason.
During 2024, we repurchased $96.6 million of our Senior Secured Notes through open market transactions for approximately $92.2 million. The debt repurchase was intended as a means to deleverage our balance sheet and reduce future interest costs while maintaining a balanced capital allocation strategy that provides an appropriate level of liquidity to fund our operations and future growth opportunities.
Expenses Associated with Environmental Regulatory Compliance
We are subject to numerous federal, state and local laws and regulations, including matters regarding environmental, health and safety matters. As a result, we incurred expenses of $5.2 million in 2024 in connection with environmental projects, compared to $4.3 million in 2023. For 2025, we expect to incur expenses of approximately $5 million in connection with additional environmental projects. However, it is possible that the actual costs could be significantly different than our estimates.
Dividends
We have not paid cash dividends on our outstanding common stock in many years, and we do not currently anticipate paying cash dividends on our outstanding common stock in the near future.
Seasonality
We believe sales of fertilizer products to the agricultural industry are seasonal while sales into the industrial sectors generally are less susceptible to seasonal conditions or cycles. The selling seasons for agricultural products are primarily during the spring and fall planting seasons, which typically extend from March through June and from September through November in the geographical markets where we distribute the majority of our agricultural products. As a result, we typically increase our inventory of fertilizer products prior to the beginning of each planting season in order to meet the demand for our products. In addition, the amount and timing of sales to the agricultural markets depend upon weather conditions and other circumstances beyond our control.
Performance and Payment Bonds
We are contingently liable to sureties in respect of insurance bonds issued by the sureties in connection with certain contracts entered into by subsidiaries in the normal course of business. These insurance bonds primarily represent guarantees of future performance of our subsidiaries. As of December 31, 2024, we have agreed to indemnify the sureties for payments, up to $10.3 million, made by them in respect of such bonds. All of these insurance bonds are expected to expire or be renewed in 2025.
Off-Balance Sheet Arrangements
We do not have any off-balance sheet arrangements as defined in Item 303(a)(4)(ii) of Regulation S-K under the Securities Exchange Act of 1934.
Aggregate Contractual Obligations
As of December 31, 2024 our aggregate contractual obligations are summarized in the following table:
| | | | | | | | | | | | | | | | | | | | | | | | | | | | |
| | | | | Payments Due in the Year Ending December 31, | | | | |
Contractual Obligations | | Total | | | 2025 | | | 2026 | | | 2027 | | | 2028 | | | 2029 | | | Thereafter | |
| | | | | (In Thousands) | | | | |
Long-term debt: | | | | | | | | | | | | | | | | | | | | | |
Senior Secured Notes | | $ | 478,440 | | | $ | — | | | $ | — | | | $ | — | | | $ | 478,440 | | | $ | — | | | $ | — | |
Secured financing and finance leases | | | 12,411 | | | | 9,121 | | | | 517 | | | | 488 | | | | 457 | | | | 465 | | | | 1,363 | |
Total long-term debt | | | 490,851 | | | | 9,121 | | | | 517 | | | | 488 | | | | 478,897 | | | | 465 | | | | 1,363 | |
Interest payments on long-term debt (1) | | | 106,688 | | | | 30,532 | | | | 30,188 | | | | 30,150 | | | | 15,164 | | | | 178 | | | | 476 | |
Operating leases | | | 34,669 | | | | 9,330 | | | | 6,951 | | | | 5,797 | | | | 4,464 | | | | 3,311 | | | | 4,816 | |
Finance leases | | | 5,047 | | | | 873 | | | | 742 | | | | 675 | | | | 609 | | | | 582 | | | | 1,566 | |
Natural gas pipeline commitment (2) | | | 1,620 | | | | 720 | | | | 720 | | | | 180 | | | | — | | | | — | | | | — | |
Other contractual obligations (3) | | | 8,343 | | | | 4,832 | | | | 1,567 | | | | 1,293 | | | | 163 | | | | 163 | | | | 325 | |
Total | | $ | 647,218 | | | $ | 55,408 | | | $ | 40,685 | | | $ | 38,583 | | | $ | 499,297 | | | $ | 4,699 | | | $ | 8,546 | |
_____________________________
(1)The estimated interest payments are all based on fixed interest rates. As of December 31, 2024, we do not have any outstanding borrowings based on variable interest rates.
(2)Our proportionate share of the minimum costs to ensure capacity relating to a gathering and pipeline system.
(3)Includes commitments for utility purchases, natural gas transportation and forward contracts on natural gas.
New Accounting Pronouncements
Refer to Note 1 – Summary of Significant Accounting Policies for recently adopted and issued accounting standards.
Critical Accounting Estimates
The preparation of financial statements requires management to make estimates and assumptions that affect the reported amount of assets, liabilities, revenues and expenses, and disclosures of contingencies and fair values. It is reasonably possible that the estimates and assumptions utilized as of December 31, 2024, could change in the near term. The more critical areas of financial reporting affected by management's judgment, estimates and assumptions include the following:
Contingencies – Certain conditions may exist which may result in a loss, but which will only be resolved when future events occur. We assess such contingent liabilities, and such assessment inherently involves an exercise of judgment. If the assessment of a contingency indicates that it is probable that a loss has been incurred, we would accrue for such contingent loss when such loss can be reasonably estimated. If the assessment indicates that a potentially material loss contingency is not probable but reasonably possible, or is probable but cannot be estimated, the nature of the contingent liability, together with an estimate of the range of possible loss if determinable and material, would be disclosed. Estimates of potential legal fees and other directly related costs associated with contingencies are not accrued but rather are expensed as incurred. Loss contingency liabilities are included in current and noncurrent accrued and other liabilities and are based on current estimates that may be revised in the near term. In addition, we recognize contingent gains when such gains are realized or realizable and earned.
We are involved in various legal matters that require management to make estimates and assumptions as discussed in Note 7 – Commitments and Contingencies.
It is reasonably possible that the actual costs could be significantly different than our estimates.
Regulatory Compliance – As discussed under “Item 1 – Government Laws and Regulations” of this report, we are subject to numerous federal, state, and local laws and regulations, including matters regarding environmental, health and safety matters. We have developed policies and procedures related to regulatory compliance. We must continually monitor whether we have maintained compliance with such laws and regulations and the operating implications, if any, and amount of penalties, fines and assessments that may result from noncompliance. We will also be obligated to manage certain discharge water outlets and monitor groundwater contaminants at our chemical facilities should we discontinue the operations of a facility. Certain conditions exist which may result in a loss, but which will only be resolved when future events occur relating to these matters. We are involved in various environmental matters that require management to make estimates and assumptions, including matters discussed in “ Note 7 – Commitments and Contingencies.” As of December 31, 2024 and 2023, liabilities totaling $0.6 million and $0.4 million, respectively, have been accrued relating to these matters. It is also reasonably possible that the estimates and assumptions utilized as of December 31, 2024 could change in the near term. Actual results could differ materially from these estimates and judgments, as additional information becomes known.
Income Tax – As discussed under “Income Taxes” in Note 1 – Summary of Significant Accounting Policies and in Note 6 – Income Taxes, income taxes are accounted for under the asset and liability method. Deferred tax assets and liabilities are measured using enacted tax rates expected to apply to taxable income in the years in which those differences are expected to be recovered or settled. We establish valuation allowances if we believe it is more-likely-than-not that some or all of deferred tax assets will not be realized. Significant judgment is applied in evaluating the need for and the magnitude of appropriate valuation allowances against deferred tax assets. As of December 31, 2024 and 2023, our valuation allowance on deferred tax assets was $14.2 million and $15.2 million, respectively.
Non-GAAP Financial Measures
Management uses adjusted gross profit as a supplemental measure to review and assess the performance of our core business operations and for planning purposes. We define adjusted gross profit as gross profit excluding depreciation and amortization and Turnaround expenses associated with our cost of sales, which we believe are not reflective of our operating performance in a given period.
Adjusted gross profit is a metric that provides investors with greater transparency to the information used by management in its financial and operational decision-making. We believe this metric is useful to investors because it facilitates comparisons of our core business operations across periods on a consistent basis. Management believes that the non-GAAP measure presented in this Annual Report on Form 10-K, when viewed in combination with our results prepared in accordance with U.S. GAAP, provides a more complete understanding of the factors and trends affecting our business and performance.
Adjusted gross profit is not a measure of financial performance under U.S. GAAP, and should not be considered a substitute for gross profit, which we consider to be the most directly comparable U.S. GAAP measure. Adjusted gross profit has limitations as an analytical tool, and when assessing our operating performance, investors should not consider adjusted gross profit in isolation, or as a substitute for gross profit prepared in accordance with U.S. GAAP. Adjusted gross profit may not be comparable to similarly titled measures of other companies and other companies may not calculate such measure in the same manner as we do.
The following table reconciles gross profit to adjusted gross profit.
| | | | | | | | |
| | Year Ended December 31, | |
| | 2024 | | | 2023 | |
Reconciliation of Gross Profit to Adjusted Gross Profit: | | (In Thousands) | |
Gross profit | | | 47,797 | | | | 86,260 | |
Depreciation and amortization | | | 74,260 | | | | 68,385 | |
Turnaround expenses | | | 37,781 | | | | 2,430 | |
Adjusted gross profit | | | 159,838 | | | | 157,075 | |
ITEM 7A. QUANTITATIVE AND QUALITATIVE DISCLOSURES ABOUT MARKET RISK
Our results of operations and operating cash flows are affected by changes in market prices of ammonia and natural gas and changes in market interest rates.
Forward Sales Commitments
Periodically, we enter into forward firm sales commitments for products to be delivered in future periods. As a result, we could be exposed to embedded losses should our product costs exceed the firm sales prices at the end of a reporting period. As of December 31, 2024, we had no embedded losses associated with sales commitments with firm sales prices.
Commodity Prices
A substantial portion of our products and raw materials are commodities whose prices fluctuate as market supply and demand fundamentals change. Since we are exposed to commodity price risk, we periodically enter into contracts to purchase natural gas for anticipated production needs to manage risk related to changes in prices of natural gas commodities. Generally, these contracts are considered normal purchases because they provide for the purchase of natural gas that will be delivered in quantities expected to be used over a reasonable period of time in the normal course of business, such that these contracts are exempt from the accounting and reporting requirements relating to derivatives. As of December 31, 2024, these contracts included volume purchase commitments with fixed prices of approximately 0.6 million MMBtus of natural gas that cover a period from January 2025 through March 2025. The weighted-average price of the natural gas covered by these contracts was $3.70 per MMBtu, for a total of $2.1 million. Based on strip prices, the weighted-average market price of the fixed contracts was $3.82 per MMBtu for a total of $2.2 million.
Interest Rates
We are exposed to variable interest rate risk with respect to our Revolving Credit Facility. As of December 31, 2024, we had no outstanding borrowings on the Revolving Credit Facility and no other variable rate borrowings.
We have a substantial amount of short-term investments in treasury securities. As these securities mature, to the extent that the proceeds are not required to fund operations, we may roll the funds over by purchasing additional securities. When interest rates fluctuate, there is no assurance that future purchases of short-term debt instruments will provide similar yields to the yields of those that have matured.
ITEM 8. FINANCIAL STATEMENTS AND SUPPLEMENTARY DATA
We have included the financial statements and supplementary financial information required by this item immediately following Part IV of this report and hereby incorporate by reference the relevant portions of those statements and information into this Item 8.
ITEM 9. CHANGES IN AND DISAGREEMENTS WITH ACCOUNTANTS ON ACCOUNTING AND FINANCIAL DISCLOSURE
None.
ITEM 9A. CONTROLS AND PROCEDURES
As of the end of the period covered by this report, our management carried out an evaluation, with the participation of our Principal Executive Officer and Principal Financial Officer, of the effectiveness of our disclosure controls and procedures (as defined in Rule 13a-15 under the Exchange Act). Our disclosure controls and procedures are designed to provide reasonable assurance that the information required to be disclosed by the Company in the reports that we file or submit under the Exchange Act is recorded, processed, summarized and reported within the time periods specified in the SEC’s rules and forms. These disclosure controls and procedures include, without limitation, controls and procedures designed to ensure that this information is accumulated and communicated to our management, including our Principal Executive Officer and Principal Financial Officer, as appropriate to allow timely decisions regarding required disclosure. Based upon that evaluation, our Principal Executive Officer and our Principal Financial Officer have concluded that our disclosure controls and procedures were effective as of December 31, 2024. There were no changes to our internal control over financial reporting during the quarter ended December 31, 2024, that have materially affected, or are reasonably likely to materially affect, our internal control over financial reporting.
Management’s Report on Internal Control over Financial Reporting
Our management is responsible for establishing and maintaining adequate internal control over financial reporting (as defined in Rule 13a-15(f) of the Exchange Act). Our internal control system is a process, under the supervision of our Chief Executive Officer and Chief Financial Officer, designed to provide reasonable assurance to our management and Board of Directors regarding the reliability of financial reporting and the preparation of our financial statements for external purposes in accordance with accounting principles generally accepted in the United States. All internal control systems, no matter how well designed, have inherent limitations. Therefore, even those systems determined to be effective can provide only reasonable assurance with respect to financial statement preparation and presentation.
Our management, with the participation of our Chief Executive Officer and Chief Financial Officer, assessed the effectiveness of our internal control over financial reporting as of December 31, 2024. In making this assessment, it used the criteria set forth by the Committee of Sponsoring Organizations of the Treadway Commission in Internal Control - Integrated Framework (2013 Framework). Based on this assessment, management concluded that our internal control over financial reporting was effective as of December 31, 2024.
Our independent registered public accounting firm has issued an attestation report on our internal control over financial reporting. This report appears on the following page.
Report of Independent Registered Public Accounting Firm
To the Shareholders and the Board of Directors of LSB Industries, Inc.
Opinion on Internal Control Over Financial Reporting
We have audited LSB Industries, Inc.’s internal control over financial reporting as of December 31, 2024, based on criteria established in Internal Control—Integrated Framework issued by the Committee of Sponsoring Organizations of the Treadway Commission (2013 framework) (the COSO criteria). In our opinion, LSB Industries, Inc.(the Company) maintained, in all material respects, effective internal control over financial reporting as of December 31, 2024, based on the COSO criteria.
We also have audited, in accordance with the standards of the Public Company Accounting Oversight Board (United States) (PCAOB), the 2024 consolidated financial statements of the Company and our report dated February 27, 2025 expressed an unqualified opinion thereon.
Basis for Opinion
The Company’s management is responsible for maintaining effective internal control over financial reporting and for its assessment of the effectiveness of internal control over financial reporting included in the accompanying Management’s Report on Internal Control over Financial Reporting. Our responsibility is to express an opinion on the Company’s internal control over financial reporting based on our audit. We are a public accounting firm registered with the PCAOB and are required to be independent with respect to the Company in accordance with the U.S. federal securities laws and the applicable rules and regulations of the Securities and Exchange Commission and the PCAOB.
We conducted our audit in accordance with the standards of the PCAOB. Those standards require that we plan and perform the audit to obtain reasonable assurance about whether effective internal control over financial reporting was maintained in all material respects.
Our audit included obtaining an understanding of internal control over financial reporting, assessing the risk that a material weakness exists, testing and evaluating the design and operating effectiveness of internal control based on the assessed risk, and performing such other procedures as we considered necessary in the circumstances. We believe that our audit provides a reasonable basis for our opinion.
Definition and Limitations of Internal Control Over Financial Reporting
A company’s internal control over financial reporting is a process designed to provide reasonable assurance regarding the reliability of financial reporting and the preparation of financial statements for external purposes in accordance with generally accepted accounting principles. A company’s internal control over financial reporting includes those policies and procedures that (1) pertain to the maintenance of records that, in reasonable detail, accurately and fairly reflect the transactions and dispositions of the assets of the company; (2) provide reasonable assurance that transactions are recorded as necessary to permit preparation of financial statements in accordance with generally accepted accounting principles, and that receipts and expenditures of the company are being made only in accordance with authorizations of management and directors of the company; and (3) provide reasonable assurance regarding prevention or timely detection of unauthorized acquisition, use, or disposition of the company’s assets that could have a material effect on the financial statements.
Because of its inherent limitations, internal control over financial reporting may not prevent or detect misstatements. Also, projections of any evaluation of effectiveness to future periods are subject to the risk that controls may become inadequate because of changes in conditions, or that the degree of compliance with the policies or procedures may deteriorate.
/s/ Ernst & Young LLP
Oklahoma City, Oklahoma
February 27, 2025
ITEM 9B. OTHER INFORMATION
Other Information
Amendment to Second Amended and Restated Bylaws
On December 17, 2024, the Board of Directors approved an amendment (the “Bylaws Amendment”) to the Second Amended and Restated Bylaws of the Company, effective as of such date. The Bylaws Amendment modified the provision relating to the removal of directors by removing the conditions for which cause for removal would be deemed to exist.
Prior to the Bylaws Amendment, the then-existing bylaws provided that cause for removal of a director would be deemed to exist only if the director being removed had been convicted of a felony by a court of competent jurisdiction or had been adjudged by a court of competent jurisdiction to be liable for intentional misconduct or knowing violation of law in the performance of such director’s duty to the Company and, in each case, such adjudication was no longer subject to direct appeal.
A copy of the Second Amended and Restated Bylaws, as amended by the Bylaws Amendment, is attached to this Annual Report on Form 10-K as Exhibit 3(ii).1.
Adoption of 10b5-1 Trading Plans by Our Officers and Directors
Lynn F. White, Member Board of Directors
On December 11, 2024, Lynn F. White, a member of our Board of Directors, entered into a Rule 10b5-1 trading plan that is intended to satisfy the affirmative defense of Rule 10b5-1(c) and provides that Mr. White, acting through a broker, may sell up to an aggregate of 40,000 shares of our common stock, subject to adjustments for stock splits, stock combinations, stock dividends and other similar changes to our common stock. Sales of shares under the plan may only occur from March 12, 2025 to December 31, 2025. The plan is scheduled to terminate on December 31, 2025, subject to earlier termination upon the sale of all shares subject to the plan or the expiration of all sale orders under the plan, upon termination by Mr. White or the broker, or as otherwise provided in the plan.
Other than as described above, during the three months ended December 31, 2024, none of the Company’s directors or executive officers adopted or terminated a “Rule 10b5-1 trading arrangement” or “non-Rule 10b5-1 trading arrangement,” as each term is defined in Item 408(a) of Regulation S-K.
ITEM 9C. DISCLOSURE REGARDING FOREIGN JURISDICTIONS THAT PREVENT INSPECTIONS
Not Applicable.
PART III
ITEM 10. DIRECTORS, EXECUTIVE OFFICERS AND CORPORATE GOVERNANCE
The information required in response to this Item 10 is incorporated herein by reference to our definitive proxy statement to be filed with the SEC pursuant to Regulation 14A of the Exchange Act not later than 120 days after the end of the fiscal year covered by this Annual Report on Form 10-K.
ITEM 11. EXECUTIVE COMPENSATION
The information required in response to this Item 11 (except for the information required by Item 402(v) of Regulation S-K) is incorporated herein by reference to our definitive proxy statement to be filed with the SEC pursuant to Regulation 14A of the Exchange Act not later than 120 days after the end of the fiscal year covered by this Annual Report on Form 10-K.
ITEM 12. SECURITY OWNERSHIP OF CERTAIN BENEFICIAL OWNERS AND MANAGEMENT AND RELATED STOCKHOLDER MATTERS
The information required in response to this Item 12 is incorporated herein by reference to our definitive proxy statement to be filed with the SEC pursuant to Regulation 14A of the Exchange Act not later than 120 days after the end of the fiscal year covered by this Annual Report on Form 10-K.
ITEM 13. CERTAIN RELATIONSHIPS AND RELATED TRANSACTIONS, AND DIRECTOR INDEPENDENCE
The information required in response to this Item 13 is incorporated herein by reference to our definitive proxy statement to be filed with the SEC pursuant to Regulation 14A of the Exchange Act not later than 120 days after the end of the fiscal year covered by this Annual Report on Form 10-K.
ITEM 14. PRINCIPAL ACCOUNTING FEES AND SERVICES
The information required in response to this Item 14 is incorporated herein by reference to our definitive proxy statement to be filed with the SEC pursuant to Regulation 14A of the Exchange Act not later than 120 days after the end of the fiscal year covered by this Annual Report on Form 10-K.
PART IV
ITEM 15. EXHIBITS AND FINANCIAL STATEMENT SCHEDULES
(a) (1) Financial Statements
The following consolidated financial statements of the Company appear immediately following this Part IV:
(a) (2) Financial Statement Schedule
The Company has included the following schedule in this report:
We have omitted all other schedules because the conditions requiring their filing do not exist or because the required information appears in our Consolidated Financial Statements, including the notes to those statements.
(a)(3) Exhibits
| | | | |
Exhibit Number | | Exhibit Title | | Incorporated by Reference to the Following |
| | | | |
3(i).1 | | Restated Certificate of Incorporation of LSB Industries, Inc., dated January 21, 1977, as amended August 27, 1987 | | Exhibit 3(i).1 to the Company’s Form 10-K filed on February 28, 2013 |
| | | | |
3(i).2 | | Certificate of Amendment to the Restated Certificate of Incorporation of LSB Industries, dated September 23, 2021 | | Exhibit 3(i).2 to the Company’s Registration Statement on Form S-3 filed on November 16, 2021 |
| | | | |
3(ii).1(a) | | Second Amended and Restated Bylaws of LSB Industries, Inc., as amended by the December 17, 2024 amendment | | |
| | | | |
4.1 | | Specimen Certificate for the Company’s Common Stock | | Exhibit 4.3 to the Company’s Registration Statement on Form S-3 ASR filed November 16, 2012 |
| | | | |
4.2 | | Amended and Restated Section 382 Rights Agreement, dated as of August 22, 2023, between LSB Industries, Inc. and Computershare Trust Company, N.A., as rights agent | | Exhibit 4.1 to the Company’s Form 8-K filed August 25, 2023 |
| | | | |
4.3 | | First Amendment to Amended and Restated Section 382 Rights Agreement, dated as of May 2, 2024, by and between LSB Industries, Inc. and Computershare Trust Company, N.A., as rights agent | | Exhibit 4.1 to the Company’s Form 8-K filed May 3, 2024 |
| | | | |
4.4 | | Indenture, dated as of October 14, 2021, among LSB Industries, Inc., the subsidiary guarantors party thereto and Wilmington Trust, National Association, as trustee and collateral agent. | | Exhibit 4.1 to the Company’s Form 8-K filed October 15, 2021 |
| | | | |
4.5 | | Form of 6.250% Senior Secured Notes due 2028 (included in Exhibit 4.4). | | Exhibit 4.2 to the Company’s Form 8-K filed October 15, 2021 |
| | | | |
4.6 | | Description of Registrant’s Securities Registered Pursuant to Section 12 of the Securities Exchange Act of 1934 | | Exhibit 4.17 to the Company’s Form 10-K filed February 24, 2022 |
| | | | |
10.1+ | | LSB Industries, Inc. 2016 Long Term Incentive Plan | | Exhibit 4.8 to the Company’s Form S-8 filed June 28, 2016 |
| | | | |
10.2+ | | Form of Stock Option Agreement under the LSB Industries, Inc. 2016 Long Term Incentive Plan | | Exhibit 4.9 to the Company’s Form S-8 filed June 28, 2016 |
| | | | |
10.3+ | | Form of Restricted Stock Unit Agreement (Director Award) under the LSB Industries, Inc. 2016 Long Term Incentive Plan) | | Exhibit 4.10 to the Company’s Form S-8 filed June 28, 2016 |
| | | | |
10.4+ | | Form of Restricted Stock Agreement under the LSB Industries, Inc 2016 Long Term Incentive Plan | | Exhibit 4.11 to the Company’s Form S-8 filed June 28, 2016 |
| | | | |
10.5+ | | Form of Time-Based Restricted Stock Agreement under the LSB Industries, Inc. 2016 Long Term Incentive Plan | | Exhibit 10.4 to the Company’s Form 8-K filed January 3, 2019 |
| | | | |
10.6+ | | Form of Performance-Based Restricted Stock Agreement under the LSB Industries, Inc. 2016 Long Term Incentive Plan | | Exhibit 10.5 to the Company’s Form 8-K filed January 3, 2019 |
| | | | |
10.7+(a) | | Form of Performance-Based Restricted Stock Unit Agreement under the LSB Industries, Inc. 2016 Long Term Incentive Plan | | |
| | | | |
10.8+ | | Employment Agreement, dated December 30, 2018, between LSB Industries, Inc. and Mark T. Behrman | | Exhibit 10.1 to the Company’s Form 8-K filed January 3, 2019 |
| | | | |
10.9+ | | Employment Agreement, dated December 30, 2018, between LSB Industries, Inc. and Michael J. Foster | | Exhibit 10.3 to the Company’s Form 8-K filed January 3, 2019 |
| | | | |
10.10+ | | Employment Agreement, dated December 30, 2018, between LSB Industries, Inc. and Cheryl Maguire | | Exhibit 10.2 to the Company’s Form 8-K filed January 3, 2019 |
| | | | |
| | | | |
Exhibit Number | | Exhibit Title | | Incorporated by Reference to the Following |
| | | | |
10.11+ | | Employment Agreement, dated December 20, 2019, between LSB Industries, Inc. and John Burns | | Exhibit 10.30 to the Company’s Form 10-K filed February 25, 2019 |
| | | | |
10.12+ | | Severance and Change in Control Agreement, dated April 6, 2020, between LSB Industries, Inc. and Kristy Carver | | Exhibit 10.1 to the Company’s Form 10-Q filed May 7, 2020 |
| | | | |
10.13(a) | | Form of Indemnification Agreement (Directors) | | |
| | | | |
10.14+(a) | | Form of Indemnification Agreement (Executive Officers) | | |
| | | | |
10.15* | | Stock Purchase Agreement by and among Consolidated Industries L.L.C. The Climate Control Group, Inc., NIBE Energy Systems Inc. and, solely for purposes of Sections 6.8, 6.19 and 11.15 therein, LSB Industries, Inc., and solely for purposes of Section 11.16 therein, NIBE Industrier AB (publ), dated as of May 11, 2016. | | Exhibit 10.1 to the Company’s Form 8-K filed May 13, 2016 |
| | | | |
10.16 | | Contract on the supply of Basic Engineering Package, Detail Engineering Package, Tagged Major Equipment and related Advisory Services, between Weatherly Inc. and El Dorado Chemical Company, dated November 30, 2012 | | Exhibit 99.2 to the Company’s Form 8-K filed December 6, 2012 |
| | | | |
10.17 | | Engineering, Procurement and Construction Agreement, dated August 12, 2013, between El Dorado Ammonia L.L.C. and SAIC Constructors, LLC | | Exhibit 10.1 to the Company’s Form 8-K filed August 15, 2013 |
| | | | |
10.18 | | Construction Agreement-DMW2, dated November 6, 2013, between El Dorado Chemical Company and SAIC Constructors, LLC | | Exhibit 99.1 to the Company’s Form 8-K filed November 12, 2013 |
| | | | |
10.19 | | Construction Agreement – NACSAC, dated November 6, 2013, between El Dorado Chemical Company and SAIC Constructors, LLC | | Exhibit 99.2 to the Company’s Form 8-K filed November 12, 2013 |
| | | | |
10.20 | | Engineering, Procurement and Construction Agreement, dated December 31, 2013, between El Dorado Chemical Company and SAIC Constructors, LLC | | Exhibit 99.1 to the Company’s Form 8-K filed January 7, 2014 |
| | | | |
10.21 | | Engineering, Procurement and Construction Contract, Amendment No. 1 dated October 20, 2015, by and between El Dorado Ammonia LLC and SAIC Constructors, LLC | | Exhibit 10.1 to the Company’s Form 8-K filed October 26, 2015 |
| | | | |
10.22 | | Consent Decree, dated May 28, 2014, by and among, LSB Industries, Inc., El Dorado Chemical Co., Cherokee Nitrogen Co., Pryor Chemical Co., El Dorado Nitrogen, L.P., the U.S. Department of Justice, the U.S. Environmental Protection Agency, the Alabama Department of Environmental Management, and the Oklahoma Department of Environment Quality | | Exhibit 99.1 to the Company’s Form 8-K filed June 3, 2014 |
| | | | |
10.23 | | Intercreditor Agreement, dated August 7, 2013, by and among Wells Fargo Capital Finance, Inc., as agent and UMB Bank, n.a., as collateral agent, and acknowledged and agreed to by LSB Industries, Inc. and the other grantors named therein | | Exhibit 99.1 to the Company’s Form 8-K filed August 14, 2013 |
| | | | |
10.24 | | Joinder Agreement to Intercreditor Agreement, dated November 9, 2015, by and among LSB Funding LLC, Wells Fargo Capital Finance, Inc., as ABL Agent, UMB Bank, N.A., as Notes Agent, LSB Industries, Inc. and the guarantors party thereto | | Exhibit 10.4 to the Company’s Form 8-K filed November 16, 2015 |
| | | | |
| | | | |
Exhibit Number | | Exhibit Title | | Incorporated by Reference to the Following |
| | | | |
10.25 | | Amendment No. 1 to Intercreditor Agreement, dated as of April 25, 2018, among Wells Fargo Capital Finance, LLC, UMB Bank, n.a. and Wilmington Trust, National Association, and acknowledged by LSB Industries, Inc. and the subsidiary guarantors party thereto | | Exhibit 10.1 to the Company’s Form 8-K filed April 25, 2018 |
| | | | |
10.26 | | Joinder Agreement to Intercreditor Agreement, dated as of October 14, 2021, by Wilmington Trust, National Association, as Notes Trustee, and acknowledged by Wilmington Trust, National Association, as Existing Notes Trustee, Wells Fargo Capital Finance, LLC, LSB | | Exhibit 10.1 to the Company’s Form 8-K filed October 15, 2021 |
| | | | |
10.27 | | Joinder Agreement to Intercreditor Agreement, dated as of December 21, 2023, by JPMorgan Chase Bank, N.A., as New ABL Agent, and acknowledged by Wells Fargo Capital Finance, LLC, as Existing ABL Agent, Wilmington Trust, National Association, as Notes Agent, LSB Industries, Inc. and the subsidiary guarantors party thereto | | Exhibit 10.3 to the Company’s Form 8-K filed December 26, 2023 |
| | | | |
10.28 | | Credit Agreement, dated December 21, 2023, by and among LSB Industries, Inc., the other loan parties from time to time party thereto, the lenders from time to time party thereto, and JPMorgan Chase Bank, N.A., as the administrative agent | | Exhibit 10.1 to the Company’s Form 8-K filed December 26, 2023 |
| | | | |
10.29 | | Pledge and Security Agreement dated December 21, 2023, among LSB Industries, Inc., each of the other Guarantors and JPMorgan Chase Bank, N.A., as administrative agent for the secured parties | | Exhibit 10.2 to the Company’s Form 8-K filed December 26, 2023 |
| | | | |
10.30 | | Registration Rights Agreement by and between LSB Industries, Inc. and LSB Funding LLC, dated as of December 4, 2015 | | Exhibit 10.4 to the Company’s Form 8-K filed December 8, 2015 |
| | | | |
10.31 | | Board Representation and Standstill Agreement by and among LSB Industries, Inc., LSB Funding LLC, Security Benefit Corporation, Todd Boehly and the Golsen Holders (as defined therein), dated as of December 4, 2015 | | Exhibit 10.3 to the Company’s Form 8-K filed December 8, 2015 |
| | | | |
10.32 | | Amendment to the Board Representation and Standstill Agreement, dated October 26, 2017, by and among LSB Industries, Inc., LSB Funding LLC, Security Benefit Corporation, Todd Boehly, Jack E. Golsen, Barry H. Golsen, Linda Golsen Rappaport, Golsen Family LLC, SBL LLC and Golsen Petroleum Corp., dated as of December 4, 2015 | | Exhibit 10.1. to the Company’s Form 8-K Filed on October 26, 2017 |
| | | | |
10.33 | | Amendment to Board Representation and Standstill Agreement, dated as of October 18, 2018, by and among LSB Industries, Inc., LSB Funding LLC, Security Benefit Corporation, Todd Boehly and the Golsen Holders (as defined therein) | | Exhibit 10.2 to the Company’s Form 8-K filed October 19, 2018 |
| | | | |
10.34 | | Amendment and Waiver to Board Representation and Standstill Agreement, dated as of September 27, 2021, by and among the Company, the Holder and the other parties thereto | | Exhibit 10.1 to the Company’s Form 8-K filed September 27, 2021 |
| | | | |
10.35 | | Securities Exchange Agreement, dated July 19, 2021, by and between LSB Industries, Inc. and LSB Funding LLC | | Exhibit 10.1 to the Company’s Form 8-K filed July 19, 2021 |
| | | | |
| | | | |
Exhibit Number | | Exhibit Title | | Incorporated by Reference to the Following |
| | | | |
10.36 | | Written Consent of LSB Funding LLC approving of the incurrence of indebtedness by LSB Industries, Inc., dated September 22, 2021, as amended September 28, 2021, provided pursuant to the Securities Exchange Agreement, dated as of July 19, 2021, between LSB Industries, Inc. and LSB Funding LLC | | Exhibit 10.45 to the Company’s Form 10-K filed February 23, 2023 |
| | | | |
10.37 | | Written Consent of LSB Funding LLC approving of the incurrence of indebtedness by LSB Industries, Inc., dated March 2, 2022, provided pursuant to the Securities Exchange Agreement, dated as of July 19, 2021, between LSB Industries, Inc. and LSB Funding LLC | | Exhibit 10.47 to the Company’s Form 10-K filed February 23, 2023 |
| | | | |
10.38 | | Board Representation Letter Agreement, dated as of August 10, 2022, by and among the Company, LSB Funding LLC, SBT Investors LLC and the other parties thereto | | Exhibit 10.1 to the Company’s Form 8-K filed on August 15, 2022 |
| | | | |
10.39 | | Rights Letter Agreement, dated as of August 10, 2022, by and among the Company, LSB Funding LLC and SBT Investors LLC | | Exhibit 10.2 to the Company’s Form 8-K filed on August 15, 2022 |
| | | | |
10.40(a) | | Rights Letter Agreement, dated as of November 14, 2023, by and among the Company, LSB Funding LLC, SBT Investors LLC and TLB-LSB, LLC | | |
| | | | |
19.1(a) | | LSB Industries, Inc Insider Trading Policy | | |
| | | | |
21.1(a) | | Subsidiaries of the Company | | |
| | | | |
23.1(a) | | Consent of Independent Registered Public Accounting Firm | | |
| | | | |
31.1(a) | | Certification of Mark T. Behrman, Chief Executive Officer, pursuant to Sarbanes-Oxley Act of 2002, Section 302 | | |
| | | | |
31.2(a) | | Certification of Cheryl A. Maguire, Chief Financial Officer, pursuant to Sarbanes-Oxley Act of 2002, Section 302 | | |
| | | | |
32.1(a)(b) | | Certification of Mark T. Behrman, Chief Executive Officer, furnished pursuant to Sarbanes-Oxley Act of 2002, Section 906 | | |
| | | | |
32.2(a)(b) | | Certification of Cheryl A. Maguire, Chief Financial Officer, furnished pursuant to Sarbanes-Oxley Act of 2002, Section 906 | | |
| | | | |
97.1(a) | | Policy for Recoupment of Incentive Compensation | | Exhibit 97.1 to the Company’s Form 10-K filed March 6, 2024 |
| | | | |
101.INS(a) | | Inline XBRL Instance Document | | |
| | | | |
101.SCH(a) | | Inline XBRL Taxonomy Extension Schema With Embedded Linkbases Document | | |
| | | | |
104(a) | | Cover Page Interactive Data File (formatted as Inline XBRL and contained in Exhibit 101) | | |
+ Management contract or compensatory plan or arrangement.
* Schedules and exhibits have been omitted pursuant to Item 601(a)(5) of Regulation S-K. LSB Industries, Inc. hereby undertakes to furnish supplementally copies of any of the omitted schedules and exhibits upon request by the SEC.
(b)The certifications attached as Exhibits 32.1 and 32.2 are not deemed “filed” with the SEC and are not to be incorporated by reference into any filing of LSB Industries, Inc. under the Securities Act or the Exchange Act, whether made before or
after the date of this Annual Report on Form 10-K, irrespective of any general incorporation language contained in such filing.
ITEM 16. FORM 10-K SUMMARY
Not applicable.
Signatures
Pursuant to the requirements of Section 13 or 15(d) of the Securities Exchange Act of 1934, as amended, the Registrant has duly caused this report to be signed on its behalf by the undersigned, thereunto duly authorized.
LSB INDUSTRIES, INC.
| | | | |
Dated: | | By: | | /s/ Mark T. Behrman |
February 27, 2025 | | | | Mark T. Behrman, President, Chief Executive Officer and Chairman of the Board of Directors |
Pursuant to the requirements of the Securities Exchange Act of 1934, as amended, this report has been signed below by the following persons on behalf of the Registrant and in the capacities and on the dates indicated.
| | | | |
Dated: | | By: | | /s/ Mark T. Behrman |
February 27, 2025 | | | | Mark T. Behrman, President and Chief Executive Officer (Principal Executive Officer) and Chairman of the Board of Directors |
| | | | |
Dated: | | By: | | /s/ Cheryl A. Maguire |
| | | | |
February 27, 2025 | | | | Cheryl A. Maguire, Executive Vice President and Chief Financial Officer (Principal Financial and Accounting Officer) |
| | | | |
Dated: | | By: | | /s/ John D. Chandler |
February 27, 2025 | | | | John D. Chandler, Director |
| | | | |
Dated: | | By: | | /s/ Jonathan S. Bobb |
February 27, 2025 | | | | Jonathan S. Bobb, Director |
| | | | |
Dated: | | By: | | /s/ Barry H. Golsen |
February 27, 2025 | | | | Barry H. Golsen, Director |
| | | | |
Dated: | | By: | | /s/ Kanna Kitamura |
February 27, 2025 | | | | Kanna Kitamura, Director |
| | | | |
Dated: | | By: | | /s/ Steven L. Packebush |
February 27, 2025 | | | | Steven L. Packebush, Director |
| | | | |
Dated: | | By: | | /s/ Diana M. Peninger |
February 27, 2025 | | | | Diana M. Peninger, Director |
| | | | |
Dated: | | By: | | /s/ Richard S. Sanders Jr. |
February 27, 2025 | | | | Richard S. Sanders Jr., Director |
| | | | |
Dated: | | By: | | /s/ Lynn F. White |
February 27, 2025 | | | | Lynn F. White, Director |
LSB Industries, Inc.
Consolidated Financial Statements
And Schedule for Inclusion in Form 10-K
For the Fiscal Year ended December 31, 2024
Table of Contents
Report of Independent Registered Public Accounting Firm
To the Shareholders and the Board of Directors of LSB Industries, Inc.
Opinion on the Financial Statements
We have audited the accompanying consolidated balance sheets of LSB Industries, Inc. (the Company) as of December 31, 2024 and 2023, the related consolidated statements of operations, stockholders' equity and cash flows for each of the three years in the period ended December 31, 2024, and the related notes and financial statement schedule listed in the Index at Item 15(a)(2) (collectively referred to as the “consolidated financial statements”). In our opinion, the consolidated financial statements present fairly, in all material respects, the financial position of the Company at December 31, 2024 and 2023, and the results of its operations and its cash flows for each of the three years in the period ended December 31, 2024, in conformity with U.S. generally accepted accounting principles.
We also have audited, in accordance with the standards of the Public Company Accounting Oversight Board (United States) (PCAOB), the Company's internal control over financial reporting as of December 31, 2024, based on criteria established in Internal Control—Integrated Framework issued by the Committee of Sponsoring Organizations of the Treadway Commission (2013 framework), and our report dated February 27, 2025 expressed an unqualified opinion thereon.
Basis for Opinion
These financial statements are the responsibility of the Company's management. Our responsibility is to express an opinion on the Company’s financial statements based on our audits. We are a public accounting firm registered with the PCAOB and are required to be independent with respect to the Company in accordance with the U.S. federal securities laws and the applicable rules and regulations of the Securities and Exchange Commission and the PCAOB.
We conducted our audits in accordance with the standards of the PCAOB. Those standards require that we plan and perform the audit to obtain reasonable assurance about whether the financial statements are free of material misstatement, whether due to error or fraud. Our audits included performing procedures to assess the risks of material misstatement of the financial statements, whether due to error or fraud, and performing procedures that respond to those risks. Such procedures included examining, on a test basis, evidence regarding the amounts and disclosures in the financial statements. Our audits also included evaluating the accounting principles used and significant estimates made by management, as well as evaluating the overall presentation of the financial statements. We believe that our audits provide a reasonable basis for our opinion.
Critical Audit Matters
Critical audit matters are matters arising from the current period audit of the financial statements that were communicated or required to be communicated to the audit committee and that: (1) relate to accounts or disclosures that are material to the financial statements and (2) involved our especially challenging, subjective or complex judgments. We determined that there are no critical audit matters.
/s/ Ernst & Young LLP
We have served as the Company’s auditor since 1968.
Oklahoma City, Oklahoma
February 27, 2025
LSB Industries, Inc.
Consolidated Balance Sheets
| | | | | | | | |
| | December 31, | |
| | 2024 | | | 2023 | |
| | (In Thousands) | |
Assets | | | | | | |
Current assets: | | | | | | |
Cash and cash equivalents | | $ | 20,230 | | | $ | 98,500 | |
Restricted cash | | | — | | | | 2,532 | |
Short-term investments | | | 163,971 | | | | 207,434 | |
Accounts receivable | | | 39,083 | | | | 40,749 | |
Allowance for doubtful accounts | | | (323 | ) | | | (364 | ) |
Accounts receivable, net | | | 38,760 | | | | 40,385 | |
Inventories: | | | | | | |
Finished goods | | | 22,382 | | | | 26,329 | |
Raw materials | | | 2,519 | | | | 1,799 | |
Total inventories | | | 24,901 | | | | 28,128 | |
Supplies, prepaid items and other: | | | | | | |
Prepaid insurance | | | 14,345 | | | | 14,846 | |
Precious metals | | | 11,596 | | | | 12,094 | |
Supplies | | | 31,995 | | | | 30,486 | |
Other | | | 3,916 | | | | 2,337 | |
Total supplies, prepaid items and other | | | 61,852 | | | | 59,763 | |
Total current assets | | | 309,714 | | | | 436,742 | |
Property, plant and equipment, net | | | 847,570 | | | | 835,298 | |
Other assets: | | | | | | |
Operating lease assets | | | 28,727 | | | | 24,852 | |
Intangible and other assets, net | | | 1,177 | | | | 1,292 | |
Total other assets | | | 29,904 | | | | 26,144 | |
Total assets | | $ | 1,187,188 | | | $ | 1,298,184 | |
Liabilities and Stockholders' Equity | | | | | | |
Current liabilities: | | | | | | |
Accounts payable | | | 83,498 | | | | 68,323 | |
Short-term financing | | | 12,146 | | | | 13,398 | |
Accrued and other liabilities | | | 30,874 | | | | 30,961 | |
Current portion of long-term debt | | | 9,116 | | | | 5,847 | |
Total current liabilities | | | 135,634 | | | | 118,529 | |
Long-term debt, net | | | 476,163 | | | | 575,874 | |
Noncurrent operating lease liabilities | | | 21,387 | | | | 16,074 | |
Other noncurrent accrued liabilities | | | 456 | | | | 523 | |
Deferred income taxes | | | 61,908 | | | | 68,853 | |
Commitments and contingencies (Note 7) | | | | | | |
Stockholders' equity: | | | | | | |
Common stock, $.10 par value per share; 150 million shares
authorized, 91.2 million shares issued | | | 9,117 | | | | 9,117 | |
Capital in excess of par value | | | 504,578 | | | | 501,026 | |
Retained earnings | | | 207,662 | | | | 227,015 | |
Total stockholders’ equity | | | 721,357 | | | | 737,158 | |
Less treasury stock, at cost: | | | | | | |
Common stock, 19.5 million shares (18.1 million shares at
December 31, 2023) | | | 229,717 | | | | 218,827 | |
Total stockholders' equity | | | 491,640 | | | | 518,331 | |
Total liabilities and stockholders’ equity | | $ | 1,187,188 | | | $ | 1,298,184 | |
See accompanying Notes to the Consolidated Financial Statements.
LSB Industries, Inc.
Consolidated Statements of Operations
| | | | | | | | | | | | |
| | Year Ended December 31, | |
| | 2024 | | | 2023 | | | 2022 | |
| | (In Thousands, Except Per Share Amounts) | |
Net sales | | $ | 522,400 | | | $ | 593,709 | | | $ | 901,711 | |
Cost of sales | | | 474,603 | | | | 507,449 | | | | 553,344 | |
Gross profit | | | 47,797 | | | | 86,260 | | | | 348,367 | |
Selling, general and administrative expense | | | 41,767 | | | | 36,580 | | | | 39,428 | |
Other expense (income), net | | | 11,535 | | | | (2,097 | ) | | | 561 | |
Operating (loss) income | | | (5,505 | ) | | | 51,777 | | | | 308,378 | |
Interest expense, net | | | 34,452 | | | | 41,136 | | | | 46,827 | |
(Gain) loss on extinguishments of debt | | | (3,013 | ) | | | (8,644 | ) | | | 113 | |
Non-operating income, net | | | (10,907 | ) | | | (14,611 | ) | | | (8,083 | ) |
(Loss) income before (benefit) provision for income taxes | | | (26,037 | ) | | | 33,896 | | | | 269,521 | |
(Benefit) provision for income taxes | | | (6,684 | ) | | | 5,973 | | | | 39,174 | |
Net (loss) income | | | (19,353 | ) | | | 27,923 | | | | 230,347 | |
| | | | | | | | | |
(Loss) income per common share | | | | | | | | | |
Basic: | | | | | | | | | |
Net (loss) income | | $ | (0.27 | ) | | $ | 0.37 | | | $ | 2.72 | |
Diluted: | | | | | | | | | |
Net (loss) income | | $ | (0.27 | ) | | $ | 0.37 | | | $ | 2.68 | |
See accompanying Notes to the Consolidated Financial Statements.
LSB Industries, Inc.
Consolidated Statements of Stockholders’ Equity
| | | | | | | | | | | | | | | | | | | | | | | | | | | | |
| | Common
Stock Shares | | | Treasury
Stock-
Common
Shares | | | Common
Stock
Par Value | | | Capital in
Excess of
Par Value | | | Retained
Earnings (Accumulated Deficit) | | | Treasury
Stock-
Common | | | Total | |
| | (In Thousands) | |
Balance as of December 31, 2021 | | | 91,168 | | | | (1,375 | ) | | $ | 9,117 | | | $ | 493,161 | | | $ | (31,255 | ) | | $ | (10,533 | ) | | | 460,490 | |
Net income | | | | | | | | | | | | | | $ | 230,347 | | | | | | | 230,347 | |
Stock-based compensation | | | | | | | | | | | | 4,025 | | | | | | | | | | 4,025 | |
Purchase of common stock | | | | | | (13,168 | ) | | | | | | | | | | | | (175,083 | ) | | | (175,083 | ) |
Other | | | - | | | | (345 | ) | | | | | | (7 | ) | | | | | | (3,899 | ) | | | (3,906 | ) |
Balance as of December 31, 2022 | | | 91,168 | | | | (14,888 | ) | | | 9,117 | | | | 497,179 | | | | 199,092 | | | | (189,515 | ) | | | 515,873 | |
Net income | | | | | | | | | | | | | | | 27,923 | | | | | | | 27,923 | |
Stock-based compensation | | | | | | | | | | | | 5,353 | | | | | | | | | | 5,353 | |
Purchase of common stock | | | | | | (3,094 | ) | | | | | | | | | | | | (28,510 | ) | | | (28,510 | ) |
Other | | | — | | | | (69 | ) | | | | | | (1,506 | ) | | | | | | (802 | ) | | | (2,308 | ) |
Balance as of December 31, 2023 | | | 91,168 | | | | (18,051 | ) | | | 9,117 | | | | 501,026 | | | | 227,015 | | | | (218,827 | ) | | | 518,331 | |
Net income | | | | | | | | | | | | | | | (19,353 | ) | | | | | | (19,353 | ) |
Stock-based compensation | | | | | | | | | | | | 6,607 | | | | | | | | | | 6,607 | |
Purchase of common stock | | | | | | (1,492 | ) | | | | | | | | | | | | (12,131 | ) | | | (12,131 | ) |
Other | | | | | | 15 | | | | | | | (3,055 | ) | | | | | | 1,241 | | | | (1,814 | ) |
Balance as of December 31, 2024 | | | 91,168 | | | | (19,528 | ) | | $ | 9,117 | | | $ | 504,578 | | | $ | 207,662 | | | $ | (229,717 | ) | | $ | 491,640 | |
See accompanying Notes to the Consolidated Financial Statements.
LSB Industries, Inc.
Consolidated Statements of Cash Flows
| | | | | | | | | | | | |
| | Year Ended December 31, | |
| | 2024 | | | 2023 | | | 2022 | |
| | (In Thousands) | |
Cash flows from operating activities | | | | | | | | | |
Net (loss) income | | $ | (19,353 | ) | | $ | 27,923 | | | $ | 230,347 | |
Adjustments to reconcile net (loss) income to net cash
provided by operating activities: | | | | | | | | | |
Deferred income taxes | | | (6,945 | ) | | | 5,366 | | | | 36,854 | |
Depreciation and amortization of property, plant and
equipment | | | 74,277 | | | | 68,414 | | | | 66,937 | |
Write-downs of property, plant and equipment | | | 11,703 | | | | 3,613 | | | | 1,219 | |
Stock-based compensation | | | 6,607 | | | | 5,353 | | | | 4,025 | |
Amortization of short-term investments | | | 4,046 | | | | (2,289 | ) | | | (3,341 | ) |
Amortization of debt issuance costs, including discounts
and premiums | | | 1,621 | | | | 1,924 | | | | 2,073 | |
(Gain) loss on extinguishments of debt | | | (3,013 | ) | | | (8,644 | ) | | | 113 | |
Other | | | 990 | | | | 344 | | | | (1,434 | ) |
Cash provided (used) by changes in assets and liabilities: | | | | | | | | | |
Accounts receivable, net | | | 1,619 | | | | 35,113 | | | | 10,197 | |
Inventories | | | 2,946 | | | | 2,755 | | | | (14,300 | ) |
Supplies, prepaid items and other | | | (1,215 | ) | | | 5,528 | | | | (8,548 | ) |
Accounts payable | | | 13,390 | | | | (264 | ) | | | 18,821 | |
Other assets and other liabilities | | | (97 | ) | | | (7,615 | ) | | | 2,691 | |
Net cash provided by operating activities | | | 86,576 | | | | 137,521 | | | | 345,654 | |
Cash flows from investing activities | | | | | | | | | |
Expenditures for property, plant and equipment | | | (92,294 | ) | | | (67,603 | ) | | | (45,833 | ) |
Proceeds from short-term investments | | | 310,329 | | | | 389,856 | | | | 158,879 | |
Purchases of short-term investments | | | (270,912 | ) | | | (264,448 | ) | | | (486,091 | ) |
Other investing activities | | | (203 | ) | | | (405 | ) | | | 3,310 | |
Net cash provided (used) by investing activities | | | (53,080 | ) | | | 57,400 | | | | (369,735 | ) |
Cash flows from financing activities | | | | | | | | | |
Proceeds from 6.25% senior secured notes | | | — | | | | — | | | | 200,000 | |
Repurchases of 6.25% senior secured notes | | | (92,216 | ) | | | (114,320 | ) | | | — | |
Payments on other long-term debt | | | (6,045 | ) | | | (9,536 | ) | | | (13,750 | ) |
Payments of debt-related costs, including
extinguishment costs | | | (705 | ) | | | (94 | ) | | | (4,840 | ) |
Proceeds from short-term financing | | | 16,144 | | | | 17,805 | | | | 20,143 | |
Payments on short-term financing | | | (17,396 | ) | | | (20,542 | ) | | | (16,725 | ) |
Acquisition of treasury stock, net | | | (11,904 | ) | | | (28,305 | ) | | | (174,975 | ) |
Taxes paid on equity awards | | | (2,176 | ) | | | (2,666 | ) | | | (4,012 | ) |
Payments of costs to exchange redeemable preferred
stocks for common stock | | | — | | | | — | | | | (135 | ) |
Net cash (used) provided by financing activities | | | (114,298 | ) | | | (157,658 | ) | | | 5,706 | |
Net (decrease) increase in cash, cash equivalents and restricted cash | | | (80,802 | ) | | | 37,263 | | | | (18,375 | ) |
Cash, cash equivalents and restricted cash at beginning of year | | | 101,032 | | | | 63,769 | | | | 82,144 | |
Cash, cash equivalents and restricted cash at end of year | | $ | 20,230 | | | $ | 101,032 | | | $ | 63,769 | |
See accompanying Notes to Consolidated Financial Statements.
LSB Industries, Inc.
Notes to Consolidated Financial Statements
1. Summary of Significant Accounting Policies
Basis of Consolidation – LSB Industries, Inc. (“LSB”) and its subsidiaries (the “Company”, “we”, “us”, or “our”) are consolidated in the accompanying consolidated financial statements. All material intercompany accounts and transactions have been eliminated. Certain prior period amounts reported in our consolidated financial statements and notes thereto have been reclassified to conform to current period presentation.
Nature of Business – We are engaged in the manufacture and sale of chemical products. The chemical products we primarily manufacture, market and sell are ammonia, fertilizer grade ammonium nitrate (“HDAN”) and urea ammonia nitrate (“UAN”) for agricultural applications, high purity and commercial grade ammonia, high purity ammonium nitrate, sulfuric acids, concentrated, blended and regular nitric acid, mixed nitrating acids, carbon dioxide, and industrial grade ammonium nitrate (“LDAN”) and ammonium nitrate (“AN”) solutions for industrial applications. We manufacture and distribute products in four facilities; three of which we own and are located in El Dorado, Arkansas (the “El Dorado Facility”); Cherokee, Alabama (the “Cherokee Facility”); and Pryor, Oklahoma (the “Pryor Facility”); and one of which we operate on behalf of Covestro LLC in Baytown, Texas (the “Baytown Facility”).
Sales to our customers include farmers, ranchers, fertilizer dealers and distributors primarily in the ranch land and grain production markets in the United States; industrial users of acids throughout the United States and parts of Canada; and explosive manufacturers in United States and other parts of North America.
Use of Estimates – The preparation of consolidated financial statements in conformity with United States generally accepted accounting principles (“U.S. GAAP”) requires management to make estimates and assumptions that affect the reported amounts of assets and liabilities and disclosure of contingent assets and liabilities at the date of the financial statements and the reported amounts of revenues and expenses during the reporting period. Actual results could differ from those estimates.
Consolidated Statements of Stockholders’ Equity – Amounts disclosed for “Purchase of common stock” represent repurchases of our common stock on the open market (see discussion below). Amounts disclosed for “Other” include common stock repurchases for tax withholdings on vesting of equity incentive awards offset by treasury stock issuances under the Employee Stock Purchase Plan. See Note 10 – Employee Savings and Stock Purchase Plans, Collective Bargaining Agreements and Executive Benefit Agreement.
Stock Repurchase Program – In May 2023, our Board of Directors (our “Board”) authorized a $150 million stock repurchase program. During 2024, we repurchased approximately 1.5 million shares of common stock at an average cost of $8.13 per share for a total of $12.1 million. During our fiscal quarter ended December 31, 2024, we did not repurchase any of our outstanding common stock. Total repurchase authority remaining under the repurchase program was $109 million as of December 31, 2024. The repurchase program does not have a specified expiration date and may be suspended, terminated or modified at any time for any reason.
Equity Awards – Equity award transactions with employees are measured based on the estimated fair value of the equity awards issued. For equity awards with only a service condition, the grant date fair value is based on the market price of our common stock and compensation is recognized so long as the service condition is met. For equity awards with a service and performance condition the grant date fair value is based on the market price of our common stock, and compensation is recognized so long as the service condition is met and it is probable the performance condition will be achieved. For equity awards with a service and market condition, the grant date fair value is based on a Monte Carlo simulation, and compensation cost is recognized so long as the service condition is met without regard to the outcome of the market condition. For equity awards with service conditions that have a graded vesting period, we recognize compensation cost on a straight-line basis over the requisite service period for the entire award. Forfeitures are accounted for as they occur. We may issue new shares of common stock or may use treasury shares to meet the settlement requirements upon vesting of equity awards.
Cash and Cash Equivalents – Investments, which consist of highly liquid investments with original maturities of three months or less, are considered cash equivalents.
LSB Industries, Inc.
Notes to Consolidated Financial Statements (continued)
Restricted Cash – We classify cash that has been segregated or is otherwise limited in use as restricted. Our restricted cash as of December 31, 2023, related primarily to certain cash collateral held by Wells Fargo under the terminated Revolving Credit Facility discussed in Note 5 – Long-Term Debt for letters of credit outstanding, as we transitioned those items to our current Revolving Credit Facility. Our restricted cash was classified as a current asset and separately presented on the face of our consolidated balance sheet. We did not have any restricted cash as of December 31, 2024. The following table provides a reconciliation of cash and cash equivalents and restricted cash reported within the consolidated balance sheets to the total of the same such amounts shown in the consolidated statements of cash flows:
| | | | | | | |
| December 31, | |
| 2024 | | | 2023 | |
| (in Thousands) | |
Cash and cash equivalents | $ | 20,230 | | | $ | 98,500 | |
Restricted cash | | — | | | | 2,532 | |
Total cash, cash equivalents and restricted cash shown in the statement of cash flows | $ | 20,230 | | | $ | 101,032 | |
Short-Term Investments – Investments, which consist of United States treasury securities with remaining maturity at the time of purchase greater than three months but less than 12 months, are considered short-term investments and are classified as Level 1 under the fair value hierarchy. These investments are classified as held to maturity and we have no intention nor are we required to sell them prior to maturity. United States treasury bills with remaining maturity at the time of purchase of three month or less are included in cash and cash equivalents. Due to the nature of these investments as United States treasury securities, no impairment is anticipated. See “Note 8 – Derivatives, Hedges and Financial Instruments” for more information regarding our short-term investments.
Accounts Receivable – Substantially all of our accounts receivable consists of trade receivables from customers. We have recognized an appropriate allowance for estimated uncollectible accounts to reflect any estimate of expected credit losses. Our estimate is based on historical experience and periodic assessment, particularly on accounts that are past due (based upon the terms of the sale). Our periodic assessment is based on our best estimate of amounts that are not recoverable which includes a present collectability review and forward-looking assessment, where applicable. We write off accounts receivable when we deem them uncollectible and record recoveries of accounts receivable previously written off when received.
A summary of our accounts receivable - allowance for doubtful accounts activity is presented below:
| | | | | | | | | | | | | | | | |
Accounts receivable - allowance for doubtful accounts: | | Balance at
Beginning of
Year | | | Additions-
Charges to
(Recovery of)
Costs and
Expenses | | | Deductions-
Write-
offs/Costs
Incurred | | | Balance at
End of Year | |
| | (In Thousands) | |
2024 | | $ | 364 | | | $ | 6 | | | $ | 47 | | | $ | 323 | |
| | | | | | | | | | | | |
2023 | | $ | 699 | | | $ | (164 | ) | | $ | 171 | | | $ | 364 | |
| | | | | | | | | | | | |
2022 | | $ | 474 | | | $ | 485 | | | $ | 260 | | | $ | 699 | |
Credit is extended to customers based on an evaluation of the customer’s financial condition and other factors. Customer payments are generally due thirty to sixty days after the invoice date. Concentrations of credit risk with respect to trade receivables are monitored and this risk is reduced due to short-term payment terms relating to most of our significant customers. Four customers (including their affiliates) accounted for approximately 38% of our total net receivables as of December 31, 2024.
Inventories – Inventories are stated at the lower of cost (determined using the first-in, first-out basis) or net realizable value, which is the estimated selling prices in the ordinary course of business, less reasonably predictable costs of completion, transportation or disposal. Finished goods include material, labor, and manufacturing overhead costs.
Inventory reserves associated with cost exceeding net realizable value were not material as of December 31, 2024 and 2023.
Property, Plant and Equipment – Property, plant and equipment (“PP&E”) are stated at cost or fair market value in the case of assets acquired through acquisitions, or otherwise at reduced values to the extent there have been asset impairment write-downs, net of accumulated depreciation and amortization. Major renewals and improvements that increase the life, value, or productive capacity of assets are capitalized in PP&E while maintenance, repairs and minor renewals, including planned maintenance turnarounds, are expensed as incurred. Interest cost related to the construction of qualifying assets is capitalized as part of the construction costs.
LSB Industries, Inc.
Notes to Consolidated Financial Statements (continued)
For financial reporting purposes, depreciation of the costs of PP&E is computed using the straight-line method over the estimated useful lives of the assets. No provision for depreciation is made on construction in progress or capital spare parts until such time as the relevant assets are put into service. Depreciation expense is recognized in cost of sales or selling, general and administrative expenses within the consolidated statements of operations consistent with the utilization of the underlying assets.
When PP&E is retired, sold, or otherwise disposed, the asset’s carrying amount and related accumulated depreciation and amortization is removed from the accounts and any gain or loss is included in other (income) expense, net in our consolidated statements of operations.
Operating leases are included in operating lease assets, accrued and other liabilities and noncurrent operating lease liabilities in our consolidated balance sheets. Financing leases are included in property, plant and equipment, current portion of long-term debt, and long-term debt, net, in our consolidated balance sheets.
Impairment of Long-Lived Assets – Long-lived assets are reviewed for impairment whenever events or changes in circumstances indicate that the carrying amount of an asset (asset group) may not be recoverable. An asset’s fair value must be determined when the carrying amount of an asset (asset group) exceeds the estimated undiscounted future cash flows expected to result from the use of the asset (asset group) and/or its eventual disposition. If assets to be held and used are considered to be impaired, the impairment to be recognized is the amount by which the carrying amounts of the assets exceed the fair values of the assets as measured by the present value of future net cash flows expected to be generated by the assets or their appraised value. In general, our asset groups are reviewed for impairment on a facility-by-facility basis (such as the Cherokee, El Dorado or Pryor Facility) unless it is determined that the asset being evaluated will generate cash flows that are independent from the rest of the facility.
In addition, if the event or change in circumstance relates to the probable sale of an asset (or group of assets), the specific asset (or group of assets) is reviewed for impairment.
In 2024, 2023 and 2022, we recorded asset write-downs of $11.7 million, $3.6 million and $1.2 million, respectively, primarily related to assets no longer in use. These write-downs are included in other expense (income), net on our consolidated statements of operations.
Leases – We determine if an arrangement is a lease at inception or modification of a contract and classify each lease as either an operating or finance lease based on the terms of the contract. We reassess lease classification subsequent to commencement upon a change to the expected lease term or a modification to the contract. A contract contains a lease if the contract conveys the right to control the use of the identified property or equipment, explicitly or implicitly, for a period of time in exchange for consideration. Control of an underlying asset is conveyed if we obtain the rights to direct the use of and obtain substantially all of the economic benefit from the use of the underlying asset.
An operating lease asset represents our right to use the underlying asset as a lessee for the lease term and an operating lease liability represents our obligation to make lease payments arising from the lease. Currently, most of our leases are classified as operating leases and primarily relate to railcars, other equipment and office space. Our leases that are classified as finance leases primarily relate to railcars. Variable payments are excluded from the present value of lease payments and are recognized in the period in which the payment is made. We apply a practical expedient to include non-lease components in calculating the right of use asset and lease liability. Our current leases do not contain residual value guarantees. Most of our leases do not include options to extend or terminate the lease prior to the end of the term. Leases with a term of 12 months or less are not recognized in the balance sheet.
Since our leases generally do not provide an implicit rate, we use our incremental borrowing rate based on the lease term and other information available at the commencement date in determining the present value of lease payments. Lease expense is recognized on a straight-line basis over the applicable lease term.
Concentration of Credit Risks for Cash and Cash Equivalents – Financial instruments relating to cash and cash equivalents potentially subject us to concentrations of credit risk. These financial instruments were held by financial institutions within the United States
Short-Term Financing – Our short-term financing represents the short-term note related to financing of our insurance premiums, which are renewed annually.
Income Taxes – Income taxes are accounted for under the asset and liability method. Deferred tax assets and liabilities are measured using enacted tax rates expected to apply to taxable income in the years in which those differences are expected to be recovered or settled. The effect on deferred tax assets and liabilities of a change in tax rates is recognized in the statement of operations in the period that includes the enactment date. We establish valuation allowances if we believe it is more-likely-than-not that some or all of deferred tax assets will not be realized. Significant judgment is applied in evaluating the need for and the magnitude of appropriate valuation allowances against deferred tax assets.
In addition, we do not recognize a tax benefit unless we conclude that it is more likely than not that the benefit will be sustained on audit by the relevant taxing authorities based solely on the technical merits of the associated tax position. If the recognition threshold
LSB Industries, Inc.
Notes to Consolidated Financial Statements (continued)
is met, we recognize a tax benefit measured at the largest amount of the tax benefit that, in our judgment, is greater than 50% likely to be realized. We record interest related to unrecognized tax positions in interest expense and penalties in operating other expense.
Income tax benefits associated with amounts that are deductible for income tax purposes are recorded through the consolidated statement of operations. These benefits are principally generated from the vesting of restricted stock. We reduce income tax expense for investment tax credits in the period the credit arises and is earned.
Contingencies – Certain conditions may exist which may result in a loss, but which will only be resolved when future events occur. We assess such contingent liabilities, and such assessment inherently involves an exercise of judgment. If the assessment of a contingency indicates that it is probable that a loss has been incurred, we accrue for such contingent loss when such loss can be reasonably estimated. If the assessment indicates that a potentially material loss contingency is not probable but reasonably possible, or is probable but cannot be estimated, the nature of the contingent liability, together with an estimate of the range of possible loss if determinable and material, would be disclosed. Estimates of potential legal fees and other directly related costs associated with contingencies are not accrued but rather are expensed as incurred. Loss contingency liabilities are included in current and noncurrent accrued and other liabilities and are based on current estimates that may be revised in the near term. In addition, we recognize contingent gains when such gains are realized or when the contingencies have been resolved (generally at the time a settlement has been reached).
Asset Retirement Obligations – In general, we record the estimated fair value of an asset retirement obligation (“ARO”) associated with tangible long-lived assets in the period it is incurred and when there is sufficient information available to estimate the fair value. An ARO associated with long-lived assets is a legal obligation under existing or enacted law, statute, written or oral contract or legal construction. AROs, which are initially recorded based on estimated discounted cash flows, are accreted to full value over time through charges to cost of sales. In addition, we capitalize the corresponding asset retirement cost as plant, property and equipment, which cost is depreciated or depleted over the related asset’s respective useful life. We do not have any assets restricted for the purpose of settling our AROs. As of December 31, 2024 and 2023, our AROs were not material.
Revenue Recognition and Other Information
Revenue Recognition and Performance Obligations
We determine revenue recognition through the following steps:
•Identification of the performance obligations in the contract;
•Determination of the transaction price;
•Allocation of the transaction price to the performance obligations in the contract; and
•Recognition of revenue when, or as, we satisfy a performance obligation.
A performance obligation is a promise in a contract to transfer a distinct good or service to the customer and is the unit of account. A contract’s transaction price is allocated to each distinct performance obligation and recognized as revenue when, or as, the performance obligation is satisfied. Generally, satisfaction occurs when control of the promised goods is transferred to the customer or as services are rendered or completed in exchange for consideration in an amount for which we expect to be entitled. We generally determine transfer of control based on when risk of loss is transferred, which could be at our facility or when the product reaches the buyer's destination. Most of our contracts contain a single performance obligation with the promise to transfer a specific product.
Performance obligations from product sales are satisfied at a point in time, however, we have a performance obligation to perform certain services that are satisfied over a period of time. Revenue is recognized from this type of performance obligation as services are rendered and are based on the amount for which we have a right to invoice, which reflects the amount of expected consideration that corresponds directly with the value of the services performed.
Transaction Price Constraints and Variable Consideration
Our long term contracts, which are generally for periods of one year or greater, may contain terms with variable consideration related to both price and quantity. These contract prices are often based on published commodity prices (such as NYMEX natural gas price or the Tampa ammonia benchmark price) and the contract quantities are typically based on estimated ranges. The quantities become fixed and determinable over a period of time as each sale order is received from the customer.
The nature of our contracts also gives rise to other types of variable consideration, including volume discounts and rebates, make-whole provisions, other pricing concessions, short-fall charges and storage charges. We estimate these amounts based on the expected amount to be received from or provided to customers, which results in a transaction price adjustment increasing or decreasing revenue (net sales) when it is more likely than not that such adjustments will not be reversed. These estimates are based on historical experience, anticipated performance and our best judgment at the time. We reassess these estimates on a quarterly basis.
LSB Industries, Inc.
Notes to Consolidated Financial Statements (continued)
The aforementioned constraints over transaction prices in conjunction with the variable consideration included in our material contracts prevent a practical assignment of a specific dollar amount to performance obligations at the beginning and end of the period. Therefore, we have applied the variable consideration allocation exception.
Practical Expedients and Other Information
We have applied the following practical expedients and policy elections:
•to recognize revenue in the amount we have the right to invoice relating to certain services that are performed for customers and not disclosing the value of unsatisfied performance obligations related to such services;
•not disclosing the value of unsatisfied performance obligations for contracts with an original expected duration of one year or less;
•expense as incurred any incremental costs of obtaining a contract if the associated period of benefit is one year or less;
•exclude from the measurement of the transaction price all taxes assessed by a governmental authority; and
•account for shipping and handling as activities to fulfill the promise to transfer the good.
Cost of Sales – Cost of sales includes materials, labor and overhead costs, including depreciation, to manufacture the products sold plus inbound freight, purchasing and receiving costs, inspection costs, internal transfer costs, loading and handling costs, warehousing costs, railcar lease costs and outbound freight. Precious metals used as a catalyst and consumed during the manufacturing process are included in cost of sales. Recoveries and gains from precious metals and business interruption insurance claims, if any, are reductions to cost of sales.
Turnarounds represent major maintenance activities that require the shutdown of significant parts of a plant to perform necessary inspections, cleanings, repairs, and replacements of assets. Maintenance, repairs and minor renewal costs relating to turnarounds are included in cost of sales in our consolidated statements of operations as they are incurred. Planned turnaround activities vary in frequency but generally occur every two to three years.
Selling, General and Administrative Expense – Selling, general and administrative expense includes costs associated with the sales, marketing and administrative functions. Such costs include personnel costs, including benefits, professional fees, office and occupancy costs associated with the sales, marketing and administrative functions. Also included in selling, general and administrative expense are any distribution fees paid to third parties to distribute our products.
Derivatives and Fair Value – In order to mitigate a portion of the commodity price risk associated with natural gas, which we utilize in our manufacturing process, we periodically enter into natural gas forward contracts or volume purchase commitments. Such contracts are required to be accounted for as derivatives under applicable accounting guidance unless they are eligible for and we elect the normal purchase normal sale (“NPNS”) exception. We are eligible for the NPNS exception when these contracts provide for the purchase of natural gas that will be delivered in quantities expected to be used over a reasonable period of time in the normal course of business and are documented as such. In the event that we have natural gas derivatives that we do not elect or do not qualify for the NPNS exception, we would account for such contracts as derivatives by recognizing them in the balance sheet at fair value with changes in fair value recognized in the statement of operations. Such derivatives are not designated as hedges for accounting purposes.
Assets and liabilities measured at fair value are classified using the following hierarchy, which is based upon the transparency of inputs to the valuation as of the measurement date:
Level 1 - Valuations of contracts classified as Level 1 are based on quoted prices in active markets for identical contracts.
Level 2 - Valuations of contracts classified as Level 2 are based on quoted prices for similar contracts and valuation inputs other than quoted prices that are observable for these contracts.
Level 3 - Valuations of assets and liabilities classified as Level 3 are based on prices or valuation techniques that require inputs that are both unobservable and significant to the overall fair value measurement.
Recently Adopted Accounting Pronouncements
ASU 2023-07 - In November 2023, the Financial Accounting Standards Board (“FASB”) issued Accounting Standards Update (“ASU”) 2023-07, Segment Reporting (Topic 280)—Improvements to Reportable Segment Disclosures, which improves reportable segment disclosure requirements through enhanced disclosures about significant segment expenses. The amendments include a new requirement to disclose significant segment expenses regularly provided to the chief operating decision maker (“CODM”), extend certain annual disclosures to interim periods, clarify single reportable segment entities must apply Accounting Standard Codification (“ASC”) 280 in its entirety, permit more than one measure of segment profit or loss to be reported under certain conditions and require disclosure of the title and position of the CODM. This ASU became effective for our fiscal year ended December, 31, 2024, and we have adopted the new disclosures within these financial statements. The adoption of this ASU did not have a material impact on our consolidated financial statements. See Note. 15 for further discussion.
LSB Industries, Inc.
Notes to Consolidated Financial Statements (continued)
Recently Issued Accounting Pronouncements
ASU 2023-06 - In October 2023, the FASB issued ASU 2023-06, Disclosure Improvements—Codification Amendments in Response to the SEC’s Disclosure Update and Simplification Initiative, which modifies the disclosure or presentation requirements of a variety of topics in the codification. Certain of the amendments represent clarifications to or technical corrections of the current requirements. For all entities, if by June 30, 2027, the SEC has not removed the applicable requirement from Regulation S-X or Regulation S-K, the pending content of the related amendment will be removed from the codification and will not become effective for any entity. These amendments should be applied prospectively. We are currently evaluating the timing and the effect of adoption of this ASU on our consolidated financial statements and related disclosures.
ASU 2023-09 - In December 2023, the FASB issued ASU 2023-09, Income Taxes (Topic 740): Improvements to Income Tax Disclosures, which focuses on income tax disclosures around effective tax rates and cash income taxes paid. This ASU will be effective for us on a prospective basis for annual periods beginning after December 15, 2024. We will adopt this ASU prospectively for the period ending December 31, 2025, and it will impact only our disclosures with no impacts to our financial condition and results of operations. We do not expect the impact of this update to be material as the improvements are enhancements to existing disclosures in the financial statements.
ASU 2024-03 - In November 2024, the FASB issued ASU 2024-03, Income Statement – Reporting Comprehensive Income – Expense Disaggregation Disclosures (Subtopic 220-40): Disaggregation of Income Statement Expenses. This ASU requires an entity to disclose the amounts of purchases of inventory, employee compensation, depreciation, and intangible asset amortization included in each relevant expense caption. It also requires an entity to include certain amounts that are already required to be disclosed under current U.S. GAAP in the same disclosure. Additionally, it requires an entity to disclose a qualitative description of the amounts remaining in relevant expense captions that are not separately disaggregated quantitatively, and to disclose the total amount of selling expenses and, in annual reporting periods, an entity’s definition of selling expenses. The amendments in the ASU are effective for annual reporting periods beginning after December 15, 2026 and interim reporting periods beginning after December 15, 2027, with early adoption permitted. An entity may apply the amendments prospectively for reporting periods after the effective date or retrospectively to any or all prior periods presented in the financial statements. While this ASU will impact only our disclosures and not our financial condition and results of operations, we are currently evaluating the timing and effect of adopting this ASU.
Changes to U.S. GAAP are established by the FASB in the form of ASUs to the FASB’s Accounting Standards Codification. We considered all ASUs issued and outstanding or that became effective since January 1, 2024 through the date of these financial statements and determined them not to be applicable or materially impact our financial statements other than those ASUs specifically addressed above.
LSB Industries, Inc.
Notes to Consolidated Financial Statements (continued)
2. Net (Loss) Income per Common Share
The following table sets forth the computation of basic and diluted net (loss) income per common share:
| | | | | | | | | | | | |
| | 2024 | | | 2023 | | | 2022 | |
| | (In Thousands, Except Per Share Amounts) | |
Numerator: | | | | | | | | | |
Net (loss) income | | $ | (19,353 | ) | | $ | 27,923 | | | $ | 230,347 | |
| | | | | | | | | |
Numerator for basic and diluted net income (loss) per common share | | $ | (19,353 | ) | | $ | 27,923 | | | $ | 230,347 | |
| | | | | | | | | |
Denominator: | | | | | | | | | |
Denominator for basic net (loss) income per common
share - weighted- average shares | | | 71,971 | | | | 74,536 | | | | 84,753 | |
Effect of dilutive securities: | | | | | | | | | |
Unvested restricted stock and stock units | | | — | | | | 564 | | | | 1,272 | |
Dilutive potential common shares | | | — | | | | 564 | | | | 1,272 | |
Denominator for diluted net (loss) income per common
share - adjusted weighted-average shares | | | 71,971 | | | | 75,100 | | | | 86,025 | |
| | | | | | | | | |
Basic net (loss) income per common share | | $ | (0.27 | ) | | $ | 0.37 | | | $ | 2.72 | |
| | | | | | | | | |
Diluted net (loss) income per common share | | $ | (0.27 | ) | | $ | 0.37 | | | $ | 2.68 | |
The following weighted-average shares of securities were not included in the computation of diluted net loss per common share as their effect would have been antidilutive:
| | | | | | | | | | | | |
| | 2024 | | | 2023 | | | 2022 | |
| | (In Thousands) | |
Restricted stock and stock units | | | 1,156 | | | | 388 | | | | 80 | |
Stock options | | | 10 | | | | 13 | | | | 13 | |
|
| | 1,166 | | | | 401 | | | | 93 | |
3. Property, Plant and Equipment
| | | | | | | | | | |
| | Range of useful | | December 31, | |
| | lives in years | | 2024 | | | 2023 | |
| | | | (In Thousands) | |
Machinery, equipment and automotive (1) | | 3 - 25 | | $ | 1,354,654 | | | $ | 1,324,323 | |
Buildings and improvements | | 15 - 30 | | | 38,041 | | | | 38,086 | |
Land improvements | | 20 - 35 | | | 10,443 | | | | 8,692 | |
Furniture, fixtures and store equipment | | 3 - 25 | | | 2,648 | | | | 2,726 | |
Construction in progress | | N/A | | | 60,313 | | | | 41,086 | |
Capital spare parts | | N/A | | | 26,652 | | | | 21,256 | |
Land | | N/A | | | 4,838 | | | | 4,567 | |
| | | | | 1,497,589 | | | | 1,440,736 | |
Less accumulated depreciation and amortization | | | | | 650,019 | | | | 605,438 | |
| | | | $ | 847,570 | | | $ | 835,298 | |
_____________________________
(1) Machinery, equipment and automotive primarily includes the categories of property and equipment and estimated useful lives as follows: processing plants and plant infrastructure (15-25 years); certain processing plant components (3-10 years); and trucks, automobiles, trailers, and other rolling stock (4-7 years).
LSB Industries, Inc.
Notes to Consolidated Financial Statements (continued)
4. Accrued and Other Liabilities
| | | | | | | | |
| | December 31, | |
| | 2024 | | | 2023 | |
| | (In Thousands) | |
Accrued payroll and benefits | | $ | 10,217 | | | $ | 9,400 | |
Current portion of operating lease liabilities | | | 7,406 | | | | 8,795 | |
Accrued interest | | | 6,230 | | | | 7,487 | |
Other | | | 7,477 | | | | 5,802 | |
| | | 31,330 | | | | 31,484 | |
Less noncurrent portion | | | 456 | | | | 523 | |
Current portion of accrued and other liabilities | | $ | 30,874 | | | $ | 30,961 | |
5. Long-Term Debt
| | | | | | | | |
| | December 31, | |
| | 2024 | | | 2023 | |
| | (In Thousands) | |
Revolving Credit Facility | | $ | — | | | $ | — | |
Senior Secured Notes due 2028, with an interest
rate of 6.25% | | | 478,440 | | | | 575,000 | |
Secured Financing Agreement due 2025, with an interest
rate of 8.75% | | | 8,516 | | | | 14,133 | |
Finance Leases | | | 3,895 | | | | 953 | |
Unamortized debt issuance costs (1) | | | (5,572 | ) | | | (8,365 | ) |
| | | 485,279 | | | | 581,721 | |
Less current portion of long-term debt | | | 9,116 | | | | 5,847 | |
Long-term debt due after one year, net | | $ | 476,163 | | | $ | 575,874 | |
_____________________________
(1)Debt issuance costs as of December 31, 2024 and 2023 of approximately $0.6 million and $0.5 million, respectively, relating to our Revolving Credit Facility are not included in Unamortized debt issuance cost. They are included in our consolidated balance sheet in Intangible and other assets, net.
Revolving Credit Facility - The Revolving Credit Facility provides for borrowings up to an initial maximum of $75 million, with an option to increase the maximum by an additional $25 million (which amount is uncommitted). Availability under the Revolving Credit Facility is subject to a borrowing base and is subject to an availability block of $7.5 million (which can be removed by us at our sole discretion, subject to the satisfaction of certain conditions) (the “Availability Block”). The Availability Block is applied against the $75 million maximum. The Revolving Credit Facility provides for a sub-facility for the issuance of letters of credit in an aggregate amount not to exceed $10 million, with the outstanding amount of any such letters of credit reducing availability for borrowings. As of December 31, 2024, our Revolving Credit Facility was undrawn and had approximately $37.2 million of availability.
The Revolving Credit Facility matures on December 21, 2028, subject to springing maturity to the date that is 90 days prior to the stated maturity date of our existing Senior Secured Notes, which is currently October 15, 2028 (unless such Senior Secured Notes have been repaid or redeemed in full prior thereto). Borrowings outstanding under the Revolving Credit Facility will bear interest at a rate per annum equal to, at the option of us, either (a) term Secured Overnight Financing Rate (“SOFR”) for a period of one month (with a fallback to the prime rate if such rate is unavailable), plus 0.10%, plus an applicable margin of 1.625% or (b) term SOFR for a period of one, three or six months (at our election), plus 0.10%, plus an applicable margin of 1.625%, in each case with a floor of 0.00%.
LSB Industries, Inc. and all of our subsidiaries (collectively, the “Borrowers”) are co-borrowers under the Revolving Credit Facility. Obligations under the Revolving Credit Facility are secured by a first priority security interest in substantially all of our current assets, including accounts receivable and inventory, subject to certain exceptions.
The Revolving Credit Facility contains a financial covenant, which requires that, solely if we elect to remove the Availability Block, then the Borrowers must maintain a minimum fixed charge coverage ratio of not less than 1.00:1.00. The financial covenant, if triggered, is tested monthly. The financial covenant was not triggered as of December 31, 2024.
The Revolving Credit Facility includes other customary representations and warranties, affirmative covenants, negative covenants and events of default. Upon the occurrence of events of default, the obligations under the Revolving Credit Facility may be accelerated and the revolver commitments thereunder may be terminated.
LSB Industries, Inc.
Notes to Consolidated Financial Statements (continued)
Senior Secured Notes due 2028 - We previously issued at par an aggregate total of $700 million principal value of our Senior Secured Notes due 2028 (“Senior Secured Notes”). The Senior Secured Notes, which mature in October 2028, bear interest at a rate of 6.25% paid in arrears on May 15 and October 15 of each year. From time to time, we have engaged in open market repurchases to extinguish a portion of the outstanding balance.
During 2024, we repurchased $96.6 million of our Senior Secured Notes through open market transactions for approximately $92.2 million which was accounted for as an extinguishment of debt. Including our write-off of the associated remaining portion of unamortized debt issuance costs, we recognized a gain on extinguishment of debt, net of issuance costs, of approximately $3.0 million.
The Senior Secured Notes mature on October 15, 2028, ranking senior in right of payment to all of our debt that is expressly subordinated in right of payment to the notes, and will rank pari passu in right of payment with all of our liabilities that are not so subordinated, including the Revolving Credit Facility. Our obligations under the Senior Secured Notes are jointly and severally guaranteed by the subsidiary guarantors named in the Indenture on a senior secured basis.
Pursuant to the Indenture, we may redeem the Senior Secured Notes at our option, in whole or in part, at certain redemption prices, including a “make-whole” premium, as set forth in the Indenture but also includes redemption requirements associated with a change of control (as defined in the Indenture). The Senior Secured Notes do not have any conversion features. In addition, the Indenture contains customary covenants that limit, among other things, our ability to engage in certain transactions and also provides for customary events of default (subject in certain cases to customary grace and cure periods). Generally, if an event of default occurs and is continuing, the trustee or holders of at least 25% in principal amount of the then outstanding Senior Secured Notes may declare the principal of and accrued but unpaid interest on all the Senior Secured Notes to be due and payable.
The Indenture contains covenants that limit, among other things, our ability to (1) incur additional indebtedness; (2) declare or pay dividends, redeem stock or make other distributions to stockholders; (3) make other restricted payments, including investments; (4) create dividend and other payment restrictions affecting its subsidiaries; (5) create liens or use assets as security in other transactions; (6) merge or consolidate, or sell, transfer, lease or dispose of all or substantially all of our assets; and (7) enter into transactions with affiliates. Further, during any such time when the Senior Secured Notes are rated investment grade by each of Moody’s Investors Service, Inc. and Standard & Poor’s Investors Ratings Services and no Default (as defined in the Indenture) has occurred and is continuing, certain of the covenants will be suspended with respect to the Senior Secured Notes.
Obligations in respect of the Senior Secured Notes are secured by a first priority security interest in substantially all of our fixed assets, subject to certain customary exceptions.
Secured Financing Agreement due 2025 - In August 2020, we entered into a $30 million secured financing arrangement with an affiliate of Eldridge Industries, L.L.C. (“Eldridge”). Principal and interest are payable in 60 equal monthly installments with a final balloon payment of approximately $5 million due in August 2025.
Finance Leases - Finance leases consist primarily of leases on railcars.
Maturities of long-term debt for each of the five years after December 31, 2024 are as follows (in thousands):
| | | | |
2025 | | $ | 9,121 | |
2026 | | | 517 | |
2027 | | | 488 | |
2028 | | | 478,897 | |
2029 | | | 465 | |
Thereafter | | | 1,363 | |
Less: Debt issuance costs | | | 5,572 | |
| | $ | 485,279 | |
LSB Industries, Inc.
Notes to Consolidated Financial Statements (continued)
6. Income Taxes
(Benefit) provision for income taxes are as follows:
| | | | | | | | | | | | |
| | 2024 | | | 2023 | | | 2022 | |
| | (In Thousands) | |
Current: | | | | | | | | | |
Federal | | $ | — | | | $ | — | | | $ | — | |
State | | | 261 | | | | 607 | | | | 2,320 | |
Total Current | | $ | 261 | | | $ | 607 | | | $ | 2,320 | |
| | | | | | | | | |
Deferred: | | | | | | | | | |
Federal | | $ | (4,908 | ) | | $ | 7,767 | | | $ | 43,217 | |
State | | | (2,037 | ) | | | (2,401 | ) | | | (6,363 | ) |
Total Deferred | | $ | (6,945 | ) | | $ | 5,366 | | | $ | 36,854 | |
(Benefit) provision for income taxes | | $ | (6,684 | ) | | $ | 5,973 | | | $ | 39,174 | |
The current (benefit) provision for federal and state income taxes shown above includes federal and state income tax after the consideration of permanent and temporary differences between income for U.S. GAAP and tax purposes.
The deferred tax (benefit) provision results from the recognition of changes in our prior year deferred tax assets and liabilities, and the utilization of federal and state NOL carryforwards and other temporary differences. We reduce income tax expense for tax credits in the year they arise and are earned. On December 31, 2024, our gross amount of tax credits available to offset state income taxes was $5.5 million ($4.3 million net of federal benefit). Most of these tax credits carryforward for 9 years and begin expiring in 2025. The gross amount of federal tax credits was $8.1million. These credits carryforward for 20 years and begin expiring in 2034.
In 2024, we utilized approximately $30.8 million and $12.9 million of federal and state NOL carryforwards, respectively, to reduce tax liabilities. In 2023, we utilized approximately $76.7 million and $66.0 million of federal and state NOL carryforwards, respectively, to reduce tax liabilities. In 2022, we utilized approximately $240.0 million and $243.0 million of federal and state NOL carryforwards, respectively, to reduce tax liabilities. On December 31, 2024, we have remaining federal and state tax NOL carryforwards of $243.9 million and $342.7 million, respectively. The federal NOL carryforwards begin expiring in 2037 and the state NOL carryforwards begin expiring in 2026.
We considered both positive and negative evidence in our determination of the need for valuation allowances for the deferred tax assets associated with federal and state NOLs and federal credits and in conjunction with the IRC Section 382 limitation. Information evaluated includes our financial position and results of operations for the current and preceding years, the availability of deferred tax liabilities and tax carrybacks, as well as an evaluation of currently available information about future years. Valuation allowances are reflective of our quarterly analysis of the four sources of taxable income, including the calculation of the reversal of existing tax assets and liabilities, the impact of annual utilization limitations of interest expense and net operating losses and our results of operations. Based on our analysis, we believe that it is more-likely-than-not that all of our federal deferred tax assets will be utilized and a portion of our state deferred tax assets will not be able to be utilized. Information relating to our valuation allowance is included in the tables below. In 2024, the benefit for income taxes includes a net decrease of approximately $0.9 million of state valuation allowance primarily due to changes in state apportionment causing the remeasurement of state deferred balances partially offset by changes in future taxable income. There is no federal valuation allowance remaining as of December 31, 2024 or 2023.
LSB Industries, Inc.
Notes to Consolidated Financial Statements (continued)
Deferred tax assets and liabilities include temporary differences and carryforwards as follows:
| | | | | | | | |
| | December 31, | |
| | 2024 | | | 2023 | |
| | (In Thousands) | |
| | | | | | |
Deferred compensation | | $ | 3,242 | | | $ | 2,515 | |
Other accrued liabilities | | | 168 | | | | 283 | |
Lease liability | | | 6,747 | | | | 5,941 | |
Interest expense carryforward | | | 12,692 | | | | 14,375 | |
Net operating loss | | | 66,321 | | | | 73,891 | |
Other | | | 12,663 | | | | 11,649 | |
Less valuation allowance on deferred tax assets | | | (14,238 | ) | | | (15,175 | ) |
Total deferred tax assets | | $ | 87,595 | | | $ | 93,479 | |
| | | | | | |
Property, plant and equipment | | | (139,524 | ) | | | (152,802 | ) |
Right-of-use-assets | | | (6,731 | ) | | | (5,937 | ) |
Prepaid and other insurance reserves | | | (3,248 | ) | | | (3,593 | ) |
Total deferred tax liabilities | | $ | (149,503 | ) | | $ | (162,332 | ) |
| | | | | | |
Net deferred tax liabilities | | $ | (61,908 | ) | | $ | (68,853 | ) |
All of our income (loss) before taxes relates to domestic operations. Detailed below are the differences between the amount of the provision (benefit) for income taxes and the amount which would result from the application of the federal statutory rate to “Income (loss) before benefit for income taxes.”
| | | | | | | | | | | | |
| | 2024 | | | 2023 | | | 2022 | |
| | (In Thousands) | |
Provision (benefit) for income taxes at federal
statutory rate | | $ | (5,468 | ) | | $ | 7,118 | | | $ | 56,543 | |
State current and deferred income tax provision (benefit) | | | (1,165 | ) | | | 1,238 | | | | 9,374 | |
Valuation allowance - Federal | | | — | | | | — | | | | (12,701 | ) |
Valuation allowance - State | | | (937 | ) | | | 259 | | | | (19,351 | ) |
State tax rate changes | | | 550 | | | | (3,499 | ) | | | 2,824 | |
Other | | | 336 | | | | 857 | | | | 2,485 | |
Provision (benefit) for income taxes | | $ | (6,684 | ) | | $ | 5,973 | | | $ | 39,174 | |
A reconciliation of the beginning and ending amount of uncertain tax positions is as follows:
| | | | | | | | | | | | |
| | 2024 | | | 2023 | | | 2022 | |
| | (In Thousands) | |
Balance at beginning of year | | $ | — | | | $ | — | | | $ | — | |
Additions based on tax positions related to the current year | | | — | | | | — | | | | — | |
Reductions for tax positions of prior years | | | — | | | | — | | | | — | |
Balance at end of year | | $ | — | | | $ | — | | | $ | — | |
We expect that the amount of unrecognized tax benefits may change as the result of ongoing operations, the outcomes of audits, and the expiration of statute of limitations. This change is not expected to have a significant effect on our results of operations or financial condition. As of December 31, 2024, there is no remaining uncertain tax position.
We record interest related to unrecognized tax positions in interest expense and penalties in operating other expense. For 2024, 2023 and 2022, there were no accrued interest or penalties associated with unrecognized tax positions.
LSB and certain of its subsidiaries file income tax returns in the United States federal jurisdiction and various state jurisdictions. With few exceptions, the 2021-2024 years remain open for all purposes of examination by the United States Internal Revenue Service and other major tax jurisdictions. Additionally, the 2013-2020 years remain subject to examination for determining the amount of net operating loss and other carryforwards.
LSB Industries, Inc.
Notes to Consolidated Financial Statements (continued)
7. Commitments and Contingencies
Sales Commitments – We have the following significant sales commitments.
Nitric acid supply agreement – We are party to an agreement with a customer to supply nitric acid. Under the agreement, we agreed to supply between 70,000 to 100,000 tons of nitric acid annually. The initial contract term began in 2021 and extends through 2027 but includes automatic one-year renewal terms unless terminated by either party in writing 180 days before the current contract expiration date.
Low carbon ammonium nitrate solution agreement – We are a party to an agreement with a customer to supply low carbon ammonium nitrate solution. Under the agreement, we agreed to supply 150,000 tons of low carbon ammonium nitrate solution annually. The initial contract term began in 2025 with a phasing in of the low carbon contracted volume and extends through 2029. The contract may be terminated by mutual written agreement and the customer may terminate upon one years written notice subject to certain termination fees.
Outstanding Natural Gas Purchase Commitments – Certain of our natural gas contracts qualify as normal purchases under U.S. GAAP and thus are not financial instruments for which we mark-to-market. At December 31, 2024, these contracts included volume purchase commitments with fixed prices of approximately 0.6 million MMBtus of natural gas that cover a period from January 2025 through March 2025. The weighted-average price of the natural gas covered by these contracts was $3.70 per MMBtu, for a total of $2.1 million. Based on strip prices, the weighted-average market price of the fixed contracts was $3.82 per MMBtu for a total of $2.2 million.
We had standby letters of credit outstanding of approximately $0.4 million as of December 31, 2024.
Wastewater Pipeline Operating Agreement – We are party to an operating agreement for the right to use a pipeline to dispose certain wastewater. We are contractually obligated to pay a portion of the annual operating costs of the pipeline, as incurred, which portion is estimated to be $60,000 to $90,000 annually. The initial term of the operating agreement is through December 2053.
Performance and Payment Bonds – We are contingently liable to sureties in respect of certain insurance bonds issued by the sureties in connection with certain contracts entered into by certain subsidiaries in the normal course of business. These insurance bonds primarily represent guarantees of future performance of our subsidiaries. As of December 31, 2024, we have agreed to indemnify the sureties for payments, up to $10.3 million, made by them in respect of such bonds. All of these insurance bonds are expected to expire or be renewed in 2025.
Employment and Severance Agreements - We have employment and severance agreements with several of our officers. The agreements, as amended, provide for annual base salaries, bonuses and other benefits commonly found in such agreements. In the event of termination of employment due to a change in control (as defined in the agreements), the agreements provide for payments aggregating $10.6 million as of December 31, 2024. Also see Note 10 – Employee Savings and Stock Purchase Plans, Collective Bargaining Agreements and Executive Benefit Agreement.
Environmental Matters
Our facilities and operations are subject to numerous federal, state and local environmental laws and to other laws regarding health and safety matters (collectively, the “Environmental and Health Laws”), many of which provide for certain performance obligations, substantial fines and criminal sanctions for violations. Certain Environmental and Health Laws impose strict liability as well as joint and several liability for costs required to remediate and restore sites where hazardous substances, hydrocarbons or solid wastes have been stored or released. We may be required to remediate contaminated properties currently or formerly owned or operated by us or facilities of third parties that received waste generated by our operations regardless of whether such contamination resulted from the conduct of others or from consequences of our own actions that were in compliance with all applicable laws at the time those actions were taken.
In addition, claims for damages to persons or property, including natural resources, may result from the environmental, health and safety effects of our operations.
There can be no assurance that we will not incur material costs or liabilities in complying with such laws or in paying fines or penalties for violation of such laws. Our insurance may not cover all environmental risks and costs or may not provide sufficient coverage if an environmental claim is made against us. The Environmental and Health Laws and related enforcement policies have in the past resulted and could in the future result, in significant compliance expenses, cleanup costs (for our sites or third-party sites where our wastes were disposed of), penalties or other liabilities relating to the handling, manufacture, use, emission, discharge or disposal of hazardous or toxic materials at or from our facilities or the use or disposal of certain of its chemical products. Further, a
LSB Industries, Inc.
Notes to Consolidated Financial Statements (continued)
number of our facilities are dependent on environmental permits to operate, the loss or modification of which could have a material adverse effect on their operations and our financial condition.
Historically, significant capital expenditures have been incurred by our subsidiaries in order to comply with the Environmental and Health Laws and significant capital expenditures are expected to be incurred in the future. We will also be obligated to manage certain discharge water outlets and monitor groundwater contaminants at our facilities should we discontinue the operations of a facility.
As of December 31, 2024, our accrued liabilities for environmental matters totaled approximately $0.6 million relating primarily to the matters discussed below. Estimates of the most likely costs for our environmental matters are generally based on preliminary or completed assessment studies, preliminary results of studies, or our experience with other similar matters. It is reasonably possible that a change in the estimate of our liability could occur in the near term.
Discharge Water Matters
Each of our manufacturing facilities generates process wastewater, which may include cooling tower and boiler water quality control streams, contact storm water and miscellaneous spills and leaks from process equipment. The process water discharge, storm-water runoff and miscellaneous spills and leaks are governed by various permits generally issued by the respective state environmental agencies as authorized and overseen by the United States Environmental Protection Agency. These permits limit the type and volume of effluents that can be discharged and control the method of such discharge.
In 2017, the Company filed a Permit Renewal Application for its Non-Hazardous Injection Well Permit at the Pryor Facility. Although the Injection Well Permit expired in 2018, we continue to operate the injection well in accordance with an executed November 2023 Consent Order with the Oklahoma Department of Environmental Quality (“ODEQ”) that allows for the continued use of the injection well until a wastewater treatment process is designed, built and operational. The Company continues to work with the ODEQ under the terms of the Consent Order. We have identified and selected a wastewater treatment technology using biological processes that can and will treat the nitrogen-containing wastewater streams at our Pryor Facility. We are unable to estimate the costs related to the replacement of the disposal well at this time as we are in the early stages of design for the wastewater treatment process with a wastewater process design engineering firm. We have also commenced preliminary discussions with the ODEQ on permitting the treated wastewater discharges but have not received any confirmation from the ODEQ on their preliminary acceptance of our treated wastewater stream.
In 2006, the Company entered into a Consent Administrative Order (“CAO”) that recognizes the presence of nitrate contamination in the shallow groundwater at our El Dorado Facility. The CAO required us to perform semi-annual groundwater monitoring, continue operation of a groundwater recovery system, submit a human health and ecological risk assessment and submit a remedial action plan. The risk assessment was submitted in 2007. In 2015, the Arkansas Department of Environmental Quality (“ADEQ”) stated that the El Dorado Facility was meeting the requirements of the CAO and should continue semi-annual monitoring. A CAO was signed in 2018, which required an Evaluation Report of the data and effectiveness of the groundwater remedy for nitrate contamination. During 2019, the Evaluation Report was submitted to the ADEQ and the ADEQ approved the report. In August 2023, the Company received a Notice of Violation (“NOV”) for wastewater discharges from our El Dorado Facility. We have been in discussions with the ADEQ about our response to the NOV and the potential for financial penalties associated with the NOV. As of the date of this report, the ADEQ has provided no written indication or details regarding the financial penalty. No liability has been established as of December 31, 2024, in connection with this ADEQ matter.
Other Environmental Matters
In 2002, certain of our subsidiaries sold substantially all of their operating assets relating to a Kansas chemical facility (the “Hallowell Facility”) but retained ownership of the real property where the facility is located. Our subsidiary retained the obligation to be responsible for and perform the activities under, a previously executed consent order to investigate the surface and subsurface contamination at the real property, develop a corrective action strategy based on the investigation and implement such strategy. In addition, certain of our subsidiaries agreed to indemnify the buyer of such assets for these environmental matters.
As the successor to a prior owner of the Hallowell Facility, Chevron Environmental Management Company (“Chevron”) has agreed in writing, within certain limitations, to pay and has been paying one-half of the costs of the investigation and interim measures relating to this matter as approved by the Kansas Department of Health and Environment (the “KDHE”), subject to reallocation.
During this process, our subsidiary and Chevron retained an environmental consultant that prepared and performed a corrective action study work plan as to the appropriate method to remediate the Hallowell Facility. During 2020, the KDHE selected a remedy of annual monitoring and the implementation of an Environmental Use Control (“EUC”). This remedy primarily relates to long-term surface and groundwater monitoring to track the natural decline in contamination and is subject to a 5-year re-evaluation with the KDHE.
The final remedy, including the EUC, the finalization of the cost estimates and any required financial assurances remains under discussion with the KDHE. Pending the results from our discussions regarding the final remedy, we continue to accrue our allocable
LSB Industries, Inc.
Notes to Consolidated Financial Statements (continued)
portion of costs primarily for the additional testing, monitoring and risk assessments that could be reasonably estimated, which amount is included in our accrued liabilities for environmental matters discussed above. The estimated amount is not discounted to its present value. As more information becomes available, our estimated accrual will be refined, as necessary.
We received a NOV for ten findings identified from an inspection conducted by the United States Environmental Protection Agency (“EPA”) Region IV at our Cherokee Facility in late 2022. We provided written responses to each finding in the inspection report issued in connection with such inspection and to the Notice of Potential Violations and held direct communications with the EPA related to the matter. A meeting was held with the EPA in January 2024 to discuss the NOV and our subsequent responsive actions. During the meeting, the EPA proposed two alternatives for the penalties related to the violations. We accepted one of the proposed alternatives, which included a cash fine and an investment in a community project, for which we accrued an estimate as of December 31, 2023.
Other Pending, Threatened or Settled Litigation
Global Industrial Matter
In 2015, we and El Dorado Ammonia L.L.C. (“EDA”) received written notice from Global Industrial, Inc. (“Global”) of Global’s intention to assert mechanic liens for labor, service, or materials furnished under certain subcontract agreements for the improvement of the ammonia plant (“Ammonia Plant”) at our El Dorado Facility. Global was a subcontractor of Leidos Constructors, LLC (“Leidos”), the general contractor for EDA for the construction of the Ammonia Plant. Leidos terminated the services of Global with respect to their work performed at our El Dorado Facility.
LSB and EDA are pursuing the recovery of any damage or loss caused by Global’s work performed through their contract with Leidos at our El Dorado Facility. In March 2016, EDC and LSB were served a summons in a case styled Global Industrial, Inc. d/b/a Global Turnaround vs. Leidos Constructors, LLC et al., in the Circuit Court of Union County, Arkansas (the “Union County Trial Court”), wherein Global sought damages under breach of contract and other claims. At the time of the summons, our accounts payable included invoices totaling approximately $3.5 million related to work performed by Global that is the subject of the claims asserted by Global, but such invoices were not approved by Leidos for payment. We have requested indemnification from Leidos under the terms of our contracts, which they have denied. As a result, we are seeking reimbursement of legal expenses from Leidos under our contracts. We also seek damages from Leidos for their wrongdoing during the expansion, including breach of contract, fraud, professional negligence and gross negligence.
During 2018, the Union County Trial Court bifurcated the case into: (1) Global’s claims against Leidos and LSB and (2) the cross-claims between Leidos and LSB. Part (1) of the case was tried in the Union County Trial Court. In March 2020, the Union County Trial Court rendered a judgment and then an amended final judgment in April 2020. The amended final judgment awarded Global (i) approximately $7.4 million (including the $3.5 million referred to above) for labor, service and materials furnished relating to the Ammonia Plant on the basis of what the Union County Trial Court called a claim for “nonpayment of invoices,” (ii) approximately $1.3 million for prejudgment interest on the same claim, and (iii) a lien on certain property and foreclosure on the lien to satisfy the monetary obligations of the judgement. In addition, post-judgment interest will accrue at the annual rate of 4.25% until the judgment is paid. LSB appealed this judgment and on October 18, 2023, the Arkansas Court of Appeals reversed and remanded. The Arkansas Court of Appeal ruled that the lien was defective and therefore invalid, and that the claim for “nonpayment of invoices” was not a cause of action and reversed and remanded the judgment on that claim. In December 2023, the Arkansas Court of Appeal denied Global’s request for rehearing and the Arkansas Supreme Court declined to hear Global’s appeal. As a result, we do not expect to have any material continuing liability related to this matter and, in 2023, we reversed approximately $9.8 million of payables and accrued liabilities, which related to approximately $2.4 million in pre and post-judgement accrued interest and $7.4 million of gross plant, property and equipment. These adjustments also impacted our results of operations for the twelve months ended December 31, 2023, through the reversals of approximately $2.4 million of interest expense and of approximately $1.8 million in previously recognized depreciation expense (a component of cost of sales) on the related plant, property and equipment.
LSB retains all of its claims against Leidos and intends to vigorously prosecute those claims and vigorously contest the cross-claims in Part (2) of the matter referred to above. We expect the trial to be set for the second half of 2025.
No liability was established as of December 31, 2024, in connection with the cross-claims in Part (2) of the matter, except for certain invoices held in accounts payable.
We are also involved in various other claims and legal actions (including matters involving gain contingencies) in the ordinary course of our business. While it is possible that the actual claims results could differ from our estimates, after consultation with legal counsel, we believe that any such differences will not have a material effect on our business, financial condition, results of operations or cash flows.
LSB Industries, Inc.
Notes to Consolidated Financial Statements (continued)
Section 382 Rights Plan Litigation
A putative stockholder class action complaint, styled as Witmer v. Golsen, et al., C.A. No. 2024-035-PAF (the “Action”) was filed on April 3, 2024 in the Delaware Court of Chancery (the “Court of Chancery”). The plaintiff claimed, among other things, that the Board breached its fiduciary duty by adopting an Internal Revenue Code (“IRC”) Section 382 stockholder rights plan with antitakeover and entrenching measures designed to protect the Board’s incumbency. Specifically, the plaintiff alleged that the Company’s Section 382 rights plan (the “Amended NOL Rights Agreement”) was not narrowly tailored as it carried a 4.9% trigger and an allegedly overbroad definition of “Beneficial Ownership” that aggregated shares subject to “agreements, arrangements or understandings” between stockholders related to voting or influencing the Company. The plaintiff further alleged that the Board also issued a false and misleading proxy statement when soliciting stockholder approval of the Amended NOL Rights Agreement. The Company disagreed with plaintiff’s allegations, and asserts that terms of the Amended NOL Rights Agreement, including the definition of Beneficial Ownership, is a proportionate response to the threat of the occurrence of an “ownership change” under Section 382 of the IRC and the resulting risk of substantial impairment to its ability to benefit from its net operating loss carryforwards and its other tax attributes.
On May 14, 2024, the parties stipulated to dismissal of the Action after the Company voluntarily made limited technical amendments to the Amended NOL Rights Agreement and amendments to its proxy statement. The Company issued the amended proxy statement on May 3, 2024. The Court of Chancery dismissed the Action and retained jurisdiction solely for the purpose of deciding any application of the plaintiff’s counsel for an award of attorneys’ fees and expenses. On May 31, 2024, plaintiff’s counsel filed their motion for an award of attorneys’ fee and expenses in the amount of $2.4 million. The Company and the defendants in the Action opposed such relief. The parties fully briefed the motion and the Court held argument on October 4, 2024. On October 4, 2024, the Court awarded plaintiff $0.6 million in attorneys’ fees and expenses in the aggregate which has been paid as of December 31, 2024.
8. Derivatives, Hedges and Financial Instruments
Natural Gas Contracts
Periodically, we enter into certain forward natural gas contracts or volume purchase commitments which are within the scope of derivative accounting. None of our natural gas contracts throughout 2024, 2023 and 2022 were accounted for as derivatives as we elected the normal purchase and normal sales scope exception on those contracts. Please see our discussion in Note 1 – Summary of Significant Accounting Policies regarding derivatives.
From time to time, when the Company exceeds the funding threshold in our natural gas purchase commitments, the Company is required to fund cash collateral to our counterparty. As of December 31, 2024, we had no counterparty cash collateral funding requirements.
Financial Instruments
As of December 31, 2024 and 2023, we did not have any financial instruments with fair values materially different from their carrying amounts (which excludes issuance costs, if applicable) except for our Senior Secured Notes. The fair value of our Senior Secured Notes is classified as a Level 2 fair value measurement while the treasury securities that comprise our cash equivalents and short-term investments are a Level 1. The fair value of financial instruments is not indicative of the overall fair value of our assets and liabilities since financial instruments do not include all assets, including intangibles and all liabilities.
| | | | | | | | | | | | | | | | |
| | 2024 | | | 2023 | |
| | Carrying | | | Estimated | | | Carrying | | | Estimated | |
| | Amount | | | Fair Value | | | Amount | | | Fair Value | |
| | (In Millions) | |
Senior Secured Notes (1) | | $ | 478 | | | $ | 461 | | | $ | 575 | | | $ | 543 | |
Short-Term Investments | | $ | 164 | | | $ | 164 | | | $ | 207 | | | $ | 207 | |
_____________________________
1.Based on a quoted price of 96.38 as of December 31, 2024 and 94.50 as of December 31, 2023.
9. Stock-based Compensation
2016 Long Term Incentive Plan – Our equity award grants during the periods presented below were granted under the 2016 Long Term Incentive Plan (the “2016 Plan”), which replaced the 2008 Incentive Stock Plan. The 2016 Plan was approved by our stockholders in 2016 and subsequently amended in 2021. No awards may be granted under the 2016 Plan on and after the tenth anniversary of its effective date. The 2016 Plan is administered by the compensation committee (the “Committee”) of our Board and allows for, among others, the following types of awards: restricted stock, restricted stock units, and other stock and cash-based awards, stock appreciation rights and stock options. As of December 31, 2024, the maximum aggregate number of shares currently authorized for issuance under the 2016 Plan is 5,750,000 shares with 954,864 shares available to be issued.
Restricted Stock and Restricted Stock Units – During 2024, time-based restricted stock units (“RSUs”) and performance-based restricted stock units (“PBRSUs”) were granted to certain executives and employees. Certain time-based (i.e., a “service condition”)
LSB Industries, Inc.
Notes to Consolidated Financial Statements (continued)
RSUs had graded vesting provisions of equal annual increments over three years while others had cliff vesting provisions of 100% at the end of three years. The PBRSUs granted in 2024 vest in three years and are based on a market condition. The 2023 time-based RSUs and PBRSUs were granted with similar vesting conditions as the RSUs and PBRSUs granted in 2024. The RSUs granted in 2022 have similar vesting timeframes to those granted in 2023 and 2024 while the PBRSUs granted in that year include units that vest based on a performance condition tied to the Company’s cost structure and units that vest based on a market condition. Details of the market and performance conditions are discussed further below.
We generally grant RSUs to our non-employee directors annually. Vesting of our director grants occurs upon the earliest of: (i) the director’s separation from service, (ii) the first anniversary of the grant date, or (iii) the occurrence of a change of control, as defined by the agreement. Since the separation from service vesting provision effectively allows an award to vest with no minimum service requirement, these awards are fully expensed on the date they were granted.
A summary of equity award activity during 2024 is presented below:
| | | | | | | | | | | | | | | | | | | | | | | | | | | | | | | | |
| | Restricted Stock (1) | | | Performance-Based
Restricted Stock (1)(2) | | | Restricted Stock Units | | | Performance Based Restricted Stock Units | |
| | Shares | | | Weighted-
Average
Grant Date
Fair Value | | | Shares | | | Weighted-
Average
Grant Date
Fair Value | | | Shares | | | Weighted-
Average
Grant Date
Fair Value | | | Shares | | | Weighted-
Average
Grant Date
Fair Value | |
Unvested outstanding beginning of year | | | 266,497 | | | $ | 2.73 | | | | 142,395 | | | $ | 2.73 | | | | 704,569 | | | $ | 10.33 | | | | 329,234 | | | $ | 17.03 | |
Granted | | | — | | | $ | — | | | | — | | | $ | — | | | | 649,177 | | | $ | 7.55 | | | | 296,815 | | | $ | 11.85 | |
Vested | | | (266,497 | ) | | $ | 2.73 | | | | (142,395 | ) | | $ | 2.73 | | | | (255,048 | ) | | $ | 8.14 | | | | — | | | $ | — | |
Cancelled or forfeited | | | — | | | $ | — | | | | — | | | $ | — | | | | (36,654 | ) | | $ | 10.28 | | | | — | | | $ | — | |
Unvested outstanding end of year | | | — | | | $ | — | | | | — | | | $ | — | | | | 1,062,044 | | | $ | 9.02 | | | | 626,049 | | | $ | 14.58 | |
Additional Information: | | | | | | | | | | | | | | | | | | | | | | | | |
Weighted-average fair value per stock/unit granted in 2023 | | | | | $ | — | | | | | | $ | — | | | | | | $ | 10.87 | | | | | | $ | 20.62 | |
Weighted-average fair value per stock/unit granted in 2022 | | | | | $ | — | | | | | | $ | — | | | | | | $ | 13.15 | | | | | | $ | 13.22 | |
| | | | | | | | | | | | | | | | | | | | | | | | |
| | Total Fair Value | | | Total Fair Value | | | Total Fair Value | | | Total Fair Value | |
| | In Thousands | |
Stock/unit vested in 2024 | | | | $ | 2,028 | | | | | $ | 1,084 | | | | | $ | 2,263 | | | | | $ | — | |
Stock/unit vested in 2023 | | | | $ | 3,485 | | | | | $ | 2,113 | | | | | $ | 1,343 | | | | | $ | — | |
Stock/unit vested in 2022 | | | | $ | 4,394 | | | | | $ | 4,976 | | | | | $ | - | | | | | $ | — | |
_____________________________
(1)We did not grant any restricted stock or performance based restricted stock awards during 2024, 2023 or 2022.
(2)Upon the change of control event occurring during 2021 such shares of performance-based restricted stock are subject only to the time-based vesting conditions set forth in the applicable award agreement and the 2016 Plan.
The payout on our 2024 PBRSU grants, which vest in three years, is based on our total shareholder return (“TSR”) relative to a peer group. The vesting criteria is measured annually relative to annual targets (with a minimum threshold and a maximum ceiling) with a final adjustment in the third year. Each annual measurement results in a number of shares that are independently earned (i.e. “banked”), with an upward final adjustment based on the relative three-year cumulative TSR or downward final adjustment due to a vesting cap at target when the cumulative absolute TSR is negative. As a result, the number of shares earned annually could be lower or higher than the annual target PBRSU shares. These awards granted require the grantee to be continuously employed through the end of the term for vesting purposes. The 2023 PBRSUs were granted with similar vesting provisions as the 2024 PBRSU grants.
The 2022 PBRSU grants, which vest in three years, include units that vest based on a performance condition tied to the Company’s cost structure and units that vest based on a market condition as measured by our TSR on an absolute basis. Both performance condition and market condition units are measured annually relative to annual targets for each respective criteria (with a minimum threshold and a maximum ceiling) with a final adjustment in the third year. Each annual measurement results in a number of shares that are independently earned (i.e., “banked") and are not affected by the measurement in the other periods. Banked shares are used in the final calculation to determine the vested shares at the end of the three-year period. As a result, the number of shares earned annually could be lower or higher than the annual target PBRSU shares. These awards granted require the grantee to be continuously employed through the end of the term for vesting purposes.
The fair value of our service condition and performance condition awards are based on the market price of our common stock.
LSB Industries, Inc.
Notes to Consolidated Financial Statements (continued)
We estimate the fair value of our market condition awards using a Monte Carlo simulation with the following assumptions:
•the closing stock price on the day preceding the grant;
•the prediction time horizon, the vesting term of the grant;
•the three-year Treasury yield curve rate on the grant date; and
•the standard deviation of historical daily returns for the length of the vesting term of the grant.
| | | | | | | | | | | | |
| | Valuation Date | |
| | January 17, 2024 | | | January 25, 2023 | | | January 20, 2022 | |
Valuation assumptions of market condition PBRSUs | | | | | | | | | |
Risk free rate | | | 4.03 | % | | | 3.77 | % | | | 1.34 | % |
Volatility | | | 69.39 | % | | | 95.06 | % | | | 97.92 | % |
Simulation period | | 2.95 | | | 2.93 years | | | 2.92 years | |
Fair value | | $ | 11.85 | | | $ | 20.62 | | | $ | 15.94 | |
Stock Options – We have had no grants or stock-based compensation expense related to stock options during the past three years. We had 13,000 stock options at a weighted average exercise price of $25.66, all of which expired out of the money in November 2024. As of December 31, 2024 there were no stock options outstanding.
Stock-based Compensation Expense – A summary of our stock-based compensation expense recognized and related income tax benefit is presented below:
| | | | | | | | | | | | |
| | Stock Based Compensation | |
| | 2024 | | | 2023 | | | 2022 | |
| | (In Thousands) | |
Stock-based compensation expense - Cost of sales | | | 1,046 | | | | 845 | | | | 512 | |
Stock-based compensation expense - Selling, general
and administrative expense | | | 5,561 | | | | 4,508 | | | | 3,513 | |
Income tax benefit | | | (1,548 | ) | | | (1,250 | ) | | | (947 | ) |
As of December 31, 2024, unrecognized compensation cost related to outstanding awards was $8,144,000 with a weighted-average remaining vesting period of 1.4 years.
10. Employee Savings and Stock Purchase Plans, Collective Bargaining Agreements and Executive Benefit Agreement
Employee Savings Plans - We sponsor a savings plan under Section 401(k) of the Internal Revenue Code under which participation is available to substantially all full-time employees. For full-time employees not covered by a collective bargaining agreement, beginning in April 2023 we match dollar for dollar of an employee’s active contribution, up to a total of 5% of pre-tax earnings for substantially all full-time employees. Prior to this we matched 50% of an employee’s contribution, up to 8%. For 2024, 2023 and 2022, the amounts contributed to this plan were approximately $2.3 million, $1.9 million, and $1.3 million respectively.
Employee Stock Purchase Plan - During 2022, our Board adopted and our shareholders approved our 2022 Employee Stock Purchase Plan (“ESPP”), which provides for payroll deductions by employees to purchase LSB stock directly from the Company at a discount to market price. The maximum number of shares reserved and available for issuance under the ESPP shall not exceed 4,500,000 shares. As of December 31, 2024 there were approximately 4,435,000 shares available for subsequent issuance under the ESPP. Eligibility in the ESPP is limited to our employees who have been continuously employed for a period of at least 30 days as of the first day of an offering and satisfy other requirements set forth in the ESPP. The ESPP offering period under the ESPP will be 6 months in duration and commence on the first business day of January and July of each year. Participants in the ESPP are subject to individual limits on (a) percentage of eligible compensation allocated toward purchases; (b) number of shares purchased and (c) in the event the participant holds stock option awards, total fair market value of purchases. The purchase price of each share will be 90 percent of the closing price of a share of our common stock on the exercise date. Shares purchased by the participant are issued from our treasury stock. During 2024, we had two offerings and approximately 32,000 shares were issued from our treasury stock to participants at an average price of $7.85 per share. During 2023, we had two offerings and approximately 24,000 shares were issued from our treasury stock to participants at an average price of $9.59 per share. During 2022, we had one offering and approximately 9,000 shares were issued from our treasury stock to participants at a closing price of $13.30 per share.
Collective Bargaining Agreements - As of December 31, 2024, we employed 583 persons, 164 whom are represented by unions under collective bargaining agreements. We have three 3-year union contracts of which one was ratified in 2024 and the remaining two are scheduled to be ratified in 2025.
Death Benefit Agreement - We were party to a death benefit agreement (the “2005 Agreement”) with Jack E. Golsen (“J. Golsen”), who retired effective December 31, 2017.
LSB Industries, Inc.
Notes to Consolidated Financial Statements (continued)
The 2005 Agreement provided that, upon J. Golsen’s death, we would pay to the designated beneficiary, a lump-sum payment of $2.5 million. J. Golsen passed away in April 2022. Further, we maintained and owned a life insurance policy with a face value of $3.0 million for which we were the beneficiary. The policy did not have any cash surrender value, premium payments were current, and the policy was in force at the time of J. Golsen’s death. We received the settlement payment of $3.0 million and paid the death benefit of $2.5 million in July 2022. We recorded $3.0 million in a settlement of life insurance presented within non-operating other expense (income), net within our consolidated statements of operations for the twelve months ended December 31, 2022. The settlement of life insurance is included in our consolidated statement of cash flows in “Other” investing activities.
11. Related Party Transactions
As of December 31, 2024 TLB-LSB, LLC, which is an affiliate of Todd Boehly, beneficially owns approximately 15.3 million shares of our outstanding common stock, or approximately 21% of our outstanding common stock.
As of December 31, 2024, we have one outstanding financing arrangement with an affiliate of TLB-LSB, LLC as discussed in Note 5 – Long-Term Debt.
During 2022, we exhausted our stock repurchase authorization, including by repurchasing 9.0 million shares at an average cost of $12.58 per share in connection with a public offerings by LSB Funding and SBT Investors, each of which is an affiliate of TLB-LSB, LLC.
Pursuant to the terms of the Board Representation and Standstill Agreement, as amended, our Board includes two directors that are employees of affiliates of Todd Boehly. During 2024 and 2023, we incurred director fees associated with these directors totaling approximately $0.4 million for each respective year and approximately $0.3 million for 2022.
During 2024, 2023 and 2022, we incurred director fees associated with Barry H. Golsen totaling approximately $0.2 million during 2024 and 2023 for each respective year and approximately $0.1 million for 2022.
12. Supplemental Cash Flow Information
The following provides additional information relating to cash flow activities:
| | | | | | | | | | | | |
| | 2024 | | | 2023 | | | 2022 | |
| | (In Thousands) | |
Cash payments (refunds) for: | | | | | | | | | |
Interest on long-term debt and other, net of capitalized
interest | | $ | 34,088 | | | $ | 42,921 | | | $ | 41,956 | |
Capitalized interest | | $ | 703 | | | $ | 305 | | | $ | 160 | |
Income taxes, net | | $ | 511 | | | $ | 1,689 | | | $ | 1,508 | |
| | | | | | | | | |
Noncash investing and financing activities: | | | | | | | | | |
| | | | | | | | | |
Property, plant and equipment acquired and not yet
paid at end of period | | $ | 26,758 | | | $ | 25,017 | | | $ | 28,394 | |
(Gain) loss on extinguishment of debt | | $ | (3,013 | ) | | $ | (8,644 | ) | | $ | 113 | |
Accounts payable associated with debt-related costs | | $ | — | | | $ | 450 | | | $ | — | |
LSB Industries, Inc.
Notes to Consolidated Financial Statements (continued)
13. Net Sales
Disaggregated Net Sales
As discussed in Note 1 – Summary of Significant Accounting Policies, we primarily derive our revenues from the sales of various chemical products. The following table presents our net sales disaggregated by certain of our products, which disaggregation is consistent with other financial information utilized or provided outside of our consolidated financial statements:
| | | | | | | | | | | | |
| | 2024 | | | 2023 | | | 2022 | |
| | (In Thousands) | |
Net sales: | | | | | | | | | |
AN & Nitric Acid | | $ | 212,478 | | | $ | 221,818 | | | $ | 315,679 | |
Urea ammonium nitrate (UAN) | | | 139,435 | | | | 154,206 | | | | 239,463 | |
Ammonia | | | 136,662 | | | | 166,581 | | | | 284,005 | |
Other | | | 33,825 | | | | 51,104 | | | | 62,564 | |
Total net sales | | $ | 522,400 | | | $ | 593,709 | | | $ | 901,711 | |
Other Information
Although most of our contracts have an original expected duration of one year or less, for our contracts with a duration greater than one year at contract inception, the average remaining expected duration was approximately 33 months as of December 31, 2024.
Liabilities associated with contracts with customers (contract liabilities) primarily relate to deferred revenue and customer deposits associated with cash payments received in advance from customers for volume shortfall charges and product shipments. We had approximately $1.1 million and $1.0 million of contract liabilities as of December 31, 2024 and 2023, respectively which are reflected as accrued liabilities in our consolidated balance sheets. During 2024 and 2023, deferred revenues of $0.8 million and $1.6 million, respectively were recognized and included in the balance as of December 31, 2024 and 2023. Our contract assets consist of unconditional rights to payment from our customers, which are reflected as accounts receivable in our consolidated balance sheets.
For most of our contracts with customers, the transaction price from the inception of a contract is constrained to a short period of time (generally one month) as these contracts contain terms with variable consideration related to both price and quantity. As of December 31, 2024, we have remaining performance obligations with certain customer contracts, excluding contracts with original durations of less than one year and contracts with variable consideration for which we have elected the practical expedient for consideration recognized in revenue as invoiced. The remaining performance obligations total approximately $133.9 million, of which approximately 62% of this amount relates to 2025 through 2027, approximately 23% relates to 2028 through 2029, with the remainder thereafter.
14. Leases
Our leasing activity primarily consists of leasing railcars and office space, which includes leasing the office space housing our headquarters in Oklahoma City, Oklahoma. We have in excess of 1,300 railcars under lease. Typically, the initial term of our railcar leases ranges from 2 years to 10 years, and the majority do not include any renewal options. Most of our railcar leases are operating leases with a limited number classified as finance leases.
From time to time, when we have excess freight capacity, we may sublease a portion of our railcars fleet on a short term basis to other parties. The income for these subleases is recorded as a component of “Other (income) expense, net” in our consolidated statements of operations.
LSB Industries, Inc.
Notes to Consolidated Financial Statements (continued)
| | | | | | | | | | | | |
| | | |
| | 2024 | | | 2023 | | | 2022 | |
| | (Dollars In Thousands) | |
Components of lease expense: | | | | | | | | | |
Operating lease cost | | $ | 12,056 | | | $ | 11,071 | | | $ | 10,692 | |
Short-term lease cost | | | 7,537 | | | | 3,399 | | | | 3,634 | |
Other cost (1) | | | 836 | | | | 391 | | | | 275 | |
Sublease income | | | (853 | ) | | | (5,632 | ) | | | — | |
Total lease cost | | $ | 19,576 | | | $ | 9,229 | | | $ | 14,601 | |
Supplemental cash flow information related to leases: | | | | | | | | | |
Operating cash flows from operating leases | | $ | 11,878 | | | $ | 10,948 | | | $ | 10,552 | |
Operating cash flows from finance leases | | | 213 | | | | 78 | | | | 56 | |
Financing cash flows from finance leases | | | 429 | | | | 231 | | | | 168 | |
Cash paid for amounts included in the measurement of lease liabilities | | $ | 12,520 | | | $ | 11,257 | | | $ | 10,776 | |
| | | | | | | | | |
Right-of-use assets obtained in exchange for new operating lease liabilities | | $ | 13,636 | | | $ | 11,969 | | | $ | 4,347 | |
| | | | | | | | | |
Right-of-use assets obtained in exchange for new finance lease liabilities | | $ | 3,371 | | | $ | 46 | | | $ | 932 | |
| | | | | | | | | |
Other lease-related information: | | | | | | | | | |
Weighted-average remaining lease term - operating leases (in years) | | | 4.9 | | | | 4.3 | | | | 3.3 | |
Weighted-average remaining lease term - finance leases (in years) | | | 7.3 | | | | 4.0 | | | | 4.9 | |
Weighted-average discount rate - operating leases | | | 7.94 | % | | | 8.26 | % | | | 8.25 | % |
Weighted-average discount rate - finance leases | | | 7.54 | % | | | 7.53 | % | | | 7.54 | % |
_____________________________
(1)Includes variable lease costs, finance lease interest and amortization costs.
As of December 31, 2024, future minimum lease payments due under ASC 842 are summarized by fiscal year in the table below:
| | | | | | | | |
| | Operating Leases | | | Finance Leases | |
| | (In Thousands) | |
2025 | | $ | 9,330 | | | $ | 873 | |
2026 | | | 6,951 | | | | 742 | |
2027 | | | 5,797 | | | | 675 | |
2028 | | | 4,464 | | | | 609 | |
2029 | | | 3,311 | | | | 582 | |
Thereafter | | | 4,816 | | | | 1,566 | |
Total lease payments | | | 34,669 | | | | 5,047 | |
Less imputed interest | | | (5,876 | ) | | | (1,152 | ) |
Present value of lease liabilities | | $ | 28,793 | | | $ | 3,895 | |
As of December 31, 2024, we have an executed finance lease with lease terms greater than one year, totaling approximately $1.6 million, which has not yet commenced.
LSB Industries, Inc.
Notes to Consolidated Financial Statements (continued)
15. Segment
We are engaged in the manufacture and sale of nitrogen based chemical products. We manufacture and distribute products in four facilities; three of which we own and one of which we operate on behalf of a third party. Please see "Nature of business" in Note 1-Summary of Significant Accounting Policies for a description of our products and customers.
The Company is managed on a consolidated basis with a single reportable segment, chemical manufacturing, which is not an aggregation of individual operating segments. Our segment determination is based primarily on our approach in allocating resources, which is driven by the objective of maximizing profit to the consolidated entity. We do not have business activities outside of our single reportable segment. Hence, we manage our entire company on the same basis as our single reportable segment.
We have determined that the CODM function is held by our Chief Executive Officer, Mark Behrman, and our Chief Financial Officer, Cheryl Maguire.
Our measure of segment profit that is most consistent with U.S. GAAP measurement principles is consolidated net income, which our CODM uses to assess performance and allocate resources. The accounting policies for our single reportable segment are the same as those for the Company as a whole, which are described in “Note 1 – Summary of Significant Accounting Policies”.
The CODM uses the segment profit measure to assess actual versus forecasted performance, determine incentive compensation, evaluate growth opportunities and to make decisions such as whether and when to invest profits back into the business.
Information about reported segment revenue, measures of a segment’s profit or loss, significant segment expenses, and measure of a segment's assets:
| | | | | | | | | | | | |
| | 2024 | | | 2023 | | | 2022 | |
| | (In Thousands) | |
Net sales | | $ | 522,400 | | | $ | 593,709 | | | $ | 901,711 | |
Less: | | | | | | | | | |
Cost of sales excluding depreciation, amortization
and turnaround expense | | | 362,562 | | | | 436,634 | | | | 457,327 | |
Depreciation and amortization | | | 74,260 | | | | 68,385 | | | | 66,782 | |
Turnaround expense | | | 37,781 | | | | 2,430 | | | | 29,235 | |
Total cost of sales | | | 474,603 | | | | 507,449 | | | | 553,344 | |
Selling, general and administrative | | | | | | | | | |
Wages and benefits | | | 23,191 | | | | 20,403 | | | | 18,222 | |
Other selling general and administrative | | | 18,576 | | | | 16,177 | | | | 21,206 | |
Total selling general and administrative | | | 41,767 | | | | 36,580 | | | | 39,428 | |
Interest expense | | | 34,452 | | | | 41,136 | | | | 46,827 | |
(Gain) loss on extinguishments of debt | | | (3,013 | ) | | | (8,644 | ) | | | 113 | |
Loss from asset write-down and disposals | | | 11,703 | | | | 3,613 | | | | 1,219 | |
Income tax (benefit) provision | | | (6,684 | ) | | | 5,973 | | | | 39,174 | |
Other segment items (a) | | | (11,075 | ) | | | (20,321 | ) | | | (8,741 | ) |
Segment net (loss) income | | | (19,353 | ) | | | 27,923 | | | | 230,347 | |
| | | | | | | | | |
Reconciliation of profit or loss | | | | | | | | | |
Adjustments and reconciling items | | | — | | | | — | | | | — | |
Consolidated net (loss) income | | $ | (19,353 | ) | | $ | 27,923 | | | $ | 230,347 | |
_____________________________
(a) In 2024 and 2023, amount consisted primarily of interest and sublease income. In 2022, amount consisted primarily of interest income and proceeds from an insurance settlement.
The measure of our chemical business assets is reported on the balance sheet as total consolidated assets.
All our long-lived assets are located in the United States and substantially all net sales are to customers in the United States.
In 2024, 2023 and 2022 we had one customer with net sales exceeding more than 10% our total net sales. Net sales to the single customer were 16%, 14% and 21% of our total net sales, in 2024, 2023 and 2022, respectively.
LSB Industries, Inc.
Schedule II - Valuation and Qualifying Accounts
Years ended December 31, 2024, 2023, and 2022
| | | | | | | | | | | | | | | | |
Description (1) | | Balance at
Beginning of
Year | | | Additions-
Charges to
(Recovery of)
Costs and
Expenses | | | Deductions-
Write-
offs/Costs
Incurred | | | Balance at
End of Year | |
| | (In Thousands) | |
Accounts receivable - allowance for doubtful accounts: | | | | | | | | | | | | |
2024 | | $ | 364 | | | $ | 6 | | | $ | 47 | | | $ | 323 | |
| | | | | | | | | | | | |
2023 | | $ | 699 | | | $ | (164 | ) | | $ | 171 | | | $ | 364 | |
| | | | | | | | | | | | |
2022 | | $ | 474 | | | $ | 485 | | | $ | 260 | | | $ | 699 | |
| | | | | | | | | | | | |
Deferred tax assets - valuation allowance: | | | | | | | | | | | | |
2024 | | $ | 15,175 | | | $ | (754 | ) | | $ | 183 | | | $ | 14,238 | |
| | | | | | | | | | | | |
2023 | | $ | 14,916 | | | $ | 274 | | | $ | 15 | | | $ | 15,175 | |
| | | | | | | | | | | | |
2022 | | $ | 46,968 | | | $ | (28,268 | ) | | $ | 3,784 | | | $ | 14,916 | |
_____________________________
(1)Reduction in the consolidated balance sheet from the related assets to which the reserve applies.
Other valuation and qualifying accounts are detailed in our notes to consolidated financial statements.