


Searchable text section of graphics shown above
This Exhibit has been edited solely to remove actual names of potential bidders and identifying information about a potential bidder.
[LOGO]
Presentation to:
The Special Committee of the Board of Directors of MacDermid, Incorporated
Regarding Project Deerfield
December 15, 2006
STRICTLY CONFIDENTIAL
[LOGO]
Global Markets & Investment Banking Group
Project Deerfield
Presentation to the Special Committee of the Board of Directors
Table of Contents
| |
|
|
| |
|
|
| |
|
|
| |
|
|
|
Overview of Final CSC Offer
Summary
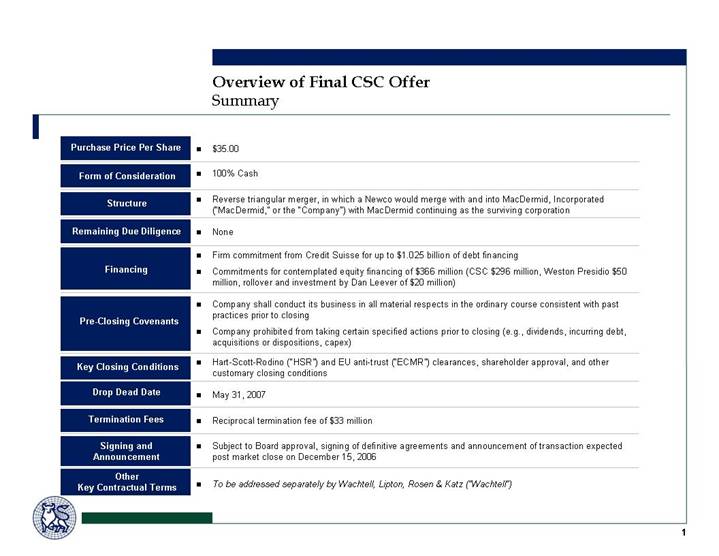
Purchase Price Per Share |
| • | $35.00 |
|
|
|
|
Form of Consideration |
| • | 100% Cash |
|
|
|
|
Structure |
| • | Reverse triangular merger, in which a Newco would merge with and into MacDermid, Incorporated (“MacDermid,”or the “Company”) with MacDermid continuing as the surviving corporation |
|
|
|
|
Remaining Due Diligence |
| • | None |
|
|
|
|
Financing |
| • | Firm commitment from Credit Suisse for up to $1.025 billion of debt financing |
• | Commitments for contemplated equity financing of $366 million (CSC $296 million, Weston Presidio $50 million, rollover and investment by Dan Leever of $20 million) | ||
|
|
|
|
|
|
|
|
Pre-Closing Covenants |
| • | Company shall conduct its business in all material respects in the ordinary course consistent with past practices prior to closing |
|
|
| |
| • | Company prohibited from taking certain specified actions prior to closing (e.g., dividends, incurring debt, acquisitions or dispositions, capex) | |
|
|
|
|
Key Closing Conditions |
| • | Hart-Scott-Rodino (“HSR”) and EU anti-trust (“ECMR”) clearances, shareholder approval, and other customary closing conditions |
|
|
|
|
Drop Dead Date |
| • | May 31, 2007 |
|
| |
|
Termination Fees |
| • | Reciprocal termination fee of $33 million |
|
|
|
|
Signing and Announcement |
| • | Subject to Board approval, signing of definitive agreements and announcement of transaction expected post market close on December 15, 2006 |
|
|
|
|
Other Key Contractual Terms |
| • | To be addressed separately by Wachtell, Lipton, Rosen & Katz (“Wachtell”) |
1
Implied Premiums and Multiples
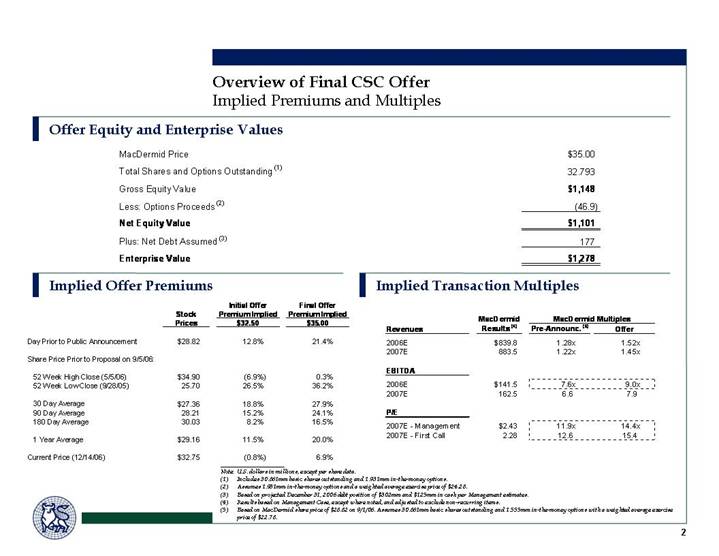
Offer Equity and Enterprise Values
MacDermid Price |
| $ | 35.00 |
|
Total Shares and Options Outstanding (1) |
| 32.793 |
| |
Gross Equity Value |
| $ | 1,148 |
|
Less: Options Proceeds (2) |
| (46.9 | ) | |
Net Equity Value |
| $ | 1,101 |
|
Plus: Net Debt Assumed (3) |
| 177 |
| |
Enterprise Value |
| $ | 1,278 |
|
Implied Offer Premiums
|
|
|
| Initial Offer |
| Final Offer |
| |
|
| Stock |
| Premium Implied |
| Premium Implied |
| |
|
| Prices |
| $32.50 |
| $35.00 |
| |
|
|
|
|
|
|
|
| |
Day Prior to Public Announcement |
| $ | 28.82 |
| 12.8 | % | 21.4 | % |
|
|
|
|
|
|
|
| |
Share Price Prior to Proposal on 9/5/06: |
|
|
|
|
|
|
| |
|
|
|
|
|
|
|
| |
52 Week High Close (5/5/06) |
| $ | 34.90 |
| (6.9 | )% | 0.3 | % |
52 Week Low Close (9/28/05) |
| 25.70 |
| 26.5 | % | 36.2 | % | |
|
|
|
|
|
|
|
| |
30 Day Average |
| $ | 27.36 |
| 18.8 | % | 27.9 | % |
90 Day Average |
| 28.21 |
| 15.2 | % | 24.1 | % | |
180 Day Average |
| 30.03 |
| 8.2 | % | 16.5 | % | |
|
|
|
|
|
|
|
| |
1 Year Average |
| $ | 29.16 |
| 11.5 | % | 20.0 | % |
|
|
|
|
|
|
|
| |
Current Price (12/14/06) |
| $ | 32.75 |
| (0.8 | )% | 6.9 | % |
Implied Transaction Multiples
|
| MacDermid |
| MacDermid Multiples |
| |||
Revenues |
| Results (4) |
| Pre-Announc. (5) |
| Offer |
| |
2006E |
| $ | 839.8 |
| 1.28 | x | 1.52 | x |
2007E |
| 883.5 |
| 1.22 | x | 1.45 | x | |
|
|
|
|
|
|
|
| |
EBITDA |
|
|
|
|
|
|
| |
2006E |
| $ | 141.5 |
| 7.6 | x | 9.0 | x |
2007E |
| 162.5 |
| 6.6 |
| 7.9 |
| |
|
|
|
|
|
|
|
| |
P/E |
|
|
|
|
|
|
| |
2007E - Management |
| $ | 2.43 |
| 11.9 | x | 14.4 | x |
2007E - First Call |
| 2.28 |
| 12.6 |
| 15.4 |
| |
Note: U.S. dollars in millions, except per share data.
(1) Includes 30.861mm basic shares outstanding and 1.931mm in-the-money options.
(2) Assumes 1.931mm in-the-money options and a weighted average exercise price of $24.28.
(3) Based on projected December 31, 2006 debt position of $302mm and $125mm in cash per Management estimates.
(4) Results based on Management Case, except where noted, and adjusted to exclude non-recurring items.
(5) Based on MacDermid share price of $28.82 on 9/1/06. Assumes 30.861mm basic shares outstanding and 1.555mm in-the-money options with a weighted average exercise price of $22.78.
2
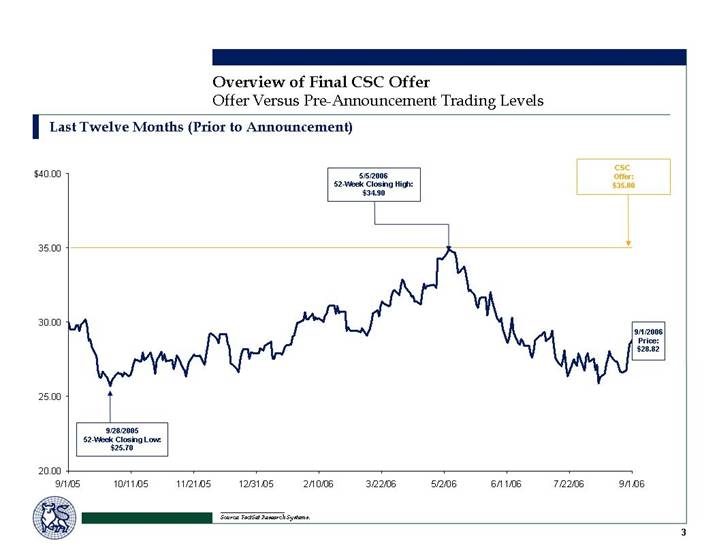
Offer Versus Pre-Announcement Trading Levels
Last Twelve Months (Prior to Announcement)
[CHART]
Source: FactSet Research Systems.
3
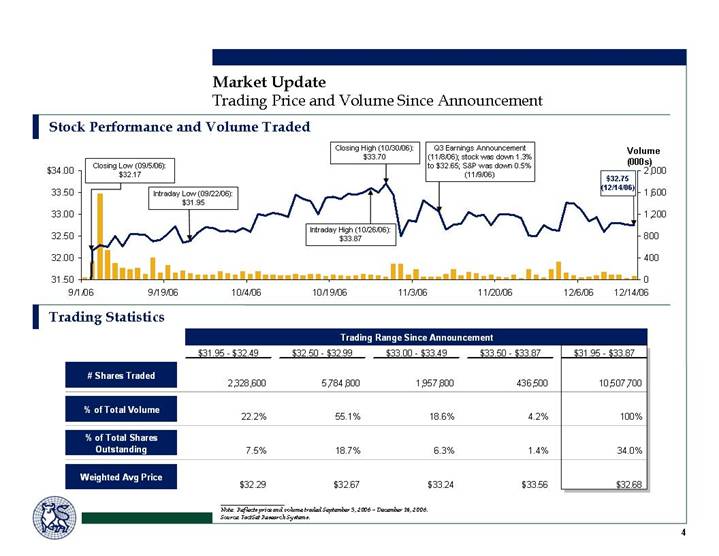
Market Update
Trading Price and Volume Since Announcement
Stock Performance and Volume Traded
[CHART]
Trading Statistics
|
| Trading Range Since Announcement |
| |||||||||||||
|
| $31.95 - $32.49 |
| $32.50 - $32.99 |
| $33.00 - $33.49 |
| $33.50 - $33.87 |
| $31.95 - $33.87 |
| |||||
|
|
|
|
|
|
|
|
|
|
|
| |||||
# Shares Traded |
| 2,328,600 |
| 5,784,800 |
| 1,957,800 |
| 436,500 |
| 10,507,700 |
| |||||
|
|
|
|
|
|
|
|
|
|
|
| |||||
% of Total Volume |
| 22.2 | % | 55.1 | % | 18.6 | % | 4.2 | % | 100 | % | |||||
|
|
|
|
|
|
|
|
|
|
|
| |||||
% of Total Shares |
| 7.5 | % | 18.7 | % | 6.3 | % | 1.4 | % | 34.0 | % | |||||
|
|
|
|
|
|
|
|
|
|
|
| |||||
Weighted Avg Price |
| $ | 32.29 |
| $ | 32.67 |
| $ | 33.24 |
| $ | 33.56 |
| $ | 32.68 |
|
Note: Reflects price and volume traded September 5, 2006 – December 14, 2006. Source: FactSet Research Systems.
4
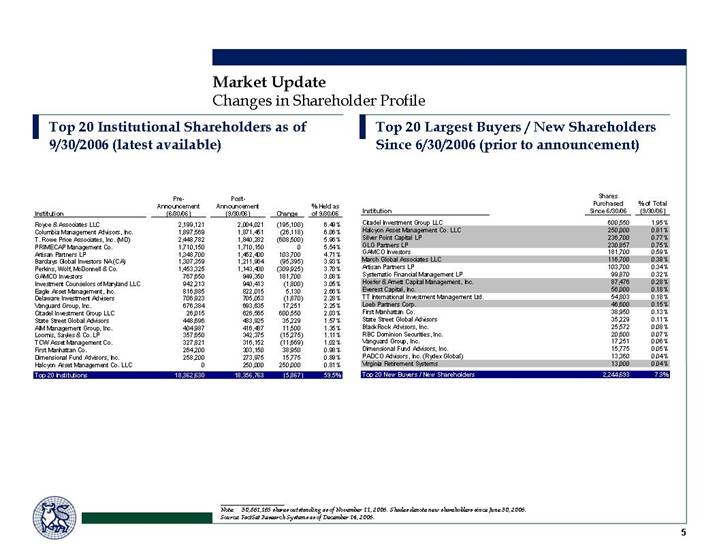
Changes in Shareholder Profile
Top 20 Institutional Shareholders as of 9/30/2006 (latest available)
|
| Pre- |
| Post- |
|
|
|
|
|
|
| Announcement |
| Announcement |
|
|
| % Held as |
|
Institution |
| (6/30/06) |
| (9/30/06) |
| Change |
| of 9/30/06 |
|
Royce & Associates LLC |
| 2,199,121 |
| 2,004,021 |
| (195,100 | ) | 6.49 | % |
Columbia Management Advisors, Inc. |
| 1,897,569 |
| 1,871,451 |
| (26,118 | ) | 6.06 | % |
T. Rowe Price Associates, Inc. (MD) |
| 2,448,782 |
| 1,840,282 |
| (608,500 | ) | 5.96 | % |
PRIMECAP Management Co. |
| 1,710,150 |
| 1,710,150 |
| 0 |
| 5.54 | % |
Artisan Partners LP |
| 1,348,700 |
| 1,452,400 |
| 103,700 |
| 4.71 | % |
Barclays Global Investors NA (CA) |
| 1,307,359 |
| 1,211,964 |
| (95,395 | ) | 3.93 | % |
Perkins, Wolf, McDonnell & Co. |
| 1,453,325 |
| 1,143,400 |
| (309,925 | ) | 3.70 | % |
GAMCO Investors |
| 767,650 |
| 949,350 |
| 181,700 |
| 3.08 | % |
Investment Counselors of Maryland LLC |
| 942,213 |
| 940,413 |
| (1,800 | ) | 3.05 | % |
Eagle Asset Management, Inc. |
| 816,885 |
| 822,015 |
| 5,130 |
| 2.66 | % |
Delaware Investment Advisers |
| 706,923 |
| 705,053 |
| (1,870 | ) | 2.28 | % |
Vanguard Group, Inc. |
| 676,384 |
| 693,635 |
| 17,251 |
| 2.25 | % |
Citadel Investment Group LLC |
| 26,015 |
| 626,565 |
| 600,550 |
| 2.03 | % |
State Street Global Advisors |
| 448,696 |
| 483,925 |
| 35,229 |
| 1.57 | % |
AIM Management Group, Inc. |
| 404,987 |
| 416,487 |
| 11,500 |
| 1.35 | % |
Loomis, Sayles & Co. LP |
| 357,650 |
| 342,375 |
| (15,275 | ) | 1.11 | % |
TCW Asset Management Co. |
| 327,821 |
| 316,152 |
| (11,669 | ) | 1.02 | % |
First Manhattan Co. |
| 264,200 |
| 303,150 |
| 38,950 |
| 0.98 | % |
Dimensional Fund Advisors, Inc. |
| 258,200 |
| 273,975 |
| 15,775 |
| 0.89 | % |
Halcyon Asset Management Co. LLC |
| 0 |
| 250,000 |
| 250,000 |
| 0.81 | % |
Top 20 Institutions |
| 18,362,630 |
| 18,356,763 |
| (5,867 | ) | 59.5 | % |
Top 20 Largest Buyers / New Shareholders Since 6/30/2006 (prior to announcement)
|
| Shares |
|
|
|
|
| Purchased |
| % of Total |
|
Institution |
| Since 6/30/06 |
| (9/30/06) |
|
Citadel Investment Group LLC |
| 600,550 |
| 1.95 | % |
Halcyon Asset Management Co. LLC |
| 250,000 |
| 0.81 | % |
Silver Point Capital LP |
| 236,700 |
| 0.77 | % |
GLG Partners LP |
| 230,857 |
| 0.75 | % |
GAMCO Investors |
| 181,700 |
| 0.59 | % |
March Global Associates LLC |
| 116,700 |
| 0.38 | % |
Artisan Partners LP |
| 103,700 |
| 0.34 | % |
Systematic Financial Management LP |
| 99,870 |
| 0.32 | % |
Hoefer & Arnett Capital Management, Inc. |
| 87,476 |
| 0.28 | % |
Everest Capital, Inc. |
| 56,000 |
| 0.18 | % |
TT International Investment Management Ltd. |
| 54,803 |
| 0.18 | % |
Loeb Partners Corp. |
| 46,600 |
| 0.15 | % |
First Manhattan Co. |
| 38,950 |
| 0.13 | % |
State Street Global Advisors |
| 35,229 |
| 0.11 | % |
BlackRock Advisors, Inc. |
| 25,572 |
| 0.08 | % |
RBC Dominion Securities, Inc. |
| 20,600 |
| 0.07 | % |
Vanguard Group, Inc. |
| 17,251 |
| 0.06 | % |
Dimensional Fund Advisors, Inc. |
| 15,775 |
| 0.05 | % |
PADCO Advisors, Inc. (Rydex Global) |
| 13,360 |
| 0.04 | % |
Virginia Retirement Systems |
| 13,000 |
| 0.04 | % |
Top 20 New Buyers / New Shareholders |
| 2,244,693 |
| 7.3 | % |
Note: 30,861,165 shares outstanding as of November 11, 2006. Shades denote new shareholders since June 30, 2006.
Source: FactSet Research Systems as of December 14, 2006.
5
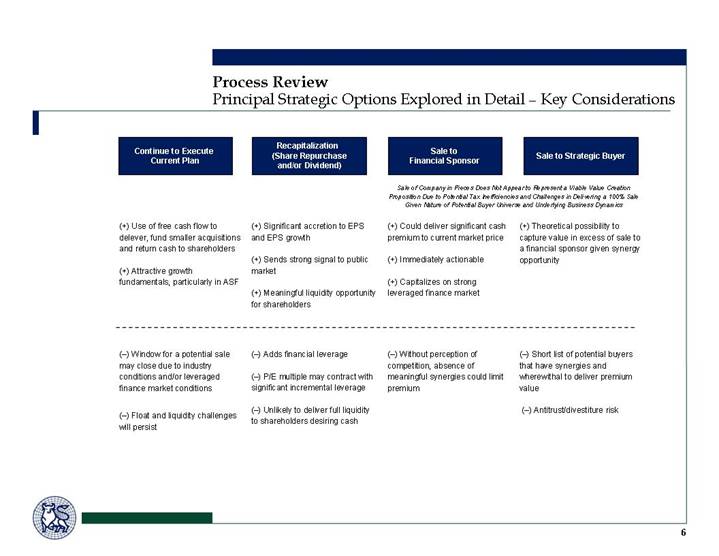
Process Review
Principal Strategic Options Explored in Detail – Key Considerations
Continue to Execute |
| Recapitalization |
| Sale to |
| Sale to Strategic Buyer |
|
|
|
|
|
|
|
|
|
|
| Sale of Company in Pieces Does Not Appear to Represent a Viable Value Creation Proposition Due to Potential Tax Inefficiencies and Challenges in Delivering a 100% Sale Given Nature of Potential Buyer Universe and Underlying Business Dynamics | ||
|
|
|
|
| ||
(+) Use of free cash flow to delever, fund smaller acquisitions and return cash to shareholders
(+) Attractive growth fundamentals, particularly in ASF
|
| (+) Significant accretion to EPS and EPS growth
(+) Sends strong signal to public market
(+) Meaningful liquidity opportunity for shareholders |
| (+) Could deliver significant cash premium to current market price
(+) Immediately actionable
(+) Capitalizes on strong leveraged finance market
|
| (+) Theoretical possibility to capture value in excess of sale to a financial sponsor given synergy opportunity
|
|
|
|
|
|
|
|
(-) Window for a potential sale may close due to industry conditions and/or leveraged finance market conditions
(-) Float and liquidity challenges will persist |
| (-) Adds financial leverage
(-) P/E multiple may contract with significant incremental leverage
(-) Unlikely to deliver full liquidity to shareholders desiring cash |
| (-) Without perception of competition, absence of meaningful synergies could limit premium |
| (-) Short list of potential buyers that have synergies and wherewithal to deliver premium value
(-) Antitrust/divestiture risk |
6
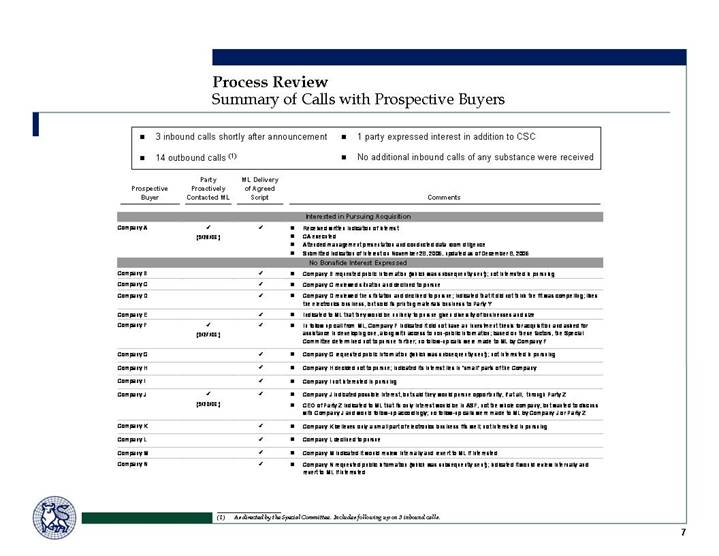
Summary of Calls with Prospective Buyers
• 3 inbound calls shortly after announcement |
| • 1 party expressed interest in addition to CSC |
• 14 outbound calls (1) |
| • No additional inbound calls of any substance were received |
|
| Party |
| ML Delivery |
|
|
|
Prospective |
| Proactively |
| of Agreed |
|
|
|
Buyer |
| Contacted ML |
| Script |
|
| Comments |
|
|
|
|
|
|
|
|
|
|
|
|
|
|
| Interested in Pursuing Acquisition |
Company A |
|
|
|
|
| • | Received written indication of interest |
|
| (9/28/06) |
|
|
| • | CA executed |
|
|
|
|
|
| • | Attended management presentation and conducted data room diligence |
|
|
|
|
|
| • | Submitted indication of interest on November 28, 2006, updated as of December 8, 2006 |
|
|
|
|
|
|
| No Bonafide Interest Expressed |
Company B |
|
|
|
|
| • | Company B requested public information (which was subsequently sent); not interested in pursuing |
Company C |
|
|
|
|
| • | Company C reviewed situation and declined to pursue |
Company D |
|
|
|
|
| • | Company D reviewed the situtation and declined to pursue; indicated that it did not think the fit was compelling; likes the electronics business, but sold its printing materials business to Party Y |
Company E |
|
|
|
|
| • | Indicated to ML that they would be unlikely to pursue given diversity of businesses and size |
Company F |
|
|
|
|
| • | In follow up call from ML, Company F indicated it did not have an investment thesis for acquisition and asked for assistance in developing one, along with access to non-public information; based on these factors, the Special Committee determined not to pursue further; no follow-up calls were made to ML by Company F |
Company G |
|
|
|
|
| • | Company G requested public information (which was subsequently sent); not interested in pursuing |
Company H |
|
|
|
|
| • | Company H decided not to pursue; indicated its interest lies in “small” parts of the Company |
Company I |
|
|
|
|
| • | Company I not interested in pursuing |
Company J |
|
|
|
|
| • | Company J indicated possible interest, but said they would pursue opportunity, if at all, through Party Z |
|
| (9/20/06) |
|
|
| • | CEO of Party Z indicated to ML that its only interest would be in ASF, not the whole company, but wanted to discuss with Company J and would follow-up accordingly; no follow-up calls were made to ML by Company J or Party Z |
Company K |
|
|
|
|
| • | Company K believes only a small part of electronics business fits well; not interested in pursuing |
Company L |
|
|
|
|
| • | Company L declined to pursue |
Company M |
|
|
|
|
| • | Company M indicated it would review internally and revert to ML if interested |
Company N |
|
|
|
|
| • | Company N requested public information (which was subsequently sent); indicated it would review internally and revert to ML if interested |
(1) As directed by the Special Committee. Includes following up on 3 inbound calls.
7
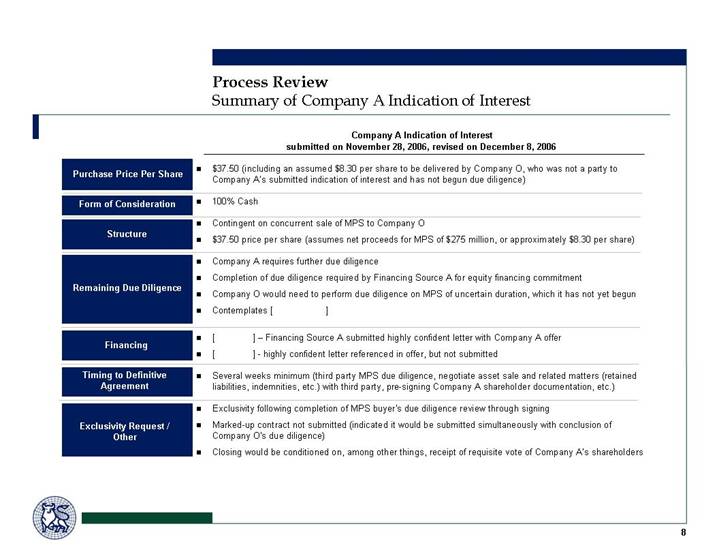
Summary of Company A Indication of Interest
|
| Company A Indication of Interest |
|
| submitted on November 28, 2006, revised on December 8, 2006 |
|
|
|
Purchase Price Per Share | • | $37.50 (including an assumed $8.30 per share to be delivered by Company O, who was not a party to Company A’s submitted indication of interest and has not begun due diligence) |
|
|
|
Form of Consideration | • | 100% Cash |
| |
|
Structure | • | Contingent on concurrent sale of MPS to Company O |
• | $37.50 price per share (assumes net proceeds for MPS of $275 million, or approximately $8.30 per share) | |
| |
|
Remaining Due Diligence | • | Company A requires further due diligence |
• | Completion of due diligence required by Financing Source A for equity financing commitment | |
• | Company O would need to perform due diligence on MPS of uncertain duration, which it has not yet begun | |
• | Contemplates [ ] | |
|
|
|
Financing | • | [ ] – Financing Source A submitted highly confident letter with Company A offer |
• | [ ] – highly confident letter referenced in offer, but not submitted | |
|
|
|
Timing to Definitive Agreement | • | Several weeks minimum (third party MPS due diligence, negotiate asset sale and related matters (retained liabilities, indemnities, etc.) with third party, pre-signing Company A shareholder documentation, etc.) |
|
|
|
Exclusivity Request / Other | • | Exclusivity following completion of MPS buyer’s due diligence review through signing |
• | Marked-up contract not submitted (indicated it would be submitted simultaneously with conclusion of Company O’s due diligence) | |
• | Closing would be conditioned on, among other things, receipt of requisite vote of Company A’s shareholders |
8
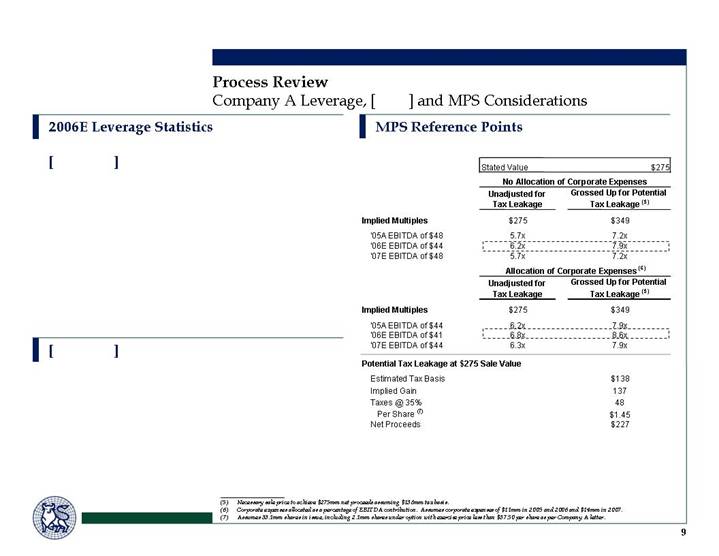
Company A Leverage, [ ] and MPS Considerations
2006E Leverage Statistics
[ ]
[ ]
MPS Reference Points
|
| Stated Value |
| $275 |
| ||
|
|
|
|
|
| ||
|
| No Allocation of Corporate Expenses |
| ||||
|
| Unadjusted for |
| Grossed Up for Potential |
| ||
|
| Tax Leakage |
| Tax Leakage (5) |
| ||
Implied Multiples |
| $ | 275 |
| $ | 349 |
|
|
|
|
|
|
| ||
‘05A EBITDA of $48 |
| 5.7 | x | 7.2 | x | ||
‘06E EBITDA of $44 |
| 6.2 | x | 7.9 | x | ||
‘07E EBITDA of $48 |
| 5.7 | x | 7.2 | x | ||
|
|
|
|
|
| ||
|
| Allocation of Corporate Expenses (6) |
| ||||
|
| Unadjusted for |
| Grossed Up for Potential |
| ||
|
| Tax Leakage |
| Tax Leakage (5) |
| ||
Implied Multiples |
| $ | 275 |
| $ | 349 |
|
|
|
|
|
|
| ||
‘05A EBITDA of $44 |
| 6.2 | x | 7.9 | x | ||
‘06E EBITDA of $41 |
| 6.8 | x | 8.6 | x | ||
‘07E EBITDA of $44 |
| 6.3 | x | 7.9 | x | ||
|
|
|
|
|
| ||
Potential Tax Leakage at $275 Sale Value |
|
|
|
|
| ||
Estimated Tax Basis |
|
|
| $ | 138 |
| |
Implied Gain |
|
|
| 137 |
| ||
Taxes @ 35% |
|
|
| 48 |
| ||
Per Share (7) |
|
|
| $ | 1.45 |
| |
Net Proceeds |
|
|
| $ | 227 |
| |
(5) Necessary sale price to achieve $275mm net proceeds assuming $138mm tax basis.
(6) Corporate expenses allocated as a percentage of EBITDA contribution. Assumes corporate expenses of $11mm in 2005 and 2006 and $14mm in 2007.
(7) Assumes 33.1mm shares in issue, including 2.1mm shares under option with exercise price less than $37.50 per share as per Company A letter.
9
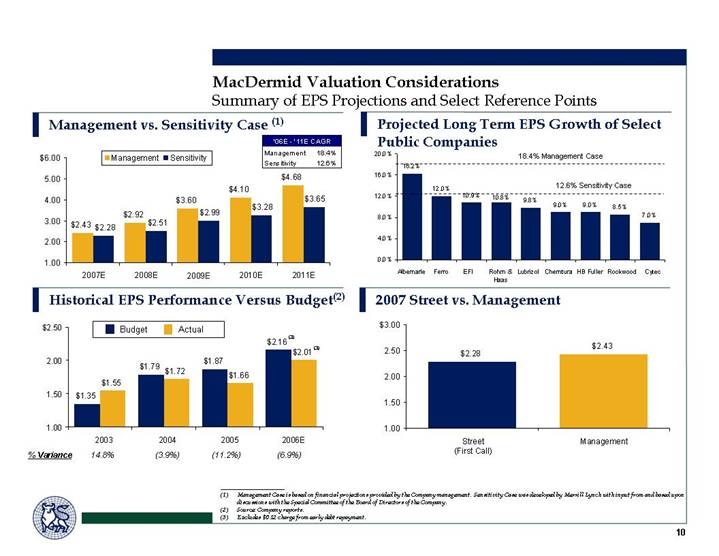
MacDermid Valuation Considerations
Summary of EPS Projections and Select Reference Points
Management vs. Sensitivity Case (1)
[CHART]
Historical EPS Performance Versus Budget(2)
[CHART]
Projected Long Term EPS Growth of Select Public Companies
[CHART]
2007 Street vs. Management
[CHART]
(1) Management Case is based on financial projections provided by the Company management. Sensitivity Case was developed by Merrill Lynch with input from and based upon discussions with the Special Committee of the Board of Directors of the Company.
(2) Source: Company reports.
(3) Excludes $0.12 charge from early debt repayment.
10
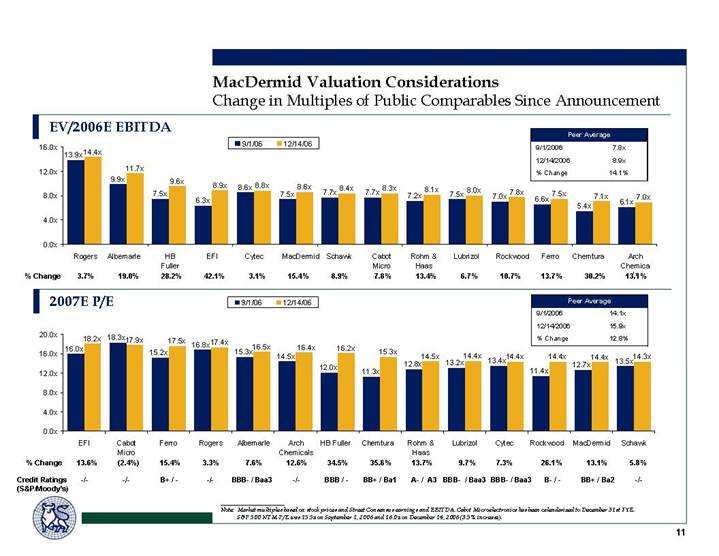
Change in Multiples of Public Comparables Since Announcement
EV/2006E EBITDA
[CHART]
Peer Average
9/1/2006 |
| 7.8 | x |
12/14/2006 |
| 8.9 | x |
% Change |
| 14.1 | % |
2007E P/E
[CHART]
Peer Average
9/1/2006 |
| 14.1 | x |
12/14/2006 |
| 15.9 | x |
% Change |
| 12.8 | % |
Note: Market multiples based on stock prices and Street Consensus earnings and EBITDA. Cabot Microelectronics has been calendarized to December 31st FYE. S&P 500 NTM P/E was 15.5x on September 1, 2006 and 16.0x on December 14, 2006 (3.5% increase).
11
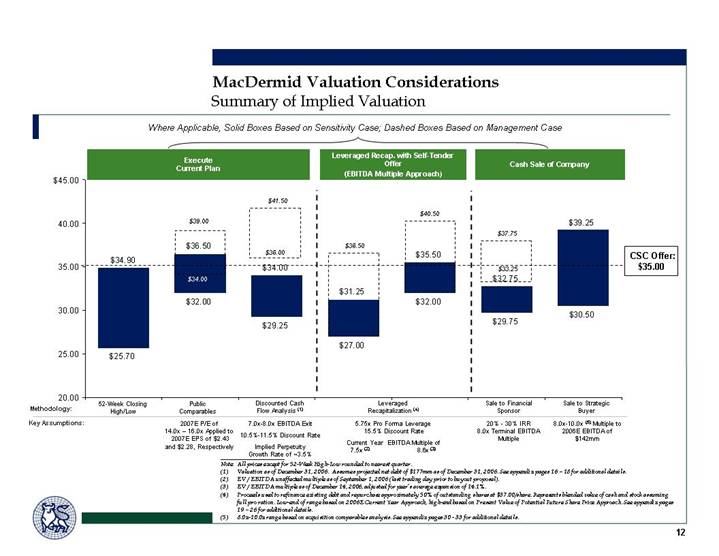
Summary of Implied Valuation
[CHART]
Note: All prices except for 52-Week High-Low rounded to nearest quarter.
(1) Valuation as of December 31, 2006. Assumes projected net debt of $177mm as of December 31, 2006. See appendix pages 16 – 18 for additional details.
(2) EV / EBITDA unaffected multiple as of September 1, 2006 (last trading day prior to buyout proposal).
(3) EV / EBITDA multiple as of December 14, 2006, adjusted for peer’s average expansion of 14.1%.
(4) Proceeds used to refinance existing debt and repurchase approximately 50% of outstanding shares at $37.00/share. Represents blended value of cash and stock assuming full pro ration. Low-end of range based on 2006E Current Year Approach, high-end based on Present Value of Potential Future Share Price Approach. See appendix pages 19 – 26 for additional details.
(5) 8.0x-10.0x range based on acquisition comparables analysis. See appendix pages 30 - 33 for additional details.
12
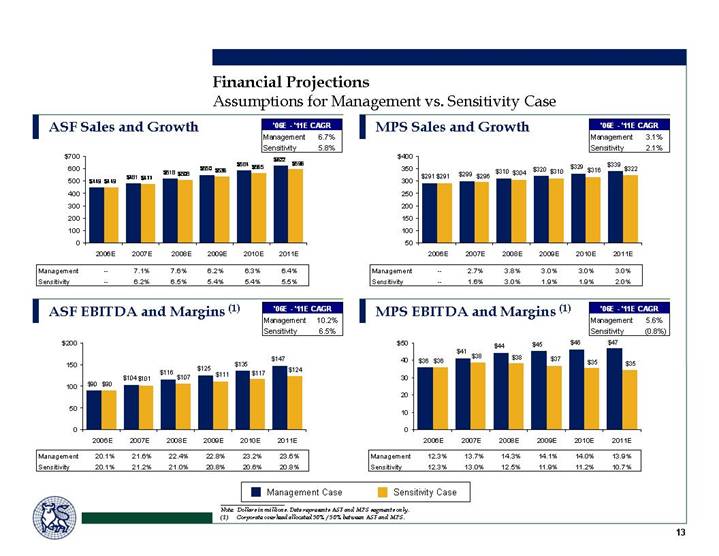
Financial Projections
Assumptions for Management vs. Sensitivity Case
ASF Sales and Growth
‘06E - ‘11E CAGR
Management |
| 6.7 | % |
Sensitivity |
| 5.8 | % |
[CHART]
Management |
| — |
| 7.1 | % | 7.6 | % | 6.2 | % | 6.3 | % | 6.4 | % |
Sensitivity |
| — |
| 6.2 | % | 6.5 | % | 5.4 | % | 5.4 | % | 5.5 | % |
MPS Sales and Growth
‘06E - ‘11E CAGR
Management |
| 3.1 | % |
Sensitivity |
| 2.1 | % |
[CHART]
Management |
| — |
| 2.7 | % | 3.8 | % | 3.0 | % | 3.0 | % | 3.0 | % |
Sensitivity |
| — |
| 1.6 | % | 3.0 | % | 1.9 | % | 1.9 | % | 2.0 | % |
ASF EBITDA and Margins (1)
‘06E - ‘11E CAGR
Management |
| 10.2 | % |
Sensitivity |
| 6.5 | % |
[CHART]
Management |
| 20.1 | % | 21.6 | % | 22.4 | % | 22.8 | % | 23.2 | % | 23.6 | % |
Sensitivity |
| 20.1 | % | 21.2 | % | 21.0 | % | 20.8 | % | 20.6 | % | 20.8 | % |
MPS EBITDA and Margins (1)
‘06E - ‘11E CAGR
Management |
| 5.6 | % |
Sensitivity |
| (0.8 | )% |
[CHART]
Management |
| 12.3 | % | 13.7 | % | 14.3 | % | 14.1 | % | 14.0 | % | 13.9 | % |
Sensitivity |
| 12.3 | % | 13.0 | % | 12.5 | % | 11.9 | % | 11.2 | % | 10.7 | % |
Note: Dollars in millions. Data represents ASF and MPS segments only.
(1) Corporate overhead allocated 50% / 50% between ASF and MPS.
13
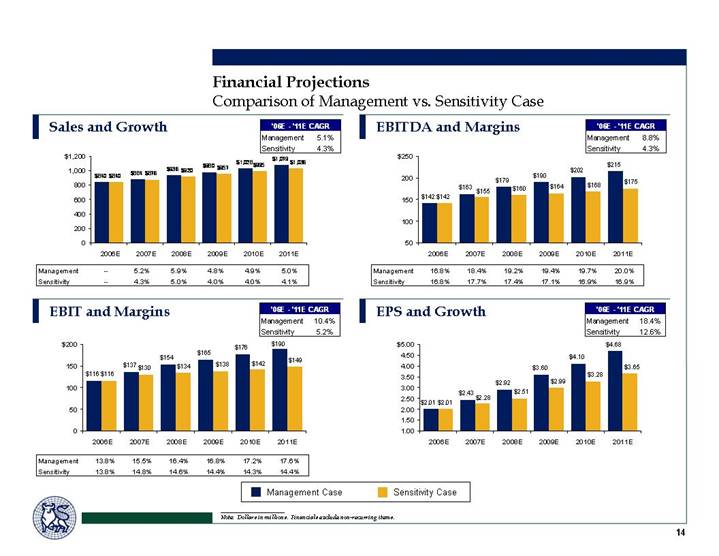
Comparison of Management vs. Sensitivity Case
Sales and Growth
‘06E - ‘11E CAGR
Management |
| 5.1 | % |
Sensitivity |
| 4.3 | % |
[CHART]
Management |
| — |
| 5.2 | % | 5.9 | % | 4.8 | % | 4.9 | % | 5.0 | % |
Sensitivity |
| — |
| 4.3 | % | 5.0 | % | 4.0 | % | 4.0 | % | 4.1 | % |
EBITDA and Margins
‘06E - ‘11E CAGR
Management |
| 8.8 | % |
Sensitivity |
| 4.3 | % |
[CHART]
Management |
| 16.8 | % | 18.4 | % | 19.2 | % | 19.4 | % | 19.7 | % | 20.0 | % |
Sensitivity |
| 16.8 | % | 17.7 | % | 17.4 | % | 17.1 | % | 16.9 | % | 16.9 | % |
EBIT and Margins
‘06E - ‘11E CAGR
Management |
| 10.4 | % |
Sensitivity |
| 5.2 | % |
[CHART]
Management |
| 13.8 | % | 15.5 | % | 16.4 | % | 16.8 | % | 17.2 | % | 17.6 | % |
Sensitivity |
| 13.8 | % | 14.8 | % | 14.6 | % | 14.4 | % | 14.3 | % | 14.4 | % |
EPS and Growth
‘06E - ‘11E CAGR
Management |
| 18.4 | % |
Sensitivity |
| 12.6 | % |
[CHART]
Note: Dollars in millions. Financials exclude non-recurring items.
14
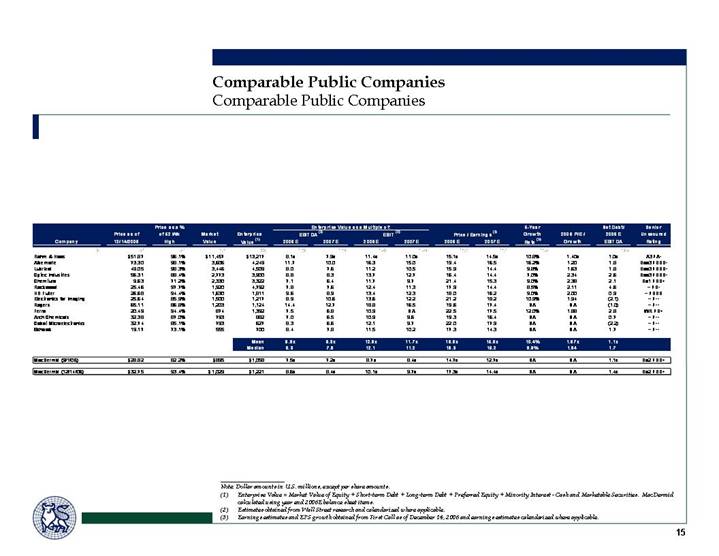
Comparable Public Companies
Comparable Public Companies
|
|
|
| Price as a % |
|
|
|
|
| Enterprise Value as a Multiple of: |
|
|
|
|
| 5-Year |
|
|
| Net Debt/ |
| Senior |
| ||||||||||
|
| Price as of |
| of 52 Wk |
| Market |
| Enterprise |
| EBITDA (2) |
| EBIT (2) |
| Price / Earnings (3) |
| Growth |
| 2006 P/E / |
| 2006E |
| Unsecured |
| ||||||||||
Company |
| 12/14/2006 |
| High |
| Value |
| Value (1) |
| 2006E |
| 2007E |
| 2006E |
| 2007E |
| 2006E |
| 2007E |
| Rate (3) |
| Growth |
| EBITDA |
| Rating |
| ||||
|
|
|
|
|
|
|
|
|
|
|
|
|
|
|
|
|
|
|
|
|
|
|
|
|
|
|
|
|
| ||||
Rohm & Haas |
| $ | 51.87 |
| 96.1 | % | $ | 11,457 |
| $ | 13,217 |
| 8.1 | x | 7.9 | x | 11.4 | x | 11.0 | x | 15.1 | x | 14.5 | x | 10.8 | % | 1.40 | x | 1.0 | x | A3 / A- |
| |
Albemarle |
| 73.30 |
| 98.1 | % | 3,606 |
| 4,249 |
| 11.7 |
| 10.0 |
| 16.3 |
| 15.0 |
| 19.4 |
| 16.5 |
| 16.2 | % | 1.20 |
| 1.8 |
| Baa3 / BBB- |
| ||||
Lubrizol |
| 49.05 |
| 98.3 | % | 3,446 |
| 4,509 |
| 8.0 |
| 7.6 |
| 11.2 |
| 10.5 |
| 15.9 |
| 14.4 |
| 9.8 | % | 1.63 |
| 1.8 |
| Baa3 / BBB- |
| ||||
Cytec Industries |
| 56.31 |
| 88.4 | % | 2,773 |
| 3,900 |
| 8.8 |
| 8.3 |
| 13.7 |
| 12.7 |
| 16.4 |
| 14.4 |
| 7.0 | % | 2.34 |
| 2.6 |
| Baa3 / BBB- |
| ||||
Chemtura |
| 9.63 |
| 71.2 | % | 2,330 |
| 3,322 |
| 7.1 |
| 6.4 |
| 11.7 |
| 9.7 |
| 21.4 |
| 15.3 |
| 9.0 | % | 2.38 |
| 2.1 |
| Ba1 / BB+ |
| ||||
Rockwood |
| 25.46 |
| 97.7 | % | 1,920 |
| 4,792 |
| 7.8 |
| 7.6 |
| 12.4 |
| 11.3 |
| 17.9 |
| 14.4 |
| 8.5 | % | 2.11 |
| 4.6 |
| – / B- |
| ||||
HB Fuller |
| 26.68 |
| 94.4 | % | 1,630 |
| 1,811 |
| 9.6 |
| 8.9 |
| 13.4 |
| 12.3 |
| 18.0 |
| 16.2 |
| 9.0 | % | 2.00 |
| 0.9 |
| – / BBB |
| ||||
Electronics for Imaging |
| 25.64 |
| 85.9 | % | 1,500 |
| 1,217 |
| 8.9 |
| 10.6 |
| 13.6 |
| 12.2 |
| 21.2 |
| 18.2 |
| 10.9 | % | 1.94 |
| (2.1 | ) | – / – |
| ||||
Rogers |
| 65.11 |
| 86.8 | % | 1,203 |
| 1,124 |
| 14.4 |
| 12.7 |
| 18.8 |
| 16.5 |
| 19.6 |
| 17.4 |
| NA |
| NA |
| (1.0 | ) | – / – |
| ||||
Ferro |
| 20.49 |
| 94.4 | % | 874 |
| 1,392 |
| 7.5 |
| 6.8 |
| 10.9 |
| NA |
| 22.5 |
| 17.5 |
| 12.0 | % | 1.88 |
| 2.8 |
| WR / B+ |
| ||||
Arch Chemicals |
| 32.38 |
| 87.0 | % | 793 |
| 882 |
| 7.0 |
| 6.5 |
| 10.9 |
| 9.6 |
| 19.3 |
| 16.4 |
| NA |
| NA |
| 0.7 |
| – / – |
| ||||
Cabot Microelectronics |
| 32.74 |
| 85.1 | % | 793 |
| 627 |
| 8.3 |
| 6.6 |
| 12.1 |
| 9.7 |
| 22.0 |
| 17.9 |
| NA |
| NA |
| (2.2 | ) | – / – |
| ||||
Schawk |
| 19.17 |
| 73.1 | % | 555 |
| 700 |
| 8.4 |
| 7.8 |
| 11.5 |
| 10.2 |
| 17.3 |
| 14.3 |
| NA |
| NA |
| 1.7 |
| – / – |
| ||||
|
|
|
|
|
|
|
|
|
|
|
|
|
|
|
|
|
|
|
|
|
|
|
|
|
|
|
|
|
| ||||
|
|
|
|
|
|
|
| Mean |
| 8.9 | x | 8.3 | x | 12.9 | x | 11.7 | x | 18.9 | x | 15.9 | x | 10.4 | % | 1.87 | x | 1.1 | x |
|
| ||||
|
|
|
|
|
|
|
| Median |
| 8.3 |
| 7.8 |
| 12.1 |
| 11.2 |
| 19.3 |
| 16.2 |
| 9.8 | % | 1.94 |
| 1.7 |
|
|
| ||||
|
|
|
|
|
|
|
|
|
|
|
|
|
|
|
|
|
|
|
|
|
|
|
|
|
|
|
|
|
| ||||
MacDermid (9/1/06) |
| $ | 28.82 |
| 82.2 | % | $ | 895 |
| $ | 1,058 |
| 7.5 | x | 7.2 | x | 8.7 | x | 8.4 | x | 14.7 | x | 12.7 | x | NA |
| NA |
| 1.1 | x | Ba2 / BB+ |
| |
|
|
|
|
|
|
|
|
|
|
|
|
|
|
|
|
|
|
|
|
|
|
|
|
|
|
|
|
|
| ||||
MacDermid (12/14/06) |
| $ | 32.75 |
| 93.4 | % | $ | 1,029 |
| $ | 1,221 |
| 8.6 | x | 8.4 | x | 10.1 | x | 9.7 | x | 17.3 | x | 14.4 | x | NA |
| NA |
| 1.4 | x | Ba2 / BB+ |
| |
Note: Dollar amounts in U.S. millions, except per share amounts.
(1) Enterprise Value = Market Value of Equity + Short-term Debt + Long-term Debt + Preferred Equity + Minority Interest -Cash and Marketable Securities. MacDermid calculated using year end 2006E balance sheet items.
(2) Estimates obtained from Wall Street research and calendarized where applicable.
(3) Earnings estimates and EPS growth obtained from First Call as of December 14, 2006 and earnings estimates calendarized where applicable.
15
Discounted Cash Flow Analysis
Discounted Cash Flow Analysis – Management Case
(Dollars in Millions, Except per Share Data)
|
| Year Ending December 31, |
|
|
| ||||||||||||||||||||
|
| 2005 |
| 2006 |
| 2007 |
| 2008 |
| 2009 |
| 2010 |
| 2011 |
| Normalized |
| ||||||||
Revenue |
| $ | 738 |
| $ | 840 |
| $ | 884 |
| $ | 936 |
| $ | 980 |
| $ | 1,028 |
| $ | 1,079 |
| 1,079 |
| |
EBITDA |
| 121 |
| 142 |
| 163 |
| 179 |
| 190 |
| 202 |
| 215 |
| 215 |
| ||||||||
Depreciation and Amortization |
| (21 | ) | (26 | ) | (26 | ) | (26 | ) | (26 | ) | (26 | ) | (26 | ) | (12 | ) | ||||||||
EBIT |
| $ | 99 |
| $ | 116 |
| $ | 137 |
| $ | 154 |
| $ | 165 |
| $ | 176 |
| $ | 190 |
| $ | 203 |
|
|
|
|
|
|
|
|
|
|
|
|
|
|
|
|
|
|
| ||||||||
Taxes |
|
|
|
|
| 48 |
| 54 |
| 58 |
| 62 |
| 66 |
| 71 |
| ||||||||
Tax Rate |
|
|
|
|
| 35.0 | % | 35.0 | % | 35.0 | % | 35.0 | % | 35.0 | % | 35.0 | % | ||||||||
After-tax EBIT |
|
|
|
|
| $ | 89 |
| $ | 100 |
| $ | 107 |
| $ | 115 |
| $ | 123 |
| $ | 132 |
| ||
Depreciation and Amortization |
|
|
|
|
| 26 |
| 26 |
| 26 |
| 26 |
| 26 |
| 12 |
| ||||||||
Change in Working Capital and LT Items |
|
|
|
|
| 19 |
| (11 | ) | (10 | ) | (10 | ) | (11 | ) | (11 | ) | ||||||||
Capital Expenditures |
|
|
|
|
| (8 | ) | (8 | ) | (10 | ) | (10 | ) | (12 | ) | (12 | ) | ||||||||
Free Cash Flow |
|
|
|
|
| $ | 126 |
| $ | 107 |
| $ | 113 |
| $ | 120 |
| $ | 126 |
| $ | 121 |
| ||
Discount |
| Present Value |
|
|
| PV of Terminal Value @ |
|
|
| Enterprise Value @ |
| |||||||||||||||
Rate |
| (2007-2011) |
|
|
| 7.0x |
| 7.5x |
| 8.0x |
|
|
| 7.0x |
| 7.5x |
| 8.0x |
| |||||||
10.50 | % | $ | 442 |
|
|
| $ | 915 |
| $ | 980 |
| $ | 1,046 |
|
|
| $ | 1,357 |
| $ | 1,422 |
| $ | 1,488 |
|
10.75 | % | 439 |
|
|
| 905 |
| 969 |
| 1,034 |
|
|
| 1,344 |
| 1,408 |
| 1,473 |
| |||||||
11.00 | % | 436 |
| + |
| 895 |
| 959 |
| 1,022 |
| = |
| 1,331 |
| 1,395 |
| 1,459 |
| |||||||
11.25 | % | 433 |
|
|
| 885 |
| 948 |
| 1,011 |
|
|
| 1,318 |
| 1,381 |
| 1,444 |
| |||||||
11.50 | % | 431 |
|
|
| 875 |
| 937 |
| 1,000 |
|
|
| 1,305 |
| 1,368 |
| 1,430 |
| |||||||
Discount |
|
|
| Projected |
|
|
| Equity Value @ |
| Price Per Share @ |
| |||||||||||||||
Rate |
|
|
| FYE 2006 |
|
|
| 7.0x |
| 7.5x |
| 8.0x |
| 7.0x |
| 7.5x |
| 8.0x |
| |||||||
10.50 | % |
|
| $ | 177 |
|
|
| $ | 1,180 |
| $ | 1,245 |
| $ | 1,311 |
| $ | 37.57 |
| $ | 39.52 |
| $ | 41.46 |
|
10.75 | % |
|
| 177 |
|
|
| 1,167 |
| 1,232 |
| 1,296 |
| 37.16 |
| 39.11 |
| 41.03 |
| |||||||
11.00 | % | - |
| 177 |
| = |
| 1,154 |
| 1,218 |
| 1,282 |
| 36.77 |
| 38.71 |
| 40.60 |
| |||||||
11.25 | % |
|
| 177 |
|
|
| 1,141 |
| 1,204 |
| 1,268 |
| 36.38 |
| 38.31 |
| 40.18 |
| |||||||
11.50 | % |
|
| 177 |
|
|
| 1,129 |
| 1,191 |
| 1,254 |
| 35.99 |
| 37.91 |
| 39.77 |
| |||||||
Discount |
|
|
| PV of Terminal Value |
| Equivalent Perpetuity Growth Rate |
| ||||||||
Rate |
|
|
| 7.0x |
| 7.5x |
| 8.0x |
| 7.0x |
| 7.5x |
| 8.0x |
|
10.50 | % |
|
| 67.4 | % | 68.9 | % | 70.3 | % | 2.3 | % | 2.8 | % | 3.3 | % |
10.75 | % |
|
| 67.3 | % | 68.8 | % | 70.2 | % | 2.5 | % | 3.0 | % | 3.5 | % |
11.00 | % |
|
| 67.2 | % | 68.7 | % | 70.1 | % | 2.8 | % | 3.3 | % | 3.7 | % |
11.25 | % |
|
| 67.1 | % | 68.6 | % | 70.0 | % | 3.0 | % | 3.5 | % | 4.0 | % |
11.50 | % |
|
| 67.0 | % | 68.5 | % | 69.9 | % | 3.2 | % | 3.7 | % | 4.2 | % |
Note: EBITDA and EBIT before non-recurring items.
16
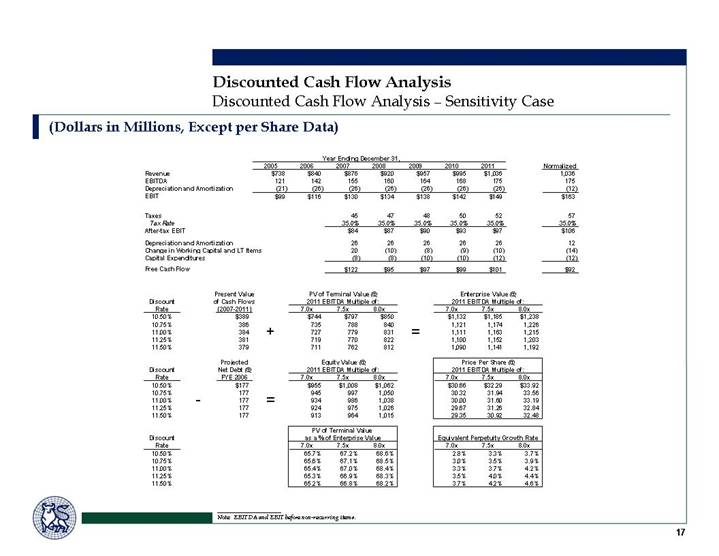
Discounted Cash Flow Analysis – Sensitivity Case
(Dollars in Millions, Except per Share Data)
|
| Year Ending December 31, |
|
|
| ||||||||||||||||||||
|
| 2005 |
| 2006 |
| 2007 |
| 2008 |
| 2009 |
| 2010 |
| 2011 |
| Normalized |
| ||||||||
Revenue |
| $ | 738 |
| $ | 840 |
| $ | 876 |
| $ | 920 |
| $ | 957 |
| $ | 995 |
| $ | 1,036 |
| 1,036 |
| |
EBITDA |
| 121 |
| 142 |
| 155 |
| 160 |
| 164 |
| 168 |
| 175 |
| 175 |
| ||||||||
Depreciation and Amortization |
| (21 | ) | (26 | ) | (26 | ) | (26 | ) | (26 | ) | (26 | ) | (26 | ) | (12 | ) | ||||||||
EBIT |
| $ | 99 |
| $ | 116 |
| $ | 130 |
| $ | 134 |
| $ | 138 |
| $ | 142 |
| $ | 149 |
| $ | 163 |
|
|
|
|
|
|
|
|
|
|
|
|
|
|
|
|
|
|
| ||||||||
Taxes |
|
|
|
|
| 45 |
| 47 |
| 48 |
| 50 |
| 52 |
| 57 |
| ||||||||
Tax Rate |
|
|
|
|
| 35.0 | % | 35.0 | % | 35.0 | % | 35.0 | % | 35.0 | % | 35.0 | % | ||||||||
After-tax EBIT |
|
|
|
|
| $ | 84 |
| $ | 87 |
| $ | 90 |
| $ | 93 |
| $ | 97 |
| $ | 106 |
| ||
Depreciation and Amortization |
|
|
|
|
| 26 |
| 26 |
| 26 |
| 26 |
| 26 |
| 12 |
| ||||||||
Change in Working Capital and LT Items |
|
|
|
|
| 20 |
| (10 | ) | (8 | ) | (9 | ) | (10 | ) | (14 | ) | ||||||||
Capital Expenditures |
|
|
|
|
| (8 | ) | (8 | ) | (10 | ) | (10 | ) | (12 | ) | (12 | ) | ||||||||
Free Cash Flow |
|
|
|
|
| $ | 122 |
| $ | 95 |
| $ | 97 |
| $ | 99 |
| $ | 101 |
| $ | 92 |
| ||
Discount |
| Present Value |
|
|
| PV of Terminal Value @ |
|
|
| Enterprise Value @ |
| |||||||||||||||
Rate |
| (2007-2011) |
|
|
| 7.0x |
| 7.5x |
| 8.0x |
|
|
| 7.0x |
| 7.5x |
| 8.0x |
| |||||||
10.50 | % | $ | 389 |
|
|
| $ | 744 |
| $ | 797 |
| $ | 850 |
|
|
| $ | 1,132 |
| $ | 1,185 |
| $ | 1,238 |
|
10.75 | % | 386 |
|
|
| 735 |
| 788 |
| 840 |
|
|
| 1,121 |
| 1,174 |
| 1,226 |
| |||||||
11.00 | % | 384 |
| + |
| 727 |
| 779 |
| 831 |
| = |
| 1,111 |
| 1,163 |
| 1,215 |
| |||||||
11.25 | % | 381 |
|
|
| 719 |
| 770 |
| 822 |
|
|
| 1,100 |
| 1,152 |
| 1,203 |
| |||||||
11.50 | % | 379 |
|
|
| 711 |
| 762 |
| 812 |
|
|
| 1,090 |
| 1,141 |
| 1,192 |
| |||||||
Discount |
|
|
| Projected |
|
|
| Equity Value @ |
| Price Per Share @ |
| |||||||||||||||
Rate |
|
|
| FYE 2006 |
|
|
| 7.0x |
| 7.5x |
| 8.0x |
| 7.0x |
| 7.5x |
| 8.0x |
| |||||||
10.50 | % |
|
| $ | 177 |
|
|
| $ | 955 |
| $ | 1,008 |
| $ | 1,062 |
| $ | 30.66 |
| $ | 32.29 |
| $ | 33.92 |
|
10.75 | % |
|
| 177 |
|
|
| 945 |
| 997 |
| 1,050 |
| 30.32 |
| 31.94 |
| 33.56 |
| |||||||
11.00 | % | - |
| 177 |
| = |
| 934 |
| 986 |
| 1,038 |
| 30.00 |
| 31.60 |
| 33.19 |
| |||||||
11.25 | % |
|
| 177 |
|
|
| 924 |
| 975 |
| 1,026 |
| 29.67 |
| 31.26 |
| 32.84 |
| |||||||
11.50 | % |
|
| 177 |
|
|
| 913 |
| 964 |
| 1,015 |
| 29.35 |
| 30.92 |
| 32.48 |
| |||||||
Discount |
|
|
| PV of Terminal Value |
| Equivalent Perpetuity Growth Rate |
| ||||||||
Rate |
|
|
| 7.0x |
| 7.5x |
| 8.0x |
| 7.0x |
| 7.5x |
| 8.0x |
|
10.50 | % |
|
| 65.7 | % | 67.2 | % | 68.6 | % | 2.8 | % | 3.3 | % | 3.7 | % |
10.75 | % |
|
| 65.6 | % | 67.1 | % | 68.5 | % | 3.0 | % | 3.5 | % | 3.9 | % |
11.00 | % |
|
| 65.4 | % | 67.0 | % | 68.4 | % | 3.3 | % | 3.7 | % | 4.2 | % |
11.25 | % |
|
| 65.3 | % | 66.9 | % | 68.3 | % | 3.5 | % | 4.0 | % | 4.4 | % |
11.50 | % |
|
| 65.2 | % | 66.8 | % | 68.2 | % | 3.7 | % | 4.2 | % | 4.6 | % |
Note: EBITDA and EBIT before non-recurring items.
17
Weighted Average Cost of Capital
Macroeconomic Assumptions (1) |
|
|
|
Ten Year Government Bond Yield at 12/14/2006 |
| 4.6 | % |
Historical Risk Premium |
| 7.1 | % |
Size Premium |
| 1.8 | % |
Adjusted Risk Premium |
| 8.9 | % |
Estimated Future Market Return |
| 13.5 | % |
|
| Levered |
| Marginal |
| Net Debt to |
| Unlevered |
| Levered |
| Unlevered |
|
Comparable Companies |
| Beta (2) |
| Tax Rate |
| Equity (3) |
| Beta (4) |
| Return |
| Return (5) |
|
Albemarle |
| 1.11 |
| 38.0 | % | 17.9 | % | 1.00 |
| 12.5 | % | 11.7 | % |
Arch Chemicals |
| 0.83 |
| 38.0 | % | 11.3 | % | 0.78 |
| 10.5 | % | 10.1 | % |
Cabot Microelectronics |
| 1.64 |
| 38.0 | % | 0.0 | % | 1.64 |
| 16.2 | % | 16.2 | % |
Chemtura |
| 1.23 |
| 38.0 | % | 42.6 | % | 0.97 |
| 13.3 | % | 11.5 | % |
Cytec |
| 0.89 |
| 38.0 | % | 40.6 | % | 0.71 |
| 10.9 | % | 9.6 | % |
Electronics for Imaging |
| 0.96 |
| 38.0 | % | 0.0 | % | 0.96 |
| 11.4 | % | 11.4 | % |
Ferro |
| 1.04 |
| 38.0 | % | 57.1 | % | 0.77 |
| 12.0 | % | 10.0 | % |
HB Fuller |
| 0.89 |
| 38.0 | % | 10.1 | % | 0.84 |
| 10.9 | % | 10.5 | % |
Lubrizol |
| 0.87 |
| 38.0 | % | 29.4 | % | 0.74 |
| 10.8 | % | 9.8 | % |
Rockwood* |
| 0.24 |
| 38.0 | % | 147.9 | % | 0.13 |
| 6.3 | % | 5.5 | % |
Rogers |
| 1.23 |
| 38.0 | % | 0.0 | % | 1.23 |
| 13.3 | % | 13.3 | % |
Rohm & Haas |
| 1.05 |
| 38.0 | % | 14.3 | % | 0.96 |
| 12.0 | % | 11.4 | % |
Schawk* |
| 0.55 |
| 38.0 | % | 26.0 | % | 0.47 |
| 8.5 | % | 8.0 | % |
|
|
|
|
|
|
|
|
|
|
|
|
|
|
Average |
| 1.07 |
| 38.0 | % | 20.3 | % | 0.96 |
| 12.2 | % | 11.4 | % |
|
|
|
|
|
|
|
|
|
|
|
|
|
|
MacDermid |
| 0.94 |
| 38 | % | 21.5 | % | 0.83 |
| 11.3 | % | 10.5 | % |
Capital Structures
Net Debt/ |
| Net Debt/ |
| Levered Cost of Equity at Various Unlevered Beta and Capital Structures (6) |
| ||||||||
Capitalization |
| Equity |
| 0.90 |
| 0.93 |
| 0.96 |
| 0.99 |
| 1.02 |
|
0.0 | % | 0.0 | % | 11.0 | % | 11.2 | % | 11.4 | % | 11.6 | % | 11.8 | % |
6.7 | % | 7.1 | % | 11.3 | % | 11.5 | % | 11.7 | % | 11.9 | % | 12.2 | % |
13.3 | % | 15.4 | % | 11.6 | % | 11.8 | % | 12.1 | % | 12.3 | % | 12.5 | % |
20.0 | % | 25.0 | % | 12.0 | % | 12.2 | % | 12.5 | % | 12.7 | % | 13.0 | % |
26.7 | % | 36.4 | % | 12.4 | % | 12.7 | % | 13.0 | % | 13.2 | % | 13.5 | % |
33.4 | % | 50.0 | % | 13.0 | % | 13.3 | % | 13.5 | % | 13.8 | % | 14.1 | % |
|
|
|
|
|
|
|
|
|
|
|
|
|
|
Pro Forma for Recapitalization | |||||||||||||
44.4 | % | 80.0 | % | 14.2 | % | 14.5 | % | 14.8 | % | 15.1 | % | 15.4 | % |
47.4 | % | 90.0 | % | 14.6 | % | 14.9 | % | 15.2 | % | 15.6 | % | 15.9 | % |
49.3 | % | 97.4 | % | 14.9 | % | 15.2 | % | 15.5 | % | 15.9 | % | 16.2 | % |
50.0 | % | 100.0 | % | 15.0 | % | 15.3 | % | 15.6 | % | 16.0 | % | 16.3 | % |
52.4 | % | 110.0 | % | 15.4 | % | 15.7 | % | 16.1 | % | 16.4 | % | 16.8 | % |
Capital Structures
Net Debt/ |
| Net Debt/ |
| Est. Cost |
| WACC at Various Unlevered Beta and Capital Structures (7) |
| ||||||||
Capitalization |
| Equity |
| of Debt |
| 0.90 |
| 0.93 |
| 0.96 |
| 0.99 |
| 1.02 |
|
0.0 | % | 0.0 | % | 6.00 | % | 11.0 | % | 11.2 | % | 11.4 | % | 11.6 | % | 11.8 | % |
6.7 | % | 7.1 | % | 6.50 | % | 10.8 | % | 11.0 | % | 11.2 | % | 11.4 | % | 11.6 | % |
13.3 | % | 15.4 | % | 7.00 | % | 10.6 | % | 10.8 | % | 11.0 | % | 11.2 | % | 11.4 | % |
20.0 | % | 25.0 | % | 7.50 | % | 10.5 | % | 10.7 | % | 10.9 | % | 11.1 | % | 11.3 | % |
26.7 | % | 36.4 | % | 8.00 | % | 10.4 | % | 10.6 | % | 10.8 | % | 11.0 | % | 11.2 | % |
33.4 | % | 50.0 | % | 8.50 | % | 10.4 | % | 10.6 | % | 10.8 | % | 11.0 | % | 11.1 | % |
* Excluded from averages.
(1) Historical spread between the long bond and the S&P 500. Source: Ibbotson & Sinquefeld 2006 Yearbook.
(2) Adjusted Beta. Source: Merrill Lynch Beta Book for all but Rockwood (Bloomberg) as of December 14, 2006.
(3) Book Value of Net Debt to Market Value of Equity.
(4) Unlevered Beta equals (Levered Beta/(1 + ((1 - Tax Rate) * Debt/Equity)). Assumes Beta of debt equals zero.
(5) Unlevered Return equals (Estimated Future Risk Free Rate + (Unlevered Beta * Risk Premium)).
(6) Levered Cost of Equity equals (Estimated Future Risk Free Rate + (Levered Beta * Risk Premium)).
(7) WACC equals ((Net Debt/Capitalization * (Cost of Debt * (1 - Tax Rate))) + (Equity/Capitalization * Levered Cost of Equity)).
18
Recapitalization Transaction
Recapitalization Transaction Overview
Overview
• $575mm self-tender (assumed maximum leverage scenario for recapitalization transaction)
• Pro forma total debt / 2006E EBITDA of 5.75x, still targeting a B+/B1 ratings outcome
• Per share purchase price of $37.00 analyzed at various levels of shareholder participation
• Represents 50% of shares outstanding
Sources & Uses
Sources of Funds |
| Amount |
| |
Existing Cash |
| $ | 105 |
|
Revolver |
| 0 |
| |
Term Loan B (L + 250 bps) |
| 500 |
| |
Sr. Notes (10.25%) |
| 310 |
| |
Total Sources |
| $ | 915 |
|
|
|
|
| |
Uses of Funds |
| Amount |
| |
Refinance Debt |
| 300 |
| |
Share Repurchase |
| 575 |
| |
Financing Fees |
| 17 |
| |
Redemption Premium |
| 14 |
| |
Transaction Costs |
| 10 |
| |
Total Uses |
| $ | 915 |
|
Pro Forma Capitalization
|
| Pre-Recap |
| Adjustment |
| Pro Forma |
| |||
Cash and cash equivalents |
| $ | 125 |
| $ | (105 | ) | $ | 20 |
|
Existing Debt |
| 302 |
| (300 | ) | 2 |
| |||
Revolver |
| 0 |
| 0 |
| 0 |
| |||
Term Loan B (L + 2.50%) |
| 0 |
| 500 |
| 500 |
| |||
Senior Notes (10.25%) |
| 0 |
| 310 |
| 310 |
| |||
Total Debt |
| $ | 302 |
|
|
| $ | 812 |
| |
Net Debt |
| $ | 177 |
|
|
| $ | 792 |
| |
|
|
|
|
|
|
|
| |||
2006E EBITDA |
| $ | 142 |
|
|
| $ | 142 |
| |
Interest |
| 26 |
| 44 |
| 69 |
| |||
Equity |
| $ | 393 |
| (598 | ) | $ | (206 | ) | |
|
|
|
|
|
|
|
| |||
Total Debt / EBITDA |
| 2.1 | x |
|
| 5.7 | x | |||
Total Debt to Capitalization |
| 43.4 | % |
|
| 133.9 | % | |||
EBITDA / Interest |
| 5.5 | x |
|
| 2.0 | x | |||
Rating (S&P / Moody’s) |
| BB+ / Ba2 |
|
|
| B+ / B1 |
| |||
Note: Existing debt includes approximately $2mm of capital leases.
19
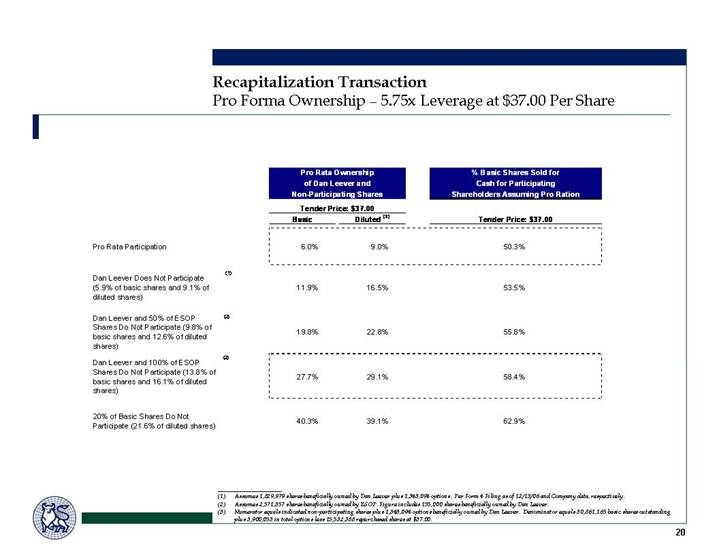
Pro Forma Ownership – 5.75x Leverage at $37.00 Per Share
|
| Pro Rata Ownership |
| % Basic Shares Sold for |
| ||
|
| Tender Price: $ 37.00 |
|
|
| ||
|
| Basic |
| Diluted (3) |
| Tender Price: $ 37.00 |
|
|
|
|
|
|
|
|
|
Pro Rata Participation |
| 6.0 | % | 9.0 | % | 50.3 | % |
|
|
|
|
|
|
|
|
Dan Leever Does Not Participate (5.9% of basic shares and 9.1% of diluted shares) (1) |
| 11.9 | % | 16.5 | % | 53.5 | % |
|
|
|
|
|
|
|
|
Dan Leever and 50% of ESOP Shares Do Not Participate (9.8% of basic shares and 12.6% of diluted shares) (2) |
| 19.8 | % | 22.8 | % | 55.8 | % |
|
|
|
|
|
|
|
|
Dan Leever and 100% of ESOP Shares Do Not Participate (13.8% of basic shares and 16.1% of diluted shares) (2) |
| 27.7 | % | 29.1 | % | 58.4 | % |
|
|
|
|
|
|
|
|
20% of Basic Shares Do Not Participate (21.6% of diluted shares) |
| 40.3 | % | 39.1 | % | 62.9 | % |
(1) Assumes 1,829,979 shares beneficially owned by Dan Leever plus 1,343,094 options. Per Form 4 Filing as of 12/13/06 and Company data, respectively.
(2) Assumes 2,571,357 shares beneficially owned by ESOP. Figure includes 155,000 shares beneficially owned by Dan Leever.
(3) Numerator equals indicated non-participating shares plus 1,343,094 options beneficially owned by Dan Leever. Denominator equals 30,861,165 basic shares outstanding plus 3,900,053 in total options less 15,532,388 repurchased shares at $37.00.
20
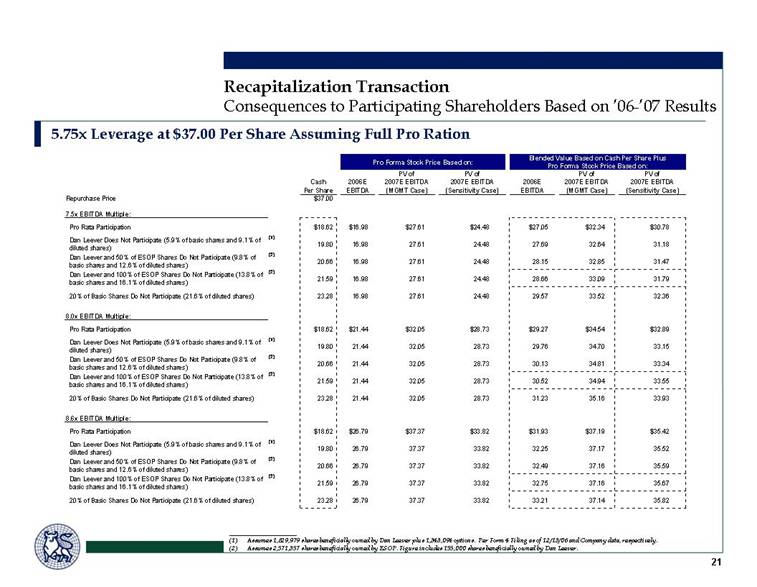
Consequences to Participating Shareholders Based on ‘06-‘07 Results
5.75x Leverage at $37.00 Per Share Assuming Full Pro Ration
|
| Pro Forma Stock Price Based on: |
| Blended Value Based on Cash Per Share Plus |
| |||||||||||||||||
|
|
|
|
|
| PV of |
| PV of |
|
|
| PV of |
| PV of |
| |||||||
|
| Cash |
| 2006E |
| 2007E EBITDA |
| 2007E EBITDA |
| 2006E |
| 2007E EBITDA |
| 2007E EBITDA |
| |||||||
|
| Per Share |
| EBITDA |
| (MGMT Case) |
| (Sensitivity Case) |
| EBITDA |
| (MGMT Case) |
| (Sensitivity Case) |
| |||||||
Repurchase Price |
| $ | 37.00 |
|
|
|
|
|
|
|
|
|
|
|
|
| ||||||
|
|
|
|
|
|
|
|
|
|
|
|
|
|
|
| |||||||
7.5x EBITDA Multiple: |
|
|
|
|
|
|
|
|
|
|
|
|
|
|
| |||||||
Pro Rata Participation |
| $ | 18.62 |
| $ | 16.98 |
| $ | 27.61 |
| $ | 24.48 |
| $ | 27.05 |
| $ | 32.34 |
| $ | 30.78 |
|
Dan Leever Does Not Participate (5.9% of basic shares and 9.1% of diluted shares) (1) |
| 19.80 |
| 16.98 |
| 27.61 |
| 24.48 |
| 27.69 |
| 32.64 |
| 31.18 |
| |||||||
Dan Leever and 50% of ESOP Shares Do Not Participate (9.8% of basic shares and 12.6% of diluted shares) (2) |
| 20.66 |
| 16.98 |
| 27.61 |
| 24.48 |
| 28.15 |
| 32.85 |
| 31.47 |
| |||||||
Dan Leever and 100% of ESOP Shares Do Not Participate (13.8% of basic shares and 16.1% of diluted shares) (2) |
| 21.59 |
| 16.98 |
| 27.61 |
| 24.48 |
| 28.66 |
| 33.09 |
| 31.79 |
| |||||||
20% of Basic Shares Do Not Participate (21.6% of diluted shares) |
| 23.28 |
| 16.98 |
| 27.61 |
| 24.48 |
| 29.57 |
| 33.52 |
| 32.36 |
| |||||||
|
|
|
|
|
|
|
|
|
|
|
|
|
|
|
| |||||||
8.0x EBITDA Multiple: |
|
|
|
|
|
|
|
|
|
|
|
|
|
|
| |||||||
Pro Rata Participation |
| $ | 18.62 |
| $ | 21.44 |
| $ | 32.05 |
| $ | 28.73 |
| $ | 29.27 |
| $ | 34.54 |
| $ | 32.89 |
|
Dan Leever Does Not Participate (5.9% of basic shares and 9.1% of diluted shares) (1) |
| 19.80 |
| 21.44 |
| 32.05 |
| 28.73 |
| 29.76 |
| 34.70 |
| 33.15 |
| |||||||
Dan Leever and 50% of ESOP Shares Do Not Participate (9.8% of basic shares and 12.6% of diluted shares) (2) |
| 20.66 |
| 21.44 |
| 32.05 |
| 28.73 |
| 30.13 |
| 34.81 |
| 33.34 |
| |||||||
Dan Leever and 100% of ESOP Shares Do Not Participate (13.8% of basic shares and 16.1% of diluted shares) (2) |
| 21.59 |
| 21.44 |
| 32.05 |
| 28.73 |
| 30.52 |
| 34.94 |
| 33.55 |
| |||||||
20% of Basic Shares Do Not Participate (21.6% of diluted shares) |
| 23.28 |
| 21.44 |
| 32.05 |
| 28.73 |
| 31.23 |
| 35.16 |
| 33.93 |
| |||||||
|
|
|
|
|
|
|
|
|
|
|
|
|
|
|
| |||||||
8.6x EBITDA Multiple: |
|
|
|
|
|
|
|
|
|
|
|
|
|
|
| |||||||
Pro Rata Participation |
| $ | 18.62 |
| $ | 26.79 |
| $ | 37.37 |
| $ | 33.82 |
| $ | 31.93 |
| $ | 37.19 |
| $ | 35.42 |
|
Dan Leever Does Not Participate (5.9% of basic shares and 9.1% of diluted shares) (1) |
| 19.80 |
| 26.79 |
| 37.37 |
| 33.82 |
| 32.25 |
| 37.17 |
| 35.52 |
| |||||||
Dan Leever and 50% of ESOP Shares Do Not Participate (9.8% of basic shares and 12.6% of diluted shares) (2) |
| 20.66 |
| 26.79 |
| 37.37 |
| 33.82 |
| 32.49 |
| 37.16 |
| 35.59 |
| |||||||
Dan Leever and 100% of ESOP Shares Do Not Participate (13.8% of basic shares and 16.1% of diluted shares) (2) |
| 21.59 |
| 26.79 |
| 37.37 |
| 33.82 |
| 32.75 |
| 37.16 |
| 35.67 |
| |||||||
20% of Basic Shares Do Not Participate (21.6% of diluted shares) |
| 23.28 |
| 26.79 |
| 37.37 |
| 33.82 |
| 33.21 |
| 37.14 |
| 35.82 |
| |||||||
(1) Assumes 1,829,979 shares beneficially owned by Dan Leever plus 1,343,094 options. Per Form 4 Filing as of 12/13/06 and Company data, respectively.
(2) Assumes 2,571,357 shares beneficially owned by ESOP. Figure includes 155,000 shares beneficially owned by Dan Leever.
21
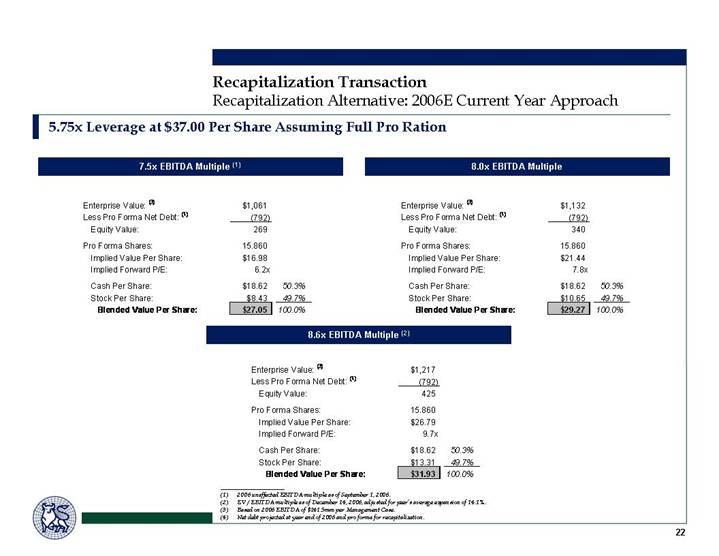
Recapitalization Alternative: 2006E Current Year Approach
5.75x Leverage at $37.00 Per Share Assuming Full Pro Ration
7.5x EBITDA Multiple (1)
Enterprise Value: (3) |
| $ | 1,061 |
|
|
|
Less Pro Forma Net Debt: (4) |
| (792 | ) |
|
| |
Equity Value: |
| 269 |
|
|
| |
Pro Forma Shares: |
| 15.860 |
|
|
| |
Implied Value Per Share: |
| $ | 16.98 |
|
|
|
Implied Forward P/E: |
| 6.2 | x |
|
| |
Cash Per Share: |
| $ | 18.62 |
| 50.3 | % |
Stock Per Share: |
| $ | 8.43 |
| 49.7 | % |
Blended Value Per Share: |
| $ | 27.05 |
| 100.0 | % |
8.0x EBITDA Multiple
Enterprise Value: (3) |
| $ | 1,132 |
|
|
|
Less Pro Forma Net Debt: (4) |
| (792 | ) |
|
| |
Equity Value: |
| 340 |
|
|
| |
Pro Forma Shares: |
| 15.860 |
|
|
| |
Implied Value Per Share: |
| $ | 21.44 |
|
|
|
Implied Forward P/E: |
| 7.8 | x |
|
| |
Cash Per Share: |
| $ | 18.62 |
| 50.3 | % |
Stock Per Share: |
| $ | 10.65 |
| 49.7 | % |
Blended Value Per Share: |
| $ | 29.27 |
| 100.0 | % |
8.6x EBITDA Multiple (2)
Enterprise Value: (3) |
| $ | 1,217 |
|
|
|
Less Pro Forma Net Debt: (4) |
| (792 | ) |
|
| |
Equity Value: |
| 425 |
|
|
| |
Pro Forma Shares: |
| 15.860 |
|
|
| |
Implied Value Per Share: |
| $ | 26.79 |
|
|
|
Implied Forward P/E: |
| 9.7 | x |
|
| |
Cash Per Share: |
| $ | 18.62 |
| 50.3 | % |
Stock Per Share: |
| $ | 13.31 |
| 49.7 | % |
Blended Value Per Share: |
| $ | 31.93 |
| 100.0 | % |
(1) 2006 unaffected EBITDA multiple as of September 1, 2006.
(2) EV / EBITDA multiple as of December 14, 2006, adjusted for peer’s average expansion of 14.1%.
(3) Based on 2006 EBITDA of $141.5mm per Management Case.
(4) Net debt projected at year end of 2006 and pro forma for recapitalization.
22
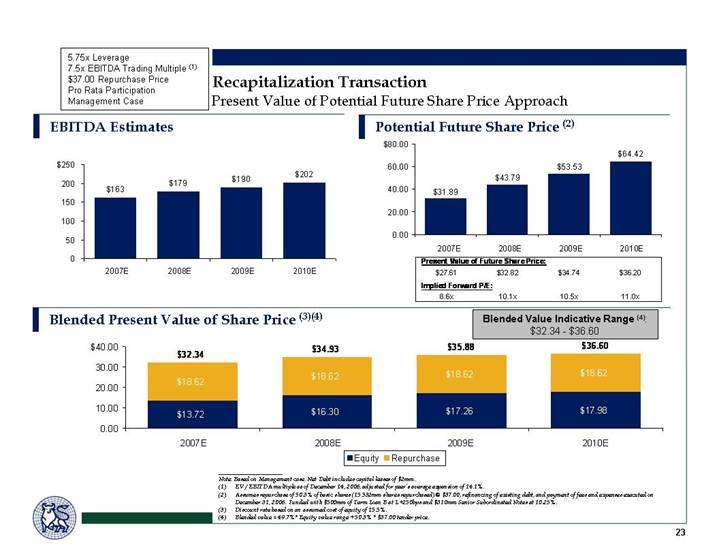
Present Value of Potential Future Share Price Approach
5.75x Leverage
7.5x EBITDA Trading Multiple (1)
$37.00 Repurchase Price
Pro Rata Participation
Management Case
EBITDA Estimates
[CHART]
Potential Future Share Price (2)
[CHART]
Present Value of Future Share Price: | |||||||||||
| |||||||||||
$ | 27.61 |
| $ | 32.82 |
| $ | 34.74 |
| $ | 36.20 |
|
|
|
|
|
|
|
|
| ||||
Implied Forward P/E: | |||||||||||
| |||||||||||
8.6 | x | 10.1 | x | 10.5 | x | 11.0 | x | ||||
Blended Present Value of Share Price (3)(4)
[CHART]
Blended Value Indicative Range (4):
$32.34 - $36.60
Note: Based on Management case. Net Debt includes capital leases of $2mm.
(1) EV / EBITDA multiple as of December 14, 2006, adjusted for peer’s average expansion of 14.1%.
(2) Assumes repurchase of 50.3% of basic shares (15.532mm shares repurchased) @ $37.00, refinancing of existing debt, and payment of fees and expenses executed on December 31, 2006. Funded with $500mm of Term Loan B at L+250bps and $310mm Senior Subordinated Notes at 10.25%.
(3) Discount rate based on an assumed cost of equity of 15.5%.
(4) Blended value = 49.7%* Equity value range + 50.3% * $37.00 tender price.
23
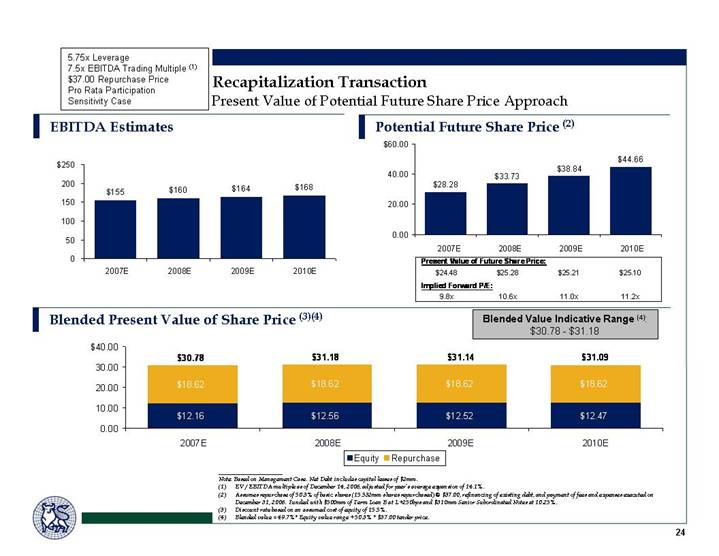
5.75x Leverage
7.5x EBITDA Trading Multiple (1)
$37.00 Repurchase Price
Pro Rata Participation
Sensitivity Case
EBITDA Estimates
[CHART]
Potential Future Share Price (2)
[CHART]
Present Value of Future Share Price: | |||||||||||
| |||||||||||
$ | 24.48 |
| $ | 25.28 |
| $ | 25.21 |
| $ | 25.10 |
|
|
|
|
|
|
|
|
| ||||
Implied Forward P/E: | |||||||||||
| |||||||||||
9.8 | x | 10.6 | x | 11.0 | x | 11.2 | x | ||||
Blended Present Value of Share Price (3)(4)
[CHART]
Blended Value Indicative Range (4):
$30.78 - $31.18
Note: Based on Management Case. Net Debt includes capital leases of $2mm.
(1) EV / EBITDA multiple as of December 14, 2006, adjusted for peer’s average expansion of 14.1%.
(2) Assumes repurchase of 50.3% of basic shares (15.532mm shares repurchased) @ $37.00, refinancing of existing debt, and payment of fees and expenses executed on December 31, 2006. Funded with $500mm of Term Loan B at L+250bps and $310mm Senior Subordinated Notes at 10.25%.
(3) Discount rate based on an assumed cost of equity of 15.5%.
(4) Blended value = 49.7%* Equity value range + 50.3% * $37.00 tender price.
24
5.75x Leverage
8.6x EBITDA Trading Multiple (1)
$37.00 Repurchase Price
Pro Rata Participation
Management Case
EBITDA Estimates
[CHART]
Potential Future Share Price (2)
[CHART]
Present Value of Future Share Price: | |||||||||||
|
|
|
|
|
|
|
| ||||
$ | 37.37 |
| $ | 42.15 |
| $ | 43.31 |
| $ | 44.08 |
|
|
|
|
|
|
|
|
| ||||
Implied Forward P/E: | |||||||||||
|
|
|
|
|
|
|
| ||||
11.7 | x | 12.9 | x | 13.1 | x | 13.3 | x | ||||
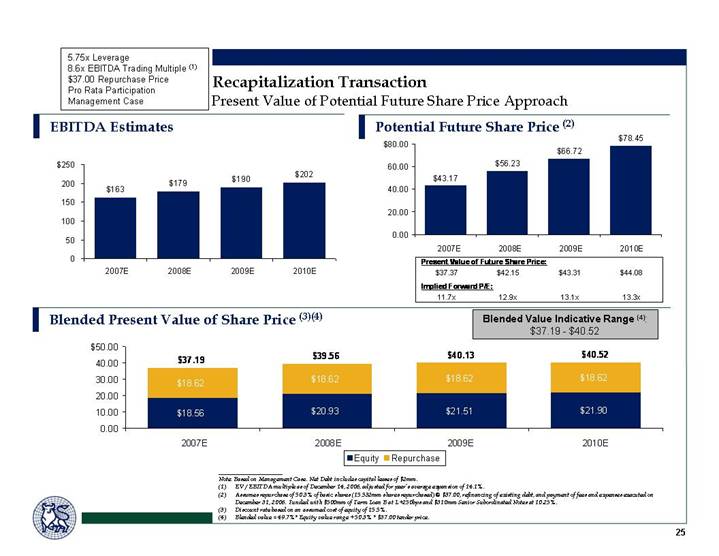
Blended Present Value of Share Price (3)(4)
[CHART]
Blended Value Indicative Range (4):
$37.19 - $40.52
Note: Based on Management Case. Net Debt includes capital leases of $2mm.
(1) EV / EBITDA multiple as of December 14, 2006, adjusted for peer’s average expansion of 14.1%.
(2) Assumes repurchase of 50.3% of basic shares (15.532mm shares repurchased) @ $37.00, refinancing of existing debt, and payment of fees and expenses executed on December 31, 2006. Funded with $500mm of Term Loan B at L+250bps and $310mm Senior Subordinated Notes at 10.25%.
(3) Discount rate based on an assumed cost of equity of 15.5%.
(4) Blended value = 49.7%* Equity value range + 50.3% * $37.00 tender price.
25
5.75x Leverage
8.6x EBITDA Trading Multiple (1)
$37.00 Repurchase Price
Pro Rata Participation
Sensitivity Case
EBITDA Estimates
[CHART]
Potential Future Share Price (2)
[CHART]
Present Value of Future Share Price: | |||||||||||
|
|
|
|
|
|
|
| ||||
$ | 33.82 |
| $ | 33.61 |
| $ | 32.58 |
| $ | 31.65 |
|
|
|
|
|
|
|
|
| ||||
Implied Forward P/E: | |||||||||||
|
|
|
|
|
|
|
| ||||
13.5 | x | 14.1 | x | 14.2 | x | 14.1x |
| ||||
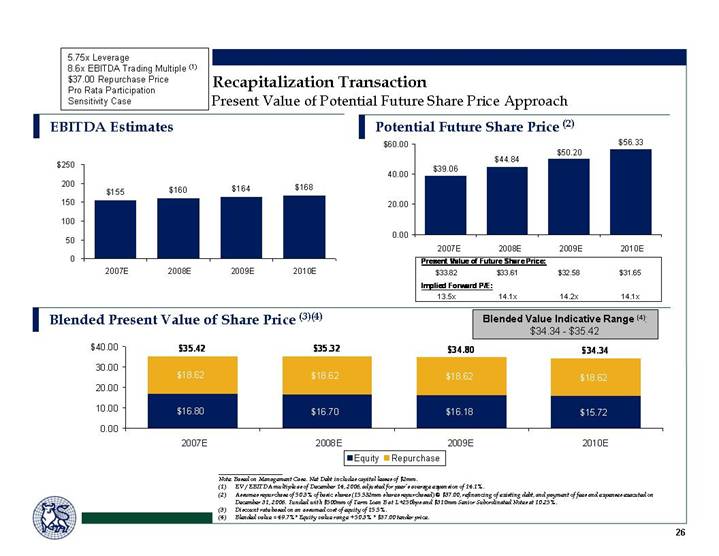
Blended Present Value of Share Price (3)(4)
[CHART]
Blended Value Indicative Range (4):
$34.34 - $35.42
Note: Based on Management Case. Net Debt includes capital leases of $2mm.
(1) EV / EBITDA multiple as of December 14, 2006, adjusted for peer’s average expansion of 14.1%.
(2) Assumes repurchase of 50.3% of basic shares (15.532mm shares repurchased) @ $37.00, refinancing of existing debt, and payment of fees and expenses executed on December 31, 2006. Funded with $500mm of Term Loan B at L+250bps and $310mm Senior Subordinated Notes at 10.25%.
(3) Discount rate based on an assumed cost of equity of 15.5%.
(4) Blended value = 49.7%* Equity value range + 50.3% * $37.00 tender price.
26
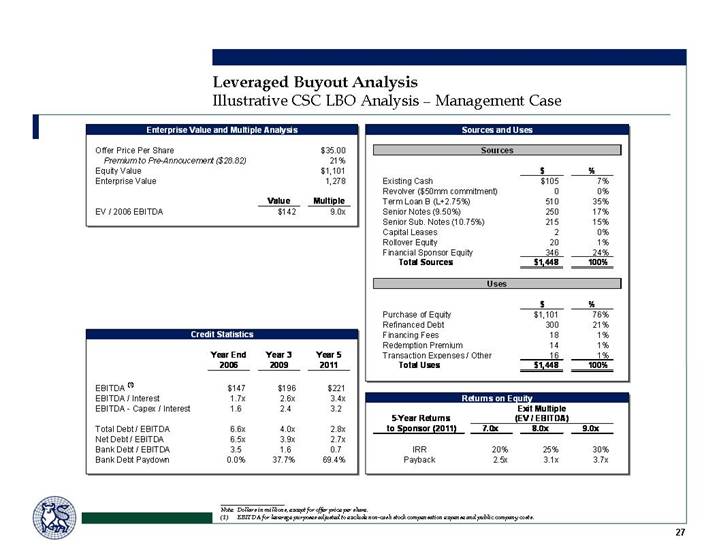
Leveraged Buyout Analysis
Illustrative CSC LBO Analysis – Management Case
Enterprise Value and Multiple Analysis
Offer Price Per Share |
|
|
| $ | 35.00 |
| |
Premium to Pre-Annoucement ($28.82) |
|
|
| 21 | % | ||
Equity Value |
|
|
| $ | 1,101 |
| |
Enterprise Value |
|
|
| 1,278 |
| ||
|
|
|
|
|
| ||
|
| Value |
| Multiple |
| ||
EV / 2006 EBITDA |
| $ | 142 |
| 9.0 | x | |
Credit Statistics
|
| Year End |
| Year 3 |
| Year 5 |
| |||
|
| 2006 |
| 2009 |
| 2011 |
| |||
|
|
|
|
|
|
|
| |||
EBITDA (1) |
| $ | 147 |
| $ | 196 |
| $ | 221 |
|
EBITDA / Interest |
| 1.7 | x | 2.6 | x | 3.4 | x | |||
EBITDA - Capex / Interest |
| 1.6 |
| 2.4 |
| 3.2 |
| |||
|
|
|
|
|
|
|
| |||
Total Debt / EBITDA |
| 6.6 | x | 4.0 | x | 2.8 | x | |||
Net Debt / EBITDA |
| 6.5 | x | 3.9 | x | 2.7 | x | |||
Bank Debt / EBITDA |
| 3.5 |
| 1.6 |
| 0.7 |
| |||
Bank Debt Paydown |
| 0.0 | % | 37.7 | % | 69.4 | % | |||
Sources and Uses
Sources
|
| $ |
| % |
| |
Existing Cash |
| $ | 105 |
| 7 | % |
Revolver ($50mm commitment) |
| 0 |
| 0 | % | |
Term Loan B (L+2.75%) |
| 510 |
| 35 | % | |
Senior Notes (9.50%) |
| 250 |
| 17 | % | |
Senior Sub. Notes (10.75%) |
| 215 |
| 15 | % | |
Capital Leases |
| 2 |
| 0 | % | |
Rollover Equity |
| 20 |
| 1 | % | |
Financial Sponsor Equity |
| 346 |
| 24 | % | |
Total Sources |
| $ | 1,448 |
| 100 | % |
|
|
|
|
|
| |
Uses | ||||||
|
|
|
|
|
| |
|
| $ |
| % |
| |
Purchase of Equity |
| $ | 1,101 |
| 76 | % |
Refinanced Debt |
| 300 |
| 21 | % | |
Financing Fees |
| 18 |
| 1 | % | |
Redemption Premium |
| 14 |
| 1 | % | |
Transaction Expenses / Other |
| 16 |
| 1 | % | |
Total Uses |
| $ | 1,448 |
| 100 | % |
Returns on Equity
5-Year Returns |
| Exit Multiple |
| ||||
to Sponsor (2011) |
| 7.0x |
| 8.0x |
| 9.0x |
|
|
|
|
|
|
|
|
|
IRR |
| 20 | % | 25 | % | 30 | % |
Payback |
| 2.5 | x | 3.1 | x | 3.7 | x |
Note: Dollars in millions, except for offer price per share.
(1) EBITDA for leverage purposes adjusted to exclude non-cash stock compensation expense and public company costs.
27
Illustrative CSC LBO Analysis – Sensitivity Case
Enterprise Value and Multiple Analysis
Offer Price Per Share |
|
|
| $ | 35.00 |
| |
Premium to Pre-Annoucement ($28.82) |
|
|
| 21 | % | ||
Equity Value |
|
|
| $ | 1,101 |
| |
Enterprise Value |
|
|
| 1,278 |
| ||
|
|
|
|
|
| ||
|
| Value |
| Multiple |
| ||
EV / 2006 EBITDA |
| $ | 142 |
| 9.0x |
| |
Credit Statistics
|
| Year End |
| Year 3 |
| Year 5 |
| |||
|
| 2006 |
| 2009 |
| 2011 |
| |||
|
|
|
|
|
|
|
| |||
EBITDA (1) |
| $ | 147 |
| $ | 170 |
| $ | 181 |
|
EBITDA / Interest |
| 1.7 | x | 2.2 | x | 2.6 | x | |||
EBITDA - Capex / Interest |
| 1.6 |
| 2.0 |
| 2.4 |
| |||
|
|
|
|
|
|
|
| |||
Total Debt / EBITDA |
| 6.6 | x | 4.8 | x | 3.9 | x | |||
Net Debt / EBITDA |
| 6.5 | x | 4.7 | x | 3.8 | x | |||
Bank Debt / EBITDA |
| 3.5 |
| 2.1 |
| 1.3 |
| |||
Bank Debt Paydown |
| 0.0 | % | 31.2 | % | 53.0 | % | |||
Sources and Uses
Sources
|
| $ |
| % |
| |
Existing Cash |
| $ | 105 |
| 7 | % |
Revolver ($50mm commitment) |
| 0 |
| 0 | % | |
Term Loan B (L+2.75%) |
| 510 |
| 35 | % | |
Senior Notes (9.50%) |
| 250 |
| 17 | % | |
Senior Sub. Notes (10.75%) |
| 215 |
| 15 | % | |
Capital Leases |
| 2 |
| 0 | % | |
Rollover Equity |
| 20 |
| 1 | % | |
Financial Sponsor Equity |
| 346 |
| 24 | % | |
Total Sources |
| $ | 1,448 |
| 100 | % |
Uses
|
| $ |
| % |
| |
Purchase of Equity |
| $ | 1,101 |
| 76 | % |
Refinanced Debt |
| 300 |
| 21 | % | |
Financing Fees |
| 18 |
| 1 | % | |
Redemption Premium |
| 14 |
| 1 | % | |
Transaction Expenses / Other |
| 16 |
| 1 | % | |
Total Uses |
| $ | 1,448 |
| 100 | % |
Returns on Equity
|
| Exit Multiple |
| |||||
5-Year Returns |
| (EV / EBITDA) |
| |||||
to Sponsor (2011) |
| 7.0x |
| 8.0x |
| 9.0x |
| |
|
|
|
|
|
|
|
| |
IRR |
|
| 9 | % | 15 | % | 20 | % |
Payback |
|
| 1.5 | x | 2.0 | x | 2.5 | x |
Note: Dollars in millions, except for offer price per share.
(1) EBITDA for leverage purposes adjusted to exclude non-cash stock compensation expense and public company costs.
28
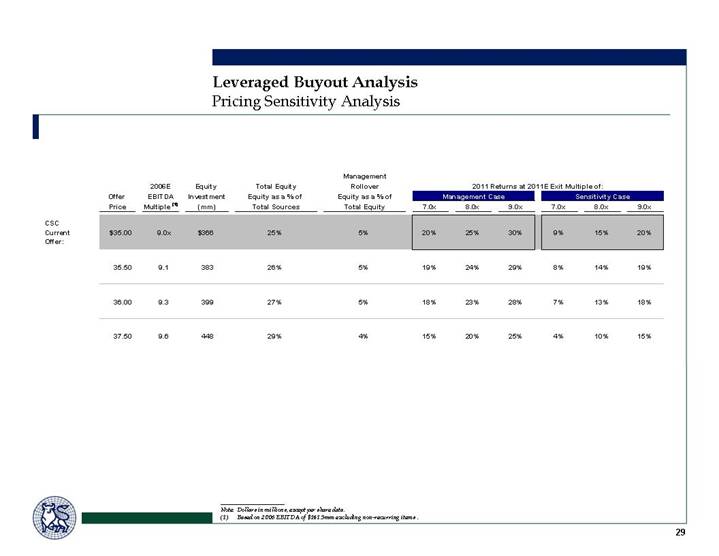
Pricing Sensitivity Analysis
|
|
|
|
|
|
|
|
|
| Management |
|
|
|
|
|
|
|
|
|
|
|
|
| ||
|
|
|
| 2006E |
| Equity |
| Total Equity |
| Rollover |
| 2011 Returns at 2011E Exit Multiple of: |
| ||||||||||||
|
| Offer |
| EBITDA |
| Investment |
| Equity as a % of |
| Equity as a % of |
| Management Case |
| Sensitivity Case |
| ||||||||||
|
| Price |
| Multiple (1) |
| (mm) |
| Total Sources |
| Total Equity |
| 7.0x |
| 8.0x |
| 9.0x |
| 7.0x |
| 8.0x |
| 9.0x |
| ||
|
|
|
|
|
|
|
|
|
|
|
|
|
|
|
|
|
|
|
|
|
|
|
| ||
CSC |
| $ | 35.00 |
| 9.0 | x | $ | 366 |
| 25 | % | 5 | % | 20 | % | 25 | % | 30 | % | 9 | % | 15 | % | 20 | % |
|
|
|
|
|
|
|
|
|
|
|
|
|
|
|
|
|
|
|
|
|
|
|
| ||
|
| 35.50 |
| 9.1 |
| 383 |
| 26 | % | 5 | % | 19 | % | 24 | % | 29 | % | 8 | % | 14 | % | 19 | % | ||
|
|
|
|
|
|
|
|
|
|
|
|
|
|
|
|
|
|
|
|
|
|
|
| ||
|
| 36.00 |
| 9.3 |
| 399 |
| 27 | % | 5 | % | 18 | % | 23 | % | 28 | % | 7 | % | 13 | % | 18 | % | ||
|
|
|
|
|
|
|
|
|
|
|
|
|
|
|
|
|
|
|
|
|
|
|
| ||
|
| 37.50 |
| 9.6 |
| 448 |
| 29 | % | 4 | % | 15 | % | 20 | % | 25 | % | 4 | % | 10 | % | 15 | % | ||
Note: Dollars in millions, except per share data.
(1) Based on 2006 EBITDA of $141.5mm excluding non-recurring items .
29
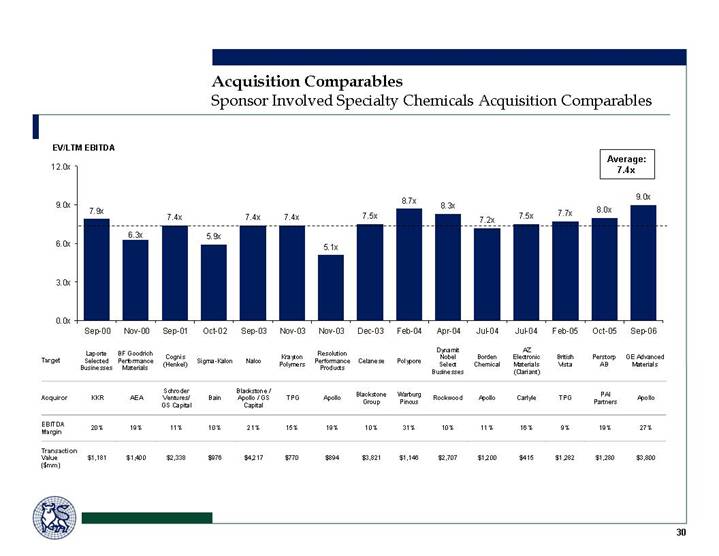
Acquisition Comparables
Sponsor Involved Specialty Chemicals Acquisition Comparables
[CHART]
|
| Laporte |
| BF Goodrich |
| Cognis |
|
|
|
|
| Krayton |
| Resolution |
|
|
| ||||||||
Target |
| Selected |
| Performance |
| (Henkel) |
| Sigma-Kalon |
| Nalco |
| Polymers |
| performance |
| Celanese |
| ||||||||
|
| Businesses |
| Materials |
|
|
|
|
|
|
|
|
| Products |
|
|
| ||||||||
|
|
|
|
|
|
|
|
|
|
|
|
|
|
|
|
|
| ||||||||
|
|
|
|
|
| Schroder |
|
|
| Blackstone / |
|
|
|
|
| Blackstone |
| ||||||||
Acquiror |
| KKR |
| AEA |
| Ventures/ |
| Bain |
| Apollo / GS |
| TPG |
| Apollo |
| Groups |
| ||||||||
|
|
|
|
|
| GS Capital |
|
|
| Capital |
|
|
|
|
|
|
| ||||||||
|
|
|
|
|
|
|
|
|
|
|
|
|
|
|
|
|
| ||||||||
EBITDA Margin |
| 20 | % | 19 | % | 11 | % | 10 | % | 21 | % | 15 | % | 19 | % | 10 | % | ||||||||
|
|
|
|
|
|
|
|
|
|
|
|
|
|
|
|
|
| ||||||||
Transaction Value ($mm) |
| $ | 1,181 |
| $ | 1,400 |
| $ | 2,338 |
| $ | 976 |
| $ | 4,217 |
| $ | 770 |
| $ | 894 |
| $ | 3,821 |
|
|
|
|
| Dynamit |
|
|
| AZ |
|
|
|
|
|
|
| |||||||
Target |
| Polypore |
| Nobel |
| Borden |
| Electronic |
| British |
| Perstorp |
| GE Advanced |
| |||||||
|
|
|
| Select |
| Chemical |
| Materials |
| Vista |
| AB |
| Materials |
| |||||||
|
|
|
| Businesses |
|
|
| (Clariant) |
|
|
|
|
|
|
| |||||||
|
|
|
|
|
|
|
|
|
|
|
|
|
|
|
| |||||||
Acquiror |
| Warburg |
| Rockwood |
| Apollo |
| Carlyle |
| TPG |
| PAI |
| Apollo |
| |||||||
|
| Pincus |
|
|
|
|
|
|
|
|
| Partners |
|
|
| |||||||
|
|
|
|
|
|
|
|
|
|
|
|
|
|
|
| |||||||
EBITDA Margin |
| 31 | % | 10 | % | 11 | % | 16 | % | 9 | % | 19 | % | 27 | % | |||||||
|
|
|
|
|
|
|
|
|
|
|
|
|
|
|
| |||||||
Transaction Value ($mm) |
| $ | 1,146 |
| $ | 2,707 |
| $ | 1,200 |
| $ | 415 |
| $ | 1,282 |
| $ | 1,280 |
| $ | 3,800 |
|
30
Broader Specialty Chemicals Acquisition Comparables
[CHART]
Target |
| Degussa |
| Courtaulds |
| Morton |
| Witco |
| Celanese |
| Noveon |
| ||||||
|
|
|
|
|
|
|
|
|
|
|
|
|
| ||||||
Acquiror |
| Hüls |
| Akzo |
| Rohm & |
| Crompton |
| Blackstone |
| Lubrizol |
| ||||||
|
|
|
| Nobel |
| Haas |
| & Knowles |
| Group |
|
|
| ||||||
|
|
|
|
|
|
|
|
|
|
|
|
|
| ||||||
EBITDA Margin |
| 9 | % | 12 | % | 18 | % | 12 | % | 10 | % | 18 | % | ||||||
|
|
|
|
|
|
|
|
|
|
|
|
|
| ||||||
Transaction Value ($mm) |
| $ | 5,760 |
| $ | 3,824 |
| $ | 4,857 |
| $ | 2,029 |
| $ | 3,821 |
| $ | 1,840 |
|
|
| Dynamit |
| UCB Surface |
| Great |
| Degussa |
|
|
|
|
| ||||||
Target |
| Nobel Select |
| Specialities |
| Lakes |
| Construction |
| Engelhard |
| Uniqema |
| ||||||
|
| Businesses |
|
|
|
|
| Chemicals |
|
|
|
|
| ||||||
|
|
|
|
|
|
|
|
|
|
|
|
|
| ||||||
Acquiror |
| Rockwood |
| Cytec |
| Crompton |
| BASF |
| BASF |
| Croda |
| ||||||
|
|
|
|
|
|
|
|
|
|
|
|
|
| ||||||
EBITDA Margin |
| 10 | % | 11 | % | 11 | % | 14 | % | 9 | % | 8 | % | ||||||
|
|
|
|
|
|
|
|
|
|
|
|
|
| ||||||
Transaction Value ($mm) |
| $ | 2,707 |
| $ | 1,866 |
| $ | 2,213 |
| $ | 3,210 |
| $ | 5,600 |
| $ | 756 |
|
31
Electronics Chemicals Acquisition Comparables
[CHART]
|
|
|
| Isola |
| Johnson |
|
|
| Enthone- |
| Dexter |
| ||||||
Target |
| LeaRonal |
| Laminate |
| Matthey |
| Align-Rite |
| OMI |
| Electronics |
| ||||||
|
|
|
| Systems |
| Electronics |
|
|
|
|
|
|
| ||||||
|
|
|
|
|
|
|
|
|
|
|
|
|
| ||||||
Acquiror |
| Rohm & |
| Rütgers |
| Allied Signal |
| Photronics |
| Cookson |
| Loctite |
| ||||||
|
| Haas |
|
|
|
|
|
|
|
|
| (Henkel) |
| ||||||
|
|
|
|
|
|
|
|
|
|
|
|
|
| ||||||
EBITDA Margin |
| 16 | % | 11 | % | 10 | % | 28 | % | 10 | % | 15 | % | ||||||
|
|
|
|
|
|
|
|
|
|
|
|
|
| ||||||
Transaction Value ($mm) |
| $ | 424 |
| $ | 425 |
| $ | 655 |
| $ | 115 |
| $ | 503 |
| $ | 400 |
|
|
|
|
|
|
|
|
|
|
|
|
| Arch |
| ||||||
|
| Applied |
|
|
|
|
| AZ Electronic |
| Merck KGaA |
| Chemical |
| ||||||
Target |
| Science & |
| ChemFirst |
| Ashland |
| Materials |
| Electronic |
| Micro- |
| ||||||
|
| Techn. |
|
|
| Electronics |
| (Clariant) |
| Chemicals |
| electronic |
| ||||||
|
|
|
|
|
|
|
|
|
| Unit |
| Materials |
| ||||||
|
|
|
|
|
|
|
|
|
|
|
| Business |
| ||||||
|
|
|
|
|
|
|
|
|
|
|
|
|
| ||||||
Acquiror |
| MKS |
| DuPont |
| Air Products |
| Carlyle |
| BASF |
| Fuji Photo |
| ||||||
|
| Instruments |
|
|
|
|
|
|
|
|
| Film Co. |
| ||||||
|
|
|
|
|
|
|
|
|
|
|
|
|
| ||||||
EBITDA Margin |
| 16 | % | 14 | % | 18 | % | 16 | % | 18 | % | 10 | % | ||||||
|
|
|
|
|
|
|
|
|
|
|
|
|
| ||||||
Transaction Value ($mm) |
| $ | 244 |
| $ | 408 |
| $ | 300 |
| $ | 415 |
| $ | 352 |
| $ | 162 |
|
32
Printing Acquisition Comparables
[CHART]
Target |
| Polyfibron |
| PrimeSource |
|
|
|
|
| ||||
|
| Technologies |
| Corporation |
| Phoenix |
| Seven Worldwide |
| ||||
|
|
|
|
|
|
|
|
|
| ||||
Acquiror |
| MacDermid |
| Fuji Photo Film |
| Continental |
| Schawk Inc. |
| ||||
|
|
|
|
|
|
|
|
|
| ||||
EBITDA Margin |
| 24 | % | 3 | % | 8 | % | 5 | % | ||||
|
|
|
|
|
|
|
|
|
| ||||
Transaction Value ($mm) |
| $ | 294 |
| $ | 125 |
| $ | 709 |
| $ | 191 |
|
Target |
| Creo Inc. |
| VUTEK |
| Imagistics |
| Micro Inks |
| Southern Graphic |
| |||||
|
|
|
|
|
|
|
|
|
| Systems |
| |||||
|
|
|
|
|
|
|
|
|
|
|
| |||||
Acquiror |
| Eastman Kodak |
| Electronics for Imaging |
| Océ |
| Huber Group |
| CVC |
| |||||
|
|
|
|
|
|
|
|
|
|
|
| |||||
EBITDA Margin |
| 8 | % | 23 | % | 19 | % | 31 | % | 20 | % | |||||
|
|
|
|
|
|
|
|
|
|
|
| |||||
Transaction Value ($mm) |
| $ | 902 |
| $ | 281 |
| $ | 783 |
| $ | 377 |
| $ | 410 |
|
33
Disclaimers
Merrill Lynch prohibits (a) employees from, directly or indirectly, offering a favorable research rating or specific price target, or offering to change such rating or price target, as consideration or inducement for the receipt of business or for compensation, and (b) Research Analysts from being compensated for involvement in investment banking transactions except to the extent that such participation is intended to benefit investor clients.
This proposal is confidential, for your private use only, and may not be shared with others (other than your advisors) without Merrill Lynch’s written permission, except that you (and each of your employees, representatives or other agents) may disclose to any and all persons, without limitation of any kind, the tax treatment and tax structure of the proposal and all materials of any kind (including opinions or other tax analyses) that are provided to you relating to such tax treatment and tax structure. For purposes of the preceding sentence, tax refers to U.S. federal and state tax. This proposal is for discussion purposes only. Merrill Lynch is not an expert on, and does not render opinions regarding, legal, accounting, regulatory or tax matters. You should consult with your advisors concerning these matters before undertaking the proposed transaction.
34