Exhibit 99.1

| NEWSLINE |
1401 Blake Street • Denver, CO 80202 • Tel (720) 479 3062 |
Earnings Announcement
DENVER, COLORADO
AUGUST 9 th, 2006
FOR IMMEDIATE RELEASE
Second Quarter diluted earnings per share $0.49
MacDermid, Incorporated a worldwide manufacturer of proprietary specialty chemical products and materials for the electronics, metal finishing and printing industries (NYSE: MRD) today announced financial results for the second quarter ended June 30, 2006.
Second Quarter Operating Results
Sales of $ 207.3 million were $29.0 million higher, a 16.3% increase over the same period in 2005. The Autotype acquisition added $19.2 million compared with June 2005. Sales were strong in Advanced Surface Finishing reflecting demand in our Offshore products and share gain in North America. Foreign currency had a negligible affect on sales in the quarter.
The gross margin percentage declined from 44.9% to 44.1% mainly as a result of the inclusion of the results of our June 2005 acquisition of Autotype which has a lower gross margin percentage than our other businesses.
Operating expenses increased due to the inclusion of Autotype for a full quarter, an increase in our infrastructure in Asia and the absence of the $2.5 million litigation costs in the prior year period.
Operating profit increased by $ 4.4 million (18.7%) to $ 28.0 million. In June 2005 a charge was recorded in the amount of $2.5 million to settle litigation. Absent this expense in 2005 operating profit would have increased $1.9 million or 7.4%.
Diluted earnings per share of $0.49 were 25.6% higher than the $0.39 per share from operations in 2005. Absent the charge for litigation in 2005 the diluted earnings per share in 2005 would have been $0.45, and thus the increase would be $.04 or 8.9%.
Owner Earnings, a measure of free cash flow (defined below and shown in BOLD in the attached Condensed Consolidated Summary of Cash Flows), were $ 17.1 million. Our Cash balance at the end of the quarter was $99.0 million.
Year to date Operating Results
Sales of $ 407.6 million were $59.1 million higher, a 17.0% increase over the same period in 2005. Autotype added $43.8 million compared with last year. Year to date sales were strong in Advanced Surface Finishing reflecting share gain in North America and growth in Asia. Foreign currency had a small unfavorable affect on sales, reducing our reported sales by 1.8%.
The gross margin percentage declined from 45.2% to 44.1% mainly as a result the inclusion of the results of our June 2005 acquisition of Autotype which has a lower gross margin percentage than our other businesses.
Selling, technical and administrative expenses increased by $ 9.6 million due primarily to the inclusion of Autotype for a full two quarters this year, and the absence of the $2.5 litigation costs in the second quarter of last year.
Operating profit increased by $ 4.4 million (9.2%) to $ 52.5 million. In the first quarter of this year we had unusual charges of $1.9 million to recognize the costs for the investigation of a potential acquisition and $2.2 million for the loss on the disposal of assets.
Diluted earnings per share of $0.92 were 19.5% higher than the $0.77 per share in 2005.
Owner Earnings, a measure of free cash flow (defined below and shown in BOLD in the attached Condensed Consolidated Summary of Cash Flows), were $ 16.1 million versus $19.8 million last year to date.
Dan Leever Chairman and CEO said “we are pleased to see the underlying earnings continue at the levels of the first quarter. We view these results as satisfactory. Advanced Surface Finishing continues to perform well, especially in North America and Offshore Solutions. ASF Asia was disappointing as operating profits flattened year on year. In Printing Solutions there was some improvement in North American packaging as a result of better execution in the plants. Autotype continued to perform well. We are concerned about the remainder of the year, especially the summer quarter. Whereas local operating management is optimistic, long experience suggests caution in the current economic environment. ASF Asia flattened in the second quarter. There are uncertainties in North America especially surrounding the automotive industry. There are still substantial issues in Printing Solutions in packaging and with continuing weak end markets in offset and a weaker market for newspapers than we have seen. The summer quarter often is slower than the rest of the year for most of our businesses”.
Note:
Owner Earnings is calculated as Net Cash flows provided by operating activities (GAAP definition) less net capital expenditures. EBITDA comprises Earnings before Interest, Taxation, Depreciation and Amortization. This press release and additional financial information together with our reconciliation of GAAP to Non-GAAP numbers are available on our website.
Website: http://www.macdermid.com
| MacDermid, Incorporated |
| |
| NYSE - MRD |
| CUSIP 554273 10 2 |
August 9th, 2006
This report and other Corporation reports and statements describe many of the positive factors affecting the Corporation’s future business prospects. Investors should also be aware of factors that could have a negative impact on those prospects. These include political, economic or other conditions such as currency exchange rates, inflation rates, recessionary or expansive trends, taxes and regulations and laws affecting the business; competitive products, advertising, promotional and pricing activity; the degree of acceptance of new product introductions in the marketplace; technical difficulties which may arise with new product introductions; and the difficulty of forecasting sales at certain times in certain markets.
MacDermid, Incorporated
Condensed Consolidated Summary of Earnings
(Unaudited)
$ in thousands, except share and per share amounts
| | Three Months Ended | | Six Months Ended | |
| | June 30th | | June 30th | | June 30th | | June 30th | |
| | 2006 | | 2005 | | 2006 | | 2005 | |
| | | | | | | | | |
Proprietary sales | | $ | 197,829 | | $ | 169,273 | | $ | 389,546 | | $ | 329,458 | |
Other sales | | 9,428 | | 9,008 | | 18,069 | | 19,070 | |
Total net sales | | 207,257 | | 178,281 | | 407,615 | | 348,528 | |
| | | | | | | | | |
Gross margin | | 91,375 | | 80,026 | | 179,846 | | 157,679 | |
GM% | | 44.1 | % | 44.9 | % | 44.1 | % | 45.2 | % |
| | | | | | | | | |
Selling, technical and administrative | | 54,727 | | 49,521 | | 105,832 | | 96,191 | |
Research and development | | 7,996 | | 6,509 | | 15,300 | | 13,041 | |
Consulting fees for acquisition investigation | | — | | — | | 1,913 | | — | |
Loss on disposal of assets | | — | | — | | 2,224 | | — | |
Restructure/Purchase Acct. | | 622 | | 386 | | 2,107 | | 386 | |
| | | | | | | | | |
Operating profit | | 28,030 | | 23,610 | | 52,470 | | 48,061 | |
| | | | | | | | | |
Other income (expense), net | | (14 | ) | (622 | ) | (378 | ) | (592 | ) |
Interest (expense), net | | (6,622 | ) | (7,049 | ) | (12,458 | ) | (14,071 | ) |
| | | | | | | | | |
Earnings before income taxes | | 21,394 | | 15,939 | | 39,634 | | 33,398 | |
Income tax (expense) | | (5,859 | ) | (4,011 | ) | (10,820 | ) | (9,685 | ) |
| | | | | | | | | |
Net earnings | | $ | 15,535 | | $ | 11,928 | | $ | 28,814 | | $ | 23,713 | |
| | | | | | | | | |
Diluted earnings per share | | $ | 0.49 | | $ | 0.39 | | $ | 0.92 | | $ | 0.77 | |
| | | | | | | | | |
Diluted average common shares outstanding | | 31,402,758 | | 30,787,829 | | 31,234,851 | | 30,799,337 | |
MacDermid, Incorporated
Sales and Margins by Region
$ in thousands
| | Three Months Ended | | Six Months Ended | |
| | June 30th | | June 30th | | June 30th | | June 30th | |
| | 2006 | | 2005 | | 2006 | | 2005 | |
| | | | | | | | | |
Americas | | | | | | | | | |
Total net sales | | $ | 79,262 | | $ | 71,912 | | $ | 157,439 | | $ | 139,404 | |
Operating profit | | $ | 10,473 | | $ | 7,441 | | $ | 15,385 | | $ | 16,416 | |
OP % | | 13.2 | % | 10.3 | % | 9.8 | % | 11.8 | % |
| | | | | | | | | |
Europe | | | | | | | | | |
Total net sales | | $ | 74,853 | | $ | 62,731 | | $ | 146,079 | | $ | 125,241 | |
Operating profit | | $ | 7,893 | | $ | 7,503 | | $ | 16,825 | | $ | 16,220 | |
OP % | | 10.5 | % | 12.0 | % | 11.5 | % | 13.0 | % |
| | | | | | | | | |
Asia | | | | | | | | | |
Total net sales | | $ | 53,142 | | $ | 43,638 | | $ | 104,097 | | $ | 83,883 | |
Operating profit | | $ | 9,664 | | $ | 8,666 | | $ | 20,260 | | $ | 15,425 | |
OP % | | 18.2 | % | 19.9 | % | 19.5 | % | 18.4 | % |
| | | | | | | | | |
Consolidated Total | | | | | | | | | |
Total net sales | | $ | 207,257 | | $ | 178,281 | | $ | 407,615 | | $ | 348,528 | |
Operating profit | | $ | 28,030 | | $ | 23,610 | | $ | 52,470 | | $ | 48,061 | |
OP % | | 13.5 | % | 13.2 | % | 12.9 | % | 13.8 | % |
MacDermid, Incorporated
Sales and Margins by Group
$ in thousands
| | Three Months Ended | | Six Months Ended | |
| | June 30th | | June 30th | | June 30th | | June 30th | |
| | 2006 | | 2005 | | 2006 | | 2005 | |
| | | | | | | | | |
Advanced Surface Finishing | | | | | | | | | |
Total net sales | | $ | 122,095 | | $ | 103,333 | | $ | 239,256 | | $ | 202,474 | |
Operating profit | | $ | 18,709 | | $ | 16,705 | | $ | 36,050 | | $ | 30,840 | |
OP % | | 15.3 | % | 16.2 | % | 15.1 | % | 15.2 | % |
| | | | | | | | | |
Printing Solutions | | | | | | | | | |
Total net sales | | $ | 85,162 | | $ | 74,948 | | $ | 168,359 | | $ | 146,054 | |
Operating profit | | $ | 9,321 | | $ | 6,905 | | $ | 16,420 | | $ | 17,221 | |
OP % | | 10.9 | % | 9.2 | % | 9.8 | % | 11.8 | % |
| | | | | | | | | |
Consolidated Total | | | | | | | | | |
Total net sales | | $ | 207,257 | | $ | 178,281 | | $ | 407,615 | | $ | 348,528 | |
Operating profit | | $ | 28,030 | | $ | 23,610 | | $ | 52,470 | | $ | 48,061 | |
OP % | | 13.5 | % | 13.2 | % | 12.9 | % | 13.8 | % |
MacDermid, Incorporated
Condensed Consolidated Balance Sheets
$ in thousands
| | June 30th | | Dec 31st | |
| | 2006 | | 2005 | |
| | (Unaudited) | | (Restated and
Unaudited) | |
| | | | | |
Cash and cash equivalents | | $ | 99,041 | | $ | 80,932 | |
Accounts receivable, net | | 170,001 | | 155,718 | |
Inventories, net | | 115,886 | | 92,973 | |
Other current assets | | 29,299 | | 30,737 | |
Current Assets | | 414,227 | | 360,360 | |
| | | | | |
Property, plant & equipment, net | | 122,229 | | 123,229 | |
Goodwill | | 250,934 | | 242,935 | |
Intangibles | | 42,211 | | 40,916 | |
Other assets, net | | 52,019 | | 52,487 | |
Total assets | | $ | 881,620 | | $ | 819,927 | |
| | | | | |
Payables and accruals | | $ | 153,376 | | $ | 141,109 | |
Short-term debt | | 1,222 | | 730 | |
Current Liabilities | | 154,598 | | 141,839 | |
| | | | | |
Long-term debt | | 300,972 | | 301,043 | |
Other long-term liabilities | | 39,652 | | 37,968 | |
Total Liabilities | | 495,222 | | 480,850 | |
| | | | | |
Shareholders’ equity | | 386,398 | | 339,077 | |
| | | | | |
Total liabilities & shareholders’ equity | | $ | 881,620 | | $ | 819,927 | |
| | | | | |
Debt to total capital | | 44 | % | 47 | % |
MacDermid, Incorporated
Condensed Consolidated Summary of Cash Flows
(Unaudited)
$ in thousands
| | Three Months Ended | | Six Months Ended | |
| | June 30th | | June 30th | | June 30th | | June 30th | |
| | 2006 | | 2005 | | 2006 | | 2005 | |
| | | | | | | | | |
Net earnings | | $ | 15,535 | | $ | 11,928 | | $ | 28,814 | | $ | 23,713 | |
| | | | | | | | | |
Depreciation | | 5,016 | | 3,771 | | 9,913 | | 7,617 | |
Amortization | | 1,518 | | 897 | | 2,970 | | 1,788 | |
Provision for bad debt | | 110 | | 221 | | 573 | | 738 | |
Stock compensation expense | | 1,496 | | 1,873 | | 2,248 | | 4,050 | |
Deferred taxes | | 437 | | 462 | | 3,509 | | 625 | |
Restructuring/Purchase Adjustments | | 625 | | 386 | | 2,107 | | 386 | |
Working capital changes | | (4,303 | ) | 5,307 | | (29,198 | ) | (12,049 | ) |
Cash from operations | | 20,434 | | 24,845 | | 20,936 | | 26,868 | |
| | | | | | | | | |
Capital Expenditures | | (3,537 | ) | (4,820 | ) | (5,099 | ) | (7,826 | ) |
Proceeds from Asset Disposal | | 210 | | 762 | | 289 | | 778 | |
Net Capital Expenditures | | (3,327 | ) | (4,058 | ) | (4,810 | ) | (7,048 | ) |
| | | | | | | | | |
Owner earnings** | | 17,107 | | 20,787 | | 16,126 | | 19,820 | |
| | | | | | | | | |
Acquisition of business | | — | | (89,270 | ) | — | | (89,270 | ) |
Dividends paid | | (1,846 | ) | (1,819 | ) | (3,682 | ) | (3,031 | ) |
Increase/(decrease) in debt | | (1,284 | ) | 10,719 | | 287 | | 10,657 | |
Treasury shares | | 0 | | — | | 26 | | 33 | |
Other | | 2,027 | | (4,044 | ) | 5,352 | | (5,924 | ) |
| | | | | | | | | |
Increase/(decrease) in cash | | $ | 16,004 | | $ | (63,627 | ) | $ | 18,109 | | $ | (67,715 | ) |
**Note: Pro forma owner earnings adjusted for semi-annual bond interest payments would have been as follows: | | $ | 10,207 | | $ | 13,887 | | $ | 16,126 | | $ | 19,820 | |
MacDermid, Inc. Conference Call – Charts Q2 June 2006 |
8/10/2006 8:58:45 AM8/10/2006 8:58:45 AM8/10/2006 8:58:45 AM
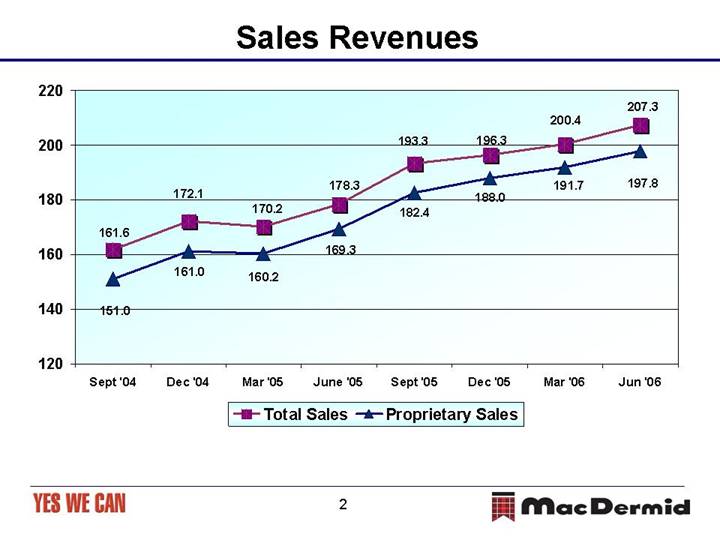
Sales Revenues 161.6 172.1 170.2 178.3 193.3 196.3 200.4 207.3 151.0 161.0 160.2 169.3 182.4 188.0 191.7 197.8 120 140 160 180 200 220 Sept ‘04 Dec ‘04 Mar ‘05 June ‘05 Sept ‘05 Dec ‘05 Mar ‘06 Jun ‘06 Total Sales Proprietary Sales |
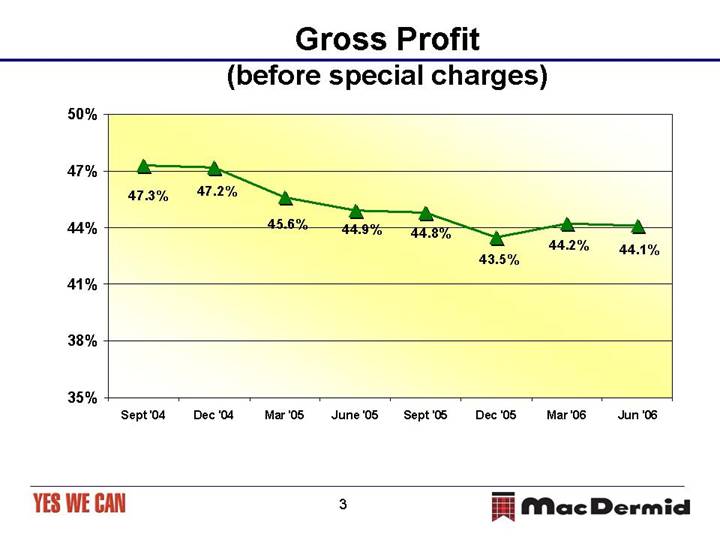
Gross Profit (before special charges) 47.3% 47.2% 45.6% 44.9% 44.8% 43.5% 44.2% 44.1% 35% 38% 41% 44% 47% 50% Sept ‘04 Dec ‘04 Mar ‘05 June ‘05 Sept ‘05 Dec ‘05 Mar ‘06 Jun ‘06 |
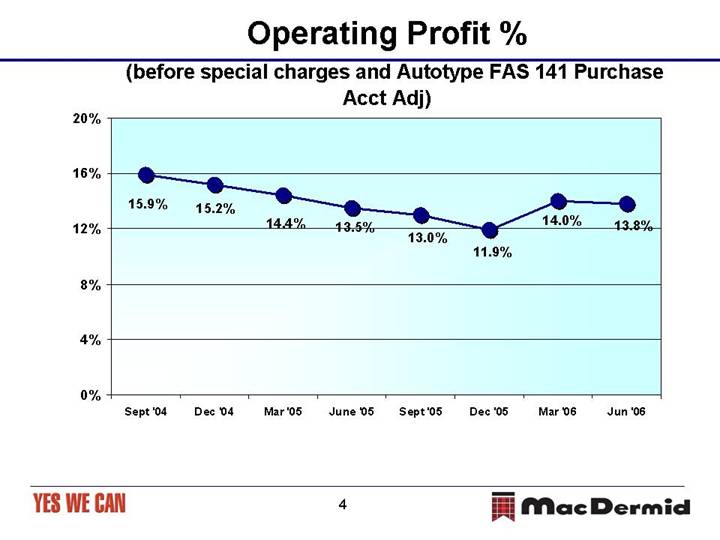
Operating Profit % (before special charges and Autotype FAS 141 Purchase Acct Adj) 13.8% 14.0% 11.9% 13.0% 13.5% 14.4% 15.2% 15.9% 0% 4% 8% 12% 16% 20% Sept ‘04 Dec ‘04 Mar ‘05 June ‘05 Sept ‘05 Dec ‘05 Mar ‘06 Jun ‘06 |
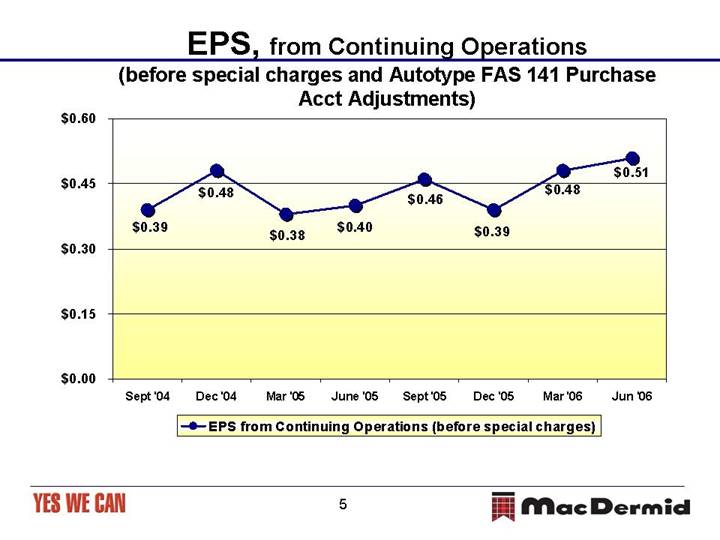
EPS, from Continuing Operations (before special charges and Autotype FAS 141 Purchase Acct Adjustments) $0.48 $0.39 $0.38 $0.40 $0.46 $0.39 $0.48 $0.51 $0.00 $0.15 $0.30 $0.45 $0.60 Sept ‘04 Dec ‘04 Mar ‘05 June ‘05 Sept ‘05 Dec ‘05 Mar ‘06 Jun ‘06 EPS from Continuing Operations (before special charges) |
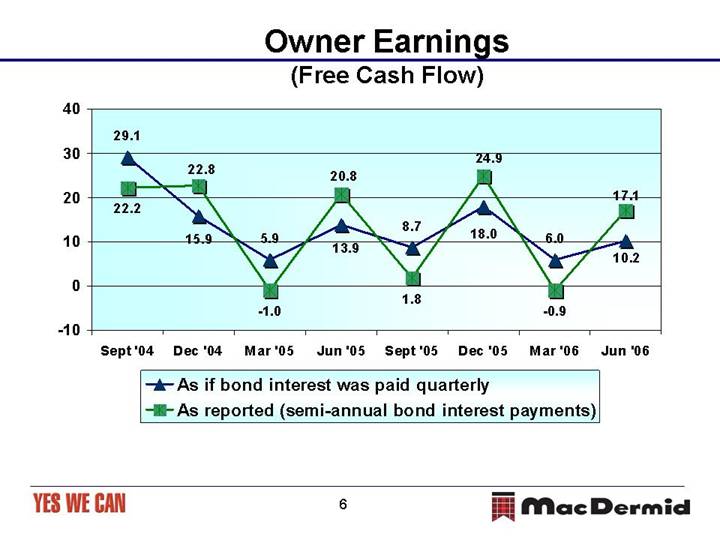
Owner Earnings (Free Cash Flow) 29.1 15.9 5.9 13.9 8.7 18.0 6.0 10.2 22.2 22.8 -1.0 20.8 1.8 24.9 -0.9 17.1 -10 0 10 20 30 40 Sept ‘04 Dec ‘04 Mar ‘05 Jun ‘05 Sept ‘05 Dec ‘05 Mar ‘06 Jun ‘06 As if bond interest was paid quarterly As reported (semi-annual bond interest payments) |
MacDermid, Inc.
Regulation G: GAAP to Non-GAAP Reconciliation
Gross Profit Before | | Three Months Ended | | Year
Ended | | Year
Ended | |
Special Charges (a) | | Mar-04 | | Jun-04 | | Sep-04 | | Dec-04 | | Mar-05 | | Jun-05 | | Sep-05 | | Dec-05 | | Mar-06 | | Jun-06 | | Dec-04 | | Dec-05 | |
(In thousands) | | | | | | | | | | | | | | | | | | | | | | | | | |
Net Sales as reported | | $ | 162,012 | | $ | 165,053 | | $ | 161,585 | | $ | 172,135 | | $ | 170,247 | | $ | 178,281 | | $ | 193,260 | | $ | 196,255 | | $ | 200,358 | | $ | 207,257 | | $ | 660,785 | | $ | 738,043 | |
| | | | | | | | | | | | | | | | | | | | | | | | | |
Gross Profit as reported | | $ | 77,526 | | $ | 78,074 | | $ | 76,375 | | $ | 81,266 | | $ | 77,653 | | $ | 80,026 | | $ | 83,282 | | $ | 83,771 | | $ | 88,471 | | $ | 91,375 | | $ | 313,241 | | $ | 324,732 | |
Add: Special Charges | | — | | — | | — | | — | | — | | 117 | | 654 | | 293 | | — | | — | | — | | 1,064 | |
Gross Profit Before Special Charges | | $ | 77,526 | | $ | 78,074 | | $ | 76,375 | | $ | 81,266 | | $ | 77,653 | | $ | 80,143 | | $ | 83,936 | | $ | 84,064 | | $ | 88,471 | | $ | 91,375 | | $ | 313,241 | | $ | 325,796 | |
| | | | | | | | | | | | | | | | | | | | | | | | | |
GP % Before Special Charges | | 47.9 | % | 47.3 | % | 47.3 | % | 47.2 | % | 45.6 | % | 45.0 | % | 43.4 | % | 42.8 | % | 44.2 | % | 44.1 | % | 47.4 | % | 44.1 | % |
| | Three Months Ended | | Year
Ended | | Year
Ended | |
Operating Profit Before Amortization and Special Charges (a) | | Mar-04 | | Jun-04 | | Sep-04 | | Dec-04 | | Mar-05 | | Jun-05 | | Sep-05 | | Dec-05 | | Mar-06 | | Jun-06 | | Dec-04 | | Dec-05 | |
(In thousands) | | | | | | | | | | | | | | | | | | | | | | | | | |
Net Sales per above | | $ | 162,012 | | $ | 165,053 | | $ | 161,585 | | $ | 172,135 | | $ | 170,247 | | $ | 178,281 | | $ | 193,260 | | $ | 196,255 | | $ | 200,358 | | $ | 207,257 | | $ | 660,785 | | $ | 738,043 | |
| | | | | | | | | | | | | | | | | | | | | | | | | |
Earnings Before Interest and Taxes | | $ | 26,551 | | $ | 27,348 | | $ | 25,838 | | $ | 27,615 | | $ | 24,481 | | $ | 22,988 | | $ | 24,937 | | $ | 21,287 | | $ | 24,077 | | $ | 28,016 | | $ | 107,352 | | $ | 93,693 | |
| | | | | | | | | | | | | | | | | | | | | | | | | |
Add: Other (Income) Expense | | 258 | | (697 | ) | (92 | ) | (1,411 | ) | (30 | ) | 620 | | (799 | ) | 249 | | 367 | | 14 | | (1,942 | ) | 40 | |
Add: Special Charges | | — | | — | | — | | — | | — | | 502 | | 1,731 | | 2,094 | | 2,042 | | 622 | | — | | 4,327 | |
| | | | | | | | | | | | | | | | | | | | | | | | | |
Operating Profit Before Special Charges | | $ | 26,809 | | $ | 26,651 | | $ | 25,746 | | $ | 26,204 | | $ | 24,451 | | $ | 24,110 | | $ | 25,869 | | $ | 23,630 | | $ | 26,486 | | $ | 28,652 | | $ | 105,410 | | $ | 98,060 | |
| | | | | | | | | | | | | | | | | | | | | | | | | |
% OP Before Special Charges to Net Sales | | 16.5 | % | 16.1 | % | 15.9 | % | 15.2 | % | 14.4 | % | 13.5 | % | 13.4 | % | 12.0 | % | 13.2 | % | 13.8 | % | 16.0 | % | 13.3 | % |
(a) “Gross Profit Before Special Charges” and “Operating Profit Special Charges” are not intended to represent Net Earnings as defined by Generally Accepted Accounting Principles. These measurements should not be used as an alternative to Net Earnings as an indicator of operating performance and may not be comparable to similarly titled measures used by other entities. Management believes that these measurements portray a meaningful measure of past operating performance and believes these measurements play an important factor toward the growth of shareholder value over time.
MacDermid, Inc.
Regulation G: GAAP to Non-GAAP Reconciliation
EPS from Continuing Operations Before Special Charges (a) | | Mar-04 | | Jun-04 | | Sep-04 | | Dec-04 | | Mar-05 | | Jun-05 | | Sep-05 | | Dec-05 | | Mar-06 | | Jun-06 | | Year
Ended
Dec-04 | | Year
Ended
Dec-05 | |
(In thousands, except share and per share amounts) | | | | | | | | | | | | | | | | | | | | | | | | | |
Net Income (Loss) as reported | | $ | 12,893 | | $ | 13,385 | | $ | 12,043 | | $ | 14,903 | | $ | 11,785 | | $ | 11,928 | | $ | 12,916 | | $ | 10,414 | | $ | 13,278 | | $ | 15,535 | | $ | 53,224 | | $ | 47,043 | |
Deduct: Income (Loss) from Discontinued Ops, net of income taxes | | — | | — | | — | | — | | — | | — | | — | | — | | — | | — | | — | | — | |
Income (Loss) from Continuing Operations | | 12,893 | | 13,385 | | 12,043 | | 14,903 | | 11,785 | | 11,928 | | 12,916 | | 10,414 | | 13,278 | | 15,535 | | 53,224 | | 47,043 | |
| | | | | | | | | | | | | | | | | | | | | | | | | |
Change in accounting method | | — | | — | | — | | — | | — | | — | | — | | — | | — | | — | | — | | — | |
SFAS 150 gain on stock call option | | — | | — | | — | | — | | — | | — | | — | | — | | — | | — | | — | | — | |
Cost of sales impact of acquisition inventory adj | | — | | — | | — | | — | | | | 117 | | 654 | | 293 | | — | | — | | — | | 1,064 | |
Write-off of In process R&D | | — | | — | | — | | — | | — | | 385 | | — | | — | | — | | — | | — | | 385 | |
Restructuring & Other Charges | | | | | | | | | | | | | | 1,077 | | 1,801 | | 2,042 | | 622 | | | | 2,878 | |
Total Special Charges (Income) | | — | | — | | — | | — | | — | | 502 | | 1,731 | | 2,094 | | 2,042 | | 622 | | — | | 4,327 | |
| | | | | | | | | | | | | | | | | | | | | | | | | |
After Tax Effect of Special Charges (Income) | | — | | — | | — | | — | | — | | 356 | | 1,238 | | 1,516 | | 1,487 | | 452 | | — | | 3,110 | |
| | | | | | | | | | | | | | | | | | | | | | | | | |
Net Income from Continuing Operations Before Tax Effected Special Charges | | $ | 12,893 | | $ | 13,385 | | $ | 12,043 | | $ | 14,903 | | $ | 11,785 | | $ | 12,284 | | $ | 14,154 | | $ | 11,930 | | $ | 14,765 | | $ | 15,987 | | $ | 53,224 | | $ | 50,153 | |
| | | | | | | | | | | | | | | | | | | | | | | | | |
Earnings Per Share from Continuing Operations Before Tax Effected Special Charges | | $ | 0.42 | | $ | 0.43 | | $ | 0.39 | | $ | 0.48 | | $ | 0.38 | | $ | 0.40 | | $ | 0.46 | | $ | 0.39 | | $ | 0.48 | | $ | 0.51 | | $ | 1.72 | | $ | 1.62 | |
| | | | | | | | | | | | | | | | | | | | | | | | | |
Diluted Average Common Shares Outstanding | | 31,041,763 | | 31,014,374 | | 30,988,259 | | 30,794,808 | | 30,809,620 | | 30,787,829 | | 30,865,440 | | 30,940,941 | | 31,065,191 | | 31,402,758 | | 30,961,108 | | 30,892,052 | |
EBITDA from Continuing Operations Before Special Charges (a) (b) | | Mar-04 | | Jun-04 | | Sep-04 | | Dec-04 | | Mar-05 | | Jun-05 | | Sep-05 | | Dec-05 | | Mar-06 | | Jun-06 | | Year
Ended
Dec-04 | | Year
Ended
Dec-05 | |
(In thousands) | | | | | | | | | | | | | | | | | | | | | | | | | |
Earnings Before Interest and Taxes | | $ | 26,551 | | $ | 27,348 | | $ | 25,838 | | $ | 27,615 | | $ | 24,481 | | $ | 22,988 | | $ | 24,937 | | $ | 21,287 | | $ | 24,077 | | $ | 28,016 | | $ | 107,352 | | $ | 93,693 | |
| | | | | | | | | | | | | | | | | | | | | | | | | |
SFAS 150 gain on stock call option | | — | | — | | — | | — | | — | | — | | — | | — | | — | | — | | — | | — | |
Cost of sales impact of acquisition inventory adj | | — | | — | | — | | — | | — | | 117 | | 654 | | 293 | | — | | — | | — | | 1,064 | |
Write-off of In Process R&D | | — | | — | | — | | — | | — | | 385 | | | | | | — | | — | | — | | 385 | |
Restructuring & Other Charges | | | | | | | | | | | | | | 1,077 | | 1,801 | | 2,042 | | 622 | | | | 2,878 | |
Total Special Charges | | — | | — | | — | | — | | — | | 502 | | 1,731 | | 2,094 | | 2,042 | | 622 | | — | | 4,327 | |
| | | | | | | | | | | | | | | | | | | | | | | | | |
Amortization | | 734 | | 717 | | 708 | | 850 | | 891 | | 897 | | 1,008 | | 1,561 | | 1,452 | | 1,518 | | 3,009 | | 4,357 | |
Depreciation | | 4,125 | | 3,989 | | 3,897 | | 4,137 | | 3,846 | | 3,771 | | 4,592 | | 4,829 | | 4,897 | | 5,016 | | 16,148 | | 17,038 | |
| | | | | | | | | | | | | | | | | | | | | | | | | |
EBITDA from Continuing Operations Before Special Charges | | $ | 31,410 | | $ | 32,054 | | $ | 30,443 | | $ | 32,602 | | $ | 29,218 | | $ | 28,158 | | $ | 32,268 | | $ | 29,771 | | $ | 32,468 | | $ | 35,172 | | $ | 126,509 | | $ | 119,415 | |
Owners Earnings (b) | | Mar-04 | | Jun-04 | | Sep-04 | | Dec-04 | | Mar-05 | | Jun-05 | | Sep-05 | | Dec-05 | | Mar-06 | | Jun-06 | | Year
Ended
Dec-04 | | Year
Ended
Dec-05 | |
(In thousands) | | | | | | | | | | | | | | | | | | | | | | | | | |
Net cash flow provided by operating activities | | $ | 5,977 | | $ | 28,153 | | $ | 22,978 | | $ | 28,169 | | $ | 2,023 | | $ | 24,845 | | $ | 4,321 | | $ | 27,979 | | $ | 501 | | $ | 20,434 | | $ | 85,277 | | $ | 59,168 | |
| | | | | | | | | | | | | | | | | | | | | | | | | |
Capital expenditures, net | | 782 | | 1,662 | | 768 | | 5,322 | | 2,728 | | 4,058 | | 2,517 | | 3,074 | | 1,483 | | 3,327 | | 8,534 | | 12,377 | |
Owner Earnings | | $ | 5,195 | | $ | 26,491 | | $ | 22,210 | | $ | 22,847 | | $ | (705 | ) | $ | 20,787 | | $ | 1,804 | | $ | 24,905 | | $ | (982 | ) | $ | 17,107 | | $ | 76,743 | | $ | 46,791 | |
| | | | | | | | | | | | | | | | | | | | | | | | | |
Adjustment for Bond Interest assumed to be paid quarterly | | | | | | | | | | | | | | | | | | | | | | | | | |
| | | | | | | | | | | | | | | | | | | | | | | | | |
Owner Earnings | | $ | 5,195 | | $ | 26,491 | | $ | 22,210 | | $ | 22,847 | | $ | (705 | ) | $ | 20,787 | | $ | 1,804 | | $ | 24,905 | | $ | (982 | ) | $ | 17,107 | | $ | 76,743 | | $ | 46,791 | |
Assumed if Bond Interest was paid quarterly | | 6,900 | | (6,900 | ) | 6,900 | | (6,900 | ) | 6,900 | | (6,900 | ) | 6,900 | | (6,900 | ) | 6,900 | | (6,900 | ) | — | | — | |
Adjusted Owner Earnings | | $ | 12,095 | | $ | 19,591 | | $ | 29,110 | | $ | 15,947 | | $ | 6,195 | | $ | 13,887 | | $ | 8,704 | | $ | 18,005 | | $ | 5,918 | | $ | 10,207 | | $ | 76,743 | | $ | 46,791 | |
(a) “EPS from Continuing Operations Before Special Charges”, “EBITDA from Continuing Operations Before Special Charges” and “Owners Earnings” are not intended to represent Net Earnings (loss) or Net Cash Flow From Operating Activities as defined by Generally Accepted Accounting Principles. These measurements should not be used as an alternative to Net Earnings or Net Cash Flow From Operating Activities as an indicator of operating performance and may not be comparable to similarly titled measures used by other entities. Management believes that these measurements portray a meaningful measure of past operating performance and believes these measurements play an important factor toward the growth of shareholder value over time.