Exhibit 99.1

Earnings Announcement
DENVER, COLORADO
NOVEMBER 8 th, 2006
FOR IMMEDIATE RELEASE
Third Quarter diluted earnings per share $0.42
MacDermid, Incorporated a worldwide manufacturer of proprietary specialty chemical products and materials for the electronics, metal finishing and printing industries (NYSE: MRD) today announced financial results for the third quarter ended September 30, 2006.
Third Quarter Operating Results
Sales of $ 200.3 million were $ 7.0 million higher, a 3.6% increase over the same period in 2005. Sales were strong in Advanced Surface Finishing reflecting demand for our Offshore, Electronics and Industrial products in all regions while our Printing businesses continued with the weak performance we have seen all year. The sales of Autotype were $0.9 million lower than the third quarter last year. Foreign currency had a negligible affect on sales in the quarter.
The gross margin percentage declined from 43.1% to 42.0% due in part to continuing inefficiencies at our Middletown, DE plant, higher raw material costs in our North American printing (packaging) business and the increased costs associated with the temporary shutdown of a production line at Autotype in the United Kingdom. The production line was shutdown to convert to a clean coating line to support the demand for the successful commercialization of our in-mold decoration process.
Operating expenses increased due to an increase in selling and technical expenses in Asia to support the higher level of business, and expenses relating to the special committee’s consideration of the proposed buy-out offer. Offsetting these higher expenses was a $1.1 million gain on disposal of assets related to the disposal of a small joint venture in Asia and the disposal of a building in America.
Operating profit increased by $ 1.0 million (4.2%).
The effective tax rate is higher this quarter at 30.7% than the 27.6% recorded last year. The difference is almost entirely due to the absence of the R & D credit this year. It is expected that Congress will renew this credit but the timing is uncertain. The higher tax
rate offset the lower net interest paid leaving our diluted earnings per share at $0.42, the same as in 2005.
Owner Earnings, a measure of free cash flow (defined below and shown in BOLD in the attached Condensed Consolidated Summary of Cash Flows), were $ 12.0 million. Our Cash balance at the end of the quarter was $ 109 million.
Year to date Operating Results
Sales of $ 607.9 million were $ 66.1 million higher, a 12.2% increase over the same period in 2005. Autotype, our June 2005 acquisition, added $ 42.9 million compared with last year, leaving our sales excluding Autotype up by $ 23.2 million or 4.3%. Year to date sales were strong in Advanced Surface Finishing reflecting growth in North America and in Asia, while MPS sales (excluding Autotype) have declined slightly in the Americas and Europe. Foreign currency had a small unfavorable affect on sales, reducing our reported sales by 1.1%.
The gross margin percentage declined from 44.5% to 43.4% mainly as a result the inclusion of the results of our June 2005 acquisition of Autotype which has a lower gross margin percentage than our other businesses, and to a lesser extent because of the lower yields of our MPS Americas business.
Selling, technical and administrative expenses increased by $ 10.8 million due primarily to the inclusion of Autotype for a full three quarters this year versus 3 and one half months in last year, and the absence of the $2.5 litigation costs in the second quarter of last year.
Operating profit increased by $ 5.4 million (7.5%) to $ 77.6 million. In the first quarter of this year we had unusual charges of $1.9 million to recognize the costs for the investigation of a potential acquisition and $2.2 million for the loss on the disposal of assets, less the $1.1 million gain on disposal of assets recorded in the third quarter this year.
Our net interest paid decreased due to higher cash balances and higher interest rates on cash on deposit. Diluted earnings per share of $1.34 were 12.6% higher than the $1.19 per share in 2005.
Owner Earnings, a measure of free cash flow (defined below and shown in BOLD in the attached Condensed Consolidated Summary of Cash Flows), were $ 28.1 million versus $21.6 million last year to date.
Dan Leever Chairman and CEO said “The summer quarter is always the most difficult quarter to predict. There was good news. Our Industrial Group had an excellent quarter, more than offsetting the normal summer decline. Printing Solutions continues to under perform. Recent improvements in product development and manufacturing give us hope for MPS, but solid improvement in results still eludes us. ColorSpan had a down quarter,
but management believes it is only a seasonal effect and that Q4 will be back closer to the record results we have seen this year. Autotype suffered this quarter. Order timing and seasonal effect affected results as well as continuing losses in the Middletown Delaware plant which the Autotype team has been attacking. We expect the fourth quarter to improve, but as always we have very limited visibility.”
Note:
Owner Earnings is calculated as Net Cash flows provided by operating activities (GAAP definition) less net capital expenditures. EBITDA comprises Earnings before Interest, Taxation, Depreciation and Amortization. This press release and additional financial information together with our reconciliation of GAAP to Non-GAAP numbers are available on our website.
Website: http://www.macdermid.com
| MacDermid, Incorporated |
| |
| NYSE - MRD |
| CUSIP 554273 10 2 |
November 8th, 2006
This report and other Corporation reports and statements describe many of the positive factors affecting the Corporation’s future business prospects. Investors should also be aware of factors that could have a negative impact on those prospects. These include political, economic or other conditions such as currency exchange rates, inflation rates, recessionary or expansive trends, taxes and regulations and laws affecting the business; competitive products, advertising, promotional and pricing activity; the degree of acceptance of new product introductions in the marketplace; technical difficulties which may arise with new product introductions; and the difficulty of forecasting sales at certain times in certain markets.
MacDermid, Incorporated
Condensed Consolidated Summary of Earnings
(Unaudited)
$ in thousands, except share and per share amounts
| | Three Months Ended | | Nine Months Ended | |
| | Sept. 30th | | Sept. 30th | | Sept. 30th | | Sept. 30th | |
| | 2006 | | 2005 | | 2006 | | 2005 | |
Proprietary sales | | $ | 191,544 | | $ | 182,445 | | $ | 581,090 | | $ | 511,903 | |
Other sales | | 8,751 | | 10,815 | | 26,820 | | 29,885 | |
Total net sales | | 200,295 | | 193,260 | | 607,910 | | 541,788 | |
| | | | | | | | | |
Gross margin | | 84,053 | | 83,282 | | 263,899 | | 240,961 | |
GM% | | 42.0 | % | 43.1 | % | 43.4 | % | 44.5 | % |
| | | | | | | | | |
Selling, technical and administrative | | 52,514 | | 51,387 | | 158,346 | | 147,581 | |
Research and development | | 7,489 | | 6,684 | | 22,788 | | 19,725 | |
Consulting fees for acquisition investigation | | — | | — | | 1,913 | | — | |
(Gain)/Loss on disposal of assets | | (1,108 | ) | — | | 1,116 | | — | |
Restructure/Purchase Acct. | | 1 | | 1,077 | | 2,108 | | 1,462 | |
Operating profit | | 25,157 | | 24,134 | | 77,628 | | 72,193 | |
| | | | | | | | | |
Other income (expense), net | | 230 | | 799 | | (148 | ) | 207 | |
Interest (expense), net | | (6,496 | ) | (7,101 | ) | (18,955 | ) | (21,170 | ) |
| | | | | | | | | |
Earnings before income taxes | | 18,891 | | 17,832 | | 58,525 | | 51,230 | |
Income tax (expense) | | (5,801 | ) | (4,915 | ) | (16,621 | ) | (14,600 | ) |
Net earnings | | $ | 13,090 | | $ | 12,917 | | $ | 41,904 | | $ | 36,630 | |
| | | | | | | | | |
Diluted earnings per share | | $ | 0.42 | | $ | 0.42 | | $ | 1.34 | | $ | 1.19 | |
| | | | | | | | | |
Diluted average common shares outstanding | | 31,293,290 | | 30,956,963 | | 31,254,656 | | 30,865,440 | |
| | | | | | | | | | | | | | | | |
MacDermid, Incorporated
Sales and Margins by Region
$ in thousands
| | Three Months Ended | | Nine Months Ended | |
| | Sept. 30th | | Sept. 30th | | Sept. 30th | | Sept. 30th | |
| | 2006 | | 2005 | | 2006 | | 2005 | |
Americas | | | | | | | | | |
Total net sales | | $ | 74,390 | | $ | 76,194 | | $ | 231,829 | | $ | 215,599 | |
Operating profit | | $ | 8,303 | | $ | 10,398 | | $ | 23,687 | | $ | 26,812 | |
OP% | | 11.2 | % | 13.6 | % | 10.2 | % | 12.4 | % |
| | | | | | | | | |
Europe | | | | | | | | | |
Total net sales | | $ | 72,691 | | $ | 65,836 | | $ | 218,770 | | $ | 191,077 | |
Operating profit | | $ | 6,713 | | $ | 3,235 | | $ | 23,539 | | $ | 19,455 | |
OP% | | 9.2 | % | 4.9 | % | 10.8 | % | 10.2 | % |
| | | | | | | | | |
Asia | | | | | | | | | |
Total net sales | | $ | 53,214 | | $ | 51,230 | | $ | 157,311 | | $ | 135,112 | |
Operating profit | | $ | 10,141 | | $ | 10,501 | | $ | 30,402 | | $ | 25,926 | |
OP% | | 19.1 | % | 20.5 | % | 19.3 | % | 19.2 | % |
| | | | | | | | | |
Consolidated Total | | | | | | | | | |
Total net sales | | $ | 200,295 | | $ | 193,260 | | $ | 607,910 | | $ | 541,788 | |
Operating profit | | $ | 25,157 | | $ | 24,134 | | $ | 77,628 | | $ | 72,193 | |
OP% | | 12.6 | % | 12.5 | % | 12.8 | % | 13.3 | % |
| | | | | | | | | | | | | | | | | |
MacDermid, Incorporated
Sales and Margins by Group
$ in thousands
| | Three Months Ended | | Nine Months Ended | |
| | Sept. 30th | | Sept. 30th | | Sept. 30th | | Sept. 30th | |
| | 2006 | | 2005 | | 2006 | | 2005 | |
Advanced Surface Finishing | | | | | | | | | |
Total net sales | | $ | 121,370 | | $ | 111,003 | | $ | 360,625 | | $ | 313,476 | |
Operating profit | | $ | 19,001 | | $ | 16,925 | | $ | 55,052 | | $ | 47,764 | |
OP% | | 15.7 | % | 15.2 | % | 15.3 | % | 15.2 | % |
| | | | | | | | | |
Printing Solutions | | | | | | | | | |
Total net sales | | $ | 78,925 | | $ | 82,257 | | $ | 247,285 | | $ | 228,312 | |
Operating profit | | $ | 6,156 | | $ | 7,209 | | $ | 22,576 | | $ | 24,429 | |
OP% | | 7.8 | % | 8.8 | % | 9.1 | % | 10.7 | % |
| | | | | | | | | |
Consolidated Total | | | | | | | | | |
Total net sales | | $ | 200,295 | | $ | 193,260 | | $ | 607,910 | | $ | 541,788 | |
Operating profit | | $ | 25,157 | | $ | 24,134 | | $ | 77,628 | | $ | 72,193 | |
OP% | | 12.6 | % | 12.5 | % | 12.8 | % | 13.3 | % |
| | | | | | | | | | | | | | | | | |
MacDermid, Incorporated
Condensed Consolidated Balance Sheets
$ in thousands
| | Sept. 30th | | Dec 31st | |
| | 2006 | | 2005 | |
| | (Unaudited) | | (Restated and
Unaudited) | |
| | | | | |
Cash and cash equivalents | | $ | 108,965 | | $ | 80,932 | |
Accounts receivable, net | | 166,470 | | 155,718 | |
Inventories, net | | 123,844 | | 92,973 | |
Other current assets | | 30,833 | | 30,737 | |
Current Assets | | 430,112 | | 360,360 | |
| | | | | |
Property, plant & equipment, net | | 118,955 | | 123,229 | |
Goodwill | | 251,736 | | 242,935 | |
Intangibles | | 41,324 | | 40,916 | |
Other assets, net | | 53,118 | | 52,487 | |
Total assets | | $ | 895,245 | | $ | 819,927 | |
| | | | | |
Payables and accruals | | $ | 147,069 | | $ | 141,109 | |
Short-term debt | | 520 | | 730 | |
Current Liabilities | | 147,589 | | 141,839 | |
| | | | | |
Long-term debt | | 300,784 | | 301,043 | |
Other long-term liabilities | | 48,724 | | 37,968 | |
Total Liabilities | | 497,097 | | 480,850 | |
| | | | | |
Shareholders’ equity | | 398,148 | | 339,077 | |
| | | | | |
Total liabilities & shareholders’ equity | | $ | 895,245 | | $ | 819,927 | |
| | | | | |
Debt to total capital | | 43 | % | 47 | % |
| | | | | | | | | | |
MacDermid, Incorporated
Condensed Consolidated Summary of Cash Flows
(Unaudited)
$ in thousands
| | Three Months Ended | | Nine Months Ended | |
| | Sept 30th | | Sept 30th | | Sept 30th | | Sept 30th | |
| | 2006 | | 2005 | | 2006 | | 2005 | |
Net earnings | | $ | 13,090 | | $ | 12,917 | | $ | 41,904 | | $ | 36,630 | |
| | | | | | | | | |
Depreciation | | 4,922 | | 4,592 | | 14,835 | | 12,209 | |
Amortization | | 1,286 | | 1,008 | | 4,256 | | 2,796 | |
Provision for bad debt | | 344 | | 842 | | 917 | | 1,580 | |
Inventory Reserve adjustment | | (2,846 | ) | — | | (2,846 | ) | — | |
Stock compensation expense | | (326 | ) | 1,177 | | 1,922 | | 5,227 | |
Deferred taxes | | (338 | ) | (1,620 | ) | 3,171 | | (995 | ) |
Net Loss on Asset sales and Business Dispositions | | 830 | | — | | 830 | | — | |
Restructuring/Purchase Adjustments | | 1 | | 1,077 | | 2,108 | | 1,463 | |
Working capital changes | | (4,524 | ) | (15,669 | ) | (33,722 | ) | (27,718 | ) |
Cash from operations | | 12,439 | | 4,324 | | 33,375 | | 31,192 | |
| | | | | | | | | |
Capital Expenditures | | (2,431 | ) | (2,984 | ) | (7,530 | ) | (10,810 | ) |
Proceeds from Asset Disposal | | 1,981 | | 467 | | 2,270 | | 1,245 | |
Net Capital Expenditures | | (450 | ) | (2,517 | ) | (5,260 | ) | (9,565 | ) |
| | | | | | | | | |
Owner earnings** | | 11,989 | | 1,807 | | 28,115 | | 21,627 | |
| | | | | | | | | |
Acquisition of business | | (219 | ) | (3,884 | ) | (256 | ) | (93,153 | ) |
Dividends paid | | (1,850 | ) | (1,827 | ) | (5,532 | ) | (4,858 | ) |
Increase/(decrease) in debt | | (916 | ) | (7,877 | ) | (629 | ) | 2,780 | |
Treasury shares | | — | | — | | 26 | | 33 | |
Other | | 920 | | 1,974 | | 6,309 | | (3,951 | ) |
| | | | | | | | | |
Increase/(decrease) in cash | | $ | 9,924 | | $ | (9,807 | ) | $ | 28,033 | | $ | (77,522 | ) |
| | | | | | | | | |
**Note: Pro forma owner earnings | | | | | | | | | |
adjusted for semi-annual bond interest | | $ | 6,900 | | $ | 6,900 | | $ | 6,900 | | $ | 6,900 | |
payments would have been as follows: | | $ | 18,889 | | $ | 8,707 | | $ | 35,015 | | $ | 28,527 | |
| | | | | | | | | | | | | |
| | | | | | | | | | | | | | |

| MacDermid, Inc. Conference Call – Charts Q3 September 2006 |
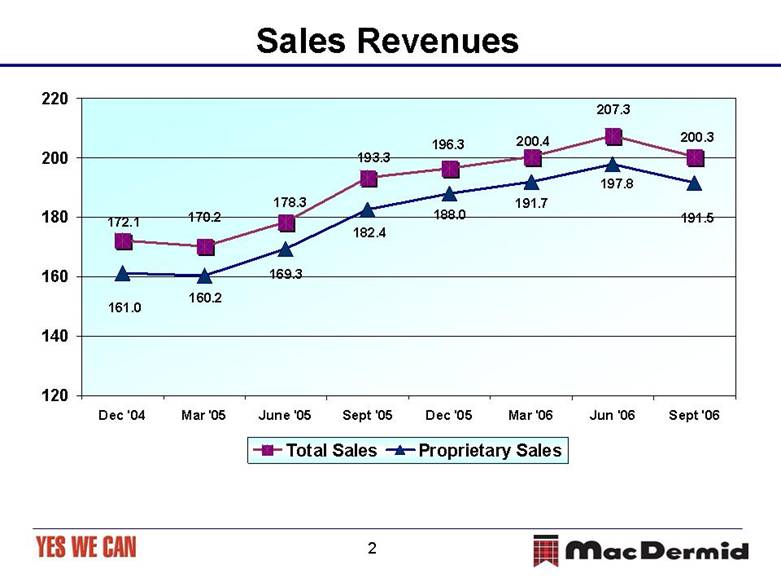
| Sales Revenues 200.3207.3200.4196.3193.3178.3170.2172.1191.5197.8191.7188.0182.4169.3160.2161.0120140160180200220Dec '04Mar '05June '05Sept '05Dec '05Mar '06Jun '06Sept '06Total SalesProprietary Sales |
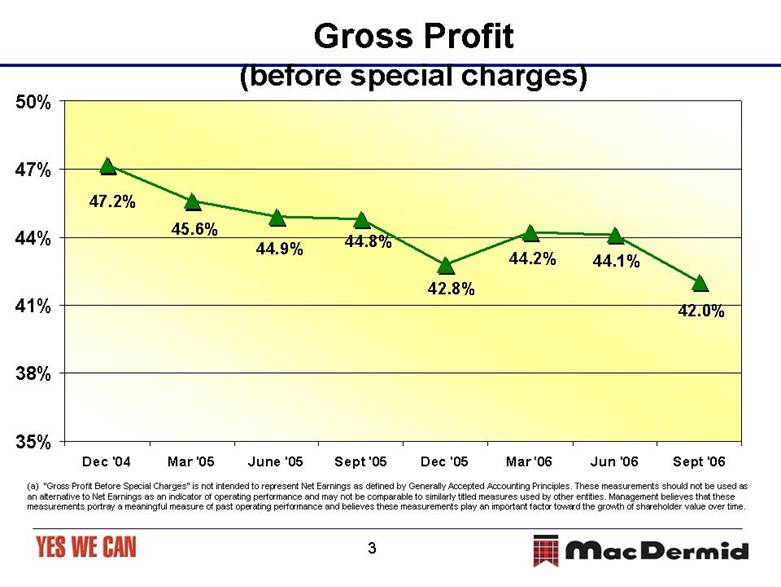
| Gross Profit (before special charges) (a) "Gross Profit Before Special Charges" is not intended to represent Net Earnings as defined by Generally Accepted Accounting Principles. These measurements should not be used as an alternative to Net Earnings as an indicator of operating performance and may not be comparable to similarly titled measures used by other entities. Management believes that these measurements portray a meaningful measure of past operating performance and believes these measurements play an important factor toward the growth of shareholder value over time. 47.2%45.6%44.9%44.8%42.8%44.2%44.1%42.0%35%38%41%44%47%50%Dec '04Mar '05June '05Sept '05Dec '05Mar '06Jun '06Sept '06 |
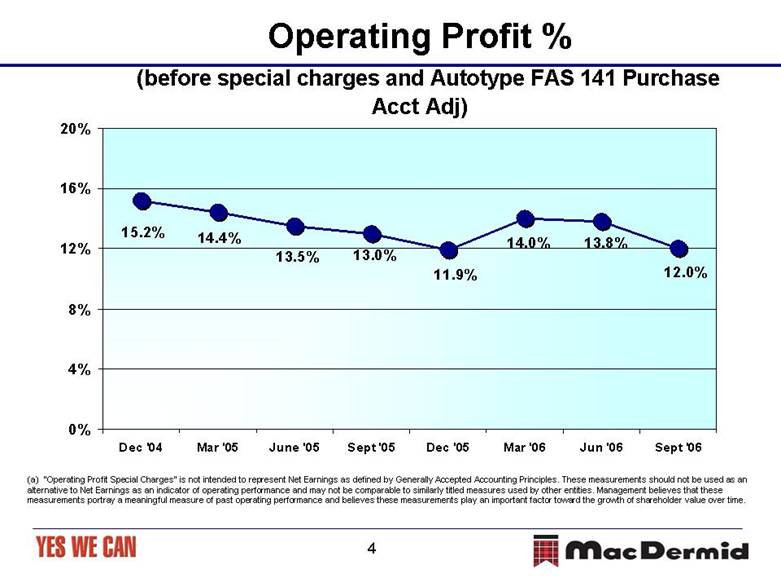
| Operating Profit %(before special charges and Autotype FAS 141 Purchase Acct Adj) (a) "Operating Profit Special Charges" is not intended to represent Net Earnings as defined by Generally Accepted Accounting Principles. These measurements should not be used as an alternative to Net Earnings as an indicator of operating performance and may not be comparable to similarly titled measures used by other entities. Management believes that these measurements portray a meaningful measure of past operating performance and believes these measurements play an important factor toward the growth of shareholder value over time. 12.0%13.8%14.0%11.9%13.0%13.5%14.4%15.2%0%4%8%12%16%20%Dec '04Mar '05June '05Sept '05Dec '05Mar '06Jun '06Sept '06 |
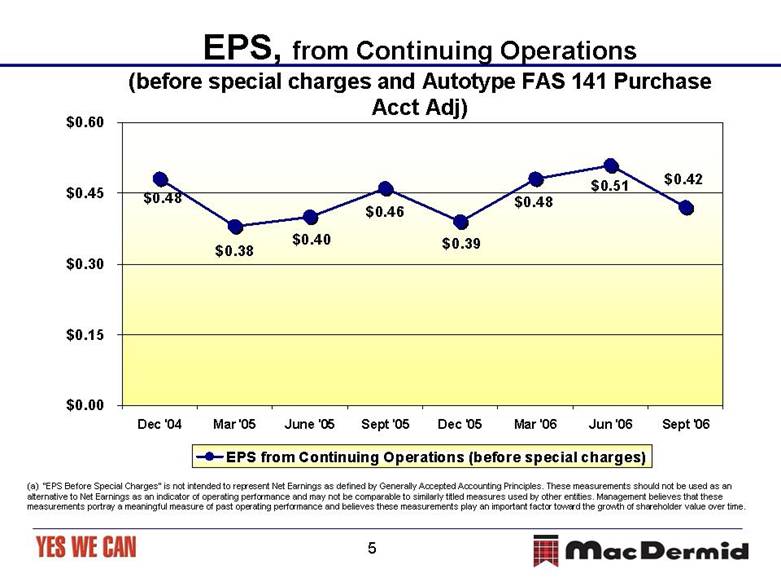
| EPS, from Continuing Operations(before special charges and Autotype FAS 141 Purchase Acct Adj) (a) “EPS Before Special Charges" is not intended to represent Net Earnings as defined by Generally Accepted Accounting Principles. These measurements should not be used as an alternative to Net Earnings as an indicator of operating performance and may not be comparable to similarly titled measures used by other entities. Management believes that these measurements portray a meaningful measure of past operating performance and believes these measurements play an important factor toward the growth of shareholder value over time. $0.38$0.48$0.40$0.46$0.39$0.48$0.51$0.42$0.00$0.15$0.30$0.45$0.60Dec '04Mar '05June '05Sept '05Dec '05Mar '06Jun '06Sept '06EPS from Continuing Operations (before special charges) |
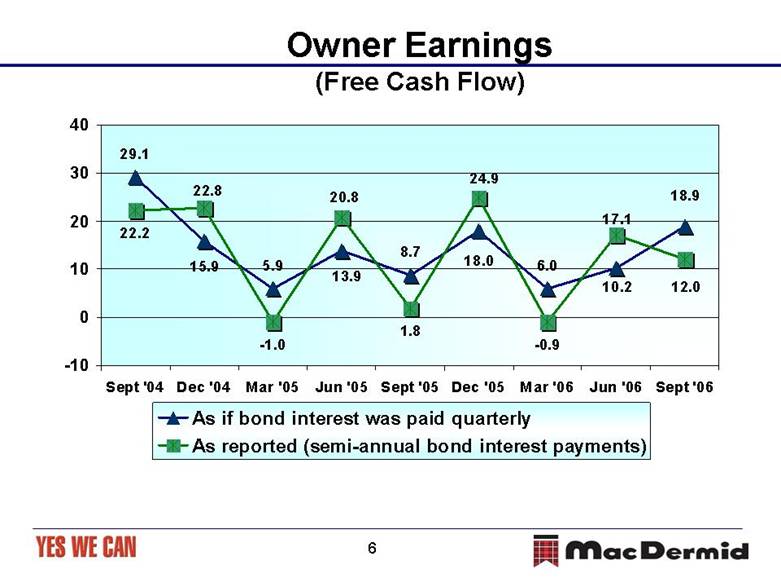
| Owner Earnings (Free Cash Flow) 18.929.115.95.913.98.718.06.010.212.022.222.8-1.020.81.824.9-0.917.1-10010203040Sept '04Dec '04Mar '05Jun '05Sept '05Dec '05Mar '06Jun '06Sept '06As if bond interest was paid quarterlyAs reported (semi-annual bond interest payments) |
MacDermid, Inc.
Regulation G: GAAP to Non-GAAP Reconciliation
Gross Profit Before Special Charges (a) | | | | | | | | | | | | | | | |
(In thousands) | | Three Months Ended | |
| | Mar-04 | | Jun-04 | | Sep-04 | | Dec-04 | | Mar-05 | | Jun-05 | | Sep-05 | |
Net Sales as reported | | $ | 162,012 | | $ | 165,053 | | $ | 161,585 | | $ | 172,135 | | $ | 170,247 | | $ | 178,281 | | $ | 193,260 | |
| | | | | | | | | | | | | | | |
Gross Profit as reported | | $ | 77,526 | | $ | 78,074 | | $ | 76,375 | | $ | 81,266 | | $ | 77,653 | | $ | 80,026 | | $ | 83,282 | |
Add: Special Charges | | — | | — | | — | | — | | — | | 117 | | 654 | |
Gross Profit Before Special Charges | | $ | 77,526 | | $ | 78,074 | | $ | 76,375 | | $ | 81,266 | | $ | 77,653 | | $ | 80,143 | | $ | 83,936 | |
| | | | | | | | | | | | | | | |
GP% Before Special Charges | | 47.9 | % | 47.3 | % | 47.3 | % | 47.2 | % | 45.6 | % | 45.0 | % | 43.4 | % |
| | | | | | | | | | | | | | | |
Operating Profit Before Amortization and Special Charges (a) | | | | | | | | | | | | | | | |
(In thousands) | | Three Months Ended | |
| | Mar-04 | | Jun-04 | | Sep-04 | | Dec-04 | | Mar-05 | | Jun-05 | | Sep-05 | |
Net Sales per above | | $ | 162,012 | | $ | 165,053 | | $ | 161,585 | | $ | 172,135 | | $ | 170,247 | | $ | 178,281 | | $ | 193,260 | |
| | | | | | | | | | | | | | | |
Earnings Before Interest and Taxes | | $ | 26,551 | | $ | 27,348 | | $ | 25,838 | | $ | 27,615 | | $ | 24,481 | | $ | 22,988 | | $ | 24,937 | |
| | | | | | | | | | | | | | | |
Add: Other (Income) Expense | | 258 | | (697 | ) | (92 | ) | (1,411 | ) | (30 | ) | 620 | | (799 | ) |
Add: Special Charges | | — | | — | | — | | — | | — | | 502 | | 1,731 | |
| | | | | | | | | | | | | | | |
Operating Profit Before Special Charges | | $ | 26,809 | | $ | 26,651 | | $ | 25,746 | | $ | 26,204 | | $ | 24,451 | | $ | 24,110 | | $ | 25,869 | |
| | | | | | | | | | | | | | | |
% OP Before Special Charges to Net Sales | | 16.5 | % | 16.1 | % | 15.9 | % | 15.2 | % | 14.4 | % | 13.5 | % | 13.4 | % |
| | | | | | | | | | | | | | | | | | | | | | | | | | | | | | | | |
Gross Profit Before Special Charges (a) | | | | | | | | | | Year | | Year | |
(In thousands) | | Three Months Ended | | Ended | | Ended | |
| | Dec-05 | | Mar-06 | | Jun-06 | | Sep-06 | | Dec-04 | | Dec-05 | |
Net Sales as reported | | $ | 196,255 | | $ | 200,358 | | $ | 207,257 | | $ | 200,295 | | $ | 660,785 | | $ | 738,043 | |
| | | | | | | | | | | | | |
Gross Profit as reported | | $ | 83,771 | | $ | 88,471 | | $ | 91,375 | | $ | 84,053 | | $ | 313,241 | | $ | 324,732 | |
Add: Special Charges | | 293 | | — | | — | | — | | — | | 1,064 | |
Gross Profit Before Special Charges | | $ | 84,064 | | $ | 88,471 | | $ | 91,375 | | $ | 84,053 | | $ | 313,241 | | $ | 325,796 | |
| | | | | | | | | | | | | |
GP% Before Special Charges% | | 42.8 | % | 44.2 | % | 44.1 | % | 42.0 | % | 47.4 | % | 44.1 | % |
| | | | | | | | | | | | | |
Operating Profit Before Amortization and Special Charges (a) | | | | | | | | | | Year | | Year | |
(In thousands) | | Three Months Ended | | Ended | | Ended | |
| | Dec-05 | | Mar-06 | | Jun-06 | | Sep-06 | | Dec-04 | | Dec-05 | |
Net Sales per above | | $ | 196,255 | | $ | 200,358 | | $ | 207,257 | | $ | 200,295 | | $ | 660,785 | | $ | 738,043 | |
| | | | | | | | | | | | | |
Earnings Before Interest and Taxes | | $ | 21,287 | | $ | 24,077 | | $ | 28,016 | | $ | 25,387 | | $ | 107,352 | | $ | 93,693 | |
| | | | | | | | | | | | | |
Add: Other (Income) Expense) | | 249 | | 367 | | 14 | | (230 | ) | (1,942 | ) | 40 | |
Add: Special Charges | | 2,094 | | 2,042 | | 622 | | (1,107 | ) | — | | 4,327 | |
| | | | | | | | | | | | | |
Operating Profit Before Special Charges | | $ | 23,630 | | $ | 26,486 | | $ | 28,652 | | $ | 24,050 | | $ | 105,410 | | $ | 98,060 | |
| | | | | | | | | | | | | |
% OP Before Special Charges to Net Sales% | | 12.0 | % | 13.2 | % | 13.8 | % | 12.0 | % | 16.0 | % | 13.3 | % |
| | | | | | | | | | | | | | | | | | | | | | | | | | | | |
(a) “Gross Profit Before Special Charges” and “Operating Profit Special Charges” are not intended to represent Net Earnings as defined by Generally Accepted Accounting Principles. These measurements should not be used as an alternative to Net Earnings as an indicator of operating performance and may not be comparable to similarly titled measures used by other entities. Management believes that these measurements portray a meaningful measure of past operating performance and believes these measurements play an important factor toward the growth of shareholder value over time.
MacDermid, Inc.
Regulation G: GAAP to Non-GAAP Reconciliation
EPS from Continuing Operations Before Special Charges (a) | | | | | | | | | | | | | | | |
(In thousands, except share and per share amounts) | | | | | | | | | | | | | | | |
| | Mar-04 | | Jun-04 | | Sep-04 | | Dec-04 | | Mar-05 | | Jun-05 | | Sep-05 | |
Net Income (Loss) as reported | | $ | 12,893 | | $ | 13,385 | | $ | 12,043 | | $ | 14,903 | | $ | 11,785 | | $ | 11,928 | | $ | 12,916 | |
Deduct: Income (Loss) from Discontinued Ops, net of income taxes | | — | | — | | — | | — | | — | | — | | — | |
Income (Loss) from Continuing Operations | | 12,893 | | 13,385 | | 12,043 | | 14,903 | | 11,785 | | 11,928 | | 12,916 | |
| | | | | | | | | | | | | | | |
Change in accounting method | | — | | — | | — | | — | | — | | — | | — | |
SFAS 150 gain on stock call option | | — | | — | | — | | — | | — | | — | | — | |
Cost of sales impact of acquisition inventory adj | | — | | — | | — | | — | | | | 117 | | 654 | |
Write-off of In process R&D | | — | | — | | — | | — | | — | | 385 | | — | |
Restructuring & Other Charges | | | | | | | | | | | | | | 1,077 | |
Total Special Charges (Income) | | — | | — | | — | | — | | — | | 502 | | 1,731 | |
| | | | | | | | | | | | | | | |
After Tax Effect of Special Charges (Income) | | — | | — | | — | | — | | — | | 356 | | 1,238 | |
| | | | | | | | | | | | | | | |
Net Income from Continuing Operations Before Tax Effected Special Charges | | $ | 12,893 | | $ | 13,385 | | $ | 12,043 | | $ | 14,903 | | $ | 11,785 | | $ | 12,284 | | $ | 14,154 | |
| | | | | | | | | | | | | | | |
Earnings Per Share from Continuing Operations Before Tax Effected Special Charges | | $ | 0.42 | | $ | 0.43 | | $ | 0.39 | | $ | 0.48 | | $ | 0.38 | | $ | 0.40 | | $ | 0.46 | |
| | | | | | | | | | | | | | | |
Diluted Average Common Shares Outstanding | | 31,041,763 | | 31,014,374 | | 30,988,259 | | 30,794,808 | | 30,809,620 | | 30,787,829 | | 30,865,440 | |
| | | | | | | | | | | | | | | |
EBITDA from Continuing Operations Before Special Charges (a) (b) | | | | | | | | | | | | | | | |
(In thousands) | | | | | | | | | | | | | | | |
| | Mar-04 | | Jun-04 | | Sep-04 | | Dec-04 | | Mar-05 | | Jun-05 | | Sep-05 | |
Earnings Before Interest and Taxes | | $ | 26,551 | | $ | 27,348 | | $ | 25,838 | | $ | 27,615 | | $ | 24,481 | | $ | 22,988 | | $ | 24,937 | |
| | | | | | | | | | | | | | | |
SFAS 150 gain on stock call option | | — | | — | | — | | — | | — | | — | | — | |
Cost of sales impact of acquisition inventory adj | | — | | — | | — | | — | | — | | 117 | | 654 | |
Write-off of In Process R&D | | — | | — | | — | | — | | — | | 385 | | | |
Restructuring & Other Charges | | | | | | | | | | | | | | 1,077 | |
Total Special Charges | | — | | — | | — | | — | | — | | 502 | | 1,731 | |
| | | | | | | | | | | | | | | |
Amortization | | 734 | | 717 | | 708 | | 850 | | 891 | | 897 | | 1,008 | |
Depreciation | | 4,125 | | 3,989 | | 3,897 | | 4,137 | | 3,846 | | 3,771 | | 4,592 | |
| | | | | | | | | | | | | | | |
EBITDA from Continuing Operations Before Special Charges | | $ | 31,410 | | $ | 32,054 | | $ | 30,443 | | $ | 32,602 | | $ | 29,218 | | $ | 28,158 | | $ | 32,268 | |
| | | | | | | | | | | | | | | |
Owners Earnings (b) | | | | | | | | | | | | | | | |
(In thousands) | | | | | | | | | | | | | | | |
| | Mar-04 | | Jun-04 | | Sep-04 | | Dec-04 | | Mar-05 | | Jun-05 | | Sep-05 | |
Net cash flow provided by operating activities | | $ | 5,977 | | $ | 28,153 | | $ | 22,978 | | $ | 28,169 | | $ | 2,023 | | $ | 24,845 | | $ | 4,321 | |
| | | | | | | | | | | | | | | |
Capital expenditures, net | | 782 | | 1,662 | | 768 | | 5,322 | | 2,728 | | 4,058 | | 2,517 | |
Owner Earnings | | $ | 5,195 | | $ | 26,491 | | $ | 22,210 | | $ | 22,847 | | $ | (705 | ) | $ | 20,787 | | $ | 1,804 | |
| | | | | | | | | | | | | | | |
Adjustment for Bond Interest assumed to be paid quarterly | | | | | | | | | | | | | | | |
Owner Earnings | | $ | 5,195 | | $ | 26,491 | | $ | 22,210 | | $ | 22,847 | | $ | (705 | ) | $ | 20,787 | | $ | 1,804 | |
Assumed if Bond Interest was paid quarterly | | 6,900 | | (6,900 | ) | 6,900 | | (6,900 | ) | 6,900 | | (6,900 | ) | 6,900 | |
Adjusted Owner Earnings | | $ | 12,095 | | $ | 19,591 | | $ | 29,110 | | $ | 15,947 | | $ | 6,195 | | $ | 13,887 | | $ | 8,704 | |
EPS from Continuing Operations Before Special Charges (a) | | | | | | | | | | Year | | Year | |
(In thousands, except share and per share amounts) | | | | | | | | | | Ended | | Ended | |
| | Dec-05 | | Mar-06 | | Jun-06 | | Sep-06 | | Dec-04 | | Dec-05 | |
Net Income (Loss) as reported | | $ | 10,414 | | $ | 13,278 | | $ | 15,535 | | $ | 13,090 | | $ | 53,224 | | $ | 47,043 | |
Deduct: Income (Loss) from Discontinued Ops, net of income taxes | | — | | — | | — | | — | | — | | — | |
Income (Loss) from Continuing Operations | | 10,414 | | 13,278 | | 15,535 | | 13,090 | | 53,224 | | 47,043 | |
| | | | | | | | | | | | | |
Change in accounting method | | — | | — | | — | | — | | — | | — | |
SFAS 150 gain on stock call option | | — | | — | | — | | — | | — | | — | |
Cost of sales impact of acquisition inventory adj | | 293 | | — | | — | | — | | — | | 1,064 | |
Write-off of In process R&D | | — | | — | | — | | — | | — | | 385 | |
Restructuring & Other Charges | | 1,801 | | 2,042 | | 622 | | (1,107 | ) | | | 2,878 | |
Total Special Charges (Income) | | 2,094 | | 2,042 | | 622 | | (1,107 | ) | — | | 4,327 | |
| | | | | | | | | | | | | |
After Tax Effect of Special Charges (Income) | | 1,516 | | 1,487 | | 452 | | (767 | ) | — | | 3,110 | |
| | | | | | | | | | | | | |
Net Income from Continuing Operations Before Tax Effected Special Charges | | $ | 11,930 | | $ | 14,765 | | $ | 15,987 | | $ | 12,323 | | $ | 53,224 | | $ | 50,153 | |
| | | | | | | | | | | | | |
Earnings Per Share from Continuing Operations Before Tax Effected Special Charges | | $ | 0.39 | | $ | 0.48 | | $ | 0.51 | | $ | 0.39 | | $ | 1.72 | | $ | 1.62 | |
| | | | | | | | | | | | | |
Diluted Average Common Shares Outstanding | | 30,940,941 | | 31,065,191 | | 31,402,758 | | 31,293,290 | | 30,961,108 | | 30,892,052 | |
| | | | | | | | | | | | | |
EBITDA from Continuing Operations Before Special Charges (a) (b) | | | | | | | | | | Year | | Year | |
(In thousands) | | | | | | | | | | Ended | | Ended | |
| | Dec-05 | | Mar-06 | | Jun-06 | | Sep-06 | | Dec-04 | | Dec-05 | |
Earnings Before Interest and Taxes | | $ | 21,287 | | $ | 24,077 | | $ | 28,016 | | $ | 25,387 | | $ | 107,352 | | $ | 93,693 | |
| | | | | | | | | | | | | |
SFAS 150 gain on stock call option | | — | | — | | — | | — | | — | | — | |
Cost of sales impact of acquisition inventory adj | | 293 | | — | | — | | — | | — | | 1,064 | |
Write-off of In Process R&D | | | | — | | — | | — | | — | | 385 | |
Restructuring & Other Charges | | 1,801 | | 2,042 | | 622 | | (1,107 | ) | | | 2,878 | |
Total Special Charges | | 2,094 | | 2,042 | | 622 | | (1,107 | ) | — | | 4,327 | |
| | | | | | | | | | | | | |
Amortization | | 1,561 | | 1,452 | | 1,518 | | 1,286 | | 3,009 | | 4,357 | |
Depreciation | | 4,829 | | 4,897 | | 5,016 | | 4,922 | | 16,148 | | 17,038 | |
| | | | | | | | | | | | | |
EBITDA from Continuing Operations Before Special Charges | | $ | 29,771 | | $ | 32,468 | | $ | 35,172 | | $ | 30,488 | | $ | 126,509 | | $ | 119,415 | |
| | | | | | | | | | | | | |
Owners Earnings (b) | | | | | | | | | | Year | | Year | |
(In thousands) | | | | | | | | | | Ended | | Ended | |
| | Dec-05 | | Mar-06 | | Jun-06 | | Sep-06 | | Dec-04 | | Dec-05 | |
Net cash flow provided by operating activities | | $ | 27,979 | | $ | 501 | | $ | 20,435 | | $ | 12,439 | | $ | 85,277 | | $ | 59,168 | |
| | | | | | | | | | | | | |
Capital expenditures, net | | 3,074 | | 1,483 | | 3,327 | | 450 | | 8,534 | | 12,377 | |
Owner Earnings | | $ | 24,905 | | $ | (982 | ) | $ | 17,108 | | $ | 11,989 | | $ | 76,743 | | $ | 46,791 | |
| | | | | | | | | | | | | |
Adjustment for Bond Interest assumed to be paid quarterly | | | | | | | | | | | | | |
| | | | | | | | | | | | | |
Owner Earnings | | $ | 24,905 | | $ | (982 | ) | $ | 17,108 | | $ | 11,989 | | $ | 76,743 | | $ | 46,791 | |
Assumed if Bond Interest was paid quarterly | | (6,900 | ) | 6,900 | | (6,900 | ) | 6,900 | | — | | — | |
Adjusted Owner Earnings | | $ | 18,005 | | $ | 5,918 | | $ | 10,208 | | $ | 18,889 | | $ | 76,743 | | $ | 46,791 | |
| | | | | | | | | | | | | | | | | | | | | | | | | | |
(a) “EPS from Continuing Operations Before Special Charges”, “EBITDA from Continuing Operations Before Special Charges” and “Owners Earnings” are not intended to represent Net Earnings (loss) or Net Cash Flow From Operating Activities as defined by Generally Accepted Accounting Principles. These measurements should not be used as an alternative to Net Earnings or Net Cash Flow From Operating Activities as an indicator of operating performance and may not be comparable to similarly titled measures used by other entities. Management believes that these measurements portray a meaningful measure of past operating performance and believes these measurements play an important factor toward the growth of shareholder value over time.