UNITED STATES
SECURITIES AND EXCHANGE COMMISSION
Washington, D.C. 20549
FORM N-CSR
CERTIFIED SHAREHOLDER REPORT OF REGISTERED
MANAGEMENT INVESTMENT COMPANIES
Investment Company Act file number 811-1193
Fidelity Magellan Fund
(Exact name of registrant as specified in charter)
82 Devonshire St., Boston, Massachusetts 02109
(Address of principal executive offices) (Zip code)
Eric D. Roiter, Secretary
82 Devonshire St.
Boston, Massachusetts 02109
(Name and address of agent for service)
Registrant's telephone number, including area code: 617-563-7000
Date of fiscal year end: | March 31 |
| |
Date of reporting period: | September 30, 2005 |
Item 1. Reports to Stockholders
| | Semiannual Report
September 30, 2005
|


| Contents | | | | |
| |
| Chairman’s Message | | 3 | | Ned Johnson’s message to shareholders. |
| Shareholder Expense | | 4 | | An example of shareholder expenses. |
| Example | | | | |
| Investment Changes | | 5 | | A summary of major shifts in the fund’s |
| | | | | investments over the past six months. |
| Investments | | 6 | | A complete list of the fund’s investments |
| | | | | with their market values. |
| Financial Statements | | 16 | | Statements of assets and liabilities, |
| | | | | operations, and changes in net assets, |
| | | | | as well as financial highlights. |
| Notes | | 20 | | Notes to the financial statements. |
| Report of Independent | | 26 | | |
| Registered Public | | | | |
| Accounting Firm | | | | |
| Proxy Voting Results | | 27 | | |
| Board Approval of | | 28 | | |
| Investment Advisory | | | | |
| Contracts and | | | | |
| Management Fees | | | | |
To view a fund’s proxy voting guidelines and proxy voting record for the 12 month period ended
June 30, visit www.fidelity.com/proxyvotingresults or visit the Securities and Exchange Commis
sion’s (SEC) website at www.sec.gov. You may also call 1-800-544-8544 to request a free copy of
the proxy voting guidelines.
Standard & Poor’s, S&P and S&P 500 are registered service marks of The McGraw Hill Companies,
Inc. and have been licensed for use by Fidelity Distributors Corporation.
Other third party marks appearing herein are the property of their respective owners.
All other marks appearing herein are registered or unregistered trademarks or service marks of
FMR Corp. or an affiliated company.
|
| | This report and the financial statements contained herein are submitted for the general information
of the shareholders of the fund. This report is not authorized for distribution to prospective investors
in the fund unless preceded or accompanied by an effective prospectus.
A fund files its complete schedule of portfolio holdings with the SEC for the first and third quarters of
each fiscal year on Form N Q. Forms N Q are available on the SEC’s web site at http://www.sec.gov. A
fund’s Forms N Q may be reviewed and copied at the SEC’s Public Reference Room in Washington, DC.
Information regarding the operation of the SEC’s Public Reference Room may be obtained by calling
1-800-SEC-0330. For a complete list of a fund’s portfolio holdings, view the most recent quarterly
holdings report, semiannual report, or annual report on Fidelity’s web site at
http://www.fidelity.com/holdings.
NOT FDIC INSURED · MAY LOSE VALUE · NO BANK GUARANTEE
Neither the fund nor Fidelity Distributors Corporation is a bank.
|
Semiannual Report 2
Chairman’s Message
(photograph of Edward C. Johnson 3d)
Dear Shareholder:
During the past year or so, much has been reported about the mutual fund industry, and much of it has been more critical than I believe is warranted. Allegations that some companies have been less than forthright with their shareholders have cast a shadow on the entire industry. I continue to find these reports disturbing, and assert that they do not create an accurate picture of the industry overall. Therefore, I would like to remind every one where Fidelity stands on these issues. I will say two things specifically regarding allegations that some mutual fund companies were in violation of the Securities and Exchange Commission’s forward pricing rules or were involved in so called “market timing” activities.
First, Fidelity has no agreements that per mit customers who buy fund shares after 4 p.m. to obtain the 4 p.m. price. This is not a new policy. This is not to say that some one could not deceive the company through fraudulent acts. However, we are extremely diligent in preventing fraud from occurring in this manner and in every other. But I underscore again that Fidelity has no so called “agreements” that sanction illegal practices.
Second, Fidelity continues to stand on record, as we have for years, in opposition to predatory short term trading that adversely affects shareholders in a mutual fund. Back in the 1980s, we initiated a fee which is returned to the fund and, therefore, to investors to discourage this activity. Further, we took the lead several years ago in developing a Fair Value Pricing Policy to prevent market timing on foreign securities in our funds. I am confident we will find other ways to make it more difficult for predatory traders to operate. However, this will only be achieved through close cooperation among regulators, legislators and the industry.
Yes, there have been unfortunate instances of unethical and illegal activity within the mutual fund industry from time to time. That is true of any industry. When this occurs, confessed or convicted offend ers should be dealt with appropriately. But we are still concerned about the risk of over regulation and the quick application of simplistic solutions to intricate problems. Every system can be improved, and we support and applaud well thought out improvements by regulators, legislators and industry representatives that achieve the common goal of building and protecting the value of investors’ holdings.
For nearly 60 years, Fidelity has worked very hard to improve its products and service to justify your trust. When our family founded this company in 1946, we had only a few hundred customers. Today, we serve more than 18 million customers in cluding individual investors and partici pants in retirement plans across America.
Let me close by saying that we do not take your trust in us for granted, and we realize that we must always work to improve all aspects of our service to you. In turn, we urge you to continue your active participation with your financial matters, so that your interests can be well served.
Best regards,
/s/ Edward C. Johnson 3s
Edward C. Johnson 3d
3 Semiannual Report
Shareholder Expense Example
As a shareholder of the Fund, you incur two types of costs: (1) transaction costs, and (2) ongoing costs, including management fees and other Fund expenses. This Example is intended to help you understand your ongoing costs (in dollars) of investing in the Fund and to compare these costs with the ongoing costs of investing in other mutual funds. The Example is based on an investment of $1,000 invested at the beginning of the period and held for the entire period (April 1, 2005 to September 30, 2005).
The first line of the table below provides information about actual account values and actual expenses. You may use the information in this line, together with the amount you invested, to estimate the expenses that you paid over the period. Simply divide your account value by $1,000.00 (for example, an $8,600 account value divided by $1,000.00 = 8.6), then multiply the result by the number in the first line under the heading entitled ���Expenses Paid During Period” to estimate the expenses you paid on your account during this period. A small balance maintenance fee of $12.00 that is charged once a year may apply for certain accounts with a value of less than $2,000. This fee is not included in the table below. If it was, the estimate of expenses you paid during the period would be higher, and your ending account value lower, by this amount.
Hypothetical Example for Comparison Purposes
The second line of the table below provides information about hypothetical account values and hypothetical expenses based on the Fund’s actual expense ratio and an assumed rate of return of 5% per year before expenses, which is not the Fund’s actual return. The hypothetical account values and expenses may not be used to estimate the actual ending account balance or expenses you paid for the period. You may use this information to compare the ongoing costs of investing in the Fund and other funds. To do so, compare this 5% hypothetical example with the 5% hypothetical examples that appear in the share holder reports of the other funds. A small balance maintenance fee of $12.00 that is charged once a year may apply for certain accounts with a value of less than $2,000. This fee is not included in the table below. If it was, the estimate of expenses you paid during the period would be higher, and your ending account value lower, by this amount.
Please note that the expenses shown in the table are meant to highlight your ongoing costs only and do not reflect any transaction costs. Therefore, the second line of the table is useful in comparing ongoing costs only, and will not help you determine the relative total costs of owning different funds.
| | | | | | | | | | | Expenses Paid |
| | | | | Beginning | | Ending | | During Period* |
| | | | | Account Value | | Account Value | | April 1, 2005 |
| | | | | April 1, 2005 | | September 30, 2005 | | to September 30, 2005 |
| Actual | | $ | | 1,000.00 | | $ | | 1,051.20 | | $ | | 2.93 |
| Hypothetical (5% return per | | | | | | | | | | | | |
| year before expenses) | | $ | | 1,000.00 | | $ | | 1,022.21 | | $ | | 2.89 |
* Expenses are equal to the Fund’s annualized expense ratio of .57%; multiplied by the average account value over the period, multiplied by 183/365 (to reflect the one-half year period).
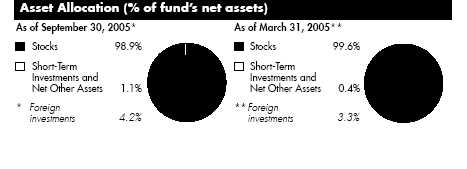
Investment Changes
| Top Ten Stocks as of September 30, 2005 | | | | |
| | | % of fund’s | | % of fund’s net assets |
| | | net assets | | 6 months ago |
| General Electric Co. | | 4.2 | | 4.1 |
| Microsoft Corp. | | 3.5 | | 3.0 |
| Exxon Mobil Corp. | | 3.4 | | 3.0 |
| American International Group, Inc. | | 2.9 | | 2.7 |
| Home Depot, Inc. | | 2.3 | | 2.2 |
| Citigroup, Inc. | | 2.1 | | 2.7 |
| Johnson & Johnson | | 2.0 | | 1.9 |
| Intel Corp. | | 1.9 | | 1.7 |
| Lowe’s Companies, Inc. | | 1.7 | | 1.7 |
| Viacom, Inc. Class B (non vtg.) | | 1.7 | | 2.1 |
| | | 25.7 | | |
| Top Five Market Sectors as of September 30, 2005 | | |
| | | % of fund’s | | % of fund’s net assets |
| | | net assets | | 6 months ago |
| Information Technology | | 20.6 | | 17.5 |
| Financials | | 16.8 | | 20.3 |
| Consumer Discretionary | | 16.0 | | 16.8 |
| Health Care | | 12.8 | | 11.4 |
| Energy | | 12.0 | | 10.7 |
5 Semiannual Report
Investments September 30, 2005
Showing Percentage of Net Assets
Common Stocks 98.9%
| | | Shares | | Value (Note 1) |
| | | | | | | (000s) |
| |
| CONSUMER DISCRETIONARY – 16.0% | | | | | | |
| Hotels, Restaurants & Leisure 0.8% | | | | | | |
| McDonald’s Corp. | | 5,047,400 | | | $ | 169,037 |
| Starwood Hotels & Resorts Worldwide, Inc. unit | | 3,973,827 | | | | 227,184 |
| | | | | | | 396,221 |
| Household Durables – 0.2% | | | | | | |
| Centex Corp. | | 1,000,000 | | | | 64,580 |
| Garmin Ltd. (d) | | 700,000 | | | | 47,481 |
| | | | | | | 112,061 |
| Internet & Catalog Retail 0.8% | | | | | | |
| Amazon.com, Inc. (a) | | 526,900 | | | | 23,869 |
| eBay, Inc. (a) | | 6,100,000 | | | | 251,320 |
| Expedia, Inc., Delaware (a) | | 2,500,000 | | | | 49,525 |
| IAC/InterActiveCorp (a) | | 2,500,000 | | | | 63,375 |
| | | | | | | 388,089 |
| Media – 6.8% | | | | | | |
| Clear Channel Communications, Inc. | | 14,857,854 | | | | 488,675 |
| EchoStar Communications Corp. Class A | | 2,400,000 | | | | 70,968 |
| Gannett Co., Inc. | | 1,392,300 | | | | 95,832 |
| McGraw Hill Companies, Inc. | | 1,332,000 | | | | 63,989 |
| News Corp.: | | | | | | |
| Class A | | 8,160,000 | | | | 127,214 |
| Class B | | 10,600,000 | | | | 174,900 |
| Omnicom Group, Inc. | | 3,401,576 | | | | 284,474 |
| Time Warner, Inc. | | 33,004,754 | | | | 597,716 |
| Tribune Co. | | 1,633,922 | | | | 55,374 |
| Univision Communications, Inc. Class A (a) | | 2,590,000 | | | | 68,713 |
| Viacom, Inc. Class B (non-vtg.) | | 27,328,537 | | | | 902,115 |
| Walt Disney Co. | | 17,601,500 | | | | 424,724 |
| XM Satellite Radio Holdings, Inc. Class A (a) | | 5,000,000 | | | | 179,550 |
| | | | | | | 3,534,244 |
| Multiline Retail – 1.3% | | | | | | |
| Federated Department Stores, Inc. | | 2,247,300 | | | | 150,277 |
| JCPenney Co., Inc. | | 2,000,000 | | | | 94,840 |
| Kohl’s Corp. (a) | | 3,200,000 | | | | 160,576 |
| Target Corp. | | 5,100,000 | | | | 264,843 |
| | | | | | | 670,536 |
| Specialty Retail – 5.5% | | | | | | |
| Best Buy Co., Inc. | | 3,673,350 | | | | 159,901 |
| Circuit City Stores, Inc. | | 1,000,000 | | | | 17,160 |
See accompanying notes which are an integral part of the financial statements.
| Common Stocks continued | | | | |
| | | | | Shares | | Value (Note 1) |
| | | | | | | (000s) |
| |
| CONSUMER DISCRETIONARY – continued | | | | |
| Specialty Retail – continued | | | | |
| Home Depot, Inc. | | | | 31,145,800 | | $ 1,187,901 |
| Lowe’s Companies, Inc. | | | | 14,210,000 | | 915,124 |
| Office Depot, Inc. (a) | | | | 1,700,000 | | 50,490 |
| Staples, Inc. | | | | 18,918,000 | | 403,332 |
| TJX Companies, Inc. | | | | 7,000,000 | | 143,360 |
| | | | | | | 2,877,268 |
| Textiles, Apparel & Luxury Goods – 0.6% | | | | |
| Liz Claiborne, Inc. | | | | 4,490,000 | | 176,547 |
| NIKE, Inc. Class B | | | | 1,798,500 | | 146,901 |
| | | | | | | 323,448 |
| |
| TOTAL CONSUMER DISCRETIONARY | | | | 8,301,867 |
| |
| CONSUMER STAPLES 7.3% | | | | |
| Beverages – 1.2% | | | | | | |
| PepsiCo, Inc. | | | | 6,024,700 | | 341,661 |
| The Coca-Cola Co. | | | | 6,266,100 | | 270,633 |
| | | | | | | 612,294 |
| Food & Staples Retailing – 2.8% | | | | |
| CVS Corp. | | | | 23,841,972 | | 691,656 |
| Safeway, Inc. | | | | 914,000 | | 23,398 |
| Wal-Mart Stores, Inc. | | | | 14,894,240 | | 652,666 |
| Walgreen Co. | | | | 2,345,900 | | 101,929 |
| | | | | | | 1,469,649 |
| Food Products 0.0% | | | | | | |
| Nestle SA (Reg.) | | | | 36,600 | | 10,719 |
| Household Products – 1.1% | | | | |
| Colgate-Palmolive Co. | | | | 3,379,700 | | 178,414 |
| Kimberly Clark Corp. | | | | 1,700,000 | | 101,201 |
| Procter & Gamble Co. | | | | 4,858,800 | | 288,904 |
| | | | | | | 568,519 |
| Personal Products 0.9% | | | | |
| Gillette Co. | | | | 7,706,200 | | 448,501 |
| Tobacco 1.3% | | | | | | |
| Altria Group, Inc. | | | | 9,105,200 | | 671,144 |
| |
| TOTAL CONSUMER STAPLES | | | | 3,780,826 |
See accompanying notes which are an integral part of the financial statements.
| Investments continued | | | | | | |
| |
| |
| Common Stocks continued | | | | | | |
| | | Shares | | Value (Note 1) |
| | | | | | | (000s) |
| |
| ENERGY 12.0% | | | | | | |
| Energy Equipment & Services – 4.7% | | | | | | |
| Baker Hughes, Inc. | | 8,221,000 | | | $ | 490,629 |
| BJ Services Co. | | 1,200,000 | | | | 43,188 |
| Cooper Cameron Corp. (a) | | 1,295,500 | | | | 95,776 |
| Diamond Offshore Drilling, Inc. | | 800,000 | | | | 49,000 |
| GlobalSantaFe Corp. | | 600,000 | | | | 27,372 |
| Halliburton Co. | | 6,299,600 | | | | 431,649 |
| Nabors Industries Ltd. (a) | | 1,800,000 | | | | 129,294 |
| Noble Corp. | | 300,000 | | | | 20,538 |
| Pride International, Inc. (a) | | 1,500,000 | | | | 42,765 |
| Schlumberger Ltd. (NY Shares) | | 8,728,700 | | | | 736,528 |
| Smith International, Inc. | | 557,200 | | | | 18,560 |
| Transocean, Inc. (a) | | 3,612,563 | | | | 221,486 |
| Weatherford International Ltd. (a) | | 2,020,000 | | | | 138,693 |
| | | | | | | 2,445,478 |
| Oil, Gas & Consumable Fuels – 7.3% | | | | | | |
| Apache Corp. | | 3,003,210 | | | | 225,901 |
| BP PLC sponsored ADR | | 4,768,842 | | | | 337,872 |
| Burlington Resources, Inc. | | 3,923,850 | | | | 319,087 |
| Chevron Corp. | | 4,069,100 | | | | 263,393 |
| ConocoPhillips | | 8,304,118 | | | | 580,541 |
| EnCana Corp. | | 800,000 | | | | 46,688 |
| Exxon Mobil Corp. | | 27,922,136 | | | | 1,774,173 |
| Occidental Petroleum Corp. | | 3,021,400 | | | | 258,118 |
| | | | | | | 3,805,773 |
| |
| TOTAL ENERGY | | | | | | 6,251,251 |
| |
| FINANCIALS – 16.8% | | | | | | |
| Capital Markets 2.2% | | | | | | |
| Bank of New York Co., Inc. | | 2,204,400 | | | | 64,831 |
| E*TRADE Financial Corp. (a) | | 5,500,000 | | | | 96,800 |
| Goldman Sachs Group, Inc. | | 3,648,500 | | | | 443,585 |
| Merrill Lynch & Co., Inc. | | 8,642,900 | | | | 530,242 |
| Morgan Stanley | | 500,000 | | | | 26,970 |
| | | | | | | 1,162,428 |
| Commercial Banks – 3.9% | | | | | | |
| Bank of America Corp. | | 21,222,808 | | | | 893,480 |
| Synovus Financial Corp. | | 3,959,775 | | | | 109,765 |
| U.S. Bancorp, Delaware | | 1,955,674 | | | | 54,915 |
See accompanying notes which are an integral part of the financial statements.
| Common Stocks continued | | | | | | |
| | | Shares | | Value (Note 1) |
| | | | | (000s) |
| |
| FINANCIALS – continued | | | | | | |
| Commercial Banks – continued | | | | | | |
| Wachovia Corp. | | 6,146,094 | | | $ | 292,493 |
| Wells Fargo & Co. | | 11,461,200 | | | | 671,282 |
| | | | | | | 2,021,935 |
| Consumer Finance – 1.6% | | | | | | |
| American Express Co. | | 12,095,100 | | | | 694,743 |
| Capital One Financial Corp. | | 500,000 | | | | 39,760 |
| MBNA Corp. | | 4,392,950 | | | | 108,242 |
| | | | | | | 842,745 |
| Diversified Financial Services – 3.0% | | | | | | |
| Citigroup, Inc. | | 24,115,753 | | | | 1,097,749 |
| Indiabulls Financial Services Ltd. GDR (e) | | 3,433,108 | | | | 15,465 |
| JPMorgan Chase & Co. | | 12,430,408 | | | | 421,764 |
| | | | | | | 1,534,978 |
| Insurance – 5.0% | | | | | | |
| ACE Ltd. | | 1,000,000 | | | | 47,070 |
| AFLAC, Inc. | | 4,147,000 | | | | 187,859 |
| American International Group, Inc. | | 24,472,570 | | | | 1,516,320 |
| Berkshire Hathaway, Inc. Class A (a) | | 557 | | | | 45,674 |
| Hartford Financial Services Group, Inc. | | 3,000,000 | | | | 231,510 |
| MetLife, Inc. | | 5,000,000 | | | | 249,150 |
| The St. Paul Travelers Companies, Inc. | | 6,558,817 | | | | 294,294 |
| W.R. Berkley Corp. | | 1,237,500 | | | | 48,857 |
| | | | | | | 2,620,734 |
| Real Estate 0.4% | | | | | | |
| Equity Office Properties Trust | | 2,286,400 | | | | 74,788 |
| Equity Residential (SBI) | | 3,343,000 | | | | 126,533 |
| | | | | | | 201,321 |
| Thrifts & Mortgage Finance – 0.7% | | | | | | |
| Countrywide Financial Corp. | | 821,567 | | | | 27,095 |
| Fannie Mae | | 3,951,900 | | | | 177,124 |
| Golden West Financial Corp., Delaware | | 2,700,000 | | | | 160,353 |
| | | | | | | 364,572 |
| |
| TOTAL FINANCIALS | | | | | | 8,748,713 |
| |
| HEALTH CARE – 12.8% | | | | | | |
| Biotechnology – 2.8% | | | | | | |
| Amgen, Inc. (a) | | 4,302,230 | | | | 342,759 |
See accompanying notes which are an integral part of the financial statements.
| Investments continued | | | | | | |
| |
| |
| Common Stocks continued | | | | | | |
| | | Shares | | Value (Note 1) |
| | | | | | | (000s) |
| |
| HEALTH CARE – continued | | | | | | |
| Biotechnology – continued | | | | | | |
| Biogen Idec, Inc. (a) | | 2,118,300 | | | $ | 83,630 |
| Charles River Laboratories International, Inc. (a) | | 804,700 | | | | 35,101 |
| Genentech, Inc. (a) | | 7,884,000 | | | | 663,912 |
| Genzyme Corp. (a) | | 1,300,000 | | | | 93,132 |
| Gilead Sciences, Inc. (a) | | 3,600,000 | | | | 175,536 |
| MedImmune, Inc. (a) | | 1,000,000 | | | | 33,650 |
| Millennium Pharmaceuticals, Inc. (a) | | 1,700,000 | | | | 15,861 |
| | | | | | | 1,443,581 |
| Health Care Equipment & Supplies – 1.8% | | | | | | |
| Baxter International, Inc. | | 3,200,000 | | | | 127,584 |
| Boston Scientific Corp. (a) | | 344,000 | | | | 8,039 |
| C.R. Bard, Inc. | | 200,000 | | | | 13,206 |
| Gen-Probe, Inc. (a) | | 500,000 | | | | 24,725 |
| Medtronic, Inc. | | 9,000,000 | | | | 482,580 |
| St. Jude Medical, Inc. (a) | | 1,800,000 | | | | 84,240 |
| Thermo Electron Corp. (a) | | 1,471,500 | | | | 45,469 |
| Waters Corp. (a) | | 3,198,600 | | | | 133,062 |
| | | | | | | 918,905 |
| Health Care Providers & Services – 2.5% | | | | | | |
| Aetna, Inc. | | 300,000 | | | | 25,842 |
| Cardinal Health, Inc. | | 7,799,336 | | | | 494,790 |
| UnitedHealth Group, Inc. | | 14,026,000 | | | | 788,261 |
| WebMD Health Corp. Class A | | 95,700 | | | | 2,359 |
| WellPoint, Inc. (a) | | 300,000 | | | | 22,746 |
| | | | | | | 1,333,998 |
| Pharmaceuticals – 5.7% | | | | | | |
| Abbott Laboratories | | 6,046,500 | | | | 256,372 |
| Allergan, Inc. | | 550,000 | | | | 50,391 |
| Forest Laboratories, Inc. (a) | | 1,200,000 | | | | 46,764 |
| Johnson & Johnson | | 16,315,200 | | | | 1,032,426 |
| Pfizer, Inc. | | 35,799,895 | | | | 893,923 |
| Schering-Plough Corp. | | 4,732,700 | | | | 99,623 |
| Teva Pharmaceutical Industries Ltd. sponsored ADR | | 3,000,000 | | | | 100,260 |
| Wyeth | | 11,021,300 | | | | 509,956 |
| | | | | | | 2,989,715 |
| |
| TOTAL HEALTH CARE | | | | | | 6,686,199 |
See accompanying notes which are an integral part of the financial statements.
| Common Stocks continued | | | | | | |
| | | Shares | | Value (Note 1) |
| | | | | (000s) |
| |
| INDUSTRIALS – 10.0% | | | | | | |
| Aerospace & Defense – 1.7% | | | | | | |
| Honeywell International, Inc. | | 7,780,400 | | | $ | 291,765 |
| Lockheed Martin Corp. | | 2,300,000 | | | | 140,392 |
| The Boeing Co. | | 1,250,000 | | | | 84,938 |
| United Technologies Corp. | | 7,200,000 | | | | 373,248 |
| | | | | | | 890,343 |
| Air Freight & Logistics – 0.1% | | | | | | |
| United Parcel Service, Inc. Class B | | 600,000 | | | | 41,478 |
| Building Products 0.3% | | | | | | |
| Masco Corp. | | 5,665,200 | | | | 173,808 |
| Commercial Services & Supplies – 0.7% | | | | | | |
| Cendant Corp. | | 11,000,000 | | | | 227,040 |
| ChoicePoint, Inc. (a) | | 839,066 | | | | 36,222 |
| Monster Worldwide, Inc. (a) | | 500,000 | | | | 15,355 |
| Robert Half International, Inc. | | 2,124,900 | | | | 75,625 |
| | | | | | | 354,242 |
| Electrical Equipment – 0.4% | | | | | | |
| Emerson Electric Co. | | 2,732,400 | | | | 196,186 |
| Industrial Conglomerates – 6.1% | | | | | | |
| 3M Co. | | 3,926,240 | | | | 288,029 |
| General Electric Co. | | 64,615,900 | | | | 2,175,618 |
| Tyco International Ltd. | | 25,407,455 | | | | 707,598 |
| | | | | | | 3,171,245 |
| Machinery – 0.7% | | | | | | |
| Caterpillar, Inc. | | 3,500,000 | | | | 205,625 |
| Dover Corp. | | 1,000,000 | | | | 40,790 |
| Ingersoll-Rand Co. Ltd. Class A | | 3,937,700 | | | | 150,538 |
| Trivest 1992 Special Fund Ltd. (a)(f) | | 26,600,000 | | | | 266 |
| | | | | | | 397,219 |
| |
| TOTAL INDUSTRIALS | | | | | | 5,224,521 |
| |
| INFORMATION TECHNOLOGY – 20.6% | | | | | | |
| Communications Equipment – 4.3% | | | | | | |
| Adtran, Inc. | | 500,000 | | | | 15,750 |
| Cisco Systems, Inc. (a) | | 42,308,200 | | | | 758,586 |
| Comverse Technology, Inc. (a) | | 500,000 | | | | 13,135 |
| Juniper Networks, Inc. (a) | | 6,700,000 | | | | 159,393 |
| Lucent Technologies, Inc. warrants 12/10/07 (a) | | 1,201,054 | | | | 1,141 |
See accompanying notes which are an integral part of the financial statements.
11 Semiannual Report
| Investments continued | | | | | | |
| |
| |
| Common Stocks continued | | | | | | |
| | | Shares | | Value (Note 1) |
| | | | | (000s) |
| |
| INFORMATION TECHNOLOGY – continued | | | | | | |
| Communications Equipment – continued | | | | | | |
| Motorola, Inc. | | 19,200,000 | | | $ | 424,128 |
| Nokia Corp. sponsored ADR | | 4,000,000 | | | | 67,640 |
| QUALCOMM, Inc. | | 11,282,000 | | | | 504,870 |
| Research In Motion Ltd. (a) | | 1,734,200 | | | | 118,288 |
| SiRF Technology Holdings, Inc. (a) | | 500,000 | | | | 15,065 |
| Sonus Networks, Inc. (a) | | 1,000,000 | | | | 5,800 |
| Telefonaktiebolaget LM Ericsson (B Shares) sponsored ADR | | 5,000,000 | | | | 184,200 |
| | | | | | | 2,267,996 |
| Computers & Peripherals – 3.1% | | | | | | |
| Apple Computer, Inc. (a) | | 5,300,000 | | | | 284,133 |
| Dell, Inc. (a) | | 19,362,400 | | | | 662,194 |
| EMC Corp. (a) | | 20,816,900 | | | | 269,371 |
| Hewlett-Packard Co. | | 2,300,000 | | | | 67,160 |
| International Business Machines Corp. | | 3,967,600 | | | | 318,281 |
| Lexmark International, Inc. Class A (a) | | 222,000 | | | | 13,553 |
| | | | | | | 1,614,692 |
| Electronic Equipment & Instruments – 0.1% | | | | | | |
| Flextronics International Ltd. (a) | | 3,125,000 | | | | 40,156 |
| Jabil Circuit, Inc. (a) | | 1,000,000 | | | | 30,920 |
| | | | | | | 71,076 |
| Internet Software & Services – 3.1% | | | | | | |
| Google, Inc. Class A (sub. vtg.) (a) | | 2,811,800 | | | | 889,822 |
| Yahoo!, Inc. (a) | | 20,986,600 | | | | 710,187 |
| | | | | | | 1,600,009 |
| IT Services – 0.4% | | | | | | |
| First Data Corp. | | 5,150,000 | | | | 206,000 |
| Semiconductors & Semiconductor Equipment – 4.4% | | | | | | |
| Advanced Micro Devices, Inc. (a) | | 500,000 | | | | 12,600 |
| Altera Corp. (a) | | 500,000 | | | | 9,555 |
| Analog Devices, Inc. | | 6,119,732 | | | | 227,287 |
| Applied Materials, Inc. | | 3,500,000 | | | | 59,360 |
| Broadcom Corp. Class A (a) | | 3,900,000 | | | | 182,949 |
| Freescale Semiconductor, Inc.: | | | | | | |
| Class A (a) | | 3,000,000 | | | | 70,230 |
| Class B (a) | | 1,819,968 | | | | 42,915 |
| Ikanos Communications, Inc. | | 100,000 | | | | 1,229 |
| Intel Corp. | | 40,176,900 | | | | 990,361 |
| Intersil Corp. Class A | | 1,069,700 | | | | 23,298 |
See accompanying notes which are an integral part of the financial statements.
| Common Stocks continued | | | | | | |
| | | Shares | | Value (Note 1) |
| | | | | (000s) |
| |
| INFORMATION TECHNOLOGY – continued | | | | | | |
| Semiconductors & Semiconductor Equipment – continued | | | | | | |
| KLA Tencor Corp. | | 1,800,000 | | | $ | 87,768 |
| Lam Research Corp. (a) | | 499,200 | | | | 15,211 |
| Taiwan Semiconductor Manufacturing Co. Ltd. sponsored ADR | | 14,093,720 | | | | 115,850 |
| Texas Instruments, Inc. | | 11,697,700 | | | | 396,552 |
| Xilinx, Inc. | | 1,700,000 | | | | 47,345 |
| | | | | | | 2,282,510 |
| Software 5.2% | | | | | | |
| Adobe Systems, Inc. | | 1,416,094 | | | | 42,270 |
| Autodesk, Inc. (a) | | 500,000 | | | | 23,220 |
| BEA Systems, Inc. (a) | | 3,150,000 | | | | 28,287 |
| Citrix Systems, Inc. (a) | | 1,440,000 | | | | 36,202 |
| FileNET Corp. (a) | | 550,000 | | | | 15,345 |
| Macromedia, Inc. (a) | | 415,000 | | | | 16,878 |
| Macrovision Corp. (a) | | 1,100,000 | | | | 21,010 |
| Microsoft Corp. | | 69,842,900 | | | | 1,797,058 |
| Oracle Corp. (a) | | 25,895,000 | | | | 320,839 |
| Quest Software, Inc. (a) | | 1,631,000 | | | | 24,579 |
| SAP AG sponsored ADR | | 1,950,000 | | | | 84,494 |
| Symantec Corp. (a) | | 13,076,468 | | | | 296,313 |
| | | | | | | 2,706,495 |
| |
| TOTAL INFORMATION TECHNOLOGY | | | | | | 10,748,778 |
| |
| MATERIALS 0.8% | | | | | | |
| Chemicals – 0.5% | | | | | | |
| Dow Chemical Co. | | 4,450,000 | | | | 185,432 |
| Lyondell Chemical Co. | | 901,100 | | | | 25,789 |
| Praxair, Inc. | | 1,000,000 | | | | 47,930 |
| | | | | | | 259,151 |
| Containers & Packaging – 0.0% | | | | | | |
| Packaging Corp. of America | | 400,000 | | | | 7,764 |
| Smurfit-Stone Container Corp. (a) | | 1,300,000 | | | | 13,468 |
| | | | | | | 21,232 |
| Metals & Mining – 0.2% | | | | | | |
| Alcoa, Inc. | | 4,100,000 | | | | 100,122 |
See accompanying notes which are an integral part of the financial statements.
13 Semiannual Report
| Investments continued | | | | | | | | |
| |
| |
| Common Stocks continued | | | | | | | | |
| | | | | | | Shares | | Value (Note 1) |
| | | | | | | | | (000s) |
| |
| MATERIALS – continued | | | | | | | | | | |
| Paper & Forest Products 0.1% | | | | | | | | |
| Weyerhaeuser Co. | | | | | | 800,000 | | | $ | 55,000 |
| |
| TOTAL MATERIALS | | | | | | | | | | 435,505 |
| |
| TELECOMMUNICATION SERVICES – 2.6% | | | | | | |
| Diversified Telecommunication Services – 1.9% | | | | | | |
| BellSouth Corp. | | | | | | 9,403,100 | | | | 247,302 |
| SBC Communications, Inc. | | | | 13,577,214 | | | | 325,446 |
| Verizon Communications, Inc. | | | | 11,933,004 | | | | 390,090 |
| | | | | | | | | | | 962,838 |
| Wireless Telecommunication Services – 0.7% | | | | | | |
| Sprint Nextel Corp. | | | | | | 11,661,020 | | | | 277,299 |
| Vodafone Group PLC sponsored ADR | | | | 3,632,200 | | | | 94,328 |
| | | | | | | | | | | 371,627 |
| |
| TOTAL TELECOMMUNICATION SERVICES | | | | | | 1,334,465 |
| |
| TOTAL COMMON STOCKS | | | | | | | | |
| (Cost $29,784,063) | | | | | | | | 51,512,125 |
| |
| Money Market Funds 1.8% | | | | | | | | |
| |
| Fidelity Cash Central Fund, 3.82% (b) | | | | 913,429,464 | | | | 913,429 |
| Fidelity Securities Lending Cash Central Fund, | | | | | | |
| 3.84% (b)(c) | | | | | | 12,128,825 | | | | 12,129 |
| TOTAL MONEY MARKET FUNDS | | | | | | | | |
| (Cost $925,558) | | | | | | | | | | 925,558 |
| |
| TOTAL INVESTMENT PORTFOLIO 100.7% | | | | | | |
| (Cost $30,709,621) | | | | | | | | 52,437,683 |
| |
| NET OTHER ASSETS – (0.7)% | | | | | | | | (354,171) |
| NET ASSETS 100% | | | | | | | | | | | $ | 52,083,512 |
| |
| Legend | | | | | | | | | | |
| (a) Non-income producing | | | | | | | | |
See accompanying notes which are an integral part of the financial statements.
(b) Affiliated fund that is available only to
investment companies and other
accounts managed by Fidelity
Investments. The rate quoted is the
annualized seven-day yield of the fund
at period end. A complete unaudited
listing of the fund’s holdings as of its
most recent quarter end is available
upon request.
(c) Investment made with cash collateral
received from securities on loan.
(d) Security or a portion of the security is on
loan at period end.
(e) Security exempt from registration under
Rule 144A of the Securities Act of 1933.
These securities may be resold in
transactions exempt from registration,
normally to qualified institutional buyers.
At the period end, the value of these
securities amounted to $15,465,000 or
0.0% of net assets.
(f) Restricted securities – Investment in
securities not registered under the
Securities Act of 1933 (excluding 144A
issues). At the end of the period, the
value of restricted securities (excluding
144A issues) amounted to $266,000 or
0.0% of net assets.
|
Additional information on each holding is
as follows:
|
| | | Acquisition | | Acquisition |
| Security | | Date | | Cost (000s) |
| Trivest 1992 | | | | | | |
| Special Fund Ltd. | | 7/2/92 | | | $ | 0 |
Income Tax Information
At March 31, 2005, the fund had a capital
loss carryforward of approximately
$3,456,976,000 of which $821,534,000,
$2,372,897,000 and $262,545,000 will
expire on March 31, 2010, 2011 and
2012, respectively.
|
See accompanying notes which are an integral part of the financial statements.
15 Semiannual Report
| Financial Statements | | | | | | |
| |
| |
| Statement of Assets and Liabilities | | | | | | |
| Amounts in thousands (except per share amount) | | | | September 30, 2005 |
| |
| Assets | | | | | | | | |
| Investment in securities, at value (including securities | | | | | | |
| loaned of $12,100) (cost $30,709,621) | | | | | | | | |
| See accompanying schedule | | | | | | $ | | 52,437,683 |
| Cash | | | | | | | | 1,425 |
| Receivable for investments sold | | | | | | | | 74,406 |
| Receivable for fund shares sold | | | | | | | | 32,650 |
| Dividends receivable | | | | | | | | 48,498 |
| Interest receivable | | | | | | | | 1,155 |
| Prepaid expenses | | | | | | | | 33 |
| Other affiliated receivables | | | | | | | | 660 |
| Other receivables | | | | | | | | 1,714 |
| Total assets | | | | | | | | 52,598,224 |
| |
| Liabilities | | | | | | | | |
| Payable for investments purchased | | $ | | 18,963 | | | | |
| Payable for fund shares redeemed | | | | 458,215 | | | | |
| Accrued management fee | | | | 15,023 | | | | |
| Other affiliated payables | | | | 10,131 | | | | |
| Other payables and accrued expenses | | | | 251 | | | | |
| Collateral on securities loaned, at value | | | | 12,129 | | | | |
| Total liabilities | | | | | | | | 514,712 |
| |
| Net Assets | | | | | | $ | | 52,083,512 |
| Net Assets consist of: | | | | | | | | |
| Paid in capital | | | | | | $ | | 31,337,413 |
| Undistributed net investment income | | | | | | | | 269,490 |
| Accumulated undistributed net realized gain (loss) on | | | | | | |
| investments and foreign currency transactions | | | | | | (1,251,454) |
| Net unrealized appreciation (depreciation) on | | | | | | | | |
| investments and assets and liabilities in foreign | | | | | | |
| currencies | | | | | | | | 21,728,063 |
| Net Assets, for 491,940 shares outstanding | | | | | | $ | | 52,083,512 |
| Net Asset Value, offering price and redemption price per | | | | | | |
| share ($52,083,512 ÷ 491,940 shares) | | | | | | $ | | 105.87 |
See accompanying notes which are an integral part of the financial statements.
| Statement of Operations | | | | | | |
| Amounts in thousands | | | | Six months ended September 30, 2005 |
| |
| Investment Income | | | | | | |
| Dividends | | | | $ | | 405,815 |
| Interest | | | | | | 9,233 |
| Security lending | | | | | | 487 |
| Total income | | | | | | 415,535 |
| |
| Expenses | | | | | | |
| Management fee | | | | | | |
| Basic fee | | $ | | 157,258 | | |
| Performance adjustment | | | | (52,984) | | |
| Transfer agent fees | | | | 50,642 | | |
| Accounting and security lending fees | | | | 1,217 | | |
| Independent trustees’ compensation | | | | 127 | | |
| Depreciation in deferred trustee compensation account | | | | (6) | | |
| Custodian fees and expenses | | | | 426 | | |
| Registration fees | | | | 47 | | |
| Audit | | | | 233 | | |
| Legal | | | | 150 | | |
| Interest | | | | 24 | | |
| Miscellaneous | | | | 342 | | |
| Total expenses before reductions | | | | 157,476 | | |
| Expense reductions | | | | (3,535) | | 153,941 |
| |
| Net investment income (loss) | | | | | | 261,594 |
| Realized and Unrealized Gain (Loss) | | | | | | |
| Net realized gain (loss) on: | | | | | | |
| Investment securities | | | | 2,364,028 | | |
| Foreign currency transactions | | | | 1 | | |
| Total net realized gain (loss) | | | | | | 2,364,029 |
| Change in net unrealized appreciation (depreciation) on: | | | | | | |
| Investment securities | | | | 121,113 | | |
| Assets and liabilities in foreign currencies | | | | 1 | | |
| Total change in net unrealized appreciation | | | | | | |
| (depreciation) | | | | | | 121,114 |
| Net gain (loss) | | | | | | 2,485,143 |
| Net increase (decrease) in net assets resulting from | | | | | | |
| operations | | | | $ | | 2,746,737 |
See accompanying notes which are an integral part of the financial statements.
17 Semiannual Report
| Financial Statements continued | | | | | | | | |
| |
| |
| Statement of Changes in Net Assets | | | | | | | | |
| | | Six months ended | | | | Year ended |
| | | | | September 30, | | | | March 31, |
| Amounts in thousands | | | | 2005 | | | | 2005 |
| Increase (Decrease) in Net Assets | | | | | | | | |
| Operations | | | | | | | | |
| Net investment income (loss) | | $ | | 261,594 | | $ | | 790,819 |
| Net realized gain (loss) | | | | 2,364,029 | | | | 1,094,209 |
| Change in net unrealized appreciation (depreciation) . | | | | 121,114 | | | | 66,480 |
| Net increase (decrease) in net assets resulting from | | | | | | | | |
| operations | | | | 2,746,737 | | | | 1,951,508 |
| Distributions to shareholders from net investment income . | | | | (153,930) | | | | (772,150) |
| Share transactions | | | | | | | | |
| Proceeds from sales of shares | | | | 1,678,437 | | | | 4,911,554 |
| Reinvestment of distributions | | | | 150,079 | | | | 753,651 |
| Cost of shares redeemed | | | | (9,229,025) | | | | (16,750,341) |
| Net increase (decrease) in net assets resulting from | | | | | | | | |
| share transactions | | | | (7,400,509) | | | | (11,085,136) |
| Total increase (decrease) in net assets | | | | (4,807,702) | | | | (9,905,778) |
| |
| Net Assets | | | | | | | | |
| Beginning of period | | | | 56,891,214 | | | | 66,796,992 |
| End of period (including undistributed net investment | | | | | | | | |
| income of $269,490 and undistributed net invest- | | | | | | | | |
| ment income of $161,826, respectively) | | $ | | 52,083,512 | | $ | | 56,891,214 |
| |
| Other Information | | | | | | | | |
| Shares | | | | | | | | |
| Sold | | | | 16,296 | | | | 49,445 |
| Issued in reinvestment of distributions | | | | 1,501 | | | | 7,451 |
| Redeemed | | | | (89,142) | | | | (167,452) |
| Net increase (decrease) | | | | (71,345) | | | | (110,556) |
See accompanying notes which are an integral part of the financial statements.
| Financial Highlights | | | | | | | | | | |
| |
| | | Six months ended | | | | | | | | | | |
| | | September 30, | | | | Years ended March 31, | | |
| | | 2005 | | 2005 | | 2004 | | 2003 | | 2002 | | 2001 |
| Selected Per Share Data | | | | | | | | | | | | |
| Net asset value, | | | | | | | | | | | | |
| beginning of period . | | $101.00 | | $ 99.13 | | $ 76.69 | | $102.55 | | $104.50 | | $143.26 |
| Income from Investment | | | | | | | | | | | | |
| Operations | | | | | | | | | | | | |
| Net investment in- | | | | | | | | | | | | |
| come (loss)D | | 49 | | 1.26E | | .76 | | .69 | | .45 | | .37 |
| Net realized and un | | | | | | | | | | | | |
| realized gain (loss) | | 4.66 | | 1.85 | | 22.44 | | (25.91) | | (1.14) | | (34.17) |
| Total from investment | | | | | | | | | | | | |
| operations | | 5.15 | | 3.11 | | 23.20 | | (25.22) | | (.69) | | (33.80) |
| Distributions from net | | | | | | | | | | | | |
| investment income | | (.28) | | (1.24) | | (.76) | | (.64) | | (.46) | | (.27) |
| Distributions from net | | | | | | | | | | | | |
| realized gain | | — | | — | | — | | — | | (.80) | | (4.69) |
| Total distributions | | (.28) | | (1.24) | | (.76) | | (.64) | | (1.26) | | (4.96) |
| Net asset value, end of | | | | | | | | | | | | |
| period | | $105.87 | | $101.00 | | $ 99.13 | | $ 76.69 | | $102.55 | | $104.50 |
| Total ReturnB,C | | 5.12% | | 3.14% | | 30.35% | | (24.65)% | | (.76)% | | (24.22)% |
| Ratios to Average Net AssetsF | | | | | | | | | | |
| Expenses before ex- | | | | | | | | | | | | |
| pense reductions | | 57%A | | .63% | | .70% | | .77% | | .89% | | .89% |
| Expenses net of vol- | | | | | | | | | | | | |
| untary waivers, if | | | | | | | | | | | | |
| any | | 57%A | | .63% | | .70% | | .77% | | .89% | | .89% |
| Expenses net of all | | | | | | | | | | | | |
| reductions | | 56%A | | .62% | | .70% | | .76% | | .88% | | .88% |
| Net investment in- | | | | | | | | | | | | |
| come (loss) | | 95%A | | 1.26%E | | .83% | | .82% | | .43% | | .29% |
| Supplemental Data | | | | | | | | | | | | |
| Net assets, end of | | | | | | | | | | | | |
| period (in millions) | | $52,084 | | $56,891 | | $66,797 | | $54,164 | | $77,818 | | $80,190 |
| Portfolio turnover | | | | | | | | | | | | |
| rate | | 9%A | | 6% | | 13% | | 21% | | 15% | | 24% |
A Annualized
B Total returns for periods of less than one year are not annualized.
C Total returns would have been lower had certain expenses not been reduced during the periods shown.
D Calculated based on average shares outstanding during the period.
E Investment income per share reflects a special dividend which amounted to $.35 per share. Excluding the special dividend, the ratio of net
investment income to average net assets would have been .91%.
F Expense ratios reflect operating expenses of the fund. Expenses before reductions do not reflect amounts reimbursed by the investment adviser or
reductions from brokerage service arrangements or other expense offset arrangements and do not represent the amount paid by the fund during
periods when reimbursements or reductions occur. Expenses net of any voluntary waivers reflect expenses after reimbursement by the investment
adviser but prior to reductions from brokerage service arrangements or other expense offset arrangements. Expenses net of all reductions repre
sent the net expenses paid by the fund.
|
See accompanying notes which are an integral part of the financial statements.
19 Semiannual Report
Notes to Financial Statements
For the period ended September 30, 2005
(Amounts in thousands except ratios)
1. Significant Accounting Policies.
Fidelity Magellan Fund (the fund) is registered under the Investment Company Act of 1940, as amended (the 1940 Act), as an open end management investment company organized as a Massachusetts business trust and is authorized to issue an unlimited number of shares. The fund may invest in affiliated money market central funds (Money Market Central Funds), which are open end investment companies available to invest ment companies and other accounts managed by Fidelity Management & Research Company (FMR) and its affiliates. The fund is currently closed to most new accounts. The financial statements have been prepared in conformity with accounting principles generally accepted in the United States of America, which require management to make certain estimates and assumptions at the date of the financial statements. The following summarizes the significant accounting policies of the fund:
Security Valuation. Net asset value per share (NAV calculation) is calculated as of the close of business of the New York Stock Exchange, normally 4:00 p.m. Eastern time. Equity securities, including restricted securities, for which market quotations are available are valued at the last sale price or official closing price (closing bid price or last evaluated quote if no sale has occurred) on the primary market or exchange on which they trade. If prices are not readily available or do not accurately reflect fair value for a security, or if a security’s value has been materially affected by events occurring after the close of the exchange or market on which the security is principally traded, that security may be valued by another method that the Board of Trustees believes accurately reflects fair value. A security’s valuation may differ depending on the method used for determin ing value. Price movements in futures contracts and ADRs, market and trading trends, the bid/ask quotes of brokers and off exchange institutional trading may be reviewed in the course of making a good faith determination of a security’s fair value. Short term securities with remaining maturities of sixty days or less for which quotations are not readily available are valued on the basis of amortized cost. Investments in open end investment companies are valued at their net asset value each business day.
Foreign Currency. The fund uses foreign currency contracts to facilitate transactions in foreign denominated securities. Losses from these transactions may arise from changes in the value of the foreign currency or if the counterparties do not perform under the contracts’ terms.
Foreign denominated assets, including investment securities, and liabilities are translated into U.S. dollars at the exchange rate at period end. Purchases and sales of investment securities, income and dividends received and expenses denominated in foreign currencies are translated into U.S. dollars at the exchange rate in effect on the transaction date.
The effects of exchange rate fluctuations on investments are included with the net realized and unrealized gain (loss) on investment securities. Other foreign currency transactions resulting in realized and unrealized gain (loss) are disclosed separately.
1. Significant Accounting Policies continued
Investment Transactions and Income. Security transactions are accounted for as of trade date. Gains and losses on securities sold are determined on the basis of identified cost and may include proceeds received from litigation. Dividend income is recorded on the ex dividend date, except for certain dividends from foreign securities where the ex dividend date may have passed, which are recorded as soon as the fund is informed of the ex dividend date. Non cash dividends included in dividend income, if any, are recorded at the fair market value of the securities received.
Distributions received on securities that represent a return of capital or capital gain are recorded as a reduction of cost of investments and/or as a realized gain. The fund esti mates the components of distributions received that may be considered return of capital distributions or capital gain distributions. Interest income is accrued as earned. Interest income includes coupon interest and amortization of premium and accretion of discount on debt securities. Investment income is recorded net of foreign taxes withheld where recovery of such taxes is uncertain.
Expenses. Most expenses of the trust can be directly attributed to a fund. Expenses which cannot be directly attributed are apportioned among each fund in the trust.
Deferred Trustee Compensation. Under a Deferred Compensation Plan (the Plan), independent Trustees must defer receipt of a portion of, and may elect to defer receipt of an additional portion of, their annual compensation. Deferred amounts are treated as though equivalent dollar amounts had been invested in shares of the fund or are invested in a cross section of other Fidelity funds, and are marked to market. Deferred amounts remain in the fund until distributed in accordance with the Plan.
Income Tax Information and Distributions to Shareholders. Each year, the fund intends to qualify as a regulated investment company by distributing all of its taxable income and realized gains under Subchapter M of the Internal Revenue Code. As a result, no provision for income taxes is required in the accompanying financial statements. Foreign taxes are provided for based on the fund’s understanding of the tax rules and rates that exist in the foreign markets in which it invests.
Distributions are recorded on the ex dividend date. Income and capital gain distribu tions are determined in accordance with income tax regulations, which may differ from generally accepted accounting principles.
Capital accounts within the financial statements are adjusted for permanent book tax differences. These adjustments have no impact on net assets or the results of operations. Temporary book tax differences will reverse in a subsequent period.
21 Semiannual Report
Notes to Financial Statements continued
(Amounts in thousands except ratios)
1. Significant Accounting Policies continued
Income Tax Information and Distributions to Shareholders continued
|
Book tax differences are primarily due to foreign currency transactions, partnerships, deferred trustees compensation, capital loss carryforwards and losses deferred due to wash sales.
The federal tax cost of investments and unrealized appreciation (depreciation) as of period end were as follows:
| Unrealized appreciation | | $ | | 22,651,622 |
| Unrealized depreciation | | | | (958,005) |
| Net unrealized appreciation (depreciation) | | $ | | 21,693,617 |
| Cost for federal income tax purposes | | $ | | 30,744,066 |
| |
| 2. Operating Policies. | | | | |
Repurchase Agreements. Fidelity Management & Research Company (FMR) has received an Exemptive Order from the Securities and Exchange Commission (the SEC) which permits the fund and other affiliated entities of FMR to transfer uninvested cash balances into joint trading accounts which are then invested in repurchase agreements. The fund may also invest directly with institutions in repurchase agreements. Repur chase agreements are collateralized by government or non government securities. Collateral is held in segregated accounts with custodian banks and may be obtained in the event of a default of the counterparty. The fund monitors, on a daily basis, the value of the collateral to ensure it is at least equal to the principal amount of the repurchase agreement (including accrued interest). In the event of a default by the counterparty, realization of the collateral proceeds could be delayed, during which time the value of the collateral may decline.
Restricted Securities. The fund may invest in securities that are subject to legal or contractual restrictions on resale. These securities generally may be resold in transac tions exempt from registration or to the public if the securities are registered. Disposal of these securities may involve time consuming negotiations and expense, and prompt sale at an acceptable price may be difficult. Information regarding restricted securities is included at the end of the fund’s Schedule of Investments.
3. Purchases and Sales of Investments.
Purchases and sales of securities, other than short term securities and U.S. government securities, aggregated $2,499,312 and $10,126,619, respectively.
4. Fees and Other Transactions with Affiliates.
Management Fee. FMR and its affiliates provide the fund with investment management related services for which the fund pays a monthly management fee. The management fee is the sum of an individual fund fee rate that is based on an annual rate of .30% of the fund’s average net assets and a group fee rate that averaged .27% during the period. The group fee rate is based upon the average net assets of all the mutual funds advised by FMR. The group fee rate decreases as assets under management increase and increases as assets under management decrease. In addition, the management fee is subject to a performance adjustment (up to a maximum of .20% of the fund’s average net assets over a 36 month performance period). The upward or downward adjustment to the management fee is based on the fund’s relative investment performance as compared to an appropriate benchmark index. For the period, the total annualized management fee rate, including the performance adjustment, was .38% of the fund’s average net assets.
Transfer Agent Fees. Fidelity Service Company, Inc. (FSC), an affiliate of FMR, is the fund’s transfer, dividend disbursing and shareholder servicing agent. FSC receives account fees and asset based fees that vary according to account size and type of ac count. FSC pays for typesetting, printing and mailing of shareholder reports, except proxy statements. For the period, the transfer agent fees were equivalent to an annual ized rate of .18% of average net assets.
Accounting and Security Lending Fees. FSC maintains the fund’s accounting rec ords. The accounting fee is based on the level of average net assets for the month. Under a separate contract, FSC administers the security lending program. The security lending fee is based on the number and duration of lending transactions.
Affiliated Central Funds. The fund may invest in Money Market Central Funds which seek preservation of capital and current income and are managed by Fidelity Invest ments Money Management, Inc. (FIMM), an affiliate of FMR.
The Money Market Central Funds do not pay a management fee. Income distributions earned by the fund are recorded as income in the accompanying financial statements and totaled $10,106 for the period.
Brokerage Commissions. The fund placed a portion of its portfolio transactions with brokerage firms which are affiliates of the investment adviser. The commissions paid to these affiliated firms were $210 for the period.
Interfund Lending Program. Pursuant to an Exemptive Order issued by the SEC, the fund, along with other registered investment companies having management contracts with FMR, may participate in an interfund lending program. This program provides an alternative credit facility allowing the funds to borrow from, or lend money to, other participating affiliated funds. At period end, there were no interfund loans outstanding.
23 Semiannual Report
Notes to Financial Statements continued
(Amounts in thousands except ratios)
|
4. Fees and Other Transactions with Affiliates continued
Interfund Lending Program continued
The fund’s activity in this program during the period for which loans were outstanding was as follows:
| | | | | Weighted | | Interest Earned | | | | |
| | | Average Daily | | Average Interest | | (included in | | | | Interest |
| Borrower or Lender | | Loan Balance | | Rate | | interest income) | | | | Expense |
| Borrower | | $ 118,322 | | 3.70% | | — | | | $ | 24 |
| |
| |
| 5. Committed Line of Credit. | | | | | | | | |
The fund participates with other funds managed by FMR in a $4.2 billion credit facility (the “line of credit”) to be utilized for temporary or emergency purposes to fund share holder redemptions or for other short term liquidity purposes. The fund has agreed to pay commitment fees on its pro rata portion of the line of credit. During the period, there were no borrowings on this line of credit.
The fund lends portfolio securities from time to time in order to earn additional income. The fund receives collateral (in the form of U.S. Treasury obligations, letters of credit and/or cash) against the loaned securities and maintains collateral in an amount not less than 100% of the market value of the loaned securities during the period of the loan. The market value of the loaned securities is determined at the close of business of the fund and any additional required collateral is delivered to the fund on the next business day. If the borrower defaults on its obligation to return the securities loaned because of insol vency or other reasons, a fund could experience delays and costs in recovering the securities loaned or in gaining access to the collateral. Cash collateral is invested in the Fidelity Securities Lending Cash Central Fund. The value of loaned securities and cash collateral at period end are disclosed on the fund’s Statement of Assets and Liabilities. Security lending income represents the income earned on investing cash collateral, less fees and expenses associated with the loan, plus any premium payments that may be received on the loan of certain types of securities.
Many of the brokers with whom FMR places trades on behalf of the fund provided services to the fund in addition to trade execution. These services included payments of certain expenses on behalf of the fund totaling $2,423 for the period. In addition, through arrangements with the fund’s transfer agent, credits realized as a result of uninvested cash balances were used to reduce the fund’s expenses. During the period, these credits reduced the fund’s transfer agent expenses by $1,112.
The fund’s organizational documents provide former and current trustees and officers with a limited indemnification against liabilities arising in connection with the perfor mance of their duties to the fund. In the normal course of business, the fund may also enter into contracts that provide general indemnifications. The fund’s maximum expo sure under these arrangements is unknown as this would be dependent on future claims that may be made against the fund. The risk of material loss from such claims is considered remote.
25 Semiannual Report
Report of Independent Registered Public Accounting Firm
To the Trustees and Shareholders of Fidelity Magellan Fund:
In our opinion, the accompanying statement of assets and liabilities, including the sched ule of investments, and the related statements of operations and of changes in net assets and the financial highlights present fairly, in all material respects, the financial position of Fidelity Magellan Fund at September 30, 2005 and the results of its operations, the changes in its net assets and the financial highlights for the periods indicated, in confor mity with accounting principles generally accepted in the United States of America. These financial statements and financial highlights (hereafter referred to as “financial state ments”) are the responsibility of the Fidelity Magellan Fund’s management; our responsibility is to express an opinion on these financial statements based on our audits. We conducted our audits of these financial statements in accordance with the standards of the Public Company Accounting Oversight Board (United States). Those standards require that we plan and perform the audit to obtain reasonable assurance about whether the financial statements are free of material misstatement. An audit includes examining, on a test basis, evidence supporting the amounts and disclosures in the financial state ments, assessing the accounting principles used and significant estimates made by management, and evaluating the overall financial statement presentation. We believe that our audits, which included confirmation of securities at September 30, 2005 by correspon dence with the custodian and brokers, provide a reasonable basis for our opinion.
/s/ PricewaterhouseCoopers LLP
PricewaterhouseCoopers LLP
Boston, Massachusetts
November 9, 2005
|
Proxy Voting Results
A special meeting of the fund’s shareholders was held on October 26, 2005. The results of votes taken among shareholders on proposals before them are reported below. Each vote reported represents one dollar of net asset value held on the record date for the meeting.
| PROPOSAL 1 | | | | Ned C. Lautenbach | | |
| To elect a Board of Trustees.A | | | | Affirmative | | 26,340,642,660.73 | | 95.382 |
| | | # of | | % of | | Withheld | | 1,275,350,916.97 | | 4.618 |
| | | Votes | | Votes | | | | TOTAL | | 27,615,993,577.70 | | 100.000 |
| |
| Dennis J. Dirks | | | | Marvin L. Mann | | |
| Affirmative | | 26,346,963,828.16 | | 95.405 | | Affirmative | | 26,268,964,028.76 | | 95.122 |
| Withheld | | 1,269,029,749.54 | | 4.595 | | Withheld | | 1,347,029,548.94 | | 4.878 |
| TOTAL | | 27,615,993,577.70 | | 100.000 | | | | TOTAL | | 27,615,993,577.70 | | 100.000 |
| |
| Albert R. Gamper, Jr. B | | | | William O. McCoy | | |
| Affirmative | | 26,321,406,104.59 | | 95.312 | | Affirmative | | 26,274,352,396.31 | | 95.142 |
| Withheld | | 1,294,587,473.11 | | 4.688 | | Withheld | | 1,341,641,181.39 | | 4.858 |
| TOTAL | | 27,615,993,577.70 | | 100.000 | | | | TOTAL | | 27,615,993,577.70 | | 100.000 |
| |
| Robert M. Gates | | | | Robert L. Reynolds | | |
| Affirmative | | 26,231,411,892.70 | | 94.986 | | Affirmative | | 26,317,937,962.57 | | 95.300 |
| Withheld | | 1,384,581,685.00 | | 5.014 | | Withheld | | 1,298,055,615.13 | | 4.700 |
| TOTAL | | 27,615,993,577.70 | | 100.000 | | | | TOTAL | | 27,615,993,577.70 | | 100.000 |
| |
| George H. Heilmeier | | | | Cornelia M. Small | | |
| Affirmative | | 26,316,012,184.81 | | 95.293 | | Affirmative | | 26,333,310,436.19 | | 95.355 |
| Withheld | | 1,299,981,392.89 | | 4.707 | | Withheld | | 1,282,683,141.51 | | 4.645 |
| TOTAL | | 27,615,993,577.70 | | 100.000 | | | | TOTAL | | 27,615,993,577.70 | | 100.000 |
| |
| Abigail P. Johnson | | | | William S. Stavropoulos | | |
| Affirmative | | 26,220,074,127.79 | | 94.945 | | Affirmative | | 26,311,871,485.50 | | 95.278 |
| Withheld | | 1,395,919,449.91 | | 5.055 | | Withheld | | 1,304,122,092.20 | | 4.722 |
| TOTAL | | 27,615,993,577.70 | | 100.000 | | | | TOTAL | | 27,615,993,577.70 | | 100.000 |
| |
| Edward C. Johnson 3d | | | | Kenneth L. Wolfe | | |
| Affirmative | | 26,178,573,707.41 | | 94.795 | | Affirmative | | 26,311,161,516.68 | | 95.275 |
| Withheld | | 1,437,419,870.29 | | 5.205 | | Withheld | | 1,304,832,061.02 | | 4.725 |
| TOTAL | | 27,615,993,577.70 | | 100.000 | | | | TOTAL | | 27,615,993,577.70 | | 100.000 |
| Stephen P. Jonas | | | | | | | | | | |
| | | | | | | A Denotes trust-wide proposals and voting results. |
| Affirmative | | 26,295,566,032.38 | | 95.219 | | | | | | | | |
| | | | | | | B Effective January 1, 2006. | | |
| Withheld | | 1,320,427,545.32 | | 4.781 | | | | | | | | |
| TOTAL | | 27,615,993,577.70 | | 100.000 | | | | | | | | |
| |
| Marie L. Knowles | | | | | | | | | | |
| Affirmative | | 26,342,939,596.60 | | 95.390 | | | | | | | | |
| Withheld | | 1,273,053,981.10 | | 4.610 | | | | | | | | |
| TOTAL | | 27,615,993,577.70 | | 100.000 | | | | | | | | |
| |
| |
| | | | | | | 27 | | | | Semiannual Report |
Board Approval of Investment Advisory Contracts and Management Fees
Fidelity Magellan Fund
Each year, typically in July, the Board of Trustees, including the independent Trustees (together, the Board), votes on the renewal of the management contract and sub advisory agreements (together, the Advisory Contracts) for the fund. The Board, assisted by the advice of fund counsel and independent Trustees’ counsel, requests and considers a broad range of information throughout the year.
The Board meets regularly each month except August and takes into account throughout the year matters bearing on Advisory Contracts. The Board, acting directly and through its separate committees, considers at each of its meetings factors that are relevant to the annual renewal of the fund’s Advisory Contracts, including the services and support provided to the fund and its shareholders by Fidelity. At the time of the renewal, the Board had 11 standing committees, each composed of independent Trustees with varying backgrounds, to which the Board has assigned specific subject matter responsibilities in order to enhance effective decision making by the Board. Each committee has adopted a written charter outlining the structure and purposes of the committee. One such com mittee, the Equity Contract Committee, meets periodically during the first six months of each year and as necessary to consider matters specifically related to the annual renewal of Advisory Contracts. The committee requests and receives information on, and makes recommendations to the independent Trustees concerning, the approval and annual review of the Advisory Contracts.
At its July 2005 meeting, the Board of Trustees, including the independent Trustees, unanimously determined to renew the Advisory Contracts for the fund. In reaching its determination, the Board considered all factors it believed relevant, including (1) the nature, extent, and quality of the services to be provided to the fund and its shareholders by Fidelity (including the investment performance of the fund); (2) the competitiveness of the management fee and total expenses of the fund; (3) the total costs of the services to be provided by and the profits to be realized by the investment adviser and its affiliates from the relationship with the fund; (4) the extent to which economies of scale would be realized as the fund grows; and (5) whether fee levels reflect these economies of scale, if any, for the benefit of fund shareholders.
In determining whether to renew the Advisory Contracts for the fund, the Board ulti mately reached a determination, with the assistance of fund counsel and independent Trustees’ counsel, that the renewal of the Advisory Contracts and the compensation to be received by Fidelity under the management contract is consistent with Fidelity’s fidu ciary duty under applicable law. In addition to evaluating the specific factors noted above, the Board, in reaching its determination, is aware that shareholders in the fund have a broad range of investment choices available to them, including a wide choice among mutual funds offered by competitors to Fidelity, and that the fund’s shareholders, with the opportunity to review and weigh the disclosure provided by the fund in its
prospectus and other public disclosures, have chosen to invest in this fund, managed by Fidelity.
Nature, Extent, and Quality of Services Provided by Fidelity. The Board consid ered staffing within the investment adviser, FMR, and the sub advisers (together, the Investment Advisers), including the background of the fund’s portfolio manager and the fund’s investment objective and discipline. The independent Trustees also had discus sions with senior management of Fidelity’s investment operations and investment groups. The Board considered the structure of the portfolio manager compensation program and whether this structure provides appropriate incentives.
Fidelity Resources Dedicated to Investment Management and Support Services. The Board reviewed the size, education, and experience of the Investment Advisers’ invest ment staff, their use of technology, and the Investment Advisers’ approach to recruiting, training, and retaining portfolio managers and other research, advisory, and manage ment personnel. The Board considered Fidelity’s extensive global research capabilities that enable the Investment Advisers to aggregate data from various sources in an effort to produce positive investment results. The Board noted that Fidelity’s analysts have access to a variety of technological tools that enable them to perform both fundamental and quantitative analysis and to specialize in various disciplines. The Board also considered that Fidelity’s portfolio managers and analysts have access to daily portfolio attribution that allows for monitoring of a fund’s portfolio, as well as an electronic communication system that provides immediate real time access to research concerning issuers and credit enhancers.
Shareholder and Administrative Services. The Board considered the nature, extent, quality, and cost of administrative, distribution, and shareholder services performed by the Investment Advisers and their affiliates under the Advisory Contracts and under separate agreements covering transfer agency, pricing and bookkeeping, and securities lending services for the fund. The Board also considered the nature and extent of the Investment Advisers’ supervision of third party service providers, principally custodians and subcustodians. The Board reviewed the allocation of fund brokerage, including allocations to brokers affiliated with the Investment Advisers, the use of brokerage commissions to pay fund expenses, and the use of “soft” commission dollars to pay for research services. The Board also considered that Fidelity voluntarily decided in 2004 to stop using “soft” commission dollars to pay for market data and, instead, to pay for that data out of its own resources. The Board also considered the resources devoted to, and the record of compliance with, the fund’s compliance policies and procedures.
The Board noted that the growth of fund assets across the complex allows Fidelity to reinvest in the development of services designed to enhance the value or convenience of the Fidelity funds as investment vehicles. These services include 24 hour access to
29 Semiannual Report
Board Approval of Investment Advisory Contracts and Management Fees continued
account information and market information through phone representatives and over the Internet, and investor education materials and asset allocation tools.
Investment in a Large Fund Family. The Board considered the benefits to shareholders of investing in a Fidelity fund, including the benefits of investing in a fund that is part of a large family of funds offering a variety of investment disciplines and providing for a large variety of mutual fund investor services. For example, fund shareholders are offered the privilege of exchanging shares of the fund for shares of other Fidelity funds, as set forth in the fund’s prospectus, without paying a sales charge. The Board noted that, since the last Advisory Contract renewals in July 2004, Fidelity has taken a number of actions that benefited particular funds, including (i) voluntarily deciding in 2004 to stop using “soft” commission dollars to pay for market data and, instead, to pay for that data out of its own resources, (ii) contractually agreeing to impose management fee reductions and expense limitations on its five Spartan stock index funds and its stock index fund available through variable insurance products, (iii) contractually agreeing to eliminate the management fees on the Fidelity Freedom Funds and the Fidelity Advisor Freedom Funds, (iv) contractually agreeing to reduce the management fees on most of its investment grade taxable bond funds, and (v) contractually agreeing to impose expense limitations on its retail and Spartan investment grade taxable bond funds.
Investment Performance and Compliance. The Board considered whether the fund has operated within its investment objective, as well as its record of compliance with its investment restrictions. It also reviewed the fund’s absolute investment performance, as well as the fund’s relative investment performance measured against (i) a broad based securities market index, and (ii) a peer group of mutual funds deemed appropriate by the Board over multiple periods. The following charts considered by the Board show, over the one , three , and five year periods ended December 31, 2004, the fund’s returns, the returns of a broad based securities market index (“benchmark”), and a range of returns of a peer group of mutual funds identified by Lipper Inc. as having an investment objec tive similar to that of the fund. The box within each chart shows the 25th percentile return (bottom of box) and the 75th percentile return (top of box) of the Lipper peer group. Returns shown above the box are in the first quartile and returns shown below the box are in the fourth quartile. The percentage beaten number noted below each chart corresponds to the percentile box and represents the percentage of funds in the Lipper peer group whose performance was equal to or lower than that of the fund.
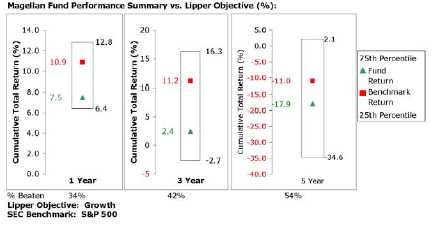
The Board reviewed the fund’s relative investment performance against its Lipper peer group and stated that the performance of the fund was in the third quartile for the one and three year periods and the second quartile for the five year period. The Board also stated that the relative investment performance of the fund was lower than its bench mark over time. The Board discussed with FMR actions to be taken by FMR to improve the fund’s more recent disappointing performance.
The Board also considered that the fund’s management fee is subject to upward or downward adjustment depending upon whether, and to what extent, the fund’s invest ment performance for the performance period exceeds, or is exceeded by, the record (over the same period) of a Board approved performance adjustment index. The Board realizes that the performance adjustment provides FMR with a strong economic incen tive to seek to achieve superior performance for the fund’s shareholders and helps to more closely align the interests of FMR and the fund’s shareholders.
The Board has had thorough discussions with FMR throughout the year about the Board’s and FMR’s concerns about equity research, equity fund performance, and compliance with internal policies governing gifts and entertainment. FMR has taken steps that it believes will refocus and strengthen equity research and equity portfolio management and compliance. The Board noted with favor FMR’s recent reorganization of its senior management team and FMR’s plans to dedicate additional resources to investment research, and participated in the process that led to those changes.
Based on its review, and giving particular weight to the nature and quality of the resources dedicated by the Investment Advisers to maintain and improve relative performance, the Board concluded that the nature, extent, and quality of the services
31 Semiannual Report
Board Approval of Investment Advisory Contracts and Management Fees continued
provided by Fidelity will benefit the fund’s shareholders, particularly in light of the Board’s view that the fund’s shareholders benefit from investing in a fund that is part of a large family of funds offering a variety of investment disciplines and services.
Competitiveness of Management Fee and Total Fund Expenses. The Board considered the fund’s management fee and total expenses compared to “mapped groups” of competitive funds and classes. Fidelity creates “mapped groups” by combining similar Lipper investment objective categories that have comparable management fee charac teristics. Combining Lipper investment objective categories aids the Board’s manage ment fee and total expense comparisons by broadening the competitive group used for comparison and by reducing the number of universes to which various Fidelity funds are compared.
The Board considered two proprietary management fee comparisons for the 12 month periods shown in the chart below. The group of Lipper funds used by the Board for management fee comparisons is referred to below as the “Total Mapped Group” and, for the reasons explained above, is broader than the Lipper peer group used by the Board for performance comparisons. The Total Mapped Group comparison focuses on a fund’s standing relative to the total universe of comparable funds available to investors, in terms of gross management fees before expense reimbursements or caps. “TMG %” represents the percentage of funds in the Total Mapped Group that had management fees that were lower than the fund’s. For example, a TMG % of 17% means that 83% of the funds in the Total Mapped Group had higher management fees than the fund. The “Asset Size Peer Group” (ASPG) comparison focuses on a fund’s standing relative to non Fidelity funds similar in size to the fund within the Total Mapped Group. The ASPG represents at least 15% of the funds in the Total Mapped Group with comparable asset size and management fee characteristics, subject to a minimum of 50 funds (or all funds in the Total Mapped Group if fewer than 50). Additional information, such as the ASPG quartile (“quadrant”) in which the fund’s management fee ranked and the impact of the fund’s performance adjustment, is also included in the chart and considered by the Board.
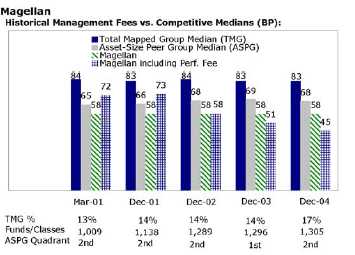
The Board noted that the fund’s management fee ranked below the median of its Total Mapped Group and below the median of its ASPG for 2004. The Board also noted the effect of the fund’s negative performance adjustment on the fund’s management fee ranking.
Based on its review, the Board concluded that the fund’s management fee was fair and reasonable in light of the services that the fund receives and the other factors considered.
In its review of the fund’s total expenses, the Board considered the fund’s management fee as well as other fund expenses, such as transfer agent fees, pricing and bookkeeping fees, and custodial, legal, and audit fees. The Board also noted the effects of any waivers and reimbursements on fees and expenses, as well as the fund’s negative performance adjustment. As part of its review, the Board also considered current and historical total expenses of the fund compared to competitive fund median expenses. The fund is compared to those funds and classes in the Total Mapped Group (used by the Board for management fee comparisons) that have a similar sales load structure.
The Board noted that the fund’s total expenses ranked below its competitive median for 2004.
In its review of total expenses, the Board also considered Fidelity fee structures and other information on clients that FMR and its affiliates service in other competitive markets, such as other mutual funds advised or subadvised by FMR or its affiliates, pension plan clients, and other institutional clients.
33 Semiannual Report
Board Approval of Investment Advisory Contracts and Management Fees continued
Based on its review, the Board concluded that the fund’s total expenses were reasonable in light of the services that the fund and its shareholders receive and the other factors considered.
Costs of the Services and Profitability. The Board considered the revenues earned and the expenses incurred by Fidelity in conducting the business of developing, market ing, distributing, managing, administering and servicing the fund and its shareholders. The Board also considered the level of Fidelity’s profits in respect of all the Fidelity funds.
On an annual basis, FMR presents to the Board Fidelity’s profitability for the fund. Fidelity calculates the profitability for each fund, as well as aggregate profitability for groups of Fidelity funds and all Fidelity funds, using a series of detailed revenue and cost allocation methodologies which originate with the audited books and records of Fidelity. The Audit Committee of the Board reviews any significant changes from the prior year’s methodologies.
PricewaterhouseCoopers LLP (PwC), independent registered accounting firm and auditor to Fidelity and certain Fidelity funds, has been engaged annually by the Board as part of the Board’s assessment of the results of Fidelity’s profitability analysis. PwC’s engagement includes the review and assessment of Fidelity’s methodologies used in determining the revenues and expenses attributable to Fidelity’s mutual fund business, and completion of agreed upon procedures surrounding the mathematical accuracy of fund profitability and its conformity to allocation methodologies. After considering PwC’s reports issued under the engagement and information provided by Fidelity, the Board believes that while other allocation methods may also be reasonable, Fidelity’s profitabil ity methodologies are reasonable in all material respects.
The Board has also reviewed Fidelity’s non fund businesses and any fall out benefits related to the mutual fund business as well as cases where Fidelity’s affiliates may benefit from or be related to the fund’s business. In addition, a special committee of the Board reviewed services provided to Fidelity by its affiliates and determined that the fees that Fidelity paid for such services were reasonable.
The Board considered the costs of the services provided by and the profits realized by Fidelity in connection with the operation of the fund and determined that the amount of profit is a fair entrepreneurial profit for the management of the fund.
Economies of Scale. The Board considered whether there have been economies of scale in respect of the management of the Fidelity funds, whether the Fidelity funds (including the fund) have appropriately benefited from any such economies of scale, and whether there is potential for realization of any further economies of scale. The Board considered the extent to which the fund will benefit from economies of scale through increased services to the fund, through waivers or reimbursements, or through fee or
expense reductions, including reductions that occur through operation of the transfer agent agreement. The transfer agent fee varies in part based on the number of accounts in the fund. If the number of accounts decreases or the average account size increases, the overall transfer agent fee rate decreases.
The Board recognized that the fund’s management contract incorporates a “group fee” structure, which provides for lower fee rates as total fund assets under FMR’s manage ment increase, and for higher fee rates as total fund assets under FMR’s management decrease. The Board considered that the group fee is designed to deliver the benefits of economies of scale to fund shareholders when total fund assets increase, even if assets of any particular fund are unchanged or have declined, because some portion of Fidelity’s costs are attributable to services provided to all Fidelity funds, and all funds benefit if those costs can be allocated among more assets. The Board also considered that although the fund is partially closed to new investors, it continues to incur investment manage ment expenses, and marketing and distribution expenses related to the retention of existing shareholders and assets. The Board further noted that the fund may continue to realize benefits from the group fee structure, even though assets may not be expected to grow significantly at the fund level. The Board concluded that, given the group fee structure, fund shareholders will achieve a certain level of economies of scale as assets under FMR’s management increase at the fund complex level, regardless of whether Fidelity achieves any such economies of scale.
The Board further concluded that any potential economies of scale are being shared between fund shareholders and Fidelity in an appropriate manner.
Additional Information Requested by the Board. In order to develop fully the factual basis for consideration of the Advisory Contracts, the Board requested additional information regarding (i) equity fund transfer agency fees; (ii) Fidelity’s fund profitability methodology and the impact of various changes in the methodology over time; (iii) benefits to shareholders from economies of scale; (iv) composition and characteristics of various fund and industry data used in comparisons; (v) compensation of portfolio managers and research analysts; and (vi) the impact of partially closing the fund to new investors.
Based on its evaluation of all of the conclusions noted above, and after considering all material factors, the Board ultimately concluded that the existing advisory fee structures are fair and reasonable, and that the fund’s existing Advisory Contracts should be renewed.
35 Semiannual Report
Managing Your Investments
Fidelity offers several ways to conveniently manage your personal investments via your telephone or PC. You can access your account information, conduct trades and research your investments 24 hours a day.
By Phone
Fidelity Automated Service Telephone provides a single toll free number to access account balances, positions, quotes and trading. It’s easy to navigate the service, and on your first call, the system will help you create a personal identification number (PIN) for security.

By PC
Fidelity’s web site on the Internet provides a wide range of information, including daily financial news, fund performance, interactive planning tools and news about Fidelity products and services.

* When you call the quotes line, please remember that a fund’s yield and return will vary and, except for money market funds, share price will also vary. This means that you may have a gain or loss when you sell your shares. There is no assurance that money market funds will be able to maintain a stable $1 share price; an investment in a money market fund is not insured or guar anteed by the U.S. government. Total returns are historical and include changes in share price, reinvestment of dividends and capital gains, and the effects of any sales charges.
Semiannual Report 36
To Write Fidelity
We’ll give your correspondence immediate attention and send you written confirmation upon completion of your request.

(such as changing name, address, bank, etc.)
Fidelity Investments
P.O. Box 770001
Cincinnati, OH 45277-0002
|

| | Fidelity Investments
P.O. Box 770001
Cincinnati, OH 45277-0003
Overnight Express
Fidelity Investments
Attn: Distribution Services
100 Crosby Parkway KC1H
Covington, KY 41015
Selling shares
Fidelity Investments
P.O. Box 770001
Cincinnati, OH 45277-0035
Overnight Express
Fidelity Investments
Attn: Distribution Services
100 Crosby Parkway KC1H
Covington, KY 41015
General Correspondence
Fidelity Investments
P.O. Box 500
Merrimack, NH 03054-0500
|

| | Buying shares
Fidelity Investments
P.O. Box 770001
Cincinnati, OH 45277-0003
Selling shares
Fidelity Investments
P.O. Box 770001
Cincinnati, OH 45277-0035
Overnight Express
Fidelity Investments
Attn: Distribution Services
100 Crosby Parkway KC1H
Covington, KY 41015
General Correspondence
Fidelity Investments
P.O. Box 500
Merrimack, NH 03054-0500
|
37 Semiannual Report
To Visit Fidelity
For directions and hours,
please call 1 800 544 9797.
Arizona
7001 West Ray Road
Chandler, AZ
7373 N. Scottsdale Road
Scottsdale, AZ
California
815 East Birch Street
Brea, CA
1411 Chapin Avenue
Burlingame, CA
851 East Hamilton Avenue
Campbell, CA
19200 Von Karman Avenue
Irvine, CA
601 Larkspur Landing Circle
Larkspur, CA
10100 Santa Monica Blvd.
Los Angeles, CA
27101 Puerta Real
Mission Viejo, CA
73 575 El Paseo
Palm Desert, CA
251 University Avenue
Palo Alto, CA
123 South Lake Avenue
Pasadena, CA
16995 Bernardo Ctr. Drive
Rancho Bernardo, CA
1740 Arden Way
Sacramento, CA
7676 Hazard Center Drive
San Diego, CA
8 Montgomery Street
San Francisco, CA
3793 State Street
Santa Barbara, CA
21701 Hawthorne Boulevard
Torrance, CA
2001 North Main Street
Walnut Creek, CA
6300 Canoga Avenue
Woodland Hills, CA
|
Colorado
1625 Broadway
Denver, CO
9185 East Westview Road
Littleton, CO
Connecticut
48 West Putnam Avenue
Greenwich, CT
265 Church Street
New Haven, CT
300 Atlantic Street
Stamford, CT
29 South Main Street
West Hartford, CT
Delaware
222 Delaware Avenue
Wilmington, DE
Florida
4400 N. Federal Highway
Boca Raton, FL
121 Alhambra Plaza
Coral Gables, FL
2948 N. Federal Highway
Ft. Lauderdale, FL
1907 West State Road 434
Longwood, FL
8880 Tamiami Trail, North
Naples, FL
3550 Tamiami Trail, South
Sarasota, FL
1502 N. Westshore Blvd.
Tampa, FL
2465 State Road 7
Wellington, FL
3501 PGA Boulevard
West Palm Beach, FL
Georgia
3445 Peachtree Road, N.E.
Atlanta, GA
1000 Abernathy Road
Atlanta, GA
Illinois
One North LaSalle Street
Chicago, IL
875 North Michigan Ave.
Chicago, IL
1415 West 22nd Street
Oak Brook, IL
|
1700 East Golf Road
Schaumburg, IL
3232 Lake Avenue
Wilmette, IL
Indiana
4729 East 82nd Street
Indianapolis, IN
Kansas
5400 College Boulevard
Overland Park, KS
Maine
Three Canal Plaza
Portland, ME
Maryland
7315 Wisconsin Avenue
Bethesda, MD
One W. Pennsylvania Ave.
Towson, MD
Massachusetts
801 Boylston Street
Boston, MA
155 Congress Street
Boston, MA
300 Granite Street
Braintree, MA
44 Mall Road
Burlington, MA
405 Cochituate Road
Framingham, MA
416 Belmont Street
Worcester, MA
Michigan
500 E. Eisenhower Pkwy.
Ann Arbor, MI
280 Old N. Woodward Ave.
Birmingham, MI
43420 Grand River Avenue
Novi, MI
29155 Northwestern Hwy.
Southfield, MI
Minnesota
7600 France Avenue South
Edina, MN
Missouri
8885 Ladue Road
Ladue, MO
|
Semiannual Report 38
Nevada
2225 Village Walk Drive
Henderson, NV
New Jersey
150 Essex Street
Millburn, NJ
56 South Street
Morristown, NJ
396 Route 17, North
Paramus, NJ
3518 Route 1 North
Princeton, NJ
530 Highway 35
Shrewsbury, NJ
New York
1055 Franklin Avenue
Garden City, NY
37 West Jericho Turnpike
Huntington Station, NY
1271 Avenue of the Americas
New York, NY
61 Broadway
New York, NY
350 Park Avenue
New York, NY
200 Fifth Avenue
New York, NY
733 Third Avenue
New York, NY
11 Penn Plaza
New York, NY
2070 Broadway
New York, NY
1075 Northern Blvd.
Roslyn, NY
North Carolina
4611 Sharon Road
Charlotte, NC
Ohio
3805 Edwards Road
Cincinnati, OH
1324 Polaris Parkway
Columbus, OH
28699 Chagrin Boulevard
Woodmere Village, OH
Oregon
16850 SW 72nd Avenue
Tigard, OR
|
Pennsylvania
600 West DeKalb Pike
King of Prussia, PA
1735 Market Street
Philadelphia, PA
12001 Perry Highway
Wexford, PA
Rhode Island
47 Providence Place
Providence, RI
Tennessee
6150 Poplar Avenue
Memphis, TN
Texas
10000 Research Boulevard
Austin, TX
4001 Northwest Parkway
Dallas, TX
12532 Memorial Drive
Houston, TX
2701 Drexel Drive
Houston, TX
6500 N. MacArthur Blvd.
Irving, TX
6005 West Park Boulevard
Plano, TX
14100 San Pedro
San Antonio, TX
1576 East Southlake Blvd.
Southlake, TX
19740 IH 45 North
Spring, TX
Utah
215 South State Street
Salt Lake City, UT
Virginia
1861 International Drive
McLean, VA
Washington
411 108th Avenue, N.E.
Bellevue, WA
1518 6th Avenue
Seattle, WA
Washington, DC
1900 K Street, N.W.
Washington, DC
Wisconsin
595 North Barker Road
Brookfield, WI
|
Fidelity Brokerage Services, Inc., 100 Summer St., Boston, MA 02110 Member NYSE/SIPC
39 Semiannual Report
39
Investment Adviser
Fidelity Management &
Research Company
Boston, MA
Investment Sub Advisers
FMR Co., Inc.
Fidelity Management & Research
(U.K.) Inc.
Fidelity Management & Research
(Far East) Inc.
Fidelity Investments Japan Limited
Fidelity International Investment
Advisors
Fidelity International Investment
Advisors (U.K.) Limited
General Distributor
Fidelity Distributors Corporation
Boston, MA
Transfer and Service Agent
Fidelity Service Company, Inc.
Boston, MA
Custodian
State Street Bank and Trust Company
Quincy, MA
|
| The Fidelity Telephone Connection |
| Mutual Fund 24 Hour Service |
| Exchanges/Redemptions | | |
| and Account Assistance | | 1-800-544-6666 |
| Product Information | | 1-800-544-6666 |
| Retirement Accounts | | 1-800-544-4774 |
| (8 a.m. - 9 p.m.) | | |
| TDD Service | | 1-800-544-0118 |
| for the deaf and hearing impaired |
| (9 a.m. 9 p.m. Eastern time) |
| Fidelity Automated Service | | |
| Telephone (FAST® ) | | (automated phone logo) 1-800-544-5555 |
(automated phone logo)
Automated line for quickest serviceMAG USAN-1105
1.792157.102
|

Item 2. Code of Ethics
Not applicable.
Item 3. Audit Committee Financial Expert
Not applicable.
Item 4. Principal Accountant Fees and Services
Not applicable.
Item 5. Audit Committee of Listed Registrants
Not applicable.
Item 6. Schedule of Investments
Not applicable.
Item 7. Disclosure of Proxy Voting Policies and Procedures for Closed-End Management Investment Companies
Not applicable.
Item 8. Portfolio Managers of Closed-End Management Investment Companies
Not applicable.
Item 9. Purchase of Equity Securities by Closed-End Management Investment Company and Affiliated Purchasers
Not applicable.
Item 10. Submission of Matters to a Vote of Security Holders
There were no material changes to the procedures by which shareholders may recommend nominees to the Magellan Fund's Board of Trustees.
Item 11. Controls and Procedures
(a)(i) The President and Treasurer and the Chief Financial Officer have concluded that the Fidelity Magellan Fund's (the "Trust") disclosure controls and procedures (as defined in Rule 30a-3(c) under the Investment Company Act) provide reasonable assurances that material information relating to the Trust is made known to them by the appropriate persons, based on their evaluation of these controls and procedures as of a date within 90 days of the filing date of this report.
(a)(ii) There was no change in the Trust's internal control over financial reporting (as defined in Rule 30a-3(d) under the Investment Company Act) that occurred during the second fiscal quarter of the period covered by this report that has materially affected, or is reasonably likely to materially affect, the Trust's internal control over financial reporting.
Item 12. Exhibits
(a) | (1) | Not applicable. |
(a) | (2) | Certification pursuant to Rule 30a-2(a) under the Investment Company Act of 1940 (17 CFR 270.30a-2(a)) is filed and attached hereto as Exhibit 99.CERT. |
(a) | (3) | Not applicable. |
(b) | | Certification pursuant to Rule 30a-2(b) under the Investment Company Act of 1940 (17 CFR 270.30a-2(b)) is furnished and attached hereto as Exhibit 99.906CERT. |
SIGNATURES
Pursuant to the requirements of the Securities Exchange Act of 1934 and the Investment Company Act of 1940, the registrant has duly caused this report to be signed on its behalf by the undersigned, thereunto duly authorized.
Fidelity Magellan Fund
By: | /s/Christine Reynolds |
| Christine Reynolds |
| President and Treasurer |
| |
Date: | November 18, 2005 |
Pursuant to the requirements of the Securities Exchange Act of 1934 and the Investment Company Act of 1940, this report has been signed below by the following persons on behalf of the registrant and in the capacities and on the dates indicated.
By: | /s/Christine Reynolds |
| Christine Reynolds |
| President and Treasurer |
| |
Date: | November 18, 2005 |
By: | /s/Paul M. Murphy |
| Paul M. Murphy |
| Chief Financial Officer |
| |
Date: | November 18, 2005 |