Fidelity® Magellan® Fund
Annual Report
March 31, 2021


Contents
To view a fund's proxy voting guidelines and proxy voting record for the 12-month period ended June 30, visit http://www.fidelity.com/proxyvotingresults or visit the Securities and Exchange Commission's (SEC) web site at http://www.sec.gov.
You may also call 1-800-544-8544 if you’re an individual investing directly with Fidelity, call 1-800-835-5092 if you’re a plan sponsor or participant with Fidelity as your recordkeeper or call 1-877-208-0098 on institutional accounts or if you’re an advisor or invest through one to request a free copy of the proxy voting guidelines.
Standard & Poor's, S&P and S&P 500 are registered service marks of The McGraw-Hill Companies, Inc. and have been licensed for use by Fidelity Distributors Corporation.
Other third-party marks appearing herein are the property of their respective owners.
All other marks appearing herein are registered or unregistered trademarks or service marks of FMR LLC or an affiliated company. © 2021 FMR LLC. All rights reserved.
This report and the financial statements contained herein are submitted for the general information of the shareholders of the Fund. This report is not authorized for distribution to prospective investors in the Fund unless preceded or accompanied by an effective prospectus.
A fund files its complete schedule of portfolio holdings with the SEC for the first and third quarters of each fiscal year on Form N-PORT. Forms N-PORT are available on the SEC’s web site at http://www.sec.gov. A fund's Forms N-PORT may be reviewed and copied at the SEC’s Public Reference Room in Washington, DC. Information regarding the operation of the SEC's Public Reference Room may be obtained by calling 1-800-SEC-0330.
For a complete list of a fund's portfolio holdings, view the most recent holdings listing, semiannual report, or annual report on Fidelity's web site at http://www.fidelity.com, http://www.institutional.fidelity.com, or http://www.401k.com, as applicable.
NOT FDIC INSURED •MAY LOSE VALUE •NO BANK GUARANTEE
Neither the Fund nor Fidelity Distributors Corporation is a bank.
Note to Shareholders:
Early in 2020, the outbreak and spread of a new coronavirus emerged as a public health emergency that had a major influence on financial markets, primarily based on its impact on the global economy and the outlook for corporate earnings. The virus causes a respiratory disease known as COVID-19. On March 11, 2020 the World Health Organization declared the COVID-19 outbreak a pandemic, citing sustained risk of further global spread.
In the weeks following, as the crisis worsened, we witnessed an escalating human tragedy with wide-scale social and economic consequences from coronavirus-containment measures. The outbreak of COVID-19 prompted a number of measures to limit the spread, including travel and border restrictions, quarantines, and restrictions on large gatherings. In turn, these resulted in lower consumer activity, diminished demand for a wide range of products and services, disruption in manufacturing and supply chains, and – given the wide variability in outcomes regarding the outbreak – significant market uncertainty and volatility. Amid the turmoil, global governments and central banks took unprecedented action to help support consumers, businesses, and the broader economies, and to limit disruption to financial systems.
The situation continues to unfold, and the extent and duration of its impact on financial markets and the economy remain highly uncertain. Extreme events such as the coronavirus crisis are “exogenous shocks” that can have significant adverse effects on mutual funds and their investments. Although multiple asset classes may be affected by market disruption, the duration and impact may not be the same for all types of assets.
Fidelity is committed to helping you stay informed amid news about COVID-19 and during increased market volatility, and we’re taking extra steps to be responsive to customer needs. We encourage you to visit our websites, where we offer ongoing updates, commentary, and analysis on the markets and our funds.
Performance: The Bottom Line
Average annual total return reflects the change in the value of an investment, assuming reinvestment of distributions from dividend income and capital gains (the profits earned upon the sale of securities that have grown in value, if any) and assuming a constant rate of performance each year. The hypothetical investment and the average annual total returns do not reflect the deduction of taxes that a shareholder would pay on fund distributions or the redemption of fund shares. During periods of reimbursement by Fidelity, a fund’s total return will be greater than it would be had the reimbursement not occurred. How a fund did yesterday is no guarantee of how it will do tomorrow.
Average Annual Total Returns
| For the periods ended March 31, 2021 | Past 1 year | Past 5 years | Past 10 years |
| Fidelity® Magellan® Fund | 49.27% | 16.78% | 12.95% |
| Class K | 49.38% | 16.86% | 13.05% |
$10,000 Over 10 Years
Let's say hypothetically that $10,000 was invested in Fidelity® Magellan® Fund, a class of the fund, on March 31, 2011.
The chart shows how the value of your investment would have changed, and also shows how the S&P 500® Index performed over the same period.

| Period Ending Values |
| $33,787 | Fidelity® Magellan® Fund |
| $36,788 | S&P 500® Index |
Management's Discussion of Fund Performance
Market Recap: The S&P 500
® index gained 56.35% for the 12 months ending March 31, 2021. The early-2020 outbreak and spread of COVID-19 resulted in stocks suffering one of the quickest declines on record, followed by a historic rebound that left the index just shy of an all-time high as of March 31. The rally slowed in September, when stocks began a two-month retreat amid Congress’s inability to reach a deal on additional fiscal stimulus, as well as concerns about election uncertainty. But as the calendar turned, investors saw reason to be hopeful. The rollout of two COVID-19 vaccines was underway, the U.S. Federal Reserve pledged to hold interest rates near zero until the economy recovered, and the federal government planned to deploy trillions of dollars in aid to boost consumers and the economy. This backdrop fueled a powerful market rotation, with small-cap value stocks usurping longstanding leadership from large growth shares. As part of the so-called reopening trade, investors moved out of tech-driven mega-caps that thrived due to the work-from-home trend in favor of cheap smaller companies they believed stood to benefit from a broad cyclical recovery. Reflecting this shift, the energy sector gained 75% for the 12 months, boosted by a rally in the price of oil. Financials rose roughly 68%, riding momentum among banks (+80%), whose profitability outlook improved amid rising long-term interest rates and a steeper yield curve. Conversely, notable “laggards” included the defensive utilities (+19%) and consumer staples (+28%) sectors.
Comments from Portfolio Manager Sammy Simnegar: For the fiscal year ending March 31, 2021, the fund's Retail Class shares gained 49.27%, underperforming the 56.35% advance of the benchmark S&P 500
® index. The largest detractor from performance versus the benchmark was security selection and an underweighting in industrials. Also hampering the portfolio’s relative result were stock picks and an underweighting in financials and consumer discretionary. The biggest individual relative detractor was untimely positioning in Lowe’s Companies (-2%), a stake that was not held at the end of this period. Another notable relative detractor was an overweighting in SBA Communications (+3%). Further weighing on performance versus the benchmark was an outsized holding in Crown Castle International (+8%), a position that was sold the past 12 months. Conversely, the top relative contributors included security selection and an underweighting in the lagging health care sector, especially within the pharmaceuticals, biotechnology & life sciences industry. An overweighting and stock picking in the information technology sector, primarily driven by the software & services industry, also bolstered the fund's relative performance. Also adding value were investment choices and an underweighting in the consumer staples sector, especially food, beverage & tobacco stocks. The biggest individual relative contributor was an overweight position in PayPal Holdings (+152%). Our second-largest relative contributor this period was avoiding Merck, a benchmark component that gained about 3%. Lastly, not owning Johnson & Johnson, a benchmark component that gained about 29%, further aided relative performance. Notable changes in positioning include increased exposure to the communication services sector and a lower allocation to real estate.
The views expressed above reflect those of the portfolio manager(s) only through the end of the period as stated on the cover of this report and do not necessarily represent the views of Fidelity or any other person in the Fidelity organization. Any such views are subject to change at any time based upon market or other conditions and Fidelity disclaims any responsibility to update such views. These views may not be relied on as investment advice and, because investment decisions for a Fidelity fund are based on numerous factors, may not be relied on as an indication of trading intent on behalf of any Fidelity fund.
Investment Summary (Unaudited)
Top Ten Stocks as of March 31, 2021
| | % of fund's net assets |
| Apple, Inc. | 6.6 |
| Microsoft Corp. | 6.2 |
| Amazon.com, Inc. | 4.7 |
| Facebook, Inc. Class A | 2.9 |
| Alphabet, Inc. Class A | 2.3 |
| Alphabet, Inc. Class C | 2.2 |
| The Home Depot, Inc. | 1.9 |
| Visa, Inc. Class A | 1.9 |
| UnitedHealth Group, Inc. | 1.9 |
| NVIDIA Corp. | 1.8 |
| | 32.4 |
Top Five Market Sectors as of March 31, 2021
| | % of fund's net assets |
| Information Technology | 40.3 |
| Communication Services | 14.9 |
| Consumer Discretionary | 9.8 |
| Health Care | 9.4 |
| Industrials | 8.5 |
Asset Allocation (% of fund's net assets)
| As of March 31, 2021* |
| | Stocks | 98.7% |
| | Convertible Securities | 0.3% |
| | Short-Term Investments and Net Other Assets (Liabilities) | 1.0% |

* Foreign investments - 3.7%
Schedule of Investments March 31, 2021
Showing Percentage of Net Assets
| Common Stocks - 98.7% | | | |
| | | Shares | Value (000s) |
| COMMUNICATION SERVICES - 14.9% | | | |
| Entertainment - 3.3% | | | |
| Netflix, Inc. (a) | | 664,600 | $346,695 |
| The Walt Disney Co. (a) | | 2,065,400 | 381,108 |
| | | | 727,803 |
| Interactive Media & Services - 8.2% | | | |
| Alphabet, Inc.: | | | |
| Class A (a) | | 240,466 | 495,966 |
| Class C (a) | | 238,554 | 493,480 |
| Facebook, Inc. Class A (a) | | 2,124,600 | 625,758 |
| Match Group, Inc. (a) | | 1,288,500 | 177,014 |
| | | | 1,792,218 |
| Media - 3.4% | | | |
| Cable One, Inc. | | 96,260 | 175,998 |
| Charter Communications, Inc. Class A (a) | | 373,500 | 230,457 |
| Comcast Corp. Class A | | 6,447,700 | 348,885 |
| | | | 755,340 |
|
| TOTAL COMMUNICATION SERVICES | | | 3,275,361 |
|
| CONSUMER DISCRETIONARY - 9.8% | | | |
| Hotels, Restaurants & Leisure - 1.0% | | | |
| Hilton Worldwide Holdings, Inc. | | 1,787,200 | 216,108 |
| Internet & Direct Marketing Retail - 5.6% | | | |
| Amazon.com, Inc. (a) | | 335,990 | 1,039,580 |
| Chewy, Inc. (a)(b) | | 2,186,900 | 185,252 |
| | | | 1,224,832 |
| Specialty Retail - 1.9% | | | |
| The Home Depot, Inc. | | 1,408,654 | 429,992 |
| Textiles, Apparel & Luxury Goods - 1.3% | | | |
| NIKE, Inc. Class B | | 2,148,275 | 285,484 |
|
| TOTAL CONSUMER DISCRETIONARY | | | 2,156,416 |
|
| CONSUMER STAPLES - 2.2% | | | |
| Food & Staples Retailing - 1.3% | | | |
| Costco Wholesale Corp. | | 807,500 | 284,628 |
| Personal Products - 0.9% | | | |
| Estee Lauder Companies, Inc. Class A | | 700,476 | 203,733 |
|
| TOTAL CONSUMER STAPLES | | | 488,361 |
|
| FINANCIALS - 6.1% | | | |
| Capital Markets - 4.1% | | | |
| Intercontinental Exchange, Inc. | | 2,029,599 | 226,666 |
| Moody's Corp. | | 751,298 | 224,345 |
| MSCI, Inc. | | 463,800 | 194,462 |
| S&P Global, Inc. | | 740,870 | 261,431 |
| | | | 906,904 |
| Insurance - 2.0% | | | |
| Arthur J. Gallagher & Co. | | 1,628,094 | 203,137 |
| Marsh & McLennan Companies, Inc. | | 1,877,935 | 228,732 |
| | | | 431,869 |
|
| TOTAL FINANCIALS | | | 1,338,773 |
|
| HEALTH CARE - 9.4% | | | |
| Health Care Equipment & Supplies - 4.3% | | | |
| Danaher Corp. | | 1,222,931 | 275,257 |
| IDEXX Laboratories, Inc. (a) | | 421,300 | 206,146 |
| Intuitive Surgical, Inc. (a) | | 325,000 | 240,156 |
| Stryker Corp. | | 941,500 | 229,331 |
| | | | 950,890 |
| Health Care Providers & Services - 1.9% | | | |
| UnitedHealth Group, Inc. | | 1,134,817 | 422,231 |
| Health Care Technology - 0.8% | | | |
| Veeva Systems, Inc. Class A (a) | | 694,417 | 181,409 |
| Life Sciences Tools & Services - 1.4% | | | |
| Thermo Fisher Scientific, Inc. | | 643,811 | 293,822 |
| Pharmaceuticals - 1.0% | | | |
| Zoetis, Inc. Class A | | 1,427,409 | 224,788 |
|
| TOTAL HEALTH CARE | | | 2,073,140 |
|
| INDUSTRIALS - 8.5% | | | |
| Aerospace & Defense - 1.7% | | | |
| HEICO Corp. Class A | | 1,631,128 | 185,296 |
| TransDigm Group, Inc. (a) | | 337,400 | 198,364 |
| | | | 383,660 |
| Electrical Equipment - 1.0% | | | |
| AMETEK, Inc. | | 1,687,247 | 215,512 |
| Professional Services - 3.5% | | | |
| CoStar Group, Inc. (a) | | 216,800 | 178,186 |
| IHS Markit Ltd. | | 2,235,564 | 216,358 |
| TransUnion Holding Co., Inc. | | 1,972,165 | 177,495 |
| Verisk Analytics, Inc. | | 1,106,747 | 195,551 |
| | | | 767,590 |
| Road & Rail - 2.3% | | | |
| Old Dominion Freight Lines, Inc. | | 814,129 | 195,725 |
| Union Pacific Corp. | | 1,361,200 | 300,022 |
| | | | 495,747 |
|
| TOTAL INDUSTRIALS | | | 1,862,509 |
|
| INFORMATION TECHNOLOGY - 40.0% | | | |
| Electronic Equipment & Components - 0.9% | | | |
| Amphenol Corp. Class A | | 3,061,000 | 201,934 |
| IT Services - 9.6% | | | |
| Accenture PLC Class A | | 1,141,800 | 315,422 |
| Fiserv, Inc. (a) | | 1,943,400 | 231,342 |
| Global Payments, Inc. | | 1,047,753 | 211,206 |
| MasterCard, Inc. Class A | | 1,092,922 | 389,135 |
| PayPal Holdings, Inc. (a) | | 1,446,100 | 351,171 |
| Square, Inc. (a) | | 813,100 | 184,614 |
| Visa, Inc. Class A | | 2,013,826 | 426,387 |
| | | | 2,109,277 |
| Semiconductors & Semiconductor Equipment - 7.3% | | | |
| Advanced Micro Devices, Inc. (a) | | 3,138,100 | 246,341 |
| Analog Devices, Inc. | | 1,380,000 | 214,010 |
| KLA Corp. | | 660,000 | 218,064 |
| Lam Research Corp. | | 397,800 | 236,786 |
| NVIDIA Corp. | | 742,700 | 396,550 |
| Texas Instruments, Inc. | | 1,573,300 | 297,338 |
| | | | 1,609,089 |
| Software - 15.6% | | | |
| Adobe, Inc. (a) | | 693,200 | 329,526 |
| ANSYS, Inc. (a) | | 570,500 | 193,719 |
| Autodesk, Inc. (a) | | 811,800 | 224,990 |
| Cadence Design Systems, Inc. (a) | | 1,577,145 | 216,053 |
| DocuSign, Inc. (a) | | 870,800 | 176,293 |
| Fortinet, Inc. (a) | | 1,066,600 | 196,702 |
| Intuit, Inc. | | 671,000 | 257,033 |
| Microsoft Corp. | | 5,779,500 | 1,362,633 |
| ServiceNow, Inc. (a) | | 499,998 | 250,054 |
| Synopsys, Inc. (a) | | 866,000 | 214,577 |
| | | | 3,421,580 |
| Technology Hardware, Storage & Peripherals - 6.6% | | | |
| Apple, Inc. | | 11,901,652 | 1,453,794 |
|
| TOTAL INFORMATION TECHNOLOGY | | | 8,795,674 |
|
| MATERIALS - 2.3% | | | |
| Chemicals - 2.3% | | | |
| Linde PLC | | 1,007,586 | 282,265 |
| Sherwin-Williams Co. | | 306,251 | 226,016 |
| | | | 508,281 |
| REAL ESTATE - 4.2% | | | |
| Equity Real Estate Investment Trusts (REITs) - 4.1% | | | |
| American Tower Corp. | | 1,116,499 | 266,910 |
| Equinix, Inc. | | 312,800 | 212,576 |
| Prologis (REIT), Inc. | | 2,298,843 | 243,677 |
| SBA Communications Corp. Class A | | 636,158 | 176,566 |
| | | | 899,729 |
| Real Estate Management & Development - 0.1% | | | |
| Rialto Real Estate Fund LP(a)(c)(d)(e)(f) | | 500,000 | 39 |
| RREF CMBS AIV, LP (c)(d)(e)(f)(g) | | 500,000 | 20,891 |
| RREF Midtown Colony REIT, Inc. (a)(c)(d)(e)(f)(h) | | 500,000 | 0 |
| | | | 20,930 |
|
| TOTAL REAL ESTATE | | | 920,659 |
|
| UTILITIES - 1.3% | | | |
| Electric Utilities - 1.3% | | | |
| NextEra Energy, Inc. | | 3,667,224 | 277,279 |
| TOTAL COMMON STOCKS | | | |
| (Cost $12,266,034) | | | 21,696,453 |
|
| Convertible Preferred Stocks - 0.3% | | | |
| INFORMATION TECHNOLOGY - 0.3% | | | |
| Software - 0.3% | | | |
| Bird Rides, Inc. Series C1 (e)(f) | | 527,862 | 2,766 |
| Malwarebytes Corp. Series B (a)(e)(f) | | 3,373,494 | 71,855 |
| TOTAL CONVERTIBLE PREFERRED STOCKS | | | |
| (Cost $41,200) | | | 74,621 |
|
| Money Market Funds - 1.3% | | | |
| Fidelity Cash Central Fund 0.06% (i) | | 170,015,131 | 170,049 |
| Fidelity Securities Lending Cash Central Fund 0.06% (i)(j) | | 119,322,668 | 119,335 |
| TOTAL MONEY MARKET FUNDS | | | |
| (Cost $289,384) | | | 289,384 |
| TOTAL INVESTMENT IN SECURITIES - 100.3% | | | |
| (Cost $12,596,618) | | | 22,060,458 |
| NET OTHER ASSETS (LIABILITIES) - (0.3)% | | | (75,641) |
| NET ASSETS - 100% | | | $21,984,817 |
Legend
(a) Non-income producing
(b) Security or a portion of the security is on loan at period end.
(c) Affiliated company
(d) Investment is owned by a wholly-owned subsidiary (Subsidiary) that is treated as a corporation for U.S. tax purposes.
(e) Restricted securities (including private placements) - Investment in securities not registered under the Securities Act of 1933 (excluding 144A issues). At the end of the period, the value of restricted securities (excluding 144A issues) amounted to $95,552,000 or 0.4% of net assets.
(f) Level 3 security
(g) Investment represents the Fund's ownership interest in a limited partnership, which is under common ownership and management with Rialto Real Estate Fund, LP.
(h) Investment represents the Fund's ownership interest in a real estate investment trust, which is under common ownership and management with Rialto Real Estate Fund, LP.
(i) Affiliated fund that is generally available only to investment companies and other accounts managed by Fidelity Investments. The rate quoted is the annualized seven-day yield of the fund at period end. A complete unaudited listing of the fund's holdings as of its most recent quarter end is available upon request. In addition, each Fidelity Central Fund's financial statements, which are not covered by the Fund's Report of Independent Registered Public Accounting Firm, are available on the SEC's website or upon request.
(j) Investment made with cash collateral received from securities on loan.
Additional information on each restricted holding is as follows:
| Security | Acquisition Date | Acquisition Cost |
| Bird Rides, Inc. Series C1 | 12/21/18 | $6,200 |
| Malwarebytes Corp. Series B | 12/21/15 | $35,000 |
| Rialto Real Estate Fund LP | 2/24/11- 8/17/12 | $33,049 |
| RREF CMBS AIV, LP | 8/10/11- 8/17/12 | $15,528 |
| RREF Midtown Colony REIT, Inc. | 12/31/12 | $1,423 |
Affiliated Central Funds
Information regarding fiscal year to date income earned by the Fund from investments in Fidelity Central Funds is as follows:
| Fund | Income earned |
| | (Amounts in thousands) |
| Fidelity Cash Central Fund | $225 |
| Fidelity Securities Lending Cash Central Fund | 305 |
| Total | $530 |
Amounts in the income column in the above table include any capital gain distributions from underlying funds, which are presented in the corresponding line-item in the Statement of Operations, if applicable. Amount for Fidelity Securities Lending Cash Central Fund represents the income earned on investing cash collateral, less rebates paid to borrowers and any lending agent fees associated with the loan, plus any premium payments received for lending certain types of securities.
Other Affiliated Issuers
An affiliated company is a company in which the Fund has ownership of at least 5% of the voting securities. Fiscal year to date transactions with companies which are or were affiliates are as follows:
| Affiliate (Amounts in thousands) | Value, beginning of period | Purchases | Sales Proceeds | Dividend Income | Realized Gain (loss) | Change in Unrealized appreciation (depreciation) | Value, end of period |
| Rialto Real Estate Fund LP | $895 | $-- | $-- | $-- | $-- | $(856) | $39 |
| RREF CMBS AIV, LP | 20,695 | -- | -- | 1,601 | -- | 196 | 20,891 |
| RREF Midtown Colony REIT, Inc. | -- | -- | -- | -- | -- | -- | -- |
| Total | $21,590 | $-- | $-- | $1,601 | $-- | $(660) | $20,930 |
Investment Valuation
The following is a summary of the inputs used, as of March 31, 2021, involving the Fund's assets and liabilities carried at fair value. The inputs or methodology used for valuing securities may not be an indication of the risk associated with investing in those securities. For more information on valuation inputs, and their aggregation into the levels used below, please refer to the Investment Valuation section in the accompanying Notes to Financial Statements.
| | Valuation Inputs at Reporting Date: |
| Description | Total | Level 1 | Level 2 | Level 3 |
| (Amounts in thousands) | | | | |
| Investments in Securities: | | | | |
| Equities: | | | | |
| Communication Services | $3,275,361 | $3,275,361 | $-- | $-- |
| Consumer Discretionary | 2,156,416 | 2,156,416 | -- | -- |
| Consumer Staples | 488,361 | 488,361 | -- | -- |
| Financials | 1,338,773 | 1,338,773 | -- | -- |
| Health Care | 2,073,140 | 2,073,140 | -- | -- |
| Industrials | 1,862,509 | 1,862,509 | -- | -- |
| Information Technology | 8,870,295 | 8,795,674 | -- | 74,621 |
| Materials | 508,281 | 508,281 | -- | -- |
| Real Estate | 920,659 | 899,729 | -- | 20,930 |
| Utilities | 277,279 | 277,279 | -- | -- |
| Money Market Funds | 289,384 | 289,384 | -- | -- |
| Total Investments in Securities: | $22,060,458 | $21,964,907 | $-- | $95,551 |
See accompanying notes which are an integral part of the financial statements.
Financial Statements
Statement of Assets and Liabilities
| Amounts in thousands (except per-share amounts) | | March 31, 2021 |
| Assets | | |
Investment in securities, at value (including securities loaned of $123,278) — See accompanying schedule:
Unaffiliated issuers (cost $12,274,989) | $21,750,144 | |
| Fidelity Central Funds (cost $289,384) | 289,384 | |
| Other affiliated issuers (cost $32,245) | 20,930 | |
| Total Investment in Securities (cost $12,596,618) | | $22,060,458 |
| Restricted cash | | 93 |
| Receivable for investments sold | | 55,609 |
| Receivable for fund shares sold | | 1,903 |
| Dividends receivable | | 2,737 |
| Distributions receivable from Fidelity Central Funds | | 13 |
| Prepaid expenses | | 13 |
| Other receivables | | 1,737 |
| Total assets | | 22,122,563 |
| Liabilities | | |
| Payable for fund shares redeemed | $5,808 | |
| Accrued management fee | 8,643 | |
| Other affiliated payables | 2,198 | |
| Other payables and accrued expenses | 1,762 | |
| Collateral on securities loaned | 119,335 | |
| Total liabilities | | 137,746 |
| Net Assets | | $21,984,817 |
| Net Assets consist of: | | |
| Paid in capital | | $11,461,155 |
| Total accumulated earnings (loss) | | 10,523,662 |
| Net Assets | | $21,984,817 |
| Net Asset Value and Maximum Offering Price | | |
| Magellan: | | |
| Net Asset Value, offering price and redemption price per share ($21,001,660 ÷ 1,602,471 shares) | | $13.11 |
| Class K: | | |
| Net Asset Value, offering price and redemption price per share ($983,157 ÷ 75,083 shares) | | $13.09 |
See accompanying notes which are an integral part of the financial statements.
Statement of Operations
| Amounts in thousands | | Year ended March 31, 2021 |
| Investment Income | | |
| Dividends (including $1,601 earned from other affiliated issuers) | | $157,620 |
| Income from Fidelity Central Funds (including $305 from security lending) | | 530 |
| Total income | | 158,150 |
| Expenses | | |
| Management fee | | |
| Basic fee | $107,692 | |
| Performance adjustment | 26,331 | |
| Transfer agent fees | 22,848 | |
| Accounting fees | 1,710 | |
| Custodian fees and expenses | 161 | |
| Independent trustees' fees and expenses | 103 | |
| Registration fees | 108 | |
| Audit | 109 | |
| Legal | 26 | |
| Interest | 1 | |
| Miscellaneous | 206 | |
| Total expenses before reductions | 159,295 | |
| Expense reductions | (510) | |
| Total expenses after reductions | | 158,785 |
| Net investment income (loss) | | (635) |
| Realized and Unrealized Gain (Loss) | | |
| Net realized gain (loss) on: | | |
| Investment securities: | | |
| Unaffiliated issuers | 1,417,275 | |
| Fidelity Central Funds | (13) | |
| Total net realized gain (loss) | | 1,417,262 |
| Change in net unrealized appreciation (depreciation) on: | | |
| Investment securities: | | |
| Unaffiliated issuers | 6,112,619 | |
| Affiliated issuers | (660) | |
| Assets and liabilities in foreign currencies | 8 | |
| Total change in net unrealized appreciation (depreciation) | | 6,111,967 |
| Net gain (loss) | | 7,529,229 |
| Net increase (decrease) in net assets resulting from operations | | $7,528,594 |
See accompanying notes which are an integral part of the financial statements.
Statement of Changes in Net Assets
| Amounts in thousands | Year ended March 31, 2021 | Year ended March 31, 2020 |
| Increase (Decrease) in Net Assets | | |
| Operations | | |
| Net investment income (loss) | $(635) | $65,400 |
| Net realized gain (loss) | 1,417,262 | 2,028,707 |
| Change in net unrealized appreciation (depreciation) | 6,111,967 | (2,291,443) |
| Net increase (decrease) in net assets resulting from operations | 7,528,594 | (197,336) |
| Distributions to shareholders | (66,225) | (2,299,389) |
| Share transactions - net increase (decrease) | (1,167,205) | 1,867,466 |
| Total increase (decrease) in net assets | 6,295,164 | (629,259) |
| Net Assets | | |
| Beginning of period | 15,689,653 | 16,318,912 |
| End of period | $21,984,817 | $15,689,653 |
See accompanying notes which are an integral part of the financial statements.
Financial Highlights
Fidelity Magellan Fund
| Years ended March 31, | 2021 | 2020 | 2019 A | 2018 A | 2017 A |
| Selected Per–Share Data | | | | | |
| Net asset value, beginning of period | $8.81 | $10.23 | $10.57 | $9.72 | $8.75 |
| Income from Investment Operations | | | | | |
| Net investment income (loss)B | –C | .04 | .06 | .08D | .06 |
| Net realized and unrealized gain (loss) | 4.34 | .06E | .57 | 1.78 | 1.18 |
| Total from investment operations | 4.34 | .10 | .63 | 1.86 | 1.24 |
| Distributions from net investment income | – | (.05) | (.06) | (.08) | (.06) |
| Distributions from net realized gain | (.04) | (1.47) | (.91) | (.93) | (.21) |
| Total distributions | (.04) | (1.52) | (.97) | (1.01) | (.27) |
| Net asset value, end of period | $13.11 | $8.81 | $10.23 | $10.57 | $9.72 |
| Total ReturnF | 49.27% | (.67)% | 6.51% | 20.16% | 14.46% |
| Ratios to Average Net AssetsG,H | | | | | |
| Expenses before reductions | .79% | .76% | .67% | .69% | .68% |
| Expenses net of fee waivers, if any | .79% | .76% | .67% | .69% | .67% |
| Expenses net of all reductions | .78% | .76% | .66% | .69% | .67% |
| Net investment income (loss) | (.01)% | .38% | .60% | .79%D | .68% |
| Supplemental Data | | | | | |
| Net assets, end of period (in millions) | $21,002 | $14,668 | $14,729 | $14,906 | $13,467 |
| Portfolio turnover rateI | 56%J | 106%J | 42%J | 53%J | 51%J |
A Per share amounts have been adjusted to reflect the impact of the 10 for 1 share split that occurred on August 10, 2018.
B Calculated based on average shares outstanding during the period.
C Amount represents less than $.005 per share.
D Net investment income per share reflects one or more large, non-recurring dividend(s) which amounted to $.02 per share. Excluding such non-recurring dividend(s), the ratio of net investment income (loss) to average net assets would have been .57%.
E The amount shown for a share outstanding does not correspond with the aggregate net gain (loss) on investments for the period due to the timing of sales and repurchases of shares in relation to fluctuating market values of the investments of the Fund.
F Total returns would have been lower if certain expenses had not been reduced during the applicable periods shown.
G Fees and expenses of any underlying mutual funds or exchange-traded funds (ETFs) are not included in the Fund's expense ratio. The Fund indirectly bears its proportionate share of these expenses. For additional expense information related to investments in Fidelity Central Funds, please refer to the "Investments in Fidelity Central Funds" note found in the Notes to Financial Statements section of the most recent Annual or Semi-Annual report.
H Expense ratios reflect operating expenses of the class. Expenses before reductions do not reflect amounts reimbursed, waived, or reduced through arrangements with the investment adviser, brokerage services, or other offset arrangements, if applicable, and do not represent the amount paid by the class during periods when reimbursements, waivers or reductions occur.
I Amount does not include the portfolio activity of any underlying mutual funds or exchange-traded funds (ETFs).
J Portfolio turnover rate excludes securities received or delivered in-kind.
See accompanying notes which are an integral part of the financial statements.
Fidelity Magellan Fund Class K
| Years ended March 31, | 2021 | 2020 | 2019 A | 2018 A | 2017 A |
| Selected Per–Share Data | | | | | |
| Net asset value, beginning of period | $8.79 | $10.22 | $10.56 | $9.71 | $8.74 |
| Income from Investment Operations | | | | | |
| Net investment income (loss)B | .01 | .05 | .07 | .09C | .07 |
| Net realized and unrealized gain (loss) | 4.33 | .05D | .57 | 1.78 | 1.18 |
| Total from investment operations | 4.34 | .10 | .64 | 1.87 | 1.25 |
| Distributions from net investment income | – | (.06) | (.07) | (.09) | (.06) |
| Distributions from net realized gain | (.04) | (1.47) | (.91) | (.93) | (.22) |
| Total distributions | (.04) | (1.53) | (.98) | (1.02) | (.28) |
| Net asset value, end of period | $13.09 | $8.79 | $10.22 | $10.56 | $9.71 |
| Total ReturnE | 49.38% | (.71)% | 6.63% | 20.27% | 14.57% |
| Ratios to Average Net AssetsF,G | | | | | |
| Expenses before reductions | .71% | .68% | .58% | .61% | .58% |
| Expenses net of fee waivers, if any | .71% | .68% | .58% | .60% | .58% |
| Expenses net of all reductions | .71% | .68% | .58% | .60% | .58% |
| Net investment income (loss) | .07% | .46% | .69% | .88%C | .78% |
| Supplemental Data | | | | | |
| Net assets, end of period (in millions) | $983 | $1,021 | $1,590 | $2,271 | $1,893 |
| Portfolio turnover rateH | 56%I | 106%I | 42%I | 53%I | 51%I |
A Per share amounts have been adjusted to reflect the impact of the 10 for 1 share split that occurred on August 10, 2018.
B Calculated based on average shares outstanding during the period.
C Net investment income per share reflects one or more large, non-recurring dividend(s) which amounted to $.02 per share. Excluding such non-recurring dividend(s), the ratio of net investment income (loss) to average net assets would have been .65%.
D The amount shown for a share outstanding does not correspond with the aggregate net gain (loss) on investments for the period due to the timing of sales and repurchases of shares in relation to fluctuating market values of the investments of the Fund.
E Total returns would have been lower if certain expenses had not been reduced during the applicable periods shown.
F Fees and expenses of any underlying mutual funds or exchange-traded funds (ETFs) are not included in the Fund's expense ratio. The Fund indirectly bears its proportionate share of these expenses. For additional expense information related to investments in Fidelity Central Funds, please refer to the "Investments in Fidelity Central Funds" note found in the Notes to Financial Statements section of the most recent Annual or Semi-Annual report.
G Expense ratios reflect operating expenses of the class. Expenses before reductions do not reflect amounts reimbursed, waived, or reduced through arrangements with the investment adviser, brokerage services, or other offset arrangements, if applicable, and do not represent the amount paid by the class during periods when reimbursements, waivers or reductions occur.
H Amount does not include the portfolio activity of any underlying mutual funds or exchange-traded funds (ETFs).
I Portfolio turnover rate excludes securities received or delivered in-kind.
See accompanying notes which are an integral part of the financial statements.
Notes to Financial Statements
For the period ended March 31, 2021
(Amounts in thousands except percentages)
1. Organization.
Fidelity Magellan Fund (the Fund) is a fund of Fidelity Magellan Fund (the Trust) and is authorized to issue an unlimited number of shares. The Trust is registered under the Investment Company Act of 1940, as amended (the 1940 Act), as an open-end management investment company organized as a Massachusetts business trust. The Fund offers Magellan and Class K shares, each of which has equal rights as to assets and voting privileges. Each class has exclusive voting rights with respect to matters that affect that class.
2. Investments in Fidelity Central Funds.
The Fund invests in Fidelity Central Funds, which are open-end investment companies generally available only to other investment companies and accounts managed by the investment adviser and its affiliates. The Fund's Schedule of Investments lists each of the Fidelity Central Funds held as of period end, if any, as an investment of the Fund, but does not include the underlying holdings of each Fidelity Central Fund. As an Investing Fund, the Fund indirectly bears its proportionate share of the expenses of the underlying Fidelity Central Funds.
The Money Market Central Funds seek preservation of capital and current income and are managed by the investment adviser. Annualized expenses of the Money Market Central Funds as of their most recent shareholder report date ranged from less than .005% to .01%.
A complete unaudited list of holdings for each Fidelity Central Fund is available upon request or at the Securities and Exchange Commission (the SEC) website at www.sec.gov. In addition, the financial statements of the Fidelity Central Funds, which are not covered by the Fund's Report of Independent Registered Public Accounting Firm, are available on the SEC website or upon request.
3. Significant Accounting Policies.
The Fund is an investment company and applies the accounting and reporting guidance of the Financial Accounting Standards Board (FASB) Accounting Standards Codification Topic 946 Financial Services - Investment Companies. The financial statements have been prepared in conformity with accounting principles generally accepted in the United States of America (GAAP), which require management to make certain estimates and assumptions at the date of the financial statements. Actual results could differ from those estimates. Subsequent events, if any, through the date that the financial statements were issued have been evaluated in the preparation of the financial statements. The Fund's Schedule of Investments lists any underlying mutual funds or exchange-traded funds (ETFs) but does not include the underlying holdings of these funds. The following summarizes the significant accounting policies of the Fund:
Investment Valuation. Investments are valued as of 4:00 p.m. Eastern time on the last calendar day of the period. The Board of Trustees (the Board) has delegated the day to day responsibility for the valuation of the Fund's investments to the Fair Value Committee (the Committee) established by the Fund's investment adviser. In accordance with valuation policies and procedures approved by the Board, the Fund attempts to obtain prices from one or more third party pricing vendors or brokers to value its investments. When current market prices, quotations or currency exchange rates are not readily available or reliable, investments will be fair valued in good faith by the Committee, in accordance with procedures adopted by the Board. Factors used in determining fair value vary by investment type and may include market or investment specific events. The frequency with which these procedures are used cannot be predicted and they may be utilized to a significant extent. The Committee oversees the Fund's valuation policies and procedures and reports to the Board on the Committee's activities and fair value determinations. The Board monitors the appropriateness of the procedures used in valuing the Fund's investments and ratifies the fair value determinations of the Committee.
The Fund categorizes the inputs to valuation techniques used to value its investments into a disclosure hierarchy consisting of three levels as shown below:
- Level 1 – quoted prices in active markets for identical investments
- Level 2 – other significant observable inputs (including quoted prices for similar investments, interest rates, prepayment speeds, etc.)
- Level 3 – unobservable inputs (including the Fund's own assumptions based on the best information available)
Valuation techniques used to value the Fund's investments by major category are as follows:
Equity securities, including restricted securities, for which market quotations are readily available, are valued at the last reported sale price or official closing price as reported by a third party pricing vendor on the primary market or exchange on which they are traded and are categorized as Level 1 in the hierarchy. In the event there were no sales during the day or closing prices are not available, securities are valued at the last quoted bid price or may be valued using the last available price and are generally categorized as Level 2 in the hierarchy. For foreign equity securities, when market or security specific events arise, comparisons to the valuation of American Depositary Receipts (ADRs), futures contracts, Exchange-Traded Funds (ETFs) and certain indexes as well as quoted prices for similar securities may be used and would be categorized as Level 2 in the hierarchy. For equity securities, including restricted securities, where observable inputs are limited, assumptions about market activity and risk are used and these securities may be categorized as Level 3 in the hierarchy.
Investments in open-end mutual funds, including the Fidelity Central Funds, are valued at their closing net asset value (NAV) each business day and are categorized as Level 1 in the hierarchy.
Changes in valuation techniques may result in transfers in or out of an assigned level within the disclosure hierarchy. The aggregate value of investments by input level as of March 31, 2021, is included at the end of the Fund's Schedule of Investments.
Foreign Currency. Certain Funds may use foreign currency contracts to facilitate transactions in foreign-denominated securities. Gains and losses from these transactions may arise from changes in the value of the foreign currency or if the counterparties do not perform under the contracts' terms.
Foreign-denominated assets, including investment securities, and liabilities are translated into U.S. dollars at the exchange rates at period end. Purchases and sales of investment securities, income and dividends received, and expenses denominated in foreign currencies are translated into U.S. dollars at the exchange rate in effect on the transaction date.
The effects of exchange rate fluctuations on investments are included with the net realized and unrealized gain (loss) on investment securities. Other foreign currency transactions resulting in realized and unrealized gain (loss) are disclosed separately.
Investment Transactions and Income. For financial reporting purposes, the Fund's investment holdings and NAV include trades executed through the end of the last business day of the period. The NAV per share for processing shareholder transactions is calculated as of the close of business of the New York Stock Exchange (NYSE), normally 4:00 p.m. Eastern time and includes trades executed through the end of the prior business day. Gains and losses on securities sold are determined on the basis of identified cost and include proceeds received from litigation. Dividend income is recorded on the ex-dividend date, except for certain dividends from foreign securities where the ex-dividend date may have passed, which are recorded as soon as the Fund is informed of the ex-dividend date. Non-cash dividends included in dividend income, if any, are recorded at the fair market value of the securities received. Income and capital gain distributions from Fidelity Central Funds, if any, are recorded on the ex-dividend date. Certain distributions received by the Fund represent a return of capital or capital gain. The Fund determines the components of these distributions subsequent to the ex-dividend date, based upon receipt of tax filings or other correspondence relating to the underlying investment. These distributions are recorded as a reduction of cost of investments and/or as a realized gain. Investment income is recorded net of foreign taxes withheld where recovery of such taxes is uncertain.
Class Allocations and Expenses. Investment income, realized and unrealized capital gains and losses, common expenses of the Fund, and certain fund-level expense reductions, if any, are allocated daily on a pro-rata basis to each class based on the relative net assets of each class to the total net assets of the Fund. Each class differs with respect to transfer agent fees incurred. Certain expense reductions may also differ by class. For the reporting period, the allocated portion of income and expenses to each class as a percent of its average net assets may vary due to the timing of recording these transactions in relation to fluctuating net assets of the classes. Expenses directly attributable to a fund are charged to that fund. Expenses attributable to more than one fund are allocated among the respective funds on the basis of relative net assets or other appropriate methods. Expense estimates are accrued in the period to which they relate and adjustments are made when actual amounts are known.
Deferred Trustee Compensation. Under a Deferred Compensation Plan (the Plan) for certain Funds, certain independent Trustees have elected to defer receipt of a portion of their annual compensation. Deferred amounts are invested in affiliated mutual funds, are marked-to-market and remain in a fund until distributed in accordance with the Plan. The investment of deferred amounts and the offsetting payable to the Trustees presented below are included in the accompanying Statement of Assets and Liabilities in other receivables and other payables and accrued expenses, as applicable.
| Fidelity Magellan Fund | $1,646 |
Income Tax Information and Distributions to Shareholders. Each year, the Fund intends to qualify as a regulated investment company under Subchapter M of the Internal Revenue Code, including distributing substantially all of its taxable income and realized gains. As a result, no provision for U.S. Federal income taxes is required. As of March 31, 2021, the Fund did not have any unrecognized tax benefits in the financial statements; nor is the Fund aware of any tax positions for which it is reasonably possible that the total amounts of unrecognized tax benefits will significantly change in the next twelve months. The Fund files a U.S. federal tax return, in addition to state and local tax returns as required. The Fund's federal income tax returns are subject to examination by the Internal Revenue Service (IRS) for a period of three fiscal years after they are filed. State and local tax returns may be subject to examination for an additional fiscal year depending on the jurisdiction. Foreign taxes are provided for based on the Fund's understanding of the tax rules and rates that exist in the foreign markets in which it invests.
Distributions are declared and recorded on the ex-dividend date. Income and capital gain distributions are declared separately for each class. Income and capital gain distributions are determined in accordance with income tax regulations, which may differ from GAAP. In addition, the Fund claimed a portion of the payment made to redeeming shareholders as a distribution for income tax purposes.
Capital accounts within the financial statements are adjusted for permanent book-tax differences. These adjustments have no impact on net assets or the results of operations. Capital accounts are not adjusted for temporary book-tax differences which will reverse in a subsequent period.
Book-tax differences are primarily due to passive foreign investment companies (PFIC), redemptions in kind, partnerships, deferred Trustees compensation, net operating losses and losses deferred due to wash sales and excise tax regulations.
As of period end, the cost and unrealized appreciation (depreciation) in securities, and derivatives if applicable, for federal income tax purposes were as follows:
| Gross unrealized appreciation | $9,578,892 |
| Gross unrealized depreciation | (119,295) |
| Net unrealized appreciation (depreciation) | $9,459,597 |
| Tax Cost | $12,600,861 |
The tax-based components of distributable earnings as of period end were as follows:
| Undistributed long-term capital gain | $1,065,704 |
| Net unrealized appreciation (depreciation) on securities and other investments | $9,459,604 |
The tax character of distributions paid was as follows:
| | March 31, 2021 | March 31, 2020 |
| Ordinary Income | $– | $ 75,958 |
| Long-term Capital Gains | 66,225 | 2,223,431 |
| Total | $66,225 | $ 2,299,389 |
Restricted Securities (including Private Placements). Funds may invest in securities that are subject to legal or contractual restrictions on resale. These securities generally may be resold in transactions exempt from registration or to the public if the securities are registered. Disposal of these securities may involve time-consuming negotiations and expense, and prompt sale at an acceptable price may be difficult. Information regarding restricted securities held at period end is included at the end of the Schedule of Investments, if applicable.
Consolidated Subsidiary. The Funds included in the table below hold certain investments through a wholly-owned subsidiary ("Subsidiary"), which may be subject to federal and state taxes upon disposition.
As of period end, investments in Subsidiaries were as follows:
| | $ Amount | % of Net Assets |
| Fidelity Magellan Fund | 21,023 | .10% |
The financial statements have been consolidated to include the Subsidiary accounts where applicable. Accordingly, all inter-company transactions and balances have been eliminated.
At period end, any estimated tax liability for these investments is presented as "Deferred taxes" in the Statement of Assets and Liabilities and included in "Change in net unrealized appreciation (depreciation) on investment securities" in the Statement of Operations. The tax liability incurred may differ materially depending on conditions when these investments are disposed. Any cash held by a Subsidiary is restricted as to its use and is presented as "Restricted cash" in the Statement of Assets and Liabilities, if applicable.
4. Purchases and Sales of Investments.
Purchases and sales of securities, other than short-term securities and in-kind transactions, are noted in the table below.
| | Purchases ($) | Sales ($) |
| Fidelity Magellan Fund | 11,274,850 | 12,431,257 |
Unaffiliated Redemptions In-Kind. During the period, 22,824 shares of the Fund were redeemed in-kind for investments, and cash with a value of $192,403. The net realized gain of $67,933 on investments delivered through in-kind redemptions is included in the accompanying Statement of Operations. The amount of the in-kind redemptions is included in share transactions in the accompanying Statement of Changes in Net Assets as well as the Notes to Financial Statements. The Fund recognized no gain or loss for federal income tax purposes.
Prior Fiscal Year Unaffiliated Redemptions In-Kind. During the prior period, 2,053 shares of the Fund were redeemed in-kind for investments and cash with a value of $22,233. The Fund had a net realized gain of $7,511 on investments delivered through in-kind redemptions. The amount of the in-kind redemptions is included in share transactions in the accompanying Statement of Changes in Net Assets as well as the Notes to Financial Statements. The Fund recognized no gain or loss for federal income tax purposes.
5. Fees and Other Transactions with Affiliates.
Management Fee. Fidelity Management & Research Company LLC (the investment adviser) and its affiliates provide the Fund with investment management related services for which the Fund pays a monthly management fee. The management fee is the sum of an individual fund fee rate that is based on an annual rate of .30% of the Fund's average net assets and an annualized group fee rate that averaged .23% during the period. The group fee rate is based upon the monthly average net assets of a group of registered investment companies with which the investment adviser has management contracts. The group fee rate decreases as assets under management increase and increases as assets under management decrease. In addition, the management fee is subject to a performance adjustment (up to a maximum of +/- .20% of the Fund's average net assets over a 36 month performance period). The upward or downward adjustment to the management fee is based on the relative investment performance of Magellan as compared to its benchmark index, the S&P 500 Index, over the same 36 month performance period. For the reporting period, the total annual management fee rate, including the performance adjustment, was .66% of the Fund's average net assets. The performance adjustment included in the management fee rate may be higher or lower than the maximum performance adjustment rate due to the difference between the average net assets for the reporting and performance periods.
Transfer Agent Fees. Fidelity Investments Institutional Operations Company LLC (FIIOC), an affiliate of the investment adviser, is the transfer, dividend disbursing and shareholder servicing agent for each class of the Fund. FIIOC receives account fees and asset-based fees that vary according to the account size and type of account of the shareholders of Magellan, except for Class K. FIIOC receives an asset-based fee of Class K's average net assets. FIIOC pays for typesetting, printing and mailing of shareholder reports, except proxy statements.
For the period, transfer agent fees for each class were as follows:
| | Amount | % of Class-Level Average Net Assets |
| Magellan | $22,401 | .12 |
| Class K | 447 | .04 |
| | $ 22,848 | |
Accounting Fees. Fidelity Service Company, Inc. (FSC), an affiliate of the investment adviser, maintains the Fund's accounting records. The accounting fee is based on the level of average net assets for each month. For the period, the fees were equivalent to the following annual rates:
| | % of Average Net Assets |
| Fidelity Magellan Fund | .01 |
Brokerage Commissions. A portion of portfolio transactions were placed with brokerage firms which are affiliates of the investment adviser. Brokerage commissions are included in net realized gain (loss) and change in net unrealized appreciation (depreciation) in the Statement of Operations. The commissions paid to these affiliated firms were as follows:
| | Amount |
| Fidelity Magellan Fund | $154 |
Interfund Lending Program. Pursuant to an Exemptive Order issued by the SEC, the Fund, along with other registered investment companies having management contracts with Fidelity Management & Research Company LLC (FMR), or other affiliated entities of FMR, may participate in an interfund lending program. This program provides an alternative credit facility allowing the Fund to borrow from, or lend money to, other participating affiliated funds. At period end, there were no interfund loans outstanding. Activity in this program during the period for which loans were outstanding was as follows:
| | Borrower or Lender | Average Loan Balance | Weighted Average Interest Rate | Interest Expense |
| Fidelity Magellan Fund | Borrower | $24,303 | .31% | $1 |
Interfund Trades. Funds may purchase from or sell securities to other Fidelity Funds under procedures adopted by the Board. The procedures have been designed to ensure these interfund trades are executed in accordance with Rule 17a-7 of the 1940 Act. Any interfund trades are included within the respective purchases and sales amounts shown in the Purchases and Sales of Investments note and are noted in the table below.
| | Purchases ($) | Sales ($) |
| Fidelity Magellan Fund | 928,933 | 806,634 |
Prior Fiscal Year Affiliated Redemptions In-Kind. During the prior period, 11,607 shares of the Fund were redeemed in-kind for investments and cash with a value of $124,780. The Fund had a net realized gain of $44,325 on investments delivered through in-kind redemptions. The amount of the in-kind redemptions is included in share transactions in the accompanying Statement of Changes in Net Assets as well as the Notes to Financial Statements. The Fund recognized no gain or loss for federal income tax purposes.
6. Committed Line of Credit.
Certain Funds participate with other funds managed by the investment adviser or an affiliate in a $4.25 billion credit facility (the "line of credit") to be utilized for temporary or emergency purposes to fund shareholder redemptions or for other short-term liquidity purposes. The participating funds have agreed to pay commitment fees on their pro-rata portion of the line of credit, which are reflected in Miscellaneous expenses on the Statement of Operations, and are listed below.
| | Amount |
| Fidelity Magellan Fund | $43 |
During the period, there were no borrowings on this line of credit.
7. Security Lending.
Funds lend portfolio securities from time to time in order to earn additional income. Lending agents are used, including National Financial Services (NFS), an affiliate of the investment adviser. Pursuant to a securities lending agreement, NFS will receive a fee, which is capped at 9.9% of a fund's daily lending revenue, for its services as lending agent. A fund may lend securities to certain qualified borrowers, including NFS. On the settlement date of the loan, a fund receives collateral (in the form of U.S. Treasury obligations, letters of credit and/or cash) against the loaned securities and maintains collateral in an amount not less than 100% of the market value of the loaned securities during the period of the loan. The market value of the loaned securities is determined at the close of business of a fund and any additional required collateral is delivered to a fund on the next business day. A fund or borrower may terminate the loan at any time, and if the borrower defaults on its obligation to return the securities loaned because of insolvency or other reasons, a fund may apply collateral received from the borrower against the obligation. A fund may experience delays and costs in recovering the securities loaned. Any cash collateral received is invested in the Fidelity Securities Lending Cash Central Fund. Any loaned securities are identified as such in the Schedule of Investments, and the value of loaned securities and cash collateral at period end, as applicable, are presented in the Statement of Assets and Liabilities. Security lending income represents the income earned on investing cash collateral, less rebates paid to borrowers and any lending agent fees associated with the loan, plus any premium payments received for lending certain types of securities. Security lending income is presented in the Statement of Operations as a component of income from Fidelity Central Funds. Affiliated security lending activity, if any, was as follows:
| | Total Security Lending Income Fees Paid to NFS | Security Lending Income From Securities Loaned to NFS | Value of Securities Loaned to NFS at Period End |
| Fidelity Magellan Fund | $33 | $– | $– |
8. Expense Reductions.
Commissions paid to certain brokers with whom the investment adviser, or its affiliates, places trades on behalf of the Fund include an amount in addition to trade execution, which may be rebated back to the Fund to offset expenses. This amount totaled $443 for the period.
In addition, during the period the investment adviser or an affiliate reimbursed and/or waived a portion of fund-level operating expenses in the amount of $67.
9. Distributions to Shareholders.
Distributions to shareholders of each class were as follows:
| | Year ended
March 31, 2021 | Year ended
March 31, 2020 |
| Distributions to shareholders | | |
| Magellan | $62,880 | $2,102,226 |
| Class K | 3,345 | 197,163 |
| Total | $66,225 | $2,299,389 |
10. Share Transactions.
Share transactions for each class were as follows and may contain automatic conversions between classes or exchanges between affiliated funds:
| | Shares | Shares | Dollars | Dollars |
| | Year ended March 31, 2021 | Year ended March 31, 2020 | Year ended March 31, 2021 | Year ended March 31, 2020 |
| Magellan | | | | |
| Shares sold | 73,840 | 188,980 | $877,387 | $1,962,946 |
| Reinvestment of distributions | 4,757 | 198,803 | 59,849 | 1,993,499 |
| Shares redeemed | (141,915) | (161,269) | (1,686,140) | (1,666,229) |
| Net increase (decrease) | (63,318) | 226,514 | $(748,904) | $2,290,216 |
| Class K | | | | |
| Shares sold | 5,940 | 33,112 | $70,349 | $307,492 |
| Reinvestment of distributions | 266 | 19,675 | 3,345 | 197,163 |
| Shares redeemed | (47,312)(a) | (92,147)(b),(c) | (491,995)(a) | (927,405)(b),(c) |
| Net increase (decrease) | (41,106) | (39,360) | $(418,301) | $(422,750) |
(a) Amount includes in-kind redemptions (see the Unaffiliated Redemptions In-Kind note for additional details).
(b) Amount includes in-kind redemptions (see the Prior Fiscal Year Unaffiliated Redemptions In-Kind note for additional details).
(c) Amount includes in-kind redemptions (see the Prior Fiscal Year Affiliated Redemptions In-Kind note for additional details).
11. Other.
The Fund's organizational documents provide former and current trustees and officers with a limited indemnification against liabilities arising in connection with the performance of their duties to the Fund. In the normal course of business, the Fund may also enter into contracts that provide general indemnifications. The Fund's maximum exposure under these arrangements is unknown as this would be dependent on future claims that may be made against the Fund. The risk of material loss from such claims is considered remote.
At the end of the period, Strategic Advisers Fidelity U.S. Total Stock Fund was the owner of record of approximately 11% of the total outstanding shares of the Fund.
12. Coronavirus (COVID-19) Pandemic.
An outbreak of COVID-19 first detected in China during December 2019 has since spread globally and was declared a pandemic by the World Health Organization during March 2020. Developments that disrupt global economies and financial markets, such as the COVID-19 pandemic, may magnify factors that affect the Fund's performance.
13. Proposed Reorganization.
The Board of Trustees of the Fund approved an Agreement and Plan of Reorganization (the Agreement) between the Fund and Fidelity Independence Fund. Pursuant to the Agreement the Fund will acquire all the assets and assume all the liabilities of the Fidelity Independence Fund. The reorganization will be accomplished by an exchange of corresponding shares of the Fund for shares of Fidelity Independence Fund at their net asset value on the date the reorganization is effective.
The Fidelity Independence Fund's shareholders approved the reorganization which is expected to become effective on or about May 14, 2021. The reorganization is expected to qualify as a tax-free transaction for federal income tax purposes with no gain or loss recognized by the funds or their shareholders.
Report of Independent Registered Public Accounting Firm
To the Board of Trustees of Fidelity Magellan Fund and Shareholders of Fidelity Magellan Fund
Opinion on the Financial Statements
We have audited the accompanying statement of assets and liabilities, including the schedule of investments, of Fidelity Magellan Fund (one of the funds constituting Fidelity Magellan Fund, referred to hereafter as the “Fund”) as of March 31, 2021, the related statement of operations for the year ended March 31, 2021, the statement of changes in net assets for each of the two years in the period ended March 31, 2021, including the related notes, and the financial highlights for each of the five years in the period ended March 31, 2021 (collectively referred to as the “financial statements”). In our opinion, the financial statements present fairly, in all material respects, the financial position of the Fund as of March 31, 2021, the results of its operations for the year then ended, the changes in its net assets for each of the two years in the period ended March 31, 2021 and the financial highlights for each of the five years in the period ended March 31, 2021 in conformity with accounting principles generally accepted in the United States of America.
Basis for Opinion
These financial statements are the responsibility of the Fund’s management. Our responsibility is to express an opinion on the Fund’s financial statements based on our audits. We are a public accounting firm registered with the Public Company Accounting Oversight Board (United States) (PCAOB) and are required to be independent with respect to the Fund in accordance with the U.S. federal securities laws and the applicable rules and regulations of the Securities and Exchange Commission and the PCAOB.
We conducted our audits of these financial statements in accordance with the standards of the PCAOB. Those standards require that we plan and perform the audit to obtain reasonable assurance about whether the financial statements are free of material misstatement, whether due to error or fraud.
Our audits included performing procedures to assess the risks of material misstatement of the financial statements, whether due to error or fraud, and performing procedures that respond to those risks. Such procedures included examining, on a test basis, evidence regarding the amounts and disclosures in the financial statements. Our audits also included evaluating the accounting principles used and significant estimates made by management, as well as evaluating the overall presentation of the financial statements. Our procedures included confirmation of securities owned as of March 31, 2021 by correspondence with the custodian, issuers of privately offered securities and brokers. We believe that our audits provide a reasonable basis for our opinion.
/s/ PricewaterhouseCoopers LLP
Boston, Massachusetts
May 14, 2021
We have served as the auditor of one or more investment companies in the Fidelity group of funds since 1932.
Trustees and Officers
The Trustees, Members of the Advisory Board (if any), and officers of the trust and fund, as applicable, are listed below. The Board of Trustees governs the fund and is responsible for protecting the interests of shareholders. The Trustees are experienced executives who meet periodically throughout the year to oversee the fund's activities, review contractual arrangements with companies that provide services to the fund, oversee management of the risks associated with such activities and contractual arrangements, and review the fund's performance. Each of the Trustees oversees 309 funds.
The Trustees hold office without limit in time except that (a) any Trustee may resign; (b) any Trustee may be removed by written instrument, signed by at least two-thirds of the number of Trustees prior to such removal; (c) any Trustee who requests to be retired or who has become incapacitated by illness or injury may be retired by written instrument signed by a majority of the other Trustees; and (d) any Trustee may be removed at any special meeting of shareholders by a two-thirds vote of the outstanding voting securities of the trust. Each Trustee who is not an interested person (as defined in the 1940 Act) of the trust and the fund is referred to herein as an Independent Trustee. Each Independent Trustee shall retire not later than the last day of the calendar year in which his or her 75th birthday occurs. The Independent Trustees may waive this mandatory retirement age policy with respect to individual Trustees. Officers and Advisory Board Members hold office without limit in time, except that any officer or Advisory Board Member may resign or may be removed by a vote of a majority of the Trustees at any regular meeting or any special meeting of the Trustees. Except as indicated, each individual has held the office shown or other offices in the same company for the past five years.
The fund's Statement of Additional Information (SAI) includes more information about the Trustees. To request a free copy, call Fidelity at 1-800-544-8544 if you’re an individual investing directly with Fidelity, call 1-800-835-5092 if you’re a plan sponsor or participant with Fidelity as your recordkeeper or call 1-877-208-0098 on institutional accounts or if you’re an advisor or invest through one.
Experience, Skills, Attributes, and Qualifications of the Trustees. The Governance and Nominating Committee has adopted a statement of policy that describes the experience, qualifications, attributes, and skills that are necessary and desirable for potential Independent Trustee candidates (Statement of Policy). The Board believes that each Trustee satisfied at the time he or she was initially elected or appointed a Trustee, and continues to satisfy, the standards contemplated by the Statement of Policy. The Governance and Nominating Committee also engages professional search firms to help identify potential Independent Trustee candidates who have the experience, qualifications, attributes, and skills consistent with the Statement of Policy. From time to time, additional criteria based on the composition and skills of the current Independent Trustees, as well as experience or skills that may be appropriate in light of future changes to board composition, business conditions, and regulatory or other developments, have also been considered by the professional search firms and the Governance and Nominating Committee. In addition, the Board takes into account the Trustees' commitment and participation in Board and committee meetings, as well as their leadership of standing and ad hoc committees throughout their tenure.
In determining that a particular Trustee was and continues to be qualified to serve as a Trustee, the Board has considered a variety of criteria, none of which, in isolation, was controlling. The Board believes that, collectively, the Trustees have balanced and diverse experience, qualifications, attributes, and skills, which allow the Board to operate effectively in governing the fund and protecting the interests of shareholders. Information about the specific experience, skills, attributes, and qualifications of each Trustee, which in each case led to the Board's conclusion that the Trustee should serve (or continue to serve) as a trustee of the fund, is provided below.
Board Structure and Oversight Function. Robert A. Lawrence is an interested person and currently serves as Acting Chairman. The Trustees have determined that an interested Chairman is appropriate and benefits shareholders because an interested Chairman has a personal and professional stake in the quality and continuity of services provided to the fund. Independent Trustees exercise their informed business judgment to appoint an individual of their choosing to serve as Chairman, regardless of whether the Trustee happens to be independent or a member of management. The Independent Trustees have determined that they can act independently and effectively without having an Independent Trustee serve as Chairman and that a key structural component for assuring that they are in a position to do so is for the Independent Trustees to constitute a substantial majority for the Board. The Independent Trustees also regularly meet in executive session. David M. Thomas serves as Lead Independent Trustee and as such (i) acts as a liaison between the Independent Trustees and management with respect to matters important to the Independent Trustees and (ii) with management prepares agendas for Board meetings.
Fidelity® funds are overseen by different Boards of Trustees. The fund's Board oversees Fidelity's high income and certain equity funds, and other Boards oversee Fidelity's investment-grade bond, money market, asset allocation, and other equity funds. The asset allocation funds may invest in Fidelity® funds overseen by the fund's Board. The use of separate Boards, each with its own committee structure, allows the Trustees of each group of Fidelity® funds to focus on the unique issues of the funds they oversee, including common research, investment, and operational issues. On occasion, the separate Boards establish joint committees to address issues of overlapping consequences for the Fidelity® funds overseen by each Board.
The Trustees operate using a system of committees to facilitate the timely and efficient consideration of all matters of importance to the Trustees, the fund, and fund shareholders and to facilitate compliance with legal and regulatory requirements and oversight of the fund's activities and associated risks. The Board, acting through its committees, has charged FMR and its affiliates with (i) identifying events or circumstances the occurrence of which could have demonstrably adverse effects on the fund's business and/or reputation; (ii) implementing processes and controls to lessen the possibility that such events or circumstances occur or to mitigate the effects of such events or circumstances if they do occur; and (iii) creating and maintaining a system designed to evaluate continuously business and market conditions in order to facilitate the identification and implementation processes described in (i) and (ii) above. Because the day-to-day operations and activities of the fund are carried out by or through FMR, its affiliates, and other service providers, the fund's exposure to risks is mitigated but not eliminated by the processes overseen by the Trustees. While each of the Board's committees has responsibility for overseeing different aspects of the fund's activities, oversight is exercised primarily through the Operations, Audit, and Compliance Committees. Appropriate personnel, including but not limited to the fund's Chief Compliance Officer (CCO), FMR's internal auditor, the independent accountants, the fund's Treasurer and portfolio management personnel, make periodic reports to the Board's committees, as appropriate, including an annual review of Fidelity's risk management program for the Fidelity® funds. The responsibilities of each standing committee, including their oversight responsibilities, are described further under "Standing Committees of the Trustees."
Interested Trustees*:
Correspondence intended for a Trustee who is an interested person may be sent to Fidelity Investments, 245 Summer Street, Boston, Massachusetts 02210.
Name, Year of Birth; Principal Occupations and Other Relevant Experience+
Bettina Doulton (1964)
Year of Election or Appointment: 2020
Trustee
Ms. Doulton also serves as Trustee of other Fidelity® funds. Prior to her retirement, Ms. Doulton served in a variety of positions at Fidelity Investments, including as a managing director of research (2006-2007), portfolio manager to certain Fidelity® funds (1993-2005), equity analyst and portfolio assistant (1990-1993), and research assistant (1987-1990). Ms. Doulton currently owns and operates Phi Builders + Architects and Cellardoor Winery. Previously, Ms. Doulton served as a member of the Board of Brown Capital Management, LLC (2014-2018).
Robert A. Lawrence (1952)
Year of Election or Appointment: 2020
Trustee
Acting Chairman of the Board of Trustees
Mr. Lawrence also serves as Trustee of other funds. Previously, Mr. Lawrence served as a Member of the Advisory Board of certain funds. Prior to his retirement in 2008, Mr. Lawrence served as Vice President of certain Fidelity® funds (2006-2008), Senior Vice President, Head of High Income Division of Fidelity Management & Research Company (investment adviser firm, 2006-2008), and President of Fidelity Strategic Investments (investment adviser firm, 2002-2005).
* Determined to be an “Interested Trustee” by virtue of, among other things, his or her affiliation with the trust or various entities under common control with FMR.
+ The information includes the Trustee's principal occupation during the last five years and other information relating to the experience, attributes, and skills relevant to the Trustee's qualifications to serve as a Trustee, which led to the conclusion that the Trustee should serve as a Trustee for the fund.
Independent Trustees:
Correspondence intended for an Independent Trustee may be sent to Fidelity Investments, P.O. Box 55235, Boston, Massachusetts 02205-5235.
Name, Year of Birth; Principal Occupations and Other Relevant Experience+
Dennis J. Dirks (1948)
Year of Election or Appointment: 2005
Trustee
Mr. Dirks also serves as Trustee of other Fidelity® funds. Prior to his retirement in May 2003, Mr. Dirks served as Chief Operating Officer and as a member of the Board of The Depository Trust & Clearing Corporation (financial markets infrastructure), President, Chief Operating Officer and a member of the Board of The Depository Trust Company (DTC), President and a member of the Board of the National Securities Clearing Corporation (NSCC), Chief Executive Officer and a member of the Board of the Government Securities Clearing Corporation and Chief Executive Officer and a member of the Board of the Mortgage-Backed Securities Clearing Corporation. Mr. Dirks currently serves as a member of the Finance Committee (2016-present) and Board (2017-present) and is Treasurer (2018-present) of the Asolo Repertory Theatre.
Donald F. Donahue (1950)
Year of Election or Appointment: 2018
Trustee
Mr. Donahue also serves as Trustee of other Fidelity® funds. Mr. Donahue serves as President and Chief Executive Officer of Miranda Partners, LLC (risk consulting for the financial services industry, 2012-present). Previously, Mr. Donahue served as Chief Executive Officer (2006-2012), Chief Operating Officer (2003-2006) and Managing Director, Customer Marketing and Development (1999-2003) of The Depository Trust & Clearing Corporation (financial markets infrastructure). Mr. Donahue currently serves as a member (2007-present) and Co-Chairman (2016-present) of the Board of United Way of New York and a member of the Board of NYC Leadership Academy (2012-present). Mr. Donahue previously served as a member of the Advisory Board of certain Fidelity® funds (2015-2018).
Vicki L. Fuller (1957)
Year of Election or Appointment: 2020
Trustee
Ms. Fuller also serves as Trustee of other Fidelity® funds. Previously, Ms. Fuller served as a member of the Advisory Board of certain Fidelity® funds (2018-2020), Chief Investment Officer of the New York State Common Retirement Fund (2012-2018) and held a variety of positions at AllianceBernstein L.P. (global asset management, 1985-2012), including Managing Director (2006-2012) and Senior Vice President and Senior Portfolio Manager (2001-2006). Ms. Fuller currently serves as a member of the Board, Audit Committee and Nominating and Governance Committee of The Williams Companies, Inc. (natural gas infrastructure, 2018-present), as a member of the Board, Audit Committee and Nominating and Governance Committee of two Blackstone business development companies (2020-present) and as a member of the Board of Treliant, LLC (consulting, 2019-present).
Patricia L. Kampling (1959)
Year of Election or Appointment: 2020
Trustee
Ms. Kampling also serves as Trustee of other Fidelity® funds. Prior to her retirement, Ms. Kampling served as Chairman of the Board and Chief Executive Officer (2012-2019), President and Chief Operating Officer (2011-2012) and Executive Vice President and Chief Financial Officer (2010-2011) of Alliant Energy Corporation. Ms. Kampling currently serves as a member of the Board, Finance Committee and Governance, Compensation and Nominating Committee of Xcel Energy Inc. (utilities company, 2020-present) and as a member of the Board, Audit, Finance and Risk Committee and Safety, Environmental, Technology and Operations Committee of American Water Works Company, Inc. (utilities company, 2019-present). In addition, Ms. Kampling currently serves as a member of the Board of the Nature Conservancy, Wisconsin Chapter (2019-present). Previously, Ms. Kampling served as a Member of the Advisory Board of certain Fidelity® funds (2020), a member of the Board, Compensation Committee and Executive Committee and Chair of the Audit Committee of Briggs & Stratton Corporation (manufacturing, 2011-2021), a member of the Board of Interstate Power and Light Company (2012-2019) and Wisconsin Power and Light Company (2012-2019) (each a subsidiary of Alliant Energy Corporation) and as a member of the Board and Workforce Development Committee of the Business Roundtable (2018-2019).
Thomas A. Kennedy (1955)
Year of Election or Appointment: 2021
Trustee
Mr. Kennedy also serves as Trustee of other Fidelity® funds. Previously, Mr. Kennedy served as a Member of the Advisory Board of certain Fidelity® funds (2020) and held a variety of positions at Raytheon Company (aerospace and defense, 1983-2020), including Chairman and Chief Executive Officer (2014-2020) and Executive Vice President and Chief Operating Officer (2013-2014). Mr. Kennedy currently serves as Executive Chairman of the Board of Directors of Raytheon Technologies Corporation (aerospace and defense, 2020-present). He is also a member of the Rutgers School of Engineering Industry Advisory Board (2011-present) and a member of the UCLA Engineering Dean’s Executive Board (2016-present).
Garnett A. Smith (1947)
Year of Election or Appointment: 2018
Trustee
Mr. Smith also serves as Trustee of other Fidelity® funds. Prior to his retirement, Mr. Smith served as Chairman and Chief Executive Officer (1990-1997) and President (1986-1990) of Inbrand Corp. (manufacturer of personal absorbent products). Prior to his employment with Inbrand Corp., he was employed by a retail fabric chain and North Carolina National Bank (now Bank of America). Mr. Smith previously served as a member of the Advisory Board of certain Fidelity® funds (2012-2013).
David M. Thomas (1949)
Year of Election or Appointment: 2008
Trustee
Lead Independent Trustee
Mr. Thomas also serves as Trustee of other Fidelity® funds. Previously, Mr. Thomas served as Executive Chairman (2005-2006) and Chairman and Chief Executive Officer (2000-2005) of IMS Health, Inc. (pharmaceutical and healthcare information solutions). Mr. Thomas currently serves as a member of the Board of Fortune Brands Home and Security (home and security products, 2004-present) and Presiding Director (2013-present) of Interpublic Group of Companies, Inc. (marketing communication).
Susan Tomasky (1953)
Year of Election or Appointment: 2020
Trustee
Ms. Tomasky also serves as Trustee of other Fidelity® funds. Prior to her retirement, Ms. Tomasky served in various executive officer positions at American Electric Power Company, Inc. (1998-2011), including most recently as President of AEP Transmission (2007-2011). Ms. Tomasky currently serves as a member of the Board and Sustainability Committee and as Chair of the Audit Committee of Marathon Petroleum Corporation (2018-present) and as a member of the Board, Corporate Governance Committee and Organization and Compensation Committee and as Chair of the Audit Committee of Public Service Enterprise Group, Inc. (utilities company, 2012-present). In addition, Ms. Tomasky currently serves as a member (2009-present) and President (2020-present) of the Board of the Royal Shakespeare Company – America (2009-present), as a member of the Board of the Columbus Association for the Performing Arts (2011-present) and as a member of the Board and Investment Committee of Kenyon College (2016-present). Previously, Ms. Tomasky served as a Member of the Advisory Board of certain Fidelity® funds (2020), as a member of the Board of the Columbus Regional Airport Authority (2007-2020), as a member of the Board (2011-2018) and Lead Independent Director (2015-2018) of Andeavor Corporation (previously Tesoro Corporation) (independent oil refiner and marketer) and as a member of the Board of Summit Midstream Partners LP (energy, 2012-2018).
Michael E. Wiley (1950)
Year of Election or Appointment: 2018
Trustee
Mr. Wiley also serves as Trustee of other Fidelity® funds. Previously, Mr. Wiley served as a member of the Advisory Board of certain Fidelity® funds (2018-2020), Chairman, President and CEO of Baker Hughes, Inc. (oilfield services, 2000-2004). Mr. Wiley also previously served as a member of the Board of Andeavor Corporation (independent oil refiner and marketer, 2005-2018), a member of the Board of Andeavor Logistics LP (natural resources logistics, 2015-2018) and a member of the Board of High Point Resources (exploration and production, 2005-2020).
+ The information includes the Trustee's principal occupation during the last five years and other information relating to the experience, attributes, and skills relevant to the Trustee's qualifications to serve as a Trustee, which led to the conclusion that the Trustee should serve as a Trustee for the fund.
Advisory Board Members and Officers:
Correspondence intended for a Member of the Advisory Board (if any) may be sent to Fidelity Investments, P.O. Box 55235, Boston, Massachusetts 02205-5235. Correspondence intended for an officer or Peter S. Lynch may be sent to Fidelity Investments, 245 Summer Street, Boston, Massachusetts 02210. Officers appear below in alphabetical order.
Name, Year of Birth; Principal Occupation
Ned C. Lautenbach (1944)
Year of Election or Appointment: 2021
Member of the Advisory Board
Mr. Lautenbach also serves as a Member of the Advisory Board of other Fidelity® funds. Mr. Lautenbach currently serves as a member of the Council on Foreign Relations (1994-present). He is also a member and has in the past served as Chairman of the Board of Directors of Artis-Naples (2012-present). Previously, Mr. Lautenbach served as a Trustee of certain Fidelity® funds (2000-2020), as a member (2013-2019) and Chair (2018-2019) of the Board of Governors of the State University System of Florida and as a member and then Lead Director of the Board of Directors of Eaton Corporation (diversified industrial, 1997-2016). He was also a Partner at Clayton, Dubilier & Rice, LLC (private equity investment, 1998-2010); as well as Director of Sony Corporation (2006-2007). In addition, Mr. Lautenbach had a 30-year career with IBM (technology company), during which time he served as Senior Vice President and as a member of the Corporate Executive Committee (1968-1998).
Peter S. Lynch (1944)
Year of Election or Appointment: 2003
Member of the Advisory Board
Mr. Lynch also serves as a Member of the Advisory Board of other Fidelity® funds. Mr. Lynch is Vice Chairman and a Director of Fidelity Management & Research Company LLC (investment adviser firm). In addition, Mr. Lynch serves as a Trustee of Boston College and as the Chairman of the Inner-City Scholarship Fund. Previously, Mr. Lynch served as Vice Chairman and a Director of FMR Co., Inc. (investment adviser firm) and on the Special Olympics International Board of Directors (1997-2006).
Craig S. Brown (1977)
Year of Election or Appointment: 2019
Assistant Treasurer
Mr. Brown also serves as Assistant Treasurer of other funds. Mr. Brown is an employee of Fidelity Investments (2013-present).
John J. Burke III (1964)
Year of Election or Appointment: 2018
Chief Financial Officer
Mr. Burke also serves as Chief Financial Officer of other funds. Mr. Burke serves as Head of Investment Operations for Fidelity Fund and Investment Operations (2018-present) and is an employee of Fidelity Investments (1998-present). Previously Mr. Burke served as head of Asset Management Investment Operations (2012-2018).
William C. Coffey (1969)
Year of Election or Appointment: 2019
Assistant Secretary
Mr. Coffey also serves as Assistant Secretary of other funds. He is Senior Vice President and Deputy General Counsel of FMR LLC (diversified financial services company, 2010-present), and is an employee of Fidelity Investments. Previously, Mr. Coffey served as Secretary and CLO of certain funds (2018-2019); CLO, Secretary, and Senior Vice President of Fidelity Management & Research Company and FMR Co., Inc. (investment adviser firms, 2018-2019); Secretary of Fidelity SelectCo, LLC and Fidelity Investments Money Management, Inc. (investment adviser firms, 2018-2019); CLO of Fidelity Management & Research (Hong Kong) Limited, FMR Investment Management (UK) Limited, and Fidelity Management & Research (Japan) Limited (investment adviser firms, 2018-2019); and Assistant Secretary of certain funds (2009-2018).
Timothy M. Cohen (1969)
Year of Election or Appointment: 2018
Vice President
Mr. Cohen also serves as Vice President of other funds. Mr. Cohen serves as Co-Head of Equity (2018-present), a Director of Fidelity Management & Research (Japan) Limited (investment adviser firm, 2016-present), and is an employee of Fidelity Investments. Previously, Mr. Cohen served as Executive Vice President of Fidelity SelectCo, LLC (2019), Head of Global Equity Research (2016-2018), Chief Investment Officer - Equity and a Director of Fidelity Management & Research (U.K.) Inc. (investment adviser firm, 2013-2015) and as a Director of Fidelity Management & Research (Hong Kong) Limited (investment adviser firm, 2017).
Jonathan Davis (1968)
Year of Election or Appointment: 2010
Assistant Treasurer
Mr. Davis also serves as Assistant Treasurer of other funds. Mr. Davis serves as Assistant Treasurer of FMR Capital, Inc. (2017-present) and is an employee of Fidelity Investments. Previously, Mr. Davis served as Vice President and Associate General Counsel of FMR LLC (diversified financial services company, 2003-2010).
Laura M. Del Prato (1964)
Year of Election or Appointment: 2018
Assistant Treasurer
Ms. Del Prato also serves as an officer of other funds. Ms. Del Prato is an employee of Fidelity Investments (2017-present). Previously, Ms. Del Prato served as President and Treasurer of The North Carolina Capital Management Trust: Cash Portfolio and Term Portfolio (2018-2020). Prior to joining Fidelity Investments, Ms. Del Prato served as a Managing Director and Treasurer of the JPMorgan Mutual Funds (2014-2017). Prior to JPMorgan, Ms. Del Prato served as a partner at Cohen Fund Audit Services (accounting firm, 2012-2013) and KPMG LLP (accounting firm, 2004-2012).
Colm A. Hogan (1973)
Year of Election or Appointment: 2020
Assistant Treasurer
Mr. Hogan also serves as an officer of other funds. Mr. Hogan serves as Assistant Treasurer of FMR Capital, Inc. (2017-present) and is an employee of Fidelity Investments (2005-present). Previously, Mr. Hogan served as Deputy Treasurer of certain Fidelity® funds (2016-2020) and Assistant Treasurer of certain Fidelity® funds (2016-2018).
Pamela R. Holding (1964)
Year of Election or Appointment: 2018
Vice President
Ms. Holding also serves as Vice President of other funds. Ms. Holding serves as Co-Head of Equity (2018-present) and is an employee of Fidelity Investments (2013-present). Previously, Ms. Holding served as Executive Vice President of Fidelity SelectCo, LLC (2019) and as Chief Investment Officer of Fidelity Institutional Asset Management (2013-2018).
Cynthia Lo Bessette (1969)
Year of Election or Appointment: 2019
Secretary and Chief Legal Officer (CLO)
Ms. Lo Bessette also serves as an officer of other funds. Ms. Lo Bessette serves as CLO, Secretary, and Senior Vice President of Fidelity Management & Research Company LLC (investment adviser firm, 2019-present); and CLO of Fidelity Management & Research (Hong Kong) Limited, FMR Investment Management (UK) Limited, and Fidelity Management & Research (Japan) Limited (investment adviser firms, 2019-present). She is a Senior Vice President and Deputy General Counsel of FMR LLC (diversified financial services company, 2019-present), and is an employee of Fidelity Investments. Previously, Ms. Lo Bessette served as CLO, Secretary, and Senior Vice President of FMR Co., Inc. (investment adviser firm, 2019); Secretary of Fidelity SelectCo, LLC and Fidelity Investments Money Management, Inc. (investment adviser firms, 2019). Prior to joining Fidelity Investments, Ms. Lo Bessette was Executive Vice President, General Counsel (2016-2019) and Senior Vice President, Deputy General Counsel (2015-2016) of OppenheimerFunds (investment management company) and Deputy Chief Legal Officer (2013-2015) of Jennison Associates LLC (investment adviser firm).
Chris Maher (1972)
Year of Election or Appointment: 2020
Deputy Treasurer
Mr. Maher also serves as an officer of other funds. Mr. Maher serves as Assistant Treasurer of FMR Capital, Inc. (2017-present), and is an employee of Fidelity Investments (2008-present). Previously, Mr. Maher served as Assistant Treasurer of certain funds (2013-2020); Vice President of Asset Management Compliance (2013), Vice President of the Program Management Group of FMR (investment adviser firm, 2010-2013), and Vice President of Valuation Oversight (2008-2010).
Jason P. Pogorelec (1975)
Year of Election or Appointment: 2020
Chief Compliance Officer
Mr. Pogorelec also serves as Chief Compliance Officer of other funds. Mr. Pogorelec is a senior Vice President of Asset Management Compliance for Fidelity Investments and is an employee of Fidelity Investments (2006-present). Previously, Mr. Pogorelec served as Vice President, Associate General Counsel for Fidelity Investments (2010-2020) and Assistant Secretary of certain Fidelity funds (2015-2020).
Brett Segaloff (1972)
Year of Election or Appointment: 2021
Anti-Money Laundering (AML) Officer
Mr. Segaloff also serves as an AML Officer of other funds and other related entities. He is Director, Anti-Money Laundering (2007-present) of FMR LLC (diversified financial services company) and is an employee of Fidelity Investments (1996-present).
Stacie M. Smith (1974)
Year of Election or Appointment: 2016
President and Treasurer
Ms. Smith also serves as an officer of other funds. Ms. Smith serves as Assistant Treasurer of FMR Capital, Inc. (2017-present), is an employee of Fidelity Investments (2009-present), and has served in other fund officer roles. Prior to joining Fidelity Investments, Ms. Smith served as Senior Audit Manager of Ernst & Young LLP (accounting firm, 1996-2009). Previously, Ms. Smith served as Assistant Treasurer (2013-2019) and Deputy Treasurer (2013-2016) of certain Fidelity® funds.
Marc L. Spector (1972)
Year of Election or Appointment: 2016
Assistant Treasurer
Mr. Spector also serves as an officer of other funds. Mr. Spector serves as Assistant Treasurer of FMR Capital, Inc. (2017-present) and is an employee of Fidelity Investments (2016-present). Prior to joining Fidelity Investments, Mr. Spector served as Director at the Siegfried Group (accounting firm, 2013-2016), and prior to Siegfried Group as audit senior manager at Deloitte & Touche LLP (accounting firm, 2005-2013).
Jim Wegmann (1979)
Year of Election or Appointment: 2019
Assistant Treasurer
Mr. Wegmann also serves as Assistant Treasurer of other funds. Mr. Wegmann is an employee of Fidelity Investments (2011-present).
Shareholder Expense Example
As a shareholder, you incur two types of costs: (1) transaction costs, which may include sales charges (loads) on purchase payments or redemption proceeds, as applicable and (2) ongoing costs, which generally include management fees, distribution and/or service (12b-1) fees and other Fund expenses. This Example is intended to help you understand your ongoing costs (in dollars) of investing in a fund and to compare these costs with the ongoing costs of investing in other mutual funds.
The Example is based on an investment of $1,000 invested at the beginning of the period and held for the entire period (October 1, 2020 to March 31, 2021).
Actual Expenses
The first line of the accompanying table provides information about actual account values and actual expenses. You may use the information in this line, together with the amount you invested, to estimate the expenses that you paid over the period. Simply divide your account value by $1,000.00 (for example, an $8,600 account value divided by $1,000.00 = 8.6), then multiply the result by the number in the first line for a class/Fund under the heading entitled "Expenses Paid During Period" to estimate the expenses you paid on your account during this period. If any fund is a shareholder of any underlying mutual funds or exchange-traded funds (ETFs) (the Underlying Funds), such fund indirectly bears its proportional share of the expenses of the Underlying Funds in addition to the direct expenses incurred presented in the table. These fees and expenses are not included in the annualized expense ratio used to calculate the expense estimate in the table below.
Hypothetical Example for Comparison Purposes
The second line of the accompanying table provides information about hypothetical account values and hypothetical expenses based on the actual expense ratio and an assumed rate of return of 5% per year before expenses, which is not the actual return. The hypothetical account values and expenses may not be used to estimate the actual ending account balance or expenses you paid for the period. You may use this information to compare the ongoing costs of investing in the Fund and other funds. To do so, compare this 5% hypothetical example with the 5% hypothetical examples that appear in the shareholder reports of the other funds. If any fund is a shareholder of any Underlying Funds, such fund indirectly bears its proportional share of the expenses of the Underlying Funds in addition to the direct expenses as presented in the table. These fees and expenses are not included in the annualized expense ratio used to calculate the expense estimate in the table below.
Please note that the expenses shown in the table are meant to highlight your ongoing costs only and do not reflect any transaction costs. Therefore, the second line of the table is useful in comparing ongoing costs only, and will not help you determine the relative total costs of owning different funds.
| | Annualized Expense Ratio-A | Beginning
Account Value
October 1, 2020 | Ending
Account Value
March 31, 2021 | Expenses Paid
During Period-B
October 1, 2020
to March 31, 2021 |
| Fidelity Magellan Fund | | | | |
| Magellan | .74% | | | |
| Actual | | $1,000.00 | $1,083.20 | $3.84 |
| Hypothetical-C | | $1,000.00 | $1,021.24 | $3.73 |
| Class K | .66% | | | |
| Actual | | $1,000.00 | $1,082.50 | $3.43 |
| Hypothetical-C | | $1,000.00 | $1,021.64 | $3.33 |
A Annualized expense ratio reflects expenses net of applicable fee waivers.
B Expenses are equal to the annualized expense ratio, multiplied by the average account value over the period, multiplied by 182/ 365 (to reflect the one-half year period). The fees and expenses of any Underlying Funds are not included in each annualized expense ratio.
C 5% return per year before expenses
Distributions (Unaudited)
The Board of Trustees of Fidelity Magellan Fund voted to pay to shareholders of record at the opening of business on record date, the following distributions per share derived from capital gains realized from sales of portfolio securities:
| | Pay Date | Record Date | Capital Gains |
| Fidelity Magellan Fund | | | |
| Magellan | 05/10/21 | 05/07/21 | $0.634 |
| Class K | 05/10/21 | 05/07/21 | $0.634 |
|
The fund hereby designates as a capital gain dividend with respect to the taxable year ended March 31, 2021, $1,152,818,395, or, if subsequently determined to be different, the net capital gain of such year.
The fund will notify shareholders in January 2022 of amounts for use in preparing 2021 income tax returns.
Board Approval of Investment Advisory Contracts
Fidelity Magellan Fund
At its January 2021 meeting, the Board of Trustees, including the Independent Trustees (together, the Board), voted to continue the management contract with Fidelity Management & Research Company LLC (FMR), and the sub-advisory agreements and sub-subadvisory agreements, in each case, where applicable (together, the Advisory Contracts) for the fund for four months from February 1, 2021 through May 31, 2021, in connection with changes to the Board's meeting calendar.
The Board considered that the approval of the fund's Advisory Contracts will not result in any changes in (i) the investment process or strategies employed in the management of the fund's assets; (ii) the fees and expenses paid by shareholders; (iii) the nature, extent or quality of services provided under the fund's Advisory Contracts; or (iv) the day-to-day management of the fund or the persons primarily responsible for such management. The Board also considered that since its last approval of the fund's Advisory Contracts, FMR had provided additional information on the fund in support of the annual contract renewal process, including competitive analyses on total expenses and management fees and in-depth reviews of fund performance and fund profitability information. The Board also considered the findings of certain ad hoc committees that had been previously formed to discuss matters relevant to all of the Fidelity funds, including economies of scale, fall-out benefits and retail vs. institutional funds. The Board concluded that the fund's Advisory Contracts are fair and reasonable, and that the fund's Advisory Contracts should be renewed, without modification, through May 31, 2021, with the understanding that the Board will consider the annual renewal for a full one year period in May 2021.
In connection with its consideration of future renewals of the fund's Advisory Contracts, the Board will consider: (i) the nature, extent and quality of services provided to the funds, including shareholder and administrative services and investment performance; (ii) the competitiveness of the management fee and total expenses for the fund; (iii) the costs of the services and profitability, including the revenues earned and the expenses incurred in conducting the business of developing, marketing, distributing, managing, administering, and servicing the fund and its shareholders, to the extent applicable; and (iv) whether there have been economies of scale in respect of the Fidelity funds, whether the Fidelity funds (including the fund) have appropriately benefited from any such economies of scale, and whether there is the potential for realization of any further economies.
Based on its evaluation of all of the conclusions noted above, and after considering all factors it believed relevant, the Board ultimately concluded that the fund's management fee structure is fair and reasonable, and that the continuation of the fund's Advisory Contracts should be approved for four months from February 1, 2021 through May 31, 2021.
Liquidity Risk Management Program
The Securities and Exchange Commission adopted Rule 22e-4 under the Investment Company Act of 1940 (the Liquidity Rule) to promote effective liquidity risk management throughout the open-end investment company industry, thereby reducing the risk that funds will be unable to meet their redemption obligations and mitigating dilution of the interests of fund shareholders.
The Fund has adopted and implemented a liquidity risk management program pursuant to the Liquidity Rule (the Program) effective December 1, 2018. The Program is reasonably designed to assess and manage the Fund’s liquidity risk and to comply with the requirements of the Liquidity Rule. The Fund’s Board of Trustees (the Board) has designated the Fund’s investment adviser as administrator of the Program. The Fidelity advisers have established a Liquidity Risk Management Committee (the LRM Committee) to manage the Program for each of the Fidelity Funds. The LRM Committee monitors the adequacy and effectiveness of implementation of the Program and on a periodic basis assesses each Fund’s liquidity risk based on a variety of factors including (1) the Fund’s investment strategy, (2) portfolio liquidity and cash flow projections during normal and reasonably foreseeable stressed conditions, (3) shareholder redemptions, (4) borrowings and other funding sources and (5) in the case of exchange-traded funds, certain additional factors including the effect of the Fund’s prices and spreads, market participants, and basket compositions on the overall liquidity of the Fund’s portfolio, as applicable.
In accordance with the Program, each of the Fund’s portfolio investments is classified into one of four liquidity categories described below based on a determination of a reasonable expectation for how long it would take to convert the investment to cash (or sell or dispose of the investment) without significantly changing its market value.
- Highly liquid investments – cash or convertible to cash within three business days or less
- Moderately liquid investments – convertible to cash in three to seven calendar days
- Less liquid investments – can be sold or disposed of, but not settled, within seven calendar days
- Illiquid investments – cannot be sold or disposed of within seven calendar days
Liquidity classification determinations take into account a variety of factors including various market, trading and investment-specific considerations, as well as market depth, and generally utilize analysis from a third-party liquidity metrics service.
The Liquidity Rule places a 15% limit on a fund’s illiquid investments and requires funds that do not primarily hold assets that are highly liquid investments to determine and maintain a minimum percentage of the fund’s net assets to be invested in highly liquid investments (highly liquid investment minimum or HLIM). The Program includes provisions reasonably designed to comply with the 15% limit on illiquid investments and for determining, periodically reviewing and complying with the HLIM requirement as applicable.
At a recent meeting of the Fund’s Board of Trustees, the LRM Committee provided a written report to the Board pertaining to the operation, adequacy, and effectiveness of implementation of the Program for the annual period from December 1, 2019 through November 30, 2020. The report concluded that the Program has been implemented and is operating effectively and is reasonably designed to assess and manage the Fund’s liquidity risk.
Proxy Voting Results
A special meeting of shareholders was held on June 9, 2020. The results of votes taken among shareholders on the proposals before them are reported below. Each vote reported represents one dollar of net asset value held on the record date for the meeting.
PROPOSAL 1
To elect a Board of Trustees.
| | # of
Votes | % of
Votes |
| Dennis J. Dirks |
| Affirmative | 10,061,430,446.439 | 92.048 |
| Withheld | 869,148,916.701 | 7.952 |
| TOTAL | 10,930,579,363.140 | 100.000 |
| Donald F. Donahue |
| Affirmative | 10,083,461,374.401 | 92.250 |
| Withheld | 847,117,988.739 | 7.750 |
| TOTAL | 10,930,579,363.140 | 100.000 |
| Bettina Doulton |
| Affirmative | 10,118,193,283.037 | 92.568 |
| Withheld | 812,386,080.103 | 7.432 |
| TOTAL | 10,930,579,363.140 | 100.000 |
| Vicki L. Fuller |
| Affirmative | 10,176,147,138.465 | 93.098 |
| Withheld | 754,432,224.675 | 6.902 |
| TOTAL | 10,930,579,363.140 | 100.00 |
| Patricia L. Kampling |
| Affirmative | 10,064,771,576.919 | 92.079 |
| Withheld | 865,807,786.221 | 7.921 |
| TOTAL | 10,930,579,363.140 | 100.000 |
| Alan J. Lacy |
| Affirmative | 9,940,858,884.420 | 90.945 |
| Withheld | 989,720,478.720 | 9.055 |
| TOTAL | 10,930,579,363.140 | 100.000 |
| Ned C. Lautenbach |
| Affirmative | 9,912,987,477.934 | 90.690 |
| Withheld | 1,017,591,885.206 | 9.310 |
| TOTAL | 10,930,579,363.140 | 100.000 |
| Robert A. Lawrence |
| Affirmative | 10,045,804,273.831 | 91.906 |
| Withheld | 884,775,089.309 | 8.094 |
| TOTAL | 10,930,579,363.140 | 100.000 |
| Joseph Mauriello |
| Affirmative | 9,973,528,703.577 | 91.244 |
| Withheld | 957,050,659.563 | 8.756 |
| TOTAL | 10,930,579,363.140 | 100.000 |
| Cornelia M. Small |
| Affirmative | 10,022,576,250.072 | 91.693 |
| Withheld | 908,003,113.068 | 8.307 |
| TOTAL | 10,930,579,363.140 | 100.000 |
| Garnett A. Smith |
| Affirmative | 9,995,148,303.253 | 91.442 |
| Withheld | 935,431,059.887 | 8.558 |
| TOTAL | 10,930,579,363.140 | 100.000 |
| David M. Thomas |
| Affirmative | 9,998,808,602.280 | 91.476 |
| Withheld | 931,770,760.860 | 8.524 |
| TOTAL | 10,930,579,363.140 | 100.000 |
| Susan Tomasky |
| Affirmative | 10,103,706,791.914 | 92.435 |
| Withheld | 826,872,571.226 | 7.565 |
| TOTAL | 10,930,579,363.140 | 100.000 |
| Michael E. Wiley |
| Affirmative | 10,003,968,980.833 | 91.523 |
| Withheld | 926,610,382.307 | 8.477 |
| TOTAL | 10,930,579,363.140 | 100.000 |
PROPOSAL 2
To convert a fundamental investment policy to a non-fundamental investment policy.
| | # of
Votes | % of
Votes |
| Affirmative | 7,353,842,347.652 | 68.015 |
| Against | 1,901,753,086.569 | 17.589 |
| Abstain | 1,234,922,343.242 | 11.422 |
| Broker Non-Vote | 321,533,334.710 | 2.974 |
| TOTAL | 10,812,051,112.173 | 100.000 |
|
| Proposal 1 reflects trust wide proposal and voting results. |

MAG-ANN-0521
1.702307.123
Fidelity® Magellan® K6 Fund
Annual Report
March 31, 2021
Contents
To view a fund's proxy voting guidelines and proxy voting record for the 12-month period ended June 30, visit http://www.fidelity.com/proxyvotingresults or visit the Securities and Exchange Commission's (SEC) web site at http://www.sec.gov.
You may also call 1-800-835-5092 to request a free copy of the proxy voting guidelines.
Standard & Poor's, S&P and S&P 500 are registered service marks of The McGraw-Hill Companies, Inc. and have been licensed for use by Fidelity Distributors Corporation.
Other third-party marks appearing herein are the property of their respective owners.
All other marks appearing herein are registered or unregistered trademarks or service marks of FMR LLC or an affiliated company. © 2021 FMR LLC. All rights reserved.
This report and the financial statements contained herein are submitted for the general information of the shareholders of the Fund. This report is not authorized for distribution to prospective investors in the Fund unless preceded or accompanied by an effective prospectus.
A fund files its complete schedule of portfolio holdings with the SEC for the first and third quarters of each fiscal year on Form N-PORT. Forms N-PORT are available on the SEC’s web site at http://www.sec.gov. A fund's Forms N-PORT may be reviewed and copied at the SEC’s Public Reference Room in Washington, DC. Information regarding the operation of the SEC's Public Reference Room may be obtained by calling 1-800-SEC-0330.
For a complete list of a fund's portfolio holdings, view the most recent holdings listing, semiannual report, or annual report on Fidelity's web site at http://www.fidelity.com, http://www.institutional.fidelity.com, or http://www.401k.com, as applicable.
NOT FDIC INSURED •MAY LOSE VALUE •NO BANK GUARANTEE
Neither the Fund nor Fidelity Distributors Corporation is a bank.
Note to Shareholders:
Early in 2020, the outbreak and spread of a new coronavirus emerged as a public health emergency that had a major influence on financial markets, primarily based on its impact on the global economy and the outlook for corporate earnings. The virus causes a respiratory disease known as COVID-19. On March 11, 2020 the World Health Organization declared the COVID-19 outbreak a pandemic, citing sustained risk of further global spread.
In the weeks following, as the crisis worsened, we witnessed an escalating human tragedy with wide-scale social and economic consequences from coronavirus-containment measures. The outbreak of COVID-19 prompted a number of measures to limit the spread, including travel and border restrictions, quarantines, and restrictions on large gatherings. In turn, these resulted in lower consumer activity, diminished demand for a wide range of products and services, disruption in manufacturing and supply chains, and – given the wide variability in outcomes regarding the outbreak – significant market uncertainty and volatility. Amid the turmoil, global governments and central banks took unprecedented action to help support consumers, businesses, and the broader economies, and to limit disruption to financial systems.
The situation continues to unfold, and the extent and duration of its impact on financial markets and the economy remain highly uncertain. Extreme events such as the coronavirus crisis are “exogenous shocks” that can have significant adverse effects on mutual funds and their investments. Although multiple asset classes may be affected by market disruption, the duration and impact may not be the same for all types of assets.
Fidelity is committed to helping you stay informed amid news about COVID-19 and during increased market volatility, and we’re taking extra steps to be responsive to customer needs. We encourage you to visit our websites, where we offer ongoing updates, commentary, and analysis on the markets and our funds.
Performance: The Bottom Line
Average annual total return reflects the change in the value of an investment, assuming reinvestment of distributions from dividend income and capital gains (the profits earned upon the sale of securities that have grown in value, if any) and assuming a constant rate of performance each year. The hypothetical investment and the average annual total returns do not reflect the deduction of taxes that a shareholder would pay on fund distributions or the redemption of fund shares. During periods of reimbursement by Fidelity, a fund’s total return will be greater than it would be had the reimbursement not occurred. How a fund did yesterday is no guarantee of how it will do tomorrow.
Average Annual Total Returns
| For the periods ended March 31, 2021 | Past 1 year | Life of fundA |
| Fidelity® Magellan® K6 Fund | 50.18% | 22.66% |
A From June 13, 2019
$10,000 Over Life of Fund
Let's say hypothetically that $10,000 was invested in Fidelity® Magellan® K6 Fund on June 13, 2019, when the fund started.
The chart shows how the value of your investment would have changed, and also shows how the S&P 500® Index performed over the same period.
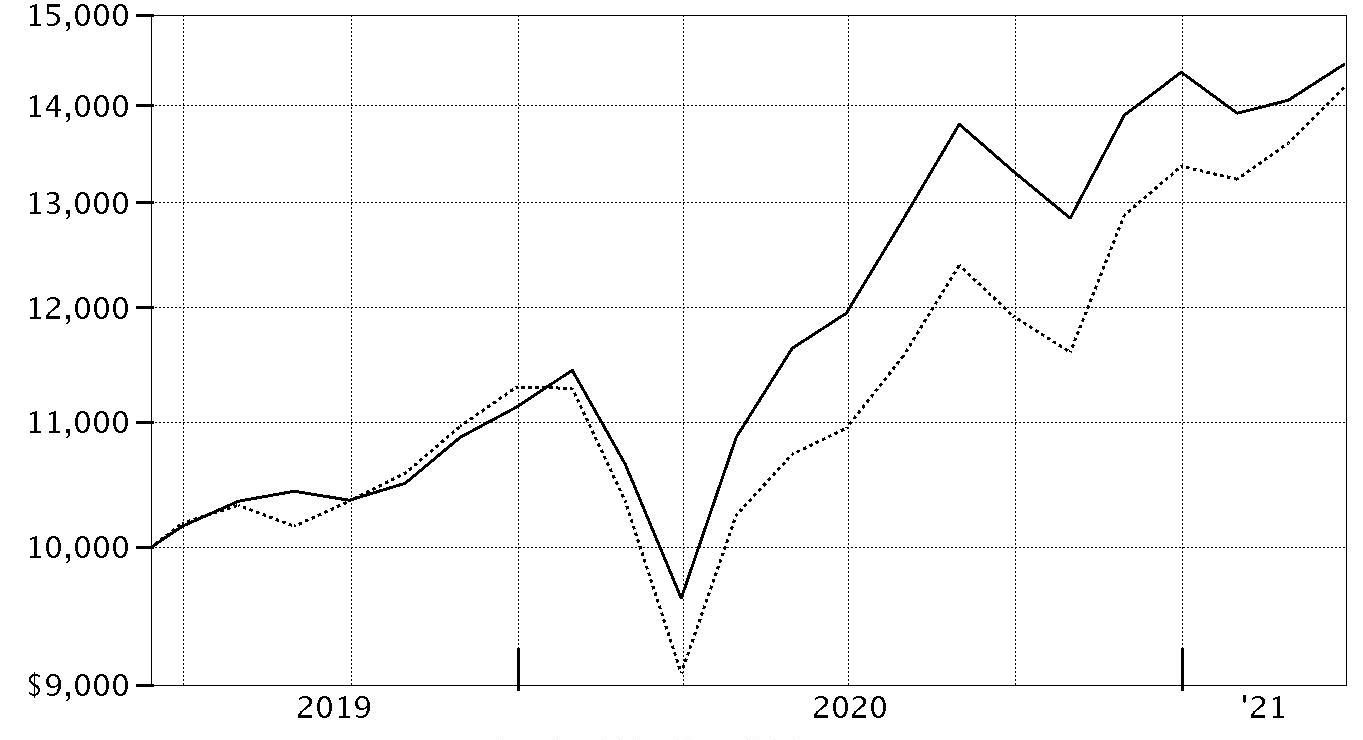
| Period Ending Values |
| $14,443 | Fidelity® Magellan® K6 Fund |
| $14,193 | S&P 500® Index |
Management's Discussion of Fund Performance
Market Recap: The S&P 500
® index gained 56.35% for the 12 months ending March 31, 2021. The early-2020 outbreak and spread of COVID-19 resulted in stocks suffering one of the quickest declines on record, followed by a historic rebound that left the index just shy of an all-time high as of March 31. The rally slowed in September, when stocks began a two-month retreat amid Congress’s inability to reach a deal on additional fiscal stimulus, as well as concerns about election uncertainty. But as the calendar turned, investors saw reason to be hopeful. The rollout of two COVID-19 vaccines was underway, the U.S. Federal Reserve pledged to hold interest rates near zero until the economy recovered, and the federal government planned to deploy trillions of dollars in aid to boost consumers and the economy. This backdrop fueled a powerful market rotation, with small-cap value stocks usurping longstanding leadership from large growth shares. As part of the so-called reopening trade, investors moved out of tech-driven mega-caps that thrived due to the work-from-home trend in favor of cheap smaller companies they believed stood to benefit from a broad cyclical recovery. Reflecting this shift, the energy sector gained 75% for the 12 months, boosted by a rally in the price of oil. Financials rose roughly 68%, riding momentum among banks (+80%), whose profitability outlook improved amid rising long-term interest rates and a steeper yield curve. Conversely, notable “laggards” included the defensive utilities (+19%) and consumer staples (+28%) sectors.
Comments from Portfolio Manager Sammy Simnegar: For the fiscal year ending March 31, 2021, the fund gained 50.18%, underperforming the 56.35% result of the benchmark S&P 500
® index. The largest detractor from performance versus the benchmark was security selection and an underweighting in industrials. Also hampering the portfolio’s relative result were stock picks and an underweighting in financials and consumer discretionary. The biggest individual relative detractor was an overweighting in SBA Communications (+3%). Another notable relative detractor was untimely positioning in Lowe’s Companies (-2%), a stake that was not held at the end of this period. Further weighing on performance versus the benchmark was an outsized holding in Crown Castle International (+8%), a position that was sold the past 12 months. Conversely, the top relative contributors included security selection and an underweighting in the lagging health care sector, especially within the pharmaceuticals, biotechnology & life sciences industry. An overweighting and stock picking in the information technology sector, primarily driven by the software & services industry, also bolstered the fund's relative performance. Also adding value were investment choices and an underweighting in the consumer staples sector, especially food, beverage & tobacco stocks. The biggest individual relative contributor was an overweight position in PayPal Holdings (+153%). Our second-largest relative contributor this period was avoiding Merck, a benchmark component that gained about 3%. Lastly, not owning Johnson & Johnson, a benchmark component that gained about 29%, further aided relative performance. Notable changes in positioning include increased exposure to the communication services sector and a lower allocation to real estate.
The views expressed above reflect those of the portfolio manager(s) only through the end of the period as stated on the cover of this report and do not necessarily represent the views of Fidelity or any other person in the Fidelity organization. Any such views are subject to change at any time based upon market or other conditions and Fidelity disclaims any responsibility to update such views. These views may not be relied on as investment advice and, because investment decisions for a Fidelity fund are based on numerous factors, may not be relied on as an indication of trading intent on behalf of any Fidelity fund.
Investment Summary (Unaudited)
Top Ten Stocks as of March 31, 2021
| | % of fund's net assets |
| Apple, Inc. | 6.6 |
| Microsoft Corp. | 6.3 |
| Amazon.com, Inc. | 4.8 |
| Facebook, Inc. Class A | 2.9 |
| Alphabet, Inc. Class A | 2.3 |
| Alphabet, Inc. Class C | 2.2 |
| The Home Depot, Inc. | 2.0 |
| Visa, Inc. Class A | 1.9 |
| UnitedHealth Group, Inc. | 1.9 |
| NVIDIA Corp. | 1.8 |
| | 32.7 |
Top Five Market Sectors as of March 31, 2021
| | % of fund's net assets |
| Information Technology | 40.2 |
| Communication Services | 15.0 |
| Consumer Discretionary | 9.9 |
| Health Care | 9.5 |
| Industrials | 8.5 |
Asset Allocation (% of fund's net assets)
| As of March 31, 2021* |
| | Stocks | 99.1% |
| | Short-Term Investments and Net Other Assets (Liabilities) | 0.9% |

* Foreign investments - 3.7%
Schedule of Investments March 31, 2021
Showing Percentage of Net Assets
| Common Stocks - 99.1% | | | |
| | | Shares | Value |
| COMMUNICATION SERVICES - 15.0% | | | |
| Entertainment - 3.3% | | | |
| Netflix, Inc. (a) | | 5,710 | $2,978,679 |
| The Walt Disney Co. (a) | | 17,720 | 3,269,694 |
| | | | 6,248,373 |
| Interactive Media & Services - 8.2% | | | |
| Alphabet, Inc.: | | | |
| Class A (a) | | 2,084 | 4,298,292 |
| Class C (a) | | 2,062 | 4,265,515 |
| Facebook, Inc. Class A (a) | | 18,319 | 5,395,495 |
| Match Group, Inc. (a) | | 11,030 | 1,515,301 |
| | | | 15,474,603 |
| Media - 3.5% | | | |
| Cable One, Inc. | | 830 | 1,517,539 |
| Charter Communications, Inc. Class A (a) | | 3,202 | 1,975,698 |
| Comcast Corp. Class A | | 55,490 | 3,002,564 |
| | | | 6,495,801 |
|
| TOTAL COMMUNICATION SERVICES | | | 28,218,777 |
|
| CONSUMER DISCRETIONARY - 9.9% | | | |
| Hotels, Restaurants & Leisure - 1.0% | | | |
| Hilton Worldwide Holdings, Inc. | | 15,300 | 1,850,076 |
| Internet & Direct Marketing Retail - 5.6% | | | |
| Amazon.com, Inc. (a) | | 2,907 | 8,994,491 |
| Chewy, Inc. (a)(b) | | 18,632 | 1,578,317 |
| | | | 10,572,808 |
| Specialty Retail - 2.0% | | | |
| The Home Depot, Inc. | | 12,138 | 3,705,125 |
| Textiles, Apparel & Luxury Goods - 1.3% | | | |
| NIKE, Inc. Class B | | 18,411 | 2,446,638 |
|
| TOTAL CONSUMER DISCRETIONARY | | | 18,574,647 |
|
| CONSUMER STAPLES - 2.2% | | | |
| Food & Staples Retailing - 1.3% | | | |
| Costco Wholesale Corp. | | 6,920 | 2,439,162 |
| Personal Products - 0.9% | | | |
| Estee Lauder Companies, Inc. Class A | | 6,011 | 1,748,299 |
|
| TOTAL CONSUMER STAPLES | | | 4,187,461 |
|
| FINANCIALS - 6.1% | | | |
| Capital Markets - 4.1% | | | |
| Intercontinental Exchange, Inc. | | 17,370 | 1,939,882 |
| Moody's Corp. | | 6,434 | 1,921,257 |
| MSCI, Inc. | | 3,970 | 1,664,542 |
| S&P Global, Inc. | | 6,349 | 2,240,372 |
| | | | 7,766,053 |
| Insurance - 2.0% | | | |
| Arthur J. Gallagher & Co. | | 13,950 | 1,740,542 |
| Marsh & McLennan Companies, Inc. | | 16,070 | 1,957,326 |
| | | | 3,697,868 |
|
| TOTAL FINANCIALS | | | 11,463,921 |
|
| HEALTH CARE - 9.5% | | | |
| Health Care Equipment & Supplies - 4.4% | | | |
| Danaher Corp. | | 10,478 | 2,358,388 |
| IDEXX Laboratories, Inc. (a) | | 3,600 | 1,761,516 |
| Intuitive Surgical, Inc. (a) | | 2,792 | 2,063,120 |
| Stryker Corp. | | 8,070 | 1,965,691 |
| | | | 8,148,715 |
| Health Care Providers & Services - 1.9% | | | |
| UnitedHealth Group, Inc. | | 9,778 | 3,638,100 |
| Health Care Technology - 0.8% | | | |
| Veeva Systems, Inc. Class A (a) | | 5,950 | 1,554,378 |
| Life Sciences Tools & Services - 1.4% | | | |
| Thermo Fisher Scientific, Inc. | | 5,523 | 2,520,587 |
| Pharmaceuticals - 1.0% | | | |
| Zoetis, Inc. Class A | | 12,220 | 1,924,406 |
|
| TOTAL HEALTH CARE | | | 17,786,186 |
|
| INDUSTRIALS - 8.5% | | | |
| Aerospace & Defense - 1.7% | | | |
| HEICO Corp. Class A | | 13,982 | 1,588,355 |
| TransDigm Group, Inc. (a) | | 2,890 | 1,699,089 |
| | | | 3,287,444 |
| Electrical Equipment - 1.0% | | | |
| AMETEK, Inc. | | 14,465 | 1,847,614 |
| Professional Services - 3.5% | | | |
| CoStar Group, Inc. (a) | | 1,860 | 1,528,715 |
| IHS Markit Ltd. | | 19,160 | 1,854,305 |
| TransUnion Holding Co., Inc. | | 16,879 | 1,519,110 |
| Verisk Analytics, Inc. | | 9,471 | 1,673,431 |
| | | | 6,575,561 |
| Road & Rail - 2.3% | | | |
| Old Dominion Freight Lines, Inc. | | 6,970 | 1,675,658 |
| Union Pacific Corp. | | 11,670 | 2,572,185 |
| | | | 4,247,843 |
|
| TOTAL INDUSTRIALS | | | 15,958,462 |
|
| INFORMATION TECHNOLOGY - 40.2% | | | |
| Electronic Equipment & Components - 0.9% | | | |
| Amphenol Corp. Class A | | 26,200 | 1,728,414 |
| IT Services - 9.6% | | | |
| Accenture PLC Class A | | 9,790 | 2,704,488 |
| Fiserv, Inc. (a) | | 16,630 | 1,979,635 |
| Global Payments, Inc. | | 8,987 | 1,811,599 |
| MasterCard, Inc. Class A | | 9,407 | 3,349,362 |
| PayPal Holdings, Inc. (a) | | 12,392 | 3,009,273 |
| Square, Inc. (a) | | 6,960 | 1,580,268 |
| Visa, Inc. Class A | | 17,307 | 3,664,411 |
| | | | 18,099,036 |
| Semiconductors & Semiconductor Equipment - 7.4% | | | |
| Advanced Micro Devices, Inc. (a) | | 26,810 | 2,104,585 |
| Analog Devices, Inc. | | 11,820 | 1,833,046 |
| KLA Corp. | | 5,660 | 1,870,064 |
| Lam Research Corp. | | 3,420 | 2,035,721 |
| NVIDIA Corp. | | 6,390 | 3,411,813 |
| Texas Instruments, Inc. | | 13,470 | 2,545,695 |
| | | | 13,800,924 |
| Software - 15.7% | | | |
| Adobe, Inc. (a) | | 5,951 | 2,828,927 |
| ANSYS, Inc. (a) | | 4,890 | 1,660,448 |
| Autodesk, Inc. (a) | | 6,950 | 1,926,193 |
| Cadence Design Systems, Inc. (a) | | 13,522 | 1,852,379 |
| DocuSign, Inc. (a) | | 7,470 | 1,512,302 |
| Fortinet, Inc. (a) | | 9,140 | 1,685,599 |
| Intuit, Inc. | | 5,753 | 2,203,744 |
| Microsoft Corp. | | 49,847 | 11,752,427 |
| ServiceNow, Inc. (a) | | 4,290 | 2,145,472 |
| Synopsys, Inc. (a) | | 7,409 | 1,835,802 |
| | | | 29,403,293 |
| Technology Hardware, Storage & Peripherals - 6.6% | | | |
| Apple, Inc. | | 101,614 | 12,412,148 |
|
| TOTAL INFORMATION TECHNOLOGY | | | 75,443,815 |
|
| MATERIALS - 2.3% | | | |
| Chemicals - 2.3% | | | |
| Linde PLC | | 8,636 | 2,419,289 |
| Sherwin-Williams Co. | | 2,631 | 1,941,704 |
| | | | 4,360,993 |
| REAL ESTATE - 4.1% | | | |
| Equity Real Estate Investment Trusts (REITs) - 4.1% | | | |
| American Tower Corp. | | 9,555 | 2,284,218 |
| Equinix, Inc. | | 2,687 | 1,826,058 |
| Prologis (REIT), Inc. | | 19,682 | 2,086,292 |
| SBA Communications Corp. Class A | | 5,095 | 1,414,117 |
| | | | 7,610,685 |
| UTILITIES - 1.3% | | | |
| Electric Utilities - 1.3% | | | |
| NextEra Energy, Inc. | | 31,438 | 2,377,027 |
| TOTAL COMMON STOCKS | | | |
| (Cost $132,194,306) | | | 185,981,974 |
|
| Money Market Funds - 1.1% | | | |
| Fidelity Cash Central Fund 0.06% (c) | | 1,663,901 | 1,664,234 |
| Fidelity Securities Lending Cash Central Fund 0.06% (c)(d) | | 450,955 | 451,000 |
| TOTAL MONEY MARKET FUNDS | | | |
| (Cost $2,115,234) | | | 2,115,234 |
| TOTAL INVESTMENT IN SECURITIES - 100.2% | | | |
| (Cost $134,309,540) | | | 188,097,208 |
| NET OTHER ASSETS (LIABILITIES) - (0.2)% | | | (348,800) |
| NET ASSETS - 100% | | | $187,748,408 |
Legend
(a) Non-income producing
(b) Security or a portion of the security is on loan at period end.
(c) Affiliated fund that is generally available only to investment companies and other accounts managed by Fidelity Investments. The rate quoted is the annualized seven-day yield of the fund at period end. A complete unaudited listing of the fund's holdings as of its most recent quarter end is available upon request. In addition, each Fidelity Central Fund's financial statements, which are not covered by the Fund's Report of Independent Registered Public Accounting Firm, are available on the SEC's website or upon request.
(d) Investment made with cash collateral received from securities on loan.
Affiliated Central Funds
Information regarding fiscal year to date income earned by the Fund from investments in Fidelity Central Funds is as follows:
| Fund | Income earned |
| Fidelity Cash Central Fund | $2,091 |
| Fidelity Securities Lending Cash Central Fund | 10 |
| Total | $2,101 |
Amounts in the income column in the above table include any capital gain distributions from underlying funds, which are presented in the corresponding line-item in the Statement of Operations, if applicable. Amount for Fidelity Securities Lending Cash Central Fund represents the income earned on investing cash collateral, less rebates paid to borrowers and any lending agent fees associated with the loan, plus any premium payments received for lending certain types of securities.
Investment Valuation
The following is a summary of the inputs used, as of March 31, 2021, involving the Fund's assets and liabilities carried at fair value. The inputs or methodology used for valuing securities may not be an indication of the risk associated with investing in those securities. For more information on valuation inputs, and their aggregation into the levels used below, please refer to the Investment Valuation section in the accompanying Notes to Financial Statements.
| | Valuation Inputs at Reporting Date: |
| Description | Total | Level 1 | Level 2 | Level 3 |
| Investments in Securities: | | | | |
| Equities: | | | | |
| Communication Services | $28,218,777 | $28,218,777 | $-- | $-- |
| Consumer Discretionary | 18,574,647 | 18,574,647 | -- | -- |
| Consumer Staples | 4,187,461 | 4,187,461 | -- | -- |
| Financials | 11,463,921 | 11,463,921 | -- | -- |
| Health Care | 17,786,186 | 17,786,186 | -- | -- |
| Industrials | 15,958,462 | 15,958,462 | -- | -- |
| Information Technology | 75,443,815 | 75,443,815 | -- | -- |
| Materials | 4,360,993 | 4,360,993 | -- | -- |
| Real Estate | 7,610,685 | 7,610,685 | -- | -- |
| Utilities | 2,377,027 | 2,377,027 | -- | -- |
| Money Market Funds | 2,115,234 | 2,115,234 | -- | -- |
| Total Investments in Securities: | $188,097,208 | $188,097,208 | $-- | $-- |
See accompanying notes which are an integral part of the financial statements.
Financial Statements
Statement of Assets and Liabilities
| | | March 31, 2021 |
| Assets | | |
Investment in securities, at value (including securities loaned of $465,905) — See accompanying schedule:
Unaffiliated issuers (cost $132,194,306) | $185,981,974 | |
| Fidelity Central Funds (cost $2,115,234) | 2,115,234 | |
| Total Investment in Securities (cost $134,309,540) | | $188,097,208 |
| Receivable for investments sold | | 144,714 |
| Receivable for fund shares sold | | 4,708 |
| Dividends receivable | | 22,568 |
| Distributions receivable from Fidelity Central Funds | | 89 |
| Other receivables | | 924 |
| Total assets | | 188,270,211 |
| Liabilities | | |
| Payable for fund shares redeemed | $1,159 | |
| Accrued management fee | 69,644 | |
| Collateral on securities loaned | 451,000 | |
| Total liabilities | | 521,803 |
| Net Assets | | $187,748,408 |
| Net Assets consist of: | | |
| Paid in capital | | $131,826,328 |
| Total accumulated earnings (loss) | | 55,922,080 |
| Net Assets | | $187,748,408 |
| Net Asset Value, offering price and redemption price per share ($187,748,408 ÷ 13,080,924 shares) | | $14.35 |
See accompanying notes which are an integral part of the financial statements.
Statement of Operations
| | | Year ended March 31, 2021 |
| Investment Income | | |
| Dividends | | $1,354,016 |
| Income from Fidelity Central Funds (including $10 from security lending) | | 2,101 |
| Total income | | 1,356,117 |
| Expenses | | |
| Management fee | $790,075 | |
| Independent trustees' fees and expenses | 887 | |
| Miscellaneous | 1,004 | |
| Total expenses before reductions | 791,966 | |
| Expense reductions | (4,297) | |
| Total expenses after reductions | | 787,669 |
| Net investment income (loss) | | 568,448 |
| Realized and Unrealized Gain (Loss) | | |
| Net realized gain (loss) on: | | |
| Investment securities: | | |
| Unaffiliated issuers | 7,892,218 | |
| Fidelity Central Funds | 1 | |
| Total net realized gain (loss) | | 7,892,219 |
| Change in net unrealized appreciation (depreciation) on investment securities | | 57,379,985 |
| Net gain (loss) | | 65,272,204 |
| Net increase (decrease) in net assets resulting from operations | | $65,840,652 |
See accompanying notes which are an integral part of the financial statements.
Statement of Changes in Net Assets
| | Year ended March 31, 2021 | For the period
June 13, 2019 (commencement of operations) to March 31, 2020 |
| Increase (Decrease) in Net Assets | | |
| Operations | | |
| Net investment income (loss) | $568,448 | $581,097 |
| Net realized gain (loss) | 7,892,219 | (5,839,080) |
| Change in net unrealized appreciation (depreciation) | 57,379,985 | (3,592,317) |
| Net increase (decrease) in net assets resulting from operations | 65,840,652 | (8,850,300) |
| Distributions to shareholders | (634,417) | (433,855) |
| Share transactions | | |
| Proceeds from sales of shares | 15,671,136 | 158,771,149 |
| Reinvestment of distributions | 634,417 | 433,855 |
| Cost of shares redeemed | (25,221,879) | (18,462,350) |
| Net increase (decrease) in net assets resulting from share transactions | (8,916,326) | 140,742,654 |
| Total increase (decrease) in net assets | 56,289,909 | 131,458,499 |
| Net Assets | | |
| Beginning of period | 131,458,499 | – |
| End of period | $187,748,408 | $131,458,499 |
| Other Information | | |
| Shares | | |
| Sold | 1,220,926 | 15,429,819 |
| Issued in reinvestment of distributions | 49,046 | 39,702 |
| Redeemed | (1,901,831) | (1,756,738) |
| Net increase (decrease) | (631,859) | 13,712,783 |
See accompanying notes which are an integral part of the financial statements.
Financial Highlights
Fidelity Magellan K6 Fund
| | | |
| Years ended March 31, | 2021 | 2020 A |
| Selected Per–Share Data | | |
| Net asset value, beginning of period | $9.59 | $10.00 |
| Income from Investment Operations | | |
| Net investment income (loss)B | .04 | .06 |
| Net realized and unrealized gain (loss) | 4.77 | (.44) |
| Total from investment operations | 4.81 | (.38) |
| Distributions from net investment income | (.05) | (.03) |
| Total distributions | (.05) | (.03) |
| Net asset value, end of period | $14.35 | $9.59 |
| Total ReturnC,D | 50.18% | (3.83)% |
| Ratios to Average Net AssetsE,F | | |
| Expenses before reductions | .45% | .45%G |
| Expenses net of fee waivers, if any | .45% | .45%G |
| Expenses net of all reductions | .45% | .45%G |
| Net investment income (loss) | .32% | .65%G |
| Supplemental Data | | |
| Net assets, end of period (000 omitted) | $187,748 | $131,458 |
| Portfolio turnover rateH | 62% | 93%G,I |
A For the period June 13, 2019 (commencement of operations) to March 31, 2020.
B Calculated based on average shares outstanding during the period.
C Total returns for periods of less than one year are not annualized.
D Total returns would have been lower if certain expenses had not been reduced during the applicable periods shown.
E Fees and expenses of any underlying mutual funds or exchange-traded funds (ETFs) are not included in the Fund's expense ratio. The Fund indirectly bears its proportionate share of these expenses. For additional expense information related to investments in Fidelity Central Funds, please refer to the "Investments in Fidelity Central Funds" note found in the Notes to Financial Statements section of the most recent Annual or Semi-Annual report.
F Expense ratios reflect operating expenses of the class. Expenses before reductions do not reflect amounts reimbursed, waived, or reduced through arrangements with the investment advisor, brokerage services, or other offset arrangements, if applicable, and do not represent the amount paid by the class during periods when reimbursements, waivers or reductions occur.
G Annualized
H Amount does not include the portfolio activity of any underlying mutual funds or exchange-traded funds (ETFs).
I Portfolio turnover rate excludes securities received or delivered in-kind.
See accompanying notes which are an integral part of the financial statements.
Notes to Financial Statements
For the period ended March 31, 2021
1. Organization.
Fidelity Magellan K6 Fund (the Fund) is a fund of Fidelity Magellan Fund (the Trust) and is authorized to issue an unlimited number of shares. Share transactions on the Statement of Changes in Net Assets may contain exchanges between affiliated funds. The Trust is registered under the Investment Company Act of 1940, as amended (the 1940 Act), as an open-end management investment company organized as a Massachusetts business trust. Shares generally are available only to employer-sponsored retirement plans that are recordkept by Fidelity, or to certain employer-sponsored retirement plans that are not recordkept by Fidelity.
2. Investments in Fidelity Central Funds.
The Fund invests in Fidelity Central Funds, which are open-end investment companies generally available only to other investment companies and accounts managed by the investment adviser and its affiliates. The Fund's Schedule of Investments lists each of the Fidelity Central Funds held as of period end, if any, as an investment of the Fund, but does not include the underlying holdings of each Fidelity Central Fund. As an Investing Fund, the Fund indirectly bears its proportionate share of the expenses of the underlying Fidelity Central Funds.
The Money Market Central Funds seek preservation of capital and current income and are managed by the investment adviser. Annualized expenses of the Money Market Central Funds as of their most recent shareholder report date ranged from less than .005% to .01%.
A complete unaudited list of holdings for each Fidelity Central Fund is available upon request or at the Securities and Exchange Commission (the SEC) website at www.sec.gov. In addition, the financial statements of the Fidelity Central Funds, which are not covered by the Fund's Report of Independent Registered Public Accounting Firm, are available on the SEC website or upon request.
3. Significant Accounting Policies.
The Fund is an investment company and applies the accounting and reporting guidance of the Financial Accounting Standards Board (FASB) Accounting Standards Codification Topic 946 Financial Services - Investment Companies. The financial statements have been prepared in conformity with accounting principles generally accepted in the United States of America (GAAP), which require management to make certain estimates and assumptions at the date of the financial statements. Actual results could differ from those estimates. Subsequent events, if any, through the date that the financial statements were issued have been evaluated in the preparation of the financial statements. The Fund's Schedule of Investments lists any underlying mutual funds or exchange-traded funds (ETFs) but does not include the underlying holdings of these funds. The following summarizes the significant accounting policies of the Fund:
Investment Valuation. Investments are valued as of 4:00 p.m. Eastern time on the last calendar day of the period. The Board of Trustees (the Board) has delegated the day to day responsibility for the valuation of the Fund's investments to the Fair Value Committee (the Committee) established by the Fund's investment adviser. In accordance with valuation policies and procedures approved by the Board, the Fund attempts to obtain prices from one or more third party pricing vendors or brokers to value its investments. When current market prices, quotations or currency exchange rates are not readily available or reliable, investments will be fair valued in good faith by the Committee, in accordance with procedures adopted by the Board. Factors used in determining fair value vary by investment type and may include market or investment specific events. The frequency with which these procedures are used cannot be predicted and they may be utilized to a significant extent. The Committee oversees the Fund's valuation policies and procedures and reports to the Board on the Committee's activities and fair value determinations. The Board monitors the appropriateness of the procedures used in valuing the Fund's investments and ratifies the fair value determinations of the Committee.
The Fund categorizes the inputs to valuation techniques used to value its investments into a disclosure hierarchy consisting of three levels as shown below:
- Level 1 – quoted prices in active markets for identical investments
- Level 2 – other significant observable inputs (including quoted prices for similar investments, interest rates, prepayment speeds, etc.)
- Level 3 – unobservable inputs (including the Fund's own assumptions based on the best information available)
Valuation techniques used to value the Fund's investments by major category are as follows:
Equity securities, including restricted securities, for which market quotations are readily available, are valued at the last reported sale price or official closing price as reported by a third party pricing vendor on the primary market or exchange on which they are traded and are categorized as Level 1 in the hierarchy. In the event there were no sales during the day or closing prices are not available, securities are valued at the last quoted bid price or may be valued using the last available price and are generally categorized as Level 2 in the hierarchy. For foreign equity securities, when market or security specific events arise, comparisons to the valuation of American Depositary Receipts (ADRs), futures contracts, Exchange-Traded Funds (ETFs) and certain indexes as well as quoted prices for similar securities may be used and would be categorized as Level 2 in the hierarchy. For equity securities, including restricted securities, where observable inputs are limited, assumptions about market activity and risk are used and these securities may be categorized as Level 3 in the hierarchy.
Investments in open-end mutual funds, including the Fidelity Central Funds, are valued at their closing net asset value (NAV) each business day and are categorized as Level 1 in the hierarchy.
Changes in valuation techniques may result in transfers in or out of an assigned level within the disclosure hierarchy. The aggregate value of investments by input level as of March 31, 2021 is included at the end of the Fund's Schedule of Investments.
Investment Transactions and Income. For financial reporting purposes, the Fund's investment holdings and NAV include trades executed through the end of the last business day of the period. The NAV per share for processing shareholder transactions is calculated as of the close of business of the New York Stock Exchange (NYSE), normally 4:00 p.m. Eastern time and includes trades executed through the end of the prior business day. Gains and losses on securities sold are determined on the basis of identified cost. Dividend income is recorded on the ex-dividend date, except for certain dividends from foreign securities where the ex-dividend date may have passed, which are recorded as soon as the Fund is informed of the ex-dividend date. Non-cash dividends included in dividend income, if any, are recorded at the fair market value of the securities received. Income and capital gain distributions from Fidelity Central Funds, if any, are recorded on the ex-dividend date. Certain distributions received by the Fund represent a return of capital or capital gain. The Fund determines the components of these distributions subsequent to the ex-dividend date, based upon receipt of tax filings or other correspondence relating to the underlying investment. These distributions are recorded as a reduction of cost of investments and/or as a realized gain.
Expenses. Expenses directly attributable to a fund are charged to that fund. Expenses attributable to more than one fund are allocated among the respective funds on the basis of relative net assets or other appropriate methods. Expense estimates are accrued in the period to which they relate and adjustments are made when actual amounts are known.
Income Tax Information and Distributions to Shareholders. Each year, the Fund intends to qualify as a regulated investment company under Subchapter M of the Internal Revenue Code, including distributing substantially all of its taxable income and realized gains. As a result, no provision for U.S. Federal income taxes is required. As of March 31, 2021, the Fund did not have any unrecognized tax benefits in the financial statements; nor is the Fund aware of any tax positions for which it is reasonably possible that the total amounts of unrecognized tax benefits will significantly change in the next twelve months. The Fund files a U.S. federal tax return, in addition to state and local tax returns as required. The Fund's federal income tax returns are subject to examination by the Internal Revenue Service (IRS) for a period of three fiscal years after they are filed. State and local tax returns may be subject to examination for an additional fiscal year depending on the jurisdiction.
Distributions are declared and recorded on the ex-dividend date. Income and capital gain distributions are determined in accordance with income tax regulations, which may differ from GAAP.
Capital accounts within the financial statements are adjusted for permanent book-tax differences. These adjustments have no impact on net assets or the results of operations. Capital accounts are not adjusted for temporary book-tax differences which will reverse in a subsequent period.
Book-tax differences are primarily due to passive foreign investment companies (PFIC), capital loss carryforwards and losses deferred due to wash sales.
As of period end, the cost and unrealized appreciation (depreciation) in securities, and derivatives if applicable, for federal income tax purposes were as follows:
| Gross unrealized appreciation | $54,380,604 |
| Gross unrealized depreciation | (729,274) |
| Net unrealized appreciation (depreciation) | $53,651,330 |
| Tax Cost | $134,445,878 |
The tax-based components of distributable earnings as of period end were as follows:
| Undistributed ordinary income | $25,152 |
| Undistributed long-term capital gain | $2,245,599 |
| Net unrealized appreciation (depreciation) on securities and other investments | $53,651,330 |
The tax character of distributions paid was as follows:
| | March 31, 2021 | March 31, 2020(a) |
| Ordinary Income | $634,417 | $ 433,855 |
| Total | $634,417 | $ 433,855 |
(a) For the period June 13, 2019 (commencement of operations) to March 31, 2020.
4. Purchases and Sales of Investments.
Purchases and sales of securities, other than short-term securities, are noted in the table below.
| | Purchases ($) | Sales ($) |
| Fidelity Magellan K6 Fund | 106,873,514 | 116,301,202 |
Prior Fiscal Year Unaffiliated Exchanges In-Kind. During the prior period, the Fund received investments and cash valued at $22,232,601 in exchange for 2,146,004 shares of the Fund. The amount of in-kind exchanges is included in share transactions in the accompanying Statement of Changes in Net Assets.
5. Fees and Other Transactions with Affiliates.
Management Fee. Fidelity Management & Research Company LLC (the investment adviser) and its affiliates provide the Fund with investment management related services for which the Fund pays a monthly management fee that is based on an annual rate of .45% of average net assets. Under the management contract, the investment adviser or an affiliate pays all other expenses of the Fund, excluding fees and expenses of the independent Trustees, and certain miscellaneous expenses such as proxy and shareholder meeting expenses.
Brokerage Commissions. A portion of portfolio transactions were placed with brokerage firms which are affiliates of the investment adviser. Brokerage commissions are included in net realized gain (loss) and change in net unrealized appreciation (depreciation) in the Statement of Operations. The commissions paid to these affiliated firms were as follows:
| | Amount |
| Fidelity Magellan K6 Fund | $1,349 |
Interfund Trades. Funds may purchase from or sell securities to other Fidelity Funds under procedures adopted by the Board. The procedures have been designed to ensure these interfund trades are executed in accordance with Rule 17a-7 of the 1940 Act. Any interfund trades are included within the respective purchases and sales amounts shown in the Purchases and Sales of Investments note and are noted in the table below.
| | Purchases ($) | Sales ($) |
| Fidelity Magellan K6 Fund | 8,304,045 | 7,095,819 |
Prior Fiscal Year Affiliated Exchanges In-Kind. During the prior period, the Fund received investments and cash valued at $124,779,539 in exchange for 12,149,906 shares of the Fund. The amount of in-kind exchanges is included in share transactions in the accompanying Statement of Changes in Net Assets.
6. Committed Line of Credit.
Certain Funds participate with other funds managed by the investment adviser or an affiliate in a $4.25 billion credit facility (the "line of credit") to be utilized for temporary or emergency purposes to fund shareholder redemptions or for other short-term liquidity purposes. The participating funds have agreed to pay commitment fees on their pro-rata portion of the line of credit, which are reflected in Miscellaneous expenses on the Statement of Operations, and are listed below. Effective during January 2021, commitment fees are borne by the investment advisor.
| | Amount |
| Fidelity Magellan K6 Fund | $369 |
During the period, there were no borrowings on this line of credit.
7. Security Lending.
Funds lend portfolio securities from time to time in order to earn additional income. Lending agents are used, including National Financial Services (NFS), an affiliate of the investment adviser. Pursuant to a securities lending agreement, NFS will receive a fee, which is capped at 9.9% of a fund's daily lending revenue, for its services as lending agent. A fund may lend securities to certain qualified borrowers, including NFS. On the settlement date of the loan, a fund receives collateral (in the form of U.S. Treasury obligations, letters of credit and/or cash) against the loaned securities and maintains collateral in an amount not less than 100% of the market value of the loaned securities during the period of the loan. The market value of the loaned securities is determined at the close of business of a fund and any additional required collateral is delivered to a fund on the next business day. A fund or borrower may terminate the loan at any time, and if the borrower defaults on its obligation to return the securities loaned because of insolvency or other reasons, a fund may apply collateral received from the borrower against the obligation. A fund may experience delays and costs in recovering the securities loaned. Any cash collateral received is invested in the Fidelity Securities Lending Cash Central Fund. Any loaned securities are identified as such in the Schedule of Investments, and the value of loaned securities and cash collateral at period end, as applicable, are presented in the Statement of Assets and Liabilities. Security lending income represents the income earned on investing cash collateral, less rebates paid to borrowers and any lending agent fees associated with the loan, plus any premium payments received for lending certain types of securities. Security lending income is presented in the Statement of Operations as a component of income from Fidelity Central Funds. Affiliated security lending activity, if any, was as follows:
| | Total Security Lending Income Fees Paid to NFS | Security Lending Income From Securities Loaned to NFS | Value of Securities Loaned to NFS at Period End |
| Fidelity Magellan K6 Fund | $1 | $– | $– |
8. Expense Reductions.
Commissions paid to certain brokers with whom the investment adviser, or its affiliates, places trades on behalf of the Fund include an amount in addition to trade execution, which may be rebated back to the Fund to offset expenses. This amount totaled $4,282 for the period. In addition, through arrangements with the Fund's custodian, credits realized as a result of certain uninvested cash balances were used to reduce the Fund's expenses by $15.
9. Other.
The Fund's organizational documents provide former and current trustees and officers with a limited indemnification against liabilities arising in connection with the performance of their duties to the Fund. In the normal course of business, the Fund may also enter into contracts that provide general indemnifications. The Fund's maximum exposure under these arrangements is unknown as this would be dependent on future claims that may be made against the Fund. The risk of material loss from such claims is considered remote.
10. Coronavirus (COVID-19) Pandemic.
An outbreak of COVID-19 first detected in China during December 2019 has since spread globally and was declared a pandemic by the World Health Organization during March 2020. Developments that disrupt global economies and financial markets, such as the COVID-19 pandemic, may magnify factors that affect the Fund's performance.
Report of Independent Registered Public Accounting Firm
To the Board of Trustees of Fidelity Magellan Fund and Shareholders of Fidelity Magellan K6 Fund
Opinion on the Financial Statements
We have audited the accompanying statement of assets and liabilities, including the schedule of investments, of Fidelity Magellan K6 Fund (one of the funds constituting Fidelity Magellan Fund, referred to hereafter as the “Fund”) as of March 31, 2021, the related statement of operations for the year ended March 31, 2021 and the statement of changes in net assets and the financial highlights for the year ended March 31, 2021 and for the period June 13, 2019 (commencement of operations) through March 31, 2020, including the related notes (collectively referred to as the “financial statements”). In our opinion, the financial statements present fairly, in all material respects, the financial position of the Fund as of March 31, 2021, the results of its operations for the year ended March 31, 2021, and the changes in its net assets and the financial highlights for the year ended March 31, 2021 and for the period June 13, 2019 (commencement of operations) through March 31, 2020 in conformity with accounting principles generally accepted in the United States of America.
Basis for Opinion
These financial statements are the responsibility of the Fund’s management. Our responsibility is to express an opinion on the Fund’s financial statements based on our audits. We are a public accounting firm registered with the Public Company Accounting Oversight Board (United States) (PCAOB) and are required to be independent with respect to the Fund in accordance with the U.S. federal securities laws and the applicable rules and regulations of the Securities and Exchange Commission and the PCAOB.
We conducted our audits of these financial statements in accordance with the standards of the PCAOB. Those standards require that we plan and perform the audit to obtain reasonable assurance about whether the financial statements are free of material misstatement, whether due to error or fraud.
Our audits included performing procedures to assess the risks of material misstatement of the financial statements, whether due to error or fraud, and performing procedures that respond to those risks. Such procedures included examining, on a test basis, evidence regarding the amounts and disclosures in the financial statements. Our audits also included evaluating the accounting principles used and significant estimates made by management, as well as evaluating the overall presentation of the financial statements. Our procedures included confirmation of securities owned as of March 31, 2021 by correspondence with the custodian. We believe that our audits provide a reasonable basis for our opinion.
/s/ PricewaterhouseCoopers LLP
Boston, Massachusetts
May 14, 2021
We have served as the auditor of one or more investment companies in the Fidelity group of funds since 1932.
Trustees and Officers
The Trustees, Members of the Advisory Board (if any), and officers of the trust and fund, as applicable, are listed below. The Board of Trustees governs the fund and is responsible for protecting the interests of shareholders. The Trustees are experienced executives who meet periodically throughout the year to oversee the fund's activities, review contractual arrangements with companies that provide services to the fund, oversee management of the risks associated with such activities and contractual arrangements, and review the fund's performance. Each of the Trustees oversees 309 funds.
The Trustees hold office without limit in time except that (a) any Trustee may resign; (b) any Trustee may be removed by written instrument, signed by at least two-thirds of the number of Trustees prior to such removal; (c) any Trustee who requests to be retired or who has become incapacitated by illness or injury may be retired by written instrument signed by a majority of the other Trustees; and (d) any Trustee may be removed at any special meeting of shareholders by a two-thirds vote of the outstanding voting securities of the trust. Each Trustee who is not an interested person (as defined in the 1940 Act) of the trust and the fund is referred to herein as an Independent Trustee. Each Independent Trustee shall retire not later than the last day of the calendar year in which his or her 75th birthday occurs. The Independent Trustees may waive this mandatory retirement age policy with respect to individual Trustees. Officers and Advisory Board Members hold office without limit in time, except that any officer or Advisory Board Member may resign or may be removed by a vote of a majority of the Trustees at any regular meeting or any special meeting of the Trustees. Except as indicated, each individual has held the office shown or other offices in the same company for the past five years.
The fund’s Statement of Additional Information (SAI) includes more information about the Trustees. To request a free copy, call Fidelity at 1-800-835-5092.
Experience, Skills, Attributes, and Qualifications of the Trustees. The Governance and Nominating Committee has adopted a statement of policy that describes the experience, qualifications, attributes, and skills that are necessary and desirable for potential Independent Trustee candidates (Statement of Policy). The Board believes that each Trustee satisfied at the time he or she was initially elected or appointed a Trustee, and continues to satisfy, the standards contemplated by the Statement of Policy. The Governance and Nominating Committee also engages professional search firms to help identify potential Independent Trustee candidates who have the experience, qualifications, attributes, and skills consistent with the Statement of Policy. From time to time, additional criteria based on the composition and skills of the current Independent Trustees, as well as experience or skills that may be appropriate in light of future changes to board composition, business conditions, and regulatory or other developments, have also been considered by the professional search firms and the Governance and Nominating Committee. In addition, the Board takes into account the Trustees' commitment and participation in Board and committee meetings, as well as their leadership of standing and ad hoc committees throughout their tenure.
In determining that a particular Trustee was and continues to be qualified to serve as a Trustee, the Board has considered a variety of criteria, none of which, in isolation, was controlling. The Board believes that, collectively, the Trustees have balanced and diverse experience, qualifications, attributes, and skills, which allow the Board to operate effectively in governing the fund and protecting the interests of shareholders. Information about the specific experience, skills, attributes, and qualifications of each Trustee, which in each case led to the Board's conclusion that the Trustee should serve (or continue to serve) as a trustee of the fund, is provided below.
Board Structure and Oversight Function. Robert A. Lawrence is an interested person and currently serves as Acting Chairman. The Trustees have determined that an interested Chairman is appropriate and benefits shareholders because an interested Chairman has a personal and professional stake in the quality and continuity of services provided to the fund. Independent Trustees exercise their informed business judgment to appoint an individual of their choosing to serve as Chairman, regardless of whether the Trustee happens to be independent or a member of management. The Independent Trustees have determined that they can act independently and effectively without having an Independent Trustee serve as Chairman and that a key structural component for assuring that they are in a position to do so is for the Independent Trustees to constitute a substantial majority for the Board. The Independent Trustees also regularly meet in executive session. David M. Thomas serves as Lead Independent Trustee and as such (i) acts as a liaison between the Independent Trustees and management with respect to matters important to the Independent Trustees and (ii) with management prepares agendas for Board meetings.
Fidelity® funds are overseen by different Boards of Trustees. The fund's Board oversees Fidelity's high income and certain equity funds, and other Boards oversee Fidelity's investment-grade bond, money market, asset allocation, and other equity funds. The asset allocation funds may invest in Fidelity® funds overseen by the fund's Board. The use of separate Boards, each with its own committee structure, allows the Trustees of each group of Fidelity® funds to focus on the unique issues of the funds they oversee, including common research, investment, and operational issues. On occasion, the separate Boards establish joint committees to address issues of overlapping consequences for the Fidelity® funds overseen by each Board.
The Trustees operate using a system of committees to facilitate the timely and efficient consideration of all matters of importance to the Trustees, the fund, and fund shareholders and to facilitate compliance with legal and regulatory requirements and oversight of the fund's activities and associated risks. The Board, acting through its committees, has charged FMR and its affiliates with (i) identifying events or circumstances the occurrence of which could have demonstrably adverse effects on the fund's business and/or reputation; (ii) implementing processes and controls to lessen the possibility that such events or circumstances occur or to mitigate the effects of such events or circumstances if they do occur; and (iii) creating and maintaining a system designed to evaluate continuously business and market conditions in order to facilitate the identification and implementation processes described in (i) and (ii) above. Because the day-to-day operations and activities of the fund are carried out by or through FMR, its affiliates, and other service providers, the fund's exposure to risks is mitigated but not eliminated by the processes overseen by the Trustees. While each of the Board's committees has responsibility for overseeing different aspects of the fund's activities, oversight is exercised primarily through the Operations, Audit, and Compliance Committees. Appropriate personnel, including but not limited to the fund's Chief Compliance Officer (CCO), FMR's internal auditor, the independent accountants, the fund's Treasurer and portfolio management personnel, make periodic reports to the Board's committees, as appropriate, including an annual review of Fidelity's risk management program for the Fidelity® funds. The responsibilities of each standing committee, including their oversight responsibilities, are described further under "Standing Committees of the Trustees."
Interested Trustees*:
Correspondence intended for a Trustee who is an interested person may be sent to Fidelity Investments, 245 Summer Street, Boston, Massachusetts 02210.
Name, Year of Birth; Principal Occupations and Other Relevant Experience+
Bettina Doulton (1964)
Year of Election or Appointment: 2020
Trustee
Ms. Doulton also serves as Trustee of other Fidelity® funds. Prior to her retirement, Ms. Doulton served in a variety of positions at Fidelity Investments, including as a managing director of research (2006-2007), portfolio manager to certain Fidelity® funds (1993-2005), equity analyst and portfolio assistant (1990-1993), and research assistant (1987-1990). Ms. Doulton currently owns and operates Phi Builders + Architects and Cellardoor Winery. Previously, Ms. Doulton served as a member of the Board of Brown Capital Management, LLC (2014-2018).
Robert A. Lawrence (1952)
Year of Election or Appointment: 2020
Trustee
Acting Chairman of the Board of Trustees
Mr. Lawrence also serves as Trustee of other funds. Previously, Mr. Lawrence served as a Member of the Advisory Board of certain funds. Prior to his retirement in 2008, Mr. Lawrence served as Vice President of certain Fidelity® funds (2006-2008), Senior Vice President, Head of High Income Division of Fidelity Management & Research Company (investment adviser firm, 2006-2008), and President of Fidelity Strategic Investments (investment adviser firm, 2002-2005).
* Determined to be an “Interested Trustee” by virtue of, among other things, his or her affiliation with the trust or various entities under common control with FMR.
+ The information includes the Trustee's principal occupation during the last five years and other information relating to the experience, attributes, and skills relevant to the Trustee's qualifications to serve as a Trustee, which led to the conclusion that the Trustee should serve as a Trustee for the fund.
Independent Trustees:
Correspondence intended for an Independent Trustee may be sent to Fidelity Investments, P.O. Box 55235, Boston, Massachusetts 02205-5235.
Name, Year of Birth; Principal Occupations and Other Relevant Experience+
Dennis J. Dirks (1948)
Year of Election or Appointment: 2005
Trustee
Mr. Dirks also serves as Trustee of other Fidelity® funds. Prior to his retirement in May 2003, Mr. Dirks served as Chief Operating Officer and as a member of the Board of The Depository Trust & Clearing Corporation (financial markets infrastructure), President, Chief Operating Officer and a member of the Board of The Depository Trust Company (DTC), President and a member of the Board of the National Securities Clearing Corporation (NSCC), Chief Executive Officer and a member of the Board of the Government Securities Clearing Corporation and Chief Executive Officer and a member of the Board of the Mortgage-Backed Securities Clearing Corporation. Mr. Dirks currently serves as a member of the Finance Committee (2016-present) and Board (2017-present) and is Treasurer (2018-present) of the Asolo Repertory Theatre.
Donald F. Donahue (1950)
Year of Election or Appointment: 2018
Trustee
Mr. Donahue also serves as Trustee of other Fidelity® funds. Mr. Donahue serves as President and Chief Executive Officer of Miranda Partners, LLC (risk consulting for the financial services industry, 2012-present). Previously, Mr. Donahue served as Chief Executive Officer (2006-2012), Chief Operating Officer (2003-2006) and Managing Director, Customer Marketing and Development (1999-2003) of The Depository Trust & Clearing Corporation (financial markets infrastructure). Mr. Donahue currently serves as a member (2007-present) and Co-Chairman (2016-present) of the Board of United Way of New York and a member of the Board of NYC Leadership Academy (2012-present). Mr. Donahue previously served as a member of the Advisory Board of certain Fidelity® funds (2015-2018).
Vicki L. Fuller (1957)
Year of Election or Appointment: 2020
Trustee
Ms. Fuller also serves as Trustee of other Fidelity® funds. Previously, Ms. Fuller served as a member of the Advisory Board of certain Fidelity® funds (2018-2020), Chief Investment Officer of the New York State Common Retirement Fund (2012-2018) and held a variety of positions at AllianceBernstein L.P. (global asset management, 1985-2012), including Managing Director (2006-2012) and Senior Vice President and Senior Portfolio Manager (2001-2006). Ms. Fuller currently serves as a member of the Board, Audit Committee and Nominating and Governance Committee of The Williams Companies, Inc. (natural gas infrastructure, 2018-present), as a member of the Board, Audit Committee and Nominating and Governance Committee of two Blackstone business development companies (2020-present) and as a member of the Board of Treliant, LLC (consulting, 2019-present).
Patricia L. Kampling (1959)
Year of Election or Appointment: 2020
Trustee
Ms. Kampling also serves as Trustee of other Fidelity® funds. Prior to her retirement, Ms. Kampling served as Chairman of the Board and Chief Executive Officer (2012-2019), President and Chief Operating Officer (2011-2012) and Executive Vice President and Chief Financial Officer (2010-2011) of Alliant Energy Corporation. Ms. Kampling currently serves as a member of the Board, Finance Committee and Governance, Compensation and Nominating Committee of Xcel Energy Inc. (utilities company, 2020-present) and as a member of the Board, Audit, Finance and Risk Committee and Safety, Environmental, Technology and Operations Committee of American Water Works Company, Inc. (utilities company, 2019-present). In addition, Ms. Kampling currently serves as a member of the Board of the Nature Conservancy, Wisconsin Chapter (2019-present). Previously, Ms. Kampling served as a Member of the Advisory Board of certain Fidelity® funds (2020), a member of the Board, Compensation Committee and Executive Committee and Chair of the Audit Committee of Briggs & Stratton Corporation (manufacturing, 2011-2021), a member of the Board of Interstate Power and Light Company (2012-2019) and Wisconsin Power and Light Company (2012-2019) (each a subsidiary of Alliant Energy Corporation) and as a member of the Board and Workforce Development Committee of the Business Roundtable (2018-2019).
Thomas A. Kennedy (1955)
Year of Election or Appointment: 2021
Trustee
Mr. Kennedy also serves as Trustee of other Fidelity® funds. Previously, Mr. Kennedy served as a Member of the Advisory Board of certain Fidelity® funds (2020) and held a variety of positions at Raytheon Company (aerospace and defense, 1983-2020), including Chairman and Chief Executive Officer (2014-2020) and Executive Vice President and Chief Operating Officer (2013-2014). Mr. Kennedy currently serves as Executive Chairman of the Board of Directors of Raytheon Technologies Corporation (aerospace and defense, 2020-present). He is also a member of the Rutgers School of Engineering Industry Advisory Board (2011-present) and a member of the UCLA Engineering Dean’s Executive Board (2016-present).
Garnett A. Smith (1947)
Year of Election or Appointment: 2018
Trustee
Mr. Smith also serves as Trustee of other Fidelity® funds. Prior to his retirement, Mr. Smith served as Chairman and Chief Executive Officer (1990-1997) and President (1986-1990) of Inbrand Corp. (manufacturer of personal absorbent products). Prior to his employment with Inbrand Corp., he was employed by a retail fabric chain and North Carolina National Bank (now Bank of America). Mr. Smith previously served as a member of the Advisory Board of certain Fidelity® funds (2012-2013).
David M. Thomas (1949)
Year of Election or Appointment: 2008
Trustee
Lead Independent Trustee
Mr. Thomas also serves as Trustee of other Fidelity® funds. Previously, Mr. Thomas served as Executive Chairman (2005-2006) and Chairman and Chief Executive Officer (2000-2005) of IMS Health, Inc. (pharmaceutical and healthcare information solutions). Mr. Thomas currently serves as a member of the Board of Fortune Brands Home and Security (home and security products, 2004-present) and Presiding Director (2013-present) of Interpublic Group of Companies, Inc. (marketing communication).
Susan Tomasky (1953)
Year of Election or Appointment: 2020
Trustee
Ms. Tomasky also serves as Trustee of other Fidelity® funds. Prior to her retirement, Ms. Tomasky served in various executive officer positions at American Electric Power Company, Inc. (1998-2011), including most recently as President of AEP Transmission (2007-2011). Ms. Tomasky currently serves as a member of the Board and Sustainability Committee and as Chair of the Audit Committee of Marathon Petroleum Corporation (2018-present) and as a member of the Board, Corporate Governance Committee and Organization and Compensation Committee and as Chair of the Audit Committee of Public Service Enterprise Group, Inc. (utilities company, 2012-present). In addition, Ms. Tomasky currently serves as a member (2009-present) and President (2020-present) of the Board of the Royal Shakespeare Company – America (2009-present), as a member of the Board of the Columbus Association for the Performing Arts (2011-present) and as a member of the Board and Investment Committee of Kenyon College (2016-present). Previously, Ms. Tomasky served as a Member of the Advisory Board of certain Fidelity® funds (2020), as a member of the Board of the Columbus Regional Airport Authority (2007-2020), as a member of the Board (2011-2018) and Lead Independent Director (2015-2018) of Andeavor Corporation (previously Tesoro Corporation) (independent oil refiner and marketer) and as a member of the Board of Summit Midstream Partners LP (energy, 2012-2018).
Michael E. Wiley (1950)
Year of Election or Appointment: 2018
Trustee
Mr. Wiley also serves as Trustee of other Fidelity® funds. Previously, Mr. Wiley served as a member of the Advisory Board of certain Fidelity® funds (2018-2020), Chairman, President and CEO of Baker Hughes, Inc. (oilfield services, 2000-2004). Mr. Wiley also previously served as a member of the Board of Andeavor Corporation (independent oil refiner and marketer, 2005-2018), a member of the Board of Andeavor Logistics LP (natural resources logistics, 2015-2018) and a member of the Board of High Point Resources (exploration and production, 2005-2020).
+ The information includes the Trustee's principal occupation during the last five years and other information relating to the experience, attributes, and skills relevant to the Trustee's qualifications to serve as a Trustee, which led to the conclusion that the Trustee should serve as a Trustee for the fund.
Advisory Board Members and Officers:
Correspondence intended for a Member of the Advisory Board (if any) may be sent to Fidelity Investments, P.O. Box 55235, Boston, Massachusetts 02205-5235. Correspondence intended for an officer or Peter S. Lynch may be sent to Fidelity Investments, 245 Summer Street, Boston, Massachusetts 02210. Officers appear below in alphabetical order.
Name, Year of Birth; Principal Occupation
Ned C. Lautenbach (1944)
Year of Election or Appointment: 2021
Member of the Advisory Board
Mr. Lautenbach also serves as a Member of the Advisory Board of other Fidelity® funds. Mr. Lautenbach currently serves as a member of the Council on Foreign Relations (1994-present). He is also a member and has in the past served as Chairman of the Board of Directors of Artis-Naples (2012-present). Previously, Mr. Lautenbach served as a Trustee of certain Fidelity® funds (2000-2020), as a member (2013-2019) and Chair (2018-2019) of the Board of Governors of the State University System of Florida and as a member and then Lead Director of the Board of Directors of Eaton Corporation (diversified industrial, 1997-2016). He was also a Partner at Clayton, Dubilier & Rice, LLC (private equity investment, 1998-2010); as well as Director of Sony Corporation (2006-2007). In addition, Mr. Lautenbach had a 30-year career with IBM (technology company), during which time he served as Senior Vice President and as a member of the Corporate Executive Committee (1968-1998).
Peter S. Lynch (1944)
Year of Election or Appointment: 2003
Member of the Advisory Board
Mr. Lynch also serves as a Member of the Advisory Board of other Fidelity® funds. Mr. Lynch is Vice Chairman and a Director of Fidelity Management & Research Company LLC (investment adviser firm). In addition, Mr. Lynch serves as a Trustee of Boston College and as the Chairman of the Inner-City Scholarship Fund. Previously, Mr. Lynch served as Vice Chairman and a Director of FMR Co., Inc. (investment adviser firm) and on the Special Olympics International Board of Directors (1997-2006).
Craig S. Brown (1977)
Year of Election or Appointment: 2019
Assistant Treasurer
Mr. Brown also serves as Assistant Treasurer of other funds. Mr. Brown is an employee of Fidelity Investments (2013-present).
John J. Burke III (1964)
Year of Election or Appointment: 2018
Chief Financial Officer
Mr. Burke also serves as Chief Financial Officer of other funds. Mr. Burke serves as Head of Investment Operations for Fidelity Fund and Investment Operations (2018-present) and is an employee of Fidelity Investments (1998-present). Previously Mr. Burke served as head of Asset Management Investment Operations (2012-2018).
William C. Coffey (1969)
Year of Election or Appointment: 2019
Assistant Secretary
Mr. Coffey also serves as Assistant Secretary of other funds. He is Senior Vice President and Deputy General Counsel of FMR LLC (diversified financial services company, 2010-present), and is an employee of Fidelity Investments. Previously, Mr. Coffey served as Secretary and CLO of certain funds (2018-2019); CLO, Secretary, and Senior Vice President of Fidelity Management & Research Company and FMR Co., Inc. (investment adviser firms, 2018-2019); Secretary of Fidelity SelectCo, LLC and Fidelity Investments Money Management, Inc. (investment adviser firms, 2018-2019); CLO of Fidelity Management & Research (Hong Kong) Limited, FMR Investment Management (UK) Limited, and Fidelity Management & Research (Japan) Limited (investment adviser firms, 2018-2019); and Assistant Secretary of certain funds (2009-2018).
Timothy M. Cohen (1969)
Year of Election or Appointment: 2018
Vice President
Mr. Cohen also serves as Vice President of other funds. Mr. Cohen serves as Co-Head of Equity (2018-present), a Director of Fidelity Management & Research (Japan) Limited (investment adviser firm, 2016-present), and is an employee of Fidelity Investments. Previously, Mr. Cohen served as Executive Vice President of Fidelity SelectCo, LLC (2019), Head of Global Equity Research (2016-2018), Chief Investment Officer - Equity and a Director of Fidelity Management & Research (U.K.) Inc. (investment adviser firm, 2013-2015) and as a Director of Fidelity Management & Research (Hong Kong) Limited (investment adviser firm, 2017).
Jonathan Davis (1968)
Year of Election or Appointment: 2010
Assistant Treasurer
Mr. Davis also serves as Assistant Treasurer of other funds. Mr. Davis serves as Assistant Treasurer of FMR Capital, Inc. (2017-present) and is an employee of Fidelity Investments. Previously, Mr. Davis served as Vice President and Associate General Counsel of FMR LLC (diversified financial services company, 2003-2010).
Laura M. Del Prato (1964)
Year of Election or Appointment: 2018
Assistant Treasurer
Ms. Del Prato also serves as an officer of other funds. Ms. Del Prato is an employee of Fidelity Investments (2017-present). Previously, Ms. Del Prato served as President and Treasurer of The North Carolina Capital Management Trust: Cash Portfolio and Term Portfolio (2018-2020). Prior to joining Fidelity Investments, Ms. Del Prato served as a Managing Director and Treasurer of the JPMorgan Mutual Funds (2014-2017). Prior to JPMorgan, Ms. Del Prato served as a partner at Cohen Fund Audit Services (accounting firm, 2012-2013) and KPMG LLP (accounting firm, 2004-2012).
Colm A. Hogan (1973)
Year of Election or Appointment: 2020
Assistant Treasurer
Mr. Hogan also serves as an officer of other funds. Mr. Hogan serves as Assistant Treasurer of FMR Capital, Inc. (2017-present) and is an employee of Fidelity Investments (2005-present). Previously, Mr. Hogan served as Deputy Treasurer of certain Fidelity® funds (2016-2020) and Assistant Treasurer of certain Fidelity® funds (2016-2018).
Pamela R. Holding (1964)
Year of Election or Appointment: 2018
Vice President
Ms. Holding also serves as Vice President of other funds. Ms. Holding serves as Co-Head of Equity (2018-present) and is an employee of Fidelity Investments (2013-present). Previously, Ms. Holding served as Executive Vice President of Fidelity SelectCo, LLC (2019) and as Chief Investment Officer of Fidelity Institutional Asset Management (2013-2018).
Cynthia Lo Bessette (1969)
Year of Election or Appointment: 2019
Secretary and Chief Legal Officer (CLO)
Ms. Lo Bessette also serves as an officer of other funds. Ms. Lo Bessette serves as CLO, Secretary, and Senior Vice President of Fidelity Management & Research Company LLC (investment adviser firm, 2019-present); and CLO of Fidelity Management & Research (Hong Kong) Limited, FMR Investment Management (UK) Limited, and Fidelity Management & Research (Japan) Limited (investment adviser firms, 2019-present). She is a Senior Vice President and Deputy General Counsel of FMR LLC (diversified financial services company, 2019-present), and is an employee of Fidelity Investments. Previously, Ms. Lo Bessette served as CLO, Secretary, and Senior Vice President of FMR Co., Inc. (investment adviser firm, 2019); Secretary of Fidelity SelectCo, LLC and Fidelity Investments Money Management, Inc. (investment adviser firms, 2019). Prior to joining Fidelity Investments, Ms. Lo Bessette was Executive Vice President, General Counsel (2016-2019) and Senior Vice President, Deputy General Counsel (2015-2016) of OppenheimerFunds (investment management company) and Deputy Chief Legal Officer (2013-2015) of Jennison Associates LLC (investment adviser firm).
Chris Maher (1972)
Year of Election or Appointment: 2020
Deputy Treasurer
Mr. Maher also serves as an officer of other funds. Mr. Maher serves as Assistant Treasurer of FMR Capital, Inc. (2017-present), and is an employee of Fidelity Investments (2008-present). Previously, Mr. Maher served as Assistant Treasurer of certain funds (2013-2020); Vice President of Asset Management Compliance (2013), Vice President of the Program Management Group of FMR (investment adviser firm, 2010-2013), and Vice President of Valuation Oversight (2008-2010).
Jason P. Pogorelec (1975)
Year of Election or Appointment: 2020
Chief Compliance Officer
Mr. Pogorelec also serves as Chief Compliance Officer of other funds. Mr. Pogorelec is a senior Vice President of Asset Management Compliance for Fidelity Investments and is an employee of Fidelity Investments (2006-present). Previously, Mr. Pogorelec served as Vice President, Associate General Counsel for Fidelity Investments (2010-2020) and Assistant Secretary of certain Fidelity funds (2015-2020).
Brett Segaloff (1972)
Year of Election or Appointment: 2021
Anti-Money Laundering (AML) Officer
Mr. Segaloff also serves as an AML Officer of other funds and other related entities. He is Director, Anti-Money Laundering (2007-present) of FMR LLC (diversified financial services company) and is an employee of Fidelity Investments (1996-present).
Stacie M. Smith (1974)
Year of Election or Appointment: 2016
President and Treasurer
Ms. Smith also serves as an officer of other funds. Ms. Smith serves as Assistant Treasurer of FMR Capital, Inc. (2017-present), is an employee of Fidelity Investments (2009-present), and has served in other fund officer roles. Prior to joining Fidelity Investments, Ms. Smith served as Senior Audit Manager of Ernst & Young LLP (accounting firm, 1996-2009). Previously, Ms. Smith served as Assistant Treasurer (2013-2019) and Deputy Treasurer (2013-2016) of certain Fidelity® funds.
Marc L. Spector (1972)
Year of Election or Appointment: 2016
Assistant Treasurer
Mr. Spector also serves as an officer of other funds. Mr. Spector serves as Assistant Treasurer of FMR Capital, Inc. (2017-present) and is an employee of Fidelity Investments (2016-present). Prior to joining Fidelity Investments, Mr. Spector served as Director at the Siegfried Group (accounting firm, 2013-2016), and prior to Siegfried Group as audit senior manager at Deloitte & Touche LLP (accounting firm, 2005-2013).
Jim Wegmann (1979)
Year of Election or Appointment: 2019
Assistant Treasurer
Mr. Wegmann also serves as Assistant Treasurer of other funds. Mr. Wegmann is an employee of Fidelity Investments (2011-present).
Shareholder Expense Example
As a shareholder, you incur two types of costs: (1) transaction costs, which may include sales charges (loads) on purchase payments or redemption proceeds, as applicable and (2) ongoing costs, which generally include management fees, distribution and/or service (12b-1) fees and other Fund expenses. This Example is intended to help you understand your ongoing costs (in dollars) of investing in a fund and to compare these costs with the ongoing costs of investing in other mutual funds.
The Example is based on an investment of $1,000 invested at the beginning of the period and held for the entire period (October 1, 2020 to March 31, 2021).
Actual Expenses
The first line of the accompanying table provides information about actual account values and actual expenses. You may use the information in this line, together with the amount you invested, to estimate the expenses that you paid over the period. Simply divide your account value by $1,000.00 (for example, an $8,600 account value divided by $1,000.00 = 8.6), then multiply the result by the number in the first line for a class/Fund under the heading entitled "Expenses Paid During Period" to estimate the expenses you paid on your account during this period. If any fund is a shareholder of any underlying mutual funds or exchange-traded funds (ETFs) (the Underlying Funds), such fund indirectly bears its proportional share of the expenses of the Underlying Funds in addition to the direct expenses incurred presented in the table. These fees and expenses are not included in the annualized expense ratio used to calculate the expense estimate in the table below.
Hypothetical Example for Comparison Purposes
The second line of the accompanying table provides information about hypothetical account values and hypothetical expenses based on the actual expense ratio and an assumed rate of return of 5% per year before expenses, which is not the actual return. The hypothetical account values and expenses may not be used to estimate the actual ending account balance or expenses you paid for the period. You may use this information to compare the ongoing costs of investing in the Fund and other funds. To do so, compare this 5% hypothetical example with the 5% hypothetical examples that appear in the shareholder reports of the other funds. If any fund is a shareholder of any Underlying Funds, such fund indirectly bears its proportional share of the expenses of the Underlying Funds in addition to the direct expenses as presented in the table. These fees and expenses are not included in the annualized expense ratio used to calculate the expense estimate in the table below.
Please note that the expenses shown in the table are meant to highlight your ongoing costs only and do not reflect any transaction costs. Therefore, the second line of the table is useful in comparing ongoing costs only, and will not help you determine the relative total costs of owning different funds.
| | Annualized Expense Ratio-A | Beginning
Account Value
October 1, 2020 | Ending
Account Value
March 31, 2021 | Expenses Paid
During Period-B
October 1, 2020
to March 31, 2021 |
| Fidelity Magellan K6 Fund | .45% | | | |
| Actual | | $1,000.00 | $1,085.00 | $2.34 |
| Hypothetical-C | | $1,000.00 | $1,022.69 | $2.27 |
A Annualized expense ratio reflects expenses net of applicable fee waivers.
B Expenses are equal to the annualized expense ratio, multiplied by the average account value over the period, multiplied by 182/ 365 (to reflect the one-half year period). The fees and expenses of any Underlying Funds are not included in each annualized expense ratio.
C 5% return per year before expenses
Distributions (Unaudited)
The Board of Trustees of Fidelity Magellan K6 Fund voted to pay on May 17, 2021, to shareholders of record at the opening of business on May 14, 2021, a distribution of $.147 per share derived from capital gains realized from sales of portfolio securities and a dividend of $.002 per share from net investment income.
The fund hereby designates as a capital gain dividend with respect to the taxable year ended March 31, 2021, $ 2,245,599, or, if subsequently determined to be different, the net capital gain of such year.
The fund designates 100% of the dividends distributed during the fiscal year as qualifying for the dividends–received deduction for corporate shareholders.
The fund designates 100% of the dividends distributed during the fiscal year as amounts which may be taken into account as a dividend for the purposes of the maximum rate under section 1(h)(11) of the Internal Revenue Code.
The fund will notify shareholders in January 2022 of amounts for use in preparing 2021 income tax returns.
Board Approval of Investment Advisory Contracts
Fidelity Magellan K6 Fund
At its January 2021 meeting, the Board of Trustees, including the Independent Trustees (together, the Board), voted to continue the management contract with Fidelity Management & Research Company LLC (FMR), and the sub-advisory agreements and sub-subadvisory agreements, in each case, where applicable (together, the Advisory Contracts) for the fund for four months from February 1, 2021 through May 31, 2021, in connection with changes to the Board's meeting calendar.
The Board considered that the approval of the fund's Advisory Contracts will not result in any changes in (i) the investment process or strategies employed in the management of the fund's assets; (ii) the fees and expenses paid by shareholders; (iii) the nature, extent or quality of services provided under the fund's Advisory Contracts; or (iv) the day-to-day management of the fund or the persons primarily responsible for such management. The Board also considered that since its last approval of the fund's Advisory Contracts, FMR had provided additional information on the fund in support of the annual contract renewal process, including competitive analyses on total expenses and management fees and in-depth reviews of fund performance and fund profitability information. The Board also considered the findings of certain ad hoc committees that had been previously formed to discuss matters relevant to all of the Fidelity funds, including economies of scale, fall-out benefits and retail vs. institutional funds. The Board concluded that the fund's Advisory Contracts are fair and reasonable, and that the fund's Advisory Contracts should be renewed, without modification, through May 31, 2021, with the understanding that the Board will consider the annual renewal for a full one year period in May 2021.
In connection with its consideration of future renewals of the fund's Advisory Contracts, the Board will consider: (i) the nature, extent and quality of services provided to the funds, including shareholder and administrative services and investment performance; (ii) the competitiveness of the management fee and total expenses for the fund; (iii) the costs of the services and profitability, including the revenues earned and the expenses incurred in conducting the business of developing, marketing, distributing, managing, administering, and servicing the fund and its shareholders, to the extent applicable; and (iv) whether there have been economies of scale in respect of the Fidelity funds, whether the Fidelity funds (including the fund) have appropriately benefited from any such economies of scale, and whether there is the potential for realization of any further economies.
Based on its evaluation of all of the conclusions noted above, and after considering all factors it believed relevant, the Board ultimately concluded that the fund's management fee structure is fair and reasonable, and that the continuation of the fund's Advisory Contracts should be approved for four months from February 1, 2021 through May 31, 2021.
Liquidity Risk Management Program
The Securities and Exchange Commission adopted Rule 22e-4 under the Investment Company Act of 1940 (the Liquidity Rule) to promote effective liquidity risk management throughout the open-end investment company industry, thereby reducing the risk that funds will be unable to meet their redemption obligations and mitigating dilution of the interests of fund shareholders.
The Fund has adopted and implemented a liquidity risk management program pursuant to the Liquidity Rule (the Program) effective December 1, 2018. The Program is reasonably designed to assess and manage the Fund’s liquidity risk and to comply with the requirements of the Liquidity Rule. The Fund’s Board of Trustees (the Board) has designated the Fund’s investment adviser as administrator of the Program. The Fidelity advisers have established a Liquidity Risk Management Committee (the LRM Committee) to manage the Program for each of the Fidelity Funds. The LRM Committee monitors the adequacy and effectiveness of implementation of the Program and on a periodic basis assesses each Fund’s liquidity risk based on a variety of factors including (1) the Fund’s investment strategy, (2) portfolio liquidity and cash flow projections during normal and reasonably foreseeable stressed conditions, (3) shareholder redemptions, (4) borrowings and other funding sources and (5) in the case of exchange-traded funds, certain additional factors including the effect of the Fund’s prices and spreads, market participants, and basket compositions on the overall liquidity of the Fund’s portfolio, as applicable.
In accordance with the Program, each of the Fund’s portfolio investments is classified into one of four liquidity categories described below based on a determination of a reasonable expectation for how long it would take to convert the investment to cash (or sell or dispose of the investment) without significantly changing its market value.
- Highly liquid investments – cash or convertible to cash within three business days or less
- Moderately liquid investments – convertible to cash in three to seven calendar days
- Less liquid investments – can be sold or disposed of, but not settled, within seven calendar days
- Illiquid investments – cannot be sold or disposed of within seven calendar days
Liquidity classification determinations take into account a variety of factors including various market, trading and investment-specific considerations, as well as market depth, and generally utilize analysis from a third-party liquidity metrics service.
The Liquidity Rule places a 15% limit on a fund’s illiquid investments and requires funds that do not primarily hold assets that are highly liquid investments to determine and maintain a minimum percentage of the fund’s net assets to be invested in highly liquid investments (highly liquid investment minimum or HLIM). The Program includes provisions reasonably designed to comply with the 15% limit on illiquid investments and for determining, periodically reviewing and complying with the HLIM requirement as applicable.
At a recent meeting of the Fund’s Board of Trustees, the LRM Committee provided a written report to the Board pertaining to the operation, adequacy, and effectiveness of implementation of the Program for the annual period from December 1, 2019 through November 30, 2020. The report concluded that the Program has been implemented and is operating effectively and is reasonably designed to assess and manage the Fund’s liquidity risk.
Proxy Voting Results
A special meeting of shareholders was held on June 9, 2020. The results of votes taken among shareholders on the proposal before them are reported below. Each vote reported represents one dollar of net asset value held on the record date for the meeting.
PROPOSAL 1
To elect a Board of Trustees.
| | # of
Votes | % of
Votes |
| Dennis J. Dirks |
| Affirmative | 10,061,430,446.439 | 92.048 |
| Withheld | 869,148,916.701 | 7.952 |
| TOTAL | 10,930,579,363.140 | 100.000 |
| Donald F. Donahue |
| Affirmative | 10,083,461,374.401 | 92.250 |
| Withheld | 847,117,988.739 | 7.750 |
| TOTAL | 10,930,579,363.140 | 100.000 |
| Bettina Doulton |
| Affirmative | 10,118,193,283.037 | 92.568 |
| Withheld | 812,386,080.103 | 7.432 |
| TOTAL | 10,930,579,363.140 | 100.000 |
| Vicki L. Fuller |
| Affirmative | 10,176,147,138.465 | 93.098 |
| Withheld | 754,432,224.675 | 6.902 |
| TOTAL | 10,930,579,363.140 | 100.00 |
| Patricia L. Kampling |
| Affirmative | 10,064,771,576.919 | 92.079 |
| Withheld | 865,807,786.221 | 7.921 |
| TOTAL | 10,930,579,363.140 | 100.000 |
| Alan J. Lacy |
| Affirmative | 9,940,858,884.420 | 90.945 |
| Withheld | 989,720,478.720 | 9.055 |
| TOTAL | 10,930,579,363.140 | 100.000 |
| Ned C. Lautenbach |
| Affirmative | 9,912,987,477.934 | 90.690 |
| Withheld | 1,017,591,885.206 | 9.310 |
| TOTAL | 10,930,579,363.140 | 100.000 |
| Robert A. Lawrence |
| Affirmative | 10,045,804,273.831 | 91.906 |
| Withheld | 884,775,089.309 | 8.094 |
| TOTAL | 10,930,579,363.140 | 100.000 |
| Joseph Mauriello |
| Affirmative | 9,973,528,703.577 | 91.244 |
| Withheld | 957,050,659.563 | 8.756 |
| TOTAL | 10,930,579,363.140 | 100.000 |
| Cornelia M. Small |
| Affirmative | 10,022,576,250.072 | 91.693 |
| Withheld | 908,003,113.068 | 8.307 |
| TOTAL | 10,930,579,363.140 | 100.000 |
| Garnett A. Smith |
| Affirmative | 9,995,148,303.253 | 91.442 |
| Withheld | 935,431,059.887 | 8.558 |
| TOTAL | 10,930,579,363.140 | 100.000 |
| David M. Thomas |
| Affirmative | 9,998,808,602.280 | 91.476 |
| Withheld | 931,770,760.860 | 8.524 |
| TOTAL | 10,930,579,363.140 | 100.000 |
| Susan Tomasky |
| Affirmative | 10,103,706,791.914 | 92.435 |
| Withheld | 826,872,571.226 | 7.565 |
| TOTAL | 10,930,579,363.140 | 100.000 |
| Michael E. Wiley |
| Affirmative | 10,003,968,980.833 | 91.523 |
| Withheld | 926,610,382.307 | 8.477 |
| TOTAL | 10,930,579,363.140 | 100.000 |
|
| Proposal 1 reflects trust wide proposal and voting results. |
MAG-K6-ANN-0521
1.9893883.101