Fidelity® Magellan® Fund
Semi-Annual Report
September 30, 2021


Contents
To view a fund's proxy voting guidelines and proxy voting record for the 12-month period ended June 30, visit http://www.fidelity.com/proxyvotingresults or visit the Securities and Exchange Commission's (SEC) web site at http://www.sec.gov.
You may also call 1-800-544-8544 if you’re an individual investing directly with Fidelity, call 1-800-835-5092 if you’re a plan sponsor or participant with Fidelity as your recordkeeper or call 1-877-208-0098 on institutional accounts or if you’re an advisor or invest through one to request a free copy of the proxy voting guidelines.
Standard & Poor's, S&P and S&P 500 are registered service marks of The McGraw-Hill Companies, Inc. and have been licensed for use by Fidelity Distributors Corporation.
Other third-party marks appearing herein are the property of their respective owners.
All other marks appearing herein are registered or unregistered trademarks or service marks of FMR LLC or an affiliated company. © 2021 FMR LLC. All rights reserved.
This report and the financial statements contained herein are submitted for the general information of the shareholders of the Fund. This report is not authorized for distribution to prospective investors in the Fund unless preceded or accompanied by an effective prospectus.
A fund files its complete schedule of portfolio holdings with the SEC for the first and third quarters of each fiscal year on Form N-PORT. Forms N-PORT are available on the SEC’s web site at http://www.sec.gov. A fund's Forms N-PORT may be reviewed and copied at the SEC’s Public Reference Room in Washington, DC. Information regarding the operation of the SEC's Public Reference Room may be obtained by calling 1-800-SEC-0330.
For a complete list of a fund's portfolio holdings, view the most recent holdings listing, semiannual report, or annual report on Fidelity's web site at http://www.fidelity.com, http://www.institutional.fidelity.com, or http://www.401k.com, as applicable.
NOT FDIC INSURED •MAY LOSE VALUE •NO BANK GUARANTEE
Neither the Fund nor Fidelity Distributors Corporation is a bank.
Note to Shareholders:
Early in 2020, the outbreak and spread of COVID-19 emerged as a public health emergency that had a major influence on financial markets, primarily based on its impact on the global economy and corporate earnings. On March 11, 2020, the World Health Organization declared the COVID-19 outbreak a pandemic, citing sustained risk of further global spread. The pandemic prompted a number of measures to limit the spread of COVID-19, including travel and border restrictions, quarantines, and restrictions on large gatherings. In turn, these resulted in lower consumer activity, diminished demand for a wide range of products and services, disruption in manufacturing and supply chains, and – given the wide variability in outcomes regarding the outbreak – significant market uncertainty and volatility. To help stem the turmoil, the U.S. government took unprecedented action – in concert with the U.S. Federal Reserve and central banks around the world – to help support consumers, businesses, and the broader economy, and to limit disruption to the financial system.
In general, the overall impact of the pandemic lessened in 2021, amid a resilient economy and widespread distribution of three COVID-19 vaccines granted emergency use authorization from the U.S. Food and Drug Administration (FDA) early in the year. Still, the situation remains dynamic, and the extent and duration of its influence on financial markets and the economy is highly uncertain, due in part to a recent spike in cases based on highly contagious variants of the coronavirus.
Extreme events such as the COVID-19 crisis are exogenous shocks that can have significant adverse effects on mutual funds and their investments. Although multiple asset classes may be affected by market disruption, the duration and impact may not be the same for all types of assets. Fidelity is committed to helping you stay informed amid news about COVID-19 and during increased market volatility, and we continue to take extra steps to be responsive to customer needs. We encourage you to visit us online, where we offer ongoing updates, commentary, and analysis on the markets and our funds.
Investment Summary (Unaudited)
Top Ten Stocks as of September 30, 2021
| | % of fund's net assets |
| Apple, Inc. | 6.9 |
| Microsoft Corp. | 6.8 |
| Amazon.com, Inc. | 4.8 |
| Facebook, Inc. Class A | 3.1 |
| Alphabet, Inc. Class A | 2.6 |
| Alphabet, Inc. Class C | 2.5 |
| NVIDIA Corp. | 2.3 |
| UnitedHealth Group, Inc. | 1.9 |
| Visa, Inc. Class A | 1.9 |
| The Home Depot, Inc. | 1.8 |
| | 34.6 |
Top Five Market Sectors as of September 30, 2021
| | % of fund's net assets |
| Information Technology | 41.1 |
| Communication Services | 13.6 |
| Consumer Discretionary | 9.9 |
| Health Care | 9.3 |
| Industrials | 7.5 |
Asset Allocation (% of fund's net assets)
| As of September 30, 2021* |
| | Stocks | 97.8% |
| | Convertible Securities | 0.3% |
| | Short-Term Investments and Net Other Assets (Liabilities) | 1.9% |

* Foreign investments - 3.9%
Schedule of Investments September 30, 2021 (Unaudited)
Showing Percentage of Net Assets
| Common Stocks - 97.8% | | | |
| | | Shares | Value (000s) |
| COMMUNICATION SERVICES - 13.6% | | | |
| Entertainment - 2.7% | | | |
| Netflix, Inc. (a) | | 816,008 | $498,042 |
| The Walt Disney Co. (a) | | 1,744,530 | 295,122 |
| | | | 793,164 |
| Interactive Media & Services - 8.2% | | | |
| Alphabet, Inc.: | | | |
| Class A (a) | | 284,731 | 761,234 |
| Class C (a) | | 277,325 | 739,157 |
| Facebook, Inc. Class A (a) | | 2,643,842 | 897,294 |
| | | | 2,397,685 |
| Media - 2.7% | | | |
| Charter Communications, Inc. Class A (a) | | 479,546 | 348,898 |
| Comcast Corp. Class A | | 8,005,137 | 447,727 |
| | | | 796,625 |
|
| TOTAL COMMUNICATION SERVICES | | | 3,987,474 |
|
| CONSUMER DISCRETIONARY - 9.9% | | | |
| Hotels, Restaurants & Leisure - 1.0% | | | |
| Hilton Worldwide Holdings, Inc. (a) | | 2,256,592 | 298,118 |
| Internet & Direct Marketing Retail - 4.8% | | | |
| Amazon.com, Inc. (a) | | 426,617 | 1,401,454 |
| Multiline Retail - 1.0% | | | |
| Dollar General Corp. | | 1,310,900 | 278,094 |
| Specialty Retail - 1.8% | | | |
| The Home Depot, Inc. | | 1,576,748 | 517,583 |
| Textiles, Apparel & Luxury Goods - 1.3% | | | |
| NIKE, Inc. Class B | | 2,697,380 | 391,740 |
|
| TOTAL CONSUMER DISCRETIONARY | | | 2,886,989 |
|
| CONSUMER STAPLES - 2.4% | | | |
| Food & Staples Retailing - 1.4% | | | |
| Costco Wholesale Corp. | | 956,695 | 429,891 |
| Personal Products - 1.0% | | | |
| Estee Lauder Companies, Inc. Class A | | 948,543 | 284,497 |
|
| TOTAL CONSUMER STAPLES | | | 714,388 |
|
| FINANCIALS - 7.2% | | | |
| Capital Markets - 5.1% | | | |
| BlackRock, Inc. Class A | | 405,100 | 339,741 |
| Intercontinental Exchange, Inc. | | 370,751 | 42,570 |
| Moody's Corp. | | 871,088 | 309,332 |
| MSCI, Inc. | | 543,045 | 330,356 |
| S&P Global, Inc. | | 845,749 | 359,350 |
| T. Rowe Price Group, Inc. | | 573,263 | 112,761 |
| | | | 1,494,110 |
| Insurance - 2.1% | | | |
| Arthur J. Gallagher & Co. | | 1,894,799 | 281,662 |
| Marsh & McLennan Companies, Inc. | | 2,224,911 | 336,918 |
| | | | 618,580 |
|
| TOTAL FINANCIALS | | | 2,112,690 |
|
| HEALTH CARE - 9.3% | | | |
| Health Care Equipment & Supplies - 3.8% | | | |
| Danaher Corp. | | 1,434,283 | 436,653 |
| IDEXX Laboratories, Inc. (a) | | 499,136 | 310,413 |
| Intuitive Surgical, Inc. (a) | | 357,871 | 355,777 |
| | | | 1,102,843 |
| Health Care Providers & Services - 1.9% | | | |
| UnitedHealth Group, Inc. | | 1,441,748 | 563,349 |
| Health Care Technology - 0.9% | | | |
| Veeva Systems, Inc. Class A (a) | | 875,813 | 252,383 |
| Life Sciences Tools & Services - 1.5% | | | |
| Thermo Fisher Scientific, Inc. | | 788,299 | 450,379 |
| Pharmaceuticals - 1.2% | | | |
| Zoetis, Inc. Class A | | 1,787,276 | 346,982 |
|
| TOTAL HEALTH CARE | | | 2,715,936 |
|
| INDUSTRIALS - 7.5% | | | |
| Aerospace & Defense - 1.8% | | | |
| HEICO Corp. Class A | | 2,174,235 | 257,495 |
| TransDigm Group, Inc. (a) | | 456,470 | 285,097 |
| | | | 542,592 |
| Electrical Equipment - 0.9% | | | |
| AMETEK, Inc. | | 2,093,756 | 259,647 |
| Industrial Conglomerates - 0.9% | | | |
| Roper Technologies, Inc. | | 606,086 | 270,393 |
| Professional Services - 3.9% | | | |
| Equifax, Inc. | | 1,113,457 | 282,172 |
| IHS Markit Ltd. | | 2,648,673 | 308,888 |
| TransUnion Holding Co., Inc. | | 2,224,753 | 249,862 |
| Verisk Analytics, Inc. | | 1,456,111 | 291,615 |
| | | | 1,132,537 |
|
| TOTAL INDUSTRIALS | | | 2,205,169 |
|
| INFORMATION TECHNOLOGY - 40.8% | | | |
| Electronic Equipment & Components - 1.5% | | | |
| Amphenol Corp. Class A | | 4,016,324 | 294,115 |
| Teledyne Technologies, Inc. (a) | | 357,107 | 153,406 |
| | | | 447,521 |
| IT Services - 6.9% | | | |
| Accenture PLC Class A | | 1,402,587 | 448,716 |
| MasterCard, Inc. Class A | | 1,458,825 | 507,204 |
| PayPal Holdings, Inc. (a) | | 1,862,929 | 484,753 |
| Visa, Inc. Class A | | 2,516,330 | 560,513 |
| | | | 2,001,186 |
| Semiconductors & Semiconductor Equipment - 7.9% | | | |
| Analog Devices, Inc. | | 1,845,658 | 309,111 |
| Applied Materials, Inc. | | 2,617,688 | 336,975 |
| KLA Corp. | | 863,766 | 288,938 |
| Lam Research Corp. | | 535,204 | 304,611 |
| NVIDIA Corp. | | 3,287,780 | 681,097 |
| Texas Instruments, Inc. | | 2,065,110 | 396,935 |
| | | | 2,317,667 |
| Software - 17.6% | | | |
| Adobe, Inc. (a) | | 821,292 | 472,834 |
| ANSYS, Inc. (a) | | 790,329 | 269,068 |
| Autodesk, Inc. (a) | | 1,023,280 | 291,809 |
| Cadence Design Systems, Inc. (a) | | 1,955,810 | 296,188 |
| Fortinet, Inc. (a) | | 972,695 | 284,066 |
| Intuit, Inc. | | 749,469 | 404,346 |
| Microsoft Corp. | | 7,008,023 | 1,975,702 |
| Salesforce.com, Inc. (a) | | 1,716,820 | 465,636 |
| ServiceNow, Inc. (a) | | 617,420 | 384,202 |
| Synopsys, Inc. (a) | | 1,018,676 | 305,002 |
| | | | 5,148,853 |
| Technology Hardware, Storage & Peripherals - 6.9% | | | |
| Apple, Inc. | | 14,245,744 | 2,015,773 |
|
| TOTAL INFORMATION TECHNOLOGY | | | 11,931,000 |
|
| MATERIALS - 2.3% | | | |
| Chemicals - 2.3% | | | |
| Linde PLC | | 1,288,486 | 378,016 |
| Sherwin-Williams Co. | | 1,088,461 | 304,475 |
| | | | 682,491 |
| REAL ESTATE - 3.4% | | | |
| Equity Real Estate Investment Trusts (REITs) - 3.3% | | | |
| American Tower Corp. | | 1,261,500 | 334,815 |
| Equinix, Inc. | | 368,700 | 291,321 |
| Prologis (REIT), Inc. | | 2,668,028 | 334,651 |
| | | | 960,787 |
| Real Estate Management & Development - 0.1% | | | |
| Rialto Real Estate Fund LP(a)(b)(c)(d)(e) | | 500,000 | 30 |
| RREF CMBS AIV, LP(b)(c)(d)(e)(f) | | 500,000 | 18,889 |
| RREF Midtown Colony REIT, Inc.(a)(b)(c)(d)(e)(g) | | 500,000 | 0 |
| | | | 18,919 |
|
| TOTAL REAL ESTATE | | | 979,706 |
|
| UTILITIES - 1.4% | | | |
| Electric Utilities - 1.4% | | | |
| NextEra Energy, Inc. | | 5,026,993 | 394,719 |
| TOTAL COMMON STOCKS | | | |
| (Cost $14,597,336) | | | 28,610,562 |
|
| Convertible Preferred Stocks - 0.3% | | | |
| CONSUMER DISCRETIONARY - 0.0% | | | |
| Automobiles - 0.0% | | | |
| Bird Rides, Inc. Series C1 (a)(d) | | 647,057 | 4,853 |
| INFORMATION TECHNOLOGY - 0.3% | | | |
| Software - 0.3% | | | |
| Malwarebytes Corp. Series B (a)(d)(e) | | 3,373,494 | 72,665 |
| TOTAL CONVERTIBLE PREFERRED STOCKS | | | |
| (Cost $42,600) | | | 77,518 |
|
| Money Market Funds - 1.7% | | | |
| Fidelity Cash Central Fund 0.06%(h) | | | |
| (Cost $508,043) | | 507,941,017 | 508,043 |
| TOTAL INVESTMENT IN SECURITIES - 99.8% | | | |
| (Cost $15,147,979) | | | 29,196,123 |
| NET OTHER ASSETS (LIABILITIES) - 0.2% | | | 47,517 |
| NET ASSETS - 100% | | | $29,243,640 |
Legend
(a) Non-income producing
(b) Affiliated company
(c) Investment is owned by a wholly-owned subsidiary (Subsidiary) that is treated as a corporation for U.S. tax purposes.
(d) Restricted securities (including private placements) - Investment in securities not registered under the Securities Act of 1933 (excluding 144A issues). At the end of the period, the value of restricted securities (excluding 144A issues) amounted to $96,437,000 or 0.3% of net assets.
(e) Level 3 security
(f) Investment represents the Fund's ownership interest in a limited partnership, which is under common ownership and management with Rialto Real Estate Fund, LP.
(g) Investment represents the Fund's ownership interest in a real estate investment trust, which is under common ownership and management with Rialto Real Estate Fund, LP.
(h) Affiliated fund that is generally available only to investment companies and other accounts managed by Fidelity Investments. The rate quoted is the annualized seven-day yield of the fund at period end. A complete unaudited listing of the fund's holdings as of its most recent quarter end is available upon request. In addition, each Fidelity Central Fund's financial statements are available on the SEC's website or upon request.
Additional information on each restricted holding is as follows:
| Security | Acquisition Date | Acquisition Cost (000s) |
| Bird Rides, Inc. Series C1 | 12/21/18 | $7,600 |
| Malwarebytes Corp. Series B | 12/21/15 | $35,000 |
| Rialto Real Estate Fund LP | 2/24/11-8/17/12 | $33,049 |
| RREF CMBS AIV, LP | 8/10/11-8/17/12 | 15,528 |
| RREF Midtown Colony REIT, Inc. | 12/31/12 | 1,423 |
Affiliated Central Funds
Fiscal year to date information regarding the Fund's investments in Fidelity Central Funds, including the ownership percentage, is presented below.
| Fund (Amounts in thousands) | Value, beginning of period | Purchases | Sales Proceeds | Dividend Income | Realized Gain/Loss | Change in Unrealized appreciation (depreciation) | Value, end of period | % ownership, end of period |
| Fidelity Cash Central Fund 0.06% | $170,049 | $2,353,899 | $2,015,905 | $72 | $-- | $-- | $508,043 | 0.7% |
| Fidelity Securities Lending Cash Central Fund 0.06% | 119,335 | 810,219 | 929,554 | 14 | -- | -- | -- | 0.0% |
| Total | $289,384 | $3,164,118 | $2,945,459 | $86 | $-- | $-- | $508,043 | |
Amounts in the income column in the above table include any capital gain distributions from underlying funds, which are presented in the corresponding line-item in the Statement of Operations, if applicable. Amount for Fidelity Securities Lending Cash Central Fund represents the income earned on investing cash collateral, less rebates paid to borrowers and any lending agent fees associated with the loan, plus any premium payments received for lending certain types of securities.
Other Affiliated Issuers
An affiliated company is a company in which the Fund has ownership of at least 5% of the voting securities. Fiscal year to date transactions with companies which are or were affiliates are as follows:
| Affiliate (Amounts in thousands) | Value, beginning of period | Purchases | Sales Proceeds(a) | Dividend Income | Realized Gain (loss) | Change in Unrealized appreciation (depreciation) | Value, end of period |
| Rialto Real Estate Fund LP | $39 | $-- | $-- | $-- | $-- | $(9) | $30 |
| RREF CMBS AIV, LP | 20,891 | -- | -- | 1,498 | -- | (2,002) | 18,889 |
| RREF Midtown Colony REIT, Inc. | -- | -- | -- | -- | -- | -- | -- |
| Total | $20,930 | $-- | $-- | $1,498 | $-- | $(2,011) | $18,919 |
(a) Includes the value of securities delivered through in-kind transactions, if applicable.
Investment Valuation
The following is a summary of the inputs used, as of September 30, 2021, involving the Fund's assets and liabilities carried at fair value. The inputs or methodology used for valuing securities may not be an indication of the risk associated with investing in those securities. For more information on valuation inputs, and their aggregation into the levels used below, please refer to the Investment Valuation section in the accompanying Notes to Financial Statements.
| | Valuation Inputs at Reporting Date: |
| Description | Total | Level 1 | Level 2 | Level 3 |
| (Amounts in thousands) | | | | |
| Investments in Securities: | | | | |
| Equities: | | | | |
| Communication Services | $3,987,474 | $3,987,474 | $-- | $-- |
| Consumer Discretionary | 2,891,842 | 2,886,989 | 4,853 | -- |
| Consumer Staples | 714,388 | 714,388 | -- | -- |
| Financials | 2,112,690 | 2,112,690 | -- | -- |
| Health Care | 2,715,936 | 2,715,936 | -- | -- |
| Industrials | 2,205,169 | 2,205,169 | -- | -- |
| Information Technology | 12,003,665 | 11,931,000 | -- | 72,665 |
| Materials | 682,491 | 682,491 | -- | -- |
| Real Estate | 979,706 | 960,787 | -- | 18,919 |
| Utilities | 394,719 | 394,719 | -- | -- |
| Money Market Funds | 508,043 | 508,043 | -- | -- |
| Total Investments in Securities: | $29,196,123 | $29,099,686 | $4,853 | $91,584 |
See accompanying notes which are an integral part of the financial statements.
Financial Statements
Statement of Assets and Liabilities
| Amounts in thousands (except per-share amounts) | | September 30, 2021 (Unaudited) |
| Assets | | |
Investment in securities, at value — See accompanying schedule:
Unaffiliated issuers (cost $14,607,691) | $28,669,161 | |
| Fidelity Central Funds (cost $508,043) | 508,043 | |
| Other affiliated issuers (cost $32,245) | 18,919 | |
| Total Investment in Securities (cost $15,147,979) | | $29,196,123 |
| Receivable for investments sold | | 248,786 |
| Receivable for fund shares sold | | 2,066 |
| Dividends receivable | | 4,245 |
| Distributions receivable from Fidelity Central Funds | | 20 |
| Prepaid expenses | | 42 |
| Other receivables | | 2,156 |
| Total assets | | 29,453,438 |
| Liabilities | | |
| Payable for investments purchased | $182,476 | |
| Payable for fund shares redeemed | 8,182 | |
| Accrued management fee | 14,283 | |
| Other affiliated payables | 2,793 | |
| Other payables and accrued expenses | 2,064 | |
| Total liabilities | | 209,798 |
| Net Assets | | $29,243,640 |
| Net Assets consist of: | | |
| Paid in capital | | $14,552,782 |
| Total accumulated earnings (loss) | | 14,690,858 |
| Net Assets | | $29,243,640 |
| Net Asset Value and Maximum Offering Price | | |
| Magellan: | | |
| Net Asset Value, offering price and redemption price per share ($28,142,010 ÷ 1,985,002 shares) | | $14.18 |
| Class K: | | |
| Net Asset Value, offering price and redemption price per share ($1,101,630 ÷ 77,745 shares) | | $14.17 |
See accompanying notes which are an integral part of the financial statements.
Statement of Operations
| Amounts in thousands | | Six months ended September 30, 2021 (Unaudited) |
| Investment Income | | |
| Dividends (including $1,498 earned from other affiliated issuers) | | $85,761 |
| Income from Fidelity Central Funds (including $14 from security lending) | | 86 |
| Total income | | 85,847 |
| Expenses | | |
| Management fee | | |
| Basic fee | $72,945 | |
| Performance adjustment | 3,443 | |
| Transfer agent fees | 14,895 | |
| Accounting fees | 974 | |
| Custodian fees and expenses | 84 | |
| Independent trustees' fees and expenses | 49 | |
| Registration fees | 70 | |
| Audit | 48 | |
| Legal | 26 | |
| Miscellaneous | 50 | |
| Total expenses before reductions | 92,584 | |
| Expense reductions | (459) | |
| Total expenses after reductions | | 92,125 |
| Net investment income (loss) | | (6,278) |
| Realized and Unrealized Gain (Loss) | | |
| Net realized gain (loss) on: | | |
| Investment securities: | | |
| Unaffiliated issuers | 656,856 | |
| Foreign currency transactions | 12 | |
| Total net realized gain (loss) | | 656,868 |
| Change in net unrealized appreciation (depreciation) on: | | |
| Investment securities: | | |
| Unaffiliated issuers | 2,666,245 | |
| Affiliated issuers | (2,011) | |
| Assets and liabilities in foreign currencies | (8) | |
| Total change in net unrealized appreciation (depreciation) | | 2,664,226 |
| Net gain (loss) | | 3,321,094 |
| Net increase (decrease) in net assets resulting from operations | | $3,314,816 |
See accompanying notes which are an integral part of the financial statements.
Statement of Changes in Net Assets
| Amounts in thousands | Six months ended September 30, 2021 (Unaudited) | Year ended March 31, 2021 |
| Increase (Decrease) in Net Assets | | |
| Operations | | |
| Net investment income (loss) | $(6,278) | $(635) |
| Net realized gain (loss) | 656,868 | 1,417,262 |
| Change in net unrealized appreciation (depreciation) | 2,664,226 | 6,111,967 |
| Net increase (decrease) in net assets resulting from operations | 3,314,816 | 7,528,594 |
| Distributions to shareholders | (1,067,690) | (66,225) |
| Share transactions - net increase (decrease) | 5,011,697 | (1,167,205) |
| Total increase (decrease) in net assets | 7,258,823 | 6,295,164 |
| Net Assets | | |
| Beginning of period | 21,984,817 | 15,689,653 |
| End of period | $29,243,640 | $21,984,817 |
See accompanying notes which are an integral part of the financial statements.
Financial Highlights
Fidelity Magellan Fund
| | Six months ended (Unaudited) September 30, | Years endedMarch 31, | | | | |
| | 2021 | 2021 | 2020 | 2019 A | 2018 A | 2017 A |
| Selected Per–Share Data | | | | | | |
| Net asset value, beginning of period | $13.11 | $8.81 | $10.23 | $10.57 | $9.72 | $8.75 |
| Income from Investment Operations | | | | | | |
| Net investment income (loss)B | –C | –C | .04 | .06 | .08D | .06 |
| Net realized and unrealized gain (loss) | 1.70 | 4.34 | .06 | .57 | 1.78 | 1.18 |
| Total from investment operations | 1.70 | 4.34 | .10 | .63 | 1.86 | 1.24 |
| Distributions from net investment income | – | – | (.05) | (.06) | (.08) | (.06) |
| Distributions from net realized gain | (.63) | (.04) | (1.47) | (.91) | (.93) | (.21) |
| Total distributions | (.63) | (.04) | (1.52) | (.97) | (1.01) | (.27) |
| Net asset value, end of period | $14.18 | $13.11 | $8.81 | $10.23 | $10.57 | $9.72 |
| Total ReturnE,F | 13.34% | 49.27% | (.67)% | 6.51% | 20.16% | 14.46% |
| Ratios to Average Net AssetsG,H | | | | | | |
| Expenses before reductions | .67%I | .79% | .76% | .67% | .69% | .68% |
| Expenses net of fee waivers, if any | .67%I | .79% | .76% | .67% | .69% | .67% |
| Expenses net of all reductions | .67%I | .78% | .76% | .66% | .69% | .67% |
| Net investment income (loss) | (.05)%I | (.01)% | .38% | .60% | .79%D | .68% |
| Supplemental Data | | | | | | |
| Net assets, end of period (in millions) | $28,142 | $21,002 | $14,668 | $14,729 | $14,906 | $13,467 |
| Portfolio turnover rateJ | 35%I,K,L | 56%L | 106%L | 42%L | 53%L | 51%L |
A Per share amounts have been adjusted to reflect the impact of the 10 for 1 share split that occurred on August 10, 2018.
B Calculated based on average shares outstanding during the period.
C Amount represents less than $.005 per share.
D Net investment income per share reflects one or more large, non-recurring dividend(s) which amounted to $.02 per share. Excluding such non-recurring dividend(s), the ratio of net investment income (loss) to average net assets would have been .57%.
E Total returns for periods of less than one year are not annualized.
F Total returns would have been lower if certain expenses had not been reduced during the applicable periods shown.
G Fees and expenses of any underlying mutual funds or exchange-traded funds (ETFs) are not included in the Fund's expense ratio. The Fund indirectly bears its proportionate share of these expenses. For additional expense information related to investments in Fidelity Central Funds, please refer to the "Investments in Fidelity Central Funds" note found in the Notes to Financial Statements section of the most recent Annual or Semi-Annual report.
H Expense ratios reflect operating expenses of the class. Expenses before reductions do not reflect amounts reimbursed, waived, or reduced through arrangements with the investment adviser, brokerage services, or other offset arrangements, if applicable, and do not represent the amount paid by the class during periods when reimbursements, waivers or reductions occur.
I Annualized
J Amount does not include the portfolio activity of any underlying mutual funds or exchange-traded funds (ETFs).
K The portfolio turnover rate does not include the assets acquired in the merger.
L Portfolio turnover rate excludes securities received or delivered in-kind.
See accompanying notes which are an integral part of the financial statements.
Fidelity Magellan Fund Class K
| | Six months ended (Unaudited) September 30, | Years endedMarch 31, | | | | |
| | 2021 | 2021 | 2020 | 2019 A | 2018 A | 2017 A |
| Selected Per–Share Data | | | | | | |
| Net asset value, beginning of period | $13.09 | $8.79 | $10.22 | $10.56 | $9.71 | $8.74 |
| Income from Investment Operations | | | | | | |
| Net investment income (loss)B | –C | .01 | .05 | .07 | .09D | .07 |
| Net realized and unrealized gain (loss) | 1.71 | 4.33 | .05 | .57 | 1.78 | 1.18 |
| Total from investment operations | 1.71 | 4.34 | .10 | .64 | 1.87 | 1.25 |
| Distributions from net investment income | – | – | (.06) | (.07) | (.09) | (.06) |
| Distributions from net realized gain | (.63) | (.04) | (1.47) | (.91) | (.93) | (.22) |
| Total distributions | (.63) | (.04) | (1.53) | (.98) | (1.02) | (.28) |
| Net asset value, end of period | $14.17 | $13.09 | $8.79 | $10.22 | $10.56 | $9.71 |
| Total ReturnE,F | 13.43% | 49.38% | (.71)% | 6.63% | 20.27% | 14.57% |
| Ratios to Average Net AssetsG,H | | | | | | |
| Expenses before reductions | .60%I | .71% | .68% | .58% | .61% | .58% |
| Expenses net of fee waivers, if any | .60%I | .71% | .68% | .58% | .60% | .58% |
| Expenses net of all reductions | .60%I | .71% | .68% | .58% | .60% | .58% |
| Net investment income (loss) | .02%I | .07% | .46% | .69% | .88%D | .78% |
| Supplemental Data | | | | | | |
| Net assets, end of period (in millions) | $1,102 | $983 | $1,021 | $1,590 | $2,271 | $1,893 |
| Portfolio turnover rateJ | 35%I,K,L | 56%L | 106%L | 42%L | 53%L | 51%L |
A Per share amounts have been adjusted to reflect the impact of the 10 for 1 share split that occurred on August 10, 2018.
B Calculated based on average shares outstanding during the period.
C Amount represents less than $.005 per share.
D Net investment income per share reflects one or more large, non-recurring dividend(s) which amounted to $.02 per share. Excluding such non-recurring dividend(s), the ratio of net investment income (loss) to average net assets would have been .65%.
E Total returns for periods of less than one year are not annualized.
F Total returns would have been lower if certain expenses had not been reduced during the applicable periods shown.
G Fees and expenses of any underlying mutual funds or exchange-traded funds (ETFs) are not included in the Fund's expense ratio. The Fund indirectly bears its proportionate share of these expenses. For additional expense information related to investments in Fidelity Central Funds, please refer to the "Investments in Fidelity Central Funds" note found in the Notes to Financial Statements section of the most recent Annual or Semi-Annual report.
H Expense ratios reflect operating expenses of the class. Expenses before reductions do not reflect amounts reimbursed, waived, or reduced through arrangements with the investment adviser, brokerage services, or other offset arrangements, if applicable, and do not represent the amount paid by the class during periods when reimbursements, waivers or reductions occur.
I Annualized
J Amount does not include the portfolio activity of any underlying mutual funds or exchange-traded funds (ETFs).
K The portfolio turnover rate does not include the assets acquired in the merger.
L Portfolio turnover rate excludes securities received or delivered in-kind.
See accompanying notes which are an integral part of the financial statements.
Notes to Financial Statements (Unaudited)
For the period ended September 30, 2021
(Amounts in thousands except percentages)
1. Organization.
Fidelity Magellan Fund (the Fund) is a fund of Fidelity Magellan Fund (the Trust) and is authorized to issue an unlimited number of shares. The Trust is registered under the Investment Company Act of 1940, as amended (the 1940 Act), as an open-end management investment company organized as a Massachusetts business trust. The Fund offers Magellan and Class K shares, each of which has equal rights as to assets and voting privileges. Each class has exclusive voting rights with respect to matters that affect that class.
2. Investments in Fidelity Central Funds.
Funds may invest in Fidelity Central Funds, which are open-end investment companies generally available only to other investment companies and accounts managed by the investment adviser and its affiliates. The Schedule of Investments lists any Fidelity Central Funds held as an investment as of period end, but does not include the underlying holdings of each Fidelity Central Fund. An investing fund indirectly bears its proportionate share of the expenses of the underlying Fidelity Central Funds.
Based on its investment objective, each Fidelity Central Fund may invest or participate in various investment vehicles or strategies that are similar to those of the investing fund. These strategies are consistent with the investment objectives of the investing fund and may involve certain economic risks which may cause a decline in value of each of the Fidelity Central Funds and thus a decline in the value of the investing fund.
| Fidelity Central Fund | Investment Manager | Investment Objective | Investment Practices | Expense Ratio(a) |
| Fidelity Money Market Central Funds | Fidelity Management & Research Company LLC (FMR) | Each fund seeks to obtain a high level of current income consistent with the preservation of capital and liquidity. | Short-term Investments | Less than .005% |
(a) Expenses expressed as a percentage of average net assets and are as of each underlying Central Fund's most recent annual or semi-annual shareholder report.
A complete unaudited list of holdings for each Fidelity Central Fund is available upon request or at the Securities and Exchange Commission website at www.sec.gov. In addition, the financial statements of the Fidelity Central Funds which contain the significant accounting policies (including investment valuation policies) of those funds, and are not covered by the Report of Independent Registered Public Accounting Firm, are available on the Securities and Exchange Commission website or upon request.
3. Significant Accounting Policies.
The Fund is an investment company and applies the accounting and reporting guidance of the Financial Accounting Standards Board (FASB) Accounting Standards Codification Topic 946 Financial Services - Investment Companies. The financial statements have been prepared in conformity with accounting principles generally accepted in the United States of America (GAAP), which require management to make certain estimates and assumptions at the date of the financial statements. Actual results could differ from those estimates. Subsequent events, if any, through the date that the financial statements were issued have been evaluated in the preparation of the financial statements. The Fund's Schedule of Investments lists any underlying mutual funds or exchange-traded funds (ETFs) but does not include the underlying holdings of these funds. The following summarizes the significant accounting policies of the Fund:
Investment Valuation. Investments are valued as of 4:00 p.m. Eastern time on the last calendar day of the period. The Board of Trustees (the Board) has delegated the day to day responsibility for the valuation of the Fund's investments to the Fair Value Committee (the Committee) established by the Fund's investment adviser. In accordance with valuation policies and procedures approved by the Board, the Fund attempts to obtain prices from one or more third party pricing vendors or brokers to value its investments. When current market prices, quotations or currency exchange rates are not readily available or reliable, investments will be fair valued in good faith by the Committee, in accordance with procedures adopted by the Board. Factors used in determining fair value vary by investment type and may include market or investment specific events. The frequency with which these procedures are used cannot be predicted and they may be utilized to a significant extent. The Committee oversees the Fund's valuation policies and procedures and reports to the Board on the Committee's activities and fair value determinations. The Board monitors the appropriateness of the procedures used in valuing the Fund's investments and ratifies the fair value determinations of the Committee.
The Fund categorizes the inputs to valuation techniques used to value its investments into a disclosure hierarchy consisting of three levels as shown below:
- Level 1 – quoted prices in active markets for identical investments
- Level 2 – other significant observable inputs (including quoted prices for similar investments, interest rates, prepayment speeds, etc.)
- Level 3 – unobservable inputs (including the Fund's own assumptions based on the best information available)
Valuation techniques used to value the Fund's investments by major category are as follows:
Equity securities, including restricted securities, for which market quotations are readily available, are valued at the last reported sale price or official closing price as reported by a third party pricing vendor on the primary market or exchange on which they are traded and are categorized as Level 1 in the hierarchy. In the event there were no sales during the day or closing prices are not available, securities are valued at the last quoted bid price or may be valued using the last available price and are generally categorized as Level 2 in the hierarchy. For foreign equity securities, when market or security specific events arise, comparisons to the valuation of American Depositary Receipts (ADRs), futures contracts, Exchange-Traded Funds (ETFs) and certain indexes as well as quoted prices for similar securities may be used and would be categorized as Level 2 in the hierarchy. For equity securities, including restricted securities, where observable inputs are limited, assumptions about market activity and risk are used and these securities may be categorized as Level 3 in the hierarchy.
Investments in open-end mutual funds, including the Fidelity Central Funds, are valued at their closing net asset value (NAV) each business day and are categorized as Level 1 in the hierarchy.
Changes in valuation techniques may result in transfers in or out of an assigned level within the disclosure hierarchy. The aggregate value of investments by input level as of September 30, 2021 is included at the end of the Fund's Schedule of Investments.
Foreign Currency. Certain Funds may use foreign currency contracts to facilitate transactions in foreign-denominated securities. Gains and losses from these transactions may arise from changes in the value of the foreign currency or if the counterparties do not perform under the contracts' terms.
Foreign-denominated assets, including investment securities, and liabilities are translated into U.S. dollars at the exchange rates at period end. Purchases and sales of investment securities, income and dividends received, and expenses denominated in foreign currencies are translated into U.S. dollars at the exchange rate in effect on the transaction date.
The effects of exchange rate fluctuations on investments are included with the net realized and unrealized gain (loss) on investment securities. Other foreign currency transactions resulting in realized and unrealized gain (loss) are disclosed separately.
Investment Transactions and Income. For financial reporting purposes, the Fund's investment holdings and NAV include trades executed through the end of the last business day of the period. The NAV per share for processing shareholder transactions is calculated as of the close of business of the New York Stock Exchange (NYSE), normally 4:00 p.m. Eastern time and includes trades executed through the end of the prior business day. Gains and losses on securities sold are determined on the basis of identified cost and include proceeds received from litigation. Dividend income is recorded on the ex-dividend date, except for certain dividends from foreign securities where the ex-dividend date may have passed, which are recorded as soon as the Fund is informed of the ex-dividend date. Non-cash dividends included in dividend income, if any, are recorded at the fair market value of the securities received. Income and capital gain distributions from Fidelity Central Funds, if any, are recorded on the ex-dividend date. Investment income is recorded net of foreign taxes withheld where recovery of such taxes is uncertain.
Class Allocations and Expenses. Investment income, realized and unrealized capital gains and losses, common expenses of a fund, and certain fund-level expense reductions, if any, are allocated daily on a pro-rata basis to each class based on the relative net assets of each class to the total net assets of a fund. Each class differs with respect to transfer agent and distribution and service plan fees incurred, as applicable. Certain expense reductions may also differ by class, if applicable. For the reporting period, the allocated portion of income and expenses to each class as a percent of its average net assets may vary due to the timing of recording these transactions in relation to fluctuating net assets of the classes. Expenses directly attributable to a fund are charged to that fund. Expenses attributable to more than one fund are allocated among the respective funds on the basis of relative net assets or other appropriate methods. Expenses included in the accompanying financial statements reflect the expenses of that fund and do not include any expenses associated with any underlying mutual funds or exchange-traded funds. Although not included in a fund's expenses, a fund indirectly bears its proportionate share of these expenses through the net asset value of each underlying mutual fund or exchange-traded fund. Expense estimates are accrued in the period to which they relate and adjustments are made when actual amounts are known.
Deferred Trustee Compensation. Under a Deferred Compensation Plan (the Plan) for certain Funds, certain independent Trustees have elected to defer receipt of a portion of their annual compensation. Deferred amounts are invested in affiliated mutual funds, are marked-to-market and remain in a fund until distributed in accordance with the Plan. The investment of deferred amounts and the offsetting payable to the Trustees presented below are included in the accompanying Statement of Assets and Liabilities in other receivables and other payables and accrued expenses, as applicable.
| Fidelity Magellan Fund | $1,942 |
Income Tax Information and Distributions to Shareholders. Each year, the Fund intends to qualify as a regulated investment company under Subchapter M of the Internal Revenue Code, including distributing substantially all of its taxable income and realized gains. As a result, no provision for U.S. Federal income taxes is required. The Fund files a U.S. federal tax return, in addition to state and local tax returns as required. The Fund's federal income tax returns are subject to examination by the Internal Revenue Service (IRS) for a period of three fiscal years after they are filed. State and local tax returns may be subject to examination for an additional fiscal year depending on the jurisdiction. Foreign taxes are provided for based on the Fund's understanding of the tax rules and rates that exist in the foreign markets in which it invests.
Distributions are declared and recorded on the ex-dividend date. Income and capital gain distributions are declared separately for each class. Income and capital gain distributions are determined in accordance with income tax regulations, which may differ from GAAP.
Capital accounts within the financial statements are adjusted for permanent book-tax differences. These adjustments have no impact on net assets or the results of operations. Capital accounts are not adjusted for temporary book-tax differences which will reverse in a subsequent period.
Book-tax differences are primarily due to passive foreign investment companies (PFIC), redemptions in kind, partnerships, deferred Trustees compensation, net operating losses and losses deferred due to wash sales and excise tax regulations.
As of period end, the cost and unrealized appreciation (depreciation) in securities, and derivatives if applicable, for federal income tax purposes were as follows:
| Gross unrealized appreciation | $14,159,387 |
| Gross unrealized depreciation | (120,390) |
| Net unrealized appreciation (depreciation) | $14,038,997 |
| Tax cost | $15,157,126 |
Restricted Securities (including Private Placements). Funds may invest in securities that are subject to legal or contractual restrictions on resale. These securities generally may be resold in transactions exempt from registration or to the public if the securities are registered. Disposal of these securities may involve time-consuming negotiations and expense, and prompt sale at an acceptable price may be difficult. Information regarding restricted securities held at period end is included at the end of the Schedule of Investments, if applicable.
Consolidated Subsidiary. The Funds included in the table below hold certain investments through a wholly-owned subsidiary ("Subsidiary"), which may be subject to federal and state taxes upon disposition.
As of period end, investments in Subsidiaries were as follows:
| | $ Amount | % of Net Assets |
| Fidelity Magellan Fund | 18,919 | 0.1 |
The financial statements have been consolidated to include the Subsidiary accounts where applicable. Accordingly, all inter-company transactions and balances have been eliminated.
At period end, any estimated tax liability for these investments is presented as "Deferred taxes" in the Statement of Assets and Liabilities and included in "Change in net unrealized appreciation (depreciation) on investment securities" in the Statement of Operations. The tax liability incurred may differ materially depending on conditions when these investments are disposed. Any cash held by a Subsidiary is restricted as to its use and is presented as "Restricted cash" in the Statement of Assets and Liabilities, if applicable.
4. Purchases and Sales of Investments.
Purchases and sales of securities, other than short-term securities, in-kind transactions and securities acquired in the merger, are noted in the table below.
| | Purchases ($) | Sales ($) |
| Fidelity Magellan Fund | 4,649,778 | 5,277,212 |
Unaffiliated Redemptions In-Kind. Shares that were redeemed in-kind for investments, including accrued interest and cash, if any, are shown in the table below. The net realized gain or loss on investments delivered through in-kind redemptions is included in the accompanying Statement of Operations. The amount of the in-kind redemptions is included in share transactions in the accompanying Statement of Changes in Net Assets. There was no gain or loss for federal income tax purposes.
| | Shares | Total net realized gain or loss
($) | Total Proceeds
($) | Participating classes |
| Fidelity Magellan Fund | 5,943 | 42,937 | 79,781 | Class K |
Prior Fiscal Year Unaffiliated Redemptions In-Kind. Shares that were redeemed in-kind for investments, including accrued interest and cash, if any, are shown in the table below; along with realized gain or loss on investments delivered through in-kind redemptions. The amount of the in-kind redemptions is included in share transactions in the accompanying Statement of Changes in Net Assets. There was no gain or loss for federal income tax purposes.
| | Shares | Total net realized gain or loss
($) | Total Proceeds
($) | Participating classes |
| Fidelity Magellan Fund | 22,824 | 67,933 | 192,403 | Class K |
5. Fees and Other Transactions with Affiliates.
Management Fee. Fidelity Management & Research Company LLC (the investment adviser) and its affiliates provide the Fund with investment management related services for which the Fund pays a monthly management fee. The management fee is the sum of an individual fund fee rate that is based on an annual rate of .30% of the Fund's average net assets and an annualized group fee rate that averaged .23% during the period. The group fee rate is based upon the monthly average net assets of a group of registered investment companies with which the investment adviser has management contracts. The group fee rate decreases as assets under management increase and increases as assets under management decrease. In addition, the management fee is subject to a performance adjustment (up to a maximum of +/- .20% of the Fund's average net assets over a 36 month performance period). The upward or downward adjustment to the management fee is based on the relative investment performance of Magellan as compared to its benchmark index, the S&P 500 Index, over the same 36 month performance period. For the reporting period, the total annualized management fee rate, including the performance adjustment, was .55% of the Fund's average net assets. The performance adjustment included in the management fee rate may be higher or lower than the maximum performance adjustment rate due to the difference between the average net assets for the reporting and performance periods.
Transfer Agent Fees. Fidelity Investments Institutional Operations Company LLC (FIIOC), an affiliate of the investment adviser, is the transfer, dividend disbursing and shareholder servicing agent for each class of the Fund. FIIOC receives account fees and asset-based fees that vary according to the account size and type of account of the shareholders of Magellan, except for Class K. FIIOC receives an asset-based fee of Class K's average net assets. FIIOC pays for typesetting, printing and mailing of shareholder reports, except proxy statements.
For the period, transfer agent fees for each class were as follows:
| | Amount | % of Class-Level Average Net Assets(a) |
| Magellan | $14,658 | .11 |
| Class K | 237 | .04 |
| | $14,895 | |
(a) Annualized
Accounting Fees. Fidelity Service Company, Inc. (FSC), an affiliate of the investment adviser, maintains the Fund's accounting records. The accounting fee is based on the level of average net assets for each month. For the period, the fees were equivalent to the following annualized rates:
| | % of Average Net Assets |
| Fidelity Magellan Fund | .01 |
Brokerage Commissions. A portion of portfolio transactions were placed with brokerage firms which are affiliates of the investment adviser. Brokerage commissions are included in net realized gain (loss) and change in net unrealized appreciation (depreciation) in the Statement of Operations. The commissions paid to these affiliated firms were as follows:
| | Amount |
| Fidelity Magellan Fund | $45 |
Interfund Trades. Funds may purchase from or sell securities to other Fidelity Funds under procedures adopted by the Board. The procedures have been designed to ensure these interfund trades are executed in accordance with Rule 17a-7 of the 1940 Act. Any interfund trades are included within the respective purchases and sales amounts shown in the Purchases and Sales of Investments note and are noted in the table below.
| | Purchases ($) | Sales ($) |
| Fidelity Magellan Fund | 567,443 | 166,024 |
6. Committed Line of Credit.
Certain Funds participate with other funds managed by the investment adviser or an affiliate in a $4.25 billion credit facility (the "line of credit") to be utilized for temporary or emergency purposes to fund shareholder redemptions or for other short-term liquidity purposes. The participating funds have agreed to pay commitment fees on their pro-rata portion of the line of credit, which are reflected in Miscellaneous expenses on the Statement of Operations, and are listed below. During the period, there were no borrowings on this line of credit.
| | Amount |
| Fidelity Magellan Fund | $11 |
7. Security Lending.
Funds lend portfolio securities from time to time in order to earn additional income. Lending agents are used, including National Financial Services (NFS), an affiliate of the investment adviser. Pursuant to a securities lending agreement, NFS will receive a fee, which is capped at 9.9% of a fund's daily lending revenue, for its services as lending agent. A fund may lend securities to certain qualified borrowers, including NFS. On the settlement date of the loan, a fund receives collateral (in the form of U.S. Treasury obligations, letters of credit and/or cash) against the loaned securities and maintains collateral in an amount not less than 100% of the market value of the loaned securities during the period of the loan. The market value of the loaned securities is determined at the close of business of a fund and any additional required collateral is delivered to a fund on the next business day. A fund or borrower may terminate the loan at any time, and if the borrower defaults on its obligation to return the securities loaned because of insolvency or other reasons, a fund may apply collateral received from the borrower against the obligation. A fund may experience delays and costs in recovering the securities loaned. Any cash collateral received is invested in the Fidelity Securities Lending Cash Central Fund. Any loaned securities are identified as such in the Schedule of Investments, and the value of loaned securities and cash collateral at period end, as applicable, are presented in the Statement of Assets and Liabilities. Security lending income represents the income earned on investing cash collateral, less rebates paid to borrowers and any lending agent fees associated with the loan, plus any premium payments received for lending certain types of securities. Security lending income is presented in the Statement of Operations as a component of income from Fidelity Central Funds. Affiliated security lending activity, if any, was as follows:
| | Total Security Lending Fees Paid to NFS | Security Lending Income From Securities Loaned to NFS | Value of Securities Loaned to NFS at Period End |
| Fidelity Magellan Fund | $1 | $– | $– |
8. Expense Reductions.
Commissions paid to certain brokers with whom the investment adviser, or its affiliates, places trades on behalf of the Fund include an amount in addition to trade execution, which may be rebated back to the Fund to offset expenses. This amount totaled $252 for the period.
In addition, during the period the investment adviser or an affiliate reimbursed and/or waived a portion of fund-level operating expenses in the amount of $207.
9. Distributions to Shareholders.
Distributions to shareholders of each class were as follows:
| | Six months ended
September 30, 2021 | Year ended
March 31, 2021 |
| Fidelity Magellan Fund | | |
| Distributions to shareholders | | |
| Magellan | $1,022,853 | $62,880 |
| Class K | 44,837 | 3,345 |
| Total | $1,067,690 | $66,225 |
10. Share Transactions.
Share transactions for each class were as follows and may contain in-kind transactions, automatic conversions between classes or exchanges between affiliated funds:
| | Shares | Shares | Dollars | Dollars |
| | Six months ended September 30, 2021 | Year ended March 31, 2021 | Six months ended September 30, 2021 | Year ended March 31, 2021 |
| Fidelity Magellan Fund | | | | |
| Magellan | | | | |
| Shares sold | 60,067 | 73,840 | $852,550 | $877,387 |
| Issued in exchange for the shares of Fidelity Independence Fund | 320,281 | – | 4,160,451 | – |
| Reinvestment of distributions | 73,273 | 4,757 | 970,874 | 59,849 |
| Shares redeemed | (71,090) | (141,915) | (993,693) | (1,686,140) |
| Net increase (decrease) | 382,531 | (63,318) | $4,990,182 | $(748,904) |
| Class K | | | | |
| Shares sold | 1,821 | 5,940 | $25,473 | $70,349 |
| Issued in exchange for the shares of Fidelity Independence Fund | 13,419 | – | 174,174 | – |
| Reinvestment of distributions | 3,387 | 266 | 44,837 | 3,345 |
| Shares redeemed | (15,965) | (47,312) | (222,969) | (491,995) |
| Net increase (decrease) | 2,662 | (41,106) | $21,515 | $(418,301) |
11. Other.
Fund's organizational documents provide former and current trustees and officers with a limited indemnification against liabilities arising in connection with the performance of their duties to the fund. In the normal course of business, the fund may also enter into contracts that provide general indemnifications. The fund's maximum exposure under these arrangements is unknown as this would be dependent on future claims that may be made against the fund. The risk of material loss from such claims is considered remote.
At the end of the period, the following mutual funds managed by the investment adviser or its affiliates were the owners of record of 10% or more of the total outstanding shares.
| | Strategic Advisers Fidelity U.S. Total Stock Fund |
| Fidelity Magellan Fund | 11% |
12. Merger Information.
On May 14, 2021, the Fund acquired all of the assets and assumed all of the liabilities of Fidelity Independence Fund ("Target Fund") pursuant to an Agreement and Plan of Reorganization approved by the Board of Trustees ("The Board"). The securities held by the Target Fund were the primary assets acquired by the Fund. The acquisition was accomplished by an exchange of each class of the Fund for corresponding shares then outstanding of the Target Fund at their respective net asset value on the acquisition date. The reorganization provides shareholders of the Target Fund access to a larger portfolio with a similar investment objective and lower projected expenses. For financial reporting purposes, the assets and liabilities of the Target Fund and shares issued by the Fund were recorded at fair value; however, the cost basis of the investments received from the Target Fund were carried forward and will be utilized for purposes of the Fund's ongoing reporting of realized and unrealized gains and losses to more closely align subsequent reporting of realized gains with amounts distributable to shareholders for tax purposes. The reorganization qualified as a tax-free reorganization for federal income tax purposes with no gain or loss recognized to the funds or their shareholders.
| Target Fund and Share Class | Investments $ | Unrealized appreciation (depreciation) $ | Net Assets $ | Shares Exchanged | Shares Exchanged Ratio |
| Fidelity Independence Fund | 4,342,458 | 1,920,070 | | | |
| Independence | | | 4,160,451 | 320,281 | 3.4635565820 |
| Class K | | | 174,174 | 13,419 | 3.4696533128 |
| Surviving Fund | Net Assets$ | Total net assets after the acquisition $ |
| Fidelity Magellan Fund | 22,826,812 | 27,161,437 |
Pro forma results of operations of the combined entity for the entire period ended September 30, 2021, as though the acquisition had occurred as of the beginning of the year (rather than on the actual acquisition date), are as follows:
| Net investment income (loss) | $(7,536) |
| Total net realized gain (loss) | 719,399 |
| Total change in net unrealized appreciation (depreciation) | 2,766,122 |
| Net increase (decrease) in net assets resulting from operations | $3,477,985 |
Because the combined investment portfolios have been managed as a single portfolio since the acquisition was completed, it is not practicable to separate the amounts of revenue and earnings of the acquired fund that have been included in the Fund's accompanying Statement of Operations since May 14, 2021.
13. Coronavirus (COVID-19) Pandemic.
An outbreak of COVID-19 first detected in China during December 2019 has since spread globally and was declared a pandemic by the World Health Organization during March 2020. Developments that disrupt global economies and financial markets, such as the COVID-19 pandemic, may magnify factors that affect the Fund's performance.
Shareholder Expense Example
As a shareholder, you incur two types of costs: (1) transaction costs, which may include sales charges (loads) on purchase payments or redemption proceeds, as applicable and (2) ongoing costs, which generally include management fees, distribution and/or service (12b-1) fees and other Fund expenses. This Example is intended to help you understand your ongoing costs (in dollars) of investing in a fund and to compare these costs with the ongoing costs of investing in other mutual funds.
The Example is based on an investment of $1,000 invested at the beginning of the period and held for the entire period (April 1, 2021 to September 30, 2021).
Actual Expenses
The first line of the accompanying table provides information about actual account values and actual expenses. You may use the information in this line, together with the amount you invested, to estimate the expenses that you paid over the period. Simply divide your account value by $1,000.00 (for example, an $8,600 account value divided by $1,000.00 = 8.6), then multiply the result by the number in the first line for a class/Fund under the heading entitled "Expenses Paid During Period" to estimate the expenses you paid on your account during this period. If any fund is a shareholder of any underlying mutual funds or exchange-traded funds (ETFs) (the Underlying Funds), such fund indirectly bears its proportional share of the expenses of the Underlying Funds in addition to the direct expenses incurred presented in the table. These fees and expenses are not included in the annualized expense ratio used to calculate the expense estimate in the table below.
Hypothetical Example for Comparison Purposes
The second line of the accompanying table provides information about hypothetical account values and hypothetical expenses based on the actual expense ratio and an assumed rate of return of 5% per year before expenses, which is not the actual return. The hypothetical account values and expenses may not be used to estimate the actual ending account balance or expenses you paid for the period. You may use this information to compare the ongoing costs of investing in the Fund and other funds. To do so, compare this 5% hypothetical example with the 5% hypothetical examples that appear in the shareholder reports of the other funds. If any fund is a shareholder of any Underlying Funds, such fund indirectly bears its proportional share of the expenses of the Underlying Funds in addition to the direct expenses as presented in the table. These fees and expenses are not included in the annualized expense ratio used to calculate the expense estimate in the table below.
Please note that the expenses shown in the table are meant to highlight your ongoing costs only and do not reflect any transaction costs. Therefore, the second line of the table is useful in comparing ongoing costs only, and will not help you determine the relative total costs of owning different funds.
| | Annualized Expense Ratio-A | Beginning
Account Value
April 1, 2021 | Ending
Account Value
September 30, 2021 | Expenses Paid
During Period-B
April 1, 2021
to September 30, 2021 |
| Fidelity Magellan Fund | | | | |
| Magellan | .67% | | | |
| Actual | | $1,000.00 | $1,133.40 | $3.58 |
| Hypothetical-C | | $1,000.00 | $1,021.71 | $3.40 |
| Class K | .60% | | | |
| Actual | | $1,000.00 | $1,134.30 | $3.21 |
| Hypothetical-C | | $1,000.00 | $1,022.06 | $3.04 |
A Annualized expense ratio reflects expenses net of applicable fee waivers.
B Expenses are equal to the annualized expense ratio, multiplied by the average account value over the period, multiplied by 183/ 365 (to reflect the one-half year period). The fees and expenses of any Underlying Funds are not included in each annualized expense ratio.
C 5% return per year before expenses
Board Approval of Investment Advisory Contracts and Management Fees
Fidelity Magellan Fund
Each year, the Board of Trustees, including the Independent Trustees (together, the Board), votes on the renewal of the management contract with Fidelity Management & Research Company LLC (FMR) and the sub-advisory agreements (together, the Advisory Contracts) for the fund. FMR and the sub-advisers are referred to herein as the Investment Advisers. The Board, assisted by the advice of fund counsel and Independent Trustees' counsel, requests and considers a broad range of information relevant to the renewal of the Advisory Contracts throughout the year.
The Board meets regularly and, at each of its meetings, covers an extensive agenda of topics and materials and considers factors that are relevant to its annual consideration of the renewal of the fund's Advisory Contracts, including the services and support provided to the fund and its shareholders. The Board has established various standing committees (Committees), each composed of and chaired by Independent Trustees with varying backgrounds, to which the Board has assigned specific subject matter responsibilities in order to enhance effective decision-making by the Board. The Board, acting directly and through its Committees, requests and receives information concerning the annual consideration of the renewal of the fund's Advisory Contracts. The Board also meets as needed to review matters specifically related to the Board's annual consideration of the renewal of the Advisory Contracts. Members of the Board may also meet with trustees of other Fidelity funds through joint ad hoc committees to discuss certain matters relevant to all of the Fidelity funds.
At its May 2021 meeting, the Board unanimously determined to renew the fund's Advisory Contracts. In reaching its determination, the Board considered all factors it believed relevant, including (i) the nature, extent, and quality of the services provided to the fund and its shareholders (including the investment performance of the fund); (ii) the competitiveness of the fund's management fee and total expense ratio relative to peer funds; (iii) the total costs of the services provided by and the profits realized by Fidelity from its relationships with the fund; and (iv) the extent to which, if any, economies of scale exist and are realized as the fund grows, and whether any economies of scale are appropriately shared with fund shareholders.
In considering whether to renew the Advisory Contracts for the fund, the Board reached a determination, with the assistance of fund counsel and Independent Trustees' counsel and through the exercise of its business judgment, that the renewal of the Advisory Contracts was in the best interests of the fund and its shareholders and that the compensation payable under the Advisory Contracts was fair and reasonable. The Board's decision to renew the Advisory Contracts was not based on any single factor, but rather was based on a comprehensive consideration of all the information provided to the Board at its meetings throughout the year. The Board, in reaching its determination to renew the Advisory Contracts, was aware that shareholders of the fund have a broad range of investment choices available to them, including a wide choice among funds offered by Fidelity's competitors, and that the fund's shareholders, who have the opportunity to review and weigh the disclosure provided by the fund in its prospectus and other public disclosures, have chosen to invest in this fund, which is part of the Fidelity family of funds.
Nature, Extent, and Quality of Services Provided. The Board considered Fidelity's staffing as it relates to the fund, including the backgrounds of investment personnel of Fidelity, and also considered the fund's investment objective, strategies, and related investment philosophy. The Independent Trustees also had discussions with senior management of Fidelity's investment operations and investment groups. The Board considered the structure of the investment personnel compensation program and whether this structure provides appropriate incentives to act in the best interests of the fund. Additionally, the Board considered the portfolio managers' investments, if any, in the funds that they manage.
Resources Dedicated to Investment Management and Support Services. The Board and the Fund Oversight and Research Committees reviewed the general qualifications and capabilities of Fidelity's investment staff, including its size, education, experience, and resources, as well as Fidelity's approach to recruiting, training, managing, and compensating investment personnel. The Board noted that Fidelity has continued to increase the resources devoted to non-U.S. offices, including expansion of Fidelity's global investment organization. The Board also noted that Fidelity's analysts have extensive resources, tools and capabilities that allow them to conduct sophisticated quantitative and fundamental analysis, as well as credit analysis of issuers, counterparties and guarantors. Further, the Board considered that Fidelity's investment professionals have sufficient access to global information and data so as to provide competitive investment results over time, and that those professionals also have access to sophisticated tools that permit them to assess portfolio construction and risk and performance attribution characteristics continuously, as well as to transmit new information and research conclusions rapidly around the world. Additionally, in its deliberations, the Board considered Fidelity's trading, risk management, compliance, and technology and operations capabilities and resources, which are integral parts of the investment management process. The Board also considered Fidelity's investments in business continuity planning, and its success in continuously providing services to the fund notwithstanding the severe disruptions caused by the COVID-19 pandemic.
Shareholder and Administrative Services. The Board considered (i) the nature, extent, quality, and cost of advisory, administrative, and shareholder services performed by the Investment Advisers and their affiliates under the Advisory Contracts and under separate agreements covering transfer agency, pricing and bookkeeping, and securities lending services for the fund; (ii) the nature and extent of the supervision of third party service providers, principally custodians, subcustodians, and pricing vendors; and (iii) the resources devoted to, and the record of compliance with, the fund's compliance policies and procedures. The Board also reviewed the allocation of fund brokerage, including allocations to brokers affiliated with the Investment Advisers, the use of brokerage commissions to pay fund expenses, and the use of "soft" commission dollars to pay for research services.
The Board noted that the growth of fund assets over time across the complex allows Fidelity to reinvest in the development of services designed to enhance the value and convenience of the Fidelity funds as investment vehicles. These services include 24-hour access to account information and market information over the Internet and through telephone representatives, investor education materials and asset allocation tools, and the expanded availability of Fidelity Investor Centers.
The Board noted that, in the past, it and the boards of certain other Fidelity funds had formed an ad hoc Committee on Transfer Agency Fees to review the variety of transfer agency fee structures throughout the industry and Fidelity's competitive positioning with respect to industry participants.
Investment in a Large Fund Family. The Board considered the benefits to shareholders of investing in a Fidelity fund, including the benefits of investing in a fund that is part of a large family of funds offering a variety of investment disciplines and providing a large variety of mutual fund investor services. The Board noted that Fidelity had taken, or had made recommendations that resulted in the Fidelity funds taking, a number of actions over the previous year that benefited particular funds, including: (i) continuing to dedicate additional resources to Fidelity's investment research process, which includes meetings with management of issuers of securities in which the funds invest, and to the support of the senior management team that oversees asset management; (ii) continuing efforts to enhance Fidelity's global research capabilities; (iii) launching new funds and ETFs with innovative structures, strategies and pricing and making other enhancements to meet client needs; (iv) launching new share classes of existing funds; (v) eliminating purchase minimums and broadening eligibility requirements for certain funds and share classes; (vi) approving the reduction in the holding period for the Class C to Class A conversion policy; (vii) reducing management fees and total expenses for certain target date funds and classes and index funds; (viii) lowering expenses for certain existing funds and classes by implementing or lowering expense caps; (ix) rationalizing product lines and gaining increased efficiencies from fund mergers, liquidations, and share class consolidations; (x) continuing to develop, acquire and implement systems and technology to improve services to the funds and shareholders, strengthen information security, and increase efficiency; and (xi) continuing to implement enhancements to further strengthen Fidelity's product line to increase investors' probability of success in achieving their investment goals, including retirement income goals.
Investment Performance. The Board considered whether the fund has operated in accordance with its investment objective, as well as its record of compliance with its investment restrictions and its performance history. The Board noted that there were portfolio management changes for the fund in February 2019 and January 2020. The Board will continue to monitor closely the fund's performance, taking into account the portfolio management changes.
The Board took into account discussions that occur at Board meetings throughout the year with representatives of the Investment Advisers about fund investment performance. In this regard the Board noted that as part of regularly scheduled fund reviews and other reports to the Board on fund performance, the Board considers annualized return information for the fund for different time periods, measured against an appropriate securities market index (benchmark index) and an appropriate peer group of funds with similar objectives (peer group). In its evaluation of fund investment performance, the Board gave particular attention to information indicating changes in performance of certain Fidelity funds for specific time periods and discussed with the Investment Advisers the reasons for any overperformance or underperformance.
In addition to reviewing absolute and relative fund performance, the Independent Trustees periodically consider the appropriateness of fund performance metrics in evaluating the results achieved. In general, the Independent Trustees believe that fund performance should be evaluated based on net performance (after fees and expenses) of both the highest performing and lowest performing fund share classes, where applicable, compared to appropriate benchmark indices, over appropriate time periods that may include full market cycles, and compared to peer groups, as applicable, over the same periods, taking into account relevant factors including the following: general market conditions; issuer-specific information; and fund cash flows and other factors.
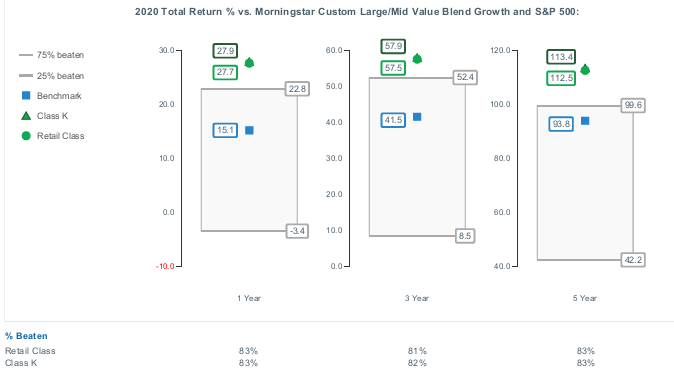
The Independent Trustees recognize that shareholders evaluate performance on a net basis over their own holding periods, for which one-, three-, and five-year periods are often used as a proxy. For this reason, the performance information reviewed by the Board also included net cumulative total return information for the fund and an appropriate benchmark index and peer group for the most recent one-, three-, and five-year periods ended September 30, 2020, as shown below. Returns are shown compared to the 25th percentile (top of box, 75% beaten) and 75th percentile (bottom of box, 25% beaten) of the peer universe.
Fidelity Magellan Fund
The Board also considered that the fund's management fee is subject to upward or downward adjustment depending upon whether, and to what extent, the fund's investment performance for the performance period (a rolling 36-month period) exceeds, or is exceeded by, a securities index, thus leading to a performance adjustment for the same period. The Board noted that the performance adjustment provides FMR with a strong economic incentive to seek to achieve superior long-term performance for the fund's shareholders and helps to more closely align the interests of FMR and the shareholders of the fund.
Based on its review, the Board concluded that the nature, extent, and quality of services provided to the fund under the Advisory Contracts should continue to benefit the shareholders of the fund.
Competitiveness of Management Fee and Total Expense Ratio. The Board considered the fund's management fee and total expense ratio compared to "mapped groups" of competitive funds and classes created for the purpose of facilitating the Trustees' competitive analysis of management fees and total expenses. Fidelity creates "mapped groups" by combining similar Lipper investment objective categories that have comparable investment mandates. Combining Lipper investment objective categories aids the Board's management fee and total expense ratio comparisons by broadening the competitive group used for comparison.
Management Fee. The Board considered two proprietary management fee comparisons for the 12-month periods ended September 30 (June 30 for periods ended 2019 and 2018 and December 31 for periods prior to 2018) shown in basis points (BP) in the chart below. The group of Lipper funds used by the Board for management fee comparisons is referred to below as the "Total Mapped Group." The Total Mapped Group comparison focuses on a fund's standing in terms of gross management fees before expense reimbursements or caps, and without giving effect to the fund's performance adjustment, relative to the total universe of funds with comparable investment mandates, regardless of whether their management fee structures also are comparable. Funds with comparable investment mandates offer exposure to similar types of securities. Funds with comparable management fee structures have similar management fee contractual arrangements (
e.g., flat rate charged for advisory services, all-inclusive fee rate,
etc.). "TMG %" represents the percentage of funds in the Total Mapped Group that had management fees that were lower than the fund's. For example, a hypothetical TMG % of 20% would mean that 80% of the funds in the Total Mapped Group had higher, and 20% had lower, management fees than the fund. The fund's actual TMG %s and the number of funds in the Total Mapped Group are in the chart below. The "Asset-Sized Peer Group" (ASPG) comparison focuses on a fund's standing relative to a subset of non-Fidelity funds within the Total Mapped Group that are similar in size and management fee structure without taking into account performance adjustments, if any. For example, if a fund is in the first quartile of the ASPG, the fund's management fee ranks in the least expensive or lowest 25% of funds in the ASPG. The ASPG represents at least 15% of the funds in the Total Mapped Group with comparable asset size and management fee structures, subject to a minimum of 50 funds (or all funds in the Total Mapped Group if fewer than 50). Additional information, such as the ASPG quartile in which the fund's management fee rate ranked and the impact of the fund's performance adjustment, is also included in the chart and was considered by the Board.
Fidelity Magellan Fund
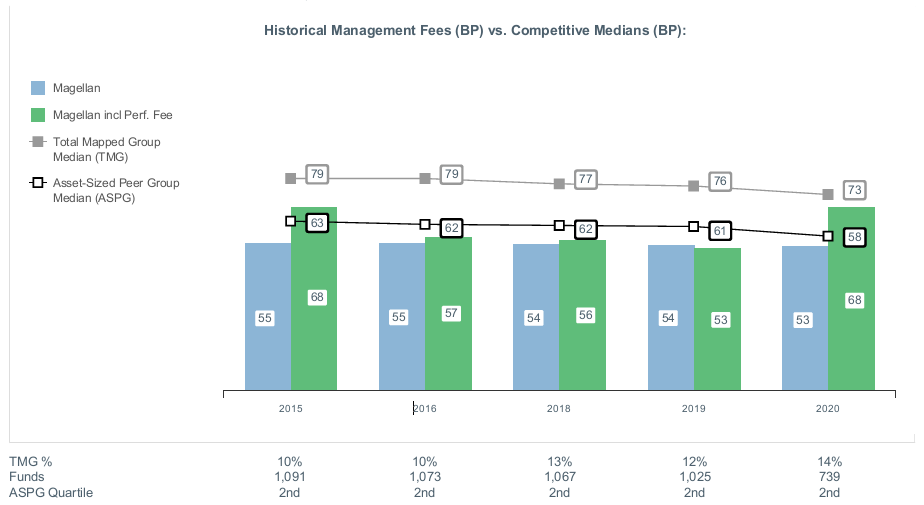
The Board noted that the fund's management fee rate ranked below the median of its Total Mapped Group and below the median of its ASPG for the 12-month period ended September 30, 2020. The Board also noted the effect of the fund's performance adjustment, if any, on the fund's management fee ranking.
The Board noted that, in the past, it and the boards of other Fidelity funds had formed an ad hoc Committee on Group Fee to conduct an in-depth review of the "group fee" component of the management fee of funds with such management fee structures. The Committee's focus included the mechanics of the group fee, the competitive landscape of group fee structures, Fidelity funds with no group fee component and investment products not included in group fee assets. The Board also considered that, for funds subject to the group fee, FMR agreed to voluntarily waive fees over a specified period of time in amounts designed to account for assets converted from certain funds to certain collective investment trusts.
The Board also noted that, in 2013, the ad hoc Committee on Management Fees was formed to conduct an in-depth review of the management fee rates of Fidelity's active equity mutual funds. The Committee focused on the following areas: (i) standard fee structures; (ii) research consumption and trading evolution; (iii) management fee competitiveness/profitability by category; and (iv) factors that drive institutional pricing.
Based on its review, the Board concluded that the fund's management fee is fair and reasonable in light of the services that the fund receives and the other factors considered.
Total Expense Ratio. In its review of each class's total expense ratio, the Board considered the fund's management fee rate as well as other fund or class expenses, as applicable, such as transfer agent fees, pricing and bookkeeping fees, and custodial, legal, and audit fees. The Board noted the impact of the fund's performance adjustment. The Board also noted that Fidelity may agree to waive fees or reimburse expenses from time to time, and the extent to which, if any, it has done so for the fund. As part of its review, the Board also considered the current and historical total expense ratios of a representative class of the fund compared to competitive fund median expenses. The fund's representative class is compared to those funds and classes in the Total Mapped Group (used by the Board for management fee comparisons) that have a similar sales load structure (SLTG). The Board also considered a total expense ASPG comparison for the representative class, which focuses on the total expenses of the representative class relative to a subset of non-Fidelity funds within the total expense SLTG. The total expense ASPG is limited to 15 larger and 15 smaller classes in fund average assets for a total of 30 classes, where possible. The total expense ASPG comparison excludes performance adjustments and fund-paid 12b-1 fees to eliminate variability in fee structures.
The Board noted that the total expense ratio of the retail class ranked below the SLTG competitive median and below the ASPG competitive median for the 12-month period ended September 30, 2020.
Fees Charged to Other Fidelity Clients. The Board also considered Fidelity fee structures and other information with respect to clients of Fidelity, such as other funds advised or subadvised by Fidelity, pension plan clients, and other institutional clients with similar mandates. The Board noted that a joint ad hoc committee created by it and the boards of other Fidelity funds periodically reviews and compares Fidelity's institutional investment advisory business with its business of providing services to the Fidelity funds and also noted the most recent findings of the committee. The Board noted that the committee's review included a consideration of the differences in services provided, fees charged, and costs incurred, as well as competition in the markets serving the different categories of clients.
Based on its review of total expense ratios and fees charged to other Fidelity clients, the Board concluded that the total expense ratio of each class of the fund was reasonable in light of the services that the fund and its shareholders receive and the other factors considered.
Costs of the Services and Profitability. The Board considered the revenues earned and the expenses incurred by Fidelity in conducting the business of developing, marketing, distributing, managing, administering and servicing the fund and servicing the fund's shareholders. The Board also considered the level of Fidelity's profits in respect of all the Fidelity funds.
On an annual basis, Fidelity presents to the Board information about the profitability of its relationships with the fund. Fidelity calculates profitability information for each fund, as well as aggregate profitability information for groups of Fidelity funds and all Fidelity funds, using a series of detailed revenue and cost allocation methodologies which originate with the books and records of Fidelity on which Fidelity's audited financial statements are based. The Audit Committee of the Board reviews any significant changes from the prior year's methodologies and the full Board approves such changes.
A public accounting firm has been engaged annually by the Board as part of the Board's assessment of Fidelity's profitability analysis. The engagement includes the review and assessment of the methodologies used by Fidelity in determining the revenues and expenses attributable to Fidelity's mutual fund business, and completion of agreed-upon procedures in respect of the mathematical accuracy of certain fund profitability information and its conformity to established allocation methodologies. After considering the reports issued under the engagement and information provided by Fidelity, the Board concluded that while other allocation methods may also be reasonable, Fidelity's profitability methodologies are reasonable in all material respects.
The Board also reviewed Fidelity's non-fund businesses and potential indirect benefits such businesses may have received as a result of their association with Fidelity's mutual fund business (i.e., fall-out benefits) as well as cases where Fidelity's affiliates may benefit from the funds' business. The Board considered areas where potential indirect benefits to the Fidelity funds from their relationships with Fidelity may exist. The Board also considered that in 2019 a joint ad hoc committee created by it and the boards of other Fidelity funds evaluated potential fall-out benefits (PFOB Committee). The Board noted that it considered the PFOB Committee's findings in connection with its consideration of the renewal of the Advisory Contracts.
The Board considered the costs of the services provided by and the profits realized by Fidelity in connection with the operation of the fund, including the conclusions of the PFOB Committee, and was satisfied that the profitability was not excessive.
Economies of Scale. The Board considered whether there have been economies of scale in respect of the management of the Fidelity funds, whether the Fidelity funds (including the fund) have appropriately benefited from any such economies of scale, and whether there is potential for realization of any further economies of scale. The Board considered the extent to which the fund will benefit from economies of scale as assets grow through increased services to the fund, through waivers or reimbursements, or through fee or expense ratio reductions. The Board also noted that a committee (the Economies of Scale Committee) created by it and the boards of other Fidelity funds periodically analyzes whether Fidelity attains economies of scale in respect of the management and servicing of the Fidelity funds, whether the Fidelity funds have appropriately benefited from such economies of scale, and whether there is potential for realization of any further economies of scale.
The Board recognized that the fund's management contract incorporates a "group fee" structure, which provides for lower group fee rates as total "group assets" increase, and for higher group fee rates as total "group assets" decrease ("group assets" as defined in the management contract). FMR calculates the group fee rates based on a tiered asset "breakpoint" schedule that varies based on asset class. The Board considered that the group fee is designed to deliver the benefits of economies of scale to fund shareholders when total Fidelity fund assets increase, even if assets of any particular fund are unchanged or have declined, because some portion of Fidelity's costs are attributable to services provided to all Fidelity funds, and all funds benefit if those costs can be allocated among more assets. The Board further considered that Fidelity agreed to impose a temporary fee waiver in the form of additional breakpoints to the current breakpoint schedule. The Board concluded that, given the group fee structure, fund shareholders will benefit from lower management fees as "group assets" increase at the fund complex level, regardless of whether Fidelity achieves any such economies of scale.
The Board concluded, taking into account the analysis of the Economies of Scale Committee, that economies of scale, if any, are being appropriately shared between fund shareholders and Fidelity.
Additional Information Requested by the Board. In order to develop fully the factual basis for consideration of the Fidelity funds' advisory contracts, the Board requested and received additional information on certain topics, including: (i) fund flow and performance trends, in particular the underperformance of certain funds and strategies, and Fidelity's long-term strategies for certain funds; (ii) consideration of expanding the use of performance fees for additional funds; (iii) Fidelity's pricing philosophy compared to competitors; (iv) metrics for evaluating index fund and ETF performance and information about ETF trading characteristics; (v) the methodology with respect to evaluating competitive fund data and peer group classifications and fee and expense comparisons; (vi) the expense structures for different funds and classes and information about the differences between various expense structures; (vii) group fee breakpoints; (viii) information regarding other accounts managed by Fidelity and sub-advisory arrangements; and (ix) Fidelity's philosophies and strategies for evaluating funds and classes with lower or declining asset levels.
Based on its evaluation of all of the conclusions noted above, and after considering all factors it believed relevant, the Board concluded that the advisory fee arrangements are fair and reasonable, and that the fund's Advisory Contracts should be renewed.

MAG-SANN-1121
1.537468.124
Fidelity® Magellan® K6 Fund
Semi-Annual Report
September 30, 2021
Contents
To view a fund's proxy voting guidelines and proxy voting record for the 12-month period ended June 30, visit http://www.fidelity.com/proxyvotingresults or visit the Securities and Exchange Commission's (SEC) web site at http://www.sec.gov.
You may also call 1-800-835-5092 to request a free copy of the proxy voting guidelines.
Standard & Poor's, S&P and S&P 500 are registered service marks of The McGraw-Hill Companies, Inc. and have been licensed for use by Fidelity Distributors Corporation.
Other third-party marks appearing herein are the property of their respective owners.
All other marks appearing herein are registered or unregistered trademarks or service marks of FMR LLC or an affiliated company. © 2021 FMR LLC. All rights reserved.
This report and the financial statements contained herein are submitted for the general information of the shareholders of the Fund. This report is not authorized for distribution to prospective investors in the Fund unless preceded or accompanied by an effective prospectus.
A fund files its complete schedule of portfolio holdings with the SEC for the first and third quarters of each fiscal year on Form N-PORT. Forms N-PORT are available on the SEC’s web site at http://www.sec.gov. A fund's Forms N-PORT may be reviewed and copied at the SEC’s Public Reference Room in Washington, DC. Information regarding the operation of the SEC's Public Reference Room may be obtained by calling 1-800-SEC-0330.
For a complete list of a fund's portfolio holdings, view the most recent holdings listing, semiannual report, or annual report on Fidelity's web site at http://www.fidelity.com, http://www.institutional.fidelity.com, or http://www.401k.com, as applicable.
NOT FDIC INSURED •MAY LOSE VALUE •NO BANK GUARANTEE
Neither the Fund nor Fidelity Distributors Corporation is a bank.
Note to Shareholders:
Early in 2020, the outbreak and spread of COVID-19 emerged as a public health emergency that had a major influence on financial markets, primarily based on its impact on the global economy and corporate earnings. On March 11, 2020, the World Health Organization declared the COVID-19 outbreak a pandemic, citing sustained risk of further global spread. The pandemic prompted a number of measures to limit the spread of COVID-19, including travel and border restrictions, quarantines, and restrictions on large gatherings. In turn, these resulted in lower consumer activity, diminished demand for a wide range of products and services, disruption in manufacturing and supply chains, and – given the wide variability in outcomes regarding the outbreak – significant market uncertainty and volatility. To help stem the turmoil, the U.S. government took unprecedented action – in concert with the U.S. Federal Reserve and central banks around the world – to help support consumers, businesses, and the broader economy, and to limit disruption to the financial system.
In general, the overall impact of the pandemic lessened in 2021, amid a resilient economy and widespread distribution of three COVID-19 vaccines granted emergency use authorization from the U.S. Food and Drug Administration (FDA) early in the year. Still, the situation remains dynamic, and the extent and duration of its influence on financial markets and the economy is highly uncertain, due in part to a recent spike in cases based on highly contagious variants of the coronavirus.
Extreme events such as the COVID-19 crisis are exogenous shocks that can have significant adverse effects on mutual funds and their investments. Although multiple asset classes may be affected by market disruption, the duration and impact may not be the same for all types of assets. Fidelity is committed to helping you stay informed amid news about COVID-19 and during increased market volatility, and we continue to take extra steps to be responsive to customer needs. We encourage you to visit us online, where we offer ongoing updates, commentary, and analysis on the markets and our funds.
Investment Summary (Unaudited)
Top Ten Stocks as of September 30, 2021
| | % of fund's net assets |
| Apple, Inc. | 6.9 |
| Microsoft Corp. | 6.8 |
| Amazon.com, Inc. | 4.8 |
| Facebook, Inc. Class A | 3.1 |
| Alphabet, Inc. Class A | 2.6 |
| Alphabet, Inc. Class C | 2.6 |
| NVIDIA Corp. | 2.3 |
| UnitedHealth Group, Inc. | 1.9 |
| Visa, Inc. Class A | 1.9 |
| The Home Depot, Inc. | 1.8 |
| | 34.7 |
Top Five Market Sectors as of September 30, 2021
| | % of fund's net assets |
| Information Technology | 41.1 |
| Communication Services | 13.7 |
| Consumer Discretionary | 9.9 |
| Health Care | 9.3 |
| Industrials | 7.6 |
Asset Allocation (% of fund's net assets)
| As of September 30, 2021* |
| | Stocks | 98.3% |
| | Short-Term Investments and Net Other Assets (Liabilities) | 1.7% |

* Foreign investments - 3.9%
Schedule of Investments September 30, 2021 (Unaudited)
Showing Percentage of Net Assets
| Common Stocks - 98.3% | | | |
| | | Shares | Value |
| COMMUNICATION SERVICES - 13.7% | | | |
| Entertainment - 2.7% | | | |
| Netflix, Inc. (a) | | 6,942 | $4,236,980 |
| The Walt Disney Co. (a) | | 14,339 | 2,425,729 |
| | | | 6,662,709 |
| Interactive Media & Services - 8.3% | | | |
| Alphabet, Inc.: | | | |
| Class A (a) | | 2,459 | 6,574,186 |
| Class C (a) | | 2,396 | 6,386,083 |
| Facebook, Inc. Class A (a) | | 22,633 | 7,681,414 |
| | | | 20,641,683 |
| Media - 2.7% | | | |
| Charter Communications, Inc. Class A (a) | | 4,076 | 2,965,535 |
| Comcast Corp. Class A | | 68,053 | 3,806,204 |
| | | | 6,771,739 |
|
| TOTAL COMMUNICATION SERVICES | | | 34,076,131 |
|
| CONSUMER DISCRETIONARY - 9.9% | | | |
| Hotels, Restaurants & Leisure - 1.0% | | | |
| Hilton Worldwide Holdings, Inc. (a) | | 19,188 | 2,534,927 |
| Internet & Direct Marketing Retail - 4.8% | | | |
| Amazon.com, Inc. (a) | | 3,626 | 11,911,555 |
| Multiline Retail - 1.0% | | | |
| Dollar General Corp. | | 11,140 | 2,363,240 |
| Specialty Retail - 1.8% | | | |
| The Home Depot, Inc. | | 13,414 | 4,403,280 |
| Textiles, Apparel & Luxury Goods - 1.3% | | | |
| NIKE, Inc. Class B | | 22,936 | 3,330,995 |
|
| TOTAL CONSUMER DISCRETIONARY | | | 24,543,997 |
|
| CONSUMER STAPLES - 2.5% | | | |
| Food & Staples Retailing - 1.5% | | | |
| Costco Wholesale Corp. | | 8,135 | 3,655,462 |
| Personal Products - 1.0% | | | |
| Estee Lauder Companies, Inc. Class A | | 8,070 | 2,420,435 |
|
| TOTAL CONSUMER STAPLES | | | 6,075,897 |
|
| FINANCIALS - 7.2% | | | |
| Capital Markets - 5.1% | | | |
| BlackRock, Inc. Class A | | 3,425 | 2,872,411 |
| Intercontinental Exchange, Inc. | | 2,549 | 292,676 |
| Moody's Corp. | | 7,414 | 2,632,786 |
| MSCI, Inc. | | 4,625 | 2,813,573 |
| S&P Global, Inc. | | 7,190 | 3,054,959 |
| T. Rowe Price Group, Inc. | | 5,000 | 983,500 |
| | | | 12,649,905 |
| Insurance - 2.1% | | | |
| Arthur J. Gallagher & Co. | | 16,115 | 2,395,495 |
| Marsh & McLennan Companies, Inc. | | 18,914 | 2,864,147 |
| | | | 5,259,642 |
|
| TOTAL FINANCIALS | | | 17,909,547 |
|
| HEALTH CARE - 9.3% | | | |
| Health Care Equipment & Supplies - 3.8% | | | |
| Danaher Corp. | | 12,196 | 3,712,950 |
| IDEXX Laboratories, Inc. (a) | | 4,244 | 2,639,344 |
| Intuitive Surgical, Inc. (a) | | 3,051 | 3,033,152 |
| | | | 9,385,446 |
| Health Care Providers & Services - 1.9% | | | |
| UnitedHealth Group, Inc. | | 12,265 | 4,792,426 |
| Health Care Technology - 0.9% | | | |
| Veeva Systems, Inc. Class A (a) | | 7,454 | 2,148,019 |
| Life Sciences Tools & Services - 1.5% | | | |
| Thermo Fisher Scientific, Inc. | | 6,705 | 3,830,768 |
| Pharmaceuticals - 1.2% | | | |
| Zoetis, Inc. Class A | | 15,197 | 2,950,346 |
|
| TOTAL HEALTH CARE | | | 23,107,005 |
|
| INDUSTRIALS - 7.6% | | | |
| Aerospace & Defense - 1.9% | | | |
| HEICO Corp. Class A | | 18,488 | 2,189,534 |
| TransDigm Group, Inc. (a) | | 3,880 | 2,423,332 |
| | | | 4,612,866 |
| Electrical Equipment - 0.9% | | | |
| AMETEK, Inc. | | 17,807 | 2,208,246 |
| Industrial Conglomerates - 0.9% | | | |
| Roper Technologies, Inc. | | 5,222 | 2,329,691 |
| Professional Services - 3.9% | | | |
| Equifax, Inc. | | 9,467 | 2,399,127 |
| IHS Markit Ltd. | | 22,516 | 2,625,816 |
| TransUnion Holding Co., Inc. | | 18,916 | 2,124,456 |
| Verisk Analytics, Inc. | | 12,382 | 2,479,743 |
| | | | 9,629,142 |
|
| TOTAL INDUSTRIALS | | | 18,779,945 |
|
| INFORMATION TECHNOLOGY - 41.1% | | | |
| Electronic Equipment & Components - 1.7% | | | |
| Amphenol Corp. Class A | | 34,146 | 2,500,512 |
| Teledyne Technologies, Inc. (a) | | 3,750 | 1,610,925 |
| | | | 4,111,437 |
| IT Services - 6.9% | | | |
| Accenture PLC Class A | | 11,923 | 3,814,406 |
| MasterCard, Inc. Class A | | 12,407 | 4,313,666 |
| PayPal Holdings, Inc. (a) | | 15,843 | 4,122,507 |
| Visa, Inc. Class A | | 21,403 | 4,767,518 |
| | | | 17,018,097 |
| Semiconductors & Semiconductor Equipment - 7.9% | | | |
| Analog Devices, Inc. | | 15,692 | 2,628,096 |
| Applied Materials, Inc. | | 22,252 | 2,864,500 |
| KLA Corp. | | 7,350 | 2,458,649 |
| Lam Research Corp. | | 4,556 | 2,593,047 |
| NVIDIA Corp. | | 28,058 | 5,812,495 |
| Texas Instruments, Inc. | | 17,560 | 3,375,208 |
| | | | 19,731,995 |
| Software - 17.7% | | | |
| Adobe, Inc. (a) | | 6,989 | 4,023,707 |
| ANSYS, Inc. (a) | | 6,721 | 2,288,164 |
| Autodesk, Inc. (a) | | 8,700 | 2,480,979 |
| Cadence Design Systems, Inc. (a) | | 16,627 | 2,517,993 |
| Fortinet, Inc. (a) | | 8,271 | 2,415,463 |
| Intuit, Inc. | | 6,334 | 3,417,256 |
| Microsoft Corp. | | 59,670 | 16,822,166 |
| Salesforce.com, Inc. (a) | | 14,600 | 3,959,812 |
| ServiceNow, Inc. (a) | | 5,258 | 3,271,896 |
| Synopsys, Inc. (a) | | 8,661 | 2,593,190 |
| | | | 43,790,626 |
| Technology Hardware, Storage & Peripherals - 6.9% | | | |
| Apple, Inc. | | 121,312 | 17,165,646 |
|
| TOTAL INFORMATION TECHNOLOGY | | | 101,817,801 |
|
| MATERIALS - 2.3% | | | |
| Chemicals - 2.3% | | | |
| Linde PLC | | 10,956 | 3,214,271 |
| Sherwin-Williams Co. | | 9,255 | 2,588,901 |
| | | | 5,803,172 |
| REAL ESTATE - 3.3% | | | |
| Equity Real Estate Investment Trusts (REITs) - 3.3% | | | |
| American Tower Corp. | | 10,740 | 2,850,503 |
| Equinix, Inc. | | 3,140 | 2,481,008 |
| Prologis (REIT), Inc. | | 22,687 | 2,845,630 |
| | | | 8,177,141 |
| UTILITIES - 1.4% | | | |
| Electric Utilities - 1.4% | | | |
| NextEra Energy, Inc. | | 42,739 | 3,355,866 |
| TOTAL COMMON STOCKS | | | |
| (Cost $163,915,528) | | | 243,646,502 |
|
| Money Market Funds - 1.5% | | | |
| Fidelity Cash Central Fund 0.06% (b) | | | |
| (Cost $3,734,984) | | 3,734,237 | 3,734,984 |
| TOTAL INVESTMENT IN SECURITIES - 99.8% | | | |
| (Cost $167,650,512) | | | 247,381,486 |
| NET OTHER ASSETS (LIABILITIES) - 0.2% | | | 587,587 |
| NET ASSETS - 100% | | | $247,969,073 |
Legend
(a) Non-income producing
(b) Affiliated fund that is generally available only to investment companies and other accounts managed by Fidelity Investments. The rate quoted is the annualized seven-day yield of the fund at period end. A complete unaudited listing of the fund's holdings as of its most recent quarter end is available upon request. In addition, each Fidelity Central Fund's financial statements are available on the SEC's website or upon request.
Affiliated Central Funds
Fiscal year to date information regarding the Fund's investments in Fidelity Central Funds, including the ownership percentage, is presented below.
| Fund | Value, beginning of period | Purchases | Sales Proceeds | Dividend Income | Realized Gain/Loss | Change in Unrealized appreciation (depreciation) | Value, end of period | % ownership, end of period |
| Fidelity Cash Central Fund 0.06% | $1,664,234 | $27,923,258 | $25,852,508 | $663 | $-- | $-- | $3,734,984 | 0.0% |
| Fidelity Securities Lending Cash Central Fund 0.06% | 451,000 | 8,127,655 | 8,578,655 | 98 | -- | -- | -- | 0.0% |
| Total | $2,115,234 | $36,050,913 | $34,431,163 | $761 | $-- | $-- | $3,734,984 | |
Amounts in the income column in the above table include any capital gain distributions from underlying funds, which are presented in the corresponding line-item in the Statement of Operations, if applicable. Amount for Fidelity Securities Lending Cash Central Fund represents the income earned on investing cash collateral, less rebates paid to borrowers and any lending agent fees associated with the loan, plus any premium payments received for lending certain types of securities.
Investment Valuation
The following is a summary of the inputs used, as of September 30, 2021, involving the Fund's assets and liabilities carried at fair value. The inputs or methodology used for valuing securities may not be an indication of the risk associated with investing in those securities. For more information on valuation inputs, and their aggregation into the levels used below, please refer to the Investment Valuation section in the accompanying Notes to Financial Statements.
| | Valuation Inputs at Reporting Date: |
| Description | Total | Level 1 | Level 2 | Level 3 |
| Investments in Securities: | | | | |
| Equities: | | | | |
| Communication Services | $34,076,131 | $34,076,131 | $-- | $-- |
| Consumer Discretionary | 24,543,997 | 24,543,997 | -- | -- |
| Consumer Staples | 6,075,897 | 6,075,897 | -- | -- |
| Financials | 17,909,547 | 17,909,547 | -- | -- |
| Health Care | 23,107,005 | 23,107,005 | -- | -- |
| Industrials | 18,779,945 | 18,779,945 | -- | -- |
| Information Technology | 101,817,801 | 101,817,801 | -- | -- |
| Materials | 5,803,172 | 5,803,172 | -- | -- |
| Real Estate | 8,177,141 | 8,177,141 | -- | -- |
| Utilities | 3,355,866 | 3,355,866 | -- | -- |
| Money Market Funds | 3,734,984 | 3,734,984 | -- | -- |
| Total Investments in Securities: | $247,381,486 | $247,381,486 | $-- | $-- |
See accompanying notes which are an integral part of the financial statements.
Financial Statements
Statement of Assets and Liabilities
| | | September 30, 2021 (Unaudited) |
| Assets | | |
Investment in securities, at value — See accompanying schedule:
Unaffiliated issuers (cost $163,915,528) | $243,646,502 | |
| Fidelity Central Funds (cost $3,734,984) | 3,734,984 | |
| Total Investment in Securities (cost $167,650,512) | | $247,381,486 |
| Receivable for investments sold | | 2,194,994 |
| Receivable for fund shares sold | | 35,660 |
| Dividends receivable | | 36,277 |
| Distributions receivable from Fidelity Central Funds | | 154 |
| Other receivables | | 1,116 |
| Total assets | | 249,649,687 |
| Liabilities | | |
| Payable for investments purchased | $1,484,641 | |
| Payable for fund shares redeemed | 98,356 | |
| Accrued management fee | 97,617 | |
| Total liabilities | | 1,680,614 |
| Net Assets | | $247,969,073 |
| Net Assets consist of: | | |
| Paid in capital | | $161,553,631 |
| Total accumulated earnings (loss) | | 86,415,442 |
| Net Assets | | $247,969,073 |
| Net Asset Value, offering price and redemption price per share ($247,969,073 ÷ 15,370,543 shares) | | $16.13 |
See accompanying notes which are an integral part of the financial statements.
Statement of Operations
| | | Six months ended September 30, 2021 (Unaudited) |
| Investment Income | | |
| Dividends | | $781,774 |
| Income from Fidelity Central Funds (including $98 from security lending) | | 761 |
| Total income | | 782,535 |
| Expenses | | |
| Management fee | $582,529 | |
| Independent trustees' fees and expenses | 432 | |
| Interest | 624 | |
| Total expenses before reductions | 583,585 | |
| Expense reductions | (2,352) | |
| Total expenses after reductions | | 581,233 |
| Net investment income (loss) | | 201,302 |
| Realized and Unrealized Gain (Loss) | | |
| Net realized gain (loss) on: | | |
| Investment securities: | | |
| Unaffiliated issuers | 6,639,236 | |
| Total net realized gain (loss) | | 6,639,236 |
| Change in net unrealized appreciation (depreciation) on investment securities | | 25,943,306 |
| Net gain (loss) | | 32,582,542 |
| Net increase (decrease) in net assets resulting from operations | | $32,783,844 |
See accompanying notes which are an integral part of the financial statements.
Statement of Changes in Net Assets
| | Six months ended September 30, 2021 (Unaudited) | Year ended March 31, 2021 |
| Increase (Decrease) in Net Assets | | |
| Operations | | |
| Net investment income (loss) | $201,302 | $568,448 |
| Net realized gain (loss) | 6,639,236 | 7,892,219 |
| Change in net unrealized appreciation (depreciation) | 25,943,306 | 57,379,985 |
| Net increase (decrease) in net assets resulting from operations | 32,783,844 | 65,840,652 |
| Distributions to shareholders | (2,290,482) | (634,417) |
| Share transactions | | |
| Proceeds from sales of shares | 84,019,680 | 15,671,136 |
| Reinvestment of distributions | 2,290,482 | 634,417 |
| Cost of shares redeemed | (56,582,859) | (25,221,879) |
| Net increase (decrease) in net assets resulting from share transactions | 29,727,303 | (8,916,326) |
| Total increase (decrease) in net assets | 60,220,665 | 56,289,909 |
| Net Assets | | |
| Beginning of period | 187,748,408 | 131,458,499 |
| End of period | $247,969,073 | $187,748,408 |
| Other Information | | |
| Shares | | |
| Sold | 5,579,828 | 1,220,926 |
| Issued in reinvestment of distributions | 155,287 | 49,046 |
| Redeemed | (3,445,496) | (1,901,831) |
| Net increase (decrease) | 2,289,619 | (631,859) |
See accompanying notes which are an integral part of the financial statements.
Financial Highlights
Fidelity Magellan K6 Fund
| | Six months ended (Unaudited) September 30, | Years endedMarch 31, | |
| | 2021 | 2021 | 2020 A |
| Selected Per–Share Data | | | |
| Net asset value, beginning of period | $14.35 | $9.59 | $10.00 |
| Income from Investment Operations | | | |
| Net investment income (loss)B | .01 | .04 | .06 |
| Net realized and unrealized gain (loss) | 1.92 | 4.77 | (.44) |
| Total from investment operations | 1.93 | 4.81 | (.38) |
| Distributions from net investment income | –C | (.05) | (.03) |
| Distributions from net realized gain | (.15) | – | – |
| Total distributions | (.15) | (.05) | (.03) |
| Net asset value, end of period | $16.13 | $14.35 | $9.59 |
| Total ReturnD,E | 13.54% | 50.18% | (3.83)% |
| Ratios to Average Net AssetsF,G | | | |
| Expenses before reductions | .45%H | .45% | .45%H |
| Expenses net of fee waivers, if any | .45%H | .45% | .45%H |
| Expenses net of all reductions | .45%H | .45% | .45%H |
| Net investment income (loss) | .16%H | .32% | .65%H |
| Supplemental Data | | | |
| Net assets, end of period (000 omitted) | $247,969 | $187,748 | $131,458 |
| Portfolio turnover rateI | 36%H,J | 62% | 93%H,J |
A For the period June 13, 2019 (commencement of operations) to March 31, 2020.
B Calculated based on average shares outstanding during the period.
C Amount represents less than $.005 per share.
D Total returns for periods of less than one year are not annualized.
E Total returns would have been lower if certain expenses had not been reduced during the applicable periods shown.
F Fees and expenses of any underlying mutual funds or exchange-traded funds (ETFs) are not included in the Fund's expense ratio. The Fund indirectly bears its proportionate share of these expenses. For additional expense information related to investments in Fidelity Central Funds, please refer to the "Investments in Fidelity Central Funds" note found in the Notes to Financial Statements section of the most recent Annual or Semi-Annual report.
G Expense ratios reflect operating expenses of the class. Expenses before reductions do not reflect amounts reimbursed, waived, or reduced through arrangements with the investment adviser, brokerage services, or other offset arrangements, if applicable, and do not represent the amount paid by the class during periods when reimbursements, waivers or reductions occur.
H Annualized
I Amount does not include the portfolio activity of any underlying mutual funds or exchange-traded funds (ETFs).
J Portfolio turnover rate excludes securities received or delivered in-kind.
See accompanying notes which are an integral part of the financial statements.
Notes to Financial Statements (Unaudited)
For the period ended September 30, 2021
1. Organization.
Fidelity Magellan K6 Fund (the Fund) is a fund of Fidelity Magellan Fund (the Trust) and is authorized to issue an unlimited number of shares. Share transactions on the Statement of Changes in Net Assets may contain exchanges between affiliated funds. The Trust is registered under the Investment Company Act of 1940, as amended (the 1940 Act), as an open-end management investment company organized as a Massachusetts business trust. Shares generally are available only to employer-sponsored retirement plans that are recordkept by Fidelity, or to certain employer-sponsored retirement plans that are not recordkept by Fidelity.
2. Investments in Fidelity Central Funds.
Funds may invest in Fidelity Central Funds, which are open-end investment companies generally available only to other investment companies and accounts managed by the investment adviser and its affiliates. The Schedule of Investments lists any Fidelity Central Funds held as an investment as of period end, but does not include the underlying holdings of each Fidelity Central Fund. An investing fund indirectly bears its proportionate share of the expenses of the underlying Fidelity Central Funds.
Based on its investment objective, each Fidelity Central Fund may invest or participate in various investment vehicles or strategies that are similar to those of the investing fund. These strategies are consistent with the investment objectives of the investing fund and may involve certain economic risks which may cause a decline in value of each of the Fidelity Central Funds and thus a decline in the value of the investing fund.
| Fidelity Central Fund | Investment Manager | Investment Objective | Investment Practices | Expense Ratio(a) |
| Fidelity Money Market Central Funds | Fidelity Management & Research Company LLC (FMR) | Each fund seeks to obtain a high level of current income consistent with the preservation of capital and liquidity. | Short-term Investments | Less than .005% |
(a) Expenses expressed as a percentage of average net assets and are as of each underlying Central Fund's most recent annual or semi-annual shareholder report.
A complete unaudited list of holdings for each Fidelity Central Fund is available upon request or at the Securities and Exchange Commission website at www.sec.gov. In addition, the financial statements of the Fidelity Central Funds which contain the significant accounting policies (including investment valuation policies) of those funds, and are not covered by the Report of Independent Registered Public Accounting Firm, are available on the Securities and Exchange Commission website or upon request.
3. Significant Accounting Policies.
The Fund is an investment company and applies the accounting and reporting guidance of the Financial Accounting Standards Board (FASB) Accounting Standards Codification Topic 946 Financial Services - Investment Companies. The financial statements have been prepared in conformity with accounting principles generally accepted in the United States of America (GAAP), which require management to make certain estimates and assumptions at the date of the financial statements. Actual results could differ from those estimates. Subsequent events, if any, through the date that the financial statements were issued have been evaluated in the preparation of the financial statements. The Fund's Schedule of Investments lists any underlying mutual funds or exchange-traded funds (ETFs) but does not include the underlying holdings of these funds. The following summarizes the significant accounting policies of the Fund:
Investment Valuation. Investments are valued as of 4:00 p.m. Eastern time on the last calendar day of the period. The Board of Trustees (the Board) has delegated the day to day responsibility for the valuation of the Fund's investments to the Fair Value Committee (the Committee) established by the Fund's investment adviser. In accordance with valuation policies and procedures approved by the Board, the Fund attempts to obtain prices from one or more third party pricing vendors or brokers to value its investments. When current market prices, quotations or currency exchange rates are not readily available or reliable, investments will be fair valued in good faith by the Committee, in accordance with procedures adopted by the Board. Factors used in determining fair value vary by investment type and may include market or investment specific events. The frequency with which these procedures are used cannot be predicted and they may be utilized to a significant extent. The Committee oversees the Fund's valuation policies and procedures and reports to the Board on the Committee's activities and fair value determinations. The Board monitors the appropriateness of the procedures used in valuing the Fund's investments and ratifies the fair value determinations of the Committee.
The Fund categorizes the inputs to valuation techniques used to value its investments into a disclosure hierarchy consisting of three levels as shown below:
- Level 1 – quoted prices in active markets for identical investments
- Level 2 – other significant observable inputs (including quoted prices for similar investments, interest rates, prepayment speeds, etc.)
- Level 3 – unobservable inputs (including the Fund's own assumptions based on the best information available)
Valuation techniques used to value the Fund's investments by major category are as follows:
Equity securities, including restricted securities, for which market quotations are readily available, are valued at the last reported sale price or official closing price as reported by a third party pricing vendor on the primary market or exchange on which they are traded and are categorized as Level 1 in the hierarchy. In the event there were no sales during the day or closing prices are not available, securities are valued at the last quoted bid price or may be valued using the last available price and are generally categorized as Level 2 in the hierarchy. For foreign equity securities, when market or security specific events arise, comparisons to the valuation of American Depositary Receipts (ADRs), futures contracts, Exchange-Traded Funds (ETFs) and certain indexes as well as quoted prices for similar securities may be used and would be categorized as Level 2 in the hierarchy. For equity securities, including restricted securities, where observable inputs are limited, assumptions about market activity and risk are used and these securities may be categorized as Level 3 in the hierarchy.
Investments in open-end mutual funds, including the Fidelity Central Funds, are valued at their closing net asset value (NAV) each business day and are categorized as Level 1 in the hierarchy.
Changes in valuation techniques may result in transfers in or out of an assigned level within the disclosure hierarchy. The aggregate value of investments by input level as of September 30, 2021 is included at the end of the Fund's Schedule of Investments.
Investment Transactions and Income. For financial reporting purposes, the Fund's investment holdings and NAV include trades executed through the end of the last business day of the period. The NAV per share for processing shareholder transactions is calculated as of the close of business of the New York Stock Exchange (NYSE), normally 4:00 p.m. Eastern time and includes trades executed through the end of the prior business day. Gains and losses on securities sold are determined on the basis of identified cost. Dividend income is recorded on the ex-dividend date, except for certain dividends from foreign securities where the ex-dividend date may have passed, which are recorded as soon as the Fund is informed of the ex-dividend date. Non-cash dividends included in dividend income, if any, are recorded at the fair market value of the securities received. Income and capital gain distributions from Fidelity Central Funds, if any, are recorded on the ex-dividend date.
Expenses. Expenses directly attributable to a fund are charged to that fund. Expenses attributable to more than one fund are allocated among the respective funds on the basis of relative net assets or other appropriate methods. Expenses included in the accompanying financial statements reflect the expenses of that fund and do not include any expenses associated with any underlying mutual funds or exchange-traded funds. Although not included in a fund's expenses, a fund indirectly bears its proportionate share of these expenses through the net asset value of each underlying mutual fund or exchange-traded fund. Expense estimates are accrued in the period to which they relate and adjustments are made when actual amounts are known.
Income Tax Information and Distributions to Shareholders. Each year, the Fund intends to qualify as a regulated investment company under Subchapter M of the Internal Revenue Code, including distributing substantially all of its taxable income and realized gains. As a result, no provision for U.S. Federal income taxes is required. The Fund files a U.S. federal tax return, in addition to state and local tax returns as required. The Fund's federal income tax returns are subject to examination by the Internal Revenue Service (IRS) for a period of three fiscal years after they are filed. State and local tax returns may be subject to examination for an additional fiscal year depending on the jurisdiction.
Distributions are declared and recorded on the ex-dividend date. Income and capital gain distributions are determined in accordance with income tax regulations, which may differ from GAAP.
Capital accounts within the financial statements are adjusted for permanent book-tax differences. These adjustments have no impact on net assets or the results of operations. Capital accounts are not adjusted for temporary book-tax differences which will reverse in a subsequent period.
Book-tax differences are primarily due to passive foreign investment companies (PFIC), capital loss carryforwards and losses deferred due to wash sales.
As of period end, the cost and unrealized appreciation (depreciation) in securities, and derivatives if applicable, for federal income tax purposes were as follows:
| Gross unrealized appreciation | $80,344,140 |
| Gross unrealized depreciation | (700,469) |
| Net unrealized appreciation (depreciation) | $79,643,671 |
| Tax cost | $167,737,815 |
4. Purchases and Sales of Investments.
Purchases and sales of securities, other than short-term securities and in-kind transactions, as applicable, are noted in the table below.
| | Purchases ($) | Sales ($) |
| Fidelity Magellan K6 Fund | 43,462,931 | 97,889,945 |
Unaffiliated Exchanges In-Kind. Shares that were exchanged for investments, including accrued interest and cash, if any, are shown in the table below. The amount of in-kind exchanges is included in share transactions in the accompanying Statement of Changes in Net Assets.
| | Shares | Total Proceeds
($) |
| Fidelity Magellan K6 Fund | 5,308,777 | 79,780,928 |
5. Fees and Other Transactions with Affiliates.
Management Fee. Fidelity Management & Research Company LLC (the investment adviser) and its affiliates provide the Fund with investment management related services for which the Fund pays a monthly management fee that is based on an annual rate of .45% of average net assets. Under the management contract, the investment adviser or an affiliate pays all other expenses of the Fund, excluding fees and expenses of the independent Trustees, and certain miscellaneous expenses such as proxy and shareholder meeting expenses.
Brokerage Commissions. A portion of portfolio transactions were placed with brokerage firms which are affiliates of the investment adviser. Brokerage commissions are included in net realized gain (loss) and change in net unrealized appreciation (depreciation) in the Statement of Operations. The commissions paid to these affiliated firms were as follows:
| | Amount |
| Fidelity Magellan K6 Fund | $548 |
Interfund Trades. Funds may purchase from or sell securities to other Fidelity Funds under procedures adopted by the Board. The procedures have been designed to ensure these interfund trades are executed in accordance with Rule 17a-7 of the 1940 Act. Any interfund trades are included within the respective purchases and sales amounts shown in the Purchases and Sales of Investments note and are noted in the table below.
| | Purchases ($) | Sales ($) |
| Fidelity Magellan K6 Fund | 5,324,023 | 4,600,422 |
6. Committed Line of Credit.
Certain Funds participate with other funds managed by the investment adviser or an affiliate in a $4.25 billion credit facility (the "line of credit") to be utilized for temporary or emergency purposes to fund shareholder redemptions or for other short-term liquidity purposes. The commitment fees on the pro-rata portion of the line of credit are borne by the investment adviser. During the period, there were no borrowings on this line of credit.
7. Security Lending.
Funds lend portfolio securities from time to time in order to earn additional income. Lending agents are used, including National Financial Services (NFS), an affiliate of the investment adviser. Pursuant to a securities lending agreement, NFS will receive a fee, which is capped at 9.9% of a fund's daily lending revenue, for its services as lending agent. A fund may lend securities to certain qualified borrowers, including NFS. On the settlement date of the loan, a fund receives collateral (in the form of U.S. Treasury obligations, letters of credit and/or cash) against the loaned securities and maintains collateral in an amount not less than 100% of the market value of the loaned securities during the period of the loan. The market value of the loaned securities is determined at the close of business of a fund and any additional required collateral is delivered to a fund on the next business day. A fund or borrower may terminate the loan at any time, and if the borrower defaults on its obligation to return the securities loaned because of insolvency or other reasons, a fund may apply collateral received from the borrower against the obligation. A fund may experience delays and costs in recovering the securities loaned. Any cash collateral received is invested in the Fidelity Securities Lending Cash Central Fund. Any loaned securities are identified as such in the Schedule of Investments, and the value of loaned securities and cash collateral at period end, as applicable, are presented in the Statement of Assets and Liabilities. Security lending income represents the income earned on investing cash collateral, less rebates paid to borrowers and any lending agent fees associated with the loan, plus any premium payments received for lending certain types of securities. Security lending income is presented in the Statement of Operations as a component of income from Fidelity Central Funds. Affiliated security lending activity, if any, was as follows:
| | Total Security Lending Fees Paid to NFS | Security Lending Income From Securities Loaned to NFS | Value of Securities Loaned to NFS at Period End |
| Fidelity Magellan K6 Fund | $10 | $– | $– |
8. Bank Borrowings.
The Fund is permitted to have bank borrowings for temporary or emergency purposes to fund shareholder redemptions or for other short-term liquidity requirements. The Fund has established borrowing arrangements with certain banks. The interest rate on the borrowings is the bank's base rate, as revised from time to time. Any open loans, including accrued interest, at period end are presented under the caption "Notes payable" in the Statement of Assets and Liabilities, if applicable. Activity in this program during the period for which loans were outstanding was as follows:
| | Average Loan Balance | Weighted Average Interest Rate | Interest Expense |
| Fidelity Magellan K6 Fund | $37,413,000 | .60% | $624 |
9. Expense Reductions.
Commissions paid to certain brokers with whom the investment adviser, or its affiliates, places trades on behalf of the Fund include an amount in addition to trade execution, which may be rebated back to the Fund to offset expenses. This amount totaled $2,352 for the period.
10. Other.
Fund's organizational documents provide former and current trustees and officers with a limited indemnification against liabilities arising in connection with the performance of their duties to the fund. In the normal course of business, the fund may also enter into contracts that provide general indemnifications. The fund's maximum exposure under these arrangements is unknown as this would be dependent on future claims that may be made against the fund. The risk of material loss from such claims is considered remote.
11. Coronavirus (COVID-19) Pandemic.
An outbreak of COVID-19 first detected in China during December 2019 has since spread globally and was declared a pandemic by the World Health Organization during March 2020. Developments that disrupt global economies and financial markets, such as the COVID-19 pandemic, may magnify factors that affect the Fund's performance.
Shareholder Expense Example
As a shareholder, you incur two types of costs: (1) transaction costs, which may include sales charges (loads) on purchase payments or redemption proceeds, as applicable and (2) ongoing costs, which generally include management fees, distribution and/or service (12b-1) fees and other Fund expenses. This Example is intended to help you understand your ongoing costs (in dollars) of investing in a fund and to compare these costs with the ongoing costs of investing in other mutual funds.
The Example is based on an investment of $1,000 invested at the beginning of the period and held for the entire period (April 1, 2021 to September 30, 2021).
Actual Expenses
The first line of the accompanying table provides information about actual account values and actual expenses. You may use the information in this line, together with the amount you invested, to estimate the expenses that you paid over the period. Simply divide your account value by $1,000.00 (for example, an $8,600 account value divided by $1,000.00 = 8.6), then multiply the result by the number in the first line for a class/Fund under the heading entitled "Expenses Paid During Period" to estimate the expenses you paid on your account during this period. If any fund is a shareholder of any underlying mutual funds or exchange-traded funds (ETFs) (the Underlying Funds), such fund indirectly bears its proportional share of the expenses of the Underlying Funds in addition to the direct expenses incurred presented in the table. These fees and expenses are not included in the annualized expense ratio used to calculate the expense estimate in the table below.
Hypothetical Example for Comparison Purposes
The second line of the accompanying table provides information about hypothetical account values and hypothetical expenses based on the actual expense ratio and an assumed rate of return of 5% per year before expenses, which is not the actual return. The hypothetical account values and expenses may not be used to estimate the actual ending account balance or expenses you paid for the period. You may use this information to compare the ongoing costs of investing in the Fund and other funds. To do so, compare this 5% hypothetical example with the 5% hypothetical examples that appear in the shareholder reports of the other funds. If any fund is a shareholder of any Underlying Funds, such fund indirectly bears its proportional share of the expenses of the Underlying Funds in addition to the direct expenses as presented in the table. These fees and expenses are not included in the annualized expense ratio used to calculate the expense estimate in the table below.
Please note that the expenses shown in the table are meant to highlight your ongoing costs only and do not reflect any transaction costs. Therefore, the second line of the table is useful in comparing ongoing costs only, and will not help you determine the relative total costs of owning different funds.
| | Annualized Expense Ratio-A | Beginning
Account Value
April 1, 2021 | Ending
Account Value
September 30, 2021 | Expenses Paid
During Period-B
April 1, 2021
to September 30, 2021 |
| Fidelity Magellan K6 Fund | .45% | | | |
| Actual | | $1,000.00 | $1,135.40 | $2.41 |
| Hypothetical-C | | $1,000.00 | $1,022.81 | $2.28 |
A Annualized expense ratio reflects expenses net of applicable fee waivers.
B Expenses are equal to the annualized expense ratio, multiplied by the average account value over the period, multiplied by 183/ 365 (to reflect the one-half year period). The fees and expenses of any Underlying Funds are not included in each annualized expense ratio.
C 5% return per year before expenses
Board Approval of Investment Advisory Contracts and Management Fees
Fidelity Magellan K6 Fund
Each year, the Board of Trustees, including the Independent Trustees (together, the Board), votes on the renewal of the management contract with Fidelity Management & Research Company LLC (FMR) and the sub-advisory agreements (together, the Advisory Contracts) for the fund. FMR and the sub-advisers are referred to herein as the Investment Advisers. The Board, assisted by the advice of fund counsel and Independent Trustees' counsel, requests and considers a broad range of information relevant to the renewal of the Advisory Contracts throughout the year.
The Board meets regularly and, at each of its meetings, covers an extensive agenda of topics and materials and considers factors that are relevant to its annual consideration of the renewal of the fund's Advisory Contracts, including the services and support provided to the fund and its shareholders. The Board has established various standing committees (Committees), each composed of and chaired by Independent Trustees with varying backgrounds, to which the Board has assigned specific subject matter responsibilities in order to enhance effective decision-making by the Board. The Board, acting directly and through its Committees, requests and receives information concerning the annual consideration of the renewal of the fund's Advisory Contracts. The Board also meets as needed to review matters specifically related to the Board's annual consideration of the renewal of the Advisory Contracts. Members of the Board may also meet with trustees of other Fidelity funds through joint ad hoc committees to discuss certain matters relevant to all of the Fidelity funds.
At its May 2021 meeting, the Board unanimously determined to renew the fund's Advisory Contracts. In reaching its determination, the Board considered all factors it believed relevant, including (i) the nature, extent, and quality of the services provided to the fund and its shareholders (including the investment performance of the fund); (ii) the competitiveness of the fund's management fee and total expense ratio relative to peer funds; (iii) the total costs of the services provided by and the profits realized by Fidelity from its relationships with the fund; and (iv) the extent to which, if any, economies of scale exist and are realized as the fund grows, and whether any economies of scale are appropriately shared with fund shareholders.
In considering whether to renew the Advisory Contracts for the fund, the Board reached a determination, with the assistance of fund counsel and Independent Trustees' counsel and through the exercise of its business judgment, that the renewal of the Advisory Contracts was in the best interests of the fund and its shareholders and that the compensation payable under the Advisory Contracts was fair and reasonable. The Board's decision to renew the Advisory Contracts was not based on any single factor, but rather was based on a comprehensive consideration of all the information provided to the Board at its meetings throughout the year. The Board, in reaching its determination to renew the Advisory Contracts, was aware that shareholders of the fund have a broad range of investment choices available to them, including a wide choice among funds offered by Fidelity's competitors, and that the fund's shareholders, who have the opportunity to review and weigh the disclosure provided by the fund in its prospectus and other public disclosures, have chosen to invest in this fund, which is part of the Fidelity family of funds.
Nature, Extent, and Quality of Services Provided. The Board considered Fidelity's staffing as it relates to the fund, including the backgrounds of investment personnel of Fidelity, and also considered the fund's investment objective, strategies, and related investment philosophy. The Independent Trustees also had discussions with senior management of Fidelity's investment operations and investment groups. The Board considered the structure of the investment personnel compensation program and whether this structure provides appropriate incentives to act in the best interests of the fund. Additionally, the Board considered the portfolio managers' investments, if any, in the funds that they manage.
Resources Dedicated to Investment Management and Support Services. The Board and the Fund Oversight and Research Committees reviewed the general qualifications and capabilities of Fidelity's investment staff, including its size, education, experience, and resources, as well as Fidelity's approach to recruiting, training, managing, and compensating investment personnel. The Board noted that Fidelity has continued to increase the resources devoted to non-U.S. offices, including expansion of Fidelity's global investment organization. The Board also noted that Fidelity's analysts have extensive resources, tools and capabilities that allow them to conduct sophisticated quantitative and fundamental analysis, as well as credit analysis of issuers, counterparties and guarantors. Further, the Board considered that Fidelity's investment professionals have sufficient access to global information and data so as to provide competitive investment results over time, and that those professionals also have access to sophisticated tools that permit them to assess portfolio construction and risk and performance attribution characteristics continuously, as well as to transmit new information and research conclusions rapidly around the world. Additionally, in its deliberations, the Board considered Fidelity's trading, risk management, compliance, and technology and operations capabilities and resources, which are integral parts of the investment management process. The Board also considered Fidelity's investments in business continuity planning, and its success in continuously providing services to the fund notwithstanding the severe disruptions caused by the COVID-19 pandemic.
Shareholder and Administrative Services. The Board considered (i) the nature, extent, quality, and cost of advisory, administrative, and shareholder services performed by the Investment Advisers and their affiliates under the Advisory Contracts and under separate agreements covering transfer agency, pricing and bookkeeping, and securities lending services for the fund; (ii) the nature and extent of the supervision of third party service providers, principally custodians, subcustodians, and pricing vendors; and (iii) the resources devoted to, and the record of compliance with, the fund's compliance policies and procedures. The Board also reviewed the allocation of fund brokerage, including allocations to brokers affiliated with the Investment Advisers, the use of brokerage commissions to pay fund expenses, and the use of "soft" commission dollars to pay for research services.
The Board noted that the growth of fund assets over time across the complex allows Fidelity to reinvest in the development of services designed to enhance the value and convenience of the Fidelity funds as investment vehicles. These services include 24-hour access to account information and market information over the Internet and through telephone representatives, investor education materials and asset allocation tools, and the expanded availability of Fidelity Investor Centers.
The Board noted that, in the past, it and the boards of certain other Fidelity funds had formed an ad hoc Committee on Transfer Agency Fees to review the variety of transfer agency fee structures throughout the industry and Fidelity's competitive positioning with respect to industry participants.
Investment in a Large Fund Family. The Board considered the benefits to shareholders of investing in a Fidelity fund, including the benefits of investing in a fund that is part of a large family of funds offering a variety of investment disciplines and providing a large variety of mutual fund investor services. The Board noted that Fidelity had taken, or had made recommendations that resulted in the Fidelity funds taking, a number of actions over the previous year that benefited particular funds, including: (i) continuing to dedicate additional resources to Fidelity's investment research process, which includes meetings with management of issuers of securities in which the funds invest, and to the support of the senior management team that oversees asset management; (ii) continuing efforts to enhance Fidelity's global research capabilities; (iii) launching new funds and ETFs with innovative structures, strategies and pricing and making other enhancements to meet client needs; (iv) launching new share classes of existing funds; (v) eliminating purchase minimums and broadening eligibility requirements for certain funds and share classes; (vi) approving the reduction in the holding period for the Class C to Class A conversion policy; (vii) reducing management fees and total expenses for certain target date funds and classes and index funds; (viii) lowering expenses for certain existing funds and classes by implementing or lowering expense caps; (ix) rationalizing product lines and gaining increased efficiencies from fund mergers, liquidations, and share class consolidations; (x) continuing to develop, acquire and implement systems and technology to improve services to the funds and shareholders, strengthen information security, and increase efficiency; and (xi) continuing to implement enhancements to further strengthen Fidelity's product line to increase investors' probability of success in achieving their investment goals, including retirement income goals.
Investment Performance. The Board considered whether the fund has operated in accordance with its investment objective, as well as its record of compliance with its investment restrictions and its performance history. The Board noted that there was a portfolio management change for the fund in January 2020. The Board will continue to monitor closely the fund's performance, taking into account the portfolio management change.
The Board took into account discussions that occur at Board meetings throughout the year with representatives of the Investment Advisers about fund investment performance. In this regard the Board noted that as part of regularly scheduled fund reviews and other reports to the Board on fund performance, the Board considers annualized return information for the fund for different time periods, measured against an appropriate securities market index (benchmark index) and an appropriate peer group of funds with similar objectives (peer group). In its evaluation of fund investment performance, the Board gave particular attention to information indicating changes in performance of certain Fidelity funds for specific time periods and discussed with the Investment Advisers the reasons for any overperformance or underperformance.
In addition to reviewing absolute and relative fund performance, the Independent Trustees periodically consider the appropriateness of fund performance metrics in evaluating the results achieved. In general, the Independent Trustees believe that fund performance should be evaluated based on net performance (after fees and expenses) of both the highest performing and lowest performing fund share classes, where applicable, compared to appropriate benchmark indices, over appropriate time periods that may include full market cycles, and compared to peer groups, as applicable, over the same periods, taking into account relevant factors including the following: general market conditions; issuer-specific information; and fund cash flows and other factors.
The Independent Trustees recognize that shareholders evaluate performance on a net basis over their own holding periods, for which one-, three-, and five-year periods are often used as a proxy. For this reason, the performance information reviewed by the Board also included net total return information for the fund and an appropriate benchmark index and peer group for the most recent one-year period ended September 30, 2020, as shown below. Returns are shown compared to the 25th percentile (top of box, 75% beaten) and 75th percentile (bottom of box, 25% beaten) of the peer universe.
Fidelity Magellan K6

Based on its review, the Board concluded that the nature, extent, and quality of services provided to the fund under the Advisory Contracts should continue to benefit the shareholders of the fund.
Competitiveness of Management Fee and Total Expense Ratio. The Board considered the fund's management fee and total expense ratio compared to "mapped groups" of competitive funds and classes created for the purpose of facilitating the Trustees' competitive analysis of management fees and total expenses. Fidelity creates "mapped groups" by combining similar Lipper investment objective categories that have comparable investment mandates. Combining Lipper investment objective categories aids the Board's management fee and total expense ratio comparisons by broadening the competitive group used for comparison.
Management Fee. The Board considered two proprietary management fee comparisons for the the 12-month (or shorter) periods ended September 30 (June 30 for the period ended 2019) shown in basis points (BP) in the chart below. The group of Lipper funds used by the Board for management fee comparisons is referred to below as the "Total Mapped Group." The Total Mapped Group comparison focuses on a fund's standing in terms of gross management fees before expense reimbursements or caps relative to the total universe of funds with comparable investment mandates, regardless of whether their management fee structures also are comparable. Funds with comparable investment mandates offer exposure to similar types of securities. Funds with comparable management fee structures have similar management fee contractual arrangements (
e.g., flat rate charged for advisory services, all-inclusive fee rate,
etc.). "TMG %" represents the percentage of funds in the Total Mapped Group that had management fees that were lower than the fund's. For example, a hypothetical TMG % of 20% would mean that 80% of the funds in the Total Mapped Group had higher, and 20% had lower, management fees than the fund. The fund's actual TMG %s and the number of funds in the Total Mapped Group are in the chart below. The "Asset-Sized Peer Group" (ASPG) comparison focuses on a fund's standing relative to a subset of non-Fidelity funds within the Total Mapped Group that are similar in size and management fee structure. For example, if a fund is in the first quartile of the ASPG, the fund's management fee ranks in the least expensive or lowest 25% of funds in the ASPG. The ASPG represents at least 15% of the funds in the Total Mapped Group with comparable asset size and management fee structures, subject to a minimum of 50 funds (or all funds in the Total Mapped Group if fewer than 50). Additional information, such as the ASPG quartile in which the fund's management fee rate ranked is also included in the chart and was considered by the Board.
Fidelity Magellan K6 Fund
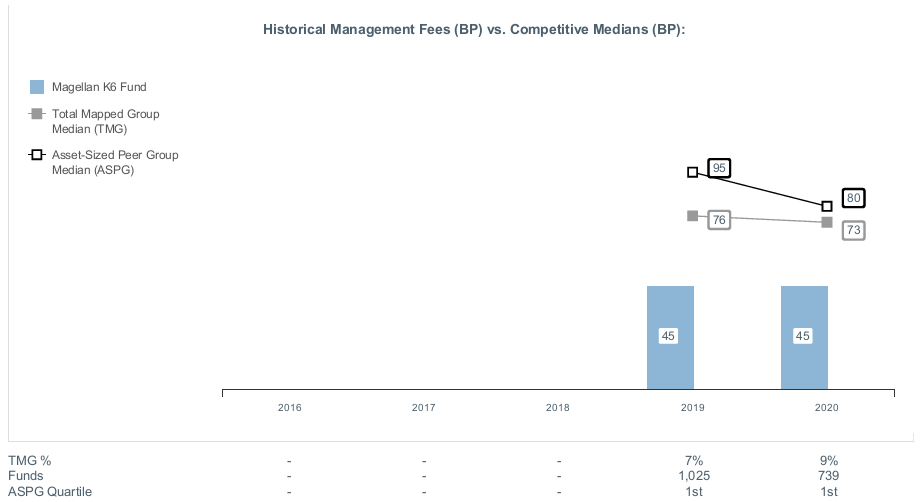
The Board noted that the fund's management fee rate ranked below the median of its Total Mapped Group and below the median of its ASPG for the 12-month period ended September 30, 2020.
The Board noted that, in the past, it and the boards of other Fidelity funds had formed an ad hoc Committee on Group Fee to conduct an in-depth review of the "group fee" component of the management fee of funds with such management fee structures. The Committee's focus included the mechanics of the group fee, the competitive landscape of group fee structures, Fidelity funds with no group fee component (such as the fund) and investment products not included in group fee assets. The Board also considered that, for funds subject to the group fee, FMR agreed to voluntarily waive fees over a specified period of time in amounts designed to account for assets converted from certain funds to certain collective investment trusts.
The Board also noted that, in 2013, the ad hoc Committee on Management Fees was formed to conduct an in-depth review of the management fee rates of Fidelity's active equity mutual funds. The Committee focused on the following areas: (i) standard fee structures; (ii) research consumption and trading evolution; (iii) management fee competitiveness/profitability by category; and (iv) factors that drive institutional pricing.
Based on its review, the Board concluded that the fund's management fee is fair and reasonable in light of the services that the fund receives and the other factors considered.
Total Expense Ratio. In its review of the fund's total expense ratio, the Board considered the fund's unitary fee rate as well as other fund expenses paid by FMR under the fund's management contract, such as transfer agent fees, pricing and bookkeeping fees, and custodial, legal, and audit fees. The Board also noted that Fidelity may agree to waive fees or reimburse expenses from time to time, and the extent to which, if any, it has done so for the fund. As part of its review, the Board also considered the current and historical total expense ratios of the fund compared to competitive fund median expenses. The fund is compared to those funds and classes in the Total Mapped Group (used by the Board for management fee comparisons) that have a similar sales load structure (SLTG). The Board also considered a total expense ASPG comparison for the fund, which focuses on the total expenses of the fund relative to a subset of non-Fidelity funds within the total expense SLTG. The total expense ASPG is limited to 15 larger and 15 smaller classes in fund average assets for a total of 30 classes, where possible. The total expense ASPG comparison excludes performance adjustments and fund-paid 12b-1 fees to eliminate variability in fee structures.
The Board noted that the fund's total expense ratio ranked below the SLTG competitive median and below the ASPG competitive median for the 12-month period ended September 30, 2020.
Fees Charged to Other Fidelity Clients. The Board also considered Fidelity fee structures and other information with respect to clients of Fidelity, such as other funds advised or subadvised by Fidelity, pension plan clients, and other institutional clients with similar mandates. The Board noted that a joint ad hoc committee created by it and the boards of other Fidelity funds periodically reviews and compares Fidelity's institutional investment advisory business with its business of providing services to the Fidelity funds and also noted the most recent findings of the committee. The Board noted that the committee's review included a consideration of the differences in services provided, fees charged, and costs incurred, as well as competition in the markets serving the different categories of clients.
Based on its review of total expense ratios and fees charged to other Fidelity clients, the Board concluded that the fund's total expense ratio was reasonable in light of the services that the fund and its shareholders receive and the other factors considered.
Costs of the Services and Profitability. The Board considered the revenues earned and the expenses incurred by Fidelity in conducting the business of developing, marketing, distributing, managing, administering and servicing the fund and servicing the fund's shareholders. The Board also considered the level of Fidelity's profits in respect of all the Fidelity funds.
On an annual basis, Fidelity presents to the Board information about the profitability of its relationships with the fund. Fidelity calculates profitability information for each fund, as well as aggregate profitability information for groups of Fidelity funds and all Fidelity funds, using a series of detailed revenue and cost allocation methodologies which originate with the books and records of Fidelity on which Fidelity's audited financial statements are based. The Audit Committee of the Board reviews any significant changes from the prior year's methodologies and the full Board approves such changes.
A public accounting firm has been engaged annually by the Board as part of the Board's assessment of Fidelity's profitability analysis. The engagement includes the review and assessment of the methodologies used by Fidelity in determining the revenues and expenses attributable to Fidelity's mutual fund business, and completion of agreed-upon procedures in respect of the mathematical accuracy of certain fund profitability information and its conformity to established allocation methodologies. After considering the reports issued under the engagement and information provided by Fidelity, the Board concluded that while other allocation methods may also be reasonable, Fidelity's profitability methodologies are reasonable in all material respects.
The Board also reviewed Fidelity's non-fund businesses and potential indirect benefits such businesses may have received as a result of their association with Fidelity's mutual fund business (i.e., fall-out benefits) as well as cases where Fidelity's affiliates may benefit from the funds' business. The Board considered areas where potential indirect benefits to the Fidelity funds from their relationships with Fidelity may exist. The Board also considered that in 2019 a joint ad hoc committee created by it and the boards of other Fidelity funds evaluated potential fall-out benefits (PFOB Committee). The Board noted that it considered the PFOB Committee's findings in connection with its consideration of the renewal of the Advisory Contracts.
The Board considered the costs of the services provided by and the profits realized by Fidelity in connection with the operation of the fund, including the conclusions of the PFOB Committee, and was satisfied that the profitability was not excessive.
Economies of Scale. The Board considered whether there have been economies of scale in respect of the management of the Fidelity funds, whether the Fidelity funds (including the fund) have appropriately benefited from any such economies of scale, and whether there is potential for realization of any further economies of scale. The Board considered the extent to which the fund will benefit from economies of scale as assets grow through increased services to the fund, through waivers or reimbursements, or through fee or expense ratio reductions. The Board recognized that, due to the fund's current contractual arrangements, its expense ratio will not decline if the fund's operating costs decrease as assets grow, or rise as assets decrease. The Board also noted that a committee (the Economies of Scale Committee) created by it and the boards of other Fidelity funds periodically analyzes whether Fidelity attains economies of scale in respect of the management and servicing of the Fidelity funds, whether the Fidelity funds have appropriately benefited from such economies of scale, and whether there is potential for realization of any further economies of scale.
The Board concluded, taking into account the analysis of the Economies of Scale Committee, that economies of scale, if any, are being appropriately shared between fund shareholders and Fidelity.
Additional Information Requested by the Board. In order to develop fully the factual basis for consideration of the Fidelity funds' advisory contracts, the Board requested and received additional information on certain topics, including: (i) fund flow and performance trends, in particular the underperformance of certain funds and strategies, and Fidelity's long-term strategies for certain funds; (ii) consideration of expanding the use of performance fees for additional funds; (iii) Fidelity's pricing philosophy compared to competitors; (iv) metrics for evaluating index fund and ETF performance and information about ETF trading characteristics; (v) the methodology with respect to evaluating competitive fund data and peer group classifications and fee and expense comparisons; (vi) the expense structures for different funds and classes and information about the differences between various expense structures; (vii) group fee breakpoints; (viii) information regarding other accounts managed by Fidelity and sub-advisory arrangements; and (ix) Fidelity's philosophies and strategies for evaluating funds and classes with lower or declining asset levels.
Based on its evaluation of all of the conclusions noted above, and after considering all factors it believed relevant, the Board concluded that the advisory fee arrangements are fair and reasonable, and that the fund's Advisory Contracts should be renewed.
MAG-K6-SANN-1121
1.9893882.102