2016-2018 Strategic Plan Summary November 10, 2015 Ampco-Pittsburgh Corporation Exhibit 99.1
The Private Securities Litigation Reform Act of 1995 (the “Act”) provides a safe harbor for forward-looking statements made by or on our behalf. This news release may contain forward-looking statements that reflect our current views with respect to future events and financial performance. All statements in this document other than statements of historical fact are statements that are, or could be, deemed forward-looking statements within the meaning of the Act. In this document, statements regarding future financial position, sales, costs, earnings, cash flows, other measures of results of operations, capital expenditures or debt levels and plans, objectives, outlook, targets, guidance or goals are forward-looking statements. Words such as “may,” “intend,” “believe,” “expect,” “anticipate,” “estimate,” “project,” “forecast” and other terms of similar meaning that indicate future events and trends are also generally intended to identify forward-looking statements. Forward-looking statements speak only as of the date on which such statements are made, are not guarantees of future performance or expectations, and involve risks and uncertainties. For Ampco-Pittsburgh, these risks and uncertainties include, but are not limited to, those described under Item 1A, Risk Factors, of Ampco-Pittsburgh’s Annual Report on Form 10-K. In addition, there may be events in the future that we are not able to predict accurately or control which may cause actual results to differ materially from expectations expressed or implied by forward-looking statements. Except as required by applicable law, we assume no obligation, and disclaim any obligation, to update forward-looking statements whether as a result of new information, events or otherwise.
Presentation Outline Welcome, IntroductionJohn Stanik Forged and Cast Engineered ProductsRodney Scagline Air and Liquid ProcessingTerry Kenny SummaryDee Ann Johnson Questions
Who is Ampco-Pittsburgh Corporation? Ampco-Pittsburgh Corporation manufactures and sells highly engineered, high performance specialty metal products and customized equipment utilized by industry throughout the world. Two segments are reported: Forged and Cast Engineered Products (known as UES) Air and Liquid Processing
Today’s speakers John Stanik, CEO Dee Ann Johnson, CFO Rodney Scagline, President, Forged and Cast Engineered Products (Union Electric Steel) Terry Kenny, President, Air & Liquid Systems
State of Ampco-Pittsburgh Forged and Cast Engineered Products or Union Electric Steel (UES) Historically served steel and aluminum industry primarily Current steel industry market conditions: Excess global steelmaking capacity impacting customer financial performance Cost control extended to vendors purchases Price concessions, emphasis on cost not performance Idled capacity in North America and Europe Result: Volume and revenue decline, margin decline Expect no steel industry recovery until 2017, at the earliest
State of Ampco-Pittsburgh cont’d Good news: Flexible manufacturing assets: open-die forging Market pull into fracking industry Opportunity to diversify into broader markets Added Alloys Unlimited & Processing company (forged and cast product distribution center including short turnaround, emergency supply)
State of Ampco-Pittsburgh cont’d Air and Liquid Processing Comprised of three businesses: Aerofin – Heat exchangers Buffalo Air Handling – Custom air handling systems Buffalo Pumps – Specialty centrifugal pumps Profitable, consistent performer Buffalo Air performance improvement in 2015 Lack of growth over past several years
Key strategies to improve performance Union Electric Steel – stabilize business and return to profitability Roll Business Reduce costs (lean techniques) Invest in technical development Position as global player Other actions
Key strategies to improve performance cont’d Diversify – open-die forged products Fracking industry Broaden capabilities Sales Logistics Manufacturing Geography Products
Key strategies to improve performance cont’d Air and Liquid Processing Grow revenue Reduce costs, increase margins Strengthen engineering and manufacturing capabilities Revise sales and marketing approach
How will we be successful? A Process Action plans have been assigned and will be measured and tracked. Clear delineation of responsibilities Annual strategy update Incorporate action plan results into compensation and annual internal business plans Monitor risks and mitigate in timely fashion; ERM in place Invest wisely with strong ROIC (including M&A) Integrate any acquisitions and maximize synergies
2016 – 2018 Strategic Plan Union Electric Steel
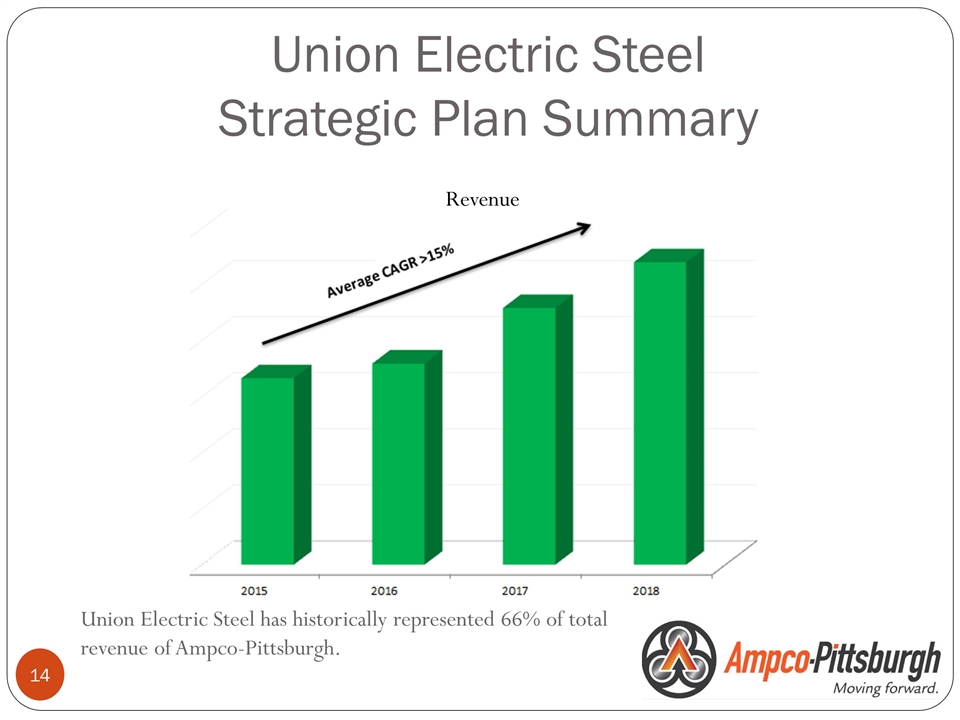
Union Electric Steel Strategic Plan Summary Union Electric Steel has historically represented 66% of total revenue of Ampco-Pittsburgh. Revenue
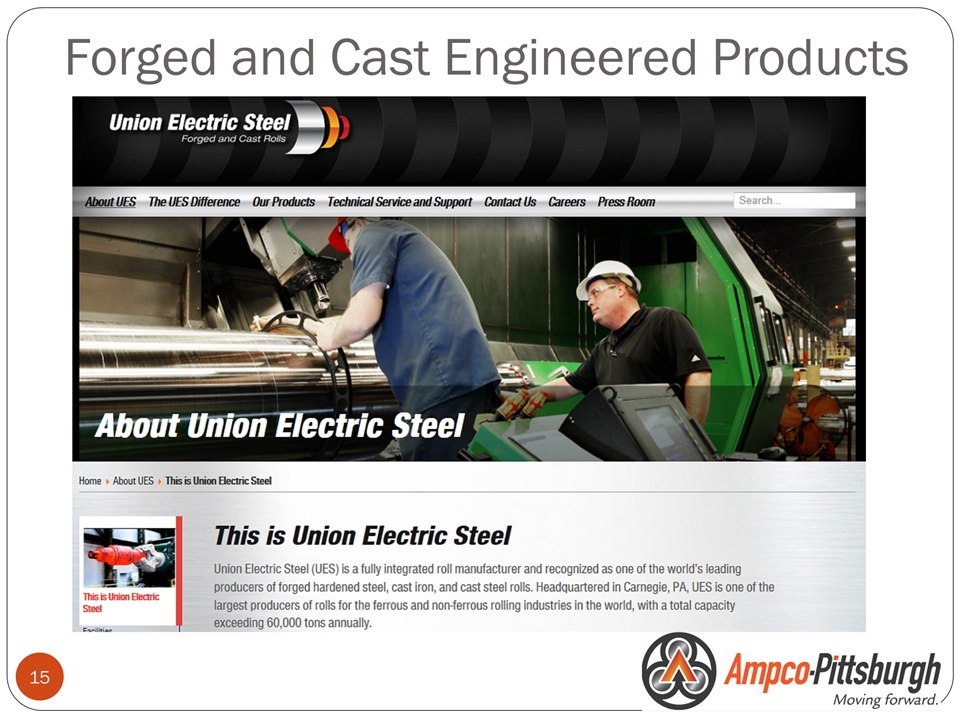
Forged and Cast Engineered Products
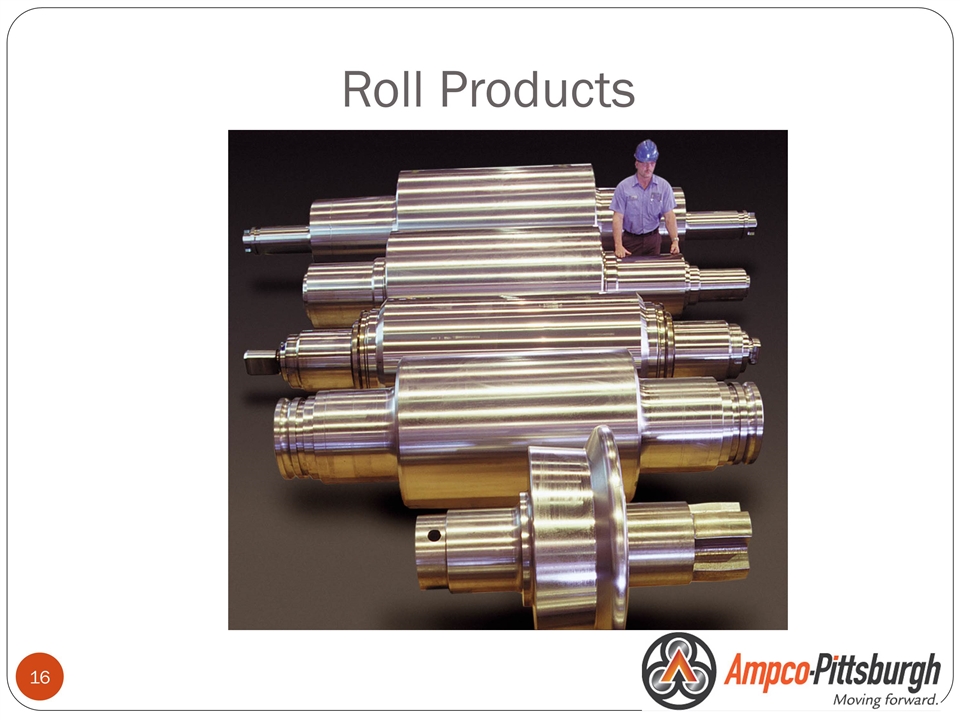
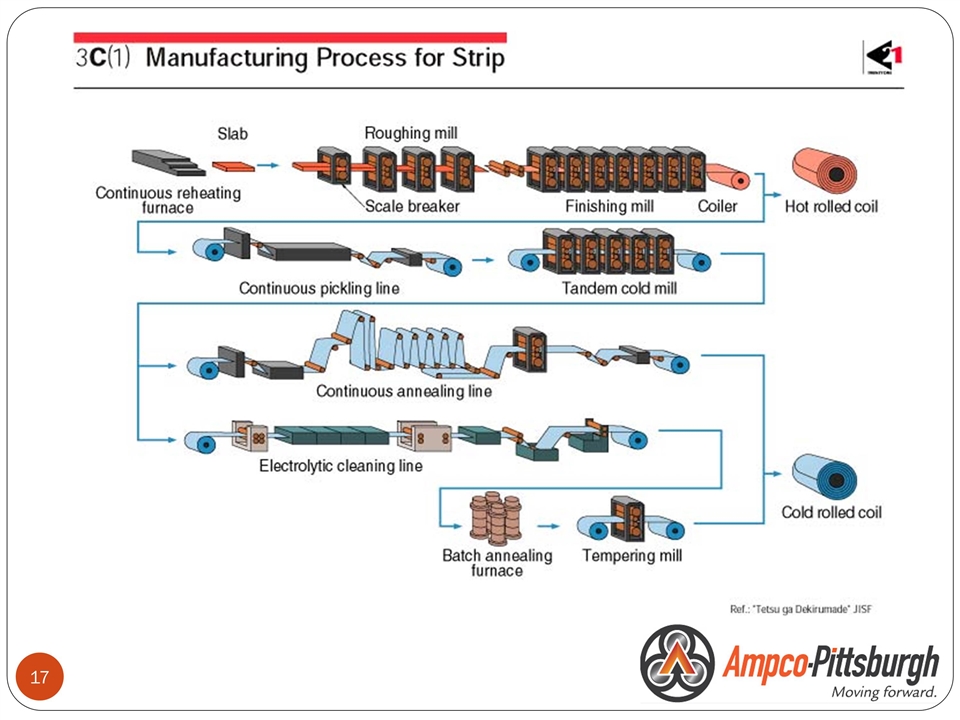
Roll Products
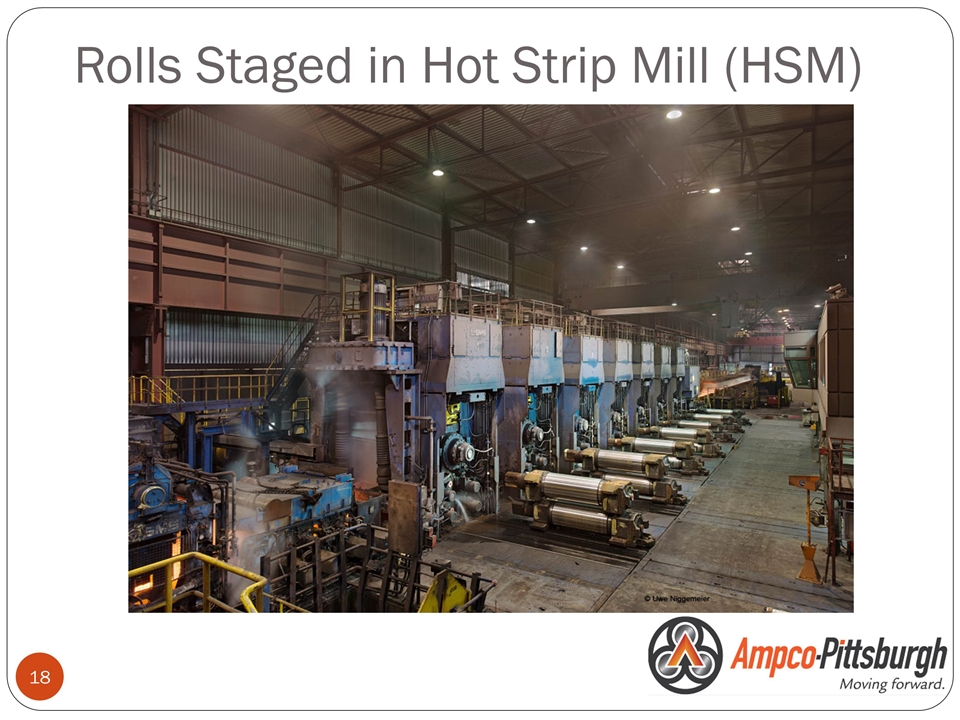
Rolls Staged in Hot Strip Mill (HSM)
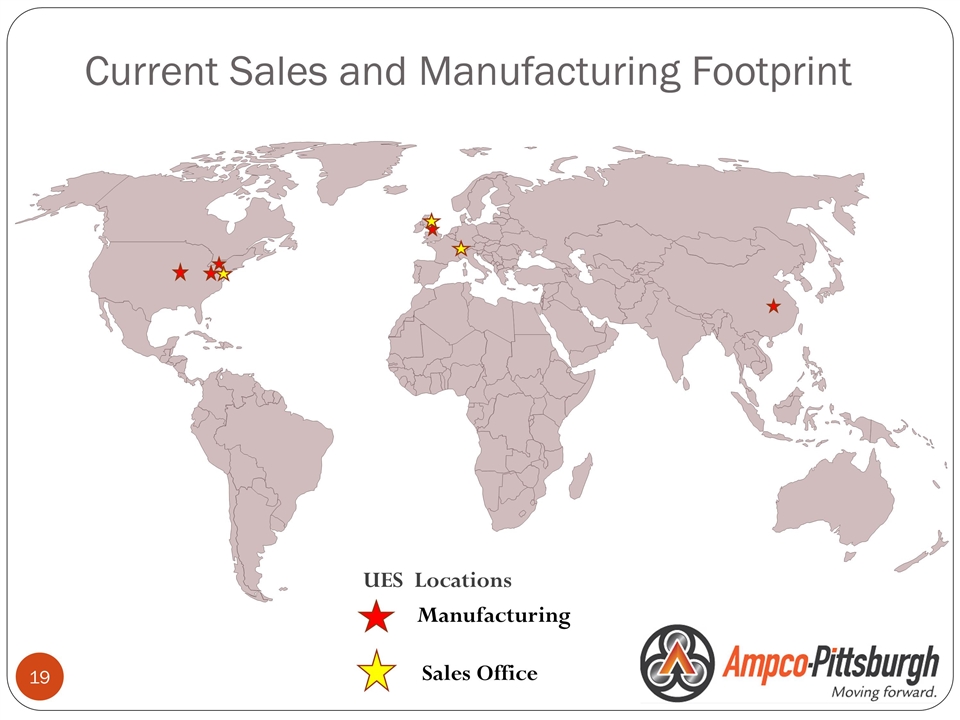
UES Locations Manufacturing Sales Office Current Sales and Manufacturing Footprint
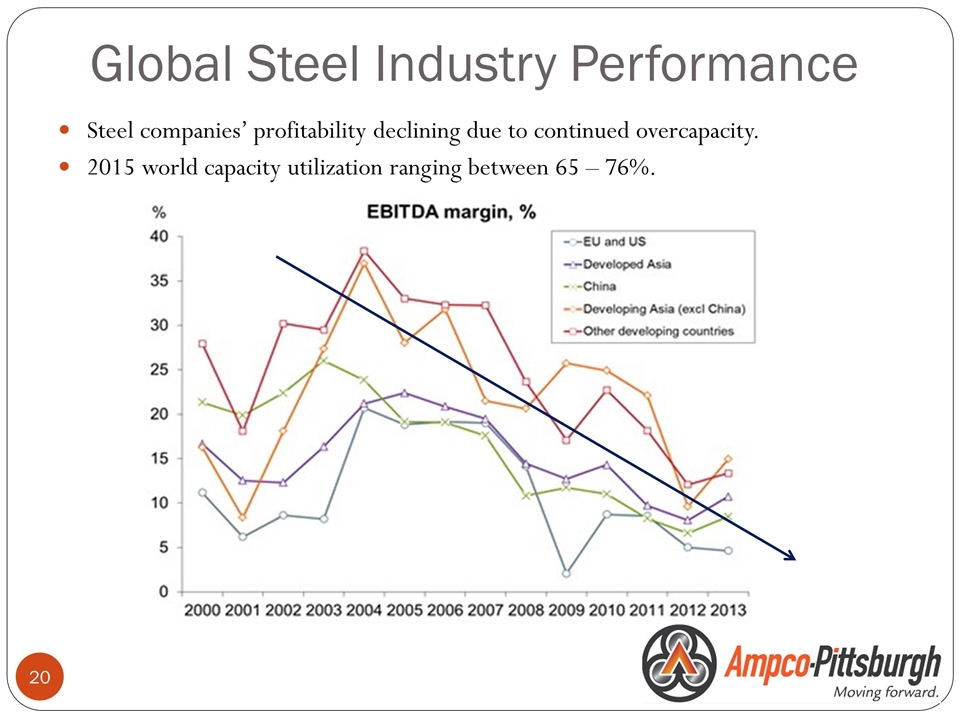
Global Steel Industry Performance Steel companies’ profitability declining due to continued overcapacity. 2015 world capacity utilization ranging between 65 – 76%.
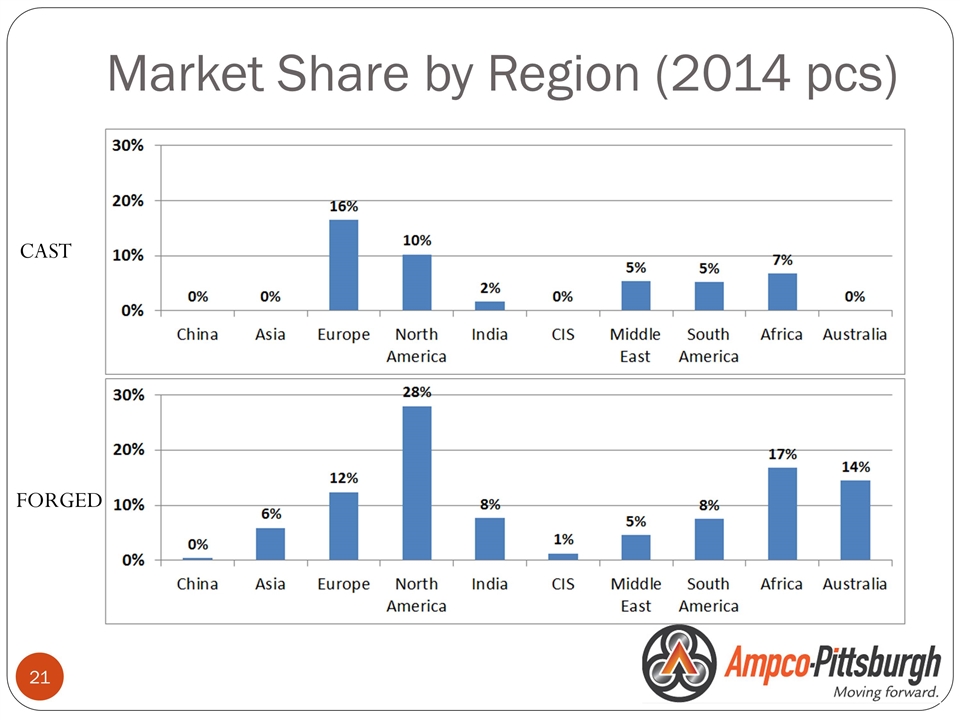
Market Share by Region (2014 pcs) CAST FORGED
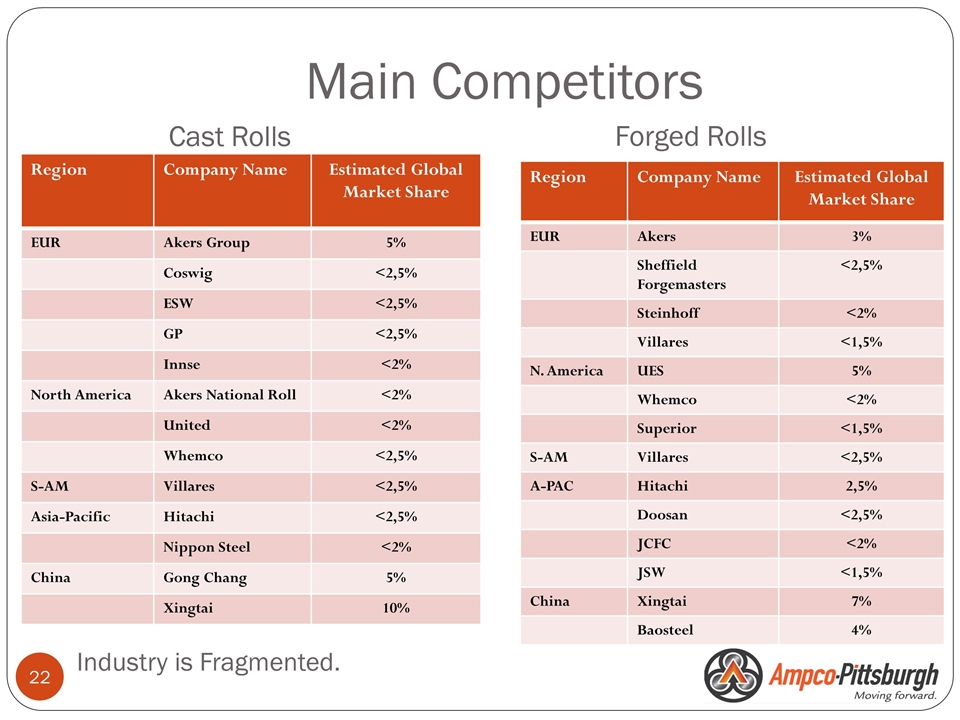
Region Company Name Estimated Global Market Share EUR Akers Group 5% Coswig <2,5% ESW <2,5% GP <2,5% Innse <2% North America Akers National Roll <2% United <2% Whemco <2,5% S-AM Villares <2,5% Asia-Pacific Hitachi <2,5% Nippon Steel <2% China Gong Chang 5% Xingtai 10% Region Company Name Estimated Global Market Share EUR Akers 3% Sheffield Forgemasters <2,5% Steinhoff <2% Villares <1,5% N. America UES 5% Whemco <2% Superior <1,5% S-AM Villares <2,5% A-PAC Hitachi 2,5% Doosan <2,5% JCFC <2% JSW <1,5% China Xingtai 7% Baosteel 4% Main Competitors Cast Rolls Forged Rolls Industry is Fragmented.
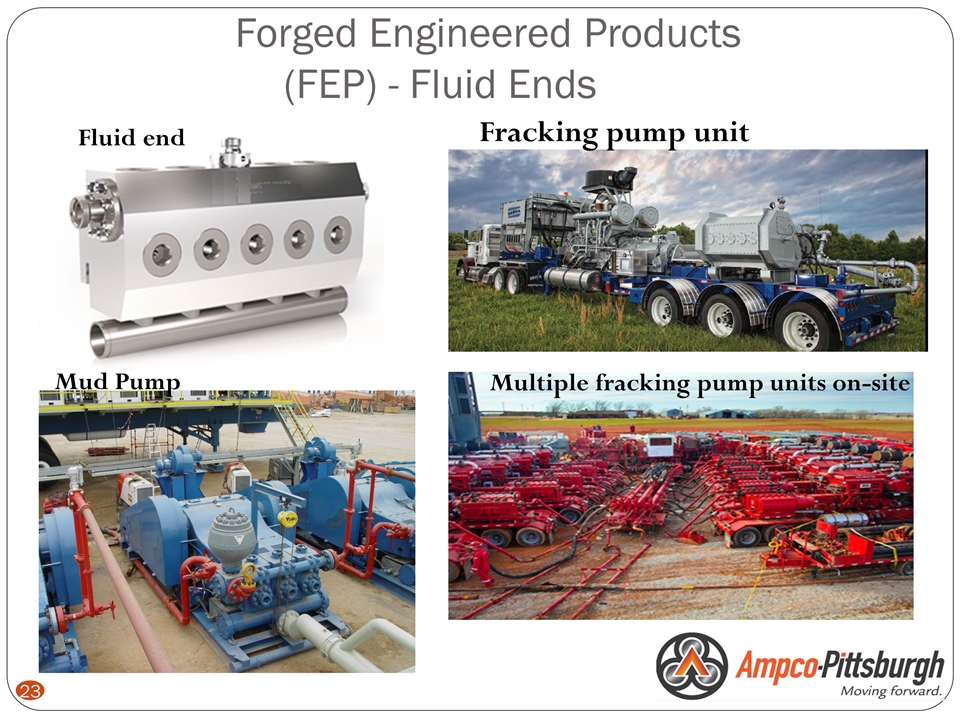
Forged Engineered Products (FEP) - Fluid Ends Fracking pump unit Mud Pump Fluid end Multiple fracking pump units on-site
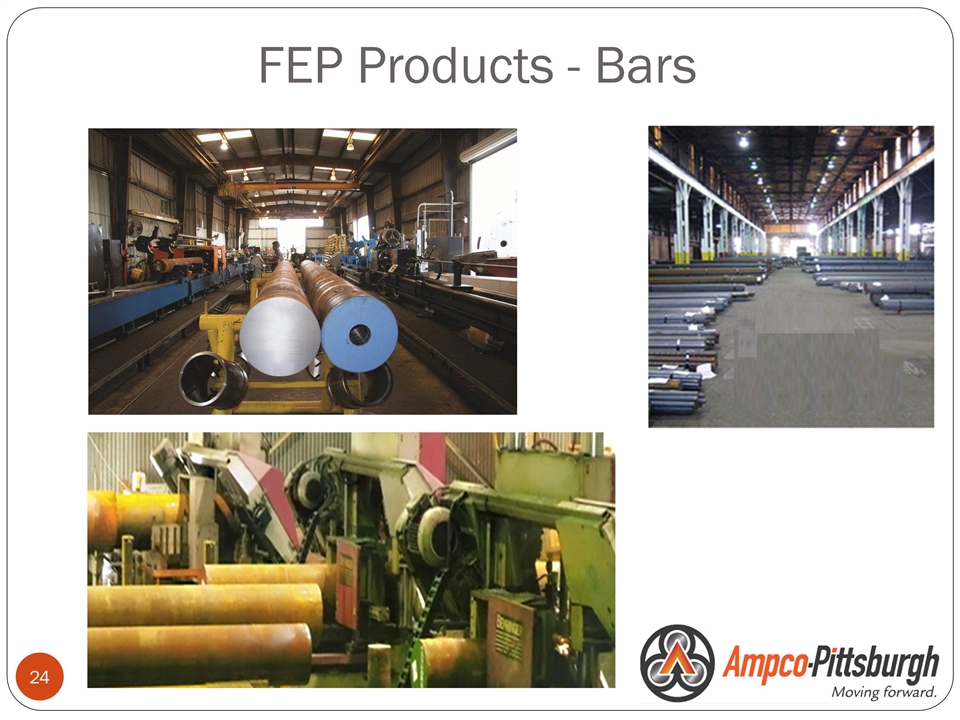
FEP Products - Bars
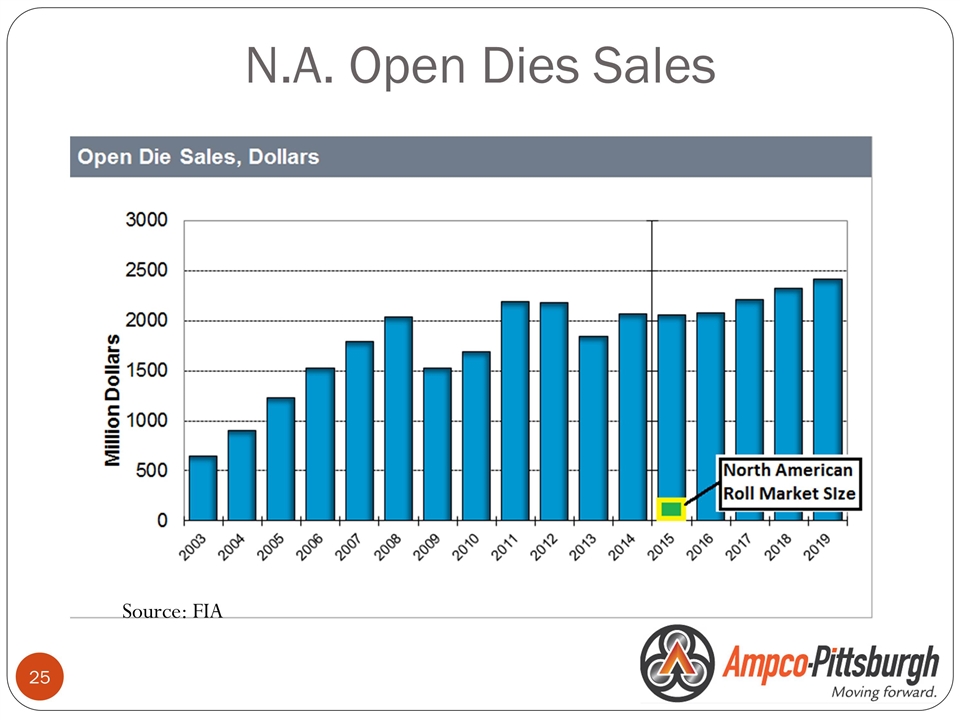
N.A. Open Dies Sales Source: FIA
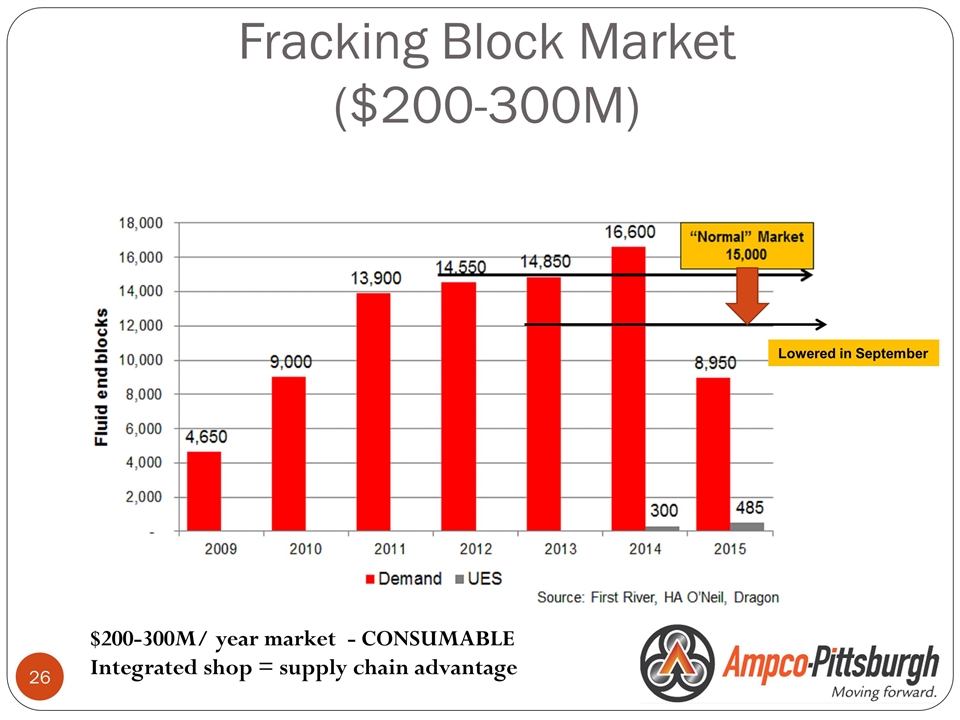
Fracking Block Market ($200-300M) Lowered in September $200-300M/ year market - CONSUMABLE Integrated shop = supply chain advantage
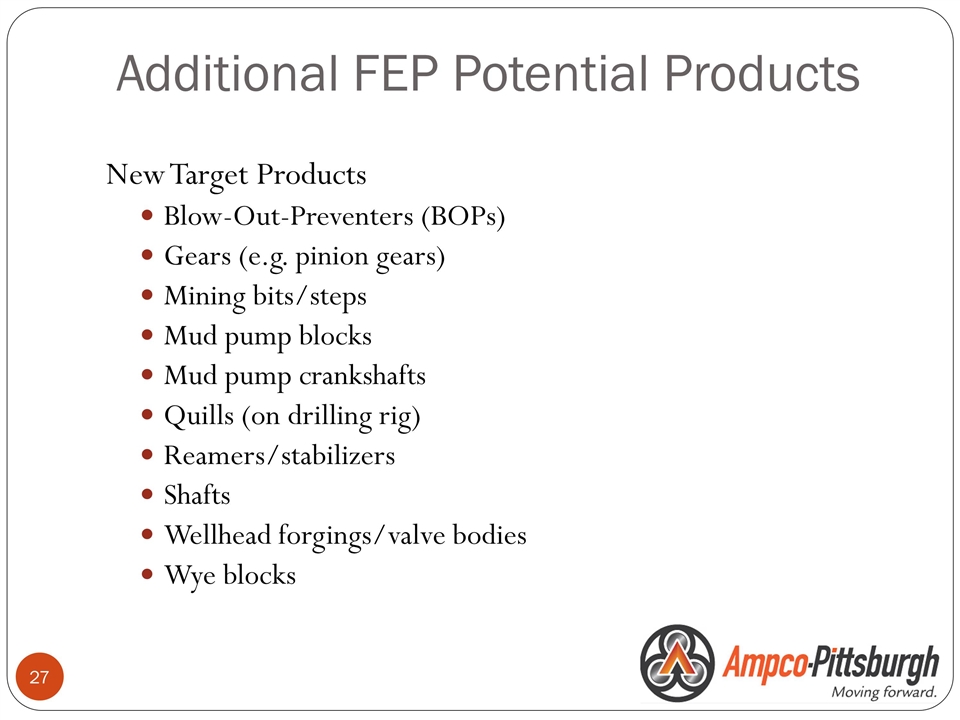
Additional FEP Potential Products New Target Products Blow-Out-Preventers (BOPs) Gears (e.g. pinion gears) Mining bits/steps Mud pump blocks Mud pump crankshafts Quills (on drilling rig) Reamers/stabilizers Shafts Wellhead forgings/valve bodies Wye blocks
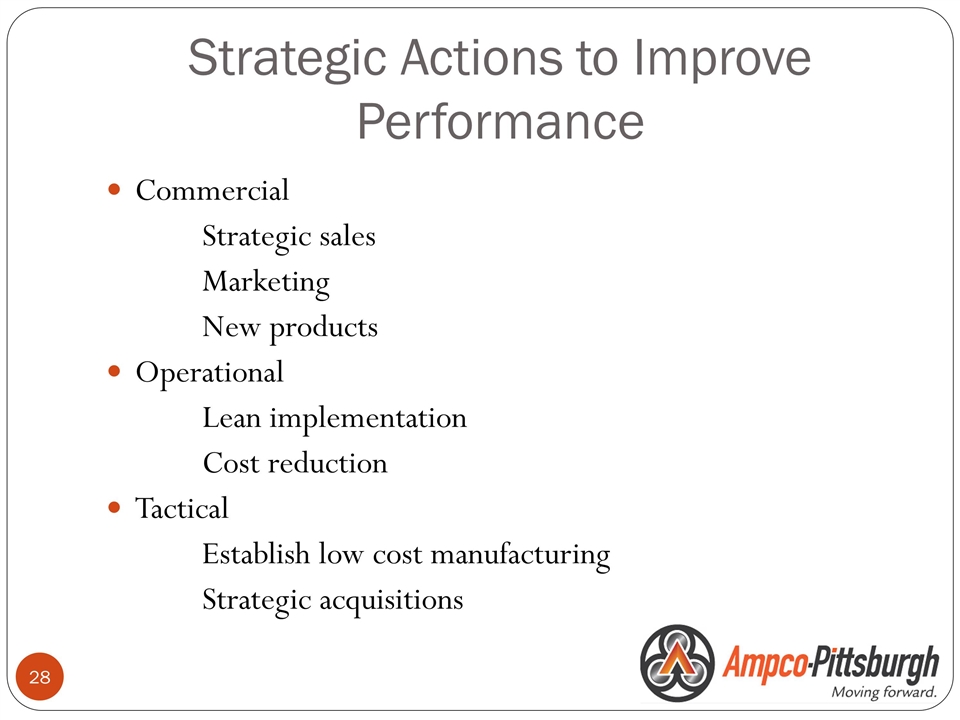
Strategic Actions to Improve Performance Commercial Strategic sales Marketing New products Operational Lean implementation Cost reduction Tactical Establish low cost manufacturing Strategic acquisitions
2016-2018 Strategic Plan Air and Liquid Processing Segment
Air and Liquid Processing Segment Information The Air and Liquid Processing Segment is comprised of three divisions: Aerofin Buffalo Air Handling Buffalo Pumps These divisions represent approximately 34% of Ampco- Pittsburgh’s total annual revenue.
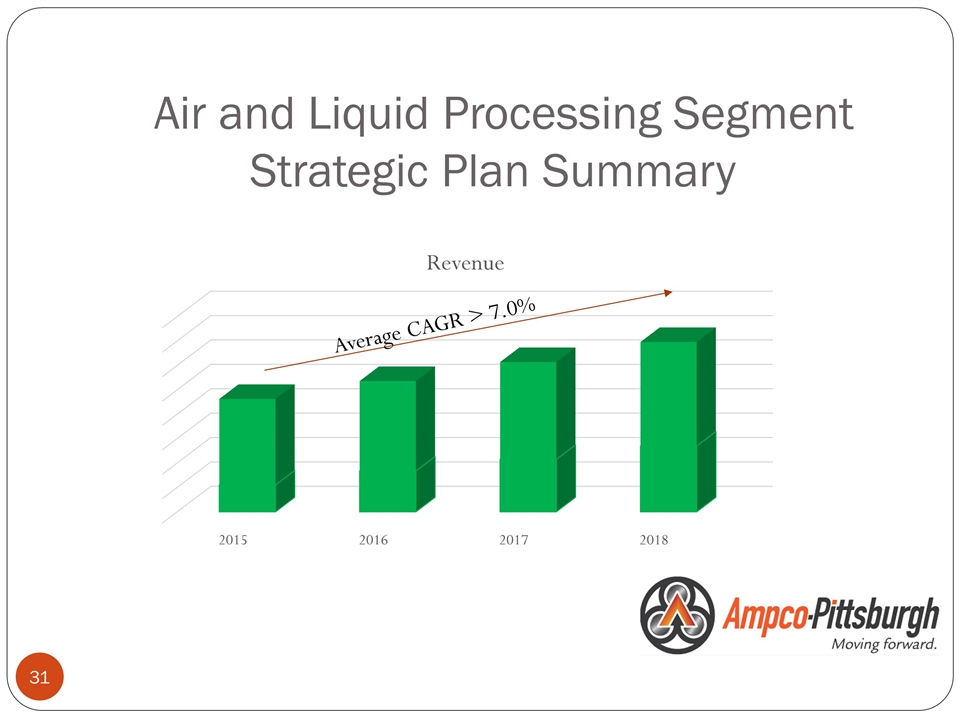
Air and Liquid Processing Segment Strategic Plan Summary
Aerofin 2016 – 2018 Strategic Plan
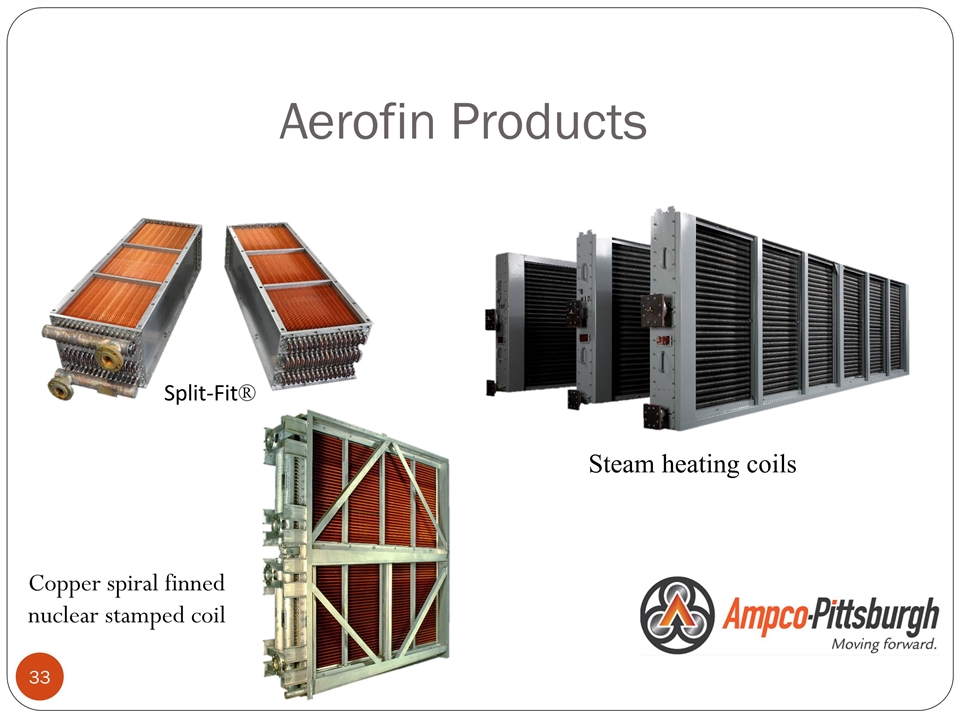
Aerofin Products Copper spiral finned nuclear stamped coil Split-Fit® Steam heating coils
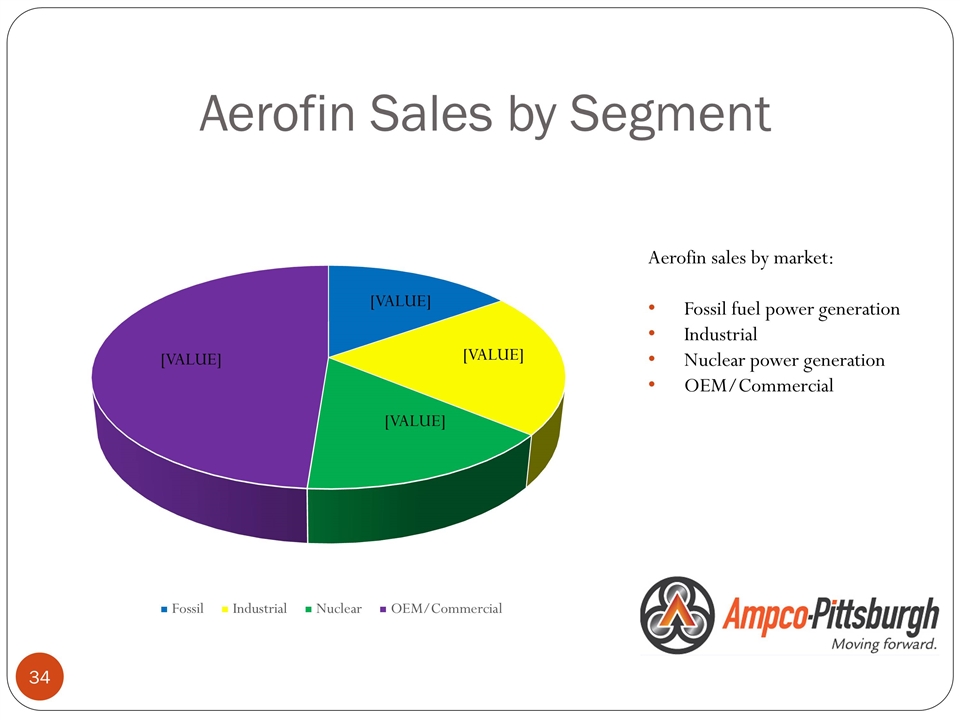
Aerofin Sales by Segment Aerofin sales by market: Fossil fuel power generation Industrial Nuclear power generation OEM/Commercial
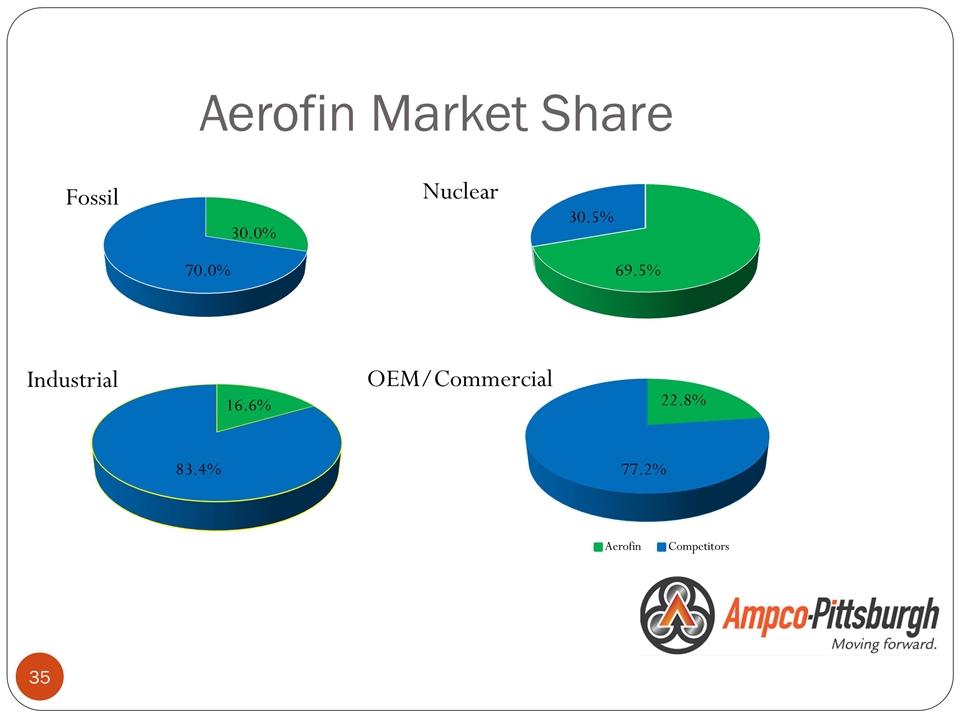
Aerofin Market Share 16.6% 83.4% 22.8% 77.2% 30.5%
Aerofin Market Strategies Increase market share Introduce new products Expand markets and territory Improve manufacturing efficiencies/productivity by a minimum of 10% Explore acquisitions that complement Aerofin’s products and geography
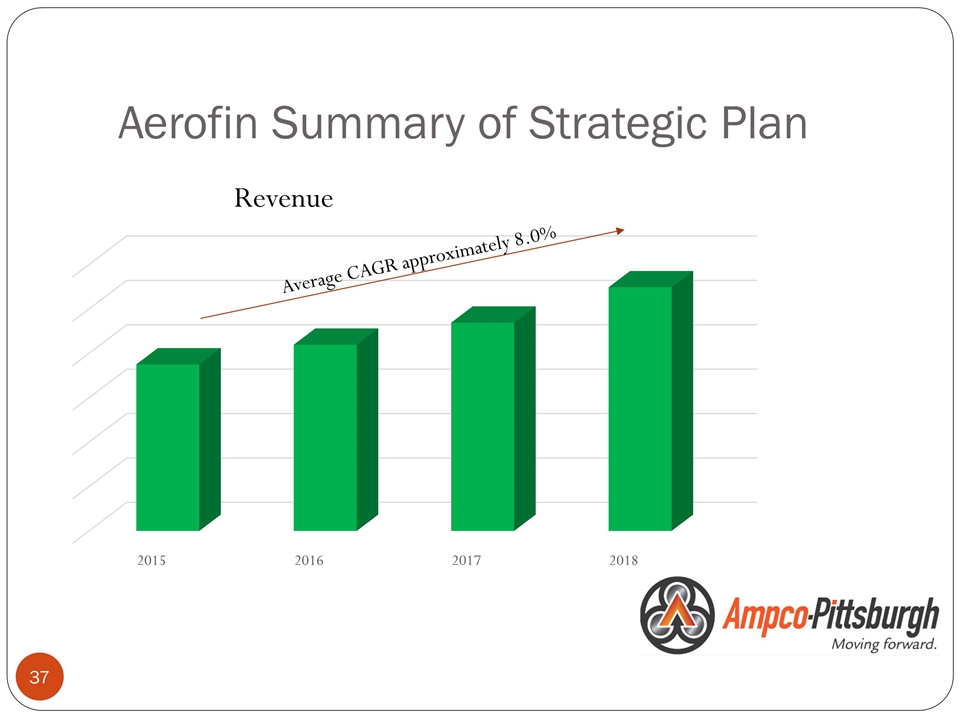
Aerofin Summary of Strategic Plan Revenue Average CAGR approximately 8.0%
Buffalo Air Handling 2016 – 2018 Strategic Plan
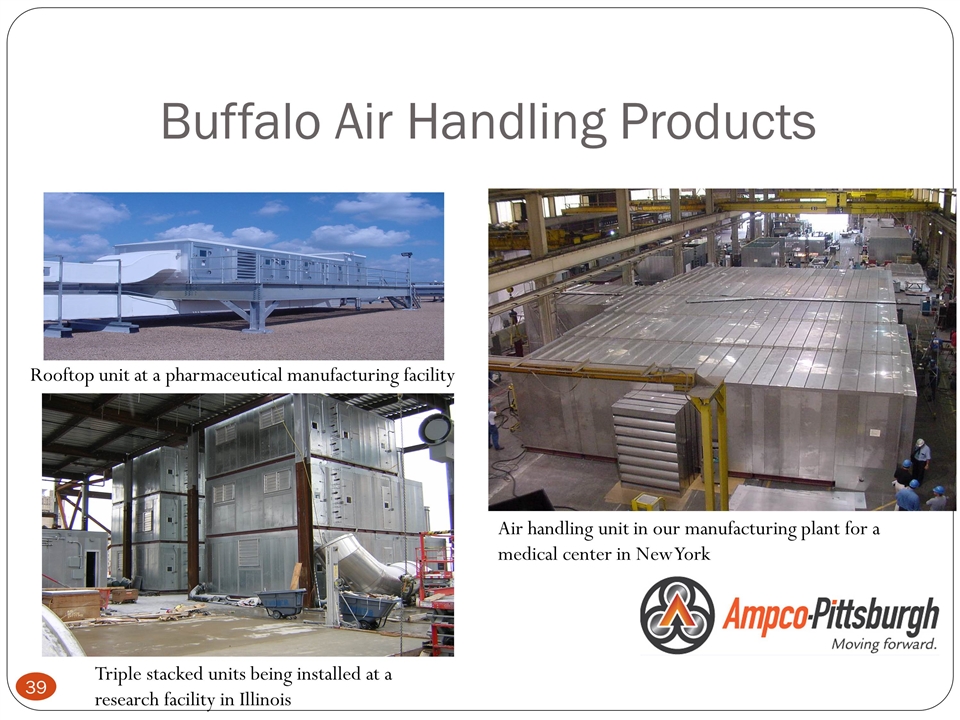
Buffalo Air Handling Products Rooftop unit at a pharmaceutical manufacturing facility Triple stacked units being installed at a research facility in Illinois Air handling unit in our manufacturing plant for a medical center in New York
Buffalo Air Handling Why use a custom air handling unit? Reliability requirements Performance requirements Unique features such as special filtration or humidity control Air pressure requirements Air leakage control Energy recovery requirements Specific size limitations End user or engineer preference
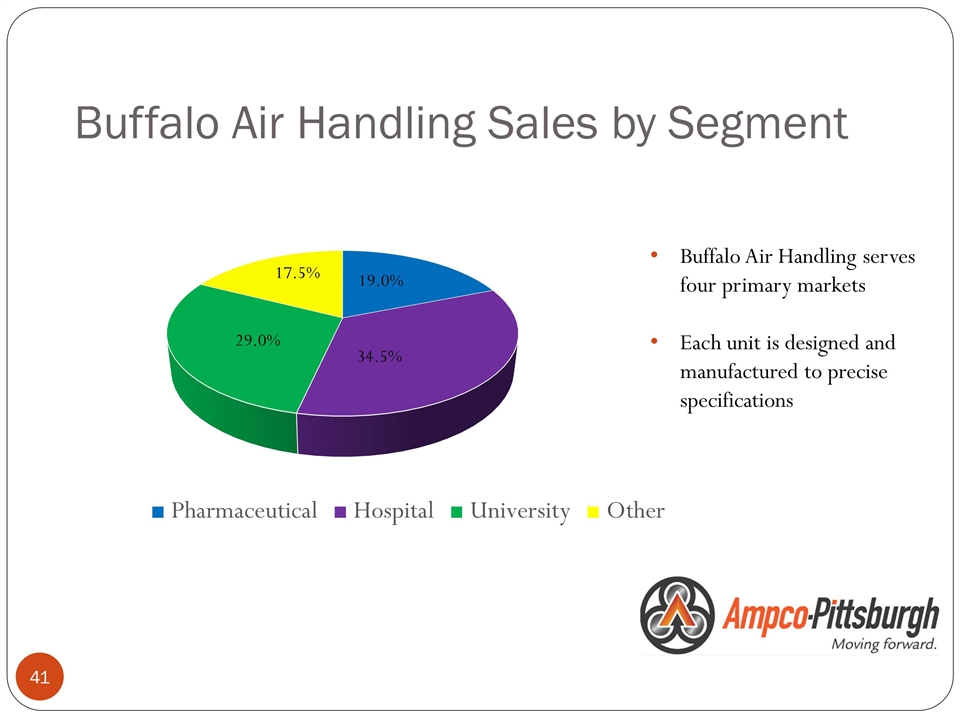
Buffalo Air Handling Sales by Segment Buffalo Air Handling serves four primary markets Each unit is designed and manufactured to precise specifications
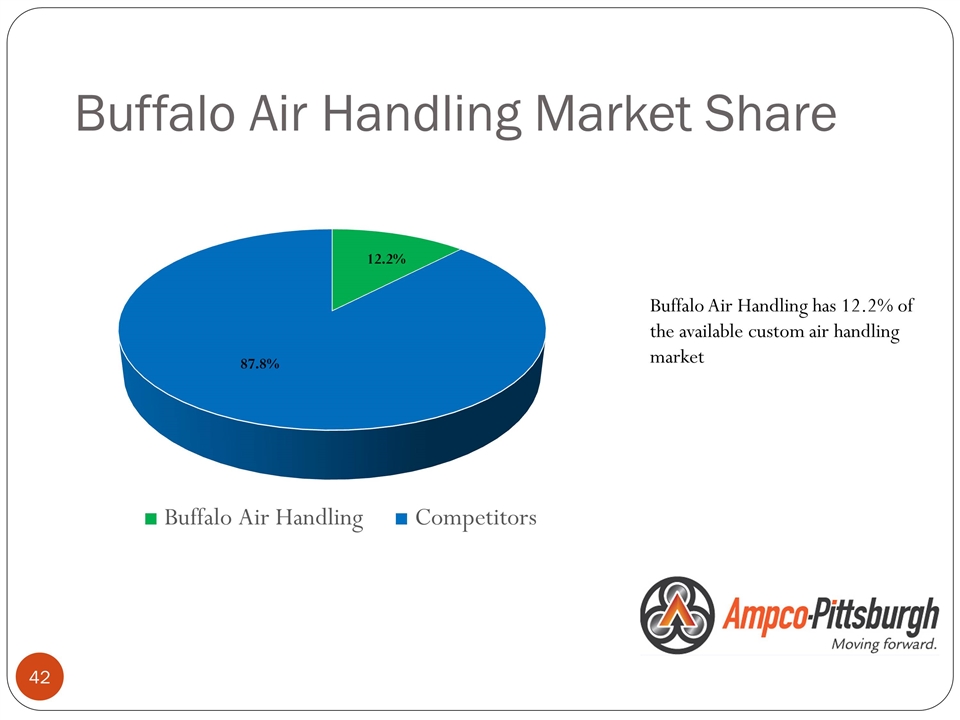
Buffalo Air Handling Market Share Buffalo Air Handling has 12.2% of the available custom air handling market
Buffalo Air Handling Market Strategies Grow targeted markets Enhance opportunities for design basis Broaden product offering Reduce manufacturing costs Explore acquisitions with complementary products
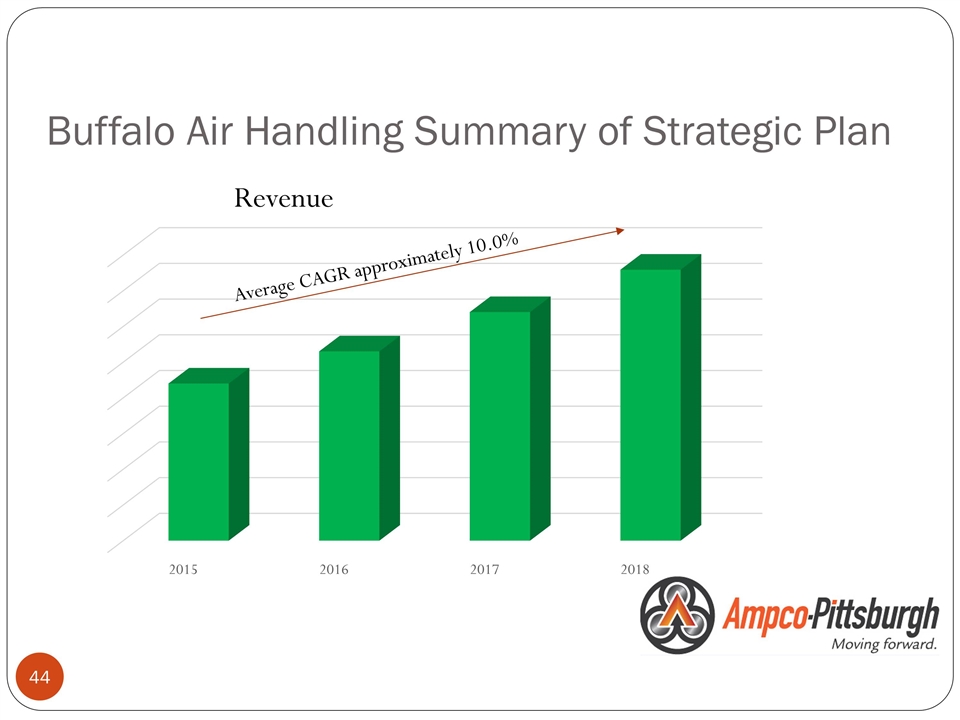
Buffalo Air Handling Summary of Strategic Plan Revenue Average CAGR approximately 10.0%
Buffalo Pumps 2016 – 2018 Strategic Plan
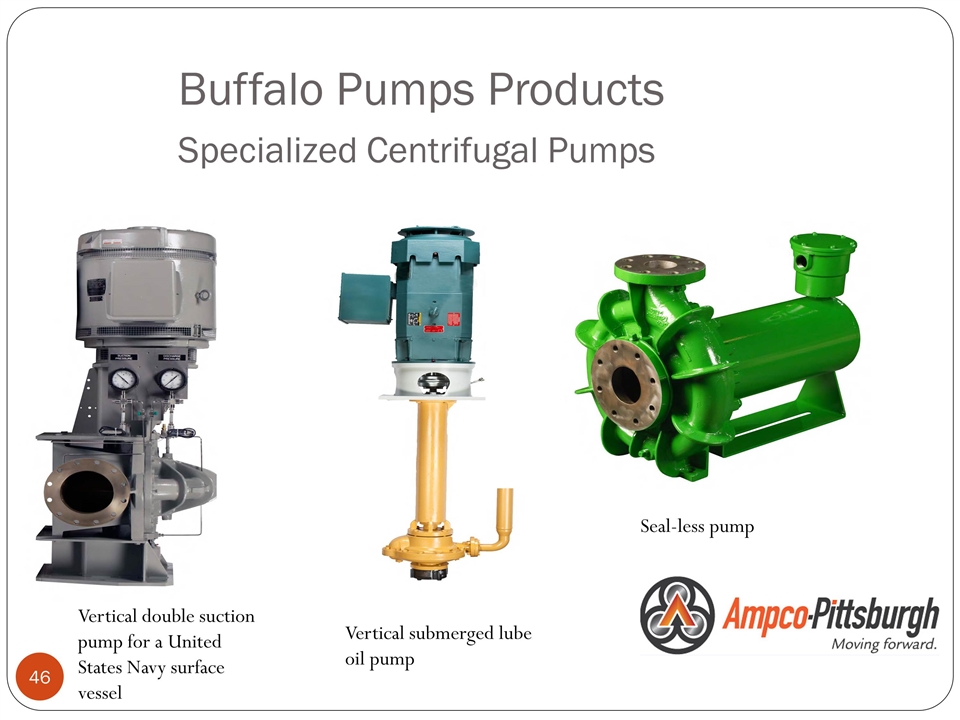
Buffalo Pumps Products Specialized Centrifugal Pumps Vertical double suction pump for a United States Navy surface vessel Vertical submerged lube oil pump Seal-less pump
Buffalo Pumps Market Segments Fossil fuel power generation Military use Industrial refrigeration
Buffalo Pumps Market Strategies Focus on customer service enhancements Improve after market support Grow OEM market share Broaden product offerings Reduce manufacturing costs Explore acquisitions that complement Buffalo Pump’s products and markets served
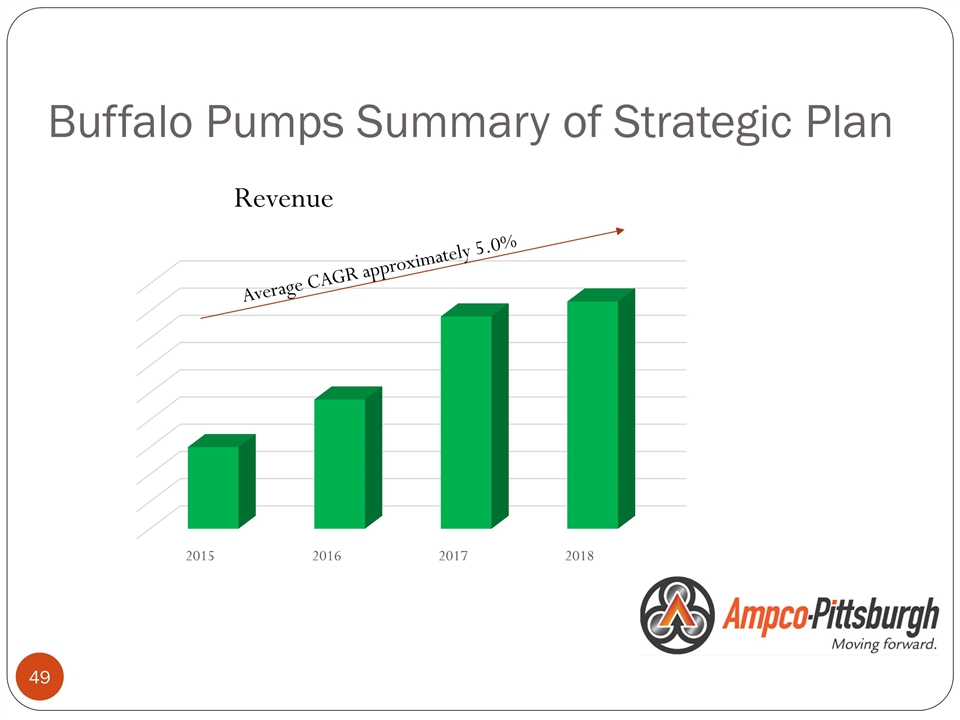
Buffalo Pumps Summary of Strategic Plan Revenue Average CAGR approximately 5.0%
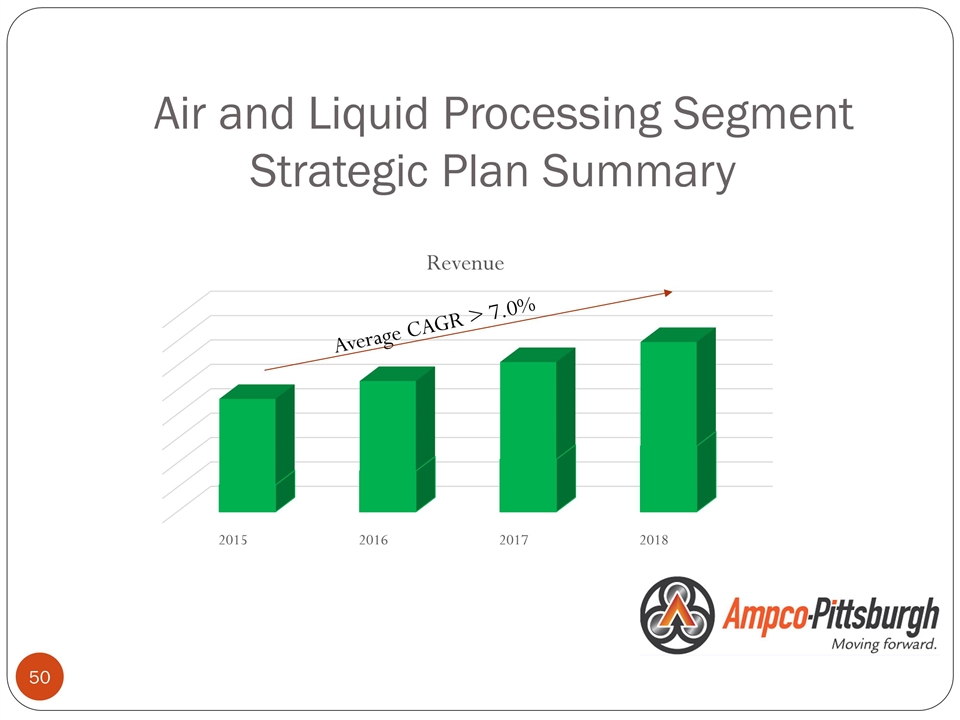
Air and Liquid Processing Segment Strategic Plan Summary
2016-2018 Strategic Plan Financials Ampco-Pittsburgh Corporation
Ampco-Pittsburgh Corporation Financial Assumptions Growth: Organic, no impact from potential acquisitions Markets: Forged and Cast Engineered Products (FCEP) Steel – no recovery in 2016. Slow and steady growth in 2017 and 2018 Oil and gas – improving in latter half of 2016 Air and Liquid Processing (ALP): Slow and steady growth for 2016-2018 Inflation: Direct materials: FCEP Segment: 2016 – flat; 2017 – 50% increase; 2018 - flat ALP Segment: 2016 – flat; 2017 & 2018 - 3% increase Currency: No significant change
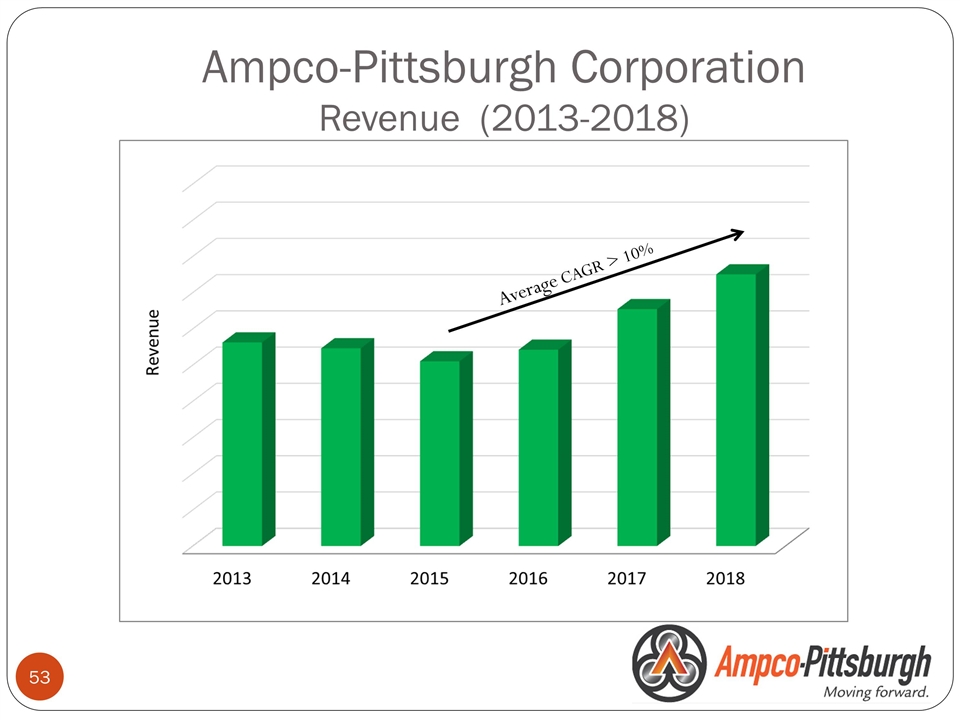
Ampco-Pittsburgh Corporation Revenue (2013-2018) Average CAGR > 10%
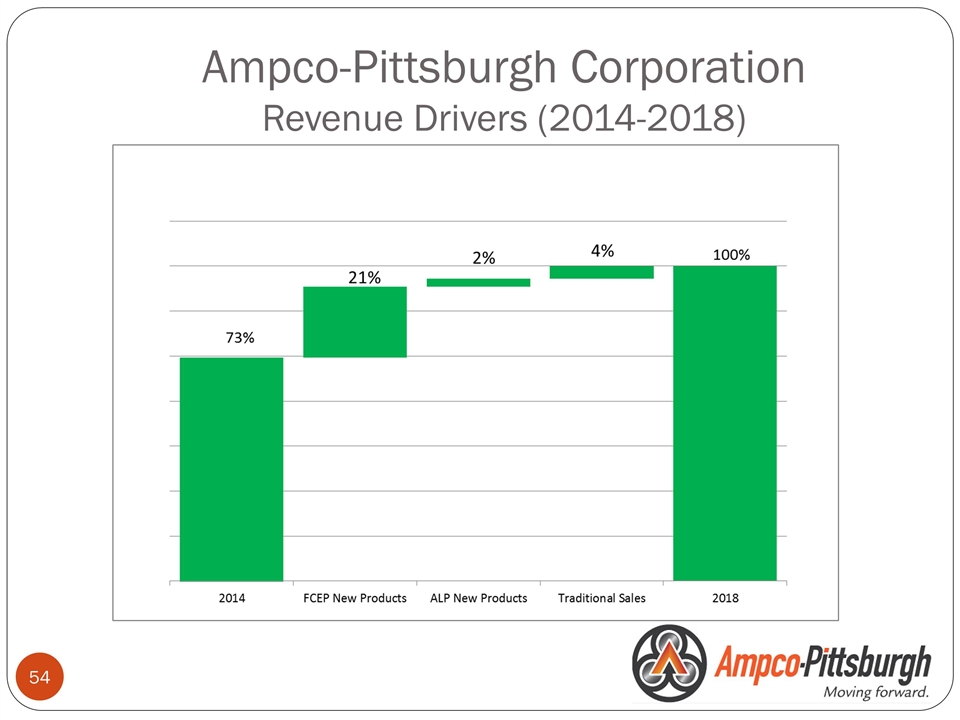
Ampco-Pittsburgh Corporation Revenue Drivers (2014-2018)
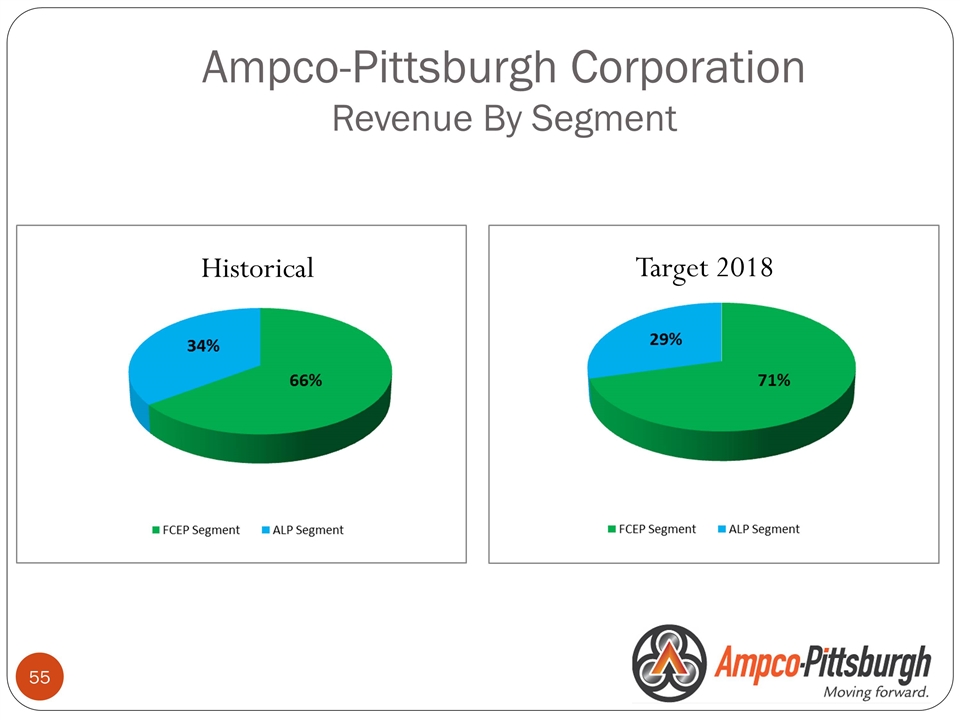
Ampco-Pittsburgh Corporation Revenue By Segment Historical Target 2018
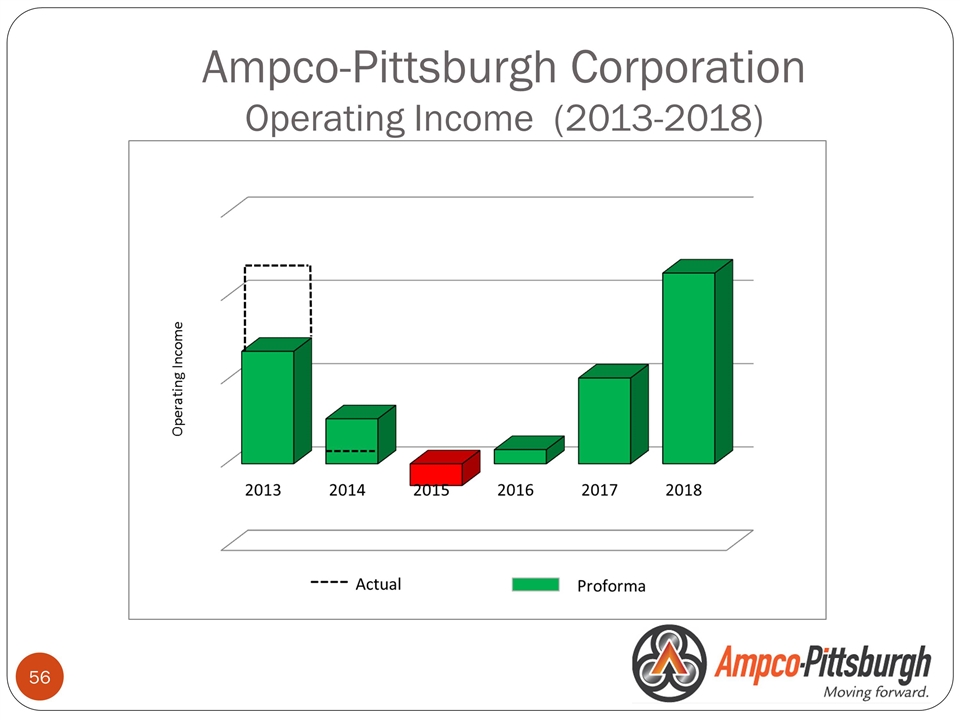
Ampco-Pittsburgh Corporation Operating Income (2013-2018)

Ampco-Pittsburgh Corporation Financial Performance Drivers Reduced workforce Centralized back office functions Relocated corporate headquarters Froze significant portion of U.S. defined benefit plan Ongoing…. Implement company-wide “lean manufacturing” strategies Focus on cash flow and working capital management Enhance ROIC strategy and payback analyses
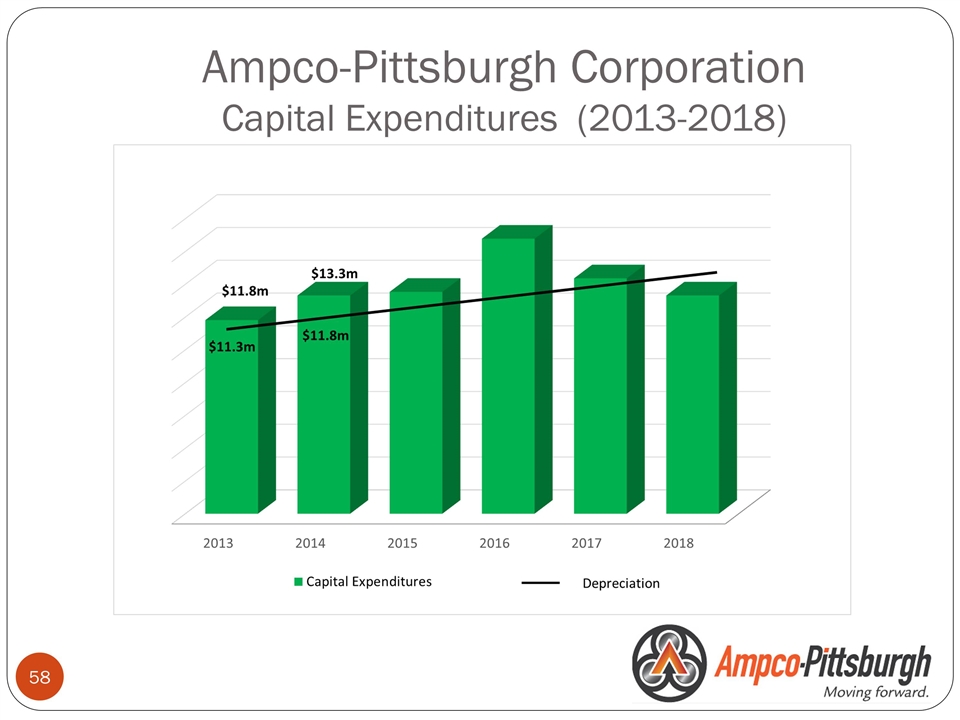
Ampco-Pittsburgh Corporation Capital Expenditures (2013-2018)
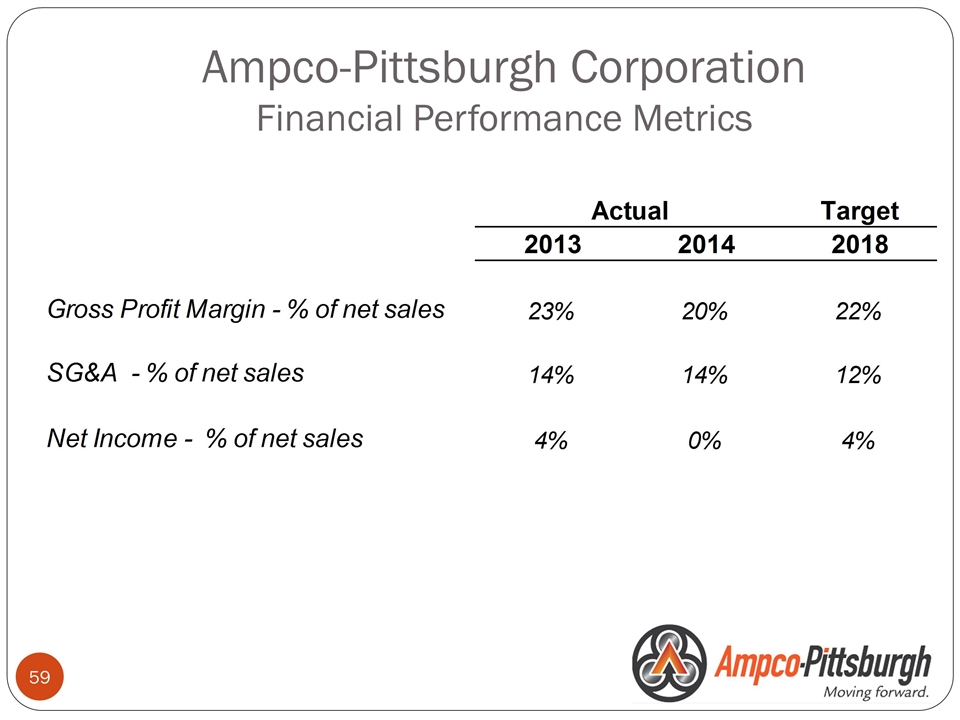
Ampco-Pittsburgh Corporation Financial Performance Metrics
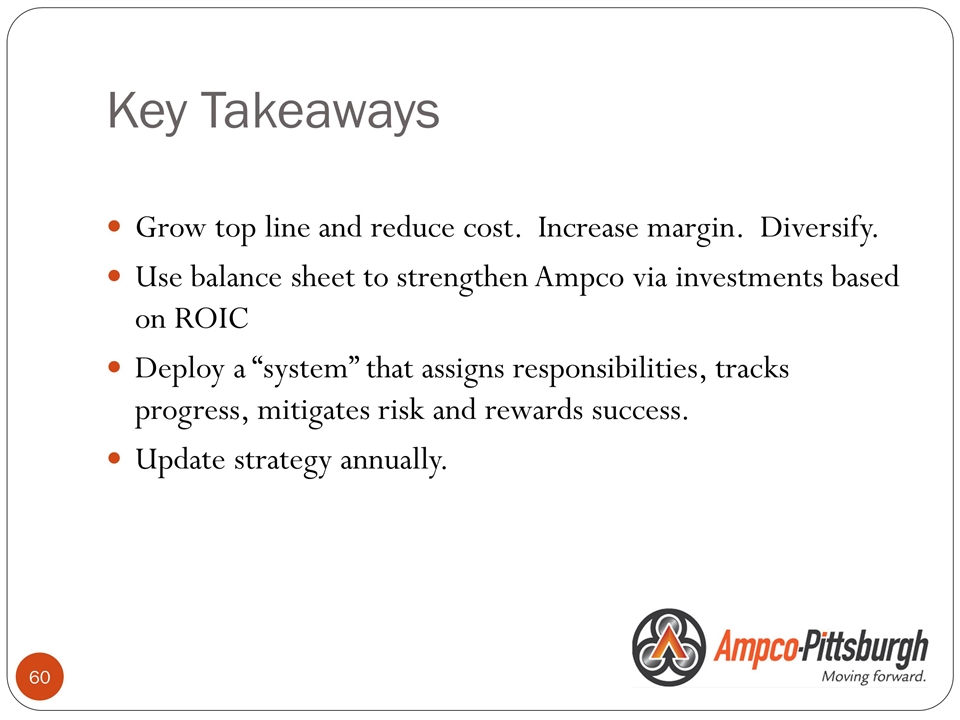
Key Takeaways Grow top line and reduce cost. Increase margin. Diversify. Use balance sheet to strengthen Ampco via investments based on ROIC Deploy a “system” that assigns responsibilities, tracks progress, mitigates risk and rewards success. Update strategy annually.
Thank you Questions Ampco-Pittsburgh Corporation


