UNITED STATES
SECURITIES AND EXCHANGE COMMISSION
Washington, D.C. 20549
FORM 10-K
☒ Annual Report Pursuant to Section 13 or 15(d) of the Securities Exchange Act of 1934
For the fiscal year ended December 31, 2024
or
☐ Transition Report Pursuant to Section 13 or 15(d) of the Securities Exchange Act of 1934
For the transition period from to
Commission File Number 1-11978

The Manitowoc Company, Inc.
(Exact name of registrant as specified in its charter)
| | |
Wisconsin | | 39-0448110 |
(State or other jurisdiction of incorporation) | | (I.R.S. Employer Identification Number) |
| | |
11270 West Park Place Suite 1000 | | |
Milwaukee, Wisconsin | | 53224 |
(Address of principal executive offices) | | (Zip Code) |
(414) 760-4600
(Registrant’s telephone number, including area code)
Securities registered pursuant to Section 12(b) of the Act:
| | | | |
Title of each class | | Trading Symbol(s) | | Name of each exchange on which registered |
Common Stock, $.01 Par Value | | MTW | | New York Stock Exchange |
Securities Registered Pursuant to Section 12(g) of the Act: None
Indicate by check mark if the registrant is a well-known seasoned issuer, as defined in Rule 405 of the Securities Act. Yes ☐ No ☒
Indicate by check mark if the Registrant is not required to file reports pursuant to Section 13 or 15(d) of the Act. Yes ☐ No ☒
Indicate by check mark whether the Registrant: (1) has filed all reports required to be filed by Section 13 or 15(d) of the Securities Exchange Act of 1934 during the preceding 12 months (or for such shorter period that the Registrant was required to file such reports), and (2) has been subject to such filing requirements for the past 90 days. Yes ☒ No ☐
Indicate by check mark whether the registrant has submitted electronically every Interactive Data File required to be submitted pursuant to Rule 405 of Regulation S-T (§232.405 of this chapter) during the preceding 12 months (or for such shorter period that the registrant was required to submit such files). Yes ☒ No ☐
Indicate by check mark whether the registrant is a large accelerated filer, an accelerated filer, a non-accelerated filer, smaller reporting company, or an emerging growth company. See the definitions of “large accelerated filer,” “accelerated filer,” “smaller reporting company,” and “emerging growth company” in Rule 12b-2 of the Exchange Act.
| | | | | | |
Large accelerated filer |
| ☐ |
| Accelerated filer |
| ☒ |
Non-accelerated filer |
| ☐ |
| Smaller reporting company |
| ☐ |
Emerging growth company | | ☐ | | | | |
If an emerging growth company, indicate by check mark if the registrant has elected not to use the extended transition period for complying with any new or revised financial accounting standards provided pursuant to Section 13(a) of the Exchange Act. ☐
Indicate by check mark whether the registrant has filed a report on and attestation to its management’s assessment of the effectiveness of its internal control over financial reporting under Section 404(b) of the Sarbanes-Oxley Act (15 U.S.C. 7262(b)) by the registered public accounting firm that prepared or issued its audit report. ☒
If securities are registered pursuant to Section 12(b) of the Act, indicate by check mark whether the financial statements of the registrant included in the filing reflect the correction of an error to previously issued financial statements. ☐
Indicate by check mark whether any of those error corrections are restatements that required a recovery analysis of incentive-based compensation received by any of the registrant's executive officers during the relevant recovery period pursuant to §240.10D-1(b). ☐
Indicate by check mark whether the Registrant is a shell company (as defined in Rule 12b-2 of the Act). Yes ☐ No ☒
The Aggregate Market Value on June 28, 2024, of the registrant’s Common Stock held by non-affiliates of the registrant was approximately $389.2 million based on the closing per share price of $11.53 on that date.
The number of shares outstanding of the registrant’s Common Stock as of January 31, 2025, the most recent practicable date, was 35,134,245.
DOCUMENTS INCORPORATED BY REFERENCE
Portions of the registrant’s Proxy Statement for the 2025 Annual Meeting of Shareholders, are incorporated by reference in Part III of this Annual Report on Form 10-K.
THE MANITOWOC COMPANY, INC.
Index to Annual Report on Form 10-K
For the Year Ended December 31, 2024
Cautionary Statements Regarding Forward-Looking Information
All of the statements in this Annual Report on Form 10-K, other than historical facts, are forward-looking statements, including, without limitation, the statements made in the “Management's Discussion and Analysis of Financial Condition and Results of Operations.” As a general matter, forward-looking statements are those focused upon anticipated events or trends, expectations and beliefs relating to matters that are not historical in nature. The words “could,” “should,” “may,” “feel,” “anticipate,” “aim,” “preliminary,” “expect,” “believe,” “estimate,” “intend,” “intent,” “plan,” “will,” “foresee,” “project,” “forecast,” or the negative thereof or variations thereon, and similar expressions identify forward-looking statements.
The Private Securities Litigation Reform Act of 1995 provides a “safe harbor” for these forward-looking statements. In order to comply with the terms of the safe harbor, The Manitowoc Company, Inc. (“Manitowoc,” the “Company,” “we,” “us,” or "our”) notes that forward-looking statements are subject to known and unknown risks, uncertainties and other factors relating to the Company's operations and business environment, all of which are difficult to predict and many of which are beyond the control of the Company. These known and unknown risks, uncertainties and other factors could cause actual results to differ materially from those matters expressed in, anticipated by or implied by such forward-looking statements. These risks, uncertainties and other factors include, but are not limited to:
•Macroeconomic conditions, including inflation and elevated interest rates, as well as prior supply chain, labor and logistics constraints, have had, and may continue to have, a negative impact on Manitowoc’s ability to convert backlog into revenue which could, and has, impacted its financial condition, cash flows, and results of operations (including future uncertain impacts);
•changes in economic or industry conditions generally or in the markets served by Manitowoc;
•geopolitical events, including the ongoing conflicts in Ukraine and in the Middle East, other political and economic conditions and risks and other geographic factors, has had and may continue to lead to market disruptions, including volatility in commodity prices (including oil and gas), raw material and component costs, energy prices, inflation, consumer behavior, supply chain, and credit and capital markets, and could result in the impairment of assets;
•changes in customer demand, including changes in global demand for high-capacity lifting equipment, changes in demand for lifting equipment in emerging economies and changes in demand for used lifting equipment including changes in government approval and funding of projects;
•the ability to convert backlog, orders, and order activity into sales and the timing of those sales;
•adverse changes to trade policy, including export duties, tariffs, import controls and trade barriers (including quotas);
•the ability to focus on customers, new technologies, and innovation;
•uncertainties associated with new product introductions, the successful development and market acceptance of new and innovative products that drive growth;
•failure to comply with regulatory requirements related to the products and aftermarket services the Company sells;
•the ability to capitalize on key strategic opportunities and the ability to implement Manitowoc’s long-term initiatives;
•the ability of Manitowoc's customers to receive financing;
•risks associated with high debt leverage;
•impairment of goodwill and/or intangible assets;
•changes in revenues, margins and costs;
•the ability to increase operational efficiencies across Manitowoc and to capitalize on those efficiencies;
•the ability to generate cash and manage working capital consistent with Manitowoc’s stated goals;
•work stoppages, labor negotiations, labor rates, and labor costs;
•the Company’s ability to attract and retain qualified personnel;
•changes in the capital and financial markets;
•the ability to complete and appropriately integrate acquisitions, strategic alliances, joint ventures or other significant transactions;
•issues associated with the availability and viability of suppliers;
•the ability to significantly improve profitability;
•realization of anticipated earnings enhancements, cost savings, strategic options and other synergies, and the anticipated timing to realize those savings, synergies and options;
•the replacement cycle of technologically obsolete products;
•foreign currency fluctuation and its impact on reported results;
•risks associated with data security and technological systems and protections;
•the ability to direct resources to those areas that will deliver the highest returns;
•risks associated with manufacturing or design defects;
•natural disasters, other weather events, pandemics and other public health crises disrupting commerce in one or more regions of the world;
•issues relating to the ability to timely and effectively execute on manufacturing strategies, general efficiencies, and capacity utilization of the Company’s facilities;
•the ability to focus and capitalize on product and service quality and reliability;
•issues associated with the quality of materials, components and products sourced from third parties and the ability to successfully resolve those issues;
•changes in laws throughout the world, including governmental regulations on climate change;
•the inability to defend against potential infringement claims on intellectual property rights;
•the ability to sell products and services through distributors and other third parties;
•issues affecting the effective tax rate for the year;
•other risks factors detailed in Manitowoc's filings with the United States Securities and Exchange Commission, including risk factors in Item 1A, “Risk Factors” of this Annual Report on Form 10-K, as such may be amended or supplemented in Manitowoc’s subsequently filed Quarterly Reports on Form 10-Q.
These statements reflect the current views and assumptions of management with respect to future events. Except to the extent required by the federal securities laws, the Company does not undertake, and hereby disclaims, any duty to update these forward-looking statements, even though its situation and circumstances may change in the future. Readers are cautioned not to place undue reliance on forward-looking statements, which speak only as of the date of this report. The inclusion of any statement in this report does not constitute an admission by the Company or any other person that the events or circumstances described in such statement are material.
PART I
Item 1. BUSINESS
General
The Manitowoc Company, Inc. (“Manitowoc,” the “Company,” “we,” “us,” or "our”) was founded in 1902 and has over a 120-year tradition of providing high-quality, customer-focused products and support services to its markets. Headquartered in Milwaukee, Wisconsin, United States, Manitowoc is one of the world's leading providers of engineered lifting solutions. Manitowoc, through its wholly-owned subsidiaries, designs, manufactures, markets, distributes, and supports comprehensive product lines of mobile hydraulic cranes, lattice-boom crawler cranes, boom trucks, and tower cranes under the Aspen Equipment, Grove, Manitowoc, MGX Equipment Services, National Crane, Potain, and Shuttlelift brand names.
Reporting Segments
The Company has three reportable segments, the Americas segment, the Europe and Africa (“EURAF”) segment, and the Middle East and Asia Pacific (“MEAP”) segment. The Americas reporting segment includes the North America and South America continents. The EURAF reporting segment includes the Europe and Africa continents, excluding the Middle East region. The MEAP reporting segment includes the Asia and Australia continents and the Middle East region. The segments were identified using the “management approach,” which designates the internal organization that is used by management for making operating decisions and assessing performance. Refer to Part II, Item 7. “Management’s Discussion and Analysis of Financial Condition and Results of Operations” and Note 16, “Segments,” for additional information on our reporting segments.
The Manitowoc Way
Manitowoc plays an integral role in building the physical communities and structures for current and future generations. Our Mission is integral to this vision, aspiring to deliver the highest level of customer confidence and trust in the lifting industry. Our Core Values are the guiding principles for our employees to ensure that we meet our Vision and Mission. These Core Values are:
(1)We succeed when our customers excel: We are committed to our customers' success, we provide a customer first experience every time, we are focused on improving the customer experience every day, and we provide reliable and excellent service.
(2)Do what is right: We work in a safe and environmentally responsible way, we respect others, we behave in an ethical way and we deliver quality work.
(3)Work as a team: We help each other to meet customer needs, we put the team first, we collaborate and support team members and we foster open, two-way communication.
(4)Deliver results: We do what we say we will do, we focus on continuous improvement and innovation, and we strive to exceed customer expectations.
(5)Act as a role model: We celebrate successes and learn from failures, we approach every day with a can-do-attitude, and we have fun.
Encompassing these Core Values, The Manitowoc Way is our business system for executing our Vision and Mission. The Manitowoc Way includes our continuous improvement process, focused on delivering value to our customers, shareholders and employees. This includes lean tools such as the Toyota Production System to eliminate waste from processes, reduce lead times, increase safety within our facilities, improve the quality of our products and drive our sustainability. The Manitowoc
Way also encompasses our Voice of the Customer process which has allowed us to introduce innovative, customer-focused products to the market.
The Manitowoc Way has played a critical role in our success to build a sustainable, stand-alone crane company. As we execute our growth strategies, The Manitowoc Way will remain our guiding force for building processes that enhance our new product development; sales strategies; service and rental operations; and acquisition integration.
Aspirations, Business Strategy and Initiatives
Our long-term aspirations are as follows:
•Strive towards a zero-harm work environment (achieve recordable injury rate <1.0)
•$3.0 billion in net sales
•$1.0 billion in non-new machine sales
•12% Adjusted EBITDA margin
•15% adjusted return on invested capital ("Adjusted ROIC")
•Reduce the Company's environmental impact
Supporting our long-term aspirations is our CRANES+50 strategy which is to grow our non-new machine sales to $1 billion. The bedrock of our CRANES+50 strategy are our four breakthrough initiatives: 1) Grow our tower crane rental and aftermarket business in Europe; 2) Grow our Belt and Road tower crane business with a focus on the Middle East; 3) Expand our aftermarket activities in North America; and 4) Leverage our all-terrain crane new product development to grow aftermarket.
Grow our tower crane rental and aftermarket business in Europe: Since 2021, we have grown our European tower crane rental fleet original equipment cost by $27.3 million. The Company continues to enhance the portfolio of aftermarket services performed in Europe, such as sale of parts and whole goods accessories, on-site repairs, technical support, erection and decommissioning services, crane remanufacturing, training services, and digital solutions.
Grow our Belt and Road tower crane business with a focus on the Middle East: We have invested in research and development to design and manufacture innovative tower cranes for the Belt and Road, namely the Middle East market, that is experiencing significant growth. Since 2021, ten new models have been launched. Utilizing the principles of The Manitowoc Way, the engineering team reduced the new product development cycle from 18-24 months to 12-14 months to more quickly go to market with new products.
Expand our aftermarket activities in North America: In 2021, we acquired the assets of two companies, Aspen Equipment Company (“Aspen”) and the crane business of H&E Equipment Services, Inc. (now MGX Equipment Services, LLC, or “MGX”), which expanded our ability to provide new machine sales, used machine sales, aftermarket parts, remanufacturing, and service support to a variety of end market customers. In 2022, we completed the acquisition of certain assets of the crane rental fleet of Honnen Equipment Company (“Honnen”), which expanded our rental portfolio and direct-to-customer footprint in Colorado, Wyoming and Nebraska. Additionally, in 2023, we added key territories including Missouri and South Carolina and, in 2024, we relocated to larger locations in Louisiana and Arizona. The acquisition of the assets of these businesses and additional territories advances our strategy to expand our aftermarket activities within North America. We currently offer 16 full-service branch locations in 14 states with over 160 field service technicians that provide industry-leading technical competencies and exceptional customer support. In early 2025, we announced the acquisition of certain territories and related assets of Ring Power Corporation. This further expands our direct-to-customer territories in Georgia, North Carolina, and South Carolina.
Leverage our all-terrain crane new product development to grow aftermarket: We have invested in research and development to design and manufacture innovative all-terrain cranes. Since 2021, we have launched ten new or refreshed all-terrain cranes which include enhancements such as longer boom lengths, increased load capacity, reduced weight, improved roadability, new cab designs, and the Grove CONNECT telematics system. Offering an innovative and wide breadth of cranes to customers
enables us to be more competitive in the market. In addition, in 2024, we added a second service location in the United Kingdom to expand our service capabilities.
Products and Aftermarket Services
Our crane products are used in a wide variety of applications throughout the world, including energy production/distribution and utility, petrochemical and industrial, infrastructure, such as road, bridge and airport construction, as well as commercial and residential construction. We design, manufacture, and distribute a diversified line of crawler-mounted lattice-boom cranes, sold under the Manitowoc brand name, an expansive line of top-slewing and self-erecting tower cranes, sold under the Potain brand name, and a diversified line of mobile hydraulic cranes, sold under the Grove, Shuttlelift, and National Crane brand names. We also provide an expansive array of aftermarket services and continue to invest in our rental fleet to further expand our aftermarket services to customers. We sell our entire product offering to most regions of the world and offer our full line of services primarily in the United States and Europe. Moreover, we report using a geographic reporting structure to better align with the location of our customers and the unique market dynamics of each geographic region. We primarily distribute our products through a global network of independent distributors and/or rental companies. Additionally, we distribute our products through our wholly owned distribution network under the brand name of MGX and Aspen in certain areas of the United States. Our main products and services are:
Products.
Lattice-boom crawler cranes. Under the Manitowoc brand name, we design, manufacture, market, and sell lattice-boom crawler cranes. The lattice-boom sections, together with the crane base, are transported to and erected at a project site. These cranes are used to lift material and equipment in a wide variety of applications, including heavy construction, bridge and highway, infrastructure, and energy-related projects. These cranes are also used by the crane rental industry, which serves all the aforementioned end markets. Our lattice boom crawler cranes are produced in the U.S.
Tower cranes. Under the Potain brand name, we design, manufacture, market, rent, and sell tower cranes primarily used in the commercial and residential construction end markets. Tower cranes offer the ability to lift and distribute material at the point of use, more quickly and accurately than other types of lifting machinery, without utilizing substantial square footage on the ground. We offer a complete line of tower crane products, including top slewing, luffing jib, topless, self-erecting, and special cranes for large building projects.
Top-slewing tower cranes have a tower and a multi-sectioned horizontal jib. These cranes rotate from the top of their mast and can increase in height with the project. These cranes are sold to rental companies and building and construction groups for a variety of applications varying from skyscrapers, nuclear power plants, semiconductor plants, and general construction. There are three styles of top-slewing tower cranes: hammerhead/cathead; topless; and luffing jib. These cranes are produced in France, Portugal, India, and China.
Self-erecting tower cranes rotate from the bottom of the mast which have a counterweight positioned at the bottom. The lower segment of the range unfolds in four sections, two for the mast and two for the jib. Self-erecting cranes are utilized primarily in low to medium rise commercial and residential construction applications. The Company's self-erecting tower cranes are produced in France and Italy.
Mobile hydraulic cranes. Under the Grove, Shuttlelift, and National Crane brand names, we design, manufacture, market, rent, and sell mobile hydraulic cranes utilized in industrial, commercial, construction and maintenance applications. Mobile hydraulic cranes consist of a telescopic boom mounted on a carrier with the ability to easily move in or between job sites, with some permitted on public roadways. We currently offer the following six types of mobile hydraulic cranes: rough-terrain, all-terrain, truck-mounted, telescopic crawler, industrial, and boom truck.
Rough-terrain cranes are designed to lift materials and equipment on rough or uneven terrain, and their versatility allows them to carry out many different lifts within the boundaries of given job sites. These cranes cannot be driven on public roadways,
and, accordingly, must be transported by truck to the site. Rough-terrain cranes are produced in the U.S. and Italy and sold under the Grove brand name.
All-terrain cranes are versatile cranes designed to perform a wide range of lifts on rough or uneven terrain. These cranes are highly maneuverable and roadable at highway speeds. All-terrain cranes are produced in Germany and sold under the Grove brand name.
Truck-mounted cranes provide simple set-up, long reach, high-capacity booms, and are roadable at highway speeds. These cranes are produced in the U.S and sold under the Grove brand name.
Telescopic crawler cranes consist of a telescopic boom superstructure mounted on a crawler crane chassis. These cranes are purchased as complete units from a strategic manufacturing partner and sold under the Grove brand name.
Industrial cranes are designed primarily for plant maintenance, storage yard, and material handling applications. These cranes allow for lifting and carrying loads on a smooth, flat surface. These cranes are produced in the U.S. and sold under the Grove and Shuttlelift brand names.
Hydraulic boom trucks are hydraulically powered telescopic cranes mounted on a conventional truck chassis. Hydraulic boom trucks are used primarily for lifting material on a job site. These cranes are produced in the U.S. under the National Crane brand name.
Services.
Aftermarket services.
We provide expansive aftermarket services such as sale of parts and accessories, field service work, routine maintenance services, technical support, erection and decommissioning services, crane and major component remanufacturing, training services, and telematics. Additionally, we continue to invest in our rental fleet in the United States and Europe to provide additional options and flexibility to our customers. Our aftermarket services are offered through our crane product brand names, Manitowoc, Potain, Grove, Shuttlelift, and National Crane, as well as through our wholly owned distributors, MGX and Aspen.
Parts and accessories. Parts and accessories are stocked at our parts distribution centers around the world and sold through our distribution networks to ensure availability of parts to our customers. Our distribution locations also stock operational critical and frequently used parts to increase parts fulfillment velocity and reduce customer downtime.
Services. Our certified technicians can provide troubleshooting, remote diagnostic, maintenance service, and repairs for our crane products. Our technicians provide customers with efficient and high-quality repairs to ensure the crane products can operate to the original crane product specification and performance. We have over 460 technicians globally which provide various aftermarket services to our customers.
Technical support. We have product-based technical support teams that provide advanced troubleshooting, major repair procedures, incident reporting, and repair consultation services. Our technical support team has extensive subject matter expertise and works closely with our engineering and manufacturing teams to provide prompt and expert advice to our customers.
Erection and decommissioning services. Our qualified crane service technicians from our company-owned and independent distributors assist customers in safely erecting and decommissioning cranes on job sites.
Crane and major component remanufacturing. Under the brand name EnCORE, our remanufacturing services offer cost-effective ways for our customers to restore a crane to its original specifications and performance. As part of this service, complete machines or major components are disassembled, cleaned, repaired, or replaced to meet manufacturer’s
specifications, using genuine parts. All controls and safety devices are updated to current regulatory standards. Finally, the machine or component is thoroughly inspected and tested.
Training. Our Manitowoc Training Center offers extensive technical training on all our crane products which are conducted at our training facilities or on-site for our distribution service technicians and some customers.
Telematics. Manitowoc’s Potain Connect and Grove Connect telematics solutions provide subscription-based real-time access to service information on cranes through remote troubleshooting, enhancing service support, and improving speed to assist in resolving product issues. Key benefits include minimizing downtime on cranes and ability to monetize aftermarket revenue.
Manufacturing Process
Manitowoc operates nine manufacturing facilities across the world that utilize a variety of processes. In general, the manufacturing process involves the fabrication and machining of raw materials, primarily steel, which are then manufactured into sub-assemblies. Sub-assemblies are then assembled with purchased components into a complete crane. In our manufacturing operations, we maintain advanced manufacturing, quality assurance and testing equipment, and utilize extensive process automation. We have invested in Product Verification Centers at our major manufacturing facilities to support new product development, testing and qualification of sub-systems, and final product designs.
Competition
We sell our products in highly competitive end markets. We compete in each of our end markets based on product design, quality of products, aftermarket support services, product performance, maintenance costs, energy and resource savings, and overall total cost of ownership, which includes an attractive resale value. Given the expense that can be caused by operational disruption, our customers generally view quality and reliability as critical factors in their purchasing decision. We believe that we benefit from the following competitive advantages which create customer loyalty: strong brand names with competitive resale values, a reputation for quality and reliable products and aftermarket support and solution services, an established network of global distributors and customer relationships, broad product line offerings in the markets we serve, a commitment to customer-focused engineering design and product innovation, and in-house service and distribution. The following table sets forth our primary competitors:
| | |
Products |
| Primary Competitors |
Tower Cranes |
| Cattaneo; Comansa; Favelle Favco; Jaso; Liebherr; Raimondi; Saez; Sany; SOIMA; Terex Comedil/Peiner; Vicario; Wolffkran; Yongmao; XCMG; and Zoomlion/Wilbert |
|
| |
Mobile Telescopic Cranes |
| Broderson; Elliott; Hitachi Sumitomo; Kobelco; Liebherr; Locatelli; Manitex; Sany; Link-Belt; Tadano; Terex; XCMG; and Zoomlion |
Major Customers
We did not have any customers that individually comprised more than 10% of our consolidated net sales in the years ended December 31, 2024, 2023, or 2022.
Raw Material and Component Sources and Availability
We globally source raw materials and components such as semi- and fully-finished processed materials from suppliers. Our primary raw materials are structural and rolled steel and our purchased semi- and fully-finished processed materials are primarily steel structures, hydraulic components, and powertrains. We utilize a global sourcing strategy by maintaining alternate sources of supply for our critical materials and parts around the globe, wherever possible. This sourcing strategy mitigates the risk of being dependent on a single supplier and that raw materials and components are available in the regions we operate. For the majority of our critical suppliers, we have long-term agreements.
Patents, Trademarks and Licenses
We utilize patent rights to protect our intellectual property and our position as a leading provider of engineered lifting solutions. We hold numerous patents globally pertaining to our products in addition to having pending applications for additional patents. Further, we have various registered and unregistered trademarks, copyrights, and licenses. We believe our patents, trademarks,
and copyrights are adequately protected in customary fashions under applicable laws and we actively enforce our patents, trademarks, and copyrights.
Engineering, Research, and Development
We believe our extensive engineering, research, and development capabilities are key drivers of our success in creating innovative and quality products. Our dedicated locations for research and development activities are staffed by in-house engineers and technicians on three continents, supplemented with external engineering resources, who are responsible for enhancing our existing products and developing new products.
Our team of engineers focus on developing high performance, low maintenance, and innovative products intended to create significant brand loyalty among customers. Design engineers work closely with our customers and our manufacturing and marketing staffs, enabling us to identify real-time changing end-user requirements, implement new technologies, and effectively introduce product innovations. Closely managed relationships with dealers, distributors, and end users help us identify their needs, not only for products, but for the service and support level that are critical to their profitable operations. As part of our ongoing commitment to provide superior products, we intend to continue our efforts to design products that meet evolving customer demands and reduce the period from product conception to product introduction.
Seasonality
Due to seasonal conditions in the northern hemisphere impacting customer buying behaviors, particularly in the construction industry, net sales in the first and third quarters of the year are generally the lowest.
Human Capital Management
With over 4,800 employees in more than 20 countries, the success of our Company depends on these talented and dedicated team members. Our culture of continuous improvement, The Manitowoc Way, inspires us to continually look for ways to improve the employee experience and therefore attract, grow, and retain the exceptional people we need now and in the future. Authentic leadership and a commitment to living our values every day creates trust, respect, and empowerment across our business. It helps us stay focused on delivering the best outcomes for all our stakeholders.
Employment
Manitowoc’s strategy requires the engagement of a skilled, high-performing workforce. As of December 31, 2024, we employed approximately 4,800 people; 1,800 in the Americas segment, 2,500 in the EURAF segment, and 500 in the MEAP segment. The vast majority of employees are full-time, with approximately 27% covered by a national trade union or collective bargaining agreement. Manitowoc is dedicated to investing continuously in technology, training, systems, and programs that help protect and support our people, as our long-term success depends on our people.
Health and Safety
The health and safety of our employees is a top priority, with a goal to achieve a zero-injury workplace. The Company aims to maintain an injury-free environment through the implementation of Safety Management Systems (“SMS”), focusing on safe working practices and the belief that all injuries are preventable. Health and safety performance across global manufacturing locations is tracked using a mix of lagging and leading indicators. The two lagging indicators used are Recordable Injury Rate (“RIR”) and Lost Time Injury Frequency Rate (“LTIFR”), calculated according to United States Department of Labor Occupational Safety and Health Administration standards. In 2024, our year end RIR was 1.19 compared to the industry average of 3.7 and our LTIFR was 0.81 compared to the industry average of 0.9. Industry standards are per the U.S. Bureau of Labor and Statistics. In addition to our focus on lagging indicators, we have developed pro-active programs to track our leading indicators which include reporting of “near misses” and daily hazard observations through our “SLAM” (Stop-Look-Assess-Manage) and “Interactive Observation” Programs. In 2024, we recorded 78,678 SLAMs and 21,458 Interactive Observations which drove improvements to both our RIR and LTIFR by helping our workforce to identify hazards and implement pro-active mitigation measures to avoid injury or loss. More information about our health and safety is in our latest Corporate Sustainability Report (“CSR”) which can be found on our Company website. The information provided in our CSR or on our website is not part of this Annual Report on Form 10-K and is not incorporated by reference as part of this report.
Training and Talent Development
Our learning and development programs are designed to help employees achieve their full potential by building technical, operating, and leadership capabilities at all levels. These include environmental health and safety training, welding apprenticeships, sales skills development, lean manufacturing methodologies, and corporate compliance courses. Additional
opportunities for personal and professional development include providing tuition reimbursement for ongoing education, supervisor leadership cohorts, apprenticeships and internships as we continuously look for the next generation of crane specialists, from engineers to accountants, and welders.
To ensure business continuity, management, senior leadership, and the Board of Directors regularly reviews the talent pipeline, identifies and develops succession candidates, and builds succession plans for key positions. To support their growth, we have programs like the Manitowoc Mentorship Program and individual development initiatives for current and future leaders. More information about our workplace initiatives can be found in our latest CSR which can be found on our company website. The information provided in our CSR or on our website is not part of this Annual Report on Form 10-K and is not incorporated by reference as part of this report.
Available Information
We make available, free of charge, at our website (www.manitowoc.com), our Annual Reports on Form 10-K, Quarterly Reports on Form 10-Q, Current Reports on Form 8-K, our proxy statements and any amendments to those reports, as soon as reasonably practicable after we electronically file such material with, or furnish it to, the Securities and Exchange Commission (“SEC”). The information on our website is not part of this or any other report we file with or furnish to the SEC.
The SEC also maintains electronic versions of our reports on its website at www.sec.gov.
Item 1A. RISK FACTORS
The Company's financial position, results of operations and cash flows are subject to various risks, many of which are not exclusively within the Company's control, which may cause actual performance to differ materially from historical or projected future performance. Investors should carefully consider information in this Annual Report on Form 10-K in light of the risk factors described below.
Risks Relating to Our Business, Operations and Industry
Macroeconomic conditions and geopolitical events could have a material adverse impact on our business, financial condition, cash flows and results of operations.
Macroeconomic conditions, including inflation and elevated interest rates, as well as prior supply chain, labor and logistics constraints, have had, and may continue to have, a negative impact on our ability to convert backlog into revenue which could, and has, impacted our financial condition, cash flows and results of operations. For instance, the delay in the realization of price increases and provisional pricing strategies (due to longer lead times of orders in our backlog), together with prior supply chain, labor and logistics constraints, previously impacted our ability to convert backlog into revenue, impacting the timings of those sales. In addition, prior shipping constraints resulted in delays in shipments in certain regions. Continuing or worsening inflation may have a material adverse impact on our financial condition, results of operations and/or cash flows.
Geopolitical events, including the ongoing conflicts in Ukraine and in the Middle East, have had and may continue to lead to logistic constraints, higher logistic costs, and significant volatility in raw material and component costs in Europe, exacerbating the inflation situation, which may have a material adverse impact on our financial condition, results of operations and/or cash flows.
Because we participate in end markets that are highly competitive, our net sales and profits could decline as we respond, or fail to effectively respond, to competition.
We sell most of our products in highly competitive end markets. We compete in each of those end markets based on product design, quality of products, quality and responsiveness of product support services, product performance, cost of ownership, maintenance costs and price. Some of our competitors may have greater financial, marketing, manufacturing and distribution resources than we do. These competitors may, among others:
•respond more quickly to new or emerging technologies;
•have greater name recognition, critical mass or geographic market presence;
•be better positioned to compete on price for their products, due to any combination of low-cost labor, raw materials, components, facilities or other operating items, or willingness to sell at lower margins than us;
•be better able to take advantage of acquisition opportunities;
•adapt more quickly to changes in customer requirements;
•devote greater resources to the development, promotion and sale of their products;
•consolidate with other competitors in the industry which may create increased pricing and competitive pressures on our business; and
•be better able to utilize excess capacity which may reduce the cost of their products or services.
We cannot be certain that our products and services will continue to compete successfully with those of our competitors or that we will be able to retain our customer base or improve or maintain our profit margins on sales to our customers, any of which could materially and adversely affect our financial condition, results of operations and cash flows.
Unfair foreign competition could adversely affect our financial results.
Many of our foreign competitors benefit from government policies that could give them a competitive advantage in the United States and Europe, including currency devaluation and erecting trade barriers that prevent American manufacturers from selling cranes in those markets. Low-cost competition from China and developing markets could also result in decreased demand for our products. If competition in our industry intensifies or if our current competitors lower their prices for competing products, we may lose sales or be required to lower the prices we charge for our products, which may undermine our ability to generate returns on our investments.
Sales of our products are cyclical and/or are otherwise sensitive to volatile or variable factors. Weakness or a downturn in overall economic activity, or fluctuations in those other factors could have a material adverse impact on our operating results.
Historically, sales of products that we manufacture and sell have been subject to cyclical variations caused by changes in general economic conditions and other factors. In particular, demand for our products is cyclical and is impacted by the strength of the economy, generally, the availability of financing and other factors, including crude oil prices, that may have an effect on the level of construction activity on an international, national or regional basis, each of which have been and/or continue to be negatively impacted by global supply chain constraints, labor constraints, logistic constraints, cost pressures, inflation, elevated interest rates and geopolitical events. Additionally, the level of construction activity and customer demand has been and may continue to be impacted by pandemics or global health crises.
During periods of expansion in construction activity, we generally have benefited from increased demand for our products. Conversely, during recessionary periods, we have been adversely affected by reduced demand for our products, and challenging conditions can continue well beyond the end of such periods. Furthermore, any economic recession may impact leveraged companies, like us, more than competing companies with less leverage and may have a material adverse effect on our financial condition, results of operations and cash flows.
Demand for our products also depends in part on federal, state, local and foreign governmental spending and appropriations, including infrastructure, security and defense outlays. Reductions in governmental spending can reduce demand for our products, which in turn, can negatively affect our performance. Our sales depend, in part, upon our customers’ replacement or repair cycles. Adverse economic conditions, including global supply chain constraints, labor constraints, logistic constraints, and cost pressures, pandemics or public health crises, inflation, elevated interest rates and geopolitical events, have caused and may continue to cause customers to forego or postpone new purchases in favor of repairing existing machinery.
If we are unable to sufficiently adjust to market conditions, among other potential adverse effects on our financial condition, results of operations and cash flows, we could fail to deliver on expected results, incur high fixed costs and/or fail to benefit from any increased customer demand, resulting in loss of market share.
Large or rapid increases in the cost of raw material or components, substantial decreases in their availability, or our dependence on particular suppliers of raw material and components has had and will continue to have a negative impact on our operating results.
We use large amounts of steel, among other items, in the manufacture of our products. Occasionally, market prices of some of our key raw materials increase significantly, including as a result of tariffs, other trade barriers, macroeconomic conditions or
geopolitical events, resulting in increases in the cost of our products or shortages. If in the future we are unable to reduce product costs in other areas, or pass raw material price increases on to our customers, our margins could be adversely affected. In addition, because we maintain limited raw material and component inventories, even brief unanticipated delays in delivery by suppliers - including those due to supply chain constraints, labor constraints, logistic constraints, geopolitical events, supplier capacity constraints, labor disputes, impaired financial condition of suppliers, pandemics, global health crises, other infectious diseases, weather emergencies or other natural disasters - may impair our ability to satisfy our customer demand, as well as delay our ability to produce and ship certain of our products, and have had and may continue to adversely affect our financial performance.
The Company purchases under strategic alliances from third-party suppliers which are then sold into our markets. If we are not able to effectively manage pricing from these suppliers, our financial performance could be adversely affected. Likewise, if our suppliers terminate these agreements and we are unable to procure alternate products at substantially similar competitive pricing, our financial performance could be adversely affected.
We have significant manufacturing and sales of our products outside of the United States and such international operations could be subject to a number of risks specific to these countries.
For the years ended December 31, 2024, 2023, and 2022, approximately 51%, 53%, and 55%, respectively, of our net sales were attributable to products sold outside of the United States. Expanding the Company’s international sales is part of our growth strategy. Our international operations across many different jurisdictions may be subject to a number of risks specific to these countries, including:
•less flexible employee relationships which can be difficult and expensive to terminate;
•political and economic instability (including war and acts of terrorism);
•adverse trade policies or adverse changes to any of the policies of either the United States or any of the foreign jurisdictions in which we operate;
•export duties, tariffs, import controls and trade barriers (including quotas);
•inadequate infrastructure for our operations (i.e., lack of adequate power, water, transportation and raw materials);
•risk of governmental expropriation of our property;
•less favorable, or relatively undefined, intellectual property laws;
•changes in regulatory requirements and laws;
•burdens of complying with a wide variety of labor practices and foreign laws, including those relating to export and import duties, environmental policies and privacy issues;
•longer customer payment cycles and difficulty in collecting trade accounts receivable;
•adverse changes in tax rates or regulations;
•legal or political constraints on our ability to maintain or increase prices;
•health concerns and related government actions;
•inability to utilize net operating losses incurred by our foreign operations against future income in the same jurisdiction; and
•economies that are emerging or developing, that may be subject to greater currency volatility, negative growth, or recession, high inflation, limited availability of foreign exchange and other risks.
These factors may harm our results of operations, and any measures that we may implement to reduce the effect of volatile currencies and other risks of our international operations may not be effective. In our experience, entry into new international markets requires considerable management time as well as start-up expenses for market development, hiring and establishing office facilities before any significant revenue is generated. As a result, initial operations in a new market may operate at low margins or may be unprofitable.
If we do not develop new and innovative products or if customers in our markets do not accept them, our results could be negatively affected.
Our products must be kept current to meet our customers’ needs. To remain competitive, we, therefore, must develop new and innovative products on an on-going basis. If we fail to make innovations or the market does not accept our new products, our sales and results would likely suffer. We invest significantly in the research and development of new products. These expenditures do not always result in products that will be accepted by the market. To the extent they do not, whether as a function of the product or the business cycle, we will have increased expenses without significant sales to benefit us. Failure to develop successful new products may also cause potential customers to purchase competitors’ products, rather than products manufactured by us.
We have incurred and may incur in the future additional expenses and delays due to interruptions at our manufacturing and service facilities as a result of supply chain constraints, and in the future we may also incur additional expenses and delays due to technical problems or other interruptions at our manufacturing and service facilities.
Disruptions in operations, including supply chain constraints, technical problems or other interruptions, such as floods, fire, natural disasters, pandemics or other public health crises, have and in the future may adversely affect the manufacturing or service capacity of our facilities and delay our ability to produce, ship or service certain of our products. Such interruptions have caused, and in the future could cause, delays in production or service, and cause us to incur additional expenses such as charges for expedited deliveries for products that are delayed. Additionally, our customers may have the ability to cancel purchase orders in the event of any delays in production or service and may decrease future orders if delays are persistent. To the extent that such disruptions do not result from damage to our physical property, these disruptions may not be covered by our business interruption insurance. Any such disruptions may adversely affect our business, operations and financial results.
We depend on our key executive officers, managers and skilled personnel and may have difficulty retaining and recruiting qualified employees.
Our success depends to a large extent upon the continued services of our executive officers, senior management personnel, managers and other skilled personnel and our ability to recruit and retain skilled personnel to maintain and expand our operations. We could be affected by the loss of any of our executive officers who are responsible for formulating and implementing our business plan and strategy. In addition, we need to recruit and retain additional management personnel and other skilled employees. However, competition is high for skilled technical personnel among companies that rely on engineering and technology. The loss of qualified employees or an inability to attract, retain and motivate additional skilled employees required for the operation and expansion of our business could hinder our ability to conduct design, engineering and manufacturing activities successfully and develop marketable products, as well as successfully expand our aftermarket service business. We may not be able to attract the skilled personnel we require or retain those whom we have trained at our own cost. If we are not able to do so, our business and our ability to continue to grow could be negatively affected and we could face additional competition from those employees who leave and work for our competitors.
We may not be able to maintain our engineering, technological and manufacturing expertise.
The markets for our products and services are characterized by changing technology and evolving process development. The continued success of our business will depend upon our ability to:
•hire, retain and expand our pool of qualified engineering and technical personnel;
•maintain technological leadership in our industry;
•successfully anticipate or respond to rapidly changing technologies;
•successfully anticipate or respond to changes in manufacturing processes in a cost-effective and timely manner; and
•successfully anticipate or respond to changes in cost to serve in a cost-effective and timely manner.
We cannot be certain that we will develop the capabilities required by our customers in the future. The emergence of new technologies, industry standards or customer requirements may render our equipment, inventory or processes obsolete or uncompetitive. We may have to acquire new technologies, skills and equipment to remain competitive. The acquisition and implementation of new technologies and equipment may require us to incur significant expense and capital investment, which
could reduce our margins and affect our operating results. When we establish new facilities, we may not be able to maintain or develop our engineering, technological, manufacturing and service expertise due to a lack of trained personnel, effective training of new staff or technical difficulties with machinery. Failure to anticipate and adapt to customers’ changing technological needs and requirements or to hire and retain a sufficient number of engineers and service technicians and maintain engineering, technological, manufacturing and service expertise may have a material adverse effect on our business.
An inability to successfully manage information systems, or to adequately maintain these systems and their security, as well as to protect data and other confidential information, could adversely affect our business and reputation.
In the ordinary course of business, we collect and store sensitive data and information, including our proprietary and regulated business information and that of our customers, suppliers and business partners, as well as personally identifiable information about our employees. We depend on our information systems to successfully manage our business. We have taken steps to maintain adequate data security by implementing cyber security technologies, internal controls, and network and data center resiliency and recovery processes. However, an inability to successfully manage these systems, including matters related to system and data security, privacy, reliability, compliance, performance and access, as well as an inability of these systems to fulfill their intended purpose within our business, could have an adverse effect on our business.
Despite our efforts, our information systems, like those of other companies, are susceptible to damage or interruption due to natural disasters, power loss, telecommunications failures, viruses, breaches of security, system upgrades or new system implementations. Furthermore, our security measures may not detect or prevent all security threats, whether from intentional or inadvertent breaches by our employees or attacks designed to gain unauthorized access to our systems, networks and data, such as denial-of-service attacks, viruses, malicious software, break-ins, phishing attacks, social engineering, security breaches or other attacks and similar disruptions. Any operational failure or breach of security from increasingly sophisticated cyber threats could lead to the loss or disclosure of both our and our customers’ financial, product and other confidential information, result in regulatory actions, legal proceedings and increased insurance costs, and have an adverse effect on our business and reputation.
Any disruption in our information systems could disrupt our operations and would be adverse to our business and financial operations.
We depend on various information systems to successfully manage our business, including managing orders, suppliers, accounting controls and payroll. The inability to successfully manage the procurement, development, implementation or execution of our information systems and back-up systems, including matters related to system security, reliability, performance and access, as well as the inability of these systems to fulfill their intended purpose within our business, could have an adverse effect on our business and financial performance. Such disruptions may not be covered by our business interruption insurance.
If we fail to identify, manage, complete and appropriately integrate acquisitions, strategic alliances, joint ventures or other significant transactions, it could adversely affect our future results.
We have in the past and expect to continue to pursue acquisitions, strategic alliances, joint ventures or other significant transactions in line with our strategy. In order to pursue this strategy successfully, we must identify attractive acquisitions, strategic alliances, joint venture opportunities, potentially obtain financing for future acquisitions on satisfactory terms, successfully complete the transaction, some of which may be large and complex, and manage post-closing issues such as integration of the acquired company or employees. We may not be able to identify or complete appealing acquisition, strategic alliance or joint venture opportunities given the intense competition for these transactions. Even if we identify and complete suitable transactions, we may not be able to successfully address inherent risks in a timely manner, or at all. These inherent risks include, among other things: failure to achieve all or any projected synergies, performance targets or other anticipated benefits of the acquisition, strategic alliance or joint venture; failure to successfully integrate the purchased operations, technologies, products or services and maintain uniform standard controls, policies and procedures; incurring substantial unanticipated integration costs; the loss of key employees, including those of an acquired business; diversion of management’s attention from other business concerns; failure to retain the customers of the acquired business; additional debt and/or assumption of known or unknown liabilities; potential dilutive issuances of equity securities; and a write-off of goodwill, customer lists, other intangibles and amortization of expenses. If we fail to successfully integrate an acquisition, we may not realize all or any of the anticipated benefits of the acquisition, and our future results of operations could be adversely affected.
If we fail to maintain an effective network for distribution of our products and services, it could affect our business and financial results.
We sell some of our products and provide aftermarket services through both independent third parties such as distributors, agents and channel partners (collectively referred to as distributors) and wholly owned subsidiaries. Each distribution method has risks and costs, and our failure to maintain and grow an effective distribution network may have a material adverse impact on our business.
Using distributors exposes us to many risks, including competitive pressure, concentration risk, credit risk, and compliance risks. Distributors may sell products that compete with our products, and we may need to provide financial and other incentives to focus distributors on the sale of our products. We may rely on one or more key distributors for a product, and the loss of these distributors could negatively impact our sales. Distributors may face financial difficulties, including bankruptcy, which could harm our collection of accounts receivable and financial results. Violations of the Foreign Corrupt Practices Act or similar laws by distributors or other third-party intermediaries could have a material impact on our business. Failing to manage risks related to our use of distributors may reduce sales, increase expenses, and weaken our competitive position.
Increasing costs of doing business in many countries in which we operate may adversely affect our business and financial results.
Increasing costs such as labor costs, raw material and component costs, logistic costs, unfavorable absorption of overhead costs due to inefficiencies from supply chain constraints, and energy costs, in the countries in which we operate may erode our profit margins and compromise our price competitiveness. Our profitability also depends on our ability to manage and contain our other operating expenses such as the cost of factory supplies, factory space, equipment rental, repairs and maintenance and freight and packaging expenses. In the event we are unable to manage any increase in our labor and other operating expenses in an environment where revenue does not increase proportionately, our financial results would be adversely affected.
Our operations and profitability could suffer if we experience problems with labor relations.
As of December 31, 2024, we employed approximately 1,800 in the Americas segment, 2,500 in the EURAF segment, and 500 in the MEAP segment. The vast majority of employees are full-time, with approximately 27% covered by a national trade union or collective bargaining agreement. Any significant labor relations issues with our various employee unions could have an adverse effect on our operations, reputation, results of operations and financial condition.
Our inability to recover from natural or man-made disasters or public health crises could adversely affect our business.
Our business and financial results may be affected by certain events that we cannot anticipate or that are beyond our control, such as natural or manmade disasters, pandemics or other public health crises, national emergencies, significant labor strikes, work stoppages, the effects of climate change, political unrest, war or terrorist activities that could curtail production at our facilities and cause delayed deliveries and canceled orders. In addition, we purchase raw material and components, information technology and other services from numerous suppliers, and, even if our facilities were not directly affected by such events, we have been and in the future could be affected by interruptions at such suppliers. Such suppliers may be less likely than our own facilities to be able to quickly recover from such events and may be subject to additional risks such as financial problems that limit their ability to conduct their operations. We cannot be assured that we will have insurance to adequately compensate us for any of these events.
Financial Risks
Some of our customers may not be able to obtain financing with third parties to purchase our products, and we could incur expenses associated with our assistance to customers in securing third-party financing.
A portion of our sales are financed by third-party finance companies on behalf of our customers. The availability of financing from third parties is affected by general economic conditions, the creditworthiness of our customers and the estimated residual value of our equipment. In certain transactions, we provide residual value guarantees and buyback commitments to our customers or to third-party financial institutions. Deterioration in the credit quality of our customers or the overall health of the finance industry could negatively impact our customers’ ability to obtain the resources needed to make purchases of our equipment or their ability to obtain third-party financing. In addition, if the actual value of the equipment for which we have provided a residual value guaranty declines below the amount of our guaranty, we may incur additional costs, which may negatively impact our financial condition, results of operations and cash flows.
Our leverage could impair our operations and financial condition.
As of December 31, 2024, our total consolidated debt was $390.2 million compared to $372.1 million as of December 31, 2023.
We and certain of our subsidiaries (the “Loan Parties”) are parties to a credit agreement (the “ABL Credit Agreement”), as last amended on September 18, 2024, with JP Morgan Chase Bank, N.A. as administrative and collateral agent, and certain financial institutions party thereto as lenders, providing for a senior secured asset-based revolving credit facility (the “ABL Revolving Credit Facility”) of up to $325.0 million, of which $100.0 million is available to our German subsidiary that is a borrower under the ABL Revolving Credit Facility. The borrowing capacity under the ABL Revolving Credit Facility is based on the value of inventory, accounts receivable and certain fixed assets of the Loan Parties. The Loan Parties’ obligations under the ABL Revolving Credit Facility are secured on a first-priority basis, subject to certain exceptions and permitted liens, by substantially all of the personal property and fee-owned real property of the Loan Parties. The liens securing the ABL Revolving Credit Facility are senior in priority to the second-priority liens securing the obligations under the 2031 Notes (as defined below) and the related guarantees. The ABL Revolving Credit Facility matures on September 18, 2029.
On September 19, 2024, we and certain of our subsidiaries entered into an indenture with U.S. Bank Trust Company, National Association as trustee and notes collateral agent, pursuant to which we issued $300.0 million aggregate principal amount of senior secured second lien notes due on October 1, 2031, with an annual coupon rate of 9.25% (the “2031 Notes”). Interest on the 2031 Notes is payable in cash semi-annually in arrears on April 1 and October 1 of each year. The 2031 Notes are fully and unconditionally guaranteed on a senior secured second lien basis, jointly and severally, by each of our existing and future domestic subsidiaries that is either a guarantor or a borrower under the ABL Revolving Credit Facility or that guarantees certain other debt of us or a guarantor. The 2031 Notes and the related guarantees are secured on a second-priority basis, subject to certain exceptions and permitted liens, by pledges of capital stock and other equity interests and other security interests in substantially all of the personal property and fee-owned real property of us and of the guarantors that secure obligations under the ABL Revolving Credit Facility.
The amount of debt we maintain could have consequences, including increasing our vulnerability to general adverse economic and industry conditions; requiring a substantial portion of our cash flows from operations be used for the payment of interest rather than to fund working capital, capital expenditures, acquisitions and general corporate requirements, especially in a high interest environment; limiting our ability to obtain additional financing and/or to refinance our existing debt (and the potential for higher costs associated with any additional financing or the refinancing of our existing debt); and limiting our flexibility in planning for, or reacting to, changes in our business and the end markets in which we operate.
The agreements governing our debt include covenants that restrict, among other matters, our ability to assume or guarantee additional debt or issue certain preferred shares, pay dividends on or make other distributions in respect of our capital stock or make other restricted payments, make certain investments, sell or transfer certain assets, create liens on certain assets to secure debt, consolidate, merge, sell, or otherwise dispose of all or substantially all of our assets, enter into certain transactions with affiliates and designate our subsidiaries as unrestricted. Certain of our debt facilities require or will require us to maintain specified financial ratios and satisfy certain financial condition tests. Our ability to comply with these covenants may be affected by events beyond our control, including prevailing economic, financial and industry conditions. Adhering to these covenants may also require that we take disadvantageous actions, including reducing spending on marketing, advertising and new product innovation, reducing future financing for working capital, capital expenditures and general corporate purposes, selling assets or dedicating an unsustainable level of cash flows from operations to the payment of principal and interest on our indebtedness. Our leverage could also put us at a disadvantage compared to any competitors that are less leveraged. We cannot be certain that we will meet any future financial tests or that the lenders would waive any such failure to meet those tests. Refer to Note 10, “Debt,” to the Consolidated Financial Statements.
If we default under our debt agreements, our lenders could elect, among other potential remedies, to declare all amounts outstanding under our debt agreements to be immediately due and payable and could proceed against any collateral securing the debt, which would adversely affect our results of operations, financial condition and cash flows in future periods.
Our results of operations are subject to exchange rate and other currency risks. A significant movement in exchange rates could adversely impact our results of operations and cash flows.
Some of our operations are and will continue to be conducted by subsidiaries in foreign countries. The results of the operations and the financial position of these subsidiaries will be reported in the relevant foreign currencies and then translated into U.S. dollars at the applicable exchange rates for inclusion in our consolidated financial statements, which are stated in U.S. dollars.
The exchange rates between foreign currencies and the U.S. dollar have fluctuated significantly in recent years and may continue to fluctuate in the future. Such fluctuations may have a material effect on our results of operations and financial position and may significantly affect the comparability of our results between financial periods.
We also incur currency transaction risk whenever one of our operating subsidiaries enters into a transaction using a different currency than its functional currency. We attempt to reduce currency transaction risk whenever one of our operating subsidiaries enters into a material transaction in a currency other its functional currency by:
•matching cash receipts and payments in the same currency;
•direct foreign currency borrowing; and
•entering into foreign exchange contracts for hedging purposes.
However, we may not be able to hedge this risk completely or at an acceptable cost, which may adversely affect our results of operations, financial condition and cash flows in future periods.
Exposure to additional tax liabilities could have a negative impact on our operating results.
We regularly undergo tax audits in various jurisdictions in which we operate. Although we believe that our tax estimates are reasonable and that we prepare our tax filings in accordance with all applicable tax laws, the final determination with respect to any tax audits, and any related contests thereto, could be materially different from our estimates or from our historical income tax provisions and accruals. The results of an audit or contests thereto could have a material adverse effect on operating results and/or cash flows in the periods for which that determination is made. In addition, future period earnings may be adversely impacted by litigation costs, settlements, penalties and/or interest assessments.
Our goodwill and intangible assets represent a significant amount of our total assets; as a result, impairment charges have had, and future impairment charges may have, an adverse effect on our results of operations.
As of December 31, 2024, goodwill and intangible assets — net totaled $196.3 million, or approximately 11.8% of our total assets. The Company performs its annual goodwill and indefinite-lived intangible assets impairment test during the fourth quarter, or more frequently if events or changes in circumstances indicate that the asset might be impaired. Deterioration in macroeconomic conditions, a decline in actual results as compared with the Company's projections, a prolonged low Company equity market capitalization, or material changes to management's assumptions could require the Company to recognize non-cash charges to operating earnings from goodwill and/or intangible asset impairment charges. Material changes to management’s assumptions include weakening industry or economic trends, disruptions to the Company's business, unexpected significant changes or planned changes in the use of the assets or in entity structure. Goodwill or intangible asset impairments have had, and any future impairments may have, a material adverse effect on our results of operations.
We face risks associated with our pension and other postretirement benefit obligations.
We have both funded and unfunded pension and other postretirement benefit plans worldwide. As of December 31, 2024, our projected benefit obligations under our pension and other postretirement benefit plans exceeded the fair value of plan assets by an aggregate of approximately $50.6 million (“unfunded status”), as compared to $61.4 million as of December 31, 2023. Estimates for the amount and timing of the future funding obligations of these benefit plans are based on various assumptions. These assumptions include discount rates, rates of compensation increases, expected long-term rates of return on plan assets and expected healthcare cost trend rates. If our assumptions prove incorrect, our funding obligations may increase, which may have a material adverse effect on our financial results.
We have invested the plan assets of our funded benefit plans in various equity and debt securities. A deterioration in the value of plan assets could cause the unfunded status of these benefit plans to increase, thereby increasing our obligation to make additional contributions to these plans. An obligation to make contributions to our benefit plans could reduce the cash available for working capital and other corporate uses, and may have an adverse impact on our operations, financial condition and cash flows.
Legal and Regulatory Risks
Environmental liabilities that may arise could be material.
Our operations, facilities and properties are subject to extensive and evolving laws and regulations pertaining to air emissions, wastewater discharges, the handling and disposal of solid and hazardous materials and wastes, the remediation of contamination, and otherwise relating to health, safety and the protection of the environment. As a result, we are involved from time to time in administrative or legal proceedings relating to environmental and health and safety matters and have in the past and will continue to incur capital costs and other expenditures relating to such matters. For example, we recently entered into a consent decree with the United States government concerning our participation in the Environmental Protection Agency's Transition Program for Equipment Manufacturers and related matters. Refer to Note 17, “Commitments and Contingencies” to the Consolidated Financial Statements.
We cannot be certain that identification of presently unidentified environmental conditions, more vigorous enforcement by regulatory authorities or other unanticipated events will not arise in the future and give rise to additional environmental liabilities, compliance costs and/or penalties that could be material. Further, environmental policies, laws and regulations are constantly evolving, and it is impossible to predict accurately the effect they may have upon our financial condition, results of operations or cash flows.
In addition, increasing laws and regulations dealing with environmental aspects of the products we manufacture can result in significant expenditures in designing and manufacturing new products that satisfy such new laws and regulations. In particular, many scientists, legislators and others attribute climate change to increased levels of greenhouse gas emissions. While additional regulation of emissions in the future appears likely, how such new regulations would ultimately affect our business, operations or financial results is unknown at this time.
Our international sales and operations are subject to applicable laws relating to trade, export controls and foreign corrupt practices, the violation of which could adversely affect our operations.
We must comply with all applicable international trade, customs, export controls and economic sanctions laws and regulations of the United States and other countries. We are also subject to the Foreign Corrupt Practices Act and other anti-bribery laws that generally bar bribes or gifts to foreign governments or officials. The recent presidential administrations in the United States have taken, and may take additional, actions that may inhibit international trade by U.S.-based companies. Changes in trade sanctions laws may restrict our business practices, including cessation of business activities in sanctioned countries or with sanctioned parties, and may result in modifications to compliance programs. Violation of these laws or regulations could result in sanctions or fines and could have a material adverse effect on our financial condition, results of operations, cash flows and reputation.
If our manufacturing processes and products do not comply with applicable statutory and regulatory requirements, or if we manufacture products containing design or manufacturing defects, demand for our products could decline and we could be subject to product liability claims.
Our designs, manufacturing processes and facilities need to comply with applicable statutory and regulatory requirements. We may also have the responsibility to ensure that products we design satisfy safety and regulatory standards including those applicable to our customers and to obtain any necessary certifications. As a result, products that we manufacture may at times contain manufacturing or design defects, and our manufacturing processes may be subject to errors or not be in compliance with applicable statutory and regulatory requirements or demands of our customers. Potential defects in the products we manufacture or design, whether caused by a design, manufacturing or component failure or error, or deficiencies in our manufacturing processes, may result in delayed shipments to customers, replacement costs or reduced or canceled customer orders. If these defects or deficiencies are significant, our business reputation may also be damaged. The failure of the products that we manufacture or our manufacturing processes and facilities to comply with applicable statutory and regulatory requirements may subject us to legal fines or penalties and, in some cases, require us to shut down or incur considerable expense to correct a manufacturing process or facility.
Any manufacturing or design defects may also result in product liability claims. Furthermore, customers use some of our products in potentially hazardous applications that can cause injury or loss of life and damage to property, equipment or the environment. We may be named as a defendant in product liability or other lawsuits asserting potentially large claims if an accident occurs at a location where our equipment and services have been or are being used. Certain of our businesses also have experienced claims relating to past alleged asbestos exposure. We have not to date incurred material costs related to these
asbestos claims. We vigorously defend ourselves against current claims and intend to do so against future claims. We also have certain insurance policies which may limit our financial exposures. Any significant liabilities which are not covered by insurance could have an adverse effect on our financial condition, results of operation and cash flows. Likewise, a substantial increase in the number of claims that are made against us or the amounts of any judgments or settlements could materially and adversely affect our reputation, the ability to obtain and the rates for insurance coverages, and our financial condition, results of operations and cash flows.
If we do not meet customers’ product quality, reliability standards and expectations, we may experience increased or unexpected product warranty claims and other adverse consequences to our business.
Product quality and reliability are significant factors influencing customers' decisions to purchase our products and aftermarket services. Inability to maintain the high quality of our products relative to the perceived or actual quality of similar products offered by competitors could result in the loss of market share, loss of revenue, reduced profitability, an increase in warranty costs, government investigations and/or damage to our reputation.
Product quality and reliability are determined in part by factors that are not entirely within our control. We depend on our suppliers for parts and components that meet our standards. If our suppliers fail to meet those standards, we may not be able to deliver the quality of products that our customers expect, which may impair our reputation, resulting in lower revenue and higher warranty costs.
We provide our customers a warranty covering workmanship, and in some cases materials, on products we manufacture. Such warranties generally provide that products will be free from defects for periods ranging from 12 months to 60 months. If a product fails to comply with the warranty, we may be obligated, at our expense, to correct any defect by repairing or replacing the defective product. Although we maintain warranty reserves in an amount based primarily on the number of units shipped and on historical and anticipated warranty claims, there can be no assurance that future warranty claims will follow historical patterns or that we can accurately anticipate the level of future warranty claims. An increase in the rate of warranty claims or the occurrence of unexpected warranty claims, for which we do not have a reserve or where we cannot recover from our vendors to the extent their materials or workmanship were defective, could materially and adversely affect our financial condition, results of operations and cash flows.
Compliance or the failure to comply with regulations and governmental policies could cause us to incur significant expense.
Changes in laws or regulations, or a failure to comply with laws and regulations, may adversely affect our business, investments and results of operations. We are subject to laws and regulations enacted by national, regional and local governments, including non-U.S. governments. In particular, we are required to comply with certain SEC and other legal requirements. Compliance with, and monitoring of, applicable laws and regulations may be difficult, time consuming and costly. Those laws and regulations and their interpretation and application may also change from time to time and those changes could have a material adverse effect on our business, investments and results of operations. In addition, a failure to comply with applicable laws or regulations, as interpreted and applied, could have a material adverse effect on our business and results of operations. Additionally, we may need to obtain and maintain licenses and permits to conduct business in various jurisdictions. If we or the businesses or companies we acquire have failed or fail in the future to comply with such laws and regulations, then we could incur liabilities and fines and our operations could be suspended. Such laws and regulations could also restrict our ability to modify or expand our facilities, could require us to acquire costly equipment, or could impose other significant expenditures.
If we fail to protect our intellectual property rights or maintain our rights to use licensed intellectual property, our business could be adversely affected.
Our intellectual property, including our patents, trade secrets, trademarks and licenses are important in the operation of our business. Although we intend to protect our intellectual property rights vigorously, we cannot be certain that we will be successful in doing so. Third parties may assert or prosecute infringement claims against us in connection with the services and products that we offer, and we may or may not be able to successfully defend these claims. Litigation, either to enforce our intellectual property rights or to defend against claimed infringement of the rights of others, could result in substantial costs and in a diversion of our resources. In addition, if a third party would prevail in an infringement claim against us, then we would likely need to obtain a license from the third party on commercial terms, which would likely increase our costs. Our failure to maintain or obtain necessary licenses or an adverse outcome in any litigation relating to patent infringement or other
intellectual property matters could have a material adverse effect on our financial condition, results of operations and cash flows.
None.
Item 1C. CYBERSECURITY
The Company’s risk management program includes procedures, systems, and processes for assessing, identifying, and managing material risks from cybersecurity threats. Overall, we address cybersecurity risks through the Board of Directors (the "Board") and management oversight and a system of controls and procedures designed to protect the confidentiality, integrity, and availability of the Company’s information assets. The Company employs a comprehensive system of monitoring, detection, internal reporting, and prompt escalation of certain cybersecurity incidents, plans for incident response and recovery, technical safeguards, third-party risk management, and mandatory training and awareness campaigns.
Governance and Management Oversight
The Board, in conjunction with the Audit Committee of the Board (“Audit Committee”), oversees the Company’s Enterprise Risk Management process, which includes cybersecurity risks. The Board and the Audit Committee receive regular presentations and discuss topics on cybersecurity risks with management, including the Director of Cybersecurity and the Senior Vice President Global Information Systems. The presentations and discussions address a range of topics, including recent cybersecurity developments, the threat environment, evolving standards and technology, vulnerability assessments and related remediation plans, education and training programs, and cybersecurity insurance. The Board also receives periodic training on recent developments and trends in cybersecurity from a third-party advisor. Based on the Company’s procedures, the Board and Audit Committee receive prompt and timely information regarding any cybersecurity threat or incident that meets established reporting thresholds, and regular updates until such threat or incident has been addressed.
The Director of Cybersecurity and the Senior Vice President Global Information Systems work closely with the CEO, CFO, General Counsel and other members of management to design, implement and maintain policies, procedures and practices to protect the Company’s information systems and promptly respond to any cybersecurity threats or incidents, consistent with the Company’s response and recovery plans. The Global Information Services team monitors the prevention, detection, and mitigation systems in real time and reports such threats and incidents to the Director of Cybersecurity, Senior Vice President Global Information Systems, the CEO, CFO, General Counsel, and other members of management, when appropriate. The process provides for prompt escalation of certain cybersecurity incidents so that decisions regarding public disclosure and reporting of such incidents can be made by management in a timely manner.
The Global Information Services team has relevant educational and industry experience. The Director of Cybersecurity has served in various roles in information technology and security at Manitowoc for over 30 years, including the last six years overseeing cybersecurity. The Senior Vice President Global Information Systems has been with Manitowoc for over 24 years, leading the Global IS team since 2022.
Controls, Procedures and Technical Safeguards
The Company has enterprise security policies, controls and procedures designed to protect the confidentiality, integrity, and availability of our information assets. Among other areas, the comprehensive system addresses intrusion detection, encryption, device hardening, and monitoring through various controls, including phishing protection solutions, administrative password management tools, system patching, encryption, and intrusion prevention and detection systems.
The Company regularly engages in assessments, testing and subsequent remediation of our policies, procedures and practices that are designed to address cybersecurity threats and incidents. These efforts include a variety of third-party vendors and activities, including audits, assessments, penetration tests, threat modeling, tabletop exercises and vulnerability testing. We have also engaged a third party to perform an independent review of our information security environment. The results of such assessments, audits and reviews, along with remediation and development plans, are reported by management to the Board and Audit Committee.
The Company deploys technical safeguards designed to protect the Company’s information systems, including firewalls and systems for anti-malware, intrusion detection and prevention. The technical safeguards are regularly evaluated, tested, and
improved through vulnerability assessments and updated cybersecurity intelligence. The Company also maintains incident response and recovery plans that address the Company's response to a cybersecurity incident and such plans are tested, evaluated and updated on a regular basis.
The company evaluates and oversees cybersecurity risks presented by third parties, including vendors, and service providers, and the systems of third parties that could impact our business. We seek vendor partners who are reliable, reputable and maintain cybersecurity programs. We also rely on contractual terms for indemnification and to ensure vendors and service providers employ industry best practices to protect confidential information.
The Company uses employee training and education as part of the comprehensive system designed to protect the Company’s information systems. Through mandatory training and ongoing awareness campaigns, including phishing simulations, we are educating our personnel about cybersecurity risks and providing them with the tools to identify, prevent and report potential cybersecurity threats.
Cybersecurity threats, including as a result of previous cybersecurity incidents, have not materially affected or are not reasonably likely to affect the Company, including its business strategy, results of operations or financial condition.
Item 2. PROPERTIES
General Information
Manitowoc maintains leased and owned service centers, distribution centers, remanufacturing, manufacturing, and office facilities throughout the world. The Company believes the properties it owns to be generally well maintained and adequate for present use. Through planned capital expenditures, the Company expects these properties to remain adequate for future needs. Leased properties are covered by leases expiring over terms of one to twenty years. The Company does not anticipate any difficulty in retaining occupancy of any leased facilities, either by renewing leases prior to expiration or by replacing them with equivalent leased facilities.
Headquarters and Other Key Offices
The Company’s corporate headquarters is in a leased office located in Milwaukee, Wisconsin.
Service Centers
The Company operates service centers through its wholly owned subsidiary, MGX Equipment Services, in the following locations: Phoenix, Arizona; Denver, Colorado; Ankeny, Iowa; Baton Rouge and Belle Chasse, Louisiana; Baltimore, Maryland; Bloomington, Minnesota; Kansas City, Missouri; Billings, Montana; Winston-Salem, North Carolina; Omaha, Nebraska; Aiken, South Carolina; Houston and Dallas, Texas; Salt Lake City, Utah; and Norfolk, Virginia.
The Company also operates service centers in Europe and Australia at the following locations: Sydney, Australia; Saint Herblain, France; Vitrolles, France; Saint Ouen l’Aumône, France; Saint Pierre de Chandieu, France; Dole, France; Dry, France; Nice, France; Pompignac, France; Langenfeld, Germany; Lainate, Italy; Breda, Netherlands; Baltar, Portugal; Ajalvir, Spain; Buckingham, United Kingdom; and Barnsley, United Kingdom.
Parts Distribution Centers
The Company operates parts distribution centers in Jeffersonville, Indiana and Saint Pierre de Chandieu, France.
Remanufacturing
Remanufacturing of products through our EnCORE brand name is conducted in the following locations: Bauxite, Arkansas; Charlieu, France; Dry, France; Langenfeld, Germany; Belle Chasse, Louisiana; Baltimore, Maryland; Baltar, Portugal; Aiken, South Carolina; Houston, Texas; and Norfolk, Virginia.
Manufacturing
The manufacturing facilities are believed to be suitable for their intended purposes, with adequate capacities for current and projected needs for existing products. Manitowoc management continually monitors the Company’s capacity needs and makes adjustments as dictated by market and other conditions.
The following table provides information about material manufacturing facilities owned or leased by the Company as of December 31, 2024.
|
Facility Location |
Americas |
Shady Grove, Pennsylvania |
EURAF |
Wilhelmshaven, Germany |
Niella Tanaro, Italy |
Moulins, France |
Charlieu, France |
Baltar, Portugal |
MEAP |
Zhangjiagang, China |
Pune, India |
Item 3. LEGAL PROCEEDINGS
From time to time, the Company is subject to litigation incidental to its business, as well as other litigation of a non-material nature in the ordinary course of business. Refer to Note 17, “Commitments and Contingencies,” to the Consolidated Financial Statements included in Part II, Item 8 of this Annual Report on Form 10-K for further information.
Item 4. MINE SAFETY DISCLOSURE
Not Applicable.
INFORMATION ABOUT OUR EXECUTIVE OFFICERS
Each of the following executive officers of the Company has been elected by the Board of Directors. The information presented below is as of February 21, 2025.
| | | | | | |
Name | | Age | | Position With The Registrant | | Principal
Position Held
Since |
Aaron H. Ravenscroft | | 46 | | President and Chief Executive Officer | | 2020 |
Brian P. Regan | | 51 | | Executive Vice President and Chief Financial Officer | | 2022 |
Jennifer L. Peterson | | 48 | | Executive Vice President, General Counsel and Secretary | | 2022 |
Leslie L. Middleton | | 55 | | Executive Vice President, Americas and EU
Mobile Cranes | | 2020 |
James S. Cook | | 41 | | Executive Vice President, Human Resources | | 2023 |
The following paragraphs provide further information as to our executive officers’ duties and their employment history:
Aaron H. Ravenscroft has served as the President and Chief Executive Officer of the Company since August 2020. Prior to his appointment, he was the Executive Vice President of Cranes since 2017, overseeing the company’s operational activities. Mr. Ravenscroft joined Manitowoc in 2016 as the Executive Vice President of Mobile Cranes. Before joining Manitowoc, Mr. Ravenscroft served as Regional Managing Director of the North American Minerals business for the Weir Group (2013-2016); President and Group Executive of Process & Flow Control Group of Robbins & Myers (2011-2013); and Regional Vice President of Industrial Products Group for Gardner Denver, Inc. (2008-2011). Mr. Ravenscroft also worked at Westinghouse Air Brake Technologies and Janney Montgomery Scott. He holds an MBA from Carnegie Mellon University and a Bachelor of Arts in Economics from Bucknell University.
Brian P. Regan has served as Executive Vice President and Chief Financial Officer of the Company since May 2022. Prior to his appointment, he was the Vice President, Corporate Controller and Principal Accounting Officer since November 2018, overseeing the Company’s accounting and financial reporting teams and was also responsible for the Treasury function
beginning in 2020. Before joining Manitowoc, Mr. Regan served in positions of increasing responsibility at SPX Corporation (2006-2018) where he had most recently served as Vice President Finance, Chief Financial Officer of SPX Transformer Solutions. Prior to SPX Corporation, Mr. Regan served in positions of increasing responsibility at Ernst & Young LLP (2000-2006) and Ogilvy & Mather (1997-2000). He holds a Bachelor of Arts in Economics and Accounting from the College of the Holy Cross and earned his Certified Public Accountant license in New York.
Jennifer L. Peterson has served as the Executive Vice President, General Counsel and Secretary of the Company since August 2022. Prior to her appointment, she was the Interim General Counsel and Assistant Secretary since May 2022, Vice President and Associate General Counsel since April 2021, and Associate General Counsel – Litigation and Product Safety since January 2018. Before joining Manitowoc, Ms. Peterson served as Director of Litigation, Americas for Adient plc (2016-2018); Senior Group Counsel for Johnson Controls, Inc. (2014-2016); Deputy General Counsel for Journal Communications, Inc. (2009-2014); worked at the law firm Godfrey & Kahn, S.C. (2002-2009); and was Law Clerk to the Honorable N. Patrick Crooks on the Wisconsin Supreme Court (2001-2002). She holds a Bachelor of Arts in Public Communications from the University of Wisconsin – Eau Claire and a Juris Doctorate from the University of Wisconsin Law School.
Leslie L. Middleton has served as the Executive Vice President, Americas and EU Mobile Cranes of the Company since November 2020. Prior to his appointment he was the Senior Vice President of Americas Mobile Cranes. Mr. Middleton joined Manitowoc in February 2016 and is responsible for optimizing operations, development and implementation of lean strategies, increased new product development, and growth in the Americas business and Germany mobiles. Before joining Manitowoc, Mr. Middleton served as Managing Director U.S. Minerals and Executive Vice President Operations at Weir Minerals North America (2014-2016); Vice President and General Manager of Gardner Denver (2009-2013); Director of Manufacturing at Magnet Schultz of America (2004-2009); and Director of Manufacturing and Performance Systems at Vapor Corporation (1995-2004).
James S. Cook has served as Executive Vice President, Human Resources since May 2023. Prior to his appointment, he served as Senior Vice President, Human Resources since August 2022, Senior Vice President, EH&S (Environment, Health & Safety) and The Manitowoc Way, since August 2022 and Vice President, EH&S and Security since August 2017. Before joining Manitowoc, Mr. Cook served in progressive executive roles at Hansa Heavy Lift (2015-2017), SAL Heavy Lift (2012-2015), Aida Cruises (2012), Holland America Line (2003-2012), and served as an Officer in the British Royal Navy (2002).
PART II
Item 5. MARKET FOR REGISTRANT’S COMMON EQUITY, RELATED STOCKHOLDER MATTERS AND ISSUER PRUCHASES OF EQUITY SECURITIES
The Company’s common stock is traded on the New York Stock Exchange (“NYSE”) under the symbol MTW. The number of shareholders of record of common stock as of December 31, 2024 was 473.
The amount and timing of any dividends are determined by the Board of Directors at its regular meetings each year, subject to limitations within the indenture governing the Company’s 2031 Notes and the Company’s ABL Revolving Credit Facility described below. For the years ended December 31, 2024 and 2023, no cash dividends were declared or paid.
The Company’s ABL Revolving Credit Facility and Indenture governing the 2031 Notes defines certain payments the Company can make, such as the repurchase or retirement of Company stock, prepayment of debt principal and distribution of dividends to holders of Company stock as “Restricted Payments.” These Restricted Payments may be constrained by a provision requiring a minimum fixed charge coverage ratio after giving effect to the Restricted Payments under the ABL Credit Agreement and a provision requiring a minimum consolidated total debt ratio under the 2031 Notes indenture. Refer to Note 10, “Debt,” to the Company’s Consolidated Financial Statements.
See Part III, Item 12 of this Annual Report on Form 10-K for certain information regarding the Company’s equity compensation plans.
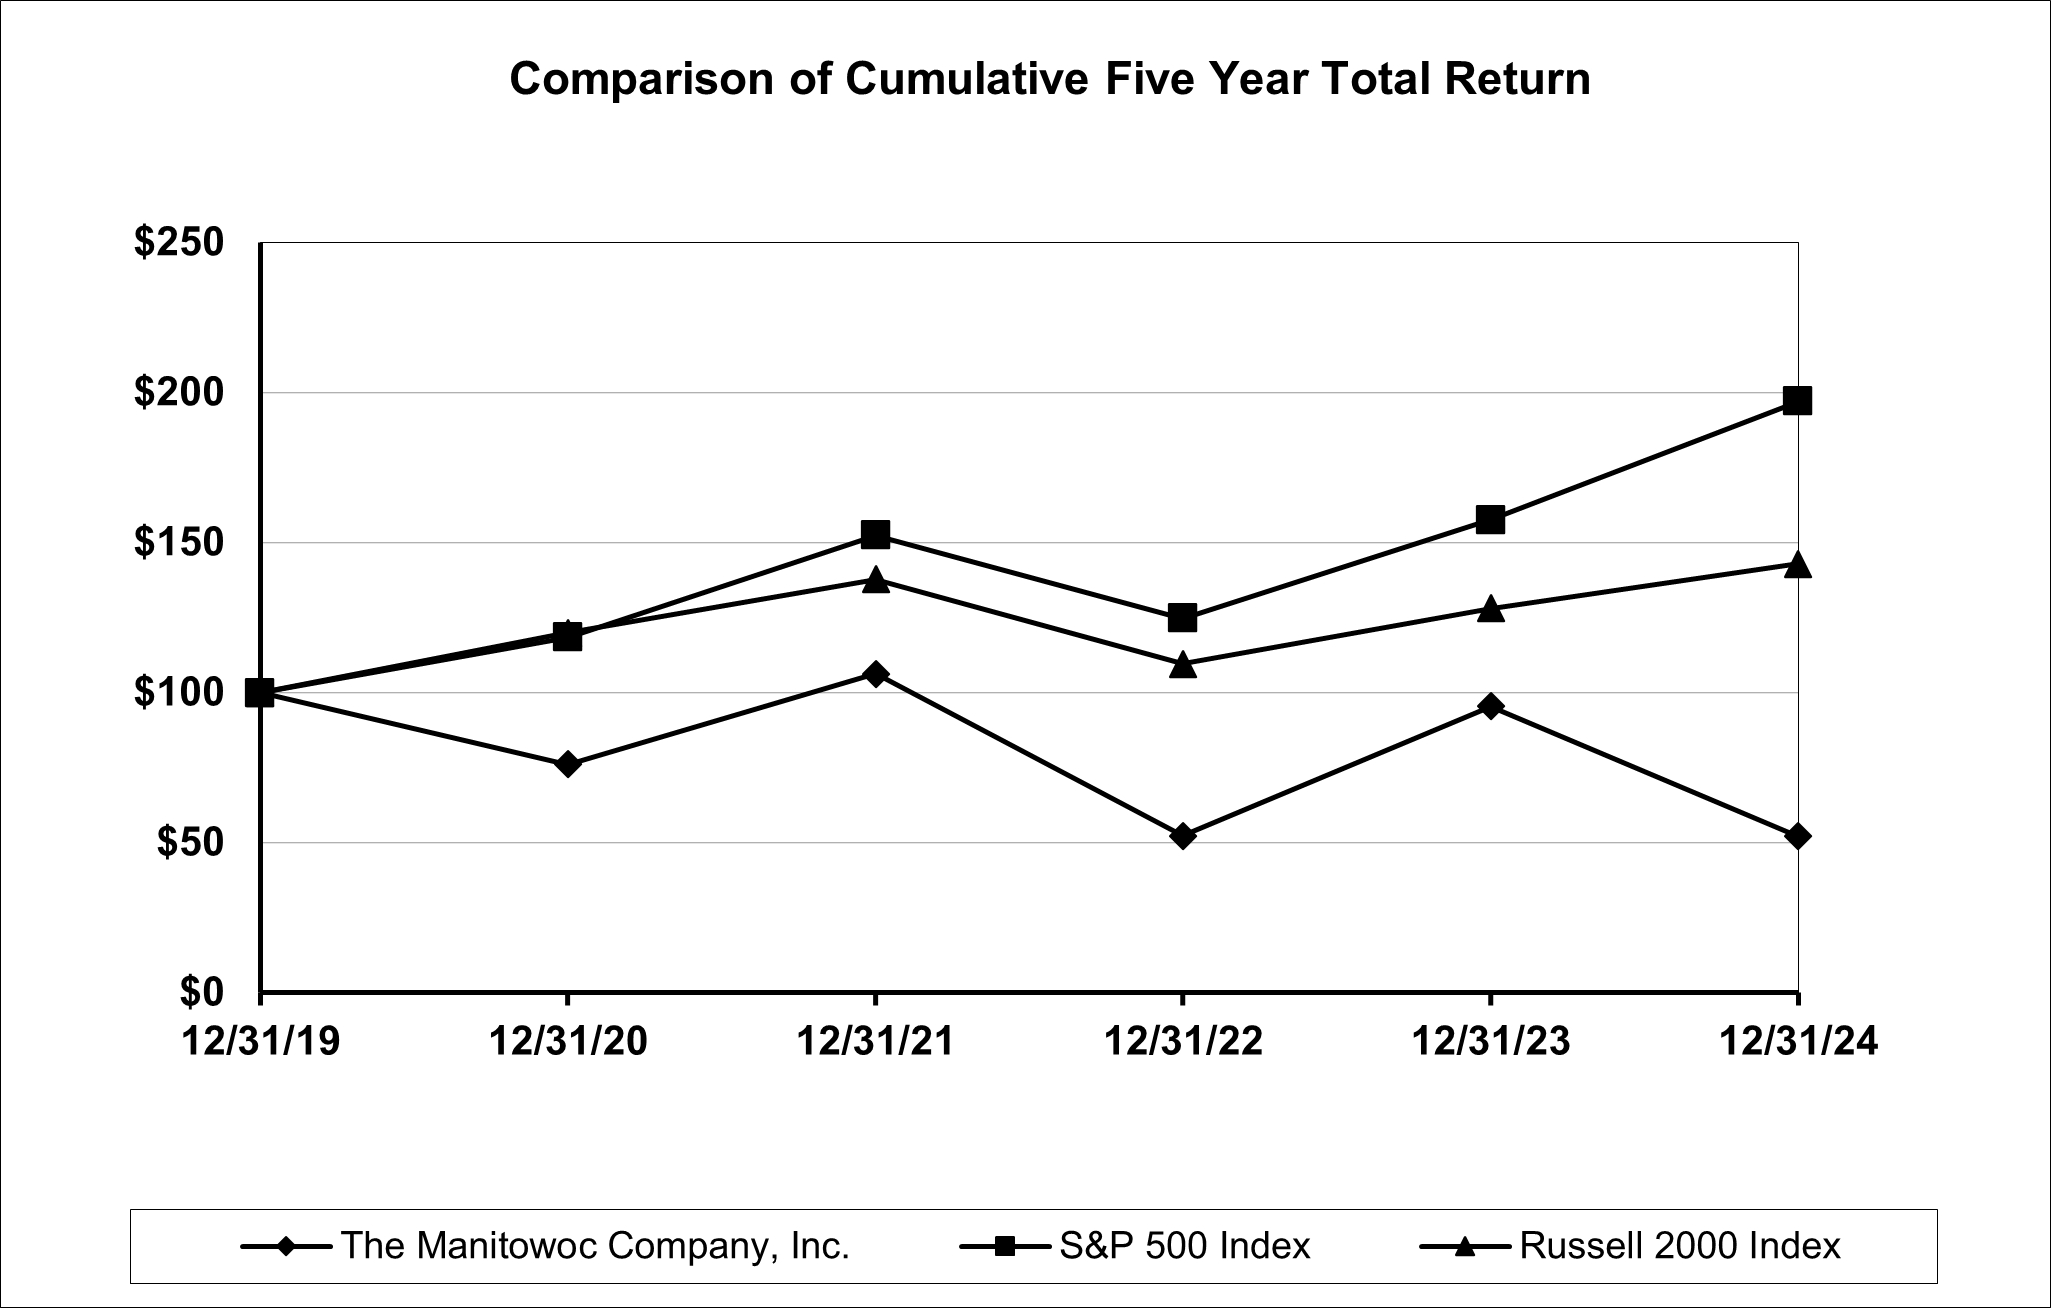
Total Return to Shareholders
(Includes reinvestment of dividends)
| | | | | | | | | | | | | | | | | | | | |
| | Annual Return Percentages | |
| | Years Ending December 31, | |
| | 2020 | | | 2021 | | | 2022 | | | 2023 | | | 2024 | |
The Manitowoc Company, Inc. | | | (23.94 | )% | | | 39.67 | % | | | (50.73 | )% | | | 82.21 | % | | | (45.30 | )% |
S&P 500 Index | | | 18.40 | % | | | 28.71 | % | | | (18.11 | )% | | | 26.29 | % | | | 25.02 | % |
Russell 2000 Index | | | 19.96 | % | | | 14.82 | % | | | (20.44 | )% | | | 16.93 | % | | | 11.54 | % |
| | | | | | | | | | | | | | | | | | | | | | | | |
| | Indexed Returns | |
| | Years Ending December 31, | |
| | 2019 | | | 2020 | | | 2021 | | | 2022 | | | 2023 | | | 2024 | |
The Manitowoc Company, Inc. | | | 100.00 | | | | 76.06 | | | | 106.23 | | | | 52.34 | | | | 95.37 | | | | 52.17 | |
S&P 500 Index | | | 100.00 | | | | 118.40 | | | | 152.39 | | | | 124.79 | | | | 157.59 | | | | 197.02 | |
Russell 2000 Index | | | 100.00 | | | | 119.96 | | | | 137.74 | | | | 109.59 | | | | 128.14 | | | | 142.93 | |
Item 6. RESERVED
Item 7. MANAGEMENT’S DISCUSSION AND ANALYSIS OF FINANCIAL CONDITION AND RESULTS OF OPERATIONS
The following discussion and analysis should be read in conjunction with the consolidated financial statements and accompanying notes appearing in Part II, Item 8 of this Annual Report on Form 10-K.
Overview: The Manitowoc Company, Inc. (“Manitowoc” or the “Company”) is a leading provider of engineered lifting solutions headquartered in Milwaukee, Wisconsin, United States. Through its wholly owned subsidiaries, Manitowoc designs, manufacturers, markets, distributes and supports comprehensive product lines of mobile hydraulic cranes, lattice-boom crawler cranes, boom trucks, and tower cranes.
All dollar amounts are in millions throughout the tables included in Management’s Discussion and Analysis of Financial Condition and Results of Operations unless otherwise indicated.
Orders and Backlog
Orders and backlog are not measures defined by accounting principles generally accepted in the United States of America ("GAAP") and our methodology for determining orders and backlog may vary from the methodology used by other companies. Management uses orders and backlog for capacity and resource planning. The Company believes this information is useful to investors to provide an indication of future revenues. Backlog represents the dollar value of orders which are expected to be recognized in net sales in the future. Orders are included in backlog when an executed binding contract with a price that has a floor has been received but has not been recognized in net sales.
Orders for the year ended December 31, 2024 decreased 7.7% to $1,922.8 million from $2,082.3 million for the same period in 2023. The decrease in orders was primarily due to lower demand in the Americas segment as a result of uncertainty related to the U.S. presidential election and the high-interest rate environment, and lower demand in MEAP as a result of slowdowns in China and South Korea.
The Company’s backlog as of December 31, 2024 was $650.2 million, a 29.1% decrease from the December 31, 2023 backlog of $917.2 million. The decrease in backlog from December 31, 2023 was primarily attributable to the lower orders as discussed above. Backlog was unfavorably impacted by $12.9 million from changes in foreign currency exchange rates.
Results of Operations
A detailed discussion of the year-over-year changes for the years ended December 31, 2023 and 2022 can be found in the Management's Discussion and Analysis section of the Company's 2023 Annual Report on Form 10-K filed on February 23, 2024, and is available on the SEC's website at www.sec.gov as well as in the "Investors" section of our website at www.manitowoc.com.
Results of Operations for the Years Ended December 31, 2024 and 2023
| | | | | | | | | | | | | |
| | 2024 | | | 2023 | | | Change | | |
Net sales | | | 2,178.0 | | | | 2,227.8 | | | | (2.2 | )% | |
Gross profit | | | 375.0 | | | | 425.2 | | | | (11.8 | )% | |
Gross profit % | | | 17.2 | % | | | 19.1 | % | | | | |
Engineering, selling, and administrative
expenses | | | 315.7 | | | | 328.3 | | | | (3.8 | )% | |
Interest expense | | | 38.3 | | | | 33.9 | | | | 13.0 | % | |
Other expense - net | | | (0.4 | ) | | | (13.0 | ) | | | (96.9 | )% | |
Provision (benefit) for income taxes | | | (44.1 | ) | | | 5.0 | | | * | | |
*Measure not meaningful | | | | | | | | | | |
Net Sales
Consolidated net sales for the year ended December 31, 2024 decreased 2.2% to $2,178.0 million from $2,227.8 million for the year ended December 31, 2023. The decrease was primarily attributable to lower new crane shipments in the EURAF and MEAP segments. This was partially offset by $16.5 million of higher non-new machine sales primarily due to higher used crane shipments. Net sales were unfavorably impacted by $2.7 million from changes in foreign currency exchange rates.
Gross Profit
Gross profit for the year ended December 31, 2024 decreased 11.8% to $375.0 million compared to $425.2 million for the year ended December 31, 2023. The decrease was primarily attributable to the lower net sales, unfavorable product mix, and under absorption of fixed costs due to lower manufacturing volume of tower cranes in the EURAF segment.
Engineering, Selling, and Administrative Expenses
Engineering, selling, and administrative expenses for the year ended December 31, 2024 decreased 3.8% to $315.7 million compared to $328.3 million for the year ended December 31, 2023. The decrease is primarily due to $12.3 million of lower costs associated with a legal matter with the U.S. Environmental Protection Agency (“U.S. EPA”) and $3.1 million of lower employee-related costs when compared to the prior year. This was partially offset by $2.8 million of higher marketing costs from the Company’s Crane Days event in the U.S. and the China bauma trade show and $5.8 million of higher research and development costs related to new product development.
Interest Expense
Interest expense for the year ended December 31, 2024 increased 13% to $38.3 million compared to $33.9 million for the year ended December 31, 2023. The increase was primarily due to higher average debt and higher interest rates on borrowings from the Company's ABL revolving credit facility when compared to the prior year. See further detail at Note 10, “Debt,” to the Consolidated Financial Statements.
Other Expense – Net
Other expense – net for the year ended December 31, 2024 was $0.4 million and was primarily composed of $2.9 million of pension benefit and postretirement health costs and $1.1 million of non-cash losses associated with the refinancing of the Company’s former senior secured second lien notes. This was partially offset by $2.6 million of net foreign currency transaction gains and $0.7 million of interest income.
Other expense - net for the year ended December 31, 2023 was $13.0 million and was primarily composed of a $9.3 million non-cash write-off of foreign currency translation adjustments related to the curtailment of operations in Russia and $6.0 million of pension benefit and postretirement health costs. This was partially offset by $3.3 million of net foreign currency transaction gains.
Provision (benefit) for Income Taxes
During the year ended December 31, 2024 and 2023 the Company recorded a benefit for income taxes of $44.1 million and a provision for income taxes of $5.0 million, respectively.
The 2024 effective tax rate was favorably impacted by a $57.5 million net reduction of the valuation allowance. The rate was unfavorably impacted by $5.6 million of additional unrecognized tax benefit reserves recorded during the year and non-deductible expenses related to a legal matter.
The 2023 effective tax rate was favorably impacted by the release of a $19.0 million valuation allowance and a $3.2 million tax benefit for the favorable resolution of a previously reserved foreign income tax matter. The rate was unfavorably impacted primarily by non-deductible expenses related to a legal matter, additional valuation allowances recorded during the year and the jurisdictional mix of the financial results.
Due to the Company’s historic losses, impacts from United States tax reform and full valuation allowances in certain jurisdictions, the effective annual tax rate is not a meaningful measure of the Company’s cash tax position or performance of the business. It is reasonably possible that sufficient positive evidence may result in a requirement to release a portion of certain valuation allowances within the next twelve months. Such changes in the realizability of deferred tax assets will be reflected in continuing operations and could have a material effect on the Company’s financial position and results of operations.
Refer to Note 12, “Income Taxes,” to the Consolidated Financial Statements.
Segment Operating Performance
The Company has three reportable segments, the Americas segment, the Europe and Africa (“EURAF”) segment and the Middle East and Asia Pacific (“MEAP”) segment. The segments were identified using the “management approach,” which designates the internal organization that is used by the CEO, who is also the Company’s Chief Operating Decision Maker (“CODM”), for making decisions about the allocation of resources and assessing performance. Further information regarding the Company’s reportable segments can be found in Note 16, “Segments,” to the Consolidated Financial Statements included in Part II, Item 8 of this Annual Report on Form 10-K.
| | | | | | | | | | | | |
| | Year ended December 31, 2024 | | | Year ended December 31, 2023 | | | Change | |
Net Sales | | | | | | | | | |
Americas | | $ | 1,197.6 | | | $ | 1,211.2 | | | | (1.1 | )% |
EURAF | | | 616.0 | | | | 669.6 | | | | (8.0 | )% |
MEAP | | | 364.4 | | | | 347.0 | | | | 5.0 | % |
| | | | | | | | | |
Segment Operating
Income (Loss) | | | | | | | | | |
Americas | | $ | 103.7 | | | $ | 111.7 | | | | (7.2 | )% |
EURAF | | | (46.6 | ) | | | (7.9 | ) | | * | |
MEAP | | | 39.4 | | | | 52.3 | | | | (24.7 | )% |
*Measure not meaningful | | | | | | | | | |
Americas
Americas segment net sales decreased 1.1% in 2024 to $1,197.6 million from $1,211.2 million in 2023. The decrease was primarily attributable to product mix.
Americas segment operating income of $103.7 million decreased $8.0 million in 2024 from $111.7 million in 2023. The decrease was primarily attributable to the lower sales, unfavorable product mix, and $4.8 million of higher engineering, selling, and administrative expenses.
EURAF
EURAF segment net sales decreased 8.0% in 2024 to $616.0 million from $669.6 million in 2023. The decrease was primarily attributable to a lower number of new crane shipments, partially offset by $8.6 million of higher non-new machine sales, as a result of higher used crane shipments.
EURAF segment operating loss of $46.6 million increased $38.7 million in 2024 from $7.9 million in 2023. The increase in operating loss was primarily attributable to the lower net sales and under absorption of fixed costs due to lower manufacturing volume of tower cranes.
MEAP
MEAP segment net sales increased 5.0% in 2024 to $364.4 million from $347.0 million in 2023. The increase was primarily attributable to $9.3 million of higher non-new machine sales as a result of higher used crane shipments and $8.1 million of higher new machine sales as a result of favorable product mix. This was partially offset by lower realized pricing. MEAP net sales were unfavorably impacted by $2.7 million from changes in foreign currency exchange rates.
MEAP segment operating income of $39.4 million decreased $12.9 million from $52.3 million in 2023. The decrease was primarily attributable to the lower realized price and unfavorable product mix.
Financial Condition
Cash Flows
The table below shows a summary of cash flows for the years ended December 31, 2024 and 2023:
| | | | | | | | | |
| | Year Ended December 31, |
| | 2024 | | | 2023 | | |
Net cash provided by operating activities | | $ | 49.2 | | | $ | 63.0 | | |
Net cash used for investing activities | | | (40.4 | ) | | | (71.8 | ) | |
Net cash provided by (used for) financing activities | | | 6.7 | | | | (21.4 | ) | |
Cash and cash equivalents | | | 48.0 | | | | 34.4 | | |
Cash Flows from Operating Activities
Net cash provided by operating activities of $49.2 million in 2024 decreased $13.8 million from $63.0 million in 2023. The decrease in net cash provided by operating activities was primarily due to $38.6 million of lower net income adjusted for non-cash items, partially offset by $24.8 million of lower cash use from changes in operating assets and liabilities. The lower cash use was primarily due to $68.1 million of additional cash provided by inventory, $18.3 million of additional cash provided by accounts receivable, $12.5 million of additional cash provided by other assets, partially offset by $74.1 million of higher cash used for accounts payable, accrued expenses, and other liabilities when compared to the prior year.
Cash Flows from Investing Activities
Net cash used for investing activities of $40.4 million in 2024 decreased $31.4 million from $71.8 million in 2023. The decrease in net cash used for investing activities was primarily due to $31.7 million of lower capital expenditures.
Cash Flows from Financing Activities
Net cash provided by financing activities of $6.7 million in 2024 increased $28.1 million from net cash used for financing activities of $21.4 million in 2023. The increase in net cash provided by financing activities was primarily due to $40.7 million of additional proceeds from the revolving credit facility and a $2.8 million increase of proceeds from other debt – net when compared to the prior year. This was partially offset by $7.5 million of payments for other financing activities and $7.4 million of payments for debt issuance costs related to the refinancing of the ABL Revolving Credit Facility and former senior secured second lien notes due April 1, 2026.
Liquidity and Capital Resources
Liquidity
The Company’s liquidity position as of December 31, 2024 and 2023 is summarized as follows:
| | | | | | | | |
| | 2024 | | | 2023 | |
Cash and cash equivalents | | $ | 48.0 | | | $ | 34.4 | |
Revolver borrowing capacity | | | 325.0 | | | | 275.0 | |
Other debt availability | | | 42.4 | | | | 45.2 | |
Less: Borrowings on revolver | | | (79.0 | ) | | | (60.0 | ) |
Less: Borrowings on other debt | | | (12.1 | ) | | | (11.2 | ) |
Less: Outstanding letters of credit | | | (3.4 | ) | | | (3.4 | ) |
Total liquidity | | $ | 320.9 | | | $ | 280.0 | |
The Company’s revolving credit facility, or other future facilities, may be used for working capital requirements, capital expenditures, funding future acquisitions (within the Company’s debt limitations), and other operating, investing and financing needs. The Company believes its liquidity and expected cash flows from operations are sufficient to meet expected working capital, capital expenditures, contractual obligations and other ongoing operational needs in the subsequent twelve months.
Cash Sources
The Company has historically relied primarily on cash flows from operations, borrowings under revolving credit facilities, issuances of notes and other forms of debt financing as its sources of cash.
The maximum availability under the Company’s current ABL Revolving Credit Facility is $325.0 million, of which $100.0 million is available to our German subsidiary. The borrowing capacity under the ABL Revolving Credit Facility is based on the value of inventory, accounts receivable, and certain fixed assets of the Loan Parties. The Loan Parties’ obligations under the ABL Revolving Credit Facility are secured on a first-priority basis, subject to certain exceptions and permitted liens, by substantially all of the personal property and fee-owned real property of the Loan Parties. The liens securing the ABL Revolving Credit Facility are senior in priority to the second-priority liens securing the obligations under the 2031 Notes and the related guarantees. The ABL Revolving Credit Facility has a maturity date of September 18, 2029, and includes a $75.0 million letter of credit sub-facility, $10.0 million of which is available to the Company's German subsidiary that is a borrower under this facility.
In addition to the ABL Revolving Credit Facility, the Company has access to committed and non-committed lines of credit to fund working capital in Europe and China. There are six facilities, of which five facilities are denominated in Euros totaling €37.0 million and one facility denominated in Chinese Yuan totaling ¥30.0 million. Total U.S. dollar availability as of December 31, 2024 for the six overdraft facilities is $42.4 million, with $12.1 million outstanding.
Debt
Outstanding debt as of December 31, 2024 and 2023 is summarized as follows:
| | | | | | | | |
| | 2024 | | | 2023 | |
Borrowing under senior secured asset based revolving
credit facility | | $ | 79.0 | | | $ | 60.0 | |
Senior secured second lien notes due 2026 | | | — | | | | 300.0 | |
Senior secured second lien notes due 2031 | | | 300.0 | | | | — | |
Other debt | | | 16.4 | | | | 13.7 | |
Deferred financing costs | | | (5.2 | ) | | | (1.6 | ) |
Total debt | | | 390.2 | | | | 372.1 | |
Short-term borrowings and current portion of
long-term debt | | | (13.1 | ) | | | (13.4 | ) |
Long-term debt | | $ | 377.1 | | | $ | 358.7 | |
Both the ABL Revolving Credit Facility and 2031 Notes include customary covenants and events of default. Refer to Note 10, “Debt,” to the Consolidated Financial Statements for additional discussions of covenants for the ABL Revolving Credit Facility and 2031 Notes. As of December 31, 2024, the Company was in compliance with all affirmative and negative covenants in its debt instruments, inclusive of the financial covenants pertaining to the ABL Revolving Credit Facility and 2031 Notes. Based upon management’s current plans and outlook, the Company believes it will be able to comply with these covenants during the subsequent twelve months. From time to time, the Company may seek to opportunistically raise capital in the debt capital markets and bank credit markets.
Other Financing Arrangements
The Company has two non-U.S. accounts receivable financing programs with no maximum availability. Transactions under the non-U.S. programs were accounted for as sales in accordance with Accounting Standards Codification (“ASC”) 860, “Transfers and Servicing.” Under these financing programs, the Company has the ability to sell eligible receivables up to the customer's maximum limit. Refer to Note 11, “Accounts Receivable Factoring,” to the Consolidated Financial Statements.
Off-Balance Sheet Arrangements
As of December 31, 2024, the Company had buyback commitments outstanding of $29.9 million. This amount is not reduced for amounts the Company would recover from the repossession and subsequent resale of collateral. Refer to Note 18, “Guarantees,” to the Consolidated Financial Statements for further information.
Contractual Obligations and Commercial Commitments
The Company's material cash requirements, contractual obligations and commercial commitments include the following:
Debt
As of December 31, 2024, the Company had outstanding debt of $390.2 million with $13.1 million payable within one year. The Company is committed to pay 9.25% of annual interest on the $300.0 million 2031 Notes that mature on October 1, 2031. Additionally, the Company's debt outstanding under the ABL Revolving Credit Facility is subject to variable interest using either the Alternate Base Rate or Term Benchmark, Applicable Overnight Rate, Central Bank Rate ("CBR") or RFR rate (each as defined in the ABL Credit Agreement) plus the applicable spread. For the year ended December 31, 2024 the Company incurred $7.8 million and $3.3 million of interest on borrowings from the ABL Revolving Credit Facility and other debts, respectively. Refer to Note 10, “Debt,” to the Consolidated Financial Statements for further information.
Purchase Obligations
As of December 31, 2024, the Company has purchase obligations of $890.4 million with $601.9 million due within one year. Purchase obligations consist primarily of open purchase orders for raw materials and various components used in the manufacturing process and purchase obligations from agreements with various suppliers that include a right of cancellation.
Leases
As of December 31, 2024, the Company had contractual fixed costs related to operating lease commitments of $72.5 million with $15.8 million due within one year. Refer to Note 20, “Leases,” to the Consolidated Financial Statements for further information.
Capital Expenditures
The Company funds capital expenditures that are intended to improve the cost structure of the Company’s business; invest in new processes, products and technology; maintain high-quality production standards; and maintain and expand the Company's rental fleet.
The Company paid a total of $45.7 million during 2024 for capital expenditures. For the year ended December 31, 2024, depreciation was $60.0 million. The Company anticipates that capital expenditures for 2025 will be approximately $47.0 million, of which approximately $23.0 million is for rental fleet assets.
Other Cash Requirements
The Company has unrecognized tax benefits totaling $13.9 million as of December 31, 2024, excluding related interest and penalties. It is reasonably possible that the unrecognized tax benefits could significantly change over the next 12 months. However, due to the highly uncertain nature of resolution and closure on audits, we are unable to estimate the range of impact at this time. Refer to Note 12, “Income Taxes,” to the Consolidated Financial Statements for disclosures surrounding uncertain income tax positions under ASC Topic 740 “Income Taxes.”
The Company maintains defined benefit pension plans for some of the Company’s employees and retirees. The Board of Directors has established the Retirement Plan Committee to manage the operations and administration of all benefit plans and related trusts. Refer to Note 19, “Employee Benefit Plans,” to the Consolidated Financial Statements.
In 2024, cash contributions by the Company to defined benefit pension, postretirement medical, and other defined benefit plans were $9.1 million, and the Company estimates that its contributions in 2025 will be approximately $5.2 million. Cash contributions to the Company’s 401(k) plan were $9.0 million in 2024. Cash contributions to the 401(k) plan earned in 2024 and expected to be paid in 2025 are $3.3 million.
The Company maintains a non-qualified supplemental deferred compensation plan for highly compensated and key management employees and for non-employee directors of the Company. The Company contributes a matching contribution
for eligible wages above IRS employee compensation limits for 401(k) retirement plans and/or an additional contribution from the Company for each individual participant, which may or may not be made, at the full discretion of the Company based on its performance. In 2024, cash contributions by the Company to the non-qualified supplemental deferred compensation plan were $0.2 million. Cash contributions to the non-qualified supplemental deferred compensation plan earned in 2024 and expected to be paid in 2025 are $0.4 million.
Non-GAAP Measures
The Company uses EBITDA, adjusted EBITDA, adjusted operating income, Adjusted ROIC and free cash flows, which are financial measures that are not prepared in accordance with GAAP, as additional metrics to evaluate the Company’s performance. The Company believes these non-GAAP measures provide important supplemental information to readers regarding business trends that can be used in evaluating its results because these financial measures provide a consistent method of comparing financial performance and are commonly used by investors to assess performance. These non-GAAP financial measures should be considered together with, and are not substitutes for, the GAAP financial information provided herein.
Adjusted ROIC
Adjusted ROIC measures how efficiently the Company uses invested capital in its operations. Adjusted ROIC is not a measure defined by GAAP and the Company’s methodology for determining Adjusted ROIC may vary from the methodology used by other companies. Management and the Board use Adjusted ROIC as a measure to assess operational performance and capital allocation. The Company believes this information is useful to investors as it provides a measure of value creation as a percentage of capital invested.
Adjusted ROIC is determined by dividing adjusted net operating profit after tax (“Adjusted NOPAT”) for the year ended December 31, 2024 by the five-quarter average of invested capital. Adjusted NOPAT is calculated by taking operating income plus the addback of amortization of intangible assets and the addback or subtraction of restructuring expenses, other non-recurring items - net, and provision for income taxes, which is determined using a 15% tax rate. Invested capital is defined as net total assets less cash and cash equivalents and income tax assets - net plus short-term and long-term debt. Income taxes are defined as income tax payables/receivables, net deferred tax assets/liabilities, and uncertain tax positions.
The Company’s Adjusted ROIC for the year ended December 31, 2024 was 6.0%. Below is the calculation of Adjusted ROIC for the year ended December 31, 2024.
| | | |
| | |
| Year Ended December 31, 2024 | |
Operating income | $ | 51.8 | |
Amortization of intangible assets | | 2.9 | |
Restructuring expense | | 4.6 | |
Other non-recurring items - net1 | | 9.1 | |
Adjusted operating income | | 68.4 | |
Provision for income taxes | | (10.3 | ) |
Adjusted NOPAT | $ | 58.1 | |
| | |
| 5-Quarter Average | |
Total assets | $ | 1,734.4 | |
Total liabilities | | (1,126.5 | ) |
Net total assets | | 607.9 | |
Cash and cash equivalents | | (35.0 | ) |
Short-term borrowings and current portion of long-term debt | | 26.2 | |
Long-term debt | | 388.3 | |
Income tax assets - net | | (17.5 | ) |
Invested capital | $ | 969.9 | |
| | |
Adjusted ROIC | | 6.0 | % |
(1)Other non-recurring items - net for the year ended December 31, 2024 relate to $8.9 million of costs associated with a legal matter with the U.S. EPA and $0.2 million of one-time costs.
EBITDA and Adjusted EBITDA
The Company defines EBITDA as net income (loss) before interest, taxes, depreciation, and amortization. The Company defines adjusted EBITDA as EBITDA plus the addback or subtraction of restructuring expense, other income (expense) – net, and certain other non-recurring items.
The reconciliation of net income (loss) to EBITDA, and further to adjusted EBITDA for the years ended December 31, 2024 and 2023 is summarized as follows:
| | | | | | | | | |
| | Year Ended December 31, |
| | 2024 | | | 2023 | | |
Net income | | $ | 55.8 | | | $ | 39.2 | | |
Interest expense and amortization of deferred
financing fees | | | 39.7 | | | | 35.2 | | |
Provision (benefit) for income taxes | | | (44.1 | ) | | | 5.0 | | |
Depreciation expense | | | 60.0 | | | | 56.6 | | |
Amortization of intangible assets | | | 2.9 | | | | 3.2 | | |
EBITDA | | | 114.3 | | | | 139.2 | | |
Restructuring expense | | | 4.6 | | | | 1.3 | | |
Other non-recurring items - net (1) | | | 9.1 | | | | 21.8 | | |
Other expense - net (2) | | | 0.4 | | | | 13.0 | | |
Adjusted EBITDA | | $ | 128.4 | | | $ | 175.3 | | |
(1)Other non-recurring items - net for the year ended December 31, 2024 relate to $8.9 million of costs associated with a legal matter with the U.S. EPA and $0.2 million of one-time costs. Other non-recurring items - net for the year ended December 31, 2023 relate to $21.2 million of costs associated with a legal matter with the U.S. EPA and $0.6 million of one-time costs
(2)Other expense - net includes net foreign currency gains (losses), other components of net periodic pension costs, and other items in the years ended December 31, 2024 and 2023. Other expense – net for the year ended December 31, 2023 includes a $9.3 million write-off of non-cash foreign currency translation adjustments from the curtailment of operations in Russia.
Free Cash Flows
Free cash flows is defined as net cash provided by operating activities less capital expenditures. The reconciliation of net cash provided by operating activities to free cash flows for the years ended December 31, 2024 and 2023 is summarized as follows:
| | | | | | | | | |
| | Year Ended December 31, |
| | 2024 | | | 2023 | | |
Net cash provided by operating activities | | $ | 49.2 | | | $ | 63.0 | | |
Capital expenditures | | | (45.7 | ) | | | (77.4 | ) | |
Free cash flows | | $ | 3.5 | | | $ | (14.4 | ) | |
Financial Risk Management
The Company is exposed to market risks from changes in interest rates, commodities, and foreign currency exchange rates. To reduce these risks, the Company selectively makes use of derivative financial instruments and other proactive management techniques. The Company has written policies and procedures that place financial instruments under the direction of corporate finance and restrict all derivative transactions to those intended for hedging purposes. The use of financial instruments for trading purposes or speculation is strictly prohibited.
For a more detailed discussion of the Company's accounting policies and the financial instruments that we use, refer to Note 2, “Summary of Significant Accounting Policies,” Note 4, “Fair Value of Financial Instruments,” and Note 10, “Debt,” to the Consolidated Financial Statements.
Interest Rate Risk
The Company's long-term debt primarily consists of $300.0 million on the 2031 Notes and borrowings under its ABL Revolving Credit Facility. Borrowings under the ABL Revolving Credit Facility are subject to variable interest using either the Alternate Base Rate or Term Benchmark, Applicable Overnight Rate, CBR or RFR rate (each as defined in the ABL Credit Agreement) plus the applicable spread. The variable interest rate is based upon the average availability as of the most recent determination date. As of December 31, 2024, the Company had borrowings on the ABL Revolving Credit Facility of $79.0 million. At any time, the Company could be party to various interest rate swaps in connection with its fixed or floating rate debt. No interest rate swaps were entered into or outstanding during 2024 or 2023. A hypothetical 100 basis point increase/decrease in the average interest rate of the Company's annual average borrowings under its ABL Revolving Credit Facility would have resulted in a $1.2 million increase/decrease to interest expense for the year ended December 31, 2024.
Commodity Prices
The Company is exposed to fluctuating market prices for commodities, including steel, copper, aluminum, and petroleum-based products. From time to time the Company may use commodity financial instruments to hedge commodity prices. No commodity financial instruments were entered into or outstanding during 2024 and 2023. For more information on commodities risk, see Part I, Item 1A. – “Risk Factors.”
Currency Risk
The Company has manufacturing, sales, and distribution facilities around the world, and therefore, makes investments and enters into transactions denominated in various currencies, which introduces transactional currency exchange risk.
To mitigate transactional currency exchange risk, the Company, from time-to-time, enters into foreign exchange contracts to 1) reduce the earnings and cash flows impact on non-functional currency denominated receivables and payables and 2) reduce the impact of changes in foreign currency rates between a budgeted rate and the rate realized at the time it recognizes a particular purchase or sale transaction. Gains and losses resulting from hedging instruments either impact the Company’s Consolidated Statements of Operations in the period of the underlying purchase or sale transaction, or offset the foreign exchange gains and losses on the underlying receivables and payables being hedged. The maturities of these foreign exchange contracts coincide with the expected underlying settlement date of the related cash inflow or outflow. The hedges of anticipated transactions are designated as cash flow hedges as required under ASC Topic 815 “Derivatives and Hedging.” As of December 31, 2024, the Company was party to foreign currency forward contracts with a notional value of $129.7 million all of which are carried on the Company’s balance sheet at fair value. As of December 31, 2024, a hypothetical 10% increase or decrease in the exchange rate in the Company’s portfolio of foreign currency contracts would result in a $11.5 million unrealized gain and a $5.6 million unrealized loss, respectively. Consistent with the use of these contracts to neutralize the effect of exchange rate fluctuations, such unrealized losses or gains would be offset by corresponding gains or losses, respectively, in the remeasurement of the underlying transactions being hedged.
Amounts invested in non-U.S. based subsidiaries are translated into U.S. dollars at the exchange rate in effect at year-end. Results of operations are translated into U.S. dollars at an average exchange rate for the period. The resulting translation adjustments are recorded in stockholders’ equity as other comprehensive income (loss). The cumulative translation adjustment recorded in other comprehensive income (loss) for the year ended December 31, 2024 was a loss of $20.8 million.
Environmental, Health, Safety, Contingencies and Other Matters
Refer to Part II, Item 8, Note 17, “Commitments and Contingencies,” where the Company has disclosed environmental, health, safety, contingencies and other matters.
Critical Accounting Policies and Estimates
The Consolidated Financial Statements include the accounts of the Company and all its subsidiaries. The preparation of financial statements in conformity with GAAP requires the Company to make estimates and assumptions in certain circumstances that affect amounts reported in the accompanying Consolidated Financial Statements and related footnotes. In preparing these Consolidated Financial Statements, the Company has made its best estimates and judgments of certain amounts included in the Consolidated Financial Statements giving due consideration to materiality. However, application of these accounting policies involves the exercise of judgment and use of assumptions as to future uncertainties and, as a result, actual results could differ from these estimates. Although the Company has listed a number of accounting policies and estimates below which the Company believes to be most critical, the Company also believes that all of the Company’s accounting policies are important to the reader. Refer to Part II, Item 8, Note 2, “Summary of Significant Accounting Policies,” for a detailed description of these and other accounting policies of the Company.
Revenue Recognition – The Company records revenue in accordance with ASC Topic 606 – “Revenue from Contracts with Customers.” Below are the Company's revenue recognition policies by performance obligation.
Crane sales are primarily generated through the sale of new and used cranes. Contracts with customers are generally in the form of a purchase order. Based on the nature of the Company’s contracts, the Company does not have any significant financing terms. Contracts may have variable consideration in the form of early pay discounts or rebates. Revenue is recognized under these contracts when control of the product is transferred to the customer. Control transfers to the customer generally upon delivery to the carrier or acceptance through an independent inspection company that acts as an agent of the customer.
From time to time, the Company enters into agreements where the customer has the right to exercise a put option requiring the Company to buy back a crane at an agreed upon price. The Company evaluates each agreement at inception to determine if the customer has a significant economic incentive to exercise that right. If it is determined that the customer has a significant economic incentive to exercise that right, the agreement is accounted for as a lease in accordance with ASC Topic 842 – “Leases.” If it is determined that the customer does not have a significant economic incentive to exercise that right, then revenue is recognized when control of the asset is transferred to the customer.
Given the nature of the Company’s products, the customer may request that the product be held until a delivery location is identified. Under these “bill and hold” arrangements, sales are recognized when all of the following criteria are met: 1) the reason for the bill-and-hold arrangement is substantive, 2) the product is separately identified as belonging to the customer, 3) the product is ready for transfer to the customer and 4) the Company does not have the ability to use the product or direct it to another customer.
Crane attachment sales are generated through the sale of new or used crane attachments such as luffing jibs, ecomats and counterweights. Crane attachment sales are recognized when control of the product is transferred to the customer. Control transfers to the customer generally upon delivery to the carrier.
Aftermarket part sales are generated through the sale of new and used parts to end customers and distributors. Aftermarket part sales are recognized when control of the product is transferred to the customer. Control transfers to the customer generally upon delivery to the carrier. Customers generally have a right of return which the Company estimates using historical information. The amount of estimated returns is deducted from net sales.
The Company’s other sales consist primarily of sales from:
•Repair and field service work;
As it relates to the Company’s other sales, the Company’s performance obligations generally relate to performing specific agreed upon services. Depending on the nature of the contract, sales are recognized based on completion of those services or over the service period based on a measure of progress.
Inventories and Related Reserve for Obsolete and Excess Inventory – Inventories are valued at the lower of cost or net realizable value. Finished goods and work-in-process inventories include material, labor and manufacturing overhead costs. Inventories are reduced by a reserve for excess and obsolete inventories. The estimated reserve is based upon specific identification of excess or obsolete inventories based on historical usage and estimated future usage.
Goodwill, Intangible Assets and Other Long-Lived Assets – The Company accounts for goodwill and intangible assets under the guidance of ASC Topic 350-10, “Intangibles – Goodwill and Other.” Under ASC Topic 350-10, goodwill is not amortized;
instead, the Company performs an annual impairment test. The Company has two reporting units with goodwill: Americas – Distribution and MEAP. The date for the annual impairment test is October 31, or more frequently if events or changes in circumstances indicate that the assets might be impaired. To perform its goodwill impairment test, the Company uses a combination of the income approach and market approach with a weighting of 70/30, respectively, to determine the fair value of the MEAP reporting unit. The Company determined a 70% weighting toward the income approach was appropriate as cash flows for the reporting unit are better aligned to the cyclical nature of the crane business and its unique market dynamics. The Company determined a 30% weighting toward the market approach was appropriate as the valuation is indicative of the fair value of the Company and its reporting unit but there is a lack of comparable peer companies. The Company uses only the income approach to determine the fair value of the Americas – Distribution reporting unit due to the lack of comparable peer companies to determine fair value under the market approach. Impairment is determined based on the amount in which a reporting unit’s carrying value exceeds its fair value, not to exceed the carrying amount of goodwill at the reporting unit.
The Company has two indefinite-lived intangible assets subject to an annual impairment test: the Potain trademark, tradename, and distribution network assets (“Potain Tradename”) and the Grove trademark, tradename, and distribution network assets (“Grove Tradename”). To perform its indefinite-lived intangible assets impairment test, the Company uses a fair-value method, based on a relief of royalty valuation approach. Management’s judgments and assumptions about the amounts of those cash flows and the discount rates are inputs to the annual impairment test. Impairment is determined based on the amount in which the carrying value of the indefinite-lived intangible asset exceeds its fair value, not to exceed the carrying amount of the indefinite-lived intangible asset.
As of October 31, 2024, the Company performed its annual goodwill impairment test. The fair values of the Americas - Distribution and MEAP reporting units were 13% and 69%, respectively, in excess of their carrying values as of the date of the annual impairment test and, therefore, were not impaired as of December 31, 2024.
As of October 31, 2024 the Company performed its annual indefinite-lived intangible assets impairment test. The fair value of the Potain and Grove Tradenames were substantially in excess of their carrying values as of the date of the annual impairment test and, therefore, were not impaired as of December 31, 2024.
A considerable amount of management judgment and assumptions are required in performing the goodwill and indefinite-lived asset impairment tests as it relates to the forecast of future revenues and margins, especially considering the limited operating history of Americas – Distribution, and the discount rate, as applicable. While the Company believes the judgments and assumptions are reasonable, different assumptions could change the estimated fair value and, therefore, additional impairments could be required. Weakening industry or economic trends, disruptions to the Company's business, unexpected significant changes or planned changes in the use of the assets or in entity structure are all factors which may adversely impact the assumptions used in the valuations.
Intangible assets with definite lives continue to be amortized over their estimated useful lives. Definite-lived intangible assets are also subject to impairment testing whenever events or circumstances indicate that the carrying value of the assets may not be recoverable. The Company determined there was not a triggering event during the year ended December 31, 2024, with the exception of one asset group located in Europe. Based on the results of the recoverability test, it was determined that the undiscounted cash flows were in excess of the carrying value of the long-lived assets.
The Company also reviews long-lived assets for impairment whenever events or changes in circumstances indicate that the asset's carrying amount may not be recoverable. The Company conducts its long-lived asset impairment analyses in accordance with ASC Topic 360-10-5, “Property, Plant, and Equipment.” ASC Topic 360-10-5 requires the Company to group assets and liabilities at the lowest level for which identifiable cash flows are largely independent of the cash flows of other assets and liabilities and to evaluate the asset group against the sum of the undiscounted future cash flows.
The Company monitors events and market conditions to determine if any interim impairment tests of goodwill, other intangibles or long-lived assets are warranted. Deterioration in macroeconomic conditions, a decline in actual results as compared with the Company’s projections, or a low equity market capitalization for a prolonged period, are factors which could indicate an interim triggering event has occurred. In the event the Company determines that assets are impaired in the future, the Company would recognize a non-cash impairment charge, which could have a material adverse effect on the Company’s Consolidated Balance Sheet and Results of Operations.
Employee Benefit Plans – The Company provides a range of benefits to its employees and retired employees, including pensions and postretirement health care coverage. Plan assets and obligations are recorded annually based on the Company’s measurement date utilizing various actuarial assumptions such as discount rates, expected return on plan assets, compensation
increases, retirement and mortality rates and health care cost trend rates as of that date. The approach the Company uses to determine the annual assumptions are as follows:
•Discount Rate – The Company’s discount rate assumptions are based on the interest rate of noncallable high-quality corporate bonds, with appropriate consideration of pension plan participant demographics and benefit payment terms. The Company’s discount rate is provided by an independent third party calculated based on an appropriate mix of high-quality bonds.
•Expected Return on Plan Assets – The Company’s expected return on plan assets assumptions are based on the Company’s expectation of the long-term average rate of return on assets in the pension funds, which is reflective of the current and projected asset mix of the funds and considers the historical returns earned on the funds, net of estimated fees.
•Compensation increase – The Company’s compensation increase assumptions reflect its long-term actual experience, the near-term outlook and assumed inflation.
•Retirement and Mortality Rates – The Company’s retirement and mortality rate assumptions are based primarily on actual plan experience and mortality tables.
•Health Care Cost Trend Rates – The Company’s health care cost trend rate assumptions are developed based on historical cost data, near-term outlook and an assessment of likely long-term trends.
The following table summarizes the sensitivity of the Company's December 31, 2024 retirement obligations and 2024 retirement benefit costs to changes in the key assumptions used to determine those results:
| | | | | | | | | | | | | | | | |
Change in assumption: | | Estimated
increase
(decrease) in
2025 pension
net periodic
benefit costs | | | Estimated
increase
(decrease) in
projected
benefit
obligation
for the
year ended
December
31, 2024 | | | Estimated increase
(decrease) in
2025 other
postretirement
net periodic
benefit
costs | | | Estimated
increase
(decrease) in
other
postretirement
benefit
obligation for
the year ended
December 31,
2024 | |
0.50% increase in discount rate | | $ | (0.3 | ) | | $ | (6.8 | ) | | $ | — | | | $ | (0.1 | ) |
0.50% decrease in discount rate | | | 0.3 | | | | 7.4 | | | | — | | | | 0.1 | |
0.50% increase in long-term return on assets | | | (0.5 | ) | | N/A | | | N/A | | | N/A | |
0.50% decrease in long-term return on assets | | | 0.5 | | | N/A | | | N/A | | | N/A | |
1.0% increase in health care cost trend rates | | N/A | | | N/A | | | | — | | | | 0.1 | |
1.0% decrease in health care cost trend rates | | N/A | | | N/A | | | | — | | | | (0.1 | ) |
It is reasonably possible that the estimate for future retirement and medical costs may change in the near future due to changes in interest rates. Presently, there is no reliable means to estimate the amount of any such potential changes.
Measurements of net periodic benefit cost are based on the assumptions used for the previous year-end measurements of assets and obligations. The Company reviews its actuarial assumptions on an annual basis and makes modifications to the assumptions when appropriate. As required by GAAP, the effects of the modifications are recorded currently or amortized over future periods. The Company has developed the assumptions with the assistance of its independent actuaries and other relevant sources, and believes the assumptions used are reasonable; however, changes in these assumptions could impact the Company’s financial position, results of operations, or cash flows.
Income Taxes – The Company accounts for income taxes under the guidance of ASC Topic 740-10, “Income Taxes.” Deferred tax assets and liabilities are recognized for the future tax consequences attributable to differences between financial statement carrying amounts of existing assets and liabilities and their respective tax bases and operating loss and tax credit carryforwards. Management judgment is required in determining the provision for income taxes, deferred tax assets and liabilities, and the valuation allowance recorded against the net deferred tax assets. The Company does not currently provide for additional U.S. and foreign income taxes which would become payable upon repatriation of undistributed earnings of foreign subsidiaries.
Deferred tax assets and liabilities are measured using enacted tax rates expected to apply to taxable income in the years in which those temporary differences are expected to be recovered or settled. The Company recognizes deferred tax assets to the extent they are believed to be more likely than not to be realized by considering all available positive and negative evidence,
including future reversals of existing taxable temporary differences, projected future taxable income, tax-planning strategies, and results of recent operations.
The Company reviewed both positive and negative information, including the most recent three-year cumulative income position, and forecasted taxable earnings to determine the realizability of the deferred tax assets. As a result, the Company reduced the valuation allowances by $57.5 million related to U.S. federal and state deferred tax assets for the year ended December 31, 2024, and $19.0 million related to a foreign jurisdiction for the year ended December 31, 2023. As of December 31, 2024, valuation allowances of $73.4 million remained against deferred tax assets that are not more likely than not to be realized based on positive and negative evidence available as of this time. The realizability of deferred tax assets are continuously monitored and adjusted based on most recent available evidence. As such, valuation allowances may be established or reduced in future periods, which would decrease or increase the provision for income taxes.
The Company measures and records income tax contingency accruals under the guidance of ASC Topic 740-10. The Company recognizes liabilities for uncertain income tax positions based on a two-step process. The first step is to evaluate the tax position for recognition by determining if the weight of available evidence indicates that it is more likely than not that the position will be sustained on audit, including resolution of related appeals or litigation processes, if any. The second step requires the Company to estimate and measure the tax benefit as the largest amount that is more than 50% likely to be realized upon ultimate settlement. It is inherently difficult and subjective to estimate such amounts, as the Company must determine the probability of various possible outcomes. The Company reevaluates these uncertain tax positions on a quarterly basis or when new information becomes available to management. These reevaluations are based on factors including, but not limited to, changes in facts or circumstances, changes in tax law, successfully settled issues under audit, expirations due to statutes, and new audit activity. Such a change in recognition or measurement could result in the recognition of a tax benefit or an increase to the tax accrual.
Warranties – In the normal course of business, the Company provides its customers warranties covering workmanship, and in some cases materials, on products manufactured. Such warranties generally provide that products will be free from defects for periods ranging from 12 months to 60 months. If a product fails to comply with the Company’s warranties, it may be obligated, at its expense, to correct any defect by repairing or replacing such defective product. The Company provides for an estimate of costs that may be incurred under its warranties at the time product revenue is recognized based on historical warranty experience for the related product or estimates of projected losses due to specific warranty issues on new products. These costs primarily include labor and materials, as necessary, associated with repair or replacement. The primary factors that affect the Company’s warranty liabilities include the number of shipped units and historical and anticipated rates or warranty claims. As these factors are impacted by actual experience and future expectations, the Company assesses the adequacy of its recorded warranty liability and adjusts the amounts as necessary.
Item 7A. QUANTITATIVE AND QUALITATIVE DISCLOSURES ABOUT MARKET RISK
Refer to Liquidity and Capital Resources, and Financial Risk Management in Item 7. “Management’s Discussion and Analysis of Financial Condition and Results of Operations” for a description of the quantitative and qualitative disclosures about market risk.
Item 8. FINANCIAL STATEMENTS AND SUPPLEMENTARY DATA
Index to Consolidated Financial Statements:
| | |
Financial Statements: | | |
| | |
Report of Independent Registered Public Accounting Firm (PCAOB ID: 34) | | 41 |
| | |
| | |
Report of Independent Registered Public Accounting Firm (PCAOB ID: 238) | | 43 |
| | |
Consolidated Statements of Operations for the years ended December 31, 2024, 2023, and 2022 | | 44 |
| | |
Consolidated Statements of Comprehensive Income (Loss) for the years ended December 31, 2024, 2023, and 2022 | | 45 |
| | |
Consolidated Balance Sheets for the years ended December 31, 2024 and 2023 | | 46 |
| | |
Consolidated Statements of Cash Flows for the years ended December 31, 2024, 2023, and 2022 | | 47 |
| | |
Consolidated Statements of Equity for the years ended December 31, 2024, 2023, and 2022 | | 48 |
| | |
Notes to Consolidated Financial Statements | | 49 |
REPORT OF INDEPENDENT REGISTERED PUBLIC ACCOUNTING FIRM
To the stockholders and the Board of Directors of The Manitowoc Company, Inc.
Opinion on the Financial Statements
We have audited the accompanying consolidated balance sheets of The Manitowoc Company, Inc. and subsidiaries (the "Company") as of December 31, 2024 and 2023, the related consolidated statements of operations, comprehensive income (loss), equity, and cash flows, for each of the two years in the period ended December 31, 2024, and the related notes and the schedule listed in the Index at Item 15(a)(2) (collectively referred to as the "financial statements"). In our opinion, the financial statements present fairly, in all material respects, the financial position of the Company as of December 31, 2024 and 2023, and the results of its operations and its cash flows for each of the two years in the period ended December 31, 2024, in conformity with accounting principles generally accepted in the United States of America.
We have also audited, in accordance with the standards of the Public Company Accounting Oversight Board (United States) (PCAOB), the Company's internal control over financial reporting as of December 31, 2024, based on criteria established in Internal Control — Integrated Framework (2013) issued by the Committee of Sponsoring Organizations of the Treadway Commission and our report dated February 21, 2025, expressed an unqualified opinion on the Company's internal control over financial reporting.
Basis for Opinion
These financial statements are the responsibility of the Company's management. Our responsibility is to express an opinion on the Company's financial statements based on our audits. We are a public accounting firm registered with the PCAOB and are required to be independent with respect to the Company in accordance with the U.S. federal securities laws and the applicable rules and regulations of the Securities and Exchange Commission and the PCAOB.
We conducted our audits in accordance with the standards of the PCAOB. Those standards require that we plan and perform the audit to obtain reasonable assurance about whether the financial statements are free of material misstatement, whether due to error or fraud. Our audits included performing procedures to assess the risks of material misstatement of the financial statements, whether due to error or fraud, and performing procedures that respond to those risks. Such procedures included examining, on a test basis, evidence regarding the amounts and disclosures in the financial statements. Our audits also included evaluating the accounting principles used and significant estimates made by management, as well as evaluating the overall presentation of the financial statements. We believe that our audits provide a reasonable basis for our opinion.
Critical Audit Matter
The critical audit matter communicated below is a matter arising from the current-period audit of the financial statements that was communicated or required to be communicated to the audit committee and that (1) relates to accounts or disclosures that are material to the financial statements and (2) involved our especially challenging, subjective, or complex judgments. The communication of critical audit matters does not alter in any way our opinion on the financial statements, taken as a whole, and we are not, by communicating the critical audit matter below, providing a separate opinion on the critical audit matter or on the accounts or disclosures to which it relates.
Goodwill – Americas – Distribution Reporting Unit – Refer to Notes 2 and 8 to the financial statements
Critical Audit Matter Description
The Company’s evaluation of goodwill for impairment involves the comparison of the fair value of each reporting unit to its carrying value. The Company performed its annual goodwill impairment test on October 31, 2024. The goodwill balance was $77.8 million as of December 31, 2024, of which $14.4 million related to the Americas – Distribution reporting unit. The Company used only the income approach to determine the fair value of the Americas – Distribution reporting unit. A considerable amount of management judgment and assumptions are required in performing the goodwill impairment test as it relates to forecasts of future revenues and margins and the selection of the discount rate. The Company determined that the fair
value of the Americas - Distribution reporting unit exceeded its carrying value by 13% as of the measurement date and, therefore, no impairment was recognized.
We identified the impairment evaluation of goodwill for the Americas – Distribution reporting unit as a critical audit matter because of the inherent subjectivity involved in management’s estimates and the assumptions related to forecasts of future revenues and margins, and the selection of the discount rate. This required a high degree of auditor judgment and an increased extent of effort, including the need to involve our fair value specialists, when performing audit procedures.
How the Critical Audit Matter Was Addressed in the Audit
Our audit procedures related to the discount rate and forecasts of future revenues and margins used by management to estimate the fair value of the Americas - Distribution reporting unit included the following, among others:
•We tested the effectiveness of controls over management’s goodwill impairment evaluation, including those related to management’s forecasts of future revenues and margins and selection of the discount rate.
•We evaluated management’s ability to accurately forecast future revenues and margins by comparing actual results to management’s previous forecasts.
•We evaluated the reasonableness of management’s revenue and margin forecasts by comparing the forecasts to (1) historical revenues and margins and (2) forecasted information for certain companies in the reporting unit’s industry.
•We reviewed industry reports for industry-specific and economic factors for the reporting unit and evaluated the reasonableness of management's revenue forecasts by comparing the forecasts to forecasted information from the industry reports.
•With the assistance of our fair value specialists, we evaluated the reasonableness of the valuation methodology and the discount rate by (1) testing the source information underlying the determination of the discount rate; (2) testing the mathematical accuracy of the calculation; and (3) developing a range of independent estimates and comparing those to the discount rate selected by management.
/s/ DELOITTE & TOUCHE LLP
Milwaukee, Wisconsin
February 21, 2025
We have served as the Company’s auditor since 2023.
REPORT OF INDEPENDENT REGISTERED PUBLIC ACCOUNTING FIRM
To the Board of Directors and Shareholders of The Manitowoc Company, Inc.
Opinion on the Financial Statements
We have audited the consolidated statements of operations, of comprehensive income (loss), of equity and of cash flows of The Manitowoc Company, Inc. and its subsidiaries (the “Company”) for the year ended December 31, 2022, including the related notes and schedule of valuation and qualifying accounts for the year ended December 31, 2022 listed in the index appearing under Item 15(a)(2) (collectively referred to as the “consolidated financial statements”). In our opinion, the consolidated financial statements present fairly, in all material respects, the results of operations and cash flows of the Company for the year ended December 31, 2022 in conformity with accounting principles generally accepted in the United States of America.
Basis for Opinion
These consolidated financial statements are the responsibility of the Company's management. Our responsibility is to express an opinion on the Company’s consolidated financial statements based on our audit. We are a public accounting firm registered with the Public Company Accounting Oversight Board (United States) (PCAOB) and are required to be independent with respect to the Company in accordance with the U.S. federal securities laws and the applicable rules and regulations of the Securities and Exchange Commission and the PCAOB.
We conducted our audit of these consolidated financial statements in accordance with the standards of the PCAOB. Those standards require that we plan and perform the audit to obtain reasonable assurance about whether the consolidated financial statements are free of material misstatement, whether due to error or fraud.
Our audit included performing procedures to assess the risks of material misstatement of the consolidated financial statements, whether due to error or fraud, and performing procedures that respond to those risks. Such procedures included examining, on a test basis, evidence regarding the amounts and disclosures in the consolidated financial statements. Our audit also included evaluating the accounting principles used and significant estimates made by management, as well as evaluating the overall presentation of the consolidated financial statements. We believe that our audit provides a reasonable basis for our opinion.
/s/ PricewaterhouseCoopers LLP
Milwaukee, Wisconsin
February 24, 2023
We served as the Company's auditor from 1995 to 2023.
The Manitowoc Company, Inc.
Consolidated Statements of Operations
For the years ended December 31, 2024, 2023, and 2022
| | | | | | | | | | | | |
Millions of dollars, except per share data | | 2024 | | | 2023 | | | 2022 | |
Net sales | | $ | 2,178.0 | | | $ | 2,227.8 | | | $ | 2,032.5 | |
Cost of sales | | | 1,803.0 | | | | 1,802.6 | | | | 1,668.0 | |
Gross profit | | | 375.0 | | | | 425.2 | | | | 364.5 | |
Operating costs and expenses: | | | | | | | | | |
Engineering, selling, and administrative expenses | | | 315.7 | | | | 328.3 | | | | 281.0 | |
Asset impairment expense | | | — | | | | — | | | | 171.9 | |
Amortization of intangible assets | | | 2.9 | | | | 3.2 | | | | 3.1 | |
Restructuring expense | | | 4.6 | | | | 1.3 | | | | 1.5 | |
Total operating costs and expenses | | | 323.2 | | | | 332.8 | | | | 457.5 | |
Operating income (loss) | | | 51.8 | | | | 92.4 | | | | (93.0 | ) |
Other income (expense): | | | | | | | | | |
Interest expense | | | (38.3 | ) | | | (33.9 | ) | | | (31.6 | ) |
Amortization of deferred financing fees | | | (1.4 | ) | | | (1.3 | ) | | | (1.4 | ) |
Other income (expense) — net | | | (0.4 | ) | | | (13.0 | ) | | | 5.8 | |
Total other expense — net | | | (40.1 | ) | | | (48.2 | ) | | | (27.2 | ) |
Income (loss) before income taxes | | | 11.7 | | | | 44.2 | | | | (120.2 | ) |
Provision (benefit) for income taxes | | | (44.1 | ) | | | 5.0 | | | | 3.4 | |
Net income (loss) | | $ | 55.8 | | | $ | 39.2 | | | $ | (123.6 | ) |
Per Share Data | | | | | | | | | |
Basic income (loss) per common share | | $ | 1.58 | | | $ | 1.12 | | | $ | (3.51 | ) |
| | | | | | | | | |
Diluted income (loss) per share | | $ | 1.56 | | | $ | 1.09 | | | $ | (3.51 | ) |
The accompanying notes are an integral part of these consolidated financial statements.
The Manitowoc Company, Inc.
Consolidated Statements of Comprehensive Income (Loss)
For the years ended December 31, 2024, 2023, and 2022
| | | | | | | | | | | | |
Millions of dollars | | 2024 | | | 2023 | | | 2022 | |
Net income (loss) | | $ | 55.8 | | | $ | 39.2 | | | $ | (123.6 | ) |
Other comprehensive income (loss), net of income tax: | | | | | | | | | |
Unrealized gain (loss) on derivatives,
net of income tax benefit of $1.0, $0.0 and $0.0,
respectively | | | (3.0 | ) | | | (4.1 | ) | | | 5.4 | |
Employee pension and postretirement benefit income, net of
income tax (provision) benefit of $(1.3), $0.7 and $(1.1),
respectively | | | 2.6 | | | | 5.0 | | | | 17.0 | |
Foreign currency translation adjustments, net of income tax
(provision) benefit of $2.1, $0.1 and $(0.4), respectively | | | (20.8 | ) | | | 20.6 | | | | (27.9 | ) |
Total other comprehensive income (loss), net of income tax | | | (21.2 | ) | | | 21.5 | | | | (5.5 | ) |
Comprehensive income (loss) | | $ | 34.6 | | | $ | 60.7 | | | $ | (129.1 | ) |
The accompanying notes are an integral part of these consolidated financial statements.
The Manitowoc Company, Inc.
Consolidated Balance Sheets
As of December 31, 2024 and 2023
| | | | | | | | |
Dollars in millions, except par value and share amounts | | 2024 | | | 2023 | |
Assets | | | | | | |
Current Assets: | | | | | | |
Cash and cash equivalents | | $ | 48.0 | | | $ | 34.4 | |
Accounts receivable, less allowances of $5.9 and $6.1, respectively | | | 260.3 | | | | 278.8 | |
Inventories | | | 609.4 | | | | 666.5 | |
Other current assets | | | 41.2 | | | | 53.3 | |
Total current assets | | | 958.9 | | | | 1,033.0 | |
Property, plant, and equipment — net | | | 346.2 | | | | 366.1 | |
Operating lease right-of-use assets | | | 59.3 | | | | 59.7 | |
Goodwill | | | 77.8 | | | | 79.6 | |
Intangible assets — net | | | 118.5 | | | | 125.6 | |
Other non-current assets | | | 99.3 | | | | 42.7 | |
Total assets | | $ | 1,660.0 | | | $ | 1,706.7 | |
Liabilities and Stockholders' Equity | | | | | | |
Current Liabilities: | | | | | | |
Accounts payable and accrued expenses | | $ | 389.4 | | | $ | 457.4 | |
Customer advances | | | 18.0 | | | | 19.2 | |
Short-term borrowings and current portion of long-term debt | | | 13.1 | | | | 13.4 | |
Product warranties | | | 37.0 | | | | 47.1 | |
Other liabilities | | | 16.8 | | | | 26.2 | |
Total current liabilities | | | 474.3 | | | | 563.3 | |
Non-Current Liabilities: | | | | | | |
Long-term debt | | | 377.1 | | | | 358.7 | |
Operating lease liabilities | | | 47.0 | | | | 47.2 | |
Deferred income taxes | | | 2.1 | | | | 7.5 | |
Pension obligations | | | 47.1 | | | | 55.8 | |
Postretirement health and other benefit obligations | | | 4.7 | | | | 5.6 | |
Long-term deferred revenue | | | 17.5 | | | | 24.1 | |
Other non-current liabilities | | | 50.1 | | | | 41.2 | |
Total non-current liabilities | | | 545.6 | | | | 540.1 | |
Commitments and contingencies (Note 17) | | | | | | |
Stockholders' equity: | | | | | | |
Preferred stock (3,500,000 shares authorized of $.01 par value; none outstanding) | | | — | | | | — | |
Common stock (75,000,000 shares authorized, 40,793,983
shares issued, 35,134,245 and 35,094,993 shares outstanding, respectively) | | | 0.4 | | | | 0.4 | |
Additional paid-in capital | | | 615.1 | | | | 613.1 | |
Accumulated other comprehensive loss | | | (107.6 | ) | | | (86.4 | ) |
Retained earnings | | | 199.3 | | | | 143.5 | |
Treasury stock, at cost (5,659,738 and 5,698,990 shares, respectively) | | | (67.1 | ) | | | (67.3 | ) |
Total stockholders’ equity | | | 640.1 | | | | 603.3 | |
Total liabilities and stockholders' equity | | $ | 1,660.0 | | | $ | 1,706.7 | |
The accompanying notes are an integral part of these consolidated financial statements.
The Manitowoc Company, Inc.
Consolidated Statements of Cash Flows
For the years ended December 31, 2024, 2023, and 2022
| | | | | | | | | | | | |
Millions of dollars | | 2024 | | | 2023 | | | 2022 | |
Cash Flows From Operating Activities | | | | | | | | | |
Net income (loss) | | $ | 55.8 | | | $ | 39.2 | | | $ | (123.6 | ) |
Adjustments to reconcile net income (loss) to cash
provided by operating activities: | | | | | | | | | |
Asset impairment expense | | | — | | | | — | | | | 171.9 | |
Depreciation expense | | | 60.0 | | | | 56.6 | | | | 60.6 | |
Amortization of intangible assets | | | 2.9 | | | | 3.2 | | | | 3.1 | |
Loss on debt extinguishment | | | 1.1 | | | | — | | | | — | |
Stock-based compensation expense | | | 10.9 | | | | 11.5 | | | | 8.5 | |
Amortization of deferred financing fees | | | 1.4 | | | | 1.3 | | | | 1.4 | |
Gain on sale of property, plant, and equipment | | | — | | | | — | | | | (0.9 | ) |
Net unrealized foreign currency transaction gains | | | — | | | | — | | | | (3.2 | ) |
Income tax benefit from change in reserve of
uncertain tax positions | | | — | | | | — | | | | (11.0 | ) |
Deferred income tax expense (benefit) - net | | | (55.6 | ) | | | (6.0 | ) | | | 4.4 | |
Other | | | — | | | | 9.3 | | | | 0.9 | |
Changes in operating assets and liabilities | | | | | | | | | |
Accounts receivable | | | 9.0 | | | | (9.3 | ) | | | (36.4 | ) |
Inventories | | | 21.4 | | | | (46.7 | ) | | | (42.0 | ) |
Notes receivable | | | — | | | | — | | | | 8.3 | |
Other assets | | | 8.5 | | | | (4.0 | ) | | | 5.8 | |
Accounts payable | | | (39.1 | ) | | | (28.5 | ) | | | 40.4 | |
Accrued expenses and other liabilities | | | (27.1 | ) | | | 36.4 | | | | (11.3 | ) |
Net cash provided by operating activities | | | 49.2 | | | | 63.0 | | | | 76.9 | |
Cash Flows From Investing Activities | | | | | | | | | |
Capital expenditures | | | (45.7 | ) | | | (77.4 | ) | | | (61.8 | ) |
Proceeds from sale of fixed assets | | | 4.8 | | | | 5.6 | | | | 1.5 | |
Acquisition of business | | | — | | | | — | | | | 2.3 | |
Other | | | 0.5 | | | | — | | | | — | |
Net cash used for investing activities | | | (40.4 | ) | | | (71.8 | ) | | | (58.0 | ) |
Cash Flows From Financing Activities | | | | | | | | | |
Payments on revolving credit facility | | | (20.0 | ) | | | (20.0 | ) | | | (20.0 | ) |
Proceeds from revolving credit facility | | | 40.7 | | | | — | | | | — | |
Payments on long-term debt | | | (300.0 | ) | | | — | | | | — | |
Proceeds from long-term debt | | | 300.0 | | | | — | | | | — | |
Proceeds from (payments on) other debt - net | | | 6.6 | | | | 3.8 | | | | (5.1 | ) |
Debt issuance and other debt related costs | | | (7.4 | ) | | | — | | | | (1.9 | ) |
Exercises of stock options | | | — | | | | 0.3 | | | | 0.1 | |
Common stock repurchases | | | (5.7 | ) | | | (5.5 | ) | | | (3.0 | ) |
Other financing activities | | | (7.5 | ) | | | — | | | | — | |
Net cash provided by (used for) financing activities | | | 6.7 | | | | (21.4 | ) | | | (29.9 | ) |
Effect of exchange rate changes on cash and cash equivalents | | | (1.9 | ) | | | 0.2 | | | | — | |
Net increase (decrease) in cash and cash equivalents | | | 13.6 | | | | (30.0 | ) | | | (11.0 | ) |
Cash and cash equivalents at beginning of period | | | 34.4 | | | | 64.4 | | | | 75.4 | |
Cash and cash equivalents at end of period | | $ | 48.0 | | | $ | 34.4 | | | $ | 64.4 | |
Supplemental Cash Flow Information | | | | | | | | | |
Interest paid | | $ | 36.6 | | | $ | 34.0 | | | $ | 30.8 | |
Income taxes paid | | | 12.9 | | | | 10.1 | | | | 7.3 | |
The accompanying notes are an integral part of these consolidated financial statements.
The Manitowoc Company, Inc.
Consolidated Statements of Equity
For the years ended December 31, 2024, 2023, and 2022
| | | | | | | | | | | | |
Millions of dollars | | 2024 | | | 2023 | | | 2022 | |
Common Stock - Par Value | | | | | | | | | |
Balance at beginning of year | | $ | 0.4 | | | $ | 0.4 | | | $ | 0.4 | |
Balance at end of year | | $ | 0.4 | | | $ | 0.4 | | | $ | 0.4 | |
Additional Paid-in Capital | | | | | | | | | |
Balance at beginning of year | | $ | 613.1 | | | $ | 606.7 | | | $ | 602.4 | |
Stock compensation plans | | | (8.9 | ) | | | (5.1 | ) | | | (4.2 | ) |
Stock-based compensation expense | | | 10.9 | | | | 11.5 | | | | 8.5 | |
Balance at end of year | | $ | 615.1 | | | $ | 613.1 | | | $ | 606.7 | |
Accumulated Other Comprehensive Loss | | | | | | | | | |
Balance at beginning of year | | $ | (86.4 | ) | | $ | (107.9 | ) | | $ | (102.4 | ) |
Other comprehensive income (loss) | | | (21.2 | ) | | | 21.5 | | | | (5.5 | ) |
Balance at end of year | | $ | (107.6 | ) | | $ | (86.4 | ) | | $ | (107.9 | ) |
Retained Earnings | | | | | | | | | |
Balance at beginning of year | | $ | 143.5 | | | $ | 104.3 | | | $ | 227.9 | |
Net income (loss) | | | 55.8 | | | | 39.2 | | | | (123.6 | ) |
Balance at end of year | | $ | 199.3 | | | $ | 143.5 | | | $ | 104.3 | |
Treasury Stock | | | | | | | | | |
Balance at beginning of year | | $ | (67.3 | ) | | $ | (65.7 | ) | | $ | (65.9 | ) |
Stock compensation plans | | | 5.9 | | | | 3.9 | | | | 3.2 | |
Common stock repurchases | | | (5.7 | ) | | | (5.5 | ) | | | (3.0 | ) |
Balance at end of year | | $ | (67.1 | ) | | $ | (67.3 | ) | | $ | (65.7 | ) |
Total stockholders' equity | | $ | 640.1 | | | $ | 603.3 | | | $ | 537.8 | |
The accompanying notes are an integral part of these consolidated financial statements.
Notes to Consolidated Financial Statements
1. Company and Basis of Presentation
The Manitowoc Company, Inc. (“Manitowoc” or the “Company”) was founded in 1902 and has over a 120-year tradition of providing high-quality, customer-focused products and support services to its markets. Headquartered in Milwaukee, Wisconsin, United States, Manitowoc is one of the world's leading providers of engineered lifting solutions. Manitowoc, through its wholly-owned subsidiaries, designs, manufactures, markets, distributes, and supports comprehensive product lines of mobile hydraulic cranes, lattice-boom crawler cranes, boom trucks, and tower cranes under the Aspen Equipment, Grove, Manitowoc, MGX Equipment Services, National Crane, Potain, and Shuttlelift brand names. The Company serves a wide variety of customers, including dealers, rental companies, contractors, and government entities, across the petrochemical, industrial, commercial construction, power and utilities, infrastructure and residential construction end markets. Due to the ongoing and predictable maintenance needed by cranes, as well as the high cost of crane downtime, Manitowoc’s aftermarket support operations provide the Company with a consistent stream of recurring revenue. Manitowoc's principal executive offices are located at 11270 West Park Place Suite 1000, Milwaukee, Wisconsin 53224.
Basis of Presentation The consolidated financial statements include the accounts of the Company and its wholly owned subsidiaries. All significant intercompany balances and transactions have been eliminated. The preparation of financial statements in conformity with accounting principles generally accepted in the United States of America ("GAAP") requires management to make estimates and assumptions that affect the reported amounts of assets and liabilities, disclosure of contingent assets and liabilities at the date of the financial statements and the reported amounts of revenues and expenses during the reporting period. Actual results could differ from these estimates.
All amounts, except per share data and share amounts, are in millions throughout the tables in these notes unless otherwise indicated.
2. Summary of Significant Accounting Policies
Cash and Cash Equivalents The Company considers all cash, bankers acceptance, and short-term investments purchased with an original maturity of three months or less as cash and cash equivalents.
Allowance for Credit Losses Accounts receivable are reduced by an allowance for amounts that may become uncollectible in the future. The Company's allowance for credit losses is based on an estimate of the losses inherent in amounts billed, pools of receivables with similar risk characteristics, existing and future economic conditions, reasonable and supportable forecasts that affect the collectability of the related receivable and any specific customer collection issues the Company has identified.
The following table is a rollforward of the allowance for credit losses for the years ended December 31, 2024, 2023, and 2022.
| | | | | | | | | | | | |
| | 2024 | | | 2023 | | | 2022 | |
Balance at beginning of period | | $ | 6.1 | | | $ | 5.3 | | | $ | 7.3 | |
Bad debt expenses | | | 1.2 | | | | 2.3 | | | | 0.1 | |
Use of reserve | | | (1.2 | ) | | | (1.4 | ) | | | (1.8 | ) |
Currency translation | | | (0.2 | ) | | | (0.1 | ) | | | (0.3 | ) |
Balance at end of period | | $ | 5.9 | | | $ | 6.1 | | | $ | 5.3 | |
Inventories Inventories are valued at the lower of cost or net realizable value. Finished goods and work-in-process inventories include material, labor, and manufacturing overhead costs. The Company determines inventory value using the first-in, first-out and average cost methodologies.
Business Combinations The Company accounts for business combinations under the acquisition method in accordance with Accounting Standards Codification (“ASC”) Topic 805, Business Combinations (“Topic 805”). The acquisition method requires identifiable assets acquired and liabilities assumed and any non-controlling interest in the business acquired be recognized and measured at fair value on the acquisition date, which is the date that the Company obtains control of the acquired business. The amount by which the fair value of consideration transferred as the purchase price exceeds the net fair value of assets acquired and liabilities assumed is recorded as goodwill. The Company expenses transaction costs in a business combination.
Goodwill and Intangible Assets The Company accounts for goodwill and intangible assets under the guidance of ASC Topic 350-10, “Intangibles — Goodwill and Other” (“Topic 350”). Under ASC Topic 350, goodwill is not amortized; instead, the
Company performs an annual impairment test. The date for the annual impairment test is October 31 or more frequently if events or changes in circumstances indicate that the assets might be impaired. To perform its goodwill impairment test, the Company uses a combination of the income approach and market approach with a weighting of 70/30, respectively, to determine the fair value of the Middle East and Asia Pacific (“MEAP”) reporting unit. The Company uses only the income approach to determine the fair value of the Americas - Distribution reporting unit due to a lack of comparable peer companies to determine fair value under the market approach. Impairment is determined based on the amount in which a reporting unit's carrying value exceeds its fair value, not to exceed the carrying amount of goodwill at the reporting unit. In addition, goodwill of a reporting unit is tested for impairment between annual tests if an event occurs or circumstances change that would more-likely-than-not reduce the fair value of a reporting unit below its carrying value.
The Company’s indefinite-lived intangible assets are not amortized but are subject to an annual impairment test. To perform its indefinite-lived intangible assets impairment test, the Company uses a fair-value method based on a relief of royalty valuation approach to determine the fair value of its indefinite-lived intangible assets. Management’s judgments and assumptions about the amounts of those cash flows and the discount rates are inputs to the annual impairment test. Impairment is determined based on the amount in which the carrying value of the indefinite-lived intangible asset exceeds its fair value, not to exceed the carrying amount of the indefinite-lived intangible asset. Refer to Note 8, “Goodwill and Intangible Assets,” for further details on the Company's impairment assessments. The Company’s definite-lived intangible assets subject to amortization are subject to impairment testing whenever events or changes in circumstances indicate that the carrying value of the assets may not be recoverable. If an indicator of impairment is identified, the Company would use the undiscounted cash flow model.
The Company’s intangible assets subject to amortization are amortized straight-line over the following minimum and maximum estimated useful lives according to the Company's policy:
| | |
| | Years |
Patents | | 20 |
Customer relationships | | 12 - 18 |
Trademarks and tradenames | | 5 |
Noncompetition agreements | | 5 |
Property, Plant, and Equipment Property, plant, and equipment are stated at cost. Expenditures for maintenance and repairs are charged against earnings as incurred. Expenditures for major renewals and improvements that substantially extend the capacity or useful life of an asset are capitalized and depreciated over the remaining estimated useful life. The cost and accumulated depreciation for property, plant, and equipment sold, retired, or otherwise disposed of are relieved from the accounts, and resulting gains or losses are reflected in earnings. Property, plant, and equipment are depreciated over the asset’s estimated useful life using the straight-line depreciation method for financial reporting and accelerated methods for income tax purposes. The Company also has certain leasehold improvements which are depreciated over the lesser of the asset's useful life or lease term using the straight-line depreciation method.
Property, plant, and equipment are generally depreciated over the following estimated useful lives according to the Company's policy:
| | |
| | Years |
Building and improvements | | 10 - 50 |
Machinery, equipment, and tooling | | 5 - 20 |
Furniture and fixtures | | 5 - 10 |
Computer hardware and software | | 3 - 5 |
Rental cranes | | 5 - 10 |
Property, plant, and equipment also includes cranes accounted for as operating leases which are included in rental cranes. Equipment accounted for as operating leases includes rental cranes leased directly to the customer and cranes for which the Company has assisted in the financing arrangement, whereby the Company has made a buyback commitment in which the customer at the time of the order had a significant economic incentive to exercise. Equipment that is leased directly to the customer is accounted for as an operating lease with the related assets capitalized and depreciated over their estimated economic life. Equipment involved in a financing arrangement is depreciated over the life of the underlying arrangement to the buyback amount at the end of the lease period. The amount of rental cranes included in property, plant, and equipment - net amounted to $142.1 million and $153.3 million, net of accumulated depreciation, as of December 31, 2024 and 2023, respectively.
The Company reviews property, plant, and equipment for impairment whenever events or changes in circumstances indicate that the assets’ carrying amount may not be recoverable. The Company conducts its impairment analyses in accordance with ASC Topic 360-10-5 “Property, Plant, and Equipment” (“Topic 360”). Topic 360 requires the Company to group assets and liabilities at the lowest level for which identifiable cash flows are largely independent of the cash flows of other assets and liabilities and to evaluate the asset group against the sum of the undiscounted future cash flows. If the undiscounted cash flows are less than the net book value of the assets, any related impairment loss is calculated based upon comparison of the fair value to the net book value of the assets.
Warranties Estimated manufacturing warranty costs are recorded in cost of sales at the time of sale of the warranted products based on historical warranty experience for the related product or estimates of projected costs due to specific warranty issues on new products. These estimates are reviewed periodically and are adjusted based on changes in facts, circumstances, or actual experience. When a customer purchases an extended warranty, revenue associated with the extended warranty is deferred and recognized over the life of the extended warranty period. Costs during the extended warranty period are expensed as incurred. Costs associated with other warranty activity not related to a manufacturer's standard or extended warranty are recorded in the period a loss is probable and can be reasonably estimated in accordance with ASC Topic 450-20 “Loss Contingencies.”
Product Liabilities The Company records product liability reserves for its self-insured portion of any outstanding product liability cases when losses are probable and reasonably estimable. The reserve is based upon two estimates. First, the Company tracks the population of all outstanding product liability cases to determine an appropriate case reserve for each based upon the Company’s best judgment with the advice of legal counsel. These estimates are continually evaluated and adjusted based upon changes to facts and circumstances surrounding the case. Second, the Company determines the amount of additional reserve required to cover incurred, but not reported, product liability obligations and to account for possible adverse development of the established case reserves utilizing actuarially developed estimates. Insurance recoveries related to a product liability case are recorded as an asset in the period it is determined that the gain has been realized or realizable. Refer to Note 17, “Commitments and Contingencies,” for further information.
Derivative Financial Instruments and Hedging Activities The Company has policies and procedures that place all financial instruments under the direction of corporate treasury and restrict all derivative transactions to those intended for hedging purposes. The use of financial instruments for trading purposes is strictly prohibited. The Company uses financial instruments to manage the market risk from changes in foreign exchange rates, commodities and interest rates. The Company follows the guidance in accordance with ASC Topic 815 “Derivatives and Hedging” (“Topic 815”). The fair values of all outstanding derivatives are recorded in the Consolidated Balance Sheets. The change in a derivative’s fair value is recorded each period in current earnings or accumulated other comprehensive income (loss) (“AOCI”) depending on whether the derivative is designated and qualifies as a cash flow hedge.
The Company selectively hedges anticipated transactions that are subject to foreign exchange exposure, commodity price exposure or variable interest rate exposure, primarily using foreign currency exchange contracts (“FX Forward Contracts”), commodity contracts and interest rate contracts, respectively. These instruments are designated as cash flow hedges in accordance with Topic 815 and are recorded in the Consolidated Balance Sheets at fair value. The effective portion of the contracts’ gains or losses due to changes in fair value are initially recorded as a component of AOCI and are subsequently reclassified into earnings when the hedged transactions, typically sales and costs related to sales and interest expense, occur and affect earnings. These contracts are highly effective in hedging the variability in future cash attributable to changes in currency exchange rates, commodity prices or interest rates.
The amount reported as derivative instrument fair market value adjustment in the AOCI account within the Consolidated Statements of Comprehensive Income (Loss) represents the net gain (loss) on foreign currency exchange contracts designated as cash flow hedges, net of income taxes.
Stock-Based Compensation The Company recognizes expense net of estimated future forfeitures for non-performance stock-based awards on a straight-line basis over the vesting period of the entire award. The Company recognizes expense net of estimated future forfeitures for stock-based awards with performance goals based on actual or estimated achievement of those goals on a straight-line basis over the vesting period of the entire award. Estimated future forfeiture rates are based on the Company's historical experience. Refer to Note 15, “Stock-Based Compensation,” for more information on stock-based compensation plans.
Research and Development Research and development costs are charged to expense as incurred and amounted to $41.1 million, $35.3 million and $33.5 million for the years ended December 31, 2024, 2023, and 2022, respectively. Research and
development costs include salaries, materials, contractor fees and other administrative costs. These costs are recorded within engineering, selling, and administrative expenses in the Consolidated Statement of Operations.
Income Taxes The Company utilizes the liability method to recognize deferred tax assets and liabilities for the expected future income tax consequences of events that have been recognized in the Company’s financial statements. Under this method, deferred tax assets and liabilities are determined based on the temporary difference between financial statement carrying amounts and the tax basis of assets and liabilities using enacted tax rates in effect in the years in which the temporary differences are expected to reverse. Valuation allowances are provided for deferred tax assets where it is considered more likely than not that the Company will not realize the benefit of such assets. The Company evaluates its uncertain tax positions as new information becomes available. Tax benefits are recognized to the extent a position is more likely than not to be sustained upon examination by the taxing authority.
Net Income (Loss) Per Share Net income (loss) per share is computed by dividing net income (loss) by the weighted average number of common shares outstanding during each year or period. The calculation of diluted net income (loss) per share reflects the effect of all potential dilutive shares that were outstanding during the respective periods, unless the effect of doing so would be antidilutive. The Company uses the treasury stock method to calculate the effect of outstanding stock-based compensation awards.
Comprehensive Income (Loss) Comprehensive income (loss) includes, in addition to net income (loss), other items that are reported as direct adjustments to Manitowoc stockholders’ equity. These items are foreign currency translation adjustments, employee postretirement benefit adjustments, and the change in fair value of certain derivative instruments.
Net Sales Sales are recognized when obligations under the terms of a contract with the Company’s customer are satisfied; generally this occurs with the transfer of control of the Company’s cranes or attachments or aftermarket parts or completion of performance of services. Sales are measured as the amount of consideration the Company expects to be entitled to receive in exchange for transferring goods or providing services. The Company recognizes sales for extended warranties over the life of the extended warranty period.
Taxes assessed by a governmental authority that are both imposed on and concurrent with a specific revenue-producing transaction, and are collected by the Company from a customer, are excluded from sales.
Performance Obligations
The following is a description of principal activities from which the Company generates sales. Disaggregation of the Company’s revenue sources are disclosed in Note 16, “Segments.”
Crane Sales
Crane sales are primarily generated through the sale of new and used cranes. Contracts with customers are generally in the form of a purchase order. Based on the nature of the Company’s contracts, the Company does not have any significant financing terms. Contracts may have variable consideration in the form of early pay discounts or rebates, however variable consideration is not material to the overall contract with the customer. Sales are recognized under these contracts when control of the product is transferred to the customer. Control transfers to the customer generally upon delivery to the carrier or acceptance through an independent inspection company that acts as an agent of the customer.
From time to time, the Company enters into agreements where the customer has the right to exercise a put option requiring the Company to buyback a crane at an agreed upon price. The Company evaluates each agreement at inception to determine if the customer has a significant economic incentive to exercise that right. If it is determined that the customer has a significant economic incentive to exercise that right, the agreement is accounted for as a lease in accordance with ASC Topic 842 “Leases” (“Topic 842”). If it is determined that the customer does not have a significant economic incentive to exercise that right, then revenue is recognized when control of the asset is transferred to the customer. Refer to Note 18, “Guarantees,” for additional information.
Given the nature of the Company’s products, the customer may request that the product be held until a delivery location is identified. Under these “bill and hold” arrangements, sales are recognized when all of the following criteria are met: 1) the reason for the bill-and-hold arrangement is substantive, 2) the product is separately identified as belonging to the customer, 3) the product is ready for transfer to the customer, and 4) the Company does not have the ability to use the product or direct it to another customer.
Crane Attachment Sales
Crane attachment sales are generated through the sale of new or used crane attachments such as luffing jibs, ecomats and counterweights. Crane attachment sales are recognized when control of the product is transferred to the customer. Control transfers to the customer generally upon delivery to the carrier.
Aftermarket Part Sales
Aftermarket part sales are generated through the sale of new and used parts to end customers and distributors. Aftermarket part sales are recognized when control of the product is transferred to the customer. Control transfers to the customer generally upon delivery to the carrier. Customers generally have a right of return which the Company estimates using historical information. The amount of estimated returns is deducted from net sales.
Other Sales
The Company’s other sales consist primarily of sales from:
•Repair and field service work;
The Company’s performance obligations for other sales generally relates to performing specific agreed upon services. Depending on the nature of the contract, sales are recognized upon the completion of those services or over the service period based on a measure of progress.
Practical Expedients and Exemptions
The Company expenses sales commissions when incurred because the amortization period would be one year or less. These costs are recorded within engineering, selling, and administrative expenses in the Consolidated Statement of Operations.
The Company accounts for shipping and handling activities performed after control of a product has been transferred to the customer as a fulfillment cost. As such, we have applied the practical expedient and we accrue for the costs of shipping and handling activities if revenue is recognized before contractually agreed shipping and handling activities occur.
The Company does not disclose the value of unsatisfied performance obligations for (i) contracts with an original expected length of one year or less and (ii) contracts for which it recognizes revenue at the amount to which it has the right to invoice for services performed.
Recent Accounting Changes and Pronouncements
In November 2023, the Financial Accounting Standards Board ("FASB") issued Accounting Standards Update ("ASU") No. 2023-07, "Segment Reporting - Improvements to Reportable Segments Disclosures”. The amendments in this ASU improve reportable segment disclosure requirements, primarily through enhanced disclosures about significant segment expenses. The standard is effective for annual periods beginning after December 15, 2023, and for interim periods within fiscal years beginning after December 15, 2024. Early adoption is permitted. The Company adopted this ASU as of December 31, 2024, which did not have a material impact on the Company’s consolidated financial statements. Refer to Note 16, “Segments” for the additional disclosures required by the adoption of this ASU.
In December 2023, the FASB issued ASU No. 2023-09, "Income Taxes (Topic 740): Improvements to Income Tax Disclosures”. The amendments in this ASU enhance the transparency and decision usefulness of income tax disclosures. The standard is effective for annual periods beginning after December 15, 2024. Early adoption is permitted. The adoption of this ASU will not have a material impact on the Company’s consolidated financial statements.
In November 2024, the FASB issued ASU No. 2024-03, "Income Statement - Reporting Comprehensive Income - Expense Disaggregation Disclosures (Subtopic 220-40): Disaggregation of Income Statement Expense". The amendments in this ASU require public companies to disclose more information about their expenses in their financial statements. The standard is effective for annual periods beginning after December 15, 2026 and interim periods within annual reporting periods beginning
after December 15, 2027. Early adoption is permitted. The Company is evaluating the impact the adoption this ASU will have on its consolidated financial statements.
3. Net Sales
The Company defers revenue when cash payments are received in advance of satisfying the performance obligation. These amounts are recorded as customer advances in the Consolidated Balance Sheets. The table below shows the change in the customer advances balance for the years ended December 31, 2024 and 2023.
| | | | | | | | |
| | 2024 | | | 2023 | |
Balance at beginning of period | | $ | 19.2 | | | $ | 21.9 | |
Cash received in advance of satisfying
performance obligations | | | 113.0 | | | | 147.7 | |
Revenue recognized | | | (113.3 | ) | | | (150.8 | ) |
Currency translation | | | (0.9 | ) | | | 0.4 | |
Balance at end of period | | $ | 18.0 | | | $ | 19.2 | |
The Company recognizes a contract asset for certain remanufacturing, repair, and field service work when the service is completed but unbilled as of the end of the period. Contract assets are recorded in other current assets in the Consolidated Balance Sheets. Contract assets are immaterial as of December 31, 2024 and 2023.
4. Fair Value of Financial Instruments
ASC Topic 820-10 ("ASC 820") defines fair value as the price that would be received to sell an asset or paid to transfer a liability in an orderly transaction between market participants at the measurement date. ASC Topic 820 classifies the inputs used to measure fair value into the following hierarchy:
Level 1 Unadjusted quoted prices in active markets for identical assets or liabilities
Level 2 Unadjusted quoted prices in active markets for similar assets or liabilities, or
Unadjusted quoted prices for identical or similar assets or liabilities in markets that are not active, or
Inputs other than quoted prices that are observable for the asset or liability
Level 3 Unobservable inputs for the asset or liability
The following tables set forth the Company’s financial assets and liabilities related to FX Forward Contracts and the Manitowoc Company, Inc. Deferred Compensation Plan (the "Deferred Compensation Plan") that were accounted for at fair value as of December 31, 2024 and 2023.
| | | | | | | | | | | | | | | | | | |
| | Fair Value as of December 31, 2024 | | | |
| | Level 1 | | | Level 2 | | | Level 3 | | | Total | | | Recognized Location |
Current Assets: | | | | | | | | | | | | | | |
FX Forward Contracts | | $ | — | | | $ | 0.1 | | | $ | — | | | $ | 0.1 | | | Other current assets |
Deferred Compensation Plan - Program B | | | 8.8 | | | | — | | | | — | | | | 8.8 | | | Other non-current assets |
Total current assets at fair value | | $ | 8.8 | | | $ | 0.1 | | | $ | — | | | $ | 8.9 | | | |
Current Liabilities: | | | | | | | | | | | | | | |
FX Forward Contracts | | $ | — | | | $ | 3.4 | | | $ | — | | | $ | 3.4 | | | Accounts payable and
accrued expenses |
| | | | | | | | | | | | | | | | | | |
| | Fair Value as of December 31, 2023 | | | |
| | Level 1 | | | Level 2 | | | Level 3 | | | Total | | | Recognized Location |
Current Assets: | | | | | | | | | | | | | | |
FX Forward Contracts | | $ | — | | | $ | 1.6 | | | $ | — | | | $ | 1.6 | | | Other current assets |
Deferred Compensation Plan - Program B | | | 8.1 | | | | — | | | | — | | | | 8.1 | | | Other non-current assets |
Total current assets at fair value | | $ | 8.1 | | | $ | 1.6 | | | $ | — | | | $ | 9.7 | | | |
Current Liabilities: | | | | | | | | | | | | | | |
FX Forward Contracts | | $ | — | | | $ | 0.6 | | | $ | — | | | $ | 0.6 | | | Accounts payable and
accrued expenses |
The fair value of the $300.0 million senior secured second lien notes due on October 1, 2031, with an annual coupon rate of 9.25% (the “2031 Notes”), was approximately $309.4 million as of December 31, 2024. Refer to Note 10, “Debt,” for a description of the 2031 Notes and the related carrying value.
The Company endeavors to utilize the best available information in measuring fair value. Financial assets and liabilities are classified in their entirety based on the lowest level of input that is significant to the fair value measurement. The Company estimates the fair value of its 2031 Notes based on quoted market prices of the instruments; because these markets are typically actively traded, the liabilities are classified as Level 1 within the valuation hierarchy. The carrying values of cash and cash equivalents, accounts receivable, accounts payable, and short-term variable debt, including any amounts outstanding under the Company's revolving credit facility, approximate fair value, without being discounted as of December 31, 2024 due to the short-term nature of these instruments.
FX Forward Contracts are valued through an independent valuation source which uses an industry standard data provider, with resulting valuations periodically validated through third-party or counterparty quotes. As such, these derivative instruments are classified within Level 2. Refer to Note 5, “Derivative Financial Instruments,” for additional information.
The Deferred Compensation Plan utilizes a rabbi trust to hold assets intended to satisfy the Company's corresponding future benefit obligations. The plan assets and corresponding obligations for Program B under the Deferred Compensation Plan are classified within Level 1. Refer to Note 19, "Employee Benefit Plans," for additional information on the Deferred Compensation Plan.
5. Derivative Financial Instruments
The Company’s risk management objective is to ensure that business exposures to risks are minimized using the most effective and efficient methods to eliminate, reduce, or transfer such exposures. Operating decisions consider these associated risks and, whenever possible, transactions are structured to avoid or mitigate these risks.
From time to time, the Company enters into FX Forward Contracts to manage the exposure on forecasted transactions denominated in non-functional currencies and to manage the risk of transaction gains and losses associated with assets/liabilities in currencies other than the functional currency of certain subsidiaries. Certain of these FX Forward Contracts are designated as cash flow hedges. To the extent these derivatives are effective in offsetting the variability of the hedged cash flows, changes in the derivatives’ fair value are not included in current earnings but are included in AOCI. These changes in fair value are reclassified into earnings as a component of cost of sales, as applicable, when the forecasted transaction impacts earnings. In addition, if the forecasted transaction is no longer probable, the cumulative change in the derivatives’ fair value is recorded as a component of other income (expense) – net in the period in which the transaction is no longer considered probable of occurring. No amounts were recorded related to forecasted transactions no longer being probable during the years ended December 31, 2024, 2023 or 2022.
The Company had FX Forward Contracts with an aggregate notional amount of $129.7 million and $140.1 million outstanding as of December 31, 2024 and 2023, respectively. The aggregate notional amount outstanding as of December 31, 2024 is scheduled to mature within 13 months. The FX Forward Contracts purchased are denominated in various foreign currencies. As of December 31, 2024 and 2023, the net fair value of these contracts was a net short-term liability of $3.3 million and a net short-term asset of $1.0 million, respectively. The net long-term liability was immaterial as of December 31, 2024 and zero as of December 31, 2023. Net unrealized gains (losses), net of income tax, recorded in AOCI were $(1.7) million as of December 31, 2024 and $1.3 million as of December 31, 2023.
The gains (losses) recorded in the Consolidated Statement of Operations for FX Forward Contracts for the years ended December 31, 2024, 2023, and 2022 are summarized as follows:
| | | | | | | | | | | | | | |
| | Recognized Location | | 2024 | | | 2023 | | | 2022 | |
Designated | | Cost of sales | | $ | (1.7 | ) | | $ | 2.3 | | | $ | (5.8 | ) |
Non-Designated | | Other income (expense) - net | | | 2.4 | | | | (3.3 | ) | | | 7.2 | |
6. Inventories
The components of inventories as of December 31, 2024 and 2023 are summarized as follows:
| | | | | | | | |
| | 2024 | | | 2023 | |
Raw materials | | $ | 121.4 | | | $ | 164.7 | |
Work-in-process | | | 114.8 | | | | 111.3 | |
Finished goods | | | 373.2 | | | | 390.5 | |
Total Inventories | | $ | 609.4 | | | $ | 666.5 | |
7. Property, Plant, and Equipment
The components of property, plant, and equipment as of December 31, 2024 and 2023 are summarized as follows:
| | | | | | | | |
| | 2024 | | | 2023 | |
Land | | $ | 14.3 | | | $ | 14.9 | |
Building and improvements | | | 203.3 | | | | 201.5 | |
Machinery, equipment, and tooling | | | 318.3 | | | | 318.4 | |
Furniture and fixtures | | | 13.3 | | | | 13.8 | |
Computer hardware and software | | | 129.6 | | | | 135.8 | |
Rental cranes | | | 185.7 | | | | 201.9 | |
Construction in progress | | | 6.9 | | | | 7.2 | |
Total cost | | | 871.4 | | | | 893.5 | |
Less accumulated depreciation | | | (525.2 | ) | | | (527.4 | ) |
Property, plant, and equipment — net | | $ | 346.2 | | | $ | 366.1 | |
Property, plant, and equipment is depreciated over the estimated useful life using the straight-line depreciation method for financial reporting and accelerated methods for income tax purposes.
Additions to property, plant, and equipment included in accounts payable and accrued expenses in the Consolidated Balance Sheets as of December 31, 2024 and 2023 was $5.3 million and $7.0 million, respectively.
Assets Held for Sale
As of December 31, 2023, the Company had $3.0 million of property, plant, and equipment classified as assets held for sale recorded in other current assets in the Consolidated Balance Sheets. This amount relates to a manufacturing building and land in Fanzeres, Portugal. As of December 31, 2024, the Company had sold the property, plant, and equipment previously classified as assets held for sale.
8. Goodwill and Intangible Assets
The changes in the carrying amount of goodwill for the years ended December 31, 2024 and 2023 are summarized as follows:
| | | | | | | | | | | | |
| | Americas - Distribution | | | MEAP | | | Consolidated | |
Balance as of January 1, 2023 | | $ | 14.4 | | | $ | 65.7 | | | $ | 80.1 | |
Foreign currency impact | | | — | | | | (0.5 | ) | | | (0.5 | ) |
Net balance as of December 31, 2023 | | | 14.4 | | | | 65.2 | | | | 79.6 | |
Foreign currency impact | | | — | | | | (1.8 | ) | | | (1.8 | ) |
Net balance as of December 31, 2024 | | $ | 14.4 | | | $ | 63.4 | | | $ | 77.8 | |
The gross carrying amount, accumulated impairment, and net book value of the Company's goodwill balances by reportable segment are summarized as follows:
| | | | | | | | | | | | | | | | | | | | | | | | |
| | December 31, 2024 | | | December 31, 2023 | |
| | | | | | | | | | | | | | | | | | |
| | Gross Carrying Amount | | | Accumulated Impairment Amount | | | Net Book Value | | | Gross Carrying Amount | | | Accumulated Impairment Amount | | | Net Book Value | |
Americas | | $ | 180.9 | | | $ | (166.5 | ) | | $ | 14.4 | | | $ | 180.9 | | | $ | (166.5 | ) | | $ | 14.4 | |
EURAF | | | 82.2 | | | | (82.2 | ) | | | — | | | | 82.2 | | | | (82.2 | ) | | | — | |
MEAP | | | 63.4 | | | | — | | | | 63.4 | | | | 65.2 | | | | — | | | | 65.2 | |
Total | | $ | 326.5 | | | $ | (248.7 | ) | | $ | 77.8 | | | $ | 328.3 | | | $ | (248.7 | ) | | $ | 79.6 | |
The Company performs its annual goodwill impairment test during the fourth quarter, or more frequently if events or changes in circumstances indicate that the asset might be impaired. The Company will continue to monitor changes in circumstances and test more frequently if those changes indicate that assets might be impaired. As of October 31, 2024, the Company performed its annual goodwill impairment test. The fair values of the Americas - Distribution and MEAP reporting units were in excess of their carrying values by 13% and 69%, respectively, as of the date of the annual impairment test and, therefore, were not impaired as of December 31, 2024.
The gross carrying amount, accumulated amortization and net book value of the Company’s intangible assets other than goodwill as of December 31, 2024 and 2023 are summarized as follows:
| | | | | | | | | | | | | | | | | | | | | | | | |
| | December 31, 2024 | | | December 31, 2023 | |
| | Gross
Carrying
Amount | | | Accumulated
Amortization
Amount | | | Net
Book
Value | | | Gross
Carrying
Amount | | | Accumulated
Amortization
Amount | | | Net
Book
Value | |
Definite lived intangible assets: | | | | | | | | | | | | | | | | | | |
Customer relationships | | $ | 26.3 | | | $ | (13.0 | ) | | $ | 13.3 | | | $ | 26.5 | | | $ | (11.6 | ) | | $ | 14.9 | |
Patents | | | 28.1 | | | | (27.8 | ) | | | 0.3 | | | | 29.2 | | | | (28.8 | ) | | | 0.4 | |
Noncompetition agreements | | | 4.2 | | | | (2.8 | ) | | | 1.4 | | | | 4.2 | | | | (2.0 | ) | | | 2.2 | |
Trademarks and tradenames | | | 2.2 | | | | (1.5 | ) | | | 0.7 | | | | 2.2 | | | | (1.0 | ) | | | 1.2 | |
Other intangibles | | | 0.7 | | | | (0.7 | ) | | | — | | | | 0.7 | | | | (0.7 | ) | | | — | |
Total | | | 61.5 | | | | (45.8 | ) | | | 15.7 | | | | 62.8 | | | | (44.1 | ) | | | 18.7 | |
Indefinite lived intangible assets: | | | | | | | | | | | | | | | | | | |
Trademarks and tradenames | | | 89.2 | | | | — | | | | 89.2 | | | | 92.6 | | | | — | | | | 92.6 | |
Distribution network | | | 13.6 | | | | — | | | | 13.6 | | | | 14.3 | | | | — | | | | 14.3 | |
Total | | | 102.8 | | | | — | | | | 102.8 | | | | 106.9 | | | | — | | | | 106.9 | |
Total intangible assets | | $ | 164.3 | | | $ | (45.8 | ) | | $ | 118.5 | | | $ | 169.7 | | | $ | (44.1 | ) | | $ | 125.6 | |
Definite lived intangible assets are amortized over their estimated useful lives.
Amortization expense of intangible assets for the years ended December 31, 2024, 2023, and 2022 was $2.9 million, $3.2 million, and $3.1 million, respectively.
Excluding the impact of any future acquisitions, divestitures or impairments, the Company's anticipated future amortization of intangible assets as of December 31, 2024 is summarized as follows:
| | | | |
Year | | Amortization | |
2025 | | $ | 2.9 | |
2026 | | | 2.5 | |
2027 | | | 1.5 | |
2028 | | | 1.4 | |
2029 | | | 1.4 | |
Thereafter | | | 6.0 | |
Total | | $ | 15.7 | |
Long-lived assets, which are primarily made up of property, plant, and equipment and definite lived intangible assets, are subject to impairment testing whenever events or circumstances indicate that the carrying value of the assets may not be recoverable. The Company determined there was not a triggering event during the year ended December 31, 2024, with the exception of one asset group located in Europe. Based on the results of the recoverability test, it was determined that the undiscounted cash flows were in excess of the carrying value of that asset group.
The Company performs its annual indefinite-lived intangible assets impairment testing during the fourth quarter, or more frequently if events or changes in circumstances indicate that the asset might be impaired. The Company will continue to monitor changes in circumstances and test more frequently if those changes indicate that assets might be impaired. The Company has two indefinite-lived intangible assets subject to an annual impairment test: the Potain trademark, tradename, and distribution network assets (“Potain Tradename”) and the Grove trademark, tradename, and distribution network assets (“Grove Tradename”). As of October 31, 2024, the Company performed its annual indefinite-lived intangible assets impairment test. The fair value of the Potain and Grove Tradenames were substantially in excess of their carrying values as of the date of the annual impairment test and, therefore, were not impaired as of December 31, 2024.
A considerable amount of management judgment and assumptions are required in performing the goodwill and indefinite-lived asset impairment tests as it relates to the forecast of future revenues and margins, especially considering the limited operating history of Americas – Distribution, and the discount rate, as applicable. While the Company believes the judgments and assumptions are reasonable, different assumptions could change the estimated fair value and, therefore, additional impairments could be required. Weakening industry or economic trends, disruptions to the Company's business, unexpected significant changes or planned changes in the use of the assets or in entity structure are all factors which may adversely impact the assumptions used in the valuations.
The Company continually monitors market conditions and determines if any additional interim reviews of other intangibles or long-lived assets are warranted. In the event the Company determines that assets are impaired in the future, the Company would recognize a non-cash impairment charge, which could have a material adverse effect on the Company’s Consolidated Balance Sheets and Results of Operations.
9. Accounts Payable and Accrued Expenses
Accounts payable and accrued expenses as of December 31, 2024 and 2023 are summarized as follows:
| | | | | | | | |
| | 2024 | | | 2023 | |
Trade accounts payable | | $ | 205.5 | | | $ | 254.7 | |
Employee-related expenses | | | 43.2 | | | | 57.9 | |
Accrued vacation | | | 23.3 | | | | 23.7 | |
Miscellaneous accrued expenses | | | 117.4 | | | | 121.1 | |
Total accounts payable and accrued expenses | | $ | 389.4 | | | $ | 457.4 | |
10. Debt
Outstanding debt as of December 31, 2024 and 2023 is summarized as follows:
| | | | | | | | |
| | 2024 | | | 2023 | |
Borrowing under senior secured asset based revolving
credit facility | | $ | 79.0 | | | $ | 60.0 | |
Senior secured second lien notes due 2026 | | | — | | | | 300.0 | |
Senior secured second lien notes due 2031 | | | 300.0 | | | | — | |
Other debt | | | 16.4 | | | | 13.7 | |
Deferred financing costs | | | (5.2 | ) | | | (1.6 | ) |
Total debt | | | 390.2 | | | | 372.1 | |
Short-term borrowings and current portion of
long-term debt | | | (13.1 | ) | | | (13.4 | ) |
Long-term debt | | $ | 377.1 | | | $ | 358.7 | |
On March 25, 2019, the Company and certain subsidiaries of the Company (the “Loan Parties”) entered into a credit agreement (the “ABL Credit Agreement”) with JP Morgan Chase Bank, N.A. as administrative and collateral agent, and certain financial institutions party thereto as lenders, providing for a senior secured asset-based revolving credit facility (the “ABL Revolving Credit Facility”) of up to $275.0 million. The borrowing capacity under the ABL Revolving Credit Facility is based on the value of inventory, accounts receivable and certain fixed assets of the Loan Parties. The Loan Parties’ obligations under the ABL Revolving Credit Facility are secured on a first-priority basis, subject to certain exceptions and permitted liens, by substantially all of the personal property and fee-owned real property of the Loan Parties. The liens securing the ABL Revolving Credit Facility are senior in priority to the second-priority liens securing the obligations under the 2031 Notes and the related guarantees. The ABL Revolving Credit Facility includes a $75.0 million letter of credit sub-facility, $10.0 million of
which is available to the Company’s German subsidiary that is a borrower under the ABL Revolving Credit Facility (the “German Borrower”).
On June 17, 2021, the Company amended the ABL Credit Agreement to adjust certain negative covenants which reduced restrictions on the Company’s ability to expand its rental business. On May 19, 2022, the Company further amended the ABL Credit Agreement to (i) extend the maturity date to May 19, 2027 (subject to a springing maturity date of December 30, 2025 if our senior secured lien notes due April 1, 2026 have not been repaid in full or refinanced prior to December 30, 2025), (ii) permit the inclusion, subject to certain limitations, of the crane rental assets of certain subsidiaries in the borrowing base used to calculate availability under the ABL Credit Agreement, (iii) permit separate financing of crane rental assets not included in the borrowing base and (iv) replace U.S. dollar London Inter-bank Offered Rate with interest rates based on the secured overnight financing rate plus a credit spread adjustment (“SOFR”).
On September 18, 2024, the Company further amended the ABL Credit Agreement to (i) increase the aggregate commitment by $50.0 million to a total aggregate commitment of up to $325.0 million, of which $100.0 million is available to the German Borrower, (ii) increase the swingline sublimit by $20.0 million to an aggregate $50.0 million, of which $20.0 million is available to the German Borrower, and (iii) extend the maturity date to September 18, 2029.
Borrowings under the ABL Revolving Credit Facility bear interest at a variable rate using either the Alternate Base Rate or Term Benchmark, Applicable Overnight Rate, Central Bank Rate ("CBR") or RFR rate (each as defined in the ABL Credit Agreement) plus the applicable spread set forth below. The variable interest rate is based upon the average availability as of the most recent determination date as follows:
| | | |
| Average quarterly availability | Alternative Base Rate spread | Term Benchmark, Applicable Overnight Rate, CBR and RFR spread |
Category 1 | ≥ 66% of Aggregate Commitment | 0.25% | 1.25% |
Category 2 | < 66% but ≥ 33% of Aggregate Commitment | 0.50% | 1.50% |
Category 3 | < 33% of Aggregate Commitment | 0.75% | 1.75% |
As of December 31, 2024 and 2023, the Company had $79.0 million and $60.0 million, respectively, of borrowings outstanding under the ABL Revolving Credit Facility. During the period from September 18, 2024 to June 30, 2025, the spreads for Term Benchmark, Applicable Overnight Rate, CBR and RFR spread and Alternative Base Rate borrowings are deemed to be in Category 2. Excess availability as of December 31, 2024 was $242.6 million, which represents revolver borrowing capacity of $325.0 million less $79.0 million in borrowings outstanding and U.S. letters of credit outstanding of $3.4 million.
During the year ended December 31, 2024, the highest daily borrowing under the ABL Revolving Credit Facility was $173.0 million and the average borrowing was $120.5 million, while the weighted-average annual interest rate was 6.47%. During the year ended December 31, 2023, the highest daily borrowing under the ABL Revolving Credit Facility was $119.6 million and the average borrowing was $103.4 million, while the weighted-average annual interest rate was 5.21%.
As of December 31, 2024, the Company had outstanding $16.4 million of other indebtedness that has a weighted-average interest rate of approximately 4.90%. This debt includes balances on local credit lines, overdraft facilities, and other financing arrangements. The overdraft facilities are composed of five Euro facilities totaling €37.0 million and one Chinese Yuan facility totaling ¥30.0 million. Total U.S. dollar availability as of December 31, 2024 for the six overdraft facilities is $42.4 million, with $12.1 million outstanding.
On September 19, 2024, the Company and certain of its subsidiaries entered into an indenture with U.S. Bank Trust Company, National Association as trustee and notes collateral agent, pursuant to which the Company issued $300.0 million aggregate principal amount of the 2031 Notes with an annual coupon rate of 9.25%. Interest on the 2031 Notes is payable in cash semi-annually in arrears on April 1 and October 1 of each year. The 2031 Notes are fully and unconditionally guaranteed on a senior secured second lien basis, jointly and severally, by each of the Company’s existing and future domestic subsidiaries that is either a guarantor or a borrower under the ABL Revolving Credit Facility or that guarantees certain other debt of the Company or a guarantor. The 2031 Notes and the related guarantees are secured on a second-priority basis, subject to certain exceptions and permitted liens, by pledges of capital stock and other equity interests and other security interests in substantially all of the
personal property and fee-owned real property of the Company and of the guarantors that secure obligations under the ABL Revolving Credit Facility. The Company used the net proceeds from this offering, together with cash on hand, to redeem all of its outstanding 9.00% senior secured second lien notes due 2026.
For the year ended December 31, 2024, the Company recorded a $1.1 million non-cash charge in other income (expense) – net in the Consolidated Statement of Operations associated with the Company’s refinancing of the ABL Revolving Credit Facility and 2031 Notes. The charge is related to unamortized debt issuance costs on the prior $300.0 million senior secured second lien notes due April 1, 2026.
Both the ABL Revolving Credit Facility and the 2031 Notes include customary covenants which include, without limitation, restrictions on the Company’s ability and the ability of the Company’s restricted subsidiaries to incur, assume or guarantee additional debt or issue certain preferred shares, pay dividends on or make other distributions in respect of the Company’s capital stock or make other restricted payments, make certain investments, sell or transfer certain assets, create liens on certain assets to secure debt, consolidate, merge, sell, or otherwise dispose of all or substantially all of the Company’s assets, enter into certain transactions with affiliates and designate the Company’s subsidiaries as unrestricted. Both the ABL Revolving Credit Facility and the 2031 Notes also include customary events of default. The ABL Revolving Credit Facility has customary representations and warranties including, as a condition to borrowing, that all such representations and warranties are true and correct, in all material respects, on the date of the borrowing, including representations as to no material adverse change in the Company’s business or financial condition since December 31, 2021.
Additionally, the ABL Revolving Credit Facility contains a covenant requiring the Company to maintain a minimum fixed charge coverage ratio under certain circumstances set forth in the ABL Credit Agreement.
The aggregate scheduled future maturities of outstanding debt obligations as of December 31, 2024 is summarized as follows:
| | | | |
Year | | Maturities | |
2025 | | $ | 13.1 | |
2026 | | | 0.8 | |
2027 | | | 0.9 | |
2028 | | | 0.9 | |
2029 | | | 79.7 | |
Thereafter | | | 300.0 | |
Total | | $ | 395.4 | |
The table of scheduled maturities above does not agree to the Company’s total debt as of December 31, 2024 as shown on the Consolidated Balance Sheet due to $5.2 million of deferred financing costs associated with the 2031 Notes.
As of December 31, 2024, the Company was in compliance with all affirmative and negative covenants in its debt instruments, inclusive of the financial covenants pertaining to the ABL Revolving Credit Facility and the 2031 Notes. Based upon management’s current plans and outlook, the Company believes it will be able to comply with these covenants during the subsequent twelve months.
11. Accounts Receivable Factoring
The Company has two non-U.S. accounts receivable financing programs with no maximum availability. Transactions under the non-U.S. programs were accounted for as sales in accordance with ASC 860, “Transfers and Servicing.” Under these financing programs, the Company has the ability to sell eligible receivables up to the customer's maximum limit.
For the years ended December 31, 2024 and 2023, cash proceeds from the factoring of accounts receivable qualifying as sales were $169.8 million and $163.5 million, respectively.
Financing charges incurred from the factoring of accounts receivable qualifying as sales for the year ended December 31, 2024, 2023, and 2022 were immaterial.
12. Income Taxes
Income (loss) before income taxes for the years ended December 31, 2024, 2023, and 2022 is summarized as follows:
| | | | | | | | | | | | |
| | 2024 | | | 2023 | | | 2022 | |
Income (loss) before income taxes: | | | | | | | | | |
United States | | $ | 7.5 | | | $ | (32.7 | ) | | $ | (203.8 | ) |
Foreign | | | 4.2 | | | | 76.9 | | | | 83.6 | |
Total | | $ | 11.7 | | | $ | 44.2 | | | $ | (120.2 | ) |
Provision (benefit) for income taxes for the years ended December 31, 2024, 2023, and 2022 is summarized as follows:
| | | | | | | | | | | | |
| | 2024 | | | 2023 | | | 2022 | |
Current: | | | | | | | | | |
United States federal and state | | $ | 0.4 | | | $ | 0.3 | | | $ | (11.7 | ) |
Foreign | | | 11.1 | | | | 10.7 | | | | 10.9 | |
Total current | | | 11.5 | | | | 11.0 | | | | (0.8 | ) |
Deferred: | | | | | | | | | |
United States federal and state | | | (55.1 | ) | | | — | | | | (2.4 | ) |
Foreign | | | (0.5 | ) | | | (6.0 | ) | | | 6.6 | |
Total deferred | | | (55.6 | ) | | | (6.0 | ) | | $ | 4.2 | |
Provision (benefit) for income taxes | | $ | (44.1 | ) | | $ | 5.0 | | | $ | 3.4 | |
The items accounting for the difference between income taxes computed at the United States federal statutory rate and the Company's effective rate for the years ended December 31, 2024, 2023, and 2022 is summarized as follows:
| | | | | | | | | | | | |
| | 2024 | | | 2023 | | | 2022 | |
Federal income tax at statutory rate | | $ | 2.5 | | | $ | 9.3 | | | $ | (25.2 | ) |
State income tax provision | | | 1.0 | | | | 2.0 | | | | 0.9 | |
Manufacturing and research incentives | | | (1.4 | ) | | | (1.3 | ) | | | (0.5 | ) |
Taxes on foreign income which differ from the federal
statutory rate | | | (0.1 | ) | | | 9.1 | | | | (1.9 | ) |
Adjustments for unrecognized tax benefits | | | 5.6 | | | | 0.2 | | | | (11.0 | ) |
Adjustments to valuation allowances | | | (61.0 | ) | | | (28.6 | ) | | | 5.2 | |
United States tax reform | | | 0.4 | | | | 10.1 | | | | 4.8 | |
Goodwill and indefinite-lived intangible asset impairment | | | — | | | | — | | | | 31.7 | |
Audit settlements | | | — | | | | (3.0 | ) | | | — | |
Non-deductible expenses | | | 8.8 | | | | 8.2 | | | | 1.6 | |
Other items | | | 0.1 | | | | (1.0 | ) | | | (2.2 | ) |
Provision (benefit) for income taxes | | $ | (44.1 | ) | | $ | 5.0 | | | $ | 3.4 | |
For the year ended December 31, 2024, the benefit for income taxes was primarily driven by a $57.5 million net reduction of the valuation allowance. The benefit was partially offset by an increase of $5.6 million in the reserve for unrecognized tax benefits. For the year ended December 31, 2023, the provision for income taxes was favorably impacted by the release of a $19.0 million valuation allowance and a $3.2 million tax benefit for the favorable resolution of a previously reserved foreign income tax matter. These benefits were partially offset by the tax effect of $8.2 million related to non-deductible expenses. For the year ended December 31, 2022, the benefit for income taxes related to unrecognized tax benefits was primarily driven by a release of a $12.1 million uncertain tax position, inclusive of $1.2 million of interest, related to U.S. Federal tax planning strategies implemented as a result of the Coronavirus Aid, Relief and Economic Security Act. There were no significant items included in “other items” for the years ended December 31, 2024, 2023, 2022.
For the years ended December 31, 2024, 2023, and 2022, the Company recorded a net income tax inclusion for global intangible low-taxed income (“GILTI”) in the amount of $2.1 million, $48.0 million, and $22.9 million respectively. The GILTI inclusion for each respective year is reflective of the final regulations issued in 2020 relating to Internal Revenue Code Section 951A and the treatment of foreign income subject to a high tax rate.
As of each reporting date, the Company considers new evidence, both positive and negative, that could impact its assessment related to future realization of deferred tax assets. The benefit for income taxes for the year ended December 31, 2024 includes
a $57.5 million income tax benefit from the reduction of a valuation allowance. The provision for income taxes for the year ended December 31, 2023 includes a $19.0 million income tax benefit for the release of a valuation allowance. The income tax provision for the year ended December 31, 2022 includes a $1.2 million income tax benefit for the release of a valuation allowance. As of December 31, 2024, the Company has recorded valuation allowances on deferred tax assets for certain legal entities in Brazil, Chile, Russia, the U.K. and the United States as it is more likely than not that the assets will not be realized.
Temporary differences and carryforwards that give rise to deferred tax assets and liabilities are summarized as follows:
| | | | | | | | |
| | 2024 | | | 2023 | |
Deferred income tax assets: | | | | | | |
Inventories | | $ | 15.8 | | | $ | 14.7 | |
Deferred employee benefits | | | 25.6 | | | | 27.8 | |
Product warranty reserves | | | 6.3 | | | | 7.8 | |
Product liability reserves | | | 0.2 | | | | 2.6 | |
Tax credits | | | 8.5 | | | | 7.9 | |
Loss and other tax attribute carryforwards | | | 111.0 | | | | 114.1 | |
Deferred revenue | | | 2.0 | | | | 3.9 | |
Capitalized research costs | | | 13.5 | | | | 10.5 | |
Other | | | 17.5 | | | | 12.5 | |
Total deferred income tax assets | | | 200.4 | | | | 201.8 | |
Less valuation allowance | | | (73.4 | ) | | | (130.8 | ) |
Net deferred income tax assets | | $ | 127.0 | | | $ | 71.0 | |
Deferred income tax liabilities | | | | | | |
Property, plant, and equipment | | $ | 23.5 | | | $ | 25.6 | |
Intangible assets | | | 27.2 | | | | 28.5 | |
Total deferred income tax liabilities | | $ | 50.7 | | | $ | 54.1 | |
Net deferred income tax assets | | $ | 76.3 | | | $ | 16.9 | |
| | | | | | |
The net deferred tax assets reflected in the Consolidated Balance Sheets for the years ended December 31, 2024 and 2023 are summarized as follows:
| | | | | | | | |
| | 2024 | | | 2023 | |
Long-term income tax assets, included in
other non-current assets | | $ | 78.4 | | | $ | 24.4 | |
Long-term deferred income tax liability | | | (2.1 | ) | | | (7.5 | ) |
Net deferred income tax asset | | $ | 76.3 | | | $ | 16.9 | |
The Company believes that certain offshore cash can be accessed in a tax efficient manner and therefore, as of December 31, 2024, deferred taxes were not provided on approximately $182.7 million of unremitted earnings of foreign subsidiaries that may be remitted to the United States without material tax cost. The Company had approximately $403.1 million and $397.4 million of cumulative foreign earnings as of December 31, 2024 and December 31, 2023, respectively, which are asserted to be permanently reinvested. Determination of the amount of unrecognized deferred tax liability related to these earnings is not practicable.
As of December 31, 2024, the Company had approximately $72.1 million of federal net operating loss carryforwards, which are available to reduce future federal tax liabilities. The full amount is not subject to any time restrictions for future use. As of December 31, 2023, the Company had approximately $96.4 million of federal net operating loss carryforwards, which were available to reduce future federal tax liabilities. However, utilization of the 2024 and 2023 indefinite lived loss carryforwards is limited annually to 80% of adjusted taxable income. The carryforward was previously offset by a valuation allowance as of December 31, 2023 and 2022.
As of December 31, 2024 and 2023, the Company had approximately $40.7 million and $43.2 million, respectively, of federal interest expense carryforward that is not subject to any time restrictions for future use. The utilization of the interest expense carryforward is limited annually to 30% of adjusted taxable income. The carryforward is offset by a full valuation allowance as of December 31, 2024 and 2023.
As of December 31, 2024 and 2023, the Company had approximately $682.7 million and $616.1 million, respectively, of state net operating loss carryforwards, which are available to reduce future state tax liabilities. As of December 31, 2024, these state net operating loss carryforwards expire at various times through 2044, respectively. As of December 31, 2024, $669.2 million of the carryforward is offset by a partial valuation allowance. As of December 31, 2023, the full amount is offset by a valuation allowance.
As of December 31, 2024 and 2023, the Company had approximately $208.5 million and $212.4 million, respectively, of foreign loss carryforwards, which are available to reduce future foreign tax liabilities. Substantially all the foreign loss carryforwards have an indefinite carryforward period of which $55.5 million is offset by a valuation allowance as of December 31, 2024 and $48.8 million as of December 31, 2023.
The Company or one of its subsidiaries files income tax returns in the United States and certain foreign jurisdictions. The following table provides the open tax years for which the Company could be subject to income tax examination by the tax authorities in its major jurisdictions:
| | |
Jurisdiction | | Open Years |
U.S. federal | | 2016 — 2024 |
China | | 2015 — 2024 |
France | | 2021 — 2024 |
Germany | | 2018 — 2024 |
The Company regularly assesses the likelihood of an adverse outcome resulting from examinations to determine the adequacy of its tax reserves. As of December 31, 2024, the Company believes that it is more likely than not that the tax positions taken will be sustained upon the resolution of audits resulting in no material impact on its consolidated financial position and the results of operations and cashflows. However, the final determination with respect to any tax audits, including any related litigation costs, settlements, penalties and/or interest assessments, could be materially different from the Company’s accruals and could have a material effect on its financial position, results of operations, and/or cashflows in the periods for which that determination is made.
During the years ended December 31, 2024, 2023, and 2022, the Company recorded an increase (decrease) to the gross unrecognized tax benefits including interest and penalties of $5.4 million, $0.2 million, and $(11.0) million, respectively, of which $0.6 million, $0.2 million, and $(1.7) million, respectively, are a result of adjustments to interest and penalties. Interest and penalties are recognized as a component of income tax expense.
A reconciliation of the beginning and ending amount of unrecognized tax benefits excluding interest and penalties as of December 31, 2024, 2023, and 2022 is summarized as follows:
| | | | | | | | | | | | |
| | 2024 | | | 2023 | | | 2022 | |
Balance at beginning of year | | $ | 9.1 | | | $ | 9.1 | | | $ | 18.4 | |
Additions for tax positions of current year | | | 2.2 | | | | 0.1 | | | | 0.1 | |
Additions for tax positions of prior years | | | 3.3 | | | | 0.1 | | | | 3.6 | |
Reductions for tax positions of prior years | | | (0.2 | ) | | | — | | | | (11.0 | ) |
Reductions based on settlements with tax
authorities | | | — | | | | — | | | | — | |
Reductions for lapse of statute of limitations | | | (0.5 | ) | | | (0.2 | ) | | | (2.0 | ) |
Balance at end of year | | $ | 13.9 | | | $ | 9.1 | | | $ | 9.1 | |
As of December 31, 2024, 2023, and 2022, the Company recorded interest and penalties of $2.0 million, $1.4 million, and $1.2 million, respectively.
The amount of the unrecognized tax benefits that would affect the effective tax rate, if recognized, was approximately $11.9 million as of December 31, 2024.
It is reasonably possible that the unrecognized tax benefits could significantly change over the next 12 months. However, due to the highly uncertain nature of resolution and closure on audits, we are unable to estimate the range of impact at this time.
13. Net Income (Loss) Per Common Share
The following is a reconciliation of the weighted average common shares outstanding used to compute basic and diluted net income (loss) per common share:
| | | | | | | | | | | | |
| | 2024 | | | 2023 | | | 2022 | |
Basic weighted average common shares outstanding | | | 35,221,758 | | | | 35,093,963 | | | | 35,184,336 | |
Effect of dilutive securities - equity
compensation awards | | | 487,024 | | | | 868,815 | | | | — | |
Diluted weighted average common shares outstanding | | | 35,708,782 | | | | 35,962,778 | | | | 35,184,336 | |
Equity compensation awards for which total employee proceeds from exercise exceed the average fair value of the same equity incentive instrument over the period have an anti-dilutive effect on earnings per share during periods with net income, and accordingly, are excluded from diluted weighted average common shares outstanding. Anti-dilutive equity instruments of 1,037,975 and 431,392 common shares were excluded from the computation of diluted net income per share for the years ended December 31, 2024 and 2023, respectively. Due to the net loss during the year ended December 31, 2022, the assumed exercise of all equity instruments was anti-dilutive and, therefore, not included in the diluted loss per share calculation for the period.
No cash dividends were declared or paid as of December 31, 2024, 2023, and 2022.
14. Equity
Authorized capitalization consists of 75.0 million shares of $0.01 par value common stock and 3.5 million shares of $0.01 par value preferred stock. None of the preferred shares have been issued.
As of December 31, 2024, the Company has authorization from the Board of Directors to purchase up to $35.0 million of the Company's common stock at management's discretion. During 2024, the Company repurchased 455,942 shares of the Company's common stock for $5.7 million under this authorization. As of December 31, 2024, the Company has $29.3 million remaining under this authorization.
As of December 31, 2023, the Company released $9.3 million of non-cash foreign currency translation adjustments recorded in accumulated other comprehensive loss on the Consolidated Balance Sheets to other income (expense) – net in the Consolidated Statement of Operations as a result of the substantial curtailment of its Russia operations. The results of the Company’s Russian operations continue to be included in its consolidated results in accordance with ASC 810, “Consolidation.”
The components of accumulated other comprehensive loss as of December 31, 2024 and 2023 are summarized as follows:
| | | | | | | | |
| | 2024 | | | 2023 | |
Foreign currency translation, net of income tax
benefit of $2.3 and $0.2 | | $ | (98.2 | ) | | $ | (77.4 | ) |
Derivative instrument fair market value, net of income
tax benefit of $1.0 and $0.0 | | | (1.7 | ) | | | 1.3 | |
Employee pension and postretirement benefit adjustments,
net of income tax benefit of $12.3 and $13.6 | | | (7.7 | ) | | | (10.3 | ) |
Total accumulated other comprehensive loss | | $ | (107.6 | ) | | $ | (86.4 | ) |
A reconciliation of the changes in accumulated other comprehensive loss, net of income tax, by component as of December 31, 2024 and 2023 are summarized as follows:
| | | | | | | | | | | | | | | | |
| | Gains (Losses) on
Cash Flow Hedges | | | Pension &
Postretirement | | | Foreign
Currency
Translation | | | Total | |
Balance as of December 31, 2022 | | $ | 5.4 | | | $ | (15.3 | ) | | $ | (98.0 | ) | | $ | (107.9 | ) |
Other comprehensive income (loss) before
reclassifications | | | (1.8 | ) | | | 2.4 | | | | 11.3 | | | | 11.9 | |
Amounts reclassified from accumulated other
comprehensive loss | | | (2.3 | ) | | | 2.6 | | | | 9.3 | | | | 9.6 | |
Net other comprehensive income (loss) | | | (4.1 | ) | | | 5.0 | | | | 20.6 | | | | 21.5 | |
Balance as of December 31, 2023 | | | 1.3 | | | | (10.3 | ) | | | (77.4 | ) | | | (86.4 | ) |
Other comprehensive income (loss) before
reclassifications | | | (4.7 | ) | | | 2.4 | | | | (20.8 | ) | | | (23.1 | ) |
Amounts reclassified from accumulated other
comprehensive loss | | | 1.7 | | | | 0.2 | | | | — | | | | 1.9 | |
Net other comprehensive income (loss) | | | (3.0 | ) | | | 2.6 | | | | (20.8 | ) | | | (21.2 | ) |
Balance as of December 31, 2024 | | $ | (1.7 | ) | | $ | (7.7 | ) | | $ | (98.2 | ) | | $ | (107.6 | ) |
A reconciliation of the reclassifications out of accumulated other comprehensive loss, net of income taxes, for the years ended December 31, 2024, 2023, and 2022 are summarized as follows:
| | | | | | | | | | | | | | |
| | Amount Reclassified from Accumulated Other Comprehensive Loss | | | |
| | 2024 | | | | 2023 | | | | 2022 | | | Recognized
Location |
Gain (losses) on cash flow hedges | | | | | | | | | | | |
FX Forward Contracts | | $ | (1.7 | ) | | $ | 2.3 | | | $ | (5.8 | ) | | Cost of sales |
Total before income taxes | | | (1.7 | ) | | | 2.3 | | | | (5.8 | ) | | |
Provision for income taxes | | | — | | | | — | | | | — | | | |
Total, net of income taxes | | $ | (1.7 | ) | | $ | 2.3 | | | $ | (5.8 | ) | | |
Amortization of pension and
postretirement items | | | | | | | | | | | |
Actuarial losses | | $ | (0.3 | ) | | $ | (2.6 | ) | | $ | (2.9 | ) | (a) | Other income (expense) - net |
Amortization of prior service cost | | | (0.1 | ) | | | (0.1 | ) | | | 1.3 | | (a) | Other income (expense) - net |
Pension settlement gain | | | 0.1 | | | | 0.1 | | | | 0.1 | | (a) | Other income (expense) - net |
Total before income taxes | | | (0.3 | ) | | | (2.6 | ) | | | (1.5 | ) | | |
Benefit for income taxes | | | 0.1 | | | | — | | | | — | | | |
Total, net of income taxes | | $ | (0.2 | ) | | $ | (2.6 | ) | | $ | (1.5 | ) | | |
Foreign currency translation | | | | | | | | | | | |
Losses on foreign currency translation | | $ | — | | | $ | (9.3 | ) | | $ | — | | | |
Total before income taxes | | | — | | | | (9.3 | ) | | | — | | | |
Provision for income taxes | | | — | | | | — | | | | — | | | |
Total, net of income taxes | | $ | — | | | $ | (9.3 | ) | | $ | — | | | |
| | | | | | | | | | | |
Total reclassifications for the period, net
of income taxes | | $ | (1.9 | ) | | $ | (9.6 | ) | | $ | (7.3 | ) | | |
(a)These accumulated other comprehensive loss components are components of net periodic pension cost (refer to Note 19, “Employee Benefit Plans,” for further details).
15. Stock-Based Compensation
The Company’s 2013 Omnibus Incentive Plan (the “2013 Omnibus Plan”) was approved by shareholders on May 7, 2013. The 2013 Omnibus Plan provides for both short-term and long-term incentive awards for employees and non-employee directors.
Stock-based awards may take the form of stock options, stock appreciation rights, restricted stock, restricted stock units, and performance share or performance unit awards.
The Company recognizes expense net of estimated future forfeitures for all stock-based compensation on a straight-line basis over the vesting period of the entire award. Estimated future forfeitures are based on the Company’s historical experience.
During the years ended December 31, 2024, 2023, and 2022, the Company recorded stock-based compensation expense of $10.9 million, $11.5 million, and $8.5 million, respectively, in engineering, selling, and administrative expense in the Consolidated Statement of Operations. The Company recognizes stock-based compensation expense over the award’s vesting period, subject to retirement, death, or disability provisions of the 2013 Omnibus Incentive Plan.
Shares are issued out of treasury stock upon exercise for stock options and vesting of restricted stock units and performance share units.
Stock Options
Stock option grants to employees are exercisable in three annual increments over a three-year period beginning on the first anniversary of the grant date and expire 10 years subsequent to the grant date.
The Company did not grant employees stock options in 2024, 2023, or 2022. Stock-based compensation expense is calculated by estimating the fair value of non-qualified stock options at the time of grant and is amortized over the stock options’ vesting period. The Company recognized no expense before income taxes associated with stock options during the years ended December 31, 2024 and 2023 and $0.1 million of expense during the year ended December 31, 2022.
The activity for stock options is summarized as follows:
| | | | | | | | | | | | |
| | Shares | | | Weighted
Average
Exercise Price Per Share | | | Aggregate
Intrinsic
Value | |
Options outstanding as of December 31, 2023 | | | 494,370 | | | $ | 21.47 | | | | |
Granted | | | — | | | | — | | | | |
Exercised | | | — | | | | — | | | | |
Forfeited | | | — | | | | — | | | | |
Cancelled | | | (23,906 | ) | | | 23.47 | | | | |
Options outstanding as of December 31, 2024 | | | 470,464 | | | $ | 21.37 | | | $ | — | |
| | | | | | | | | |
Options exercisable as of December 31, 2024 | | | 470,464 | | | $ | 21.37 | | | $ | — | |
Restricted Stock Units
The Company granted 461,632, 520,132, and 413,543 restricted stock units inclusive of director awards in 2024, 2023, and 2022, respectively. A total of 78,894, 77,576, and 56,640 equity compensation awards were granted to directors in 2024, 2023, and 2022, respectively, which vested immediately upon the grant date. The Company recognized $6.4 million, $6.3 million, and $5.2 million of compensation expense associated with restricted stock units during the years ended December 31, 2024, 2023, and 2022, respectively.
With the exception of director grants, the restricted stock units are earned based on service over the vesting period. Restricted stock units granted to employees vest in three annual increments over a three-year period beginning on the first anniversary of the grant date. The expense is based on the fair value of the Company's shares as of the grant date which is the grant date closing stock price.
The activity for restricted stock units is summarized as follows:
| | | | | | | | |
| | Shares | | | Weighted
Average
Grant Date
Fair Value Per Share | |
Unvested as of December 31, 2023 | | | 805,462 | | | $ | 15.37 | |
Granted | | | 461,632 | | | | 13.38 | |
Vested | | | (405,309 | ) | | | 15.73 | |
Forfeited | | | (21,991 | ) | | | 16.06 | |
Unvested as of December 31, 2024 | | | 839,794 | | | $ | 14.07 | |
As of December 31, 2024, the Company has $5.7 million of unrecognized compensation expense before income tax and net of estimated forfeitures related to restricted stock units which will be recognized over a weighted average period of 1.7 years.
Performance Share Units
The Company granted 365,174, 316,022, and 122,280 of performance share units in 2024, 2023, and 2022, respectively. The performance share units are earned based on service over the vesting period and only to the extent to which performance goals are met over the applicable three-year performance period. The performance goals vary for performance share units each grant year. The Company recognized $4.5 million, $5.2 million, and $3.2 million of compensation expense associated with performance share units during the years ended December 31, 2024, 2023, and 2022, respectively.
The performance goals for the performance share units granted in 2024 are weighted 60% on the 3-year average of the Company's adjusted return on invested capital ("Adjusted ROIC") percentage from 2024 to 2026 and 40% on cumulative non-new machine sales from January 1, 2024 through December 31, 2026. The Company defines non-new machine sales as parts sales, used crane sales, rental revenue, service revenue, and other revenue. The 2024 performance share units include a +/-20% modifier weighted on total shareholder return relative to a defined peer group of companies during the three-year performance period, not to exceed 200% of target shares granted.
The performance goals for the performance share units granted in 2023 are weighted 60% on the 3-year average of the Company’s adjusted EBITDA percentage from 2023 to 2025 and 40% on cumulative non-new machine sales from January 1, 2023 through December 31, 2025. The 2023 performance share units include a +/-20% modifier weighted on total shareholder return relative to a defined peer group of companies during the three-year performance period, not to exceed 200% of target shares granted.
The performance goals for the performance share units granted in 2022 are weighted 60% on the 3-year average of the Company’s adjusted EBITDA percentage from 2022 to 2024 and 40% on non-new machine sales for the year ending December 31, 2024. The 2022 performance share units include a +/-20% modifier weighted on total shareholder return relative to a defined peer group of companies during the three-year performance period, not to exceed 200% of target shares granted.
The 2024 activity for performance share units is summarized as follows:
| | | | | | | | |
| | Shares | | | Weighted
Average
Grant Date Fair Value
Per Share | |
Unvested as of December 31, 2023 | | | 630,395 | | | $ | 17.39 | |
Granted (1) | | | 365,174 | | | | 14.34 | |
Adjustment for performance results achieved (2) | | | 154,145 | | | | 16.39 | |
Vested | | | (302,479 | ) | | | 16.39 | |
Forfeited | | | (21,121 | ) | | | 16.12 | |
Unvested as of December 31, 2024 | | | 826,114 | | | $ | 15.95 | |
(1)Performance shares granted assuming achievement of performance goals at target.
(2)Adjustment due to performance share units granted in 2021 and vested in 2024 where the number of shares achieved based on the three-year performance period ended December 31, 2023 were higher than target.
As of December 31, 2024, the Company has $5.7 million of unrecognized compensation expense before income tax and net of estimated forfeitures related to performance share units expected to be recognized over a weighted average period of 1.7 years.
The Company uses the Monte Carlo valuation model to determine fair value of the performance share unit grants. The Company used an average of historical stock prices of selected peers for its volatility assumption. The assumed risk-free rates were based on three-year U.S. Treasury rates in effect at the time of grant. The fair value of each performance share unit was estimated at the date of grant using the following assumptions:
| | | | | | | | | | | | |
| | 2024 | | | 2023 | | | 2022 | |
Correlation | | | 22.8 | % | | | 28.2 | % | | | 25.9 | % |
Risk-free interest rate | | | 4.5 | % | | | 4.1 | % | | | 1.7 | % |
Expected volatility | | | 51.2 | % | | | 60.3 | % | | | 59.5 | % |
Expected dividend yield | | | — | % | | | — | % | | | — | % |
16. Segments
The Company reports segment information based on the “management” approach. The management approach designates the internal reporting used by the President & CEO, who is also the Company’s Chief Operating Decision Maker (“CODM”), for making decisions about the allocation of resources and assessing performance as the source of the Company’s reportable operating segments.
The Company has three reportable segments: Americas, Europe and Africa (“EURAF”) and MEAP. The Americas reporting segment includes the North America and South America continents. The EURAF reporting segment includes the Europe and Africa continents, excluding the Middle East region. The MEAP reporting segment includes the Asia and Australia continents and the Middle East region.
The CODM evaluates the performance of its reportable segments based on net sales and operating income. Segment net sales are recognized in the geographic region the product is sold. Each reportable segment has new and non-new machine sales. Operating income for each segment includes net sales to third parties, cost of sales directly attributable to the segment, selling and administrative costs directly attributable to the segment, and engineering costs directly attributable to the segment. Manufacturing variances generated by the manufacturing locations within each operating segment are maintained in each segment’s operating income. Operating income for each segment excludes other income and expense and certain expenses managed outside the operating segments. Costs excluded from segment operating income include various corporate expenses such as stock-based compensation expenses, income taxes and other separately managed general and administrative costs. The Company does not include intercompany sales between segments for management reporting purposes. The CODM does not evaluate performance of the reportable segments based on total assets.
The following table shows information by reportable segment for the years ended December 31, 2024, 2023, and 2022:
| | | | | | | | | | | | | | | | | | | | | | | | | | | | | | | | | | | | | | | | | | | | | | | | |
| | Year Ended December 31, 2024 | | | Year Ended December 31, 2023 | | | Year Ended December 31, 2022 | |
| | Americas | | | EURAF | | | MEAP | | | Total | | | Americas | | | EURAF | | | MEAP | | | Total | | | Americas | | | EURAF | | | MEAP | | | Total | |
Revenues from external customers | | $ | 1,197.6 | | | $ | 616.0 | | | $ | 364.4 | | | $ | 2,178.0 | | | $ | 1,211.2 | | | $ | 669.6 | | | $ | 347.0 | | | $ | 2,227.8 | | | $ | 1,013.0 | | | $ | 761.5 | | | $ | 258.0 | | | $ | 2,032.5 | |
Less: (a) | | | | | | | | | | | | | | | | | | | | | | | | | | | | | | | | | | | | |
Cost of sales | | | 962.1 | | | | 541.1 | | | | 299.8 | | | | 1,803.0 | | | | 973.6 | | | | 557.8 | | | | 271.2 | | | | 1,802.6 | | | | | | | | | | | | | |
Engineering, selling, and administration costs | | | 127.8 | | | | 119.0 | | | | 24.4 | | | | 271.2 | | | | 123.0 | | | | 118.8 | | | | 23.2 | | | | 265.0 | | | | | | | | | | | | | |
Other segment items (b) | | | 4.0 | | | | 2.5 | | | | 0.8 | | | | 7.3 | | | | 2.9 | | | | 0.9 | | | | 0.3 | | | | 4.1 | | | | | | | | | | | | | |
Segment operating income (loss) | | | 103.7 | | | | (46.6 | ) | | | 39.4 | | | | 96.5 | | | | 111.7 | | | | (7.9 | ) | | | 52.3 | | | | 156.1 | | | | (88.8 | ) | | | (3.2 | ) | | | 40.2 | | | | (51.8 | ) |
| | | | | | | | | | | | | | | | | | | | | | | | | | | | | | | | | | | | |
Reconciliation of segment operating income (loss) | | | | | | | | | | | | | | | | | | | | | | | | | | | | | | | | | | | | |
Interest expense | | | | | | | | | | | | (38.3 | ) | | | | | | | | | | | | (33.9 | ) | | | | | | | | | | | | (31.6 | ) |
Amortization of deferred financing fees | | | | | | | | | | | | (1.4 | ) | | | | | | | | | | | | (1.3 | ) | | | | | | | | | | | | (1.4 | ) |
Other (income) expense - net | | | | | | | | | | | | (0.4 | ) | | | | | | | | | | | | (13.0 | ) | | | | | | | | | | | | 5.8 | |
Unallocated amounts: | | | | | | | | | | | | | | | | | | | | | | | | | | | | | | | | | | | | |
Other corporate expenses | | | | | | | | | | | | (44.7 | ) | | | | | | | | | | | | (63.6 | ) | | | | | | | | | | | | (41.3 | ) |
Restructuring (income) expense | | | | | | | | | | | | — | | | | | | | | | | | | | (0.1 | ) | | | | | | | | | | | | 0.1 | |
Income (loss) before income taxes | | | | | | | | | | | $ | 11.7 | | | | | | | | | | | | $ | 44.2 | | | | | | | | | | | | $ | (120.2 | ) |
| | | | | | | | | | | | | | | | | | | | | | | | | | | | | | | | | | | | |
Other Segment Disclosures | | | | | | | | | | | | | | | | | | | | | | | | | | | | | | | | | | | | |
Depreciation and amortization (c) | | | 33.4 | | | | 23.6 | | | | 2.8 | | | | 59.8 | | | | 32.1 | | | | 22.1 | | | | 2.4 | | | | 56.6 | | | | 35.4 | | | | 20.1 | | | | 2.2 | | | | 57.7 | |
Capital expenditures | | | 17.7 | | | | 25.1 | | | | 2.9 | | | | 45.7 | | | | 46.5 | | | | 28.5 | | | | 2.4 | | | | 77.4 | | | | 32.0 | | | | 27.7 | | | | 2.1 | | | | 61.8 | |
(a)The significant expense categories and amounts align with the segment-level information that is regularly provided to the CODM.
(b)Other segment items for each reportable segment includes:
Americas — amortization expense and restructuring expense.
EURAF — restructuring expense.
MEAP — restructuring expense.
(c)The amount of depreciation and amortization disclosed by reportable segment are included within cost of sales or engineering, selling, and administration costs, as applicable.
Net sales by geographic area for the years ended December 31, 2024, 2023, and 2022 and property, plant, and equipment as of December 31, 2024 and 2023 are summarized as follows:
| | | | | | | | | | | | | | | | | | | | |
| | Net Sales | | | Property, Plant, and Equipment | |
| | 2024 | | | 2023 | | | 2022 | | | 2024 | | | 2023 | |
United States | | $ | 1,060.7 | | | $ | 1,039.9 | | | $ | 906.4 | | | $ | 170.5 | | | $ | 158.1 | |
Europe | | | 598.7 | | | | 641.9 | | | | 740.1 | | | | 154.3 | | | | 183.8 | |
Other | | | 518.6 | | | | 546.0 | | | | 386.0 | | | | 21.4 | | | | 24.2 | |
Total | | $ | 2,178.0 | | | $ | 2,227.8 | | | $ | 2,032.5 | | | $ | 346.2 | | | $ | 366.1 | |
New machine and non-new machine sales for the years ended December 31, 2024, 2023, and 2022 are summarized as follows:
| | | | | | | | | | | | |
| | 2024 | | | 2023 | | | 2022 | |
New machine sales | | $ | 1,548.9 | | | $ | 1,615.1 | | | $ | 1,487.2 | |
Non-new machine sales | | | 629.1 | | | | 612.7 | | | | 545.3 | |
Total net sales | | $ | 2,178.0 | | | $ | 2,227.8 | | | $ | 2,032.5 | |
17. Commitments and Contingencies
The Company is subject to various legal proceedings and claims that have arisen in the ordinary course of business which have not been fully resolved. The outcome of any litigation is inherently uncertain. When a loss related to a legal proceeding or claim is probable and reasonably estimable, the Company accrues its best estimate for the ultimate resolution of the matter.
As of December 31, 2024, various product-related lawsuits were pending. To the extent permitted under applicable law, all of these are insured with self-insurance retention levels. The Company’s self-insurance retention levels have varied over the last 10 years. As of December 31, 2024, the largest self-insured retention level for new occurrences currently maintained by the Company is $3.0 million per occurrence and applies to product liability claims arising in North America.
As of December 31, 2024, current and long-term product liability reserves were $1.4 million and $5.0 million, respectively. As of December 31, 2023, current and long-term product liabilities reserves were $11.4 million and $5.1 million, respectively. Current product liability reserves are included within other liabilities and long-term product liability reserves are included within other non-current liabilities in the Consolidated Balance Sheets. These amounts are not reduced for insurance recoveries for claims above the Company's self-insured retention level. As of December 31, 2024 and December 31, 2023, the Company had zero and $3.9 million, respectively, of estimated insurance recoveries included in the other current assets in the Consolidated Balance Sheets.
Reserves for product-related lawsuits were estimated using a combination of actual case reserves and actuarial methods. Based on the Company’s experience in defending product liability claims, management believes the reserves are adequate for estimated case resolutions on aggregate self-insured claims and insured claims. Any recoveries from insurance carriers are dependent upon the legal sufficiency of claims and solvency of insurance carriers.
As of December 31, 2024 and 2023, the Company had reserved $45.3 million and $56.8 million, respectively, for warranty and other related claims included in product warranties and other non-current liabilities in the Consolidated Balance Sheets. Certain of these warranty and other related claims involve matters in dispute that ultimately are resolved by negotiation, arbitration, or litigation. Refer to Note 18, “Guarantees,” for further information.
It is reasonably possible that the estimates for warranty and other related claims, product liability, asbestos-related claims and other various legal matters may change based upon new information that may arise or matters that are beyond the scope of the Company’s historical experience. Presently, there are no reliable methods to estimate the amount of any such potential changes. The ultimate resolution of these matters, individually and in the aggregate, is not expected to have a material adverse effect on the Company’s financial condition, results of operations or cash flows.
In July 2017, the Company received an Information Request from the United States Environmental Protection Agency (“U.S. EPA”) relating to the sales of cranes manufactured between January 1, 2014 and July 31, 2017 and the Company’s related participation in the Transition Program for Equipment Manufacturers (the “TPEM” program). The TPEM program allowed equipment manufacturers to delay installing engines meeting Tier 4 final emission standards in their products, subject to certain percentage allowance restrictions.
As of December 31, 2024, the Company agreed to the terms of a Consent Decree with the U.S. EPA and the U.S. Department of Justice regarding alleged violations of the TPEM. The Consent Decree has been lodged in the federal district court for the Eastern District of Wisconsin and the public comment period has ended. The proposed Consent Decree provides that the Company pay a civil penalty of $42.6 million and complete an emissions mitigation project upgrading a short-line locomotive engine in Maryland. Completion of the terms in the Consent Decree will settle this matter and release the Company from civil claims under the Clean Air Act related to the Company’s participation in the TPEM program.
As a result of the settlement, the Company recorded an additional charge of $8.9 million for the year ended December 31, 2024. The total recorded liability in accounts payable and accrued expenses in the Company’s Consolidated Balance Sheets was $45.0 million as of December 31, 2024, which accounts for the civil penalty and emissions mitigation project.
18. Guarantees
The Company periodically enters into transactions with customers that provide for buyback commitments. The Company evaluates each agreement at inception to determine if the customer has a significant economic incentive to exercise the buyback option. If it is determined that the customer has a significant economic incentive to exercise that right, the revenue is deferred and the agreement is accounted for as a lease in accordance with Topic 842. If it is determined that the customer does not have a significant economic incentive to exercise that right, then revenue is recognized when control of the product is transferred to the customer. The revenue deferred related to buyback obligations accounted for under Topic 842 included in other current and non-current liabilities as of December 31, 2024 and 2023 was $14.9 million and $32.2 million, respectively. The total amount of buyback commitments given by the Company and outstanding as of December 31, 2024 and 2023 was $29.9 million and $43.4 million, respectively. These amounts are not reduced for amounts the Company would recover from repossession and subsequent resale of the units. The buyback commitments expire at various times through 2032. The Company also has various loss guarantees with maximum liabilities of $14.3 million and $13.0 million as of December 31, 2024 and 2023, respectively. These amounts are not reduced for amounts the Company would recover from repossession and subsequent resale of the cranes securing the related guarantees.
In the normal course of business, the Company provides its customers a warranty covering workmanship, and in some cases materials, on products manufactured by the Company. Such warranties generally provide that products will be free from defects for periods ranging from 12 months to 60 months. In addition, the Company may incur other warranty related costs outside of its standard warranty period. Costs for other warranty related work are recorded in the period a loss is probable and can be reasonably estimated. Below is a table summarizing the warranty and other warranty related work for the years ended December 31, 2024, 2023, and 2022:
| | | | | | | | | | | | |
| | 2024 | | | 2023 | | | 2022 | |
Balance at beginning of period | | $ | 56.8 | | | $ | 58.0 | | | $ | 60.2 | |
Adjustments to accruals for warranties | | | 25.5 | | | | 28.9 | | | | 27.3 | |
Settlements made (in cash or in kind) during
the period | | | (35.5 | ) | | | (31.0 | ) | | | (27.8 | ) |
Currency translation | | | (1.5 | ) | | | 0.9 | | | | (1.7 | ) |
Balance at end of period | | $ | 45.3 | | | $ | 56.8 | | | $ | 58.0 | |
The long-term portion of the warranty liability is recorded in other non-current liabilities in the Consolidated Balance Sheets.
The Company sells extended warranty contracts, which it accounts for as a service type warranty under ASC Topic 606 – “Revenue from Contracts with Customers.” Revenue associated with extended warranty contracts is deferred and amortized on a straight-line basis over the duration of the extended warranty period. As of December 31, 2024 and 2023, there was $8.6 million and $6.1 million, respectively, of deferred revenue included in other current and non-current liabilities in the Consolidated Balance Sheets.
19. Employee Benefit Plans
The Company provides defined benefit pension plans, defined contribution plans, and/or other postretirement benefit plans to employees in many of the Company’s locations throughout the world. The Company’s defined benefit plans provide a benefit based on years of service and/or the employee’s average earnings near retirement. The Company’s defined contribution plans allow employees to contribute a portion of their salary to help save for retirement, and in most cases, the Company provides a matching contribution. The benefit obligation related to the Company’s non-U.S. defined benefit pension plans are for employees located primarily in Europe. For postretirement medical and other benefit plans, all of the Company’s benefit obligation is for employees located in the United States.
Defined contribution plans
The Company maintains two defined contribution retirement plans for its employees in the United States: (1) The Manitowoc Company, Inc. 401(k) Retirement Plan (the “Manitowoc 401(k) Plan”) and (2) The Manitowoc Deferred Compensation Plan. Each plan results in individual participant balances that reflect a combination of amounts contributed by the Company or deferred by the participant, amounts invested at the direction of either the Company or the participant, and the continuing reinvestment of returns until the accounts are distributed.
The Company also has various other non-U.S. defined contribution plans that allow eligible employees to contribute a portion of their salary to the plans. In most cases, the Company provides a matching contribution to the funds contributed by the employees. Company contributions to the plans are generally based upon formulas contained in the plans. Total costs incurred under the Non-U.S. defined contribution plans, and reported within the Consolidated Statement of Operations were $2.0 million, $1.7 million, and $1.7 million for the years ended December 31, 2024, 2023, and 2022, respectively.
Manitowoc 401(k) Plan
The Manitowoc 401(k) Plan is a tax-qualified retirement plan that is available to substantially all U.S. employees of Manitowoc, its subsidiaries, and related entities.
The Manitowoc 401(k) Plan allows employees to make both pre and after-tax elective deferrals, subject to certain limitations under the Internal Revenue Code of 1986, as amended (the “Tax Code”). The Company also has the right to make the following additional contributions: (1) a safe harbor matching contribution and (2) an additional contribution, which may or may not be made, at the full discretion of the Company and for which the value will be fully determined by the Company based on its performance. Each participant in the Manitowoc 401(k) Plan is allowed to direct the investment of that participant’s account among a diverse mix of investment funds, including a Company stock alternative. To the extent that any funds are invested in the Company’s stock, that portion of the Manitowoc 401(k) Plan is an employee stock ownership plan, as defined under the Tax Code (an “ESOP”).
The terms governing the retirement benefits under the Manitowoc 401(k) Plan are the same for the Company’s executive officers as they are for other eligible employees in the U.S.
Total costs incurred under this plan, and reported within the Consolidated Statement of Operations, were $9.3 million, $8.7 million and $11.9 million for the years ended December 31, 2024, 2023, and 2022, respectively.
Manitowoc Deferred Compensation Plan
The Manitowoc Deferred Compensation Plan is a non-qualified supplemental deferred compensation plan for highly compensated and key management employees and for non-employee directors of the Company. The Company maintains the Manitowoc Deferred Compensation Plan to allow eligible individuals to save for retirement in a tax-efficient manner despite Tax Code restrictions that would otherwise impair their ability to do so under the Manitowoc 401(k) Plan. The Manitowoc Deferred Compensation Plan also assists the Company in retaining those key employees and directors.
The Manitowoc Deferred Compensation Plan accounts are credited with: (1) elective deferrals made at the request of the individual participant; (2) a matching contribution for eligible wages above IRS employee compensation limits for 401(k) retirement plans; and/or (3) an additional contribution from the Company for each individual participant, which may or may not be made, at the full discretion of the Company based on its performance. Although unfunded within the meaning of the Tax Code, the Manitowoc Deferred Compensation Plan utilizes a rabbi trust to hold assets intended to satisfy the Company’s corresponding future benefit obligations. Each participant in the Manitowoc Deferred Compensation Plan is credited with earnings based upon individual elections from a diverse mix of investment funds that are intended to reflect investment funds similar to those offered under the Manitowoc 401(k) Plan, including the Company’s stock. Participants do not receive preferential or above-market rates of return under the Manitowoc Deferred Compensation Plan.
The Company has two separate investment programs: Program A and B, which allows participants to direct deferrals and Company contributions and restricts the Company’s use and access to the funds but are subject to the claims of the Company’s general creditors in rabbi trusts. Program A invests solely in the Company’s stock; dividends paid, if any, on the Company’s stock are automatically reinvested; and all distributions must be made in Company stock. Program B offers a variety of investment options but does not include Company stock as an investment option. All distributions from Program B must be made in cash. Participants cannot transfer assets between programs.
Program A is accounted for as a plan that does not permit diversification. As a result, the Company stock held by Program A is classified in equity in a manner similar to accounting for treasury stock. The deferred compensation obligation is classified as an equity instrument. Changes in the fair value of the Company’s stock and the compensation obligation are not recognized. The fair market value of the asset and corresponding obligation for Program A were $0.7 million and $1.2 million as of December 31, 2024 and 2023, respectively.
Program B is accounted for as a plan that permits diversification. As a result, the assets held by Program B are classified as an asset in the Consolidated Balance Sheets and changes in the fair value of the assets are recognized in earnings. The deferred compensation obligation is classified as a liability in the Consolidated Balance Sheets and adjusted to reflect changes in the fair value of the obligation. The assets, which are included in other non-current assets, and obligations, which are included in other non-current liabilities, were $8.8 million and $8.1 million as of December 31, 2024 and 2023, respectively.
Total costs incurred under this plan, and reported within the Consolidated Statement of Operations, for the years ended December 31, 2024, 2023, and 2022 were $0.4 million, $0.2 million and $0.4 million, respectively.
Pension, Postretirement Medical and Other Benefit Plans
The Company provides certain pension, postretirement medical, and other benefits (death benefits) for eligible retirees and their dependents in the U.S. under various frozen plans. Pension benefits are provided under the Manitowoc U.S. Pension Plan (“U.S. Pension Plan”). Certain pension benefits are funded, the postretirement medical benefits are not funded but are paid as incurred, and the death benefits are fully insured. Eligibility for coverage is based on meeting certain years of service and retirement qualifications. The healthcare benefits may be subject to deductibles, co-payment provisions, and other limitations. The Company has reserved the right to modify these benefits which have been frozen.
In addition to the U.S. Pension Plan, the Company also maintains defined benefit pension plans for various Non-US subsidiaries which are sponsored directly by the Company or its subsidiaries and offered only to employees or retirees of those subsidiaries (“Non-U.S. Pension Plans”). Certain Non-U.S. Pension Plans have frozen benefit accruals.
The components of periodic benefit costs for the years ended December 31, 2024, 2023, and 2022 are summarized as follows:
| | | | | | | | | | | | | | | | | | | | | | | | | | | | | | | | | | | | |
| | U.S. Pension Plan | | | Non-U.S. Pension Plans | | | Postretirement Medical
and Other | |
| | 2024 | | | 2023 | | | 2022 | | | 2024 | | | 2023 | | | 2022 | | | 2024 | | | 2023 | | | 2022 | |
Service cost - benefits earned
during the year | | $ | — | | | $ | — | | | $ | — | | | $ | 1.3 | | | $ | 1.2 | | | $ | 1.6 | | | $ | — | | | $ | 0.1 | | | $ | 0.1 | |
Interest cost of projected
benefit obligation | | | 5.2 | | | | 5.5 | | | | 3.2 | | | | 2.7 | | | | 3.0 | | | | 1.7 | | | | 0.3 | | | | 0.4 | | | | 0.2 | |
Expected return on assets | | | (3.9 | ) | | | (3.9 | ) | | | (5.2 | ) | | | (1.7 | ) | | | (1.6 | ) | | | (1.2 | ) | | | — | | | | — | | | | — | |
Amortization of prior service
cost | | | — | | | | — | | | | — | | | | 0.1 | | | | 0.1 | | | | 0.1 | | | | — | | | | — | | | | (1.4 | ) |
Amortization of actuarial net
loss (gain) | | | 1.8 | | | | 2.2 | | | | 1.9 | | | | 0.1 | | | | 1.6 | | | | 1.5 | | | | (1.6 | ) | | | (1.2 | ) | | | (0.5 | ) |
Pension settlement gain | | | — | | | | — | | | | — | | | | (0.1 | ) | | | (0.1 | ) | | | (0.1 | ) | | | — | | | | — | | | | — | |
Net periodic benefit cost | | $ | 3.1 | | | $ | 3.8 | | | $ | (0.1 | ) | | $ | 2.4 | | | $ | 4.2 | | | $ | 3.6 | | | $ | (1.3 | ) | | $ | (0.7 | ) | | $ | (1.6 | ) |
Weighted average
assumptions: | | | | | | | | | | | | | | | | | | | | | | | | | | | |
Effective discount rate for
benefit obligations | | | 5.1 | % | | | 5.4 | % | | | 2.8 | % | | | 3.7 | % | | | 4.7 | % | | | 1.4 | % | | | 5.0 | % | | | 5.4 | % | | | 2.5 | % |
Expected return on
plan assets | | | 4.9 | % | | | 5.0 | % | | | 4.7 | % | | | 4.4 | % | | | 5.4 | % | | | 2.9 | % | | N/A | | | N/A | | | N/A | |
Rate of compensation
increase | | N/A | | | N/A | | | N/A | | | | 2.9 | % | | | 3.7 | % | | | 4.1 | % | | N/A | | | N/A | | | N/A | |
The prior service costs are amortized on a straight-line basis over the average remaining service period of active participants. Gains and losses in excess of 10% of the greater of the benefit obligation and the market-related value of assets are amortized over the average remaining service period of active participants.
To develop the expected long-term rate of return on assets assumptions, the Company considered the historical returns and future expectations for returns in each asset class net of fees, as well as targeted asset allocation percentages within the pension portfolio.
The following is a reconciliation of the changes in benefit obligation, plan assets, and funded status as of December 31, 2024 and 2023:
| | | | | | | | | | | | | | | | | | | | | | | | |
| | U.S. Pension Plan | | | Non-U.S. Pension Plans | | | Postretirement
Medical and Other | |
| | 2024 | | | 2023 | | | 2024 | | | 2023 | | | 2024 | | | 2023 | |
Change in Benefit Obligation | | | | | | | | | | | | | | | | | | |
Benefit obligation, beginning of year | | $ | 106.4 | | | $ | 106.4 | | | $ | 61.9 | | | $ | 59.0 | | | $ | 6.6 | | | $ | 9.5 | |
Service cost | | | — | | | | — | | | | 1.3 | | | | 1.2 | | | | — | | | | 0.1 | |
Interest cost | | | 5.2 | | | | 5.5 | | | | 2.7 | | | | 3.0 | | | | 0.3 | | | | 0.4 | |
Participant contributions | | | — | | | | — | | | | — | | | | — | | | | — | | | | 0.1 | |
Actuarial (gain) loss | | | (4.4 | ) | | | 2.5 | | | | (1.9 | ) | | | (0.3 | ) | | | (0.7 | ) | | | (2.4 | ) |
Currency translation adjustment | | | — | | | | — | | | | (2.6 | ) | | | 2.6 | | | | — | | | | — | |
Pension settlement | | | — | | | | — | | | | (0.6 | ) | | | (0.1 | ) | | | — | | | | — | |
Benefits paid | | | (8.0 | ) | | | (8.0 | ) | | | (3.3 | ) | | | (3.5 | ) | | | (0.7 | ) | | | (1.1 | ) |
Benefit obligation, end of year | | $ | 99.2 | | | $ | 106.4 | | | $ | 57.5 | | | $ | 61.9 | | | $ | 5.5 | | | $ | 6.6 | |
Change in Plan Assets | | | | | | | | | | | | | | | | | | |
Fair value of plan assets, beginning of year | | $ | 82.2 | | | $ | 82.3 | | | $ | 31.3 | | | $ | 29.7 | | | $ | — | | | $ | — | |
Actual return on plan assets | | | 3.3 | | | | 7.4 | | | | (1.2 | ) | | | — | | | | — | | | | — | |
Employer contributions | | | 4.9 | | | | 0.5 | | | | 3.5 | | | | 3.6 | | | | 0.7 | | | | 1.0 | |
Participant contributions | | | — | | | | — | | | | — | | | | — | | | | — | | | | 0.1 | |
Currency translation adjustment | | | — | | | | — | | | | (0.5 | ) | | | 1.6 | | | | — | | | | — | |
Pension settlement | | | — | | | | — | | | | (0.6 | ) | | | (0.1 | ) | | | — | | | | — | |
Benefits paid | | | (8.0 | ) | | | (8.0 | ) | | | (3.3 | ) | | | (3.5 | ) | | | (0.7 | ) | | | (1.1 | ) |
Fair value of plan assets, end of year | | | 82.4 | | | | 82.2 | | | | 29.2 | | | | 31.3 | | | | — | | | | — | |
Funded status | | $ | (16.8 | ) | | $ | (24.2 | ) | | $ | (28.3 | ) | | $ | (30.6 | ) | | $ | (5.5 | ) | | $ | (6.6 | ) |
Amounts recognized in the Consolidated
Balance Sheets as of December 31 | | | | | | | | | | | | | | | | | | |
Pension asset | | $ | — | | | $ | — | | | $ | 3.8 | | | $ | 2.7 | | | $ | — | | | $ | — | |
Short-term pension obligation | | | (0.5 | ) | | | (0.5 | ) | | | (1.3 | ) | | | (1.2 | ) | | | — | | | | — | |
Long-term pension obligation | | | (16.3 | ) | | | (23.7 | ) | | | (30.8 | ) | | | (32.1 | ) | | | — | | | | — | |
Short-term postretirement medical and other
benefit obligations | | | — | | | | — | | | | — | | | | — | | | | (0.8 | ) | | | (1.0 | ) |
Long-term postretirement medical and other
benefit obligations | | | — | | | | — | | | | — | | | | — | | | | (4.7 | ) | | | (5.6 | ) |
Net amount recognized | | $ | (16.8 | ) | | $ | (24.2 | ) | | $ | (28.3 | ) | | $ | (30.6 | ) | | $ | (5.5 | ) | | $ | (6.6 | ) |
Weighted-Average Assumptions | | | | | | | | | | | | | | | | | | |
Discount rate | | | 5.6 | % | | | 5.1 | % | | | 4.4 | % | | | 4.2 | % | | | 5.3 | % | | | 5.0 | % |
Rate of compensation increase | | N/A | | | N/A | | | | 3.8 | % | | | 3.8 | % | | N/A | | | N/A | |
The Company determines its discount rates with advice from an independent third party. The Company uses different discount rates for each plan depending on the plan jurisdiction, the demographics of participants and the expected timing of benefit payments. For the qualified U.S. pension plan and postretirement medical plans, the Company uses a discount rate calculated based on an appropriate mix of high-quality corporate bonds. For the non-U.S. pension and postretirement plans, the Company consistently uses the relevant country specific benchmark indices for determining the various discount rates.
Amounts recognized in accumulated other comprehensive loss as of December 31, 2024 and 2023, are summarized as follows:
| | | | | | | | | | | | | | | | |
| | Pensions | | | Postretirement
Medical and Other | |
| | 2024 | | | 2023 | | | 2024 | | | 2023 | |
Net actuarial gain (loss) | | $ | (27.2 | ) | | $ | (32.0 | ) | | $ | 7.3 | | | $ | 8.3 | |
Prior service cost | | | (0.2 | ) | | | (0.2 | ) | | | — | | | | — | |
Total amount recognized | | $ | (27.4 | ) | | $ | (32.2 | ) | | $ | 7.3 | | | $ | 8.3 | |
For measurement purposes, a 7.70% annual rate of increase in the per capita cost of covered health care benefits was assumed for the postretirement medical and other plan for 2024. The rate was assumed to decrease gradually to 4.00% in 2048 and remain at that level thereafter.
The weighted-average asset allocation of the U.S. Pension Plan as of December 31, 2024 and 2023, by asset category are summarized as follows:
| | | | | | | | |
| | 2024 | | | 2023 | |
Equity | | | 50.3 | % | | | 53.3 | % |
Fixed income | | | 43.6 | % | | | 39.7 | % |
Other | | | 6.1 | % | | | 7.0 | % |
Total | | | 100.0 | % | | | 100.0 | % |
The weighted-average asset allocation of the Non-U.S. Pension Plans as of December 31, 2024 and 2023, by asset category are summarized as follows:
| | | | | | | | |
| | 2024 | | | 2023 | |
Equity | | | — | % | | | — | % |
Fixed income | | | 52.0 | % | | | 39.4 | % |
Other(1) | | | 48.0 | % | | | 60.6 | % |
Total | | | 100.0 | % | | | 100.0 | % |
(1)Includes diversified investments that have equity and fixed income holdings.
The Board of Directors has established the Retirement Plan Committee (the “Committee”) to manage the operations and administration of all benefit plans and related trusts. On a quarterly basis, the Committee reviews progress toward achieving the pension plans’ and individual investment managers’ performance objectives.
Investment Strategy The overall objective of the Company's pension assets is to earn a rate of return over time to satisfy the benefit obligations of the pension plans and to maintain sufficient liquidity to pay benefits and address other cash requirements of the pension funds. Specific investment objectives for the Company’s long-term investment strategy include reducing the volatility of pension assets relative to pension liabilities, achieving a competitive, total investment return, achieving diversification between and within asset classes and managing other risks. Investment objectives for each asset class are determined based on specific risks and investment opportunities identified.
The Company reviews its long-term, strategic asset allocations annually. The Company uses various analytics to determine the optimal asset mix and considers plan liability characteristics, liquidity characteristics, funding requirements, expected rates of return, and the distribution of returns. The Company identifies investment benchmarks for the asset classes in the strategic asset allocation that are market-based.
Actual allocations to each asset class vary from target allocations due to periodic investment strategy changes, market value fluctuations, the length of time it takes to fully implement investment allocation positions and the timing of benefit payments and contributions. The asset allocation is monitored and rebalanced monthly.
The actual and target allocations for the pension assets as of December 31, 2024, by asset class, are summarized as follows:
| | | | | | | | | | | | | | | | |
| | Target Allocations | | | Weighted Average Asset
Allocations | |
| | U.S. Plans | | | Non-U.S. Plans | | | U.S. Plans | | | Non-U.S. Plans | |
Equity Securities | | | 46.2 | % | | | — | % | | | 50.3 | % | | | — | % |
Debt Securities | | | 45.0 | % | | | 63.0 | % | | | 43.6 | % | | | 52.0 | % |
Other | | | 8.8 | % | | | 37.0 | % | | | 6.1 | % | | | 48.0 | % |
Risk Management In managing the plan assets, the Company reviews and manages risk associated with funded status risk, interest rate risk, market risk, counterparty risk, liquidity risk, and operational risk. Liability management and asset class diversification are central to the Company’s risk management approach and are integral to the overall investment strategy. Further, asset classes are constructed to achieve diversification by investment strategy, by industry or sector and by holding. Asset performance is monitored against the relative benchmarked indices.
Fair Value Measurements The following tables present the Company’s plan assets using the fair value hierarchy as of December 31, 2024 and 2023. The fair value hierarchy has three levels based on the reliability of the inputs used to determine
fair value. Refer to Note 4, “Fair Value of Financial Instruments,” for definitions of each fair value level. The plan assets may consist of a combination of investments and are allocated based on the predominant asset class.
| | | | | | | | | | | | | | | | | | | | |
| | December 31, 2024 | |
Assets | | Quoted
Prices in
Active
Markets for
Identical
Assets
(Level 1) | | | Significant
Other
Observable
Inputs
(Level 2) | | | Unobservable
Inputs
(Level 3) | | | Net Asset Value ("NAV")* | | | Total | |
Equity: | | | | | | | | | | | | | | | |
U.S. equity | | $ | — | | | $ | — | | | $ | — | | | $ | 20.8 | | | $ | 20.8 | |
International equity | | | — | | | | — | | | | — | | | | 20.3 | | | | 20.3 | |
Fixed income: | | | | | | | | | | | | | | | |
Corporate bonds and notes | | | — | | | | — | | | | — | | | | 14.8 | | | | 14.8 | |
Government and agency bonds | | | — | | | | — | | | | — | | | | 28.1 | | | | 28.1 | |
Commingled funds | | | — | | | | — | | | | — | | | | 12.9 | | | | 12.9 | |
International fixed income | | | — | | | | — | | | | — | | | | 4.4 | | | | 4.4 | |
Other: | | | | | | | | | | | | | | | |
Cash and cash equivalents | | | 0.8 | | | | — | | | | — | | | | — | | | | 0.8 | |
Annuity contracts | | | — | | | | — | | | | 6.0 | | | | — | | | | 6.0 | |
Other | | | 0.7 | | | | — | | | | — | | | | 2.8 | | | | 3.5 | |
Total | | $ | 1.5 | | | $ | — | | | $ | 6.0 | | | $ | 104.1 | | | $ | 111.6 | |
*Certain assets that are measured at fair value using the NAV per share practical expedient have not been classified in the fair value hierarchy.
| | | | | | | | | | | | | | | | | | | | |
| | December 31, 2023 | |
Assets | | Quoted
Prices in
Active
Markets for
Identical
Assets
(Level 1) | | | Significant
Other
Observable
Inputs
(Level 2) | | | Unobservable
Inputs
(Level 3) | | | Net Asset Value ("NAV")* | | | Total | |
Equity: | | | | | | | | | | | | | | | |
U.S. equity | | $ | — | | | $ | — | | | $ | — | | | $ | 21.7 | | | $ | 21.7 | |
International equity | | | — | | | | — | | | | — | | | | 22.1 | | | | 22.1 | |
Fixed income: | | | | | | | | | | | | | | | |
Corporate bonds and notes | | | — | | | | — | | | | — | | | | 16.6 | | | | 16.6 | |
Government and agency bonds | | | — | | | | — | | | | — | | | | 25.5 | | | | 25.5 | |
Commingled funds | | | — | | | | — | | | | — | | | | 11.1 | | | | 11.1 | |
International fixed income | | | — | | | | — | | | | — | | | | 4.7 | | | | 4.7 | |
Other: | | | | | | | | | | | | | | | |
Cash and cash equivalents | | | 1.0 | | | | — | | | | — | | | | — | | | | 1.0 | |
Money market funds | | | 0.7 | | | | — | | | | — | | | | — | | | | 0.7 | |
Annuity contracts | | | — | | | | — | | | | 7.4 | | | | — | | | | 7.4 | |
Other | | | — | | | | — | | | | — | | | | 2.7 | | | | 2.7 | |
Total | | $ | 1.7 | | | $ | - | | | $ | 7.4 | | | $ | 104.4 | | | $ | 113.5 | |
*Certain assets that are measured at fair value using the NAV per share practical expedient have not been classified in the fair value hierarchy.
Cash and cash equivalents, which are used to pay benefits, are primarily held in registered money market funds which are valued using a market approach based on the quoted market prices of identical instruments. Other cash and cash equivalents are valued daily by the fund using a market approach with inputs that include quoted market prices for similar instruments.
Insurance group annuity contracts are valued at the present value of the future benefit payments owed by the insurance Company to the Non-U.S. Pension Plan's participants.
The valuation methodologies described above may generate a fair value calculation that may not be indicative of net realizable value or future fair values. While the Company believes the valuation methodologies used are appropriate, the use of different methodologies or assumptions in calculating fair value could result in different amounts.
A reconciliation of the fair value measurements of plan assets using significant unobservable inputs (Level 3) from the beginning of the year to the end of the year is as follows:
| | | | | | | | |
| | Annuity Contracts
Year Ended December 31, | |
| | 2024 | | | 2023 | |
Beginning Balance | | $ | 7.4 | | | $ | 8.5 | |
Additions | | | — | | | | 0.5 | |
Actual return on assets | | | 0.1 | | | | (1.2 | ) |
Benefit payments | | | (1.4 | ) | | | (0.9 | ) |
Foreign currency impact | | | (0.1 | ) | | | 0.5 | |
Ending Balance | | $ | 6.0 | | | $ | 7.4 | |
The expected 2025 minimum contributions for the U.S. pension plan are $3.0 million and there are no planned discretionary or non-cash contributions. The expected 2025 minimum contributions for the non-U.S. pension plans are $1.4 million and there are no planned discretionary or non-cash contributions. Expected Company paid claims for the postretirement medical and other plans are $0.8 million for 2025. Projected future benefit payments from the plans as of December 31, 2024 are estimated as follows:
| | | | | | | | | | | | |
| | U.S. Pension
Plan | | | Non-U.S.
Pension
Plans | | | Postretirement
Medical and
Other | |
2025 | | $ | 8.8 | | | $ | 3.0 | | | $ | 0.8 | |
2026 | | | 8.7 | | | | 3.1 | | | | 0.8 | |
2027 | | | 8.7 | | | | 3.4 | | | | 0.7 | |
2028 | | | 8.7 | | | | 3.9 | | | | 0.7 | |
2029 | | | 8.6 | | | | 3.9 | | | | 0.6 | |
Thereafter | | | 40.2 | | | | 19.7 | | | | 2.3 | |
Total | | $ | 83.7 | | | $ | 37.0 | | | $ | 5.9 | |
The fair value of plan assets for which the accumulated benefit obligation is in excess of the plan assets as of December 31, 2024 and 2023 is summarized as follows:
| | | | | | | | | | | | | | | | |
| | U.S. Pension Plan | | | Non U.S. Pension Plans | |
| | 2024 | | | 2023 | | | 2024 | | | 2023 | |
Projected benefit obligation | | $ | 99.2 | | | $ | 106.4 | | | $ | 32.1 | | | $ | 33.8 | |
Accumulated benefit obligation | | | 99.2 | | | | 106.4 | | | | 29.2 | | | | 30.6 | |
Fair value of plan assets | | | 82.4 | | | | 82.2 | | | | — | | | | 0.5 | |
The measurement date for all plans is December 31, 2024.
20. Leases
The Company has operating leases for offices, warehouses, land for storage of cranes, vehicles, information technology equipment, and manufacturing equipment. The remaining lease terms are up to 19 years, some of which include multiple renewal options which would extend the lease term for up to an additional 10 years, and some which include options to terminate the lease within one year. Certain leases include one or more options to renew; the exercise of lease renewal options is at the Company’s discretion. The Company includes renewal option periods in the lease term when it is determined that the
options are reasonably certain to be exercised. The Company’s financing leases have an immaterial impact on the consolidated financial statements.
The components of lease expense for the years ended December 31, 2024, 2023, and 2022 are summarized as follows:
| | | | | | | | | | | | |
| | 2024 | | | 2023 | | | 2022 | |
Operating lease cost | | $ | 16.9 | | | $ | 15.5 | | | $ | 14.0 | |
Variable lease cost* | | | 1.5 | | | | 1.2 | | | | 1.4 | |
Total lease cost | | $ | 18.4 | | | $ | 16.7 | | | $ | 15.4 | |
*Includes short-term leases, which are immaterial. | | | | | | | |
Supplemental Consolidated Balance Sheet information related to leases as of December 31, 2024 and 2023 are summarized as follows:
| | | | | | | | |
| | 2024 | | | 2023 | |
Operating lease right-of-use assets | | $ | 59.3 | | | $ | 59.7 | |
| | | | | | |
Other liabilities | | $ | 12.9 | | | $ | 13.0 | |
Operating lease liabilities | | | 47.0 | | | | 47.2 | |
Total operating lease liabilities | | $ | 59.9 | | | $ | 60.2 | |
Cash paid for operating leases included in operating cash flows was $30.6 million, $29.5 million, and $26.8 million for the years ended December 31, 2024, 2023, and 2022, respectively.
Operating lease right-of-use assets obtained in exchange for lease obligations were $14.9 million for the year ended December 31, 2024 and $26.0 million for the year ended December 31, 2023.
As of December 31, 2024, the Company’s operating leases have a weighted-average remaining lease term of 6.3 years and a weighted average discount rate of 6.1%. As of December 31, 2023, the Company's leases had a weighted-average remaining lease term of 6.4 years and a weighted average discount rate of 5.9%. Topic 842 requires a lessee to discount its unpaid lease obligations using the interest rate implicit in the lease, or if not readily determinable, the incremental borrowing rate at the time of lease commencement. Generally, the Company uses its incremental borrowing rate as the implicit rate cannot be determined. The Company’s incremental borrowing rate for a lease is the rate of interest the Company would have to pay on a collateralized basis to borrow an amount equal to the lease payments under similar terms in a similar region.
Maturities of operating lease liabilities as of December 31, 2024 are summarized as follows:
| | | | |
Year | | Lease Payments | |
2025 | | $ | 15.8 | |
2026 | | | 12.9 | |
2027 | | | 11.5 | |
2028 | | | 9.4 | |
2029 | | | 7.1 | |
Thereafter | | | 15.8 | |
Total lease payments | | | 72.5 | |
Less: imputed interest | | | (12.6 | ) |
Present value of lease liabilities | | $ | 59.9 | |
As of December 31, 2024, we have additional operating leases for facilities that have not yet commenced with undiscounted lease obligations of approximately $9.5 million. These leases are expected to commence during the year ending December 31, 2025 and have terms of up to approximately 10 years.
Lessor Accounting
The Company rents cranes to its customers and actively manages the size, quality, age and composition of its rental fleet to meet customer demands and trends. The rental fleet is serviced through the Company’s parts and service team. The rental activities create cross-selling opportunities in crane sales including rent-to-own purchase options whereby customers are given a period of time to exercise an option to purchase the related equipment at an established price with any rental payments paid applied to reduce the purchase price.
Substantially all of the Company's leasing arrangements are classified as operating leases. Rental revenue is recognized on a straight-line basis over the rental period.
In most cases, the Company's rental arrangements include non-lease components, including delivery and pick-up services. The Company accounts for these non-lease components separate from the rental arrangement and recognizes the revenue associated with these components when the service is performed. The Company has elected to exclude from rental revenue all taxes collected from customers related to rental activities. The Company manages the residual value risk of its rented assets by (i) monitoring the quality, aging and anticipated retail market value of the rental fleet assets to determine the optimal period to remove an asset from the rental fleet, (ii) maintaining the quality of assets through parts and service support and (iii) requiring physical damage insurance of customers. The Company primarily disposes of the rental assets through its rent to own program or sale of the asset.
Refer to Note 7, “Property, Plant, and Equipment,” for the balance of rental cranes included in property, plant, and equipment in the Consolidated Balance Sheets.
Item 9. CHANGES IN AND DISAGREEMENTS WITH ACCOUNTANTS ON ACCOUNTING AND FINANCIAL DISCLOSURE
None.
Item 9A. CONTROLS AND PROCEDURES
Conclusion Regarding the Effectiveness of Disclosure Controls and Procedures
The Company’s management, with the participation of the Company’s Chief Executive Officer and Chief Financial Officer, have evaluated the effectiveness of the Company’s disclosure controls and procedures (as such term is defined in Rules 13a-15(e) and 15d-15(e) under the Securities Exchange Act of 1934, as amended (the “Exchange Act”)) as of the end of the period covered by this report. Based on such evaluation, the Company’s Chief Executive Officer and Chief Financial Officer have concluded that, as of the end of such period, the Company’s disclosure controls and procedures are effective in recording, processing, summarizing, and reporting, on a timely basis, information required to be disclosed by the Company in the reports that it files or submits under the Exchange Act, and that such information is accumulated and communicated to the Chief Executive Officer and Chief Financial Officer, as appropriate, to allow timely discussions regarding required disclosure.
Management’s Report on Internal Control Over Financial Reporting
The Company’s management is responsible for establishing and maintaining adequate internal control over financial reporting, as such term is defined in Exchange Act Rule 13a-15(f). The Company’s management, with the participation of the Company’s Chief Executive Officer and Chief Financial Officer, has evaluated the effectiveness of the Company’s internal control over financial reporting based on the framework in Internal Control-Integrated Framework (2013) issued by the Committee of Sponsoring Organizations of the Treadway Commission. Based on this evaluation, the Company’s management has concluded that, as of December 31, 2024, the Company’s internal control over financial reporting was effective.
Because of its inherent limitations, internal control over financial reporting may not prevent or detect misstatements. Also, projections of any evaluation of effectiveness to future periods are subject to the risk that the controls may become inadequate because of changes in conditions, or that the degree of compliance with the policies or procedures may deteriorate.
The effectiveness of the Company’s internal control over financial reporting as of December 31, 2024, has been audited by Deloitte & Touche LLP, an independent registered public accounting firm, as stated in their report which appears herein.
Changes in Internal Control Over Financial Reporting
The Company's management is responsible for establishing and maintaining adequate internal control over financial reporting, as such term is defined in Exchange Act Rules 13a-15(f) and 15d-15(f). During the fourth quarter ended December 31, 2024 covered by this report, the Company made no changes to internal control over financial reporting that materially affected, or are reasonably likely to materially affect, its internal control over financial reporting.
REPORT OF INDEPENDENT REGISTERED PUBLIC ACCOUNTING FIRM
To the stockholders and the Board of Directors of The Manitowoc Company, Inc.
Opinion on Internal Control over Financial Reporting
We have audited the internal control over financial reporting of The Manitowoc Company, Inc. and subsidiaries (the “Company”) as of December 31, 2024, based on criteria established in Internal Control — Integrated Framework (2013) issued by the Committee of Sponsoring Organizations of the Treadway Commission (COSO). In our opinion, the Company maintained, in all material respects, effective internal control over financial reporting as of December 31, 2024, based on criteria established in Internal Control — Integrated Framework (2013) issued by COSO.
We have also audited, in accordance with the standards of the Public Company Accounting Oversight Board (United States) (PCAOB), the consolidated financial statements as of and for the year ended December 31, 2024, of the Company and our report dated February 21, 2025, expressed an unqualified opinion on those financial statements.
Basis for Opinion
The Company’s management is responsible for maintaining effective internal control over financial reporting and for its assessment of the effectiveness of internal control over financial reporting, included in the accompanying Management's Report on Internal Control over Financial Reporting. Our responsibility is to express an opinion on the Company’s internal control over financial reporting based on our audit. We are a public accounting firm registered with the PCAOB and are required to be independent with respect to the Company in accordance with the U.S. federal securities laws and the applicable rules and regulations of the Securities and Exchange Commission and the PCAOB.
We conducted our audit in accordance with the standards of the PCAOB. Those standards require that we plan and perform the audit to obtain reasonable assurance about whether effective internal control over financial reporting was maintained in all material respects. Our audit included obtaining an understanding of internal control over financial reporting, assessing the risk that a material weakness exists, testing and evaluating the design and operating effectiveness of internal control based on the assessed risk, and performing such other procedures as we considered necessary in the circumstances. We believe that our audit provides a reasonable basis for our opinion.
Definition and Limitations of Internal Control over Financial Reporting
A company’s internal control over financial reporting is a process designed to provide reasonable assurance regarding the reliability of financial reporting and the preparation of financial statements for external purposes in accordance with generally accepted accounting principles. A company’s internal control over financial reporting includes those policies and procedures that (1) pertain to the maintenance of records that, in reasonable detail, accurately and fairly reflect the transactions and dispositions of the assets of the company; (2) provide reasonable assurance that transactions are recorded as necessary to permit preparation of financial statements in accordance with generally accepted accounting principles, and that receipts and expenditures of the company are being made only in accordance with authorizations of management and directors of the company; and (3) provide reasonable assurance regarding prevention or timely detection of unauthorized acquisition, use, or disposition of the company’s assets that could have a material effect on the financial statements.
Because of its inherent limitations, internal control over financial reporting may not prevent or detect misstatements. Also, projections of any evaluation of effectiveness to future periods are subject to the risk that controls may become inadequate because of changes in conditions, or that the degree of compliance with the policies or procedures may deteriorate.
/s/ DELOITTE & TOUCHE LLP
Milwaukee, Wisconsin
February 21, 2025
Item 9B. OTHER INFORMATION
During the three months ended December 31, 2024, no director or Section 16 officer of the Company adopted a "Rule 10b5-1 trading arrangement" or "non-Rule 10b5-1 trading arrangement", as each term is defined in Item 408 of Regulation S-K.
Item 9C. DISCLOSURE REGARDING FOREIGN JURISDICTIONS THAT PREVENT INSPECTIONS
Not applicable.
PART III
Item 10. DIRECTORS, EXECUTIVE OFFICERS AND CORPORATE GOVERNANCE
The information required by this item is incorporated by reference from the sections in the Company’s definitive Proxy Statement for its 2025 Annual Meeting of Shareholders (the “2025 Proxy Statement”) captioned “Corporate Governance – Governance of the Company,” "Corporate Governance - Insider Trading Policy," “Corporate Governance – Audit Committee,” “Election of Directors” and “Miscellaneous – Delinquent Section16(a) Reports.” See also “Information About Our Executive Officers” in Part I hereof, which is incorporated herein by reference.
The Company has a Global Ethics Policy and other policies relating to business conduct, that pertain to all employees, which can be viewed at the Company’s website (www.manitowoc.com). The Company has adopted a code of ethics that applies to the Company’s principal executive officer, principal financial officer, and controller, which is part of the Company’s Global Ethics Policy and other policies related to business conduct. Any amendments to the Global Ethics Policy, or information about any waivers granted to directors or executive officers with respect to the Global Ethics Policy, will be posted on the Company’s website (www.manitowoc.com).
Item 11. EXECUTIVE COMPENSATION
The information required by this item is incorporated by reference from the sections of the 2025 Proxy Statement captioned “Non-Employee Director Compensation,” “Compensation Discussion and Analysis,” “Corporate Governance – Transactions with Related Persons,” “Summary Compensation Tables,” “Potential Payments upon Termination or Change in Control, ” “CEO Pay Ratio” and “Pay versus Performance.”
Item 12. SECURITY OWNERSHIP OF CERTAIN BENEFICIAL OWNERS AND MANAGEMENT AND RELATED STOCKHOLDER MATTERS
The information required by this item with respect to security ownership of certain beneficial owners and management is incorporated by reference from the section of the 2025 Proxy Statement captioned “Ownership of Securities.”
Item 13. CERTAIN RELATIONSHIPS AND RELATED TRANSACTIONS, AND DIRECTOR INDEPENDENCE
The information required by this item is incorporated by reference from the section of the 2025 Proxy Statement captioned “Corporate Governance – Governance of the Company” and “Corporate Governance – Transactions with Related Persons.”
Item 14. PRINCIPAL ACCOUNTING FEES AND SERVICES
The information required by this item is incorporated by reference from the section of the 2025 Proxy Statement captioned “Audit Committee Report.”
PART IV
Item 15. EXHIBITS AND FINANCIAL STATEMENT SCHEDULES
(a)Documents filed as part of this Report.
| | |
(1) | Financial Statements: |
| | |
| | The following Consolidated Financial Statements are filed as part of this report under Item 8, “Financial Statements and Supplementary Data.” |
| | |
| | Report of Independent Registered Public Accounting Firm |
| | |
| | Consolidated Statements of Operations |
| | |
| | Consolidated Statements of Comprehensive Income (Loss) |
| | |
| | Consolidated Balance Sheets |
| | |
| | Consolidated Statements of Cash Flows |
| | |
| | Consolidated Statements of Equity |
| | |
| | Notes to Consolidated Financial Statements |
| | |
(2) | Financial Statement Schedule: |
| | |
| | Schedule II – Valuation and Qualifying Accounts |
| | | | |
Schedule | | Description | | Filed Herewith |
| | | | |
II | | Valuation and Qualifying Accounts | | X |
All other financial statement schedules not listed have been omitted since the required information is included in the Consolidated Financial Statements or the Notes thereto, or is not applicable or required under rules of Regulation S-X.
(b) Exhibits:
The exhibits listed in the Exhibit Index below are filed or furnished as part of this Annual Report on Form 10-K.
EXHIBIT INDEX
| | | | |
Exhibit No. | | Description | | Filed/Furnished Herewith |
| | | | |
3.1 | | Amended and Restated Articles of Incorporation, as amended through May 10, 2019 (incorporated by reference to Exhibit 3.1 to the Company’s Current Report on Form 8-K dated May 7, 2019). | | |
| | | | |
3.2 | | Restated By-laws, as amended through April 3, 2020 (incorporated by reference to Exhibit 3.2 to the Company’s Current Report on Form 8-K dated April 6, 2020). | | |
| | | | |
4.1 | | Indenture, dated September 19, 2024, between The Manitowoc Company, Inc., the subsidiary guarantors party thereto and U.S. Bank National Association, as trustee and as collateral agent (incorporated by reference to Exhibit 4.1 to the Company’s Current Report on Form 8-K, dated September 18, 2024). | | |
| | | | |
4.2 | | Form of 9.25% Senior Secured Second Lien Note due 2031 (included as Exhibit 1 to Annex I of Exhibit 4.1). | | |
| | | | |
4.3 | | Description of The Manitowoc Company, Inc.’s Securities (filed as Exhibit 4.3 to the Company’s Annual Report on Form 10-K for the fiscal year ended December 31, 2019 and incorporated herein by reference). | | |
| | | | |
10.1 | | Amendment No. 3, dated as of September 18, 2024 to Credit Agreement dated March 25, 2019, among The Manitowoc Company, Inc., the other borrowers and loan parties party thereto, JPMorgan Chase Bank, N.A., as administrative agent and collateral agent, and certain financial institutions party thereto as lenders (incorporated by reference to Exhibit 10.1 to the Company's Current Report on Form 8-K, dated September 18, 2024). | | |
| | | | |
10.2** | | The Manitowoc Company, Inc. Deferred Compensation Plan, as amended and restated through December 31, 2008 (filed as exhibit 10.1 to the Company’s Annual Report on Form 10-K for the fiscal year ended December 31, 2008 and incorporated herein by reference). | | |
| | | | |
10.3** | | Form of Employment Agreement for Executive Officers (filed as Exhibit 10.1 to the Company's Current Report on Form 8-K filed on February 12, 2021 and incorporated herein by reference). | | |
| | | | |
10.4** | | Form of Indemnity Agreement between the Company and each of the directors, executive officers and certain other employees of the Company (filed as Exhibit 10.4 to the Company’s Annual Report on Form 10-K for the fiscal year ended December 31, 2017 and incorporated herein by reference). | | |
| | | | |
10.5** | | Supplemental Retirement Plan, as amended and restated through December 31, 2008 (filed as Exhibit 10.6(c) to the Company’s Annual Report on Form 10-K for the fiscal year ended December 31, 2008 and incorporated herein by reference). | | |
| | | | |
10.6** | | The Manitowoc Company, Inc. 2013 Omnibus Incentive Plan, as amended and restated (filed as Exhibit 10.1 to the Company’s Current Report on Form 8-K dated November 17, 2017 and incorporated herein by reference). | | |
| | | | |
10.7(a)** | | Current Form of Performance Share Award Agreement under The Manitowoc Company, Inc. 2013 Omnibus Incentive Plan (filed as Exhibit 10.11(a) to the Company’s Annual Report on Form 10-K for the fiscal year ended December 31, 2019 and incorporated herein by reference). | | |
| | | | |
10.7(b)** | | Form of Restricted Stock Award Agreement for Directors under The Manitowoc Company, Inc. 2013 Omnibus Incentive Plan (filed as Exhibit 10.2 to the Company’s Quarterly Report on Form 10-Q filed on August 2, 2013 and incorporated herein by reference). | | |
| | | | |
| | | | |
10.7(c)** | | Form of Restricted Stock Award Agreement for Employees under The Manitowoc Company, Inc. 2013 Omnibus Incentive Plan (filed as Exhibit 10.3 to the Company’s Quarterly Report on Form 10-Q filed on August 2, 2013 and incorporated herein by reference). | | |
| | | | |
10.7(d)** | | Current Form of Restricted Stock Unit Award Agreement for Directors under The Manitowoc Company, Inc. 2013 Omnibus Incentive Plan (filed as Exhibit 10.11(d) to the Company’s Annual Report on Form 10-K for the fiscal year ended December 31, 2019 and incorporated herein by reference). | | |
| | | | |
10.7(e)** | | Current Form of Restricted Stock Unit Award Agreement for Employees under The Manitowoc Company, Inc. 2013 Omnibus Incentive Plan (filed as Exhibit 10.11(e) to the Company’s Annual Report on Form 10-K for the fiscal year ended December 31, 2019 and incorporated herein by reference). | | |
| | | | |
10.7(f)** | | Current Form of Non-Qualified Stock Option Award Agreement under The Manitowoc Company, Inc. 2013 Omnibus Incentive Plan (filed as Exhibit 10.11(f) to the Company’s Annual Report on Form 10-K for the fiscal year ended December 31, 2019 and incorporated herein by reference). | | |
| | | | |
10.7(g)** | | Form of Incentive Award Agreement under The Manitowoc Company, Inc. 2013 Omnibus Incentive Plan (filed as Exhibit 10.7 to the Company’s Quarterly Report on Form 10-Q filed on August 2, 2013 and incorporated herein by reference). | | |
| | | | |
10.7(h)** | | Prior Form of Performance Share Award Agreement under The Manitowoc Company, Inc. 2013 Omnibus Incentive Plan (filed as Exhibit 10.1 to the Company’s Quarterly Report on Form 10-Q filed on August 2, 2013 and incorporated herein by reference). | | |
| | | | |
10.7(i)** | | Prior Form of Restricted Stock Unit Award Agreement for Directors under The Manitowoc Company, Inc. 2013 Omnibus Incentive Plan (filed as Exhibit 10.4 to the Company’s Quarterly Report on Form 10-Q filed on August 2, 2013 and incorporated herein by reference). | | |
| | | | |
10.7(j)** | | Prior Form of Restricted Stock Unit Award Agreement for Employees under The Manitowoc Company, Inc. 2013 Omnibus Incentive Plan (filed as Exhibit 10.5 to the Company’s Quarterly Report on Form 10-Q filed on August 2, 2013 and incorporated herein by reference). | | |
| | | | |
10.7(k)** | | Prior Form of Non-Qualified Stock Option Award Agreement under The Manitowoc Company, Inc. 2013 Omnibus Incentive Plan (filed as Exhibit 10.6 to the Company’s Quarterly Report on Form 10-Q filed on August 2, 2013 and incorporated herein by reference). | | |
| | | | |
10.8** | | The Manitowoc Company, Inc. Severance Pay Plan adopted by the Board of Directors as of May 4, 2009 (filed as Exhibit 10.13 to the Company’s Quarterly Report on Form 10-Q for the period ended September 30, 2009, and incorporated herein by reference.) | | |
| | | | |
10.9** | | Addendum to The Manitowoc Company, Inc. Omnibus Incentive Plan and Restricted Stock Unit Award Agreement for Restricted Stock Units and Performance Shares Awards made to Participants in France (incorporated by reference to Exhibit 10.21 to the Company's Annual Report on Form 10-K for the fiscal year ended December 31, 2020). | | |
| | | | |
19 | | The Manitowoc Company, Inc. Insider Trading Policy | | X(1) |
| | | | |
21 | | Subsidiaries of The Manitowoc Company, Inc. | | X(1) |
| | | | |
23.1 | | Consent of Deloitte & Touche LLP, the Company's Independent Registered Public Accounting Firm | | X(1) |
| | | | |
23.2 | | Consent of PricewaterhouseCoopers LLP | | X(1) |
(1) Filed Herewith
(2) Furnished Herewith
** Management contracts and executive compensation plans and arrangements.
(c) Financial Statement Schedule
THE MANITOWOC COMPANY, INC
AND SUBSIDIARIES
Schedule II: Valuation and Qualifying Accounts
For the Years Ended December 31, 2024, 2023, and 2022
(dollars in millions)
| | | | | | | | | | | | | | | | | | | | |
| | Balance at
Beginning
of Year | | | Charge to
Costs and
Expenses | | | Utilization
of Reserve | | | Other,
Primarily
Impact of
Foreign
Exchange
Rates | | | Balance
at end
of Year | |
Year End December 31, 2022 | | | | | | | | | | | | | | | |
Allowance for credit losses | | $ | 7.3 | | | $ | 0.1 | | | $ | (1.8 | ) | | $ | (0.3 | ) | | $ | 5.3 | |
Deferred tax valuation allowance | | $ | 170.5 | | | $ | 10.6 | | | $ | (4.9 | ) | | $ | (2.1 | ) | | $ | 174.1 | |
Year End December 31, 2023 | | | | | | | | | | | | | | | |
Allowance for credit losses | | $ | 5.3 | | | $ | 2.3 | | | $ | (1.4 | ) | | $ | (0.1 | ) | | $ | 6.1 | |
Deferred tax valuation allowance | | $ | 174.1 | | | $ | 1.7 | | | $ | (30.2 | ) | | $ | (14.8 | ) | | $ | 130.8 | |
Year End December 31, 2024 | | | | | | | | | | | | | | | |
Allowance for credit losses | | $ | 6.1 | | | $ | 1.2 | | | $ | (1.2 | ) | | $ | (0.2 | ) | | $ | 5.9 | |
Deferred tax valuation allowance | | $ | 130.8 | | | $ | 1.2 | | | $ | (57.2 | ) | | $ | (1.4 | ) | | $ | 73.4 | |
Item 16. FORM 10-K SUMMARY
None.
SIGNATURES
Pursuant to the requirements of Section 13 or 15(d) of the Securities Exchange Act of 1934, the registrant has duly caused this Report to be signed on its behalf by the undersigned, thereunto duly authorized:
Date: February 21, 2025
| |
The Manitowoc Company, Inc. | |
(Registrant) | |
| |
/s/ Brian P. Regan | |
Brian P. Regan | |
Executive Vice President and Chief Financial Officer |
Pursuant to the requirements of the Securities Exchange Act of 1934, this Report has been signed below by the following persons on behalf of the registrant and in the capacities and on the dates indicated:
| | |
/s/ Aaron H. Ravenscroft | | |
Aaron H. Ravenscroft, President and Chief Executive Officer (Principal Executive Officer and Director) | | February 21, 2025 |
| | |
/s/ Brian P. Regan | | |
Brian P. Regan, Executive Vice President and Chief Financial Officer (Principal Financial Officer) | | February 21, 2025 |
| | |
/s/ Ryan M. Palmer | | February 21, 2025 |
Ryan M. Palmer, Vice President, Corporate Controller and Principal Accounting Officer (Principal Accounting Officer) | | |
| | |
/s/ Anne E. Bélec | | |
Anne E. Bélec, Director | | February 21, 2025 |
| | |
/s/ Robert G. Bohn | | |
Robert G. Bohn, Director | | February 21, 2025 |
| | |
/s/ Anne M. Cooney | | |
Anne M. Cooney, Director | | February 21, 2025 |
| | |
/s/ Amy R. Davis | | |
Amy R. Davis, Director | | February 21, 2025 |
| | |
/s/ Ryan M. Gwillim | | |
Ryan M. Gwillim, Director | | February 21, 2025 |
| | |
/s/ Kenneth W. Krueger | | |
Kenneth W. Krueger, Chairman of the Board | | February 21, 2025 |
| | |
/s/ Robert W. Malone | | |
Robert W. Malone, Director | | February 21, 2025 |
| | |
/s/ C. David Myers | | |
C. David Myers, Director | | February 21, 2025 |