
Exhibit 99.2
2

3
• • • • • 1/ See GAAP to non-GAAP reconciliation at the end of this presentation.
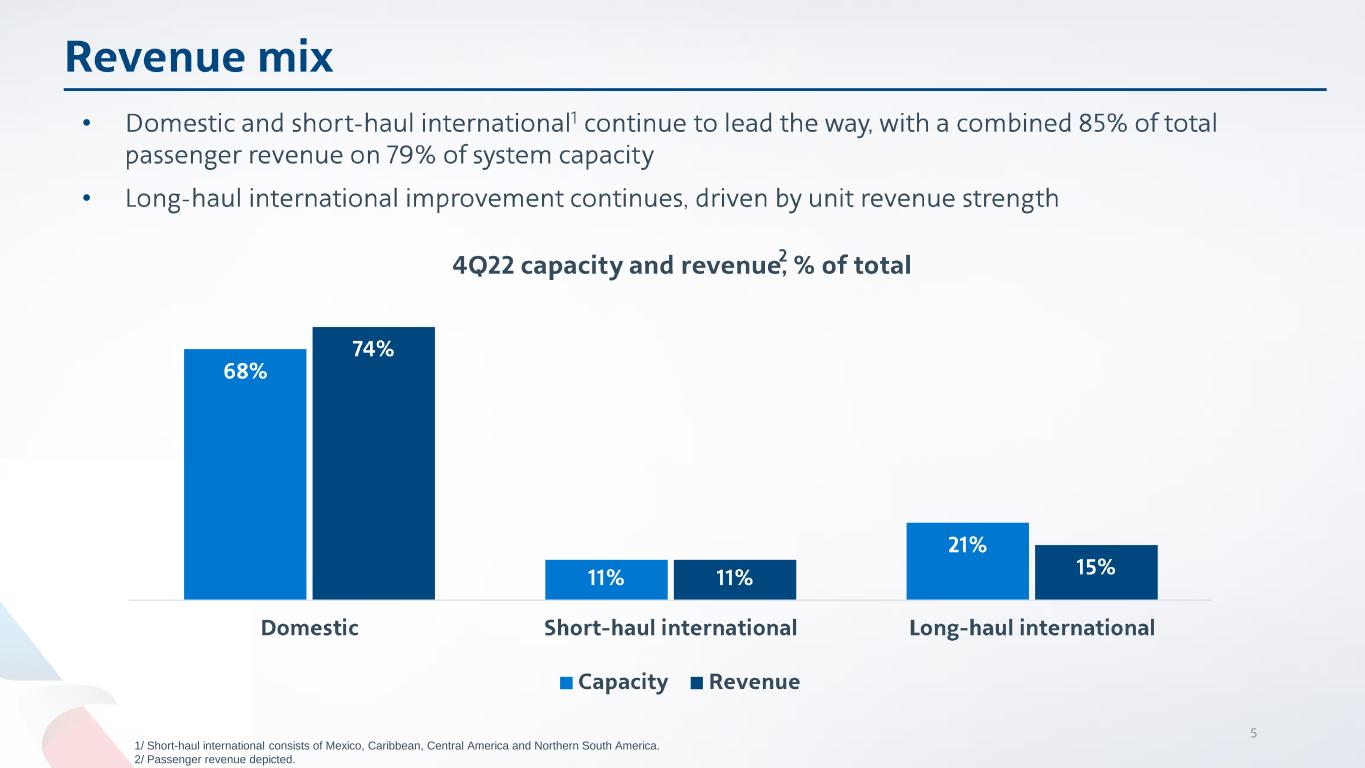
5 1/ Short-haul international consists of Mexico, Caribbean, Central America and Northern South America. 2/ Passenger revenue depicted. • •
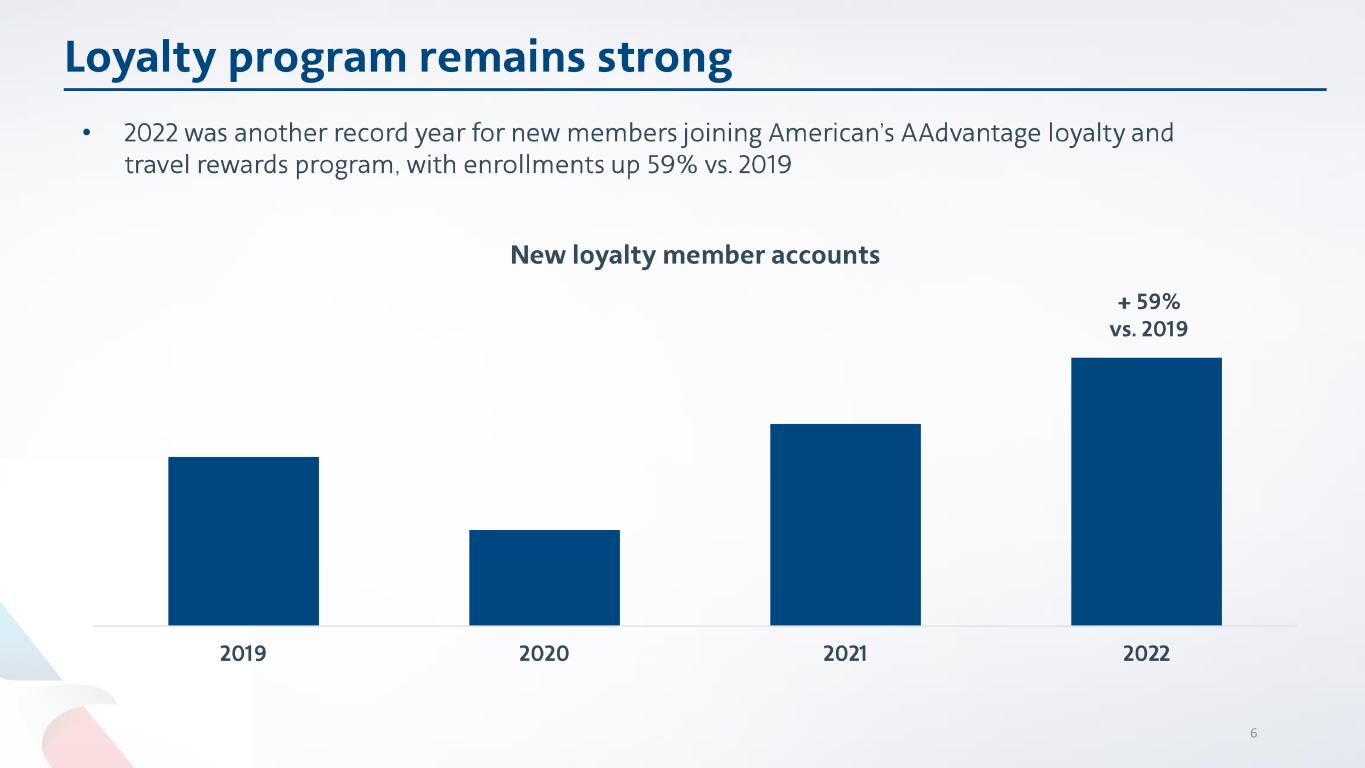
6 •

7

8Note: May not recalculate due to rounding. 1/ See GAAP to non-GAAP reconciliation at the end of this presentation.
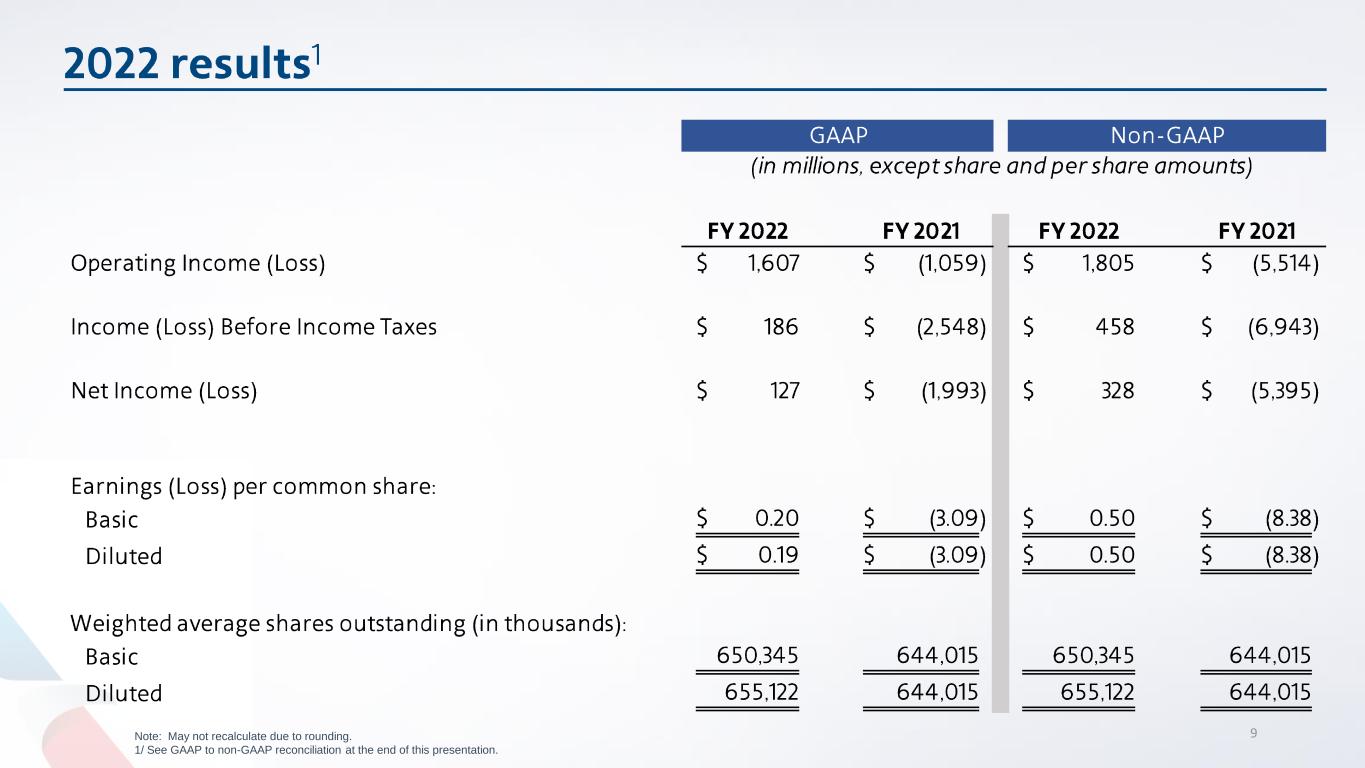
9Note: May not recalculate due to rounding. 1/ See GAAP to non-GAAP reconciliation at the end of this presentation.
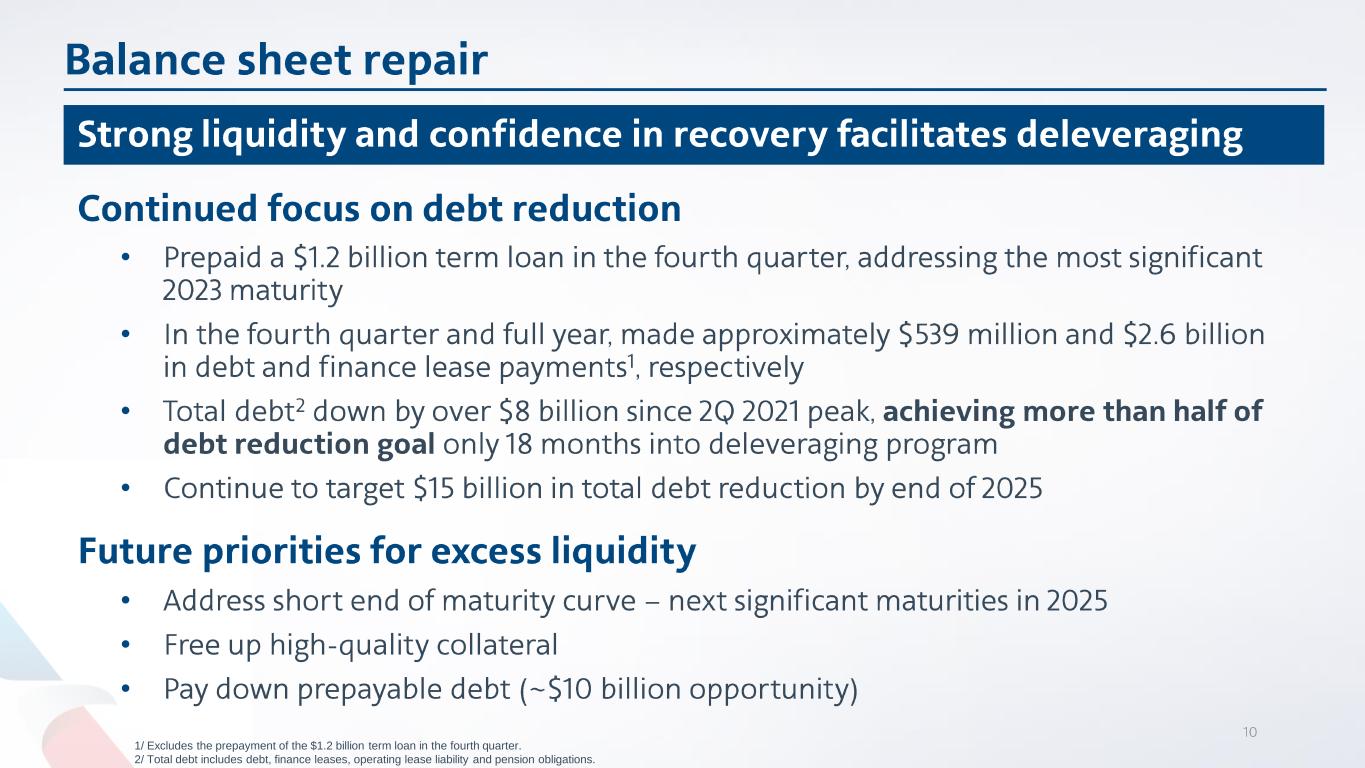
• • • • • • • 1/ Excludes the prepayment of the $1.2 billion term loan in the fourth quarter. 2/ Total debt includes debt, finance leases, operating lease liability and pension obligations.
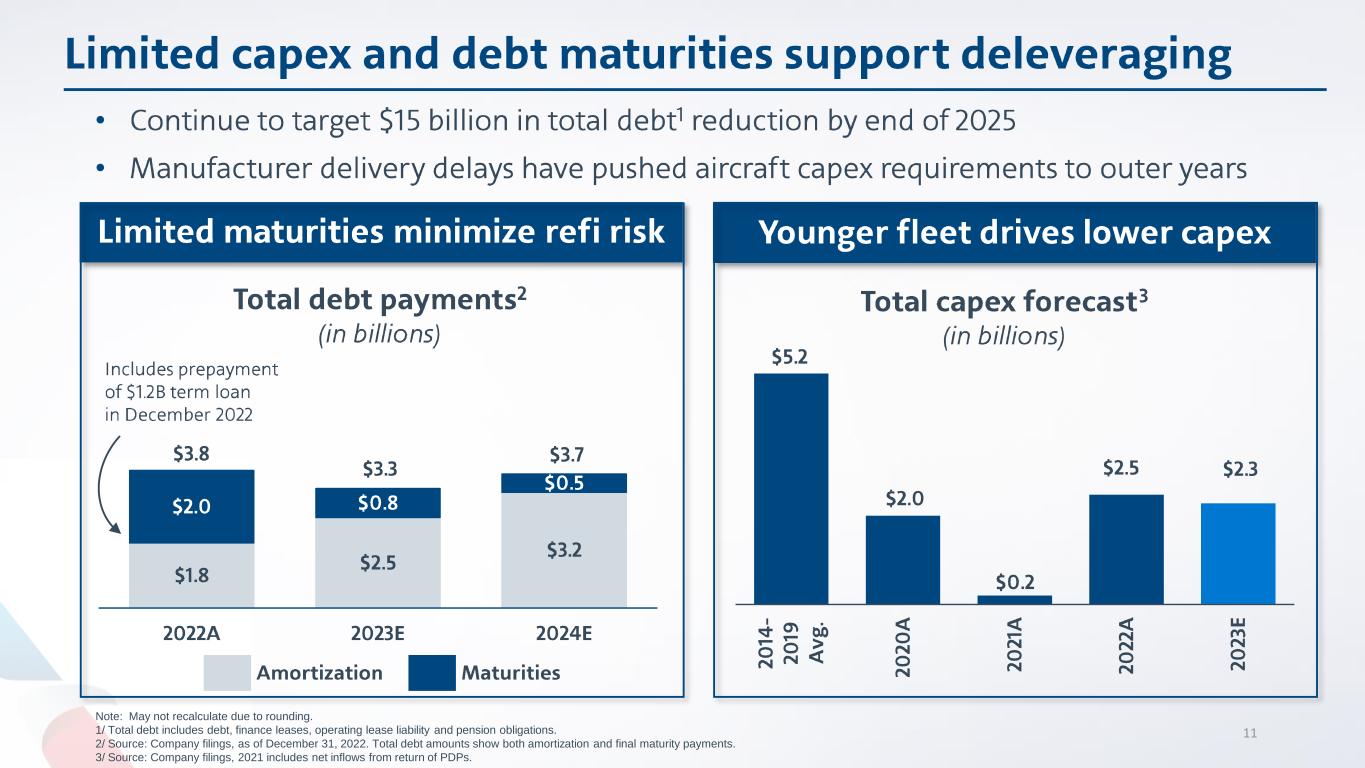
Note: May not recalculate due to rounding. 1/ Total debt includes debt, finance leases, operating lease liability and pension obligations. 2/ Source: Company filings, as of December 31, 2022. Total debt amounts show both amortization and final maturity payments. 3/ Source: Company filings, 2021 includes net inflows from return of PDPs. 11 • •
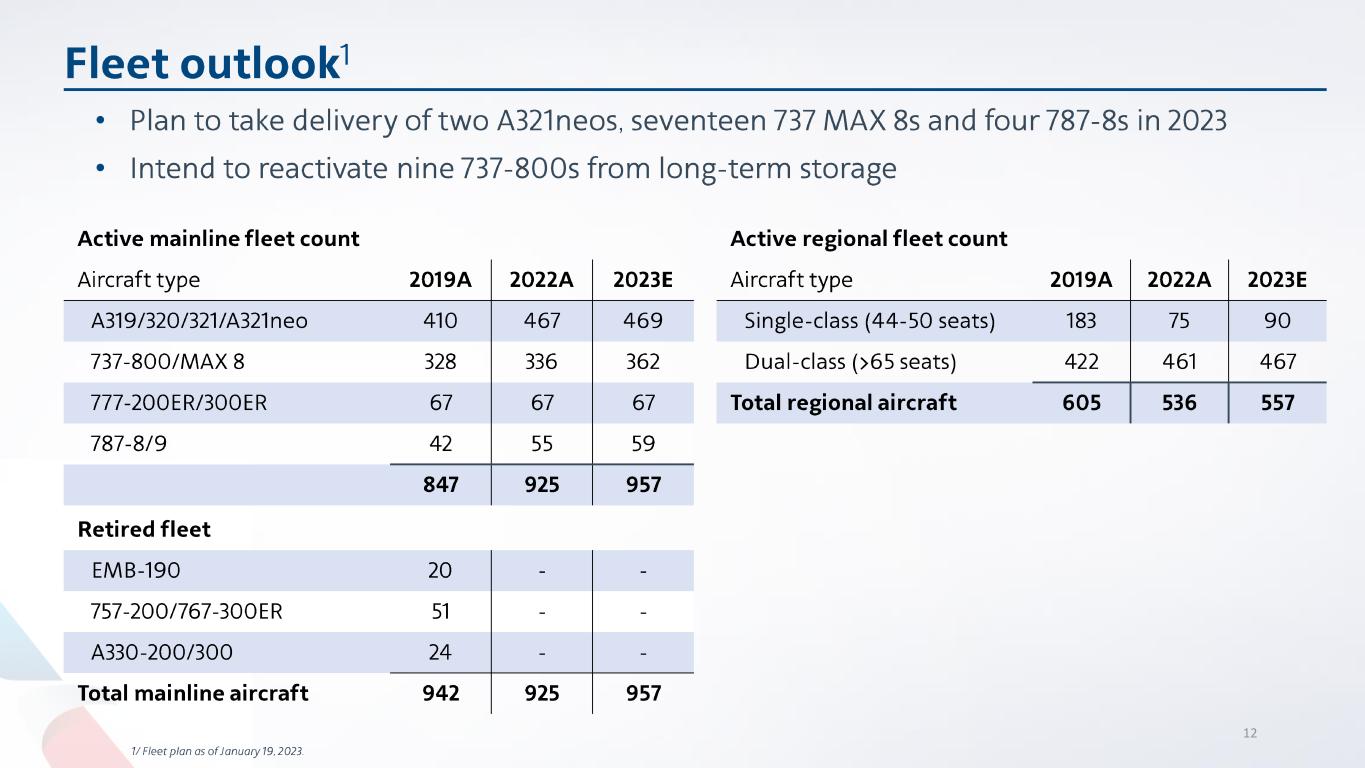
12 • •
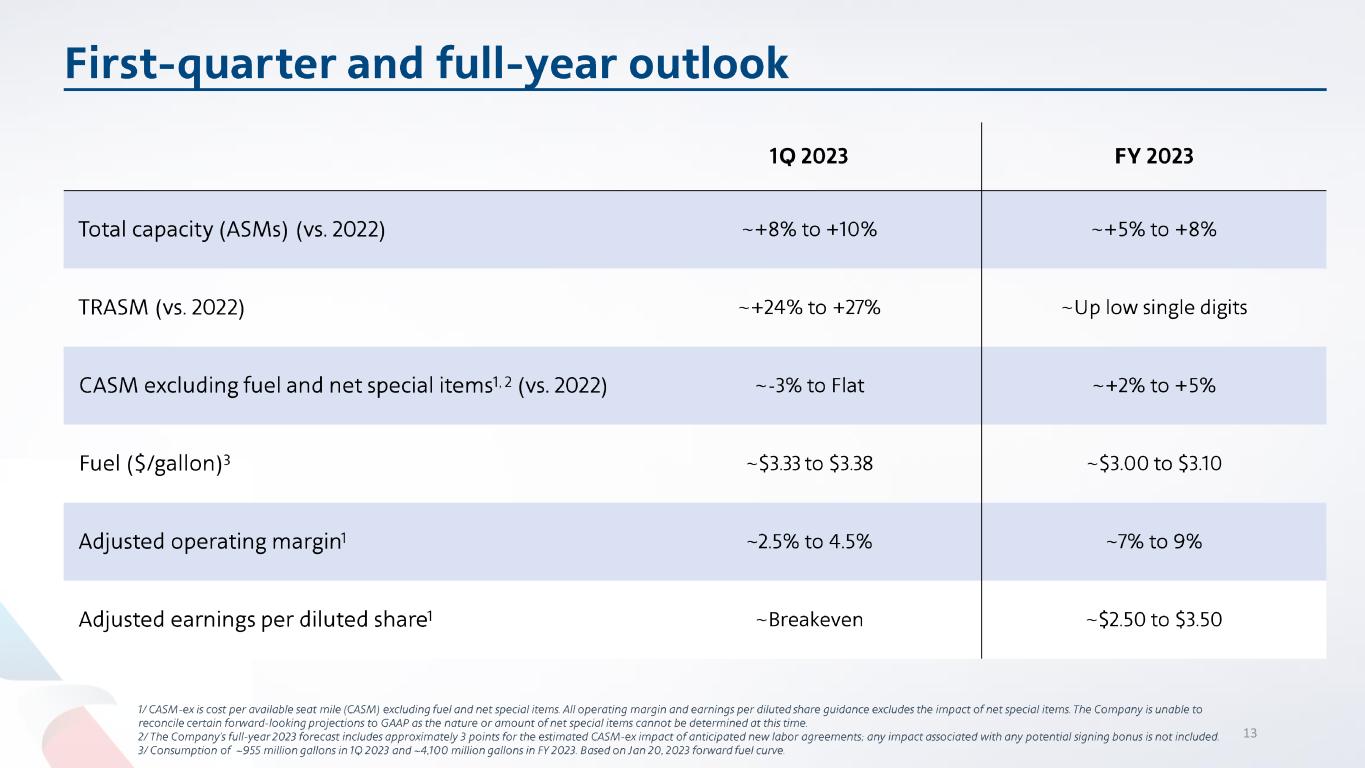
13

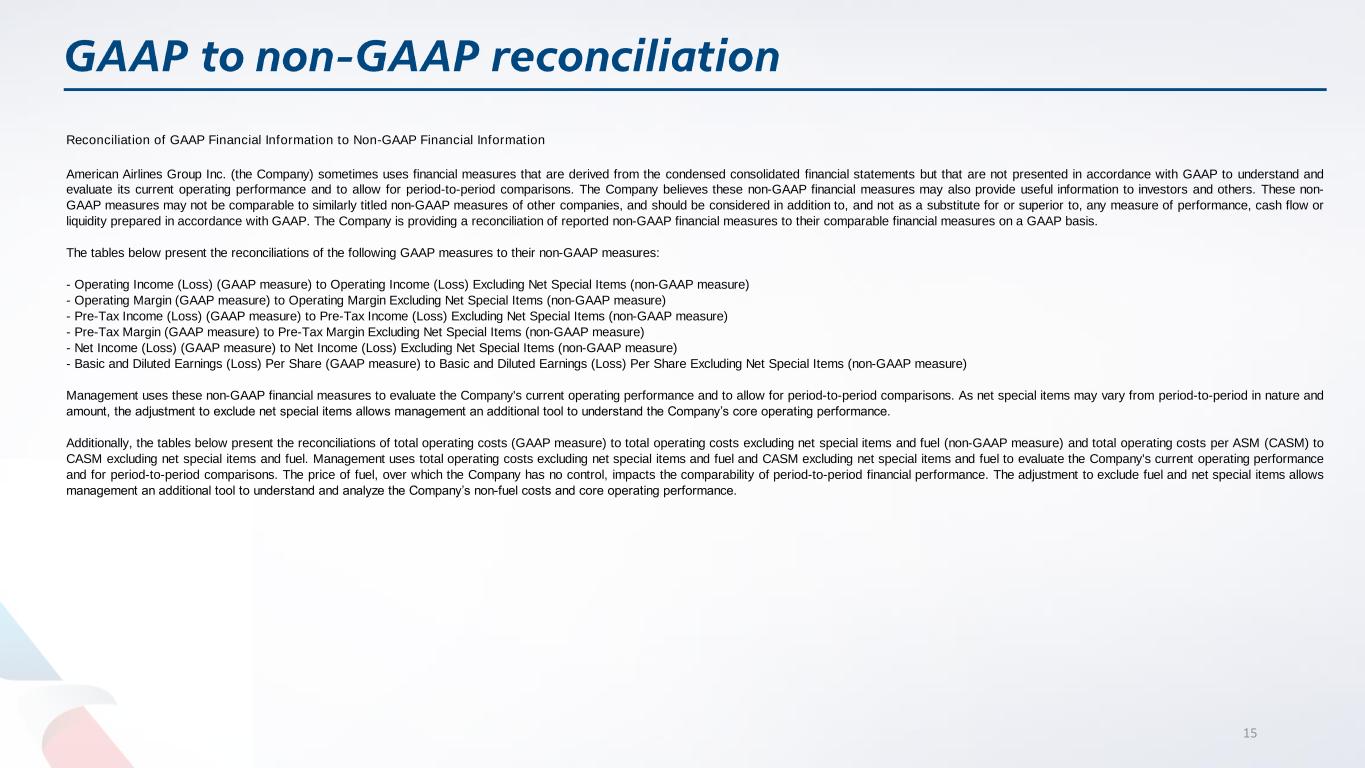
15 Reconciliation of GAAP Financial Information to Non-GAAP Financial Information American Airlines Group Inc. (the Company) sometimes uses financial measures that are derived from the condensed consolidated financial statements but that are not presented in accordance with GAAP to understand and evaluate its current operating performance and to allow for period-to-period comparisons. The Company believes these non-GAAP financial measures may also provide useful information to investors and others. These non- GAAP measures may not be comparable to similarly titled non-GAAP measures of other companies, and should be considered in addition to, and not as a substitute for or superior to, any measure of performance, cash flow or liquidity prepared in accordance with GAAP. The Company is providing a reconciliation of reported non-GAAP financial measures to their comparable financial measures on a GAAP basis. The tables below present the reconciliations of the following GAAP measures to their non-GAAP measures: - Operating Income (Loss) (GAAP measure) to Operating Income (Loss) Excluding Net Special Items (non-GAAP measure) - Operating Margin (GAAP measure) to Operating Margin Excluding Net Special Items (non-GAAP measure) - Pre-Tax Income (Loss) (GAAP measure) to Pre-Tax Income (Loss) Excluding Net Special Items (non-GAAP measure) - Pre-Tax Margin (GAAP measure) to Pre-Tax Margin Excluding Net Special Items (non-GAAP measure) - Net Income (Loss) (GAAP measure) to Net Income (Loss) Excluding Net Special Items (non-GAAP measure) - Basic and Diluted Earnings (Loss) Per Share (GAAP measure) to Basic and Diluted Earnings (Loss) Per Share Excluding Net Special Items (non-GAAP measure) Management uses these non-GAAP financial measures to evaluate the Company's current operating performance and to allow for period-to-period comparisons. As net special items may vary from period-to-period in nature and amount, the adjustment to exclude net special items allows management an additional tool to understand the Company’s core operating performance. Additionally, the tables below present the reconciliations of total operating costs (GAAP measure) to total operating costs excluding net special items and fuel (non-GAAP measure) and total operating costs per ASM (CASM) to CASM excluding net special items and fuel. Management uses total operating costs excluding net special items and fuel and CASM excluding net special items and fuel to evaluate the Company's current operating performance and for period-to-period comparisons. The price of fuel, over which the Company has no control, impacts the comparability of period-to-period financial performance. The adjustment to exclude fuel and net special items allows management an additional tool to understand and analyze the Company’s non-fuel costs and core operating performance.
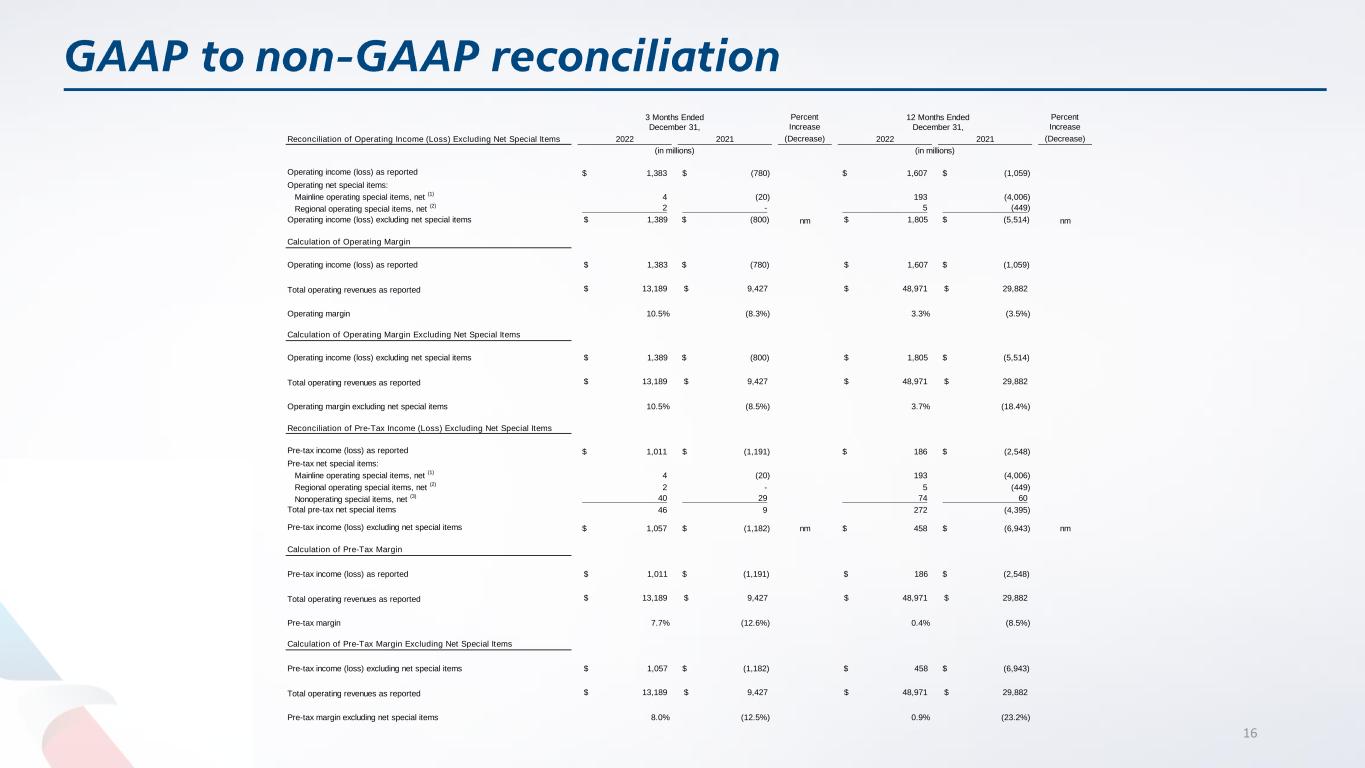
16 Percent Increase Percent Increase Reconciliation of Operating Income (Loss) Excluding Net Special Items 2022 2021 (Decrease) 2022 2021 (Decrease) Operating income (loss) as reported 1,383$ (780)$ 1,607$ (1,059)$ Operating net special items: Mainline operating special items, net (1) 4 (20) 193 (4,006) Regional operating special items, net (2) 2 - 5 (449) Operating income (loss) excluding net special items $ 1,389 $ (800) nm $ 1,805 $ (5,514) nm Calculation of Operating Margin Operating income (loss) as reported $ 1,383 $ (780) $ 1,607 $ (1,059) Total operating revenues as reported $ 13,189 $ 9,427 $ 48,971 $ 29,882 Operating margin 10.5% (8.3%) 3.3% (3.5%) Calculation of Operating Margin Excluding Net Special Items Operating income (loss) excluding net special items $ 1,389 $ (800) $ 1,805 $ (5,514) Total operating revenues as reported $ 13,189 $ 9,427 $ 48,971 $ 29,882 Operating margin excluding net special items 10.5% (8.5%) 3.7% (18.4%) Reconciliation of Pre-Tax Income (Loss) Excluding Net Special Items Pre-tax income (loss) as reported 1,011$ (1,191)$ 186$ (2,548)$ Pre-tax net special items: Mainline operating special items, net (1) 4 (20) 193 (4,006) Regional operating special items, net (2) 2 - 5 (449) Nonoperating special items, net (3) 40 29 74 60 Total pre-tax net special items 46 9 272 (4,395) Pre-tax income (loss) excluding net special items 1,057$ (1,182)$ nm 458$ (6,943)$ nm Calculation of Pre-Tax Margin Pre-tax income (loss) as reported $ 1,011 $ (1,191) $ 186 $ (2,548) Total operating revenues as reported $ 13,189 $ 9,427 $ 48,971 $ 29,882 Pre-tax margin 7.7% (12.6%) 0.4% (8.5%) Calculation of Pre-Tax Margin Excluding Net Special Items Pre-tax income (loss) excluding net special items $ 1,057 $ (1,182) $ 458 $ (6,943) Total operating revenues as reported $ 13,189 $ 9,427 $ 48,971 $ 29,882 Pre-tax margin excluding net special items 8.0% (12.5%) 0.9% (23.2%) 3 Months Ended December 31, (in millions) (in millions) 12 Months Ended December 31,

17 Percent Increase Percent Increase Reconciliation of Net Income (Loss) Excluding Net Special Items 2022 2021 (Decrease) 2022 2021 (Decrease) Net income (loss) as reported 803$ (931)$ 127$ (1,993)$ Net special items: Total pre-tax net special items (1), (2), (3) 46 9 272 (4,395) Income tax special items, net - - (9) - Net tax effect of net special items (22) 1 (62) 993 Net income (loss) excluding net special items 827$ (921)$ nm 328$ (5,395)$ nm Reconciliation of Basic and Diluted Earnings (Loss) Per Share Excluding Net Special Items Net income (loss) excluding net special items 827$ (921)$ 328$ (5,395)$ Shares used for computation (in thousands): Basic 650,944 648,766 650,345 644,015 Diluted 716,070 648,766 655,122 644,015 Earnings (loss) per share excluding net special items: Basic 1.27$ (1.42)$ 0.50$ (8.38)$ Diluted (4) 1.17$ (1.42)$ 0.50$ (8.38)$ Reconciliation of Total Operating Costs per ASM Excluding Net Special Items and Fuel Total operating expenses as reported 11,806$ 10,207$ 47,364$ 30,941$ Operating net special items: Mainline operating special items, net (1) (4) 20 (193) 4,006 Regional operating special items, net (2) (2) - (5) 449 Total operating expenses excluding net special items 11,800 10,227 47,166 35,396 Aircraft fuel and related taxes (3,421) (2,196) (13,791) (6,792) Total operating expenses excluding net special items and fuel 8,379$ 8,031$ 33,375$ 28,604$ Total operating expenses per ASM as reported 17.90 16.70 18.20 14.42 Operating net special items per ASM: Mainline operating special items, net (1) (0.01) 0.03 (0.07) 1.87 Regional operating special items, net (2) - - - 0.21 Total operating expenses per ASM excluding net special items 17.89 16.74 18.13 16.50 Aircraft fuel and related taxes per ASM (5.19) (3.59) (5.30) (3.17) Total operating expenses per ASM excluding net special items and fuel 12.70 13.14 12.83 13.33 Note: Amounts may not recalculate due to rounding. 3 Months Ended December 31, 12 Months Ended December 31, (in cents) (in cents) (in millions, except share and per share amounts) (in millions, except share and per share amounts)
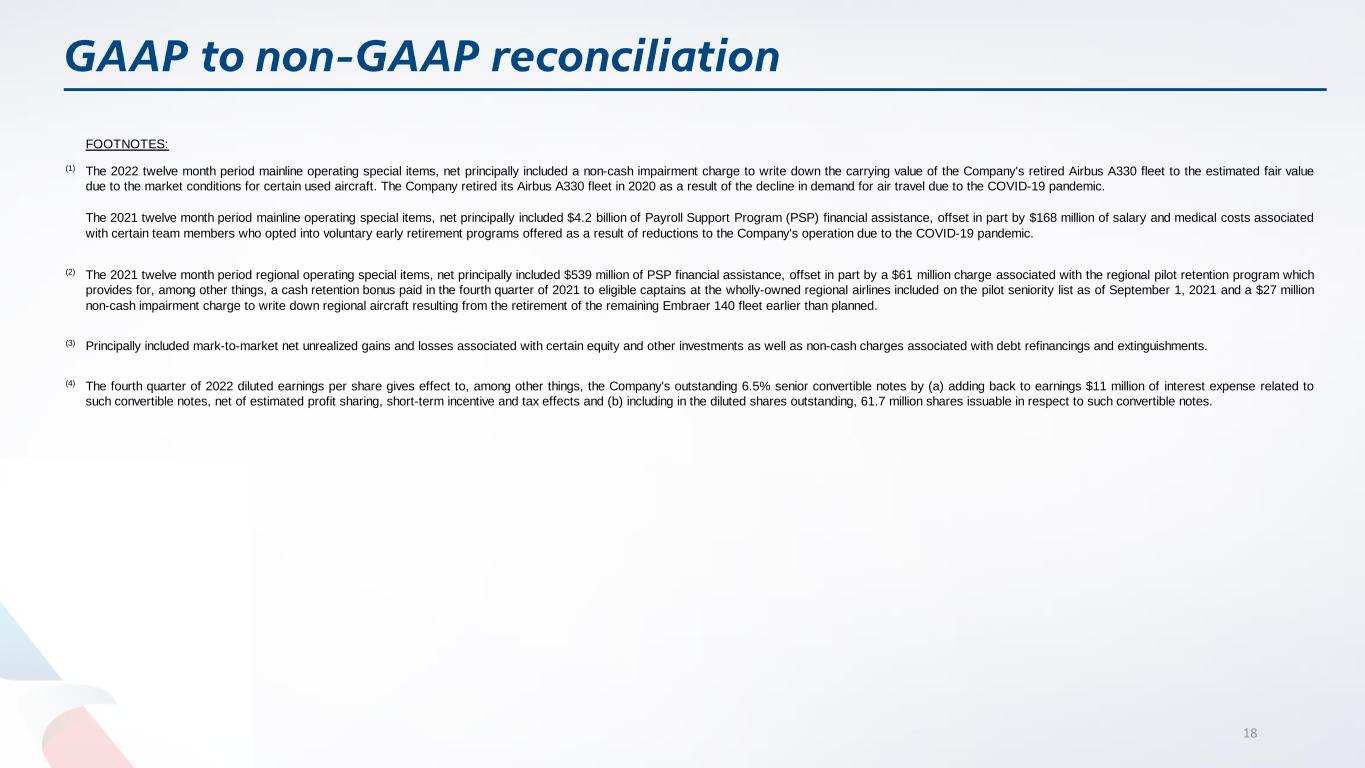
18 FOOTNOTES: (1) (2) (3) (4) The 2021 twelve month period regional operating special items, net principally included $539 million of PSP financial assistance, offset in part by a $61 million charge associated with the regional pilot retention program which provides for, among other things, a cash retention bonus paid in the fourth quarter of 2021 to eligible captains at the wholly-owned regional airlines included on the pilot seniority list as of September 1, 2021 and a $27 million non-cash impairment charge to write down regional aircraft resulting from the retirement of the remaining Embraer 140 fleet earlier than planned. The 2022 twelve month period mainline operating special items, net principally included a non-cash impairment charge to write down the carrying value of the Company's retired Airbus A330 fleet to the estimated fair value due to the market conditions for certain used aircraft. The Company retired its Airbus A330 fleet in 2020 as a result of the decline in demand for air travel due to the COVID-19 pandemic. The 2021 twelve month period mainline operating special items, net principally included $4.2 billion of Payroll Support Program (PSP) financial assistance, offset in part by $168 million of salary and medical costs associated with certain team members who opted into voluntary early retirement programs offered as a result of reductions to the Company's operation due to the COVID-19 pandemic. The fourth quarter of 2022 diluted earnings per share gives effect to, among other things, the Company's outstanding 6.5% senior convertible notes by (a) adding back to earnings $11 million of interest expense related to such convertible notes, net of estimated profit sharing, short-term incentive and tax effects and (b) including in the diluted shares outstanding, 61.7 million shares issuable in respect to such convertible notes. Principally included mark-to-market net unrealized gains and losses associated with certain equity and other investments as well as non-cash charges associated with debt refinancings and extinguishments.

19


