
April 25, 2024 FIRST- QUARTER 2024 FINANCIAL RESULTS American Airlines Group Inc. Exhibit 99.2
Certain of the statements contained in this presentation should be considered forward-looking statements within the meaning of the Securities Act of 1933, as amended, the Securities Exchange Act of 1934, as amended, and the Private Securities Litigation Reform Act of 1995. These forward- looking statements may be identified by words such as “may,” “will,” “expect,” “intend,” “anticipate,” “believe,” “estimate,” “plan,” “project,” “could,” “should,” “would,” “continue,” “seek,” “target,” “guidance,” “outlook,” “if current trends continue,” “optimistic,” “forecast” and other similar words. Such statements include, but are not limited to, statements about the Company’s plans, objectives, expectations, intentions, estimates and strategies for the future, and other statements that are not historical facts. These forward-looking statements are based on the Company’s current objectives, beliefs and expectations, and they are subject to significant risks and uncertainties that may cause actual results and financial position and timing of certain events to differ materially from the information in the forward-looking statements. These risks and uncertainties include, but are not limited to, those set forth herein as well as in the Company’s Quarterly Report on Form 10-Q for the quarter ended March 31, 2024 (especially in Part I, Item 2. Management’s Discussion and Analysis of Financial Condition and Results of Operations and Part II, Item 1A. Risk Factors), and other risks and uncertainties listed from time to time in the Company’s other filings with the Securities and Exchange Commission. Additionally, there may be other factors of which the Company is not currently aware that may affect matters discussed in the forward-looking statements and may also cause actual results to differ materially from those discussed. The Company does not assume any obligation to publicly update or supplement any forward-looking statement to reflect actual results, changes in assumptions or changes in other factors affecting these forward-looking statements other than as required by law. Any forward-looking statements speak only as of the date hereof or as of the dates indicated in the statement. Forward-looking statements
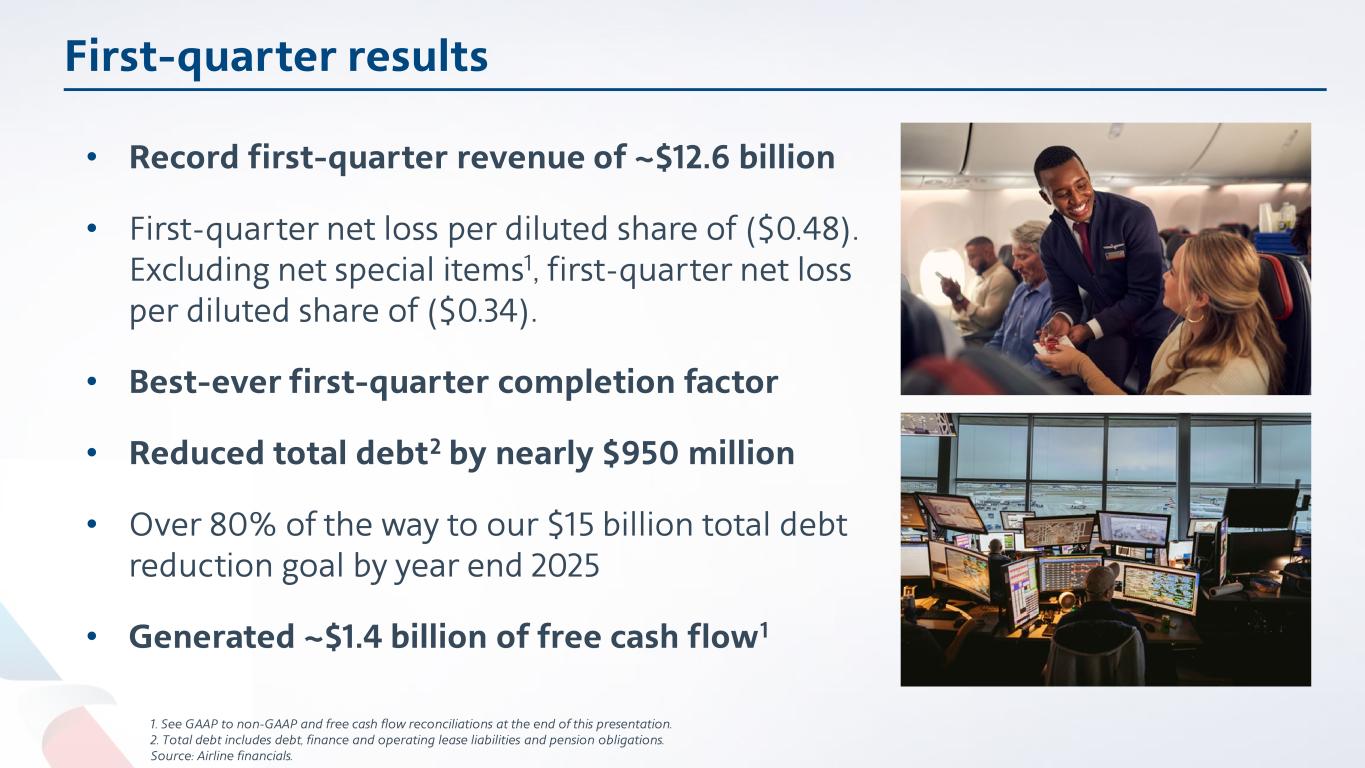
First-quarter results • Record first-quarter revenue of ~$12.6 billion • First-quarter net loss per diluted share of ($0.48). Excluding net special items1, first-quarter net loss per diluted share of ($0.34). • Best-ever first-quarter completion factor • Reduced total debt2 by nearly $950 million • Over 80% of the way to our $15 billion total debt reduction goal by year end 2025 • Generated ~$1.4 billion of free cash flow1 1. See GAAP to non-GAAP and free cash flow reconciliations at the end of this presentation. 2. Total debt includes debt, finance and operating lease liabilities and pension obligations. Source: Airline financials.
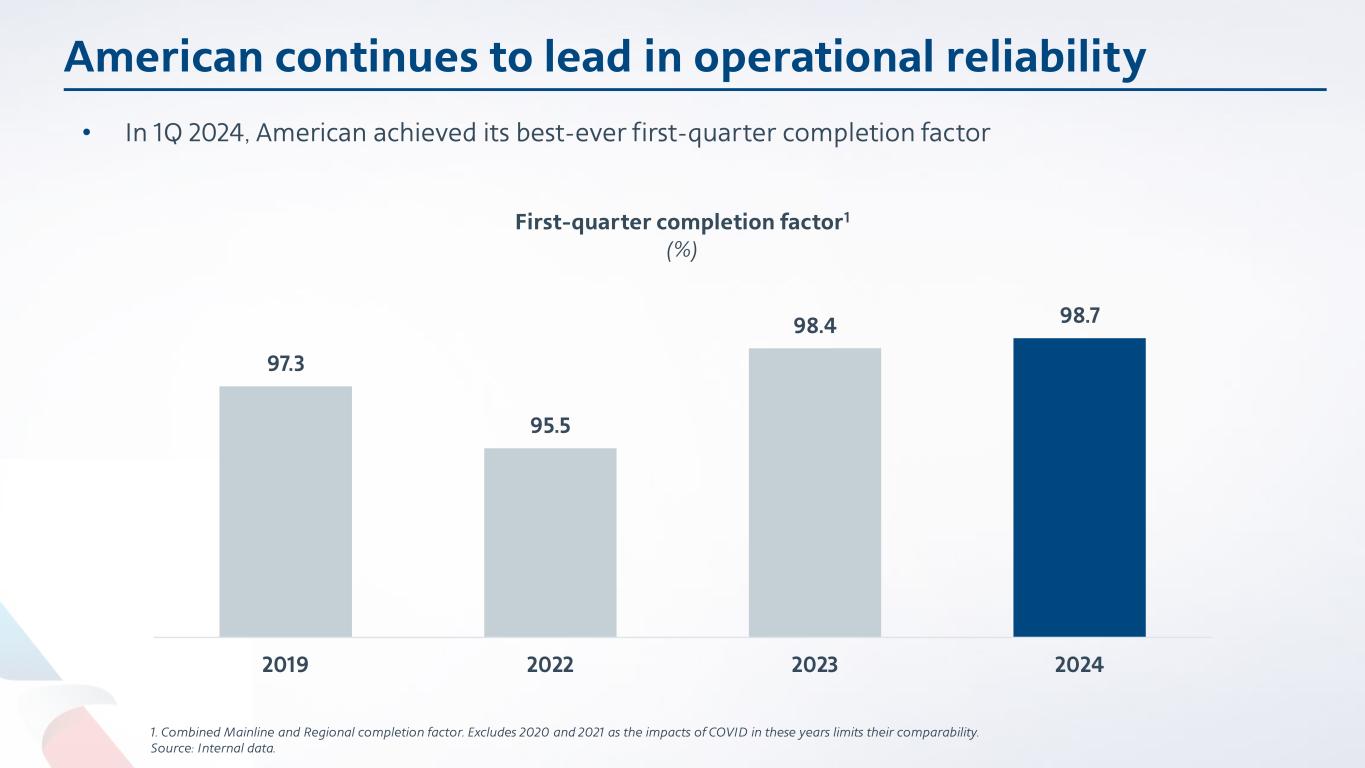
97.3 95.5 98.4 98.7 2019 2022 2023 2024 American continues to lead in operational reliability • In 1Q 2024, American achieved its best-ever first-quarter completion factor First-quarter completion factor1 (%) 1. Combined Mainline and Regional completion factor. Excludes 2020 and 2021 as the impacts of COVID in these years limits their comparability. Source: Internal data.
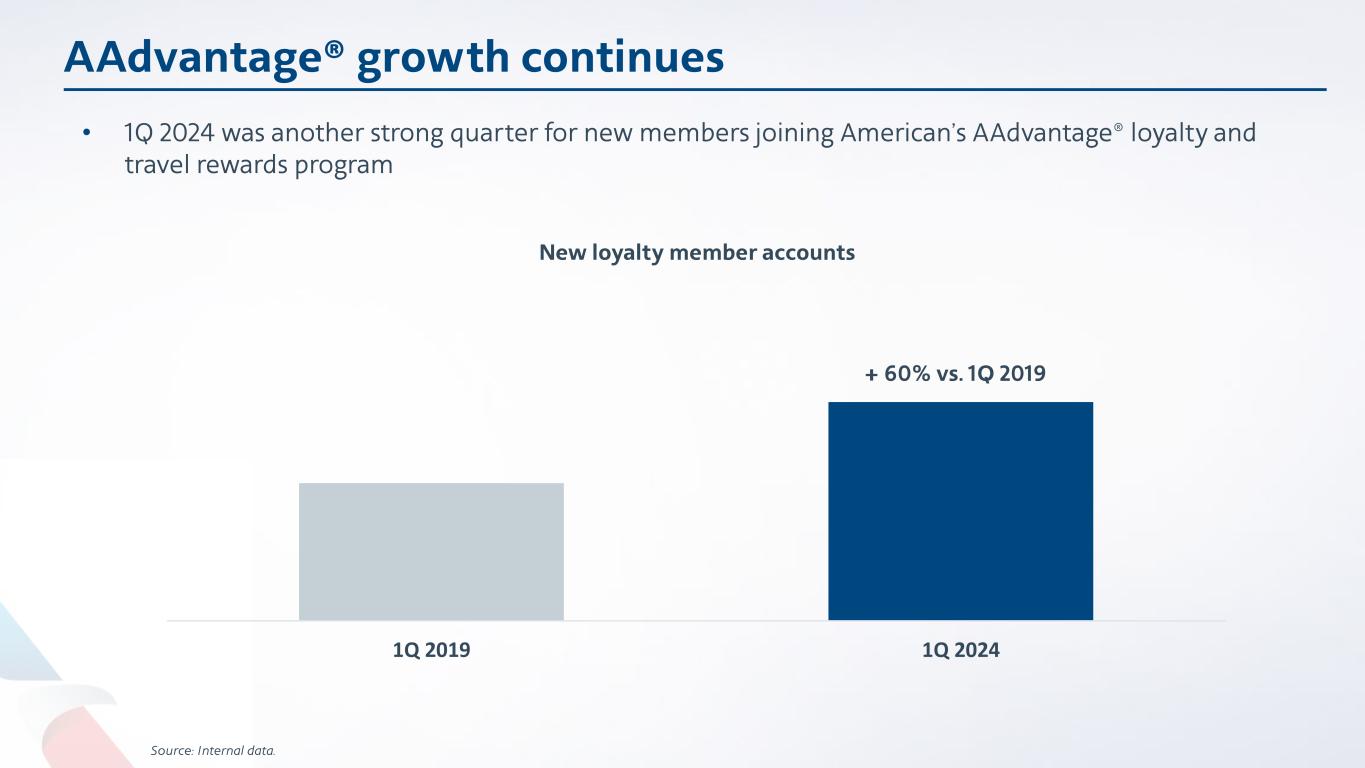
1Q 2019 1Q 2024 New loyalty member accounts AAdvantage® growth continues • 1Q 2024 was another strong quarter for new members joining American’s AAdvantage® loyalty and travel rewards program Source: Internal data. + 60% vs. 1Q 2019
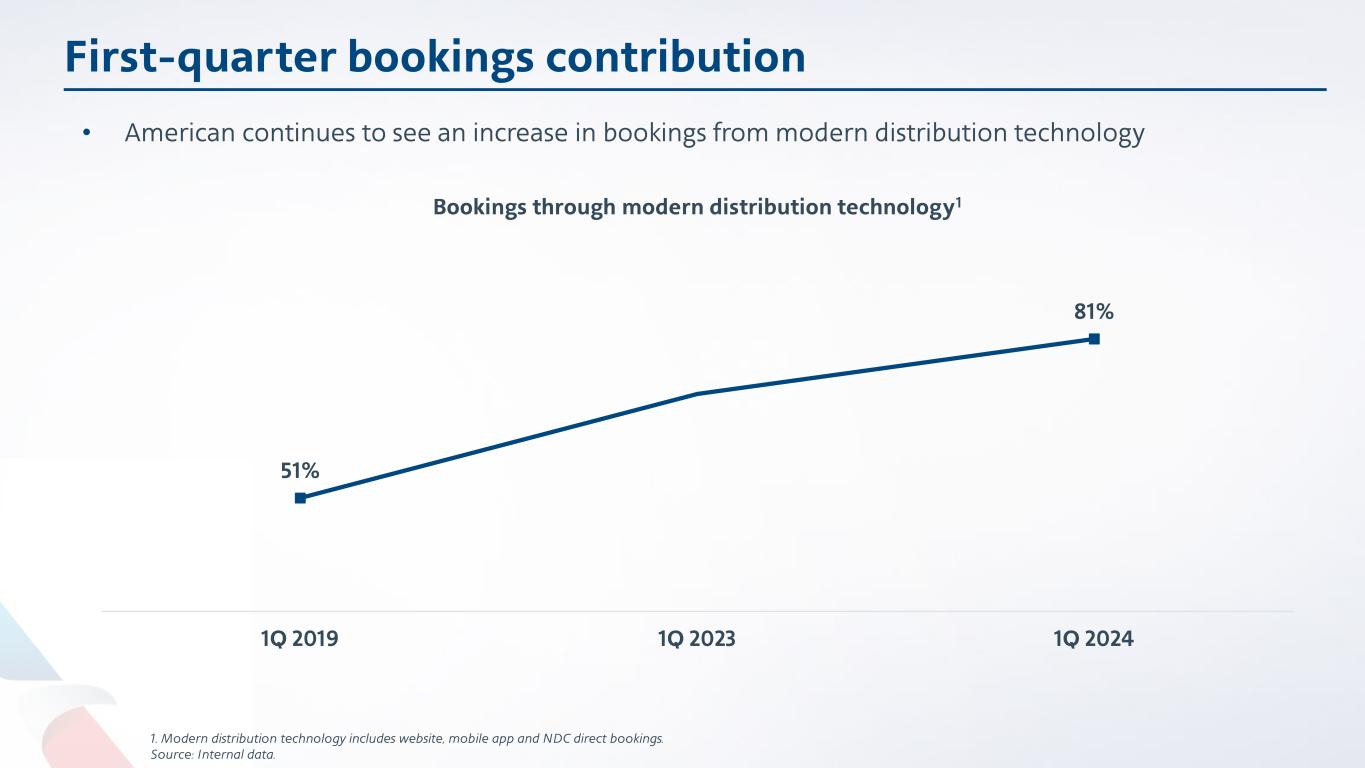
51% 81% 1Q 2019 1Q 2023 1Q 2024 First-quarter bookings contribution • American continues to see an increase in bookings from modern distribution technology 1. Modern distribution technology includes website, mobile app and NDC direct bookings. Source: Internal data. Bookings through modern distribution technology1

Financial update
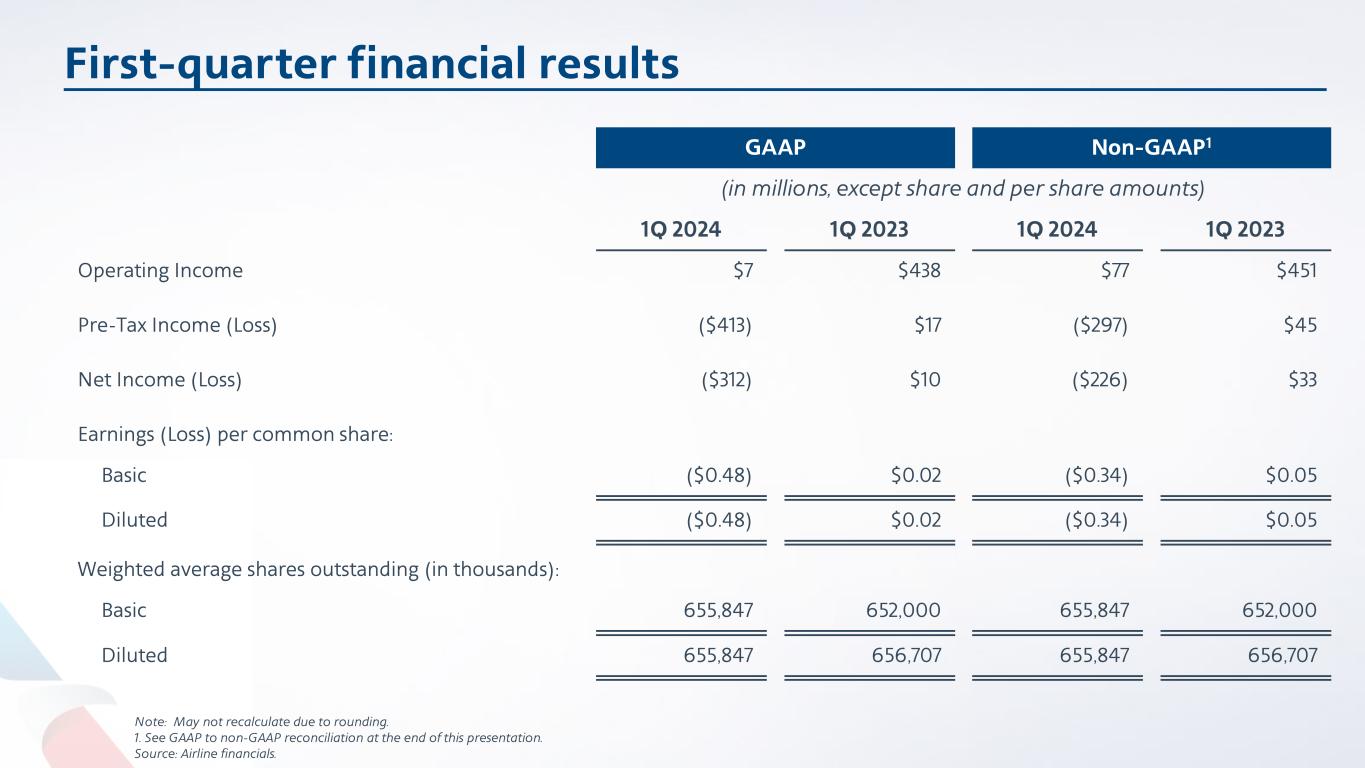
First-quarter financial results Note: May not recalculate due to rounding. 1. See GAAP to non-GAAP reconciliation at the end of this presentation. Source: Airline financials. GAAP Non-GAAP1 (in millions, except share and per share amounts) 1Q 2024 1Q 2023 1Q 2024 1Q 2023 Operating Income $7 $438 $77 $451 Pre-Tax Income (Loss) ($413) $17 ($297) $45 Net Income (Loss) ($312) $10 ($226) $33 Earnings (Loss) per common share: Basic ($0.48) $0.02 ($0.34) $0.05 Diluted ($0.48) $0.02 ($0.34) $0.05 Weighted average shares outstanding (in thousands): Basic 655,847 652,000 655,847 652,000 Diluted 655,847 656,707 655,847 656,707

(3.7) (5.0) (4.3) 2Q 2021 Total Debt Maturities & Prepayments Amortizing Debt Lease & Pension YE 2024E Total Debt YE 2025E Total Debt Longer Term Total Debt Balance sheet strengthening continues ~13B Peak • $12.3 billion total debt1 reduction from peak levels through first-quarter 2024 • On track to reduce total debt from peak levels by ~$13 billion by the end of 2024 ($ in billions) 1. Total debt includes debt, finance and operating lease liabilities and pension obligations. 2. Net of new financings. Source: Airline financials. 2 Total debt1 reduction 54 < 35 ~ 41 ~ 39

$3.8 $1.8 $1.9 ~$2.2 ~$3.0-$3.5 2014 - 2019 Avg. 2022 2023 2024E 2025E - 2030E Avg. Young fleet enables a moderate capex profile Source: Airline financials for historical data. Total aircraft capex ($ in billions)
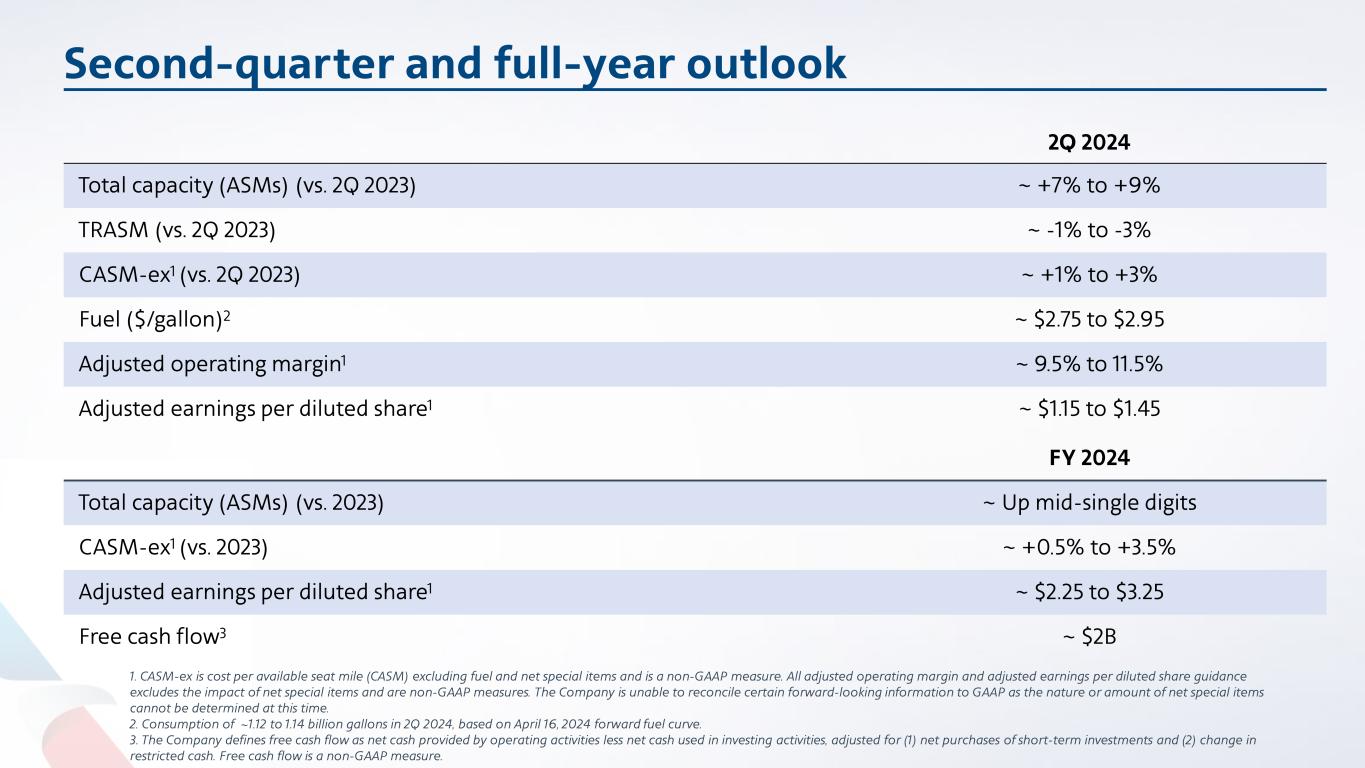
Second-quarter and full-year outlook 1. CASM-ex is cost per available seat mile (CASM) excluding fuel and net special items and is a non-GAAP measure. All adjusted operating margin and adjusted earnings per diluted share guidance excludes the impact of net special items and are non-GAAP measures. The Company is unable to reconcile certain forward-looking information to GAAP as the nature or amount of net special items cannot be determined at this time. 2. Consumption of ~1.12 to 1.14 billion gallons in 2Q 2024, based on April 16, 2024 forward fuel curve. 3. The Company defines free cash flow as net cash provided by operating activities less net cash used in investing activities, adjusted for (1) net purchases of short-term investments and (2) change in restricted cash. Free cash flow is a non-GAAP measure. 2Q 2024 Total capacity (ASMs) (vs. 2Q 2023) ~ +7% to +9% TRASM (vs. 2Q 2023) ~ -1% to -3% CASM-ex1 (vs. 2Q 2023) ~ +1% to +3% Fuel ($/gallon)2 ~ $2.75 to $2.95 Adjusted operating margin1 ~ 9.5% to 11.5% Adjusted earnings per diluted share1 ~ $1.15 to $1.45 FY 2024 Total capacity (ASMs) (vs. 2023) ~ Up mid-single digits CASM-ex1 (vs. 2023) ~ +0.5% to +3.5% Adjusted earnings per diluted share1 ~ $2.25 to $3.25 Free cash flow3 ~ $2B

Thank you, #AATeam 4/24/2024
GAAP to non-GAAP reconciliation Reconciliation of GAAP Financial Information to Non-GAAP Financial Information American Airlines Group Inc. (the Company) sometimes uses financial measures that are derived from the condensed consolidated financial statements but that are not presented in accordance with GAAP to understand and evaluate its current operating performance and to allow for period-to-period comparisons. The Company believes these non-GAAP financial measures may also provide useful information to investors and others. These non-GAAP measures may not be comparable to similarly titled non-GAAP measures of other companies, and should be considered in addition to, and not as a substitute for or superior to, any measure of performance, cash flow or liquidity prepared in accordance with GAAP. The Company is providing a reconciliation of reported non-GAAP financial measures to their comparable financial measures on a GAAP basis. The tables below present the reconciliations of the following GAAP measures to their non-GAAP measures: - Operating Income (GAAP measure) to Operating Income Excluding Net Special Items (non-GAAP measure) - Operating Margin (GAAP measure) to Operating Margin Excluding Net Special Items (non-GAAP measure) - Pre-Tax Income (Loss) (GAAP measure) to Pre-Tax Income (Loss) Excluding Net Special Items (non-GAAP measure) - Pre-Tax Margin (GAAP measure) to Pre-Tax Margin Excluding Net Special Items (non-GAAP measure) - Net Income (Loss) (GAAP measure) to Net Income (Loss) Excluding Net Special Items (non-GAAP measure) - Basic and Diluted Earnings (Loss) Per Share (GAAP measure) to Basic and Diluted Earnings (Loss) Per Share Excluding Net Special Items (non-GAAP measure) Management uses these non-GAAP financial measures to evaluate the Company's current operating performance and to allow for period-to-period comparisons. As net special items may vary from period-to-period in nature and amount, the adjustment to exclude net special items allows management an additional tool to understand the Company’s core operating performance. Additionally, the tables below present the reconciliations of total operating costs (GAAP measure) to total operating costs excluding net special items and fuel (non- GAAP measure) and total operating costs per ASM (CASM) to CASM excluding net special items and fuel. Management uses total operating costs excluding net special items and fuel and CASM excluding net special items and fuel to evaluate the Company's current operating performance and for period-to-period comparisons. The price of fuel, over which the Company has no control, impacts the comparability of period-to-period financial performance. The adjustment to exclude fuel and net special items allows management an additional tool to understand and analyze the Company’s non-fuel costs and core operating performance.

GAAP to non-GAAP reconciliation Reconciliation of Operating Income Excluding Net Special Items 3 Months Ended March 31, Percent Increase 2024 2023 (Decrease) (in millions) Operating income as reported $ 7 $ 438 Operating net special items: Mainline operating special items, net (1) 70 13 Operating income excluding net special items $ 77 $ 451 (83.0%) Calculation of Operating Margin Operating income as reported $ 7 $ 438 Total operating revenues as reported $ 12,570 $ 12,189 Operating margin 0.1% 3.6% Calculation of Operating Margin Excluding Net Special Items Operating income excluding net special items $ 77 $ 451 Total operating revenues as reported $ 12,570 $ 12,189 Operating margin excluding net special items 0.6% 3.7% Reconciliation of Pre-Tax Income (Loss) Excluding Net Special Items Pre-tax income (loss) as reported $ (413) $ 17 Pre-tax net special items: Mainline operating special items, net (1) 70 13 Nonoperating special items, net (2) 46 15 Total pre-tax net special items 116 28 Pre-tax income (loss) excluding net special items $ (297) $ 45 nm Calculation of Pre-Tax Margin Pre-tax income (loss) as reported $ (413) $ 17 Total operating revenues as reported $ 12,570 $ 12,189 Pre-tax margin (3.3%) 0.1% Calculation of Pre-Tax Margin Excluding Net Special Items Pre-tax income (loss) excluding net special items $ (297) $ 45 Total operating revenues as reported $ 12,570 $ 12,189 Pre-tax margin excluding net special items (2.4%) 0.4%
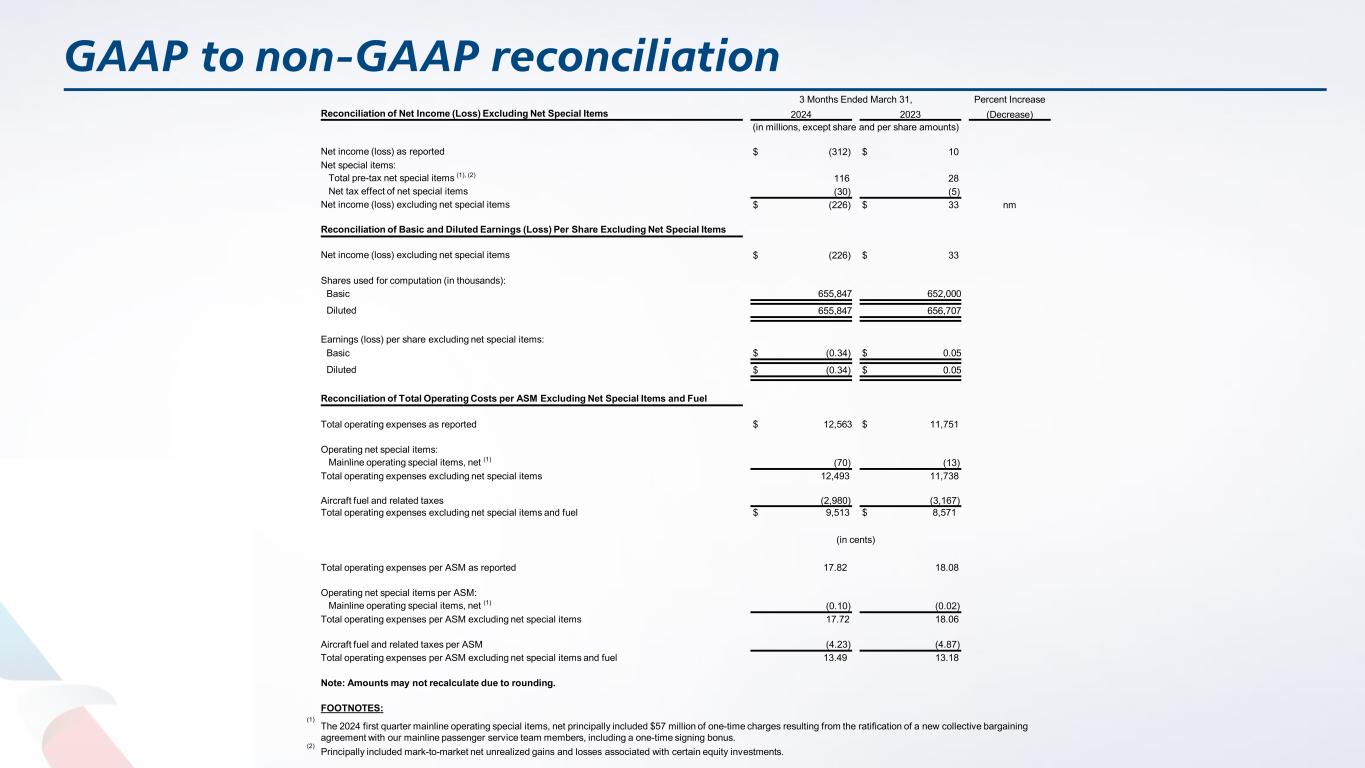
GAAP to non-GAAP reconciliation 3 Months Ended March 31, Percent Increase Reconciliation of Net Income (Loss) Excluding Net Special Items 2024 2023 (Decrease) (in millions, except share and per share amounts) Net income (loss) as reported $ (312) $ 10 Net special items: Total pre-tax net special items (1), (2) 116 28 Net tax effect of net special items (30) (5) Net income (loss) excluding net special items $ (226) $ 33 nm Reconciliation of Basic and Diluted Earnings (Loss) Per Share Excluding Net Special Items Net income (loss) excluding net special items $ (226) $ 33 Shares used for computation (in thousands): Basic 655,847 652,000 Diluted 655,847 656,707 Earnings (loss) per share excluding net special items: Basic $ (0.34) $ 0.05 Diluted $ (0.34) $ 0.05 Reconciliation of Total Operating Costs per ASM Excluding Net Special Items and Fuel Total operating expenses as reported $ 12,563 $ 11,751 Operating net special items: Mainline operating special items, net (1) (70) (13) Total operating expenses excluding net special items 12,493 11,738 Aircraft fuel and related taxes (2,980) (3,167) Total operating expenses excluding net special items and fuel $ 9,513 $ 8,571 (in cents) Total operating expenses per ASM as reported 17.82 18.08 Operating net special items per ASM: Mainline operating special items, net (1) (0.10) (0.02) Total operating expenses per ASM excluding net special items 17.72 18.06 Aircraft fuel and related taxes per ASM (4.23) (4.87) Total operating expenses per ASM excluding net special items and fuel 13.49 13.18 Note: Amounts may not recalculate due to rounding. FOOTNOTES: (1) The 2024 first quarter mainline operating special items, net principally included $57 million of one-time charges resulting from the ratification of a new collective bargaining agreement with our mainline passenger service team members, including a one-time signing bonus. (2) Principally included mark-to-market net unrealized gains and losses associated with certain equity investments.
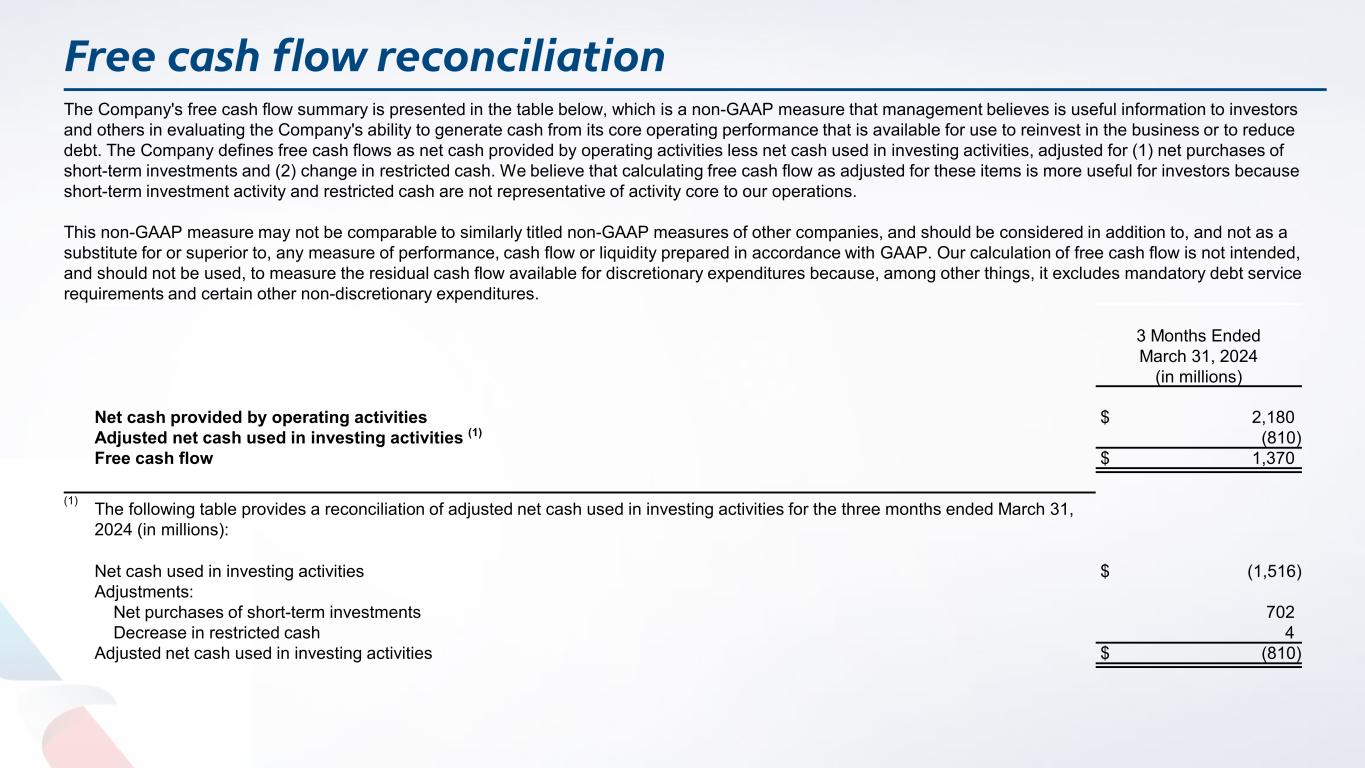
Free cash flow reconciliation The Company's free cash flow summary is presented in the table below, which is a non-GAAP measure that management believes is useful information to investors and others in evaluating the Company's ability to generate cash from its core operating performance that is available for use to reinvest in the business or to reduce debt. The Company defines free cash flows as net cash provided by operating activities less net cash used in investing activities, adjusted for (1) net purchases of short-term investments and (2) change in restricted cash. We believe that calculating free cash flow as adjusted for these items is more useful for investors because short-term investment activity and restricted cash are not representative of activity core to our operations. This non-GAAP measure may not be comparable to similarly titled non-GAAP measures of other companies, and should be considered in addition to, and not as a substitute for or superior to, any measure of performance, cash flow or liquidity prepared in accordance with GAAP. Our calculation of free cash flow is not intended, and should not be used, to measure the residual cash flow available for discretionary expenditures because, among other things, it excludes mandatory debt service requirements and certain other non-discretionary expenditures. 3 Months Ended March 31, 2024 (in millions) Net cash provided by operating activities $ 2,180 Adjusted net cash used in investing activities (1) (810) Free cash flow $ 1,370 (1) The following table provides a reconciliation of adjusted net cash used in investing activities for the three months ended March 31, 2024 (in millions): Net cash used in investing activities $ (1,516) Adjustments: Net purchases of short-term investments 702 Decrease in restricted cash 4 Adjusted net cash used in investing activities $ (810)
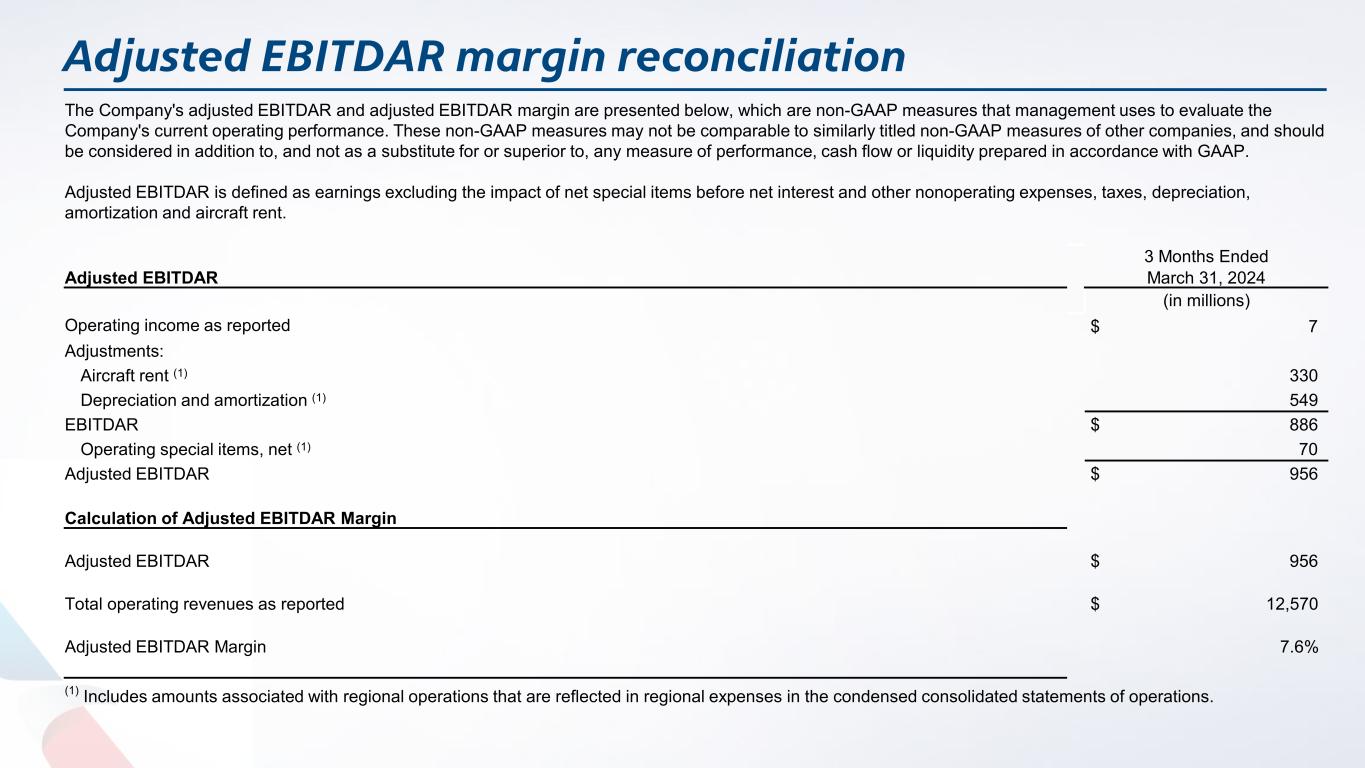
Adjusted EBITDAR margin reconciliation The Company's adjusted EBITDAR and adjusted EBITDAR margin are presented below, which are non-GAAP measures that management uses to evaluate the Company's current operating performance. These non-GAAP measures may not be comparable to similarly titled non-GAAP measures of other companies, and should be considered in addition to, and not as a substitute for or superior to, any measure of performance, cash flow or liquidity prepared in accordance with GAAP. Adjusted EBITDAR is defined as earnings excluding the impact of net special items before net interest and other nonoperating expenses, taxes, depreciation, amortization and aircraft rent. 3 Months Ended Adjusted EBITDAR March 31, 2024 (in millions) Operating income as reported $ 7 Adjustments: Aircraft rent (1) 330 Depreciation and amortization (1) 549 EBITDAR $ 886 Operating special items, net (1) 70 Adjusted EBITDAR $ 956 Calculation of Adjusted EBITDAR Margin Adjusted EBITDAR $ 956 Total operating revenues as reported $ 12,570 Adjusted EBITDAR Margin 7.6% (1) Includes amounts associated with regional operations that are reflected in regional expenses in the condensed consolidated statements of operations.
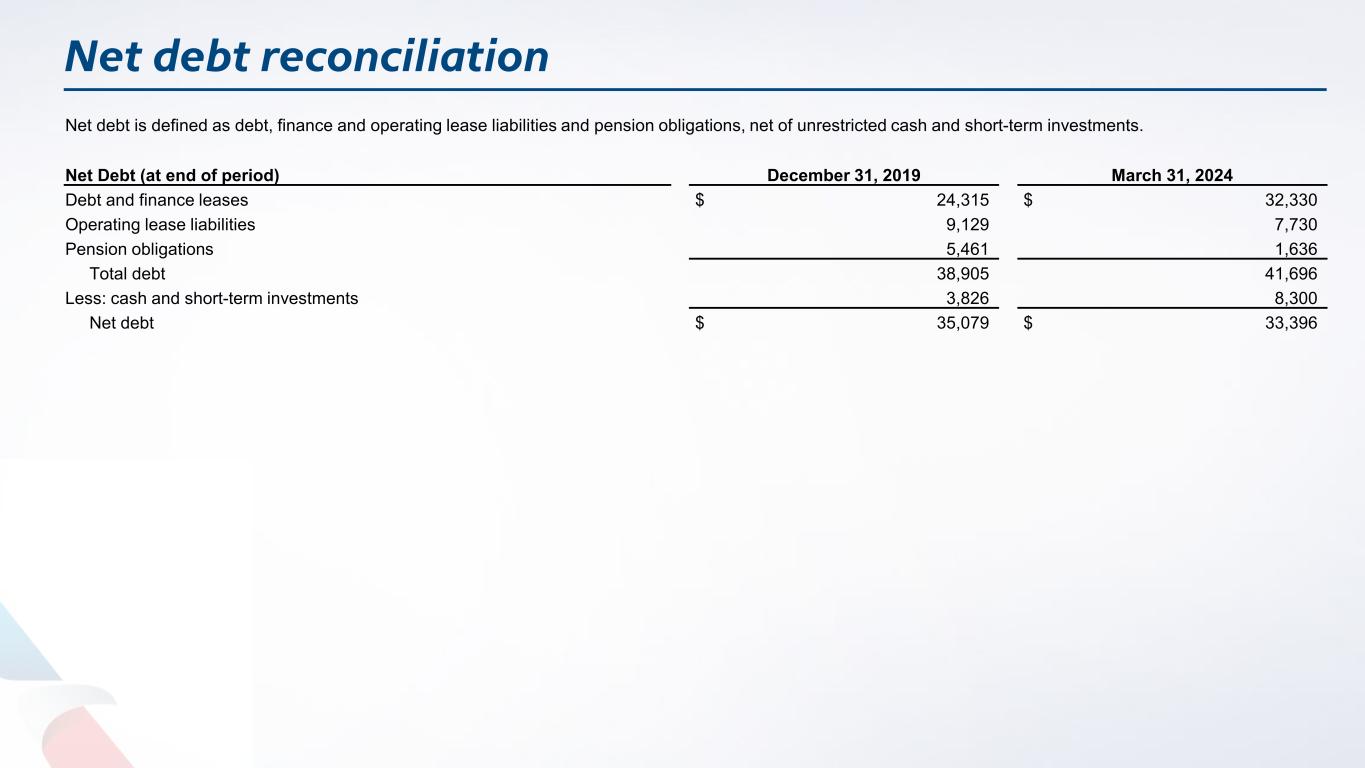
Net debt reconciliation Net debt is defined as debt, finance and operating lease liabilities and pension obligations, net of unrestricted cash and short-term investments. Net Debt (at end of period) December 31, 2019 March 31, 2024 Debt and finance leases $ 24,315 $ 32,330 Operating lease liabilities 9,129 7,730 Pension obligations 5,461 1,636 Total debt 38,905 41,696 Less: cash and short-term investments 3,826 8,300 Net debt $ 35,079 $ 33,396


