
October 24, 2024 THIRD- QUARTER 2024 FINANCIAL RESULTS American Airlines Group Inc. Exhibit 99.2

Certain of the statements contained in this presentation should be considered forward-looking statements within the meaning of the Securities Act of 1933, as amended, the Securities Exchange Act of 1934, as amended, and the Private Securities Litigation Reform Act of 1995. These forward- looking statements may be identified by words such as “may,” “will,” “expect,” “intend,” “anticipate,” “believe,” “estimate,” “plan,” “project,” “could,” “should,” “would,” “continue,” “seek,” “target,” “guidance,” “outlook,” “if current trends continue,” “optimistic,” “forecast” and other similar words. Such statements include, but are not limited to, statements about the Company’s plans, objectives, expectations, intentions, estimates and strategies for the future, and other statements that are not historical facts. These forward-looking statements are based on the Company’s current objectives, beliefs and expectations, and they are subject to significant risks and uncertainties that may cause actual results and financial position and timing of certain events to differ materially from the information in the forward-looking statements. These risks and uncertainties include, but are not limited to, those set forth herein as well as in the Company’s Quarterly Report on Form 10-Q for the quarter ended September 30, 2024 (especially in Part I, Item 2. Management’s Discussion and Analysis of Financial Condition and Results of Operations and Part II, Item 1A. Risk Factors), and other risks and uncertainties listed from time to time in the Company’s other filings with the Securities and Exchange Commission. Additionally, there may be other factors of which the Company is not currently aware that may affect matters discussed in the forward-looking statements and may also cause actual results to differ materially from those discussed. The Company does not assume any obligation to publicly update or supplement any forward-looking statement to reflect actual results, changes in assumptions or changes in other factors affecting these forward-looking statements other than as required by law. Any forward-looking statements speak only as of the date hereof or as of the dates indicated in the statement. Forward-looking statements 2

Third-quarter results • Record third-quarter revenue of $13.6 billion. • Third-quarter net loss per share of ($0.23). Excluding net special items1, third-quarter net earnings per diluted share of $0.30. • Led U.S. network carriers in third-quarter completion factor. • Reengineering the business initiatives on track to deliver $400 million in cost savings and more than $300 million in working capital improvements this year. 1. See GAAP to non-GAAP reconciliations at the end of this presentation. 3
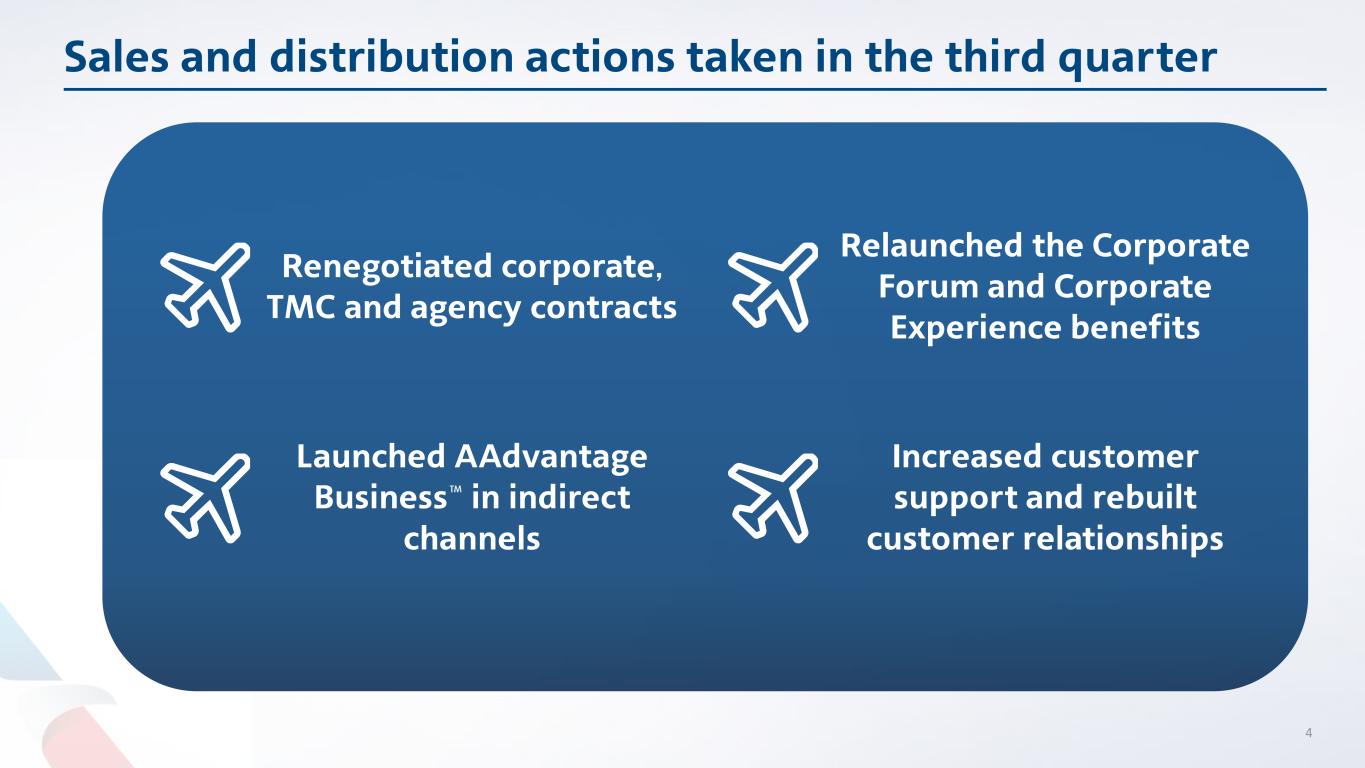
Sales and distribution actions taken in the third quarter 4 Renegotiated corporate, TMC and agency contracts Relaunched the Corporate Forum and Corporate Experience benefits Launched AAdvantage Business in indirect channels Increased customer support and rebuilt customer relationships
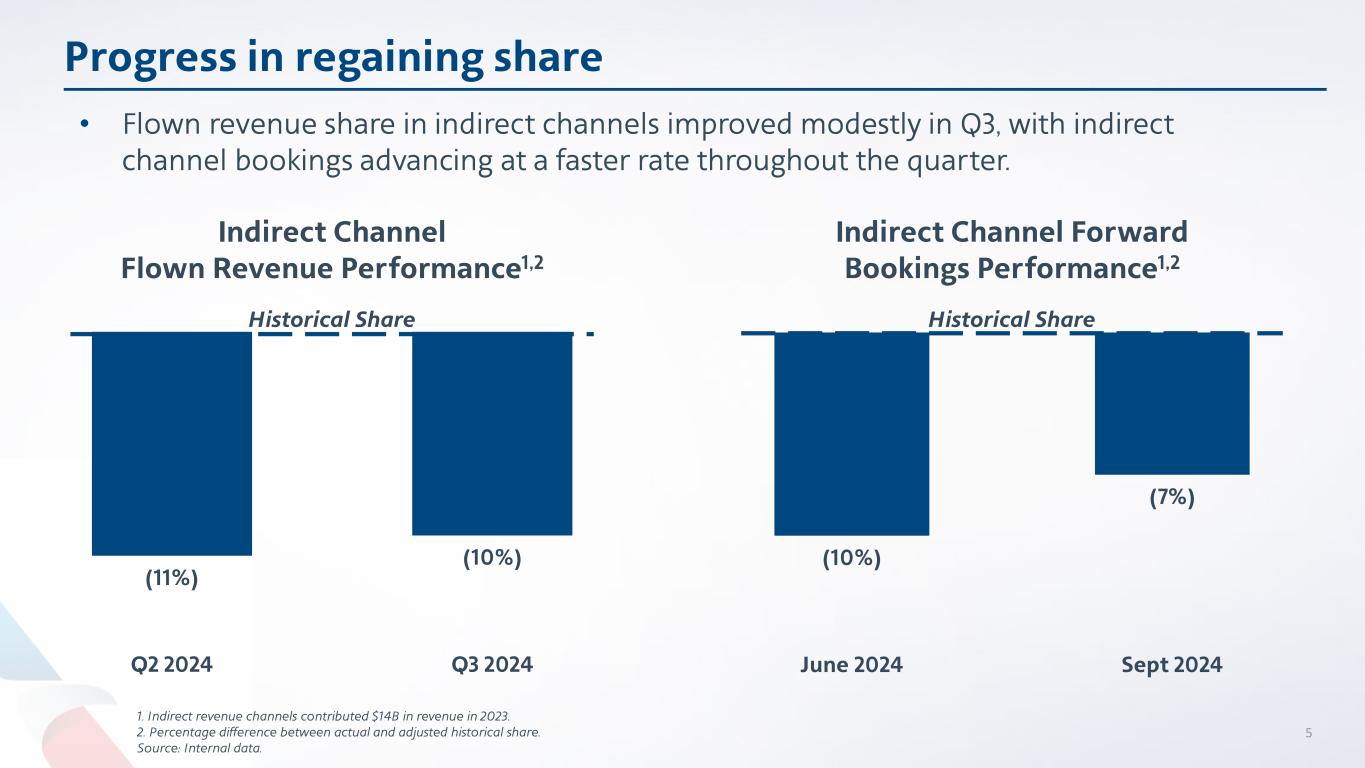
(10%) (7%) June 2024 Sept 2024 (11%) (10%) Q2 2024 Q3 2024 Progress in regaining share Indirect Channel Flown Revenue Performance1,2 Historical Share Indirect Channel Forward Bookings Performance1,2 Historical Share • Flown revenue share in indirect channels improved modestly in Q3, with indirect channel bookings advancing at a faster rate throughout the quarter. 5 1. Indirect revenue channels contributed $14B in revenue in 2023. 2. Percentage difference between actual and adjusted historical share. Source: Internal data.
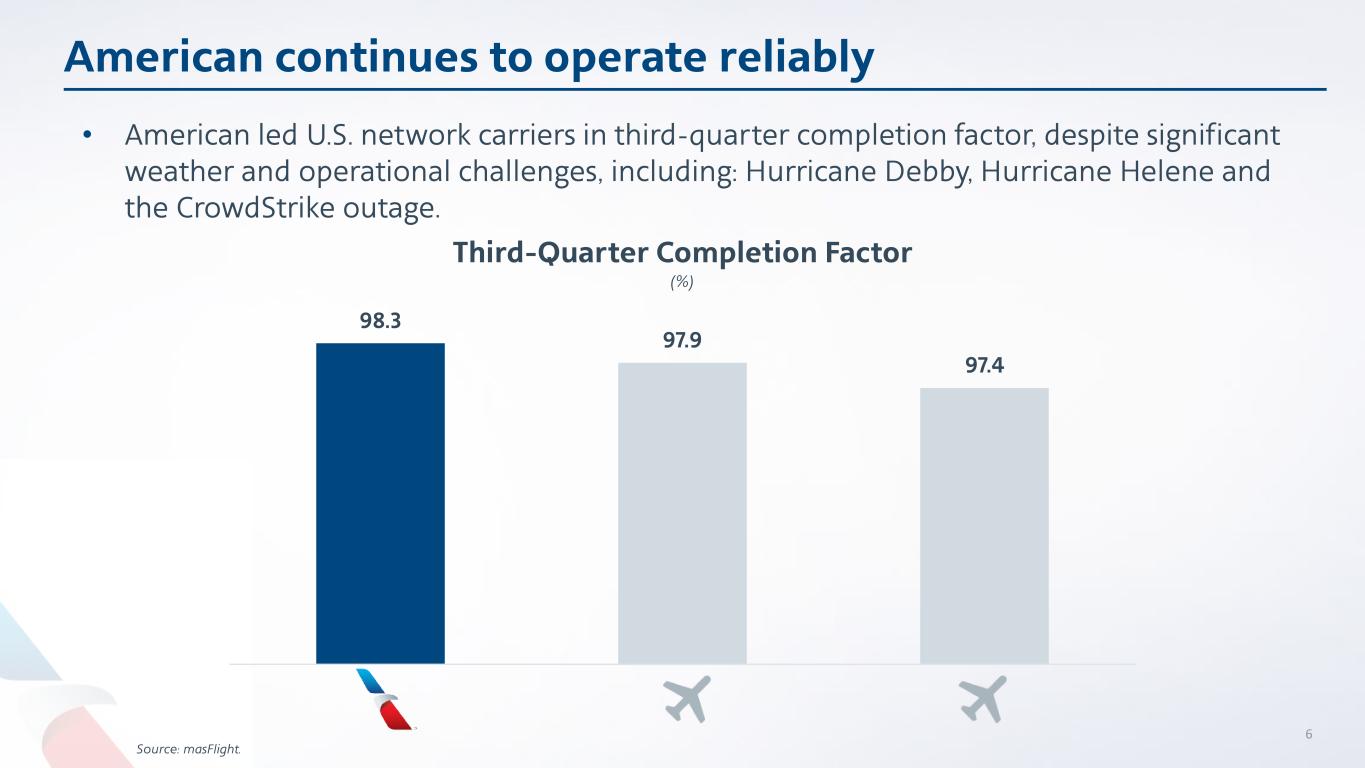
American continues to operate reliably • American led U.S. network carriers in third-quarter completion factor, despite significant weather and operational challenges, including: Hurricane Debby, Hurricane Helene and the CrowdStrike outage. Third-Quarter Completion Factor (%) 6 98.3 97.9 97.4 . Source: masFlight.

Financial update

Third-quarter financial results Note: May not recalculate due to rounding. 1. See GAAP to non-GAAP reconciliation at the end of this presentation. Source: Airline financials. GAAP Non-GAAP1 (in millions, except share and per share amounts) Q3 2024 Q3 2023 Q3 2024 Q3 2023 Operating Income (Loss) $89 ($223) $643 $728 Pretax Income (Loss) ($256) ($690) $271 $362 Net Income (Loss) ($149) ($545) $205 $263 Earnings (Loss) per common share: Basic ($0.23) ($0.83) $0.31 $0.40 Diluted ($0.23) ($0.83) $0.30 $0.38 Weighted average shares outstanding (in thousands): Basic 657,424 654,119 657,424 654,119 Diluted 657,424 654,119 720,086 722,087 8
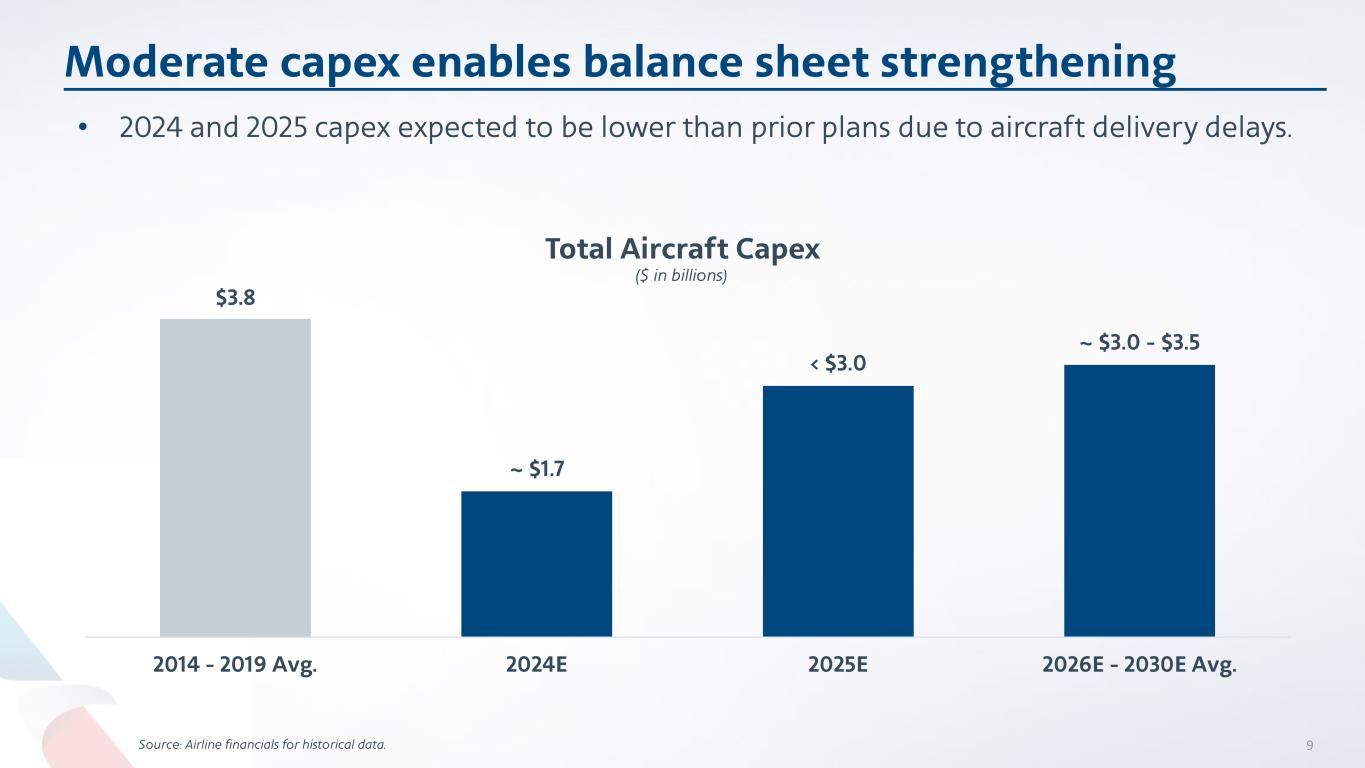
$3.8 ~ $1.7 < $3.0 ~ $3.0 - $3.5 2014 - 2019 Avg. 2024E 2025E 2026E - 2030E Avg. Moderate capex enables balance sheet strengthening Source: Airline financials for historical data. Total Aircraft Capex ($ in billions) • 2024 and 2025 capex expected to be lower than prior plans due to aircraft delivery delays. 9

$54 $41 $39 < $35 ~ ($13) Q2 2021 (peak levels) Total debt reduction Q3 2024 YE 2025E YE 2028E Continued progress toward deleveraging goals Note: Numbers may not recalculate due to rounding. 1. Total debt includes debt, finance and operating lease liabilities and pension obligations. Source: Airline financials. • In Q3 2024, reduced total debt1 by ~$360 million. • Reduced total debt by ~$13 billion from peak levels. • On track to reduce total debt by $15 billion by YE 2025. Total Debt1 ($ in billions) 10
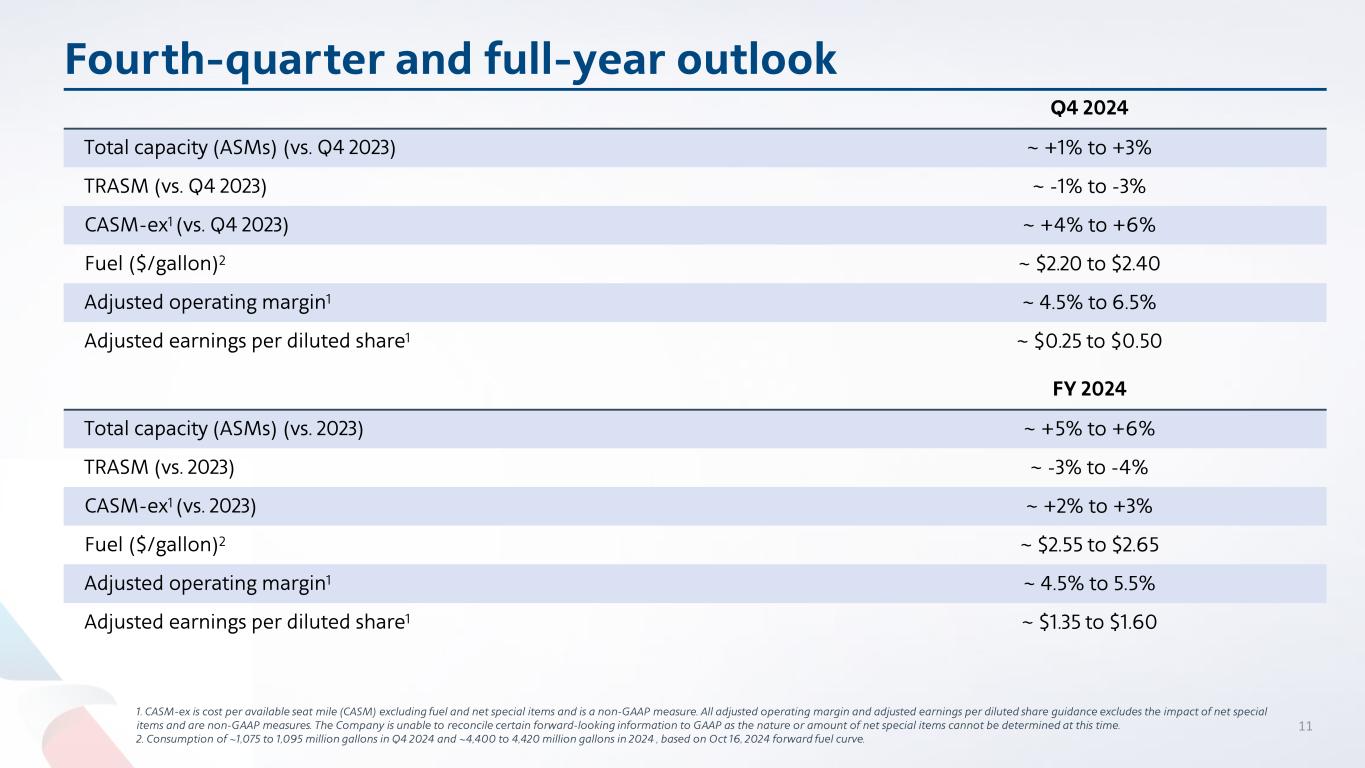
Fourth-quarter and full-year outlook 1. CASM-ex is cost per available seat mile (CASM) excluding fuel and net special items and is a non-GAAP measure. All adjusted operating margin and adjusted earnings per diluted share guidance excludes the impact of net special items and are non-GAAP measures. The Company is unable to reconcile certain forward-looking information to GAAP as the nature or amount of net special items cannot be determined at this time. 2. Consumption of ~1,075 to 1,095 million gallons in Q4 2024 and ~4,400 to 4,420 million gallons in 2024 , based on Oct 16, 2024 forward fuel curve. Q4 2024 Total capacity (ASMs) (vs. Q4 2023) ~ +1% to +3% TRASM (vs. Q4 2023) ~ -1% to -3% CASM-ex1 (vs. Q4 2023) ~ +4% to +6% Fuel ($/gallon)2 ~ $2.20 to $2.40 Adjusted operating margin1 ~ 4.5% to 6.5% Adjusted earnings per diluted share1 ~ $0.25 to $0.50 FY 2024 Total capacity (ASMs) (vs. 2023) ~ +5% to +6% TRASM (vs. 2023) ~ -3% to -4% CASM-ex1 (vs. 2023) ~ +2% to +3% Fuel ($/gallon)2 ~ $2.55 to $2.65 Adjusted operating margin1 ~ 4.5% to 5.5% Adjusted earnings per diluted share1 ~ $1.35 to $1.60 11

Thank you, #AATeam!
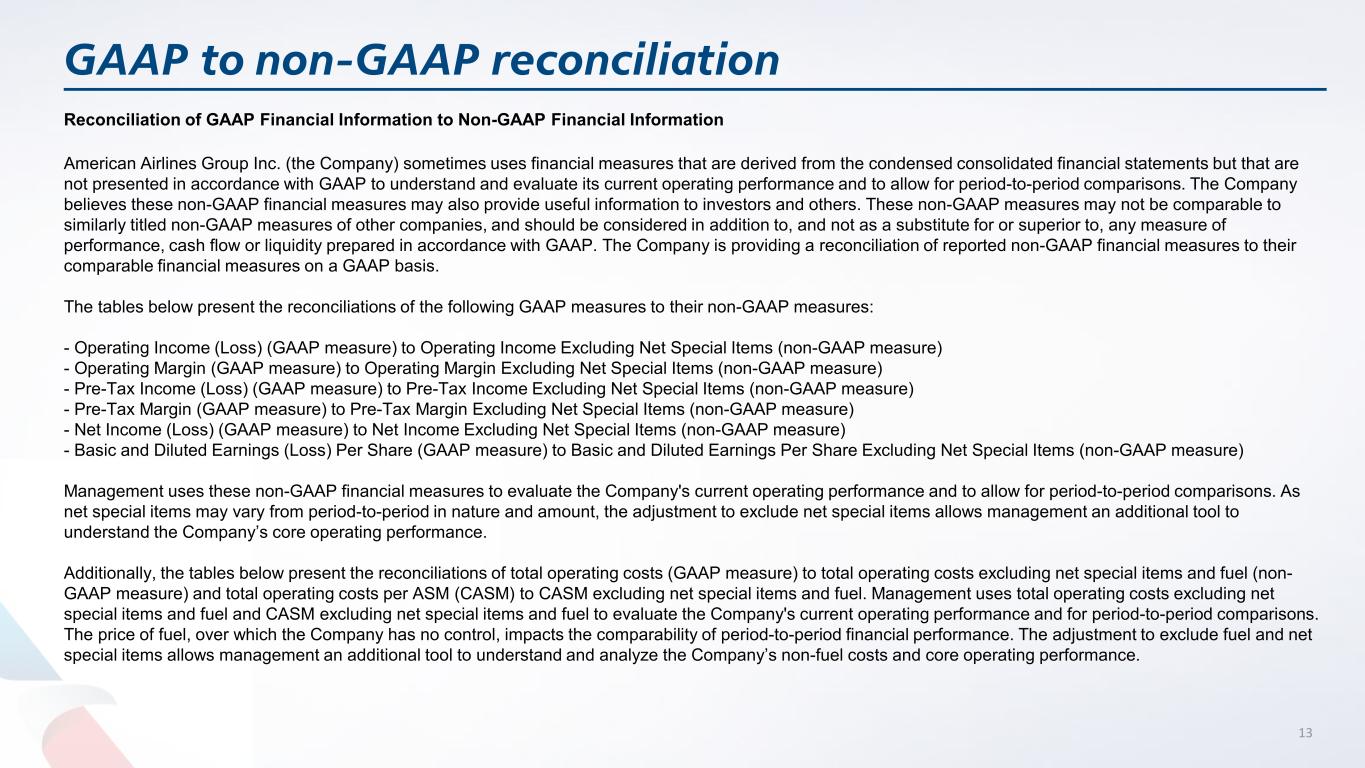
GAAP to non-GAAP reconciliation Reconciliation of GAAP Financial Information to Non-GAAP Financial Information American Airlines Group Inc. (the Company) sometimes uses financial measures that are derived from the condensed consolidated financial statements but that are not presented in accordance with GAAP to understand and evaluate its current operating performance and to allow for period-to-period comparisons. The Company believes these non-GAAP financial measures may also provide useful information to investors and others. These non-GAAP measures may not be comparable to similarly titled non-GAAP measures of other companies, and should be considered in addition to, and not as a substitute for or superior to, any measure of performance, cash flow or liquidity prepared in accordance with GAAP. The Company is providing a reconciliation of reported non-GAAP financial measures to their comparable financial measures on a GAAP basis. The tables below present the reconciliations of the following GAAP measures to their non-GAAP measures: - Operating Income (Loss) (GAAP measure) to Operating Income Excluding Net Special Items (non-GAAP measure) - Operating Margin (GAAP measure) to Operating Margin Excluding Net Special Items (non-GAAP measure) - Pre-Tax Income (Loss) (GAAP measure) to Pre-Tax Income Excluding Net Special Items (non-GAAP measure) - Pre-Tax Margin (GAAP measure) to Pre-Tax Margin Excluding Net Special Items (non-GAAP measure) - Net Income (Loss) (GAAP measure) to Net Income Excluding Net Special Items (non-GAAP measure) - Basic and Diluted Earnings (Loss) Per Share (GAAP measure) to Basic and Diluted Earnings Per Share Excluding Net Special Items (non-GAAP measure) Management uses these non-GAAP financial measures to evaluate the Company's current operating performance and to allow for period-to-period comparisons. As net special items may vary from period-to-period in nature and amount, the adjustment to exclude net special items allows management an additional tool to understand the Company’s core operating performance. Additionally, the tables below present the reconciliations of total operating costs (GAAP measure) to total operating costs excluding net special items and fuel (non- GAAP measure) and total operating costs per ASM (CASM) to CASM excluding net special items and fuel. Management uses total operating costs excluding net special items and fuel and CASM excluding net special items and fuel to evaluate the Company's current operating performance and for period-to-period comparisons. The price of fuel, over which the Company has no control, impacts the comparability of period-to-period financial performance. The adjustment to exclude fuel and net special items allows management an additional tool to understand and analyze the Company’s non-fuel costs and core operating performance. 13
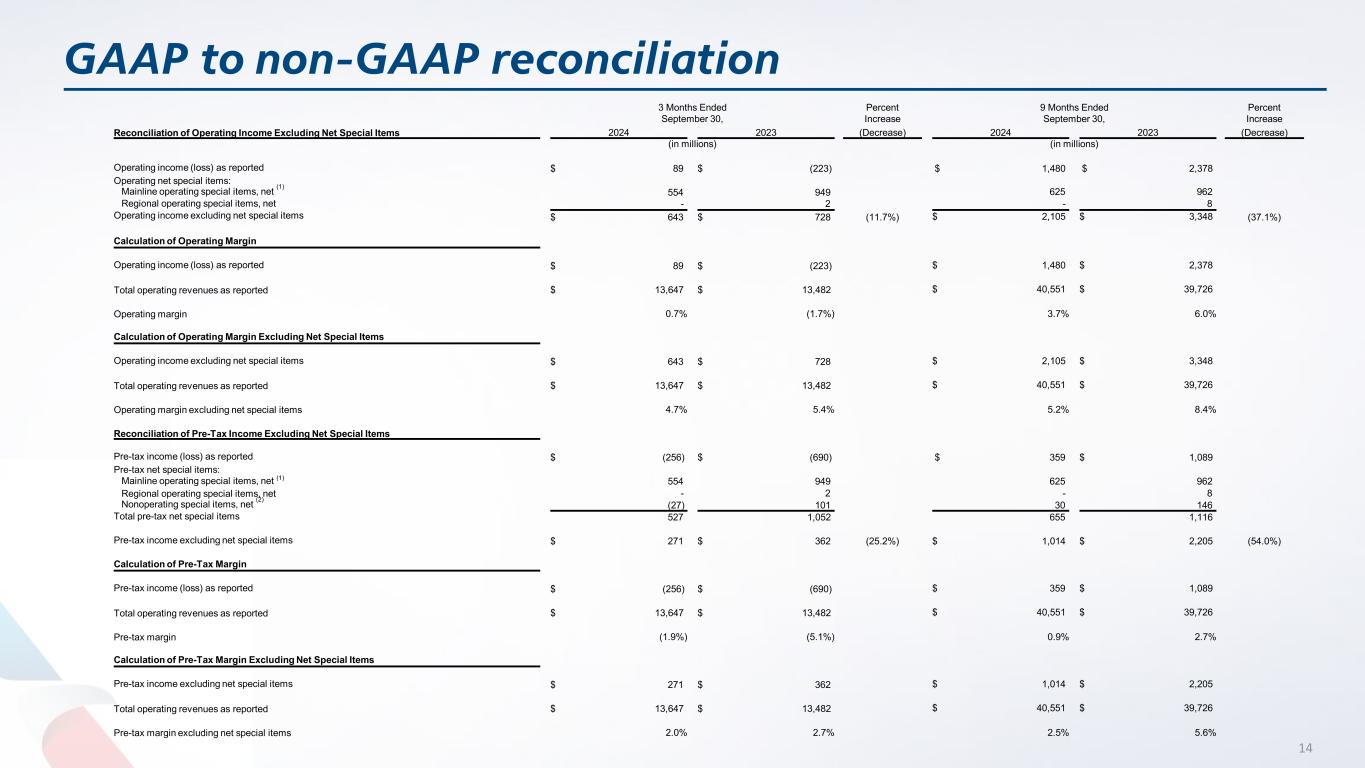
GAAP to non-GAAP reconciliation Reconciliation of Operating Income Excluding Net Special Items 3 Months Ended September 30, Percent Increase 9 Months Ended September 30, Percent Increase 2024 2023 (Decrease) 2024 2023 (Decrease) (in millions) (in millions) Operating income (loss) as reported $ 89 $ (223) $ 1,480 $ 2,378 Operating net special items: Mainline operating special items, net (1) 554 949 625 962 Regional operating special items, net - 2 - 8 Operating income excluding net special items $ 643 $ 728 (11.7%) $ 2,105 $ 3,348 (37.1%) Calculation of Operating Margin Operating income (loss) as reported $ 89 $ (223) $ 1,480 $ 2,378 Total operating revenues as reported $ 13,647 $ 13,482 $ 40,551 $ 39,726 Operating margin 0.7% (1.7%) 3.7% 6.0% Calculation of Operating Margin Excluding Net Special Items Operating income excluding net special items $ 643 $ 728 $ 2,105 $ 3,348 Total operating revenues as reported $ 13,647 $ 13,482 $ 40,551 $ 39,726 Operating margin excluding net special items 4.7% 5.4% 5.2% 8.4% Reconciliation of Pre-Tax Income Excluding Net Special Items Pre-tax income (loss) as reported $ (256) $ (690) $ 359 $ 1,089 Pre-tax net special items: Mainline operating special items, net (1) 554 949 625 962 Regional operating special items, net - 2 - 8 Nonoperating special items, net (2) (27) 101 30 146 Total pre-tax net special items 527 1,052 655 1,116 Pre-tax income excluding net special items $ 271 $ 362 (25.2%) $ 1,014 $ 2,205 (54.0%) Calculation of Pre-Tax Margin Pre-tax income (loss) as reported $ (256) $ (690) $ 359 $ 1,089 Total operating revenues as reported $ 13,647 $ 13,482 $ 40,551 $ 39,726 Pre-tax margin (1.9%) (5.1%) 0.9% 2.7% Calculation of Pre-Tax Margin Excluding Net Special Items Pre-tax income excluding net special items $ 271 $ 362 $ 1,014 $ 2,205 Total operating revenues as reported $ 13,647 $ 13,482 $ 40,551 $ 39,726 Pre-tax margin excluding net special items 2.0% 2.7% 2.5% 5.6% 14

GAAP to non-GAAP reconciliation 3 Months Ended September 30, Percent Increase 9 Months Ended September 30, Percent Increase Reconciliation of Net Income Excluding Net Special Items 2024 2023 (Decrease) 2024 2023 (Decrease) (in millions, except share and per share amounts) (in millions, except share and per share amounts) Net income (loss) as reported $ (149) $ (545) $ 256 $ 803 Net special items: Total pre-tax net special items (1), (2) 527 1,052 655 1,116 Net tax effect of net special items (173) (244) (158) (252) Net income excluding net special items $ 205 $ 263 (21.9%) $ 753 $ 1,667 (54.8%) Reconciliation of Basic and Diluted Earnings Per Share Excluding Net Special Items Net income excluding net special items $ 205 $ 263 $ 753 $ 1,667 Shares used for computation (in thousands): Basic 657,424 654,119 656,745 653,241 Diluted 720,086 722,087 720,503 719,956 Earnings per share excluding net special items: Basic $ 0.31 $ 0.40 $ 1.15 $ 2.55 Diluted (3) $ 0.30 $ 0.38 $ 1.10 $ 2.36 Reconciliation of Total Operating Costs per ASM Excluding Net Special Items and Fuel Total operating expenses as reported $ 13,558 $ 13,705 $ 39,071 $ 37,348 Operating net special items: Mainline operating special items, net (1) (544) (949) (625) (962) Regional operating special items, net - (2) - (8) Total operating expenses excluding net special items 13,004 12,754 38,446 36,378 Aircraft fuel and related taxes (2,874) (3,209) (8,916) (9,098) Total operating expenses excluding net special items and fuel $ 10,130 $ 9,545 $ 29,530 $ 27,280 (in cents) (in cents) Total operating expenses per ASM as reported 17.92 18.70 17.64 17.96 Operating net special items per ASM: Mainline operating special items, net (1) (0.73) (1.29) (0.28) (0.46) Regional operating special items, net - - - - Total operating expenses per ASM excluding net special items 17.19 17.40 17.36 17.49 Aircraft fuel and related taxes per ASM (3.80) (4.38) (4.03) (4.38) Total operating expenses per ASM excluding net special items and fuel 13.39 13.02 13.34 13.12 Note: Amounts may not recalculate due to rounding. (1) The 2024 third quarter mainline operating special items, net principally included $516 million of one-time charges resulting from the ratification of a new collective bargaining agreement with our mainline flight attendants. The 2024 nine month period mainline operating special items, net included $573 million of one-time charges resulting from the ratifications of new collective bargaining agreements with our mainline flight attendants as discussed above and with our mainline passenger service team members. The 2023 third quarter and nine month period mainline operating special items, net principally included $983 million of one-time charges resulting from the ratification of a new collective bargaining agreement with our mainline pilots, including a one-time payment of $754 million as well as adjustments to other benefit-related items of $229 million. (2) Principally included charges associated with debt refinancings and extinguishments as well as mark-to-market net unrealized gains and losses associated with certain equity investments. (3) The 2024 third quarter and nine month period diluted earnings per share gives effect to, among other things, the Company's outstanding 6.5% senior convertible notes by (a) adding back to earnings $14 million and $36 million of interest expense, respectively, related to such convertible notes, net of estimated profit sharing and tax effects and (b) including in the diluted shares outstanding, 61.7 million shares issuable in respect to such convertible notes. The 2023 third quarter and nine month period diluted earnings per share gives effect to, among other things, the Company's outstanding 6.5% senior convertible notes by (a) adding back to earnings $11 million and $33 million of interest expense, respectively, related to such convertible notes, net of estimated profit sharing, short-term incentive and tax effects and (b) including in the diluted shares outstanding, 61.7 million shares issuable in respect to such convertible notes. 15

Free cash flow reconciliation The Company's free cash flow summary is presented in the table below, which is a non-GAAP measure that management believes is useful information to investors and others in evaluating the Company's ability to generate cash from its core operating performance that is available for use to reinvest in the business or to reduce debt. The Company defines free cash flows as net cash provided by operating activities less net cash used in investing activities, adjusted for (1) net purchases of short-term investments and (2) change in restricted cash. We believe that calculating free cash flow as adjusted for these items is more useful for investors because short-term investment activity and restricted cash are not representative of activity core to our operations. This non-GAAP measure may not be comparable to similarly titled non-GAAP measures of other companies, and should be considered in addition to, and not as a substitute for or superior to, any measure of performance, cash flow or liquidity prepared in accordance with GAAP. Our calculation of free cash flow is not intended, and should not be used, to measure the residual cash flow available for discretionary expenditures because, among other things, it excludes mandatory debt service requirements and certain other non-discretionary expenditures. 9 Months Ended September 30, 2024 (in millions) Net cash provided by operating activities $ 3,585 Adjusted net cash used in investing activities (1) (1,203) Free cash flow $ 2,382 (1) The following table provides a reconciliation of adjusted net cash used in investing activities for the nine months ended September 30, 2024 (in millions): Net cash used in investing activities $ (1,834) Adjustments: Net purchases of short-term investments 627 Decrease in restricted cash 4 Adjusted net cash used in investing activities $ (1,203) 16

Adjusted EBITDAR margin reconciliation The Company's adjusted EBITDAR and adjusted EBITDAR margin are presented below, which are non-GAAP measures that management uses to evaluate the Company's current operating performance. These non-GAAP measures may not be comparable to similarly titled non-GAAP measures of other companies, and should be considered in addition to, and not as a substitute for or superior to, any measure of performance, cash flow or liquidity prepared in accordance with GAAP. Adjusted EBITDAR is defined as earnings excluding the impact of net special items before net interest and other nonoperating expenses, taxes, depreciation, amortization and aircraft rent. 3 Months Ended Adjusted EBITDAR September 30, 2024 (in millions) Operating income as reported $ 89 Adjustments: Aircraft rent (1) 306 Depreciation and amortization (1) 559 EBITDAR 954 Operating special items, net (1) 554 Adjusted EBITDAR $ 1,508 Calculation of Adjusted EBITDAR Margin Adjusted EBITDAR $ 1,508 Total operating revenues as reported $ 13,647 Adjusted EBITDAR Margin 11.1% (1) Includes amounts associated with regional operations that are reflected in regional expenses in the condensed consolidated statements of operations. 17
