Exhibit 99.1

Link to searchable text of slide shown above
Link to searchable text of slide shown above

Link to searchable text of slide shown above
Link to searchable text of slide shown above
Link to searchable text of slide shown above
Link to searchable text of slide shown above
Link to searchable text of slide shown above

Link to searchable text of slide shown above
Link to searchable text of slide shown above

Link to searchable text of slide shown above

Link to searchable text of slide shown above

Link to searchable text of slide shown above
Link to searchable text of slide shown above
Link to searchable text of slide shown above
Searchable text section of graphics shown above
[LOGO]
Private & Confidential
Statements contained herein, which are not strictly historical information, are forward-looking statements. Words such as “believes,” “intends,” “possible,” “expects,” “estimates,” “anticipates,” or “plans” and similar expressions are intended to identify forward-looking statements. Any forward-looking statements in this presentation are made pursuant to the safe harbor provisions of the Private Securities Litigation Reform Act of 1995. Such statements are based on the Company’s current expectations relating to future revenues, earnings, results of operations and future sales or growth.
The Company’s actual results may vary materially from those projected due to certain risks and uncertainties such as the general state of the economy, volume of business activity, continued need for our services by current and prospective clients, client cancellations, the Company’s ability to control and improve profit margins, including our ability to control operating costs and hourly rates for our services, the availability and utilization of qualified technical personnel and other similar factors. For more information concerning risks and uncertainties to the Company’s business refer to the discussion in the “Market Condition, Business Outlook and Risks to Our Business” section in the Company’s Annual Report for the year ending January 3, 2004, and the Company’s prior Annual Reports, 10-Ks, 10-Qs, other Securities and Exchange Commission filings and investor relations materials.
Analysts International ©
Page 2
• Diversified provider of IT Services and Solutions
• Founded and publicly traded since 1966
• Revenue of $332M in 2003
• Profitable for first 3 quarters of 2004
• Target clients are Fortune 1000 and mid-market
• Over 3000 employees
• Over 35 offices in U.S., Canada and U.K.
• Recognized for excellence, integrity, and innovation-Our core values
Analysts International ©
Page 3
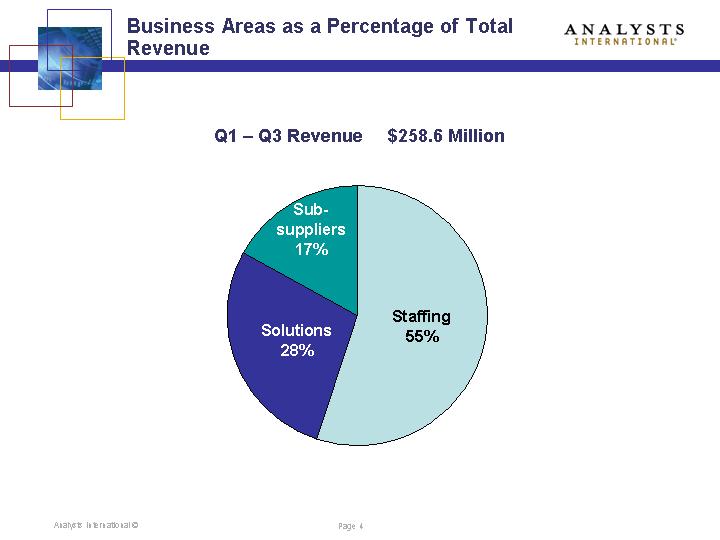
Q1 – Q3 Revenue $258.6 Million
[CHART]
Analysts International ©
Page 4
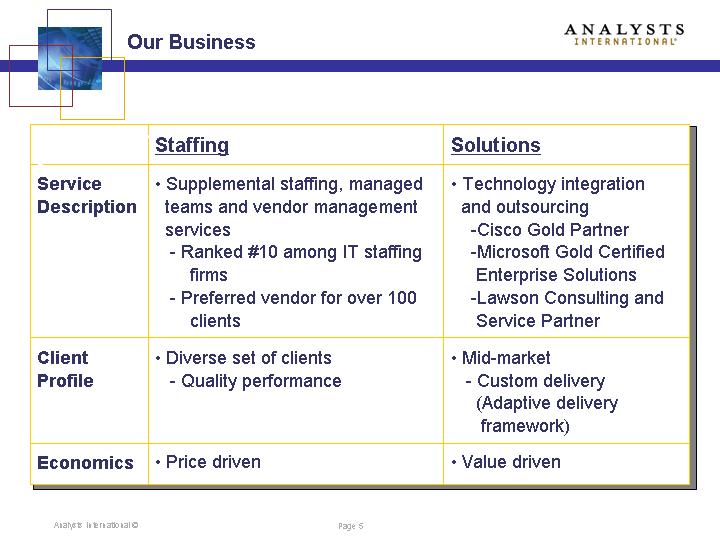
| | Staffing | | Solutions |
Service Description | | • Supplemental staffing, managed teams and vendor management services • Ranked #10 among IT staffing firms • Preferred vendor for over 100 clients | | • Technology integration and outsourcing • Cisco Gold Partner • Microsoft Gold Certified Enterprise Solutions • Lawson Consulting and Service Partner |
| | | | |
Client Profile | | • Diverse set of clients • Quality performance | | • Mid-market • Custom delivery (Adaptive delivery framework) |
| | | | |
Economics | | • Price driven | | • Value driven |
Analysts International ©
Page 5
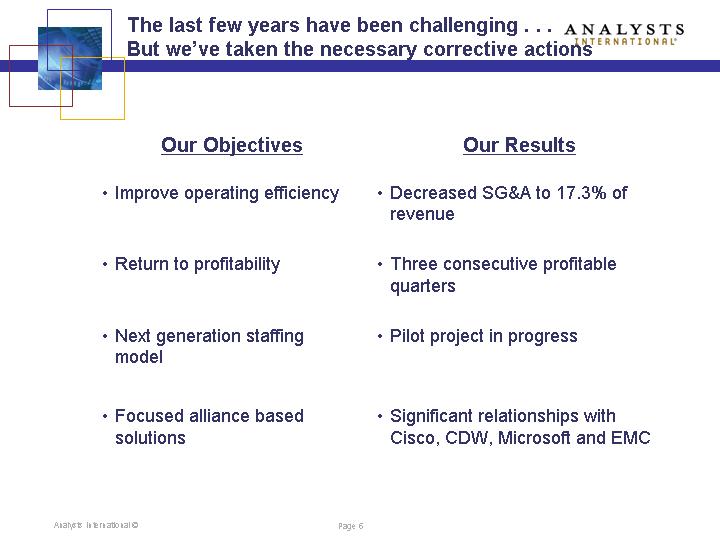
Our Objectives | | Our Results |
| | |
• Improve operating efficiency | | • Decreased SG&A to 17.3% of revenue |
| | |
• Return to profitability | | • Three consecutive profitable quarters |
| | |
• Next generation staffing model | | • Pilot project in progress |
| | |
• Focused alliance based solutions | | • Significant relationships with Cisco, CDW, Microsoft and EMC |
Page 6
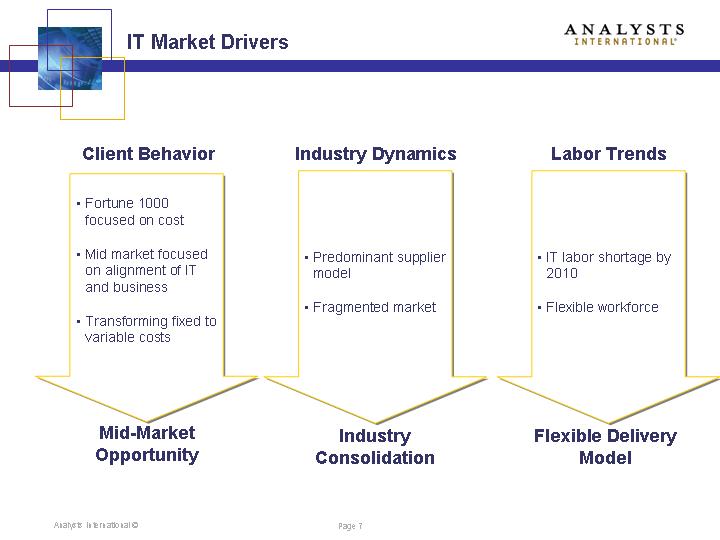
Client Behavior | | Industry Dynamics | | Labor Trends |
| | | | |
• Fortune 1000 focused on cost | | | | |
| | | | |
• Mid market focused on alignment of IT and business | | • Predominant supplier model | | • IT labor shortage by 2010 |
| | | | |
• Transforming fixed to variable costs | | • Fragmented market | | • Flexible workforce |
| | | | |
Mid-Market Opportunity | | Industry Consolidation | | Flexible Delivery Model |
Analysts International ©
Page 7
Fortune 1000 | | Mid-Market |
($1B and greater) | | ($100m to $1B) |
| | |
• Staffing services • Flexible, cost efficient delivery (next generation staffing model) | | • Technology integration services (application and infrastructure services) • Outsourcing services |
| | |
• Expand long standing client relationships | | • Focus on emerging technologies through alliances |
| | |
| | • Adaptive staffing delivery model |
Analysts International ©
Page 8
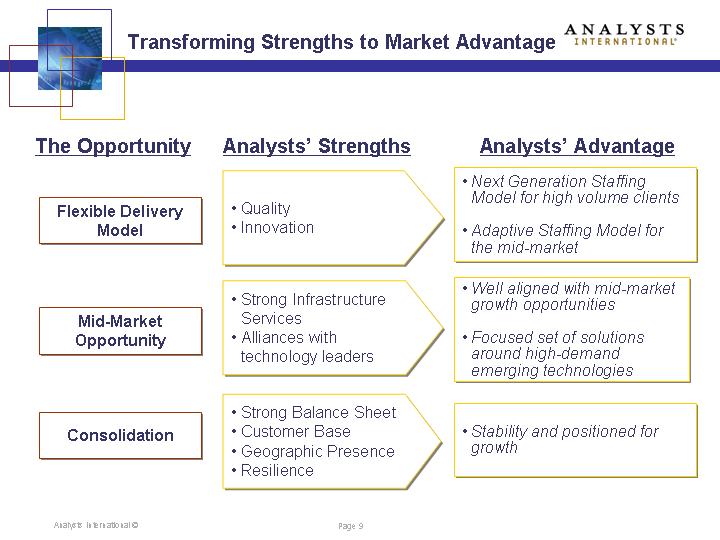
The Opportunity | | Analysts’ Strengths | | Analysts’ Advantage |
| | | | |
Flexible Delivery Model | | • Quality • Innovation | | • Next Generation Staffing Model for high volume clients
• Adaptive Staffing Model for the mid-market |
| | | | |
Mid-Market Opportunity | | • Strong InfrastructureServices • Alliances with technology leaders | | • Well aligned with mid-market growth opportunities
• Focused set of solutions around high-demand emerging technologies |
| | | | |
Consolidation | | • Strong Balance Sheet • Customer Base • Geographic Presence • Resilience | | • Stability and positioned for growth |
Analysts International ©
Page 9
Initiative | | Status |
| | |
Next generation staffing model | | In Pilot |
| | |
Vertical market development (Government, Healthcare, Financial Services) | | Re-focusing resources and services |
| | |
Strategic acquisitions | | In Progress |
| | |
Re-engineering of key business processes/ continuous improvement | | Major tasks completed |
| | |
Develop adaptive delivery model | | Underway with special teams |
Analysts International ©
Page 10
| | 2004
Q1 – Q3 | | 2003
Q1 – Q3 | |
| | | | | |
Revenue | | $ | 258,639 | | $ | 248,687 | |
| | | | | |
Expenses | | $ | 256,138 | | 249,843 | |
| | | | | |
Operating Income (Loss) | | $ | 2,456 | | $ | (1,156 | ) |
| | | | | |
EBITA | | $ | 2,444 | | $ | (1,100 | ) |
| | | | | |
EPS | | .10 | | (.04 | ) |
Analysts International ©
Page 11
Cash | | $ | 3,541 | |
| | | |
Receivables | | $ | 61,914 | |
| | | |
Total Assets | | $ | 106,127 | |
| | | |
Current Liabilities | | $ | 30,721 | |
| | | |
Debt | | $ | 0 | |
| | | |
Equity | | $ | 71,148 | |
Analysts International ©
Page 12
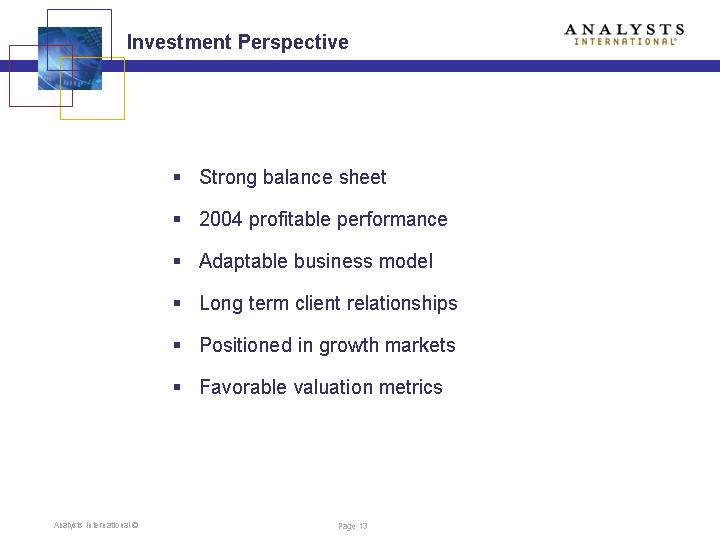
• Strong balance sheet
• 2004 profitable performance
• Adaptable business model
• Long term client relationships
• Positioned in growth markets
• Favorable valuation metrics
Analysts International ©
Page 13
[LOGO]
Private & Confidential