UNITED STATES
SECURITIES AND EXCHANGE COMMISSION Washington, D.C. 20549
FORM N-CSR
CERTIFIED SHAREHOLDER REPORT OF REGISTERED MANAGEMENT INVESTMENT COMPANIES
Investment Company Act file number 811-02032
MFS SERIES TRUST XVI
(Exact name of registrant as specified in charter)
111 Huntington Avenue, Boston, Massachusetts 02199 (Address of principal executive offices) (Zip code)
Christopher R. Bohane
Massachusetts Financial Services Company
111Huntington Avenue Boston, Massachusetts 02199
(Name and address of agents for service)
Registrant's telephone number, including area code: (617) 954-5000
Date of fiscal year end: June 30
Date of reporting period: June 30, 2023
ITEM 1. REPORTS TO STOCKHOLDERS.
Item 1(a):


| 1 | |
| 3 | |
| 5 | |
| 8 | |
| 10 | |
| 18 | |
| 20 | |
| 22 | |
| 23 | |
| 32 | |
| 49 | |
| 51 | |
| 55 | |
| 56 | |
| 56 | |
| 56 | |
| 56 | |
| 56 | |
| 57 |
| back cover |
| Active Security Selection (a) | Derivative Overlay Positions (b) | Net Market Exposure (c) | ||
| Equities | 53.9% | —% | 53.9% | |
| Gold Related Investments (f) | 1.6% | —% | 1.6% | |
| Hedges | MSCI EAFE Index Future - Sep 2023 | —% | (0.9)% | (0.9)% |
| Russell 2000 Index Option Puts | —% | (1.2)% | (1.2)% | |
| S&P 500 Index Option Puts | —% | (1.5)% | (1.5)% | |
| S&P 500 E-Mini Index Future - Sep 2023 | —% | (2.4)% | (2.4)% | |
| Net Equity Exposure | 55.5% | (6.0)% | 49.5% | |
| Debt Instruments, excluding Short-Term Government Securities | 17.0% | —% | 17.0% | |
| Cash, Cash Equivalents, and Short-Term Government Securities (d) | 26.4% | |||
| Other (e) | 7.1% | |||
| Total Net Exposure Summary | 100.0% |
| U.S. Treasury Notes, 1.375%, 9/30/2023 | 3.7% |
| U.S. Treasury Notes, 2.25%, 3/31/24 | 3.7% |
| U.S. Treasury Notes, 2.625%, 12/31/2023 | 3.7% |
| U.S. Treasury Notes, 3.0%, 6/30/2024 | 3.6% |
| LEG Immobilien SE | 3.3% |
| U.S. Treasury Notes, TIPS, 0.5%, 4/15/2024 | 3.3% |
| Alphabet, Inc., “A” | 2.8% |
| U.S. Treasury Notes, TIPS, 0.125%, 4/15/2027 | 2.3% |
| Samsung Electronics Co. Ltd. | 2.1% |
| S&P 500 E-Mini Index Future - Sep 2023 | (2.4)% |
| (a) | Represents the actively managed portion of the portfolio and for purposes of this presentation, components include the value of securities, less any securities sold short. The bond component will include any accrued interest amounts. This also reflects the equivalent exposure of certain derivative positions. These amounts may be negative from time to time. |
| (b) | Represents the tactical overlay portion of the portfolio which is how the fund manages its exposure to markets and currencies through the use of derivative positions. Percentages reflect the equivalent exposure of those derivative positions. |
| (c) | For purposes of this presentation, the components include the value of securities, less any securities sold short, and reflect the impact of the equivalent exposure of all derivative positions. These amounts may be negative from time to time. The bond component will include any accrued interest amounts. |
| (d) | Cash & Cash Equivalents includes any cash, investments in money market funds, short-term securities (including U.S. Treasury securities with a maturity of less than 3 years for the purpose of this presentation), and other assets less liabilities. Please see the Statement of Assets and Liabilities for additional information related to the fund’s cash position and other assets and liabilities. |
| (e) | Other includes currency derivatives and/or the offsetting of the leverage produced by the fund’s derivative positions, including payables and/or receivables of the finance leg of interest rate swaps and the unrealized gain or loss in connection with forward currency exchange contracts. |
| (f) | The fund invests a portion of its assets in Exchange-Traded Funds (ETFs) or Options on ETFs to gain gold related exposure. Percentages include the direct exposure from investing in ETFs and not the indirect exposure to the underlying holdings. |
Portfolio Manager(s)
David Cole, Shanti Das-Wermes, Edward Dearing, and Barnaby Weiner
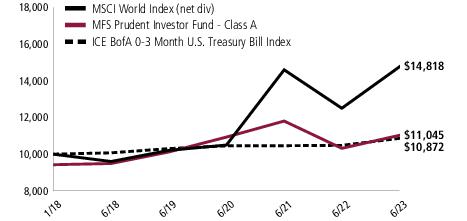
| Share Class | Class Inception Date | 1-yr | 5-yr | Life (t) |
| A | 1/18/18 | 7.04% | 3.08% | 2.95% |
| B | 1/18/18 | 6.36% | 2.32% | 2.19% |
| C | 1/18/18 | 6.25% | 2.32% | 2.18% |
| I | 1/18/18 | 7.38% | 3.33% | 3.20% |
| R1 | 1/18/18 | 6.41% | 2.33% | 2.19% |
| R2 | 1/18/18 | 6.86% | 2.82% | 2.70% |
| R3 | 1/18/18 | 7.13% | 3.08% | 2.95% |
| R4 | 1/18/18 | 7.39% | 3.35% | 3.21% |
| R6 | 1/18/18 | 7.48% | 3.39% | 3.25% |
| MSCI World Index (net div) (f) | 18.51% | 9.07% | 7.48% |
| ICE BofA 0-3 Month U.S. Treasury Bill Index (f) | 3.73% | 1.54% | 1.55% |
| A With Initial Sales Charge (5.75%) | 0.89% | 1.87% | 1.84% |
| B With CDSC (Declining over six years from 4% to 0%) (v) | 2.36% | 1.96% | 2.02% |
| C With CDSC (1% for 12 months) (v) | 5.25% | 2.32% | 2.18% |
| (f) | Source: FactSet Research Systems Inc. |
| (t) | For the period from the class inception date through the stated period end. (See Notes to Performance Summary.) |
| (v) | Assuming redemption at the end of the applicable period. |
| (d) | Source ICE Data Indices, LLC (“ICE Data”), is used with permission. ICE Data, its affiliates and their respective third party suppliers disclaim any and all warranties and representations, express and/or implied, including any warranties of merchantability or fitness for a particular purpose or use, including the indices, index data and any data included in, related to, or derived therefrom. Neither ICE Data, its affiliates nor their respective third party suppliers shall be subject to any damages or liability with respect the adequacy, accuracy, timeliness or |
| (e) | Morgan Stanley Capital International (“MSCI”) makes no express or implied warranties or representations and shall have no liability whatsoever with respect to any MSCI data contained herein. The MSCI data may not be further redistributed or used as a basis for other indices or any securities or financial products. This report is not approved, reviewed, or produced by MSCI. |
January 1, 2023 through June 30, 2023
| Share Class | Annualized Expense Ratio | Beginning Account Value 1/01/23 | Ending Account Value 6/30/23 | Expenses Paid During Period (p) 1/01/23 - 6/30/23 | |
| A | Actual | 1.24% | $1,000.00 | $1,082.10 | $6.40 |
| Hypothetical (h) | 1.24% | $1,000.00 | $1,018.65 | $6.21 | |
| B | Actual | 1.99% | $1,000.00 | $1,078.53 | $10.26 |
| Hypothetical (h) | 1.99% | $1,000.00 | $1,014.93 | $9.94 | |
| C | Actual | 1.99% | $1,000.00 | $1,076.92 | $10.25 |
| Hypothetical (h) | 1.99% | $1,000.00 | $1,014.93 | $9.94 | |
| I | Actual | 0.99% | $1,000.00 | $1,083.00 | $5.11 |
| Hypothetical (h) | 0.99% | $1,000.00 | $1,019.89 | $4.96 | |
| R1 | Actual | 1.99% | $1,000.00 | $1,078.53 | $10.26 |
| Hypothetical (h) | 1.99% | $1,000.00 | $1,014.93 | $9.94 | |
| R2 | Actual | 1.49% | $1,000.00 | $1,081.03 | $7.69 |
| Hypothetical (h) | 1.49% | $1,000.00 | $1,017.41 | $7.45 | |
| R3 | Actual | 1.24% | $1,000.00 | $1,082.02 | $6.40 |
| Hypothetical (h) | 1.24% | $1,000.00 | $1,018.65 | $6.21 | |
| R4 | Actual | 0.99% | $1,000.00 | $1,083.99 | $5.12 |
| Hypothetical (h) | 0.99% | $1,000.00 | $1,019.89 | $4.96 | |
| R6 | Actual | 0.92% | $1,000.00 | $1,083.99 | $4.75 |
| Hypothetical (h) | 0.92% | $1,000.00 | $1,020.23 | $4.61 |
| (h) | 5% class return per year before expenses. |
| (p) | “Expenses Paid During Period” are equal to each class’s annualized expense ratio, as shown above, multiplied by the average account value over the period, multiplied by 181/365 (to reflect the one-half year period). Expenses paid do not include any applicable sales charges (loads). If these transaction costs had been included, your costs would have been higher. |
| Issuer | Shares/Par | Value ($) | ||
| Common Stocks – 54.6% | ||||
| Aerospace & Defense – 2.7% | ||||
| Safran S.A. | 3,194 | $500,000 | ||
| Thales S.A. | 3,280 | 491,058 | ||
| $991,058 | ||||
| Alcoholic Beverages – 2.0% | ||||
| Heineken Holding N.V. | 8,459 | $735,206 | ||
| Automotive – 1.8% | ||||
| Knorr-Bremse AG | 8,459 | $645,948 | ||
| Brokerage & Asset Managers – 1.4% | ||||
| B3 Brasil Bolsa Balcao S.A. | 95,900 | $292,615 | ||
| Euronext N.V. | 3,042 | 206,801 | ||
| $499,416 | ||||
| Cable TV – 1.2% | ||||
| Charter Communications, Inc., “A” (a) | 1,252 | $459,947 | ||
| Computer Software – 8.3% | ||||
| Adobe Systems, Inc. (a) | 695 | $339,848 | ||
| Check Point Software Technologies Ltd. (a) | 5,446 | 684,126 | ||
| Microsoft Corp. | 1,000 | 340,540 | ||
| Oracle Corp. | 4,530 | 539,478 | ||
| Oracle Corp. Japan | 5,900 | 438,432 | ||
| Sage Group PLC | 61,736 | 725,087 | ||
| $3,067,511 | ||||
| Computer Software - Systems – 4.1% | ||||
| Amadeus IT Group S.A. (a) | 9,926 | $754,938 | ||
| Samsung Electronics Co. Ltd. | 13,963 | 769,591 | ||
| $1,524,529 | ||||
| Construction – 0.7% | ||||
| Barratt Developments PLC | 52,586 | $276,153 | ||
| Consumer Services – 1.7% | ||||
| Booking Holdings, Inc. (a) | 229 | $618,376 | ||
| Electrical Equipment – 1.7% | ||||
| Legrand S.A. | 6,351 | $629,263 | ||
| Electronics – 1.3% | ||||
| Kyocera Corp. | 9,000 | $489,206 | ||
| Issuer | Shares/Par | Value ($) | ||
| Common Stocks – continued | ||||
| Food & Beverages – 1.0% | ||||
| Nestle S.A. | 3,033 | $364,617 | ||
| Forest & Paper Products – 1.1% | ||||
| Rayonier, Inc., REIT | 12,765 | $400,821 | ||
| Insurance – 0.8% | ||||
| Swiss Re Ltd. | 2,940 | $295,757 | ||
| Internet – 4.7% | ||||
| Alphabet, Inc., “A” (a) | 8,714 | $1,043,066 | ||
| Scout24 AG | 10,649 | 674,900 | ||
| $1,717,966 | ||||
| Leisure & Toys – 1.8% | ||||
| Nintendo Co. Ltd. | 14,800 | $673,219 | ||
| Medical Equipment – 2.2% | ||||
| Agilent Technologies, Inc. | 2,308 | $277,537 | ||
| Sonova Holding AG | 2,004 | 533,325 | ||
| $810,862 | ||||
| Other Banks & Diversified Financials – 1.3% | ||||
| S&P Global, Inc. | 1,155 | $463,028 | ||
| Printing & Publishing – 1.5% | ||||
| Wolters Kluwer N.V. | 4,279 | $543,033 | ||
| Real Estate – 4.8% | ||||
| LEG Immobilien SE (a) | 21,072 | $1,210,392 | ||
| Vonovia SE, REIT | 27,792 | 542,695 | ||
| $1,753,087 | ||||
| Specialty Chemicals – 1.4% | ||||
| Nitto Denko Corp. | 7,000 | $518,875 | ||
| Telecommunications - Wireless – 3.1% | ||||
| Infrastrutture Wireless Italiane S.p.A. | 37,967 | $500,470 | ||
| KDDI Corp. | 20,400 | 630,479 | ||
| $1,130,949 | ||||
| Telephone Services – 0.9% | ||||
| Altice USA, Inc., “A” (a) | 16,124 | $48,694 | ||
| Hellenic Telecommunications Organization S.A. | 16,851 | 288,873 | ||
| $337,567 | ||||
| Trucking – 1.3% | ||||
| Yamato Holdings Co. Ltd. | 25,800 | $466,596 | ||
| Issuer | Shares/Par | Value ($) | ||
| Common Stocks – continued | ||||
| Utilities - Electric Power – 1.8% | ||||
| Iberdrola S.A. | 51,992 | $677,967 | ||
| Total Common Stocks (Identified Cost, $18,746,885) | $20,090,957 | |||
| Bonds – 37.7% | ||||
| Asset-Backed & Securitized – 0.3% | ||||
| LAD Auto Receivables Trust, 2023-2A, “A2”, 5.93%, 6/15/2027 (n) | $ | 61,000 | $60,702 | |
| Toyota Lease Owner Trust, 2023-A, “A1”, 5.388%, 4/22/2024 (n) | 9,113 | 9,109 | ||
| Toyota Lease Owner Trust, 2023-A, “A2”, 5.3%, 8/20/2025 (n) | 29,000 | 28,863 | ||
| $98,674 | ||||
| Automotive – 0.3% | ||||
| RAC Bond Co. PLC, 5.25%, 11/04/2027 | GBP | 100,000 | $100,962 | |
| Broadcasting – 0.3% | ||||
| WMG Acquisition Corp., 3.875%, 7/15/2030 (n) | $ | 149,000 | $128,529 | |
| Building – 1.5% | ||||
| Foundation Building Materials LLC, 6%, 3/01/2029 (n) | $ | 75,000 | $62,625 | |
| Interface, Inc., 5.5%, 12/01/2028 (n) | 149,000 | 120,783 | ||
| New Enterprise Stone & Lime Co., Inc., 5.25%, 7/15/2028 (n) | 160,000 | 145,605 | ||
| Standard Industries, Inc., 3.375%, 1/15/2031 (n) | 272,000 | 218,972 | ||
| $547,985 | ||||
| Consumer Products – 0.3% | ||||
| Coty, Inc., 6.5%, 4/15/2026 (n) | $ | 127,000 | $125,908 | |
| Consumer Services – 1.6% | ||||
| Arches Buyer, Inc., 6.125%, 12/01/2028 (n) | $ | 267,000 | $230,114 | |
| Match Group Holdings II LLC, 4.625%, 6/01/2028 (n) | 251,000 | 230,568 | ||
| Realogy Group LLC/Realogy Co-Issuer Corp., 5.75%, 1/15/2029 (n) | 178,000 | 133,182 | ||
| $593,864 | ||||
| Containers – 0.4% | ||||
| Can-Pack S.A./Eastern PA Land Investment Holding LLC, 3.875%, 11/15/2029 (n) | $ | 200,000 | $162,681 | |
| Electronics – 0.3% | ||||
| Sensata Technologies B.V., 5%, 10/01/2025 (n) | $ | 65,000 | $63,637 | |
| Sensata Technologies, Inc., 3.75%, 2/15/2031 (n) | 50,000 | 42,774 | ||
| $106,411 | ||||
| Issuer | Shares/Par | Value ($) | ||
| Bonds – continued | ||||
| Financial Institutions – 0.9% | ||||
| Global Aircraft Leasing Co. Ltd., 6.5% (6.5% Cash or 7.25% PIK), 9/15/2024 (n)(p) | $ | 180,294 | $165,032 | |
| Global Aircraft Leasing Co. Ltd., 6.5% (6.5% Cash or 7.25% PIK), 9/15/2024 (n)(p) | 108,806 | 99,596 | ||
| Nationstar Mortgage Holdings, Inc., 6%, 1/15/2027 (n) | 56,000 | 52,096 | ||
| $316,724 | ||||
| Insurance - Property & Casualty – 1.0% | ||||
| Acrisure LLC/Acrisure Finance, Inc., 4.25%, 2/15/2029 (n) | $ | 159,000 | $137,248 | |
| Hub International Ltd., 7%, 5/01/2026 (n) | 253,000 | 252,331 | ||
| $389,579 | ||||
| Medical & Health Technology & Services – 0.4% | ||||
| Charles River Laboratories International, Inc., 4%, 3/15/2031 (n) | $ | 172,000 | $149,392 | |
| Medical Equipment – 0.4% | ||||
| Teleflex, Inc., 4.625%, 11/15/2027 | $ | 142,000 | $133,835 | |
| Metals & Mining – 0.1% | ||||
| Coeur Mining, Inc., 5.125%, 2/15/2029 (n) | $ | 44,000 | $36,300 | |
| Midstream – 1.0% | ||||
| Peru LNG, 5.375%, 3/22/2030 | $ | 200,000 | $160,917 | |
| Venture Global LNG, Inc., 8.125%, 6/01/2028 (n) | 72,000 | 73,126 | ||
| Venture Global LNG, Inc., 8.375%, 6/01/2031 (n) | 133,000 | 134,086 | ||
| $368,129 | ||||
| Mortgage-Backed – 3.1% | ||||
| Freddie Mac, UMBS, 5%, 2/01/2038 | $ | 50,000 | $49,676 | |
| Freddie Mac, UMBS, 4.5%, 7/01/2038 - 10/01/2052 | 249,750 | 241,107 | ||
| Freddie Mac, UMBS, 6%, 1/01/2053 | 75,000 | 75,657 | ||
| Freddie Mac, UMBS, 5.5%, 5/01/2053 | 200,000 | 199,060 | ||
| Ginnie Mae, 5.5%, 2/20/2053 | 174,201 | 173,455 | ||
| Ginnie Mae, 5%, 4/20/2053 | 199,495 | 196,087 | ||
| Ginnie Mae, TBA, 4.5%, 7/15/2053 | 100,000 | 96,516 | ||
| UMBS, TBA, 4.5%, 7/18/2038 | 50,000 | 49,023 | ||
| UMBS, TBA, 5%, 7/18/2038 | 50,000 | 49,670 | ||
| $1,130,251 | ||||
| Precious Metals & Minerals – 0.2% | ||||
| IAMGOLD Corp., 5.75%, 10/15/2028 (n) | $ | 103,000 | $77,060 | |
| Issuer | Shares/Par | Value ($) | ||
| Bonds – continued | ||||
| Telecommunications - Wireless – 0.8% | ||||
| SBA Communications Corp., 3.875%, 2/15/2027 | $ | 142,000 | $130,811 | |
| SBA Communications Corp., 3.125%, 2/01/2029 | 200,000 | 169,531 | ||
| $300,342 | ||||
| Transportation - Services – 0.7% | ||||
| Q-Park Holding I B.V., 2%, 3/01/2027 | EUR | 265,000 | $246,154 | |
| U.S. Treasury Obligations – 23.2% | ||||
| U.S. Treasury Bonds, TIPS, 2.375%, 1/15/2025 | $ | 384,619 | $380,589 | |
| U.S. Treasury Notes, 1.375%, 9/30/2023 (f) | 1,374,000 | 1,360,960 | ||
| U.S. Treasury Notes, 2.625%, 12/31/2023 | 1,365,000 | 1,347,298 | ||
| U.S. Treasury Notes, 2.25%, 3/31/2024 | 1,388,000 | 1,355,523 | ||
| U.S. Treasury Notes, 3%, 6/30/2024 | 1,373,000 | 1,340,606 | ||
| U.S. Treasury Notes, 4.25%, 9/30/2024 | 740,000 | 730,288 | ||
| U.S. Treasury Notes, TIPS, 0.5%, 4/15/2024 | 1,226,809 | 1,197,121 | ||
| U.S. Treasury Notes, TIPS, 0.125%, 4/15/2027 | 898,502 | 831,570 | ||
| $8,543,955 | ||||
| Utilities - Electric Power – 0.9% | ||||
| Clearway Energy Operating LLC, 4.75%, 3/15/2028 (n) | $ | 150,000 | $138,393 | |
| Clearway Energy Operating LLC, 3.75%, 2/15/2031 (n) | 118,000 | 97,922 | ||
| Pacific Gas & Electric Co., 6.1%, 1/15/2029 | 46,000 | 45,260 | ||
| Pacific Gas & Electric Co., 6.4%, 6/15/2033 | 56,000 | 55,694 | ||
| $337,269 | ||||
| Total Bonds (Identified Cost, $14,334,063) | $13,894,004 | |||
| Exchange-Traded Funds – 1.6% | ||||
| Gold ETFs – 1.6% | ||||
| VanEck Gold Miners UCITS ETF (a) | 6,184 | $202,279 | ||
| VanEck Junior Gold Miners UCITS ETF (a) | 12,416 | 381,916 | ||
| Total Exchange-Traded Funds (Identified Cost, $756,661) | $584,195 | |||
| Investment Companies (h) – 6.0% | ||||
| Money Market Funds – 6.0% | ||||
| MFS Institutional Money Market Portfolio, 5.04% (v) (Identified Cost, $2,206,028) | 2,206,037 | $2,206,478 | ||
| Underlying/Expiration Date/Exercise Price | Put/Call | Counterparty | Notional Amount | Par Amount/ Number of Contracts | Value ($) |
| Purchased Options – 0.5% | |||||
| Computer Software - Systems – 0.0% | |||||
| Apple, Inc. – September 2023 @ $145 | Put | Goldman Sachs International | $ 1,862,112 | 96 | $2,880 |
| Apple, Inc. – March 2024 @ $145 | Put | Goldman Sachs International | 659,498 | 34 | 6,562 |
| $9,442 | |||||
| Internet – 0.0% | |||||
| Tencent Holdings Ltd. – September 2023 @ HKD 470.157 | Call | Goldman Sachs International | $ 434,138 | 102 | $1,603 |
| Market Index Securities – 0.4% | |||||
| Russell 2000 Index – December 2023 @ $1,650 | Put | Goldman Sachs International | $ 944,367 | 5 | $11,800 |
| Russell 2000 Index – June 2024 @ $1,400 | Put | Goldman Sachs International | 944,367 | 5 | 12,200 |
| Russell 2000 Index – June 2024 @ $1,500 | Put | Goldman Sachs International | 755,494 | 4 | 15,280 |
| Russell 2000 Index – December 2025 @ $1,400 | Put | Goldman Sachs International | 944,367 | 5 | 28,285 |
| S&P 500 Index – December 2023 @ $3,200 | Put | Goldman Sachs International | 890,076 | 2 | 2,438 |
| S&P 500 Index – December 2023 @ $3,300 | Put | Goldman Sachs International | 890,076 | 2 | 2,860 |
| S&P 500 Index – June 2024 @ $3,150 | Put | Goldman Sachs International | 1,335,114 | 3 | 9,810 |
| S&P 500 Index – June 2024 @ $3,250 | Put | Goldman Sachs International | 890,076 | 2 | 7,392 |
| S&P 500 Index – June 2024 @ $3,350 | Put | Goldman Sachs International | 890,076 | 2 | 8,600 |
| S&P 500 Index – December 2024 @ $3,250 | Put | Goldman Sachs International | 1,335,114 | 3 | 19,140 |
| S&P 500 Index – December 2025 @ $3,300 | Put | Goldman Sachs International | 1,335,114 | 3 | 39,660 |
| $157,465 | |||||
| Medical Equipment – 0.1% | |||||
| Mettler-Toledo International, Inc. – December 2023 @ $1,530 | Put | Goldman Sachs International | $ 131,164 | 1 | $23,400 |
| Total Purchased Options (Premiums Paid, $714,863) | $191,910 | ||||
| Value ($) | ||||
| Written Options (see table below) – (0.0)% | ||||
| (Premiums Received, $39,146) | $(1,886) | |||
| Other Assets, Less Liabilities – (0.4)% | (132,697) | |||
| Net Assets – 100.0% | $36,832,961 | |||
| (a) | Non-income producing security. | |||
| (f) | All or a portion of the security has been segregated as collateral for open futures contracts. | |||
| (h) | An affiliated issuer, which may be considered one in which the fund owns 5% or more of the outstanding voting securities, or a company which is under common control. At period end, the aggregate values of the fund's investments in affiliated issuers and in unaffiliated issuers were $2,206,478 and $34,761,066, respectively. | |||
| (n) | Securities exempt from registration under Rule 144A of the Securities Act of 1933. These securities may be sold in the ordinary course of business in transactions exempt from registration, normally to qualified institutional buyers. At period end, the aggregate value of these securities was $3,176,634, representing 8.6% of net assets. | |||
| (p) | Payment-in-kind (PIK) security for which interest income may be received in additional securities and/or cash. | |||
| (v) | Affiliated issuer that is available only to investment companies managed by MFS. The rate quoted for the MFS Institutional Money Market Portfolio is the annualized seven-day yield of the fund at period end. |
| The following abbreviations are used in this report and are defined: | |
| ETF | Exchange-Traded Fund |
| REIT | Real Estate Investment Trust |
| TBA | To Be Announced |
| TIPS | Treasury Inflation Protected Security |
| UMBS | Uniform Mortgage-Backed Security |
| Abbreviations indicate amounts shown in currencies other than the U.S. dollar. All amounts are stated in U.S. dollars unless otherwise indicated. A list of abbreviations is shown below: | |
| EUR | Euro |
| GBP | British Pound |
| HKD | Hong Kong Dollar |
| Written Options | |||||||
| Underlying | Put/ Call | Counterparty | Par Amount/ Number of Contracts | Notional Amount | Exercise Price | Expiration Date | Value |
| Liability Derivatives | |||||||
| Computer Software - Systems | |||||||
| Apple, Inc. | Put | Goldman Sachs International | 96 | $1,862,112 | $100.00 | September – 2023 | $(288) |
| Apple, Inc. | Put | Goldman Sachs International | 34 | 659,498 | 110.00 | March – 2024 | (1,598) |
| $(1,886) | |||||||
| Forward Foreign Currency Exchange Contracts | ||||||
| Currency Purchased | Currency Sold | Counterparty | Settlement Date | Unrealized Appreciation (Depreciation) | ||
| Asset Derivatives | ||||||
| USD | 275,971 | EUR | 250,722 | HSBC Bank | 7/21/2023 | $2,155 |
| Liability Derivatives | ||||||
| USD | 105,845 | GBP | 84,604 | State Street Bank Corp. | 7/21/2023 | $(1,613) |
| Futures Contracts | ||||||
| Description | Long/ Short | Currency | Contracts | Notional Amount | Expiration Date | Value/Unrealized Appreciation (Depreciation) |
| Liability Derivatives | ||||||
| Equity Futures | ||||||
| MSCI EAFE Index | Short | USD | 3 | $323,325 | September – 2023 | $(2,632) |
| S&P 500 E-Mini Index | Short | USD | 4 | 897,650 | September – 2023 | (29,201) |
| $(31,833) | ||||||
| Assets | |
| Investments in unaffiliated issuers, at value (identified cost, $34,552,472) | $34,761,066 |
| Investments in affiliated issuers, at value (identified cost, $2,206,028) | 2,206,478 |
| Cash | 30 |
| Receivables for | |
| Forward foreign currency exchange contracts | 2,155 |
| Investments sold | 16,446 |
| Fund shares sold | 2,087 |
| Interest and dividends | 135,037 |
| Receivable from investment adviser | 19,033 |
| Other assets | 155 |
| Total assets | $37,142,487 |
| Liabilities | |
| Payables for | |
| Forward foreign currency exchange contracts | $1,613 |
| Net daily variation margin on open futures contracts | 14,295 |
| Investments purchased | 462 |
| TBA purchase commitments | 196,037 |
| Written options (premiums received, $39,146) | 1,886 |
| Payable to affiliates | |
| Administrative services fee | 94 |
| Shareholder servicing costs | 9,585 |
| Distribution and service fees | 418 |
| Payable for independent Trustees' compensation | 3 |
| Accrued expenses and other liabilities | 85,133 |
| Total liabilities | $309,526 |
| Net assets | $36,832,961 |
| Net assets consist of | |
| Paid-in capital | $37,892,349 |
| Total distributable earnings (loss) | (1,059,388) |
| Net assets | $36,832,961 |
| Shares of beneficial interest outstanding | 3,369,145 |
| Net assets | Shares outstanding | Net asset value per share (a) | |
| Class A | $8,516,414 | 778,294 | $10.94 |
| Class B | 73,626 | 6,787 | 10.85 |
| Class C | 5,204,104 | 482,568 | 10.78 |
| Class I | 11,703,157 | 1,067,859 | 10.96 |
| Class R1 | 263,980 | 24,339 | 10.85 |
| Class R2 | 57,797 | 5,285 | 10.94 |
| Class R3 | 58,591 | 5,350 | 10.95 |
| Class R4 | 59,394 | 5,416 | 10.97 |
| Class R6 | 10,895,898 | 993,247 | 10.97 |
| (a) | Maximum offering price per share was equal to the net asset value per share for all share classes, except for Class A, for which the maximum offering price per share was $11.61 [100 / 94.25 x $10.94]. On sales of $50,000 or more, the maximum offering price of Class A shares is reduced. A contingent deferred sales charge may be imposed on redemptions of Class A, Class B, and Class C shares. Redemption price per share was equal to the net asset value per share for Classes I, R1, R2, R3, R4, and R6. |
| Net investment income (loss) | |
| Income | |
| Interest | $497,245 |
| Dividends | 359,359 |
| Dividends from affiliated issuers | 80,320 |
| Income on securities loaned | 212 |
| Foreign taxes withheld | (31,868) |
| Total investment income | $905,268 |
| Expenses | |
| Management fee | $307,007 |
| Distribution and service fees | 89,821 |
| Shareholder servicing costs | 31,969 |
| Administrative services fee | 17,500 |
| Independent Trustees' compensation | 3,025 |
| Custodian fee | 15,913 |
| Shareholder communications | 9,851 |
| Audit and tax fees | 72,315 |
| Legal fees | 282 |
| Registration fees | 131,032 |
| Miscellaneous | 32,549 |
| Total expenses | $711,264 |
| Reduction of expenses by investment adviser and distributor | (248,104) |
| Net expenses | $463,160 |
| Net investment income (loss) | $442,108 |
| Realized and unrealized gain (loss) | |
| Realized gain (loss) (identified cost basis) | |
| Unaffiliated issuers | $(724,112) |
| Affiliated issuers | (251) |
| Written options | 2,529 |
| Futures contracts | (71,024) |
| Forward foreign currency exchange contracts | (3,575) |
| Foreign currency | (166) |
| Net realized gain (loss) | $(796,599) |
| Change in unrealized appreciation or depreciation | |
| Unaffiliated issuers | $2,766,864 |
| Affiliated issuers | 602 |
| Written options | 37,260 |
| Futures contracts | (45,969) |
| Forward foreign currency exchange contracts | (11,587) |
| Translation of assets and liabilities in foreign currencies | 1,257 |
| Net unrealized gain (loss) | $2,748,427 |
| Net realized and unrealized gain (loss) | $1,951,828 |
| Change in net assets from operations | $2,393,936 |
| Year ended | ||
| 6/30/23 | 6/30/22 | |
| Change in net assets | ||
| From operations | ||
| Net investment income (loss) | $442,108 | $135,052 |
| Net realized gain (loss) | (796,599) | 51,483 |
| Net unrealized gain (loss) | 2,748,427 | (6,930,020) |
| Change in net assets from operations | $2,393,936 | $(6,743,485) |
| Total distributions to shareholders | $(425,103) | $(1,216,364) |
| Change in net assets from fund share transactions | $(7,226,513) | $(6,332,978) |
| Total change in net assets | $(5,257,680) | $(14,292,827) |
| Net assets | ||
| At beginning of period | 42,090,641 | 56,383,468 |
| At end of period | $36,832,961 | $42,090,641 |
| Class A | Year ended | ||||
| 6/30/23 | 6/30/22 | 6/30/21 | 6/30/20 | 6/30/19 | |
| Net asset value, beginning of period | $10.33 | $12.06 | $11.32 | $10.60 | $10.07 |
| Income (loss) from investment operations | |||||
| Net investment income (loss) (d) | $0.11 | $0.03 | $0.07 | $0.07 | $0.12 |
| Net realized and unrealized gain (loss) | 0.61 | (1.51) | 0.83 | 0.77 | 0.54 |
| Total from investment operations | $0.72 | $(1.48) | $0.90 | $0.84 | $0.66 |
| Less distributions declared to shareholders | |||||
| From net investment income | $(0.11) | $(0.07) | $(0.06) | $(0.11) | $(0.13) |
| From net realized gain | — | (0.18) | (0.10) | (0.01) | — |
| Total distributions declared to shareholders | $(0.11) | $(0.25) | $(0.16) | $(0.12) | $(0.13) |
| Net asset value, end of period (x) | $10.94 | $10.33 | $12.06 | $11.32 | $10.60 |
| Total return (%) (r)(s)(t)(x) | 7.04 | (12.58) | 7.99 | 8.01 | 6.63 |
| Ratios (%) (to average net assets) and Supplemental data: | |||||
| Expenses before expense reductions (f) | 1.88 | 1.69 | 1.74 | 2.35 | 2.74 |
| Expenses after expense reductions (f) | 1.24 | 1.24 | 1.24 | 1.24 | 1.21 |
| Net investment income (loss) | 1.08 | 0.23 | 0.56 | 0.61 | 1.16 |
| Portfolio turnover | 60 | 52 | 32 | 46 | 51 |
| Net assets at end of period (000 omitted) | $8,516 | $11,779 | $16,738 | $7,992 | $3,485 |
| Class B | Year ended | ||||
| 6/30/23 | 6/30/22 | 6/30/21 | 6/30/20 | 6/30/19 | |
| Net asset value, beginning of period | $10.24 | $11.99 | $11.28 | $10.56 | $10.03 |
| Income (loss) from investment operations | |||||
| Net investment income (loss) (d) | $0.04 | $(0.06) | $(0.04) | $(0.02) | $0.05 |
| Net realized and unrealized gain (loss) | 0.61 | (1.51) | 0.85 | 0.78 | 0.53 |
| Total from investment operations | $0.65 | $(1.57) | $0.81 | $0.76 | $0.58 |
| Less distributions declared to shareholders | |||||
| From net investment income | $(0.04) | $— | $— | $(0.03) | $(0.05) |
| From net realized gain | — | (0.18) | (0.10) | (0.01) | — |
| Total distributions declared to shareholders | $(0.04) | $(0.18) | $(0.10) | $(0.04) | $(0.05) |
| Net asset value, end of period (x) | $10.85 | $10.24 | $11.99 | $11.28 | $10.56 |
| Total return (%) (r)(s)(t)(x) | 6.36 | (13.31) | 7.19 | 7.25 | 5.84 |
| Ratios (%) (to average net assets) and Supplemental data: | |||||
| Expenses before expense reductions (f) | 2.64 | 2.44 | 2.50 | 3.11 | 3.50 |
| Expenses after expense reductions (f) | 1.99 | 1.99 | 1.99 | 1.99 | 1.96 |
| Net investment income (loss) | 0.35 | (0.49) | (0.33) | (0.16) | 0.46 |
| Portfolio turnover | 60 | 52 | 32 | 46 | 51 |
| Net assets at end of period (000 omitted) | $74 | $87 | $100 | $94 | $65 |
| Class C | Year ended | ||||
| 6/30/23 | 6/30/22 | 6/30/21 | 6/30/20 | 6/30/19 | |
| Net asset value, beginning of period | $10.17 | $11.90 | $11.20 | $10.52 | $10.03 |
| Income (loss) from investment operations | |||||
| Net investment income (loss) (d) | $0.03 | $(0.06) | $(0.02) | $(0.01) | $0.05 |
| Net realized and unrealized gain (loss) | 0.60 | (1.49) | 0.82 | 0.77 | 0.53 |
| Total from investment operations | $0.63 | $(1.55) | $0.80 | $0.76 | $0.58 |
| Less distributions declared to shareholders | |||||
| From net investment income | $(0.02) | $— | $(0.00)(w) | $(0.07) | $(0.09) |
| From net realized gain | — | (0.18) | (0.10) | (0.01) | — |
| Total distributions declared to shareholders | $(0.02) | $(0.18) | $(0.10) | $(0.08) | $(0.09) |
| Net asset value, end of period (x) | $10.78 | $10.17 | $11.90 | $11.20 | $10.52 |
| Total return (%) (r)(s)(t)(x) | 6.25 | (13.25) | 7.17 | 7.29 | 5.83 |
| Ratios (%) (to average net assets) and Supplemental data: | |||||
| Expenses before expense reductions (f) | 2.64 | 2.44 | 2.49 | 3.08 | 3.49 |
| Expenses after expense reductions (f) | 1.99 | 1.99 | 1.99 | 1.99 | 1.96 |
| Net investment income (loss) | 0.32 | (0.51) | (0.18) | (0.12) | 0.46 |
| Portfolio turnover | 60 | 52 | 32 | 46 | 51 |
| Net assets at end of period (000 omitted) | $5,204 | $7,200 | $8,893 | $4,624 | $1,311 |
| Class I | Year ended | ||||
| 6/30/23 | 6/30/22 | 6/30/21 | 6/30/20 | 6/30/19 | |
| Net asset value, beginning of period | $10.35 | $12.09 | $11.34 | $10.61 | $10.08 |
| Income (loss) from investment operations | |||||
| Net investment income (loss) (d) | $0.14 | $0.05 | $0.09 | $0.09 | $0.14 |
| Net realized and unrealized gain (loss) | 0.61 | (1.51) | 0.84 | 0.79 | 0.53 |
| Total from investment operations | $0.75 | $(1.46) | $0.93 | $0.88 | $0.67 |
| Less distributions declared to shareholders | |||||
| From net investment income | $(0.14) | $(0.10) | $(0.08) | $(0.14) | $(0.14) |
| From net realized gain | — | (0.18) | (0.10) | (0.01) | — |
| Total distributions declared to shareholders | $(0.14) | $(0.28) | $(0.18) | $(0.15) | $(0.14) |
| Net asset value, end of period (x) | $10.96 | $10.35 | $12.09 | $11.34 | $10.61 |
| Total return (%) (r)(s)(t)(x) | 7.38 | (12.41) | 8.24 | 8.33 | 6.81 |
| Ratios (%) (to average net assets) and Supplemental data: | |||||
| Expenses before expense reductions (f) | 1.64 | 1.43 | 1.48 | 2.08 | 2.49 |
| Expenses after expense reductions (f) | 0.99 | 0.99 | 0.99 | 0.99 | 0.96 |
| Net investment income (loss) | 1.39 | 0.42 | 0.76 | 0.87 | 1.41 |
| Portfolio turnover | 60 | 52 | 32 | 46 | 51 |
| Net assets at end of period (000 omitted) | $11,703 | $12,499 | $18,654 | $5,093 | $1,870 |
| Class R1 | Year ended | ||||
| 6/30/23 | 6/30/22 | 6/30/21 | 6/30/20 | 6/30/19 | |
| Net asset value, beginning of period | $10.24 | $11.99 | $11.29 | $10.56 | $10.03 |
| Income (loss) from investment operations | |||||
| Net investment income (loss) (d) | $0.05 | $(0.05) | $(0.01) | $(0.02) | $0.04 |
| Net realized and unrealized gain (loss) | 0.60 | (1.52) | 0.81 | 0.79 | 0.54 |
| Total from investment operations | $0.65 | $(1.57) | $0.80 | $0.77 | $0.58 |
| Less distributions declared to shareholders | |||||
| From net investment income | $(0.04) | $— | $— | $(0.03) | $(0.05) |
| From net realized gain | — | (0.18) | (0.10) | (0.01) | — |
| Total distributions declared to shareholders | $(0.04) | $(0.18) | $(0.10) | $(0.04) | $(0.05) |
| Net asset value, end of period (x) | $10.85 | $10.24 | $11.99 | $11.29 | $10.56 |
| Total return (%) (r)(s)(t)(x) | 6.41 | (13.32) | 7.10 | 7.32 | 5.81 |
| Ratios (%) (to average net assets) and Supplemental data: | |||||
| Expenses before expense reductions (f) | 2.64 | 2.44 | 2.49 | 3.10 | 3.49 |
| Expenses after expense reductions (f) | 1.99 | 1.99 | 1.99 | 1.99 | 1.96 |
| Net investment income (loss) | 0.44 | (0.47) | (0.05) | (0.15) | 0.39 |
| Portfolio turnover | 60 | 52 | 32 | 46 | 51 |
| Net assets at end of period (000 omitted) | $264 | $223 | $240 | $57 | $53 |
| Class R2 | Year ended | ||||
| 6/30/23 | 6/30/22 | 6/30/21 | 6/30/20 | 6/30/19 | |
| Net asset value, beginning of period | $10.33 | $12.06 | $11.32 | $10.59 | $10.06 |
| Income (loss) from investment operations | |||||
| Net investment income (loss) (d) | $0.09 | $0.00(w) | $0.03 | $0.04 | $0.09 |
| Net realized and unrealized gain (loss) | 0.61 | (1.51) | 0.83 | 0.78 | 0.54 |
| Total from investment operations | $0.70 | $(1.51) | $0.86 | $0.82 | $0.63 |
| Less distributions declared to shareholders | |||||
| From net investment income | $(0.09) | $(0.04) | $(0.02) | $(0.08) | $(0.10) |
| From net realized gain | — | (0.18) | (0.10) | (0.01) | — |
| Total distributions declared to shareholders | $(0.09) | $(0.22) | $(0.12) | $(0.09) | $(0.10) |
| Net asset value, end of period (x) | $10.94 | $10.33 | $12.06 | $11.32 | $10.59 |
| Total return (%) (r)(s)(t)(x) | 6.86 | (12.80) | 7.62 | 7.82 | 6.31 |
| Ratios (%) (to average net assets) and Supplemental data: | |||||
| Expenses before expense reductions (f) | 2.14 | 1.94 | 2.01 | 2.60 | 2.99 |
| Expenses after expense reductions (f) | 1.49 | 1.49 | 1.49 | 1.49 | 1.46 |
| Net investment income (loss) | 0.91 | 0.01 | 0.27 | 0.35 | 0.90 |
| Portfolio turnover | 60 | 52 | 32 | 46 | 51 |
| Net assets at end of period (000 omitted) | $58 | $54 | $62 | $58 | $53 |
| Class R3 | Year ended | ||||
| 6/30/23 | 6/30/22 | 6/30/21 | 6/30/20 | 6/30/19 | |
| Net asset value, beginning of period | $10.34 | $12.08 | $11.33 | $10.60 | $10.07 |
| Income (loss) from investment operations | |||||
| Net investment income (loss) (d) | $0.12 | $0.03 | $0.06 | $0.07 | $0.12 |
| Net realized and unrealized gain (loss) | 0.61 | (1.52) | 0.84 | 0.78 | 0.53 |
| Total from investment operations | $0.73 | $(1.49) | $0.90 | $0.85 | $0.65 |
| Less distributions declared to shareholders | |||||
| From net investment income | $(0.12) | $(0.07) | $(0.05) | $(0.11) | $(0.12) |
| From net realized gain | — | (0.18) | (0.10) | (0.01) | — |
| Total distributions declared to shareholders | $(0.12) | $(0.25) | $(0.15) | $(0.12) | $(0.12) |
| Net asset value, end of period (x) | $10.95 | $10.34 | $12.08 | $11.33 | $10.60 |
| Total return (%) (r)(s)(t)(x) | 7.13 | (12.65) | 7.96 | 8.07 | 6.56 |
| Ratios (%) (to average net assets) and Supplemental data: | |||||
| Expenses before expense reductions (f) | 1.89 | 1.69 | 1.76 | 2.35 | 2.74 |
| Expenses after expense reductions (f) | 1.24 | 1.24 | 1.24 | 1.24 | 1.21 |
| Net investment income (loss) | 1.16 | 0.26 | 0.51 | 0.60 | 1.15 |
| Portfolio turnover | 60 | 52 | 32 | 46 | 51 |
| Net assets at end of period (000 omitted) | $59 | $55 | $63 | $58 | $54 |
| Class R4 | Year ended | ||||
| 6/30/23 | 6/30/22 | 6/30/21 | 6/30/20 | 6/30/19 | |
| Net asset value, beginning of period | $10.36 | $12.10 | $11.34 | $10.61 | $10.08 |
| Income (loss) from investment operations | |||||
| Net investment income (loss) (d) | $0.15 | $0.06 | $0.09 | $0.09 | $0.14 |
| Net realized and unrealized gain (loss) | 0.60 | (1.52) | 0.85 | 0.79 | 0.53 |
| Total from investment operations | $0.75 | $(1.46) | $0.94 | $0.88 | $0.67 |
| Less distributions declared to shareholders | |||||
| From net investment income | $(0.14) | $(0.10) | $(0.08) | $(0.14) | $(0.14) |
| From net realized gain | — | (0.18) | (0.10) | (0.01) | — |
| Total distributions declared to shareholders | $(0.14) | $(0.28) | $(0.18) | $(0.15) | $(0.14) |
| Net asset value, end of period (x) | $10.97 | $10.36 | $12.10 | $11.34 | $10.61 |
| Total return (%) (r)(s)(t)(x) | 7.39 | (12.40) | 8.31 | 8.33 | 6.81 |
| Ratios (%) (to average net assets) and Supplemental data: | |||||
| Expenses before expense reductions (f) | 1.64 | 1.44 | 1.51 | 2.10 | 2.49 |
| Expenses after expense reductions (f) | 0.99 | 0.99 | 0.99 | 0.99 | 0.96 |
| Net investment income (loss) | 1.41 | 0.51 | 0.77 | 0.86 | 1.40 |
| Portfolio turnover | 60 | 52 | 32 | 46 | 51 |
| Net assets at end of period (000 omitted) | $59 | $55 | $63 | $58 | $54 |
| Class R6 | Year ended | ||||
| 6/30/23 | 6/30/22 | 6/30/21 | 6/30/20 | 6/30/19 | |
| Net asset value, beginning of period | $10.36 | $12.10 | $11.35 | $10.62 | $10.08 |
| Income (loss) from investment operations | |||||
| Net investment income (loss) (d) | $0.15 | $0.07 | $0.10 | $0.10 | $0.14 |
| Net realized and unrealized gain (loss) | 0.61 | (1.53) | 0.83 | 0.78 | 0.55 |
| Total from investment operations | $0.76 | $(1.46) | $0.93 | $0.88 | $0.69 |
| Less distributions declared to shareholders | |||||
| From net investment income | $(0.15) | $(0.10) | $(0.08) | $(0.14) | $(0.15) |
| From net realized gain | — | (0.18) | (0.10) | (0.01) | — |
| Total distributions declared to shareholders | $(0.15) | $(0.28) | $(0.18) | $(0.15) | $(0.15) |
| Net asset value, end of period (x) | $10.97 | $10.36 | $12.10 | $11.35 | $10.62 |
| Total return (%) (r)(s)(t)(x) | 7.48 | (12.35) | 8.26 | 8.33 | 6.92 |
| Ratios (%) (to average net assets) and Supplemental data: | |||||
| Expenses before expense reductions (f) | 1.57 | 1.37 | 1.45 | 2.07 | 2.48 |
| Expenses after expense reductions (f) | 0.92 | 0.92 | 0.93 | 0.95 | 0.95 |
| Net investment income (loss) | 1.48 | 0.58 | 0.83 | 0.89 | 1.41 |
| Portfolio turnover | 60 | 52 | 32 | 46 | 51 |
| Net assets at end of period (000 omitted) | $10,896 | $10,140 | $11,569 | $10,682 | $9,857 |
| (d) | Per share data is based on average shares outstanding. |
| (f) | Ratios do not reflect reductions from fees paid indirectly, if applicable. See Note 2 in the Notes to Financial Statements for additional information. |
| (r) | Certain expenses have been reduced without which performance would have been lower. |
| (s) | From time to time the fund may receive proceeds from litigation settlements, without which performance would be lower. |
| (t) | Total returns do not include any applicable sales charges. |
| (w) | Per share amount was less than $0.01. |
| (x) | The net asset values and total returns have been calculated on net assets which include adjustments made in accordance with U.S. generally accepted accounting principles required at period end for financial reporting purposes. |
| Financial Instruments | Level 1 | Level 2 | Level 3 | Total |
| Equity Securities: | ||||
| United States | $4,531,335 | $190,307 | $— | $4,721,642 |
| Japan | — | 3,216,807 | — | 3,216,807 |
| Germany | 3,073,935 | — | — | 3,073,935 |
| France | 1,827,122 | — | — | 1,827,122 |
| United Kingdom | 1,585,435 | — | — | 1,585,435 |
| Spain | 1,432,905 | — | — | 1,432,905 |
| Netherlands | 1,278,239 | — | — | 1,278,239 |
| Switzerland | 1,193,699 | — | — | 1,193,699 |
| South Korea | — | 769,591 | — | 769,591 |
| Other Countries | 1,766,084 | 1,603 | — | 1,767,687 |
| U.S. Treasury Bonds & U.S. Government Agencies & Equivalents | — | 8,543,955 | — | 8,543,955 |
| U.S. Corporate Bonds | — | 3,108,722 | — | 3,108,722 |
| Residential Mortgage-Backed Securities | — | 1,130,251 | — | 1,130,251 |
| Asset-Backed Securities (including CDOs) | — | 98,674 | — | 98,674 |
| Foreign Bonds | — | 1,012,402 | — | 1,012,402 |
| Mutual Funds | 2,206,478 | — | — | 2,206,478 |
| Total | $18,895,232 | $18,072,312 | $— | $36,967,544 |
| Other Financial Instruments | ||||
| Futures Contracts – Liabilities | $(31,833) | $— | $— | $(31,833) |
| Forward Foreign Currency Exchange Contracts – Assets | — | 2,155 | — | 2,155 |
| Forward Foreign Currency Exchange Contracts – Liabilities | — | (1,613) | — | (1,613) |
| Written Options - Liabilities | — | (1,886) | — | (1,886) |
| Fair Value (a) | |||
| Risk | Derivative Contracts | Asset Derivatives | Liability Derivatives |
| Equity | Written Option Contracts | $— | $(1,886) |
| Equity | Purchased Option Contracts | 191,910 | — |
| Equity | Futures Contracts | — | (31,833) |
| Foreign Exchange | Forward Foreign Currency Exchange Contracts | 2,155 | (1,613) |
| Total | $194,065 | $(35,332) | |
| (a) | The value of purchased options outstanding is included in investments in unaffiliated issuers, at value, within the Statement of Assets and Liabilities. Values presented in this table for futures contracts correspond to the values reported in the Portfolio of Investments. Only the current day net variation margin for futures contracts is reported separately within the Statement of Assets and Liabilities. |
| Risk | Futures Contracts | Forward Foreign Currency Exchange Contracts | Unaffiliated Issuers (Purchased Options) | Written Options |
| Foreign Exchange | $— | $(3,575) | $— | $— |
| Equity | (71,024) | — | 463,534 | 2,529 |
| Total | $(71,024) | $(3,575) | $463,534 | $2,529 |
| Risk | Futures Contracts | Forward Foreign Currency Exchange Contracts | Unaffiliated Issuers (Purchased Options) | Written Options |
| Foreign Exchange | $— | $(11,587) | $— | $— |
| Equity | (45,969) | — | (624,387) | 37,260 |
| Total | $(45,969) | $(11,587) | $(624,387) | $37,260 |
| Year ended 6/30/23 | Year ended 6/30/22 | |
| Ordinary income (including any short-term capital gains) | $425,103 | $408,811 |
| Long-term capital gains | — | 807,553 |
| Total distributions | $425,103 | $1,216,364 |
| As of 6/30/23 | |
| Cost of investments | $37,062,484 |
| Gross appreciation | 3,425,600 |
| Gross depreciation | (3,553,717) |
| Net unrealized appreciation (depreciation) | $(128,117) |
| Undistributed ordinary income | 294,496 |
| Capital loss carryforwards | (1,226,169) |
| Other temporary differences | 402 |
| Total distributable earnings (loss) | $(1,059,388) |
| Short-Term | $(912,338) |
| Long-Term | (313,831) |
| Total | $(1,226,169) |
| Year ended 6/30/23 | Year ended 6/30/22 | ||
| Class A | $99,764 | $316,149 | |
| Class B | 316 | 1,466 | |
| Class C | 14,767 | 137,983 | |
| Class I | 157,763 | 485,200 | |
| Class R1 | 964 | 3,562 | |
| Class R2 | 479 | 1,096 | |
| Class R3 | 625 | 1,258 | |
| Class R4 | 773 | 1,424 | |
| Class R6 | 149,652 | 268,226 | |
| Total | $425,103 | $1,216,364 |
| Up to $1 billion | 0.80% |
| In excess of $1 billion and up to $2.5 billion | 0.75% |
| In excess of $2.5 billion | 0.70% |
| Classes | ||||||||
| A | B | C | I | R1 | R2 | R3 | R4 | R6 |
| 1.24% | 1.99% | 1.99% | 0.99% | 1.99% | 1.49% | 1.24% | 0.99% | 0.95% |
| Distribution Fee Rate (d) | Service Fee Rate (d) | Total Distribution Plan (d) | Annual Effective Rate (e) | Distribution and Service Fee | |
| Class A | — | 0.25% | 0.25% | 0.25% | $ 24,359 |
| Class B | 0.75% | 0.25% | 1.00% | 1.00% | 812 |
| Class C | 0.75% | 0.25% | 1.00% | 1.00% | 61,909 |
| Class R1 | 0.75% | 0.25% | 1.00% | 1.00% | 2,330 |
| Class R2 | 0.25% | 0.25% | 0.50% | 0.50% | 273 |
| Class R3 | — | 0.25% | 0.25% | 0.25% | 138 |
| Total Distribution and Service Fees | $89,821 |
| (d) | In accordance with the distribution plan for certain classes, the fund pays distribution and/or service fees equal to these annual percentage rates of each class’s average daily net assets. The distribution and service fee rates disclosed by class represent the current rates in effect at the end of the reporting period. Any rate changes, if applicable, are detailed below. |
| (e) | The annual effective rates represent actual fees incurred under the distribution plan for the year ended June 30, 2023 based on each class's average daily net assets. MFD has voluntarily |
| Amount | |
| Class A | $8,140 |
| Class B | — |
| Class C | 1,915 |
| Purchases | Sales | |
| U.S. Government securities | $14,784,492 | $16,855,127 |
| Non-U.S. Government securities | 6,736,402 | 10,780,097 |
| Year ended 6/30/23 | Year ended 6/30/22 | ||||
| Shares | Amount | Shares | Amount | ||
| Shares sold | |||||
| Class A | 65,895 | $678,200 | 328,306 | $3,881,834 | |
| Class B | — | — | 444 | 5,000 | |
| Class C | 9,166 | 94,503 | 187,706 | 2,203,007 | |
| Class I | 164,209 | 1,709,377 | 605,775 | 7,257,787 | |
| Class R1 | 5,151 | 53,020 | 3,967 | 45,636 | |
| 244,421 | $2,535,100 | 1,126,198 | $13,393,264 | ||
| Shares issued to shareholders in reinvestment of distributions | |||||
| Class A | 9,800 | $99,764 | 26,792 | $316,149 | |
| Class B | 31 | 316 | 125 | 1,466 | |
| Class C | 1,465 | 14,767 | 11,824 | 137,983 | |
| Class I | 15,498 | 157,763 | 41,084 | 485,200 | |
| Class R1 | 95 | 964 | 303 | 3,562 | |
| Class R2 | 47 | 479 | 93 | 1,096 | |
| Class R3 | 61 | 625 | 107 | 1,258 | |
| Class R4 | 76 | 773 | 120 | 1,424 | |
| Class R6 | 14,686 | 149,652 | 22,692 | 268,226 | |
| 41,759 | $425,103 | 103,140 | $1,216,364 | ||
| Year ended 6/30/23 | Year ended 6/30/22 | ||||
| Shares | Amount | Shares | Amount | ||
| Shares reacquired | |||||
| Class A | (438,202) | $(4,466,178) | (602,024) | $(7,028,652) | |
| Class B | (1,705) | (17,826) | (466) | (5,416) | |
| Class C | (236,159) | (2,413,357) | (238,569) | (2,753,643) | |
| Class I | (319,523) | (3,261,979) | (981,872) | (11,125,911) | |
| Class R1 | (2,654) | (27,376) | (2,574) | (28,984) | |
| (998,243) | $(10,186,716) | (1,825,505) | $(20,942,606) | ||
| Net change | |||||
| Class A | (362,507) | $(3,688,214) | (246,926) | $(2,830,669) | |
| Class B | (1,674) | (17,510) | 103 | 1,050 | |
| Class C | (225,528) | (2,304,087) | (39,039) | (412,653) | |
| Class I | (139,816) | (1,394,839) | (335,013) | (3,382,924) | |
| Class R1 | 2,592 | 26,608 | 1,696 | 20,214 | |
| Class R2 | 47 | 479 | 93 | 1,096 | |
| Class R3 | 61 | 625 | 107 | 1,258 | |
| Class R4 | 76 | 773 | 120 | 1,424 | |
| Class R6 | 14,686 | 149,652 | 22,692 | 268,226 | |
| (712,063) | $(7,226,513) | (596,167) | $(6,332,978) | ||
| Affiliated Issuers | Beginning Value | Purchases | Sales Proceeds | Realized Gain (Loss) | Change in Unrealized Appreciation or Depreciation | Ending Value |
| MFS Institutional Money Market Portfolio | $2,529,336 | $16,996,295 | $17,319,504 | $(251) | $602 | $2,206,478 |
| Affiliated Issuers | Dividend Income | Capital Gain Distributions |
| MFS Institutional Money Market Portfolio | $80,320 | $— |
MFS Prudent Investor Fund:
August 15, 2023
| Name, Age | Position(s) Held with Fund | Trustee/Officer Since(h) | Number of MFS Funds overseen by the Trustee | Principal Occupations During the Past Five Years | Other Directorships During the Past Five Years (j) | |||||
| INTERESTED TRUSTEE | ||||||||||
| Michael W. Roberge (k) (age 56) | Trustee | January 2021 | 136 | Massachusetts Financial Services Company, Chairman (since January 2021); Chief Executive Officer (since January 2017); Director; Chairman of the Board (since January 2022); President (until December 2018); Chief Investment Officer (until December 2018) | N/A | |||||
| INDEPENDENT TRUSTEES | ||||||||||
| John P. Kavanaugh (age 68) | Trustee and Chair of Trustees | January 2009 | 136 | Private investor | N/A | |||||
| Steven E. Buller (age 72) | Trustee | February 2014 | 136 | Private investor | N/A | |||||
| John A. Caroselli (age 69) | Trustee | March 2017 | 136 | Private investor; JC Global Advisors, LLC (management consulting), President (since 2015) | N/A | |||||
| Maureen R. Goldfarb (age 68) | Trustee | January 2009 | 136 | Private investor | N/A | |||||
| Peter D. Jones (age 68) | Trustee | January 2019 | 136 | Private investor | N/A | |||||
| James W. Kilman, Jr. (age 62) | Trustee | January 2019 | 136 | Burford Capital Limited (finance and investment management), Senior Advisor (since May 3, 2021), Chief Financial Officer (2019 - May 2, 2021); KielStrand Capital LLC (family office), Chief Executive Officer (since 2016) | Alpha-En Corporation, Director (2016-2019) |
| Name, Age | Position(s) Held with Fund | Trustee/Officer Since(h) | Number of MFS Funds overseen by the Trustee | Principal Occupations During the Past Five Years | Other Directorships During the Past Five Years (j) | |||||
| Clarence Otis, Jr. (age 67) | Trustee | March 2017 | 136 | Private investor | VF Corporation, Director; Verizon Communications, Inc., Director; The Travelers Companies, Director | |||||
| Maryanne L. Roepke (age 67) | Trustee | May 2014 | 136 | Private investor | N/A | |||||
| Laurie J. Thomsen (age 65) | Trustee | March 2005 | 136 | Private investor | The Travelers Companies, Director; Dycom Industries, Inc., Director |
| Name, Age | Position(s) Held with Fund | Trustee/Officer Since(h) | Number of MFS Funds for which the Person is an Officer | Principal Occupations During the Past Five Years | ||||
| OFFICERS | ||||||||
| Christopher R. Bohane (k) (age 49) | Assistant Secretary and Assistant Clerk | July 2005 | 136 | Massachusetts Financial Services Company, Senior Vice President and Senior Managing Counsel | ||||
| Kino Clark (k) (age 55) | Assistant Treasurer | January 2012 | 136 | Massachusetts Financial Services Company, Vice President | ||||
| John W. Clark, Jr. (k) (age 56) | Assistant Treasurer | April 2017 | 136 | Massachusetts Financial Services Company, Vice President | ||||
| David L. DiLorenzo (k) (age 54) | President | July 2005 | 136 | Massachusetts Financial Services Company, Senior Vice President | ||||
| Heidi W. Hardin (k) (age 55) | Secretary and Clerk | April 2017 | 136 | Massachusetts Financial Services Company, Executive Vice President and General Counsel | ||||
| Brian E. Langenfeld (k) (age 50) | Assistant Secretary and Assistant Clerk | June 2006 | 136 | Massachusetts Financial Services Company, Vice President and Managing Counsel |
| Name, Age | Position(s) Held with Fund | Trustee/Officer Since(h) | Number of MFS Funds for which the Person is an Officer | Principal Occupations During the Past Five Years | ||||
| Rosa E. Licea-Mailloux (k) (age 46) | Chief Compliance Officer | March 2022 | 136 | Massachusetts Financial Services Company, Vice President (since 2018); Director of Corporate Compliance (2018-2021), Senior Director Compliance (2021-2022), Senior Managing Director of North American Compliance & Chief Compliance Officer (since March 2022); Natixis Investment Managers (investment management), Funds Chief Compliance Officer, Deputy General Counsel & Senior Vice President (until 2018) | ||||
| Amanda S. Mooradian (k) (age 44) | Assistant Secretary and Assistant Clerk | September 2018 | 136 | Massachusetts Financial Services Company, Assistant Vice President and Senior Counsel | ||||
| Susan A. Pereira (k) (age 52) | Assistant Secretary and Assistant Clerk | July 2005 | 136 | Massachusetts Financial Services Company, Vice President and Managing Counsel | ||||
| Kasey L. Phillips (k) (age 52) | Assistant Treasurer | September 2012 | 136 | Massachusetts Financial Services Company, Vice President | ||||
| Matthew A. Stowe (k) (age 48) | Assistant Secretary and Assistant Clerk | October 2014 | 136 | Massachusetts Financial Services Company, Vice President and Senior Managing Counsel | ||||
| William B. Wilson (k) (age 40) | Assistant Secretary and Assistant Clerk | October 2022 | 136 | Massachusetts Financial Services Company, Assistant Vice President and Senior Counsel | ||||
| James O. Yost (k) (age 63) | Treasurer | September 1990 | 136 | Massachusetts Financial Services Company, Senior Vice President |
| (h) | Date first appointed to serve as Trustee/Officer of an MFS Fund. Each Trustee has served continuously since appointment unless indicated otherwise. From January 2012 through December 2016, Messrs. DiLorenzo and Yost served as Treasurer and Deputy Treasurer of the Funds, respectively. |
| (j) | Directorships or trusteeships of companies required to report to the Securities and Exchange Commission (i.e., “public companies”). |
| (k) | “Interested person” of the Trust within the meaning of the Investment Company Act of 1940 (referred to as the 1940 Act), which is the principal federal law governing investment companies like the fund, as a result of a position with MFS. The address of MFS is 111 Huntington Avenue, Boston, Massachusetts 02199-7618. |
| Investment Adviser | Custodian |
| Massachusetts Financial Services Company 111 Huntington Avenue Boston, MA 02199-7618 | JPMorgan Chase Bank, NA 4 Metrotech Center New York, NY 11245 |
| Distributor | Independent Registered Public Accounting Firm |
| MFS Fund Distributors, Inc. 111 Huntington Avenue Boston, MA 02199-7618 | Deloitte & Touche LLP 200 Berkeley Street Boston, MA 02116 |
| Portfolio Manager(s) | |
| David Cole Shanti Das-Wermes Edward Dearing Barnaby Wiener |
| FACTS | WHAT DOES MFS DO WITH YOUR PERSONAL INFORMATION? |
| Why? | Financial companies choose how they share your personal information. Federal law gives consumers the right to limit some but not all sharing. Federal law also requires us to tell you how we collect, share, and protect your personal information. Please read this notice carefully to understand what we do. |
| What? | The types of personal information we collect and share depend on the product or service you have with us. This information can include: |
| • Social Security number and account balances | |
| • Account transactions and transaction history | |
| • Checking account information and wire transfer instructions | |
| When you are no longer our customer, we continue to share your information as described in this notice. |
| How? | All financial companies need to share customers' personal information to run their everyday business. In the section below, we list the reasons financial companies can share their customers' personal information; the reasons MFS chooses to share; and whether you can limit this sharing. |
| Reasons we can share your personal information | Does MFS share? | Can you limit this sharing? |
| For our everyday business purposes – such as to process your transactions, maintain your account(s), respond to court orders and legal investigations, or report to credit bureaus | Yes | No |
| For our marketing purposes – to offer our products and services to you | No | We don't share |
| For joint marketing with other financial companies | No | We don't share |
| For our affiliates' everyday business purposes – information about your transactions and experiences | No | We don't share |
| For our affiliates' everyday business purposes – information about your creditworthiness | No | We don't share |
| For nonaffiliates to market to you | No | We don't share |
| Questions? | Call 800-225-2606 or go to mfs.com. |

| Who we are | |
| Who is providing this notice? | MFS Funds, MFS Investment Management, MFS Institutional Advisors, Inc., and MFS Heritage Trust Company. |
| What we do | |
| How does MFS protect my personal information? | To protect your personal information from unauthorized access and use, we use security measures that comply with federal law. These measures include procedural, electronic, and physical safeguards for the protection of the personal information we collect about you. |
| How does MFS collect my personal information? | We collect your personal information, for example, when you |
| • open an account or provide account information | |
| • direct us to buy securities or direct us to sell your securities | |
| • make a wire transfer | |
| We also collect your personal information from others, such as credit bureaus, affiliates, or other companies. | |
| Why can't I limit all sharing? | Federal law gives you the right to limit only |
| • sharing for affiliates' everyday business purposes – information about your creditworthiness | |
| • affiliates from using your information to market to you | |
| • sharing for nonaffiliates to market to you | |
| State laws and individual companies may give you additional rights to limit sharing. | |
| Definitions | |
| Affiliates | Companies related by common ownership or control. They can be financial and nonfinancial companies. |
| • MFS does not share personal information with affiliates, except for everyday business purposes as described on page one of this notice. | |
| Nonaffiliates | Companies not related by common ownership or control. They can be financial and nonfinancial companies. |
| • MFS does not share with nonaffiliates so they can market to you. | |
| Joint marketing | A formal agreement between nonaffiliated financial companies that together market financial products or services to you. |
| • MFS doesn't jointly market. | |
| Other important information |
| If you own an MFS product or receive an MFS service in the name of a third party such as a bank or broker-dealer, their privacy policy may apply to you instead of ours. |

Item 1(b):
Not applicable.
ITEM 2. CODE OF ETHICS.
The Registrant has adopted a Code of Ethics (the "Code") pursuant to Section 406 of the Sarbanes-Oxley Act and as defined in Form N-CSR that applies to the Registrant's principal executive officer and principal financial and accounting officer. During the period covered by this report, the Registrant has not amended any provision in the Code that relates to an element of the Code's definition enumerated in paragraph
(b)of Item 2 of this Form N-CSR. During the period covered by this report, the Registrant did not grant a waiver, including an implicit waiver, from any provision of the Code.
A copy of the Code is attached hereto as EX-99.COE.
ITEM 3. AUDIT COMMITTEE FINANCIAL EXPERT.
Messrs. Steven E. Buller, James Kilman, and Clarence Otis, Jr. and Ms. Maryanne L. Roepke, members of the Audit Committee, have been determined by the Board of Trustees in their reasonable business judgment to meet the definition of "audit committee financial expert" as such term is defined in Form N-CSR. In addition, Messrs. Buller, Kilman, and Otis and Ms. Roepke are "independent" members of the Audit Committee (as such term has been defined by the Securities and Exchange Commission in regulations implementing Section 407 of the Sarbanes-Oxley Act of 2002). The Securities and Exchange Commission has stated that the designation of a person as an audit committee financial expert pursuant to this Item 3 on the Form N-CSR does not impose on such a person any duties, obligations or liability that are greater than the duties, obligations or liability imposed on such person as a member of the Audit Committee and the Board of Trustees in the absence of such designation or identification.
ITEM 4. PRINCIPAL ACCOUNTANT FEES AND SERVICES.
Items 4(a) through 4(d) and 4(g):
The Board of Trustees has appointed Deloitte & Touche LLP ("Deloitte") to serve as independent accountants to a series of the Registrant (each a "Fund" and collectively the "Funds"). The tables below set forth the audit fees billed to each Fund as well as fees for non-audit services provided to each Fund and/or to the Fund's investment adviser, Massachusetts Financial Services Company ("MFS"), and to various entities either controlling, controlled by, or under common control with MFS that provide ongoing services to the Fund ("MFS Related Entities").
For the fiscal years ended June 30, 2023 and 2022, audit fees billed to each Fund by Deloitte were as follows:
Fees billed by Deloitte: |
| Audit Fees | |
| 2023 |
| 2022 |
MFS Prudent Investor Fund | 56,143 |
| 51,949 |
For the fiscal years ended June 30, 2023 and 2022, fees billed by Deloitte for audit-related, tax and other services provided to each Fund and for audit-related, tax and other services provided to MFS and MFS Related Entities were as follows:
Fees billed by Deloitte: | Audit-Related Fees1 |
| Tax Fees2 | All Other Fees3 | |||||
| 2023 | 2022 | 2023 |
| 2022 | 2023 |
| 2022 | |
To MFS Prudent Investor Fund | 0 | 0 | 0 |
| 400 | 0 |
| 0 | |
|
|
|
|
| |||||
Fees billed by Deloitte: | Audit-Related Fees1 |
| Tax Fees2 | All Other Fees3 | |||||
| 2023 | 2022 |
| 2023 |
| 2022 | 2023 |
| 2022 |
To MFS and MFS Related |
|
|
|
|
|
|
|
|
|
Entities of MFS Prudent | 0 | 0 |
| 0 |
| 0 | 3,790 |
| 3,790 |
Investor Fund* |
|
|
|
|
|
|
|
|
|
|
|
|
|
| |||||
Fees billed by Deloitte: |
|
|
| Aggregate Fees for Non-audit Services | |||||
|
|
|
|
| 2023 |
| 2022 | ||
To MFS Prudent Investor Fund, MFS and MFS Related |
|
|
|
|
|
|
| ||
Entities# |
|
|
|
| 3,790 |
| 4,190 | ||
*This amount reflects the fees billed to MFS and MFS Related Entities for non-audit services relating directly to the operations and financial reporting of the Funds (portions of which services also related to the operations and financial reporting of other funds within the MFS Funds complex).
# This amount reflects the aggregate fees billed by Deloitte for non-audit services rendered to the Funds and for non-audit services rendered to MFS and the MFS Related Entities.
1 The fees included under "Audit-Related Fees" are fees related to assurance and related services that are reasonably related to the performance of the audit or review of financial statements, but not reported under ''Audit Fees,'' including accounting consultations, agreed-upon procedure reports, attestation reports, comfort letters and internal control reviews.
2 The fees included under "Tax Fees" are fees associated with tax compliance, tax advice and tax planning, including services relating to the filing or amendment of federal, state or local income tax returns, regulated investment company qualification reviews and tax distribution and analysis.
3 The fees included under "All Other Fees" are fees for products and services provided by Deloitte other than those reported under "Audit Fees," "Audit-Related Fees" and "Tax Fees".
Item 4(e)(1):
Set forth below are the policies and procedures established by the Audit Committee of the Board of Trustees relating to the pre- approval of audit and non-audit related services:
To the extent required by applicable law, pre-approval by the Audit Committee of the Board is needed for all audit and permissible non-audit services rendered to the Fund and all permissible non-audit services rendered to MFS or MFS Related Entities if the services relate directly to the operations and financial reporting of the Registrant. Pre-approval is currently on an engagement-by-engagement basis. In the event pre-approval of such services is necessary between regular meetings of the Audit Committee and it is not practical to wait to seek pre-approval at the next regular meeting of the Audit Committee, pre-approval of such services may be referred to the Chair of the Audit Committee for approval; provided that the Chair may not pre-approve any individual engagement for such services exceeding $50,000 or multiple engagements for such services in the aggregate exceeding $100,000 in each period between regular
meetings of the Audit Committee. Any engagement pre-approved by the Chair between regular meetings of the Audit Committee shall be presented for ratification by the entire Audit Committee at its next regularly scheduled meeting.
Item 4(e)(2):
None, or 0%, of the services relating to the Audit-Related Fees, Tax Fees and All Other Fees paid by the Fund and MFS and MFS Related Entities relating directly to the operations and financial reporting of the Registrant disclosed above were approved by the audit committee pursuant to paragraphs (c)(7)(i)(C) of Rule 2-01 of Regulation S-X (which permits audit committee approval after the start of the engagement with respect to services other than audit, review or attest services, if certain conditions are satisfied).
Item 4(f):
Not applicable.
Item 4(h):
The Registrant's Audit Committee has considered whether the provision by a Registrant's independent registered public accounting firm of non-audit services to MFS and MFS Related Entities that were not pre-approved by the Committee (because such services did not relate directly to the operations and financial reporting of the Registrant) was compatible with maintaining the independence of the independent registered public accounting firm as the Registrant's principal auditors.
ITEM 5. AUDIT COMMITTEE OF LISTED REGISTRANTS.
Not applicable to the Registrant.
ITEM 6. INVESTMENTS
A schedule of investments for each series covered by this Form N-CSR is included as part of the report to shareholders of such series under Item 1(a) of this Form N-CSR.
ITEM 7. DISCLOSURE OF PROXY VOTING POLICIES AND PROCEDURES FOR CLOSED-END MANAGEMENT INVESTMENT COMPANIES.
Not applicable to the Registrant.
ITEM 8. PORTFOLIO MANAGERS OF CLOSED-END MANAGEMENT INVESTMENT COMPANIES.
Not applicable to the Registrant.
ITEM 9. PURCHASES OF EQUITY SECURITIES BY CLOSED-END MANAGEMENT INVESTMENT COMPANY AND AFFILIATED PURCHASERS.
Not applicable to the Registrant.
ITEM 10. SUBMISSION OF MATTERS TO A VOTE OF SECURITY HOLDERS.
There were no material changes to the procedures by which shareholders may send recommendations to the Board for nominees to the Registrant's Board since the Registrant last provided disclosure as to such procedures in response to the requirements of Item 407 (c)(2)(iv) of Regulation S-K or this Item.
ITEM 11. CONTROLS AND PROCEDURES.
(a)Based upon their evaluation of the effectiveness of the registrant's disclosure controls and procedures (as defined in Rule 30a-3(c) under the Investment Company Act of 1940 (the "Act")) as conducted within 90 days of the filing date of this report on Form N-CSR, the Registrant's principal financial officer and principal executive officer have concluded that those disclosure controls and procedures provide reasonable assurance that the material information required to be disclosed by the Registrant on this report is recorded, processed, summarized and reported within the time periods specified in the Securities and Exchange Commission's rules and forms.
(b)There were no changes in the Registrant's internal controls over financial reporting (as defined in Rule 30a-3(d) under the Act) that occurred during the period covered by the report that have materially affected, or are reasonably likely to materially affect, the Registrant's internal control over financial reporting.
ITEM 12. DISCLOSURE OF SECURITIES LENDING ACTIVITIES FOR CLOSED-END MANAGEMENT INVESTMENT COMPANIES.
Not applicable to the Registrant.
ITEM 13. EXHIBITS.
(a)(1) Any code of ethics, or amendment thereto, that is the subject of the disclosure required by Item 2, to the extent that the registrant intends to satisfy the Item 2 requirements through filing of an exhibit: Attached hereto as EX-99.COE.
(2)A separate certification for each principal executive officer and principal financial officer of the registrant as required by Rule 30a-2(a) under the Act (17 CFR 270.30a-2): Attached hereto as EX-99.302CERT.
(3)Any written solicitation to purchase securities under Rule 23c-1 under the Act (17 CFR 270.23c-1) sent or given during the period covered by the report by or on behalf of the registrant to 10 or more persons. Not applicable.
(4)Change in the registrant's independent public accountant. Not applicable.
(b)If the report is filed under Section 13(a) or 15(d) of the Exchange Act, provide the certifications required by Rule 30a-2(b) under the Act (17 CFR 270.30a-2(b)), Rule 13a-14(b) or Rule 15d-14(b) under the Exchange Act (17 CFR 240.13a-14(b) or 240.15d-14(b)) and Section 1350 of Chapter 63 of Title 18 of the United States Code (18 U.S.C. 1350) as an exhibit. A certification furnished pursuant to this paragraph will not be deemed "filed" for the purposes of Section 18 of the Exchange Act (15 U.S.C. 78r), or otherwise subject to the liability of that section. Such certification will not be deemed to be incorporated by reference into any filing under the Securities Act of 1933 or the Exchange Act, except to the extent that the registrant specifically incorporates it by reference. Attached hereto as EX-99.906CERT.
Notice
A copy of the Amended and Restated Declaration of Trust, as amended, of the Registrant is on file with the Secretary of State of The Commonwealth of Massachusetts and notice is hereby given that this instrument is executed on behalf of the Registrant by an officer of the Registrant as an officer and not individually and the obligations of or arising out of this instrument are not binding upon any of the Trustees or shareholders individually, but are binding only upon the assets and property of the respective constituent series of the Registrant.
SIGNATURES
Pursuant to the requirements of the Securities Exchange Act of 1934 and the Investment Company Act of 1940, the registrant has duly caused this report to be signed on its behalf by the undersigned, thereunto duly authorized.
(Registrant) MFS SERIES TRUST XVI
By (Signature and Title)*
/S/ DAVID L. DILORENZO
David L. DiLorenzo, President
Date: August 15, 2023
Pursuant to the requirements of the Securities Exchange Act of 1934 and the Investment Company Act of 1940, this report has been signed below by the following persons on behalf of the registrant and in the capacities and on the dates indicated.
By (Signature and Title)*
/S/ DAVID L. DILORENZO
David L. DiLorenzo, President (Principal Executive Officer)
Date: August 15, 2023
By (Signature and Title)*
/S/ JAMES O. YOST
James O. Yost, Treasurer (Principal Financial Officer and Accounting Officer) Date: August 15, 2023
* Print name and title of each signing officer under his or her signature.