| UNITED STATES |
SECURITIES AND EXCHANGE COMMISSION
|
Washington, D.C. 20549
|
FORM N-CSR
|
CERTIFIED SHAREHOLDER REPORT OF
|
| REGISTERED MANAGEMENT INVESTMENT COMPANIES |
Investment Company Act file number 811-2594 |
|
MFS SERIES TRUST IV |
|
| (Exact name of registrant as specified in charter) |
500 Boylston Street, Boston, Massachusetts 02116 |
|
| (Address of principal executive offices) (Zip code) |
Susan S. Newton |
| Massachusetts Financial Services Company |
| 500 Boylston Street |
| Boston, Massachusetts 02116 |
|
| (Name and address of agents for service) |
Registrant’s telephone number, including area code: (617) 954-5000 |
|
Date of fiscal year end: August 31 |
|
Date of reporting period: February 28, 2006 |
|
ITEM 1. REPORTS TO STOCKHOLDERS.
| NOT FDIC INSURED MAY LOSE VALUE NO BANK OR CREDIT UNION GUARANTEE NOT A DEPOSIT |
| NOT INSURED BY ANY FEDERAL GOVERNMENT AGENCY OR NCUA/NCUSIF |
MFS- Government Money Market Fund
Each fund seeks as high a level of current income as is considered consistent with preservation of capital and liquidity.
This report is prepared for the general information of shareholders. It is authorized for distribution to prospective investors only when preceded or accompanied by a current prospectus.
| TABLE OF CONTENTS | |
|
| |
| LETTER FROM THE CEO | 1 |
|
|
| PORTFOLIO COMPOSITION | 2 |
|
|
| PERFORMANCE SUMMARY | 3 |
|
|
| EXPENSE TABLES | 5 |
|
|
| PORTFOLIO OF INVESTMENTS | 7 |
|
|
| FINANCIAL STATEMENTS | 11 |
|
|
| NOTES TO FINANCIAL STATEMENTS | 19 |
|
|
| BOARD REVIEW OF INVESTMENT | |
| ADVISORY AGREEMENT | 24 |
|
|
| PROXY VOTING POLICIES AND | |
| INFORMATION | 24 |
|
|
| QUARTERLY PORTFOLIO DISCLOSURE | 24 |
|
|
| CONTACT INFORMATION | BACK COVER |

Dear Shareholders,
It has been said that change is the only constant in life. As investors have seen, that theme is still accurate today as we recently have experienced shifting economic cycles because of natural disasters and political instability around the globe.
Markets worldwide have fluctuated in the past year as devastating hurricanes had a dramatic effect on the international economy, particularly on oil prices. We witnessed political unrest in the Middle East, highlighted by instability in Iraq, and in Africa, the usually stable Nigeria also experienced violence. As a result, energy prices have bounced up and down, with crude oil prices at one point topping a record $70 per barrel.
Such cycles are not uncommon and in fact have almost become the norm in our everyday lives. What does all of this mean to you as an investor? In times like these, it helps to know that you’re working with a seasoned investment professional who has experience to guide you through difficult times. At MFS®, we believe our investment management team has the knowledge and confidence to navigate through difficult cycles and at the same time see through adversity to find investment opportunities for our clients and shareholders.
Our investment management process, honed over 80 years, combines a unique concept of teamwork with our unwavering focus on the long term. We firmly believe that the best way to realize long-term financial goals – be it a college education, a comfortable retirement, or a secure family legacy – is to follow a three-pronged approach that focuses on longer time horizons. Allocate holdings across the major asset classes – including stocks, bonds, and cash. Diversify within each class to take advantage of different market segments and investing styles. Rebalance assets regularly to maintain a desired asset allocation. Of course, these strategies cannot guarantee a profit or protect against a loss. This long-term approach requires diligence and patience, two traits that in our experience are essential to capitalizing on the many opportunities the financial markets can offer – through both up and down economic cycles.
Respectfully,

Robert J. Manning
Chief Executive Officer and Chief Investment Officer
MFS Investment Management®
April 17, 2006
The opinions expressed in this letter are those of MFS, and no forecasts can be guaranteed.
ANNUAL REPORT 1
| Short term credit quality (r) | |
| Average Credit Quality | |
| Short Term Bonds (a) | A-1 |
|
|
| All holdings are rated ‘‘A-1’’ | |
| Money market maturity breakdown (b) |
| 0-29 days | 45.3% |
|
|
| 30-59 days | 20.7% |
|
|
| 60-89 days | 32.2% |
|
|
| 90-366 days | 1.7% |
|
|
| Other Assets Less Liabilities | 0.1% |
|
|
| Short term credit quality (r) | |
| Average Credit Quality | |
| Short Term Bonds (a) | A-1 |
|
|
| All holdings are rated ‘‘A-1’’ | |
| Money market maturity breakdown (b) |
| 0-29 days | 60.3% |
|
|
| 30-59 days | 8.7% |
|
|
| 60-89 days | 29.5% |
|
|
| 90-366 days | 1.6% |
|
|
| Other Assets Less Liabilities | -0.1% |
|
|
| (b) | For purposes of this graphical presentation, the bond component includes both accrued interest amounts and the equivalent exposure from any derivative holdings, if applicable. |
| (r) | Each security is assigned a rating from Moody’s Investors Service. If not rated by Moody’s, the rating will be that assigned by Standard & Poor’s. Likewise, if not assigned a rating by Standard & Poor’s, it will be based on the rating assigned by Fitch, Inc. If not rated by any of the three agencies, the security is considered Not Rated. U.S. Treasuries and U.S. Agency Securities are included in the ‘‘A-1’’-rating category. Percentages are based on the total market value of investments as of 2/28/06. |
| (a) | The Average Credit Quality is based upon a market weighted average of portfolio holdings that are rated by public rating agencies. |
From time to time ‘‘Other Assets Less Liabilities,’’ may be negative due to timing of cash receipts.
Percentages are based on net assets as of 2/28/06, unless otherwise noted.
The portfolios are actively managed, and current holdings may be different.
2 ANNUAL REPORT
PERFORMANCE SUMMARY THROUGH 2/28/06
Total returns as well as the current 7-day yield have been provided for the applicable time periods. Performance results reflect the percentage change in net asset value, including the reinvestment of any dividends and capital gains distributions. (See Notes to Performance Summary.)
An investment in either of the funds is not insured or guaranteed by the Federal Deposit Insurance Corporation or any other government agency. Although the funds seek to preserve the value of your investment at $1.00 per share, it is possible to lose money by investing in either of these funds.
Performance data shown represents past performance and is no guarantee of future results. Investment return and principal value fluctuate so your shares, when sold, may be worth more or less than the original cost; current performance may be lower or higher than quoted. For most recent month-end performance, please visit mfs.com. The performance shown does not reflect the deduction of taxes, if any, that a shareholder would pay on fund distributions or the redemption of fund shares.
| MFS Money Market Fund | | MFS Government Money Market Fund |
| Inception Date: 12/19/75 | | Inception Date: 2/26/82 |
| 6 Month Total Return: 1.92% | | 6 Month Total Return: 1.67% |
| Current 7-day yield: 4.21% | | Current 7-day yield: 3.61% |
| Current 7-day yield without waiver: 3.90% | | Current 7-day yield without waiver: 3.26% |
| | |
Yields quoted are based on the latest seven days ended as of February 28, 2006, with dividends annualized. The yield quotations more closely reflect the current earnings of the funds than the total return quotations. Shares of the funds can be purchased at net asset value without a sales charge.
Periods less than one year are actual not annualized.
Notes to Performance Summary
Performance results reflect any applicable expense subsidies, waivers, and adjustments in effect during the periods shown. Subsidies and fee waivers may be imposed to enhance a portfolio’s yield during periods when the portfolio’s operating expenses have a significant impact on the portfolio’s yield due to lower interest rates. Without such subsidies, waivers, and adjustments, the results would be less favorable. Please see the prospectus and financial statements for complete details.
ANNUAL REPORT 3
Performance Summary – continued
Key Risk Considerations
MFS® Money Market Fund
|
The portfolio’s yield changes daily and is based on changes in interest rates and market conditions, and in response to other economic, political, or financial developments. The value of the portfolio’s investments may fluctuate in response to many factors including the performance and valuation of the issuer and general market conditions. Municipal instruments can be volatile and significantly affected by adverse tax, legislative or political changes and the financial condition of the issuers of municipal instruments. Foreign investments can be more volatile than U.S. investments. As with any fixed-income security, securities issued by certain U.S. government agencies or instrumentalities are subject to the risk that the issuer will default on principal and interest payments. Investors should note that many U.S. government securities in which the portfolio may invest are not supported by the full faith and the credit of the United States Government (including securities issued by government sponsored enterprises and by certain U.S. federal agencies and instrumentalities) and involve increased credit risk. Although the portfolio seeks to preserve the value of your investment at $1.00 per share, it is possible to lose money by investing in the portfolio.
Please see the prospectus for further information regarding these and other risk considerations.
MFS® Government Money Market Fund
|
The portfolio’s yield changes daily and is based on changes in interest rates and market conditions, and in response to other economic, political, or financial developments. The value of the portfolio’s investments may fluctuate in response to many factors including the performance and valuation of the issuer and general market conditions. As with any fixed-income security, securities issued by certain U.S. government agencies or instrumentalities are subject to the risk that the issuer will default on principal and interest payments. Investors should note that many U.S. government securities in which the portfolio may invest are not supported by the full faith and the credit of the United States Government (including securities issued by government sponsored enterprises and by certain U.S. federal agencies and instrumentalities) and involve increased credit risk. Although the portfolio seeks to preserve the value of your investment at $1.00 per share, it is possible to lose money by investing in the portfolio.
Please see the prospectus for further information regarding these and other risk considerations.
4 ANNUAL REPORT
| EXPENSE TABLES | MFS® MONEY MARKET FUND |
| MFS® GOVERNMENT MONEY MARKET FUND |
Fund Expenses Borne by the Shareholders During the Period, September 1, 2005 through February 28, 2006.
As a shareholder of the funds, you incur two types of costs: (1) transaction costs, including sales charges (loads) on certain purchase or redemption payments and redemption fees on certain exchanges and redemptions, and (2) ongoing costs, including management fees; and other fund expenses. This example is intended to help you understand your ongoing costs (in dollars) of investing in the funds and to compare these costs with the ongoing costs of investing in other mutual funds.
The example is based on an investment of $1,000 invested at the beginning of the period and held for the entire period, September 1, 2005 through February 28, 2006.
Actual Expenses
The first line of the tables on the following page provides information about actual account values and actual expenses. You may use the information in this line, together with the amount you invested, to estimate the expenses that you paid over the period. Simply divide your account value by $1,000 (for example, an $8,600 account value divided by $1,000 = 8.6), then multiply the result by the number in the first line under the heading entitled ‘‘Expenses Paid During Period’’ to estimate the expenses you paid on your account during this period.
Hypothetical Example for Comparison Purposes
The second line of the tables on the following page provides information about hypothetical account values and hypothetical expenses based on the fund’s actual expense ratio and an assumed rate of return of 5% per year before expenses, which is not the funds’ actual return. The hypothetical account values and expenses may not be used to estimate the actual ending account balance or expenses you paid for the period. You may use this information to compare the ongoing costs of investing in the funds and other funds. To do so, compare this 5% hypothetical example with the 5% hypothetical examples that appear in the shareholder reports of the other funds.
ANNUAL REPORT 5
Expense Tables – continued
|
Please note that the expenses shown in the tables are meant to highlight your ongoing costs only and do not reflect any transactional costs, such as sales charges (loads) or redemption fees. Therefore, the second line of the table is useful in comparing costs only, and will not help you determine the relative total costs of owning different funds. In addition, if these transactional costs were included, your costs would have been higher.
| | | | | Expenses |
| | Annualized | Beginning | Ending | Paid During |
| | Expense | Account Value | Account Value | Period (p) |
| MFS Money Market Fund | Ratio | 9/01/05 | 2/28/06 | 9/01/05-2/28/06 |
|
|
|
|
|
| Actual | 0.40% | $1,000.00 | $1,019.20 | $2.00 |
|
|
|
|
|
| Hypothetical (h) | 0.40% | $1,000.00 | $1,022.81 | $2.01 |
|
|
|
|
|
| | | | | Expenses |
| | Annualized | Beginning | Ending | Paid During |
| MFS Government | Expense | Account Value | Account Value | Period (p) |
| Money Market Fund | Ratio | 9/01/05 | 2/28/06 | 9/01/05-2/28/06 |
|
|
|
|
|
| Actual | 0.81% | $1,000.00 | $1,016.70 | $4.05 |
|
|
|
|
|
| Hypothetical (h) | 0.81% | $1,000.00 | $1,020.78 | $4.06 |
|
|
|
|
|
| (h) | 5% fund return per year before expenses. |
| (p) | Expenses paid is equal to each fund’s annualized expense ratio, as shown above, multiplied by the average account value over the period, multiplied by the number of days in the period, divided by the number of days in the year. Expenses paid do not include any applicable sales charges (loads) or redemption fees. If these transaction costs had been included, your costs would have been higher. |
| |
6 ANNUAL REPORT
| PORTFOLIO OF INVESTMENTS (unaudited) – 2/28/06 | | | | | |
| The Portfolio of Investments is a complete list of all securities owned by your fund. | | | |
| It is categorized by broad-based asset classes. | | | | | |
MFS Money Market Fund | | | | | |
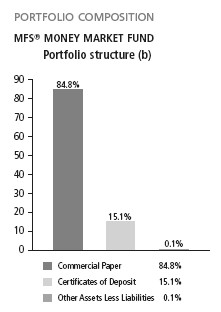
Certificates of Deposit - 15.1% |
| Issuer | | Shares/Par | | | Value ($) |
| Banks & Credit Companies - 15.1% |
| Barclays Bank NY PLC, 4.455%, due 3/28/06 | $ | 31,226,000 | | $ | 31,226,000 |
| Caylon New York Branch, 4.73%, due 5/22/06 | | 25,000,000 | | | 25,000,000 |
| Credit Suisse First Boston, NY, 4.46%, due 3/13/06 | | 31,290,000 | | | 31,290,000 |
| Royal Bank of Canada New York Branch, 4.7125%, due 5/19/06 | | 29,372,000 | | | 29,371,325 |
| Total Certificates of Deposit, at Amortized Cost and Value | | | | $ | 116,887,325 |
Commercial Paper - 84.8% (y) | | | | | |
| Banks & Credit Companies - 26.5% | | | | | |
| Abbey National North America LLC, 4.56%, due 3/01/06 | $ | 21,365,000 | | $ | 21,365,000 |
| Bank of America Corp., 4.625%, due 4/25/06 | | 20,526,000 | | | 20,380,964 |
| Citigroup Funding, Inc., 4.67%, due 5/17/06 | | 7,000,000 | | | 6,930,080 |
| Depfa Bank PLC, 4.39%, due 3/06/06 (t) | | 6,500,000 | | | 6,496,037 |
| Depfa Bank PLC, 4.475%, due 4/11/06 (t) | | 16,596,000 | | | 16,511,418 |
| Depfa Bank PLC, 4.595%, due 5/03/06 (t) | | 7,995,000 | | | 7,930,710 |
| Dexia Delaware LLC, 4.395%, due 3/14/06 | | 8,946,000 | | | 8,931,802 |
| Dexia Delaware LLC, 4.64%, due 5/09/06 | | 8,000,000 | | | 7,928,853 |
| HBOS Treasury Services PLC, 4.65%, due 5/15/06 | | 6,673,000 | | | 6,608,355 |
| HBOS Treasury Services PLC, 4.655%, due 5/17/06 | | 24,419,000 | | | 24,175,872 |
| ING America Insurance Holdings, Inc., 4.37%, due 3/01/06 | | 28,667,000 | | | 28,667,000 |
| Svenska Handelsbanken, Inc., 4.395%, due 3/09/06 | | 18,478,000 | | | 18,459,953 |
| Svenska Handelsbanken, Inc., 4.57%, due 4/27/06 | | 367,000 | | | 364,344 |
| UBS Finance Delaware LLC, 4.63%, due 5/08/06 | | 6,300,000 | | | 6,244,903 |
| UBS Finance Delaware LLC, 4.625%, due 5/10/06 | | 24,979,000 | | | 24,754,362 |
| | | | | $ | 205,749,653 |
| Financial Institutions - 54.3% |
| Alpine Securitization Corp., 4.59%, due 4/18/06 (t) | $ | 1,000,000 | | $ | 993,880 |
| Alpine Securitization Corp., 4.65%, due 5/08/06 (t) | | 5,000,000 | | | 4,956,083 |
| American General Finance Corp., 4.42%, due 3/13/06 | | 6,170,000 | | | 6,160,910 |
| American General Finance Corp., 4.625%, due 5/11/06 | | 24,849,000 | | | 24,622,339 |
| Barton Capital LLC, 4.47%, due 3/07/06 (t) | | 3,248,000 | | | 3,245,580 |
| Barton Capital LLC, 4.4%, due 3/09/06 (t) | | 27,937,000 | | | 27,909,684 |
| CAFCO LLC, 4.63%, due 4/19/06 (t) | | 8,095,000 | | | 8,043,986 |
| CAFCO LLC, 4.65%, due 4/24/06 (t) | | 9,168,000 | | | 9,104,053 |
| CAFCO LLC, 4.64%, due 5/04/06 (t) | | 13,851,000 | | | 13,736,745 |
| CRC Funding LLC, 4.43%, due 3/06/06 (t) | | 11,579,000 | | | 11,571,876 |
| CRC Funding LLC, 4.58%, due 4/17/06 (t) | | 19,561,000 | | | 19,444,036 |
| Ciesco LLC, 4.385%, due 3/06/06 (t) | | 4,427,000 | | | 4,424,304 |
| Ciesco LLC, 4.6%, due 4/18/06 (t) | | 26,576,000 | | | 26,413,001 |
| | | SEMIANNUAL REPORT 7 |
| Portfolio of Investments (unaudited) – continued | | | | |
| Issuer | Shares/Par | | | Value ($) |
|
| |
|
|
| Commercial Paper - continued | | | | |
| Financial Institutions - continued |
| Citibank Credit Card Issuance Trust, 4.42%, due 3/08/06 (t) | $ 20,000,000 | | $ | 19,982,811 |
| Citibank Credit Card Issuance Trust, 4.59%, due 4/10/06 (t) | 11,069,000 | | | 11,012,548 |
| Edison Asset Securitization LLC, 4.6%, due 5/04/06 (t) | 31,196,000 | | | 30,940,886 |
| Govco, Inc., 4.6%, due 5/04/06 (t) | 31,140,000 | | | 30,885,344 |
| Jupiter Securitization Corp., 4.55%, due 4/05/06 (t) | 31,154,000 | | | 31,016,187 |
| Kitty Hawk Funding Corp., 4.39%, due 3/20/06 (t) | 29,758,000 | | | 29,689,052 |
| Old Line Funding LLC, 4.46%, due 3/02/06 (t) | 10,000,000 | | | 9,998,761 |
| Old Line Funding LLC, 4.46%, due 3/07/06 (t) | 4,307,000 | | | 4,303,798 |
| Park Avenue Receivable Co. LLC, 4.56%, due 3/01/06 (t) | 20,157,000 | | | 20,157,000 |
| Ranger Funding Co. LLC, 4.5%, due 3/07/06 (t) | 10,000,000 | | | 9,992,500 |
| Scaldis Capital LLC, 4.58%, due 4/28/06 (t) | 17,539,000 | | | 17,409,582 |
| Scaldis Capital LLC, 4.71%, due 5/30/06 (t) | 11,496,000 | | | 11,360,635 |
| Scaldis Capital LLC, 4.72%, due 5/31/06 (t) | 2,140,000 | | | 2,114,467 |
| Thunder Bay Funding LLC, 4.44%, due 3/03/06 (t) | 17,075,000 | | | 17,070,788 |
| Thunder Bay Funding LLC, 4.405%, due 3/21/06 (t) | 14,457,000 | | | 14,421,621 |
| | | $ | 420,982,457 |
| Insurance - 4.0% |
| Metlife, Inc., 4.38%, due 3/20/06 (t) | $ 25,278,000 | | $ | 25,219,566 |
| Metlife, Inc., 4.68%, due 5/11/06 (t) | 5,764,000 | | | 5,710,798 |
| | | | $ | 30,930,364 |
| Total Commercial Paper, at Amortized Cost and Value | | $ | 657,662,474 |
| Total Investments, at Amortized Cost and Value | | $ | 774,549,799 |
| Other Assets, Less Liabilities - 0.1% | | | | 1,025,406 |
|
|
|
|
| Net Assets - 100.0% | | | $ | 775,575,205 |
|
|
|
| See Portfolio Footnotes and Notes to Financial Statements | | | | |
|
|
|
|
| 8 SEMIANNUAL REPORT | | | | |
| PORTFOLIO OF INVESTMENTS (unaudited) – 2/28/06 | | | | | |
The Portfolio of Investments is a complete list of all securities owned by your fund. | | | |
| It is categorized by broad-based asset classes. | | | | | |
MFS Government Money Market Fund | | | | | |
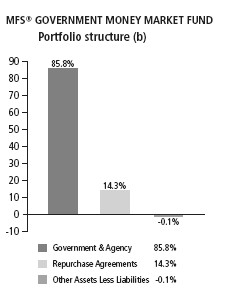
U.S. Government Agency Obligations - 85.8% (y) |
| Issuer | | | Shares/Par | | | Value ($) |
| Fannie Mae, 4.252%, due 3/08/06 | $ | 900,000 | | $ | 899,255 |
| Fannie Mae, 4.355%, due 3/22/06 | | 1,048,000 | | | 1,045,338 |
| Fannie Mae, 4.339%, due 3/27/06 | | 300,000 | | | 299,060 |
| Fannie Mae, 4.36%, due 3/27/06 | | 400,000 | | | 398,740 |
| Fannie Mae, 4.35%, due 3/29/06 | | 300,000 | | | 298,985 |
| Fannie Mae, 4.55%, due 5/01/06 - 5/10/06 | | 728,000 | | | 722,128 |
| Fannie Mae, 4.6%, due 5/31/06 | | 364,000 | | | 359,767 |
| Farmer Mac, 4.33%, due 3/17/06 | | 2,500,000 | | | 2,495,189 |
| Federal Home Loan Bank, 4.275%, due 3/10/06 | | 1,200,000 | | | 1,198,717 |
| Federal Home Loan Bank, 4.55%, due 4/26/06 | | 270,000 | | | 268,089 |
| Federal Home Loan Bank, 4.53%, due 5/03/06 | | 950,000 | | | 942,469 |
| Freddie Mac, 4.23%, due 3/07/06 | | 700,000 | | | 699,506 |
| Freddie Mac, 4.33%, due 3/14/06 | | 400,000 | | | 399,375 |
| Freddie Mac, 4.336%, due 3/14/06 | | 165,000 | | | 164,742 |
| Freddie Mac, 4.4%, due 3/14/06 | | 1,000,000 | | | 998,411 |
| Freddie Mac, 4.38%, due 3/17/06 | | 500,000 | | | 499,027 |
| Freddie Mac, 4.34%, due 3/28/06 | | 343,000 | | | 341,884 |
| Freddie Mac, 4.35%, due 3/28/06 | | 398,000 | | | 396,702 |
| Freddie Mac, 4.39%, due 4/18/06 | | 1,000,000 | | | 994,146 |
| Freddie Mac, 4.55%, due 4/25/06 - 5/10/06 | | 894,000 | | | 886,470 |
| Freddie Mac, 4.53%, due 4/28/06 - 5/09/06 | | 2,434,000 | | | 2,413,620 |
| Freddie Mac, 4.52%, due 5/02/06 | | 1,000,000 | | | 992,216 |
| Freddie Mac, 4.552%, due 5/02/06 | | 800,000 | | | 793,728 |
| Freddie Mac, 4.54%, due 5/08/06 | | 400,000 | | | 396,570 |
| Total U.S. Government Agency Obligations, at Amortized |
| Cost and Value | $ | 18,904,134 |
| Repurchase Agreements - 14.3% |
| Issuer | | | Shares/Par | | | Value ($) |
| Goldman Sachs, 4.55%, dated 2/28/06, due 3/01/06, total to be |
| received $1,000,126 (secured by various U.S. Treasury and Federal | | | | | |
| Agency obligations in a jointly traded account) | $ | 1,000,000 | | $ | 1,000,000 |
| | �� | | SEMIANNUAL REPORT 9 |
| Portfolio of Investments (unaudited) – continued | | | |
| Repurchase Agreements - continued |
| Issuer | Shares/Par | | Value ($) |
| Morgan Stanley, 4.56%, dated 2/28/06, due 3/01/06, total to be |
| received $2,140,271 (secured by various U.S. Treasury and Federal | | | |
| Agency obligations in a jointly traded account) | $ 2,140,000 | $ | 2,140,000 |
|
|
|
|
| Total Repurchase Agreements, at Cost | | $ | 3,140,000 |
|
|
|
|
| Total Investments, at Amortized Cost and Value | | $22,044,134 |
|
|
|
| Other Assets, Less Liabilities - (0.1)% | | | (20,426) |
|
|
|
|
| Net Assets - 100.0% | | $22,023,708 |
|
|
|
| (y) | The rate shown represents an annualized yield at time of purchase. |
| (t) | Security exempt from registration with the U.S. Securities and Exchange Commission under Section 4(2) of the Securities Act of 1933. |
| |
See Notes to Financial Statements
|
10 SEMIANNUAL REPORT
FINANCIAL STATEMENTS | Statement of Assets and Liabilities (unaudited)
| This statement represents your fund’s balance sheet, which details the assets | | |
| and liabilities composing the total value of the fund. | | |
At 2/28/06 | | |
MFS Money Market Fund | | |
Assets |
| Investments, at amortized cost and value | $774,549,799 | |
| Cash | 966 | |
| Receivable for fund shares sold | 3,542,134 | |
| Interest receivable | 475,456 | |
| Other assets | 3,397 | |
| Total assets | $778,571,752 |
Liabilities |
| Distributions payable | $53,042 | |
| Payable for fund shares reacquired | 2,660,854 | |
| Payable to affiliates | | |
| Management fee | 6,349 | |
| Shareholder servicing costs | 100,943 | |
| Administrative services fee | 430 | |
| Payable for independent trustees’ compensation | 46,253 | |
| Accrued expenses and other liabilities | 128,676 | |
| Total liabilities | $2,996,547 |
| Net assets | | $775,575,205 |
Net assets consist of: |
| Paid-in capital | $775,575,240 | |
| Accumulated net realized gain (loss) on investments | (8,515) | |
| Undistributed net investment income | 8,480 | |
| Net assets | $775,575,205 |
| Shares of beneficial interest outstanding | | 775,575,287 |
| Net asset value per share |
| (net assets/shares of beneficial interest outstanding) | | $1.00 |
See Notes to Financial Statements |
| | | SEMIANNUAL REPORT 11 |
| Statement of Assets and Liabilities (unaudited) – continued | | |
| This statement represents your fund’s balance sheet, which details the assets | | |
| and liabilities composing the total value of the fund. | | |
| At 2/28/06 | | |
| MFS Government Money Market Fund | | |
| Assets | | |
|
|
|
| Investments, at amortized cost and value | $18,904,134 | |
| Repurchase agreements, at value | 3,140,000 | |
|
|
|
| Total investments, at amortized cost and value | | $22,044,134 |
|
|
|
| Cash | 740 | |
| Receivable for fund shares sold | 42,354 | |
| Interest receivable | 397 | |
| Other assets | 262 | |
|
|
|
| Total assets | | $22,087,887 |
|
|
|
| Liabilities | | |
|
|
|
| Distributions payable | $1,166 | |
| Payable for fund shares reacquired | 16,532 | |
| Payable to affiliates | | |
| Management fee | 184 | |
| Shareholder servicing costs | 3,464 | |
| Administrative services fee | 36 | |
| Payable for independent trustees’ compensation | 7,523 | |
| Accrued expenses and other liabilities | 35,274 | |
|
|
|
| Total liabilities | | $64,179 |
|
|
|
| Net assets | | $22,023,708 |
|
|
|
| Net assets consist of: | | |
|
|
|
| Paid-in capital | $22,031,421 | |
| Accumulated distributions in excess of net investment income | (7,713) | �� |
|
|
|
| Net assets | | $22,023,708 |
|
|
|
| Shares of beneficial interest outstanding | | 22,023,708 |
|
|
|
| Net asset value per share | | |
| (net assets/shares of beneficial interest outstanding) | | $1.00 |
|
|
|
| See Notes to Financial Statements | | |
|
|
|
12 SEMIANNUAL REPORT | | |
FINANCIAL STATEMENTS | Statement of Operations (unaudited)
This statement describes how much your fund earned in investment income and accrued in expenses. It also describes any gains and/or losses generated by fund operations.
| Six months ended 2/28/06 | | |
MFS Money Market Fund
| | |
Net investment income
| | |
| Interest income | $15,938,817 |
| Expenses | | |
| Management fee | $1,794,423 | |
| Shareholder servicing costs | 659,058 | |
| Administrative services fee | 39,988 | |
| Independent trustees’ compensation | 14,368 | |
| Custodian fee | 116,989 | |
| Shareholder communications | 29,158 | |
| Auditing fees | 13,065 | |
| Legal fees | 8,035 | |
| Registration fees | 39,084 | |
| Miscellaneous | 29,432 | |
| Total expenses | $2,743,600 |
| Fees paid indirectly | (101,117) | |
| Reduction of expenses by investment adviser | (1,217,453) | |
| Net expenses | $1,425,030 |
| Net investment income | $14,513,787 |
| Net realized gain (loss) on investments | $(35) |
| Change from operations | $14,513,752 |
See Notes to Financial Statements |
| | | SEMIANNUAL REPORT 13 |
| Statement of Operations (unaudited) – continued | | |
This statement describes how much your fund earned in investment income and accrued in | |
| expenses. It also describes any gains and/or losses generated by fund operations. | | |
Six months ended 2/28/06
| | |
MFS Government Money Market Fund
| | |
Net investment income
| | |
|
|
|
| Interest income | | $468,091 |
|
|
|
| Expenses | | |
| Management fee | $58,112 | |
| Shareholder servicing costs | 20,681 | |
| Administrative services fee | 5,984 | |
| Independent trustees’ compensation | 2,005 | |
| Custodian fee | 5,213 | |
| Shareholder communications | 447 | |
| Auditing fees | 13,065 | |
| Legal fees | 1,676 | |
| Registration fees | 17,234 | |
| Miscellaneous | 10,238 | |
|
|
|
| Total expenses | | $134,655 |
|
|
|
| Fees paid indirectly | (3,293) | |
| Reduction of expenses by investment adviser | (40,765) | |
|
|
|
| Net expenses | | $90,597 |
|
|
|
| Net investment income | | $377,494 |
|
|
|
| See Notes to Financial Statements | | |
14 SEMIANNUAL REPORT
| FINANCIAL STATEMENTS | Statements of Changes in Net Assets | |
These statements describe the increases and/or decreases in net assets resulting | |
| from operations, any distributions, and any shareholder transactions. | |
| | Six months ended | Year ended |
| | 2/28/06 | 8/31/05 |
| MFS Money Market Fund | (unaudited) | |
| Change in net assets | | |
|
|
|
| From operations | | |
|
|
|
| Net investment income | $14,513,787 | $17,132,395 |
| Net realized gain (loss) on investments | (35) | (151) |
|
|
|
| Change in net assets from operations | $14,513,752 | $17,132,244 |
|
|
|
| Distributions declared to shareholders | | |
|
|
|
| From net investment income | $(14,880,917) | $(16,765,114) |
|
|
|
| Fund share (principal) transactions | | |
|
|
|
| Net proceeds from sale of shares | $323,504,571 | $623,054,895 |
| Net asset value of shares issued to shareholders in | | |
| reinvestment of distributions | 14,280,677 | 16,089,710 |
| Cost of shares reacquired | (330,714,139) | (699,562,244) |
|
|
|
| Change in net assets from fund share transactions | $7,071,109 | $(60,417,639) |
|
|
|
| Total change in net assets | $6,703,944 | $(60,050,509) |
|
|
|
| Net assets | | |
|
|
|
| At beginning of period | 768,871,261 | 828,921,770 |
| At end of period (including undistributed net investment | | |
| income of $8,480 and $375,610, respectively) | $775,575,205 | $768,871,261 |
|
|
|
| See Notes to Financial Statements | | |
SEMIANNUAL REPORT 15
| Statements of Changes in Net Assets – continued | | |
These statements describe the increases and/or decreases in net assets resulting | |
| from operations, any distributions, and any shareholder transactions. | | |
Six months ended | Year ended |
| | 2/28/06 | 8/31/05 |
| MFS Government Money Market Fund | (unaudited) | |
| Change in net assets | | |
|
|
|
| From operations | | |
|
|
|
| Net investment income | $377,494 | $613,292 |
|
|
|
| Distributions declared to shareholders | | |
|
|
|
| From net investment income | $(387,494) | $(603,292) |
|
|
|
| Fund share (principal) transactions | | |
|
|
|
| Net proceeds from sale of shares | $8,475,368 | $22,096,030 |
| Net asset value of shares issued to shareholders in reinvestment | | |
| of distributions | 371,555 | 576,994 |
| Cost of shares reacquired | (11,227,181) | (38,056,006) |
|
|
|
| Change in net assets from fund share transactions | $(2,380,258) | $(15,382,982) |
|
|
|
| Total change in net assets | $(2,390,258) | $(15,372,982) |
|
|
|
| Net assets | | |
|
|
|
| At beginning of period | 24,413,966 | 39,786,948 |
| At end of period (including accumulated distributions in excess | | |
| of net investment income of $7,713 and undistributed net | | |
| investment income of $2,287) | $22,023,708 | $24,413,966 |
|
|
|
| See Notes to Financial Statements | | |
16 SEMIANNUAL REPORT
FINANCIAL STATEMENTS | Financial Highlights
The financial highlights table is intended to help you understand the fund’s financial performance for the semiannual period and the past 5 fiscal years. Certain information reflects financial results for a single fund share. The total returns in the table represent the rate by which an investor would have earned (or lost) on an investment in the fund share class (assuming reinvestment of all distributions) held for the entire period.
| MFS Money | Six months ended | Years ended 8/31 |
| Market Fund | 2/28/06 | 2005 | 2004 | 2003 | 2002 | 2001 |
| (unaudited) | | | | | |
| Net asset value, beginning | | | | | | |
| of period | $1.00 | $1.00 | $1.00 | $1.00 | $1.00 | $1.00 |
|
|
|
|
|
|
|
| Income from investment | | | | | | |
| operations | | | | | | |
|
|
|
|
|
|
|
| Net investment income (d) | $0.02 | $0.02 | $0.01 | $0.01 | $0.02 | $0.05 |
| Net realized gain (loss) | | | | | | |
| on investments | (0.00)(w) | (0.00)(w) | — | — | — | — |
|
|
|
|
|
|
|
| Total from investment | | | | | | |
| operations | $0.02 | $0.02 | $0.01 | $0.01 | $0.02 | $0.05 |
|
|
|
|
|
|
|
| Less distributions declared | | | | | | |
| to shareholders | | | | | | |
|
|
|
|
|
|
|
| From net investment | | | | | | |
| income | $(0.02) | $(0.02) | $(0.01) | $(0.01) | $(0.02) | $(0.05) |
|
|
|
|
|
|
|
| Net asset value, end | | | | | | |
| of period | $1.00 | $1.00 | $1.00 | $1.00 | $1.00 | $1.00 |
|
|
|
|
|
|
|
| Total return (%) (r)(t) | 1.92(n) | 2.16 | 0.64 | 0.81 | 1.67 | 4.97 |
|
|
|
|
|
|
|
| Ratios (%) (to average net assets) | | | | | |
| and Supplemental data: | | | | | | |
|
|
|
|
|
|
|
| Expenses before expense | | | | | | |
| reductions (f) | 0.71(a) | 0.75 | 0.67 | 0.60 | 0.68 | 0.67 |
| Expenses after expense | | | | | | |
| reductions (f) | 0.40(a) | 0.44 | 0.54 | 0.60 | 0.68 | 0.67 |
| Net investment income | 3.75(a) | 2.17 | 0.62 | 0.80 | 1.66 | 4.86 |
| Net assets at end of period | | | | | | |
| (000 Omitted) | $775,575 | $768,871 | $828,921 | $2,123,459 | $1,962,159 | $1,461,101 |
|
|
|
|
|
|
|
| (r) | Certain expenses have been reduced without which performance would have been lower. |
| (a) | Annualized. |
| (n) | Not annualized. |
| (w) | Per share amount was less than $0.01. |
| (d) | Per share data are based on average shares outstanding. |
| (f) | Ratios do not reflect reductions from fees paid indirectly. |
| (t) | Total returns do not include any applicable sales charges. |
See Notes to Financial Statements
|
SEMIANNUAL REPORT 17
Financial Highlights – continued
|
The financial highlights table is intended to help you understand the fund’s financial performance for the semiannual period and the past 5 fiscal years. Certain information reflects financial results for a single fund share. The total returns in the table represent the rate by which an investor would have earned (or lost) on an investment in the fund share class (assuming reinvestment of all distributions) held for the entire period.| | | | | | |
| | | | |
| | Six months | | | |
| MFS Government Money | ended | Years ended 8/31 |
| Market Fund | 2/28/06 | 2005 | 2004 | 2003 | 2002 | 2001 |
| (unaudited) | | | | | |
| Net asset value, beginning of period | $1.00 | $1.00 | $1.00 | $1.00 | $1.00 | $1.00 |
|
|
|
|
|
|
|
| Income from investment | | | | | | |
| operations | | | | | | |
|
|
|
|
|
|
|
| Net investment income (d) | $0.02 | $0.02 | $0.01 | $0.01 | $0.01 | $0.05 |
|
|
|
|
|
|
|
| Less distributions declared | | | | | | |
| to shareholders | | | | | | |
|
|
|
|
|
|
|
| From net investment income | $(0.02) | $(0.02) | $(0.01) | $(0.01) | $(0.01) | $(0.05) |
|
|
|
|
|
|
|
| Net asset value, end of period | $1.00 | $1.00 | $1.00 | $1.00 | $1.00 | $1.00 |
|
|
|
|
|
|
|
| Total return (%) (r)(t) | 1.67(n) | 2.02 | 0.54 | 0.66 | 1.51 | 4.71 |
|
|
|
|
|
|
|
| Ratios (%) (to average net assets) | | | | | | |
| and Supplemental data: | | | | | | |
|
|
|
|
|
|
|
| Expenses before expense reductions (f) | 1.16(a) | 0.87 | 0.74 | 0.72 | 0.82 | 0.90 |
| Expenses after expense reductions (f) | 0.81(a) | 0.52 | 0.59 | 0.72 | 0.82 | 0.90 |
| Net investment income | 3.25(a) | 1.96 | 0.49 | 0.61 | 1.56 | 4.55 |
| Net assets at end of period | | | | | | |
| (000 Omitted) | $22,024 | $24,414 | $39,787 | $132,888 | $54,741 | $62,078 |
|
|
|
|
|
|
|
| (r) | Certain expenses have been reduced without which performance would have been lower. |
| (a) | Annualized. |
| (n) | Not annualized. |
| (d) | Per share data are based on average shares outstanding. |
| (f) | Ratios do not reflect reductions from fees paid indirectly. |
| (t) | Total returns do not include any applicable sales charges. |
| |
See Notes to Financial Statements
|
18 SEMIANNUAL REPORT
NOTES TO FINANCIAL STATEMENTS (unaudited)
(1) Business and Organization
|
MFS Money Market Fund and MFS Government Money Market Fund (the funds) are each a series of MFS Series Trust IV (the trust). The trust is organized as a Massachusetts business trust and is registered under the Investment Company Act of 1940, as amended, as an open-end management investment company.
(2) Significant Accounting Policies
|
General – The preparation of financial statements in conformity with U.S. generally accepted accounting principles requires management to make estimates and assumptions that affect the reported amounts of assets and liabilities, and disclosure of contingent assets and liabilities at the date of the financial statements and the reported amounts of revenues and expenses during the reporting period. Actual results could differ from those estimates.
Investment Valuations – Money market instruments are valued at amortized cost, which approximates market value. Amortized cost involves valuing an instrument at its cost as adjusted for amortization of premium or accretion of discount rather than its current market value. Each money market fund’s use of amortized cost is subject to the fund’s compliance with Rule 2a-7 of the Investment Company Act of 1940. The amortized cost value of an instrument can be different from the market value of an instrument.
Repurchase Agreements – Each fund may enter into repurchase agreements with institutions that the funds’ investment adviser has determined are creditworthy. Each repurchase agreement is recorded at cost. Each fund requires that the securities collateral in a repurchase transaction be transferred to the custodian in a manner sufficient to enable the fund to obtain those securities in the event of a default under the repurchase agreement. The funds monitor, on a daily basis, the value of the collateral to ensure that its value, including accrued interest, is greater than amounts owed to the funds under each such repurchase agreement. The funds, along with other affiliated entities of Massachusetts Financial Services Company (MFS), may utilize a joint trading account for the purpose of entering into one or more repurchase agreements.
Investment Transactions and Income – Investment transactions are recorded on the trade date. Interest income is recorded on the accrual basis. All premium and discount is amortized and accreted for financial statement purposes and tax reporting purposes in accordance with generally accepted accounting principles and federal tax regulations, respectively. All discount is accreted for tax reporting purposes as required by federal income tax regulations.
Fees Paid Indirectly – Each fund’s custody fee is reduced according to an arrangement that measures the value of cash deposited with the custodian by the fund. This amount, for the six months ended February 28, 2006, is shown as a reduction of total expenses on the Statement of Operations.
SEMIANNUAL REPORT 19
Notes to Financial Statements (unaudited) – continued
Tax Matters and Distributions – Each fund intends to continue to qualify as a regulated investment company, as defined under Subchapter M of the Internal Revenue Code, and to distribute all of its taxable income, including realized capital gains. Accordingly, no provision for federal income tax is required in the financial statements. Foreign taxes, if any, have been accrued by the funds in the accompanying financial statements.
Distributions to shareholders are recorded on the ex-dividend date. Income and capital gain distributions are determined in accordance with income tax regulations, which may differ from generally accepted accounting principles. Certain capital accounts in the financial statements are periodically adjusted for permanent differences in order to reflect their tax character. These adjustments have no impact on net assets or net asset value per share. Temporary differences which arise from recognizing certain items of income, expense, gain or loss in different periods for financial statement and tax purposes will reverse at some time in the future. Distributions in excess of net investment income or net realized gains are temporary overdistributions for financial statement purposes resulting from differences in the recognition or classification of income for financial statement and tax purposes.
The tax character of distributions declared to shareholders is as follows:
| | | | Government Money |
| | Money Market Fund | Market Fund |
| | August 31, | August 31, | August 31, | August 31, |
| | 2005 | 2004 | 2005 | 2004 |
| Distributions declared from ordinary | | | | |
| income (including any short-term | | | | |
| capital gains) | $16,765,114 | $5,864,552 | $603,292 | $515,646 |
The federal tax cost and the tax basis components of distributable earnings were as follows:
| | Money Market | Government Money |
| As of February 28, 2006 | Fund | Market Fund |
| Tax Cost of Investments | $774,549,799 | $22,044,134 |
| As of August 31, 2005 | | |
| Undistributed ordinary income | $462,026 | $12,134 |
| Capital loss carryforward | (8,480) | — |
| Other temporary differences | (86,416) | (9,847) |
As of August 31, 2005 the MFS Money Market Fund had available capital loss carryforwards to offset future realized gains.
Such losses expire as follows:
| August 31, 2011 | $(8,329) |
| August 31, 2013 | (151) |
| Total | $(8,480) |
20 SEMIANNUAL REPORT
Notes to Financial Statements (unaudited) – continued
(3) Transactions with Affiliates
|
Investment Adviser – Each fund has an investment advisory agreement with Massachusetts Financial Services Company (MFS) to provide overall investment advisory and administrative services, and general office facilities.
Each fund’s management fee is computed daily and paid monthly at the following annual rates:
| | |
| | First $300 million of average daily net assets | 0.50% |
| | | Next $400 million of average daily net assets | 0.45% |
| | Next $300 million of average daily net assets | 0.40% |
| | Average daily net assets in excess of $1 billion | 0.35% |
As part of a settlement agreement with the New York Attorney General concerning market timing and related matters, MFS has agreed to reduce each fund’s management fee to 0.15% of the fund’s average daily net assets for the period March 1, 2004 through February 28, 2009. For the six months ended February 28, 2006, this waiver amounted to $1,214,466 and $40,693 for the MFS Money Market Fund and MFS Government Money Market Fund, respectively, and is reflected as a reduction of total expenses in the Statement of Operations.
The management fee incurred for the six months ended February 28, 2006 was equivalent to an annual effective rate of 0.15% of each fund’s average daily net assets.
Distributor – Certain shares acquired through an exchange may be subject to a CDSC upon redemption depending on when the shares exchanged were originally purchased. Contingent deferred sales charges imposed during the six months ended February 28, 2006 for the MFS Money Market Fund and MFS Government Money Market Fund were $4,469 and $41, respectively.
Shareholder Servicing Agent – Each fund pays a portion of shareholder servicing costs to MFS Service Center, Inc. (MFSC), a wholly-owned subsidiary of MFS. MFSC receives a fee from each fund, for its services as shareholder servicing agent, set periodically under the supervision of the fund’s Board of Trustees. For the six months ended February 28, 2006, the fee was $376,130 and $11,291, which equated to 0.0973% and 0.0972% annually of the fund’s average daily net assets for the MFS Money Market Fund and MFS Government Money Market Fund, respectively. MFSC also receives payment from each fund for out-of-pocket and sub-accounting expenses paid by MFSC on behalf of the fund. For the six months ended February 28, 2006, these costs amounted to $65,301 and $3,469 for the MFS Money Market Fund and MFS Government Money Market Fund, respectively.
Administrator – MFS provides certain financial, legal, shareholder communications, compliance, and other administrative services to certain funds for which MFS acts as investment adviser. Under an administrative services agreement, the funds may partially reimburse MFS the costs incurred to provide these services, subject to review and approval by the Board of
SEMIANNUAL REPORT 21
Notes to Financial Statements (unaudited) – continued
Trustees. Each fund is charged a fixed amount plus a fee based on calendar year average net assets. Effective July 1, 2005, each fund’s annual fixed amount is $10,000.
The administrative services fee incurred for the six months ended February 28, 2006 was equivalent to an annual effective rate of 0.0103% and 0.0515% of the fund’s average daily net assets for the MFS Money Market Fund and MFS Government Money Market Fund, respectively.
Trustees’ and Officers’ Compensation – Each fund pays compensation to Independent Trustees in the form of a retainer, attendance fees, and additional compensation to Board and Committee chairpersons. The funds do not pay compensation directly to Trustees who are officers of the investment adviser, or to officers of the funds, all of whom receive remuneration for their services to the funds from MFS. Certain officers and Trustees of the funds are officers or directors of MFS, MFD, and MFSC. The funds have an unfunded, defined benefit plan for retired Independent Trustees which resulted in a pension expense of $4,539 and $827 for the MFS Money Market Fund and MFS Government Money Market Fund, respectively. This amount is included in independent trustees’ compensation for the six months ended February 28, 2006. The deferred liability for retirement benefits payable to retired Trustees amounted to $44,583 and $7,322, for the MFS Money Market Fund and MFS Government Money Market Fund respectively, at February 28, 2006, and is included in payable for independent trustees’ compensation.
Other – These funds and certain other MFS funds (the funds) have entered into a services agreement (the Agreement) which provides for payment of fees by the funds to Tarantino LLC in return for the provision of services of an Independent Chief Compliance Officer (ICCO) for the funds. The ICCO is an officer of the funds and the sole member of Tarantino LLC. The funds can terminate the Agreement with Tarantino LLC at any time under the terms of the Agreement. For the six months ended February 28, 2006, the fee paid to Tarantino LLC was $3,300 and $103 for the MFS Money Market Fund and MFS Government Money Market Fund, respectively. MFS has agreed to reimburse the funds for a portion of the payments made by the funds to Tarantino LLC in the amount of $2,987 and $72 for the MFS Money Market Fund and MFS Government Money Market Fund, respectively, which is shown as a reduction of total expenses in the Statement of Operations. Additionally, MFS has agreed to bear all expenses associated with office space, other administrative support, and supplies provided to the ICCO.
22 SEMIANNUAL REPORT
Notes to Financial Statements (unaudited) – continued
Purchases and sales of money market investments, exclusive of securities subject to repurchase agreements, were as follows:
| | Purchases | Sales |
| MFS Money Market Fund | $5,667,870,000 | $5,651,382,000 |
|
|
|
| MFS Government Money Market Fund | 589,525,000 | 532,506,000 |
|
|
|
| (5) Shares of Beneficial Interest |
Each fund’s Declaration of Trust permits the Trustees to issue an unlimited number of full and fractional shares of beneficial interest.
The MFS Money Market Fund is one of several mutual funds in which the MFS funds-of-funds may invest. The MFS funds-of-funds do not invest in the underlying MFS funds for the purpose of exercising management or control. At the end of the period, the MFS Conservative Allocation Fund and MFS Moderate Allocation Fund were the owners of record of approximately 8% and 12% respectively, of the value of outstanding voting shares. In addition, MFS Lifetime Retirement Income Fund, the MFS Lifetime 2010 Fund, and the MFS Lifetime 2020 Fund, were all the owners of record of less than 1% of the value of outstanding voting shares.
Each fund and other affiliated funds participate in a $1 billion unsecured line of credit provided by a syndication of banks under a credit agreement. Borrowings may be made for temporary financing needs. Interest is charged to each fund, based on its borrowings, at a rate equal to the Federal Reserve funds rate plus 0.35% . In addition, a commitment fee, based on the average daily, unused portion of the line of credit, is allocated among the participating funds at the end of each calendar quarter. The commitment fee allocated to the funds for the six months ended February 28, 2006 was $1,285 and $77 for the MFS Money Market Fund and MFS Government Money Market Fund, respectively and is included in miscellaneous expense on the Statement of Operations. The funds had no significant borrowings during the six months ended February 28, 2006.
SEMIANNUAL REPORT 23
BOARD REVIEW OF INVESTMENT ADVISORY AGREEMENT
A discussion regarding the Board’s most recent review and renewal of the Fund’s investment advisory agreement is available by clicking on the fund’s name under ‘‘Select a fund’’ on the MFS Web site (mfs.com).
PROXY VOTING POLICIES AND INFORMATION
A general description of the MFS funds’ proxy voting policies and procedures is available without charge, upon request, by calling 1-800-225-2606, by visiting the Proxy Voting section of mfs.com or by visiting the SEC’s Web site at http://www.sec.gov.
Information regarding how the fund voted proxies relating to portfolio securities during the most recent twelve-month period ended June 30 is available without charge by visiting the Proxy Voting section of mfs.com or by visiting the SEC’s Web site at http://www.sec.gov.
QUARTERLY PORTFOLIO DISCLOSURE
|
The trust will file a complete schedule of portfolio holdings with the Securities and Exchange Commission (the Commission) for the first and third quarters of each fiscal year on Form N-Q. The trust’s Form N-Q may be reviewed and copied at the:
Public Reference Room
Securities and Exchange Commission
Washington, D.C. 20549-0102
Information on the operation of the Public Reference Room may be obtained by calling the Commission at 1-800-SEC-0330. The trust’s Form N-Q is available on the EDGAR database on the Commission’s Internet Web site at http://www.sec.gov, and copies of this information may be obtained, upon payment of a duplicating fee, by electronic request at the following e-mail address: publicinfo@sec.gov or by writing the Public Reference Section at the above address.
A shareholder can also obtain the quarterly portfolio holdings report at mfs.com.
24 SEMIANNUAL REPORT
LETTER FROM THE CEO

Dear Shareholders,
It has been said that change is the only constant in life. As investors have seen, that theme is still accurate today as we recently have experienced shifting economic cycles because of natural disasters and political instability around the globe.
Markets worldwide have fluctuated in the past year as devastating hurricanes had a dramatic effect on the international economy, particularly on oil prices. We witnessed political unrest in the Middle East, highlighted by instability in Iraq, and in Africa, the usually stable Nigeria also experienced violence. As a result, energy prices have bounced up and down, with crude oil prices at one point topping a record $70 per barrel.
Such cycles are not uncommon and in fact have almost become the norm in our everyday lives. What does all of this mean to you as an investor? In times like these, it helps to know that you’re working with a seasoned investment professional who has experience to guide you through difficult times. At MFS®, we believe our investment management team has the knowledge and confidence to navigate through difficult cycles and at the same time see through adversity to find investment opportunities for our clients and shareholders.
Our investment management process, honed over 80 years, combines a unique concept of teamwork with our unwavering focus on the long term. We firmly believe that the best way to realize long-term financial goals – be it a college education, a comfortable retirement, or a secure family legacy – is to follow a three-pronged approach that focuses on longer time horizons. Allocate holdings across the major asset classes – including stocks, bonds, and cash. Diversify within each class to take advantage of different market segments and investing styles. Rebalance assets regularly to maintain a desired asset allocation. Of course, these strategies cannot guarantee a profit or protect against a loss. This long-term approach requires diligence and patience, two traits that in our experience are essential to capitalizing on the many opportunities the financial markets can offer – through both up and down economic cycles.

Robert J. Manning
Chief Executive Officer and Chief Investment Officer
MFS Investment Management®
April 17, 2006
The opinions expressed in this letter are those of MFS, and no forecasts can be guaranteed.
SEMIANNUAL REPORT 1
PORTFOLIO COMPOSITION

| Top ten holdings | |
| American Tower Corp., ‘‘A’’ | 3.1% |
|
|
| Amdocs Ltd. | 2.5% |
|
|
| Corporate Executive Board Co. | 2.3% |
|
|
| Juniper Networks, Inc. | 2.2% |
|
|
| Smith International, Inc. | 1.9% |
|
|
| Millipore Corp. | 1.9% |
|
|
| Advanced Medical Optics, Inc. | 1.8% |
|
|
| Analog Devices, Inc. | 1.8% |
|
|
| PETsMART, Inc. | 1.8% |
|
|
| DENTSPLY International, Inc. | 1.7% |
|
|
| Equity market sectors | |
| Health Care | 22.4% |
|
|
| Technology | 16.8% |
|
|
| Special Products & Services | 13.5% |
|
|
| Financial Services | 9.5% |
|
|
| Leisure | 7.9% |
|
|
| Energy | 7.2% |
|
|
| Retailing | 6.0% |
|
|
| Industrial Goods & Services | 6.0% |
|
|
| Utilities & Communications | 4.3% |
|
|
| Autos & Housing | 1.6% |
|
|
| Basic Materials | 1.3% |
|
|
| Consumer Staples | 0.7% |
|
|
| Transportation | 0.7% |
|
|
Percentages are based on net assets as of 2/28/06.
The portfolio is actively managed, and current holdings may be different.
2 SEMIANNUAL REPORT
Fund Expenses Borne by the Shareholders During the Period, September 1, 2005 through February 28, 2006.
As a shareholder of the fund, you incur two types of costs: (1) transaction costs, including sales charges (loads) on certain purchase or redemption payments and redemption fees on certain exchanges and redemptions, and (2) ongoing costs, including management fees; distribution and service (12b-1) fees; and other fund expenses. This example is intended to help you understand your ongoing costs (in dollars) of investing in the fund and to compare these costs with the ongoing costs of investing in other mutual funds.
The example is based on an investment of $1,000 invested at the beginning of the period and held for the entire period September 1, 2005 through February 28, 2006.
The first line for each share class in the following table provides information about actual account values and actual expenses. You may use the information in this line, together with the amount you invested, to estimate the expenses that you paid over the period. Simply divide your account value by $1,000 (for example, an $8,600 account value divided by $1,000 = 8.6), then multiply the result by the number in the first line under the heading entitled ‘‘Expenses Paid During Period’’ to estimate the expenses you paid on your account during this period.
Hypothetical Example for Comparison Purposes
The second line for each share class in the following table provides information about hypothetical account values and hypothetical expenses based on the fund’s actual expense ratio and an assumed rate of return of 5% per year before expenses, which is not the fund’s actual return. The hypothetical account values and expenses may not be used to estimate the actual ending account balance or expenses you paid for the period. You may use this information to compare the ongoing costs of investing in the fund and other funds. To do so, compare this 5% hypothetical example with the 5% hypothetical examples that appear in the shareholder reports of the other funds.
Please note that the expenses shown in the table are meant to highlight your ongoing costs only and do not reflect any transactional costs, such as sales charges (loads) or redemption fees. Therefore, the second line for each share class in the table is useful in comparing ongoing costs only, and will not help you determine the relative total costs of owning different funds. In addition, if these transactional costs were included, your costs would have been higher.
SEMIANNUAL REPORT 3
| Expense Table – continued | | | | |
| | | | | |
| | | | | Expenses |
| | Annualized | Beginning | Ending | Paid During |
| | Expense | Account Value | Account Value | Period (p) |
| Share Class | Ratio | 9/01/05 | 2/28/06 | 9/01/05-2/28/06 |
|
|
|
|
|
| Actual | 1.30% | $1,000.00 | $1,075.50 | $6.69 |
| A |
|
|
|
|
|
| Hypothetical (h) | 1.30% | $1,000.00 | $1,018.35 | $6.51 |
|
|
|
|
|
| Actual | 2.05% | $1,000.00 | $1,069.80 | $10.52 |
| B |
|
|
|
|
|
| Hypothetical (h) | 2.05% | $1,000.00 | $1,014.63 | $10.24 |
|
|
|
|
|
| Actual | 2.05% | $1,000.00 | $1,070.20 | $10.52 |
| C |
|
|
|
|
|
| Hypothetical (h) | 2.05% | $1,000.00 | $1,014.63 | $10.24 |
|
|
|
|
|
| Actual | 1.05% | $1,000.00 | $1,075.50 | $5.40 |
| I |
|
|
|
|
|
| Hypothetical (h) | 1.05% | $1,000.00 | $1,019.59 | $5.26 |
|
|
|
|
|
| Actual | 1.55% | $1,000.00 | $1,072.50 | $7.96 |
| R |
|
|
|
|
|
| Hypothetical (h) | 1.55% | $1,000.00 | $1,017.11 | $7.75 |
|
|
|
|
|
| Actual | 2.17% | $1,000.00 | $1,069.90 | $11.14 |
| R1 |
|
|
|
|
|
| Hypothetical (h) | 2.17% | $1,000.00 | $1,014.03 | $10.84 |
|
|
|
|
|
| Actual | 1.83% | $1,000.00 | $1,071.00 | $9.40 |
| R2 |
|
|
|
|
|
| Hypothetical (h) | 1.83% | $1,000.00 | $1,015.72 | $9.15 |
|
|
|
|
|
| Actual | 1.72% | $1,000.00 | $1,072.80 | $8.84 |
| R3 |
|
|
|
|
|
| Hypothetical (h) | 1.72% | $1,000.00 | $1,016.27 | $8.60 |
|
|
|
|
|
| Actual | 1.46% | $1,000.00 | $1,074.40 | $7.51 |
| R4 |
|
|
|
|
|
| Hypothetical (h) | 1.46% | $1,000.00 | $1,017.55 | $7.30 |
|
|
|
|
|
| Actual | 1.16% | $1,000.00 | $1,075.50 | $5.97 |
| R5 |
|
|
|
|
|
| Hypothetical (h) | 1.16% | $1,000.00 | $1,019.04 | $5.81 |
|
|
|
|
|
| Actual | 1.65% | $1,000.00 | $1,072.60 | $8.48 |
| 529A |
|
|
|
|
|
| Hypothetical (h) | 1.65% | $1,000.00 | $1,016.61 | $8.25 |
|
|
|
|
|
| Actual | 2.30% | $1,000.00 | $1,069.10 | $11.80 |
| 529B |
|
|
|
|
|
| Hypothetical (h) | 2.30% | $1,000.00 | $1,013.39 | $11.48 |
|
|
|
|
|
| Actual | 2.30% | $1,000.00 | $1,069.40 | $11.80 |
| 529C |
|
|
|
|
|
| Hypothetical (h) | 2.30% | $1,000.00 | $1,013.39 | $11.48 |
|
|
|
|
|
| (h) | 5% class return per year before expenses. |
| |
| (p) | Expenses paid is equal to each class’ annualized expense ratio, as shown above, multiplied by the average account value over the period, multiplied by the number of days in the period, divided by the number of days in the year. Expenses paid do not include any applicable sales charges (loads) or redemption fees. If these transaction costs had been included, your costs would have been higher. |
| |
Effective October 1, 2005 the fund’s Class R1, Class R2, and Class R3 retirement plan administration and services fees were reduced (as described in Note 3 of the Notes to the Financial Statements). Had this fee reduction been in effect throughout the entire six month period, the annualized expense ratio would have been 2.15%, 1.81%, and 1.70% for Class R1, Class R2, and Class R3, respectively, and the actual expenses paid during the period would have been approximately $11.04, $9.30, and $8.74 for Class R1, Class R2, and Class R3, respectively.
4 SEMIANNUAL RPORT
| PORTFOLIO OF INVESTMENTS (unaudited) – 2/28/06 | | | | |
The Portfolio of Investments is a complete list of all securities owned by your fund. | | | |
| It is categorized by broad-based asset classes. | | | | |
Stocks - 97.9% | | | | |
|
|
|
|
| Issuer | Shares/Par | | | Value ($) |
|
|
|
|
| Aerospace - 1.6% | | | | |
|
|
|
|
| FLIR Systems, Inc. (n) | 327,490 | | $ | 8,462,341 |
| ITT Industries, Inc. | 356,620 | | | 18,722,550 |
| | |
|
|
| | | | $ | 27,184,891 |
|
|
|
|
| Automotive - 1.6% | | | | |
|
|
|
|
| Gentex Corp. (l) | 504,737 | | $ | 8,408,918 |
| Harman International Industries, Inc. (l) | 167,180 | | | 18,448,313 |
| | |
|
|
| | | | $ | 26,857,231 |
|
|
|
|
| Banks & Credit Companies - 3.4% | | | | |
|
|
|
|
| Commerce Bancorp, Inc. (l) | 766,700 | | $ | 25,431,439 |
| Investors Financial Services Corp. (l) | 399,520 | | | 18,022,347 |
| Nelnet, Inc., ‘‘A’’ (l)(n) | 125,060 | | | 5,183,737 |
| SLM Corp. | 157,730 | | | 8,897,549 |
| | |
|
|
| | | | $ | 57,535,072 |
|
|
|
|
| Biotechnology - 6.0% | | | | |
|
|
|
|
| Celgene Corp. (n) | 580,720 | | $ | 22,067,360 |
| Gen-Probe, Inc. (l)(n) | 318,470 | | | 15,910,761 |
| Genzyme Corp. (n) | 312,561 | | | 21,672,980 |
| Gilead Sciences, Inc. (n) | 424,200 | | | 26,414,934 |
| Human Genome Sciences, Inc. (n) | 469,520 | | | 5,878,390 |
| ImClone Systems, Inc. (l)(n) | 273,030 | | | 10,481,622 |
| | |
|
|
| | | | $ | 102,426,047 |
|
|
|
|
| Broadcast & Cable TV - 2.4% | | | | |
|
|
|
|
| Citadel Broadcasting Corp. (l) | 773,020 | | $ | 8,611,443 |
| Grupo Televisa S.A., ADR | 279,230 | | | 21,908,386 |
| XM Satellite Radio Holdings, Inc., ‘‘A’’ (l)(n) | 445,240 | | | 9,835,352 |
| | |
|
|
| | | | $ | 40,355,181 |
|
|
|
|
| Brokerage & Asset Managers - 3.6% | | | | |
|
|
|
|
| Calamos Asset Management, Inc. (l) | 121,300 | | $ | 4,654,281 |
| Chicago Mercantile Exchange Holdings, Inc. | 68,290 | | | 29,064,224 |
| Legg Mason, Inc. | 211,530 | | | 27,623,703 |
| | |
|
|
| | | | $ | 61,342,208 |
|
| Business Services - 12.0% | | | | |
|
| Alliance Data Systems Corp. (l)(n) | 500,660 | | $ | 21,658,552 |
| Amdocs Ltd. (n) | 1,287,530 | | | 42,642,993 |
| Bright Horizons Family Solutions, Inc. (l)(n) | 228,867 | | | 7,669,333 |
| Brink’s Co. (l) | 206,670 | | | 10,120,630 |
| Corporate Executive Board Co. | 389,433 | | | 38,943,300 |
| Getty Images, Inc. (n) | 303,660 | | | 24,605,570 |
|
| | SEMIANNUAL REPORT 5 |
| Portfolio of Investments (unaudited) – continued | | | | |
| Issuer | Shares/Par | | | Value ($) |
|
|
|
|
| Stocks - continued | | | | |
|
|
|
|
| Business Services - continued | | | | |
|
|
|
|
| Monster Worldwide, Inc. (n) | 472,770 | | $ | 23,146,819 |
| Paychex, Inc. | 517,718 | | | 20,734,606 |
| TALX Corp. | 219,449 | | | 7,013,590 |
| Universal Technical Institute, Inc. (l)(n) | 251,320 | | | 7,743,169 |
| | |
|
|
| | | | $ | 204,278,562 |
|
|
|
|
| Computer Software - 3.1% | | | | |
|
|
|
|
| Adobe Systems, Inc. (n) | 686,370 | | $ | 26,507,609 |
| Symantec Corp. (n) | 1,337,467 | | | 22,589,818 |
| TIBCO Software, Inc. (n) | 452,490 | | | 3,923,088 |
| | |
|
|
| | | | $ | 53,020,515 |
|
|
|
|
| Computer Software - Systems - 1.4% | | | | |
|
|
|
|
| MICROS Systems, Inc. (l)(n) | 552,680 | | $ | 23,925,517 |
|
|
|
|
| Consumer Goods & Services - 2.2% | | | | |
|
|
|
|
| Estee Lauder Cos., Inc., ‘‘A’’ | 326,210 | | $ | 12,206,778 |
| ITT Educational Services, Inc. (n) | 398,610 | | | 24,713,820 |
| | |
|
|
| | | | $ | 36,920,598 |
|
|
|
|
| Electrical Equipment - 2.6% | | | | |
|
|
|
|
| MSC Industrial Direct Co., Inc., ‘‘A’’ (l) | 426,290 | | $ | 20,193,357 |
| Rockwell Automation, Inc. | 128,700 | | | 8,773,479 |
| W.W. Grainger, Inc. | 202,530 | | | 14,995,321 |
| | |
|
|
| | | | $ | 43,962,157 |
|
|
|
|
| Electronics - 8.4% | | | | |
|
|
|
|
| Analog Devices, Inc. | 811,030 | | $ | 30,932,684 |
| KLA-Tencor Corp. (l) | 355,240 | | | 18,554,185 |
| Marvell Technology Group Ltd. (n) | 280,160 | | | 17,151,395 |
| PMC-Sierra, Inc. (l)(n) | 1,626,070 | | | 16,602,175 |
| SanDisk Corp. (n) | 371,630 | | | 22,424,154 |
| Tessera Technologies, Inc. (l)(n) | 325,290 | | | 10,158,807 |
| Xilinx, Inc. | 988,890 | | | 26,976,919 |
| | |
|
|
| | | | $ | 142,800,319 |
|
|
|
|
| Energy - Integrated - 1.2% | | | | |
|
|
|
|
| Amerada Hess Corp. | 142,210 | | $ | 19,669,065 |
|
|
|
|
| Forest & Paper Products - 0.3% | | | | |
|
|
|
|
| Aracruz Celulose S.A., ADR (l) | 117,700 | | $ | 5,784,955 |
|
|
|
|
| 6 SEMIANNUAL REPORT | | | | |
| Portfolio of Investments (unaudited) – continued | | | | |
| Issuer | Shares/Par | | | Value ($) |
|
|
|
|
| Stocks - continued | | | | |
|
|
|
|
| Gaming & Lodging - 2.0% | | | | |
|
|
|
|
| International Game Technology | 711,910 | | $ | 25,465,021 |
| Station Casinos, Inc. | 128,410 | | | 8,789,665 |
| | |
|
|
| | | | $ | 34,254,686 |
|
|
|
|
| Health Maintenance Organizations - 1.2% | | | | |
|
|
|
|
| Health Net, Inc. (l)(n) | 444,260 | | $ | 21,302,267 |
|
|
|
|
| Insurance - 2.5% | | | | |
|
|
|
|
| Ace Ltd. | 321,800 | | $ | 17,933,914 |
| Endurance Specialty Holdings Ltd. | 253,730 | | | 7,992,495 |
| PartnerRe Ltd. (l) | 266,650 | | | 16,161,657 |
| | |
|
|
| | | | $ | 42,088,066 |
|
|
|
|
| Leisure & Toys - 1.2% | | | | |
|
| |
|
|
| Electronic Arts, Inc. (n) | 381,640 | | $ | 19,833,831 |
|
| |
|
|
| Machinery & Tools - 1.8% | | | | |
|
|
|
|
| Precision Castparts Corp. | 214,390 | | $ | 11,371,246 |
| Roper Industries, Inc. (l) | 437,140 | | | 19,701,900 |
| | |
|
|
| | | | $ | 31,073,146 |
|
|
|
|
| Medical & Health Technology & Services - 1.3% | | | | |
|
| |
|
|
| Laboratory Corp. of America Holdings (n) | 224,650 | | $ | 13,054,412 |
| United Surgical Partners International, Inc. (l)(n) | 241,860 | | | 8,501,379 |
| | |
|
|
| | | | $ | 21,555,791 |
|
|
|
|
| Medical Equipment - 10.0% | | | | |
|
|
|
|
| Advanced Medical Optics, Inc. (n) | 696,020 | | $ | 30,958,969 |
| C.R. Bard, Inc. | 197,010 | | | 12,902,185 |
| Cytyc Corp. (n) | 928,449 | | | 26,767,185 |
| DENTSPLY International, Inc. | 515,710 | | | 29,390,313 |
| Millipore Corp. (n) | 457,440 | | | 31,714,315 |
| ResMed, Inc. (n) | 273,310 | | | 11,093,653 |
| St. Jude Medical, Inc. (n) | 391,140 | | | 17,835,984 |
| Thoratec Corp. (l)(n) | 507,270 | | | 10,206,272 |
| | |
|
|
| | | | $ | 170,868,876 |
|
|
|
|
| Metals & Mining - 0% | | | | |
|
|
|
|
| Aber Diamond Corp. | 3,400 | | $ | 128,274 |
|
|
|
|
| Network & Telecom - 3.9% | | | | |
|
| Comverse Technology, Inc. (l)(n) | 686,880 | | $ | 19,754,669 |
| Harris Corp. | 183,700 | | | 8,391,416 |
| Juniper Networks, Inc. (l)(n) | 2,050,700 | | | 37,712,373 |
| | |
|
|
| | | | $ | 65,858,458 |
|
|
|
|
| | SEMIANNUAL REPORT 7 |
| Portfolio of Investments (unaudited) – continued | | | | |
Issuer | Shares/Par | | | Value ($) |
|
|
|
|
| Stocks - continued | | | | |
|
|
|
|
| Oil Services - 6.0% | | | | |
|
|
|
|
| GlobalSantaFe Corp. | 403,510 | | $ | 22,330,243 |
| National Oilwell Varco, Inc. (n) | 303,460 | | | 18,474,645 |
| Noble Corp. | 396,700 | | | 29,320,097 |
| Smith International, Inc. | 831,660 | | | 32,210,192 |
| | |
|
|
| | | | $ | 102,335,177 |
|
|
|
|
| Pharmaceuticals - 3.9% | | | | |
|
|
|
|
| Allergan, Inc. | 215,170 | | $ | 23,294,304 |
| Endo Pharmaceuticals Holdings, Inc. (n) | 640,710 | | | 20,195,179 |
| Medicis Pharmaceutical Corp., ‘‘A’’ (l) | 808,890 | | | 23,004,832 |
| | |
|
|
| | | | $ | 66,494,315 |
|
|
|
|
| Restaurants - 2.3% | | | | |
|
|
|
|
| Cheesecake Factory, Inc. (l)(n) | 726,729 | | $ | 26,278,520 |
| Rare Hospitality International, Inc. (n) | 423,210 | | | 13,542,720 |
| | |
|
|
| | | | $ | 39,821,240 |
|
|
|
|
| Specialty Chemicals - 1.0% | | | | |
|
|
|
|
| Praxair, Inc. | 321,330 | | $ | 17,345,393 |
|
|
|
|
| Specialty Stores - 6.0% | | | | |
|
|
|
|
| Aeropostale, Inc. (n) | 348,990 | | $ | 10,012,523 |
| Bed Bath & Beyond, Inc. (n) | 256,050 | | | 9,228,042 |
| Chico’s FAS, Inc. (l)(n) | 334,980 | | | 15,760,809 |
| PETsMART, Inc. | 1,185,660 | | | 30,779,734 |
| Urban Outfitters, Inc. (n) | 707,410 | | | 19,878,221 |
| Williams-Sonoma, Inc. (n) | 424,360 | | | 17,182,336 |
| | |
|
|
| | | | $ | 102,841,665 |
|
|
|
|
| Telephone Services - 3.1% | | | | |
|
|
|
|
| American Tower Corp., ‘‘A’’ (n) | 1,661,170 | | $ | 52,875,041 |
|
|
|
|
| Trucking - 0.7% | | | | |
|
|
|
|
| Expeditors International of Washington, Inc. (l) | 155,220 | | $ | 12,074,564 |
|
|
|
|
| Utilities - Electric Power - 1.2% | | | | |
|
|
|
|
| NRG Energy, Inc. (n) | 456,590 | | $ | 19,747,518 |
|
|
|
|
| Total Stocks (Identified Cost, $1,439,094,811) | | | $ | 1,666,560,626 |
|
|
|
| Short-Term Obligations - 2.5% | | | | |
|
|
|
|
| General Electric Capital Corp., 4.56%, due 3/01/06, | | | | |
| at Amortized Cost (y) | $ 41,996,000 | | $ | 41,996,000 |
|
|
|
|
| 8 SEMIANNUAL REPORT | | | | |
| Portfolio of Investments (unaudited) – continued | | |
Collateral for Securities Loaned - 10.7% | | |
|
|
|
| Issuer | Shares/Par | Value ($) |
|
|
|
| Navigator Securities Lending Prime Portfolio, at Cost and | | |
| Net Asset Value | 181,304,733 | $ 181,304,733 |
|
|
|
| Total Investments (Identified Cost, $1,662,395,544) (k) | | $1,889,861,359 |
|
|
|
| Other Assets, Less Liabilities - (11.1)% | | (188,479,367) |
|
|
|
| Net Assets - 100.0% | | $1,701,381,992 |
|
|
|
| (n) | Non-income producing security. |
| (l) | All or a portion of this security is on loan. |
| (y) | The rate shown represents an annualized yield at time of purchase. |
| (k) | As of February 28, 2006 the fund had one security that was fair valued, aggregating $128,274 and less than 0.1% of net assets in accordance with the policies adopted by the Board of Trustees. |
| |
The following abbreviations are used in the Portfolio of Investments and are defined:
ADR American Depository Receipt
See Notes to Financial Statements
|
SEMIANNUAL REPORT 9
FINANCIAL STATEMENTS | Statement of Assets and Liabilities (unaudited)
This statement represents your fund’s balance sheet, which details the assets
and liabilities composing the total value of the fund.
| At 2/28/06 | | |
| Assets | | |
|
|
|
| Investments, at value including $176,995,555 of securities on | | |
| loan (identified cost, $1,662,395,544) | $1,889,861,359 | |
| Cash | 386 | |
| Receivable for investments sold | 13,605,156 | |
| Receivable for fund shares sold | 2,406,610 | |
| Interest and dividends receivable | 507,823 | |
| Other assets | 783 | |
|
|
|
| Total assets | | $1,906,382,117 |
|
|
|
| Liabilities | | |
|
|
|
| Payable for investments purchased | $17,749,000 | |
| Payable for fund shares reacquired | 5,172,246 | |
| Collateral for securities loaned, at value | 181,304,733 | |
| Payable to affiliates | | |
| Management fee | 35,389 | |
| Shareholder servicing costs | 304,364 | |
| Distribution and service fees | 18,115 | |
| Administrative services fee | 405 | |
| Program manager fees | 8 | |
| Retirement plan administration and services fees | 146 | |
| Payable for independent trustees’ compensation | 106,437 | |
| Accrued expenses and other liabilities | 309,282 | |
|
|
|
| Total liabilities | | $205,000,125 |
|
|
|
| Net assets | | $1,701,381,992 |
|
|
|
| Net assets consist of: | | |
|
|
|
| Paid-in capital | $2,758,725,380 | |
| Unrealized appreciation (depreciation) on investments and | | |
| translation of assets and liabilities in foreign currencies | 227,465,815 | |
| Accumulated net realized gain (loss) on investments and | | |
| foreign currency transactions | (1,276,154,535) | |
| Accumulated net investment loss | (8,654,668) | |
|
|
|
| Net assets | | $1,701,381,992 |
|
|
|
| Shares of beneficial interest outstanding | | 180,504,513 |
|
|
|
| Class A shares | | |
|
|
|
| Net assets | $726,124,688 | |
| Shares outstanding | 76,063,805 | |
|
|
|
| Net asset value per share | | $9.55 |
|
|
|
| Offering price per share (100/94.25-net asset value per share) | | $10.13 |
|
|
|
| 10 SEMIANNUAL REPORT | | |
| Statement of Assets and Liabilities (unaudited) – continued | | |
Class B shares | | |
|
|
| Net assets | $358,869,426 | |
| Shares outstanding | 39,678,906 | |
|
|
| Net asset value and offering price per share | | $9.04 |
|
|
| Class C shares | | |
|
|
| Net assets | $106,326,696 | |
| Shares outstanding | 12,027,957 | |
|
|
| Net asset value and offering price per share | | $8.84 |
|
|
| Class I shares | | |
|
|
| Net assets | $453,773,844 | |
| Shares outstanding | 46,821,533 | |
|
|
| Net asset value, offering price, and redemption price per share | | $9.69 |
|
|
| Class R shares | | |
|
|
| Net assets | $8,467,001 | |
| Shares outstanding | 893,927 | |
|
|
| Net asset value, offering price, and redemption price per share | | $9.47 |
|
|
| Class R1 shares | | |
|
|
| Net assets | $534,945 | |
| Shares outstanding | 59,237 | |
|
|
| Net asset value, offering price, and redemption price per share | | $9.03 |
|
|
| Class R2 shares | | |
|
|
| Net assets | $189,928 | |
| Shares outstanding | 20,988 | |
|
|
| Net asset value, offering price, and redemption price per share | | $9.05 |
|
|
| Class R3 shares | | |
|
|
| Net assets | $1,485,250 | |
| Shares outstanding | 157,514 | |
|
|
| Net asset value, offering price, and redemption price per share | | $9.43 |
|
|
| Class R4 shares | | |
|
|
| Net assets | $674,574 | |
| Shares outstanding | 70,755 | |
|
|
| Net asset value, offering price, and redemption price per share | | $9.53 |
|
|
| Class R5 shares | | |
|
|
| Net assets | $43,658,755 | |
| Shares outstanding | 4,570,551 | |
|
|
| Net asset value, offering price, and redemption price per share | | $9.55 |
|
| |
| Class 529A shares | | |
|
|
| Net assets | $700,396 | |
| Shares outstanding | 74,108 | |
|
|
| Net asset value per share | | $9.45 |
|
|
| Offering price per share (100/94.25 x net asset value per share) | | $10.03 |
|
|
| | |
SEMIANNUAL REPORT 11 |
| Statement of Assets and Liabilities (unaudited) – continued | | |
Class 529B shares | | |
|
|
|
| Net assets | $184,171 | |
| Shares outstanding | 20,524 | |
|
|
|
| Net asset value and offering price per share | | $8.97 |
|
|
|
| Class 529C shares | | |
|
|
|
| Net assets | $392,318 | |
| Shares outstanding | 44,708 | |
|
|
|
| Net asset value and offering price per share | | $8.78 |
|
|
|
On sales of $50,000 or more, the offering price of Class A and Class 529A shares are reduced. A contingent deferred sales charge may be imposed on redemptions of Class A, Class B, Class C, Class 529B, and Class 529C shares.
See Notes to Financial Statements
|
12 SEMIANNUAL REPORT
FINANCIAL STATEMENTS | Statement of Operations (unaudited)
This statement describes how much your fund earned in investment income and accrued in
expenses. It also describes any gains and/or losses generated by fund operations.
| Six months ended 2/28/06 | | |
| Net investment loss | | |
|
|
| Income | | |
| Dividends | $3,510,078 | |
| Interest | 701,804 | |
| Foreign taxes withheld | (13,807) | |
|
|
| Total investment income | | $4,198,075 |
|
|
| Expenses | | |
| Management fee | $6,678,745 | |
| Distribution and service fees | 3,476,570 | |
| Program manager fees | 1,442 | |
| Shareholder servicing costs | 1,916,515 | |
| Administrative services fee | 85,677 | |
| Retirement plan administration and services fees | 18,437 | |
| Independent trustees’ compensation | 28,119 | |
| Custodian fee | 191,645 | |
| Shareholder communications | 117,206 | |
| Auditing fees | 22,180 | |
| Legal fees | 14,796 | |
| Registration fees | 116,415 | |
| Miscellaneous | 147,999 | |
|
|
| Total expenses | | $12,815,746 |
|
|
| Fees paid indirectly | (55,379) | |
| Reduction of expenses by investment adviser | (7,870) | |
|
|
| Net expenses | | $12,752,497 |
|
|
| Net investment loss | | $(8,554,422) |
|
|
| Realized and unrealized gain (loss) on investments | | |
|
|
| Realized gain (loss) (identified cost basis) | | |
| Investment transactions | $99,148,639 | |
| Foreign currency transactions | (6,092) | |
|
|
| Net realized gain (loss) on investments and foreign | | |
| currency transactions | | $99,142,547 |
|
|
| Change in unrealized appreciation (depreciation) | | |
| Investments | | $37,631,042 |
|
|
| Net realized and unrealized gain (loss) on investments and | | |
| foreign currency | | $136,773,589 |
|
|
| Change in net assets from operations | | $128,219,167 |
|
|
See Notes to Financial Statements | | |
| | |
| | |
SEMIANNUAL REPORT 13 |
| FINANCIAL STATEMENTS | Statements of Changes in Net Assets | |
These statements describe the increases and/or decreases in net assets resulting | |
| from operations, any distributions, and any shareholder transactions. | |
| |
Six months ended | Year ended |
| | 2/28/06 | 8/31/05 |
| | (unaudited) | |
| Change in net assets | | |
|
|
|
| From operations | | |
|
|
|
| Net investment loss | $(8,554,422) | $(19,637,443) |
| Net realized gain (loss) on investments and foreign | | |
| currency transactions | 99,142,547 | 254,762,196 |
| Net unrealized gain (loss) on investments and foreign | | |
| currency translation | 37,631,042 | 73,772,589 |
|
|
|
| Change in net assets from operations | $128,219,167 | $308,897,342 |
|
|
|
| Change in net assets from fund share transactions | $(273,643,660) | $(417,835,036) |
|
|
|
| Redemption fees | $— | $7,131 |
|
|
|
| Total change in net assets | $(145,424,493) | $(108,930,563) |
|
|
|
| Net assets | | |
|
|
|
| At beginning of period | 1,846,806,485 | 1,955,737,048 |
| At end of period (including accumulated net investment | | |
| loss of $8,654,668 and $100,246, respectively) | $1,701,381,992 | $1,846,806,485 |
|
|
|
See Notes to Financial Statements | | |
14 SEMIANNUAL REPORT
FINANCIAL STATEMENTS | Financial Highlights
The financial highlights table is intended to help you understand the fund’s financial performance for the semiannual period and the past 5 fiscal years (or life of a particular share class, if shorter). Certain information reflects financial results for a single fund share. The total returns in the table represent the rate by which an investor would have earned (or lost) on an investment in the fund share class (assuming reinvestment of all distributions) held for the entire period.
| Six months | | | | | | | |
| | ended | | Years ended 8/31 |
| Class A | 2/28/06 | | 2005 | 2004 | | 2003 | 2002 | 2001 |
| (unaudited) | | | | | | | |
| Net asset value, beginning | | | | | | | | |
| of period | $8.88 | | $7.58 | $7.43 | | $5.84 | $10.50 | $19.67 |
|
| Income (loss) from | | | | | | | | |
| investment operations | | | | | | | | |
|
|
|
|
|
|
|
| Net investment loss (d) | $(0.04 | ) | $(0.07) | $(0.08 | ) | $(0.05) | $(0.08) | $(0.07) |
| Net realized and unrealized | | | | | | | | |
| gain (loss) on investments | | | | | | | | |
| and foreign currency | 0.71 | | 1.37 | 0.23 | | 1.64 | (4.42) | (6.35) |
|
|
|
|
|
|
|
| Total from investment | | | | | | | | |
| operations | $0.67 | | $1.30 | $0.15 | | $1.59 | $(4.50) | $(6.42) |
|
|
|
|
|
|
|
| Less distributions declared | | | | | | | | |
| to shareholders | | | | | | | | |
|
|
|
|
|
|
|
| From net realized gain on | | | | | | | | |
| investments and foreign | | | | | | | | |
| currency transactions | $— | | $— | $— | | $— | $(0.15) | $(2.75) |
| From paid-in capital | — | | — | — | | — | (0.01) | — |
|
|
|
|
|
|
|
| Total distributions declared | | | | | | | | |
| to shareholders | $— | | $— | $— | | $— | $(0.16) | $(2.75) |
|
|
|
|
|
|
|
| Net asset value, end of period | $9.55 | | $8.88 | $7.58 | | $7.43 | $5.84 | $10.50 |
|
|
|
|
|
|
|
| Total return (%) (t)(s)(r) | 7.55 | (n) | 17.15 | 2.02 | (b) | 27.23 | (43.48) | (35.42) |
|
|
|
|
|
|
|
| Ratios (%) (to average net assets) | | | | | | | |
| and Supplemental data: | | | | | | | | |
|
|
|
|
|
|
|
| Expenses before expense | | | | | | | | |
| reductions (f) | 1.30 | (a) | 1.29 | 1.26 | | 1.34 | 1.39 | 1.26 |
| Expenses after expense | | | | | | | | |
| reductions (f) | 1.30 | (a) | 1.29 | 1.26 | | 1.34 | 1.39 | 1.26 |
| Net investment loss | (0.82 | )(a) | (0.84) | (0.98 | ) | (0.76) | (0.87) | (0.50) |
| Portfolio turnover | 42 | | 67 | 94 | | 120 | 147 | 109 |
| Net assets at end of period | | | | | | | | |
| (000 Omitted) | $726,125 | | $931,140 | $1,092,443 | | $1,182,259 | $946,866 | $1,036,376 |
|
|
|
|
|
|
|
| See Notes to Financial Statements | | | | | | | |
| | | | | | | |
| | | | | | | | SEMIANNUAL REPORT 15 |
| Financial Highlights – continued | | | | | | | |
| |
Six months | | | | | | | |
| | ended | | Years ended 8/31 |
| Class B | 2/28/06 | | 2005 | 2004 | | 2003 | 2002 | 2001 |
| | (unaudited) | | | | | | | |
| Net asset value, beginning | | | | | | | | |
| of period | $8.45 | | $7.26 | $7.17 | | $5.68 | $10.22 | $19.24 |
|
|
|
|
|
|
|
| Income (loss) from | | | | | | | | |
| investment operations | | | | | | | | |
|
|
|
|
|
|
|
| Net investment loss (d) | $(0.07 | ) | $(0.13) | $(0.13 | ) | $(0.09) | $(0.14) | $(0.17) |
| Net realized and unrealized | | | | | | | | |
| gain (loss) on investments and | | | | | | | | |
| foreign currency | 0.66 | | 1.32 | 0.22 | | 1.58 | (4.32) | (6.19) |
|
|
|
|
|
|
|
| Total from investment operations | $0.59 | | $1.19 | $0.09 | | $1.49 | $(4.46) | $(6.36) |
|
|
|
|
|
|
|
| Less distributions declared | | | | | | | | |
| to shareholders | | | | | | | | |
|
|
|
|
|
|
|
| From net realized gain on | | | | | | | | |
| investments and foreign | | | | | | | | |
| currency transactions | $— | | $— | $— | | $— | $(0.07) | $(2.66) |
| From paid-in capital | — | | — | — | | — | (0.01) | — |
|
|
|
|
|
|
|
| Total distributions declared | | | | | | | | |
| to shareholders | $— | | $— | $— | | $— | $(0.08) | $(2.66) |
|
|
|
|
|
|
|
| Net asset value, end of period | $9.04 | | $8.45 | $7.26 | | $7.17 | $5.68 | $10.22 |
|
| Total return (%) (t)(s)(r) | 6.98 | (n) | 16.39 | 1.26 | (b) | 26.23 | (43.94) | (35.85) |
|
|
|
|
|
|
|
| Ratios (%) (to average net assets) | | | | | | | |
| and Supplemental data: | | | | | | | | |
|
|
|
|
|
|
|
| Expenses before expense | | | | | | | | |
| reductions (f) | 2.05 | (a) | 2.04 | 2.01 | | 2.09 | 2.14 | 2.01 |
| Expenses after expense | | | | | | | | |
| reductions (f) | 2.05 | (a) | 2.04 | 2.01 | | 2.09 | 2.14 | 2.01 |
| Net investment loss | (1.57 | )(a) | (1.59) | (1.73 | ) | (1.51) | (1.60) | (1.25) |
| Portfolio turnover | 42 | | 67 | 94 | | 120 | 147 | 109 |
| Net assets at end of period | | | | | | | | |
| (000 Omitted) | $358,869 | | $384,712 | $446,415 | | $498,021 | $450,803 | $781,652 |
|
|
|
|
|
|
|
| See Notes to Financial Statements | | | | | | | |
| | | | | | | |
| 16 SEMIANNUAL REPORT | | | | | | | | |
| Financial Highlights – continued | | | | | | | |
| | Six months | | | | | | | |
| | ended | | Years ended 8/31 |
| Class C | 2/28/06 | | 2005 | 2004 | | 2003 | 2002 | 2001 |
| | (unaudited) | | | | | | | |
| Net asset value, beginning | | | | | | | | |
| of period | $8.26 | | $7.10 | $7.01 | | $5.55 | $10.00 | $18.92 |
|
|
|
|
|
|
|
| Income (loss) from | | | | | | | | |
| investment operations | | | | | | | | |
|
|
|
|
|
|
|
| Net investment loss (d) | $(0.07 | ) | $(0.13) | $(0.13 | ) | $(0.09) | $(0.14) | $(0.16) |
| Net realized and unrealized | | | | | | | | |
| gain (loss) on investments and | | | | | | | | |
| foreign currency | 0.65 | | 1.29 | 0.22 | | 1.55 | (4.22) | (6.08) |
|
|
|
|
|
|
|
| Total from investment operations | $0.58 | | $1.16 | $0.09 | | $1.46 | $(4.36) | $(6.24) |
|
|
|
|
|
|
|
| Less distributions declared | | | | | | | | |
| to shareholders | | | | | | | | |
|
|
|
|
|
|
|
| From net realized gain on | | | | | | | | |
| investments and foreign | | | | | | | | |
| currency transactions | $— | | $— | $— | | $— | $(0.08) | $(2.68) |
| From paid-in capital | — | | — | — | | — | (0.01) | — |
|
|
|
|
|
|
|
| Total distributions declared | | | | | | | | |
| to shareholders | $— | | $— | $— | | $— | $(0.09) | $(2.68) |
|
|
|
|
|
|
|
| Net asset value, end of period | $8.84 | | $8.26 | $7.10 | | $7.01 | $5.55 | $10.00 |
|
|
|
|
|
|
|
| Total return (%) (t)(s)(r) | 7.02 | (n) | 16.34 | 1.28 | (b) | 26.31 | (43.94) | (35.87) |
|
| Ratios (%) (to average net assets) | | | | | | | |
| and Supplemental data: | | | | | | | | |
|
| Expenses before expense | | | | | | | | |
| reductions (f) | 2.05 | (a) | 2.04 | 2.01 | | 2.09 | 2.14 | 2.01 |
| Expenses after expense | | | | | | | | |
| reductions (f) | 2.05 | (a) | 2.04 | 2.01 | | 2.09 | 2.14 | 2.01 |
| Net investment loss | (1.57 | )(a) | (1.59) | (1.73 | ) | (1.51) | (1.60) | (1.25) |
| Portfolio turnover | 42 | | 67 | 94 | | 120 | 147 | 109 |
| Net assets at end of period | | | | | | | | |
| (000 Omitted) | $106,327 | | $115,894 | $139,797 | | $172,466 | $176,786 | $301,405 |
|
|
|
|
|
|
|
| See Notes to Financial Statements | | | | | | | |
| | | | | | | |
| | | | | | | SEMIANNUAL REPORT 17 |
| Financial Highlights – continued | | | | | | | | |
Six months | | | | | | | |
| | ended | | Years ended 8/31 |
| Class I | 2/28/06 | | 2005 | 2004 | | 2003 | 2002 | 2001 |
| (unaudited) | | | | | | | |
| Net asset value, beginning of period | $9.01 | | $7.67 | $7.49 | | $5.87 | $10.55 | $19.73 |
|
|
|
|
|
|
|
| Income (loss) from | | | | | | | | |
| investment operations | | | | | | | | |
|
|
|
|
|
|
|
| Net investment loss (d) | $(0.03 | ) | $(0.05) | $(0.06 | ) | $(0.03) | $(0.05) | $(0.03) |
| Net realized and unrealized | | | | | | | | |
| gain (loss) on investments and | | | | | | | | |
| foreign currency | 0.71 | | 1.39 | 0.24 | | 1.65 | (4.46) | (6.37) |
|
|
|
|
|
|
|
| Total from investment operations | $0.68 | | $1.34 | $0.18 | | $1.62 | $(4.51) | $(6.40) |
|
|
|
|
|
|
|
| Less distributions declared | | | | | | | | |
| to shareholders | | | | | | | | |
|
|
|
|
|
|
|
| From net realized gain on | | | | | | | | |
| investments and foreign | | | | | | | | |
| currency transactions | $— | | $— | $— | | $— | $(0.16) | $(2.78) |
| From paid-in capital | — | | — | — | | — | (0.01) | — |
|
|
|
|
|
|
|
| Total distributions declared | | | | | | | | |
| to shareholders | $— | | $— | $— | | $— | $(0.17) | $(2.78) |
|
|
|
|
|
|
|
| Net asset value, end of period | $9.69 | | $9.01 | $7.67 | | $7.49 | $5.87 | $10.55 |
|
|
|
|
|
|
|
| Total return (%) (s)(r) | 7.55 | (n) | 17.47 | 2.40 | (b) | 27.60 | (43.38) | (35.23) |
|
| Ratios (%) (to average net assets) | | | | | | | | |
| and Supplemental data: | | | | | | | | |
|
|
|
|
|
|
|
| Expenses before expense reductions (f) | 1.05 | (a) | 1.04 | 1.01 | | 1.11 | 1.14 | 1.01 |
| Expenses after expense reductions (f) | 1.05 | (a) | 1.04 | 1.01 | | 1.11 | 1.14 | 1.01 |
| Net investment loss | (0.57 | )(a) | (0.58) | (0.72 | ) | (0.53) | (0.63) | (0.26) |
| Portfolio turnover | 42 | | 67 | 94 | | 120 | 147 | 109 |
| Net assets at end of period | | | | | | | | |
| (000 Omitted) | $453,774 | | $399,423 | $270,934 | | $109,332 | $31,798 | $30,490 |
|
|
|
|
|
|
|
| See Notes to Financial Statements | | | | | | | |
| | | | | | | |
| 18 SEMIANNUAL REPORT | | | | | | | | |
| Financial Highlights – continued | | | | | | | | |
| |
Six months | | | | | | | |
| | ended | | Years ended 8/31 | |
| Class R | 2/28/06 | | 2005 | | 2004 | | 2003(i) | |
| | (unaudited) | | | | | | | |
| Net asset value, beginning of period | $8.83 | | $7.55 | | $7.42 | | $5.64 | |
| |
| Income (loss) from investment operations | | | | | | | | |
| |
| Net investment loss (d) | $(0.05 | ) | $(0.09 | ) | $(0.10 | ) | $(0.05 | ) |
| Net realized and unrealized gain (loss) on investments | | | | | | | |
| and foreign currency | 0.69 | | 1.37 | | 0.23 | | 1.83 | |
| |
| Total from investment operations | $0.64 | | $1.28 | | $0.13 | | $1.78 | |
| |
| Net asset value, end of period | $9.47 | | $8.83 | | $7.55 | | $7.42 | |
| |
| Total return (%) (s)(r) | 7.25 | (n) | 16.95 | | 1.75 | (b) | 31.56 | (n) |
| | | | | | |
| |
| Ratios (%) (to average net assets) | | | | | | | | |
| and Supplemental data: | | | | | | | | |
| |
| Expenses before expense reductions (f) | 1.55 | (a) | 1.55 | | 1.50 | | 1.67 | (a) |
| Expenses after expense reductions (f) | 1.55 | (a) | 1.55 | | 1.50 | | 1.67 | (a) |
| Net investment loss | (1.08 | )(a) | (1.07 | ) | (1.22 | ) | (1.16 | )(a) |
| Portfolio turnover | 42 | | 67 | | 94 | | 120 | |
| Net assets at end of period (000 Omitted) | $8,467 | | $12,904 | | $5,177 | | $2,039 | |
| |
| | | | Six months | | | | Year | |
| | | | ended | | | | ended | |
| Class R1 | | | 2/28/06 | | 8/31/05(i) | |
| | | | (unaudited) | | | | | |
| Net asset value, beginning of period | | | $8.44 | | | | $7.93 | |
| |
| Income (loss) from investment operations | | | | | | | | |
| |
| Net investment loss (d) | | | $(0.08 | ) | | | $(0.06) | |
| Net realized and unrealized gain (loss) on investments and | | | | | | | |
| foreign currency | | | 0.67 | | | | 0.57 | (g) |
| |
| Total from investment operations | | | $0.59 | | | | $0.51 | |
| |
| Net asset value, end of period | | | $9.03 | | | | $8.44 | |
| |
| Total return (%) (s)(r) | | | 6.99 | (n) | | | 6.43 | (n) |
| |
| Ratios (%) (to average net assets) | | | | | | | | |
| and Supplemental data: | | | | | | | | |
| |
| Expenses before expense reductions (f) | | | 2.26 | (a) | | | 2.27 | (a) |
| Expenses after expense reductions (f) | | | 2.17 | (a) | | | 2.27 | (a) |
| Net investment loss | | | (1.68 | )(a) | | | (1.77 | )(a) |
| Portfolio turnover | | | 42 | | | | 67 | |
| Net assets at end of period (000 Omitted) | | | $535 | | | | $210 | |
| |
| See Notes to Financial Statements | | | | | | | | |
| | | | | | | | |
| | | | SEMIANNUAL REPORT 19 | |
| Financial Highlights – continued | | | | | |
| |
Six months | | | Year | |
| | ended | | | ended | |
| Class R2 | 2/28/06 | | | 8/31/05(i) | |
| | (unaudited) | | | | |
| Net asset value, beginning of period | $8.45 | | | $7.93 | |
|
|
|
| |
| Income (loss) from investment operations | | | | | |
|
|
|
| |
| Net investment loss (d) | $(0.06 | ) | $(0.05 | ) |
| Net realized and unrealized gain (loss) on investments and | | | | | |
| foreign currency | 0.66 | | | 0.57 | (g) |
|
|
|
| |
| Total from investment operations | $0.60 | | | $0.52 | |
|
|
|
| |
| Net asset value, end of period | $9.05 | | | $8.45 | |
|
|
|
| |
| Total return (%) (s)(r) | 7.10 | (n) | 6.56 | (n) |
|
|
| |
| Ratios (%) (to average net assets) | | | | | |
| and Supplemental data: | | | | | |
| |
| Expenses before expense reductions (f) | 1.95 | (a) | 1.98 | (a) |
| Expenses after expense reductions (f) | 1.83 | (a) | 1.98 | (a) |
| Net investment loss | (1.36 | )(a) | (1.45 | )(a) |
| Portfolio turnover | 42 | | | 67 | |
| Net assets at end of period (000 Omitted) | $190 | | | $212 | |
|
|
|
| |
| | Six months | | | | |
| | ended | | Years ended 8/31 | |
| Class R3 | 2/28/06 | | 2005 | 2004(i) | |
| | (unaudited) | | | | |
| Net asset value, beginning of period | $8.79 | | $7.54 | $7.60 | |
| |
| Income (loss) from investment operations | | | | | |
|
|
|
| |
| Net investment loss (d) | $(0.06 | ) | $(0.11) | $(0.09) | |
| Net realized and unrealized gain (loss) on investments and | | | | | |
| foreign currency | 0.70 | | 1.36 | 0.03 | |
|
|
|
| |
| Total from investment operations | $0.64 | | $1.25 | $(0.06) | |
|
|
|
| |
| Net asset value, end of period | $9.43 | | $8.79 | $7.54 | |
|
|
|
| |
| Total return (%) (s)(r) | 7.28 | (n) | 16.58 | (0.79 | )(b)(n) |
|
|
|
| |
| Ratios (%) (to average net assets) | | | | | |
| and Supplemental data: | | | | | |
| |
| Expenses before expense reductions (f) | 1.81 | (a) | 1.80 | 1.74 | (a) |
| Expenses after expense reductions (f) | 1.72 | (a) | 1.80 | 1.74 | (a) |
| Net investment loss | (1.23 | )(a) | (1.33) | (1.47 | )(a) |
| Portfolio turnover | 42 | | 67 | 94 | |
| Net assets at end of period (000 Omitted) | $1,485 | | $1,126 | $314 | |
|
|
|
| |
| See Notes to Financial Statements | | | | | |
| | | | | |
| 20 SEMIANNUAL REPORT | | | | | |
| Financial Highlights – continued | | | | |
| | Six months | | Year | |
| | ended | | ended | |
| Class R4 | 2/28/06 | | 8/31/05(i) | |
| | (unaudited) | | | |
| Net asset value, beginning of period | $8.87 | | $8.31 | |
|
|
| |
| Income (loss) from investment operations | | | | |
|
|
| |
| Net investment loss (d) | $(0.05 | ) | $(0.03 | ) |
| Net realized and unrealized gain (loss) on investments and | | | | |
| foreign currency | 0.71 | | 0.59 | (g) |
|
|
| |
| Total from investment operations | $0.66 | | $0.56 | |
|
|
| |
| Net asset value, end of period | $9.53 | | $8.87 | |
|
|
| |
| Total return (%) (s)(r) | 7.44 | (n) | 6.74 | (n) |
|
|
| |
| Ratios (%) (to average net assets) | | | | |
| and Supplemental data: | | | | |
|
|
| |
| Expenses before expense reductions (f) | 1.46 | (a) | 1.45 | (a) |
| Expenses after expense reductions (f) | 1.46 | (a) | 1.45 | (a) |
| Net investment loss | (1.02 | )(a) | (0.93 | )(a) |
| Portfolio turnover | 42 | | 67 | |
| Net assets at end of period (000 Omitted) | $675 | | $53 | |
|
|
| |
| | Six months | | Year | |
| | ended | | ended | |
| Class R5 | 2/28/06 | | 8/31/05(i) | |
| | (unaudited) | | | |
| Net asset value, beginning of period | $8.88 | | $8.31 | |
|
|
| |
| Income (loss) from investment operations | | | | |
|
|
| |
| Net investment loss (d) | $(0.03 | ) | $(0.02 | ) |
| Net realized and unrealized gain (loss) on investments and | | | | |
| foreign currency | 0.70 | | 0.59 | (g) |
|
|
| |
| Total from investment operations | $0.67 | | $0.57 | |
|
|
| |
| Net asset value, end of period | $9.55 | | $8.88 | |
|
|
| |
| Total return (%) (s)(r) | 7.55 | (n) | 6.86 | (n) |
|
|
| |
| Ratios (%) (to average net assets) | | | | |
| and Supplemental data: | | | | |
|
|
| |
| Expenses before expense reductions (f) | 1.16 | (a) | 1.15 | (a) |
| Expenses after expense reductions (f) | 1.16 | (a) | 1.15 | (a) |
| Net investment loss | (0.65 | )(a) | (0.63 | )(a) |
| Portfolio turnover | 42 | | 67 | |
| Net assets at end of period (000 Omitted) | $43,659 | | $53 | |
|
|
| |
| See Notes to Financial Statements | | | | |
| | | | |
| | SEMIANNUAL REPORT 21 | |
| Financial Highlights – continued | | | | | | | | |
| |
| Six months | | | | | |
| | ended | | Years ended 8/31 | |
| Class 529A | 2/28/06 | | 2005 | 2004 | | 2003 | 2002(i) | |
| (unaudited) | | | | | | | |
| Net asset value, beginning of period | $8.81 | | $7.54 | $7.40 | | $5.83 | $5.92 | |
|
|
|
|
|
| |
| Income (loss) from investment operations | | | | | | | | |
| |
| Net investment loss (d) | $(0.05 | ) | $(0.10) | $(0.11 | ) | $(0.07) | $(0.00 | )(w) |
| Net realized and unrealized gain (loss) on | | | | | | | | |
| investments and foreign currency | 0.69 | | 1.37 | 0.25 | | 1.64 | (0.09 | ) |
|
|
|
|
|
| |
| Total from investment operations | $0.64 | | $1.27 | $0.14 | | $1.57 | $(0.09 | ) |
|
|
|
|
|
| |
| Net asset value, end of period | $9.45 | | $8.81 | $7.54 | | $7.40 | $5.83 | |
| |
| Total return (%) (t)(s)(r) | 7.26 | (n) | 16.84 | 1.89 | (b) | 26.93 | (1.52 | )(n) |
|
|
|
|
|
| |
| Ratios (%) (to average net assets) | | | | | | | | |
| and Supplemental data: | | | | | | | | |
|
|
|
|
|
| |
| Expenses before expense reductions (f) | 1.65 | (a) | 1.64 | 1.60 | | 1.73 | 1.74 | (a) |
| Expenses after expense reductions (f) | 1.65 | (a) | 1.64 | 1.60 | | 1.73 | 1.74 | (a) |
| Net investment loss | (1.17 | )(a) | (1.18) | (1.32 | ) | (1.18) | (1.22 | )(a) |
| Portfolio turnover | 42 | | 67 | 94 | | 120 | 147 | |
| Net assets at end of period (000 Omitted) | $700 | | $591 | $345 | | $123 | $5 | |
|
|
|
|
|
| |
| |
| Six months | | | | | |
| | ended | Years ended 8/31 | |
| Class 529B | 2/28/06 | | 2005 | 2004 | | 2003 | 2002(i) | |
| (unaudited) | |
| Net asset value, beginning of period | $8.39 | | $7.23 | $7.16 | | $5.68 | $5.76 | |
|
|
|
|
|
| |
| Income (loss) from investment operations | | | | | | | | |
|
|
|
|
|
| |
| Net investment loss (d) | $(0.08 | ) | $(0.15) | $(0.15 | ) | $(0.11) | $(0.01 | ) |
| Net realized and unrealized gain (loss) on | | | | | | | | |
| investments and foreign currency | 0.66 | | 1.31 | 0.22 | | 1.59 | (0.07 | ) |
|
|
|
|
|
| |
| Total from investment operations | $0.58 | | $1.16 | $0.07 | | $1.48 | $(0.08 | ) |
|
|
|
|
|
| |
| Net asset value, end of period | $8.97 | | $8.39 | $7.23 | | $7.16 | $5.68 | |
|
|
|
|
|
| |
| Total return (%) (t)(s)(r) | 6.91 | (n) | 16.04 | 0.98 | (b) | 26.06 | (1.39 | )(n) |
| |
| Ratios (%) (to average net assets) | | | | | | | | |
| and Supplemental data: | | | | | | | | |
|
|
|
|
|
| |
| Expenses before expense reductions (f) | 2.30 | (a) | 2.29 | 2.25 | | 2.36 | 2.39 | (a) |
| Expenses after expense reductions (f) | 2.30 | (a) | 2.29 | 2.25 | | 2.36 | 2.39 | (a) |
| Net investment loss | (1.82 | )(a) | (1.83) | (1.97 | ) | (1.78) | (1.85 | )(a) |
| Portfolio turnover | 42 | | 67 | 94 | | 120 | 147 | |
| Net assets at end of period (000 Omitted) | $184 | | $158 | $129 | | $55 | $5 | |
| |
| See Notes to Financial Statements | | | | | | | | |
| | | | | | | | |
| 22 SEMIANNUAL REPORT | | | | | | | | |
| Financial Highlights – continued | | | | | | | | |
| |
| Six months | | | | | |
| | ended | | Years ended 8/31 | |
| Class 529C | 2/28/06 | | 2005 | 2004 | | 2003 | 2002(i) | |
| (unaudited) | | | | | | | |
| Net asset value, beginning of period | $8.21 | | $7.07 | $6.99 | | $5.55 | $5.63 | |
| |
| Income (loss) from investment operations | | | | | | | | |
| |
| Net investment loss (d) | $(0.08 | ) | $(0.14) | $(0.15 | ) | $(0.10) | $(0.01 | ) |
| Net realized and unrealized gain (loss) on | | | | | | | | |
| investments and foreign currency | 0.65 | | 1.28 | 0.23 | | 1.54 | (0.07 | ) |
| |
| Total from investment operations | $0.57 | | $1.14 | $0.08 | | $1.44 | $(0.08 | ) |
| |
| Net asset value, end of period | $8.78 | | $8.21 | $7.07 | | $6.99 | $5.55 | |
| |
| Total return (%) (t)(s)(r) | 6.94 | (n) | 16.12 | 1.14 | (b) | 25.95 | (1.42 | )(n) |
| |
| Ratios (%) (to average net assets) | | | | | | | | |
| and Supplemental data: | | | | | | | | |
| |
| Expenses before expense reductions (f) | 2.30 | (a) | 2.29 | 2.26 | | 2.36 | 2.39 | (a) |
| Expenses after expense reductions (f) | 2.30 | (a) | 2.29 | 2.26 | | 2.36 | 2.39 | (a) |
| Net investment loss | (1.82 | )(a) | (1.82) | (1.97 | ) | (1.78) | (1.85 | )(a) |
| Portfolio turnover | 42 | | 67 | 94 | | 120 | 147 | |
| Net assets at end of period (000 Omitted) | $392 | | $329 | $183 | | $86 | $5 | |
| |
Any redemption fees charged by the fund during the 2004 and 2005 fiscal years resulted in a per share impact of less than $0.01.
| (i) | For the period from the class’ inception, December 31, 2002 (Class R), July 31, 2002 (Classes 529A, 529B, and 529C), October 31, 2003 (Class R3) and April 1, 2005 (Classes R1, R2, R4, and R5) through the stated period end. |
| (r) | Certain expenses have been reduced without which performance would have been lower. |
| (a) | Annualized. |
| (n) | Not annualized. |
| (w) | Per share amount was less than $0.01. |
| (d) | Per share data are based on average shares outstanding. |
| (f) | Ratios do not reflect reductions from fees paid indirectly. |
| (g) | The per share amount is not in accordance with the net realized and unrealized gain/loss for the period because of the timing of sales of fund shares and the amount of per share realized and unrealized gains and losses at such time. |
| (t) | Total returns do not include any applicable sales charges. |
| (b) | The fund’s net asset value and total return calculation include a non-recurring accrual recorded as a result of an administrative proceeding regarding disclosure of brokerage allocation practices in connection with fund sales. The non-recurring accrual did not have a material impact on the net asset value per share based on shares outstanding on the day the proceeds were recorded. |
| (s) | From time to time the fund may receive proceeds from litigation settlements, without which performance would be lower. |
| |
See Notes to Financial Statements
|
SEMIANNUAL REPORT 23
NOTES TO FINANCIAL STATEMENTS (unaudited)
(1) Business and Organization
|
MFS Mid Cap Growth Fund (the fund) is a series of MFS Series Trust IV (the trust). The trust is organized as a Massachusetts business trust and is registered under the Investment Company Act of 1940, as amended, as an open-end management investment company.
(2) Significant Accounting Policies
|
General – The preparation of financial statements in conformity with U.S. generally accepted accounting principles requires management to make estimates and assumptions that affect the reported amounts of assets and liabilities, and disclosure of contingent assets and liabilities at the date of the financial statements and the reported amounts of revenues and expenses during the reporting period. Actual results could differ from those estimates. The fund can invest in foreign securities, including securities of emerging market issuers. Investments in foreign securities are vulnerable to the effects of changes in the relative values of the local currency and the U.S. dollar and to the effects of changes in each country’s legal, political, and economic environment. The markets of emerging markets countries are generally more volatile than the markets of developed countries with more mature economies. All of the risks of investing in foreign securities previously described are heightened when investing in emerging markets countries.
Investment Valuations – Equity securities, including restricted equity securities, are generally valued at the last sale or official closing price as reported by an independent pricing service on the market or exchange on which they are primarily traded. For securities for which there were no sales during the day, equity securities are generally valued at the last quoted bid price as reported by an independent pricing service on the market or exchange on which they are primarily traded. Short-term instruments with a maturity at issuance of 365 days or less are generally valued at amortized cost, which approximates market value. Open-end investment companies are generally valued at their net asset value per share. Securities and other assets generally valued on the basis of information from an independent pricing service may also be valued on the basis of information from brokers and dealers. The values of foreign securities and other assets and liabilities expressed in foreign currencies are converted to U.S. dollars based upon exchange rates provided by an independent source. When pricing-service information or market quotations are not readily available, securities are priced at fair value as determined under the direction of the Board of Trustees. For example, in valuing securities that trade principally on foreign markets, events reasonably determined to be significant (such as certain movements in the U.S. securities market, or other regional and local developments) may occur between the time that foreign markets close (where the security is principally traded) and the fund’s valuation time that may impact the value of securities traded in these foreign markets. In these cases, the fund may utilize information from an external vendor or other sources to adjust closing market prices of foreign equity securities to reflect what it believes to be the fair value of the securities as of the fund’s valuation time. Fair valuation of foreign equity securities may
Notes to Financial Statements (unaudited) – continued
occur frequently based on an assessment that events which occur on a fairly regular basis (such as U.S. market movements) are significant.
Repurchase Agreements – The fund may enter into repurchase agreements with institutions that the fund’s investment adviser has determined are creditworthy. Each repurchase agreement is recorded at cost. The fund requires that the securities collateral in a repurchase transaction be transferred to the custodian in a manner sufficient to enable the fund to obtain those securities in the event of a default under the repurchase agreement. The fund monitors, on a daily basis, the value of the collateral to ensure that its value, including accrued interest, is greater than amounts owed to the fund under each such repurchase agreement. The fund, along with other affiliated entities of Massachusetts Financial Services Company (MFS), may utilize a joint trading account for the purpose of entering into one or more repurchase agreements.
Foreign Currency Translation – Purchases and sales of foreign investments, income, and expenses are converted into U.S. dollars based upon currency exchange rates prevailing on the respective dates of such transactions. Gains and losses attributable to foreign currency exchange rates on sales of securities are recorded for financial statement purposes as net realized gains and losses on investments. Gains and losses attributable to foreign exchange rate movements on income and expenses are recorded for financial statement purposes as foreign currency transaction gains and losses. That portion of both realized and unrealized gains and losses on investments that results from fluctuations in foreign currency exchange rates is not separately disclosed.
Security Loans – State Street Bank and Trust Company (‘‘State Street’’), as lending agent, may loan the securities of the fund to certain qualified institutions (the ‘‘Borrowers’’) approved by the fund. The loans are collateralized at all times by cash and/or U.S. Treasury securities in an amount at least equal to the market value of the securities loaned. State Street provides the fund with indemnification against Borrower default. The fund bears the risk of loss with respect to the investment of cash collateral. On loans collateralized by cash, the cash collateral is invested in a money market fund or short-term securities. A portion of the income generated upon investment of the collateral is remitted to the Borrowers, and the remainder is allocated between the fund and the lending agent. On loans collateralized by U.S. Treasury securities, a fee is received from the Borrower, and is allocated between the fund and the lending agent. Income from securities lending is included in interest income on the Statement of Operations. The dividend and interest income earned on the securities loaned is accounted for in the same manner as other dividend and interest income.
Short Term Fees – For purchases made on or after July 1, 2004 and before April 1, 2005, the fund charged a 2% redemption fee (which was retained by the fund) on proceeds from Class A, Class B, Class C, and Class I shares redeemed or exchanged within 5 business days following their acquisition (either by purchase or exchange). Effective April 1, 2005, the fund no longer
SEMIANNUAL REPORT 25
Notes to Financial Statements (unaudited) – continued
charges a redemption fee. See the fund’s prospectus for details. Any redemption fees charged are accounted for as an addition to paid-in capital.
Investment Transactions and Income – Investment transactions are recorded on the trade date. Interest income is recorded on the accrual basis. All premium and discount is amortized or accreted for financial statement purposes in accordance with U.S. generally accepted accounting principles. All discount is accreted for tax reporting purposes as required by federal income tax regulations. Dividends received in cash are recorded on the ex-dividend date. Certain dividends from foreign securities will be recorded when the fund is informed of the dividend if such information is obtained subsequent to the ex-dividend date. Dividend and interest payments received in additional securities are recorded on the ex-dividend or ex-interest date in an amount equal to the value of the security on such date.
The fund may receive proceeds from litigation settlements involving its portfolio holdings. Any proceeds received are reflected in realized gain/loss in the Statement of Operations, or in unrealized gain/loss if the security is still held by the fund.
Fees Paid Indirectly – The fund’s custody fee is reduced according to an arrangement that measures the value of cash deposited with the custodian by the fund. During the six months ended February 28, 2006, the fund’s custodian fees were reduced by $46,686 under this arrangement. The fund has entered into a commission recapture agreement, under which certain brokers will credit the fund a portion of the commissions generated, to offset certain expenses of the fund. For the six months ended February 28, 2006, the fund’s custodian expenses were reduced by $8,693 under this agreement. These amounts are shown as a reduction of total expenses on the Statement of Operations. Effective January 1, 2006, the commission recapture agreement was terminated.
Tax Matters and Distributions – The fund intends to continue to qualify as a regulated investment company, as defined under Subchapter M of the Internal Revenue Code, and to distribute all of its taxable income, including realized capital gains. Accordingly, no provision for federal income tax is required in the financial statements. Foreign taxes, if any, have been accrued by the fund in the accompanying financial statements.
Distributions to shareholders are recorded on the ex-dividend date. Income and capital gain distributions are determined in accordance with income tax regulations, which may differ from generally accepted accounting principles. Certain capital accounts in the financial statements are periodically adjusted for permanent differences in order to reflect their tax character. These adjustments have no impact on net assets or net asset value per share. Temporary differences which arise from recognizing certain items of income, expense, gain or loss in different periods for financial statement and tax purposes will reverse at some time in the future. Distributions in excess of net investment income or net realized gains are temporary overdistributions for
26 SEMIANNUAL REPORT
Notes to Financial Statements (unaudited) – continued
financial statement purposes resulting from differences in the recognition or classification of income for financial statement and tax purposes.
Book/tax differences primarily relate to net operating losses and foreign currency transactions.
The fund declared no distributions for the years ended August 31, 2005 and August 31, 2004.
The federal tax cost and the tax basis components of distributable earnings were as follows:
| | | |
| As of February 28, 2006 | |
| Cost of investments(1) | $1,663,756,285 |
|
|
|
| Gross appreciation | $290,524,758 |
| Gross depreciation | (64,419,684) |
|
|
|
| Net unrealized appreciation (depreciation) | $226,105,074 |
|
As of August 31, 2005 | |
| Capital loss carryforwards | $(1,373,936,341) |
| Other temporary differences | (100,246) |
| Net unrealized appreciation (depreciation) | 188,474,032 |
(1) Aggregate cost includes prior fiscal year end tax adjustments.
As of August 31, 2005, the fund had available capital loss carryforwards to offset future realized gains. Such losses expire as follows:
August 31, 2011 $(1,373,936,341)
Multiple Classes of Shares of Beneficial Interest – The fund offers multiple classes of shares, which differ in their respective distribution and service fees. All shareholders bear the common expenses of the fund based on daily net assets of each class, without distinction between share classes. Dividends are declared separately for each class. Differences in per share dividend rates are generally due to differences in separate class expenses. Class B and Class 529B shares will convert to Class A and Class 529A shares, respectively, approximately eight years after purchase.
(3) Transactions with Affiliates
|
Investment Adviser – The fund has an investment advisory agreement with MFS to provide overall investment advisory and administrative services, and general office facilities.The management fee is computed daily and paid monthly at an annual rate of 0.75% of the fund’s average daily net assets. The investment adviser has contractually agreed to reduce its management fee to 0.70% of average daily net assets in excess of $3.0 billion. This management fee reduction amounted to $0 for the six months ended February 28, 2006.
The management fee incurred for the six months ended February 28, 2006 was equivalent to an annual effective rate of 0.75% of the fund’s average daily net assets.
SEMIANNUAL REPORT 27
Notes to Financial Statements (unaudited) – continued
Distributor – MFS Fund Distributors, Inc. (MFD), a wholly owned subsidiary of MFS, as distributor, received $25,449 and $521 for the six months ended February 28, 2006, as its portion of the initial sales charge on sales of Class A and Class 529A shares of the fund, respectively.
The Board of Trustees has adopted a distribution plan for certain class shares pursuant to Rule 12b-1 of the Investment Company Act of 1940.
The fund’s distribution plan provides that the fund will pay MFD for services provided by MFD and financial intermediaries in connection with the distribution and servicing of certain share classes. One component of the plan is a distribution fee paid to MFD and another component of the plan is a service fee paid to MFD. MFD may subsequently pay all, or a portion, of the distribution and/or service fees to financial intermediaries.
| Distribution Fee Plan Table: | | | | |
| | | | | Total | Annual | Distribution |
| | | Distribution | Service | Distribution | Effective | and Service |
| | | Fee Rate | Fee Rate | Plan(1) | Rate(2) | Fee |
| Class A | 0.10% | 0.25% | 0.35% | 0.25% | $1,056,848 |
| Class B | 0.75% | 0.25% | 1.00% | 1.00% | 1,835,571 |
| Class C | 0.75% | 0.25% | 1.00% | 1.00% | 548,756 |
| Class R | 0.25% | 0.25% | 0.50% | 0.50% | 25,714 |
| Class R1 | | 0.50% | 0.25% | 0.75% | 0.75% | 1,741 |
| Class R2 | | 0.25% | 0.25% | 0.50% | 0.50% | 414 |
| Class R3 | | 0.25% | 0.25% | 0.50% | 0.50% | 3,468 |
| Class R4 | | — | 0.25% | 0.25% | 0.25% | 384 |
| Class 529A | | 0.25% | 0.25% | 0.50% | 0.35% | 1,128 |
| Class 529B | | 0.75% | 0.25% | 1.00% | 1.00% | 839 |
| Class 529C | | 0.75% | 0.25% | 1.00% | 1.00% | 1,707 |
|
|
|
|
|
|
|
| Total Distribution and Service Fees | | | | $3,476,570 |
| | | |
|
| (1) | In accordance with the distribution plan for certain classes, the fund pays distribution and/or service fees up to these annual percentage rates of each class’ average daily net assets. |
| (2) | The annual effective rates represent actual fees incurred under the distribution plan for the six months ended February 28, 2006 based on each class’ average daily net assets. Payment of the 0.10% annual Class A distribution fee is not yet implemented and will commence on such date as the fund’s Board of Trustees may determine. 0.10% of the Class 529A distribution fee is currently being paid by the fund. Payment of the remaining 0.15% of the Class 529A distribution fee is not yet implemented and will commence on such date as the fund’s Board of Trustees may determine. |
| |
| |
Certain Class A, Class C and Class 529C shares are subject to a contingent deferred sales charge in the event of a shareholder redemption within 12 months of purchase. Class B and Class 529B shares are subject to a contingent deferred sales charge in the event of a shareholder redemption within six years of purchase. All contingent deferred sales charges are paid to MFD and during the six months ended February 28, 2006, were as follows:
| | Amount |
| Class A | $28,261 |
| Class B | $471,659 |
| Class C | $5,402 |
| Class 529B | $— |
| Class 529C | $1 |
|
|
Notes to Financial Statements (unaudited) – continued
The fund has entered into and may from time to time enter into contracts with program managers and other parties which administer the tuition programs through which an investment in the fund’s 529 share classes is made. The fund has entered into an agreement with MFD pursuant to which MFD receives an annual fee of up to 0.35% from the fund based solely upon the value of the fund’s 529 share classes attributable to tuition programs to which MFD, or a third party which contracts with MFD, provides administrative services. The current fee has been established at 0.25% annually of average net assets of the fund’s 529 share classes. The fee may only be increased with the approval of the Board of Trustees who oversees the fund. The services provided by MFD, or a third party with which MFD contracts, include recordkeeping and tax reporting and account services, as well as services designed to maintain the program’s compliance with the Internal Revenue Code and other regulatory requirements. Program manager fees for the six months ended February 28, 2006, were as follows:
| | | Amount |
| Class 529A | | $806 |
| Class 529B | | 210 |
| Class 529C | | 426 |
|
|
|
| Total Program Manager Fees | $1,442 |
|
|
Shareholder Servicing Agent – The fund pays a portion of shareholder servicing costs to MFS Service Center, Inc. (MFSC), a wholly-owned subsidiary of MFS. MFSC receives a fee from the fund, for its services as shareholder servicing agent, set periodically under the supervision of the fund’s Board of Trustees. For the six months ended February 28, 2006, the fee was $866,213, which equated to 0.0973% annually of the fund’s average daily net assets. MFSC also receives payment from the fund for out-of-pocket and sub-accounting expenses paid by MFSC on behalf of the fund. For the six months ended February 28, 2006, these costs amounted to $751,920.
Administrator – MFS provides certain financial, legal, shareholder communications, compliance, and other administrative services to certain funds for which MFS acts as investment adviser. Under an administrative services agreement, the funds may partially reimburse MFS the costs incurred to provide these services, subject to review and approval by the Board of Trustees. Each fund is charged a fixed amount plus a fee based on calendar year average net assets. Effective July 1, 2005, the fund’s annual fixed amount is $10,000.
The administrative services fee incurred for the six months ended February 28, 2006 was equivalent to an annual effective rate of 0.0096% of the fund’s average daily net assets.
In addition to the administrative services provided by MFS to the fund as described above, MFS is responsible for providing certain retirement plan administration and services with respect to certain shares. These services include various administrative, recordkeeping, and communication/educational services with respect to the retirement plans which invest in these shares, and
Notes to Financial Statements (unaudited) – continued
may be provided directly by MFS or by a third party. MFS may subsequently pay all, or a portion, of the retirement plan administration and services fee to affiliated or unaffiliated third parties. For the six months ended February 28, 2006, the fund paid MFS an annual retirement plan administration and services fee up to the following annual percentage rates of each class’ average daily net assets:
| | | | Annual | |
| | | | Effective | Total |
| | | Fee Rate | Rate(1) | Amount |
| Class R1 | | 0.45% | 0.36% | $1,043 |
| Class R2 | | 0.40% | 0.28% | 331 |
| Class R3 | | 0.25% | 0.16% | 1,744 |
| Class R4 | | 0.15% | 0.15% | 230 |
| Class R5 | | 0.10% | 0.10% | 15,089 |
|
|
|
|
|
| Total Retirement Plan Administrative Services Fee | | | $18,437 |
| | |
|
| (1) | Effective October 1, 2005, MFS has contractually agreed to waive a portion of the retirement plan administration and services fee equal to 0.10% for Class R1 shares, 0.15% for Class R2 shares, and 0.10% for Class R3 shares. This agreement will continue until at least September 30, 2007. For the six months ended February 28, 2006, this waiver amounted to $898 and is reflected as a reduction of total expenses in the Statement of Operations. |
| |
Trustees’ and Officers’ Compensation – The fund pays compensation to Independent Trustees in the form of a retainer, attendance fees, and additional compensation to Board and Committee chairpersons. The fund does not pay compensation directly to Trustees who are officers of the investment adviser, or to officers of the fund, all of whom receive remuneration for their services to the fund from MFS. Certain officers and Trustees of the fund are officers or directors of MFS, MFD, and MFSC.
The fund has an unfunded, defined benefit plan for retired Independent Trustees which resulted in a pension expense of $1,997. The fund also has an unfunded retirement benefit deferral plan for certain current Independent Trustees which resulted in an expense of $5,673. Both amounts are included in Independent trustees’ compensation for the six months ended February 28, 2006. The deferred liability for retirement benefits payable to retired Trustees and certain current Trustees amounted to $15,611 and $87,081, respectively, at February 28, 2006, and is included in payable for independent trustees’ compensation.
Other – This fund and certain other MFS funds (the funds) have entered into a services agreement (the Agreement) which provides for payment of fees by the funds to Tarantino LLC in return for the provision of services of an Independent Chief Compliance Officer (ICCO) for the funds. The ICCO is an officer of the funds and the sole member of Tarantino LLC. The funds can terminate the Agreement with Tarantino LLC at any time under the terms of the Agreement. For the six months ended February 28, 2006, the fee paid to Tarantino LLC was $7,321. MFS has agreed to reimburse the fund for a portion of the payments made by the funds to Tarantino LLC in the amount of $6,972, which is shown as a reduction of total expenses in the Statement of
30 SEMIANNUAL REPORT
Notes to Financial Statements (unaudited) – continued
Operations. Additionally, MFS has agreed to bear all expenses associated with office space, other administrative support, and supplies provided to the ICCO.
Purchases and sales of investments, other than U.S. government securities, purchased option transactions, and short-term obligations, aggregated $745,429,889 and $1,038,854,998, respectively.
(5) Shares of Beneficial Interest
|
The fund’s Declaration of Trust permits the Trustees to issue an unlimited number of full and fractional shares of beneficial interest. Transactions in fund shares were as follows:
| | | Six months ended 2/28/06 | Year ended 8/31/05(i) |
| | | Shares | Amount | Shares | Amount |
| Shares sold | | | | |
| Class A | 7,958,340 | $73,042,512 | 29,839,682 | $251,746,262 |
| Class B | 1,332,748 | 11,635,813 | 4,152,045 | 33,347,197 |
| Class C | 493,268 | 4,205,587 | 1,389,504 | 10,942,295 |
| Class I | 4,149,460 | 38,532,219 | 12,980,466 | 110,670,442 |
| Class R | 102,118 | 927,892 | 1,217,399 | 10,189,906 |
| Class R1 | | 38,341 | 329,358 | 24,923 | 205,879 |
| Class R2 | | 14,861 | 128,515 | 25,813 | 215,609 |
| Class R3 | | 63,444 | 561,154 | 167,878 | 1,446,814 |
| Class R4 | | 70,489 | 659,893 | 6,017 | 50,000 |
| Class R5 | | 4,855,666 | 41,799,926 | 6,017 | 50,000 |
| Class 529A | | 10,252 | 91,555 | 31,203 | 265,240 |
| Class 529B | | 1,837 | 15,985 | 4,781 | 38,386 |
| Class 529C | | 7,019 | 60,943 | 17,453 | 139,080 |
|
|
|
|
|
|
| | | 19,097,843 | $171,991,352 | 49,863,181 | $419,307,110 |
| Shares reacquired | | | | |
| Class A | (36,734,218) | $(337,019,466) | (69,133,567) | $(581,381,502) |
| Class B | (7,202,996) | (62,607,789) | (20,074,736) | (161,432,253) |
| Class C | (2,504,340) | (21,291,782) | (7,046,155) | (55,422,612) |
| Class I | (1,679,432) | (15,372,397) | (3,970,835) | (34,345,081) |
| Class R | (670,316) | (6,048,293) | (441,110) | (3,713,580) |
| Class R1 | | (4,019) | (34,582) | (8) | (72) |
| Class R2 | | (18,941) | (154,906) | (745) | (6,277) |
| Class R3 | | (34,059) | (309,241) | (81,354) | (702,767) |
| Class R4 | | (5,751) | (55,074) | — | — |
| Class R5 | | (291,132) | (2,690,105) | — | — |
| Class 529A | | (3,247) | (29,256) | (9,792) | (82,643) |
| Class 529B | | (177) | (1,588) | (3,697) | (29,738) |
| Class 529C | | (2,378) | (20,533) | (3,273) | (25,621) |
|
|
|
|
|
|
| | | (49,151,006) | $(445,635,012) | (100,765,272) | $(837,142,146) |
|
|
|
|
|
|
| | | | | SEMIANNUAL REPORT 31 |
| Notes to Financial Statements (unaudited) – continued | | |
| | | Six months ended 2/28/06 | Year ended 8/31/05(i) |
| | | Shares | Amount | Shares | Amount |
| Net change | | | | |
| Class A | (28,775,878) | $(263,976,954) | (39,293,885) | $(329,635,240) |
| Class B | (5,870,248) | (50,971,976) | (15,922,691) | (128,085,056) |
| Class C | (2,011,072) | (17,086,195) | (5,656,651) | (44,480,317) |
| Class I | 2,470,028 | 23,159,822 | 9,009,631 | 76,325,361 |
| Class R | (568,198) | (5,120,401) | 776,289 | 6,476,326 |
| Class R1 | | 34,322 | 294,776 | 24,915 | 205,807 |
| Class R2 | | (4,080) | (26,391) | 25,068 | 209,332 |
| Class R3 | | 29,385 | 251,913 | 86,524 | 744,047 |
| Class R4 | | 64,738 | 604,819 | 6,017 | 50,000 |
| Class R5 | | 4,564,534 | 39,109,821 | 6,017 | 50,000 |
| Class 529A | | 7,005 | 62,299 | 21,411 | 182,597 |
| Class 529B | | 1,660 | 14,397 | 1,084 | 8,648 |
| Class 529C | | 4,641 | 40,410 | 14,180 | 113,459 |
|
|
|
|
|
|
| | | (30,053,163) | $(273,643,660) | (50,902,091) | $(417,835,036) |
| (i) | For the period from the class’ inception, April 1, 2005 (Classes R1, R2, R4, and R5) through the stated period end. |
| |
The fund is one of several mutual funds in which the MFS funds-of-funds may invest. The MFS funds-of-funds do not invest in the underlying MFS funds for the purpose of exercising management or control. At the end of the period, the MFS Moderate Allocation Fund, MFS Growth Allocation Fund, and MFS Aggressive Growth Allocation Fund were the owners of record of approximately 6%, 12% and 8%, respectively, of the value of outstanding voting shares. In addition, the MFS Lifetime Retirement Income Fund, the MFS Lifetime 2020 Fund, the MFS Lifetime 2030 Fund, and the MFS Lifetime 2040 Fund were all the owners of record of less than 1% of the value of outstanding voting shares.
The fund and other affiliated funds participate in a $1 billion unsecured line of credit provided by a syndication of banks under a credit agreement. Borrowings may be made for temporary financing needs. Interest is charged to each fund, based on its borrowings, at a rate equal to the Federal Reserve funds rate plus 0.35% . In addition, a commitment fee, based on the average daily, unused portion of the line of credit, is allocated among the participating funds at the end of each calendar quarter. The commitment fee allocated to the fund for the six months ended February 28, 2006 was $5,937, and is included in miscellaneous expense on the Statement of Operations. The fund had no significant borrowings during the six months ended February 28, 2006.
32 SEMIANNUAL REPORT
BOARD REVIEW OF INVESTMENT ADVISORY AGREEMENT
A discussion regarding the Board’s most recent review and renewal of the Fund’s investment advisory agreement is available by clicking on the fund’s name under ‘‘Select a fund’’ on the MFS Web site (mfs.com).
PROXY VOTING POLICIES AND INFORMATION
A general description of the MFS funds’ proxy voting policies and procedures is available without charge, upon request, by calling 1-800-225-2606, by visiting the Proxy Voting section of mfs.com or by visiting the SEC’s Web site at http://www.sec.gov.
Information regarding how the fund voted proxies relating to portfolio securities during the most recent twelve-month period ended June 30 is available without charge by visiting the Proxy Voting section of mfs.com or by visiting the SEC’s Web site at http://www.sec.gov.
QUARTERLY PORTFOLIO DISCLOSURE
|
The trust will file a complete schedule of portfolio holdings with the Securities and Exchange Commission (the Commission) for the first and third quarters of each fiscal year on Form N-Q. The trust’s Form N-Q may be reviewed and copied at the:
Public Reference Room
Securities and Exchange Commission
Washington, D.C. 20549-0102
Information on the operation of the Public Reference Room may be obtained by calling the Commission at 1-800-SEC-0330. The trust’s Form N-Q is available on the EDGAR database on the Commission’s Internet Web site at http://www.sec.gov, and copies of this information may be obtained, upon payment of a duplicating fee, by electronic request at the following e-mail address: publicinfo@sec.gov or by writing the Public Reference Section at the above address.
A shareholder can also obtain the quarterly portfolio holdings report at mfs.com.
SEMIANNUAL REPORT 33
LETTER FROM THE CEO

Dear Shareholders,
It has been said that change is the only constant in life. As investors have seen, that theme is still accurate today as we recently have experienced shifting economic cycles because of natural disasters and political instability around the globe.
Markets worldwide have fluctuated in the past year as devastating hurricanes had a dramatic effect on the international economy, particularly on oil prices. We witnessed political unrest in the Middle East, highlighted by instability in Iraq, and in Africa, the usually stable Nigeria also experienced violence. As a result, energy prices have bounced up and down, with crude oil prices at one point topping a record $70 per barrel.
Such cycles are not uncommon and in fact have almost become the norm in our everyday lives. What does all of this mean to you as an investor? In times like these, it helps to know that you’re working with a seasoned investment professional who has experience to guide you through difficult times. At MFS®, we believe our investment management team has the knowledge and confidence to navigate through difficult cycles and at the same time see through adversity to find investment opportunities for our clients and shareholders.
Our investment management process, honed over 80 years, combines a unique concept of teamwork with our unwavering focus on the long term. We firmly believe that the best way to realize long-term financial goals – be it a college education, a comfortable retirement, or a secure family legacy – is to follow a three-pronged approach that focuses on longer time horizons. Allocate holdings across the major asset classes – including stocks, bonds, and cash. Diversify within each class to take advantage of different market segments and investing styles. Rebalance assets regularly to maintain a desired asset allocation. Of course, these strategies cannot guarantee a profit or protect against a loss. This long-term approach requires diligence and patience, two traits that in our experience are essential to capitalizing on the many opportunities the financial markets can offer – through both up and down economic cycles.
Respectfully,

Robert J. Manning
Chief Executive Officer and Chief Investment Officer
MFS Investment Management®
April 17, 2006
The opinions expressed in this letter are those of MFS, and no forecasts can be guaranteed.
SEMIANNUAL REPORT 1
PORTFOLIO COMPOSITION
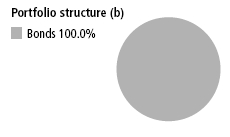
| Top five bond industries (b) | | |
| Utilities – Municipal Owned | | 18.7% |
|
| Health Care Revenue – Hospitals | | 15.5% |
|
| General Obligations – General | | |
| Purpose | | | | 10.8% |
|
| General Obligations – Schools | | 8.9% |
|
| State & Local Agencies | | 8.9% |
|
| Credit quality of bonds (r) | | |
| AAA | | 55.6% |
|
| AA | | 9.5% |
|
| A | | 23.4% |
|
| BBB | | 11.1% |
|
| BB | | 0.1% |
|
| B | | 0.1% |
|
| Not Rated | | 0.2% |
|
| Portfolio facts | | |
| Average Duration (d) | | 5.4 |
|
| Average Life (m) | | 13.5 yrs. |
|
| Average Maturity (m) | | 15.0 yrs. |
|
| Average Credit Quality of | | |
| Rated Securities (a) | | AA |
|
| Average Short Term Credit Quality | | A-1 |
|
| (b) | | For purposes of this graphical presentation, the bond component includes both accrued interest amounts |
| | | and the equivalent exposure from any derivative holdings, if applicable. |
| (r) | | Each security is assigned a rating from Moody’s Investors Service. If not rated by Moody’s, the rating will |
| | | be that assigned by Standard & Poor’s. Likewise, if not assigned a rating by Standard & Poor’s, it will be |
| | | based on the rating assigned by Fitch, Inc. For those portfolios that hold a security which is not rated by |
| | | any of the three agencies, the security is considered Not Rated. Holdings in U.S. Treasuries and |
| | | government agency mortgage-backed securities, if any, are included in the "AAA"-rating category. |
| (m) | | The average maturity shown is calculated using the final stated maturity on the portfolio’s holdings |
| | | without taking into account any holdings which have been pre-refunded to an earlier date or which |
| | | have a mandatory put date prior to the stated maturity. The average life shown takes into account these |
| | | earlier dates. |
| (a) | | The average credit quality of rated securities is based upon a market weighted average of portfolio |
| | | holdings that are rated by public rating agencies. |
| (d) | | Duration is a measure of how much a bond’s price is likely to fluctuate with general changes in interest |
| | | rates, e.g., if rates rise 1.00%, a bond with a 5-year duration is likely to lose about 5.00% of its value. |
Percentages are based on net assets as of 2/28/06, unless otherwise noted. |
The portfolio is actively managed, and current holdings may be different. |
|
2 SEMIANNUAL REPORT |
EXPENSE TABLE
Fund Expenses Borne by the Shareholders During the Period,
September 1, 2005 through February 28, 2006.
As a shareholder of the fund, you incur two types of costs: (1) transaction costs, including sales charges (loads) on certain purchase or redemption payments and redemption fees on certain exchanges and redemptions, and (2) ongoing costs, including management fees; distribution and service (12b-1) fees; and other fund expenses. This example is intended to help you understand your ongoing costs (in dollars) of investing in the fund and to compare these costs with the ongoing costs of investing in other mutual funds.
The example is based on an investment of $1,000 invested at the beginning of the period and held for the entire period September 1, 2005 through February 28, 2006.
Actual Expenses
The first line for each share class in the following table provides information about actual account values and actual expenses. You may use the information in this line, together with the amount you invested, to estimate the expenses that you paid over the period. Simply divide your account value by $1,000 (for example, an $8,600 account value divided by $1,000 = 8.6), then multiply the result by the number in the first line under the heading entitled ‘‘Expenses Paid During Period’’ to estimate the expenses you paid on your account during this period.
Hypothetical Example for Comparison Purposes
The second line for each share class in the following table provides information about hypothetical account values and hypothetical expenses based on the fund’s actual expense ratio and an assumed rate of return of 5% per year before expenses, which is not the fund’s actual return. The hypothetical account values and expenses may not be used to estimate the actual ending account balance or expenses you paid for the period. You may use this information to compare the ongoing costs of investing in the fund and other funds. To do so, compare this 5% hypothetical example with the 5% hypothetical examples that appear in the shareholder reports of the other funds.
Please note that the expenses shown in the table are meant to highlight your ongoing costs only and do not reflect any transactional costs, such as sales charges (loads) or redemption fees. Therefore, the second line for each share class in the table is useful in comparing ongoing costs only, and will not help you determine the relative total costs of owning different funds. In addition, if these transactional costs were included, your costs would have been higher.
SEMIANNUAL REPORT 3
| Expense Table – continued | | | | | | | |
|
| | | | | | | | Expenses |
| | Annualized | | Beginning | | Ending | | Paid During |
| | Expense | | Account Value | | Account Value | | Period(p) |
| Share Class | Ratio | | 9/01/05 | | 2/28/06 | | 9/01/05-2/28/06 |
|
| A | Actual | 0.49% | | $1,000.00 | | $1,010.70 | | $2.44 |
|
| Hypothetical(h) | 0.49% | | $1,000.00 | | $1,022.36 | | $2.46 |
|
| B | Actual | 1.26% | | $1,000.00 | | $1,006.80 | | $6.27 |
|
| Hypothetical(h) | 1.26% | | $1,000.00 | | $1,018.55 | | $6.31 |
|
| (h) | 5% class return per year before expenses. |
| (p) | Expenses paid is equal to each class’ annualized expense ratio, as shown above, multiplied by the average account value over the period, multiplied by the number of days in the period, divided by the number of days in the year. Expenses paid do not include any applicable sales charges (loads) or redemption fees. If these transaction costs had been included, your costs would have been higher. |
| |
4 SEMIANNUAL REPORT
| PORTFOLIO OF INVESTMENTS (unaudited) – 2/28/06 | | | | | | |
The Portfolio of Investments is a complete list of all securities owned by your fund. | | | |
| It is categorized by broad-based asset classes. | | | | | | |
Municipal Bonds - 98.8% | | | | | | |
|
| Issuer | | | Shares/Par | | | Value ($) |
|
| Airport & Port Revenue - 2.7% | | | | | | |
|
| Chicago, IL, O’Hare International Airport Rev. (2nd Lien | | | | | | |
| Passenger Facility D), AMBAC, 5.5%, 2019 | | $ | 1,845,000 | | $ | 1,989,814 |
| Chicago, IL, O’Hare International Airport Rev. (3rd Lien Passenger | | | | | | |
| Facility B), FSA, 5.75%, 2022 | | | 1,125,000 | | | 1,238,658 |
| Chicago, IL, O’Hare International Airport Rev., RITES, FSA, | | | | | | |
| 8.8%, 2022(r)(v) | | | 2,500,000 | | | 3,005,150 |
| Chicago, IL, O’Hare International Airport Rev., RITES, XLCA, | | | | | | |
| 9.3%, 2029(r)(v) | | | 3,000,000 | | | 3,684,120 |
| Chicago, IL, O’Hare International Airport Rev., Third Lien, ‘‘A’’, | | | | | | |
| FGIC, 5%, 2033 | | | 850,000 | | | 890,290 |
| Chicago, IL, O’Hare International Airport Rev., Third Lien, ‘‘A’’, | | | | | | |
| MBIA, 5%, 2029 | | | 3,395,000 | | | 3,566,990 |
| Denver, CO, City & County Airport Rev., RITES, AMBAC, | | | | | | |
| 8.51%, 2017(r)(v) | | | 2,500,000 | | | 2,962,300 |
| Massachusetts Port Authority Rev., 6.125%, 2010(c) | | | 1,500,000 | | | 1,651,260 |
| Massachusetts Port Authority Rev., ETM, 13%, 2013(c) | | | 2,955,000 | | | 4,026,306 |
| New York City, NY, City Industrial Development Agency, Special | | | | | | |
| Facilities Rev. (Terminal One Group), 5.5%, 2024 | | | 680,000 | | | 725,689 |
| Niagara, NY, Frontier Transportation Authority Rev. (Buffalo- | | | | | | |
| Niagara International Airport), MBIA, 5.875%, 2013 | | | 1,485,000 | | | 1,596,301 |
| Port of Seattle, WA, Rev. ‘‘A’’, FGIC, 5.5%, 2006(c) | | | 4,000,000 | | | 4,082,160 |
| |
|
| | | | | | $ | 29,419,038 |
|
| General Obligations - General Purpose - 10.6% | | | | | | |
|
| Allen County, IN, Jail Building Corp., First Mortgage, | | | | | | |
| 5.75%, 2011(c) | | $ | 2,750,000 | | $ | 3,046,367 |
| Chicago, IL (Lakefront Millennium Parking Facilities), MBIA, | | | | | | |
| 0% to 2006, 5.7% to 2025 | | | 2,355,000 | | | 2,580,444 |
| Chicago, IL, FGIC, 6.125%, 2020(c) | | | 3,785,000 | | | 4,209,941 |
| Chicago, IL, RITES, AMBAC, 8.353%, 2018(r)(v) | | | 5,900,000 | | | 7,365,088 |
| Commonwealth of Massachusetts, ETM, 6.5%, 2008(c) | | | 6,300,000 | | | 6,689,655 |
| Commonwealth of Massachusetts, FGIC, ETM, 7%, 2009(c) | | | 7,000,000 | | | 7,497,280 |
| Commonwealth of Massachusetts, ROLS, 7.609%, 2011(r)(c)(v) | | | 2,870,000 | | | 3,353,825 |
| Commonwealth of Puerto Rico, ROLS, XLCA, 7.803%, 2017(r)(v) | | | 1,150,000 | | | 1,479,705 |
| Cranston, RI, FGIC, 6.375%, 2009(c) | | | 830,000 | | | 920,611 |
| Delaware County, OH, 6.25%, 2010(c) | | | 1,000,000 | | | 1,126,740 |
| Detroit/Wayne County, MI, Stadium Authority, FGIC, 5.5%, 2017 | | | 6,000,000 | | | 6,223,860 |
| Houston County, AL, AMBAC, 6.25%, 2009(c) | | | 3,315,000 | | | 3,685,286 |
| Interlocken Metropolitan District, CO, Improvement, ‘‘C’’, XLCA, | | | | | | |
| 0%, 2027 | | | 1,860,000 | | | 549,537 |
| New York City, NY, ‘‘J’’, 5%, 2030 | | | 1,180,000 | | | 1,229,454 |
| New York City, NY, ‘‘B’’, 7.5%, 2007 | | | 955,000 | | | 957,101 |
| New York City, NY, FGIC, 5.75%, 2007(c) | | | 8,500,000 | | | 8,902,730 |
| New York City, NY, Urban Development Corp., 5.5%, 2016 | | | 14,690,000 | | | 15,078,991 |
|
| | | | SEMIANNUAL REPORT 5 |
| Portfolio of Investments (unaudited) – continued | | | | | | |
Issuer | | | Shares/Par | | | Value ($) |
|
| Municipal Bonds - continued | | | | | | |
|
| General Obligations - General Purpose - continued | | | | | | |
|
| Pittsfield, MA, MBIA, 5.5%, 2017 | | $ | 100,000 | | $ | 109,876 |
| San Antonio, TX, 5%, 2020 | | | 2,990,000 | | | 3,097,162 |
| Schaumburg, IL, ‘‘B’’, FGIC, 5.25%, 2034 | | | 2,000,000 | | | 2,141,640 |
| Southlake, TX, AMBAC, 0%, 2009(c) | | | 3,150,000 | | | 1,291,343 |
| Southlake, TX, AMBAC, 0%, 2009(c) | | | 1,835,000 | | | 922,308 |
| State of California, 5.5%, 2013 | | | 5,000,000 | | | 5,519,750 |
| State of California, 5.1%, 2034 | | | 5,000,000 | | | 5,097,200 |
| State of California, RITES, 8.255%, 2012(r)(v) | | | 5,825,000 | | | 6,684,304 |
| State of California, RITES, XLCA, 8.838%, 2017(r)(v) | | | 6,875,000 | | | 8,168,187 |
| State of Illinois, MBIA, 5.5%, 2025 | | | 390,000 | | | 412,250 |
| State of Washington, 6.75%, 2010 | | | 3,880,000 | | | 4,328,024 |
| State of Washington, 6%, 2012 | | | 4,360,000 | | | 4,903,910 |
| |
|
| | | | | | $ | 117,572,569 |
|
| General Obligations - Improvement - 2.9% | | | | | | |
|
| Birmingham, AL, ‘‘B’’, 5.75%, 2009(c) | | $ | 910,000 | | $ | 981,526 |
| Birmingham, AL, ‘‘B’’, 5.75%, 2019 | | | 90,000 | | | 96,901 |
| District of Columbia, MBIA, 6.5%, 2010 | | | 3,095,000 | | | 3,442,569 |
| District of Columbia, MBIA, ETM, 6.5%, 2010(c) | | | 2,905,000 | | | 3,243,345 |
| Massachusetts Bay Transportation Authority, General | | | | | | |
| Transportation Systems, ‘‘A’’, XLCA, 7%, 2021 | | | 10,185,000 | | | 12,847,563 |
| Massachusetts Bay Transportation Authority, General | | | | | | |
| Transportation Systems, ‘‘C’’, XLCA, 6.1%, 2013 | | | 10,200,000 | | | 11,662,782 |
| |
|
| | | | | | $ | 32,274,686 |
|
| General Obligations - Schools - 8.9% | | | | | | |
|
| Chicago, IL, Board of Education, AMBAC, 5.4%, 2017 | | $ | 3,000,000 | | $ | 3,150,390 |
| Chicago, IL, Board of Education, MBIA, 6.25%, 2009 | | | 5,160,000 | | | 5,532,810 |
| Chicago, IL, Board of Education, MBIA, 6.25%, 2015 | | | 20,295,000 | | | 23,146,447 |
| Chicago, IL, Board of Education, RITES, FGIC, 7.83%, 2019(r)(v) | | | 5,000,000 | | | 6,288,500 |
| Clark County, NV, School District, ‘‘A’’, MBIA, 7%, 2010 | | | 4,000,000 | | | 4,518,840 |
| De Soto, TX, Independent School District, School Building, PSF, | | | | | | |
| 0%, 2031 | | | 1,345,000 | | | 370,749 |
| De Soto, TX, Independent School District, School Building, PSF, | | | | | | |
| 0%, 2034 | | | 1,015,000 | | | 236,688 |
| De Soto, TX, Independent School District, School Building, PSF, | | | | | | |
| 0%, 2036 | | | 1,350,000 | | | 282,758 |
| Ennis, TX, Independent School District Capital Appreciation, ‘‘N’’, | | | | | | |
| PSF, 0%, 2031 | | | 1,340,000 | | | 371,502 |
| Ennis, TX, Independent School District, Capital Appreciation, ‘‘N’’, | | | | | | |
| PSF, 0%, 2028 | | | 705,000 | | | 229,936 |
| Ennis, TX, Independent School District, Capital Appreciation, ‘‘N’’, | | | | | | |
| PSF, 0%, 2029 | | | 1,350,000 | | | 427,032 |
| Ferris, TX, Independent School District, PSF, 5.5%, 2034 | | | 2,360,000 | | | 2,560,860 |
| Florida Board of Education, Capital Outlay, 9.125%, 2014 | | | 1,735,000 | | | 2,149,752 |
| Florida Board of Education, Capital Outlay, ETM, | | | | | | |
| 9.125%, 2014(c) | | | 265,000 | | | 359,170 |
|
6 SEMIANNUAL REPORT | | | | | | |
| Portfolio of Investments (unaudited) – continued | | | | | | |
Issuer | | | Shares/Par | | | Value ($) |
|
| Municipal Bonds - continued | | | | | | |
|
| General Obligations - Schools - continued | | | | | | |
|
| Forsyth County, GA, School District, 6%, 2010(c) | | $ | 865,000 | | $ | 957,469 |
| Gilroy, CA, Unified School District, FGIC, 5%, 2027 | | | 1,000,000 | | | 1,054,370 |
| Grand Blanc, MI, Community Schools (School Building & Site), | | | | | | |
| FSA, 5%, 2028 | | | 1,000,000 | | | 1,054,740 |
| Highland Park, TX, Independent School District, 5.125%, 2009(c) | | | 2,525,000 | | | 2,643,347 |
| Kane Cook & Dupage Counties, IL, FSA, 6.375%, 2011(c) | | | 1,245,000 | | | 1,400,301 |
| Kane Cook & Dupage Counties, IL, FSA, 6.5%, 2011(c) | | | 1,345,000 | | | 1,520,173 |
| Knox County, KY, XLCA, 5.625%, 2035 | | | 1,150,000 | | | 1,277,708 |
| Lancaster, TX, Independent School District, Capital Appreciation, | | | | | | |
| FSA, 0%, 2026 | | | 1,765,000 | | | 589,069 |
| Lancaster, TX, Independent School District, Capital Appreciation, | | | | | | |
| FSA, 0%, 2027 | | | 1,570,000 | | | 491,551 |
| Lane County, OR, School District, 6.25%, 2010(c) | | | 1,000,000 | | | 1,103,420 |
| Lane County, OR, School District, 6.25%, 2010(c) | | | 1,150,000 | | | 1,268,933 |
| Leander, TX, Independent School District, Capital Appreciation, | | | | | | |
| Refunding, School Building, FGIC, 0%, 2026 | | | 3,280,000 | | | 1,156,561 |
| Leander, TX, Independent School District, Capital Appreciation, | | | | | | |
| Refunding, School Building, FGIC, 0%, 2031 | | | 3,320,000 | | | 866,553 |
| Leander, TX, Independent School District, PSF, 0%, 2018 | | | 4,885,000 | | | 2,456,569 |
| Lewisville, TX, Independent School District, PSF, 5%, 2018 | | | 8,500,000 | | | 8,868,645 |
| Manchester, NH, School Facilities Rev., MBIA, 5.5%, 2027 | | | 785,000 | | | 926,214 |
| Manchester, NH, School Facilities Rev., MBIA, 5.5%, 2028 | | | 785,000 | | | 927,744 |
| Marshall, MI, Public School District, 5.5%, 2011(c) | | | 500,000 | | | 545,830 |
| Rancho Santiago, CA, Community College District, Election of | | | | | | |
| 2002, MBIA, 5%, 2013(c) | | | 2,200,000 | | | 2,400,728 |
| Rockwall, TX, Independent School District, PSF, 0%, 2014 | | | 2,000,000 | | | 1,341,100 |
| San Marcos, TX, Independent School District, PSF, 5.625%, 2025 | | | 2,000,000 | | | 2,246,820 |
| San Marcos, TX, Independent School District, PSF, 5.625%, 2026 | | | 2,000,000 | | | 2,243,780 |
| San Rafael, CA, Elementary School District, Election of 1999, | | | | | | |
| MBIA, 5%, 2028 | | | 2,500,000 | | | 2,617,025 |
| Sunnyvale, TX, Independent School District, PSF, 5.25%, 2028 | | | 1,900,000 | | | 2,037,598 |
| Sunnyvale, TX, Independent School District, PSF, 5.25%, 2031 | | | 2,000,000 | | | 2,135,080 |
| Wylie, TX, Independent School District, PSF, 5.25%, 2029 | | | 3,955,000 | | | 4,210,414 |
| |
|
| | | | | | $ | 97,967,176 |
|
| Healthcare Revenue - Hospitals - 15.3% | | | | | | |
|
| Akron Bath Copley, OH, Hospital Rev. (Children’s Hospital), FSA, | | | | | | |
| 5.25%, 2025 | | $ | 1,000,000 | | $ | 1,069,090 |
| Baxter County, AR, Hospital Rev., 5.375%, 2014 | | | 1,000,000 | | | 1,037,160 |
| Baxter County, AR, Hospital Rev., 5.6%, 2021 | | | 1,750,000 | | | 1,816,762 |
| Colorado Health Facilities Authority Rev. (Portercare Adventist | | | | | | |
| Health Systems), 6.625%, 2011(c) | | | 1,250,000 | | | 1,451,300 |
| Denver, CO, Health & Hospital Authority Rev., 5.375%, 2028 | | | 2,440,000 | | | 2,459,935 |
| District of Columbia, Hospital Rev. (Medlantic Healthcare), MBIA, | | | | | | |
| ETM, 5.25%, 2019(c) | | | 6,750,000 | | | 6,929,483 |
|
| | | |
SEMIANNUAL REPORT 7 |
| Portfolio of Investments (unaudited) – continued | | | | | | | | |
Issuer | | | | Shares/Par | | | | Value ($) |
|
| Municipal Bonds - continued | | | | | | | | |
|
| Healthcare Revenue - Hospitals - continued | | | | | | | | |
|
| Elkhart County, IN, Hospital Authority Rev. (Elkhart General | | | | | | | | |
| Hospital, Inc.), 5.25%, 2018 | | $ | | 1,000,000 | | $ | | 1,037,950 |
| Elkhart County, IN, Hospital Authority Rev. (Elkhart General | | | | | | | | |
| Hospital, Inc.), 5.25%, 2020 | | | | 4,345,000 | | | | 4,445,456 |
| Florence County, SC, Hospital Rev. (McLeod Regional Medical | | | | | | | | |
| Center), ‘‘A’’, FSA, 5.25%, 2034 | | | | 5,000,000 | | | | 5,336,450 |
| Gainesville & Hall County, GA, Hospital Authority Rev. (Northeast | | | | | | | | |
| Georgia Health System, Inc.), 5.5%, 2031 | | | | 1,555,000 | | | | 1,617,495 |
| Gulfport, MS, Hospital Facilities Rev. (Memorial Hospital), | | | | | | | | |
| 5.75%, 2031 | | | | 1,500,000 | | | | 1,548,390 |
| Harris County, TX, Health Facilities Development Corp. ‘‘A’’ | | | | | | | | |
| (Texas Children’s Hospital), 5.375%, 2015 | | | | 4,300,000 | | | | 4,519,214 |
| Harris County, TX, Health Facilities Development Corp. Hospital | | | | | | | | |
| Rev. (Memorial Herman Healthcare), 6.375%, 2011(c) | | | | 2,000,000 | | | | 2,276,460 |
| Highlands County, FL, Health Facilities Authority Rev. | | | | | | | | |
| (Adventist/Sunbelt Hospital), 6%, 2031 | | | | 1,000,000 | | | | 1,086,560 |
| Huntsville, AL, Health Care Authority Rev., 5.625%, 2026 | | | | 2,595,000 | | | | 2,727,682 |
| Illinois Development Finance Authority Rev., ‘‘A’’ (Provena | | | | | | | | |
| Health), MBIA, 5.25%, 2012 | | | | 1,600,000 | | | | 1,663,504 |
| Illinois Educational Facilities Authority Rev. (Centegra Health | | | | | | | | |
| Systems), 5.25%, 2024 | | | | 5,500,000 | | | | 5,552,525 |
| Illinois Health Facilities Authority Rev. (Advocate Health Care | | | | | | | | |
| Network), 6.375%, 2010(c) | | | | 1,800,000 | | | | 2,020,716 |
| Illinois Health Facilities Authority Rev. (Condell Medical Center), | | | | | | | | |
| 6.35%, 2015 | | | | 6,500,000 | | | | 6,975,410 |
| Illinois Health Facilities Authority Rev. (Decatur Memorial | | | | | | | | |
| Hospital), 5.75%, 2024 | | | | 2,650,000 | | | | 2,782,368 |
| Illinois Health Facilities Authority Rev. (Passavant Memorial Area | | | | | | | | |
| Hospital Associates), 6%, 2024 | | | | 1,165,000 | | | | 1,263,116 |
| Illinois Health Facilities Authority Rev. (Riverside Health Systems), | | | | | | | | |
| 5.75%, 2022 | | | | 1,975,000 | | | | 2,054,869 |
| Illinois Health Facilities Authority Rev. (Sinai Health), FHA, | | | | | | | | |
| 5.15%, 2037 | | | | 2,400,000 | | | | 2,496,216 |
| Illinois Health Facilities Authority Rev., ‘‘A’’, (Advocate Health) | | | | | | | | |
| MBIA, 5.7%, 2011 | | | | 660,000 | | | | 690,683 |
| Indiana Health Facilities Financing Authority Hospital Rev. | | | | | | | | |
| (Deaconess Hospital) ‘‘A’’, AMBAC, 5.375%, 2034 | | | | 2,075,000 | | | | 2,224,566 |
| Indiana Health Facilities Financing Authority, Hospital Rev. | | | | | | | | |
| (Clarian Health), ‘‘A’’, 5%, 2039 | | | | 2,700,000 | | | | 2,725,218 |
| Iowa Finance Authority, Health Care Facilities Rev. (Genesis | | | | | | | | |
| Medical Center), 6.125%, 2016 | | | | 2,195,000 | | | | 2,374,002 |
| Kentucky Economic Development Finance Authority, Health | | | | | | | | |
| Systems Rev. (Norton Healthcare, Inc.), 6.5%, 2020 | | | | 4,750,000 | | | | 5,198,210 |
| Marion County, FL, Hospital District Rev. (Monroe Hospital), | | | | | | | | |
| 5.625%, 2019 | | | | 2,610,000 | | | | 2,737,003 |
| Marshall County, AL, Health Care ‘‘A’’, 5.75%, 2015 | | | | 1,000,000 | | | | 1,077,490 |
|
8 SEMIANNUAL REPORT | | | | | | | | |
| Portfolio of Investments (unaudited) – continued | | | | | | |
Issuer | | | | Shares/Par | | Value ($) |
|
| Municipal Bonds - continued | | | | | | |
|
| Healthcare Revenue - Hospitals - continued | | | | | | |
|
| Martin County, FL, Health Facilities (Martin Memorial Medical | | | | | | |
| Center) ‘‘B’’, 5.875%, 2032 | | $ | | 2,200,000 | $ | 2,338,930 |
| Maryland Health & Higher Educational Facilities Authority Rev. | | | | | | |
| (Medstar Health), 5.5%, 2033 | | | | 1,115,000 | | 1,160,804 |
| Maryland Health & Higher Educational Facilities Authority Rev. | | | | | | |
| (University of Maryland Medical System), 6.75%, 2010(c) | | | | 1,000,000 | | 1,132,840 |
| Massachusetts Health & Educational Facilities Authority Rev. | | | | | | |
| (Caritas Christi), 5.7%, 2015 | | | | 2,500,000 | | 2,614,950 |
| Massachusetts Health & Educational Facilities Authority Rev. | | | | | | |
| (Partners Healthcare Systems), 5.75%, 2021 | | | | 1,500,000 | | 1,649,775 |
| Michigan Hospital Finance Authority Rev., ‘‘A’’ (Crittenton), | | | | | | |
| 5.625%, 2027 | | | | 1,000,000 | | 1,069,450 |
| Michigan Hospital Finance Authority Rev. (Mercy Mount | | | | | | |
| Clemens), MBIA, 5.75%, 2017 | | | | 2,900,000 | | 3,112,570 |
| Michigan Hospital Finance Authority Rev. (Sisters of Mercy | | | | | | |
| Health System), MBIA, ETM, 5.375%, 2014(c) | | | | 515,000 | | 535,075 |
| Monroe County, PA, Hospital Authority Rev. (Pocono Medical | | | | | | |
| Center), 6%, 2043 | | | | 750,000 | | 799,028 |
| Montgomery, AL, Special Care Facilities, Financing Authority Rev. | | | | | | |
| (Baptist Health), ‘‘A-2’’, MBIA, 0% to 2007, 5% to 2014(c) | | | | 4,620,000 | | 4,601,520 |
| Montgomery, AL, Special Care Facilities, Financing Authority Rev. | | | | | | |
| (Baptist Health), ‘‘A-2’’, MBIA, 0% to 2007, 5% to 2014(c) | | | | 6,910,000 | | 6,882,360 |
| Mount Lebanon, PA, Hospital Authority Rev. (St. Clair Memorial | | | | | | |
| Hospital), 5.625%, 2032 | | | | 1,335,000 | | 1,403,312 |
| New Hampshire Health & Education Facilities Rev. (Exeter | | | | | | |
| Hospital), 6%, 2016 | | | | 1,000,000 | | 1,107,080 |
| North Central, TX, Health Facilities Development Corp. Rev. | | | | | | |
| (Texas Health Resources System), MBIA, 5%, 2017 | | | | 5,000,000 | | 5,169,850 |
| North Texas Health Facilities Development Corp. Rev. (United | | | | | | |
| Regional Health Care System, Inc.), 6%, 2023 | | | | 4,000,000 | | 4,333,160 |
| Orange County, FL, Health Facilities Authority Hospital Rev. | | | | | | |
| (Adventist Health Systems), 5.625%, 2032 | | | | 1,490,000 | | 1,595,194 |
| Orange County, FL, Health Facilities Authority Hospital Rev. | | | | | | |
| (Orlando Regional Healthcare), 5.75%, 2012(c) | | | | 2,230,000 | | 2,499,094 |
| Peninsula Ports Authority, VA, Hospital Facility Rev. (Whittaker | | | | | | |
| Memorial), FHA, 8.7%, 2023 | | | | 1,540,000 | | 1,808,761 |
| Pennsylvania Higher Educational Facilities Authority, Health | | | | | | |
| Services Rev. (Allegheny Delaware Valley), MBIA, 5.3%, 2006 | | | | 1,975,000 | | 2,000,497 |
| Pennsylvania Higher Educational Facilities Authority, Health | | | | | | |
| Services Rev. (Allegheny Delaware Valley), MBIA, 5.875%, 2016 | | | | 5,000,000 | | 5,174,450 |
| Rhode Island Health & Education Building Corporation (Hospital | | | | | | |
| Financing Lifespan Obligations), ‘‘A’’, FSA, 5%, 2032 | | | | 3,945,000 | | 4,140,909 |
| Richland County, OH, Hospital Facilities Rev. (Medcentral Health | | | | | | |
| Systems), 6.375%, 2022 | | | | 1,000,000 | | 1,087,550 |
| Royston, GA, Hospital Authority Rev. (Ty Cobb Healthcare | | | | | | |
| Systems, Inc.), 6.7%, 2016 | | | | 770,000 | | 770,370 |
|
| | | | |
SEMIANNUAL REPORT 9 |
| Portfolio of Investments (unaudited) – continued | | | | | | |
Issuer | | | Shares/Par | | | Value ($) |
|
| Municipal Bonds - continued | | | | | | |
|
| Healthcare Revenue - Hospitals - continued | | | | | | |
|
| Shelby County, TN, Educational & Hospital Facilities Board | | | | | | |
| Hospital Rev. (Methodist Healthcare), 6.375%, 2012(c) | | $ | 1,255,000 | | $ | 1,446,450 |
| Shelby County, TN, Educational & Housing Facilities Board | | | | | | |
| Hospital Rev. (Methodist Healthcare), 6.375%, 2012(c) | | | 745,000 | | | 858,650 |
| South Carolina Jobs & Economic Development Authority Rev. | | | | | | |
| (Bon Secours Health Systems, Inc.), ‘‘A’’, 5.625%, 2030 | | | 2,055,000 | | | 2,145,009 |
| South Carolina Medical University, Hospital Facilities Rev., ‘‘A’’, | | | | | | |
| MBIA, 5%, 2031 | | | 970,000 | | | 1,011,371 |
| Steubenville, OH, Hospital Rev. (Trinity Hospital), 6.375%, 2020 | | | 1,200,000 | | | 1,323,900 |
| Tallahassee, FL, Health Facilities Rev. (Tallahassee Memorial | | | | | | |
| Healthcare), 6.25%, 2020 | | | 2,000,000 | | | 2,131,160 |
| Tarrant County, TX, Health Facilities Development Corp. (Texas | | | | | | |
| Health Resources), MBIA, 5.25%, 2018 | | | 8,605,000 | | | 8,973,896 |
| West Shore Pennsylvania, Hospital Authority Rev. (Holy Spirit | | | | | | |
| Hospital), 6.2%, 2026 | | | 1,250,000 | | | 1,340,575 |
| Wichita, KS, Hospital Authority Rev. (Via Christi Health System), | | | | | | |
| 6.25%, 2019 | | | 1,595,000 | | | 1,781,998 |
| Wichita, KS, Hospital Authority Rev. (Via Christi Health System), | | | | | | |
| 6.25%, 2020 | | | 2,465,000 | | | 2,747,341 |
| Wisconsin Health & Educational Facilities Authority Rev. | | | | | | |
| (Agnesian Healthcare, Inc.), 6%, 2017 | | | 520,000 | | | 557,055 |
| Wisconsin Health & Educational Facilities Authority Rev. | | | | | | |
| (Agnesian Healthcare, Inc.), 6%, 2021 | | | 650,000 | | | 689,052 |
| Wisconsin Health & Educational Facilities Authority Rev. (Aurora | | | | | | |
| Health Care, Inc.), 6.875%, 2030 | | | 2,000,000 | | | 2,304,800 |
| Wisconsin Health & Educational Facilities Authority Rev. | | | | | | |
| (Wheaton Franciscan Services), 5.75%, 2025 | | | 3,000,000 | | | 3,198,990 |
| |
|
| | | | | | $ | 168,693,059 |
|
| Healthcare Revenue - Long Term Care - 0.2% | | | | | | |
|
| Bell County, TX, Health Facilities Development Corp. Rev. | | | | | | |
| (Buckner Retirement Facility), 5.25%, 2019 | | $ | 2,500,000 | | $ | 2,551,925 |
|
| Industrial Revenue - Chemicals - 0.3% | | | | | | |
|
| Brazos River, TX, Harbor Navigation District (Dow Chemical Co.), | | | | | | |
| 5.7%, 2033 | | $ | 3,500,000 | | $ | 3,756,060 |
|
| Industrial Revenue - Environmental Services - 0.5% | | | | | | |
|
| California Pollution Control Financing Authority, Solid Waste | | | | | | |
| Disposal Rev. (Waste Management, Inc.), ‘‘A-2’’, 5.4%, 2025 | | $ | 785,000 | | $ | 828,033 |
| California Pollution Control Financing Authority, Solid Waste | | | | | | |
| Disposal Rev. (Waste Management, Inc.), ‘‘B’’, 5%, 2027 | | | 920,000 | | | 931,794 |
| Colorado Housing & Finance Authority, Solid Waste Rev. | | | | | | |
| (Waste Management, Inc.), 5.7%, 2018 | | | 1,730,000 | | | 1,888,658 |
| Nevada Department of Business Rev. (Republic Services, Inc.), | | | | | | |
| 5.625%, 2026 | | | 1,500,000 | | | 1,610,580 |
| |
|
| | | | | | $ | 5,259,065 |
|
10 SEMIANNUAL REPORT | | | | | | |
| Portfolio of Investments (unaudited) – continued | | | | | | |
Issuer | | | Shares/Par | | | Value ($) |
|
| Municipal Bonds - continued | | | | | | |
|
| Industrial Revenue - Other - 1.4% | | | | | | |
|
| Corpus Christi, TX, Nueces County General Rev. (Union Pacific | | | | | | |
| Corp.), 5.35%, 2010 | | $ | 670,000 | | $ | 678,616 |
| Indianapolis, IN, Local Public Improvement, (Airport Authority | | | | | | |
| Project), ‘‘I’’, MBIA, 5%, 2034 | | | 700,000 | | | 715,491 |
| Massachusetts Development Finance Agency, Resource Recovery | | | | | | |
| Rev. (Flour Corp.), 5.625%, 2019 | | | 8,650,000 | | | 9,092,448 |
| Memphis - Shelby County, TN (FedEx Corp.), 5.05%, 2012 | | | 1,400,000 | | | 1,475,152 |
| Tooele County, UT, Hazardous Waste Treatment Rev. (Union | | | | | | |
| Pacific Corp.), 5.7%, 2026 | | | 3,640,000 | | | 3,816,067 |
| |
|
| | | | | | $ | 15,777,774 |
|
| Industrial Revenue - Paper - 0.6% | | | | | | |
|
| Delta County, MI, Economic Development Corp., Environmental | | | | | | |
| Improvements Rev. (Mead Westvaco Escanaba), ‘‘A’’, | | | | | | |
| 6.25%, 2012(c) | | $ | 1,500,000 | | $ | 1,714,650 |
| Georgetown County, SC, Environmental Improvement | | | | | | |
| (International Paper Co.), 5.7%, 2014 | | | 1,400,000 | | | 1,502,872 |
| Jay, ME, Solid Waste Disposal Rev., ‘‘A’’ (International Paper | | | | | | |
| Co.), 5.125%, 2018 | | | 1,500,000 | | | 1,515,705 |
| Sabine River Authority Rev., Louisiana Water Facilities | | | | | | |
| (International Paper Co.), 6.2%, 2025 | | | 1,250,000 | | | 1,353,838 |
| |
|
| | | | | | $ | 6,087,065 |
|
| Miscellaneous Revenue - Other - 1.2% | | | | | | |
|
| Baltimore, MD, Convention Center Hotel Revenue, ‘‘A’’, XLCA, | | | | | | |
| 5.25%, 2039 | | $ | 1,945,000 | | $ | 2,092,936 |
| Gallery Certificate Trust, PA, Parking Rev., FSA, 4.5%, 2013(r) | | | 2,410,000 | | | 2,408,530 |
| Kentucky Property & Buildings Commission Rev., 5.9%, 2010(c) | | | 4,500,000 | | | 4,894,830 |
| Kentucky Property & Buildings Commission Rev., 5.85%, 2010(c) | | | 4,000,000 | | | 4,343,720 |
| |
|
| | | | | | $ | 13,740,016 |
|
| Multi-Family Housing Revenue - 0.8% | | | | | | |
|
| Bay County, FL, Housing Finance Authority, Multi-family Rev. | | | | | | |
| (Andrews Place II Apartments), FSA, 5%, 2035 | | $ | 395,000 | | $ | 401,004 |
| Bay County, FL, Housing Finance Authority, Multi-family Rev. | | | | | | |
| (Andrews Place II Apartments), FSA, 5.1%, 2046 | | | 995,000 | | | 1,010,054 |
| California Statewide Communities Development Authority Rev. | | | | | | |
| (Irvine Apartments), 5.25%, 2025 | | | 3,500,000 | | | 3,619,105 |
| Indianapolis, IN, Multi-Family Rev. (Cambridge Station | | | | | | |
| Apartments II), FNMA, 5.25%, 2039 | | | 1,145,000 | | | 1,172,285 |
| Newark, NJ, Housing Authority Port Authority (Newark Marine | | | | | | |
| Terminal), MBIA, 5.5%, 2028 | | | 785,000 | | | 863,979 |
| Seattle, WA, Housing Authority Rev., Capped Fund Program | | | | | | |
| (High Rise Rehab), ‘‘I’’, FSA, 5%, 2025 | | | 1,630,000 | | | 1,643,562 |
| |
|
| | | | | | $ | 8,709,989 |
|
| | | |
SEMIANNUAL REPORT 11 |
| Portfolio of Investments (unaudited) – continued | | | | | | |
| Issuer | | | Shares/Par | | | Value ($) |
|
| Municipal Bonds - continued | | | | | | |
|
| Parking - 0.1% | | | | | | |
|
| Rail Connections, Inc., MA Rev., 0%, 2009(c) | | $ | 375,000 | | $ | 232,260 |
| Rail Connections, Inc., MA Rev., 0%, 2009(c) | | | 450,000 | | | 260,789 |
| Rail Connections, Inc., MA Rev., 0%, 2009(c) | | | 975,000 | | | 528,343 |
| |
|
| | | | | | $ | 1,021,392 |
|
| Sales & Excise Tax Revenue - 2.7% | | | | | | |
|
| Illinois Sales Tax Rev., 0%, 2009 | | $ | 8,965,000 | | $ | 7,897,179 |
| Illinois Sales Tax Rev., 6.5%, 2022 | | | 5,000,000 | | | 6,110,250 |
| Massachusetts State School Building Authority, Sales Tax Rev., | | | | | | |
| ‘‘A’’, FSA, 5%, 2026 | | | 5,000,000 | | | 5,297,250 |
| Metropolitan Atlanta, GA, Rapid Transit Authority Rev., | | | | | | |
| 6.25%, 2018 | | | 4,580,000 | | | 5,326,952 |
| Metropolitan Pier & Expo, IL, McCormick Place Expansion, MBIA, | | | | | | |
| 5.25%, 2042 | | | 2,340,000 | | | 2,493,668 |
| Wyandotte County-Kansas City, KS, Sales Tax 2nd Lien Area B, | | | | | | |
| 5%, 2020 | | | 2,165,000 | | | 2,221,680 |
| |
|
| | | | | | $ | 29,346,979 |
|
| Single Family Housing - Local - 2.1% | | | | | | |
|
| Calcasieu Parish, LA, Public Trust Authority, Single Family | | | | | | |
| Mortgage Rev. ‘‘A’’, GNMA, 6.05%, 2032 | | $ | 1,890,000 | | $ | 2,019,276 |
| California Rural Home Mortgage Finance Authority Rev., GNMA, | | | | | | |
| 6.55%, 2030 | | | 475,000 | | | 483,407 |
| California Rural Home Mortgage Finance Authority Rev., GNMA, | | | | | | |
| 7.3%, 2031 | | | 70,000 | | | 71,831 |
| Chicago, IL, Single Family Mortgage Rev., ‘‘B’’, GNMA, 6%, 2033 | | | 695,000 | | | 715,877 |
| Chicago, IL, Single Family Mortgage Rev., ‘‘C’’, GNMA, | | | | | | |
| 7.05%, 2030 | | | 50,000 | | | 49,986 |
| Chicago, IL, Single Family Mortgage Rev., ‘‘C’’, GNMA, 7%, 2032 | | | 85,000 | | | 88,187 |
| Denver, CO, Single Family Mortgage Rev., GNMA, 7.3%, 2031 | | | 95,000 | | | 97,093 |
| Escambia County, FL, Single Family Housing Rev., GNMA, | | | | | | |
| 6.95%, 2024 | | | 320,000 | | | 328,019 |
| Jefferson Parish, LA, Single Family Mortgage Rev., GNMA, | | | | | | |
| 6.625%, 2023 | | | 485,000 | | | 500,520 |
| Jefferson Parish, LA, Single Family Mortgage Rev., GNMA, | | | | | | |
| 7.5%, 2026 | | | 195,000 | | | 199,023 |
| Jefferson Parish, LA, Single Family Mortgage Rev., GNMA, | | | | | | |
| 6.75%, 2030 | | | 630,000 | | | 657,033 |
| Lee County, FL, Housing Finance Authority Rev., ‘‘A’’, GNMA, | | | | | | |
| 7%, 2031 | | | 105,000 | | | 106,362 |
| Lubbock, TX, Housing Finance Corp. Rev., GNMA, 6.1%, 2030 | | | 1,645,000 | | | 1,701,078 |
| Manatee County, FL, Housing Finance Mortgage Rev., Single | | | | | | |
| Family, Subordinated Series 3, GNMA, 6.5%, 2023 | | | 150,000 | | | 155,934 |
| Manatee County, FL, Housing Finance Mortgage Rev., Single | | | | | | |
| Family, Subordinated Series 3, GNMA, 5.3%, 2028 | | | 785,000 | | | 797,764 |
| Manatee County, FL, Housing Finance Mortgage Rev., Single | | | | | | |
| Family, Subordinated Series 3, GNMA, 5.4%, 2029 | | | 280,000 | | | 289,181 |
| Maricopa County, AZ, Single Family Mortgage Rev. ‘‘B’’, GNMA, | | | | | | |
| 6.2%, 2034 | | | 310,000 | | | 317,254 |
|
12 SEMIANNUAL REPORT | | | | | | |
| Portfolio of Investments (unaudited) – continued | | | | | | |
Issuer | | | Shares/Par | | | Value ($) |
|
| Municipal Bonds - continued | | | | | | |
|
| Single Family Housing - Local - continued | | | | | | |
|
| Pima County, AZ, Industrial Development Authority Rev., ‘‘B-1’’, | | | | | | |
| GNMA, 7.05%, 2030 | | $ | 455,000 | | $ | 465,342 |
| Sedgwick & Shawnee Counties, KS, Single Family Housing Rev., | | | | | | |
| ‘‘A’’, GNMA, 6.45%, 2029 | | | 405,000 | | | 417,596 |
| Sedgwick & Shawnee Counties, KS, Single Family Housing Rev., | | | | | | |
| ‘‘A’’, GNMA, 5.8%, 2036 | | | 2,255,000 | | | 2,466,451 |
| Sedgwick & Shawnee Counties, KS, Single Family Housing Rev., | | | | | | |
| ‘‘A-1’’, GNMA, 6.875%, 2026 | | | 410,000 | | | 413,284 |
| Sedgwick & Shawnee Counties, KS, Single Family Housing Rev., | | | | | | |
| ‘‘A-1’’, GNMA, 5.75%, 2037 | | | 670,000 | | | 723,292 |
| Sedgwick & Shawnee Counties, KS, Single Family Housing Rev., | | | | | | |
| ‘‘A-3’’, GNMA, 6%, 2035 | | | 1,510,000 | | | 1,643,741 |
| Sedgwick & Shawnee Counties, KS, Single Family Housing Rev., | | | | | | |
| ‘‘A-5’’, GNMA, 5.8%, 2027 | | | 1,135,000 | | | 1,211,306 |
| Sedgwick & Shawnee Counties, KS, Single Family Housing Rev., | | | | | | |
| ‘‘A-5’’, GNMA, 5.7%, 2036 | | | 2,345,000 | | | 2,543,106 |
| Sedgwick & Shawnee Counties, KS, Single Family Housing Rev., | | | | | | |
| ‘‘A-5’’, GNMA, 5.9%, 2037 | | | 510,000 | | | 557,501 |
| Sedgwick & Shawnee Counties, KS, Single Family Housing Rev., | | | | | | |
| ‘‘A-6’’, GNMA, 5.65%, 2036 | | | 1,680,000 | | | 1,813,627 |
| Sedgwick & Shawnee Counties, KS, Single Family Housing Rev., | | | | | | |
| ‘‘B’’, GNMA, 5.45%, 2027 | | | 1,310,000 | | | 1,391,679 |
| Sedgwick & Shawnee Counties, KS, Single Family Housing Rev., | | | | | | |
| ‘‘B-2’’, GNMA, 6.45%, 2033 | | | 1,160,000 | | | 1,206,551 |
| |
|
| | | | | | $ | 23,431,301 |
|
| Single Family Housing - State - 3.3% | | | | | | |
|
| Arkansas Finance Authority, Mortgage Backed Securities | | | | | | |
| Program, ‘‘B’’, GNMA, 4.45%, 2034 | | $ | 1,270,000 | | $ | 1,272,552 |
| California Housing Finance Agency Rev., Home Mortgage, FSA, | | | | | | |
| 0%, 2019 | | | 11,845,000 | | | 5,224,711 |
| California Housing Finance Agency Rev., Home Mortgage, MBIA, | | | | | | |
| 0%, 2028 | | | 1,740,000 | | | 553,250 |
| Colorado Housing & Finance Authority Rev., 6.05%, 2016 | | | 325,000 | | | 337,825 |
| Colorado Housing & Finance Authority Rev., 7.45%, 2016 | | | 170,000 | | | 173,165 |
| Colorado Housing & Finance Authority Rev., 6.8%, 2030 | | | 365,000 | | | 376,362 |
| Colorado Housing & Finance Authority Rev., 7.25%, 2031 | | | 335,000 | | | 348,192 |
| Colorado Housing & Finance Authority Rev., ‘‘A-1’’, 7.4%, 2027 | | | 80,000 | | | 80,430 |
| Colorado Housing & Finance Authority Rev., ‘‘A-2’’, 7.15%, 2014 | | | 24,000 | | | 24,047 |
| Colorado Housing & Finance Authority Rev., ‘‘A-2’’, AMBAC, | | | | | | |
| 6.6%, 2028 | | | 1,065,000 | | | 1,108,803 |
| Colorado Housing & Finance Authority Rev., ‘‘B-3’’, 6.55%, 2025 | | | 129,000 | | | 131,039 |
| Colorado Housing & Finance Authority Rev., ‘‘C’’, 6.75%, 2021 | | | 180,000 | | | 182,709 |
| Colorado Housing & Finance Authority Rev., ‘‘C-2’’, 8.4%, 2021 | | | 140,000 | | | 145,447 |
| Colorado Housing & Finance Authority Rev., ‘‘C-2’’, 5.9%, 2023 | | | 645,000 | | | 674,580 |
| Colorado Housing & Finance Authority Rev., ‘‘C-2’’, FHA, | | | | | | |
| 6.6%, 2032 | | | 570,000 | | | 591,130 |
|
| | | |
SEMIANNUAL REPORT 13 |
| Portfolio of Investments (unaudited) – continued | | | | | | |
Issuer | | | Shares/Par | | | Value ($) |
|
| Municipal Bonds - continued | | | | | | |
|
| Single Family Housing - State - continued | | | | | | |
|
| Louisiana Housing Finance Agency, Single Family Mortgage Rev., | | | | | | |
| ‘‘B-2’’, GNMA, 7.55%, 2031 | | $ | 495,000 | | $ | 513,082 |
| Louisiana Housing Finance Agency, Single Family Mortgage Rev., | | | | | | |
| GNMA, 6.4%, 2032 | | | 575,000 | | | 591,457 |
| Louisiana Housing Finance Agency, Single Family Mortgage Rev., | | | | | | |
| GNMA, 6.375%, 2033 | | | 915,000 | | | 945,524 |
| Minnesota Housing Finance Agency Rev., Residential Housing | | | | | | |
| Finance, ‘‘B’’, 4.8%, 2023 | | | 1,085,000 | | | 1,093,550 |
| Mississippi Home Corp. Rev., Single Family Rev., ‘‘A’’, GNMA, | | | | | | |
| 6.1%, 2034 | | | 2,970,000 | | | 3,122,896 |
| Mississippi Home Corp. Rev., Single Family Rev., ‘‘F’’, GNMA, | | | | | | |
| 7.55%, 2027 | | | 251,000 | | | 256,271 |
| Missouri State Housing Development Commission, Single Family | | | | | | |
| Mortgage Rev. (Home Loan Program), ‘‘B’’, GNMA, 6.7%, 2030 | | | 885,000 | | | 919,825 |
| Missouri State Housing Development Commission, Single Family | | | | | | |
| Mortgage Rev. (Home Loan Program), GNMA, 7.45%, 2031 | | | 140,000 | | | 142,187 |
| Missouri State Housing Development Commission, Single Family | | | | | | |
| Mortgage Rev. (Home Loan Program), GNMA, 6.85%, 2032 | | | 310,000 | | | 321,895 |
| Missouri State Housing Development Commission, Single Family | | | | | | |
| Mortgage Rev. (Home Loan Program), GNMA, 6.75%, 2034 | | | 380,000 | | | 387,535 |
| New Hampshire Housing Finance Authority Rev., 6.85%, 2030 | | | 735,000 | | | 737,617 |
| New Hampshire Housing Finance Authority Rev., ‘‘B’’, | | | | | | |
| 5.875%, 2030 | | | 385,000 | | | 388,889 |
| New Hampshire Housing Finance Authority Rev., ‘‘B’’, | | | | | | |
| 6.3%, 2031 | | | 305,000 | | | 309,584 |
| New Mexico Mortgage Finance Authority Rev., GNMA, | | | | | | |
| 6.8%, 2031 | | | 695,000 | | | 719,228 |
| New Mexico Mortgage Finance Authority Rev., ‘‘B-2’’, GNMA, | | | | | | |
| 6.35%, 2033 | | | 615,000 | | | 644,003 |
| New Mexico Mortgage Finance Authority Rev., GNMA, | | | | | | |
| 7.1%, 2030 | | | 245,000 | | | 249,403 |
| New Mexico Mortgage Finance Authority Rev., GNMA, | | | | | | |
| 6.25%, 2032 | | | 1,360,000 | | | 1,421,336 |
| New Mexico Mortgage Finance Authority, ‘‘N’’, GNMA, | | | | | | |
| 5.95%, 2037 | | | 1,560,000 | | | 1,698,325 |
| North Dakota Housing Finance Agency Rev., Housing Finance, | | | | | | |
| ‘‘A’’, 5%, 2033 | | | 1,330,000 | | | 1,338,539 |
| Ohio Housing Finance Agency Mortgage Rev., Residential | | | | | | |
| Mortgage Backed, ‘‘C’’, GNMA, 5.9%, 2035 | | | 1,520,000 | | | 1,598,614 |
| Oklahoma Housing Finance Agency Rev., 6.8%, 2016 | | | 205,000 | | | 213,167 |
| Texas Housing & Community Affairs, Residential Mortgage Rev., | | | | | | |
| GNMA, 7.1%, 2021 | | | 5,015,000 | | | 5,288,017 |
| Vermont Housing Finance Agency Rev., FSA, 4.95%, 2032 | | | 2,030,000 | | | 2,057,182 |
| Washington Housing Finance Commission Rev., Single Family | | | | | | |
| Housing, GNMA, 5%, 2023 | | | 615,000 | | | 622,909 |
| |
|
| | | | | | $ | 36,805,277 |
|
14 SEMIANNUAL REPORT | | | | | | |
| Portfolio of Investments (unaudited) – continued | | | | | | |
Issuer | | | Shares/Par | | | Value ($) |
|
| Municipal Bonds - continued | | | | | | |
|
| Solid Waste Revenue - 0.4% | | | | | | |
|
| Central Wayne County, MI, Sanitation Rev., ‘‘VII’’, 4.75%, 2007 | | $ | 500,000 | | $ | 500,990 |
| Delaware County, PA, Industrial Development Authority, Resource | | | | | | |
| Recovery Facilities Rev. (American Ref-Fuel Co.), ‘‘A’’, | | | | | | |
| 6.2%, 2019 | | | 1,250,000 | | | 1,311,650 |
| Massachusetts Development Finance Agency Rev. (Ogden | | | | | | |
| Haverhill Associates), 6.7%, 2014 | | | 2,400,000 | | | 2,543,640 |
| |
|
| | | | | | $ | 4,356,280 |
|
| State & Agency - Other - 1.0% | | | | | | |
|
| New York Dormitory Authority Rev. (City University), | | | | | | |
| 5.75%, 2013 | | $ | 5,000,000 | | $ | 5,473,900 |
| Orange County, CA, California Recovery Certificates, MBIA, | | | | | | |
| 6%, 2006(c) | | | 5,000,000 | | | 5,144,700 |
| |
|
| | | | | | $ | 10,618,600 |
|
| State & Local Agencies - 8.7% | | | | | | |
|
| Alabama Building Renovation Authority, AMBAC, 6%, 2015 | | $ | 1,610,000 | | $ | 1,759,778 |
| Alabama Building Renovation Authority, AMBAC, 6%, 2016 | | | 1,705,000 | | | 1,863,616 |
| Delaware Valley, PA, Regional Finance Authority, RITES, AMBAC, | | | | | | |
| 8.282%, 2018 (v) | | | 16,250,000 | | | 19,969,300 |
| Fayette County, GA (Criminal Justice Center), 6.25%, 2010(c) | | | 1,000,000 | | | 1,115,320 |
| Golden State, CA, Tobacco Securitization Corp., Tobacco | | | | | | |
| Settlement Rev., ‘‘A’’, 5%, 2045 | | | 1,150,000 | | | 1,179,314 |
| Golden State, CA, Tobacco Securitization Corp., Tobacco | | | | | | |
| Settlement Rev., ‘‘A’’, FSA, 0% to 2010, 4.55% to 2022 | | | 3,415,000 | | | 2,839,709 |
| Golden State, CA, Tobacco Securitization Corp., Tobacco | | | | | | |
| Settlement Rev., ‘‘A-1’’, AMBAC, 0% to 2010, 4.6% to 2023 | | | 995,000 | | | 826,547 |
| Golden State, CA, Tobacco Securitization Corp., Tobacco | | | | | | |
| Settlement Rev., Enhanced, ‘‘B’’, 5.375%, 2010(c) | | | 4,000,000 | | | 4,289,960 |
| Golden State, CA, Tobacco Securitization Corp., Tobacco | | | | | | |
| Settlement Rev., Enhanced, ‘‘B’’, 5.5%, 2013(c) | | | 3,925,000 | | | 4,356,986 |
| New York Dormitory Authority Rev. ‘‘B’’, 6%, 2007 | | | 1,495,000 | | | 1,528,892 |
| New York Dormitory Authority Rev., Mental Health Services | | | | | | |
| Facilities, 5.75%, 2007(c) | | | 10,000 | | | 10,419 |
| New York Dormitory Authority Rev., Mental Health Services | | | | | | |
| Facilities, ETM, 6%, 2007(c) | | | 5,000 | | | 5,124 |
| Palm Springs, CA, Finance Lease Rev. (Convention Center), ‘‘A’’, | | | | | | |
| MBIA, 5.5%, 2035 | | | 7,000,000 | | | 7,790,160 |
| Pennsylvania Convention Center Authority Rev., FGIC, ETM, | | | | | | |
| 6.7%, 2016(c) | | | 26,195,000 | | | 30,617,240 |
| Philadelphia, PA, Municipal Authority, MBIA, 5.4%, 2017 | | | 5,000,000 | | | 5,188,000 |
| San Bernardino, CA, Joint Powers Financing Authority Lease Rev. | | | | | | |
| (California Department of Transportation), 5.5%, 2014 | | | 10,000,000 | | | 10,252,400 |
|
| | | |
SEMIANNUAL REPORT 15 |
| Portfolio of Investments (unaudited) – continued | | | | | | |
Issuer | | | Shares/Par | | | Value ($) |
|
| Municipal Bonds - continued | | | | | | |
|
| State & Local Agencies - continued | | | | | | |
|
| State of New York Dormitory Authority Rev., Supported Debt | | | | | | |
| (Mental Health), ‘‘A’’, 5.75%, 2010 | | $ | 605,000 | | $ | 629,133 |
| West Valley City, Utah Municipal Building Lease Rev., ‘‘A’’, | | | | | | |
| AMBAC, 5.5%, 2027 | | | 2,000,000 | | | 2,176,360 |
| |
|
| | | | | | $ | 96,398,258 |
|
| Student Loan Revenue - 0.5% | | | | | | |
|
| Arizona Student Loan Acquisition Authority Rev., 5.8%, 2016 | | $ | 2,500,000 | | $ | 2,664,900 |
| Arizona Student Loan Acquisition Authority Rev., 5.85%, 2017 | | | 2,800,000 | | | 2,985,444 |
| |
|
| | | | | | $ | 5,650,344 |
|
| Tax - Other - 1.0% | | | | | | |
|
| Illinois Dedicated Tax Rev. (Civic Center), AMBAC, 6.25%, 2011 | | $ | 3,640,000 | | $ | 3,979,830 |
| New Jersey Economic Development Authority Rev., Cigarette Tax, | | | | | | |
| 5.5%, 2024 | | | 910,000 | | | 959,140 |
| New Jersey Economic Development Authority Rev., Cigarette Tax, | | | | | | |
| 5.75%, 2029 | | | 1,640,000 | | | 1,761,836 |
| New Jersey Economic Development Authority Rev., Cigarette Tax, | | | | | | |
| 5.5%, 2031 | | | 730,000 | | | 769,230 |
| New Jersey Economic Development Authority Rev., Cigarette Tax, | | | | | | |
| 5.75%, 2034 | | | 1,095,000 | | | 1,168,584 |
| Virgin Islands Public Finance Authority Rev., ‘‘A’’, 5.5%, 2022 | | | 2,000,000 | | | 2,085,280 |
| |
|
| | | | | | $ | 10,723,900 |
|
| Tobacco - 1.6% | | | | | | |
|
| Badger, WI, Tobacco Asset Securitization Corp., 6.125%, 2027 | | $ | 2,105,000 | | $ | 2,232,478 |
| Children’s Trust Fund, Tobacco Settlement Rev., Puerto Rico, | | | | | | |
| ‘‘A’’, 0%, 2050 | | | 10,000,000 | | | 633,900 |
| District of Columbia, Tobacco Settlement, 6.25%, 2024 | | | 1,005,000 | | | 1,070,707 |
| Golden State, CA, Tobacco Securitization Corp., Tobacco | | | | | | |
| Settlement, ‘‘A-1’’, 6.25%, 2033 | | | 2,800,000 | | | 3,063,732 |
| Iowa Tobacco Settlement Authority, Tobacco Settlement Rev., | | | | | | |
| Asset Backed, ‘‘B’’, 5.3%, 2011(c) | | | 3,000,000 | | | 3,215,070 |
| Iowa Tobacco Settlement Authority, Tobacco Settlement Rev., | | | | | | |
| Asset Backed, ‘‘B’’, 0% to 2007, 5.6% to 2034 | | | 2,455,000 | | | 2,282,315 |
| Louisiana Tobacco Settlement Authority, 5.5%, 2030 | | | 1,235,000 | | | 1,288,673 |
| New Jersey Tobacco Settlement Authority, 5.75%, 2032 | | | 2,325,000 | | | 2,424,557 |
| South Carolina Tobacco Settlement Authority, 6.375%, 2028 | | | 1,500,000 | | | 1,605,855 |
| Washington Tobacco Settlement Authority, 6.5%, 2026 | | | 155,000 | | | 169,367 |
| |
|
| | | | | | $ | 17,986,654 |
|
| Toll Roads - 1.4% | | | | | | |
|
| E-470 Public Highway Authority Rev., Capital Appreciation ‘‘B’’, | | | | | | |
| MBIA, 0%, 2010(c) | | $ | 5,000,000 | | $ | 2,749,900 |
| Harris County, TX, Toll Road Subordinated Lien, 5%, 2024 | | | 3,860,000 | | | 3,934,421 |
| New Jersey Turnpike Authority Rev., RITES, MBIA, | | | | | | |
| 8.111%, 2020(r)(v) | | | 5,000,000 | | | 5,673,100 |
| Northwest Parkway Public Highway Authority Co. Rev., Capital | | | | | | |
| Appreciation ‘‘B’’, AMBAC, 0%, 2018 | | | 1,250,000 | | | 684,150 |
|
16 SEMIANNUAL REPORT | | | | | | |
| Portfolio of Investments (unaudited) – continued | | | | | | |
Issuer | | | Shares/Par | | | Value ($) |
|
| Municipal Bonds - continued | | | | | | |
|
| Toll Roads - continued | | | | | | |
|
| Northwest Parkway Public Highway Authority Co. Rev., Capital | | | | | | |
| Appreciation ‘‘B’’, AMBAC, 0%, 2019 | | $ | 2,000,000 | | $ | 1,026,120 |
| Northwest Parkway Public Highway Authority Co. Rev., Capital | | | | | | |
| Appreciation ‘‘C’’, FSA, 0% to 2011, 5.35% to 2016 | | | 1,000,000 | | | 862,030 |
| |
|
| | | | | | $ | 14,929,721 |
|
| Transportation - Special Tax - 3.5% | | | | | | |
|
| Jacksonville, FL, Transportation Authority, ETM, 9.2%, 2015(c) | | $ | 2,000,000 | | $ | 2,625,300 |
| Metropolitan, NY, Transportation Authority Rev., ‘‘A’’, FSA, | | | | | | |
| 5%, 2030 | | | 2,750,000 | | | 2,882,055 |
| Metropolitan, NY, Transportation Authority Rev., AMBAC, | | | | | | |
| 5%, 2030 | | | 5,000,000 | | | 5,217,150 |
| Metropolitan, NY, Transportation Authority Rev., ETM, | | | | | | |
| 5.75%, 2013(c) | | | 5,600,000 | | | 6,101,424 |
| New Jersey Economic Development Authority Rev., Transportation | | | | | | |
| Project Sublease ‘‘A’’, FSA, 6%, 2009(c) | | | 1,325,000 | | | 1,423,646 |
| New Jersey Transportation Trust Fund Authority Rev., ROLS, FSA, | | | | | | |
| 7.863%, 2011(r)(v) | | | 7,500,000 | | | 8,893,350 |
| New Jersey Transportation Trust Fund Authority Rev., | | | | | | |
| Transportation Systems ‘‘B’’, 5.25%, 2007(c) | | | 8,500,000 | | | 8,861,505 |
| New York Thruway Authority Service Contract Rev., 5.25%, 2013 | | | 2,420,000 | | | 2,516,485 |
| |
|
| | | | | | $ | 38,520,915 |
|
| Universities - Colleges - 5.2% | | | | | | |
|
| College of Charleston, SC, Academic & Administrative Facilities | | | | | | |
| Rev., ‘‘B’’, XLCA, 5.125%, 2034 | | $ | 2,400,000 | | $ | 2,543,904 |
| District of Columbia Rev. (Gonzaga College High School), FSA, | | | | | | |
| 5.25%, 2032 | | | 3,500,000 | | | 3,719,030 |
| Illinois Finance Authority Rev. (University of Chicago), ‘‘A’’, | | | | | | |
| 5%, 2034 | | | 785,000 | | | 821,958 |
| Los Angeles, CA, Community College ‘‘B’’, FSA, 5%, 2027 | | | 5,000,000 | | | 5,271,850 |
| Massachusetts Development Finance Agency Rev. (Boston | | | | | | |
| University), XLCA, 6%, 2059 | | | 4,975,000 | | | 6,081,092 |
| Massachusetts Development Finance Agency Rev. (Massachusetts | | | | | | |
| College of Pharmacy), 6.625%, 2010(c) | | | 350,000 | | | 392,175 |
| Massachusetts Health & Educational Facilities Authority Rev., | | | | | | |
| RITES (Harvard University), 9.815%, 2020(r)(v) | | | 8,410,000 | | | 12,597,844 |
| Ohio State University, 6%, 2009(c) | | | 500,000 | | | 547,685 |
| Rhode Island State Health & Educational Building Corp. (Lifespan | | | | | | |
| Obligated Group), 6.375%, 2021 | | | 270,000 | | | 302,065 |
| Rhode Island State Health & Educational Building Corp. (Lifespan | | | | | | |
| Obligated Group), 6.375%, 2012(c) | | | 1,730,000 | | | 1,992,285 |
| State of Oregon, Facilities Authority Rev. (Linfield College), ‘‘A’’, | | | | | | |
| 5%, 2030 | | | 605,000 | | | 622,612 |
| State of Rhode Island, Health & Educational Building Corp., | | | | | | |
| (Rhode Island School of Design), ‘‘D’’, XLCA, 5.5%, 2035 | | | 9,140,000 | | | 10,045,865 |
| Texas A&M University, Permanent University Fund, ‘‘A’’, | | | | | | |
| 0%, 2007 | | | 6,695,000 | | | 6,384,419 |
|
| | | |
SEMIANNUAL REPORT 17 |
| Portfolio of Investments (unaudited) – continued | | | | | | |
Issuer | | | Shares/Par | | | Value ($) |
|
| Municipal Bonds - continued | | | | | | |
|
| Universities - Colleges - continued | | | | | | |
|
| University of Akron, OH, General Receipts, FGIC, 6%, 2010(c) | | $ | 1,000,000 | | $ | 1,098,290 |
| University of Arkansas, University Rev. (UAMS Campus), ‘‘B’’, | | | | | | |
| MBIA, 5%, 2034 | | | 810,000 | | | 850,597 |
| University of Hawaii, University Systems Rev. ‘‘A’’, FGIC, | | | | | | |
| 5.5%, 2029 | | | 3,500,000 | | | 3,773,665 |
| University of New Mexico, MBIA, 5.75%, 2010(c) | | | 500,000 | | | 543,575 |
| |
|
| | | | | | $ | 57,588,911 |
|
| Universities - Dormitories - 0.1% | | | | | | |
|
| Georgia Private College & University Authority Rev. (Mercer | | | | | | |
| Housing Corp.), ‘‘A’’, 6%, 2021 | | $ | 1,000,000 | | $ | 1,066,020 |
|
| Universities - Secondary Schools - 0.7% | | | | | | |
|
| Clark County, NV, Economic Development Rev. (Alexander | | | | | | |
| Dawson School), 5.5%, 2020 | | $ | 6,000,000 | | $ | 6,307,380 |
| Maine Finance Authority (Waynflete School), 6.5%, 2024 | | | 1,500,000 | | | 1,619,535 |
| |
|
| | | | | | $ | 7,926,915 |
|
| Utilities - Investor Owned - 1.4% | | | | | | |
|
| Farmington, NM, Pollution Control Rev. (New Mexico Public | | | | | | |
| Service), 5.8%, 2022 | | $ | 4,880,000 | | $ | 4,933,094 |
| Lehigh County, PA, Industrial Development Authority Pollution | | | | | | |
| Control Rev. (PPL Electric Utility Corp.), ‘‘A’’, FGIC, 4.7%, 2029 | | | 1,180,000 | | | 1,206,054 |
| Michigan Strategic Fund, Limited Obligation Rev. (Detroit Edison), | | | | | | |
| MBIA, 7%, 2008 | | | 3,000,000 | | | 3,234,210 |
| New Hampshire Industrial Development Authority, Pollution | | | | | | |
| Control Rev. (Conneticut Light & Power), 5.9%, 2016 | | | 3,500,000 | | | 3,580,325 |
| New Hampshire Industrial Development Authority, Pollution | | | | | | |
| Control Rev. (Conneticut Light & Power), 5.9%, 2018 | | | 1,000,000 | | | 1,060,570 |
| Sabine River Authority, TX, Pollution (TXU Electric Co.), | | | | | | |
| 5.75%, 2030 | | | 1,500,000 | | | 1,608,315 |
| |
|
| | | | | | $ | 15,622,568 |
|
| Utilities - Municipal Owned - 18.5% | | | | | | |
|
| Austin, TX, Utility Systems Rev., AMBAC, 6.75%, 2012 | | $ | 2,500,000 | | $ | 2,932,450 |
| California Department of Water Resources Power Supply Rev., | | | | | | |
| ‘‘A’’, 5.75%, 2012(c) | | | 2,750,000 | | | 3,109,040 |
| Georgia Municipal Electric Authority Power Rev., AMBAC, | | | | | | |
| 6.5%, 2014(c) | | | 145,000 | | | 173,549 |
| Georgia Municipal Electric Authority Power Rev., AMBAC, | | | | | | |
| 6.5%, 2017 | | | 8,000,000 | | | 9,574,160 |
| Georgia Municipal Electric Authority Power Rev., AMBAC, ETM, | | | | | | |
| 6.5%, 2017(c) | | | 365,000 | | | 436,898 |
| Hawaii State Department Budget & Finance Rev., ‘‘B’’ (Electric | | | | | | |
| Co. & Subsidiary), XLCA, 5%, 2022 | | | 4,000,000 | | | 4,146,920 |
| Intermountain Power Agency, UT, ‘‘A’’, 6.15%, 2014 | | | 16,380,000 | | | 16,853,546 |
| Intermountain Power Agency, UT, ‘‘A’’, AMBAC, 6%, 2009(c) | | | 9,000,000 | | | 9,712,260 |
| Intermountain Power Agency, UT, ‘‘A’’, ETM, 6.15%, 2014(c) | | | 28,220,000 | | | 29,868,048 |
| Intermountain Power Agency, UT, ‘‘B’’, MBIA, 6%, 2016 | | | 10,000,000 | | | 10,279,300 |
|
18 SEMIANNUAL REPORT | | | | | | |
| Portfolio of Investments (unaudited) – continued | | | | | | |
Issuer | | | Shares/Par | | | Value ($) |
|
| Municipal Bonds - continued | | | | | | |
|
| Utilities - Municipal Owned - continued | | | | | | |
|
| Mercer County, ND, Pollution Control Rev. (Antelope Valley | | | | | | |
| Station), AMBAC, 7.2%, 2013 | | $ | 4,000,000 | | $ | 4,636,280 |
| North Carolina Eastern Municipal Power ‘‘A’’, MBIA, 5.7%, 2013 | | | 7,000,000 | | | 7,261,380 |
| North Carolina Eastern Municipal Power ‘‘A’’, MBIA, | | | | | | |
| 5.625%, 2014 | | | 7,735,000 | | | 8,019,184 |
| North Carolina Eastern Municipal Power ‘‘A’’, MBIA, 6.5%, 2018 | | | 9,250,000 | | | 11,362,515 |
| North Carolina Municipal Power Agency, Catawba Electric Rev., | | | | | | |
| 6.375%, 2013 | | | 1,500,000 | | | 1,645,905 |
| North Carolina Municipal Power Agency, Catawba Electric Rev., | | | | | | |
| ROLS, MBIA, 7.356%, 2019(r)(v) | | | 3,500,000 | | | 4,061,330 |
| Northern California Transmission Agency, MBIA, 7%, 2013 | | | 4,000,000 | | | 4,691,560 |
| Piedmont, SC, Municipal Power Agency, FGIC, 6.25%, 2021 | | | 4,150,000 | | | 5,138,987 |
| Puerto Rico Electric Power Authority, RITES, FSA, | | | | | | |
| 7.843%, 2015(r)(v) | | | 2,500,000 | | | 2,695,900 |
| Puerto Rico Electric Power Authority, RITES, FSA, | | | | | | |
| 7.843%, 2016(r)(v) | | | 3,000,000 | | | 3,235,080 |
| South Carolina Public Service Authority, ‘‘B’’, FSA, 5.125%, 2037 | | | 8,500,000 | | | 8,875,445 |
| Southern California Public Power Authority Rev. (Magnolia | | | | | | |
| Power), AMBAC, 5%, 2036 | | | 4,200,000 | | | 4,386,354 |
| Washington Public Power Supply System Rev. (Nuclear Project | | | | | | |
| #1), FSA, 5.125%, 2014 | | | 8,000,000 | | | 8,316,400 |
| Washington Public Power Supply System Rev. (Nuclear Project | | | | | | |
| #1), MBIA, 5.75%, 2010 | | | 13,100,000 | | | 13,453,045 |
| Washington Public Power Supply System Rev. (Nuclear Project | | | | | | |
| #1), MBIA, 5.75%, 2011 | | | 7,500,000 | | | 7,702,125 |
| Washington Public Power Supply System Rev. (Nuclear Project | | | | | | |
| #2), MBIA, 5.7%, 2012 | | | 15,000,000 | | | 15,401,850 |
| Washington Public Power Supply System Rev. (Nuclear Project | | | | | | |
| #3), 7.125%, 2016 | | | 5,145,000 | | | 6,493,968 |
| |
|
| | | | | | $ | 204,463,479 |
|
| Water & Sewer Utility Revenue - 1.2% | | | | | | |
|
| Augusta, GA, Water & Sewer Rev., FSA, 5.25%, 2039 | | $ | 3,910,000 | | $ | 4,197,189 |
| Forsyth County, GA, Water & Sewer Authority Rev., | | | | | | |
| 6.25%, 2010(c) | | | 1,000,000 | | | 1,111,100 |
| Forsyth County, GA, Water & Sewer Authority Rev., | | | | | | |
| 6.25%, 2010(c) | | | 1,055,000 | | | 1,172,211 |
| Narragansett, RI, Bay Commission Wastewater Systems Rev., | | | | | | |
| ‘‘A’’, MBIA, 5%, 2028 | | | 3,085,000 | | | 3,262,819 |
| Spartanburg, SC, Water & Sewer Authority Rev., ‘‘B’’, MBIA, | | | | | | |
| 5.25%, 2030 | | | 920,000 | | | 989,552 |
| West Virginia Water Development Authority Loan Program, ‘‘B’’, | | | | | | |
| AMBAC, 4.75%, 2035 | | | 390,000 | | | 397,242 |
| West Wilson Utility District, TN, Waterworks Rev., MBIA, | | | | | | |
| 5.25%, 2030 | | | 1,730,000 | | | 1,856,619 |
| |
|
| | | | | | $ | 12,986,732 |
|
| Total Municipal Bonds (Identified Cost, $1,007,623,949) | | | | | $1,091,252,668 |
|
| | | |
SEMIANNUAL REPORT 19 |
| Portfolio of Investments (unaudited) – continued | | | | | | |
Floating Rate Demand Notes - 0.2% | | | | | | |
|
| Issuer | | | Shares/Par | | | Value ($) |
|
| Allegheny County, PA, Hospital Development Authority Rev. | | | | | | |
| (Presbyterian University Hospital), ‘‘B’’, 3.22%, due 3/02/06 | | $ | 1,600,000 | | $ | 1,600,000 |
| Jefferson County, AL, Sewer Rev., Capital Improvement Warrants, | | | | | | |
| ‘‘A’’, 3.2%, due 3/02/06 | | | 250,000 | | | 250,000 |
|
| Total Floating Rate Demand Notes (Identified Cost, $1,850,000) | | | | | $ | 1,850,000 |
|
| Total Investments (Identified Cost, $1,009,473,949) | | | | | $1,093,102,668 |
|
| Other Assets, Less Liabilities - 1.0% | | | | | | 10,885,781 |
|
| Net Assets - 100.0% | | | | | $1,103,988,449 |
|
| Interest Rate Swaps | | | | | | | | | |
| | | | | Notional | | | | | | | |
| | | | | Principal | | | | Cash Flows | | Unrealized |
| | | | | Amount of | | Cash Flows Paid | | Received | | Appreciation |
| Expiration | | Currency | | Contract | | by the Fund | | by the Fund | | (Depreciation) |
| 12/01/2007 | | USD | | $27,000,000 | | Fixed - 3 Year | | Floating - 7 day | | $351,190 | |
| | | | | | | BMA Swap Index | | BMA Swap Index | | | |
| | | | | | | (2.795%) | | | | | |
| 6/06/2016 | | USD | | 15,000,000 | | Fixed - 10 Year | | Floating - 7 Day | | (183,558) | |
| | | | | | | BMA Swap Index | | BMA Swap Index | | | |
| | | | | | | (3.938%) | | | | | |
| 7/13/2016 | | USD | | 10,000,000 | | Fixed - 10 Year | | Floating - 7 Day | | 36,071 | |
| | | | | | | BMA Swap Index | | BMA Swap Index | | | |
| | | | | | | (3.742%) | | | | | |
| 8/29/2016 | | USD | | 20,000,000 | | Fixed - 10 Year | | Floating - 7 Day | | (205,919) | |
| | | | | | | BMA Swap Index | | BMA Swap Index | | | |
| | | | | | | (3.927%) | | | | | |
| 8/30/2016 | | USD | | 25,000,000 | | Fixed - 10 Year | | Floating - 7 Day | | (256,877) | |
| | | | | | | BMA Swap Index | | BMA Swap Index | | | |
| | | | | | | (3.927%) | | | | | |
| 8/02/2021 | | USD | | 5,000,000 | | Fixed - 15 Year | | Floating - 7 Day | | (58,241) | |
| | | | | | | BMA Swap Index | | BMA Swap Index | | | |
| | | | | | | (4.011%) | | | | | |
| |
| | | | | | | | | | | $(317,334) | |
| |
| At February 28, 2006, the fund had sufficient cash and/or securities to cover any commitments under these derivative contracts. | |
| | | | | | | | | | |
| |
20 SEMIANNUAL REPORT | | | | | | | | | |
Portfolio of Investments (unaudited) – continued
| (c) | Refunded bond. |
| (v) | Inverse floating rate security. |
| (r) | Restricted securities (excluding 144A issues) are not registered under the Securities Act of 1933 and are subject to legal or contractual restrictions on resale. These securities generally may be resold in transactions exempt from registreation or to the public if the securities are registered. Disposal of these securities may involve time-consuming negotiations and prompt sale at an acceptable price may be difficult. |
| | The fund holds the following restricted securities: |
| | | | | | | Current | | |
| | | Acquisition | | Acquisition | | Market | | Total % of |
| Restricted Securities | | Date | | Cost | | Value | | Net Assets |
| Chicago, IL, Board of Education, | | | | | | | | |
| RITES, FGIC, 7.83%, 2019 | | 2/09/2000 | | $3,984,600 | | $ 6,288,500 | | |
| Chicago, IL, O’Hare International | | | | | | | | |
| Airport Rev., RITES, FSA, 8.8%, 2022 | | 8/21/2003 | | 2,665,850 | | 3,005,150 | | |
| Chicago, IL, O’Hare International | | | | | | | | |
| Airport Rev., RITES, XLCA, 9.3%, 2029 | | 8/21/2003 | | 3,278,220 | | 3,684,120 | | |
| Chicago, IL, RITES, AMBAC, | | | | | | | | |
| 8.353%, 2018 | | 3/20/2000 | | 5,699,046 | | 7,365,088 | | |
| Commonwealth of Massachusetts, | | | | | | | | |
| ROLS, 7.609%, 2011 | | 8/28/2001 | | 3,194,941 | | 3,353,825 | | |
| Commonwealth of Puerto Rico, ROLS, | | | | | | | | |
| XLCA, 7.803%, 2017 | | 10/22/2001 | | 1,392,374 | | 1,479,705 | | |
| Denver, CO, City & County Airport | | | | | | | | |
| Rev., RITES, AMBAC, 8.51%, 2017 | | 8/28/2000 | | 2,683,700 | | 2,962,300 | | |
| Gallery Certificate Trust, PA, Parking | | | | | | | | |
| Rev., FSA, 4.5%, 2013 | | 12/17/2003 | | 2,412,102 | | 2,408,530 | | |
| Massachusetts Health & Educational | | | | | | | | |
| Facilities Authority Rev., RITES | | | | | | | | |
| (Harvard University), 9.815%, 2020 | | 11/08/1999 | | 9,595,810 | | 12,597,844 | | |
| New Jersey Transportation Trust Fund | | | | | | | | |
| Authority Rev., ROLS, FSA, | | | | | | | | |
| 7.863%, 2011 | | 1/07/2002 | | 8,749,200 | | 8,893,350 | | |
| New Jersey Turnpike Authority Rev., | | | | | | | | |
| RITES, MBIA, 8.111%, 2020 | | 4/19/2000 | | 4,637,900 | | 5,673,100 | | |
| North Carolina Municipal Power | | | | | | | | |
| Agency, Catawba Electric Rev., ROLS, | | | | | | | | |
| MBIA, 7.356%, 2019 | | 3/03/2003 | | 4,008,620 | | 4,061,330 | | |
| Puerto Rico Electric Power Authority, | | | | | | | | |
| RITES, FSA, 7.843%, 2015 | | 9/16/1999 | | 2,441,250 | | 2,695,900 | | |
| Puerto Rico Electric Power Authority, | | | | | | | | |
| RITES, FSA, 7.843%, 2016 | | 9/16/1999 | | 2,854,200 | | 3,235,080 | | |
| State of California, RITES, | | | | | | | | |
| 8.255%, 2012 | | 11/08/1999 | | 6,136,636 | | 6,684,304 | | |
| State of California, RITES, XLCA, | | | | | | | | |
| 8.838%, 2017 | | 1/03/2000 | | 7,003,975 | | 8,168,187 | | |
|
| Total Restricted Securities | | | | | | $82,556,313 | | 7.5% |
|
| | | | | | |
SEMIANNUAL REPORT 21 |
| Portfolio of Investments (unaudited) – continued | | |
| The following abbreviations are used in the Portfolio of Investments and are defined: |
| BMA | | Bond Market Assn. | | | | |
| ETM | | Escrowed to Maturity. | | | | |
| Insurers | | | | Inverse Floaters |
| AMBAC | | AMBAC Indemnity Corp. | | RITES | | Residual Interest Tax-Exempt Security |
| FGIC | | Financial Guaranty Insurance Co. | | ROLS | | Residual Options Longs |
| FHA | | Federal Housing Administration | | | | |
| FNMA | | Federal National Mortgage Assn. | | | | |
| FSA | | Financial Security Assurance, Inc. | | | | |
| GNMA | | Government National Mortgage Assn. | | | | |
| MBIA | | MBIA Insurance Corp. | | | | |
| PSF | | Permanent School Fund | | | | |
| XLCA | | XL Capital Insurance Co. | | | | |
See Notes to Financial Statements | | | | |
|
22 SEMIANNUAL REPORT | | | | |
| FINANCIAL STATEMENTS | Statement of Assets and Liabilities (unaudited) | |
This statement represents your fund’s balance sheet, which details the assets | |
| and liabilities composing the total value of the fund. | | | |
At 2/28/06 | | | |
Assets | | | |
|
| Investments, at value (identified cost, $1,009,473,949) | | $1,093,102,668 | |
| Cash | | 53,364 | |
| Receivable for investments sold | | 1,757,598 | |
| Receivable for fund shares sold | | 185,395 | |
| Interest receivable | | 13,373,546 | |
| Unrealized appreciation on interest rate swap agreements | | 575,923 | |
| Other assets | | 10,654 | |
|
| Total assets | | | $1,109,059,148 |
|
| Liabilities | | | |
|
| Distributions payable | | $1,717,004 | |
| Payable for investments purchased | | 1,008,346 | |
| Payable for fund shares reacquired | | 1,208,450 | |
| Unrealized depreciation on interest rate swap agreements | | 893,257 | |
| Payable to affiliates | | | |
| Management fee | | 1,378 | |
| Shareholder servicing costs | | 52,876 | |
| Distribution and service fees | | 5,967 | |
| Administrative services fee | | 271 | |
| Payable for independent trustees’ compensation | | 70,736 | |
| Accrued expenses and other liabilities | | 112,414 | |
|
| Total liabilities | | | $5,070,699 |
|
| Net assets | | | $1,103,988,449 |
|
| Net assets consist of: | | | |
|
| Paid-in capital | | $1,014,597,253 | |
| Unrealized appreciation (depreciation) on investments | | 83,311,385 | |
| Accumulated net realized gain (loss) on investments | | 6,306,960 | |
| Accumulated distributions in excess of net investment income | | (227,149) | |
|
| Net assets | | | $1,103,988,449 |
|
| Shares of beneficial interest outstanding | | | 104,369,073 |
|
| | |
SEMIANNUAL REPORT 23 |
| Statement of Assets and Liabilities (unaudited) – continued | | |
Class A shares | | |
|
| Net assets | $1,055,007,141 | |
| Shares outstanding | 99,733,789 | |
|
| Net asset value per share | | $10.58 |
|
| Offering price per share (100/95.25-net asset value per share) | | $11.11 |
|
| Class B shares | | |
|
| Net assets | $48,981,308 | |
| Shares outstanding | 4,635,284 | |
|
| Net asset value and offering price per share | | $10.57 |
|
| On sales of $100,000 or more, the offering price of Class A shares are reduced. A contingent deferred sales |
| charge may be imposed on redemptions of Class A and Class B shares. | | |
See Notes to Financial Statements | | |
|
24 SEMIANNUAL REPORT | | |
| FINANCIAL STATEMENTS | Statement of Operations (unaudited) | |
| This statement describes how much your fund earned in investment income and accrued in | |
| expenses. It also describes any gains and/or losses generated by fund operations. | |
Six months ended 2/28/06 | | | |
Net investment income | | | |
|
| Interest income | | | $30,239,846 |
|
| Expenses | | | |
| Management fee | | $2,224,004 | |
| Distribution and service fees | | 199,408 | |
| Shareholder servicing costs | | 690,021 | |
| Administrative services fee | | 55,391 | |
| Independent trustees’ compensation | | 19,894 | |
| Custodian fee | | 140,000 | |
| Shareholder communications | | 27,114 | |
| Auditing fees | | 23,249 | |
| Legal fees | | 13,251 | |
| Miscellaneous | | 93,654 | |
|
| Total expenses | | | $3,485,986 |
|
| Fees paid indirectly | | (39,814) | |
| Reduction of expenses by investment adviser | | (559,459) | |
|
| Net expenses | | | $2,886,713 |
|
| Net investment income | | | $27,353,133 |
|
| Realized and unrealized gain (loss) on investments | | | |
|
| Realized gain (loss) (identified cost basis) | | | |
| Investment transactions | | $2,520,382 | |
| Swap transactions | | 3,018,461 | |
|
| Net realized gain (loss) on investments | | | $5,538,843 |
|
| Change in unrealized appreciation (depreciation) | | | |
| Investments | | $(20,923,926) | |
| Swap transactions | | (660,688) | |
|
| Net unrealized gain (loss) on investments | | | $(21,584,614) |
|
| Net realized and unrealized gain (loss) on investments | | | $(16,045,771) |
|
| Change in net assets from operations | | | $11,307,362 |
|
| See Notes to Financial Statements | | | |
| |
| | |
SEMIANNUAL REPORT 25 |
| FINANCIAL STATEMENTS | Statements of Changes in Net Assets | | |
These statements describe the increases and/or decreases in net assets resulting | | |
| from operations, any distributions, and any shareholder transactions. | | |
| | | Six months ended | | Year ended |
| | | 2/28/06 | | 8/31/05 |
| | | (unaudited) | | |
| Change in net assets | | | | |
|
| From operations | | | | |
|
| Net investment income | | $27,353,133 | | $57,258,311 |
| Net realized gain (loss) on investments | | 5,538,843 | | 4,757,722 |
| Net unrealized gain (loss) on investments | | (21,584,614) | | (9,297,682) |
|
| Change in net assets from operations | | $11,307,362 | | $52,718,351 |
|
| Distributions declared to shareholders | | | | |
|
| From net investment income | | | | |
| Class A | | $(25,988,929) | | $(54,516,326) |
| Class B | | (1,065,996) | | (2,513,041) |
| From net realized gain on investments | | | | |
| Class A | | (4,372,166) | | — |
| Class B | | (211,792) | | — |
|
| Total distributions declared to shareholders | | $(31,638,883) | | $(57,029,367) |
|
| Change in net assets from fund share transactions | | $(28,691,005) | | $(56,942,049) |
|
| Redemption fees | | $— | | $43 |
|
| Total change in net assets | | $(49,022,526) | | $(61,253,022) |
|
| Net assets | | | | |
|
| At beginning of period | | 1,153,010,975 | | 1,214,263,997 |
| At end of period (including accumulated distributions in | | | | |
| excess of net investment income of $227,149 and | | | | |
| $525,357, respectively) | | $1,103,988,449 | | $1,153,010,975 |
|
| See Notes to Financial Statements | | | | |
|
26 SEMIANNUAL REPORT | | | | |
| FINANCIAL STATEMENTS | Financial Highlights | | | | | | |
The financial highlights table is intended to help you understand the fund’s financial performance for the |
| semiannual period and the past 5 fiscal years. Certain information reflects financial results for a single fund |
| share. The total returns in the table represent the rate by which an investor would have earned (or lost) on an |
| investment in the fund share class (assuming reinvestment of all distributions) held for the entire period. |
| | |
Six months | | | | | | | | | | |
| | | ended | | Years ended 8/31 |
| Class A | | 2/28/06 | | 2005 | | 2004 | | 2003 | | 2002 | | 2001 |
| | | (unaudited) | | | | | | | | | | |
| Net asset value, | | | | | | | | | | | | |
| beginning of period | | $10.77 | | $10.81 | | $10.64 | | $10.87 | | $10.77 | | $10.29 |
|
| Income (loss) from | | | | | | | | | | | | |
| investment operations | | | | | | | | | | | | |
|
| Net investment income (d) $0.26 | | $0.52 | | $0.53 | | $0.52 | | $0.53 | | $0.54 |
| Net realized and | | | | | | | | | | | | |
| unrealized gain (loss) | | | | | | | | | | | | |
| on investments | | (0.15) | | (0.04) | | 0.17 | | (0.22) | | 0.10 | | 0.48 |
|
| Total from investment | | | | | | | | | | | | |
| operations | | $0.11 | | $0.48 | | $0.70 | | $0.30 | | $0.63 | | $1.02 |
|
| Less distributions declared | | | | | | | | | | |
| to shareholders | | | | | | | | | | | | |
|
| From net investment | | | | | | | | | | | | |
| income | | $(0.26) | | $(0.52) | | $(0.53) | | $(0.53) | | $(0.53) | | $(0.54) |
| From net realized gain | | | | | | | | | | | | |
| on investments | | (0.04) | | — | | — | | — | | — | | — |
|
| Total distributions | | | | | | | | | | | | |
| declared to shareholders | | $(0.30) | | $(0.52) | | $(0.53) | | $(0.53) | | $(0.53) | | $(0.54) |
|
| Net asset value, | | | | | | | | | | | | |
| end of period | | $10.58 | | $10.77 | | $10.81 | | $10.64 | | $10.87 | | $10.77 |
|
| Total return (%) (t)(s)(r) | | 1.07 | (n) | 4.58 | | 6.70 | | 2.80 | | 6.17 | | 10.19 |
|
| Ratios (%) (to average net assets) | | | | | | | | | | |
| and Supplemental data: | | | | | | | | | | | | |
|
| Expenses before expense | | | | | | | | | | | | |
| reductions (f) | | 0.59 | (a) | 0.59 | | 0.58 | | 0.59 | | 0.59 | | 0.59 |
| Expenses after expense | | | | | | | | | | | | |
| reductions (f) | | 0.49 | (a) | 0.49 | | 0.53 | | 0.59 | | 0.59 | | 0.59 |
| Net investment income | | 4.96 | (a) | 4.87 | | 4.92 | | 4.76 | | 5.01 | | 5.16 |
| Portfolio turnover | | 3 | | 9 | | 9 | | 13 | | 14 | | 12 |
| Net assets at end of | | | | | | | | | | | | |
| period (000 Omitted) | | $1,055,007 | | $1,097,308 | | $1,147,174 | | $1,290,801 | | $1,308,191 | | $1,283,884 |
|
| See Notes to Financial Statements | | | | | | | | |
|
| | | | | | | | | | |
SEMIANNUAL REPORT 27 |
| Financial Highlights – continued | | | | | | | | | | | | |
| | | Six months | | | | | | | | | | |
| | | | | ended | | Years ended 8/31 |
| Class B | | 2/28/06 | | 2005 | | 2004 | | 2003 | | 2002 | | 2001 |
| | | (unaudited) | | | | | | | | | | |
| Net asset value, beginning of period | | $10.76 | | $10.80 | | $10.63 | | $10.86 | | $10.76 | | $10.28 |
|
| Income (loss) from | | | | | | | | | | | | |
| investment operations | | | | | | | | | | | | |
|
| | | Net investment income (d) | | $0.22 | | $0.44 | | $0.45 | | $0.43 | | $0.45 | | $0.46 |
| | | Net realized and unrealized gain (loss) | | | | | | | | | | | | |
| | | on investments | | (0.15) | | (0.04) | | 0.16 | | (0.22) | | 0.10 | | 0.48 |
|
| Total from investment operations | | $0.07 | | $0.40 | | $0.61 | | $0.21 | | $0.55 | | $0.94 |
|
| Less distributions declared | | | | | | | | | | | | |
| to shareholders | | | | | | | | | | | | |
|
| | | From net investment income | | $(0.22) | | $(0.44) | | $(0.44) | | $(0.44) | | $(0.45) | | $(0.46) |
| | | From net realized gain on investments | | (0.04) | | — | | — | | — | | — | | — |
|
| Total distributions declared to | | | | | | | | | | | | |
| shareholders | | $(0.26) | | $(0.44) | | $(0.44) | | $(0.44) | | $(0.45) | | $(0.46) |
|
| Net asset value, end of period | | $10.57 | | $10.76 | | $10.80 | | $10.63 | | $10.86 | | $10.76 |
|
| Total return (%) (t)(s)(r) | | 0.68 | (n) | 3.80 | | 5.86 | | 1.96 | | 5.33 | | 9.35 |
|
| Ratios (%) (to average net assets) | | | | | | | | | | | | |
| and Supplemental data: | | | | | | | | | | | | |
|
| Expenses before expense reductions (f) | | 1.36 | (a) | 1.36 | | 1.36 | | 1.39 | | 1.39 | | 1.38 |
| Expenses after expense reductions (f) | | 1.26 | (a) | 1.26 | | 1.31 | | 1.39 | | 1.39 | | 1.38 |
| Net investment income | | 4.18 | (a) | 4.10 | | 4.12 | | 3.96 | | 4.20 | | 4.37 |
| Portfolio turnover | | 3 | | 9 | | 9 | | 13 | | 14 | | 12 |
| Net assets at end of period | | | | | | | | | | | | |
| (000 Omitted) | | $48,981 | | $55,703 | | $66,927 | | $82,029 | | $83,990 | | $83,480 |
|
| Any redemption fees charged by the fund during the 2004 and 2005 fiscal years resulted in a per share |
| impact of less than $0.01. | | | | | | | | | | | | |
| (r) | | Certain expenses have been reduced without which performance would have been lower. | | |
| (a) | | Annualized. | | | | | | | | | | | | |
| (n) | | Not annualized. | | | | | | | | | | | | |
| (d) | | Per share data are based on average shares outstanding. | | | | | | | | |
| (f) | | Ratios do not reflect reductions from fees paid indirectly. | | | | | | | | |
| (t) | | Total returns do not include any applicable sales charges. | | | | | | | | |
| (s) | | From time to time the fund may receive proceeds from litigation settlements, without which performance |
| | | would be lower. | | | | | | | | | | | | |
See Notes to Financial Statements | | | | | | | | | | | | |
|
28 SEMIANNUAL REPORT | | | | | | | | | | | | |
NOTES TO FINANCIAL STATEMENTS (unaudited)
(1) Business and Organization
MFS Municipal Bond Fund (the fund) is a series of MFS Series Trust IV (the trust). The trust is organized as a Massachusetts business trust and is registered under the Investment Company Act of 1940, as amended, as an open-end management investment company.
(2) Significant Accounting Policies
General – The preparation of financial statements in conformity with U.S. generally accepted accounting principles requires management to make estimates and assumptions that affect the reported amounts of assets and liabilities, and disclosure of contingent assets and liabilities at the date of the financial statements and the reported amounts of revenues and expenses during the reporting period. Actual results could differ from those estimates. Municipal securities backed by current or anticipated revenues from a specific project or specific assets can be negatively affected by the discontinuance of the taxation supporting the projects or assets or the inability to collect revenues for the project or from the assets. If the Internal Revenue Service determines an issuer of a municipal security has not complied with applicable tax requirements, the security could decline in value, interest from the security could become taxable and the fund may be required to issue Forms 1099-DIV.
Investment Valuations – Debt instruments (other than short-term instruments), including restricted debt instruments, are generally valued at an evaluated bid price as reported by an independent pricing service. Values of debt instruments obtained from pricing services can utilize both dealer-supplied valuations and electronic data processing techniques which take into account factors such as institutional-size trading in similar groups of securities, yield, quality, coupon rate, maturity, type of issue, trading characteristics and other market data. Short-term instruments with a maturity at issuance of 365 days or less are generally valued at amortized cost, which approximates market value. Swaps are generally valued on the basis of quotations from brokers and dealers. Securities and other assets generally valued on the basis of information from an independent pricing service may also be valued on the basis of information from brokers and dealers. When pricing-service information or market quotations are not readily available, securities are priced at fair value as determined under the direction of the Board of Trustees.
Derivative Risk – The fund may invest in derivatives for hedging or non-hedging purposes. While hedging can reduce or eliminate losses, it can also reduce or eliminate gains. When the fund uses derivatives as an investment to gain market exposure, or for hedging purposes, gains and losses from derivative instruments may be substantially greater than the derivative’s original cost. Derivative instruments include swap agreements.
Swap Agreements – The fund may enter into swap agreements. A swap is an exchange of cash payments between the fund and another party. Net cash payments are exchanged at specified intervals and are recorded as a realized gain or loss in the Statement of Operations. The value of the swap is adjusted daily and the change in value is recorded as unrealized appreciation or
SEMIANNUAL REPORT 29
Notes to Financial Statements (unaudited) – continued
depreciation in the Statement of Operations. Risks may arise upon entering into these agreements from the potential inability of counterparties to meet the terms of their contract and from unanticipated changes in the value of the financial index on which the swap agreement is based.
Interest Rate Swap Agreements – Interest rate swap agreements are agreements to exchange cash flows periodically based on a notional principal amount, such as the exchange of fixed rate interest payments for floating rate interest payments, which are based on a specific financial index, or the exchange of two distinct floating rate payments. The net receivable or payable associated with these payments is accrued daily and recorded as an unrealized gain or loss, and any payments received or made are recorded as realized gains or losses, in the Statement of Operations. The primary risk associated with interest rate swap agreements is that unfavorable changes in the fluctuation of interest rates could adversely impact the fund.
Short Term Fees – For purchases made on or after July 1, 2004 and before April 1, 2005, the fund charged a 2% redemption fee (which was retained by the fund) on proceeds from Class A and Class B shares redeemed or exchanged within 5 business days following their acquisition (either by purchase or exchange). Effective April 1, 2005, the fund no longer charges a redemption fee. See the fund’s prospectus for details. Any redemption fees charged are accounted for as an addition to paid-in capital.
Investment Transactions and Income – Investment transactions are recorded on the trade date. Interest income is recorded on the accrual basis. All premium and discount is amortized or accreted for financial statement purposes in accordance with U.S. generally accepted accounting principles. All premium and original issue discount is amortized or accreted for tax reporting purposes as required by federal income tax regulations.
The fund may receive proceeds from litigation settlements involving its portfolio holdings. Any proceeds received are reflected in realized gain/loss in the Statement of Operations, or in unrealized gain/loss if the security is still held by the fund.
Fees Paid Indirectly – The fund’s custody fee is reduced according to an arrangement that measures the value of cash deposited with the custodian by the fund. This amount, for the six months ended February 28, 2006, is shown as a reduction of total expenses on the Statement of Operations.
Tax Matters and Distributions – The fund intends to continue to qualify as a regulated investment company, as defined under Subchapter M of the Internal Revenue Code, and to distribute all of its taxable and tax-exempt income, including realized capital gains. Accordingly, no provision for federal income tax is required in the financial statements.
Distributions to shareholders are recorded on the ex-dividend date. Income and capital gain distributions are determined in accordance with income tax regulations, which may differ from generally accepted accounting principles. Certain capital accounts in the financial statements are periodically adjusted
30 SEMIANNUAL REPORT
Notes to Financial Statements (unaudited) – continued
for permanent differences in order to reflect their tax character. These adjustments have no impact on net assets or net asset value per share. Temporary differences which arise from recognizing certain items of income, expense, gain or loss in different periods for financial statement and tax purposes will reverse at some time in the future. Distributions in excess of net investment income or net realized gains are temporary overdistributions for financial statement purposes resulting from differences in the recognition or classification of income for financial statement and tax purposes.
Book/tax differences primarily relate to amortization and accretion of debt securities, derivative transactions, and treating a portion of the proceeds from redemptions as a distribution for tax purposes.
The tax character of distributions declared to shareholders is as follows:
| | | August 31, 2005 | | August 31, 2004 |
| Tax-exempt income: | | $57,029,367 | | $63,189,015 |
The federal tax cost and the tax basis components of distributable earnings were as follows:
| As of February 28, 2006 | | |
| Cost of investments(1) | | $1,008,114,986 |
|
| Gross appreciation | | $85,656,805 |
| Gross depreciation | | (669,123) |
|
| Net unrealized appreciation (depreciation) | | $84,987,682 |
As of August 31, 2005 | | |
| Undistributed tax-exempt income | | $4,083,218 |
| Undistributed long-term capital gain | | 3,982,662 |
| Other temporary differences | | (4,237,715) |
| Net unrealized appreciation (depreciation) | | 105,894,552 |
(1) Aggregate cost includes prior fiscal year end tax adjustments.
Multiple Classes of Shares of Beneficial Interest – The fund offers multiple classes of shares, which differ in their respective distribution and service fees. All shareholders bear the common expenses of the fund based on the value of settled shares outstanding of each class, without distinction between share classes. Dividends are declared separately for each class. Differences in per share dividend rates are generally due to differences in separate class expenses. Class B shares will convert to Class A shares approximately eight years after purchase.
(3) Transactions with Affiliates
Investment Adviser – The fund has an investment advisory agreement with MFS to provide overall investment advisory and administrative services, and general office facilities.
SEMIANNUAL REPORT 31
Notes to Financial Statements (unaudited) – continued
The management fee is computed daily and paid monthly at the following annual rates:
| First $1.3 billion of average daily net assets | | 0.40% |
| Next $0.7 billion of average daily net assets | | 0.37% |
| Average daily net assets in excess of $2 billion | | 0.35% |
As part of a settlement agreement with the New York Attorney General concerning market timing and related matters, MFS has agreed to reduce the management fee to 0.30% of the fund’s average daily net assets for the period March 1, 2004 through February 28, 2009. For the six months ended February 28, 2006, this waiver amounted to $556,099 and is reflected as a reduction of total expenses in the Statement of Operations.
The management fee incurred for the six months ended February 28, 2006 was equivalent to an annual effective rate of 0.30% of the fund’s average daily net assets.
Distributor – MFS Fund Distributors, Inc. (MFD), a wholly owned subsidiary of MFS, as distributor, received $45,637 for the six months ended February 28, 2006, as its portion of the initial sales charge on sales of Class A shares of the fund.
The Board of Trustees has adopted a distribution plan for certain class shares pursuant to Rule 12b-1 of the Investment Company Act of 1940.
The fund’s distribution plan provides that the fund will pay MFD for services provided by MFD and financial intermediaries in connection with the distribution and servicing of certain share classes. One component of the plan is a distribution fee paid to MFD and another component of the plan is a service fee paid to MFD. MFD may subsequently pay all, or a portion, of the distribution and/or service fees to financial intermediaries.
Distribution Fee Plan Table:
| | | | | | | Total | | Annual | | Distribution |
| | | Distribution | | Service | | Distribution | | Effective | | and Service |
| | | Fee Rate | | Fee Rate | | Plan(1) | | Rate(2) | | Fee |
| Class B | | 0.75% | | 0.25% | | 1.00% | | 0.77% | | $199,408 |
| (1) | In accordance with the distribution plan for certain classes, the fund pays distribution and/or service fees up to these annual percentage rates of each class’ average daily net assets. |
| (2) | The annual effective rates represent actual fees incurred under the distribution plan for the six months ended February 28, 2006 based on each class’ average daily net assets. Except in the case of the 0.25% annual Class B service fee paid by the fund upon the sale of Class B shares in the first year, payment of the Class B service fee will not be implemented until such date as the fund’s Board of Trustees may determine. |
| |
Certain Class A shares are subject to a contingent deferred sales charge in the event of a shareholder redemption within 12 months of purchase. Class B shares are subject to a contingent deferred sales charge in the event of a shareholder redemption within six years of purchase. All contingent deferred sales charges are paid to MFD and during the six months ended February 28, 2006, were as follows:
32 SEMIANNUAL REPORT
Notes to Financial Statements (unaudited) – continued
| | | Amount |
| Class A | | $1,042 |
| Class B | | $36,467 |
Shareholder Servicing Agent – The fund pays a portion of shareholder servicing costs to MFS Service Center, Inc. (MFSC), a wholly-owned subsidiary of MFS. MFSC receives a fee from the fund, for its services as shareholder servicing agent, set periodically under the supervision of the fund’s Board of Trustees. For the six months ended February 28, 2006, the fee was $540,633, which equated to 0.0972% annually of the fund’s average daily net assets. MFSC also receives payment from the fund for out-of-pocket and sub-accounting expenses paid by MFSC on behalf of the fund. For the six months ended February 28, 2006, these costs amounted to $111,529.
Administrator – MFS provides certain financial, legal, shareholder communications, compliance, and other administrative services to certain funds for which MFS acts as investment adviser. Under an administrative services agreement, the funds may partially reimburse MFS the costs incurred to provide these services, subject to review and approval by the Board of Trustees. Each fund is charged a fixed amount plus a fee based on calendar year average net assets. Effective July 1, 2005, the fund’s annual fixed amount is $10,000.
The administrative services fee incurred for the six months ended February 28, 2006 was equivalent to an annual effective rate of 0.0100% of the fund’s average daily net assets.
Trustees’ and Officers’ Compensation – The fund pays compensation to Independent Trustees in the form of a retainer, attendance fees, and additional compensation to Board and Committee chairpersons. The fund does not pay compensation directly to Trustees who are officers of the investment adviser, or to officers of the fund, all of whom receive remuneration for their services to the fund from MFS. Certain officers and Trustees of the fund are officers or directors of MFS, MFD, and MFSC.
The fund has an unfunded, defined benefit plan for retired Independent Trustees which resulted in a pension expense of $3,975. This amount is included in Independent trustees’ compensation for the six months ended February 28, 2006. The deferred liability for retirement benefits payable to retired Trustees amounted to $65,380 at February 28, 2006, and is included in payable for independent trustees’ compensation.
Other – This fund and certain other MFS funds (the funds) have entered into a services agreement (the Agreement) which provides for payment of fees by the funds to Tarantino LLC in return for the provision of services of an Independent Chief Compliance Officer (ICCO) for the funds. The ICCO is an officer of the funds and the sole member of Tarantino LLC. The funds can terminate the Agreement with Tarantino LLC at any time under the terms of the Agreement. For the six months ended February 28, 2006, the fee paid to Tarantino LLC was $4,641. MFS has agreed to reimburse the fund for a portion of the payments made by the funds to Tarantino LLC in the amount
SEMIANNUAL REPORT 33
Notes to Financial Statements (unaudited) – continued
of $3,360, which is shown as a reduction of total expenses in the Statement of Operations. Additionally, MFS has agreed to bear all expenses associated with office space, other administrative support, and supplies provided to the ICCO.
(4) Portfolio Securities
Purchases and sales of investments, other than U.S. government securities, purchased option transactions, and short-term obligations, aggregated $33,386,810 and $54,394,402, respectively.
(5) Shares of Beneficial Interest
The fund’s Declaration of Trust permits the Trustees to issue an unlimited number of full and fractional shares of beneficial interest. Transactions in fund shares were as follows:
| | | Six months ended 2/28/06 | | Year ended 8/31/05 |
| | | Shares | | Amount | | Shares | | Amount |
| Shares sold | | | | | | | | |
| Class A | | 1,731,753 | | $18,355,000 | | 4,404,018 | | $47,463,563 |
| Class B | | 146,105 | | 1,546,503 | | 307,613 | | 3,311,915 |
|
| | | 1,877,858 | | $19,901,503 | | 4,711,631 | | $50,775,478 |
| Shares issued to shareholders in | | | | | | | | |
| reinvestment of distributions | | | | | | | | |
| Class A | | 1,798,484 | | $19,022,786 | | 3,322,645 | | $35,816,800 |
| Class B | | 72,789 | | 769,149 | | 150,778 | | 1,623,966 |
|
| | | 1,871,273 | | $19,791,935 | | 3,473,423 | | $37,440,766 |
| Shares reacquired | | | | | | | | |
| Class A | | (5,693,724) | | $(60,315,573) | | (11,994,507) | | $(129,215,384) |
| Class B | | (761,887) | | (8,068,870) | | (1,480,231) | | (15,942,909) |
|
| | | (6,455,611) | | $(68,384,443) | | (13,474,738) | | $(145,158,293) |
| Net change | | | | | | | | |
| Class A | | (2,163,487) | | $(22,937,787) | | (4,267,844) | | $(45,935,021) |
| Class B | | (542,993) | | (5,753,218) | | (1,021,840) | | (11,007,028) |
|
| | | (2,706,480) | | $(28,691,005) | | (5,289,684) | | $(56,942,049) |
(6) Line of Credit
The fund and other affiliated funds participate in a $1 billion unsecured line of credit provided by a syndication of banks under a credit agreement. Borrowings may be made for temporary financing needs. Interest is charged to each fund, based on its borrowings, at a rate equal to the Federal Reserve funds rate plus 0.35% . In addition, a commitment fee, based on the average daily, unused portion of the line of credit, is allocated among the participating funds at the end of each calendar quarter. The commitment fee allocated to the fund for the six months ended February 28, 2006 was $3,817, and is included in miscellaneous expense on the Statement of Operations. The fund had no significant borrowings during the six months ended February 28, 2006.
34 SEMIANNUAL REPORT
Notes to Financial Statements (unaudited) – continued
(7) Concentration of Credit Risk
At February 28, 2006, 58.01% of securities in the portfolio of investments are backed by letters of credit or bond insurance of various financial institutions and financial guaranty assurance agencies. The percentage of investments insured by or supported (backed) by a letter of credit from any one institution or agency did not exceed 20.46% of total investments.
SEMIANNUAL REPORT 35
BOARD REVIEW OF INVESTMENT ADVISORY AGREEMENT
A discussion regarding the Board’s most recent review and renewal of the Fund’s investment advisory agreement is available by clicking on the fund’s name under ‘‘Select a fund’’ on the MFS Web site (mfs.com).
PROXY VOTING POLICIES AND INFORMATION
A general description of the MFS funds’ proxy voting policies and procedures is available without charge, upon request, by calling 1-800-225-2606, by visiting the Proxy Voting section of mfs.com or by visiting the SEC’s Web site at http://www.sec.gov.
Information regarding how the fund voted proxies relating to portfolio securities during the most recent twelve-month period ended June 30 is available without charge by visiting the Proxy Voting section of mfs.com or by visiting the SEC’s Web site at http://www.sec.gov.
QUARTERLY PORTFOLIO DISCLOSURE
The trust will file a complete schedule of portfolio holdings with the Securities and Exchange Commission (the Commission) for the first and third quarters of each fiscal year on Form N-Q. The trust’s Form N-Q may be reviewed and copied at the:
Public Reference Room
Securities and Exchange Commission
Washington, D.C. 20549-0102
Information on the operation of the Public Reference Room may be obtained by calling the Commission at 1-800-SEC-0330. The trust’s Form N-Q is available on the EDGAR database on the Commission’s Internet Web site at http://www.sec.gov, and copies of this information may be obtained, upon payment of a duplicating fee, by electronic request at the following e-mail address: publicinfo@sec.gov or by writing the Public Reference Section at the above address.
A shareholder can also obtain the quarterly portfolio holdings report at mfs.com.
36 SEMIANNUAL REPORT
The Registrant has not amended any provision in its Code of Ethics (the “Code”) that relates to any element of the Code’s definition enumerated in paragraph (b) of Item 2 of this Form N-CSR.
ITEM 3. AUDIT COMMITTEE FINANCIAL EXPERT.
Not applicable for semi-annual reports.
|
ITEM 4. PRINCIPAL ACCOUNTANT FEES AND SERVICES.
Not applicable for semi-annual reports.
|
ITEM 5. AUDIT COMMITTEE OF LISTED REGISTRANTS.
Not applicable to the Registrant.
|
ITEM 6. SCHEDULE OF INVESTMENTS
A schedule of investments for each series of the Registrant is included as part of the report to shareholders of such series under Item 1 of this Form N-CSR.
ITEM 7. DISCLOSURE OF PROXY VOTING POLICIES AND PROCEDURES FOR CLOSED-END MANAGEMENT INVESTMENT COMPANIES.
Not applicable to the Registrant.
|
ITEM 8. PORTFOLIO MANAGERS OF CLOSED-END MANAGEMENT INVESTMENT COMPANIES.
Not applicable to the Registrant.
|
ITEM 9. PURCHASES OF EQUITY SECURITIES BY CLOSED-END MANAGEMENT INVESTMENT COMPANY AND AFFILIATED PURCHASERS.
Not applicable to the Registrant.
|
ITEM 10. SUBMISSION OF MATTERS TO A VOTE OF SECURITY HOLDERS.
There were no material changes to the procedures by which shareholders may send recommendations to the Board for nominees to the Registrant’s Board since the Registrant last provided disclosure as to such procedures in response to the requirements of Item 7(d)(2)(ii)(G) of Schedule 14A or this Item.
ITEM 11. CONTROLS AND PROCEDURES.
| (a) | Based upon their evaluation of the effectiveness of the registrant’s disclosure controls and procedures (as defined in Rule 30a-3(c) under the Investment Company Act of 1940 (the “Act”)) as conducted within 90 days of the filing date of this Form N-CSR, the registrant’s principal financial officer and principal executive officer have concluded that those disclosure controls and procedures provide reasonable assurance that the material information required to be disclosed by the registrant on this report is recorded, processed, summarized and reported within the time periods specified in the Securities and Exchange Commission’s rules and forms. |
| |
| (b) | There were no changes in the registrant’s internal controls over financial reporting (as defined in Rule 30a-3(d) under the Act) that occurred during the second fiscal quarter of the period covered by the report that have materially affected, or are reasonably likely to materially affect, the registrant’s internal control over financial reporting. |
| |
| (a) | File the exhibits listed below as part of this Form. Letter or number the exhibits in the sequence indicated. |
| |
| | (1) | Any code of ethics, or amendment thereto, that is the subject of the disclosure required by Item 2, to the extent that the registrant intends to satisfy the Item 2 requirements through filing of an exhibit. |
| |
| | (2) | A separate certification for each principal executive officer and principal financial officer of the registrant as required by Rule 30a-2 under the Act (17 CFR 270.30a-2): Attached hereto. |
| |
| (b) | If the report is filed under Section 13(a) or 15(d) of the Exchange Act, provide the certifications required by Rule 30a-2(b) under the Act (17 CFR 270.30a-2(b)), Rule 13a-14(b) or Rule 15d-14(b) under the Exchange Act (17 CFR 240.13a-14(b) or 240.15d-14(b)) and Section 1350 of Chapter 63 of Title 18 of the United States Code (18 U.S.C. 1350) as an exhibit. A certification furnished pursuant to this paragraph will not be deemed “filed” for the purposes of Section 18 of the Exchange Act (15 U.S.C. 78r), or otherwise subject to the liability of that section. Such certification will not be deemed to be incorporated by reference into any filing under the Securities Act of 1933 or the Exchange Act, except to the extent that the registrant specifically incorporates it by reference: Attached hereto. |
| |
Notice
A copy of the Amended and Restated Declaration of Trust of the Registrant is on file with the Secretary of State of the Commonwealth of Massachusetts and notice is hereby given that this instrument is executed on behalf of the Registrant by an officer of the Registrant as an officer and not individually and the obligations of or arising out of this instrument are not binding upon any of the Trustees or shareholders individually, but are binding only upon the assets and property of the respective constituent series of the Registrant.
SIGNATURES
Pursuant to the requirements of the Securities Exchange Act of 1934 and the Investment Company Act of 1940, the registrant has duly caused this report to be signed on its behalf by the undersigned, thereunto duly authorized.
| (Registrant) | MFS SERIES TRUST IV |
| | | |
| By (Signature and Title)* | MARIA F. DWYER |
| | Maria F. Dwyer, President |
| Date: April 24, 2006 | |
Pursuant to the requirements of the Securities Exchange Act of 1934 and the Investment Company Act of 1940, this report has been signed below by the following persons on behalf of the registrant and in the capacities and on the dates indicated.
| By (Signature and Title)* | MARIA F. DWYER |
| | Maria F. Dwyer, President (Principal Executive Officer) |
| Date: April 24, 2006 | |
By (Signature and Title)* | TRACY ATKINSON |
| | Tracy Atkinson, Treasurer (Principal Financial Officer and |
| | Accounting Officer) |
| Date: April 24, 2006 | |
* Print name and title of each signing officer under his or her signature. |
Persons Covered by this Code of Ethics
| Funds’ Principal Executive Officer: | Maria F. Dwyer |
| Funds’ Principal Financial Officer: | Tracy Atkinson |