Table of Contents
UNITED STATES
SECURITIES AND EXCHANGE COMMISSION
Washington, D.C. 20549
FORM N-CSR
CERTIFIED SHAREHOLDER REPORT OF
REGISTERED MANAGEMENT INVESTMENT COMPANIES
Investment Company Act file number 811-2594
MFS SERIES TRUST IV
(Exact name of registrant as specified in charter)
500 Boylston Street, Boston, Massachusetts 02116
(Address of principal executive offices) (Zip code)
Susan S. Newton
Massachusetts Financial Services Company
500 Boylston Street
Boston, Massachusetts 02116
(Name and address of agents for service)
Registrant’s telephone number, including area code: (617) 954-5000
Date of fiscal year end: August 31
Date of reporting period: August 31, 2012
Table of Contents
| ITEM 1. | REPORTS TO STOCKHOLDERS. |
Table of Contents
ANNUAL REPORT
August 31, 2012

MFS® MID CAP GROWTH FUND

OTC-ANN
Table of Contents
MFS® MID CAP GROWTH FUND
The report is prepared for the general information of shareholders.
It is authorized for distribution to prospective investors only when preceded or accompanied by a current prospectus.
NOT FDIC INSURED Ÿ MAY LOSE VALUE Ÿ NO BANK GUARANTEE
Table of Contents

LETTER FROM THE CHAIRMAN AND CEO
Dear Shareholders:
World financial markets continue to face a number of major economic and political challenges. While the European debt crisis has deepened and spread, there appears to be scope for improvement given the European Central Bank’s willingness to backstop troubled sovereigns. Economic activity in China, until recently the world’s growth engine, appears to be bottoming. Even the relatively strong and stable US
economy has been affected by uncertainty over the presidential election and the threat of a “fiscal cliff” at year- end. At the same time, global consumer and producer confidence has fallen sharply. And a search for safe havens by nervous investors has driven down yields on highly rated government bonds, including those issued by Germany and the United States, to multi-decade lows.
But there is also good news: Global economic data have modestly improved, performing slightly better than expected. However, the improvement is too short-lived to be called a trend. Equity markets have been largely range bound since the
Fed extended its quantitative easing program, leaving little expectation that the bank will add further money to the system. It is hard to know how much of the recent gain in financial markets has been the result of actual economic improvements versus expectations that renewed central bank action will soon lead to an economic rebound.
Through all this uncertainty, managing risk remains a top priority for investors and their advisors. At MFS®, our emphasis on global research is designed to keep our investment process functioning smoothly at all times. Close collaboration among colleagues around the world is vital in periods of uncertainty and heightened volatility. We share ideas and evaluate opportunities across continents and across all investment disciplines and types of investments. We employ this uniquely collaborative approach to build better insights — and better results — for our clients.
Like our investors, we are mindful of the many economic challenges we face at the local, national and international levels. In times like these, it is more important than ever to maintain a long-term view, adhere to time-tested investing principles such as asset allocation and diversification and work closely with investment advisors to research and identify the most suitable opportunities.
Respectfully,

Robert J. Manning
Chairman and Chief Executive Officer
MFS Investment Management®
October 17, 2012
The opinions expressed in this letter are subject to change, may not be relied upon for investment advice and no forecasts can be guaranteed.
1
Table of Contents
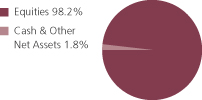
Portfolio structure
| Top ten holdings | ||||
| AMETEK, Inc. | 2.1% | |||
| Ross Stores, Inc. | 2.1% | |||
| American Tower Corp., REIT | 1.9% | |||
| MasterCard, Inc., “A” | 1.8% | |||
| Verisk Analytics, Inc., “A” | 1.8% | |||
| Airgas, Inc. | 1.6% | |||
| Urban Outfitters, Inc. | 1.6% | |||
| Cognizant Technology Solutions Corp., “A” | 1.6% | |||
| PetSmart, Inc. | 1.5% | |||
| Cabot Oil & Gas Corp. | 1.5% |
| Equity sectors | ||||
| Technology | 15.0% | |||
| Retailing | 14.6% | |||
| Health Care | 12.6% | |||
| Industrial Goods & Services | 11.7% | |||
| Special Products & Services | 8.6% | |||
| Energy | 8.2% | |||
| Basic Materials | 5.5% | |||
| Leisure | 5.5% | |||
| Autos & Housing | 5.1% | |||
| Financial Services | 4.1% | |||
| Consumer Staples | 3.2% | |||
| Utilities & Communications | 2.4% | |||
| Transportation | 1.7% |
Percentages are based on net assets as of 8/31/12.
The portfolio is actively managed and current holdings may be different.
2
Table of Contents
Summary of Results
For the twelve months ended August 31, 2012, Class A shares of the MFS Mid Cap Growth Fund (the “fund”) provided a total return of 9.62%, at net asset value. This compares with a return of 11.72% for the fund’s benchmark, the Russell Midcap Growth Index.
Market Environment
At the beginning of the reporting period, markets were roiled by several global concerns. These included prospects of U.S. sovereign debt default and the long-term public debt profile, the path of eurozone integration and the scope of its bailout facilities, the likelihood of a Chinese hard landing, and the global supply chain disruption resulting from the Japanese earthquake. Amidst this turmoil, global equity markets declined sharply and credit spreads widened. At the same time, global consumer and producer sentiment indicators fell precipitously, while highly-rated sovereign bond yields hit multi-decade lows.
During the middle of the period, however, additional liquidity from the U.S. Federal Reserve (in the form of “Operation Twist”) and the European Central Bank (in the form of 3-year, Long Term Refinancing Operations, or LTROs), coupled with healthier global macroeconomic conditions, led by moderate but sustained U.S. growth, ushered in improved market dynamics.
Towards the end of the period, though, market trends were more mixed. Worsening conditions were driven by broadly weaker global macroeconomic indicators, as well as renewed concerns over the eurozone’s capacity and determination to address its ongoing crisis. However, broad market sentiment remained relatively resilient, as equity markets generally maintained gains and credit spreads did not indicate deterioration.
Detractors from Performance
Stock selection in the technology sector held back performance relative to the Russell Midcap Growth Index. Holdings of online digital photography company Shutterfly (b)(h), security software provider Check Point Software Technologies (b) (Israel), and session border controllers Acme Packet (h) were among the fund’s top relative detractors for the reporting period. Shares of Acme Packet faced downward pressure as management lowered guidance on concerns that weaker spending trends by North American carriers could continue.
Stock selection in the industrial goods & services sector also had a negative impact on relative results, led by holdings of filtration and separation systems manufacturer Polypore International. Shares of Polypore underperformed as investors appeared to have been concerned about the potential impact to the company’s Energy Storage operations from the flood in Thailand and a change in Chinese environmental policy concerning the handling of lead in lead-acid battery production. Additionally, one of the firm’s customers announced plans to produce, in-house, the separators they currently purchase from Polypore which cut into the firm’s sales to producers of batteries used in electric cars.
Stocks in other sectors that hampered relative performance included energy company SM Energy and oil and natural gas exploration company Celtic Exploration (b). A steady
3
Table of Contents
Management Review – continued
decline in natural gas prices adversely affected Celtic Exploration’s stock as nearly 80% of the firm’s production comes from natural gas. This, combined with a significant increase in costs via capital expenditures, left the company with a sizable loss. Not holding strong-performing gas pipeline company El Paso Corporation, and the timing of the fund’s ownership in shares of surgical systems manufacturer Intuitive Surgical, also hurt relative results.
The fund’s cash and/or cash equivalents position dampened relative performance. The fund strives to be fully invested and only holds cash to buy new holdings and to provide liquidity. In a period when equity markets rose, as measured by the fund’s benchmark, holding cash hurt performance versus the benchmark, which has no cash position.
Contributors to Performance
Stock selection in the retailing sector was a key driver for positive performance. Overweight positions in off-price retail apparel and home fashion store operator Ross Stores, specialty retailer of pet food and supplies PetSmart, and apparel retailer Urban Outfitters contributed to relative results as all three stocks significantly outperformed the benchmark during the reporting period. Shares of PetSmart rose as the company posted strong sales, strong incremental margins, and noted strength across all three merchandising categories, as well as across services.
Stock selection in the energy sector also aided relative performance during the reporting period. Within this sector, not holding poor-performing coal mining company Peabody Energy benefited relative results.
Stocks in other sectors that were among the fund’s top relative contributors included biotechnology firm Alexion Pharmaceuticals, aerospace components and systems supplier Goodrich (h), broadcast and communications tower management firm American Tower (b), information and analytical tool provider Verisk Analytics, and electronic instrument manufacturer AMETEK. Shares of AMETEK benefited from strong earnings results as net income hit an all-time high. The company also continued to complete strategic acquisitions, a key tenant of its corporate growth plan. The timing of the fund’s ownership in shares of internet TV show and movie subscription provider Netflix (h) also aided relative results.
Respectfully,
| Eric Fischman | Paul Gordon | |
| Portfolio Manager | Portfolio Manager |
| (b) | Security is not a benchmark constituent. |
| (h) | Security was not held in the portfolio at period end. |
The views expressed in this report are those of the portfolio managers only through the end of the period of the report as stated on the cover and do not necessarily reflect the views of MFS or any other person in the MFS organization. These views are subject to change at any time based on market or other conditions, and MFS disclaims any responsibility to update such views. These views may not be relied upon as investment advice or an indication of trading intent on behalf of any MFS portfolio. References to specific securities are not recommendations of such securities, and may not be representative of any MFS portfolio’s current or future investments.
4
Table of Contents
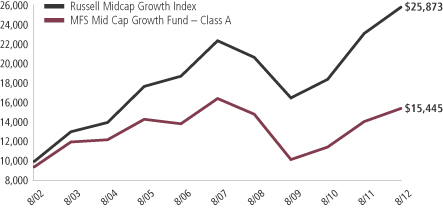
PERFORMANCE SUMMARY THROUGH 8/31/12
The following chart illustrates a representative class of the fund’s historical performance in comparison to its benchmark(s). Performance results include the deduction of the maximum applicable sales charge and reflect the percentage change in net asset value, including reinvestment of dividends and capital gains distributions. The performance of other share classes will be greater than or less than that of the class depicted below. Benchmarks are unmanaged and may not be invested in directly. Benchmark returns do not reflect sales charges, commissions or expenses. (See Notes to Performance Summary.)
Performance data shown represents past performance and is no guarantee of future results. Investment return and principal value fluctuate so your shares, when sold, may be worth more or less than the original cost; current performance may be lower or higher than quoted. The performance shown does not reflect the deduction of taxes, if any, that a shareholder would pay on fund distributions or the redemption of fund shares.
Growth of a Hypothetical $10,000 Investment
5
Table of Contents
Performance Summary – continued
Total Returns through 8/31/12
Average annual without sales charge
| Share Class | Class inception date | 1-yr | 5-yr | 10-yr | Life (t) | |||||||||
| A | 12/01/93 | 9.62% | (1.27)% | 5.06% | N/A | |||||||||
| B | 12/01/93 | 8.69% | (2.03)% | 4.27% | N/A | |||||||||
| C | 8/01/94 | 8.76% | (2.01)% | 4.28% | N/A | |||||||||
| I | 1/02/97 | 9.79% | (1.04)% | 5.33% | N/A | |||||||||
| R1 | 4/01/05 | 8.72% | (2.03)% | N/A | 1.10% | |||||||||
| R2 | 10/31/03 | 9.32% | (1.54)% | N/A | 2.27% | |||||||||
| R3 | 4/01/05 | 9.55% | (1.31)% | N/A | 1.85% | |||||||||
| R4 | 4/01/05 | 9.98% | (1.08)% | N/A | 2.11% | |||||||||
| 529A | 7/31/02 | 9.48% | (1.43)% | 4.84% | N/A | |||||||||
| 529B | 7/31/02 | 8.83% | (2.10)% | 4.11% | N/A | |||||||||
| 529C | 7/31/02 | 8.78% | (2.12)% | 4.11% | N/A | |||||||||
| Comparative benchmark | ||||||||||||||
| Russell Midcap Growth Index (f) | 11.72% | 2.92% | 9.97% | N/A | ||||||||||
| Average annual with sales charge | ||||||||||||||
| A With Initial Sales Charge (5.75%) | 3.32% | (2.43)% | 4.44% | N/A | ||||||||||
| B With CDSC (Declining over six years from 4% to 0%) (x) | 4.69% | (2.42)% | 4.27% | N/A | ||||||||||
| C With CDSC (1% for 12 months) (x) | 7.76% | (2.01)% | 4.28% | N/A | ||||||||||
| 529A With Initial Sales Charge (5.75%) | 3.19% | (2.59)% | 4.22% | N/A | ||||||||||
| 529B With CDSC (Declining over six years from 4% to 0%) (x) | 4.83% | (2.49)% | 4.11% | N/A | ||||||||||
| 529C With CDSC (1% for 12 months) (x) | 7.78% | (2.12)% | 4.11% | N/A | ||||||||||
Class I, R1, R2, R3, and R4 shares do not have a sales charge.
CDSC – Contingent Deferred Sales Charge.
| (f) | Source: FactSet Research Systems Inc. |
| (t) | For the period from the class inception date through the stated period end (for those share classes with less than 10 years of performance history). No comparative benchmark performance information is provided for “life” periods. (See Notes to Performance Summary.) |
| (x) | Assuming redemption at the end of the applicable period. |
6
Table of Contents
Performance Summary – continued
Benchmark Definition
Russell Midcap Growth Index – constructed to provide a comprehensive barometer for growth securities in the mid-cap segment of the U.S. equity universe. Companies in this index generally have higher price-to-book ratios and higher forecasted growth values.
It is not possible to invest directly in an index.
Notes to Performance Summary
Average annual total return represents the average annual change in value for each share class for the periods presented. Life returns are presented where the share class has less than 10 years of performance history and represent the average annual total return from the class inception date to the stated period end date. As the fund’s share classes may have different inception dates, the life returns may represent different time periods and may not be comparable. As a result, no comparative benchmark performance information is provided for life periods.
Performance results reflect any applicable expense subsidies and waivers in effect during the periods shown. Without such subsidies and waivers the fund’s performance results would be less favorable. Please see the prospectus and financial statements for complete details.
Performance results do not include adjustments made for financial reporting purposes in accordance with U.S. generally accepted accounting principles and may differ from amounts reported in the financial highlights.
From time to time the fund may receive proceeds from litigation settlements, without which performance would be lower.
7
Table of Contents
Fund expenses borne by the shareholders during the period,
March 1, 2012 through August 31, 2012
As a shareholder of the fund, you incur two types of costs: (1) transaction costs, including sales charges (loads) on certain purchase or redemption payments, and (2) ongoing costs, including management fees; distribution and service (12b-1) fees; and other fund expenses. This example is intended to help you understand your ongoing costs (in dollars) of investing in the fund and to compare these costs with the ongoing costs of investing in other mutual funds.
The example is based on an investment of $1,000 invested at the beginning of the period and held for the entire period March 1, 2012 through August 31, 2012.
The expenses include the payment of a portion of the transfer-agent-related expenses of MFS funds that invest in the fund. For further information, please see the Notes to the Financial Statements.
Actual Expenses
The first line for each share class in the following table provides information about actual account values and actual expenses. You may use the information in this line, together with the amount you invested, to estimate the expenses that you paid over the period. Simply divide your account value by $1,000 (for example, an $8,600 account value divided by $1,000 = 8.6), then multiply the result by the number in the first line under the heading entitled “Expenses Paid During Period” to estimate the expenses you paid on your account during this period.
Hypothetical Example for Comparison Purposes
The second line for each share class in the following table provides information about hypothetical account values and hypothetical expenses based on the fund’s actual expense ratio and an assumed rate of return of 5% per year before expenses, which is not the fund’s actual return. The hypothetical account values and expenses may not be used to estimate the actual ending account balance or expenses you paid for the period. You may use this information to compare the ongoing costs of investing in the fund and other funds. To do so, compare this 5% hypothetical example with the 5% hypothetical examples that appear in the shareholder reports of the other funds.
Please note that the expenses shown in the table are meant to highlight your ongoing costs only and do not reflect any transactional costs, such as sales charges (loads). Therefore, the second line for each share class in the table is useful in comparing ongoing costs only, and will not help you determine the relative total costs of owning different funds. In addition, if these transactional costs were included, your costs would have been higher.
8
Table of Contents
Expense Table – continued
| Share Class | Annualized Ratio | Beginning Account Value 3/01/12 | Ending Account Value | Expenses Paid During 3/01/12-8/31/12 | ||||||||||
| A | Actual | 1.24% | $1,000.00 | $1,001.05 | $6.24 | |||||||||
| Hypothetical (h) | 1.24% | $1,000.00 | $1,018.90 | $6.29 | ||||||||||
| B | Actual | 1.99% | $1,000.00 | $996.54 | $9.99 | |||||||||
| Hypothetical (h) | 1.99% | $1,000.00 | $1,015.13 | $10.08 | ||||||||||
| C | Actual | 1.99% | $1,000.00 | $997.64 | $9.99 | |||||||||
| Hypothetical (h) | 1.99% | $1,000.00 | $1,015.13 | $10.08 | ||||||||||
| I | Actual | 0.99% | $1,000.00 | $1,002.03 | $4.98 | |||||||||
| Hypothetical (h) | 0.99% | $1,000.00 | $1,020.16 | $5.03 | ||||||||||
| R1 | Actual | 1.99% | $1,000.00 | $996.52 | $9.99 | |||||||||
| Hypothetical (h) | 1.99% | $1,000.00 | $1,015.13 | $10.08 | ||||||||||
| R2 | Actual | 1.49% | $1,000.00 | $998.92 | $7.49 | |||||||||
| Hypothetical (h) | 1.49% | $1,000.00 | $1,017.65 | $7.56 | ||||||||||
| R3 | Actual | 1.24% | $1,000.00 | $1,001.05 | $6.24 | |||||||||
| Hypothetical (h) | 1.24% | $1,000.00 | $1,018.90 | $6.29 | ||||||||||
| R4 | Actual | 0.99% | $1,000.00 | $1,002.07 | $4.98 | |||||||||
| Hypothetical (h) | 0.99% | $1,000.00 | $1,020.16 | $5.03 | ||||||||||
| 529A | Actual | 1.29% | $1,000.00 | $1,000.00 | $6.49 | |||||||||
| Hypothetical (h) | 1.29% | $1,000.00 | $1,018.65 | $6.55 | ||||||||||
| 529B | Actual | 2.04% | $1,000.00 | $997.65 | $10.24 | |||||||||
| Hypothetical (h) | 2.04% | $1,000.00 | $1,014.88 | $10.33 | ||||||||||
| 529C | Actual | 2.04% | $1,000.00 | $996.40 | $10.24 | |||||||||
| Hypothetical (h) | 2.04% | $1,000.00 | $1,014.88 | $10.33 | ||||||||||
| (h) | 5% class return per year before expenses. |
| (p) | Expenses paid are equal to each class’ annualized expense ratio, as shown above, multiplied by the average account value over the period, multiplied by the number of days in the period, divided by the number of days in the year. Expenses paid do not include any applicable sales charges (loads). If these transaction costs had been included, your costs would have been higher. |
9
Table of Contents
8/31/12
The Portfolio of Investments is a complete list of all securities owned by your fund. It is categorized by broad-based asset classes.
| Common Stocks - 98.2% | ||||||||
| Issuer | Shares/Par | Value ($) | ||||||
| Aerospace - 1.4% | ||||||||
| BE Aerospace, Inc. (a) | 158,110 | $ | 6,365,502 | |||||
| TransDigm Group, Inc. (a) | 57,970 | 8,035,801 | ||||||
|
| |||||||
| $ | 14,401,303 | |||||||
| Alcoholic Beverages - 0.9% | ||||||||
| Beam, Inc. | 150,730 | $ | 8,796,603 | |||||
| Apparel Manufacturers - 1.8% | ||||||||
| Carter’s, Inc. (a) | 42,110 | $ | 2,345,948 | |||||
| Guess?, Inc. | 61,090 | 1,592,005 | ||||||
| Li & Fung Ltd. | 2,624,000 | 4,281,574 | ||||||
| VF Corp. | 65,030 | 9,928,780 | ||||||
|
| |||||||
| $ | 18,148,307 | |||||||
| Automotive - 2.9% | ||||||||
| BorgWarner Transmission Systems, Inc. (a) | 184,050 | $ | 12,658,959 | |||||
| Delphi Automotive PLC (a) | 286,910 | 8,690,504 | ||||||
| LKQ Corp. (a) | 205,590 | 7,758,967 | ||||||
|
| |||||||
| $ | 29,108,430 | |||||||
| Biotechnology - 2.2% | ||||||||
| Alexion Pharmaceuticals, Inc. (a) | 139,630 | $ | 14,969,732 | |||||
| Regeneron Pharmaceuticals, Inc. (a) | 21,560 | 3,191,958 | ||||||
| ViroPharma, Inc. (a) | 144,840 | 3,852,744 | ||||||
|
| |||||||
| $ | 22,014,434 | |||||||
| Broadcasting - 1.7% | ||||||||
| CBS Corp., “B” | 115,950 | $ | 4,213,623 | |||||
| Discovery Communications, Inc., “A” (a) | 234,866 | 12,880,051 | ||||||
|
| |||||||
| $ | 17,093,674 | |||||||
| Brokerage & Asset Managers - 2.3% | ||||||||
| Affiliated Managers Group, Inc. (a) | 124,170 | $ | 14,604,875 | |||||
| Evercore Partners, Inc. | 85,390 | 2,109,133 | ||||||
| IntercontinentalExchange, Inc. (a) | 45,580 | 6,230,786 | ||||||
|
| |||||||
| $ | 22,944,794 | |||||||
| Business Services - 6.9% | ||||||||
| Cognizant Technology Solutions Corp., “A” (a) | 247,899 | $ | 15,934,948 | |||||
| Concur Technologies, Inc. (a) | 62,710 | 4,540,204 | ||||||
10
Table of Contents
Portfolio of Investments – continued
| Issuer | Shares/Par | Value ($) | ||||||
| Common Stocks - continued | ||||||||
| Business Services - continued | ||||||||
| FleetCor Technologies, Inc. (a) | 232,490 | $ | 10,038,918 | |||||
| Gartner, Inc. (a) | 197,850 | 9,771,812 | ||||||
| IHS, Inc., “A” (a) | 23,270 | 2,653,711 | ||||||
| Jones Lang LaSalle, Inc. | 120,740 | 8,708,976 | ||||||
| Verisk Analytics, Inc., “A” (a) | 370,560 | 17,979,571 | ||||||
|
| |||||||
| $ | 69,628,140 | |||||||
| Cable TV - 0.8% | ||||||||
| Charter Communications, Inc., “A” (a) | 107,040 | $ | 8,327,712 | |||||
| Chemicals - 0.7% | ||||||||
| Celanese Corp. | 186,900 | $ | 7,150,794 | |||||
| Computer Software - 5.9% | ||||||||
| Autodesk, Inc. (a) | 121,820 | $ | 3,782,511 | |||||
| Check Point Software Technologies Ltd. (a) | 206,520 | 9,518,507 | ||||||
| Citrix Systems, Inc. (a) | 100,680 | 7,821,829 | ||||||
| CommVault Systems, Inc. (a) | 84,560 | 4,263,515 | ||||||
| Parametric Technology Corp. (a) | 567,470 | 12,058,738 | ||||||
| Red Hat, Inc. (a) | 91,930 | 5,151,757 | ||||||
| SolarWinds, Inc. (a) | 140,570 | 7,714,482 | ||||||
| TIBCO Software, Inc. (a) | 326,580 | 9,771,274 | ||||||
|
| |||||||
| $ | 60,082,613 | |||||||
| Computer Software - Systems - 2.2% | ||||||||
| MICROS Systems, Inc. (a) | 152,810 | $ | 7,741,355 | |||||
| NetApp, Inc. (a) | 108,950 | 3,760,954 | ||||||
| Qlik Technologies, Inc. (a) | 318,140 | 6,728,661 | ||||||
| Verifone Systems, Inc. (a) | 108,760 | 3,778,322 | ||||||
|
| |||||||
| $ | 22,009,292 | |||||||
| Construction - 2.2% | ||||||||
| NVR, Inc. (a) | 8,030 | $ | 6,650,285 | |||||
| Sherwin-Williams Co. | 26,540 | 3,797,343 | ||||||
| Stanley Black & Decker, Inc. | 180,925 | 11,901,247 | ||||||
|
| |||||||
| $ | 22,348,875 | |||||||
| Consumer Products - 0.7% | ||||||||
| Chr. Hansen Holding A/S | 168,486 | $ | 5,028,287 | |||||
| Nu Skin Enterprises, Inc., “A” | 54,630 | 2,266,599 | ||||||
|
| |||||||
| $ | 7,294,886 | |||||||
11
Table of Contents
Portfolio of Investments – continued
| Issuer | Shares/Par | Value ($) | ||||||
| Common Stocks - continued | ||||||||
| Consumer Services - 1.7% | ||||||||
| Anhanguera Educacional Participacoes S.A. | 128,400 | $ | 1,910,914 | |||||
| HomeAway, Inc. (a) | 37,860 | 895,768 | ||||||
| Priceline.com, Inc. (a) | 23,916 | 14,458,896 | ||||||
|
| |||||||
| $ | 17,265,578 | |||||||
| Containers - 2.2% | ||||||||
| Ball Corp. | 320,650 | $ | 13,521,811 | |||||
| Silgan Holdings, Inc. | 219,800 | 9,216,214 | ||||||
|
| |||||||
| $ | 22,738,025 | |||||||
| Electrical Equipment - 5.9% | ||||||||
| AMETEK, Inc. | 614,392 | $ | 21,079,790 | |||||
| Mettler-Toledo International, Inc. (a) | 78,030 | 12,883,533 | ||||||
| MSC Industrial Direct Co., Inc., “A” | 121,090 | 8,391,537 | ||||||
| Sensata Technologies Holding B.V. (a) | 244,840 | 7,352,545 | ||||||
| TriMas Corp. (a) | 105,640 | 2,271,260 | ||||||
| W.W. Grainger, Inc. | 38,360 | 7,900,626 | ||||||
|
| |||||||
| $ | 59,879,291 | |||||||
| Electronics - 3.2% | ||||||||
| Altera Corp. | 289,200 | $ | 10,795,836 | |||||
| Hittite Microwave Corp. (a) | 58,285 | 3,052,385 | ||||||
| Linear Technology Corp. | 227,340 | 7,507,904 | ||||||
| Microchip Technology, Inc. | 319,270 | 11,094,633 | ||||||
|
| |||||||
| $ | 32,450,758 | |||||||
| Energy - Independent - 4.7% | ||||||||
| Cabot Oil & Gas Corp. | 368,650 | $ | 15,265,797 | |||||
| Celtic Exploration Ltd. (a) | 339,930 | 5,703,720 | ||||||
| Concho Resources, Inc. (a) | 78,640 | 7,057,154 | ||||||
| EQT Corp. | 94,310 | 5,088,968 | ||||||
| Pioneer Natural Resources Co. | 43,400 | 4,225,424 | ||||||
| Range Resources Corp. | 58,950 | 3,842,951 | ||||||
| SM Energy Co. | 131,830 | 6,226,331 | ||||||
|
| |||||||
| $ | 47,410,345 | |||||||
| Engineering - Construction - 0.3% | ||||||||
| Fluor Corp. | 51,697 | $ | 2,662,396 | |||||
| Entertainment - 0.3% | ||||||||
| Six Flags Entertainment Corp. | 47,000 | $ | 2,595,810 | |||||
| Food & Beverages - 1.6% | ||||||||
| Mead Johnson Nutrition Co., “A” | 187,700 | $ | 13,764,041 | |||||
| Want Want China Holdings Ltd. | 2,358,000 | 2,927,460 | ||||||
|
| |||||||
| $ | 16,691,501 | |||||||
12
Table of Contents
Portfolio of Investments – continued
| Issuer | Shares/Par | Value ($) | ||||||
| Common Stocks - continued | ||||||||
| Gaming & Lodging - 0.7% | ||||||||
| Royal Caribbean Cruises Ltd. | 154,778 | $ | 4,182,102 | |||||
| Sands China Ltd. | 684,000 | 2,416,416 | ||||||
|
| |||||||
| $ | 6,598,518 | |||||||
| General Merchandise - 2.1% | ||||||||
| Dollar General Corp. (a) | 260,450 | $ | 13,301,182 | |||||
| Five Below, Inc. (a) | 240,990 | 7,745,419 | ||||||
|
| |||||||
| $ | 21,046,601 | |||||||
| Internet - 2.0% | ||||||||
| LinkedIn Corp., “A” (a) | 65,170 | $ | 6,992,741 | |||||
| Rackspace Hosting, Inc. (a) | 213,390 | 12,799,132 | ||||||
|
| |||||||
| $ | 19,791,873 | |||||||
| Leisure & Toys - 1.1% | ||||||||
| Brunswick Corp. | 139,120 | $ | 3,295,753 | |||||
| Polaris Industries, Inc. | 110,080 | 8,276,915 | ||||||
|
| |||||||
| $ | 11,572,668 | |||||||
| Machinery & Tools - 3.4% | ||||||||
| Flowserve Corp. | 39,080 | $ | 4,988,953 | |||||
| Joy Global, Inc. | 169,190 | 9,031,362 | ||||||
| Polypore International, Inc. (a)(l) | 115,360 | 3,739,971 | ||||||
| Roper Industries, Inc. | 52,560 | 5,402,642 | ||||||
| United Rentals, Inc. (a) | 102,080 | 3,298,205 | ||||||
| WABCO Holdings, Inc. (a) | 143,160 | 8,406,355 | ||||||
|
| |||||||
| $ | 34,867,488 | |||||||
| Medical & Health Technology & Services - 3.9% | ||||||||
| Advisory Board Co. (a) | 78,720 | $ | 3,489,658 | |||||
| Catamaran Corp. (a) | 133,440 | 11,629,296 | ||||||
| Cerner Corp. (a) | 170,160 | 12,445,502 | ||||||
| IDEXX Laboratories, Inc. (a) | 38,710 | 3,679,773 | ||||||
| Patterson Cos., Inc. | 256,670 | 8,719,080 | ||||||
|
| |||||||
| $ | 39,963,309 | |||||||
| Medical Equipment - 5.1% | ||||||||
| Cepheid, Inc. (a) | 38,850 | $ | 1,466,199 | |||||
| Cooper Cos., Inc. | 127,865 | 10,721,480 | ||||||
| Covidien PLC | 182,720 | 10,241,456 | ||||||
| Edwards Lifesciences Corp. (a) | 95,610 | 9,762,737 | ||||||
| Endologix, Inc. (a) | 349,660 | 4,185,430 | ||||||
| Intuitive Surgical, Inc. (a) | 14,940 | 7,347,343 | ||||||
| Sirona Dental Systems, Inc. (a) | 54,060 | 2,872,748 | ||||||
13
Table of Contents
Portfolio of Investments – continued
| Issuer | Shares/Par | Value ($) | ||||||
| Common Stocks - continued | ||||||||
| Medical Equipment - continued | ||||||||
| Thermo Fisher Scientific, Inc. | 97,270 | $ | 5,578,435 | |||||
|
| |||||||
| $ | 52,175,828 | |||||||
| Network & Telecom - 1.7% | ||||||||
| F5 Networks, Inc. (a) | 30,870 | $ | 3,009,516 | |||||
| Fortinet, Inc. (a) | 533,410 | 14,140,699 | ||||||
|
| |||||||
| $ | 17,150,215 | |||||||
| Oil Services - 3.5% | ||||||||
| Cameron International Corp. (a) | 103,564 | $ | 5,665,986 | |||||
| Core Laboratories N.V. | 32,810 | 4,009,054 | ||||||
| Dresser-Rand Group, Inc. (a) | 276,130 | 13,977,701 | ||||||
| FMC Technologies, Inc. (a) | 210,550 | 9,862,162 | ||||||
| Lufkin Industries, Inc. | 47,210 | 2,474,748 | ||||||
|
| |||||||
| $ | 35,989,651 | |||||||
| Other Banks & Diversified Financials - 1.8% | ||||||||
| MasterCard, Inc., “A” | 43,250 | $ | 18,290,425 | |||||
| Pharmaceuticals - 1.4% | ||||||||
| Auxilium Pharmaceuticals, Inc. (a) | 107,670 | $ | 2,508,711 | |||||
| Perrigo Co. | 102,200 | 11,238,934 | ||||||
|
| |||||||
| $ | 13,747,645 | |||||||
| Pollution Control - 0.7% | ||||||||
| Stericycle, Inc. (a) | 33,710 | $ | 3,085,139 | |||||
| Waste Connections, Inc. | 152,395 | 4,411,835 | ||||||
|
| |||||||
| $ | 7,496,974 | |||||||
| Railroad & Shipping - 1.0% | ||||||||
| Kansas City Southern Co. | 129,310 | $ | 9,999,542 | |||||
| Restaurants - 0.9% | ||||||||
| Starbucks Corp. | 187,420 | $ | 9,297,906 | |||||
| Specialty Chemicals - 2.6% | ||||||||
| Airgas, Inc. | 199,130 | $ | 16,541,729 | |||||
| Albemarle Corp. | 74,800 | 4,093,804 | ||||||
| Rockwood Holdings, Inc. | 120,740 | 5,715,832 | ||||||
|
| |||||||
| $ | 26,351,365 | |||||||
| Specialty Stores - 10.7% | ||||||||
| American Eagle Outfitters, Inc. | 180,710 | $ | 4,018,990 | |||||
| AutoZone, Inc. (a) | 35,570 | 12,863,535 | ||||||
14
Table of Contents
Portfolio of Investments – continued
| Issuer | Shares/Par | Value ($) | ||||||
| Common Stocks - continued | ||||||||
| Specialty Stores - continued | ||||||||
| Bed Bath & Beyond, Inc. (a) | 47,960 | $ | 3,221,473 | |||||
| Children’s Place Retail Store, Inc. (a) | 102,260 | 5,822,684 | ||||||
| O’Reilly Automotive, Inc. (a) | 78,850 | 6,698,308 | ||||||
| PetSmart, Inc. | 216,240 | 15,335,741 | ||||||
| Ross Stores, Inc. | 303,710 | 21,013,695 | ||||||
| rue21, Inc. (a) | 111,440 | 3,154,866 | ||||||
| Tiffany & Co. | 179,950 | 11,147,903 | ||||||
| Tractor Supply Co. | 91,510 | 8,737,375 | ||||||
| Urban Outfitters, Inc. (a) | 426,790 | 16,021,697 | ||||||
|
| |||||||
| $ | 108,036,267 | |||||||
| Telecommunications - Wireless - 1.9% | ||||||||
| American Tower Corp., REIT | 275,350 | $ | 19,384,640 | |||||
| Trucking - 0.7% | ||||||||
| Expeditors International of Washington, Inc. | 196,860 | $ | 7,207,045 | |||||
| Utilities - Electric Power - 0.5% | ||||||||
| CMS Energy Corp. | 223,050 | $ | 5,145,764 | |||||
| Total Common Stocks (Identified Cost, $849,296,560) | $ | 995,157,285 | ||||||
| Collateral for Securities Loaned - 0.3% | ||||||||
| Morgan Stanley Repurchase Agreement, 0.19%, dated 8/31/2012, due 9/04/2012, total to be received $3,524,844 (secured by U.S. Treasury and Federal Agency obligations valued at $3,595,280 in an individually traded account), at Cost and Value | $ | 3,524,770 | $ | 3,524,770 | ||||
| Money Market Funds - 1.2% | ||||||||
| MFS Institutional Money Market Portfolio, 0.16%, at Cost and Net Asset Value (v) | 12,080,387 | $ | 12,080,387 | |||||
| Total Investments (Identified Cost, $864,901,717) | $ | 1,010,762,442 | ||||||
| Other Assets, Less Liabilities - 0.3% | 2,989,179 | |||||||
| Net Assets - 100.0% | $ | 1,013,751,621 | ||||||
| (a) | Non-income producing security. |
| (l) | A portion of this security is on loan. |
| (v) | Underlying affiliated fund that is available only to investment companies managed by MFS. The rate quoted for the MFS Institutional Money Market Portfolio is the annualized seven-day yield of the fund at period end. |
The following abbreviations are used in this report and are defined:
| PLC | Public Limited Company |
| REIT | Real Estate Investment Trust |
See Notes to Financial Statements
15
Table of Contents
Financial Statements
STATEMENT OF ASSETS AND LIABILITIES
At 8/31/12
This statement represents your fund’s balance sheet, which details the assets and liabilities comprising the total value of the fund.
| Assets | ||||
Investments- | ||||
Non-affiliated issuers, at value (identified cost, $852,821,330) | $998,682,055 | |||
Underlying affiliated funds, at cost and value | 12,080,387 | |||
Total investments, at value, including $2,787,147 of securities on loan | $1,010,762,442 | |||
Receivables for | ||||
Investments sold | 11,017,943 | |||
Fund shares sold | 234,053 | |||
Interest and dividends | 633,127 | |||
Other assets | 2,040 | |||
Total assets | $1,022,649,605 | |||
| Liabilities | ||||
Payable to custodian | $991 | |||
Payables for | ||||
Investments purchased | 3,513,768 | |||
Fund shares reacquired | 1,301,238 | |||
Collateral for securities loaned, at value | 3,524,770 | |||
Payable to affiliates | ||||
Investment adviser | 42,274 | |||
Shareholder servicing costs | 372,302 | |||
Distribution and service fees | 5,491 | |||
Program manager fees | 5 | |||
Payable for independent Trustees’ compensation | 35,410 | |||
Accrued expenses and other liabilities | 101,735 | |||
Total liabilities | $8,897,984 | |||
Net assets | $1,013,751,621 | |||
| Net assets consist of | ||||
Paid-in capital | $1,150,639,066 | |||
Unrealized appreciation (depreciation) on investments and translation of assets and liabilities in foreign currencies | 145,860,769 | |||
Accumulated net realized gain (loss) on investments and foreign currency | (278,539,822 | ) | ||
Accumulated net investment loss | (4,208,392 | ) | ||
Net assets | $1,013,751,621 | |||
Shares of beneficial interest outstanding | 104,127,403 |
16
Table of Contents
Statement of Assets and Liabilities – continued
| Net assets | Shares outstanding | Net asset value per share (a) | ||||||||||
Class A | $191,461,752 | 20,005,335 | $9.57 | |||||||||
Class B | 18,917,706 | 2,191,209 | 8.63 | |||||||||
Class C | 28,646,774 | 3,394,151 | 8.44 | |||||||||
Class I | 764,857,189 | 77,457,365 | 9.87 | |||||||||
Class R1 | 1,776,955 | 206,503 | 8.60 | |||||||||
Class R2 | 4,357,425 | 469,894 | 9.27 | |||||||||
Class R3 | 1,617,324 | 169,813 | 9.52 | |||||||||
Class R4 | 255,578 | 26,354 | 9.70 | |||||||||
Class 529A | 1,231,404 | 131,631 | 9.35 | |||||||||
Class 529B | 243,226 | 28,623 | 8.50 | |||||||||
Class 529C | 386,288 | 46,525 | 8.30 | |||||||||
| (a) | Maximum offering price per share was equal to the net asset value per share for all share classes, except for Classes A and 529A, for which the maximum offering prices per share were $10.15 [100 / 94.25 x $9.57] and $9.92 [100 / 94.25 x $9.35], respectively. On sales of $50,000 or more, the maximum offering prices of Class A and Class 529A shares are reduced. A contingent deferred sales charge may be imposed on redemptions of Class A, Class B, Class C, Class 529B, and Class 529C shares. Redemption price per share was equal to the net asset value per share for Classes I, R1, R2, R3, R4, and 529A. |
See Notes to Financial Statements
17
Table of Contents
Financial Statements
Year ended 8/31/12
This statement describes how much your fund earned in investment income and accrued in expenses. It also describes any gains and/or losses generated by fund operations.
| Net Investment loss | ||||
Income | ||||
Dividends | $4,632,291 | |||
Interest | 145,980 | |||
Dividends from underlying affiliated funds | 28,103 | |||
Foreign taxes withheld | (6,559 | ) | ||
Total investment income | $4,799,815 | |||
Expenses | ||||
Management fee | $7,050,875 | |||
Distribution and service fees | 1,035,154 | |||
Program manager fees | 1,743 | |||
Shareholder servicing costs | 1,815,928 | |||
Administrative services fee | 148,988 | |||
Independent Trustees’ compensation | 20,110 | |||
Custodian fee | 122,833 | |||
Shareholder communications | 48,870 | |||
Audit and tax fees | 51,234 | |||
Legal fees | 13,145 | |||
Miscellaneous | 164,425 | |||
Total expenses | $10,473,305 | |||
Reduction of expenses by investment adviser and distributor | (4,433 | ) | ||
Net expenses | $10,468,872 | |||
Net investment loss | $(5,669,057 | ) | ||
| Realized and unrealized gain (loss) on investments and foreign currency | ||||
Realized gain (loss) (identified cost basis) | ||||
Investments | $49,525,539 | |||
Foreign currency | 137,288 | |||
Net realized gain (loss) on investments and foreign currency | $49,662,827 | |||
Change in unrealized appreciation (depreciation) | ||||
Investments | $46,882,554 | |||
Translation of assets and liabilities in foreign currencies | (1,288 | ) | ||
Net unrealized gain (loss) on investments | $46,881,266 | |||
Net realized and unrealized gain (loss) on investments | $96,544,093 | |||
Change in net assets from operations | $90,875,036 |
See Notes to Financial Statements
18
Table of Contents
Financial Statements
STATEMENTS OF CHANGES IN NET ASSETS
These statements describe the increases and/or decreases in net assets resulting from operations, any distributions, and any shareholder transactions.
| Years ended 8/31 | ||||||||
| 2012 | 2011 | |||||||
| Change in net assets | ||||||||
| From operations | ||||||||
Net investment loss | $(5,669,057 | ) | $(3,646,147 | ) | ||||
Net realized gain (loss) on investments and | 49,662,827 | 127,578,052 | ||||||
Net unrealized gain (loss) on investments and | 46,881,266 | 39,213,756 | ||||||
Change in net assets from operations | $90,875,036 | $163,145,661 | ||||||
Change in net assets from fund share transactions | $48,781,380 | $(7,931,913 | ) | |||||
Total change in net assets | $139,656,416 | $155,213,748 | ||||||
| Net assets | ||||||||
At beginning of period | 874,095,205 | 718,881,457 | ||||||
At end of period (including accumulated net investment | $1,013,751,621 | $874,095,205 | ||||||
See Notes to Financial Statements
19
Table of Contents
Financial Statements
The financial highlights table is intended to help you understand the fund’s financial performance for the past 5 years. Certain information reflects financial results for a single fund share. The total returns in the table represent the rate by which an investor would have earned (or lost) on an investment in the fund share class (assuming reinvestment of all distributions) held for the entire period.
| Class A | Years ended 8/31 | |||||||||||||||||||
| 2012 | 2011 | 2010 | 2009 | 2008 | ||||||||||||||||
Net asset value, beginning of period | $8.73 | $7.12 | $6.31 | $9.21 | $10.20 | |||||||||||||||
| Income (loss) from investment operations | ||||||||||||||||||||
Net investment loss (d) | $(0.07 | ) | $(0.05 | ) | $(0.04 | ) | $(0.02 | ) | $(0.04 | ) | ||||||||||
Net realized and unrealized gain (loss) | 0.91 | 1.66 | 0.85 | (2.88 | ) | (0.95 | ) | |||||||||||||
Total from investment operations | $0.84 | $1.61 | $0.81 | $(2.90 | ) | $(0.99 | ) | |||||||||||||
Net asset value, end of period (x) | $9.57 | $8.73 | $7.12 | $6.31 | $9.21 | |||||||||||||||
Total return (%) (r)(s)(t)(x) | 9.62 | 22.61 | 12.84 | (31.49 | ) | (9.71 | ) | |||||||||||||
| Ratios (%) (to average net assets) and Supplemental data: | ||||||||||||||||||||
Expenses before expense reductions (f) | 1.26 | 1.28 | 1.34 | 1.42 | 1.31 | |||||||||||||||
Expenses after expense reductions (f) | 1.25 | 1.28 | 1.34 | 1.42 | 1.31 | |||||||||||||||
Net investment loss | (0.74 | ) | (0.52 | ) | (0.60 | ) | (0.38 | ) | (0.39 | ) | ||||||||||
Portfolio turnover | 63 | 86 | 78 | 141 | 86 | |||||||||||||||
Net assets at end of period (000 omitted) | $191,462 | $196,911 | $167,816 | $155,565 | $295,672 | |||||||||||||||
| Class B | Years ended 8/31 | |||||||||||||||||||
| 2012 | 2011 | 2010 | 2009 | 2008 | ||||||||||||||||
Net asset value, beginning of period | $7.94 | $6.52 | $5.82 | $8.56 | $9.56 | |||||||||||||||
| Income (loss) from investment operations | ||||||||||||||||||||
Net investment loss (d) | $(0.12 | ) | $(0.10 | ) | $(0.09 | ) | $(0.06 | ) | $(0.11 | ) | ||||||||||
Net realized and unrealized gain (loss) | 0.81 | 1.52 | 0.79 | (2.68 | ) | (0.89 | ) | |||||||||||||
Total from investment operations | $0.69 | $1.42 | $0.70 | $(2.74 | ) | $(1.00 | ) | |||||||||||||
Net asset value, end of period (x) | $8.63 | $7.94 | $6.52 | $5.82 | $8.56 | |||||||||||||||
Total return (%) (r)(s)(t)(x) | 8.69 | 21.78 | 12.03 | (32.01 | ) | (10.46 | ) | |||||||||||||
| Ratios (%) (to average net assets) and Supplemental data: | ||||||||||||||||||||
Expenses before expense reductions (f) | 2.01 | 2.03 | 2.09 | 2.18 | 2.06 | |||||||||||||||
Expenses after expense reductions (f) | 2.01 | 2.03 | 2.09 | 2.18 | 2.06 | |||||||||||||||
Net investment loss | (1.49 | ) | (1.24 | ) | (1.37 | ) | (1.11 | ) | (1.14 | ) | ||||||||||
Portfolio turnover | 63 | 86 | 78 | 141 | 86 | |||||||||||||||
Net assets at end of period (000 omitted) | $18,918 | $24,759 | $29,392 | $46,214 | $124,124 | |||||||||||||||
See Notes to Financial Statements
20
Table of Contents
Financial Highlights – continued
| Class C | Years ended 8/31 | |||||||||||||||||||
| 2012 | 2011 | 2010 | 2009 | 2008 | ||||||||||||||||
Net asset value, beginning of period | $7.76 | $6.38 | $5.69 | $8.36 | $9.34 | |||||||||||||||
| Income (loss) from investment operations | ||||||||||||||||||||
Net investment loss (d) | $(0.12 | ) | $(0.10 | ) | $(0.09 | ) | $(0.06 | ) | $(0.10 | ) | ||||||||||
Net realized and unrealized gain (loss) | 0.80 | 1.48 | 0.78 | (2.61 | ) | (0.88 | ) | |||||||||||||
Total from investment operations | $0.68 | $1.38 | $0.69 | $(2.67 | ) | $(0.98 | ) | |||||||||||||
Net asset value, end of period (x) | $8.44 | $7.76 | $6.38 | $5.69 | $8.36 | |||||||||||||||
Total return (%) (r)(s)(t)(x) | 8.76 | 21.63 | 12.13 | (31.94 | ) | (10.49 | ) | |||||||||||||
| Ratios (%) (to average net assets) and Supplemental data: | ||||||||||||||||||||
Expenses before expense reductions (f) | 2.01 | 2.03 | 2.09 | 2.17 | 2.06 | |||||||||||||||
Expenses after expense reductions (f) | 2.01 | 2.03 | 2.09 | 2.17 | 2.06 | |||||||||||||||
Net investment loss | (1.49 | ) | (1.26 | ) | (1.35 | ) | (1.12 | ) | (1.14 | ) | ||||||||||
Portfolio turnover | 63 | 86 | 78 | 141 | 86 | |||||||||||||||
Net assets at end of period (000 omitted) | $28,647 | $29,123 | $26,724 | $26,786 | $47,725 | |||||||||||||||
| Class I | Years ended 8/31 | |||||||||||||||||||
| 2012 | 2011 | 2010 | 2009 | 2008 | ||||||||||||||||
Net asset value, beginning of period | $8.99 | $7.31 | $6.46 | $9.40 | $10.40 | |||||||||||||||
| Income (loss) from investment operations | ||||||||||||||||||||
Net investment loss (d) | $(0.05 | ) | $(0.02 | ) | $(0.03 | ) | $(0.01 | ) | $(0.01 | ) | ||||||||||
Net realized and unrealized gain (loss) | 0.93 | 1.70 | 0.88 | (2.93 | ) | (0.99 | ) | |||||||||||||
Total from investment operations | $0.88 | $1.68 | $0.85 | $(2.94 | ) | $(1.00 | ) | |||||||||||||
Net asset value, end of period (x) | $9.87 | $8.99 | $7.31 | $6.46 | $9.40 | |||||||||||||||
Total return (%) (r)(s)(x) | 9.79 | 22.98 | 13.16 | (31.28 | ) | (9.62 | ) | |||||||||||||
| Ratios (%) (to average net assets) and Supplemental data: | ||||||||||||||||||||
Expenses before expense reductions (f) | 1.00 | 1.03 | 1.09 | 1.17 | 1.06 | |||||||||||||||
Expenses after expense reductions (f) | 1.00 | 1.03 | 1.09 | 1.17 | 1.06 | |||||||||||||||
Net investment loss | (0.49 | ) | (0.27 | ) | (0.35 | ) | (0.13 | ) | (0.13 | ) | ||||||||||
Portfolio turnover | 63 | 86 | 78 | 141 | 86 | |||||||||||||||
Net assets at end of period (000 omitted) | $764,857 | $613,721 | $486,162 | $458,652 | $546,398 | |||||||||||||||
See Notes to Financial Statements
21
Table of Contents
Financial Highlights – continued
| Class R1 | Years ended 8/31 | |||||||||||||||||||
| 2012 | 2011 | 2010 | 2009 | 2008 | ||||||||||||||||
Net asset value, beginning of period | $7.91 | $6.50 | $5.80 | $8.53 | �� | $9.53 | ||||||||||||||
| Income (loss) from investment operations | ||||||||||||||||||||
Net investment loss (d) | $(0.12 | ) | $(0.10 | ) | $(0.09 | ) | $(0.06 | ) | $(0.11 | ) | ||||||||||
Net realized and unrealized gain (loss) | 0.81 | 1.51 | 0.79 | (2.67 | ) | (0.89 | ) | |||||||||||||
Total from investment operations | $0.69 | $1.41 | $0.70 | $(2.73 | ) | $(1.00 | ) | |||||||||||||
Net asset value, end of period (x) | $8.60 | $7.91 | $6.50 | $5.80 | $8.53 | |||||||||||||||
Total return (%) (r)(s)(x) | 8.72 | 21.69 | 12.07 | (32.00 | ) | (10.49 | ) | |||||||||||||
| Ratios (%) (to average net assets) and Supplemental data: | ||||||||||||||||||||
Expenses before expense reductions (f) | 2.01 | 2.03 | 2.09 | 2.17 | 2.11 | |||||||||||||||
Expenses after expense reductions (f) | 2.01 | 2.03 | 2.09 | 2.17 | 2.11 | |||||||||||||||
Net investment loss | (1.49 | ) | (1.26 | ) | (1.35 | ) | (1.13 | ) | (1.17 | ) | ||||||||||
Portfolio turnover | 63 | 86 | 78 | 141 | 86 | |||||||||||||||
Net assets at end of period (000 omitted) | $1,777 | $1,861 | $1,811 | $1,844 | $2,632 | |||||||||||||||
| Class R2 | Years ended 8/31 | |||||||||||||||||||
| 2012 | 2011 | 2010 | 2009 | 2008 | ||||||||||||||||
Net asset value, beginning of period | $8.48 | $6.94 | $6.16 | $9.01 | $10.02 | |||||||||||||||
| Income (loss) from investment operations | ||||||||||||||||||||
Net investment loss (d) | $(0.09 | ) | $(0.07 | ) | $(0.06 | ) | $(0.03 | ) | $(0.06 | ) | ||||||||||
Net realized and unrealized gain (loss) | 0.88 | 1.61 | 0.84 | (2.82 | ) | (0.95 | ) | |||||||||||||
Total from investment operations | $0.79 | $1.54 | $0.78 | $(2.85 | ) | $(1.01 | ) | |||||||||||||
Net asset value, end of period (x) | $9.27 | $8.48 | $6.94 | $6.16 | $9.01 | |||||||||||||||
Total return (%) (r)(s)(x) | 9.32 | 22.19 | 12.66 | (31.63 | ) | (10.08 | ) | |||||||||||||
| Ratios (%) (to average net assets) and Supplemental data: | ||||||||||||||||||||
Expenses before expense reductions (f) | 1.51 | 1.53 | 1.59 | 1.67 | 1.60 | |||||||||||||||
Expenses after expense reductions (f) | 1.51 | 1.53 | 1.59 | 1.67 | 1.60 | |||||||||||||||
Net investment loss | (0.99 | ) | (0.76 | ) | (0.85 | ) | (0.61 | ) | (0.65 | ) | ||||||||||
Portfolio turnover | 63 | 86 | 78 | 141 | 86 | |||||||||||||||
Net assets at end of period (000 omitted) | $4,357 | $4,614 | $4,143 | $4,233 | $7,216 | |||||||||||||||
See Notes to Financial Statements
22
Table of Contents
Financial Highlights – continued
| Class R3 | Years ended 8/31 | |||||||||||||||||||
| 2012 | 2011 | 2010 | 2009 | 2008 | ||||||||||||||||
Net asset value, beginning of period | $8.69 | $7.09 | $6.28 | $9.17 | $10.17 | |||||||||||||||
| Income (loss) from investment operations | ||||||||||||||||||||
Net investment loss (d) | $(0.07 | ) | $(0.04 | ) | $(0.04 | ) | $(0.02 | ) | $(0.04 | ) | ||||||||||
Net realized and unrealized gain (loss) | 0.90 | 1.64 | 0.85 | (2.87 | ) | (0.96 | ) | |||||||||||||
Total from investment operations | $0.83 | $1.60 | $0.81 | $(2.89 | ) | $(1.00 | ) | |||||||||||||
Net asset value, end of period (x) | $9.52 | $8.69 | $7.09 | $6.28 | $9.17 | |||||||||||||||
Total return (%) (r)(s)(x) | 9.55 | 22.57 | 12.90 | (31.52 | ) | (9.83 | ) | |||||||||||||
| Ratios (%) (to average net assets) and Supplemental data: | ||||||||||||||||||||
Expenses before expense reductions (f) | 1.25 | 1.28 | 1.34 | 1.43 | 1.36 | |||||||||||||||
Expenses after expense reductions (f) | 1.25 | 1.28 | 1.34 | 1.42 | 1.36 | |||||||||||||||
Net investment loss | (0.74 | ) | (0.49 | ) | (0.61 | ) | (0.39 | ) | (0.44 | ) | ||||||||||
Portfolio turnover | 63 | 86 | 78 | 141 | 86 | |||||||||||||||
Net assets at end of period (000 omitted) | $1,617 | $1,364 | $1,478 | $1,544 | $2,732 | |||||||||||||||
| Class R4 | Years ended 8/31 | |||||||||||||||||||
| 2012 | 2011 | 2010 | 2009 | 2008 | ||||||||||||||||
Net asset value, beginning of period | $8.82 | $7.18 | $6.34 | $9.24 | $10.24 | |||||||||||||||
| Income (loss) from investment operations | ||||||||||||||||||||
Net investment loss (d) | $(0.05 | ) | $(0.02 | ) | $(0.03 | ) | $(0.01 | ) | $(0.02 | ) | ||||||||||
Net realized and unrealized gain (loss) | 0.93 | 1.66 | 0.87 | (2.89 | ) | (0.98 | ) | |||||||||||||
Total from investment operations | $0.88 | $1.64 | $0.84 | $(2.90 | ) | $(1.00 | ) | |||||||||||||
Net asset value, end of period (x) | $9.70 | $8.82 | $7.18 | $6.34 | $9.24 | |||||||||||||||
Total return (%) (r)(s)(x) | 9.98 | 22.84 | 13.25 | (31.39 | ) | (9.77 | ) | |||||||||||||
| Ratios (%) (to average net assets) and Supplemental data: | ||||||||||||||||||||
Expenses before expense reductions (f) | 1.00 | 1.03 | 1.09 | 1.12 | 1.10 | |||||||||||||||
Expenses after expense reductions (f) | 1.00 | 1.03 | 1.09 | 1.11 | 1.10 | |||||||||||||||
Net investment loss | (0.49 | ) | (0.27 | ) | (0.35 | ) | (0.07 | ) | (0.19 | ) | ||||||||||
Portfolio turnover | 63 | 86 | 78 | 141 | 86 | |||||||||||||||
Net assets at end of period (000 omitted) | $256 | $199 | $159 | $136 | $14,351 | |||||||||||||||
See Notes to Financial Statements
23
Table of Contents
Financial Highlights – continued
| Class 529A | Years ended 8/31 | |||||||||||||||||||
| 2012 | 2011 | 2010 | 2009 | 2008 | ||||||||||||||||
Net asset value, beginning of period | $8.54 | $6.97 | $6.18 | $9.04 | $10.05 | |||||||||||||||
| Income (loss) from investment operations | ||||||||||||||||||||
Net investment loss (d) | $(0.07 | ) | $(0.05 | ) | $(0.05 | ) | $(0.03 | ) | $(0.06 | ) | ||||||||||
Net realized and unrealized gain (loss) | 0.88 | 1.62 | 0.84 | (2.83 | ) | (0.95 | ) | |||||||||||||
Total from investment operations | $0.81 | $1.57 | $0.79 | $(2.86 | ) | $(1.01 | ) | |||||||||||||
Net asset value, end of period (x) | $9.35 | $8.54 | $6.97 | $6.18 | $9.04 | |||||||||||||||
Total return (%) (r)(s)(t)(x) | 9.48 | 22.53 | 12.78 | (31.64 | ) | (10.05 | ) | |||||||||||||
| Ratios (%) (to average net assets) and Supplemental data: | ||||||||||||||||||||
Expenses before expense reductions (f) | 1.35 | 1.38 | 1.44 | 1.57 | 1.60 | |||||||||||||||
Expenses after expense reductions (f) | 1.30 | 1.37 | 1.44 | 1.56 | 1.60 | |||||||||||||||
Net investment loss | (0.79 | ) | (0.62 | ) | (0.69 | ) | (0.52 | ) | (0.67 | ) | ||||||||||
Portfolio turnover | 63 | 86 | 78 | 141 | 86 | |||||||||||||||
Net assets at end of period (000 omitted) | $1,231 | $949 | $685 | $507 | $665 | |||||||||||||||
| Class 529B | Years ended 8/31 | |||||||||||||||||||
| 2012 | 2011 | 2010 | 2009 | 2008 | ||||||||||||||||
Net asset value, beginning of period | $7.81 | $6.42 | $5.73 | $8.45 | $9.45 | |||||||||||||||
| Income (loss) from investment operations | ||||||||||||||||||||
Net investment loss (d) | $(0.12 | ) | $(0.11 | ) | $(0.09 | ) | $(0.07 | ) | $(0.12 | ) | ||||||||||
Net realized and unrealized gain (loss) | 0.81 | 1.50 | 0.78 | (2.65 | ) | (0.88 | ) | |||||||||||||
Total from investment operations | $0.69 | $1.39 | $0.69 | $(2.72 | ) | $(1.00 | ) | |||||||||||||
Net asset value, end of period (x) | $8.50 | $7.81 | $6.42 | $5.73 | $8.45 | |||||||||||||||
Total return (%) (r)(s)(t)(x) | 8.83 | 21.65 | 12.04 | (32.19 | ) | (10.58 | ) | |||||||||||||
| Ratios (%) (to average net assets) and Supplemental data: | ||||||||||||||||||||
Expenses before expense reductions (f) | 2.11 | 2.13 | 2.19 | 2.25 | 2.25 | |||||||||||||||
Expenses after expense reductions (f) | 2.06 | 2.12 | 2.19 | 2.25 | 2.25 | |||||||||||||||
Net investment loss | (1.54 | ) | (1.34 | ) | (1.44 | ) | (1.27 | ) | (1.32 | ) | ||||||||||
Portfolio turnover | 63 | 86 | 78 | 141 | 86 | |||||||||||||||
Net assets at end of period (000 omitted) | $243 | $264 | $271 | $219 | $170 | |||||||||||||||
See Notes to Financial Statements
24
Table of Contents
Financial Highlights – continued
| Class 529C | Years ended 8/31 | |||||||||||||||||||
| 2012 | 2011 | 2010 | 2009 | 2008 | ||||||||||||||||
Net asset value, beginning of period | $7.63 | $6.28 | $5.61 | $8.26 | $9.24 | |||||||||||||||
| Income (loss) from investment operations | ||||||||||||||||||||
Net investment loss (d) | $(0.12 | ) | $(0.11 | ) | $(0.09 | ) | $(0.06 | ) | $(0.12 | ) | ||||||||||
Net realized and unrealized gain (loss) | 0.79 | 1.46 | 0.76 | (2.59 | ) | (0.86 | ) | |||||||||||||
Total from investment operations | $0.67 | $1.35 | $0.67 | $(2.65 | ) | $(0.98 | ) | |||||||||||||
Net asset value, end of period (x) | $8.30 | $7.63 | $6.28 | $5.61 | $8.26 | |||||||||||||||
Total return (%) (r)(s)(t)(x) | 8.78 | 21.50 | 11.94 | (32.08 | ) | (10.61 | ) | |||||||||||||
| Ratios (%) (to average net assets) and Supplemental data: | ||||||||||||||||||||
Expenses before expense reductions (f) | 2.10 | 2.13 | 2.19 | 2.27 | 2.25 | |||||||||||||||
Expenses after expense reductions (f) | 2.05 | 2.12 | 2.19 | 2.27 | 2.25 | |||||||||||||||
Net investment loss | (1.54 | ) | (1.37 | ) | (1.45 | ) | (1.24 | ) | (1.32 | ) | ||||||||||
Portfolio turnover | 63 | 86 | 78 | 141 | 86 | |||||||||||||||
Net assets at end of period (000 omitted) | $386 | $330 | $239 | $205 | $281 | |||||||||||||||
| (d) | Per share data is based on average shares outstanding. |
| (f) | Ratios do not reflect reductions from fees paid indirectly, if applicable. |
| (r) | Certain expenses have been reduced without which performance would have been lower. |
| (s) | From time to time the fund may receive proceeds from litigation settlements, without which performance would be lower. |
| (t) | Total returns do not include any applicable sales charges. |
| (x) | The net asset values per share and total returns have been calculated on net assets which include adjustments made in accordance with U.S. generally accepted accounting principles required at period end for financial reporting purposes. |
See Notes to Financial Statements
25
Table of Contents
(1) Business and Organization
MFS Mid Cap Growth Fund (the fund) is a series of MFS Series Trust IV (the trust). The trust is organized as a Massachusetts business trust and is registered under the Investment Company Act of 1940, as amended, as an open-end management investment company.
(2) Significant Accounting Policies
General – The preparation of financial statements in conformity with U.S. generally accepted accounting principles requires management to make estimates and assumptions that affect the reported amounts of assets and liabilities, and disclosure of contingent assets and liabilities at the date of the financial statements and the reported amounts of revenues and expenses during the reporting period. Actual results could differ from those estimates. In the preparation of these financial statements, management has evaluated subsequent events occurring after the date of the fund’s Statement of Assets and Liabilities through the date that the financial statements were issued. The fund invests in foreign securities. Investments in foreign securities are vulnerable to the effects of changes in the relative values of the local currency and the U.S. dollar and to the effects of changes in each country’s legal, political, and economic environment.
In this reporting period the fund adopted FASB Accounting Standards Update 2011-04, Fair Value Measurement (Topic 820) – Amendments to Achieve Common Fair Value Measurement and Disclosure Requirements in U.S. GAAP and IFRSs (“ASU 2011-04”). ASU 2011-04 seeks to improve the comparability of fair value measurements as presented and disclosed in financial statements prepared in accordance with U.S. GAAP and International Financial Reporting Standards (IFRS) by providing common requirements for fair value measurement and disclosure.
In December 2011, the Financial Accounting Standards Board issued Accounting Standards Update 2011-11, Balance Sheet (Topic 210) – Disclosures about Offsetting Assets and Liabilities (“ASU 2011-11”). Effective for annual reporting periods beginning on or after January 1, 2013 and interim periods within those annual periods, ASU 2011-11 is intended to enhance disclosure requirements on the offsetting of financial assets and liabilities. Although still evaluating the potential impacts of ASU 2011-11 to the fund, management expects that the impact of the fund’s adoption will be limited to additional financial statement disclosures.
Investment Valuations – Equity securities, including restricted equity securities, are generally valued at the last sale or official closing price as provided by a third-party pricing service on the market or exchange on which they are primarily traded. Equity securities, for which there were no sales reported that day, are generally valued at the last quoted daily bid quotation as provided by a third-party pricing service on the market or exchange on which such securities are primarily traded. Short-term instruments with a maturity at issuance of 60 days or less generally are valued at amortized cost, which approximates market value. Open-end investment companies are generally valued at net asset value per share. Securities and other assets generally valued on the basis of information from a third-party pricing service may also be valued at a broker/dealer bid quotation. Values obtained from third-party pricing services can
26
Table of Contents
Notes to Financial Statements – continued
utilize both transaction data and market information such as yield, quality, coupon rate, maturity, type of issue, trading characteristics, and other market data. The values of foreign securities and other assets and liabilities expressed in foreign currencies are converted to U.S. dollars using the mean of bid and asked prices for rates provided by a third-party pricing service.
The Board of Trustees has delegated primary responsibility for determining or causing to be determined the value of the fund’s investments (including any fair valuation) to the adviser pursuant to valuation policies and procedures approved by the Board. If the adviser determines that reliable market quotations are not readily available, investments are valued at fair value as determined in good faith by the adviser in accordance with such procedures under the oversight of the Board of Trustees. Under the fund’s valuation policies and procedures, market quotations are not considered to be readily available for most types of debt instruments and floating rate loans and many types of derivatives. These investments are generally valued at fair value based on information from third-party pricing services. In addition, investments may be valued at fair value if the adviser determines that an investment’s value has been materially affected by events occurring after the close of the exchange or market on which the investment is principally traded (such as foreign exchange or market) and prior to the determination of the fund’s net asset value, or after the halting of trading of a specific security where trading does not resume prior to the close of the exchange or market on which the security is principally traded. Events that occur on a frequent basis after foreign markets close (such as developments in foreign markets and significant movements in the U.S. markets) and prior to the determination of the fund’s net asset value may be deemed to have a material effect on the value of securities traded in foreign markets. Accordingly, the fund’s foreign equity securities may often be valued at fair value. The adviser generally relies on third-party pricing services or other information (such as the correlation with price movements of similar securities in the same or other markets; the type, cost and investment characteristics of the security; the business and financial condition of the issuer; and trading and other market data) to assist in determining whether to fair value and at what value to fair value an investment. The value of an investment for purposes of calculating the fund’s net asset value can differ depending on the source and method used to determine value. When fair valuation is used, the value of an investment used to determine the fund’s net asset value may differ from quoted or published prices for the same investment. There can be no assurance that the fund could obtain the fair value assigned to an investment if it were to sell the investment at the same time at which the fund determines its net asset value per share.
Various inputs are used in determining the value of the fund’s assets or liabilities. These inputs are categorized into three broad levels. In certain cases, the inputs used to measure fair value may fall into different levels of the fair value hierarchy. In such cases, an investment’s level within the fair value hierarchy is based on the lowest level of input that is significant to the fair value measurement. The fund’s assessment of the significance of a particular input to the fair value measurement in its entirety requires judgment, and considers factors specific to the investment. Level 1 includes unadjusted quoted prices in active markets for identical assets or liabilities. Level 2 includes other significant observable market-based inputs (including quoted prices for similar securities, interest rates, prepayment speed, and credit risk). Level 3 includes
27
Table of Contents
Notes to Financial Statements – continued
unobservable inputs, which may include the adviser’s own assumptions in determining the fair value of investments. The following is a summary of the levels used as of August 31, 2012 in valuing the fund’s assets or liabilities:
| Investments at Value | Level 1 | Level 2 | Level 3 | Total | ||||||||||||
| Equity Securities: | ||||||||||||||||
United States | $951,741,112 | $— | $— | $951,741,112 | ||||||||||||
Canada | 17,333,016 | — | — | 17,333,016 | ||||||||||||
Israel | 9,518,507 | — | — | 9,518,507 | ||||||||||||
Hong Kong | 2,416,416 | 4,281,574 | — | 6,697,990 | ||||||||||||
Denmark | 5,028,286 | — | — | 5,028,286 | ||||||||||||
China | — | 2,927,460 | — | 2,927,460 | ||||||||||||
Brazil | 1,910,914 | — | — | 1,910,914 | ||||||||||||
| Short Term Securities | — | 3,524,770 | — | 3,524,770 | ||||||||||||
| Mutual Funds | 12,080,387 | — | — | 12,080,387 | ||||||||||||
| Total Investments | $1,000,028,638 | $10,733,804 | $— | $1,010,762,442 | ||||||||||||
For further information regarding security characteristics, see the Portfolio of Investments.
Of the level 2 investments presented above, equity investments amounting to $2,927,460 would have been considered level 1 investments at the beginning of the period. The primary reason for changes in the classifications between levels 1 and 2 occurs when foreign equity securities are fair valued using other observable market-based inputs in place of the closing exchange price due to events occurring after the close of the exchange or market on which the investment is principally traded. The fund’s foreign equity securities may often be valued at fair value. The fund’s policy is to recognize transfers between the levels as of the end of the period.
Repurchase Agreements – The fund entered into repurchase agreements with approved counterparties. Each repurchase agreement is recorded at cost. The fund requires that the securities collateral in a repurchase transaction be transferred to a custodian. The fund monitors, on a daily basis, the value of the collateral to ensure that its value, including accrued interest, is greater than amounts owed to the fund under each such repurchase agreement.
Foreign Currency Translation – Purchases and sales of foreign investments, income, and expenses are converted into U.S. dollars based upon currency exchange rates prevailing on the respective dates of such transactions or on the reporting date for foreign denominated receivables and payables. Gains and losses attributable to foreign currency exchange rates on sales of securities are recorded for financial statement purposes as net realized gains and losses on investments. Gains and losses attributable to foreign exchange rate movements on receivables, payables, income and expenses are recorded for financial statement purposes as foreign currency transaction gains and losses. That portion of both realized and unrealized gains and losses on investments that results from fluctuations in foreign currency exchange rates is not separately disclosed.
Security Loans – JPMorgan Chase and Co. (“Chase”), as lending agent, loans the securities of the fund to certain qualified institutions (the “Borrowers”) approved by
28
Table of Contents
Notes to Financial Statements – continued
the fund. The loans are collateralized by cash and/or U.S. Treasury and federal agency obligations in an amount typically at least equal to the market value of the securities loaned. The market value of the loaned securities is determined at the close of business of the fund and any additional required collateral is delivered to the fund on the next business day. Chase provides the fund with indemnification against Borrower default. The fund bears the risk of loss with respect to the investment of cash collateral. On loans collateralized by cash, the cash collateral is invested in short-term securities. A portion of the income generated upon investment of the collateral is remitted to the Borrowers, and the remainder is allocated between the fund and the lending agent. On loans collateralized by U.S. Treasury and/or federal agency obligations, a fee is received from the Borrower, and is allocated between the fund and the lending agent. Income from securities lending is included in “Interest” income on the Statement of Operations. The dividend and interest income earned on the securities loaned is accounted for in the same manner as other dividend and interest income.
Indemnifications – Under the fund’s organizational documents, its officers and Trustees may be indemnified against certain liabilities and expenses arising out of the performance of their duties to the fund. Additionally, in the normal course of business, the fund enters into agreements with service providers that may contain indemnification clauses. The fund’s maximum exposure under these agreements is unknown as this would involve future claims that may be made against the fund that have not yet occurred.
Investment Transactions and Income – Investment transactions are recorded on the trade date. Interest income is recorded on the accrual basis. Dividends received in cash are recorded on the ex-dividend date. Certain dividends from foreign securities will be recorded when the fund is informed of the dividend if such information is obtained subsequent to the ex-dividend date. Dividend and interest payments received in additional securities are recorded on the ex-dividend or ex-interest date in an amount equal to the value of the security on such date.
The fund may receive proceeds from litigation settlements. Any proceeds received from litigation involving portfolio holdings are reflected in the Statement of Operations in realized gain/loss if the security has been disposed of by the fund or in unrealized gain/loss if the security is still held by the fund. Any other proceeds from litigation not related to portfolio holdings are reflected as other income in the Statement of Operations.
Fees Paid Indirectly – The fund’s custody fee may be reduced according to an arrangement that measures the value of cash deposited with the custodian by the fund. For the year ended August 31, 2012, custody fees were not reduced.
Tax Matters and Distributions – The fund intends to qualify as a regulated investment company, as defined under Subchapter M of the Internal Revenue Code, and to distribute all of its taxable income, including realized capital gains. As a result, no provision for federal income tax is required. The fund’s federal tax returns, when filed, will remain subject to examination by the Internal Revenue Service for a three year period. Foreign taxes have been accrued by the fund in the accompanying financial statements.
29
Table of Contents
Notes to Financial Statements – continued
Distributions to shareholders are recorded on the ex-dividend date. Income and capital gain distributions are determined in accordance with income tax regulations, which may differ from U.S. generally accepted accounting principles. Certain capital accounts in the financial statements are periodically adjusted for permanent differences in order to reflect their tax character. These adjustments have no impact on net assets or net asset value per share. Temporary differences which arise from recognizing certain items of income, expense, gain or loss in different periods for financial statement and tax purposes will reverse at some time in the future. Distributions in excess of net investment income or net realized gains are temporary overdistributions for financial statement purposes resulting from differences in the recognition or classification of income or distributions for financial statement and tax purposes.
Book/tax differences primarily relate to net operating losses.
The fund declared no distributions for the years ended August 31, 2012 and August 31, 2011.
The federal tax cost and the tax basis components of distributable earnings were as follows:
| As of 8/31/12 | ||||
| Cost of investments | $865,359,483 | |||
| Gross appreciation | 177,556,552 | |||
| Gross depreciation | (32,153,593 | ) | ||
| Net unrealized appreciation (depreciation) | $145,402,959 | |||
| Capital loss carryforwards | (262,415,197 | ) | ||
| Post-October capital loss deferral | (15,666,859 | ) | ||
| Late year ordinary loss deferral | (4,172,179 | ) | ||
| Other temporary differences | (36,169 | ) | ||
Under the Regulated Investment Company Modernization Act of 2010 (the “Act”), net capital losses recognized after August 31, 2011 may be carried forward indefinitely, and their character is retained as short-term and/or long-term losses. Previously, net capital losses were carried forward for eight years and treated as short-term losses. As a transition rule, the Act requires that post-enactment net capital losses be used before pre-enactment net capital losses.
As of August 31, 2012, the fund had capital loss carryforwards available to offset future realized gains. Such losses expire as follows:
| Pre-enactment losses: | ||||
| 8/31/17 | $(22,350,946 | ) | ||
| 8/31/18 | (240,064,251 | ) | ||
| Total | $(262,415,197 | ) | ||
Multiple Classes of Shares of Beneficial Interest – The fund offers multiple classes of shares, which differ in their respective distribution, service, and program manager fees. The fund’s income, realized and unrealized gain (loss), and common expenses are allocated to shareholders based on the daily net assets of each class. Dividends are declared separately for each class. Differences in per share dividend rates are generally
30
Table of Contents
Notes to Financial Statements – continued
due to differences in separate class expenses. Class B and Class 529B shares will convert to Class A and Class 529A shares, respectively, approximately eight years after purchase.
(3) Transactions with Affiliates
Investment Adviser – The fund has an investment advisory agreement with MFS to provide overall investment management and related administrative services and facilities to the fund. The management fee is computed daily and paid monthly at the following annual rates:
| First $3 billion of average daily net assets | 0.75 | % | ||
| Average daily net assets in excess of $3 billion | 0.70 | % |
The investment adviser has agreed in writing to reduce its management fee to 0.70% of average daily net assets in excess of $1 billion. This written agreement will continue until modified by the fund’s Board of Trustees, but such agreement will continue at least until December 31, 2013. For the year ended August 31, 2012, the fund’s average daily net assets did not exceed the limit and therefore, the investment adviser did not pay any portion of the fund’s expenses related to this agreement.
The management fee incurred for the year ended August 31, 2012 was equivalent to an annual effective rate of 0.75% of the fund’s average daily net assets.
Effective January 1, 2013, the investment adviser has agreed in writing to pay a portion of the fund’s total annual operating expenses, exclusive of interest, taxes, extraordinary expenses, brokerage and transaction costs, and investment-related expenses such that total annual fund operating expenses do not exceed the following rates annually of each class’ average daily net assets.
| Classes | ||||||||||||||||||||||||||||||||||||||||
| A | B | C | I | R1 | R2 | R3 | R4 | 529A | 529B | 529C | ||||||||||||||||||||||||||||||
1.30% | 2.05% | 2.05% | 1.05% | 2.05% | 1.55% | 1.30% | 1.05% | 1.35% | 2.10% | 2.10% | ||||||||||||||||||||||||||||||
This written agreement will continue until modified by the fund’s Board of Trustees, but such agreement will continue at least until December 31, 2013.
Distributor – MFS Fund Distributors, Inc. (MFD), a wholly-owned subsidiary of MFS, as distributor, received $17,340 and $1,190 for the year ended August 31, 2012, as its portion of the initial sales charge on sales of Class A and Class 529A shares of the fund, respectively.
The Board of Trustees has adopted a distribution plan for certain class shares pursuant to Rule 12b-1 of the Investment Company Act of 1940.
The fund’s distribution plan provides that the fund will pay MFD for services provided by MFD and financial intermediaries in connection with the distribution and servicing of certain share classes. One component of the plan is a distribution fee paid to MFD and another component of the plan is a service fee paid to MFD. MFD may subsequently pay all, or a portion, of the distribution and/or service fees to financial intermediaries.
31
Table of Contents
Notes to Financial Statements – continued
Distribution Plan Fee Table:
| Distribution Fee Rate (d) | Service Fee Rate (d) | Total Distribution Plan (d) | Annual Effective Rate (e) | Distribution and Service Fee | ||||||||||||||||
| Class A | — | 0.25% | 0.25% | 0.25% | $483,099 | |||||||||||||||
| Class B | 0.75% | 0.25% | 1.00% | 1.00% | 214,931 | |||||||||||||||
| Class C | 0.75% | 0.25% | 1.00% | 1.00% | 284,470 | |||||||||||||||
| Class R1 | 0.75% | 0.25% | 1.00% | 1.00% | 17,746 | |||||||||||||||
| Class R2 | 0.25% | 0.25% | 0.50% | 0.50% | 22,152 | |||||||||||||||
| Class R3 | — | 0.25% | 0.25% | 0.25% | 3,737 | |||||||||||||||
| Class 529A | — | 0.25% | 0.25% | 0.25% | 2,804 | |||||||||||||||
| Class 529B | 0.75% | 0.25% | 1.00% | 1.00% | 2,560 | |||||||||||||||
| Class 529C | 0.75% | 0.25% | 1.00% | 1.00% | 3,655 | |||||||||||||||
| Total Distribution and Service Fees | $1,035,154 | |||||||||||||||||||
| (d) | In accordance with the distribution plan for certain classes, the fund pays distribution and/or service fees equal to these annual percentage rates of each class’ average daily net assets. The distribution and service fee rates disclosed by class represent the current rates in effect at the end of the reporting period. |
| (e) | The annual effective rates represent actual fees incurred under the distribution plan for the year ended August 31, 2012 based on each class’ average daily net assets. |
Certain Class A shares are subject to a contingent deferred sales charge (CDSC) in the event of a shareholder redemption within 18 months of purchase for shares purchased on or after August 1, 2012, and within 24 months of purchase for shares purchased prior to August 1, 2012. Class C and Class 529C shares are subject to a CDSC in the event of a shareholder redemption within 12 months of purchase. Class B and Class 529B shares are subject to a CDSC in the event of a shareholder redemption within six years of purchase. All contingent deferred sales charges are paid to MFD and during the year ended August 31, 2012, were as follows:
| Amount | ||||
| Class A | $290 | |||
| Class B | 31,486 | |||
| Class C | 2,253 | |||
| Class 529B | — | |||
| Class 529C | 18 | |||
The fund has entered into and may from time to time enter into contracts with program managers and other parties which administer the tuition programs through which an investment in the fund’s 529 share classes is made. The fund has entered into an agreement with MFD pursuant to which MFD receives an annual fee of up to 0.10% of the average daily net assets attributable to each 529 share class. MFD has agreed to waive a portion of this fee in an amount equal to 0.05% of the average daily net assets for each 529 share class. This waiver agreement will continue until modified by the fund’s Board of Trustees, but such agreement will continue at least until December 31, 2013, after which MFD may eliminate this waiver without a vote of the fund’s Board of Trustees. For the year ended August 31, 2012, this waiver amounted to $872 and is reflected as a reduction of total expenses in the Statement of Operations. The program manager fee incurred for the year ended August 31, 2012
32
Table of Contents
Notes to Financial Statements – continued
was equivalent to an annual effective rate of 0.05% of the average daily net assets attributable to each 529 share class. The services provided by MFD, or a third party with which MFD contracts, include recordkeeping and tax reporting and account services, as well as services designed to maintain the program’s compliance with the Internal Revenue Code and other regulatory requirements. Program manager fees and waivers for the year ended August 31, 2012, were as follows:
| Fee | Waiver | |||||||
| Class 529A | $1,122 | $561 | ||||||
| Class 529B | 256 | 128 | ||||||
| Class 529C | 365 | 183 | ||||||
| Total Program Manager Fees and Waivers | $1,743 | $872 | ||||||
Shareholder Servicing Agent – MFS Service Center, Inc. (MFSC), a wholly-owned subsidiary of MFS, receives a fee from the fund for its services as shareholder servicing agent calculated as a percentage of the average daily net assets of the fund as determined periodically under the supervision of the fund’s Board of Trustees. For the year ended August 31, 2012, the fee was $451,985, which equated to 0.0481% annually of the fund’s average daily net assets. MFSC also receives payment from the fund for out-of-pocket expenses, sub-accounting and other shareholder servicing costs which may be paid to affiliated and unaffiliated service providers. For the year ended August 31, 2012, these out-of-pocket expenses, sub-accounting and other shareholder servicing costs amounted to $461,138.
Under a Special Servicing Agreement among MFS, each MFS fund which invests in other MFS funds (“MFS fund-of-funds”) and certain underlying funds in which a MFS fund-of-funds invests (“underlying funds”), each underlying fund may pay a portion of each MFS fund-of-fund’s transfer agent-related expenses, including sub-accounting fees payable to financial intermediaries, to the extent such payments do not exceed the benefits realized or expected to be realized by the underlying fund from the investment in the underlying fund by the MFS fund-of-fund. For the year ended August 31, 2012, these costs for the fund amounted to $902,805 and are reflected in the “Shareholder servicing costs” on the Statement of Operations.
Administrator – MFS provides certain financial, legal, shareholder communications, compliance, and other administrative services to the fund. Under an administrative services agreement, the fund partially reimburses MFS the costs incurred to provide these services. The fund is charged an annual fixed amount of $17,500 plus a fee based on average daily net assets. The administrative services fee incurred for the year ended August 31, 2012 was equivalent to an annual effective rate of 0.0159% of the fund’s average daily net assets.
Trustees’ and Officers’ Compensation – The fund pays compensation to independent Trustees in the form of a retainer, attendance fees, and additional compensation to Board and Committee chairpersons. The fund does not pay compensation directly to Trustees or officers of the fund who are also officers of the investment adviser, all of whom receive remuneration for their services to the fund from MFS. Certain officers and Trustees of the fund are officers or directors of MFS, MFD, and MFSC.
33
Table of Contents
Notes to Financial Statements – continued
Prior to December 31, 2001, the fund had an unfunded defined benefit plan (“DB plan”) for independent Trustees. As of December 31, 2001, the Board took action to terminate the DB plan with respect to then-current and any future independent Trustees, such that the DB plan covers only certain of those former independent Trustees who retired on or before December 31, 2001. Effective January 1, 2002, accrued benefits under the DB plan for then-current independent Trustees who continued were credited to an unfunded retirement deferral plan (the “Retirement Deferral plan”), which was established for and exists solely with respect to these credited amounts, and is not available for other deferrals by these or other independent Trustees. Although the Retirement Deferral plan is unfunded, amounts deferred under the plan are periodically adjusted for investment experience as if they had been invested in shares of the fund. The DB plan resulted in a pension expense of $476 and the Retirement Deferral plan resulted in a net decrease in expense of $436. Both amounts are included in independent Trustees’ compensation for the year ended August 31, 2012. The liability for deferred retirement benefits payable to certain independent Trustees under both plans amounted to $35,218 at August 31, 2012, and is included in “Payable for independent Trustees’ compensation” on the Statement of Assets and Liabilities.
Other – This fund and certain other funds managed by MFS (the funds) have entered into services agreements (the Agreements) which provide for payment of fees by the funds to Tarantino LLC and Griffin Compliance LLC in return for the provision of services of an Independent Chief Compliance Officer (ICCO) and Assistant ICCO, respectively, for the funds. The ICCO and Assistant ICCO are officers of the funds and the sole members of Tarantino LLC and Griffin Compliance LLC, respectively. The funds can terminate the Agreements with Tarantino LLC and Griffin Compliance LLC at any time under the terms of the Agreements. For the year ended August 31, 2012, the aggregate fees paid by the fund to Tarantino LLC and Griffin Compliance LLC were $8,152 and are included in “Miscellaneous” expense on the Statement of Operations. MFS has agreed to reimburse the fund for a portion of the payments made by the fund in the amount of $3,561, which is shown as a reduction of total expenses in the Statement of Operations. Additionally, MFS has agreed to bear all expenses associated with office space, other administrative support, and supplies provided to the ICCO and Assistant ICCO.
The fund invests in the MFS Institutional Money Market Portfolio which is managed by MFS and seeks a high level of current income consistent with preservation of capital and liquidity. Income earned on this investment is included in “Dividends from underlying affiliated funds” on the Statement of Operations. This money market fund does not pay a management fee to MFS.
(4) Portfolio Securities
Purchases and sales of investments, other than U.S. Government securities, and short-term obligations, aggregated $636,497,330 and $573,582,061, respectively.
34
Table of Contents
Notes to Financial Statements – continued
(5) Shares of Beneficial Interest
The fund’s Declaration of Trust permits the Trustees to issue an unlimited number of full and fractional shares of beneficial interest. Transactions in fund shares were as follows:
| Year ended 8/31/12 | Year ended 8/31/11 | |||||||||||||||
| Shares | Amount | Shares | Amount | |||||||||||||
| Shares sold | ||||||||||||||||
Class A | 2,032,933 | $18,532,245 | 5,005,133 | $45,400,449 | ||||||||||||
Class B | 212,845 | 1,756,764 | 363,011 | 2,991,748 | ||||||||||||
Class C | 363,151 | 2,980,036 | 513,974 | 4,173,987 | ||||||||||||
Class I | 12,928,071 | 118,457,281 | 7,796,869 | 72,730,584 | ||||||||||||
Class R1 | 34,162 | 286,774 | 37,218 | 301,726 | ||||||||||||
Class R2 | 55,115 | 488,631 | 117,941 | 1,037,362 | ||||||||||||
Class R3 | 29,607 | 264,375 | 28,598 | 255,488 | ||||||||||||
Class R4 | 4,342 | 39,044 | 800 | 7,337 | ||||||||||||
Class 529A | 30,739 | 267,872 | 27,640 | 242,126 | ||||||||||||
Class 529B | 752 | 6,169 | 711 | 5,733 | ||||||||||||
Class 529C | 11,363 | 89,242 | 11,260 | 90,207 | ||||||||||||
| 15,703,080 | $143,168,433 | 13,903,155 | $127,236,747 | |||||||||||||
| Shares reacquired | ||||||||||||||||
Class A | (4,581,043 | ) | $(41,597,617 | ) | (6,014,518 | ) | $(54,199,196 | ) | ||||||||
Class B | (1,141,720 | ) | (9,393,380 | ) | (1,749,770 | ) | (14,297,502 | ) | ||||||||
Class C | (723,180 | ) | (5,790,321 | ) | (951,525 | ) | (7,579,728 | ) | ||||||||
Class I | (3,769,861 | ) | (35,593,703 | ) | (5,990,919 | ) | (55,940,544 | ) | ||||||||
Class R1 | (62,916 | ) | (516,442 | ) | (80,607 | ) | (661,166 | ) | ||||||||
Class R2 | (129,275 | ) | (1,136,338 | ) | (171,253 | ) | (1,513,711 | ) | ||||||||
Class R3 | (16,829 | ) | (149,087 | ) | (80,138 | ) | (716,981 | ) | ||||||||
Class R4 | (489 | ) | (4,563 | ) | (433 | ) | (4,176 | ) | ||||||||
Class 529A | (10,174 | ) | (92,259 | ) | (14,843 | ) | (132,039 | ) | ||||||||
Class 529B | (5,940 | ) | (47,367 | ) | (9,171 | ) | (74,016 | ) | ||||||||
Class 529C | (8,116 | ) | (65,976 | ) | (6,033 | ) | (49,601 | ) | ||||||||
| (10,449,543 | ) | $(94,387,053 | ) | (15,069,210 | ) | $(135,168,660 | ) | |||||||||
| Net change | ||||||||||||||||
Class A | (2,548,110 | ) | $(23,065,372 | ) | (1,009,385 | ) | $(8,798,747 | ) | ||||||||
Class B | (928,875 | ) | (7,636,616 | ) | (1,386,759 | ) | (11,305,754 | ) | ||||||||
Class C | (360,029 | ) | (2,810,285 | ) | (437,551 | ) | (3,405,741 | ) | ||||||||
Class I | 9,158,210 | 82,863,578 | 1,805,950 | 16,790,040 | ||||||||||||
Class R1 | (28,754 | ) | (229,668 | ) | (43,389 | ) | (359,440 | ) | ||||||||
Class R2 | (74,160 | ) | (647,707 | ) | (53,312 | ) | (476,349 | ) | ||||||||
Class R3 | 12,778 | 115,288 | (51,540 | ) | (461,493 | ) | ||||||||||
Class R4 | 3,853 | 34,481 | 367 | 3,161 | ||||||||||||
Class 529A | 20,565 | 175,613 | 12,797 | 110,087 | ||||||||||||
Class 529B | (5,188 | ) | (41,198 | ) | (8,460 | ) | (68,283 | ) | ||||||||
Class 529C | 3,247 | 23,266 | 5,227 | 40,606 | ||||||||||||
| 5,253,537 | $48,781,380 | (1,166,055 | ) | $(7,931,913 | ) | |||||||||||
35
Table of Contents
Notes to Financial Statements – continued
The fund is one of several mutual funds in which the MFS funds-of-funds may invest. The MFS funds-of-funds do not invest in the underlying MFS funds for the purpose of exercising management or control. At the end of the period, the MFS Lifetime 2030 Fund, the MFS Conservative Allocation Fund, the MFS Aggressive Growth Fund, the MFS Moderate Allocation Fund, and the MFS Growth Allocation Fund were the owners of record of approximately 1%, 8%, 11%, 25%, and 27%, respectively, of the value of outstanding voting shares of the fund. In addition, the MFS Lifetime Retirement Fund, the MFS Lifetime 2010 Fund, the MFS Lifetime 2020 Fund, the MFS Lifetime 2040 Fund, and the MFS Lifetime 2050 Fund were each the owners of record of less than 1% of the value of outstanding voting shares of the fund.
(6) Line of Credit
The fund and certain other funds managed by MFS participate in a $1.1 billion unsecured committed line of credit, subject to a $1 billion sublimit, provided by a syndication of banks under a credit agreement. Borrowings may be made for temporary financing needs. Interest is charged to each fund, based on its borrowings, generally at a rate equal to the higher of the Federal Reserve funds rate or one month LIBOR plus an agreed upon spread. A commitment fee, based on the average daily, unused portion of the committed line of credit, is allocated among the participating funds at the end of each calendar quarter. In addition, the fund and other funds managed by MFS have established unsecured uncommitted borrowing arrangements with certain banks for temporary financing needs. Interest is charged to each fund, based on its borrowings, at a rate equal to the Federal Reserve funds rate plus an agreed upon spread. For the year ended August 31, 2012, the fund’s commitment fee and interest expense were $6,508 and $0, respectively, and are included in “Miscellaneous” expense on the Statement of Operations.
(7) Transactions in Underlying Affiliated Funds-Affiliated Issuers
An affiliated issuer may be considered one in which the fund owns 5% or more of the outstanding voting securities, or a company which is under common control. For the purposes of this report, the fund assumes the following to be an affiliated issuer:
| Underlying Affiliated Fund | Beginning Shares/Par Amount | Acquisitions Shares/Par Amount | Dispositions Shares/Par Amount | Ending Par Amount | ||||||||||||
| MFS Institutional Money Market Portfolio | 28,137,457 | 227,282,110 | (243,339,180 | ) | 12,080,387 | |||||||||||
| Underlying Affiliated Fund | Realized Gain (Loss) | Capital Gain Distributions | Dividend Income | Ending Value | ||||||||||||
| MFS Institutional Money Market Portfolio | $— | $— | $28,103 | $12,080,387 | ||||||||||||
36
Table of Contents
REPORT OF INDEPENDENT REGISTERED PUBLIC ACCOUNTING FIRM
To the Board of Trustees of MFS Series Trust IV and the Shareholders of MFS Mid Cap Growth Fund:
We have audited the accompanying statement of assets and liabilities, including the portfolio of investments, of MFS Mid Cap Growth Fund (one of the portfolios comprising MFS Series Trust IV) (the “Fund”) as of August 31, 2012, and the related statement of operations for the year then ended, the statements of changes in net assets for each of the two years in the period then ended, and the financial highlights for each of the five years in the period then ended. These financial statements and financial highlights are the responsibility of the Fund’s management. Our responsibility is to express an opinion on these financial statements and financial highlights based on our audits.
We conducted our audits in accordance with the standards of the Public Company Accounting Oversight Board (United States). Those standards require that we plan and perform the audit to obtain reasonable assurance about whether the financial statements and financial highlights are free of material misstatement. The Fund is not required to have, nor were we engaged to perform, an audit of its internal control over financial reporting. Our audits included consideration of internal control over financial reporting as a basis for designing audit procedures that are appropriate in the circumstances, but not for the purpose of expressing an opinion on the effectiveness of the Fund’s internal control over financial reporting. Accordingly, we express no such opinion. An audit also includes examining, on a test basis, evidence supporting the amounts and disclosures in the financial statements, assessing the accounting principles used and significant estimates made by management, as well as evaluating the overall financial statement presentation. Our procedures included confirmation of securities owned as of August 31, 2012, by correspondence with the custodian and brokers; where replies were not received from brokers, we performed other auditing procedures. We believe that our audits provide a reasonable basis for our opinion.
In our opinion, the financial statements and financial highlights referred to above present fairly, in all material respects, the financial position of MFS Mid Cap Growth Fund as of August 31, 2012, the results of its operations for the year then ended, the changes in its net assets for each of the two years in the period then ended, and the financial highlights for each of the five years in the period then ended, in conformity with accounting principles generally accepted in the United States of America.
DELOITTE & TOUCHE LLP
Boston, Massachusetts
October 17, 2012
37
Table of Contents
TRUSTEES AND OFFICERS — IDENTIFICATION AND BACKGROUND
The Trustees and officers of the Trust, as of October 1, 2012, are listed below, together with their principal occupations during the past five years. (Their titles may have varied during that period.) The address of each Trustee and officer is 500 Boylston Street, Boston, Massachusetts 02116.
Name, Age | Position(s) Held with Fund | Trustee/Officer Since (h) | Principal the Past Five Years | Other Directorships (j) | ||||
| INTERESTED TRUSTEES | ||||||||
| Robert J. Manning (k) (age 48) | Trustee | February 2004 | Massachusetts Financial Services Company, Chairman, Chief Executive Officer and Director; President (until December 2009); Chief Investment Officer (until July 2010) | N/A | ||||
| INDEPENDENT TRUSTEES | ||||||||
| David H. Gunning (age 70) | Trustee and Chair of Trustees | January 2004 | Retired; Cleveland-Cliffs Inc. (mining products and service provider), Vice Chairman/Director (until 2007) | Lincoln Electric Holdings, Inc. (welding equipment manufacturer), Director; Development Alternatives, Inc. (consulting), Director/Non-Executive Chairman; Portman Limited (mining), Director (until 2008) | ||||
| Robert E. Butler (age 70) | Trustee | January 2006 | Consultant – investment company industry regulatory and compliance matters | N/A | ||||
Maureen R. Goldfarb (age 57) | Trustee | January 2009 | Private investor | N/A | ||||
| William R. Gutow (age 71) | Trustee | December 1993 | Private investor and real estate consultant; Capitol Entertainment Management Company (video franchise), Vice Chairman | Atlantic Coast Tan (tanning salons), Vice Chairman (until 2007); Texas Donuts (donut franchise), Vice Chairman (until 2010) | ||||
| Michael Hegarty (age 67) | Trustee | December 2004 | Private investor | N/A | ||||
John P. Kavanaugh (age 57) | Trustee | January 2009 | Private investor | N/A | ||||
38
Table of Contents
Trustees and Officers – continued
Name, Age | Position(s) Held with Fund | Trustee/Officer Since (h) | Principal the Past Five Years | Other Directorships (j) | ||||
| J. Dale Sherratt (age 74) | Trustee | June 1989 | Insight Resources, Inc. (acquisition planning specialists), President; Wellfleet Investments (investor in health care companies), Managing General Partner | N/A | ||||
| Laurie J. Thomsen (age 55) | Trustee | March 2005 | Private investor; New Profit, Inc. (venture philanthropy), Executive Partner (until 2010) | The Travelers Companies (insurance), Director | ||||
| Robert W. Uek (age 71) | Trustee | January 2006 | Consultant to investment company industry | N/A | ||||
| OFFICERS | ||||||||
John M. Corcoran (k) (age 47) | President | October 2008 | Massachusetts Financial Services Company, Senior Vice President (since October 2008); State Street Bank and Trust (financial services provider), Senior Vice President, (until September 2008) | N/A | ||||
| Christopher R. Bohane (k) (age 38) | Assistant Secretary and Assistant Clerk | July 2005 | Massachusetts Financial Services Company, Vice President and Senior Counsel | N/A | ||||
Kino Clark (k) (age 44) | Assistant Treasurer | January 2012 | Massachusetts Financial Services Company, Vice President | N/A | ||||
Thomas H. Connors (k) (age 53) | Assistant Secretary and Assistant Clerk | September 2012 | Massachusetts Financial Services Company, Vice President and Senior Counsel; Deutsche Asset Management, Director and Senior Counsel (until 2012) | N/A |
39
Table of Contents
Trustees and Officers – continued
Name, Age | Position(s) Held with Fund | Trustee/Officer Since (h) | Principal the Past Five Years | Other Directorships (j) | ||||
| Ethan D. Corey (k) (age 48) | Assistant Secretary and Assistant Clerk | July 2005 | Massachusetts Financial Services Company, Senior Vice President and Associate General Counsel | N/A | ||||
| David L. DiLorenzo (k) (age 44) | Treasurer | July 2005 | Massachusetts Financial Services Company, Senior Vice President | N/A | ||||
| Robyn L. Griffin (age 37) | Assistant Independent Chief Compliance Officer | August 2008 | Griffin Compliance LLC (provider of compliance services), Principal (since August 2008); State Street Corporation (financial services provider), Mutual Fund Administration Assistant Vice President (October 2006 – July 2008); | N/A | ||||
Brian E. Langenfeld (k) (age 39) | Assistant Secretary and Assistant Clerk | June 2006 | Massachusetts Financial Services Company, Vice President and Senior Counsel | N/A | ||||
Susan S. Newton (k) (age 62) | Assistant Secretary and Assistant Clerk | May 2005 | Massachusetts Financial Services Company, Senior Vice President and Associate General Counsel | N/A | ||||
| Susan A. Pereira (k) (age 41) | Assistant Secretary and Assistant Clerk | July 2005 | Massachusetts Financial Services Company, Vice President and Senior Counsel | N/A | ||||
Kasey L. Phillips (k) (age 41) | Assistant Treasurer | September 2012 | Massachusetts Financial Services Company; Wells Fargo Funds Management, LLC, Senior Vice President, Fund Treasurer (until 2012) | N/A |
40
Table of Contents
Trustees and Officers – continued
Name, Age | Position(s) Held with Fund | Trustee/Officer Since (h) | Principal the Past Five Years | Other Directorships (j) | ||||
| Mark N. Polebaum (k) (age 60) | Secretary and Clerk | January 2006 | Massachusetts Financial Services Company, Executive Vice President, General Counsel and Secretary | N/A | ||||
| Frank L. Tarantino (age 68) | Independent Chief Compliance Officer | June 2004 | Tarantino LLC (provider of compliance services), Principal | N/A | ||||
| Richard S. Weitzel (k) (age 42) | Assistant Secretary and Assistant Clerk | October 2007 | Massachusetts Financial Services Company, Senior Vice President and Associate General Counsel | N/A | ||||
| James O. Yost (k) (age 52) | Deputy Treasurer | September 1990 | Massachusetts Financial Services Company, Senior Vice President | N/A |
| (h) | Date first appointed to serve as Trustee/officer of an MFS fund. Each Trustee has served continuously since appointment unless indicated otherwise. For the period from December 15, 2004 until February 22, 2005, Mr. Manning served as Advisory Trustee. For the period October 2008, until January 2012, Mr. Corcoran served as Treasurer of the Funds. Prior to January 2012, Messrs. DiLorenzo and Yost served as Assistant Treasurers of the Funds. |
| (j) | Directorships or trusteeships of companies required to report to the Securities and Exchange Commission (i.e., “public companies”). |
| (k) | “Interested person” of the Trust within the meaning of the Investment Company Act of 1940 (referred to as the 1940 Act), which is the principal federal law governing investment companies like the fund, as a result of position with MFS. The address of MFS is 500 Boylston Street, Boston, Massachusetts 02116. |
Each Trustee has been elected by shareholders and each Trustee and officer holds office until his or her successor is chosen and qualified or until his or her earlier death, resignation, retirement or removal. The Trust does not hold annual meetings for the purpose of electing Trustees, and Trustees are not elected for fixed terms. Messrs. Butler, Kavanaugh, Uek and Ms. Thomsen are members of the Trust’s Audit Committee.
Each of the Fund’s Trustees and officers holds comparable positions with certain other funds of which MFS or a subsidiary is the investment adviser or distributor, and, in the case of the officers, with certain affiliates of MFS. As of January 1, 2012, the Trustees served as board members of 131 funds within the MFS Family of Funds.
41
Table of Contents
Trustees and Officers – continued
The Statement of Additional Information for the Fund includes further information about the Trustees and is available without charge upon request by calling 1-800-225-2606.
| Investment Adviser | Custodian | |
| Massachusetts Financial Services Company 500 Boylston Street Boston, MA 02116-3741 | JPMorgan Chase Bank One Chase Manhattan Plaza New York, NY 10081 | |
| Distributor | Independent Registered Public Accounting Firm | |
| MFS Fund Distributors, Inc. 500 Boylston Street Boston, MA 02116-3741 | Deloitte & Touche LLP 200 Berkeley Street | |
| Portfolio Managers | ||
Eric Fischman | ||
Paul Gordon |
42
Table of Contents
BOARD REVIEW OF INVESTMENT ADVISORY AGREEMENT
The Investment Company Act of 1940 requires that both the full Board of Trustees and a majority of the non-interested (“independent”) Trustees, voting separately, annually approve the continuation of the Fund’s investment advisory agreement with MFS. The Trustees consider matters bearing on the Fund and its advisory arrangements at their meetings throughout the year, including a review of performance data at each regular meeting. In addition, the independent Trustees met several times over the course of three months beginning in May and ending in July, 2012 (“contract review meetings”) for the specific purpose of considering whether to approve the continuation of the investment advisory agreement for the Fund and the other investment companies that the Board oversees (the “MFS Funds”). The independent Trustees were assisted in their evaluation of the Fund’s investment advisory agreement by independent legal counsel, from whom they received separate legal advice and with whom they met separately from MFS during various contract review meetings. The independent Trustees were also assisted in this process by the MFS Funds’ Independent Chief Compliance Officer, a full-time senior officer appointed by and reporting to the independent Trustees.
In connection with their deliberations regarding the continuation of the investment advisory agreement, the Trustees, including the independent Trustees, considered such information and factors as they believed, in light of the legal advice furnished to them and their own business judgment, to be relevant. The investment advisory agreement for the Fund was considered separately, although the Trustees also took into account the common interests of all MFS Funds in their review. As described below, the Trustees considered the nature, quality, and extent of the various investment advisory, administrative, and shareholder services performed by MFS under the existing investment advisory agreement and other arrangements with the Fund.
In connection with their contract review meetings, the Trustees received and relied upon materials that included, among other items: (i) information provided by Lipper Inc., an independent third party, on the investment performance of the Fund for various time periods ended December 31, 2011 and the investment performance of a group of funds with substantially similar investment classifications/objectives (the “Lipper performance universe”), (ii) information provided by Lipper Inc. on the Fund’s advisory fees and other expenses and the advisory fees and other expenses of comparable funds identified by Lipper Inc. (the “Lipper expense group”), (iii) information provided by MFS on the advisory fees of comparable portfolios of other clients of MFS, including institutional separate accounts and other clients, (iv) information as to whether and to what extent applicable expense waivers, reimbursements or fee “breakpoints” are observed for the Fund, (v) information regarding MFS’ financial results and financial condition, including MFS’ and certain of its affiliates’ estimated profitability from services performed for the Fund and the MFS Funds as a whole, and compared to MFS’ institutional business, (vi) MFS’ views regarding the outlook for the mutual fund industry and the strategic business plans of MFS, (vii) descriptions of various functions performed by MFS for the Funds, such as compliance monitoring and portfolio trading practices, and (viii) information regarding the overall organization of MFS, including information about MFS’ senior management
43
Table of Contents
Board Review of Investment Advisory Agreement – continued
and other personnel providing investment advisory, administrative and other services to the Fund and the other MFS Funds. The comparative performance, fee and expense information prepared and provided by Lipper Inc. was not independently verified and the independent Trustees did not independently verify any information provided to them by MFS.
The Trustees’ conclusion as to the continuation of the investment advisory agreement was based on a comprehensive consideration of all information provided to the Trustees and not the result of any single factor. Some of the factors that figured particularly in the Trustees’ deliberations are described below, although individual Trustees may have evaluated the information presented differently from one another, giving different weights to various factors. It is also important to recognize that the fee arrangements for the Fund and other MFS Funds are the result of years of review and discussion between the independent Trustees and MFS, that certain aspects of such arrangements may receive greater scrutiny in some years than in others, and that the Trustees’ conclusions may be based, in part, on their consideration of these same arrangements during the course of the year and in prior years.
Based on information provided by Lipper Inc. and MFS, the Trustees reviewed the Fund’s total return investment performance as well as the performance of peer groups of funds over various time periods. The Trustees placed particular emphasis on the total return performance of the Fund’s Class A shares in comparison to the performance of funds in its Lipper performance universe over the three-year period ended December 31, 2011, which the Trustees believed was a long enough period to reflect differing market conditions. The total return performance of the Fund’s Class A shares was in the 3rd quintile relative to the other funds in the universe for this three-year period (the 1st quintile being the best performers and the 5th quintile being the worst performers). The total return performance of the Fund’s Class A shares was in the 4th quintile for the one-year period and the 5th quintile for the five-year period ended December 31, 2011 relative to the Lipper performance universe. Because of the passage of time, these performance results may differ from the performance results for more recent periods, including those shown elsewhere in this report.
In addition to considering the performance information provided in connection with the contract review meetings, the independent Trustees noted that, in light of the Fund’s substandard relative performance at the time of their contract review meetings in 2011, they had met at each of their regular meetings since then with MFS’ senior investment management personnel to discuss the Fund’s performance and MFS’ efforts to improve the Fund’s performance. The independent Trustees further noted that the Fund’s three-year performance as compared to its Lipper performance universe improved for the period ended December 31, 2011, as compared to the prior year. Taking this information into account, the Trustees concluded, within the context of their overall conclusions regarding the investment advisory agreement, that they were satisfied with MFS’ responses and efforts relating to investment performance.
In assessing the reasonableness of the Fund’s advisory fee, the Trustees considered, among other information, the Fund’s advisory fee and the total expense ratio of the Fund’s Class A shares as a percentage of average daily net assets and the advisory fee and total expense ratios of peer groups of funds based on information provided by
44
Table of Contents
Board Review of Investment Advisory Agreement – continued
Lipper Inc. The Trustees considered that MFS has agreed to implement an expense limitation for the Fund, which may not be changed without the Trustees’ approval. The Trustees also considered that, according to the Lipper data (which takes into account any fee reductions or expense limitations that were in effect during the Fund’s last fiscal year), the Fund’s effective advisory fee rate and total expense ratio were each approximately at the Lipper expense group median.
The Trustees also considered the advisory fees charged by MFS to institutional accounts, if any. In comparing these fees, the Trustees considered information provided by MFS as to the generally broader scope of services provided by MFS to the Fund in comparison to institutional accounts, the higher demands placed on MFS’ investment personnel and trading infrastructure as a result of the daily cash in-flows and out-flows of the Fund, and the impact on MFS and expenses associated with the more extensive regulatory regime to which the Fund is subject in comparison to institutional accounts.
The Trustees also considered whether the Fund is likely to benefit from any economies of scale in the management of the Fund in the event of growth in assets of the Fund. They noted that the Fund’s advisory fee rate schedule is subject to a contractual breakpoint that reduces the Fund’s advisory fee rate on average daily net assets over $3 billion and that MFS has agreed in writing to reduce its advisory fee on average daily net assets over $1 billion, which may not be changed without the Trustees’ approval. The Trustees concluded that the existing breakpoints were sufficient to allow the Fund to benefit from economies of scale as its assets grow.
The Trustees also considered information prepared by MFS relating to MFS’ costs and profits with respect to the Fund, the MFS Funds considered as a group, and other investment companies and accounts advised by MFS, as well as MFS’ methodologies used to determine and allocate its costs to the MFS Funds, the Fund and other accounts and products for purposes of estimating profitability.
After reviewing these and other factors described herein, the Trustees concluded, within the context of their overall conclusions regarding the investment advisory agreement, that the advisory fees charged to the Fund represent reasonable compensation in light of the services being provided by MFS to the Fund.
In addition, the Trustees considered MFS’ resources and related efforts to continue to retain, attract and motivate capable personnel to serve the Fund. The Trustees also considered current and developing conditions in the financial services industry, including the presence of large and well-capitalized companies which are spending, and appear to be prepared to continue to spend, substantial sums to engage personnel and to provide services to competing investment companies. In this regard, the Trustees also considered the financial resources of MFS and its ultimate parent, Sun Life Financial Inc. The Trustees also considered the advantages and possible disadvantages to the Fund of having an adviser that also serves other investment companies as well as other accounts.
The Trustees also considered the nature, quality, cost, and extent of administrative, transfer agency, and distribution services provided to the Fund by MFS and its affiliates under agreements and plans other than the investment advisory agreement, including any 12b-1 fees the Fund pays to MFS Fund Distributors, Inc., an affiliate of MFS. The Trustees also considered the nature, extent and quality of certain other services
45
Table of Contents
Board Review of Investment Advisory Agreement – continued
MFS performs or arranges for on the Fund’s behalf, which may include securities lending programs, directed expense payment programs, class action recovery programs, and MFS’ interaction with third-party service providers, principally custodians and sub-custodians. The Trustees concluded that the various non-advisory services provided by MFS and its affiliates on behalf of the Fund were satisfactory.
The Trustees also considered benefits to MFS from the use of the Fund’s portfolio brokerage commissions, if applicable, to pay for investment research and various other factors. Additionally, the Trustees considered so-called “fall-out benefits” to MFS such as reputational value derived from serving as investment manager to the Fund.
Based on their evaluation of factors that they deemed to be material, including those factors described above, the Board of Trustees, including the independent Trustees, concluded that the Fund’s investment advisory agreement with MFS should be continued for an additional one-year period, commencing August 1, 2012.
A discussion regarding the Board’s most recent review and renewal of the fund’s Investment Advisory Agreement with MFS is available by clicking on the fund’s name under “Mutual Funds” in the “Products and Performance” section of the MFS Web site (mfs.com).
46
Table of Contents
PROXY VOTING POLICIES AND INFORMATION
A general description of the MFS funds’ proxy voting policies and procedures is available without charge, upon request, by calling 1-800-225-2606, by visiting the Proxy Voting section of mfs.com or by visiting the SEC’s Web site at http://www.sec.gov.
Information regarding how the fund voted proxies relating to portfolio securities during the most recent twelve-month period ended June 30 is available without charge by visiting the Proxy Voting section of mfs.com or by visiting the SEC’s Web site at http://www.sec.gov.
QUARTERLY PORTFOLIO DISCLOSURE
The fund will file a complete schedule of portfolio holdings with the Securities and Exchange Commission (the Commission) for the first and third quarters of each fiscal year on Form N-Q. A shareholder can obtain the quarterly portfolio holdings report at mfs.com. The fund’s Form N-Q is also available on the EDGAR database on the Commission’s Internet Web site at http://www.sec.gov, and may be reviewed and copied at the:
Public Reference Room
Securities and Exchange Commission
100 F Street, NE, Room 1580
Washington, D.C. 20549
Information on the operation of the Public Reference Room may be obtained by calling the Commission at 1-800-SEC-0330. Copies of the fund’s Form N-Q also may be obtained, upon payment of a duplicating fee, by electronic request at the following e-mail address: publicinfo@sec.gov or by writing the Public Reference Section at the above address.
From time to time, MFS may post important information about the fund or the MFS funds on the MFS web site (mfs.com). This information is available by visiting the “News & Commentary” section of mfs.com or by clicking on the fund’s name under “Mutual Funds” in the “Products and Performance” section of mfs.com.
FEDERAL TAX INFORMATION (unaudited)
The fund will notify shareholders of amounts for use in preparing 2012 income tax forms in January 2013.
47
Table of Contents
rev. 3/11
| FACTS | WHAT DOES MFS DO WITH YOUR PERSONAL INFORMATION? |  | ||
| Why? | Financial companies choose how they share your personal information. Federal law gives consumers the right to limit some but not all sharing. Federal law also requires us to tell you how we collect, share, and protect your personal information. Please read this notice carefully to understand what we do. |
| What? | The types of personal information we collect and share depend on the product or service you have with us. This information can include:
•Social Security number and account balances •Account transactions and transaction history •Checking account information and wire transfer instructions
When you are no longer our customer, we continue to share your information as described in this notice. |
| How? | All financial companies need to share customers’ personal information to run their everyday business. In the section below, we list the reasons financial companies can share their customers’ personal information; the reasons MFS chooses to share; and whether you can limit this sharing. |
| Reasons we can share your personal information | Does MFS share? | Can you limit this sharing? | ||
For our everyday business purposes – such as to process your transactions, maintain your account(s), respond to court orders and legal investigations, or report to credit bureaus | Yes | No | ||
For our marketing purposes – to offer our products and services to you | No | We don’t share | ||
| For joint marketing with other financial companies | No | We don’t share | ||
For our affiliates’ everyday business purposes – information about your transactions and experiences | No | We don’t share | ||
For our affiliates’ everyday business purposes – information about your creditworthiness | No | We don’t share | ||
| For nonaffiliates to market to you | No | We don’t share |
| Questions? | Call 800-225-2606 or go to mfs.com. |
48
Table of Contents
| Page 2 |
| Who we are | ||
| Who is providing this notice? | MFS Funds, MFS Investment Management, MFS Institutional Advisors, Inc., MFS Fund Distributors, Inc., MFS Heritage Trust Company, and MFS Service Center, Inc. | |
| What we do | ||
| How does MFS protect my personal information? | To protect your personal information from unauthorized access and use, we use security measures that comply with federal law. These measures include procedural, electronic, and physical safeguards for the protection of the personal information we collect about you. | |
| How does MFS collect my personal information? | We collect your personal information, for example, when you
•open an account or provide account information •direct us to buy securities or direct us to sell your securities •make a wire transfer
We also collect your personal information from others, such as credit bureaus, affiliates and other companies. | |
| Why can’t I limit all sharing? | Federal law gives you the right to limit only
•sharing for affiliates’ everyday business purposes – information about your creditworthiness •affiliates from using your information to market to you •sharing for nonaffiliates to market to you
State laws and individual companies may give you additional rights to limit sharing. | |
| Definitions | ||
| Affiliates | Companies related by common ownership or control. They can be financial and nonfinancial companies.
•MFS does not share personal information with affiliates, except for everyday business purposes as described on page one of this notice. | |
| Nonaffiliates | Companies not related by common ownership or control. They can be financial and nonfinancial companies.
•MFS does not share with nonaffiliates so they can market to you. | |
| Joint Marketing | A formal agreement between nonaffiliated financial companies that together market financial products or services to you.
•MFS doesn’t jointly market. | |
| Other important information | ||
| If you own an MFS product or receive an MFS service in the name of a third party such as a bank or broker-dealer, their privacy policy may apply to you instead of ours. | ||
49
Table of Contents
Save paper with eDelivery.
| MFS® will send you prospectuses, |

reports, and proxies directly via e-mail so you will get information faster with less mailbox clutter.
To sign up:
1. Go to mfs.com.
2. Log in via MFS® Access.
3. Select eDelivery.
If you own your MFS fund shares through a financial institution or a retirement plan, MFS® TALK, MFS® Access, or eDelivery may not be available to you.
WEB SITE
mfs.com
MFS TALK
1-800-637-8255
24 hours a day
ACCOUNT SERVICE AND LITERATURE
Shareholders
1-800-225-2606
Financial advisors
1-800-343-2829
Retirement plan services
1-800-637-1255
MAILING ADDRESS
MFS Service Center, Inc.
P.O. Box 55824
Boston, MA 02205-5824
OVERNIGHT MAIL
MFS Service Center, Inc.
c/o Boston Financial Data Services
30 Dan Road
Canton, MA 02021-2809
Table of Contents
ANNUAL REPORT
August 31, 2012

MFS® MONEY MARKET FUND
MFS® GOVERNMENT
MONEY MARKET FUND

MCM-ANN
Table of Contents
MFS® MONEY MARKET FUND
MFS® GOVERNMENT MONEY MARKET FUND
The report is prepared for the general information of shareholders.
It is authorized for distribution to prospective investors only when preceded or accompanied by a current prospectus.
NOT FDIC INSURED Ÿ MAY LOSE VALUE Ÿ NO BANK GUARANTEE
Table of Contents

LETTER FROM THE CHAIRMAN AND CEO
Dear Shareholders:
World financial markets continue to face a number of major economic and political challenges. While the European debt crisis has deepened and spread, there appears to be scope for improvement given the European Central Bank’s willingness to backstop troubled sovereigns. Economic activity in China, until recently the world’s growth engine, appears to be bottoming. Even the relatively strong and stable US
economy has been affected by uncertainty over the presidential election and the threat of a “fiscal cliff” at year- end. At the same time, global consumer and producer confidence has fallen sharply. And a search for safe havens by nervous investors has driven down yields on highly rated government bonds, including those issued by Germany and the United States, to multi-decade lows.
But there is also good news: Global economic data have modestly improved, performing slightly better than expected. However, the improvement is too short-lived to be called a trend. Equity markets have been largely range bound since the
Fed extended its quantitative easing program, leaving little expectation that the bank will add further money to the system. It is hard to know how much of the recent gain in financial markets has been the result of actual economic improvements versus expectations that renewed central bank action will soon lead to an economic rebound.
Through all this uncertainty, managing risk remains a top priority for investors and their advisors. At MFS®, our emphasis on global research is designed to keep our investment process functioning smoothly at all times. Close collaboration among colleagues around the world is vital in periods of uncertainty and heightened volatility. We share ideas and evaluate opportunities across continents and across all investment disciplines and types of investments. We employ this uniquely collaborative approach to build better insights — and better results — for our clients.
Like our investors, we are mindful of the many economic challenges we face at the local, national and international levels. In times like these, it is more important than ever to maintain a long-term view, adhere to time-tested investing principles such as asset allocation and diversification and work closely with investment advisors to research and identify the most suitable opportunities.
Respectfully,

Robert J. Manning
Chairman and Chief Executive Officer
MFS Investment Management®
October 17, 2012
The opinions expressed in this letter are subject to change, may not be relied upon for investment advice and no forecasts can be guaranteed.
1
Table of Contents
MFS MONEY MARKET FUND
Portfolio structure (u)

| Composition including fixed income credit quality (a)(u) | ||||
| A-1+ | 4.7% | |||
| A-1 | 90.3% | |||
| A-2 | 5.1% | |||
| Not Rated | 0.0% | |||
| Cash & Other | (0.1)% | |||
| Maturity breakdown (u) | ||||
| 0 - 7 days | 23.3% | |||
| 8 - 29 days | 33.4% | |||
| 30 - 59 days | 8.0% | |||
| 60 - 89 days | 18.2% | |||
| 90 - 365 days | 17.2% | |||
| Other Assets Less Liabilities | (0.1)% | |||
MFS GOVERNMENT MONEY MARKET FUND
Portfolio structure (u)
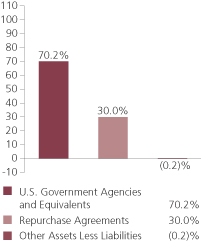
| Composition including fixed income credit quality (a)(u) | ||||
| A-1+ | 5.7% | |||
| A-1 | 84.5% | |||
| A-2 | 10.0% | |||
| Not Rated | 0.0% | |||
| Cash & Other | (0.2)% | |||
| Maturity breakdown (u) | ||||
| 0 - 7 days | 31.1% | |||
| 8 - 29 days | 18.9% | |||
| 30 - 59 days | 10.6% | |||
| 60 - 89 days | 13.7% | |||
| 90 - 365 days | 25.9% | |||
| Other Assets Less Liabilities | (0.2)% | |||
2
Table of Contents
Portfolio Composition – continued
| (a) | Ratings are assigned to portfolio securities utilizing ratings from Moody’s, Fitch, and Standard & Poor’s rating agencies and applying the following hierarchy: If all three agencies provide a rating, the middle rating (after dropping the highest and lowest ratings) is assigned; if two of the three agencies rate a security, the lower of the two is assigned. Cash & Other portfolio assets that are not securities are not included in the categories mentioned above. Ratings are shown in the S&P scale. All ratings are subject to change. The fund is not rated by these agencies. |
| (u) | For purposes of this presentation, accrued interest, where applicable, is included. |
| From | time to time “Other Assets Less Liabilities” may be negative due to timing of cash receipts. |
| Percentages | are based on net assets as of 8/31/12. |
| The | portfolio is actively managed and current holdings may be different. |
3
Table of Contents
PERFORMANCE SUMMARY THROUGH 8/31/12
Total returns as well as the current 7-day yield have been provided for the applicable time periods. Performance results reflect the percentage change in net asset value, including the reinvestment of any dividends and capital gains distributions. (See Notes to Performance Summary.)
Performance data shown represents past performance and is no guarantee of future results. Although each fund seeks to preserve the value of your investment at $1.00 per share, you could lose money on your investment in the fund. An investment in either fund is not a bank deposit and is not insured or guaranteed by the Federal Deposit Insurance Corporation or any other governmental agency. The performance shown does not reflect the deduction of taxes, if any, that a shareholder would pay on fund distributions or the redemption of fund shares.
| MFS Money Market Fund | MFS Government Money Market Fund | |
| Inception: 12/19/75 | Inception: 2/26/82 | |
| 1-Year Total Return (without sales charge): 0.00% | 1-Year Total Return (without sales charge): 0.00% | |
| Current 7-day yield: 0.00% | Current 7-day yield: 0.00% |
Yields quoted are based on the latest seven days ended as of August 31, 2012, with dividends annualized. The yield quotations more closely reflect the current earnings of the funds than the total return quotations. Shares of the funds can be purchased at net asset value without a sales charge. Certain shares of each fund acquired through an exchange may be subject to a contingent deferred sales charge upon redemption depending on when the shares exchanged were originally purchased. See the notes to financial statements for more details.
Notes to Performance Summary
Performance results reflect any applicable expense subsidies, waivers and adjustments in effect during the periods shown. Subsidies and fee waivers may be imposed to enhance a fund’s yield or to avoid a negative yield during periods when the fund’s operating expenses have a significant impact on the fund’s yield due to lower interest rates. Without such subsidies and waivers the fund’s performance results would be less favorable. Please see the prospectus and financial statements for complete details. All results are historical and assume the reinvestment of any dividends and capital gain distributions.
4
Table of Contents
Fund expenses borne by the shareholders during the period,
March 1, 2012 through August 31, 2012
As a shareholder of the funds, you incur two types of costs: (1) transaction costs, including sales charges (loads) on certain purchase or redemption payments, and (2) ongoing costs, including management fees; and other fund expenses.
These examples are intended to help you understand your ongoing costs (in dollars) of investing in the funds and to compare these costs with the ongoing costs of investing in other mutual funds.
The examples are based on an investment of $1,000 invested at the beginning of the period and held for the entire period March 1, 2012 through August 31, 2012.
Actual Expenses
The first line in the following tables provides information about actual account values and actual expenses. You may use the information in this line, together with the amount you invested, to estimate the expenses that you paid over the period. Simply divide your account value by $1,000 (for example, an $8,600 account value divided by $1,000 = 8.6), then multiply the result by the number in the first line under the heading entitled “Expenses Paid During Period” to estimate the expenses you paid on your account during this period.
Hypothetical Example for Comparison Purposes
The second line in the following tables provides information about hypothetical account values and hypothetical expenses based on the fund’s actual expense ratio and an assumed rate of return of 5% per year before expenses, which is not the fund’s actual return. The hypothetical account values and expenses may not be used to estimate the actual ending account balance or expenses you paid for the period. You may use this information to compare the ongoing costs of investing in the funds and other funds. To do so, compare this 5% hypothetical example with the 5% hypothetical examples that appear in the shareholder reports of the other funds.
Please note that the expenses shown in the tables are meant to highlight your ongoing costs only and do not reflect any transactional costs, such as sales charges (loads). Therefore, the second line in the following tables is useful in comparing ongoing costs only, and will not help you determine the relative total costs of owning different funds. In addition, if these transactional costs were included, your costs would have been higher.
5
Table of Contents
Expense Tables – continued
MFS MONEY MARKET FUND
| Annualized Expense Ratio | Beginning 3/01/12 | Ending Account Value 8/31/12 | Expenses Paid During Period (p) 3/01/12-8/31/12 | |||||||||||||||
| A | Actual | 0.16% | $1,000.00 | $1,000.00 | $0.80 | |||||||||||||
| Hypothetical (h) | 0.16% | $1,000.00 | $1,024.33 | $0.81 | ||||||||||||||
MFS GOVERNMENT MONEY MARKET FUND
| Annualized Expense Ratio | Beginning Account Value 3/01/12 | Ending Account Value 8/31/12 | Expenses Paid During Period (p) 3/01/12-8/31/12 | |||||||||||||||
| A | Actual | 0.13% | $1,000.00 | $1,000.00 | $0.65 | |||||||||||||
| Hypothetical (h) | 0.13% | $1,000.00 | $1,024.48 | $0.66 | ||||||||||||||
| (h) | 5% class return per year before expenses. |
| (p) | Expenses paid are equal to each class’ annualized expense ratio, as shown above, multiplied by the average account value over the period, multiplied by the number of days in the period, divided by the number of days in the year. Expenses paid do not include any applicable sales charges (loads). If these transaction costs had been included, your costs would have been higher. |
Expense Changes Impacting the Table
As more fully disclosed in footnote 3 to the financial statements, the expense ratios reported above include additional expense reductions to avoid a negative yield.
6
Table of Contents
8/31/12
These Portfolios of Investments are a complete list of all securities owned by your fund. They are categorized by broad-based asset classes.
MFS MONEY MARKET FUND
| Certificates of Deposit - 20.1% | ||||||||
| Issuer | Shares/Par | Value ($) | ||||||
| Major Banks - 14.9% | ||||||||
| Bank of Montreal/Chicago Branch, 0.17%, due 9/13/12 | $ | 4,450,000 | $ | 4,450,000 | ||||
| Bank of Montreal/Chicago Branch, 0.19%, due 9/13/12 | 3,500,000 | 3,500,000 | ||||||
| Bank of Nova Scotia/Houston Branch, 0.27%, due 2/01/13 | 4,860,000 | 4,860,000 | ||||||
| Canadian Imperial Bank of Commerce/New York Branch, 0.29%, due 1/22/13 | 16,460,000 | 16,460,000 | ||||||
| National Australia Bank/New York Branch, 0.27%, due 2/19/13 | 11,000,000 | 11,000,000 | ||||||
| Toronto-Dominion Bank, 0.15%, due 9/12/12 | 5,892,000 | 5,892,000 | ||||||
| Westpac Banking Corp./New York Branch, 0.25%, due 9/17/12 | 14,115,000 | 14,115,000 | ||||||
|
| |||||||
| $ | 60,277,000 | |||||||
| Other Banks & Diversified Financials - 5.2% | ||||||||
| Branch Banking & Trust Co., 0.28%, due 11/16/12 | $ | 4,440,000 | $ | 4,440,000 | ||||
| Mizuho Corporate Bank (USA)/New York Branch, 0.34%, due 11/21/12 | 4,900,000 | 4,900,000 | ||||||
| Mizuho Corporate Bank (USA)/New York Branch, 0.36%, due 9/18/12 | 7,880,000 | 7,880,000 | ||||||
| Mizuho Corporate Bank (USA)/New York Branch, 0.36%, due 10/18/12 | 3,650,000 | 3,650,000 | ||||||
|
| |||||||
| $ | 20,870,000 | |||||||
| Total Certificates of Deposit, at Cost and Value | $ | 81,147,000 | ||||||
| Commercial Paper (y) - 43.0% | ||||||||
| Automotive - 1.3% | ||||||||
| American Honda Finance Corp., 0.18%, due 9/05/12 | $ | 1,416,000 | $ | 1,415,972 | ||||
| Toyota Motor Credit Corp., 0.17%, due 10/29/12 | 3,671,000 | 3,669,995 | ||||||
|
| |||||||
| $ | 5,085,967 | |||||||
| Conglomerates - 6.5% | ||||||||
| Siemens Capital Corp., 0.17%, due 9/17/12 (t) | $ | 10,085,000 | $ | 10,084,238 | ||||
| United Technologies Corp., 0.14%, due 9/24/12 (t) | 12,109,000 | 12,107,917 | ||||||
| United Technologies Corp., 0.2%, due 9/24/12 (t) | 4,179,000 | 4,178,466 | ||||||
|
| |||||||
| $ | 26,370,621 | |||||||
| Financial Institutions - 4.1% | ||||||||
| General Electric Capital Corp., 0.23%, due 12/11/12 | $ | 16,320,000 | $ | 16,309,469 | ||||
| Food & Beverages - 8.9% | ||||||||
| Anheuser-Busch InBev S.A., 0.22%, due 10/05/12 (t) | $ | 1,879,000 | $ | 1,878,610 | ||||
| Anheuser-Busch InBev S.A., 0.25%, due 10/29/12 (t) | 644,000 | 643,739 | ||||||
| Anheuser-Busch InBev S.A., 0.35%, due 11/26/12 (t) | 470,000 | 469,607 | ||||||
7
Table of Contents
Portfolios of Investments – continued
| Issuer | Shares/Par | Value ($) | ||||||
| Commercial Paper (y) - continued | ||||||||
| Food & Beverages - continued | ||||||||
| Anheuser-Busch InBev S.A., 0.35%, due 11/27/12 (t) | $ | 13,300,000 | $ | 13,288,750 | ||||
| Coca-Cola Co., 0.21%, due 9/04/12 (t) | 4,888,000 | 4,887,914 | ||||||
| Coca-Cola Co., 0.23%, due 10/09/12 (t) | 10,644,000 | 10,641,416 | ||||||
| Coca-Cola Co., 0.25%, due 10/15/12 (t) | 1,200,000 | 1,199,633 | ||||||
| Pepsico, Inc., 0.13%, due 9/10/12 (t) | 2,761,000 | 2,760,910 | ||||||
|
| |||||||
| $ | 35,770,579 | |||||||
| Machinery & Tools - 2.8% | ||||||||
| Deere and Co., 0.14%, due 9/20/12 (t) | $ | 11,448,000 | $ | 11,447,154 | ||||
| Major Banks - 9.8% | ||||||||
| ANZ National (International) Ltd., 0.35%, due 1/25/13 (t) | $ | 8,090,000 | $ | 8,078,517 | ||||
| JPMorgan Chase & Co., 0.25%, due 10/16/12 | 1,835,000 | 1,834,427 | ||||||
| JPMorgan Chase & Co., 0.25%, due 10/24/12 | 5,913,000 | 5,910,824 | ||||||
| JPMorgan Chase & Co., 0.3%, due 1/24/13 | 3,629,000 | 3,624,615 | ||||||
| National Australia Funding (Delaware), Inc., 0.28%, due 2/19/13 (t) | 3,878,000 | 3,872,842 | ||||||
| Wells Fargo & Co., 0.16%, due 11/19/12 | 11,000,000 | 10,996,138 | ||||||
| Wells Fargo & Co., 0.16%, due 11/20/12 | 5,197,000 | 5,195,152 | ||||||
|
| |||||||
| $ | 39,512,515 | |||||||
| Pharmaceuticals - 6.3% | ||||||||
| Novartis Finance Corp., 0.13%, due 9/05/12 (t) | $ | 9,094,000 | $ | 9,093,869 | ||||
| Sanofi, 0.15%, due 9/26/12 (t) | 16,288,000 | 16,286,303 | ||||||
|
| |||||||
| $ | 25,380,172 | |||||||
| Tobacco - 3.3% | ||||||||
| Philip Morris International, Inc., 0.16%, due 9/05/12 (t) | $ | 291,000 | $ | 290,995 | ||||
| Philip Morris International, Inc., 0.17%, due 9/28/12 (t) | 13,195,000 | 13,193,318 | ||||||
|
| |||||||
| $ | 13,484,313 | |||||||
| Total Commercial Paper, at Amortized Cost and Value | $ | 173,360,790 | ||||||
| U.S. Government Agencies and Equivalents (y) - 17.6% | ||||||||
| Federal Home Loan Bank, 0.12%, due 9/26/12 | $ | 16,280,000 | $ | 16,278,643 | ||||
| Federal Home Loan Bank, 0.115%, due 10/12/12 | 2,800,000 | 2,799,633 | ||||||
| Federal Home Loan Bank, 0.14%, due 11/02/12 | 16,965,000 | 16,960,910 | ||||||
| Federal Home Loan Bank, 0.135%, due 11/09/12 | 380,000 | 379,902 | ||||||
| Federal Home Loan Bank, 0.145%, due 11/16/12 | 16,890,000 | 16,884,830 | ||||||
| Freddie Mac, 0.155%, due 9/24/12 | 12,447,000 | 12,445,767 | ||||||
| Freddie Mac, 0.155%, due 2/19/13 | 5,000,000 | 4,996,319 | ||||||
| Total U.S. Government Agencies and Equivalents, at Amortized Cost and Value | $ | 70,746,004 | ||||||
8
Table of Contents
Portfolios of Investments – continued
| Floating Rate Demand Notes - 4.3% | ||||||||
| Issuer | Shares/Par | Value ($) | ||||||
| East Baton Rouge, LA, Pollution Control Rev. (Exxon Mobil Corp.), 0.16%, 9/04/12 | $ | 8,700,000 | $ | 8,700,000 | ||||
| Lincoln County, WY, Pollution Control Rev. (Exxon Mobil Corp.), 0.16%, 9/04/12 | 8,400,000 | 8,400,000 | ||||||
| Total Floating Rate Demand Notes, at Cost and Value | $ | 17,100,000 | ||||||
| Repurchase Agreements - 15.1% | ||||||||
| Goldman Sachs, 0.18%, dated 8/31/12, due 9/04/12, total to be received $20,740,415 (secured by U.S. Treasury and Federal Agency obligations valued at $21,154,958 in a jointly traded account) | $ | 20,740,000 | $ | 20,740,000 | ||||
| Merrill Lynch, Pierce, Fenner, & Smith, Inc., 0.18%, dated 8/31/12 due 9/04/12, total to be received $40,204,804 (secured by U.S. Treasury and Federal Agency obligations valued at $41,008,094 in a jointly traded account) | 40,204,000 | 40,204,000 | ||||||
| Total Repurchase Agreements, at Cost and Value | $ | 60,944,000 | ||||||
| Total Investments, at Amortized Cost and Value | $ | 403,297,794 | ||||||
| Other Assets, Less Liabilities - (0.1)% | (308,697 | ) | ||||||
| Net Assets - 100.0% | $ | 402,989,097 | ||||||
9
Table of Contents
Portfolios of Investments – continued
MFS GOVERNMENT MONEY MARKET FUND
| Issuer | Shares/Par | Value ($) | ||||||
| U.S. Government Agencies and Equivalents (y) – 70.2% | ||||||||
| Fannie Mae, 0.13%, due 10/10/12 | $ | 496,000 | $ | 495,931 | ||||
| Fannie Mae, 0.165%, due 12/26/12 | 300,000 | 299,841 | ||||||
| Federal Home Loan Bank, 0.13%, due 9/05/12 | 165,000 | 164,998 | ||||||
| Federal Home Loan Bank, 0.1%, due 9/12/12 | 241,000 | 240,993 | ||||||
| Federal Home Loan Bank, 0.12%, due 9/12/12 | 388,000 | 387,986 | ||||||
| Federal Home Loan Bank, 0.11%, due 9/19/12 | 550,000 | 549,970 | ||||||
| Federal Home Loan Bank, 0.12%, due 9/26/12 | 560,000 | 559,953 | ||||||
| Federal Home Loan Bank, 0.13%, due 10/03/12 | 500,000 | 499,942 | ||||||
| Federal Home Loan Bank, 0.13%, due 10/26/12 | 493,000 | 492,902 | ||||||
| Federal Home Loan Bank, 0.14%, due 11/02/12 | 100,000 | 99,976 | ||||||
| Federal Home Loan Bank, 0.13%, due 11/09/12 | 560,000 | 559,860 | ||||||
| Federal Home Loan Bank, 0.135%, due 11/09/12 | 220,000 | 219,943 | ||||||
| Federal Home Loan Bank, 0.145%, due 11/16/12 | 570,000 | 569,826 | ||||||
| Federal Home Loan Bank, 0.16%, due 11/30/12 | 777,000 | 776,689 | ||||||
| Federal Home Loan Bank, 0.175%, due 12/03/12 | 400,000 | 399,819 | ||||||
| Freddie Mac, 0.12%, due 9/11/12 | 673,000 | 672,978 | ||||||
| Freddie Mac, 0.1%, due 9/17/12 | 247,000 | 246,989 | ||||||
| Freddie Mac, 0.16%, due 11/05/12 | 473,000 | 472,863 | ||||||
| Freddie Mac, 0.14%, due 12/03/12 | 560,000 | 559,797 | ||||||
| Freddie Mac, 0.15%, due 12/17/12 | 570,000 | 569,746 | ||||||
| Freddie Mac, 0.165%, due 12/24/12 | 512,000 | 511,732 | ||||||
| Freddie Mac, 0.16%, due 1/14/13 | 420,000 | 419,748 | ||||||
| Freddie Mac, 0.155%, due 2/19/13 | 100,000 | 99,926 | ||||||
| Total U.S. Government Agencies and Equivalents, at Amortized Cost and Value | $ | 9,872,408 | ||||||
| Repurchase Agreements - 30.0% | ||||||||
| Goldman Sachs, 0.18%, dated 8/31/12, due 9/04/12, total to be received $1,410,028 (secured by U.S. Treasury and Federal Agency obligations valued at $1,438,211 in a jointly traded account) | $ | 1,410,000 | $ | 1,410,000 | ||||
| Merrill Lynch, Pierce, Fenner & Smith, Inc., 0.18%, dated 8/31/12, due 9/04/12, total to be received $2,807,056 (secured by U.S. Treasury and Federal Agency obligations valued at $2,863,141 in a jointly traded account) | 2,807,000 | 2,807,000 | ||||||
| Total Repurchase Agreements, at Cost and Value | $ | 4,217,000 | ||||||
| Total Investments, at Amortized Cost and Value | $ | 14,089,408 | ||||||
| Other Assets, Less Liabilities - (0.2)% | (24,575 | ) | ||||||
| Net Assets - 100.0% | $ | 14,064,833 | ||||||
| (t) | Security exempt from registration with the U.S. Securities and Exchange Commission under Section 4(2) of the Securities Act of 1933. |
| (y) | The rate shown represents an annualized yield at time of purchase. |
See Notes to Financial Statements
10
Table of Contents
Financial Statements
STATEMENTS OF ASSETS AND LIABILITIES
At 8/31/12
These statements represent your fund’s balance sheet, which details the assets and liabilities comprising the total value of each fund.
MFS MONEY MARKET FUND
| Assets | ||||
Investments, at amortized cost and value | $342,353,794 | |||
Repurchase agreements, at cost and value | 60,944,000 | |||
Total investments, at amortized cost and value | $403,297,794 | |||
Cash | 773 | |||
Receivables for | ||||
Fund shares sold | 96,111 | |||
Interest | 27,825 | |||
Receivable from investment adviser | 19,459 | |||
Other assets | 1,052 | |||
Total assets | $403,443,014 | |||
| Liabilities | ||||
Payable for fund shares reacquired | $294,267 | |||
Payable to affiliates for shareholder servicing costs | 102,295 | |||
Payable for independent Trustees’ compensation | 16,389 | |||
Accrued expenses and other liabilities | 40,966 | |||
Total liabilities | $453,917 | |||
Net assets | $402,989,097 | |||
| Net assets consist of | ||||
Paid-in capital | $403,554,581 | |||
Accumulated net realized gain (loss) on investments | (547,172 | ) | ||
Accumulated distributions in excess of net investment income | (18,312 | ) | ||
Net assets | $402,989,097 | |||
Shares of beneficial interest outstanding | 403,571,306 | |||
Net asset value per share (net assets of $402,989,097 / 403,571,306 shares of | $1.00 |
A contingent deferred sales charge may be imposed on redemptions.
See Notes to Financial Statements
11
Table of Contents
Statements of Assets and Liabilities – continued
MFS GOVERNMENT MONEY MARKET FUND
| Assets | ||||
Investments, at amortized cost and value | $9,872,408 | |||
Repurchase agreements, at cost and value | 4,217,000 | |||
Total investments, at amortized cost and value | $14,089,408 | |||
Cash | 494 | |||
Receivables for | ||||
Interest | 21 | |||
Receivable from investment adviser | 11,218 | |||
Other assets | 75 | |||
Total assets | $14,101,216 | |||
| Liabilities | ||||
Payable for fund shares reacquired | $2,560 | |||
Payable to affiliates for shareholder servicing costs | 303 | |||
Payable for independent Trustees’ compensation | 2,714 | |||
Accrued expenses and other liabilities | 30,806 | |||
Total liabilities | $36,383 | |||
Net assets | $14,064,833 | |||
| Net assets consist of | ||||
Paid-in capital | $14,067,806 | |||
Accumulated distributions in excess of net investment income | (2,973 | ) | ||
Net assets | $14,064,833 | |||
Shares of beneficial interest outstanding | 14,069,831 | |||
Net asset value per share (net assets of $14,064,833 / 14,069,831 shares of beneficial interest outstanding) | $1.00 |
A contingent deferred sales charge may be imposed on redemptions.
See Notes to Financial Statements
12
Table of Contents
Financial Statements
Year ended 8/31/12
These statements describe how much each fund earned in investment income and accrued in expenses. They also describe any gains and/or losses generated by each fund’s operations.
MFS MONEY MARKET FUND
Net investment income | ||||
Interest income | $560,987 | |||
Expenses | ||||
Management fee | $1,746,974 | |||
Shareholder servicing costs | 813,164 | |||
Administrative services fee | 74,717 | |||
Independent Trustees’ compensation | 13,063 | |||
Custodian fee | 30,869 | |||
Shareholder communications | 22,679 | |||
Audit and tax fees | 34,225 | |||
Legal fees | 5,848 | |||
Miscellaneous | 73,075 | |||
Total expenses | $2,814,614 | |||
Fees paid indirectly | (25,757 | ) | ||
Reduction of expenses by investment adviser | (2,227,870 | ) | ||
Net expenses | $560,987 | |||
Net investment income | $0 | |||
Change in net assets from operations | $0 |
See Notes to Financial Statements
13
Table of Contents
Statements of Operations – continued
MFS GOVERNMENT MONEY MARKET FUND
Net investment income | ||||
Interest income | $13,826 | |||
Expenses | ||||
Management fee | $60,401 | |||
Shareholder servicing costs | 18,123 | |||
Administrative services fee | 17,516 | |||
Independent Trustees’ compensation | 1,739 | |||
Custodian fee | 5,994 | |||
Shareholder communications | 6,397 | |||
Audit and tax fees | 28,989 | |||
Legal fees | 423 | |||
Registration fees | 21,136 | |||
Miscellaneous | 9,579 | |||
Total expenses | $170,297 | |||
Fees paid indirectly | (2,486 | ) | ||
Reduction of expenses by investment adviser | (153,985 | ) | ||
Net expenses | $13,826 | |||
Net investment income | $0 | |||
Change in net assets from operations | $0 |
See Notes to Financial Statements
14
Table of Contents
Financial Statements
STATEMENTS OF CHANGES IN NET ASSETS
These statements describe the increases and/or decreases in net assets resulting from operations, any distributions, and any shareholder transactions.
MFS MONEY MARKET FUND
| Years ended 8/31 | ||||||||
| 2012 | 2011 | |||||||
| Change in net assets | ||||||||
| From operations | ||||||||
Net investment income | $0 | $0 | ||||||
Net realized gain (loss) on investments | — | (73 | ) | |||||
Change in net assets from operations | $0 | $(73 | ) | |||||
| Fund share (principal) transactions at net asset value of $1 per share | ||||||||
Net proceeds from sale of shares | 182,715,286 | 268,385,649 | ||||||
Cost of shares reacquired | (244,575,183 | ) | (312,102,735 | ) | ||||
Change in net assets from fund share transactions | $(61,859,897 | ) | $(43,717,086 | ) | ||||
Total change in net assets | $(61,859,897 | ) | $(43,717,159 | ) | ||||
| Net assets | ||||||||
At beginning of period | 464,848,994 | 508,566,153 | ||||||
At end of period (including accumulated distributions in excess of net investment income of $18,312 and $20,379, respectively) | $402,989,097 | $464,848,994 | ||||||
See Notes to Financial Statements
15
Table of Contents
Statements of Changes in Net Assets – continued
MFS GOVERNMENT MONEY MARKET FUND
| Years ended 8/31 | ||||||||
| 2012 | 2011 | |||||||
| Change in net assets | ||||||||
| From operations | ||||||||
Net investment income | $0 | $0 | ||||||
Change in net assets from operations | $0 | $0 | ||||||
| Fund share (principal) transactions at net asset value of $1 per share | ||||||||
Net proceeds from sale of shares | — | 12,653 | ||||||
Cost of shares reacquired | (2,099,271 | ) | (7,253,864 | ) | ||||
Change in net assets from fund share transactions | $(2,099,271 | ) | $(7,241,211 | ) | ||||
Total change in net assets | $(2,099,271 | ) | $(7,241,211 | ) | ||||
| Net assets | ||||||||
At beginning of period | 16,164,104 | 23,405,315 | ||||||
At end of period (including accumulated distributions in excess of | $14,064,833 | $16,164,104 | ||||||
See Notes to Financial Statements
16
Table of Contents
Financial Statements
The financial highlights table is intended to help you understand each fund’s financial performance for the past 5 years. Certain information reflects financial results for a single fund share. The total returns in each table represent the rate by which an investor would have earned (or lost) on an investment in each fund’s share class (assuming reinvestment of all distributions) held for the entire period.
MFS MONEY MARKET FUND
| Years ended 8/31 | ||||||||||||||||||||
| 2012 | 2011 | 2010 | 2009 | 2008 | ||||||||||||||||
Net asset value, beginning of period | $1.00 | $1.00 | $1.00 | $1.00 | $1.00 | |||||||||||||||
| Income (loss) from investment operations | ||||||||||||||||||||
Net investment income (d) | $0.00 | $0.00 | $0.00 | $0.01 | $0.04 | |||||||||||||||
Net realized and unrealized gain (loss) | — | 0.00 | (w) | 0.00 | (w) | (0.01 | ) | — | ||||||||||||
Total from investment operations | $0.00 | $0.00 | (w) | $0.00 | (w) | $0.00 | (w) | $0.04 | ||||||||||||
| Less distributions declared to shareholders | ||||||||||||||||||||
From net investment income | $— | $— | $(0.00 | )(w) | $(0.00 | )(w) | $(0.04 | ) | ||||||||||||
From tax return of capital | — | — | (0.00 | )(w) | — | — | ||||||||||||||
Total distributions declared to | $— | $— | $(0.00 | )(w) | $(0.00 | )(w) | $(0.04 | ) | ||||||||||||
Net asset value, end of period | $1.00 | $1.00 | $1.00 | $1.00 | $1.00 | |||||||||||||||
Total return (%) (r)(t) | 0.00 | 0.00 | 0.00 | (w) | 0.41 | 3.57 | ||||||||||||||
| Ratios (%) (to average net assets) and Supplemental data: | ||||||||||||||||||||
Expenses before expense reductions (f) | 0.64 | 0.64 | 0.63 | 0.68 | 0.63 | |||||||||||||||
Expenses after expense reductions (f) | 0.13 | 0.21 | 0.28 | 0.40 | 0.35 | |||||||||||||||
Net investment income | 0.00 | 0.00 | 0.00 | 0.50 | 3.51 | |||||||||||||||
Net assets at end of period (000 omitted) | $402,989 | $464,849 | $508,566 | $663,984 | $1,260,069 | |||||||||||||||
| (d) | Per share data is based on average shares outstanding. |
| (f) | Ratios do not reflect reductions from fees paid indirectly, if applicable. |
| (r) | Certain expenses have been reduced without which performance would have been lower. |
| (t) | Total returns do not include any applicable sales charges. |
| (w) | Per share amount was less than $0.01 and total return or ratio was less than 0.01%, as applicable. |
See Notes to Financial Statements
17
Table of Contents
Financial Highlights – continued
MFS GOVERNMENT MONEY MARKET FUND
| Years ended 8/31 | ||||||||||||||||||||
| 2012 | 2011 | 2010 | 2009 | 2008 | ||||||||||||||||
Net asset value, beginning of period | $1.00 | $1.00 | $1.00 | $1.00 | $1.00 | |||||||||||||||
| Income (loss) from investment operations | ||||||||||||||||||||
Net investment income (d) | $0.00 | $0.00 | $0.00 | $(0.00 | )(w) | $0.03 | ||||||||||||||
| Less distributions declared to shareholders | ||||||||||||||||||||
From net investment income | $— | $— | $(0.00 | )(w) | $(0.00 | )(w) | $(0.03 | ) | ||||||||||||
From tax return of capital | — | — | (0.00 | )(w) | — | — | ||||||||||||||
Total distributions declared to | $— | $— | $(0.00 | )(w) | $(0.00 | )(w) | $(0.03 | ) | ||||||||||||
Net asset value, end of period | $1.00 | $1.00 | $1.00 | $1.00 | $1.00 | |||||||||||||||
Total return (%) (r)(t) | 0.00 | 0.00 | 0.01 | 0.26 | 2.87 | |||||||||||||||
| Ratios (%) (to average net assets) and Supplemental data: | ||||||||||||||||||||
Expenses before expense reductions (f) | 1.13 | 1.00 | 0.79 | 0.69 | 0.94 | |||||||||||||||
Expenses after expense reductions (f) | 0.11 | 0.17 | 0.20 | 0.33 | 0.59 | |||||||||||||||
Net investment income | 0.00 | 0.00 | 0.00 | 0.27 | 2.59 | |||||||||||||||
Net assets at end of period (000 omitted) | $14,065 | $16,164 | $23,405 | $39,413 | $55,384 | |||||||||||||||
| (d) | Per share data is based on average shares outstanding. |
| (f) | Ratios do not reflect reductions from fees paid indirectly, if applicable. |
| (r) | Certain expenses have been reduced without which performance would have been lower. |
| (t) | Total returns do not include any applicable sales charges. |
| (w) | Per share amount was less than $0.01 and total return or ratio was less than 0.01%, as applicable. |
See Notes to Financial Statements
18
Table of Contents
(1) Business and Organization
MFS Money Market Fund and MFS Government Money Market Fund (the funds) are each a series of MFS Series Trust IV (the trust). The trust is organized as a Massachusetts business trust and is registered under the Investment Company Act of 1940, as amended, as an open-end management investment company.
(2) Significant Accounting Policies
General – The preparation of financial statements in conformity with U.S. generally accepted accounting principles requires management to make estimates and assumptions that affect the reported amounts of assets and liabilities, and disclosure of contingent assets and liabilities at the date of the financial statements and the reported amounts of revenues and expenses during the reporting period. Actual results could differ from those estimates. In the preparation of these financial statements, management has evaluated subsequent events occurring after the date of the funds’ Statements of Assets and Liabilities through the date that the financial statements were issued.
In this reporting period the funds adopted FASB Accounting Standards Update 2011-04, Fair Value Measurement (Topic 820) – Amendments to Achieve Common Fair Value Measurement and Disclosure Requirements in U.S. GAAP and IFRSs (“ASU 2011-04”). ASU 2011-04 seeks to improve the comparability of fair value measurements as presented and disclosed in financial statements prepared in accordance with U.S. GAAP and International Financial Reporting Standards (IFRS) by providing common requirements for fair value measurement and disclosure.
In December 2011, the Financial Accounting Standards Board issued Accounting Standards Update 2011-11, Balance Sheet (Topic 210) – Disclosures about Offsetting Assets and Liabilities (“ASU 2011-11”). Effective for annual reporting periods beginning on or after January 1, 2013 and interim periods within those annual periods, ASU 2011-11 is intended to enhance disclosure requirements on the offsetting of financial assets and liabilities. Although still evaluating the potential impacts of ASU 2011-11 to each fund, management expects that the impact of each fund’s adoption will be limited to additional financial statement disclosures.
Investment Valuations – Pursuant to procedures approved by the Board of Trustees, investments held by the funds are generally valued at amortized cost, which approximates market value. Amortized cost involves valuing an instrument at its cost as adjusted for amortization of premium or accretion of discount rather than its current market value. The amortized cost value of an instrument can be different from the market value of an instrument.
Various inputs are used in determining the value of the funds’ assets or liabilities. These inputs are categorized into three broad levels. In certain cases, the inputs used to measure fair value may fall into different levels of the fair value hierarchy. In such cases, an investment’s level within the fair value hierarchy is based on the lowest level of input that is significant to the fair value measurement. The funds’ assessment of the significance of a particular input to the fair value measurement in its entirety requires judgment, and considers factors specific to the investment. Level 1 includes unadjusted
19
Table of Contents
Notes to Financial Statements – continued
quoted prices in active markets for identical assets or liabilities. Level 2 includes other significant observable market-based inputs (including quoted prices for similar securities, interest rates, prepayment speed, and credit risk). Level 3 includes unobservable inputs, which may include the adviser’s own assumptions in determining the fair value of investments. The following is a summary of the levels used as of August 31, 2012 in valuing the funds’ assets or liabilities:
Investments at Value – Short Term Securities | Level 1 | Level 2 | Level 3 | Total | ||||||||||||
| MFS Money Market Fund | $— | $403,297,794 | $— | $403,297,794 | ||||||||||||
| MFS Government Money Market Fund | $— | $14,089,408 | $— | $14,089,408 | ||||||||||||
For further information regarding security characteristics, see the Portfolios of Investments.
Repurchase Agreements – Each fund entered into repurchase agreements with approved counterparties. Each repurchase agreement is recorded at cost. Each fund requires that the securities collateral in a repurchase transaction be transferred to a custodian. The funds monitor, on a daily basis, the value of the collateral to ensure that its value, including accrued interest, is greater than amounts owed to the funds under each such repurchase agreement. The funds and other funds managed by MFS may utilize a joint trading account for the purpose of entering into one or more repurchase agreements.
Indemnifications – Under each fund’s organizational documents, its officers and Trustees may be indemnified against certain liabilities and expenses arising out of the performance of their duties to the funds. Additionally, in the normal course of business, each fund enters into agreements with service providers that may contain indemnification clauses. Each fund’s maximum exposure under these agreements is unknown as this would involve future claims that may be made against the funds that have not yet occurred.
Investment Transactions and Income – Investment transactions are recorded on the trade date. Interest income is recorded on the accrual basis. All premium and discount is amortized or accreted for financial statement purposes in accordance with U.S. generally accepted accounting principles.
Fees Paid Indirectly – Each fund’s custody fee may be reduced according to an arrangement that measures the value of cash deposited with the custodian by the funds. This amount, for the year ended August 31, 2012, is shown as a reduction of total expenses on the Statements of Operations.
Tax Matters and Distributions – Each fund intends to qualify as a regulated investment company, as defined under Subchapter M of the Internal Revenue Code, and to distribute all of its taxable income, including realized capital gains. As a result, no provision for federal income tax is required. Each fund’s federal tax returns, when filed, will remain subject to examination by the Internal Revenue Service for a three year period.
Distributions to shareholders are recorded on the ex-dividend date. Income and capital gain distributions are determined in accordance with income tax regulations, which may differ from U.S. generally accepted accounting principles. Certain capital accounts in the financial statements are periodically adjusted for permanent differences in order to reflect their tax character. These adjustments have no impact on net assets or net
20
Table of Contents
Notes to Financial Statements – continued
asset value per share. Temporary differences which arise from recognizing certain items of income, expense, gain or loss in different periods for financial statement and tax purposes will reverse at some time in the future. Distributions in excess of net investment income or net realized gains are temporary overdistributions for financial statement purposes resulting from differences in the recognition or classification of income or distributions for financial statement and tax purposes.
Book/tax differences primarily relate to the timing of recognition of certain expenses.
MFS Money Market Fund and MFS Government Money Market Fund declared no distributions for the years ended August 31, 2012 and August 31, 2011.
The federal tax cost and the tax basis components of distributable earnings were as follows:
| As of 8/31/12 | MFS Money Market Fund | MFS Government Money Market Fund | ||||||
| Cost of investments | $403,297,794 | $14,089,408 | ||||||
| Capital loss carryforwards | $(547,172 | ) | $— | |||||
| Late year ordinary loss deferral | (2,048 | ) | (325 | ) | ||||
| Other temporary differences | (16,264 | ) | (2,648 | ) | ||||
Under the Regulated Investment Company Modernization Act of 2010 (the “Act”), net capital losses recognized after August 31, 2011 may be carried forward indefinitely, and their character is retained as short-term and/or long-term losses. Previously, net capital losses were carried forward for eight years and treated as short-term losses. As a transition rule, the Act requires that post-enactment net capital losses be used before pre-enactment net capital losses.
As of August 31, 2012, MFS Money Market Fund had capital loss carryforwards available to offset future realized gains. Such losses expire as follows:
| Pre-enactment losses: | ||||
| 8/31/13 | $(151 | ) | ||
| 8/31/15 | (35 | ) | ||
| 8/31/16 | (124,119 | ) | ||
| 8/31/17 | (422,794 | ) | ||
| Total | $(547,099 | ) | ||
| Post-enactment losses: | ||||
| Short-Term | $(73 | ) |
(3) Transactions with Affiliates
Investment Adviser – Each fund has an investment advisory agreement with MFS to provide overall investment management and related administrative services and facilities to the funds.
Each fund’s management fee is computed daily and paid monthly at the following annual rates:
| First $1 billion of average daily net assets | 0.40 | % | ||
| Average daily net assets in excess of $1 billion | 0.35 | % |
During the year ended August 31, 2012, MFS voluntarily waived receipt of $1,746,974 and $60,401 of MFS Money Market Fund’s and MFS Government Money Market
21
Table of Contents
Notes to Financial Statements – continued
Fund’s management fees, respectively, in order to avoid a negative yield. For the year ended August 31, 2012, this voluntary waiver had the effect of reducing the management fees by 0.40% of average daily net assets on an annualized basis for MFS Money Market Fund and MFS Government Money Market Fund, respectively. The management fees incurred for the year ended August 31, 2012 were equivalent to an annual effective rate 0.00% of average daily net assets for MFS Money Market Fund and MFS Government Money Market Fund, respectively.
In order to avoid a negative yield for the year ended August 31, 2012, MFS voluntarily agreed to reduce certain other expenses in the amount of $479,280 and $93,528, for MFS Money Market Fund and MFS Government Money Market Fund, respectively, which is shown as a reduction of total expenses in the Statements of Operations.
Distributor – Certain shares acquired through an exchange may be subject to a contingent deferred sales charge upon redemption depending on when the shares exchanged were originally purchased. Contingent deferred sales charges paid to MFS Distributors (MFD) during the year ended August 31, 2012 for the MFS Money Market Fund and MFS Government Money Market Fund were $25,816 and $0, respectively.
Shareholder Servicing Agent – MFS Service Center, Inc. (MFSC), a wholly-owned subsidiary of MFS, receives a fee from each fund for its services as shareholder servicing agent calculated as a percentage of the average daily net assets of each fund as determined periodically under the supervision of the funds’ Board of Trustees. For the year ended August 31, 2012, the fees were $412,051 and $12,047, which equated to 0.0943% and 0.0798% annually of each fund’s average daily net assets for MFS Money Market Fund and MFS Government Money Market Fund, respectively. MFSC also receives payment from each fund for out-of-pocket expenses, sub-accounting and other shareholder servicing costs which may be paid to affiliated and unaffiliated service providers. For the year ended August 31, 2012, these out-of-pocket expenses, sub-accounting and other shareholder servicing costs amounted to $401,113 and $6,076 for MFS Money Market Fund and MFS Government Money Market Fund, respectively.
Administrator – MFS provides certain financial, legal, shareholder communications, compliance, and other administrative services to each fund. Under an administrative services agreement, each fund partially reimburses MFS the costs incurred to provide these services. Each fund is charged an annual fixed amount of $17,500 plus a fee based on average daily net assets. The administrative services fee incurred for the year ended August 31, 2012 was equivalent to an annual effective rate of 0.0171% and 0.1160% of the fund’s average daily net assets for MFS Money Market Fund and MFS Government Money Market Fund, respectively.
Trustees’ and Officers’ Compensation – Each fund pays compensation to independent Trustees in the form of a retainer, attendance fees, and additional compensation to Board and Committee chairpersons. The funds do not pay compensation directly to Trustees or officers of the funds who are also officers of the investment adviser, all of whom receive remuneration for their services to the funds from MFS. Certain officers and Trustees of the funds are officers or directors of MFS, MFD, and MFSC.
22
Table of Contents
Notes to Financial Statements – continued
Prior to December 31, 2001, the funds had an unfunded defined benefit plan (“DB plan”) for independent Trustees. As of December 31, 2001, the Board took action to terminate the DB plan with respect to then-current and any future independent Trustees, such that the DB plan covers only certain of those former independent Trustees who retired on or before December 31, 2001. The DB plan resulted in a pension expense of $1,662 and $359 for MFS Money Market Fund and MFS Government Money Market Fund, respectively, and is included in independent Trustees’ compensation for the year ended August 31, 2012. The liability for deferred retirement benefits payable to certain independent Trustees under the DB plan amounted to $16,264 and $2,648 for MFS Money Market Fund and MFS Government Money Market Fund, respectively, at August 31, 2012, and is included in “Payable for independent Trustees’ compensation” on the Statements of Assets and Liabilities.
Other – These funds and certain other funds managed by MFS (the funds) have entered into services agreements (the Agreements) which provide for payment of fees by the funds to Tarantino LLC and Griffin Compliance LLC in return for the provision of services of an Independent Chief Compliance Officer (ICCO) and Assistant ICCO, respectively, for the funds. The ICCO and Assistant ICCO are officers of the funds and the sole members of Tarantino LLC and Griffin Compliance LLC, respectively. The funds can terminate the Agreements with Tarantino LLC and Griffin Compliance LLC at any time under the terms of the Agreements. For the year ended August 31, 2012, the aggregate fees paid by the funds to Tarantino LLC and Griffin Compliance LLC were $3,863 and $140 for MFS Money Market Fund and MFS Government Money Market Fund, respectively, and are included in “Miscellaneous” expense on the Statements of Operations. MFS has agreed to reimburse the funds for a portion of the payments made by the funds in the amount of $1,616 and $56 for MFS Money Market Fund and MFS Government Money Market Fund, respectively, which is shown as a reduction of total expenses in the Statements of Operations. Additionally, MFS has agreed to bear all expenses associated with office space, other administrative support, and supplies provided to the ICCO and Assistant ICCO.
(4) Shares of Beneficial Interest
Each fund’s Declaration of Trust permits the Trustees to issue an unlimited number of full and fractional shares of beneficial interest.
The sale of each fund’s shares has been suspended except in certain circumstances. Please see each fund’s prospectus for details.
(5) Line of Credit
Each fund and certain other funds managed by MFS participate in a $1.1 billion unsecured committed line of credit, subject to a $1 billion sublimit, provided by a syndication of banks under a credit agreement. Borrowings may be made for temporary financing needs. Interest is charged to each fund, based on its borrowings, generally at a rate equal to the higher of the Federal Reserve funds rate or one month LIBOR plus an agreed upon spread. A commitment fee, based on the average daily, unused portion of the committed line of credit, is allocated among the participating funds at the end of each calendar quarter. In addition, the funds and other funds managed by MFS have established unsecured uncommitted borrowing arrangements with certain banks for temporary financing needs. Interest is charged to each fund,
23
Table of Contents
Notes to Financial Statements – continued
based on its borrowings, at a rate equal to the Federal Reserve funds rate plus an agreed upon spread. For the year ended August 31, 2012, the funds’ commitment fees were $3,076 and $107 and interest expenses were $0 and $0, for MFS Money Market Fund and MFS Government Money Market Fund, respectively, and are included in “Miscellaneous” expense on the Statements of Operations.
24
Table of Contents
REPORT OF INDEPENDENT REGISTERED PUBLIC ACCOUNTING FIRM
To the Board of Trustees of MFS Series Trust IV and the Shareholders of MFS Money Market Fund and MFS Government Money Market Fund:
We have audited the accompanying statements of assets and liabilities, including the portfolios of investments, of MFS Money Market Fund and MFS Government Money Market Fund (two of the portfolios comprising MFS Series Trust IV) (the “Funds”) as of August 31, 2012, and the related statements of operations for the year then ended, the statements of changes in net assets for each of the two years in the period then ended, and the financial highlights for each of the five years in the period then ended. These financial statements and financial highlights are the responsibility of the Funds’ management. Our responsibility is to express an opinion on these financial statements and financial highlights based on our audits.
We conducted our audits in accordance with the standards of the Public Company Accounting Oversight Board (United States). Those standards require that we plan and perform the audits to obtain reasonable assurance about whether the financial statements and financial highlights are free of material misstatement. The Funds are not required to have, nor were we engaged to perform, an audit of their internal control over financial reporting. Our audits included consideration of internal control over financial reporting as a basis for designing audit procedures that are appropriate in the circumstances, but not for the purpose of expressing an opinion on the effectiveness of the Funds’ internal control over financial reporting. Accordingly, we express no such opinion. An audit also includes examining, on a test basis, evidence supporting the amounts and disclosures in the financial statements, assessing the accounting principles used and significant estimates made by management, as well as evaluating the overall financial statement presentation. Our procedures included confirmation of securities owned as of August 31, 2012, by correspondence with the custodian and brokers; where replies were not received from brokers, we performed other auditing procedures. We believe that our audits provide a reasonable basis for our opinion.
In our opinion, the financial statements and financial highlights referred to above present fairly, in all material respects, the financial positions of MFS Money Market Fund and MFS Government Money Market Fund as of August 31, 2012, the results of their operations for the year then ended, the changes in their net assets for each of the two years in the period then ended, and the financial highlights for each of the five years in the period then ended, in conformity with accounting principles generally accepted in the United States of America.
DELOITTE & TOUCHE LLP
Boston, Massachusetts
October 17, 2012
25
Table of Contents
TRUSTEES AND OFFICERS — IDENTIFICATION AND BACKGROUND
The Trustees and officers of the Trust, as of October 1, 2012, are listed below, together with their principal occupations during the past five years. (Their titles may have varied during that period.) The address of each Trustee and officer is 500 Boylston Street, Boston, Massachusetts 02116.
Name, Age | Position(s) Held with Fund | Trustee/Officer Since (h) | Principal the Past Five Years | Other Directorships (j) | ||||
| INTERESTED TRUSTEES | ||||||||
| Robert J. Manning (k) (age 48) | Trustee | February 2004 | Massachusetts Financial Services Company, Chairman, Chief Executive Officer and Director; President (until December 2009); Chief Investment Officer (until July 2010) | N/A | ||||
| INDEPENDENT TRUSTEES | ||||||||
| David H. Gunning (age 70) | Trustee and Chair of Trustees | January 2004 | Retired; Cleveland-Cliffs Inc. (mining products and service provider), Vice Chairman/Director (until 2007) | Lincoln Electric Holdings, Inc. (welding equipment manufacturer), Director; Development Alternatives, Inc. (consulting), Director/Non-Executive Chairman; Portman Limited (mining), Director (until 2008) | ||||
| Robert E. Butler (age 70) | Trustee | January 2006 | Consultant – investment company industry regulatory and compliance matters | N/A | ||||
| Maureen R. Goldfarb (age 57) | Trustee | January 2009 | Private investor | N/A | ||||
| William R. Gutow (age 71) | Trustee | December 1993 | Private investor and real estate consultant; Capitol Entertainment Management Company (video franchise), Vice Chairman | Atlantic Coast Tan (tanning salons), Vice Chairman (until 2007); Texas Donuts (donut franchise), Vice Chairman (until 2010) | ||||
| Michael Hegarty (age 67) | Trustee | December 2004 | Private investor | N/A | ||||
| John P. Kavanaugh (age 57) | Trustee | January 2009 | Private investor | N/A | ||||
26
Table of Contents
Trustees and Officers – continued
Name, Age | Position(s) Held with Fund | Trustee/Officer Since (h) | Principal the Past Five Years | Other Directorships (j) | ||||
| J. Dale Sherratt (age 74) | Trustee | June 1989 | Insight Resources, Inc. (acquisition planning specialists), President; Wellfleet Investments (investor in health care companies), Managing General Partner | N/A | ||||
| Laurie J. Thomsen (age 55) | Trustee | March 2005 | Private investor; New Profit, Inc. (venture philanthropy), Executive Partner (until 2010) | The Travelers Companies (insurance), Director | ||||
| Robert W. Uek (age 71) | Trustee | January 2006 | Consultant to investment company industry | N/A | ||||
| OFFICERS | ||||||||
| John M. Corcoran (k) (age 47) | President | October 2008 | Massachusetts Financial Services Company, Senior Vice President (since October 2008); State Street Bank and Trust (financial services provider), Senior Vice President, (until September 2008) | N/A | ||||
| Christopher R. Bohane (k) (age 38) | Assistant Secretary and Assistant Clerk | July 2005 | Massachusetts Financial Services Company, Vice President and Senior Counsel | N/A | ||||
| Kino Clark (k) (age 44) | Assistant Treasurer | January 2012 | Massachusetts Financial Services Company, Vice President | N/A | ||||
| Thomas H. Connors (k) (age 53) | Assistant Secretary and Assistant Clerk | September 2012 | Massachusetts Financial Services Company, Vice President and Senior Counsel; Deutsche Asset Management, Director and Senior Counsel (until 2012) | N/A |
27
Table of Contents
Trustees and Officers – continued
Name, Age | Position(s) Held with Fund | Trustee/Officer Since (h) | Principal the Past Five Years | Other Directorships (j) | ||||
| Ethan D. Corey (k) (age 48) | Assistant Secretary and Assistant Clerk | July 2005 | Massachusetts Financial Services Company, Senior Vice President and Associate General Counsel | N/A | ||||
| David L. DiLorenzo (k) (age 44) | Treasurer | July 2005 | Massachusetts Financial Services Company, Senior Vice President | N/A | ||||
| Robyn L. Griffin (age 37) | Assistant Independent Chief Compliance Officer | August 2008 | Griffin Compliance LLC (provider of compliance services), Principal (since August 2008); State Street Corporation (financial services provider), Mutual Fund Administration Assistant Vice President (October 2006 – July 2008); | N/A | ||||
| Brian E. Langenfeld (k) (age 39) | Assistant Secretary and Assistant Clerk | June 2006 | Massachusetts Financial Services Company, Vice President and Senior Counsel | N/A | ||||
| Susan S. Newton (k) (age 62) | Assistant Secretary and Assistant Clerk | May 2005 | Massachusetts Financial Services Company, Senior Vice President and Associate General Counsel | N/A | ||||
| Susan A. Pereira (k) (age 41) | Assistant Secretary and Assistant Clerk | July 2005 | Massachusetts Financial Services Company, Vice President and Senior Counsel | N/A | ||||
| Kasey L. Phillips (k) (age 41) | Assistant Treasurer | September 2012 | Massachusetts Financial Services Company; Wells Fargo Funds Management, LLC, Senior Vice President, Fund Treasurer (until 2012) | N/A |
28
Table of Contents
Trustees and Officers – continued
Name, Age | Position(s) Held with Fund | Trustee/Officer Since (h) | Principal the Past Five Years | Other Directorships (j) | ||||
| Mark N. Polebaum (k) (age 60) | Secretary and Clerk | January 2006 | Massachusetts Financial Services Company, Executive Vice President, General Counsel and Secretary | N/A | ||||
| Frank L. Tarantino (age 68) | Independent Chief Compliance Officer | June 2004 | Tarantino LLC (provider of compliance services), Principal | N/A | ||||
| Richard S. Weitzel (k) (age 42) | Assistant Secretary and Assistant Clerk | October 2007 | Massachusetts Financial Services Company, Senior Vice President and Associate General Counsel | N/A | ||||
| James O. Yost (k) (age 52) | Deputy Treasurer | September 1990 | Massachusetts Financial Services Company, Senior Vice President | N/A |
| (h) | Date first appointed to serve as Trustee/officer of an MFS fund. Each Trustee has served continuously since appointment unless indicated otherwise. For the period from December 15, 2004 until February 22, 2005, Mr. Manning served as Advisory Trustee. For the period October 2008, until January 2012, Mr. Corcoran served as Treasurer of the Funds. Prior to January 2012, Messrs. DiLorenzo and Yost served as Assistant Treasurers of the Funds. |
| (j) | Directorships or trusteeships of companies required to report to the Securities and Exchange Commission (i.e., “public companies”). |
| (k) | “Interested person” of the Trust within the meaning of the Investment Company Act of 1940 (referred to as the 1940 Act), which is the principal federal law governing investment companies like the fund, as a result of position with MFS. The address of MFS is 500 Boylston Street, Boston, Massachusetts 02116. |
Each Trustee has been elected by shareholders and each Trustee and officer holds office until his or her successor is chosen and qualified or until his or her earlier death, resignation, retirement or removal. The Trust does not hold annual meetings for the purpose of electing Trustees, and Trustees are not elected for fixed terms. Messrs. Butler, Kavanaugh, Uek and Ms. Thomsen are members of the Trust’s Audit Committee.
Each of the Fund’s Trustees and officers holds comparable positions with certain other funds of which MFS or a subsidiary is the investment adviser or distributor, and, in the case of the officers, with certain affiliates of MFS. As of January 1, 2012, the Trustees served as board members of 131 funds within the MFS Family of Funds.
29
Table of Contents
Trustees and Officers – continued
The Statement of Additional Information for the Fund includes further information about the Trustees and is available without charge upon request by calling 1-800-225-2606.
| Investment Adviser | Custodian | |
Massachusetts Financial Services Company Boston, MA 02116-3741 | State Street Bank and Trust 1 Lincoln Street Boston, MA 02111-2900 | |
| Distributor | Independent Registered Public Accounting Firm | |
MFS Fund Distributors, Inc. Boston, MA 02116-3741 | Deloitte & Touche LLP 200 Berkeley Street Boston, MA 02116 | |
| Portfolio Manager | ||
| Edward O’Dette |
30
Table of Contents
BOARD REVIEW OF INVESTMENT ADVISORY AGREEMENT
MFS Money Market Fund
The Investment Company Act of 1940 requires that both the full Board of Trustees and a majority of the non-interested (“independent”) Trustees, voting separately, annually approve the continuation of the Fund’s investment advisory agreement with MFS. The Trustees consider matters bearing on the Fund and its advisory arrangements at their meetings throughout the year, including a review of performance data at each regular meeting. In addition, the independent Trustees met several times over the course of three months beginning in May and ending in July, 2012 (“contract review meetings”) for the specific purpose of considering whether to approve the continuation of the investment advisory agreement for the Fund and the other investment companies that the Board oversees (the “MFS Funds”). The independent Trustees were assisted in their evaluation of the Fund’s investment advisory agreement by independent legal counsel, from whom they received separate legal advice and with whom they met separately from MFS during various contract review meetings. The independent Trustees were also assisted in this process by the MFS Funds’ Independent Chief Compliance Officer, a full-time senior officer appointed by and reporting to the independent Trustees.
In connection with their deliberations regarding the continuation of the investment advisory agreement, the Trustees, including the independent Trustees, considered such information and factors as they believed, in light of the legal advice furnished to them and their own business judgment, to be relevant. The investment advisory agreement for the Fund was considered separately, although the Trustees also took into account the common interests of all MFS Funds in their review. As described below, the Trustees considered the nature, quality, and extent of the various investment advisory, administrative, and shareholder services performed by MFS under the existing investment advisory agreement and other arrangements with the Fund.
In connection with their contract review meetings, the Trustees received and relied upon materials that included, among other items: (i) information provided by Lipper Inc., an independent third party, on the investment performance of the Fund for various time periods ended December 31, 2011 and the investment performance of a group of funds with substantially similar investment classifications/objectives (the “Lipper performance universe”), (ii) information provided by Lipper Inc. on the Fund’s advisory fees and other expenses and the advisory fees and other expenses of comparable funds identified by Lipper Inc. (the “Lipper expense group”), (iii) information provided by MFS on the advisory fees of comparable portfolios of other clients of MFS, including institutional separate accounts and other clients, (iv) information as to whether and to what extent applicable expense waivers, reimbursements or fee “breakpoints” are observed for the Fund, (v) information regarding MFS’ financial results and financial condition, including MFS’ and certain of its affiliates’ estimated profitability from services performed for the Fund and the MFS Funds as a whole, and compared to MFS’ institutional business, (vi) MFS’ views regarding the outlook for the mutual fund industry and the strategic business plans of MFS, (vii) descriptions of various functions performed by MFS for the Funds, such as compliance monitoring and portfolio trading practices, and (viii) information regarding the overall organization of MFS, including information about MFS’ senior management
31
Table of Contents
Board Review of Investment Advisory Agreement – continued
and other personnel providing investment advisory, administrative and other services to the Fund and the other MFS Funds. The comparative performance, fee and expense information prepared and provided by Lipper Inc. was not independently verified and the independent Trustees did not independently verify any information provided to them by MFS.
The Trustees’ conclusion as to the continuation of the investment advisory agreement was based on a comprehensive consideration of all information provided to the Trustees and not the result of any single factor. Some of the factors that figured particularly in the Trustees’ deliberations are described below, although individual Trustees may have evaluated the information presented differently from one another, giving different weights to various factors. It is also important to recognize that the fee arrangements for the Fund and other MFS Funds are the result of years of review and discussion between the independent Trustees and MFS, that certain aspects of such arrangements may receive greater scrutiny in some years than in others, and that the Trustees’ conclusions may be based, in part, on their consideration of these same arrangements during the course of the year and in prior years.
Based on information provided by Lipper Inc. and MFS, the Trustees reviewed the Fund’s total return investment performance as well as the performance of peer groups of funds over various time periods. The Trustees placed particular emphasis on the total return performance of the Fund’s shares in comparison to the performance of funds in its Lipper performance universe over the three-year period ended December 31, 2011, which the Trustees believed was a long enough period to reflect differing market conditions. The total return performance of the Fund’s shares was in the 5th quintile relative to the other funds in the universe for this three-year period (the 1st quintile being the best performers and the 5th quintile being the worst performers). The total return performance of the Fund’s shares was in the 4th quintile for the one-year period and the 2nd quintile for the five-year period ended December 31, 2011 relative to the Lipper performance universe. Because of the passage of time, these performance results may differ from the performance results for more recent periods, including those shown elsewhere in this report.
In the course of their deliberations, the Trustees took into account information provided by MFS in connection with the contract review meetings, as well as during investment review meetings conducted with portfolio management personnel during the course of the year regarding the Fund’s performance. In addition, the independent Trustees noted the market conditions affecting all money market funds, in particular the low interest rate environment, and MFS’ voluntary waiver of its fees to ensure that the fund avoids a negative yield. After reviewing these and related factors, the Trustees concluded, within the context of their overall conclusions regarding the investment advisory agreement, that they were satisfied with MFS’ responses and efforts relating to investment performance.
In assessing the reasonableness of the Fund’s advisory fee, the Trustees considered, among other information, the Fund’s advisory fee and the total expense ratio of the Fund’s shares as a percentage of average daily net assets and the advisory fee and total expense ratios of peer groups of funds based on information provided by Lipper Inc. The Trustees considered that, according to the Lipper data (which takes into account any fee reductions or expense limitations that were in effect during the Fund’s last
32
Table of Contents
Board Review of Investment Advisory Agreement – continued
fiscal year), the Fund’s effective advisory fee rate was approximately at the Lipper expense group median, and the Fund’s total expense ratio was lower than the Lipper expense group median.
The Trustees also considered the advisory fees charged by MFS to institutional accounts, if any. In comparing these fees, the Trustees considered information provided by MFS as to the generally broader scope of services provided by MFS to the Fund in comparison to institutional accounts, the higher demands placed on MFS’ investment personnel and trading infrastructure as a result of the daily cash in-flows and out-flows of the Fund, and the impact on MFS and expenses associated with the more extensive regulatory regime to which the Fund is subject in comparison to institutional accounts.
The Trustees also considered whether the Fund is likely to benefit from any economies of scale in the management of the Fund in the event of growth in assets of the Fund. They noted that the Fund’s advisory fee rate schedule is subject to a contractual breakpoint that reduces the Fund’s advisory fee rate on average daily net assets over $1 billion. The Trustees concluded that the existing breakpoint was sufficient to allow the Fund to benefit from economies of scale as its assets grow.
The Trustees also considered information prepared by MFS relating to MFS’ costs and profits with respect to the Fund, the MFS Funds considered as a group, and other investment companies and accounts advised by MFS, as well as MFS’ methodologies used to determine and allocate its costs to the MFS Funds, the Fund and other accounts and products for purposes of estimating profitability.
After reviewing these and other factors described herein, the Trustees concluded, within the context of their overall conclusions regarding the investment advisory agreement, that the advisory fees charged to the Fund represent reasonable compensation in light of the services being provided by MFS to the Fund.
In addition, the Trustees considered MFS’ resources and related efforts to continue to retain, attract and motivate capable personnel to serve the Fund. The Trustees also considered current and developing conditions in the financial services industry, including the presence of large and well-capitalized companies which are spending, and appear to be prepared to continue to spend, substantial sums to engage personnel and to provide services to competing investment companies. In this regard, the Trustees also considered the financial resources of MFS and its ultimate parent, Sun Life Financial Inc. The Trustees also considered the advantages and possible disadvantages to the Fund of having an adviser that also serves other investment companies as well as other accounts.
The Trustees also considered the nature, quality, cost, and extent of administrative, transfer agency, and distribution services provided to the Fund by MFS and its affiliates under agreements and plans other than the investment advisory agreement. The Trustees also considered the nature, extent and quality of certain other services MFS performs or arranges for on the Fund’s behalf, which may include securities lending programs, directed expense payment programs, class action recovery programs, and MFS’ interaction with third-party service providers, principally custodians and sub-custodians. The Trustees concluded that the various non-advisory services provided by MFS and its affiliates on behalf of the Fund were satisfactory.
33
Table of Contents
Board Review of Investment Advisory Agreement – continued
The Trustees also considered benefits to MFS from the use of the Fund’s portfolio brokerage commissions, if applicable, to pay for investment research and various other factors. Additionally, the Trustees considered so-called “fall-out benefits” to MFS such as reputational value derived from serving as investment manager to the Fund.
Based on their evaluation of factors that they deemed to be material, including those factors described above, the Board of Trustees, including the independent Trustees, concluded that the Fund’s investment advisory agreement with MFS should be continued for an additional one-year period, commencing August 1, 2012.
A discussion regarding the Board’s most recent review and renewal of the fund’s Investment Advisory Agreement with MFS is available by clicking on the fund’s name under “Mutual Funds” in the “Products and Performance” section of the MFS Web site (mfs.com).
34
Table of Contents
Board Review of Investment Advisory Agreement – continued
MFS Government Money Market Fund
The Investment Company Act of 1940 requires that both the full Board of Trustees and a majority of the non-interested (“independent”) Trustees, voting separately, annually approve the continuation of the Fund’s investment advisory agreement with MFS. The Trustees consider matters bearing on the Fund and its advisory arrangements at their meetings throughout the year, including a review of performance data at each regular meeting. In addition, the independent Trustees met several times over the course of three months beginning in May and ending in July, 2012 (“contract review meetings”) for the specific purpose of considering whether to approve the continuation of the investment advisory agreement for the Fund and the other investment companies that the Board oversees (the “MFS Funds”). The independent Trustees were assisted in their evaluation of the Fund’s investment advisory agreement by independent legal counsel, from whom they received separate legal advice and with whom they met separately from MFS during various contract review meetings. The independent Trustees were also assisted in this process by the MFS Funds’ Independent Chief Compliance Officer, a full-time senior officer appointed by and reporting to the independent Trustees.
In connection with their deliberations regarding the continuation of the investment advisory agreement, the Trustees, including the independent Trustees, considered such information and factors as they believed, in light of the legal advice furnished to them and their own business judgment, to be relevant. The investment advisory agreement for the Fund was considered separately, although the Trustees also took into account the common interests of all MFS Funds in their review. As described below, the Trustees considered the nature, quality, and extent of the various investment advisory, administrative, and shareholder services performed by MFS under the existing investment advisory agreement and other arrangements with the Fund.
In connection with their contract review meetings, the Trustees received and relied upon materials that included, among other items: (i) information provided by Lipper Inc., an independent third party, on the investment performance of the Fund for various time periods ended December 31, 2011 and the investment performance of a group of funds with substantially similar investment classifications/objectives (the “Lipper performance universe”), (ii) information provided by Lipper Inc. on the Fund’s advisory fees and other expenses and the advisory fees and other expenses of comparable funds identified by Lipper Inc. (the “Lipper expense group”), (iii) information provided by MFS on the advisory fees of comparable portfolios of other clients of MFS, including institutional separate accounts and other clients, (iv) information as to whether and to what extent applicable expense waivers, reimbursements or fee “breakpoints” are observed for the Fund, (v) information regarding MFS’ financial results and financial condition, including MFS’ and certain of its affiliates’ estimated profitability from services performed for the Fund and the MFS Funds as a whole, and compared to MFS’ institutional business, (vi) MFS’ views regarding the outlook for the mutual fund industry and the strategic business plans of MFS, (vii) descriptions of various functions performed by MFS for the Funds, such as compliance monitoring and portfolio trading practices, and (viii) information regarding the overall organization of MFS, including information about MFS’ senior management
35
Table of Contents
Board Review of Investment Advisory Agreement – continued
and other personnel providing investment advisory, administrative and other services to the Fund and the other MFS Funds. The comparative performance, fee and expense information prepared and provided by Lipper Inc. was not independently verified and the independent Trustees did not independently verify any information provided to them by MFS.
The Trustees’ conclusion as to the continuation of the investment advisory agreement was based on a comprehensive consideration of all information provided to the Trustees and not the result of any single factor. Some of the factors that figured particularly in the Trustees’ deliberations are described below, although individual Trustees may have evaluated the information presented differently from one another, giving different weights to various factors. It is also important to recognize that the fee arrangements for the Fund and other MFS Funds are the result of years of review and discussion between the independent Trustees and MFS, that certain aspects of such arrangements may receive greater scrutiny in some years than in others, and that the Trustees’ conclusions may be based, in part, on their consideration of these same arrangements during the course of the year and in prior years.
Based on information provided by Lipper Inc. and MFS, the Trustees reviewed the Fund’s total return investment performance as well as the performance of peer groups of funds over various time periods. The Trustees placed particular emphasis on the total return performance of the Fund’s shares in comparison to the performance of funds in its Lipper performance universe over the three-year period ended December 31, 2011, which the Trustees believed was a long enough period to reflect differing market conditions. The total return performance of the Fund’s shares was in the 5th quintile relative to the other funds in the universe for this three-year period (the 1st quintile being the best performers and the 5th quintile being the worst performers). The total return performance of the Fund’s shares was in the 4th quintile for the one-year period and the 3rd quintile for the five-year period ended December 31, 2011 relative to the Lipper performance universe. Because of the passage of time, these performance results may differ from the performance results for more recent periods, including those shown elsewhere in this report.
In addition to considering the performance information provided in connection with the contract review meetings, the independent Trustees noted that, in light of the Fund’s substandard relative performance at the time of their contract review meetings in 2011, they had met at each of their regular meetings since then with MFS’ senior investment management personnel to discuss the Fund’s performance and MFS’ efforts to improve the Fund’s performance. The independent Trustees further noted the market conditions affecting all money market funds, in particular the low interest rate environment and MFS’ voluntary waiver of its fees to ensure that the Fund avoids a negative yield. Taking this information into account, the Trustees concluded, within the context of their overall conclusions regarding the investment advisory agreement, that they were satisfied with MFS’ responses and efforts relating to investment performance.
In assessing the reasonableness of the Fund’s advisory fee, the Trustees considered, among other information, the Fund’s advisory fee and the total expense ratio of the Fund’s shares as a percentage of average daily net assets and the advisory fee and total expense ratios of peer groups of funds based on information provided by Lipper Inc. The Trustees considered that,
36
Table of Contents
Board Review of Investment Advisory Agreement – continued
according to the Lipper data (which takes into account any fee reductions or expense limitations that were in effect during the Fund’s last fiscal year), the Fund’s effective advisory fee rate was lower than the Lipper expense group median and the Fund’s total expense ratio was approximately at the Lipper expense group median.
The Trustees also considered the advisory fees charged by MFS to institutional accounts, if any. In comparing these fees, the Trustees considered information provided by MFS as to the generally broader scope of services provided by MFS to the Fund in comparison to institutional accounts, the higher demands placed on MFS’ investment personnel and trading infrastructure as a result of the daily cash in-flows and out-flows of the Fund, and the impact on MFS and expenses associated with the more extensive regulatory regime to which the Fund is subject in comparison to institutional accounts.
The Trustees also considered whether the Fund is likely to benefit from any economies of scale in the management of the Fund in the event of growth in assets of the Fund. They noted that the Fund’s advisory fee rate schedule is subject to a contractual breakpoint that reduces the Fund’s advisory fee rate on average daily net assets over $1 billion. The Trustees concluded that the existing breakpoint was sufficient to allow the Fund to benefit from economies of scale as its assets grow.
The Trustees also considered information prepared by MFS relating to MFS’ costs and profits with respect to the Fund, the MFS Funds considered as a group, and other investment companies and accounts advised by MFS, as well as MFS’ methodologies used to determine and allocate its costs to the MFS Funds, the Fund and other accounts and products for purposes of estimating profitability.
After reviewing these and other factors described herein, the Trustees concluded, within the context of their overall conclusions regarding the investment advisory agreement, that the advisory fees charged to the Fund represent reasonable compensation in light of the services being provided by MFS to the Fund.
In addition, the Trustees considered MFS’ resources and related efforts to continue to retain, attract and motivate capable personnel to serve the Fund. The Trustees also considered current and developing conditions in the financial services industry, including the presence of large and well-capitalized companies which are spending, and appear to be prepared to continue to spend, substantial sums to engage personnel and to provide services to competing investment companies. In this regard, the Trustees also considered the financial resources of MFS and its ultimate parent, Sun Life Financial Inc. The Trustees also considered the advantages and possible disadvantages to the Fund of having an adviser that also serves other investment companies as well as other accounts.
The Trustees also considered the nature, quality, cost, and extent of administrative, transfer agency, and distribution services provided to the Fund by MFS and its affiliates under agreements and plans other than the investment advisory agreement. The Trustees also considered the nature, extent and quality of certain other services MFS performs or arranges for on the Fund’s behalf, which may include securities lending programs, directed expense payment programs, class action recovery programs, and MFS’ interaction with third-party service providers, principally custodians and sub-custodians. The Trustees concluded that the various non-advisory services provided by MFS and its affiliates on behalf of the Fund were satisfactory.
37
Table of Contents
Board Review of Investment Advisory Agreement – continued
The Trustees also considered benefits to MFS from the use of the Fund’s portfolio brokerage commissions, if applicable, to pay for investment research and various other factors. Additionally, the Trustees considered so-called “fall-out benefits” to MFS such as reputational value derived from serving as investment manager to the Fund.
Based on their evaluation of factors that they deemed to be material, including those factors described above, the Board of Trustees, including the independent Trustees, concluded that the Fund’s investment advisory agreement with MFS should be continued for an additional one-year period, commencing August 1, 2012.
A discussion regarding the Board’s most recent review and renewal of the fund’s Investment Advisory Agreement with MFS is available by clicking on the fund’s name under “Mutual Funds” in the “Products and Performance” section of the MFS Web site (mfs.com).
38
Table of Contents
PROXY VOTING POLICIES AND INFORMATION
A general description of the MFS funds’ proxy voting policies and procedures is available without charge, upon request, by calling 1-800-225-2606, by visiting the Proxy Voting section of mfs.com or by visiting the SEC’s Web site at http://www.sec.gov.
Information regarding how the fund voted proxies relating to portfolio securities during the most recent twelve-month period ended June 30 is available without charge by visiting the Proxy Voting section of mfs.com or by visiting the SEC’s Web site at http://www.sec.gov.
QUARTERLY PORTFOLIO DISCLOSURE
The fund will file a complete schedule of portfolio holdings with the Securities and Exchange Commission (the Commission) for the first and third quarters of each fiscal year on Form N-Q. A shareholder can obtain the quarterly portfolio holdings report at mfs.com. The fund’s Form N-Q is also available on the EDGAR database on the Commission’s Internet Web site at http://www.sec.gov, and may be reviewed and copied at the:
Public Reference Room
Securities and Exchange Commission
100 F Street, NE, Room 1580
Washington, D.C. 20549
Information on the operation of the Public Reference Room may be obtained by calling the Commission at 1-800-SEC-0330. Copies of the fund’s Form N-Q also may be obtained, upon payment of a duplicating fee, by electronic request at the following e-mail address: publicinfo@sec.gov or by writing the Public Reference Section at the above address.
From time to time, MFS may post important information about the fund or the MFS funds on the MFS web site (mfs.com). This information is available by visiting the “News & Commentary” section of mfs.com or by clicking on the fund’s name under “Mutual Funds” in the “Products and Performance” section of mfs.com.
FEDERAL TAX INFORMATION (unaudited)
Each fund will notify shareholders of amounts for use in preparing 2012 income tax forms in January 2013.
39
Table of Contents
rev. 3/11
| FACTS | WHAT DOES MFS DO WITH YOUR PERSONAL INFORMATION? |  | ||
| Why? | Financial companies choose how they share your personal information. Federal law gives consumers the right to limit some but not all sharing. Federal law also requires us to tell you how we collect, share, and protect your personal information. Please read this notice carefully to understand what we do. |
| What? | The types of personal information we collect and share depend on the product or service you have with us. This information can include:
•Social Security number and account balances •Account transactions and transaction history •Checking account information and wire transfer instructions
When you are no longer our customer, we continue to share your information as described in this notice. |
| How? | All financial companies need to share customers’ personal information to run their everyday business. In the section below, we list the reasons financial companies can share their customers’ personal information; the reasons MFS chooses to share; and whether you can limit this sharing. |
| Reasons we can share your personal information | Does MFS share? | Can you limit this sharing? | ||
For our everyday business purposes – such as to process your transactions, maintain your account(s), respond to court orders and legal investigations, or report to credit bureaus | Yes | No | ||
For our marketing purposes – to offer our products and services to you | No | We don’t share | ||
| For joint marketing with other financial companies | No | We don’t share | ||
For our affiliates’ everyday business purposes – information about your transactions and experiences | No | We don’t share | ||
For our affiliates’ everyday business purposes – information about your creditworthiness | No | We don’t share | ||
| For nonaffiliates to market to you | No | We don’t share |
| Questions? | Call 800-225-2606 or go to mfs.com. |
40
Table of Contents
| Page 2 |
| Who we are | ||
| Who is providing this notice? | MFS Funds, MFS Investment Management, MFS Institutional Advisors, Inc., MFS Fund Distributors, Inc., MFS Heritage Trust Company, and MFS Service Center, Inc. | |
| What we do | ||
| How does MFS protect my personal information? | To protect your personal information from unauthorized access and use, we use security measures that comply with federal law. These measures include procedural, electronic, and physical safeguards for the protection of the personal information we collect about you. | |
| How does MFS collect my personal information? | We collect your personal information, for example, when you
•open an account or provide account information •direct us to buy securities or direct us to sell your securities •make a wire transfer
We also collect your personal information from others, such as credit bureaus, affiliates and other companies. | |
| Why can’t I limit all sharing? | Federal law gives you the right to limit only
•sharing for affiliates’ everyday business purposes – information about your creditworthiness •affiliates from using your information to market to you •sharing for nonaffiliates to market to you
State laws and individual companies may give you additional rights to limit sharing. | |
| Definitions | ||
| Affiliates | Companies related by common ownership or control. They can be financial and nonfinancial companies.
•MFS does not share personal information with affiliates, except for everyday business purposes as described on page one of this notice. | |
| Nonaffiliates | Companies not related by common ownership or control. They can be financial and nonfinancial companies.
•MFS does not share with nonaffiliates so they can market to you. | |
| Joint Marketing | A formal agreement between nonaffiliated financial companies that together market financial products or services to you.
•MFS doesn’t jointly market. | |
| Other important information | ||
| If you own an MFS product or receive an MFS service in the name of a third party such as a bank or broker-dealer, their privacy policy may apply to you instead of ours. | ||
41
Table of Contents
Save paper with eDelivery.
| MFS® will send you prospectuses, |

reports, and proxies directly via e-mail so you will get information faster with less mailbox clutter.
To sign up:
1. Go to mfs.com.
2. Log in via MFS® Access.
3. Select eDelivery.
If you own your MFS fund shares through a financial institution or a retirement plan, MFS® TALK, MFS® Access, or eDelivery may not be available to you.
WEB SITE
mfs.com
MFS TALK
1-800-637-8255
24 hours a day
ACCOUNT SERVICE AND LITERATURE
Shareholders
1-800-225-2606
Financial advisors
1-800-343-2829
Retirement plan services
1-800-637-1255
MAILING ADDRESS
MFS Service Center, Inc.
P.O. Box 55824
Boston, MA 02205-5824
OVERNIGHT MAIL
MFS Service Center, Inc.
c/o Boston Financial Data Services
30 Dan Road
Canton, MA 02021-2809
Table of Contents
ANNUAL REPORT
August 31, 2012

MFS® GLOBAL NEW DISCOVERY FUND

GND-ANN
Table of Contents
MFS® GLOBAL NEW DISCOVERY FUND
The report is prepared for the general information of shareholders.
It is authorized for distribution to prospective investors only when preceded or accompanied by a current prospectus.
NOT FDIC INSURED Ÿ MAY LOSE VALUE Ÿ NO BANK GUARANTEE
Table of Contents

LETTER FROM THE CHAIRMAN AND CEO
Dear Shareholders:
World financial markets continue to face a number of major economic and political challenges. While the European debt crisis has deepened and spread, there appears to be scope for improvement given the European Central Bank’s willingness to backstop troubled sovereigns. Economic activity in China, until recently the world’s growth engine, appears to be bottoming. Even the relatively strong and stable US
economy has been affected by uncertainty over the presidential election and the threat of a “fiscal cliff” at year- end. At the same time, global consumer and producer confidence has fallen sharply. And a search for safe havens by nervous investors has driven down yields on highly rated government bonds, including those issued by Germany and the United States, to multi-decade lows.
But there is also good news: Global economic data have modestly improved, performing slightly better than expected. However, the improvement is too short-lived to be called a trend. Equity markets have been largely range bound since the
Fed extended its quantitative easing program, leaving little expectation that the bank will add further money to the system. It is hard to know how much of the recent gain in financial markets has been the result of actual economic improvements versus expectations that renewed central bank action will soon lead to an economic rebound.
Through all this uncertainty, managing risk remains a top priority for investors and their advisors. At MFS®, our emphasis on global research is designed to keep our investment process functioning smoothly at all times. Close collaboration among colleagues around the world is vital in periods of uncertainty and heightened volatility. We share ideas and evaluate opportunities across continents and across all investment disciplines and types of investments. We employ this uniquely collaborative approach to build better insights — and better results — for our clients.
Like our investors, we are mindful of the many economic challenges we face at the local, national and international levels. In times like these, it is more important than ever to maintain a long-term view, adhere to time-tested investing principles such as asset allocation and diversification and work closely with investment advisors to research and identify the most suitable opportunities.
Respectfully,

Robert J. Manning
Chairman and Chief Executive Officer
MFS Investment Management®
October 17, 2012
The opinions expressed in this letter are subject to change, may not be relied upon for investment advice and no forecasts can be guaranteed.
1
Table of Contents
Portfolio structure

| Top ten holdings | ||||
| Amadeus IT Holding S.A. | 1.4% | |||
| Cabot Oil & Gas Corp. | 1.3% | |||
| Croda International PLC | 1.3% | |||
| Bunzl PLC | 1.3% | |||
| OBIC Co. Ltd. | 1.3% | |||
| Dignity PLC | 1.1% | |||
| HomeAway, Inc. | 1.0% | |||
| Joy Global, Inc. | 1.0% | |||
| Polypore International, Inc. | 1.0% | |||
| Swift Transportation Co. | 1.0% | |||
| Equity sectors | ||||
| Health Care | 14.5% | |||
| Technology | 11.9% | |||
| Retailing | 11.2% | |||
| Industrial Goods & Services | 11.0% | |||
| Special Products & Services | 10.5% | |||
| Basic Materials | 7.0% | |||
| Financial Services | 7.0% | |||
| Energy | 6.5% | |||
| Consumer Staples | 4.8% | |||
| Autos & Housing | 4.7% | |||
| Transportation | 4.3% | |||
| Leisure | 4.0% | |||
| Utilities & Communications | 1.4% | |||
| Issuer country weightings (x) | ||||
| United States | 54.4% | |||
| United Kingdom | 13.6% | |||
| Japan | 6.2% | |||
| Brazil | 3.6% | |||
| Germany | 3.3% | |||
| Spain | 1.9% | |||
| France | 1.8% | |||
| Hong Kong | 1.6% | |||
| Indonesia | 1.4% | |||
| Other Countries | 12.2% | |||
| Currency exposure weightings (y) | ||||
| United States Dollar | 59.2% | |||
| British Pound Sterling | 13.6% | |||
| Euro | 7.9% | |||
| Japanese Yen | 6.2% | |||
| Brazilian Real | 3.6% | |||
| Hong Kong Dollar | 2.4% | |||
| Indonesian Rupiah | 1.4% | |||
| South African Rand | 1.3% | |||
| Canadian Dollar | 1.1% | |||
| Other Currencies | 3.3% | |||
2
Table of Contents
Portfolio Composition – continued
| (x) | Represents the portfolio’s exposure to issuer countries as a percentage of a portfolio’s net assets. |
| (y) | Represents the portfolio’s exposure to a particular currency as a percentage of a portfolio’s net assets. |
Percentages are based on net assets as of 8/31/12.
The portfolio is actively managed and current holdings may be different.
3
Table of Contents
Summary of Results
For the period December 16, 2011 (the commencement date) to August 31, 2012, Class A shares of the MFS Global New Discovery Fund (the “fund”) provided a total return of 20.10%, at net asset value. This compares with a return of 13.51% for the fund’s benchmark, the MSCI All Country World Small Mid Cap Index.
Market Environment
At the beginning of the reporting period, additional liquidity from the U.S. Federal Reserve (in the form of “Operation Twist”) and the European Central Bank (in the form of 3-year, Long Term Refinancing Operations, or LTROs), coupled with healthier global macroeconomic conditions, led by moderate but sustained U.S. growth, ushered in improved market dynamics.
Towards the end of the period, though, market trends were more mixed. Worsening conditions were driven by broadly weaker global macroeconomic indicators, as well as renewed concerns over the eurozone’s capacity and determination to address its ongoing crisis. However, broad market sentiment remained relatively resilient, as equity markets generally maintained gains and credit spreads did not indicate deterioration.
Contributors to Performance
Stock selection in the retailing sector was a primary contributor to performance relative to the MSCI All Country World Small Mid Cap Index. Within this sector, holdings of industrial parts supplier MonotaRO Co Ltd. (Japan), which was not a benchmark constituent for the entire reporting period, aided relative returns. Holdings of specialty retailer Francesca’s Holdings, drugstore operator Cosmos Pharmaceutical (Japan), and home products store operator Mr. Price Group (South Africa) also benefited relative performance as all three stocks outperformed the broad market. Shares of Mr. Price Group appreciated over the period as the company displayed strong earnings momentum from a combination of continued refinement of its supply chain, strong cost containment, and operating margin expansion in both their Apparel and Home market segments.
Security selection in the basic materials sector was another significant contributor to relative performance. Here, holdings of specialty chemical products maker Croda International (United Kingdom) and chemical manufacturer Elementis (United Kingdom) aided relative results.
Stock selection in the special products & services and autos & housing sectors also aided relative returns. Within these sectors, overweight positions in travel technology solution provider Amadeus IT Holding (Spain) and construction material supplier Eagle Materials contributed to relative performance. Shares of Amadeus IT Holding traded higher as the company announced it had signed a multi-year content and technology agreement for North America which would provide Expedia with Amadeus’ search fare technologies.
Elsewhere, holdings of IT software provider SolarWinds and fiber laser and amplifier manufacturer IPG Photonics contributed to relative returns.
4
Table of Contents
Management Review – continued
Detractors from Performance
The combination of an underweight position and stock selection in the financial services sector detracted from relative performance. Within this sector, holdings of aircraft leasing company Air Lease weakened relative results as the stock underperformed the broad market.
Stocks in other sectors that detracted from relative results included South American McDonald’s franchisee Arcos Dorados Holdings (b) (Brazil), mining equipment manufacturer Joy Global, health information service provider WebMD Health Corp. (h), restaurant chain operator Ajisen China Holdings Ltd. (Hong Kong), mining company Iluka Resources (Australia), medical device company NxStage Medical, oilfield and power transmission product supplier Lufkin Industries (h), oil company Midstates Petroleum (b), and Israeli-headquartered security software provider Check Point Software Technologies Ltd (b). Iluka Resources’ stock price fell after the company reported lower sales of one of its main commodities, Zircon, due to a slowdown in demand for this product.
During the reporting period, the fund’s relative currency exposure, resulting primarily from differences between the portfolio’s and the benchmark’s exposures to holdings of securities denominated in foreign currencies, was another detractor from relative performance. All of MFS’ investment decisions are driven by the fundamentals of each individual opportunity and as such, it is common for our portfolios to have different currency exposure than the benchmark.
Respectfully,
| Peter Fruzzetti | Thomas Wetherald | |
| Portfolio Manager | Portfolio Manager |
| (b) | Security is not a benchmark constituent. |
| (h) | Security was not held in the portfolio at period end. |
The views expressed in this report are those of the portfolio managers only through the end of the period of the report as stated on the cover and do not necessarily reflect the views of MFS or any other person in the MFS organization. These views are subject to change at any time based on market or other conditions, and MFS disclaims any responsibility to update such views. These views may not be relied upon as investment advice or an indication of trading intent on behalf of any MFS portfolio. References to specific securities are not recommendations of such securities, and may not be representative of any MFS portfolio’s current or future investments.
5
Table of Contents
PERFORMANCE SUMMARY THROUGH 8/31/12
The following chart illustrates a representative class of the fund’s historical performance in comparison to its benchmark(s). Performance results include the deduction of the maximum applicable sales charge and reflect the percentage change in net asset value, including reinvestment of dividends and capital gains distributions. The performance of other share classes will be greater than or less than that of the class depicted below. Benchmarks are unmanaged and may not be invested in directly. Benchmark returns do not reflect sales charges, commissions or expenses. (See Notes to Performance Summary.)
Performance data shown represents past performance and is no guarantee of future results. Investment return and principal value fluctuate so your shares, when sold, may be worth more or less than the original cost; current performance may be lower or higher than quoted. The performance shown does not reflect the deduction of taxes, if any, that a shareholder would pay on fund distributions or the redemption of fund shares.
Growth of a Hypothetical $10,000 Investment (t)
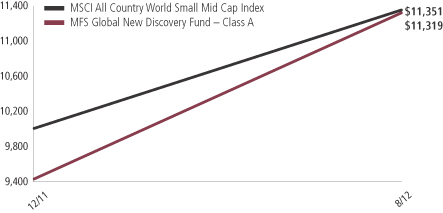
6
Table of Contents
Performance Summary – continued
Total Returns through 8/31/12
Average annual without sales charge
| Share Class | Class inception date | Life (t) | ||||||
| A | 12/16/11 | 20.10% | ||||||
| B | 12/16/11 | 19.50% | ||||||
| C | 12/16/11 | 19.50% | ||||||
| I | 12/16/11 | 20.40% | ||||||
| R1 | 12/16/11 | 19.50% | ||||||
| R2 | 12/16/11 | 19.90% | ||||||
| R3 | 12/16/11 | 20.20% | ||||||
| R4 | 12/16/11 | 20.40% | ||||||
| Comparative benchmark | ||||||||
| MSCI All Country World Small Mid Cap Index (f) | 13.51% | |||||||
| Average annual with sales charge | ||||||||
| A With Initial Sales Charge (5.75%) | 13.19% | |||||||
| B With CDSC (Declining over six years | 15.50% | |||||||
| C With CDSC (1% for 12 months) (x) | 18.50% | |||||||
Class I, R1, R2, R3, and R4 shares do not have a sales charge.
CDSC – Contingent Deferred Sales Charge.
| (f) | Source: FactSet Research Systems Inc. |
| (t) | For the period from the class inception date through the stated period end. (See Notes to Performance Summary.) |
| (x) | Assuming redemption at the end of the applicable period. |
Benchmark Definition
MSCI All Country World Small Mid Cap Index – a free float weighted index that is designed to measure equity market performance of small and mid cap companies across global developed and emerging market countries.
It is not possible to invest directly in an index.
Notes to Performance Summary
Average annual total return represents the average annual change in value for each share class for the periods presented. Life returns are presented where the share class has less than 10 years of performance history and represent the average annual total return from the class inception date to the stated period end date.
7
Table of Contents
Performance Summary – continued
Performance results reflect any applicable expense subsidies and waivers in effect during the periods shown. Without such subsidies and waivers the fund’s performance results would be less favorable. Please see the prospectus and financial statements for complete details.
Performance results do not include adjustments made for financial reporting purposes in accordance with U.S. generally accepted accounting principles and may differ from amounts reported in the financial highlights.
From time to time the fund may receive proceeds from litigation settlements, without which performance would be lower.
8
Table of Contents
Fund expenses borne by the shareholders during the period, March 1, 2012 through August 31, 2012
As a shareholder of the fund, you incur two types of costs: (1) transaction costs, including sales charges (loads) on certain purchase or redemption payments, and (2) ongoing costs, including management fees; distribution and service (12b-1) fees; and other fund expenses. This example is intended to help you understand your ongoing costs (in dollars) of investing in the fund and to compare these costs with the ongoing costs of investing in other mutual funds.
The example is based on an investment of $1,000 invested at the beginning of the period and held for the entire period March 1, 2012 through August 31, 2012.
Actual Expenses
The first line for each share class in the following table provides information about actual account values and actual expenses. You may use the information in this line, together with the amount you invested, to estimate the expenses that you paid over the period. Simply divide your account value by $1,000 (for example, an $8,600 account value divided by $1,000 = 8.6), then multiply the result by the number in the first line under the heading entitled “Expenses Paid During Period” to estimate the expenses you paid on your account during this period.
Hypothetical Example for Comparison Purposes
The second line for each share class in the following table provides information about hypothetical account values and hypothetical expenses based on the fund’s actual expense ratio and an assumed rate of return of 5% per year before expenses, which is not the fund’s actual return. The hypothetical account values and expenses may not be used to estimate the actual ending account balance or expenses you paid for the period. You may use this information to compare the ongoing costs of investing in the fund and other funds. To do so, compare this 5% hypothetical example with the 5% hypothetical examples that appear in the shareholder reports of the other funds.
Please note that the expenses shown in the table are meant to highlight your ongoing costs only and do not reflect any transactional costs, such as sales charges (loads). Therefore, the second line for each share class in the table is useful in comparing ongoing costs only, and will not help you determine the relative total costs of owning different funds. In addition, if these transactional costs were included, your costs would have been higher.
9
Table of Contents
Expense Table – continued
| Share Class | Annualized Expense Ratio | Beginning Account Value 3/01/12 | Ending Account Value 8/31/12 | Expenses Paid During Period (p) 3/01/12-8/31/12 | ||||||||||||||
| A | Actual | 1.50% | $1,000.00 | $1,024.74 | $7.63 | |||||||||||||
| Hypothetical (h) | 1.50% | $1,000.00 | $1,017.60 | $7.61 | ||||||||||||||
| B | Actual | 2.25% | $1,000.00 | $1,020.50 | $11.43 | |||||||||||||
| Hypothetical (h) | 2.25% | $1,000.00 | $1,013.83 | $11.39 | ||||||||||||||
| C | Actual | 2.25% | $1,000.00 | $1,020.50 | $11.43 | |||||||||||||
| Hypothetical (h) | 2.25% | $1,000.00 | $1,013.83 | $11.39 | ||||||||||||||
| I | Actual | 1.25% | $1,000.00 | $1,026.43 | $6.37 | |||||||||||||
| Hypothetical (h) | 1.25% | $1,000.00 | $1,018.85 | $6.34 | ||||||||||||||
| R1 | Actual | 2.25% | $1,000.00 | $1,020.50 | $11.43 | |||||||||||||
| Hypothetical (h) | 2.25% | $1,000.00 | $1,013.83 | $11.39 | ||||||||||||||
| R2 | Actual | 1.75% | $1,000.00 | $1,023.04 | $8.90 | |||||||||||||
| Hypothetical (h) | 1.75% | $1,000.00 | $1,016.34 | $8.87 | ||||||||||||||
| R3 | Actual | 1.50% | $1,000.00 | $1,024.72 | $7.63 | |||||||||||||
| Hypothetical (h) | 1.50% | $1,000.00 | $1,017.60 | $7.61 | ||||||||||||||
| R4 | Actual | 1.25% | $1,000.00 | $1,026.43 | $6.37 | |||||||||||||
| Hypothetical (h) | 1.25% | $1,000.00 | $1,018.85 | $6.34 | ||||||||||||||
| (h) | 5% class return per year before expenses. |
| (p) | Expenses paid are equal to each class’ annualized expense ratio, as shown above, multiplied by the average account value over the period, multiplied by the number of days in the period, divided by the number of days in the year. Expenses paid do not include any applicable sales charges (loads). If these transaction costs had been included, your costs would have been higher. |
10
Table of Contents
8/31/12
The Portfolio of Investments is a complete list of all securities owned by your fund. It is categorized by broad-based asset classes.
| Common Stocks - 98.0% | ||||||||
| Issuer | Shares/Par | Value ($) | ||||||
| Aerospace - 0.4% | ||||||||
| Kaman Corp. | 660 | $ | 21,640 | |||||
| Airlines - 1.6% | ||||||||
| Allegiant Travel Co. (a) | 197 | $ | 13,049 | |||||
| Spirit Airlines, Inc. (a) | 2,071 | 40,488 | ||||||
| Stagecoach Group PLC | 9,313 | 42,381 | ||||||
|
| |||||||
| $ | 95,918 | |||||||
| Apparel Manufacturers - 2.3% | ||||||||
| Arezzo Industria e Comercio S.A. | 1,600 | $ | 26,776 | |||||
| Cia.Hering S.A. | 500 | 10,924 | ||||||
| Gerry Weber International AG | 952 | 38,473 | ||||||
| Guess?, Inc. | 910 | 23,715 | ||||||
| Stella International Holdings | 14,000 | 33,419 | ||||||
|
| |||||||
| $ | 133,307 | |||||||
| Automotive - 1.0% | ||||||||
| Guangzhou Automobile Group Co. Ltd., “H” | 24,000 | $ | 16,799 | |||||
| USS Co. Ltd. | 370 | 39,795 | ||||||
|
| |||||||
| $ | 56,594 | |||||||
| Biotechnology - 0.4% | ||||||||
| Anacor Pharmaceuticals, Inc. (a) | 734 | $ | 4,514 | |||||
| ViroPharma, Inc. (a) | 610 | 16,226 | ||||||
|
| |||||||
| $ | 20,740 | |||||||
| Broadcasting - 0.7% | ||||||||
| Havas S.A. | 3,036 | $ | 15,408 | |||||
| Proto Corp. | 800 | 24,318 | ||||||
|
| |||||||
| $ | 39,726 | |||||||
| Brokerage & Asset Managers - 1.1% | ||||||||
| Aberdeen Asset Management PLC | 4,135 | $ | 18,299 | |||||
| Computershare Ltd. | 3,024 | 26,324 | ||||||
| IG Group Holdings PLC | 3,184 | 21,765 | ||||||
|
| |||||||
| $ | 66,388 | |||||||
| Business Services - 6.9% | ||||||||
| Amadeus IT Holding S.A. | 3,579 | $ | 79,950 | |||||
| Brenntag AG | 240 | 28,602 | ||||||
11
Table of Contents
Portfolio of Investments – continued
| Issuer | Shares/Par | Value ($) | ||||||
| Common Stocks - continued | ||||||||
| Business Services - continued | ||||||||
| Bunzl PLC | 4,198 | $ | 74,924 | |||||
| Constant Contact, Inc. (a) | 2,070 | 40,469 | ||||||
| FleetCor Technologies, Inc. (a) | 1,119 | 48,318 | ||||||
| Intertek Group PLC | 616 | 27,534 | ||||||
| Jones Lang LaSalle, Inc. | 422 | 30,439 | ||||||
| Multiplus S.A. | 747 | 15,898 | ||||||
| Performant Financial Corp. (a) | 2,660 | 28,861 | ||||||
| Sodexo | 435 | 34,399 | ||||||
|
| |||||||
| $ | 409,394 | |||||||
| Chemicals - 0.3% | ||||||||
| Victrex PLC | 778 | $ | 16,578 | |||||
| Computer Software - 4.0% | ||||||||
| Check Point Software Technologies Ltd. (a) | 1,092 | $ | 50,330 | |||||
| CommVault Systems, Inc. (a) | 580 | 29,244 | ||||||
| Nuance Communications, Inc. (a) | 1,610 | 38,399 | ||||||
| OBIC Co. Ltd. | 350 | 73,799 | ||||||
| SolarWinds, Inc. (a) | 770 | 42,258 | ||||||
|
| |||||||
| $ | 234,030 | |||||||
| Computer Software - Systems - 3.1% | ||||||||
| Exa Corp. (a) | 1,260 | $ | 13,154 | |||||
| ExactTarget, Inc. (a) | 420 | 8,891 | ||||||
| Guidewire Software, Inc. (a) | 490 | 13,990 | ||||||
| National Instruments Corp. | 1,230 | 31,685 | ||||||
| NICE Systems Ltd. (a) | 660 | 20,637 | ||||||
| Qlik Technologies, Inc. (a) | 870 | 18,401 | ||||||
| SciQuest, Inc. (a) | 3,164 | 53,313 | ||||||
| Vantiv, Inc. (a) | 1,140 | 25,718 | ||||||
|
| |||||||
| $ | 185,789 | |||||||
| Construction - 3.7% | ||||||||
| Beacon Roofing Supply, Inc. (a) | 1,685 | $ | 47,416 | |||||
| Bellway PLC | 1,679 | 23,168 | ||||||
| Eagle Materials, Inc. | 1,365 | 58,217 | ||||||
| NVR, Inc. (a) | 65 | 53,832 | ||||||
| PT Semen Gresik Tbk. | 27,500 | 35,763 | ||||||
|
| |||||||
| $ | 218,396 | |||||||
| Consumer Products - 1.1% | ||||||||
| Dr. Ci Labo Co. Ltd. | 3 | $ | 11,756 | |||||
| L’Occitane International S.A. | 9,500 | 24,252 | ||||||
12
Table of Contents
Portfolio of Investments – continued
| Issuer | Shares/Par | Value ($) | ||||||
| Common Stocks - continued | ||||||||
| Consumer Products - continued | ||||||||
| Uni-Charm Corp. | 500 | $ | 29,089 | |||||
|
| |||||||
| $ | 65,097 | |||||||
| Consumer Services - 3.6% | ||||||||
| Anhanguera Educacional Participacoes S.A. | 2,800 | $ | 41,671 | |||||
| Dignity PLC | 4,619 | 66,375 | ||||||
| HomeAway, Inc. (a) | 2,600 | 61,516 | ||||||
| Kroton Educacional S.A. (a) | 6 | 7 | ||||||
| Kroton Educacional S.A., IEU (a) | 1,962 | 32,089 | ||||||
| MakeMyTrip Ltd. (a) | 930 | 13,290 | ||||||
|
| |||||||
| $ | 214,948 | |||||||
| Containers - 0.5% | ||||||||
| Viscofan S.A. | 714 | $ | 31,621 | |||||
| Electrical Equipment - 4.2% | ||||||||
| AMETEK, Inc. | 1,285 | $ | 44,088 | |||||
| Domino Printing Sciences PLC | 3,471 | 31,029 | ||||||
| IMI PLC | 3,180 | 43,425 | ||||||
| MSC Industrial Direct Co., Inc., “A” | 723 | 50,104 | ||||||
| Sensata Technologies Holding B.V. (a) | 1,640 | 49,249 | ||||||
| Spectris PLC | 1,198 | 32,890 | ||||||
|
| |||||||
| $ | 250,785 | |||||||
| Electronics - 3.0% | ||||||||
| CEVA, Inc. (a) | 1,420 | $ | 22,890 | |||||
| Entegris, Inc. (a) | 3,152 | 27,706 | ||||||
| Monolithic Power Systems, Inc. (a) | 2,045 | 44,090 | ||||||
| Ultratech, Inc. (a) | 1,170 | 38,587 | ||||||
| Veeco Instruments, Inc. (a) | 1,280 | 43,904 | ||||||
|
| |||||||
| $ | 177,177 | |||||||
| Energy - Independent - 3.6% | ||||||||
| Approach Resources, Inc. (a) | 1,150 | $ | 33,051 | |||||
| Cabot Oil & Gas Corp. | 1,860 | 77,023 | ||||||
| Celtic Exploration Ltd. (a) | 1,100 | 18,457 | ||||||
| Midstates Petroleum Co., Inc. (a) | 2,160 | 17,604 | ||||||
| Pinecrest Energy, Inc. (a) | 7,780 | 14,680 | ||||||
| Range Resources Corp. | 780 | 50,848 | ||||||
|
| |||||||
| $ | 211,663 | |||||||
| Entertainment - 0.5% | ||||||||
| Six Flags Entertainment Corp. | 530 | $ | 29,272 | |||||
13
Table of Contents
Portfolio of Investments – continued
| Issuer | Shares/Par | Value ($) | ||||||
| Common Stocks - continued | ||||||||
| Food & Beverages - 2.5% | ||||||||
| Booker Group PLC | 26,810 | $ | 40,271 | |||||
| Britvic PLC | 6,290 | 31,920 | ||||||
| D.E Master Blenders 1753 N.V. (a) | 1,360 | 16,018 | ||||||
| Devro PLC | 8,058 | 40,010 | ||||||
| Green Mountain Coffee Roasters, Inc. (a) | 750 | 18,233 | ||||||
|
| |||||||
| $ | 146,452 | |||||||
| Food & Drug Stores - 2.0% | ||||||||
| Cosmos Pharmaceutical Corp. | 500 | $ | 42,659 | |||||
| CP All PLC | 13,700 | 15,084 | ||||||
| O’Key Group S.A., GDR | 4,524 | 42,526 | ||||||
| Sundrug Co. Ltd. | 500 | 18,181 | ||||||
|
| |||||||
| $ | 118,450 | |||||||
| General Merchandise - 1.9% | ||||||||
| Clicks Group Ltd. | 4,693 | $ | 32,113 | |||||
| Five Below, Inc. (a) | 1,190 | 38,247 | ||||||
| Mr. Price Group Ltd. | 2,676 | 43,342 | ||||||
|
| |||||||
| $ | 113,702 | |||||||
| Insurance - 1.3% | ||||||||
| Brasil Insurance Participacoes e Administracao S.A. | 3,400 | $ | 32,662 | |||||
| Jardine Lloyd Thompson Group PLC | 3,570 | 43,535 | ||||||
|
| |||||||
| $ | 76,197 | |||||||
| Internet - 0.2% | ||||||||
| Millennial Media, Inc. (a) | 1,280 | $ | 14,758 | |||||
| Machinery & Tools - 6.4% | ||||||||
| Allison Transmission Holdings, Inc. | 2,280 | $ | 40,516 | |||||
| Finning International, Inc. | 1,280 | 29,450 | ||||||
| IPG Photonics Corp. (a) | 585 | 35,972 | ||||||
| Joy Global, Inc. | 1,130 | 60,319 | ||||||
| Kennametal, Inc. | 1,220 | 44,945 | ||||||
| Polypore International, Inc. (a) | 1,840 | 59,653 | ||||||
| Spirax-Sarco Engineering PLC | 801 | 25,043 | ||||||
| United Rentals, Inc. (a) | 1,340 | 43,295 | ||||||
| WABCO Holdings, Inc. (a) | 611 | 35,878 | ||||||
|
| |||||||
| $ | 375,071 | |||||||
| Medical & Health Technology & Services - 4.4% | ||||||||
| Advisory Board Co. (a) | 1,008 | $ | 44,685 | |||||
| Air Methods Corp. (a) | 260 | 30,300 | ||||||
14
Table of Contents
Portfolio of Investments – continued
| Issuer | Shares/Par | Value ($) | ||||||
| Common Stocks - continued | ||||||||
| Medical & Health Technology & Services - continued | ||||||||
| Brookdale Senior Living, Inc. (a) | 2,500 | $ | 54,325 | |||||
| Cerner Corp. (a) | 586 | 42,860 | ||||||
| Fleury S.A. | 1,600 | 17,380 | ||||||
| Healthcare Services Group, Inc. | 2,060 | 43,610 | ||||||
| Kobayashi Pharmaceutical Co. Ltd. | 500 | 26,726 | ||||||
|
| |||||||
| $ | 259,886 | |||||||
| Medical Equipment - 7.7% | ||||||||
| Align Technology, Inc. (a) | 974 | $ | 33,067 | |||||
| Cepheid, Inc. (a) | 1,167 | 44,043 | ||||||
| Conceptus, Inc. (a) | 2,850 | 54,179 | ||||||
| DENTSPLY International, Inc. | 710 | 25,752 | ||||||
| Edwards Lifesciences Corp. (a) | 310 | 31,654 | ||||||
| Endologix, Inc. (a) | 2,788 | 33,372 | ||||||
| EnteroMedics, Inc. (a) | 3,240 | 11,923 | ||||||
| Globus Medical, Inc., “A” (a) | 1,870 | 29,770 | ||||||
| Masimo Corp. (a) | 1,161 | 25,635 | ||||||
| NxStage Medical, Inc. (a) | 2,106 | 26,852 | ||||||
| Sonova Holding AG | 388 | 35,967 | ||||||
| Uroplasty, Inc. (a) | 3,867 | 15,391 | ||||||
| Varian Medical Systems, Inc. (a) | 600 | 35,274 | ||||||
| Vocera Communications, Inc. (a) | 690 | 19,430 | ||||||
| Volcano Corp. (a) | 1,150 | 32,522 | ||||||
|
| |||||||
| $ | 454,831 | |||||||
| Metals & Mining - 1.4% | ||||||||
| Globe Specialty Metals, Inc. | 3,224 | $ | 47,038 | |||||
| Iluka Resources Ltd. | 3,670 | 34,883 | ||||||
|
| |||||||
| $ | 81,921 | |||||||
| Network & Telecom - 1.6% | ||||||||
| Calix, Inc. (a) | 3,484 | $ | 18,500 | |||||
| Fortinet, Inc. (a) | 1,730 | 45,862 | ||||||
| VTech Holdings Ltd. | 2,600 | 31,818 | ||||||
|
| |||||||
| $ | 96,180 | |||||||
| Oil Services - 2.9% | ||||||||
| AMEC PLC | 2,000 | $ | 35,219 | |||||
| Atwood Oceanics, Inc. (a) | 1,220 | 56,462 | ||||||
| Dresser-Rand Group, Inc. (a) | 1,080 | 54,670 | ||||||
| Helmerich & Payne, Inc. | 590 | 26,928 | ||||||
|
| |||||||
| $ | 173,279 | |||||||
15
Table of Contents
Portfolio of Investments – continued
| Issuer | Shares/Par | Value ($) | ||||||
| Common Stocks - continued | ||||||||
| Other Banks & Diversified Financials - 2.4% | ||||||||
| Air Lease Corp. (a) | 1,660 | $ | 34,229 | |||||
| Credicorp Ltd. | 242 | 29,168 | ||||||
| First Republic Bank | 1,243 | 40,634 | ||||||
| Western Union Co. | 1,990 | 35,044 | ||||||
|
| |||||||
| $ | 139,075 | |||||||
| Pharmaceuticals - 2.0% | ||||||||
| Perrigo Co. | 183 | $ | 20,125 | |||||
| Santen Pharmaceutical Co. Ltd. | 1,000 | 43,669 | ||||||
| Virbac | 303 | 54,785 | ||||||
|
| |||||||
| $ | 118,579 | |||||||
| Railroad & Shipping - 0.8% | ||||||||
| Diana Shipping, Inc. (a) | 7,270 | $ | 48,055 | |||||
| Real Estate - 1.8% | ||||||||
| Brasil Brokers Participacoes | 10,900 | $ | 35,548 | |||||
| Deutsche Wohnen AG | 2,568 | 43,444 | ||||||
| Midland Holdings Ltd. | 52,000 | 28,609 | ||||||
|
| |||||||
| $ | 107,601 | |||||||
| Restaurants - 2.8% | ||||||||
| Ajisen China Holdings Ltd. | 14,000 | $ | 8,624 | |||||
| Arcos Dorados Holdings, Inc. | 3,870 | 51,123 | ||||||
| Chuy’s Holdings, Inc. (a) | 1,800 | 37,116 | ||||||
| Domino’s Pizza UK & IRL PLC | 4,448 | 37,998 | ||||||
| Dunkin Brands Group, Inc. | 1,098 | 31,985 | ||||||
|
| |||||||
| $ | 166,846 | |||||||
| Specialty Chemicals - 4.8% | ||||||||
| Croda International PLC | 2,036 | $ | 76,166 | |||||
| Elementis PLC | 13,169 | 46,045 | ||||||
| Fuchs Petrolub AG, IPS | 651 | 38,075 | ||||||
| Rockwood Holdings, Inc. | 650 | 30,771 | ||||||
| Symrise AG | 1,436 | 48,614 | ||||||
| W. R. Grace & Co. (a) | 746 | 43,089 | ||||||
|
| |||||||
| $ | 282,760 | |||||||
| Specialty Stores - 5.0% | ||||||||
| Citi Trends, Inc. (a) | 1,102 | $ | 12,800 | |||||
| Ethan Allen Interiors, Inc. | 1,460 | 32,237 | ||||||
| Francesca’s Holdings Corp. (a) | 970 | 34,270 | ||||||
| MonotaRO Co. Ltd. | 2,700 | 58,001 | ||||||
| Monro Muffler Brake, Inc. | 1,202 | 40,688 | ||||||
| NEXT PLC | 492 | 27,929 | ||||||
16
Table of Contents
Portfolio of Investments – continued
| Issuer | Shares/Par | Value ($) | ||||||||||
| Common Stocks - continued | ||||||||||||
| Specialty Stores - continued | ||||||||||||
| Tiffany & Co. | 750 | $ | 46,463 | |||||||||
| Urban Outfitters, Inc. (a) | 1,118 | 41,970 | ||||||||||
|
| |||||||||||
| $ | 294,358 | |||||||||||
| Telephone Services - 1.4% | ||||||||||||
| PT XL Axiata Tbk | 61,000 | $ | 46,062 | |||||||||
| Ziggo N.V. | 1,090 | 34,056 | ||||||||||
|
| |||||||||||
| $ | 80,118 | |||||||||||
| Tobacco - 0.8% | ||||||||||||
| Swedish Match AB | 1,094 | $ | 45,464 | |||||||||
| Trucking - 1.9% | ||||||||||||
| Atlas Air Worldwide Holdings, Inc. (a) | 617 | $ | 31,776 | |||||||||
| DSV A.S. | 998 | 21,715 | ||||||||||
| Swift Transportation Co. (a) | 7,310 | 59,577 | ||||||||||
|
| |||||||||||
| $ | 113,068 | |||||||||||
| Total Common Stocks (Identified Cost, $5,142,249) | $ | 5,785,714 | ||||||||||
| First Exercise | ||||||||||||
| Warrants - 0.8% | ||||||||||||
| Consumer Products - 0.4% | ||||||||||||
| Merrill Lynch International & Co. (Dabur Ltd. - Zero Strike Warrant (1 share for 1 warrant)) (a)(n) | 5/27/11 | 11,910 | $ | 26,287 | ||||||||
| Other Banks & Diversified Financials - 0.4% | ||||||||||||
| Merrill Lynch International & Co. (Federal Bank Ltd. - Zero Strike Warrant (1 share for 1 warrant)) (a)(n) | 8/30/10 | 3,033 | $ | 22,202 | ||||||||
| Total Warrants (Identified Cost, $43,782) | $ | 48,489 | ||||||||||
| Money Market Funds - 3.3% | ||||||||||||
| MFS Institutional Money Market Portfolio, 0.16%, at Cost and Net Asset Value (v) | 193,187 | $ | 193,187 | |||||||||
| Total Investments (Identified Cost, $5,379,218) | $ | 6,027,390 | ||||||||||
| Other Assets, Less Liabilities - (2.1)% | (124,595 | ) | ||||||||||
| Net Assets - 100.0% | $ | 5,902,795 | ||||||||||
17
Table of Contents
Portfolio of Investments – continued
| (a) | Non-income producing security. |
| (n) | Securities exempt from registration under Rule 144A of the Securities Act of 1933. These securities may be sold in the ordinary course of business in transactions exempt from registration, normally to qualified institutional buyers. At period end, the aggregate value of these securities was $48,489, representing 0.82% of net assets. |
| (v) | Underlying affiliated fund that is available only to investment companies managed by MFS. The rate quoted for the MFS Institutional Money Market Portfolio is the annualized seven-day yield of the fund at period end. |
The following abbreviations are used in this report and are defined:
| GDR | Global Depositary Receipt |
| IEU | International Equity Unit |
| IPS | International Preference Stock |
| PLC | Public Limited Company |
See Notes to Financial Statements
18
Table of Contents
Financial Statements
STATEMENT OF ASSETS AND LIABILITIES
At 8/31/12
This statement represents your fund’s balance sheet, which details the assets and liabilities comprising the total value of the fund.
| Assets | ||||
Investments- | ||||
Non-affiliated issuers, at value (identified cost, $5,186,031) | $5,834,203 | |||
Underlying affiliated funds, at cost and value | 193,187 | |||
Total investments, at value (identified cost, $5,379,218) | $6,027,390 | |||
Foreign currency, at value (identified cost, $60) | 61 | |||
Receivables for | ||||
Investments sold | 42,595 | |||
Fund shares sold | 16,819 | |||
Interest and dividends | 4,919 | |||
Receivable from investment adviser | 17,869 | |||
Total assets | $6,109,653 | |||
| Liabilities | ||||
Payables for | ||||
Investments purchased | $169,136 | |||
Fund shares reacquired | 5,865 | |||
Payable to affiliates | ||||
Shareholder servicing costs | 55 | |||
Distribution and service fees | 57 | |||
Payable for independent Trustees’ compensation | 2 | |||
Accrued expenses and other liabilities | 31,743 | |||
Total liabilities | $206,858 | |||
Net assets | $5,902,795 | |||
| Net assets consist of | ||||
Paid-in capital | $5,174,098 | |||
Unrealized appreciation (depreciation) on investments and translation of assets and liabilities in foreign currencies (net of $423 deferred country tax) | 647,762 | |||
Accumulated net realized gain (loss) on investments and foreign currency | 80,935 | |||
Net assets | $5,902,795 | |||
Shares of beneficial interest outstanding | 491,091 |
| Net assets | Shares outstanding | Net asset value per share (a) | ||||||||||||
Class A | $1,274,397 | 106,094 | $12.01 | |||||||||||
Class B | 203,484 | 17,027 | 11.95 | |||||||||||
Class C | 295,985 | 24,769 | 11.95 | |||||||||||
Class I | 3,649,015 | 303,201 | 12.03 | |||||||||||
Class R1 | 119,500 | 10,000 | 11.95 | |||||||||||
Class R2 | 119,925 | 10,000 | 11.99 | |||||||||||
Class R3 | 120,138 | 10,000 | 12.01 | |||||||||||
Class R4 | 120,351 | 10,000 | 12.04 | |||||||||||
| (a) | Maximum offering price per share was equal to the net asset value per share for all share classes, except for Class A, for which the maximum offering price per share was $12.74 [100/94.25 * $12.01]. On sales of $50,000 or more, the maximum offering price of Class A shares is reduced. A contingent deferred sales charge may be imposed on redemptions of Class A, Class B, and Class C shares. Redemption price per share was equal to the net asset value per share for Classes I, RI, R2, R3, and R4. |
See Notes to Financial Statements
19
Table of Contents
Financial Statements
Period ended 8/31/12 (c)
This statement describes how much your fund earned in investment income and accrued in expenses. It also describes any gains and/or losses generated by fund operations.
| Net investment income | ||||
Income | ||||
Dividends | $45,117 | |||
Dividends from underlying affiliated funds | 103 | |||
Foreign taxes withheld | (2,076 | ) | ||
Total investment income | $43,144 | |||
Expenses | ||||
Management fee | $29,128 | |||
Distribution and service fees | 4,645 | |||
Shareholder servicing costs | 770 | |||
Administrative services fee | 12,431 | |||
Independent Trustees’ compensation | 799 | |||
Custodian fee | 30,308 | |||
Shareholder communications | 5,320 | |||
Audit and tax fees | 29,821 | |||
Legal fees | 93 | |||
Registration fees | 12,836 | |||
Miscellaneous | 9,134 | |||
Total expenses | $135,285 | |||
Fees paid indirectly | (1 | ) | ||
Reduction of expenses by investment adviser | (93,268 | ) | ||
Net expenses | $42,016 | |||
Net investment income | $1,128 | |||
| Realized and unrealized gain (loss) on investments and foreign currency | ||||
Realized gain (loss) (identified cost basis) | ||||
Investments (net of $568 country tax) | $82,418 | |||
Foreign currency | (2,611 | ) | ||
Net realized gain (loss) on investments and foreign currency | $79,807 | |||
Change in unrealized appreciation (depreciation) | ||||
Investments (net of $423 increase in deferred country tax) | $647,749 | |||
Translation of assets and liabilities in foreign currencies | 13 | |||
Net unrealized gain (loss) on investments and foreign currency translation | $647,762 | |||
Net realized and unrealized gain (loss) on investments and foreign currency | $727,569 | |||
Change in net assets from operations | $728,697 |
| (c) | For the period from the commencement of the fund’s investment operations, December 16, 2011, through the stated period end. |
See Notes to Financial Statements
20
Table of Contents
Financial Statements
STATEMENT OF CHANGES IN NET ASSETS
This statement describes the increases and/or decreases in net assets resulting from operations, any distributions, and any shareholder transactions.
| Change in net assets | Period ended 8/31/12 (c) | |||
| From operations | ||||
Net investment income | $1,128 | |||
Net realized gain (loss) on investments and foreign currency | 79,807 | |||
Net unrealized gain (loss) on investments and foreign currency translation | 647,762 | |||
Change in net assets from operations | $728,697 | |||
Change in net assets from fund share transactions | $5,174,098 | |||
Total change in net assets | $5,902,795 | |||
| Net assets | ||||
At beginning of period | $— | |||
At end of period | $5,902,795 | |||
| (c) | For the period from the commencement of the fund’s investment operations, December 16, 2011, through the stated period end. |
See Notes to Financial Statements
21
Table of Contents
Financial Statements
The financial highlights table is intended to help you understand the fund’s financial performance for the past 5 years (or life of a particular share class, if shorter). Certain information reflects financial results for a single fund share. The total returns in the table represent the rate by which an investor would have earned (or lost) on an investment in the fund share class (assuming reinvestment of all distributions) held for the entire period.
| Class A | Period ended 8/31/12 (c) | |||
Net asset value, beginning of period | $10.00 | |||
| Income (loss) from investment operations | ||||
Net investment income (d) | $0.00 | (w) | ||
Net realized and unrealized gain (loss) on investments and foreign currency | 2.01 | |||
Total from investment operations | $2.01 | |||
Net asset value, end of period (x) | $12.01 | |||
Total return (%) (r)(s)(t)(x) | 20.10 | (n) | ||
| Ratios (%) (to average net assets) and Supplemental data: | ||||
Expenses before expense reductions (f) | 4.66 | (a) | ||
Expenses after expense reductions (f) | 1.50 | (a) | ||
Net investment income | 0.03 | (a) | ||
Portfolio turnover | 40 | (n) | ||
Net assets at end of period (000 omitted) | $1,274 | |||
| Class B | Period ended 8/31/12 (c) | |||
Net asset value, beginning of period | $10.00 | |||
| Income (loss) from investment operations | ||||
Net investment loss (d) | $(0.06 | ) | ||
Net realized and unrealized gain (loss) on investments and foreign currency | 2.01 | |||
Total from investment operations | $1.95 | |||
Net asset value, end of period (x) | $11.95 | |||
Total return (%) (r)(s)(t)(x) | 19.50 | (n) | ||
| Ratios (%) (to average net assets) and Supplemental data: | ||||
Expenses before expense reductions (f) | 5.34 | (a) | ||
Expenses after expense reductions (f) | 2.25 | (a) | ||
Net investment loss | (0.78 | )(a) | ||
Portfolio turnover | 40 | (n) | ||
Net assets at end of period (000 omitted) | $203 | |||
See Notes to Financial Statements
22
Table of Contents
Financial Highlights – continued
| Class C | Period ended 8/31/12 (c) | |||
Net asset value, beginning of period | $10.00 | |||
| Income (loss) from investment operations | ||||
Net investment loss (d) | $(0.06 | ) | ||
Net realized and unrealized gain (loss) on investments and foreign currency | 2.01 | |||
Total from investment operations | $1.95 | |||
Net asset value, end of period (x) | $11.95 | |||
Total return (%) (r)(s)(t)(x) | 19.50 | (n) | ||
| Ratios (%) (to average net assets) and Supplemental data: | ||||
Expenses before expense reductions (f) | 5.43 | (a) | ||
Expenses after expense reductions (f) | 2.25 | (a) | ||
Net investment loss | (0.80 | )(a) | ||
Portfolio turnover | 40 | (n) | ||
Net assets at end of period (000 omitted) | $296 | |||
| Class I | Period ended 8/31/12 (c) | |||
Net asset value, beginning of period | $10.00 | |||
| Income (loss) from investment operations | ||||
Net investment income (d) | $0.01 | |||
Net realized and unrealized gain (loss) on investments and foreign currency | 2.02 | |||
Total from investment operations | $2.03 | |||
Net asset value, end of period (x) | $12.03 | |||
Total return (%) (r)(s)(x) | 20.30 | (n) | ||
| Ratios (%) (to average net assets) and Supplemental data: | ||||
Expenses before expense reductions (f) | 4.37 | (a) | ||
Expenses after expense reductions (f) | 1.25 | (a) | ||
Net investment income | 0.17 | (a) | ||
Portfolio turnover | 40 | (n) | ||
Net assets at end of period (000 omitted) | $3,649 | |||
See Notes to Financial Statements
23
Table of Contents
Financial Highlights – continued
| Class R1 | Period ended 8/31/12 (c) | |||
Net asset value, beginning of period | $10.00 | |||
| Income (loss) from investment operations | ||||
Net investment loss (d) | $(0.07 | ) | ||
Net realized and unrealized gain (loss) on investments and foreign currency | 2.02 | |||
Total from investment operations | $1.95 | |||
Net asset value, end of period (x) | $11.95 | |||
Total return (%) (r)(s)(x) | 19.50 | (n) | ||
| Ratios (%) (to average net assets) and Supplemental data: | ||||
Expenses before expense reductions (f) | 5.34 | (a) | ||
Expenses after expense reductions (f) | 2.25 | (a) | ||
Net investment loss | (0.81 | )(a) | ||
Portfolio turnover | 40 | (n) | ||
Net assets at end of period (000 omitted) | $120 | |||
| Class R2 | Period ended 8/31/12 (c) | |||
Net asset value, beginning of period | $10.00 | |||
| Income (loss) from investment operations | ||||
Net investment loss (d) | $(0.03 | ) | ||
Net realized and unrealized gain (loss) on investments and foreign currency | 2.02 | |||
Total from investment operations | $1.99 | |||
Net asset value, end of period (x) | $11.99 | |||
Total return (%) (r)(s)(x) | 19.90 | (n) | ||
| Ratios (%) (to average net assets) and Supplemental data: | ||||
Expenses before expense reductions (f) | 4.84 | (a) | ||
Expenses after expense reductions (f) | 1.75 | (a) | ||
Net investment loss | (0.31 | )(a) | ||
Portfolio turnover | 40 | (n) | ||
Net assets at end of period (000 omitted) | $120 | |||
See Notes to Financial Statements
24
Table of Contents
Financial Highlights – continued
| Class R3 | Period ended 8/31/12 (c) | |||
Net asset value, beginning of period | $10.00 | |||
| Income (loss) from investment operations | ||||
Net investment loss (d) | $(0.00 | )(w) | ||
Net realized and unrealized gain (loss) on investments and foreign currency | 2.01 | |||
Total from investment operations | $2.01 | |||
Net asset value, end of period (x) | $12.01 | |||
Total return (%) (r)(s)(x) | 20.10 | (n) | ||
| Ratios (%) (to average net assets) and Supplemental data: | ||||
Expenses before expense reductions (f) | 4.59 | (a) | ||
Expenses after expense reductions (f) | 1.50 | (a) | ||
Net investment loss | (0.06 | )(a) | ||
Portfolio turnover | 40 | (n) | ||
Net assets at end of period (000 omitted) | $120 | |||
| Class R4 | Period ended 8/31/12 (c) | |||
Net asset value, beginning of period | $10.00 | |||
| Income (loss) from investment operations | ||||
Net investment income (d) | $0.02 | |||
Net realized and unrealized gain (loss) on investments and foreign currency | 2.02 | |||
Total from investment operations | $2.04 | |||
Net asset value, end of period (x) | $12.04 | |||
Total return (%) (r)(s)(x) | 20.40 | (n) | ||
| Ratios (%) (to average net assets) and Supplemental data: | ||||
Expenses before expense reductions (f) | 4.34 | (a) | ||
Expenses after expense reductions (f) | 1.25 | (a) | ||
Net investment income | 0.19 | (a) | ||
Portfolio turnover | 40 | (n) | ||
Net assets at end of period (000 omitted) | $120 | |||
See Notes to Financial Statements
25
Table of Contents
Financial Highlights – continued
| (a) | Annualized. |
| (c) | For the period from the commencement of the fund’s investment operations, December 16, 2011, through the stated period end. |
| (d) | Per share data is based on average shares outstanding. |
| (f) | Ratios do not reflect reductions from fees paid indirectly, if applicable. |
| (n) | Not annualized. |
| (r) | Certain expenses have been reduced without which performance would have been lower. |
| (s) | From time to time the fund may receive proceeds from litigation settlements, without which performance would be lower. |
| (t) | Total returns do not include any applicable sales charges. |
| (w) | Per share amount was less than $0.01. |
| (x) | The net asset values per share and total returns have been calculated on net assets which include adjustments made in accordance with U.S. generally accepted accounting principles required at period end for financial reporting purposes. |
See Notes to Financial Statements
26
Table of Contents
(1) Business and Organization
MFS Global New Discovery Fund (the fund) is a series of MFS Series Trust IV (the trust). The trust is organized as a Massachusetts business trust and is registered under the Investment Company Act of 1940, as amended, as an open-end management investment company.
(2) Significant Accounting Policies
General – The preparation of financial statements in conformity with U.S. generally accepted accounting principles requires management to make estimates and assumptions that affect the reported amounts of assets and liabilities, and disclosure of contingent assets and liabilities at the date of the financial statements and the reported amounts of revenues and expenses during the reporting period. Actual results could differ from those estimates. In the preparation of these financial statements, management has evaluated subsequent events occurring after the date of the fund’s Statement of Assets and Liabilities through the date that the financial statements were issued. The fund invests in foreign securities. Investments in foreign securities are vulnerable to the effects of changes in the relative values of the local currency and the U.S. dollar and to the effects of changes in each country’s legal, political, and economic environment.
In this reporting period the fund adopted FASB Accounting Standards Update 2011-04, Fair Value Measurement (Topic 820) – Amendments to Achieve Common Fair Value Measurement and Disclosure Requirements in U.S. GAAP and IFRSs (“ASU 2011-04”). ASU 2011-04 seeks to improve the comparability of fair value measurements as presented and disclosed in financial statements prepared in accordance with U.S. GAAP and International Financial Reporting Standards (IFRS) by providing common requirements for fair value measurement and disclosure.
In December 2011, the Financial Accounting Standards Board issued Accounting Standards Update 2011-11, Balance Sheet (Topic 210) – Disclosures about Offsetting Assets and Liabilities (“ASU 2011-11”). Effective for annual reporting periods beginning on or after January 1, 2013 and interim periods within those annual periods, ASU 2011-11 is intended to enhance disclosure requirements on the offsetting of financial assets and liabilities. Although still evaluating the potential impacts of ASU 2011-11 to the fund, management expects that the impact of the fund’s adoption will be limited to additional financial statement disclosures.
Investment Valuations – Equity securities, including restricted equity securities, are generally valued at the last sale or official closing price as provided by a third-party pricing service on the market or exchange on which they are primarily traded. Equity securities, for which there were no sales reported that day, are generally valued at the last quoted daily bid quotation as provided by a third-party pricing service on the market or exchange on which such securities are primarily traded. Short-term instruments with a maturity at issuance of 60 days or less generally are valued at amortized cost, which approximates market value. Open-end investment companies are generally valued at net asset value per share. Securities and other assets generally valued on the basis of information from a third-party pricing service may also be valued at a broker/dealer bid quotation. Values obtained from third-party pricing services can
27
Table of Contents
Notes to Financial Statements – continued
utilize both transaction data and market information such as yield, quality, coupon rate, maturity, type of issue, trading characteristics, and other market data. The values of foreign securities and other assets and liabilities expressed in foreign currencies are converted to U.S. dollars using the mean of bid and asked prices for rates provided by a third-party pricing service.
The Board of Trustees has delegated primary responsibility for determining or causing to be determined the value of the fund’s investments (including any fair valuation) to the adviser pursuant to valuation policies and procedures approved by the Board. If the adviser determines that reliable market quotations are not readily available, investments are valued at fair value as determined in good faith by the adviser in accordance with such procedures under the oversight of the Board of Trustees. Under the fund’s valuation policies and procedures, market quotations are not considered to be readily available for most types of debt instruments and floating rate loans and many types of derivatives. These investments are generally valued at fair value based on information from third-party pricing services. In addition, investments may be valued at fair value if the adviser determines that an investment’s value has been materially affected by events occurring after the close of the exchange or market on which the investment is principally traded (such as foreign exchange or market) and prior to the determination of the fund’s net asset value, or after the halting of trading of a specific security where trading does not resume prior to the close of the exchange or market on which the security is principally traded. Events that occur on a frequent basis after foreign markets close (such as developments in foreign markets and significant movements in the U.S. markets) and prior to the determination of the fund’s net asset value may be deemed to have a material effect on the value of securities traded in foreign markets. Accordingly, the fund’s foreign equity securities may often be valued at fair value. The adviser generally relies on third-party pricing services or other information (such as the correlation with price movements of similar securities in the same or other markets; the type, cost and investment characteristics of the security; the business and financial condition of the issuer; and trading and other market data) to assist in determining whether to fair value and at what value to fair value an investment. The value of an investment for purposes of calculating the fund’s net asset value can differ depending on the source and method used to determine value. When fair valuation is used, the value of an investment used to determine the fund’s net asset value may differ from quoted or published prices for the same investment. There can be no assurance that the fund could obtain the fair value assigned to an investment if it were to sell the investment at the same time at which the fund determines its net asset value per share.
Various inputs are used in determining the value of the fund’s assets or liabilities. These inputs are categorized into three broad levels. In certain cases, the inputs used to measure fair value may fall into different levels of the fair value hierarchy. In such cases, an investment’s level within the fair value hierarchy is based on the lowest level of input that is significant to the fair value measurement. The fund’s assessment of the significance of a particular input to the fair value measurement in its entirety requires judgment, and considers factors specific to the investment. Level 1 includes unadjusted quoted prices in active markets for identical assets or liabilities. Level 2 includes other significant observable market-based inputs (including quoted prices for similar securities, interest rates, prepayment speed, and credit risk). Level 3 includes
28
Table of Contents
Notes to Financial Statements – continued
unobservable inputs, which may include the adviser’s own assumptions in determining the fair value of investments. The following is a summary of the levels used as of August 31, 2012 in valuing the fund’s assets or liabilities:
| Investments at Value | Level 1 | Level 2 | Level 3 | Total | ||||||||||||
| Equity Securities: | ||||||||||||||||
United States | $3,140,865 | $— | $— | $3,140,865 | ||||||||||||
United Kingdom | 802,503 | — | — | 802,503 | ||||||||||||
Japan | 140,973 | 227,020 | — | 367,993 | ||||||||||||
Brazil | 212,947 | 7 | — | 212,954 | ||||||||||||
Germany | 197,209 | — | — | 197,209 | ||||||||||||
Spain | 111,571 | — | — | 111,571 | ||||||||||||
France | 104,592 | — | — | 104,592 | ||||||||||||
Hong Kong | — | 93,846 | — | 93,846 | ||||||||||||
Indonesia | 81,825 | — | — | 81,825 | ||||||||||||
Other Countries | 584,889 | 135,956 | — | 720,845 | ||||||||||||
| Mutual Funds | 193,187 | — | — | 193,187 | ||||||||||||
| Total Investments | $5,570,561 | $456,829 | $— | $6,027,390 | ||||||||||||
For further information regarding security characteristics, see the Portfolio of Investments.
Foreign Currency Translation – Purchases and sales of foreign investments, income, and expenses are converted into U.S. dollars based upon currency exchange rates prevailing on the respective dates of such transactions or on the reporting date for foreign denominated receivables and payables. Gains and losses attributable to foreign currency exchange rates on sales of securities are recorded for financial statement purposes as net realized gains and losses on investments. Gains and losses attributable to foreign exchange rate movements on receivables, payables, income and expenses are recorded for financial statement purposes as foreign currency transaction gains and losses. That portion of both realized and unrealized gains and losses on investments that results from fluctuations in foreign currency exchange rates is not separately disclosed.
Zero Strike Warrants – The fund invested in low exercise price call warrants (zero strike warrants). Zero strike warrants are issued by banks or broker-dealers and allow the fund to gain exposure to common stocks in markets that place restrictions on investments by foreign investors and may or may not be traded on an exchange. Income received from zero strike warrants is recorded as dividend income in the Statement of Operations. To the extent the fund invests in zero strike warrants whose returns correspond to the performance of a foreign stock, investing in zero strike warrants will involve risks similar to the risks of investing in foreign securities. Additional risks associated with zero strike warrants include the potential inability of the counterparty to fulfill their obligations under the warrant, inability to transfer or liquidate the warrants and potential delays or an inability to redeem before expiration under certain market conditions.
Indemnifications – Under the fund’s organizational documents, its officers and Trustees may be indemnified against certain liabilities and expenses arising out of the performance of their duties to the fund. Additionally, in the normal course of business, the fund enters into agreements with service providers that may contain
29
Table of Contents
Notes to Financial Statements – continued
indemnification clauses. The fund’s maximum exposure under these agreements is unknown as this would involve future claims that may be made against the fund that have not yet occurred.
Investment Transactions and Income – Investment transactions are recorded on the trade date. Dividends received in cash are recorded on the ex-dividend date. Certain dividends from foreign securities will be recorded when the fund is informed of the dividend if such information is obtained subsequent to the ex-dividend date. Dividend and interest payments received in additional securities are recorded on the ex-dividend or ex-interest date in an amount equal to the value of the security on such date.
The fund may receive proceeds from litigation settlements. Any proceeds received from litigation involving portfolio holdings are reflected in the Statement of Operations in realized gain/loss if the security has been disposed of by the fund or in unrealized gain/loss if the security is still held by the fund. Any other proceeds from litigation not related to portfolio holdings are reflected as other income in the Statement of Operations.
Fees Paid Indirectly – The fund’s custody fee may be reduced according to an arrangement that measures the value of cash deposited with the custodian by the fund. This amount, for the period ended August 31, 2012, is shown as a reduction of total expenses on the Statement of Operations.
Tax Matters and Distributions – The fund intends to qualify as a regulated investment company, as defined under Subchapter M of the Internal Revenue Code, and to distribute all of its taxable income, including realized capital gains. As a result, no provision for federal income tax is required. The fund’s federal tax returns, when filed, will remain subject to examination by the Internal Revenue Service for a three year period. Foreign taxes have been accrued by the fund in the accompanying financial statements.
Distributions to shareholders are recorded on the ex-dividend date. Income and capital gain distributions are determined in accordance with income tax regulations, which may differ from U.S. generally accepted accounting principles. Certain capital accounts in the financial statements are periodically adjusted for permanent differences in order to reflect their tax character. These adjustments have no impact on net assets or net asset value per share. Temporary differences which arise from recognizing certain items of income, expense, gain or loss in different periods for financial statement and tax purposes will reverse at some time in the future. Distributions in excess of net investment income or net realized gains are temporary overdistributions for financial statement purposes resulting from differences in the recognition or classification of income or distributions for financial statement and tax purposes.
During the period ended August 31, 2012, there were no significant adjustments due to differences between book and tax accounting.
The fund declared no distributions for the period ended August 31, 2012.
30
Table of Contents
Notes to Financial Statements – continued
The federal tax cost and the tax basis components of distributable earnings were as follows:
| As of 8/31/12 | ||||
| Cost of investments | $5,379,468 | |||
| Gross appreciation | 780,966 | |||
| Gross depreciation | (133,044 | ) | ||
| Net unrealized appreciation (depreciation) | $647,922 | |||
| Undistributed ordinary income | 81,185 | |||
| Other temporary differences | (410 | ) | ||
Multiple Classes of Shares of Beneficial Interest – The fund offers multiple classes of shares, which differ in their respective distribution and service fees. The fund’s income, realized and unrealized gain (loss), and common expenses are allocated to shareholders based on the daily net assets of each class. Dividends are declared separately for each class. Differences in per share dividend rates are generally due to differences in separate class expenses. Class B shares will convert to Class A shares approximately eight years after purchase.
(3) Transactions with Affiliates
Investment Adviser – The fund has an investment advisory agreement with MFS to provide overall investment management and related administrative services and facilities to the fund.
The management fee is computed daily and paid monthly at the following annual rates:
| First $1 billion of average daily net assets | 0.975 | % | ||
| Next $1.5 billion of average daily net assets | 0.90 | % | ||
| Average daily net assets in excess of $2.5 billion | 0.85 | % |
The management fee incurred for the period ended August 31, 2012 was equivalent to an annual effective rate of 0.975% of the fund’s average daily net assets.
The investment adviser has agreed in writing to pay a portion of the fund’s total annual operating expenses, exclusive of interest, taxes, extraordinary expenses, brokerage and transaction costs, and investment-related expenses, such that total annual fund operating expenses do not exceed the following rates annually of each class’ average daily net assets:
| Class A | Class B | Class C | Class I | Class R1 | Class R2 | Class R3 | Class R4 | |||||||
1.50% | 2.25% | 2.25% | 1.25% | 2.25% | 1.75% | 1.50% | 1.25% |
This written agreement will continue until modified by the fund’s Board of Trustees, but such agreement will continue at least until December 31, 2013. For the period ended August 31, 2012, this reduction amounted to $93,254 and is reflected as a reduction of total expenses in the Statement of Operations.
Distributor – MFS Fund Distributors, Inc. (MFD), a wholly-owned subsidiary of MFS, as distributor, received $1,389 for the period ended August 31, 2012, as its portion of the initial sales charge on sales of Class A shares of the fund.
31
Table of Contents
Notes to Financial Statements – continued
The Board of Trustees has adopted a distribution plan for certain class shares pursuant to Rule 12b-1 of the Investment Company Act of 1940.
The fund’s distribution plan provides that the fund will pay MFD for services provided by MFD and financial intermediaries in connection with the distribution and servicing of certain share classes. One component of the plan is a distribution fee paid to MFD and another component of the plan is a service fee paid to MFD. MFD may subsequently pay all, or a portion, of the distribution and/or service fees to financial intermediaries.
Distribution Plan Fee Table:
| Distribution Fee Rate (d) | Service Fee Rate (d) | Total Distribution Plan (d) | Annual Effective Rate (e) | Distribution and Service Fee | ||||||||||||||||
| Class A | — | 0.25% | 0.25% | 0.25% | $1,019 | |||||||||||||||
| Class B | 0.75% | 0.25% | 1.00% | 1.00% | 1,035 | |||||||||||||||
| Class C | 0.75% | 0.25% | 1.00% | 1.00% | 1,176 | |||||||||||||||
| Class R1 | 0.75% | 0.25% | 1.00% | 1.00% | 808 | |||||||||||||||
| Class R2 | 0.25% | 0.25% | 0.50% | 0.50% | 404 | |||||||||||||||
| Class R3 | — | 0.25% | 0.25% | 0.25% | 203 | |||||||||||||||
| Total Distribution and Service Fees | $4,645 | |||||||||||||||||||
| (d) | In accordance with the distribution plan for certain classes, the fund pays distribution and/or service fees equal to these annual percentage rates of each class’ average daily net assets. The distribution and service fee rates disclosed by class represent the current rates in effect at the end of the reporting period. |
| (e) | The annual effective rates represent actual fees incurred under the distribution plan for the period ended August 31, 2012 based on each class’ average daily net assets. |
Certain Class A shares are subject to a contingent deferred sales charge (CDSC) in the event of a shareholder redemption within 18 months of purchase for shares purchased on or after August 1, 2012, and within 24 months of purchase for shares purchased prior to August 1, 2012. Class C shares are subject to a CDSC in the event of a shareholder redemption within 12 months of purchase. Class B shares are subject to a CDSC in the event of a shareholder redemption within six years of purchase. All contingent deferred sales charges are paid to MFD. There were no contingent deferred sales charges imposed during the period ended August 31, 2012.
Shareholder Servicing Agent – MFS Service Center, Inc. (MFSC), a wholly-owned subsidiary of MFS, receives a fee from the fund for its services as shareholder servicing agent calculated as a percentage of the average daily net assets of the fund as determined periodically under the supervision of the fund’s Board of Trustees. For the period ended August 31, 2012, the fee was $602, which equated to 0.0202% annually of the fund’s average daily net assets. MFSC also receives payment from the fund for out-of-pocket expenses, sub-accounting and other shareholder servicing costs which may be paid to affiliated and unaffiliated service providers. For the period ended August 31, 2012, these out-of-pocket expenses, sub-accounting and other shareholder servicing costs amounted to $168.
Administrator – MFS provides certain financial, legal, shareholder communications, compliance, and other administrative services to the fund. Under an administrative services agreement, the fund partially reimburses MFS the costs incurred to provide
32
Table of Contents
Notes to Financial Statements – continued
these services. The fund is charged an annual fixed amount of $17,500 plus a fee based on average daily net assets. The administrative services fee incurred for the period ended August 31, 2012 was equivalent to an annual effective rate of 0.4159% of the fund’s average daily net assets.
Trustees’ and Officers’ Compensation – The fund pays compensation to independent Trustees in the form of a retainer, attendance fees, and additional compensation to Board and Committee chairpersons. The fund does not pay compensation directly to Trustees or officers of the fund who are also officers of the investment adviser, all of whom receive remuneration for their services to the fund from MFS. Certain officers and Trustees of the fund are officers or directors of MFS, MFD, and MFSC.
Other – This fund and certain other funds managed by MFS (the funds) have entered into services agreements (the Agreements) which provide for payment of fees by the funds to Tarantino LLC and Griffin Compliance LLC in return for the provision of services of an Independent Chief Compliance Officer (ICCO) and Assistant ICCO, respectively, for the funds. The ICCO and Assistant ICCO are officers of the funds and the sole members of Tarantino LLC and Griffin Compliance LLC, respectively. The funds can terminate the Agreements with Tarantino LLC and Griffin Compliance LLC at any time under the terms of the Agreements. For the period ended August 31, 2012, the aggregate fees paid by the fund to Tarantino LLC and Griffin Compliance LLC were $24 and are included in “Miscellaneous” expense on the Statement of Operations. MFS has agreed to reimburse the fund for a portion of the payments made by the fund in the amount of $14, which is shown as a reduction of total expenses in the Statement of Operations. Additionally, MFS has agreed to bear all expenses associated with office space, other administrative support, and supplies provided to the ICCO and Assistant ICCO.
The fund invests in the MFS Institutional Money Market Portfolio which is managed by MFS and seeks a high level of current income consistent with preservation of capital and liquidity. Income earned on this investment is included in “Dividends from underlying affiliated funds” on the Statement of Operations. This money market fund does not pay a management fee to MFS.
On December 15, 2011, MFS purchased 10,000 shares each of Class A, Class B, Class C, Class R1, Class R2, Class R3, and Class R4 and 230,000 shares of Class I for an aggregate amount of $3,000,000. At August 31, 2012, MFS was the sole shareholder of Class R1, Class R2, Class R3, and Class R4.
(4) Portfolio Securities
Purchases and sales of investments, other than U.S. Government securities and short-term obligations, aggregated $6,799,380 and $1,696,335, respectively.
33
Table of Contents
Notes to Financial Statements – continued
(5) Shares of Beneficial Interest
The fund’s Declaration of Trust permits the Trustees to issue an unlimited number of full and fractional shares of beneficial interest. Transactions in fund shares were as follows:
| Period ended 8/31/12 (c) | ||||||||
| Shares | Amount | |||||||
| Shares sold | ||||||||
Class A | 109,628 | $1,247,750 | ||||||
Class B | 18,249 | 195,363 | ||||||
Class C | 25,509 | 276,674 | ||||||
Class I | 303,810 | 3,125,329 | ||||||
Class R1 | 10,000 | 100,000 | ||||||
Class R2 | 10,000 | 100,000 | ||||||
Class R3 | 10,000 | 100,000 | ||||||
Class R4 | 10,000 | 100,000 | ||||||
| 497,196 | $5,245,116 | |||||||
| Shares reacquired | ||||||||
Class A | (3,534 | ) | $(40,457 | ) | ||||
Class B | (1,222 | ) | (14,375 | ) | ||||
Class C | (740 | ) | (8,864 | ) | ||||
Class I | (609 | ) | (7,322 | ) | ||||
| (6,105 | ) | $(71,018 | ) | |||||
| Net change | ||||||||
Class A | 106,094 | $1,207,293 | ||||||
Class B | 17,027 | 180,988 | ||||||
Class C | 24,769 | 267,810 | ||||||
Class I | 303,201 | 3,118,007 | ||||||
Class R1 | 10,000 | 100,000 | ||||||
Class R2 | 10,000 | 100,000 | ||||||
Class R3 | 10,000 | 100,000 | ||||||
Class R4 | 10,000 | 100,000 | ||||||
| 491,091 | $5,174,098 | |||||||
| (c) | For the period from the commencement of the fund’s investment operations, December 16, 2011, through the stated period end. |
(6) Line of Credit
The fund and certain other funds managed by MFS participate in a $1.1 billion unsecured committed line of credit, subject to a $1 billion sublimit, provided by a syndication of banks under a credit agreement. Borrowings may be made for temporary financing needs. Interest is charged to each fund, based on its borrowings, generally at a rate equal to the higher of the Federal Reserve funds rate or one month LIBOR plus an agreed upon spread. A commitment fee, based on the average daily, unused portion of the committed line of credit, is allocated among the participating funds at the end of each calendar quarter. In addition, the fund and other funds
34
Table of Contents
Notes to Financial Statements – continued
managed by MFS have established unsecured uncommitted borrowing arrangements with certain banks for temporary financing needs. Interest is charged to each fund, based on its borrowings, at a rate equal to the Federal Reserve funds rate plus an agreed upon spread. For the period ended August 31, 2012, the fund’s commitment fee and interest expense were $9 and $0, respectively, and are included in “Miscellaneous” expense on the Statement of Operations.
(7) Transactions in Underlying Affiliated Funds-Affiliated Issuers
An affiliated issuer may be considered one in which the fund owns 5% or more of the outstanding voting securities, or a company which is under common control. For the purposes of this report, the fund assumes the following to be an affiliated issuer:
| Underlying Affiliated Fund | Beginning Shares/Par Amount | Acquisitions Shares/Par Amount | Dispositions Shares/Par Amount | Ending Shares/Par Amount | ||||||||||||
| MFS Institutional Money Market Portfolio | — | 5,360,563 | (5,167,376 | ) | 193,187 | |||||||||||
| Underlying Affiliated Fund | Realized Gain (Loss) | Capital Gain Distributions | Dividend Income | Ending Value | ||||||||||||
| MFS Institutional Money Market Portfolio | $— | $— | $103 | $193,187 | ||||||||||||
35
Table of Contents
REPORT OF INDEPENDENT REGISTERED PUBLIC ACCOUNTING FIRM
To the Board of Trustees of MFS Series Trust IV and Shareholders of MFS Global New Discovery Fund:
We have audited the accompanying statement of assets and liabilities of MFS Global New Discovery Fund (the Fund) (one of the portfolios comprising MFS Series Trust IV), including the portfolio of investments, as of August 31, 2012, and the related statement of operations, the statement of changes in net assets and the financial highlights for the period December 16, 2011 (commencement of operations) to August 31, 2012. These financial statements and financial highlights are the responsibility of the Fund’s management. Our responsibility is to express an opinion on these financial statements and financial highlights based on our audit.
We conducted our audit in accordance with the standards of the Public Company Accounting Oversight Board (United States). Those standards require that we plan and perform the audit to obtain reasonable assurance about whether the financial statements and financial highlights are free of material misstatement. We were not engaged to perform an audit of the Fund’s internal control over financial reporting. Our audit included consideration of internal control over financial reporting as a basis for designing audit procedures that are appropriate in the circumstances, but not for the purpose of expressing an opinion on the effectiveness of the Fund’s internal control over financial reporting. Accordingly, we express no such opinion. An audit also includes examining, on a test basis, evidence supporting the amounts and disclosures in the financial statements and financial highlights, assessing the accounting principles used and significant estimates made by management, and evaluating the overall financial statement presentation. Our procedures included confirmation of securities owned as of August 31, 2012, by correspondence with the custodian and brokers or by other appropriate auditing procedures where replies from brokers were not received. We believe that our audit provides a reasonable basis for our opinion.
In our opinion, the financial statements and financial highlights referred to above present fairly, in all material respects, the financial position of the MFS Global New Discovery Fund at August 31, 2012, and the results of its operations, the changes in its net assets and the financial highlights for the period December 16, 2011 (commencement of operations) to August 31, 2012, in conformity with U.S. generally accepted accounting principles.

Boston, Massachusetts
October 17, 2012
36
Table of Contents
TRUSTEES AND OFFICERS — IDENTIFICATION AND BACKGROUND
The Trustees and officers of the Trust, as of October 1, 2012, are listed below, together with their principal occupations during the past five years. (Their titles may have varied during that period.) The address of each Trustee and officer is 500 Boylston Street, Boston, Massachusetts 02116.
Name, Age | Position(s) Held with Fund | Trustee/Officer Since (h) | Principal the Past Five Years | Other Directorships (j) | ||||
| INTERESTED TRUSTEES | ||||||||
| Robert J. Manning (k) (age 48) | Trustee | February 2004 | Massachusetts Financial Services Company, Chairman, Chief Executive Officer and Director; President (until December 2009); Chief Investment Officer (until July 2010) | N/A | ||||
| INDEPENDENT TRUSTEES | ||||||||
| David H. Gunning (age 70) | Trustee and Chair of Trustees | January 2004 | Retired; Cleveland-Cliffs Inc. (mining products and service provider), Vice Chairman/Director (until 2007) | Lincoln Electric Holdings, Inc. (welding equipment manufacturer), Director; Development Alternatives, Inc. (consulting), Director/Non-Executive Chairman; Portman Limited (mining), Director (until 2008) | ||||
| Robert E. Butler (age 70) | Trustee | January 2006 | Consultant – investment company industry regulatory and compliance matters | N/A | ||||
Maureen R. Goldfarb (age 57) | Trustee | January 2009 | Private investor | N/A | ||||
| William R. Gutow (age 71) | Trustee | December 1993 | Private investor and real estate consultant; Capitol Entertainment Management Company (video franchise), Vice Chairman | Atlantic Coast Tan (tanning salons), Vice Chairman (until 2007); Texas Donuts (donut franchise), Vice Chairman (until 2010) | ||||
| Michael Hegarty (age 67) | Trustee | December 2004 | Private investor | N/A | ||||
John P. Kavanaugh (age 57) | Trustee | January 2009 | Private investor | N/A | ||||
37
Table of Contents
Trustees and Officers – continued
Name, Age | Position(s) Held with Fund | Trustee/Officer Since (h) | Principal the Past Five Years | Other Directorships (j) | ||||
| J. Dale Sherratt (age 74) | Trustee | June 1989 | Insight Resources, Inc. (acquisition planning specialists), President; Wellfleet Investments (investor in health care companies), Managing General Partner | N/A | ||||
| Laurie J. Thomsen (age 55) | Trustee | March 2005 | Private investor; New Profit, Inc. (venture philanthropy), Executive Partner (until 2010) | The Travelers Companies (insurance), Director | ||||
| Robert W. Uek (age 71) | Trustee | January 2006 | Consultant to investment company industry | N/A | ||||
| OFFICERS | ||||||||
John M. Corcoran (k) (age 47) | President | October 2008 | Massachusetts Financial Services Company, Senior Vice President (since October 2008); State Street Bank and Trust (financial services provider), Senior Vice President, (until September 2008) | N/A | ||||
| Christopher R. Bohane (k) (age 38) | Assistant Secretary and Assistant Clerk | July 2005 | Massachusetts Financial Services Company, Vice President and Senior Counsel | N/A | ||||
Kino Clark (k) (age 44) | Assistant Treasurer | January 2012 | Massachusetts Financial Services Company, Vice President | N/A | ||||
Thomas H. Connors (k) (age 53) | Assistant Secretary and Assistant Clerk | September 2012 | Massachusetts Financial Services Company, Vice President and Senior Counsel; Deutsche Asset Management, Director and Senior Counsel (until 2012) | N/A |
38
Table of Contents
Trustees and Officers – continued
Name, Age | Position(s) Held with Fund | Trustee/Officer Since (h) | Principal the Past Five Years | Other Directorships (j) | ||||
| Ethan D. Corey (k) (age 48) | Assistant Secretary and Assistant Clerk | July 2005 | Massachusetts Financial Services Company, Senior Vice President and Associate General Counsel | N/A | ||||
| David L. DiLorenzo (k) (age 44) | Treasurer | July 2005 | Massachusetts Financial Services Company, Senior Vice President | N/A | ||||
| Robyn L. Griffin (age 37) | Assistant Independent Chief Compliance Officer | August 2008 | Griffin Compliance LLC (provider of compliance services), Principal (since August 2008); State Street Corporation (financial services provider), Mutual Fund Administration Assistant Vice President (October 2006 – July 2008); | N/A | ||||
Brian E. Langenfeld (k) (age 39) | Assistant Secretary and Assistant Clerk | June 2006 | Massachusetts Financial Services Company, Vice President and Senior Counsel | N/A | ||||
Susan S. Newton (k) (age 62) | Assistant Secretary and Assistant Clerk | May 2005 | Massachusetts Financial Services Company, Senior Vice President and Associate General Counsel | N/A | ||||
| Susan A. Pereira (k) (age 41) | Assistant Secretary and Assistant Clerk | July 2005 | Massachusetts Financial Services Company, Vice President and Senior Counsel | N/A | ||||
Kasey L. Phillips (k) (age 41) | Assistant Treasurer | September 2012 | Massachusetts Financial Services Company; Wells Fargo Funds Management, LLC, Senior Vice President, Fund Treasurer (until 2012) | N/A |
39
Table of Contents
Trustees and Officers – continued
Name, Age | Position(s) Held with Fund | Trustee/Officer Since (h) | Principal the Past Five Years | Other Directorships (j) | ||||
| Mark N. Polebaum (k) (age 60) | Secretary and Clerk | January 2006 | Massachusetts Financial Services Company, Executive Vice President, General Counsel and Secretary | N/A | ||||
| Frank L. Tarantino (age 68) | Independent Chief Compliance Officer | June 2004 | Tarantino LLC (provider of compliance services), Principal | N/A | ||||
| Richard S. Weitzel (k) (age 42) | Assistant Secretary and Assistant Clerk | October 2007 | Massachusetts Financial Services Company, Senior Vice President and Associate General Counsel | N/A | ||||
| James O. Yost (k) (age 52) | Deputy Treasurer | September 1990 | Massachusetts Financial Services Company, Senior Vice President | N/A |
| (h) | Date first appointed to serve as Trustee/officer of an MFS fund. Each Trustee has served continuously since appointment unless indicated otherwise. For the period from December 15, 2004 until February 22, 2005, Mr. Manning served as Advisory Trustee. For the period October 2008, until January 2012, Mr. Corcoran served as Treasurer of the Funds. Prior to January 2012, Messrs. DiLorenzo and Yost served as Assistant Treasurers of the Funds. |
| (j) | Directorships or trusteeships of companies required to report to the Securities and Exchange Commission (i.e., “public companies”). |
| (k) | “Interested person” of the Trust within the meaning of the Investment Company Act of 1940 (referred to as the 1940 Act), which is the principal federal law governing investment companies like the fund, as a result of position with MFS. The address of MFS is 500 Boylston Street, Boston, Massachusetts 02116. |
Each Trustee has been elected by shareholders and each Trustee and officer holds office until his or her successor is chosen and qualified or until his or her earlier death, resignation, retirement or removal. The Trust does not hold annual meetings for the purpose of electing Trustees, and Trustees are not elected for fixed terms. Messrs. Butler, Kavanaugh, Uek and Ms. Thomsen are members of the Trust’s Audit Committee.
Each of the Fund’s Trustees and officers holds comparable positions with certain other funds of which MFS or a subsidiary is the investment adviser or distributor, and, in the case of the officers, with certain affiliates of MFS. As of January 1, 2012, the Trustees served as board members of 131 funds within the MFS Family of Funds.
40
Table of Contents
Trustees and Officers – continued
The Statement of Additional Information for the Fund includes further information about the Trustees and is available without charge upon request by calling 1-800-225-2606.
| Investment Adviser | Custodian | |
| Massachusetts Financial Services Company 500 Boylston Street Boston, MA 02116-3741 | State Street Bank and Trust 1 Lincoln Street Boston, MA 02111-2900 | |
| Distributor | Independent Registered Public Accounting Firm | |
| MFS Fund Distributors, Inc. 500 Boylston Street Boston, MA 02116-3741 | Ernst & Young LLP 200 Clarendon Street | |
| Portfolio Managers | ||
| Peter Fruzzetti | ||
| Thomas Wetherald |
41
Table of Contents
BOARD REVIEW OF INVESTMENT ADVISORY AGREEMENT
A discussion regarding the Board’s approval of the fund’s Investment Advisory Agreement with MFS is available by clicking on the fund’s name under “Mutual Funds” in the “Products and Performance” section of the MFS Web site (mfs.com).
PROXY VOTING POLICIES AND INFORMATION
A general description of the MFS funds’ proxy voting policies and procedures is available without charge, upon request, by calling 1-800-225-2606, by visiting the Proxy Voting section of mfs.com or by visiting the SEC’s Web site at http://www.sec.gov.
Information regarding how the fund voted proxies relating to portfolio securities during the most recent twelve-month period ended June 30 is available without charge by visiting the Proxy Voting section of mfs.com or by visiting the SEC’s Web site at http://www.sec.gov.
QUARTERLY PORTFOLIO DISCLOSURE
The fund will file a complete schedule of portfolio holdings with the Securities and Exchange Commission (the Commission) for the first and third quarters of each fiscal year on Form N-Q. A shareholder can obtain the quarterly portfolio holdings report at mfs.com. The fund’s Form N-Q is also available on the EDGAR database on the Commission’s Internet Web site at http://www.sec.gov, and may be reviewed and copied at the:
Public Reference Room
Securities and Exchange Commission
100 F Street, NE, Room 1580
Washington, D.C. 20549
Information on the operation of the Public Reference Room may be obtained by calling the Commission at 1-800-SEC-0330. Copies of the fund’s Form N-Q also may be obtained, upon payment of a duplicating fee, by electronic request at the following e-mail address: publicinfo@sec.gov or by writing the Public Reference Section at the above address.
From time to time, MFS may post important information about the fund or the MFS funds on the MFS web site (mfs.com). This information is available by visiting the “News & Commentary” section of mfs.com or by clicking on the fund’s name under “Mutual Funds” in the “Products and Performance” section of mfs.com.
FEDERAL TAX INFORMATION (unaudited)
The fund will notify shareholders of amounts for use in preparing 2012 income tax forms in January 2013.
42
Table of Contents
rev. 3/11
| FACTS | WHAT DOES MFS DO WITH YOUR PERSONAL INFORMATION? |  | ||
| Why? | Financial companies choose how they share your personal information. Federal law gives consumers the right to limit some but not all sharing. Federal law also requires us to tell you how we collect, share, and protect your personal information. Please read this notice carefully to understand what we do. |
| What? | The types of personal information we collect and share depend on the product or service you have with us. This information can include:
• Social Security number and account balances • Account transactions and transaction history • Checking account information and wire transfer instructions
When you are no longer our customer, we continue to share your information as described in this notice. |
| How? | All financial companies need to share customers’ personal information to run their everyday business. In the section below, we list the reasons financial companies can share their customers’ personal information; the reasons MFS chooses to share; and whether you can limit this sharing. |
| Reasons we can share your personal information | Does MFS share? | Can you limit this sharing? | ||
For our everyday business purposes – such as to process your transactions, maintain your account(s), respond to court orders and legal investigations, or report to credit bureaus | Yes | No | ||
For our marketing purposes – to offer our products and services to you | No | We don’t share | ||
| For joint marketing with other financial companies | No | We don’t share | ||
For our affiliates’ everyday business purposes – information about your transactions and experiences | No | We don’t share | ||
For our affiliates’ everyday business purposes – information about your creditworthiness | No | We don’t share | ||
| For nonaffiliates to market to you | No | We don’t share |
| Questions? | Call 800-225-2606 or go to mfs.com. |
43
Table of Contents
| Page 2 |
| Who we are | ||
| Who is providing this notice? | MFS Funds, MFS Investment Management, MFS Institutional Advisors, Inc., MFS Fund Distributors, Inc., MFS Heritage Trust Company, and MFS Service Center, Inc. | |
| What we do | ||
| How does MFS protect my personal information? | To protect your personal information from unauthorized access and use, we use security measures that comply with federal law. These measures include procedural, electronic, and physical safeguards for the protection of the personal information we collect about you. | |
| How does MFS collect my personal information? | We collect your personal information, for example, when you
• open an account or provide account information • direct us to buy securities or direct us to sell your securities • make a wire transfer
We also collect your personal information from others, such as credit bureaus, affiliates and other companies. | |
| Why can’t I limit all sharing? | Federal law gives you the right to limit only
• sharing for affiliates’ everyday business purposes – information about your creditworthiness • affiliates from using your information to market to you • sharing for nonaffiliates to market to you
State laws and individual companies may give you additional rights to limit sharing. | |
| Definitions | ||
| Affiliates | Companies related by common ownership or control. They can be financial and nonfinancial companies.
• MFS does not share personal information with affiliates, except for everyday business purposes as described on page one of this notice. | |
| Nonaffiliates | Companies not related by common ownership or control. They can be financial and nonfinancial companies.
• MFS does not share with nonaffiliates so they can market to you. | |
| Joint Marketing | A formal agreement between nonaffiliated financial companies that together market financial products or services to you.
• MFS doesn’t jointly market. | |
| Other important information | ||
| If you own an MFS product or receive an MFS service in the name of a third party such as a bank or broker-dealer, their privacy policy may apply to you instead of ours. | ||
44
Table of Contents
Save paper with eDelivery.
| MFS® will send you prospectuses, |

reports, and proxies directly via e-mail so you will get information faster with less mailbox clutter.
To sign up:
1. Go to mfs.com.
2. Log in via MFS® Access.
3. Select eDelivery.
If you own your MFS fund shares through a financial institution or a retirement plan, MFS® TALK, MFS® Access, or eDelivery may not be available to you.
WEB SITE
mfs.com
MFS TALK
1-800-637-8255
24 hours a day
ACCOUNT SERVICE AND LITERATURE
Shareholders
1-800-225-2606
Financial advisors
1-800-343-2829
Retirement plan services
1-800-637-1255
MAILING ADDRESS
MFS Service Center, Inc.
P.O. Box 55824
Boston, MA 02205-5824
OVERNIGHT MAIL
MFS Service Center, Inc.
c/o Boston Financial Data Services
30 Dan Road
Canton, MA 02021-2809
Table of Contents
| ITEM 2. | CODE OF ETHICS. |
The Registrant has adopted a Code of Ethics pursuant to Section 406 of the Sarbanes-Oxley Act and as defined in Form N-CSR that applies to the Registrant’s principal executive officer and principal financial and accounting officer. During the period covered by this report, the Registrant has not amended any provision in its Code of Ethics (the “Code”) that relates to an element of the Code’s definitions enumerated in paragraph (b) of Item 2 of this Form N-CSR. During the period covered by this report, the Registrant did not grant a waiver, including an implicit waiver, from any provision of the Code.
A copy of the Code of Ethics is filed as an exhibit to this Form N-CSR.
| ITEM 3. | AUDIT COMMITTEE FINANCIAL EXPERT. |
Messrs. Robert E. Butler, John P. Kavanaugh and Robert W. Uek and Ms. Laurie J. Thomsen, members of the Audit Committee, have been determined by the Board of Trustees in their reasonable business judgment to meet the definition of “audit committee financial expert” as such term is defined in Form N-CSR. In addition, Messrs. Butler, Kavanaugh and Uek and Ms. Thomsen are “independent” members of the Audit Committee (as such term has been defined by the Securities and Exchange Commission in regulations implementing Section 407 of the Sarbanes-Oxley Act of 2002). The Securities and Exchange Commission has stated that the designation of a person as an audit committee financial expert pursuant to this Item 3 on the Form N-CSR does not impose on such a person any duties, obligations or liability that are greater than the duties, obligations or liability imposed on such person as a member of the Audit Committee and the Board of Trustees in the absence of such designation or identification.
| ITEM 4. | PRINCIPAL ACCOUNTANT FEES AND SERVICES. |
Items 4(a) through 4(d) and 4(g):
The Board of Trustees has appointed Deloitte & Touche LLP (“Deloitte”) to serve as independent accountants to certain series of the Registrant and Ernst & Young LLP (“E&Y”) to serve in the same capacity to certain other series of the Registrant (the series referred to collectively as the “Funds” and singularly as a “Fund”). The tables below set forth the audit fees billed to the Funds as well as fees for non-audit services provided to the Funds and/or to the Funds’ investment adviser, Massachusetts Financial Services Company (“MFS”), and to various entities either controlling, controlled by, or under common control with MFS that provide ongoing services to the Funds (“MFS Related Entities”).
Table of Contents
For the fiscal years ended August 31, 2012 and 2011, audit fees billed to the Funds by Deloitte and E&Y were as follows:
| Audit Fees | ||||||||
| Fees billed by Deloitte: | 2012 | 2011 | ||||||
MFS Government Money Market Fund | 24,495 | 23,606 | ||||||
MFS Mid Cap Growth Fund | 41,857 | 40,316 | ||||||
MFS Money Market Fund | 29,730 | 28,644 | ||||||
Total | 96,082 | 92,566 | ||||||
| Audit Fees | ||||||||
| Fees billed by E&Y: | 2012 | 2011 | ||||||
MFS Global New Discovery Fund | 21,300 | N/A | ** | |||||
For the fiscal years ended August 31, 2012 and 2011, fees billed by Deloitte and E&Y for audit-related, tax and other services provided to the Funds and for audit-related, tax and other services provided to MFS and MFS Related Entities were as follows:
| Audit-Related Fees1 | Tax Fees2 | All Other Fees3 | ||||||||||||||||||||||
| Fees billed by Deloitte: | 2012 | 2011 | 2012 | 2011 | 2012 | 20115 | ||||||||||||||||||
To MFS Government Money Market Fund | 0 | 0 | 3,573 | 3,439 | 641 | 1,248 | ||||||||||||||||||
To MFS Mid Cap Growth Fund | 0 | 0 | 6,288 | 6,052 | 950 | 1,248 | ||||||||||||||||||
To MFS Money Market Fund | 0 | 0 | 3,574 | 3,440 | 788 | 1,248 | ||||||||||||||||||
Total fees billed by Deloitte To above Funds: | 0 | 0 | 13,435 | 12,931 | 2,379 | 3,744 | ||||||||||||||||||
| Audit-Related Fees | Tax Fees | All Other Fees | ||||||||||||||||||||||
| Fees billed by Deloitte: | 2012 | 20115 | 2012 | 2011 | 2012 | 20115 | ||||||||||||||||||
To MFS and MFS Related Entities of MFS Government Money Market Fund* | 1,249,664 | 810,204 | 0 | 0 | 0 | 113,100 | ||||||||||||||||||
To MFS and MFS Related Entities of MFS Mid Cap Growth Fund* | 1,249,664 | 810,204 | 0 | 0 | 0 | 113,100 | ||||||||||||||||||
To MFS and MFS Related Entities of MFS Money Market Fund* | 1,249,664 | 810,204 | 0 | 0 | 0 | 113,100 | ||||||||||||||||||
Table of Contents
| Aggregate fees for non-audit services: | 2012 | 20115 | ||||||
To MFS Government Money Market Fund, MFS and MFS Related Entities# | 1,541,398 | 1,352,207 | ||||||
To MFS Mid Cap Growth Fund, MFS and MFS Related Entities# | 1,544,422 | 1,354,820 | ||||||
To MFS Money Market Fund, MFS and MFS Related Entities# | 1,541,546 | 1,352,208 | ||||||
| Audit-Related Fees1 | Tax Fees2 | All Other Fees4 | ||||||||||||||||||||||
| Fees billed by E&Y: | 2012 | 2011 | 2012 | 2011 | 2012 | 2011 | ||||||||||||||||||
To MFS Global New Discovery Fund | 0 | N/A | ** | 8,238 | N/A | ** | 0 | N/A | ** | |||||||||||||||
| Audit-Related Fees | Tax Fees | All Other Fees | ||||||||||||||||||||||
| Fees billed by E&Y: | 2012 | 2011 | 2012 | 2011 | 2012 | 2011 | ||||||||||||||||||
To MFS and MFS Related Entities of MFS Global New Discovery Fund* | 0 | 0 | 0 | 0 | 0 | 0 | ||||||||||||||||||
| Aggregate fees for non-audit services: | 2012 | 2011 | ||||||
To MFS New Global New Discovery Fund, MFS and MFS Related Entities# | 133,238 | 25,000 | ||||||
| * | This amount reflects the fees billed to MFS and MFS Related Entities for non-audit services relating directly to the operations and financial reporting of the Funds (portions of which services also related to the operations and financial reporting of other funds within the MFS Funds complex). |
| ** | MFS Global New Discovery Fund commenced investment operations in December 2011. |
| # | This amount reflects the aggregate fees billed by Deloitte or E&Y for non-audit services rendered to the Fund and for non-audit services rendered to MFS and the MFS Related Entities. |
| 1 | The fees included under “Audit-Related Fees” are fees related to assurance and related services that are reasonably related to the performance of the audit or review of financial statements, but not reported under “Audit Fees,” including accounting consultations, agreed-upon procedure reports, attestation reports, comfort letters and internal control reviews. |
Table of Contents
| 2 | The fees included under “Tax Fees” are fees associated with tax compliance, tax advice and tax planning, including services relating to the filing or amendment of federal, state or local income tax returns, regulated investment company qualification reviews and tax distribution and analysis. |
| 3 | The fees included under “All Other Fees” are fees for products and services provided by Deloitte other than those reported under “Audit Fees,” “Audit-Related Fees” and “Tax Fees,” including fees for services related to review of internal controls and Rule 38a-1 compliance program. |
| 4 | The fees under “All Other Fees” are fees for products and services provided by E&Y other than those reported under “Audit Fees,” “Audit-Related Fees” and “Tax Fees”. |
| 5 | Certain fees reported in 2011 have been restated in this filing from those reported in the Registrant’s filing for the reporting period ended August 31, 2011. |
Item 4(e)(1):
Set forth below are the policies and procedures established by the Audit Committee of the Board of Trustees relating to the pre-approval of audit and non-audit related services:
To the extent required by applicable law, pre-approval by the Audit Committee of the Board is needed for all audit and permissible non-audit services rendered to the Funds and all permissible non-audit services rendered to MFS or MFS Related Entities if the services relate directly to the operations and financial reporting of the Registrant. Pre-approval is currently on an engagement-by-engagement basis. In the event pre-approval of such services is necessary between regular meetings of the Audit Committee and it is not practical to wait to seek pre-approval at the next regular meeting of the Audit Committee, pre-approval of such services may be referred to the Chair of the Audit Committee for approval; provided that the Chair may not pre-approve any individual engagement for such services exceeding $50,000 or multiple engagements for such services in the aggregate exceeding $100,000 in each period between regular meetings of the Audit Committee. Any engagement pre-approved by the Chair between regular meetings of the Audit Committee shall be presented for ratification by the entire Audit Committee at its next regularly scheduled meeting.
Item 4(e)(2):
None, or 0%, of the services relating to the Audit-Related Fees, Tax Fees and All Other Fees paid by the Fund and MFS and MFS Related Entities relating directly to the operations and financial reporting of the Registrant disclosed above were approved by the audit committee pursuant to paragraphs (c)(7)(i)(C) of Rule 2-01 of Regulation S-X (which permits audit committee approval after the start of the engagement with respect to services other than audit, review or attest services, if certain conditions are satisfied).
Item 4(f): Not applicable.
Item 4(h): The Registrant’s Audit Committee has considered whether the provision by a Registrant’s independent registered public accounting firm of non-audit services to MFS and MFS Related Entities that were not pre-approved by the Committee (because such services did not relate directly to the operations and financial reporting of the Registrant) was compatible with maintaining the independence of the independent registered public accounting firm as the Registrant’s principal auditors.
Table of Contents
| ITEM 5. | AUDIT COMMITTEE OF LISTED REGISTRANTS. |
Not applicable to the Registrant.
| ITEM 6. | INVESTMENTS |
A schedule of investments of the Registrant is included as part of the report to shareholders of such series under Item 1 of this Form N-CSR.
| ITEM 7. | DISCLOSURE OF PROXY VOTING POLICIES AND PROCEDURES FOR CLOSED-END MANAGEMENT INVESTMENT COMPANIES. |
Not applicable to the Registrant.
| ITEM 8. | PORTFOLIO MANAGERS OF CLOSED-END MANAGEMENT INVESTMENT COMPANIES. |
Not applicable to the Registrant.
| ITEM 9. | PURCHASES OF EQUITY SECURITIES BY CLOSED-END MANAGEMENT INVESTMENT COMPANY AND AFFILIATED PURCHASERS. |
Not applicable to the Registrant.
| ITEM 10. | SUBMISSION OF MATTERS TO A VOTE OF SECURITY HOLDERS. |
There were no material changes to the procedures by which shareholders may send recommendations to the Board for nominees to the Registrant’s Board since the Registrant last provided disclosure as to such procedures in response to the requirements of Item 407 (c)(2)(iv) of Regulation S-K or this Item.
| ITEM 11. | CONTROLS AND PROCEDURES. |
| (a) | Based upon their evaluation of the effectiveness of the registrant’s disclosure controls and procedures (as defined in Rule 30a-3(c) under the Investment Company Act of 1940 (the “Act”)) as conducted within 90 days of the filing date of this report on Form N-CSR, the registrant’s principal financial officer and principal executive officer have concluded that those disclosure controls and procedures provide reasonable assurance that the material information required to be disclosed by the registrant on this report is recorded, processed, summarized and reported within the time periods specified in the Securities and Exchange Commission’s rules and forms. |
Table of Contents
| (b) | There were no changes in the registrant’s internal controls over financial reporting (as defined in Rule 30a-3(d) under the Act) that occurred during the second fiscal quarter of the period covered by the report that have materially affected, or are reasonably likely to materially affect, the registrant’s internal control over financial reporting. |
| ITEM 12. | EXHIBITS. |
| (a) | File the exhibits listed below as part of this form. Letter or number the exhibits in the sequence indicated. |
| (1) | Any code of ethics, or amendment thereto, that is the subject of the disclosure required by Item 2, to the extent that the registrant intends to satisfy the Item 2 requirements through filing of an exhibit: Code of Ethics attached hereto. |
| (2) | A separate certification for each principal executive officer and principal financial officer of the registrant as required by Rule 30a-2 under the Act (17 CFR 270.30a-2): Attached hereto. |
| (b) | If the report is filed under Section 13(a) or 15(d) of the Exchange Act, provide the certifications required by Rule 30a-2(b) under the Act (17 CFR 270.30a-2(b)), Rule 13a-14(b) or Rule 15d-14(b) under the Exchange Act (17 CFR 240.13a-14(b) or 240.15d-14(b)) and Section 1350 of Chapter 63 of Title 18 of the United States Code (18 U.S.C. 1350) as an exhibit. A certification furnished pursuant to this paragraph will not be deemed “filed” for the purposes of Section 18 of the Exchange Act (15 U.S.C. 78r), or otherwise subject to the liability of that section. Such certification will not be deemed to be incorporated by reference into any filing under the Securities Act of 1933 or the Exchange Act, except to the extent that the registrant specifically incorporates it by reference: Attached hereto. |
Table of Contents
Notice
A copy of the Amended and Restated Declaration of Trust, as amended, of the Registrant is on file with the Secretary of State of The Commonwealth of Massachusetts and notice is hereby given that this instrument is executed on behalf of the Registrant by an officer of the Registrant as an officer and not individually and the obligations of or arising out of this instrument are not binding upon any of the Trustees or shareholders individually, but are binding only upon the assets and property of the respective constituent series of the Registrant.
Table of Contents
SIGNATURES
Pursuant to the requirements of the Securities Exchange Act of 1934 and the Investment Company Act of 1940, the registrant has duly caused this report to be signed on its behalf by the undersigned, thereunto duly authorized.
(Registrant) MFS SERIES TRUST IV
| By (Signature and Title)* | JOHN M. CORCORAN | |
| John M. Corcoran, President |
Date: October 17, 2012
Pursuant to the requirements of the Securities Exchange Act of 1934 and the Investment Company Act of 1940, this report has been signed below by the following persons on behalf of the registrant and in the capacities and on the dates indicated.
| By (Signature and Title)* | JOHN M. CORCORAN | |
| John M. Corcoran, President (Principal Executive Officer) |
Date: October 17, 2012
| By (Signature and Title)* | DAVID L. DILORENZO | |
| David L. DiLorenzo, Treasurer (Principal Financial Officer and Accounting Officer) |
Date: October 17, 2012
| * | Print name and title of each signing officer under his or her signature. |