UNITED STATES
SECURITIES AND EXCHANGE COMMISSION Washington, D.C. 20549
FORM N-CSR
CERTIFIED SHAREHOLDER REPORT OF REGISTERED MANAGEMENT INVESTMENT COMPANIES
Investment Company Act file number 811-02594
MFS SERIES TRUST IV
(Exact name of registrant as specified in charter)
111 Huntington Avenue, Boston, Massachusetts 02199 (Address of principal executive offices) (Zip code)
Christopher R. Bohane
Massachusetts Financial Services Company
111Huntington Avenue Boston, Massachusetts 02199
(Name and address of agents for service)
Registrant's telephone number, including area code: (617) 954-5000
Date of fiscal year end: August 31
Date of reporting period: August 31, 2023
ITEM 1. REPORTS TO STOCKHOLDERS.
Item 1(a):
Annual Report
August 31, 2023
MFS® Blended Research® Emerging Markets
Equity Fund
MFS® Blended Research® Emerging Markets
Equity Fund
| 1 |
| 3 |
| 5 |
| 8 |
| 10 |
| 17 |
| 19 |
| 20 |
| 21 |
| 27 |
| 38 |
| 40 |
| 44 |
| 48 |
| 49 |
| 49 |
| 49 |
| 49 |
| 49 |
| 50 |
The report is prepared for the general information of shareholders. It is authorized for distribution to prospective investors only when preceded or accompanied by a current prospectus.
NOT FDIC INSURED • MAY LOSE VALUE • NO BANK GUARANTEE
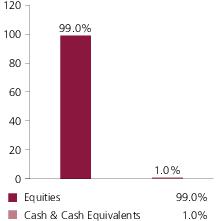
Portfolio structure
Top ten holdings
| Taiwan Semiconductor Manufacturing Co. Ltd. | 7.3% |
| Tencent Holdings Ltd. | 4.8% |
| Samsung Electronics Co. Ltd. | 4.6% |
| Alibaba Group Holding Ltd. | 2.3% |
| Hon Hai Precision Industry Co. Ltd. | 1.8% |
| China Petroleum & Chemical Corp. | 1.6% |
| Mahindra & Mahindra Ltd. | 1.6% |
| KB Financial Group, Inc. | 1.6% |
| Petrobras | 1.6% |
| Tata Consultancy Services Ltd. | 1.5% |
GICS equity sectors (g)
| Information Technology | 20.9% |
| Financials | 20.7% |
| Consumer Discretionary | 14.2% |
| Communication Services | 10.4% |
| Materials | 7.7% |
| Consumer Staples | 7.0% |
| Industrials | 5.9% |
| Energy | 5.1% |
| Health Care | 3.9% |
| Utilities | 1.8% |
| Real Estate | 1.4% |
Issuer country weightings (x)
| China | 30.1% |
| South Korea | 14.4% |
| India | 13.9% |
| Taiwan | 12.3% |
| Brazil | 5.3% |
| Indonesia | 3.7% |
| Mexico | 3.5% |
| South Africa | 3.0% |
| United Arab Emirates | 1.9% |
| Other Countries | 11.9% |
Currency exposure weightings (y)
| Hong Kong Dollar | 25.0% |
| South Korean Won | 14.4% |
| Indian Rupee | 13.6% |
| Taiwan Dollar | 12.3% |
| Brazilian Real | 5.3% |
| Chinese Renminbi | 4.3% |
| Indonesian Rupiah | 3.7% |
| United States Dollar | 3.5% |
| Mexican Peso | 3.5% |
| Other Currencies | 14.4% |
Portfolio Composition - continued
| (g) | The Global Industry Classification Standard (GICS®) was developed by and/or is the exclusive property of MSCI, Inc. and S&P Global Market Intelligence Inc. (“S&P Global Market Intelligence”). GICS is a service mark of MSCI and S&P Global Market Intelligence and has been licensed for use by MFS. MFS has applied its own internal sector/industry classification methodology for equity securities and non-equity securities that are unclassified by GICS. |
| (x) | Represents the portfolio’s exposure to issuer countries as a percentage of a portfolio’s net assets. For purposes of this presentation, United States (included in Other Countries) includes Cash & Cash Equivalents. |
| (y) | Represents the portfolio’s exposure to a particular currency as a percentage of a portfolio's net assets. For purposes of this presentation, United States Dollar includes Cash & Cash Equivalents. |
Cash & Cash Equivalents includes any cash, investments in money market funds, short-term securities, and other assets less liabilities. Please see the Statement of Assets and Liabilities for additional information related to the fund’s cash position and other assets and liabilities.
Percentages are based on net assets as of August 31, 2023.
The portfolio is actively managed and current holdings may be different.
Management Review
Summary of Results
For the twelve months ended August 31, 2023, Class A shares of the MFS Blended Research Emerging Markets Equity Fund (fund) provided a total return of 3.79%, at net asset value. This compares with a return of 1.25% for the fund’s benchmark, the MSCI Emerging Markets Index (net div).
Market Environment
During the reporting period, central banks around the world had to combat the strongest inflationary pressures in four decades, fueled by the global fiscal response to the pandemic, disrupted supply chains and the dislocations to energy markets stemming from the war in Ukraine. Interest rates rose substantially, but the effects of a tighter monetary policy may not have been fully experienced yet, given that monetary policy works with long and variable lags. Strains resulting from the abrupt tightening of monetary policy began to affect some parts of the economy, most acutely among small and regional US banks, which suffered from deposit flight as depositors sought higher yields on their savings. Those shifts exposed an asset-liability mismatch that forced the closure of several institutions by regulators. Given the importance of small and mid-sized lenders to the provision of credit in the US, concerns were raised in the aftermath of the crisis that credit availability could become constrained, leading to slower economic growth, although those effects have been limited thus far. China’s abandonment of its Zero-COVID policy ushered in a brief uptick in economic activity in the world’s second-largest economy in early 2023, although its momentum soon stalled as focus turned to the country’s highly-indebted property development sector. In developed markets, consumer demand for services remained stronger than the demand for goods.
Policymakers found themselves in the difficult position of trying to restrain inflation without tipping economies into recession. Despite the challenging macroeconomic and geopolitical environment, central banks remained focused on controlling price pressures while also confronting increasing financial stability concerns. Central banks had to juggle achieving their inflation mandates while using macroprudential tools to keep banking systems liquid, a potentially difficult balancing act, and one that suggested that we may be nearing a peak in policy rates.
Against an environment of relatively tight labor markets, tighter global financial conditions and volatile materials prices, investor anxiety appeared to have increased over the potential that corporate profit margins may be past peak for this cycle. That said, signs that supply chains have generally normalized, coupled with low levels of unemployment across developed markets and hopes that inflation levels have peaked, were supportive factors for the macroeconomic backdrop.
Contributors to Performance
Relative to the MSCI Emerging Markets Index, favorable stock selection within both the financials and energy sectors contributed to the fund's performance. Within the financials sector, the fund’s overweight positions in banking company Komercni banka (Czech Republic) and insurance company Samsung Fire & Marine Insurance (South Korea) strengthened relative results. Within the energy sector, the fund’s overweight positions in oil and gas exploration and production company Petroleo Brasileiro (Brazil)
Management Review - continued
and integrated energy and chemical company China Petroleum & Chemical (China) bolstered relative performance. The stock price of Petroleo Brasileiro advanced as the company benefited from solid operational results, a robust dividend payout and a better-than-expected outlook.
Elsewhere, the fund’s overweight positions in discount store company BIM Birleşik Magazalar (Turkey), compact excavator manufacturer Doosan Bobcat (South Korea), fabless chip design company Novatek Microelectronics (Taiwan), steel producer Gerdau (Brazil), retail company Walmart de Mexico (Mexico) and interactive and online community operator NetEase (China) helped relative results. The stock price of Doosan Bobcat advanced as the company reported robust revenue and operating profit results, driven by solid demand for construction equipment in the US due to a strong order backlog.
Detractors from Performance
Stock selection within the industrials sector detracted from relative performance, led by the fund’s holdings of business process management solutions provider WNS (Holdings)(b) (India). The stock price of WNS Holdings declined as the company reported financial results below consensus due to weaker-than-expected operating earnings.
Stocks in other sectors that dampened relative performance included the fund’s overweight positions in online direct sales company JD.com (China), internet-based multiple services company Tencent (China), telecommunication services provider PT Telekomunikasi Indonesia (Indonesia), dairy products and health drinks producer Inner Mongolia Yili Industrial Group (China) and video game developer NCSoft (South Korea). The stock price of JD.com declined as the company posted a mixed set of financial results that were held back by low revenue visibility growth and weak demand for high-ASP (Average Selling Price) electronics and home appliances. Additionally, not holding shares of computer manufacturer Quanta Computer (Taiwan), and the timing of the fund’s ownership in shares of financial services company Nedbank Group (South Africa), power and energy company Adani Power(h) (India) and credit card issuing company SBI Cards & Payment Services(h) (India), further hindered relative returns.
Respectfully,
Portfolio Manager(s)
Jim Fallon, Matt Krummell, Jonathan Sage, and Jed Stocks
| (b) | Security is not a benchmark constituent. |
| (h) | Security was not held in the portfolio at period end. |
The views expressed in this report are those of the portfolio manager(s) only through the end of the period of the report as stated on the cover and do not necessarily reflect the views of MFS or any other person in the MFS organization. These views are subject to change at any time based on market or other conditions, and MFS disclaims any responsibility to update such views. These views may not be relied upon as investment advice or an indication of trading intent on behalf of any MFS portfolio. References to specific securities are not recommendations of such securities, and may not be representative of any MFS portfolio’s current or future investments.
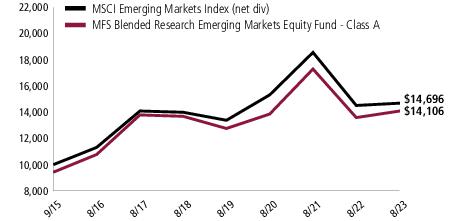
Performance Summary THROUGH 8/31/23
The following chart illustrates a representative class of the fund’s historical performance in comparison to its benchmark(s). Performance results include the deduction of the maximum applicable sales charge and reflect the percentage change in net asset value, including reinvestment of dividends and capital gains distributions. The performance of other share classes will be greater than or less than that of the class depicted below. Benchmarks are unmanaged and may not be invested in directly. Benchmark returns do not reflect sales charges, commissions or expenses. (See Notes to Performance Summary.)
Performance data shown represents past performance and is no guarantee of future results. Investment return and principal value fluctuate so your shares, when sold, may be worth more or less than the original cost; current performance may be lower or higher than quoted. The performance shown does not reflect the deduction of taxes, if any, that a shareholder would pay on fund distributions or the redemption of fund shares.
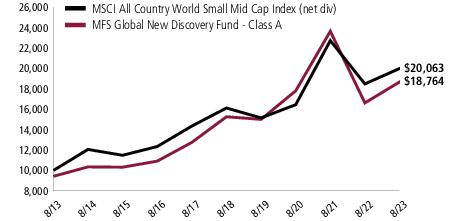
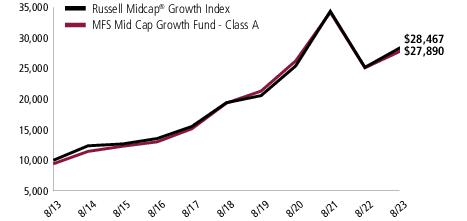
Growth of a Hypothetical $10,000 Investment (t)
Performance Summary - continued
Total Returns through 8/31/23
Average annual without sales charge
| Share Class | Class Inception Date | 1-yr | 5-yr | Life (t) |
| A | 9/15/15 | 3.79% | 0.61% | 5.20% |
| B | 9/15/15 | 3.07% | (0.14)% | 4.42% |
| C | 9/15/15 | 3.08% | (0.15)% | 4.41% |
| I | 9/15/15 | 4.06% | 0.86% | 5.46% |
| R1 | 9/15/15 | 3.82% | 0.24% | 4.66% |
| R2 | 9/15/15 | 3.61% | 0.36% | 4.94% |
| R3 | 9/15/15 | 3.83% | 0.59% | 5.19% |
| R4 | 9/15/15 | 4.05% | 0.85% | 5.46% |
| R6 | 9/15/15 | 4.24% | 0.95% | 5.55% |
Comparative benchmark(s)
| | | | |
| MSCI Emerging Markets Index (net div) (f) | 1.25% | 0.98% | 4.95% |
Average annual with sales charge
| | | | |
A
With Initial Sales Charge (5.75%) | (2.18)% | (0.58)% | 4.42% |
B
With CDSC (Declining over six years from 4% to 0%) (v) | (0.93)% | (0.50)% | 4.42% |
C
With CDSC (1% for 12 months) (v) | 2.08% | (0.15)% | 4.41% |
CDSC – Contingent Deferred Sales Charge.
Class I, R1, R2, R3, R4, and R6 shares do not have a sales charge.
| (f) | Source: FactSet Research Systems Inc. |
| (t) | For the period from the class inception date through the stated period end. (See Notes to Performance Summary.) |
| (v) | Assuming redemption at the end of the applicable period. |
Benchmark Definition(s)
MSCI Emerging Markets Index(e) (net div) – a market capitalization-weighted index that is designed to measure equity market performance in the global emerging markets.
It is not possible to invest directly in an index.
| (e) | Morgan Stanley Capital International (“MSCI”) makes no express or implied warranties or representations and shall have no liability whatsoever with respect to any MSCI data contained herein. The MSCI data may not be further redistributed or used as a basis for other indices or any securities or financial products. This report is not approved, reviewed, or produced by MSCI. |
Notes to Performance Summary
Average annual total return represents the average annual change in value for each share class for the periods presented. Life returns are presented where the share class has less than 10 years of performance history and represent the average annual total return from the class inception date to the stated period end date.
Performance Summary - continued
Performance results reflect any applicable expense subsidies and waivers in effect during the periods shown. Without such subsidies and waivers the fund's performance results would be less favorable. Please see the prospectus and financial statements for complete details.
Performance results do not include adjustments made for financial reporting purposes in accordance with U.S. generally accepted accounting principles and may differ from amounts reported in the financial highlights.
From time to time the fund may receive proceeds from litigation settlements, without which performance would be lower.
Expense Table
Fund expenses borne by the shareholders during the period,
March 1, 2023 through August 31, 2023
As a shareholder of the fund, you incur two types of costs: (1) transaction costs, including sales charges (loads) on certain purchase or redemption payments, and (2) ongoing costs, including management fees; distribution and service (12b-1) fees; and other fund expenses. This example is intended to help you understand your ongoing costs (in dollars) of investing in the fund and to compare these costs with the ongoing costs of investing in other mutual funds.
The example is based on an investment of $1,000 invested at the beginning of the period and held for the entire period March 1, 2023 through August 31, 2023.
Actual Expenses
The first line for each share class in the following table provides information about actual account values and actual expenses. You may use the information in this line, together with the amount you invested, to estimate the expenses that you paid over the period. Simply divide your account value by $1,000 (for example, an $8,600 account value divided by $1,000 = 8.6), then multiply the result by the number in the first line under the heading entitled “Expenses Paid During Period” to estimate the expenses you paid on your account during this period.
Hypothetical Example for Comparison Purposes
The second line for each share class in the following table provides information about hypothetical account values and hypothetical expenses based on the fund’s actual expense ratio and an assumed rate of return of 5% per year before expenses, which is not the fund’s actual return. The hypothetical account values and expenses may not be used to estimate the actual ending account balance or expenses you paid for the period. You may use this information to compare the ongoing costs of investing in the fund and other funds. To do so, compare this 5% hypothetical example with the 5% hypothetical examples that appear in the shareholder reports of the other funds.
Please note that the expenses shown in the table are meant to highlight your ongoing costs only and do not reflect any transactional costs, such as sales charges (loads). Therefore, the second line for each share class in the table is useful in comparing ongoing costs only, and will not help you determine the relative total costs of owning different funds. In addition, if these transactional costs were included, your costs would have been higher.
Expense Table - continued
Share
Class | | Annualized
Expense
Ratio | Beginning
Account Value
3/01/23 | Ending
Account Value
8/31/23 | Expenses
Paid During
Period (p)
3/01/23-8/31/23 |
| A | Actual | 1.24% | $1,000.00 | $1,030.30 | $6.35 |
| Hypothetical (h) | 1.24% | $1,000.00 | $1,018.95 | $6.31 |
| B | Actual | 1.99% | $1,000.00 | $1,027.19 | $10.17 |
| Hypothetical (h) | 1.99% | $1,000.00 | $1,015.17 | $10.11 |
| C | Actual | 1.99% | $1,000.00 | $1,027.14 | $10.17 |
| Hypothetical (h) | 1.99% | $1,000.00 | $1,015.17 | $10.11 |
| I | Actual | 0.99% | $1,000.00 | $1,031.99 | $5.07 |
| Hypothetical (h) | 0.99% | $1,000.00 | $1,020.21 | $5.04 |
| R1 | Actual | 1.24% | $1,000.00 | $1,030.53 | $6.35 |
| Hypothetical (h) | 1.24% | $1,000.00 | $1,018.95 | $6.31 |
| R2 | Actual | 1.49% | $1,000.00 | $1,029.51 | $7.62 |
| Hypothetical (h) | 1.49% | $1,000.00 | $1,017.69 | $7.58 |
| R3 | Actual | 1.24% | $1,000.00 | $1,030.30 | $6.35 |
| Hypothetical (h) | 1.24% | $1,000.00 | $1,018.95 | $6.31 |
| R4 | Actual | 0.99% | $1,000.00 | $1,031.07 | $5.07 |
| Hypothetical (h) | 0.99% | $1,000.00 | $1,020.21 | $5.04 |
| R6 | Actual | 0.87% | $1,000.00 | $1,032.75 | $4.46 |
| Hypothetical (h) | 0.87% | $1,000.00 | $1,020.82 | $4.43 |
| (h) | 5% class return per year before expenses. |
| (p) | “Expenses Paid During Period” are equal to each class’s annualized expense ratio, as shown above, multiplied by the average account value over the period, multiplied by 184/365 (to reflect the one-half year period). Expenses paid do not include any applicable sales charges (loads). If these transaction costs had been included, your costs would have been higher. |
Notes to Expense Table
For the period from March 1, 2023 through August 31, 2023, the distribution fee for Class R1 was not imposed. Had the distribution fee been imposed throughout the entire six month period, the annualized expense ratio, the actual expenses paid during the period, and the hypothetical expenses paid during the period would have been approximately 1.99%, $10.18, and $10.11 for Class R1. See Note 3 in the Notes to Financial Statements for additional information.
Portfolio of Investments
8/31/23
The Portfolio of Investments is a complete list of all securities owned by your fund. It is categorized by broad-based asset classes.
| Issuer | | | Shares/Par | Value ($) |
| Common Stocks – 97.7% |
| Airlines – 2.0% | |
| Copa Holdings S.A., “A” | | 2,843 | $289,133 |
| Grupo Aeroportuario del Centro Norte S.A.B. de C.V. | | 12,199 | 141,204 |
| Grupo Aeroportuario del Sureste, “B” | | 9,478 | 258,250 |
| Saudi Airlines Catering Co. | | 10,053 | 288,940 |
| | | | | $977,527 |
| Alcoholic Beverages – 1.8% | |
| Ambev S.A. | | 95,500 | $266,903 |
| China Resources Beer Holdings Co. Ltd. | | 20,000 | 117,567 |
| Jiangsu Yanghe Brewery JSC Ltd., “A” | | 10,000 | 184,083 |
| Kweichow Moutai Co. Ltd., “A” | | 800 | 202,683 |
| Wuliangye Yibin Co. Ltd., “A” | | 4,800 | 102,654 |
| | | | | $873,890 |
| Automotive – 4.4% | |
| BYD Co. Ltd. | | 13,500 | $423,126 |
| Kia Corp. | | 8,035 | 487,541 |
| Mahindra & Mahindra Ltd. | | 41,021 | 780,618 |
| Maruti Suzuki India Ltd. | | 2,471 | 298,593 |
| Tofas Turk Otomobil Fabrikasi A.S. | | 13,920 | 140,605 |
| | | | | $2,130,483 |
| Biotechnology – 0.5% | |
| Hugel, Inc. (a) | | 2,643 | $224,758 |
| Brokerage & Asset Managers – 0.2% | |
| B3 S.A. - Brasil Bolsa Balcao | | 36,000 | $93,997 |
| Moscow Exchange MICEX-RTS PJSC (a)(u) | | 57,902 | 0 |
| | | | | $93,997 |
| Business Services – 4.5% | |
| HCL Technologies Ltd. | | 31,457 | $445,392 |
| Infosys Ltd. | | 35,122 | 608,988 |
| Multiply Group (a) | | 87,748 | 91,021 |
| Tata Consultancy Services Ltd. | | 18,340 | 743,647 |
| WNS (Holdings) Ltd., ADR (a) | | 4,547 | 297,146 |
| | | | | $2,186,194 |
| Chemicals – 0.5% | |
| UPL Ltd. | | 34,827 | $248,688 |
Portfolio of Investments – continued
| Issuer | | | Shares/Par | Value ($) |
| Common Stocks – continued |
| Computer Software – 0.8% | |
| Kingsoft Corp. | | 91,200 | $363,993 |
| Computer Software - Systems – 7.3% | |
| Hon Hai Precision Industry Co. Ltd. | | 267,000 | $892,892 |
| Lenovo Group Ltd. | | 302,000 | 341,574 |
| Samsung Electronics Co. Ltd. | | 43,531 | 2,203,309 |
| Wistron Corp. | | 26,000 | 95,521 |
| | | | | $3,533,296 |
| Conglomerates – 0.6% | |
| CITIC Pacific Ltd. | | 291,000 | $289,058 |
| Construction – 3.7% | |
| Anhui Conch Cement Co. Ltd. | | 96,500 | $268,249 |
| CEMEX S.A.B. de C.V. (a) | | 630,282 | 497,187 |
| Midea Group Co. Ltd., “A” | | 32,500 | 251,924 |
| Ultratech Cement Ltd. | | 4,544 | 455,433 |
| Zhejiang Supor Co. Ltd., “A” | | 50,700 | 331,106 |
| | | | | $1,803,899 |
| Consumer Products – 0.6% | |
| AmorePacific Corp. | | 2,924 | $296,216 |
| Consumer Services – 0.1% | |
| HeadHunter Group PLC, ADR (a)(u) | | 3,158 | $0 |
| Trip.com Group Ltd., ADR (a) | | 1,673 | 65,766 |
| | | | | $65,766 |
| Electrical Equipment – 0.6% | |
| Voltronic Power Technology Corp. | | 6,000 | $273,186 |
| Electronics – 9.5% | |
| MediaTek, Inc. | | 11,000 | $243,512 |
| Novatek Microelectronics Corp. | | 29,000 | 363,792 |
| Realtek Semiconductor Corp. | | 16,000 | 210,007 |
| Taiwan Semiconductor Manufacturing Co. Ltd. | | 205,000 | 3,533,983 |
| Tripod Technology Corp. | | 36,000 | 213,650 |
| | | | | $4,564,944 |
| Energy - Independent – 0.6% | |
| Hindustan Petroleum Corp. Ltd. (a) | | 40,078 | $120,109 |
| Reliance Industries Ltd. | | 6,533 | 189,946 |
| | | | | $310,055 |
Portfolio of Investments – continued
| Issuer | | | Shares/Par | Value ($) |
| Common Stocks – continued |
| Energy - Integrated – 4.6% | |
| China Petroleum & Chemical Corp. | | 1,338,000 | $783,109 |
| LUKOIL PJSC (a)(u) | | 9,157 | 0 |
| MOL Hungarian Oil & Gas PLC | | 15,086 | 114,205 |
| Oil & Natural Gas Corp. Ltd. | | 86,253 | 181,443 |
| Petrobras | | 109,300 | 762,355 |
| PetroChina Co. Ltd. | | 354,000 | 255,490 |
| Sasol Ltd. | | 7,999 | 103,460 |
| | | | | $2,200,062 |
| Energy - Renewables – 0.3% | |
| Mytilineos S.A. | | 3,904 | $158,495 |
| Engineering - Construction – 0.9% | |
| Doosan Bobcat, Inc. | | 10,627 | $432,557 |
| Food & Beverages – 2.2% | |
| AVI Ltd. | | 60,812 | $233,587 |
| Gruma S.A.B. de C.V. | | 12,605 | 210,420 |
| Inner Mongolia Yili Industrial Group Co. Ltd., “A” | | 75,564 | 269,494 |
| Orion Corp. | | 3,632 | 334,691 |
| | | | | $1,048,192 |
| Food & Drug Stores – 0.9% | |
| BGF Retail Co., Ltd. | | 1,122 | $132,764 |
| BIM Birlesik Magazalar A.S. | | 32,606 | 307,753 |
| | | | | $440,517 |
| Gaming & Lodging – 0.6% | |
| Genting Berhad | | 201,100 | $189,592 |
| OPAP S.A. | | 7,003 | 118,310 |
| | | | | $307,902 |
| Insurance – 4.1% | |
| China Pacific Insurance Co. Ltd. | | 180,200 | $412,681 |
| DB Insurance Co. Ltd. | | 2,085 | 128,878 |
| Meritz Financial Group Inc. | | 2,610 | 108,014 |
| Ping An Insurance Co. of China Ltd., “H” | | 116,000 | 694,460 |
| Samsung Fire & Marine Insurance Co. Ltd. | | 3,298 | 615,061 |
| | | | | $1,959,094 |
| Internet – 6.9% | |
| MakeMyTrip Ltd. (a) | | 2,831 | $112,278 |
| NetEase, Inc. | | 16,500 | 344,629 |
| NetEase, Inc., ADR | | 5,135 | 531,370 |
Portfolio of Investments – continued
| Issuer | | | Shares/Par | Value ($) |
| Common Stocks – continued |
| Internet – continued | |
| Tencent Holdings Ltd. | | 56,300 | $2,333,165 |
| | | | | $3,321,442 |
| Leisure & Toys – 0.2% | |
| NCsoft Corp. | | 532 | $101,228 |
| Machinery & Tools – 0.2% | |
| Globalwafers Co., Ltd. | | 6,000 | $86,477 |
| Major Banks – 2.4% | |
| Bandhan Bank Ltd. | | 112,333 | $311,545 |
| Bank of China Ltd. | | 607,000 | 205,885 |
| Industrial & Commercial Bank of China, “H” | | 175,000 | 80,333 |
| Nedbank Group Ltd. | | 42,368 | 484,164 |
| Woori Financial Group, Inc. | | 11,182 | 100,759 |
| | | | | $1,182,686 |
| Medical & Health Technology & Services – 0.8% | |
| Dr. Sulaiman Al Habib Medical Services Group | | 2,568 | $166,378 |
| OdontoPrev S.A. | | 112,800 | 235,529 |
| | | | | $401,907 |
| Medical Equipment – 0.3% | |
| Shenzhen Mindray Bio-Medical Electronics Co. Ltd., “A” | | 4,300 | $159,255 |
| Metals & Mining – 3.7% | |
| Adaro Energy Indonesia Tbk PT | | 392,600 | $68,827 |
| African Rainbow Minerals Ltd. | | 10,869 | 103,021 |
| Alrosa PJSC (a)(u) | | 143,843 | 0 |
| Hindalco Industries Ltd. | | 20,218 | 112,304 |
| Industries Qatar Q.P.S.C. | | 93,158 | 316,328 |
| Jiangxi Copper Co. Ltd., “H” | | 155,700 | 243,010 |
| Kumba Iron Ore Ltd. | | 7,544 | 165,932 |
| POSCO Holdings, Inc. | | 719 | 314,962 |
| Tata Steel Ltd. | | 97,114 | 144,170 |
| Vale S.A. | | 24,500 | 321,980 |
| | | | | $1,790,534 |
| Natural Gas - Distribution – 0.7% | |
| China Resources Gas Group Ltd. | | 50,900 | $143,113 |
| GAIL (India) Ltd. GDR | | 141,516 | 196,583 |
| | | | | $339,696 |
Portfolio of Investments – continued
| Issuer | | | Shares/Par | Value ($) |
| Common Stocks – continued |
| Other Banks & Diversified Financials – 14.0% | |
| Axis Bank Ltd. | | 15,553 | $182,891 |
| Bangkok Bank Public Co. Ltd. | | 66,800 | 323,341 |
| Bank Negara Indonesia PT | | 426,200 | 256,755 |
| Bank of Communications Co. Ltd. | | 182,000 | 104,201 |
| BNK Financial Group, Inc. | | 34,435 | 177,679 |
| Chailease Holding Co. | | 1,644 | 9,163 |
| China Construction Bank Corp. | | 834,000 | 446,652 |
| China Merchants Bank Co. Ltd. | | 87,000 | 343,902 |
| Credicorp Ltd. | | 2,960 | 418,633 |
| Emirates NBD PJSC | | 105,676 | 470,406 |
| Hana Financial Group, Inc. | | 7,912 | 236,747 |
| HDFC Bank Ltd. | | 20,809 | 394,997 |
| HDFC Bank Ltd., ADR | | 8,001 | 498,542 |
| KB Financial Group, Inc. | | 19,012 | 778,172 |
| Komercní banka A.S. | | 12,983 | 406,234 |
| Kotak Mahindra Bank Ltd. | | 11,103 | 235,877 |
| PT Bank Central Asia Tbk | | 607,600 | 366,036 |
| PT Bank Mandiri Tbk | | 1,181,700 | 467,482 |
| Sberbank of Russia PJSC (a)(u) | | 177,552 | 0 |
| Shriram Transport Finance Co. Ltd. | | 6,245 | 145,462 |
| TCS Group Holding PLC, GDR (a)(u) | | 3,991 | 0 |
| Tisco Financial Group PCL | | 171,200 | 503,565 |
| | | | | $6,766,737 |
| Pharmaceuticals – 2.3% | |
| China Medical System Holdings Ltd. | | 60,000 | $86,607 |
| China Resources Pharmaceutical Group Ltd. | | 196,500 | 131,295 |
| Dong-E-E-Jiao Co., Ltd., “A” | | 11,900 | 84,604 |
| Gedeon Richter PLC | | 9,080 | 227,878 |
| Guangzhou Baiyunshan Pharmaceutical Holdings Co. Ltd., “A” | | 36,200 | 153,535 |
| Kalbe Farma Tbk PT | | 475,400 | 56,655 |
| Shanghai Pharmaceuticals Holding Co. Ltd., “H” | | 62,500 | 102,807 |
| Sinopharm Group Co. Ltd., “H” | | 94,000 | 272,686 |
| | | | | $1,116,067 |
| Precious Metals & Minerals – 0.1% | |
| Gold Fields Ltd., ADR | | 4,037 | $50,987 |
| Real Estate – 1.1% | |
| Aldar Properties PJSC | | 103,363 | $148,023 |
| Emaar Properties PJSC | | 119,343 | 229,394 |
| NEPI Rockcastle N.V. | | 22,844 | 137,100 |
| | | | | $514,517 |
Portfolio of Investments – continued
| Issuer | | | Shares/Par | Value ($) |
| Common Stocks – continued |
| Restaurants – 1.3% | |
| Haidilao International Holding Ltd. | | 28,000 | $76,227 |
| Jollibee Foods Corp. | | 31,140 | 130,346 |
| Yum China Holdings, Inc. | | 8,054 | 432,419 |
| | | | | $638,992 |
| Specialty Chemicals – 0.4% | |
| LG Chem Ltd. | | 321 | $141,587 |
| Sahara International Petrochemical Co. | | 4,956 | 48,164 |
| | | | | $189,751 |
| Specialty Stores – 8.1% | |
| Alibaba Group Holding Ltd. (a) | | 95,400 | $1,097,258 |
| Alibaba Group Holding Ltd., ADR (a) | | 4,257 | 395,475 |
| Cencosud S.A. | | 53,878 | 115,331 |
| JD.com, Inc., “A” | | 12,228 | 200,829 |
| JD.com, Inc., ADR | | 7,236 | 240,308 |
| Meituan, “B” (a) | | 35,060 | 574,472 |
| Multiplan Empreendimentos Imobiliarios S.A. | | 35,224 | 175,976 |
| PDD Holdings, Inc., ADR (a) | | 1,834 | 181,511 |
| Vipshop Holdings Ltd., ADR (a) | | 8,884 | 140,278 |
| Walmart de Mexico S.A.B. de C.V. | | 153,697 | 605,485 |
| Woolworths Ltd. | | 45,375 | 178,232 |
| | | | | $3,905,155 |
| Telecommunications - Wireless – 1.6% | |
| Advanced Info Service Public Co. Ltd. | | 8,900 | $54,898 |
| Ooredoo Q.P.S.C. | | 46,283 | 137,323 |
| PT Telekom Indonesia | | 2,315,000 | 566,970 |
| | | | | $759,191 |
| Telephone Services – 1.2% | |
| Hellenic Telecommunications Organization S.A. | | 38,238 | $572,195 |
| Utilities - Electric Power – 1.1% | |
| CEZ A.S. (Czech Republic) | | 5,637 | $239,999 |
| Energisa S.A., IEU | | 18,800 | 175,014 |
| Huaneng Power International, Inc. (a) | | 200,000 | 99,970 |
| | | | | $514,983 |
| Total Common Stocks (Identified Cost, $43,866,570) | | $47,194,569 |
| Preferred Stocks – 1.3% |
| Computer Software - Systems – 0.3% | | | | |
| Samsung Electronics Co. Ltd. | | 3,302 | $134,903 |
Portfolio of Investments – continued
| Issuer | | | Shares/Par | Value ($) |
| Preferred Stocks – continued |
| Metals & Mining – 1.0% | | | | |
| Gerdau S.A. | | 96,710 | $504,832 |
| Total Preferred Stocks (Identified Cost, $571,144) | | $639,735 |
| Investment Companies (h) – 1.1% |
| Money Market Funds – 1.1% | |
| MFS Institutional Money Market Portfolio, 5.3% (v) (Identified Cost, $519,742) | | | 519,742 | $519,794 |
|
|
| Other Assets, Less Liabilities – (0.1)% | | (56,681) |
| Net Assets – 100.0% | $48,297,417 |
| (a) | Non-income producing security. | | | |
| (h) | An affiliated issuer, which may be considered one in which the fund owns 5% or more of the outstanding voting securities, or a company which is under common control. At period end, the aggregate values of the fund's investments in affiliated issuers and in unaffiliated issuers were $519,794 and $47,834,304, respectively. | | | |
| (u) | The security was valued using significant unobservable inputs and is considered level 3 under the fair value hierarchy. For further information about the fund’s level 3 holdings, please see Note 2 in the Notes to Financial Statements. | | | |
| (v) | Affiliated issuer that is available only to investment companies managed by MFS. The rate quoted for the MFS Institutional Money Market Portfolio is the annualized seven-day yield of the fund at period end. | | | |
| The following abbreviations are used in this report and are defined: |
| ADR | American Depositary Receipt |
| GDR | Global Depositary Receipt |
| IEU | International Equity Unit |
| PCL | Public Company Limited |
See Notes to Financial Statements
Financial Statements
Statement of Assets and Liabilities
At 8/31/23
This statement represents your fund’s balance sheet, which details the assets and liabilities comprising the total value of the fund.
| Assets | |
| Investments in unaffiliated issuers, at value (identified cost, $44,437,714) | $47,834,304 |
| Investments in affiliated issuers, at value (identified cost, $519,742) | 519,794 |
| Cash | 636 |
| Foreign currency, at value (identified cost, $12,667) | 12,681 |
| Receivables for | |
| Fund shares sold | 34,741 |
| Dividends | 102,178 |
| Receivable from investment adviser | 63,923 |
| Other assets | 82 |
| Total assets | $48,568,339 |
| Liabilities | |
| Payables for | |
| Fund shares reacquired | $414 |
| Payable to affiliates | |
| Administrative services fee | 94 |
| Shareholder servicing costs | 10,100 |
| Distribution and service fees | 89 |
| Payable for independent Trustees' compensation | 1 |
| Deferred foreign capital gains tax expense payable | 58,951 |
| Payable for custodian fee | 102,261 |
| Payable for audit and tax fees | 88,276 |
| Accrued expenses and other liabilities | 10,736 |
| Total liabilities | $270,922 |
| Net assets | $48,297,417 |
| Net assets consist of | |
| Paid-in capital | $47,474,657 |
| Total distributable earnings (loss) | 822,760 |
| Net assets | $48,297,417 |
| Shares of beneficial interest outstanding | 3,934,103 |
Statement of Assets and Liabilities – continued
| | Net assets | Shares
outstanding | Net asset value
per share (a) |
| Class A | $4,331,442 | 353,770 | $12.24 |
| Class B | 256,167 | 21,195 | 12.09 |
| Class C | 176,769 | 14,599 | 12.11 |
| Class I | 20,792,895 | 1,695,826 | 12.26 |
| Class R1 | 71,850 | 5,914 | 12.15 |
| Class R2 | 73,378 | 6,010 | 12.21 |
| Class R3 | 119,336 | 9,747 | 12.24 |
| Class R4 | 112,954 | 9,195 | 12.28 |
| Class R6 | 22,362,626 | 1,817,847 | 12.30 |
| (a) | Maximum offering price per share was equal to the net asset value per share for all share classes, except for Class A, for which the maximum offering price per share was $12.99 [100 / 94.25 x $12.24]. On sales of $50,000 or more, the maximum offering price of Class A shares is reduced. A contingent deferred sales charge may be imposed on redemptions of Class A, Class B, and Class C shares. Redemption price per share was equal to the net asset value per share for Classes I, R1, R2, R3, R4, and R6. |
See Notes to Financial Statements
Financial Statements
Statement of Operations
Year ended 8/31/23
This statement describes how much your fund earned in investment income and accrued in expenses. It also describes any gains and/or losses generated by fund operations.
| Net investment income (loss) | |
| Income | |
| Dividends | $1,948,296 |
| Dividends from affiliated issuers | 21,050 |
| Other | 8,794 |
| Income on securities loaned | 1 |
| Foreign taxes withheld | (200,497) |
| Total investment income | $1,777,644 |
| Expenses | |
| Management fee | $335,986 |
| Distribution and service fees | 16,120 |
| Shareholder servicing costs | 37,775 |
| Administrative services fee | 17,500 |
| Independent Trustees' compensation | 3,017 |
| Custodian fee | 255,832 |
| Shareholder communications | 9,279 |
| Audit and tax fees | 140,599 |
| Legal fees | 286 |
| Registration fees | 124,442 |
| Miscellaneous | 35,872 |
| Total expenses | $976,708 |
| Reduction of expenses by investment adviser and distributor | (538,786) |
| Net expenses | $437,922 |
| Net investment income (loss) | $1,339,722 |
| Realized and unrealized gain (loss) |
| Realized gain (loss) (identified cost basis) | |
| Unaffiliated issuers (net of $4,230 foreign capital gains tax) | $(2,148,331) |
| Affiliated issuers | 178 |
| Foreign currency | (21,312) |
| Net realized gain (loss) | $(2,169,465) |
| Change in unrealized appreciation or depreciation | |
| Unaffiliated issuers (net of $22,371 increase in deferred foreign capital gains tax) | $3,206,221 |
| Affiliated issuers | 52 |
| Translation of assets and liabilities in foreign currencies | (3,157) |
| Net unrealized gain (loss) | $3,203,116 |
| Net realized and unrealized gain (loss) | $1,033,651 |
| Change in net assets from operations | $2,373,373 |
See Notes to Financial Statements
Financial Statements
Statements of Changes in Net Assets
These statements describe the increases and/or decreases in net assets resulting from operations, any distributions, and any shareholder transactions.
| | Year ended |
| | 8/31/23 | 8/31/22 |
| Change in net assets | | |
| From operations | | |
| Net investment income (loss) | $1,339,722 | $1,448,957 |
| Net realized gain (loss) | (2,169,465) | 344,817 |
| Net unrealized gain (loss) | 3,203,116 | (13,218,517) |
| Change in net assets from operations | $2,373,373 | $(11,424,743) |
| Total distributions to shareholders | $(1,376,015) | $(2,127,297) |
| Change in net assets from fund share transactions | $7,306,790 | $(6,641,570) |
| Total change in net assets | $8,304,148 | $(20,193,610) |
| Net assets | | |
| At beginning of period | 39,993,269 | 60,186,879 |
| At end of period | $48,297,417 | $39,993,269 |
See Notes to Financial Statements
Financial Statements
Financial Highlights
The financial highlights table is intended to help you understand the fund's financial performance for the past 5 years. Certain information reflects financial results for a single fund share. The total returns in the table represent the rate that an investor would have earned (or lost) on an investment in the fund share class (assuming reinvestment of all distributions) held for the entire period.
| Class A | Year ended |
| | 8/31/23 | 8/31/22 | 8/31/21 | 8/31/20 | 8/31/19 |
| Net asset value, beginning of period | $12.11 | $15.96 | $12.97 | $12.12 | $13.66 |
| Income (loss) from investment operations |
| Net investment income (loss) (d) | $0.32 | $0.37 | $0.23 | $0.24 | $0.25 |
| Net realized and unrealized gain (loss) | 0.12 | (3.70) | 2.96 | 0.81 | (1.20) |
| Total from investment operations | $0.44 | $(3.33) | $3.19 | $1.05 | $(0.95) |
| Less distributions declared to shareholders |
| From net investment income | $(0.31) | $(0.25) | $(0.20) | $(0.20) | $(0.22) |
| From net realized gain | — | (0.27) | — | — | (0.37) |
| Total distributions declared to shareholders | $(0.31) | $(0.52) | $(0.20) | $(0.20) | $(0.59) |
| Net asset value, end of period (x) | $12.24 | $12.11 | $15.96 | $12.97 | $12.12 |
| Total return (%) (r)(s)(t)(x) | 3.79 | (21.42) | 24.78 | 8.63 | (6.77) |
Ratios (%) (to average net assets)
and Supplemental data: |
| Expenses before expense reductions | 2.44 | 1.94 | 1.82 | 2.39 | 2.95 |
| Expenses after expense reductions | 1.24 | 1.24 | 1.24 | 1.24 | 1.24 |
| Net investment income (loss) | 2.69 | 2.62 | 1.50 | 1.98 | 2.01 |
| Portfolio turnover | 63 | 58 | 60 | 63 | 64 |
| Net assets at end of period (000 omitted) | $4,331 | $4,797 | $7,869 | $5,702 | $5,174 |
See Notes to Financial Statements
Financial Highlights – continued
| Class B | Year ended |
| | 8/31/23 | 8/31/22 | 8/31/21 | 8/31/20 | 8/31/19 |
| Net asset value, beginning of period | $11.96 | $15.75 | $12.81 | $11.99 | $13.54 |
| Income (loss) from investment operations |
| Net investment income (loss) (d) | $0.23 | $0.28 | $0.11 | $0.15 | $0.21 |
| Net realized and unrealized gain (loss) | 0.13 | (3.67) | 2.93 | 0.80 | (1.25) |
| Total from investment operations | $0.36 | $(3.39) | $3.04 | $0.95 | $(1.04) |
| Less distributions declared to shareholders |
| From net investment income | $(0.23) | $(0.13) | $(0.10) | $(0.13) | $(0.14) |
| From net realized gain | — | (0.27) | — | — | (0.37) |
| Total distributions declared to shareholders | $(0.23) | $(0.40) | $(0.10) | $(0.13) | $(0.51) |
| Net asset value, end of period (x) | $12.09 | $11.96 | $15.75 | $12.81 | $11.99 |
| Total return (%) (r)(s)(t)(x) | 3.07 | (21.98) | 23.77 | 7.88 | (7.51) |
Ratios (%) (to average net assets)
and Supplemental data: |
| Expenses before expense reductions | 3.18 | 2.71 | 2.58 | 3.19 | 3.70 |
| Expenses after expense reductions | 1.99 | 1.99 | 1.99 | 1.99 | 1.99 |
| Net investment income (loss) | 1.96 | 2.02 | 0.72 | 1.22 | 1.63 |
| Portfolio turnover | 63 | 58 | 60 | 63 | 64 |
| Net assets at end of period (000 omitted) | $256 | $276 | $403 | $312 | $391 |
| Class C | Year ended |
| | 8/31/23 | 8/31/22 | 8/31/21 | 8/31/20 | 8/31/19 |
| Net asset value, beginning of period | $11.95 | $15.72 | $12.78 | $11.95 | $13.50 |
| Income (loss) from investment operations |
| Net investment income (loss) (d) | $0.23 | $0.26 | $0.11 | $0.15 | $0.16 |
| Net realized and unrealized gain (loss) | 0.13 | (3.65) | 2.93 | 0.78 | (1.19) |
| Total from investment operations | $0.36 | $(3.39) | $3.04 | $0.93 | $(1.03) |
| Less distributions declared to shareholders |
| From net investment income | $(0.20) | $(0.11) | $(0.10) | $(0.10) | $(0.15) |
| From net realized gain | — | (0.27) | — | — | (0.37) |
| Total distributions declared to shareholders | $(0.20) | $(0.38) | $(0.10) | $(0.10) | $(0.52) |
| Net asset value, end of period (x) | $12.11 | $11.95 | $15.72 | $12.78 | $11.95 |
| Total return (%) (r)(s)(t)(x) | 3.08 | (22.02) | 23.87 | 7.78 | (7.51) |
Ratios (%) (to average net assets)
and Supplemental data: |
| Expenses before expense reductions | 3.18 | 2.69 | 2.58 | 3.19 | 3.70 |
| Expenses after expense reductions | 1.99 | 1.99 | 1.99 | 1.99 | 1.99 |
| Net investment income (loss) | 1.95 | 1.85 | 0.72 | 1.22 | 1.31 |
| Portfolio turnover | 63 | 58 | 60 | 63 | 64 |
| Net assets at end of period (000 omitted) | $177 | $224 | $410 | $344 | $420 |
See Notes to Financial Statements
Financial Highlights – continued
| Class I | Year ended |
| | 8/31/23 | 8/31/22 | 8/31/21 | 8/31/20 | 8/31/19 |
| Net asset value, beginning of period | $12.14 | $16.00 | $13.00 | $12.16 | $13.71 |
| Income (loss) from investment operations |
| Net investment income (loss) (d) | $0.36 | $0.39 | $0.28 | $0.29 | $0.29 |
| Net realized and unrealized gain (loss) | 0.12 | (3.69) | 2.96 | 0.80 | (1.22) |
| Total from investment operations | $0.48 | $(3.30) | $3.24 | $1.09 | $(0.93) |
| Less distributions declared to shareholders |
| From net investment income | $(0.36) | $(0.29) | $(0.24) | $(0.25) | $(0.25) |
| From net realized gain | — | (0.27) | — | — | (0.37) |
| Total distributions declared to shareholders | $(0.36) | $(0.56) | $(0.24) | $(0.25) | $(0.62) |
| Net asset value, end of period (x) | $12.26 | $12.14 | $16.00 | $13.00 | $12.16 |
| Total return (%) (r)(s)(t)(x) | 4.06 | (21.21) | 25.10 | 8.89 | (6.55) |
Ratios (%) (to average net assets)
and Supplemental data: |
| Expenses before expense reductions | 2.19 | 1.67 | 1.57 | 1.91 | 2.70 |
| Expenses after expense reductions | 0.99 | 0.99 | 0.99 | 0.99 | 0.99 |
| Net investment income (loss) | 2.98 | 2.77 | 1.83 | 2.46 | 2.26 |
| Portfolio turnover | 63 | 58 | 60 | 63 | 64 |
| Net assets at end of period (000 omitted) | $20,793 | $17,811 | $33,247 | $21,273 | $1,811 |
| Class R1 | Year ended |
| | 8/31/23 | 8/31/22 | 8/31/21 | 8/31/20 | 8/31/19 |
| Net asset value, beginning of period | $12.03 | $15.84 | $12.84 | $12.01 | $13.57 |
| Income (loss) from investment operations |
| Net investment income (loss) (d) | $0.32 | $0.39 | $0.17 | $0.15 | $0.17 |
| Net realized and unrealized gain (loss) | 0.12 | (3.70) | 2.94 | 0.80 | (1.20) |
| Total from investment operations | $0.44 | $(3.31) | $3.11 | $0.95 | $(1.03) |
| Less distributions declared to shareholders |
| From net investment income | $(0.32) | $(0.23) | $(0.11) | $(0.12) | $(0.16) |
| From net realized gain | — | (0.27) | — | — | (0.37) |
| Total distributions declared to shareholders | $(0.32) | $(0.50) | $(0.11) | $(0.12) | $(0.53) |
| Net asset value, end of period (x) | $12.15 | $12.03 | $15.84 | $12.84 | $12.01 |
| Total return (%) (r)(s)(t)(x) | 3.82 | (21.43) | 24.32 | 7.84 | (7.47) |
Ratios (%) (to average net assets)
and Supplemental data: |
| Expenses before expense reductions | 2.44 | 1.96 | 2.18 | 3.14 | 3.70 |
| Expenses after expense reductions | 1.24 | 1.24 | 1.59 | 1.99 | 1.99 |
| Net investment income (loss) | 2.72 | 2.82 | 1.11 | 1.25 | 1.32 |
| Portfolio turnover | 63 | 58 | 60 | 63 | 64 |
| Net assets at end of period (000 omitted) | $72 | $69 | $88 | $71 | $66 |
See Notes to Financial Statements
Financial Highlights – continued
| Class R2 | Year ended |
| | 8/31/23 | 8/31/22 | 8/31/21 | 8/31/20 | 8/31/19 |
| Net asset value, beginning of period | $12.08 | $15.93 | $12.95 | $12.11 | $13.66 |
| Income (loss) from investment operations |
| Net investment income (loss) (d) | $0.30 | $0.36 | $0.18 | $0.21 | $0.23 |
| Net realized and unrealized gain (loss) | 0.12 | (3.73) | 2.97 | 0.81 | (1.20) |
| Total from investment operations | $0.42 | $(3.37) | $3.15 | $1.02 | $(0.97) |
| Less distributions declared to shareholders |
| From net investment income | $(0.29) | $(0.21) | $(0.17) | $(0.18) | $(0.21) |
| From net realized gain | — | (0.27) | — | — | (0.37) |
| Total distributions declared to shareholders | $(0.29) | $(0.48) | $(0.17) | $(0.18) | $(0.58) |
| Net asset value, end of period (x) | $12.21 | $12.08 | $15.93 | $12.95 | $12.11 |
| Total return (%) (r)(s)(t)(x) | 3.61 | (21.67) | 24.47 | 8.35 | (6.97) |
Ratios (%) (to average net assets)
and Supplemental data: |
| Expenses before expense reductions | 2.69 | 2.22 | 2.08 | 2.64 | 3.20 |
| Expenses after expense reductions | 1.49 | 1.49 | 1.49 | 1.49 | 1.49 |
| Net investment income (loss) | 2.48 | 2.57 | 1.21 | 1.75 | 1.82 |
| Portfolio turnover | 63 | 58 | 60 | 63 | 64 |
| Net assets at end of period (000 omitted) | $73 | $71 | $90 | $73 | $67 |
| Class R3 | Year ended |
| | 8/31/23 | 8/31/22 | 8/31/21 | 8/31/20 | 8/31/19 |
| Net asset value, beginning of period | $12.12 | $15.98 | $12.98 | $12.14 | $13.69 |
| Income (loss) from investment operations |
| Net investment income (loss) (d) | $0.32 | $0.41 | $0.23 | $0.21 | $0.24 |
| Net realized and unrealized gain (loss) | 0.13 | (3.75) | 2.97 | 0.83 | (1.19) |
| Total from investment operations | $0.45 | $(3.34) | $3.20 | $1.04 | $(0.95) |
| Less distributions declared to shareholders |
| From net investment income | $(0.33) | $(0.25) | $(0.20) | $(0.20) | $(0.23) |
| From net realized gain | — | (0.27) | — | — | (0.37) |
| Total distributions declared to shareholders | $(0.33) | $(0.52) | $(0.20) | $(0.20) | $(0.60) |
| Net asset value, end of period (x) | $12.24 | $12.12 | $15.98 | $12.98 | $12.14 |
| Total return (%) (r)(s)(t)(x) | 3.83 | (21.45) | 24.80 | 8.52 | (6.75) |
Ratios (%) (to average net assets)
and Supplemental data: |
| Expenses before expense reductions | 2.43 | 1.99 | 1.82 | 2.43 | 2.95 |
| Expenses after expense reductions | 1.24 | 1.24 | 1.24 | 1.24 | 1.24 |
| Net investment income (loss) | 2.68 | 2.96 | 1.50 | 1.71 | 1.89 |
| Portfolio turnover | 63 | 58 | 60 | 63 | 64 |
| Net assets at end of period (000 omitted) | $119 | $118 | $107 | $81 | $71 |
See Notes to Financial Statements
Financial Highlights – continued
| Class R4 | Year ended |
| | 8/31/23 | 8/31/22 | 8/31/21 | 8/31/20 | 8/31/19 |
| Net asset value, beginning of period | $12.16 | $16.03 | $13.02 | $12.17 | $13.72 |
| Income (loss) from investment operations |
| Net investment income (loss) (d) | $0.36 | $0.43 | $0.26 | $0.28 | $0.30 |
| Net realized and unrealized gain (loss) | 0.12 | (3.74) | 2.98 | 0.81 | (1.23) |
| Total from investment operations | $0.48 | $(3.31) | $3.24 | $1.09 | $(0.93) |
| Less distributions declared to shareholders |
| From net investment income | $(0.36) | $(0.29) | $(0.23) | $(0.24) | $(0.25) |
| From net realized gain | — | (0.27) | — | — | (0.37) |
| Total distributions declared to shareholders | $(0.36) | $(0.56) | $(0.23) | $(0.24) | $(0.62) |
| Net asset value, end of period (x) | $12.28 | $12.16 | $16.03 | $13.02 | $12.17 |
| Total return (%) (r)(s)(t)(x) | 4.05 | (21.24) | 25.10 | 8.90 | (6.55) |
Ratios (%) (to average net assets)
and Supplemental data: |
| Expenses before expense reductions | 2.19 | 1.72 | 1.58 | 2.14 | 2.70 |
| Expenses after expense reductions | 0.99 | 0.99 | 0.99 | 0.99 | 0.99 |
| Net investment income (loss) | 2.97 | 3.12 | 1.70 | 2.25 | 2.36 |
| Portfolio turnover | 63 | 58 | 60 | 63 | 64 |
| Net assets at end of period (000 omitted) | $113 | $104 | $118 | $97 | $85 |
| Class R6 | Year ended |
| | 8/31/23 | 8/31/22 | 8/31/21 | 8/31/20 | 8/31/19 |
| Net asset value, beginning of period | $12.17 | $16.04 | $13.03 | $12.19 | $13.73 |
| Income (loss) from investment operations |
| Net investment income (loss) (d) | $0.37 | $0.45 | $0.27 | $0.29 | $0.31 |
| Net realized and unrealized gain (loss) | 0.13 | (3.75) | 2.98 | 0.81 | (1.22) |
| Total from investment operations | $0.50 | $(3.30) | $3.25 | $1.10 | $(0.91) |
| Less distributions declared to shareholders |
| From net investment income | $(0.37) | $(0.30) | $(0.24) | $(0.26) | $(0.26) |
| From net realized gain | — | (0.27) | — | — | (0.37) |
| Total distributions declared to shareholders | $(0.37) | $(0.57) | $(0.24) | $(0.26) | $(0.63) |
| Net asset value, end of period (x) | $12.30 | $12.17 | $16.04 | $13.03 | $12.19 |
| Total return (%) (r)(s)(t)(x) | 4.24 | (21.18) | 25.17 | 8.91 | (6.40) |
Ratios (%) (to average net assets)
and Supplemental data: |
| Expenses before expense reductions | 2.08 | 1.64 | 1.51 | 2.05 | 2.58 |
| Expenses after expense reductions | 0.88 | 0.90 | 0.93 | 0.92 | 0.87 |
| Net investment income (loss) | 3.08 | 3.23 | 1.79 | 2.36 | 2.44 |
| Portfolio turnover | 63 | 58 | 60 | 63 | 64 |
| Net assets at end of period (000 omitted) | $22,363 | $16,523 | $17,855 | $14,422 | $12,590 |
See Notes to Financial Statements
Financial Highlights – continued
| (d) | Per share data is based on average shares outstanding. |
| (r) | Certain expenses have been reduced without which performance would have been lower. |
| (s) | From time to time the fund may receive proceeds from litigation settlements, without which performance would be lower. |
| (t) | Total returns do not include any applicable sales charges. |
| (x) | The net asset values and total returns have been calculated on net assets which include adjustments made in accordance with U.S. generally accepted accounting principles required at period end for financial reporting purposes. |
See Notes to Financial Statements
Notes to Financial Statements
(1) Business and Organization
MFS Blended Research Emerging Markets Equity Fund (the fund) is a diversified series of MFS Series Trust IV (the trust). The trust is organized as a Massachusetts business trust and is registered under the Investment Company Act of 1940, as amended, as an open-end management investment company.
The fund is an investment company and accordingly follows the investment company accounting and reporting guidance of the Financial Accounting Standards Board (FASB) Accounting Standards Codification Topic 946 Financial Services - Investment Companies.
(2) Significant Accounting Policies
General — The preparation of financial statements in conformity with U.S. generally accepted accounting principles requires management to make estimates and assumptions that affect the reported amounts of assets and liabilities, and disclosure of contingent assets and liabilities at the date of the financial statements and the reported amounts of increases and decreases in net assets from operations during the reporting period. Actual results could differ from those estimates. In the preparation of these financial statements, management has evaluated subsequent events occurring after the date of the fund’s Statement of Assets and Liabilities through the date that the financial statements were issued. The fund invests in foreign securities, including securities of emerging market issuers. Investments in foreign securities are vulnerable to the effects of changes in the relative values of the local currency and the U.S. dollar and to the effects of changes in each country’s market, economic, industrial, political, regulatory, geopolitical, environmental, public health, and other conditions. Investments in emerging markets can involve additional and greater risks than the risks associated with investments in developed foreign markets. Emerging markets can have less developed markets, greater custody and operational risk, less developed legal, regulatory, accounting, and auditing systems, greater government involvement in the economy, greater risk of new or inconsistent government treatment of or restrictions on issuers and instruments, and greater political, social, and economic instability than developed markets.
Balance Sheet Offsetting — The fund's accounting policy with respect to balance sheet offsetting is that, absent an event of default by the counterparty or a termination of the agreement, the International Swaps and Derivatives Association (ISDA) Master Agreement, or similar agreement, does not result in an offset of reported amounts of financial assets and financial liabilities in the Statement of Assets and Liabilities across transactions between the fund and the applicable counterparty. The fund's right to setoff may be restricted or prohibited by the bankruptcy or insolvency laws of the particular jurisdiction to which a specific master netting agreement counterparty is subject. Balance sheet offsetting disclosures, to the extent applicable to the fund, have been included in the fund’s Significant Accounting Policies note under the captions for each of the fund’s in-scope financial instruments and transactions.
Investment Valuations — Subject to its oversight, the fund's Board of Trustees has delegated primary responsibility for determining or causing to be determined the value of the fund’s investments to MFS as the fund's adviser, pursuant to the fund’s valuation policy and procedures which have been adopted by the adviser and approved by the Board. In accordance with Rule 2a-5 under the Investment Company Act of 1940, the Board of Trustees designated the adviser as the “valuation designee” of the fund. If the
Notes to Financial Statements - continued
adviser, as valuation designee, determines that reliable market quotations are not readily available for an investment, the investment is valued at fair value as determined in good faith by the adviser in accordance with the adviser’s fair valuation policy and procedures.
Under the fund's valuation policy and procedures, equity securities, including restricted equity securities, are generally valued at the last sale or official closing price on their primary market or exchange as provided by a third-party pricing service. Equity securities, for which there were no sales reported that day, are generally valued at the last quoted daily bid quotation on their primary market or exchange as provided by a third-party pricing service. Short-term instruments with a maturity at issuance of 60 days or less may be valued at amortized cost, which approximates market value.
Open-end investment companies are generally valued at net asset value per share. The values of foreign securities and other assets and liabilities expressed in foreign currencies are converted to U.S. dollars using the mean of bid and asked prices for rates provided by a third-party pricing service.
Under the fund’s valuation policy and procedures, market quotations are not considered to be readily available for debt instruments, floating rate loans, and many types of derivatives. These investments are generally valued at fair value based on information from third-party pricing services or otherwise determined by the adviser in accordance with the adviser’s fair valuation policy and procedures. Securities and other assets generally valued on the basis of information from a third-party pricing service may also be valued at a broker/dealer bid quotation. In determining values, third-party pricing services can utilize both transaction data and market information such as yield, quality, coupon rate, maturity, type of issue, trading characteristics, spreads and other market data. An investment may also be valued at fair value if the adviser determines that the investment’s value has been materially affected by events occurring after the close of the exchange or market on which the investment is principally traded (such as foreign exchange or market) and prior to the determination of the fund’s net asset value, or after the halt of trading of a specific security where trading does not resume prior to the close of the exchange or market on which the security is principally traded. Events that occur after foreign markets close (such as developments in foreign markets and significant movements in the U.S. markets) and prior to the determination of the fund’s net asset value may be deemed to have a material effect on the value of securities traded in foreign markets. Accordingly, the fund’s foreign equity securities may often be valued at fair value. The adviser generally relies on third-party pricing services or other information (such as the correlation with price movements of similar securities in the same or other markets; the type, cost and investment characteristics of the security; the business and financial condition of the issuer; and trading and other market data) to assist in determining whether to fair value and at what value to fair value an investment. The value of an investment for purposes of calculating the fund’s net asset value can differ depending on the source and method used to determine value. When fair valuation is used, the value of an investment used to determine the fund’s net asset value may differ from quoted or published prices for the same investment. There can be no assurance that the fund could obtain the fair value assigned to an investment if it were to sell the investment at the same time at which the fund determines its net asset value per share.
Various inputs are used in determining the value of the fund's assets or liabilities. These inputs are categorized into three broad levels. In certain cases, the inputs used to measure fair value may fall into different levels of the fair value hierarchy. In such cases,
Notes to Financial Statements - continued
an investment's level within the fair value hierarchy is based on the lowest level of input that is significant to the fair value measurement. The fund's assessment of the significance of a particular input to the fair value measurement in its entirety requires judgment, and considers factors specific to the investment. Level 1 includes unadjusted quoted prices in active markets for identical assets or liabilities. Level 2 includes other significant observable market-based inputs (including quoted prices for similar securities, interest rates, prepayment speed, and credit risk). Level 3 includes significant unobservable inputs, which may include the adviser's own assumptions in determining the fair value of investments. The following is a summary of the levels used as of August 31, 2023 in valuing the fund's assets and liabilities:
| Financial Instruments | Level 1 | Level 2 | Level 3 | Total |
| Equity Securities: | | | | |
| China | $14,562,813 | $— | $— | $14,562,813 |
| South Korea | 6,949,826 | — | — | 6,949,826 |
| India | 6,704,652 | — | — | 6,704,652 |
| Taiwan | 5,922,183 | — | — | 5,922,183 |
| Brazil | 2,536,586 | — | — | 2,536,586 |
| Indonesia | 1,782,725 | — | — | 1,782,725 |
| Mexico | 1,712,546 | — | — | 1,712,546 |
| South Africa | 1,456,483 | — | — | 1,456,483 |
| United Arab Emirates | 938,844 | — | — | 938,844 |
| Other Countries | 4,196,250 | 1,071,396 | 0 | 5,267,646 |
| Mutual Funds | 519,794 | — | — | 519,794 |
| Total | $47,282,702 | $1,071,396 | $0 | $48,354,098 |
For further information regarding security characteristics, see the Portfolio of Investments. At August 31, 2023, the fund held six level 3 securities valued at $0, which were also held and valued at $0 at August 31, 2022.
Foreign Currency Translation — Purchases and sales of foreign investments, income, and expenses are converted into U.S. dollars based upon currency exchange rates prevailing on the respective dates of such transactions or on the reporting date for foreign denominated receivables and payables. Gains and losses attributable to foreign currency exchange rates on sales of securities are recorded for financial statement purposes as net realized gains and losses on investments. Gains and losses attributable to foreign exchange rate movements on receivables, payables, income and expenses are recorded for financial statement purposes as foreign currency transaction gains and losses. That portion of both realized and unrealized gains and losses on investments that results from fluctuations in foreign currency exchange rates is not separately disclosed.
Security Loans — Under its Securities Lending Agency Agreement with the fund, State Street Bank and Trust Company, as lending agent, loans the securities of the fund to certain qualified institutions (the “Borrowers”) approved by the fund. Security loans can be terminated at the discretion of either the lending agent or the fund and the related securities must be returned within the earlier of the standard trade settlement period for such securities or within three business days. The loans are collateralized by cash and/or U.S. Treasury and federal agency obligations in an amount typically at least equal to the market value of the securities loaned. On loans collateralized by cash, the cash collateral is invested in a money market fund. The market value of the loaned
Notes to Financial Statements - continued
securities is determined at the close of business of the fund and any additional required collateral is delivered to the fund on the next business day. The lending agent provides the fund with indemnification against Borrower default. In the event of Borrower default, the lending agent will, for the benefit of the fund, either purchase securities identical to those loaned or, when such purchase is commercially impracticable, pay the fund the market value of the loaned securities. In return, the lending agent assumes the fund's rights to the related collateral. If the collateral value is less than the cost to purchase identical securities, the lending agent is responsible for the shortfall, but only to the extent that such shortfall is not due to a decline in collateral value resulting from collateral reinvestment for which the fund bears the risk of loss. A portion of the income generated upon investment of the collateral is remitted to the Borrowers, and the remainder is allocated between the fund and the lending agent. On loans collateralized by U.S. Treasury and/or federal agency obligations, a fee is received from the Borrower, and is allocated between the fund and the lending agent. Income from securities lending is separately reported in the Statement of Operations. The dividend and interest income earned on the securities loaned is accounted for in the same manner as other dividend and interest income. At August 31, 2023, there were no securities on loan or collateral outstanding.
Indemnifications — Under the fund's organizational documents, its officers and Trustees may be indemnified against certain liabilities and expenses arising out of the performance of their duties to the fund. Additionally, in the normal course of business, the fund enters into agreements with service providers that may contain indemnification clauses. The fund's maximum exposure under these agreements is unknown as this would involve future claims that may be made against the fund that have not yet occurred.
Investment Transactions and Income — Dividends received in cash are recorded on the ex-dividend date. Certain dividends from foreign securities will be recorded when the fund is informed of the dividend if such information is obtained subsequent to the ex-dividend date. Dividend payments received in additional securities are recorded on the ex-dividend date in an amount equal to the value of the security on such date.
The fund may receive proceeds from litigation settlements. Any proceeds received from litigation involving portfolio holdings are reflected in the Statement of Operations in realized gain/loss if the security has been disposed of by the fund or in unrealized gain/loss if the security is still held by the fund. Any other proceeds from litigation not related to portfolio holdings are reflected as other income in the Statement of Operations.
Investment transactions are recorded on the trade date. In determining the net gain or loss on securities sold, the cost of securities is determined on the identified cost basis.
Tax Matters and Distributions — The fund intends to qualify as a regulated investment company, as defined under Subchapter M of the Internal Revenue Code, and to distribute all of its taxable income, including realized capital gains. As a result, no provision for federal income tax is required. The fund’s federal tax returns, when filed, will remain subject to examination by the Internal Revenue Service for a three year period. Management has analyzed the fund’s tax positions taken on federal and state tax returns for all open tax years and does not believe that there are any uncertain tax positions that require recognition of a tax liability. Foreign taxes, if any, have been accrued by the fund in the accompanying financial statements in accordance with the
Notes to Financial Statements - continued
applicable foreign tax law. Foreign income taxes may be withheld by certain countries in which the fund invests. Additionally, capital gains realized by the fund on securities issued in or by certain foreign countries may be subject to capital gains tax imposed by those countries.
Distributions to shareholders are recorded on the ex-dividend date. Income and capital gain distributions are determined in accordance with income tax regulations, which may differ from U.S. generally accepted accounting principles. Certain capital accounts in the financial statements are periodically adjusted for permanent differences in order to reflect their tax character. These adjustments have no impact on net assets or net asset value per share. Temporary differences which arise from recognizing certain items of income, expense, gain or loss in different periods for financial statement and tax purposes will reverse at some time in the future.
Book/tax differences primarily relate to passive foreign investment companies and wash sale loss deferrals.
The tax character of distributions declared to shareholders for the last two fiscal years is as follows:
| | Year ended
8/31/23 | Year ended
8/31/22 |
| Ordinary income (including any short-term capital gains) | $1,376,015 | $1,355,091 |
| Long-term capital gains | — | 772,206 |
| Total distributions | $1,376,015 | $2,127,297 |
The federal tax cost and the tax basis components of distributable earnings were as follows:
| As of 8/31/23 | |
| Cost of investments | $46,978,293 |
| Gross appreciation | 5,652,735 |
| Gross depreciation | (4,276,930) |
| Net unrealized appreciation (depreciation) | $1,375,805 |
| Undistributed ordinary income | 1,258,969 |
| Capital loss carryforwards | (1,751,070) |
| Other temporary differences | (60,944) |
| Total distributable earnings (loss) | $822,760 |
As of August 31, 2023, the fund had capital loss carryforwards available to offset future realized gains. These net capital losses may be carried forward indefinitely and their character is retained as short-term and/or long-term losses. Such losses are characterized as follows:
Multiple Classes of Shares of Beneficial Interest — The fund offers multiple classes of shares, which differ in their respective distribution and service fees. The fund's income, realized and unrealized gain (loss), and common expenses are allocated to shareholders based on the daily net assets of each class. Dividends are declared separately for each class. Differences in per share dividend rates are generally due to differences in separate class expenses. Class B and Class C shares will convert to
Notes to Financial Statements - continued
Class A shares approximately eight years after purchase. The fund’s distributions declared to shareholders as reported in the Statements of Changes in Net Assets are presented by class as follows:
| | Year
ended
8/31/23 | | Year
ended
8/31/22 |
| Class A | $106,681 | | $249,497 |
| Class B | 5,263 | | 9,700 |
| Class C | 3,158 | | 8,714 |
| Class I | 588,416 | | 1,191,229 |
| Class R1 | 1,867 | | 2,788 |
| Class R2 | 1,716 | | 2,729 |
| Class R3 | 3,244 | | 3,603 |
| Class R4 | 3,041 | | 4,183 |
| Class R6 | 662,629 | | 654,854 |
| Total | $1,376,015 | | $2,127,297 |
(3) Transactions with Affiliates
Investment Adviser — The fund has an investment advisory agreement with MFS to provide overall investment management and related administrative services and facilities to the fund. The management fee is computed daily and paid monthly at the following annual rates based on the fund's average daily net assets:
| Up to $1 billion | 0.75% |
| In excess of $1 billion and up to $2.5 billion | 0.70% |
| In excess of $2.5 billion | 0.675% |
MFS has agreed in writing to reduce its management fee by a specified amount if certain MFS mutual fund assets exceed thresholds agreed to by MFS and the fund's Board of Trustees. MFS has also agreed in writing to waive at least 0.01% of its management fee as part of this agreement. The agreement to waive at least 0.01% of the management fee will continue until modified by the fund's Board of Trustees, but such agreement will continue at least until December 31, 2023. For the year ended August 31, 2023, this management fee reduction amounted to $5,806, which is included in the reduction of total expenses in the Statement of Operations. The management fee incurred for the year ended August 31, 2023 was equivalent to an annual effective rate of 0.74% of the fund's average daily net assets.
The investment adviser has agreed in writing to pay a portion of the fund’s total annual operating expenses, excluding interest, taxes, extraordinary expenses, brokerage and transaction costs, certain tax reclaim recovery expenses (including contingency fees and closing agreement expenses), and investment-related expenses, such that total fund operating expenses do not exceed the following rates annually of each class’s average daily net assets:
| | | | | Classes | | | | |
| A | B | C | I | R1 | R2 | R3 | R4 | R6 |
| 1.24% | 1.99% | 1.99% | 0.99% | 1.99% | 1.49% | 1.24% | 0.99% | 0.95% |
Notes to Financial Statements - continued
This written agreement will continue until modified by the fund’s Board of Trustees, but such agreement will continue at least until December 31, 2024. For the year ended August 31, 2023, this reduction amounted to $532,979, which is included in the reduction of total expenses in the Statement of Operations.
Distributor — MFS Fund Distributors, Inc. (MFD), a wholly-owned subsidiary of MFS, as distributor, received $374 for the year ended August 31, 2023, as its portion of the initial sales charge on sales of Class A shares of the fund.
The Board of Trustees has adopted a distribution plan for certain share classes pursuant to Rule 12b-1 of the Investment Company Act of 1940.
The fund's distribution plan provides that the fund will pay MFD for services provided by MFD and financial intermediaries in connection with the distribution and servicing of certain share classes. One component of the plan is a distribution fee paid to MFD and another component of the plan is a service fee paid to MFD. MFD may subsequently pay all, or a portion, of the distribution and/or service fees to financial intermediaries. The distribution and service fees are computed daily and paid monthly.
Distribution Plan Fee Table:
| | Distribution
Fee Rate (d) | Service
Fee Rate (d) | Total
Distribution
Plan (d) | Annual
Effective
Rate (e) | Distribution
and Service
Fee |
| Class A | — | 0.25% | 0.25% | 0.25% | $ 10,760 |
| Class B | 0.75% | 0.25% | 1.00% | 1.00% | 2,658 |
| Class C | 0.75% | 0.25% | 1.00% | 1.00% | 1,876 |
| Class R1 | 0.75% | 0.25% | 1.00% | 0.25% | 175 |
| Class R2 | 0.25% | 0.25% | 0.50% | 0.50% | 358 |
| Class R3 | — | 0.25% | 0.25% | 0.25% | 293 |
| Total Distribution and Service Fees | | | | | $16,120 |
| (d) | In accordance with the distribution plan for certain classes, the fund pays distribution and/or service fees equal to these annual percentage rates of each class’s average daily net assets. The distribution and service fee rates disclosed by class represent the current rates in effect at the end of the reporting period. Any rate changes, if applicable, are detailed below. |
| (e) | The annual effective rates represent actual fees incurred under the distribution plan for the year ended August 31, 2023 based on each class's average daily net assets. MFD has voluntarily agreed to rebate a portion of each class's 0.25% service fee attributable to accounts for which there is no financial intermediary specified on the account except for accounts attributable to MFS or its affiliates' seed money. For the year ended August 31, 2023, this rebate amounted to $1 for Class A shares and is included in the reduction of total expenses in the Statement of Operations. For the year ended August 31, 2023, the 0.75% distribution fee was not imposed for Class R1 shares due to the sales charge limitations contained in Financial Industry Regulatory Authority (“FINRA”) Rule 2341. |
Certain Class A shares are subject to a contingent deferred sales charge (CDSC) in the event of a shareholder redemption within 18 months of purchase. Class B shares are subject to a CDSC in the event of a shareholder redemption within six years of
Notes to Financial Statements - continued
purchase. Class C shares are subject to a CDSC in the event of a shareholder redemption within 12 months of purchase. All contingent deferred sales charges are paid to MFD and during the year ended August 31, 2023, were as follows:
| | Amount |
| Class A | $424 |
| Class B | — |
| Class C | 4 |
Shareholder Servicing Agent — MFS Service Center, Inc. (MFSC), a wholly-owned subsidiary of MFS, receives a fee from the fund for its services as shareholder servicing agent calculated as a percentage of the average daily net assets of the fund as determined periodically under the supervision of the fund's Board of Trustees. For the year ended August 31, 2023, the fee was $4,385, which equated to 0.0098% annually of the fund's average daily net assets. MFSC also receives reimbursement from the fund for out-of-pocket expenses, sub-accounting and other shareholder servicing costs which may be paid to affiliated and unaffiliated service providers. Class R6 shares do not incur sub-accounting fees. For the year ended August 31, 2023, these out-of-pocket expenses, sub-accounting and other shareholder servicing costs amounted to $33,390.
Administrator — MFS provides certain financial, legal, shareholder communications, compliance, and other administrative services to the fund. Under an administrative services agreement, the fund reimburses MFS the costs incurred to provide these services. The fund is charged an annual fixed amount of $17,500 plus a fee based on average daily net assets. The administrative services fee is computed daily and paid monthly. The administrative services fee incurred for the year ended August 31, 2023 was equivalent to an annual effective rate of 0.0390% of the fund's average daily net assets.
Trustees’ and Officers’ Compensation — The fund pays compensation to independent Trustees in the form of a retainer, attendance fees, and additional compensation to Board and Committee chairpersons. Independent Trustees’ compensation is accrued daily and paid subsequent to each Trustee Board meeting. The fund does not pay compensation directly to Trustees or officers of the fund who are also officers of the investment adviser, all of whom receive remuneration from MFS for their services to the fund. Certain officers and Trustees of the fund are officers or directors of MFS, MFD, and MFSC.
Other — The fund invests in the MFS Institutional Money Market Portfolio which is managed by MFS and seeks current income consistent with preservation of capital and liquidity. This money market fund does not pay a management fee to MFS but does incur investment and operating costs.
At August 31, 2023, MFS held approximately 63% and 68% of the outstanding shares of Class R3 and Class R4, respectively, and 100% of the outstanding shares of Class R1 and Class R2.
The adviser has voluntarily undertaken to reimburse the fund from its own resources on a quarterly basis for the cost of investment research embedded in the cost of the fund’s securities trades. This agreement may be rescinded at any time. For the year ended August 31, 2023, this reimbursement amounted to $8,762, which is included in “Other” income in the Statement of Operations.
Notes to Financial Statements - continued
(4) Portfolio Securities
For the year ended August 31, 2023, purchases and sales of investments, other than short-term obligations, aggregated $34,562,803 and $27,451,237, respectively.
(5) Shares of Beneficial Interest
The fund's Declaration of Trust permits the Trustees to issue an unlimited number of full and fractional shares of beneficial interest. Transactions in fund shares were as follows:
| | Year ended
8/31/23 | | Year ended
8/31/22 |
| | Shares | Amount | | Shares | Amount |
| Shares sold | | | | | |
| Class A | 254,491 | $2,936,773 | | 205,671 | $2,844,904 |
| Class B | 1 | 18 | | 468 | 6,990 |
| Class C | 278 | 3,296 | | 688 | 9,471 |
| Class I | 752,072 | 8,828,285 | | 162,972 | 2,344,661 |
| Class R3 | 2,187 | 26,166 | | 3,165 | 42,366 |
| Class R4 | 967 | 11,732 | | 1,000 | 13,807 |
| Class R6 | 856,276 | 9,864,592 | | 372,261 | 5,030,980 |
| | 1,866,272 | $21,670,862 | | 746,225 | $10,293,179 |
Shares issued to shareholders
in reinvestment of distributions | | | | | |
| Class A | 9,110 | $106,681 | | 16,955 | $247,380 |
| Class B | 453 | 5,263 | | 669 | 9,700 |
| Class C | 271 | 3,158 | | 602 | 8,714 |
| Class I | 48,565 | 568,699 | | 79,467 | 1,160,214 |
| Class R1 | 161 | 1,867 | | 192 | 2,788 |
| Class R2 | 147 | 1,716 | | 187 | 2,729 |
| Class R3 | 277 | 3,244 | | 247 | 3,603 |
| Class R4 | 259 | 3,041 | | 286 | 4,183 |
| Class R6 | 56,442 | 662,629 | | 44,730 | 654,854 |
| | 115,685 | $1,356,298 | | 143,335 | $2,094,165 |
| Shares reacquired | | | | | |
| Class A | (305,998) | $(3,486,786) | | (319,561) | $(4,414,899) |
| Class B | (2,332) | (28,723) | | (3,667) | (53,204) |
| Class C | (4,704) | (53,640) | | (8,637) | (122,685) |
| Class I | (572,358) | (6,765,097) | | (852,957) | (11,984,347) |
| Class R3 | (2,475) | (30,137) | | (324) | (4,658) |
| Class R4 | (602) | (7,037) | | (70) | (1,004) |
| Class R6 | (451,996) | (5,348,950) | | (172,825) | (2,448,117) |
| | (1,340,465) | $(15,720,370) | | (1,358,041) | $(19,028,914) |
Notes to Financial Statements - continued
| | Year ended
8/31/23 | | Year ended
8/31/22 |
| | Shares | Amount | | Shares | Amount |
| Net change | | | | | |
| Class A | (42,397) | $(443,332) | | (96,935) | $(1,322,615) |
| Class B | (1,878) | (23,442) | | (2,530) | (36,514) |
| Class C | (4,155) | (47,186) | | (7,347) | (104,500) |
| Class I | 228,279 | 2,631,887 | | (610,518) | (8,479,472) |
| Class R1 | 161 | 1,867 | | 192 | 2,788 |
| Class R2 | 147 | 1,716 | | 187 | 2,729 |
| Class R3 | (11) | (727) | | 3,088 | 41,311 |
| Class R4 | 624 | 7,736 | | 1,216 | 16,986 |
| Class R6 | 460,722 | 5,178,271 | | 244,166 | 3,237,717 |
| | 641,492 | $7,306,790 | | (468,481) | $(6,641,570) |
The fund is one of several mutual funds in which certain MFS funds may invest. The MFS funds do not invest in the underlying funds for the purpose of exercising management or control. At the end of the period, the MFS Lifetime 2050 Fund, the MFS Lifetime 2040 Fund, the MFS Lifetime 2045 Fund, the MFS Lifetime 2055 Fund, the MFS Lifetime 2060 Fund, and the MFS Lifetime 2035 Fund were the owners of record of approximately 9%, 8%, 8%, 6%, 3%, and 2%, respectively, of the value of outstanding voting shares of the fund. In addition, the MFS Lifetime 2065 Fund was the owner of record of less than 1% of the value of outstanding voting shares of the fund.
Effective June 1, 2019, purchases of the fund’s Class B shares were closed to new and existing investors subject to certain exceptions. On March 30, 2023, the fund announced that effective after the close of business on September 29, 2023, purchases of Class R1 and Class R2 shares will be closed to new eligible investors.
(6) Line of Credit
The fund and certain other funds managed by MFS participate in a $1.45 billion unsecured committed line of credit of which $1.2 billion is reserved for use by the fund and certain other MFS U.S. funds. The line of credit is provided by a syndicate of banks under a credit agreement. Borrowings may be made for temporary financing needs. Interest is charged to each fund, based on its borrowings, generally at a rate equal to the highest of 1) Daily Simple SOFR (Secured Overnight Financing Rate) plus 0.10%, 2) the Federal Funds Effective Rate, or 3) the Overnight Bank Funding Rate, each plus an agreed upon spread. A commitment fee, based on the average daily unused portion of the committed line of credit, is allocated among the participating funds. The line of credit expires on March 14, 2024 unless extended or renewed. In addition, the fund and other funds managed by MFS have established unsecured uncommitted borrowing arrangements with certain banks for temporary financing needs. Interest is charged to each fund, based on its borrowings, at rates equal to customary reference rates plus an agreed upon spread. For the year ended August 31, 2023, the fund’s commitment fee and interest expense were $207 and $0, respectively, and are included in “Miscellaneous” expense in the Statement of Operations.
Notes to Financial Statements - continued
(7) Investments in Affiliated Issuers
An affiliated issuer may be considered one in which the fund owns 5% or more of the outstanding voting securities, or a company which is under common control. For the purposes of this report, the following were affiliated issuers:
| Affiliated Issuers | Beginning
Value | Purchases | Sales
Proceeds | Realized
Gain
(Loss) | Change in
Unrealized
Appreciation or
Depreciation | Ending
Value |
| MFS Institutional Money Market Portfolio | $650,889 | $22,521,204 | $22,652,529 | $178 | $52 | $519,794 |
| Affiliated Issuers | Dividend
Income | Capital Gain
Distributions |
| MFS Institutional Money Market Portfolio | $21,050 | $— |
(8) Russia and Ukraine Conflict
The fund invests in securities and/or derivative instruments that are economically tied to Russia and/or Ukraine. Escalation of the conflict between Russia and Ukraine in late February 2022 caused market volatility and disruption in the tradability of Russian securities, including closure of the local securities market, temporary restriction on securities sales by non-residents, and disruptions to clearance and payment systems. To the extent that the fund is unable to sell securities, whether due to market constraints or to the sanctions imposed on Russia by the United States and other countries, those securities are considered illiquid and the value of those securities reflects their illiquid classification. Management continues to monitor these events and to evaluate the related impacts on fund performance.
Report of Independent Registered Public Accounting Firm
To the Shareholders of MFS Blended Research Emerging Markets Equity Fund and the Board of Trustees of MFS Series Trust IV
Opinion on the Financial Statements
We have audited the accompanying statement of assets and liabilities of MFS Blended Research Emerging Markets Equity Fund (the “Fund”) (one of the funds constituting MFS Series Trust IV (the “Trust”)), including the portfolio of investments, as of August 31, 2023,and the related statement of operations for the year then ended, the statements of changes in net assets for each of the two years in the period then ended, the financial highlights for each of the five years in the period then ended and the related notes (collectively referred to as the “financial statements”). In our opinion, the financial statements present fairly, in all material respects, the financial position of the Fund (one of the funds constituting MFS Series Trust IV) at August 31, 2023, the results of its operations for the year then ended, the changes in its net assets for each of the two years in the period then ended and its financial highlights for each of the five years in the period then ended, in conformity with U.S. generally accepted accounting principles.
Basis for Opinion
These financial statements are the responsibility of the Trust’s management. Our responsibility is to express an opinion on the Fund’s financial statements based on our audits. We are a public accounting firm registered with the Public Company Accounting Oversight Board (United States) (“PCAOB”) and are required to be independent with respect to the Trust in accordance with the U.S. federal securities laws and the applicable rules and regulations of the Securities and Exchange Commission and the PCAOB.
We conducted our audits in accordance with the standards of the PCAOB. Those standards require that we plan and perform the audit to obtain reasonable assurance about whether the financial statements are free of material misstatement, whether due to error or fraud. The Trust is not required to have, nor were we engaged to perform, an audit of the Trust’s internal control over financial reporting. As part of our audits, we are required to obtain an understanding of internal control over financial reporting but not for the purpose of expressing an opinion on the effectiveness of the Trust’s internal control over financial reporting. Accordingly, we express no such opinion.
Report of Independent Registered Public Accounting Firm – continued
Our audits included performing procedures to assess the risks of material misstatement of the financial statements, whether due to error or fraud, and performing procedures that respond to those risks. Such procedures included examining, on a test basis, evidence regarding the amounts and disclosures in the financial statements. Our procedures included confirmation of securities owned as of August 31, 2023, by correspondence with the custodian, brokers and others; when replies were not received from brokers and others, we performed other auditing procedures. Our audits also included evaluating the accounting principles used and significant estimates made by management, as well as evaluating the overall presentation of the financial statements. We believe that our audits provide a reasonable basis for our opinion.
We have served as the auditor of one or more MFS investment companies since 1993.
Boston, Massachusetts
October 16, 2023
Trustees and Officers — Identification and Background
The Trustees and Officers of the Trust, as of October 1, 2023, are listed below, together with their principal occupations during the past five years. (Their titles may have varied during that period.) The address of each Trustee and Officer is 111 Huntington Avenue, Boston, Massachusetts 02199-7618.
| Name, Age | | Position(s) Held with Fund | | Trustee/Officer Since(h) | | Number of MFS Funds overseen by the Trustee | | Principal Occupations During
the Past Five Years | | Other Directorships During
the Past Five Years (j) |
| INTERESTED TRUSTEE | | | | | | | | | | |
Michael W. Roberge (k)
(age 57) | | Trustee | | January 2021 | | 136 | | Massachusetts Financial Services Company, Chairman (since January 2021); Chief Executive Officer (since January 2017); Director; Chairman of the Board (since January 2022); President (until December 2018); Chief Investment Officer (until December 2018) | | N/A |
| INDEPENDENT TRUSTEES | | | | | | | | | | |
John P. Kavanaugh
(age 68) | | Trustee and Chair of Trustees | | January 2009 | | 136 | | Private investor | | N/A |
Steven E. Buller
(age 72) | | Trustee | | February 2014 | | 136 | | Private investor | | N/A |
John A. Caroselli
(age 69) | | Trustee | | March 2017 | | 136 | | Private investor; JC Global Advisors, LLC (management consulting), President (since 2015) | | N/A |
Maureen R. Goldfarb
(age 68) | | Trustee | | January 2009 | | 136 | | Private investor | | N/A |
Peter D. Jones
(age 68) | | Trustee | | January 2019 | | 136 | | Private investor | | N/A |
James W. Kilman, Jr.
(age 62) | | Trustee | | January 2019 | | 136 | | Burford Capital Limited (finance and investment management), Senior Advisor (since May 3, 2021), Chief Financial Officer (2019 - May 2, 2021); KielStrand Capital LLC (family office), Chief Executive Officer (since 2016) | | Alpha-En Corporation, Director (2016-2019) |
Trustees and Officers - continued
| Name, Age | | Position(s) Held with Fund | | Trustee/Officer Since(h) | | Number of MFS Funds overseen by the Trustee | | Principal Occupations During
the Past Five Years | | Other Directorships During
the Past Five Years (j) |
Clarence Otis, Jr.
(age 67) | | Trustee | | March 2017 | | 136 | | Private investor | | VF Corporation, Director; Verizon Communications, Inc., Director; The Travelers Companies, Director |
Maryanne L. Roepke
(age 67) | | Trustee | | May 2014 | | 136 | | Private investor | | N/A |
Laurie J. Thomsen
(age 66) | | Trustee | | March 2005 | | 136 | | Private investor | | The Travelers Companies, Director; Dycom Industries, Inc., Director |
| Name, Age | | Position(s) Held with
Fund | | Trustee/Officer Since(h) | | Number of MFS Funds for which the Person is an Officer | | Principal Occupations During
the Past Five Years |
| OFFICERS | | | | | | | | |
Christopher R. Bohane (k)
(age 49) | | Assistant Secretary and Assistant Clerk | | July 2005 | | 136 | | Massachusetts Financial Services Company, Senior Vice President and Senior Managing Counsel |
Kino Clark (k)
(age 55) | | Assistant Treasurer | | January 2012 | | 136 | | Massachusetts Financial Services Company, Vice President |
John W. Clark, Jr. (k)
(age 56) | | Assistant Treasurer | | April 2017 | | 136 | | Massachusetts Financial Services Company, Vice President |
David L. DiLorenzo (k)
(age 55) | | President | | July 2005 | | 136 | | Massachusetts Financial Services Company, Senior Vice President |
Heidi W. Hardin (k)
(age 56) | | Secretary and Clerk | | April 2017 | | 136 | | Massachusetts Financial Services Company, Executive Vice President and General Counsel |
Brian E. Langenfeld (k)
(age 50) | | Assistant Secretary and Assistant Clerk | | June 2006 | | 136 | | Massachusetts Financial Services Company, Vice President and Managing Counsel |
Trustees and Officers - continued
| Name, Age | | Position(s) Held with
Fund | | Trustee/Officer Since(h) | | Number of MFS Funds for which the Person is an Officer | | Principal Occupations During
the Past Five Years |
Rosa E. Licea-Mailloux (k)
(age 47) | | Chief Compliance Officer | | March 2022 | | 136 | | Massachusetts Financial Services Company, Vice President (since 2018); Director of Corporate Compliance (2018-2021), Senior Director Compliance (2021-2022), Senior Managing Director of North American Compliance & Chief Compliance Officer (since March 2022); Natixis Investment Managers (investment management), Funds Chief Compliance Officer, Deputy General Counsel & Senior Vice President (until 2018) |
Amanda S. Mooradian (k)
(age 44) | | Assistant Secretary and Assistant Clerk | | September 2018 | | 136 | | Massachusetts Financial Services Company, Assistant Vice President and Senior Counsel |
Susan A. Pereira (k)
(age 52) | | Assistant Secretary and Assistant Clerk | | July 2005 | | 136 | | Massachusetts Financial Services Company, Vice President and Managing Counsel |
Kasey L. Phillips (k)
(age 52) | | Assistant Treasurer | | September 2012 | | 136 | | Massachusetts Financial Services Company, Vice President |
Matthew A. Stowe (k)
(age 48) | | Assistant Secretary and Assistant Clerk | | October 2014 | | 136 | | Massachusetts Financial Services Company, Vice President and Senior Managing Counsel |
William B. Wilson (k)
(age 41) | | Assistant Secretary and Assistant Clerk | | October 2022 | | 136 | | Massachusetts Financial Services Company, Assistant Vice President and Senior Counsel |
James O. Yost (k)
(age 63) | | Treasurer | | September 1990 | | 136 | | Massachusetts Financial Services Company, Senior Vice President |
| (h) | Date first appointed to serve as Trustee/Officer of an MFS Fund. Each Trustee has served continuously since appointment unless indicated otherwise. From January 2012 through December 2016, Messrs. DiLorenzo and Yost served as Treasurer and Deputy Treasurer of the Funds, respectively. |
| (j) | Directorships or trusteeships of companies required to report to the Securities and Exchange Commission (i.e., “public companies”). |
| (k) | “Interested person” of the Trust within the meaning of the Investment Company Act of 1940 (referred to as the 1940 Act), which is the principal federal law governing investment companies like the fund, as a result of a position with MFS. The address of MFS is 111 Huntington Avenue, Boston, Massachusetts 02199-7618. |
Trustees and Officers - continued
Each Trustee (other than Messrs. Jones, Kilman and Roberge) has been elected by shareholders and each Trustee and Officer holds office until his or her successor is chosen and qualified or until his or her earlier death, resignation, retirement or removal. Mr. Roberge became a Trustee of the Funds on January 1, 2021 and Messrs. Jones and Kilman became Trustees of the Funds on January 1, 2019. The Trust does not hold annual meetings for the purpose of electing Trustees, and Trustees are not elected for fixed terms. Under the terms of the Board's retirement policy, an Independent Trustee shall retire at the end of the calendar year in which he or she reaches the earlier of 75 years of age or 15 years of service on the Board (or, in the case of any Independent Trustee who joined the Board prior to 2015, 20 years of service on the Board).
Messrs. Buller, Kilman and Otis and Ms. Roepke are members of the Trust’s Audit Committee.
Each of the Interested Trustees and certain Officers hold comparable officer positions with certain affiliates of MFS.
The Statement of Additional Information for a Fund includes further information about the Trustees and is available without charge upon request by calling 1-800-225-2606.
| Investment Adviser | Custodian |
Massachusetts Financial Services Company
111 Huntington Avenue
Boston, MA 02199-7618 | State Street Bank and Trust Company
1 Congress Street, Suite 1
Boston, MA 02114-2016 |
| Distributor | Independent Registered Public Accounting Firm |
MFS Fund Distributors, Inc.
111 Huntington Avenue
Boston, MA 02199-7618 | Ernst & Young LLP
200 Clarendon Street
Boston, MA 02116 |
| Portfolio Manager(s) | |
Jim Fallon
Matt Krummell
Jonathan Sage
Jed Stocks | |
Board Review of Investment Advisory Agreement
MFS Blended Research Emerging Markets Equity Fund
The Investment Company Act of 1940 requires that both the full Board of Trustees and a majority of the non-interested (“independent”) Trustees, voting separately, annually approve the continuation of the Fund’s investment advisory agreement with MFS. The Trustees consider matters bearing on the Fund and its advisory arrangements at their meetings throughout the year, including a review of performance data at each regular meeting. In addition, the independent Trustees met several times over the course of three months beginning in May and ending in July, 2023 (“contract review meetings”) for the specific purpose of considering whether to approve the continuation of the investment advisory agreement for the Fund and the other investment companies that the Board oversees (the “MFS Funds”). The independent Trustees were assisted in their evaluation of the Fund’s investment advisory agreement by independent legal counsel, from whom they received separate legal advice and with whom they met separately from MFS during various contract review meetings. The independent Trustees were also assisted in this process by an independent consultant who was retained by and reported to the independent Trustees.
In connection with their deliberations regarding the continuation of the investment advisory agreement, the Trustees, including the independent Trustees, considered such information and factors as they believed, in light of the legal advice furnished to them and their own business judgment, to be relevant. The investment advisory agreement for the Fund was considered separately, although the Trustees also took into account the common interests of all MFS Funds in their review. As described below, the Trustees considered the nature, quality, and extent of the various investment advisory, administrative, and shareholder services performed by MFS under the existing investment advisory agreement and other arrangements with the Fund.
In connection with their contract review meetings, the Trustees received and relied upon materials that included, among other items: (i) information provided by Broadridge Financial Solutions, Inc. (“Broadridge”), an independent third party, on the investment performance of the Fund for various time periods ended December 31, 2022 and the investment performance of a group of funds with substantially similar investment classifications/objectives (the “Broadridge performance universe”), (ii) information provided by Broadridge on the Fund’s advisory fees and other expenses and the advisory fees and other expenses of comparable funds identified by Broadridge as well as all other funds in the same investment classification/category (the “Broadridge expense group and universe”), (iii) information provided by MFS on the advisory fees of portfolios of other clients of MFS, including institutional separate accounts and other clients, (iv) information as to whether and to what extent applicable expense waivers, reimbursements or fee “breakpoints” are observed for the Fund, (v) information regarding MFS’ financial results and financial condition, including MFS’ and certain of its affiliates’ estimated profitability from services performed for the Fund and the MFS Funds as a whole, and compared to MFS’ institutional business, (vi) MFS’ views regarding the outlook for the mutual fund industry and the strategic business plans of MFS, (vii) descriptions of various functions performed by MFS for the Funds, such as compliance monitoring and portfolio trading practices, and (viii) information regarding the overall organization of MFS, including information about
Board Review of Investment Advisory Agreement - continued
MFS’ senior management and other personnel providing investment advisory, administrative and other services to the Fund and the other MFS Funds. The comparative performance, fee and expense information prepared and provided by Broadridge was not independently verified and the independent Trustees did not independently verify any information provided to them by MFS.
The Trustees’ conclusion as to the continuation of the investment advisory agreement was based on a comprehensive consideration of all information provided to the Trustees and not the result of any single factor. Some of the factors that figured particularly in the Trustees’ deliberations are described below, although individual Trustees may have evaluated the information presented differently from one another, giving different weights to various factors. It is also important to recognize that the fee arrangements for the Fund and other MFS Funds are the result of years of review and discussion between the independent Trustees and MFS, that certain aspects of such arrangements may receive greater scrutiny in some years than in others, and that the Trustees’ conclusions may be based, in part, on their consideration of these same arrangements during the course of the year and in prior years.
Based on information provided by Broadridge and MFS, the Trustees reviewed the Fund’s total return investment performance as well as the Broadridge performance universe over various time periods. The Trustees placed particular emphasis on the total return performance of the Fund’s Class I shares in comparison to the performance of funds in its Broadridge performance universe over the five-year period ended December 31, 2022, which the Trustees believed was a long enough period to reflect differing market conditions. The total return performance of the Fund’s Class I shares was in the 3rd quintile relative to the other funds in the universe for this five-year period (the 1st quintile being the best performers and the 5th quintile being the worst performers). The total return performance of the Fund’s Class I shares was in the 2nd quintile for the one-year period and the 3rd quintile for the three-year period ended December 31, 2022 relative to the Broadridge performance universe. Because of the passage of time, these performance results may differ from the performance results for more recent periods, including those shown elsewhere in this report.
In the course of their deliberations, the Trustees took into account information provided by MFS in connection with the contract review meetings, as well as during investment review meetings conducted with portfolio management personnel during the course of the year regarding the Fund’s performance. After reviewing these and related factors, the Trustees concluded, within the context of their overall conclusions regarding the investment advisory agreement, that they were satisfied with MFS’ responses and efforts relating to investment performance.
In assessing the reasonableness of the Fund’s advisory fee, the Trustees considered, among other information, the Fund’s advisory fee and the total expense ratio of the Fund’s Class I shares as a percentage of average daily net assets and the advisory fee and total expense ratios of the Broadridge expense group based on information provided by Broadridge. The Trustees considered that MFS currently observes an expense limitation for the Fund, which may not be changed without the Trustees’ approval. The Trustees also considered that, according to the data provided by Broadridge (which takes into account any fee reductions or expense limitations that
Board Review of Investment Advisory Agreement - continued
were in effect during the Fund’s last fiscal year), the Fund’s effective advisory fee rate was lower than the Broadridge expense group median and the Fund’s total expense ratio was approximately at the Broadridge expense group median.
The Trustees also considered the advisory fees charged by MFS to any institutional separate accounts advised by MFS (“separate accounts”) and unaffiliated investment companies for which MFS serves as subadviser (“subadvised funds”) that have comparable investment strategies to the Fund, if any. In comparing these fees, the Trustees considered information provided by MFS as to the generally broader scope of services provided by MFS to the Fund, as well as the more extensive regulatory burdens imposed on MFS in managing the Fund, in comparison to separate accounts and subadvised funds. The Trustees also considered the higher demands placed on MFS’ investment personnel and trading infrastructure as a result of the daily cash in-flows and out-flows of the Fund in comparison to separate accounts.
The Trustees also considered whether the Fund may benefit from any economies of scale in the management of the Fund in the event of growth in assets of the Fund and/or growth in assets of the MFS Funds as a whole. They noted that the Fund’s advisory fee rate schedule is subject to contractual breakpoints that reduce the Fund’s advisory fee rate on average daily net assets over $1 billion and $2.5 billion. The Trustees also noted that MFS has agreed in writing to waive a portion of the management fees of certain MFS Funds, including the Fund, if the total combined assets of certain funds within the MFS Funds’ complex increase above agreed upon thresholds (the “group fee waiver”), enabling the Fund’s shareholders to share in the benefits from any economies of scale at the complex level. The group fee waiver is reviewed and renewed annually between the Board and MFS. The Trustees concluded that the breakpoints and the group fee waiver were sufficient to allow the Fund to benefit from economies of scale as its assets and overall complex assets grow.
The Trustees also considered information prepared by MFS relating to MFS’ costs and profits with respect to the Fund, the MFS Funds considered as a group, and other investment companies and accounts advised by MFS, as well as MFS’ methodologies used to determine and allocate its costs to the MFS Funds, the Fund and other accounts and products for purposes of estimating profitability.
After reviewing these and other factors described herein, the Trustees concluded, within the context of their overall conclusions regarding the investment advisory agreement, that the advisory fees charged to the Fund represent reasonable compensation in light of the services being provided by MFS to the Fund.
In addition, the Trustees considered MFS’ resources and related efforts to continue to retain, attract and motivate capable personnel to serve the Fund. The Trustees also considered current and developing conditions in the financial services industry, including the presence of large and well-capitalized companies which are spending, and appear to be prepared to continue to spend, substantial sums to engage personnel and to provide services to competing investment companies. In this regard, the Trustees also considered the financial resources of MFS and its ultimate parent, Sun Life Financial Inc. The Trustees also considered the advantages and possible disadvantages to the Fund of having an adviser that also serves other investment companies as well as other accounts.
Board Review of Investment Advisory Agreement - continued
The Trustees also considered the nature, quality, cost, and extent of administrative, transfer agency, and distribution services provided to the Fund by MFS and its affiliates under agreements and plans other than the investment advisory agreement, including any 12b-1 fees the Fund pays to MFS Fund Distributors, Inc., an affiliate of MFS. The Trustees also considered the nature, extent and quality of certain other services MFS performs or arranges for on the Fund’s behalf, which may include securities lending programs, directed expense payment programs, class action recovery programs, and MFS’ interaction with third-party service providers, principally custodians and sub-custodians. The Trustees concluded that the various non-advisory services provided by MFS and its affiliates on behalf of the Fund were satisfactory.
The Trustees considered so-called “fall-out benefits” to MFS such as reputational value derived from serving as investment manager to the MFS Funds. The Trustees also considered that MFS discontinued its historic practice of obtaining investment research from portfolio brokerage commissions paid by certain MFS Funds effective January 2018, and directly pays or voluntarily reimburses a Fund, if applicable, for the costs of external research acquired through the use of the Fund’s portfolio brokerage commissions.
Based on their evaluation of factors that they deemed to be material, including those factors described above, the Board of Trustees, including the independent Trustees, concluded that the Fund’s investment advisory agreement with MFS should be continued for an additional one-year period, commencing August 1, 2023.
Statement Regarding Liquidity Risk Management Program
The fund has adopted and implemented a liquidity risk management program (the “Program”) as required by Rule 22e-4 under the Investment Company Act of 1940, as amended. The fund’s Board of Trustees (the “Board”) has designated MFS as the administrator of the Program. The Program is reasonably designed to assess and manage the liquidity risk of the fund. Liquidity risk is the risk that the fund could not meet requests to redeem shares issued by the fund without significant dilution of remaining investors' interests.
MFS provided a written report to the Board for consideration at its March 2023 meeting that addressed the operation of the Program and provided an assessment of the adequacy and effectiveness of the Program during the period from January 1, 2022 to December 31, 2022 (the “Covered Period”). The report concluded that during the Covered Period the Program had operated effectively in all material respects and had adequately and effectively been implemented to assess and manage the fund’s liquidity risk. MFS also reported that there were no liquidity events that impacted the fund or its ability to timely meet redemptions without dilution to existing shareholders during the Covered Period.
There can be no assurance that the Program will achieve its objectives in the future. Further information on liquidity risk, and other principal risks to which an investment in the fund may be subject, can be found in the prospectus.
Proxy Voting Policies and Information
MFS votes proxies on behalf of the fund pursuant to proxy voting policies and procedures that are available without charge, upon request, by calling 1-800-225-2606, by visiting mfs.com/proxyvoting, or by visiting the SEC’s Web site at http://www.sec.gov.
Information regarding how the fund voted proxies relating to portfolio securities during the most recent twelve-month period ended June 30 is available by August 31 of each year without charge by visiting mfs.com/proxyvoting, or by visiting the SEC’s Web site at http://www.sec.gov.
Quarterly Portfolio Disclosure
The fund files a complete schedule of portfolio holdings with the SEC for the first and third quarters of each fiscal year as an exhibit to its reports on Form N-PORT. The fund's Form N-PORT reports are available on the SEC's Web site at http://www.sec.gov. A shareholder can obtain the portfolio holdings report for the first and third quarters of the fund's fiscal year at mfs.com/openendfunds by choosing the fund's name and then scrolling to the “Resources” section and clicking on the “Prospectus and Reports” tab.
Further Information
From time to time, MFS may post important information about the fund or the MFS Funds on the MFS Web site (mfs.com). This information is available at https://www.mfs.com/announcements or at mfs.com/openendfunds by choosing the fund’s name and then scrolling to the “Resources” section and clicking on the “Announcements” tab, if any.
Information About Fund Contracts and Legal Claims
The fund has entered into contractual arrangements with an investment adviser, administrator, distributor, shareholder servicing agent, and custodian who each provide services to the fund. Unless expressly stated otherwise, shareholders are not parties to, or intended beneficiaries of these contractual arrangements, and these contractual arrangements are not intended to create any shareholder right to enforce them against the service providers or to seek any remedy under them against the service providers, either directly or on behalf of the fund.
Under the Trust’s By-Laws and Declaration of Trust, any claims asserted against or on behalf of the MFS Funds, including claims against Trustees and Officers, must be brought in state and federal courts located within the Commonwealth of Massachusetts.
Federal Tax Information (unaudited)
The fund will notify shareholders of amounts for use in preparing 2023 income tax forms in January 2024. The following information is provided pursuant to provisions of the Internal Revenue Code.
The fund designates the maximum amount allowable as qualified dividend income eligible to be taxed at the same rate as long-term capital gain.
Income derived from foreign sources was $1,943,104. The fund intends to pass through foreign tax credits of $202,372 for the fiscal year.
| FACTS | WHAT DOES MFS DO WITH YOUR PERSONAL INFORMATION? |
| Why? | Financial companies choose how they share your personal information. Federal law gives consumers the right to limit some but not all sharing. Federal law also requires us to tell you how we collect, share, and protect your personal information. Please read this notice carefully to understand what we do. |
| What? | The types of personal information we collect and share depend on the product or service you have with us. This information can include: |
| • Social Security number and account balances |
| • Account transactions and transaction history |
| • Checking account information and wire transfer instructions |
| When you are no longer our customer, we continue to share your information as described in this notice. |
| How? | All financial companies need to share customers' personal information to run their everyday business. In the section below, we list the reasons financial companies can share their customers' personal information; the reasons MFS chooses to share; and whether you can limit this sharing. |
Reasons we can share your
personal information | Does MFS share? | Can you limit
this sharing? |
For our everyday business purposes –
such as to process your transactions, maintain your
account(s), respond to court orders and legal
investigations, or report to credit bureaus | Yes | No |
For our marketing purposes –
to offer our products and services to you | No | We don't share |
For joint marketing with other
financial companies | No | We don't share |
For our affiliates' everyday business purposes –
information about your transactions and experiences | No | We don't share |
For our affiliates' everyday business purposes –
information about your creditworthiness | No | We don't share |
| For nonaffiliates to market to you | No | We don't share |
| Questions? | Call 800-225-2606 or go to mfs.com. |
| Who we are |
| Who is providing this notice? | MFS Funds, MFS Investment Management, MFS Institutional Advisors, Inc., and MFS Heritage Trust Company. |
| What we do |
How does MFS
protect my personal
information? | To protect your personal information from unauthorized access and use, we use security measures that comply with federal law. These measures include procedural, electronic, and physical safeguards for the protection of the personal information we collect about you. |
How does MFS
collect my personal
information? | We collect your personal information, for example, when you |
| • open an account or provide account information |
| • direct us to buy securities or direct us to sell your securities |
| • make a wire transfer |
| We also collect your personal information from others, such as credit bureaus, affiliates, or other companies. |
| Why can't I limit all sharing? | Federal law gives you the right to limit only |
| • sharing for affiliates' everyday business purposes – information about your creditworthiness |
| • affiliates from using your information to market to you |
| • sharing for nonaffiliates to market to you |
| State laws and individual companies may give you additional rights to limit sharing. |
| Definitions |
| Affiliates | Companies related by common ownership or control. They can be financial and nonfinancial companies. |
| • MFS does not share personal information with affiliates, except for everyday business purposes as described on page one of this notice. |
| Nonaffiliates | Companies not related by common ownership or control. They can be financial and nonfinancial companies. |
| • MFS does not share with nonaffiliates so they can market to you. |
| Joint marketing | A formal agreement between nonaffiliated financial companies that together market financial products or services to you. |
| • MFS doesn't jointly market. |
| Other important information |
| If you own an MFS product or receive an MFS service in the name of a third party such as a bank or broker-dealer, their privacy policy may apply to you instead of ours. |
Save paper with eDelivery.
MFS® will send you prospectuses, reports, and proxies directly via e-mail so you will get information faster with less mailbox clutter.
To sign up:
1. Go to mfs.com.
2. Log in via MFS® Access.
3. Select eDelivery.
If you own your MFS fund shares through a financial institution or a retirement plan, MFS® TALK, MFS® Access, or eDelivery may not be available to you.
CONTACT
WEB SITE
mfs.com
MFS TALK
1-800-637-8255
24 hours a day
ACCOUNT SERVICE AND LITERATURE
Shareholders
1-800-225-2606
Financial advisors
1-800-343-2829
Retirement plan services
1-800-637-1255
MAILING ADDRESS
MFS Service Center, Inc.
P.O. Box 219341
Kansas City, MO 64121-9341
OVERNIGHT MAIL
MFS Service Center, Inc.
Suite 219341
430 W 7th Street
Kansas City, MO 64105-1407
Annual Report
August 31, 2023
MFS® Blended Research®
International Equity Fund
MFS® Blended Research®
International Equity Fund
| 1 |
| 3 |
| 6 |
| 9 |
| 11 |
| 19 |
| 21 |
| 22 |
| 23 |
| 29 |
| 41 |
| 43 |
| 47 |
| 51 |
| 52 |
| 52 |
| 52 |
| 52 |
| 52 |
| 53 |
The report is prepared for the general information of shareholders. It is authorized for distribution to prospective investors only when preceded or accompanied by a current prospectus.
NOT FDIC INSURED • MAY LOSE VALUE • NO BANK GUARANTEE
Portfolio structure
Top ten holdings
| ASML Holding N.V. | 2.2% |
| Novartis AG | 2.1% |
| Taiwan Semiconductor Manufacturing Co. Ltd., ADR | 1.9% |
| Samsung Electronics Co. Ltd. | 1.7% |
| Roche Holding AG | 1.7% |
| LVMH Moet Hennessy Louis Vuitton SE | 1.6% |
| Compagnie Financiere Richemont S.A. | 1.5% |
| Eni S.p.A. | 1.5% |
| KDDI Corp. | 1.4% |
| DBS Group Holdings Ltd. | 1.4% |
GICS equity sectors (g)
| Financials | 19.8% |
| Consumer Discretionary | 12.6% |
| Industrials | 12.3% |
| Information Technology | 12.1% |
| Health Care | 10.3% |
| Consumer Staples | 8.1% |
| Materials | 7.8% |
| Energy | 6.1% |
| Communication Services | 6.1% |
| Utilities | 2.4% |
| Real Estate | 1.3% |
| Equity Warrants (o) | 0.0% |
Issuer country weightings (x)
| Japan | 15.0% |
| United Kingdom | 10.4% |
| France | 8.9% |
| China | 8.7% |
| Canada | 8.1% |
| Switzerland | 7.1% |
| South Korea | 4.6% |
| Netherlands | 4.3% |
| Australia | 3.8% |
| Other Countries | 29.1% |
Currency exposure weightings (y)
| Euro | 23.0% |
| Japanese Yen | 15.0% |
| British Pound Sterling | 10.4% |
| Hong Kong Dollar | 9.1% |
| Canadian Dollar | 8.1% |
| Swiss Franc | 7.1% |
| South Korean Won | 4.6% |
| United States Dollar | 4.0% |
| Australian Dollar | 3.8% |
| Other Currencies | 14.9% |
Portfolio Composition - continued
| (g) | The Global Industry Classification Standard (GICS®) was developed by and/or is the exclusive property of MSCI, Inc. and S&P Global Market Intelligence Inc. (“S&P Global Market Intelligence”). GICS is a service mark of MSCI and S&P Global Market Intelligence and has been licensed for use by MFS. MFS has applied its own internal sector/industry classification methodology for equity securities and non-equity securities that are unclassified by GICS. |
| (x) | Represents the portfolio’s exposure to issuer countries as a percentage of a portfolio’s net assets. For purposes of this presentation, United States (included in Other Countries) includes Cash & Cash Equivalents and Other. |
| (y) | Represents the portfolio’s exposure to a particular currency as a percentage of a portfolio's net assets. For purposes of this presentation, United States Dollar includes Cash & Cash Equivalents. |
Cash & Cash Equivalents includes any cash, investments in money market funds, short-term securities, and other assets less liabilities. Please see the Statement of Assets and Liabilities for additional information related to the fund’s cash position and other assets and liabilities.
Other includes equivalent exposure from currency derivatives and/or any offsets to derivative positions and may be negative.
Percentages are based on net assets as of August 31, 2023.
The portfolio is actively managed and current holdings may be different.
Management Review
Summary of Results
For the twelve months ended August 31, 2023, Class A shares of the MFS Blended Research International Equity Fund (fund) provided a total return of 13.60%, at net asset value. This compares with a return of 11.89% for the fund’s benchmark, the MSCI All Country World (ex-US) Index (net div).
Market Environment
During the reporting period, central banks around the world had to combat the strongest inflationary pressures in four decades, fueled by the global fiscal response to the pandemic, disrupted supply chains and the dislocations to energy markets stemming from the war in Ukraine. Interest rates rose substantially, but the effects of a tighter monetary policy may not have been fully experienced yet, given that monetary policy works with long and variable lags. Strains resulting from the abrupt tightening of monetary policy began to affect some parts of the economy, most acutely among small and regional US banks, which suffered from deposit flight as depositors sought higher yields on their savings. Those shifts exposed an asset-liability mismatch that forced the closure of several institutions by regulators. Given the importance of small and mid-sized lenders to the provision of credit in the US, concerns were raised in the aftermath of the crisis that credit availability could become constrained, leading to slower economic growth, although those effects have been limited thus far. China’s abandonment of its Zero-COVID policy ushered in a brief uptick in economic activity in the world’s second-largest economy in early 2023, although its momentum soon stalled as focus turned to the country’s highly-indebted property development sector. In developed markets, consumer demand for services remained stronger than the demand for goods.
Policymakers found themselves in the difficult position of trying to restrain inflation without tipping economies into recession. Despite the challenging macroeconomic and geopolitical environment, central banks remained focused on controlling price pressures while also confronting increasing financial stability concerns. Central banks had to juggle achieving their inflation mandates while using macroprudential tools to keep banking systems liquid, a potentially difficult balancing act, and one that suggested that we may be nearing a peak in policy rates.
Against an environment of relatively tight labor markets, tighter global financial conditions and volatile materials prices, investor anxiety appeared to have increased over the potential that corporate profit margins may be past peak for this cycle. That said, signs that supply chains have generally normalized, coupled with low levels of unemployment across developed markets and hopes that inflation levels have peaked, were supportive factors for the macroeconomic backdrop.
Contributors to Performance
Relative to the MSCI All Country World (ex-US) Index, favorable security selection within the financials sector contributed to the fund's performance, led by its overweight positions in investment management and banking firm UBS Group (Switzerland), global banking group BNP Paribas (France), insurance and financial services company Fairfax Financial Holdings (Canada) and financial services company Erste Group Bank (Austria). The stock price of UBS Group rose after the company
Management Review - continued
posted profit results above expectations, mainly due to higher-than-expected non-recurring items and a lower-than-expected tax rate. Additionally, UBS Group acquired Credit Suisse following its collapse, which further supported the stock.
Stock selection in the energy sector further benefited the fund’s relative returns. Here, an overweight position in energy company Eni (Italy) aided relative performance as the firm reported a strong set of financial results led by better-than-anticipated operating income growth and record-level free cash flow generation.
Stocks in other sectors that were among the fund's top relative contributors included overweight positions in power and gas company E.ON (Germany), pharmaceutical company Novartis (Switzerland) and electrical distribution equipment manufacturer Schneider Electric (France). The fund’s holdings of industrial gas supplier Linde(b) (United Kingdom) and pachinko and pachislot machines manufacturer Sankyo Co.(b) (Japan) further strengthened relative results.
During the reporting period, the fund’s relative currency exposure, resulting primarily from differences between the fund's and the benchmark's exposures to holdings of securities denominated in foreign currencies, was another contributor to relative performance. All of MFS’ investment decisions are driven by the fundamentals of each individual opportunity and as such, it is common for our funds to have different currency exposure than the benchmark.
Detractors from Performance
Security selection within both the communication services and information technology sectors detracted from the fund’s relative performance. Within the communication services sector, the fund's overweight positions in telecommunication tower lease provider PT Telekom Indonesia (Indonesia) and video game developer NCSoft(h) (South Korea) held back relative returns. The stock price of PT Telekom Indonesia declined after the company reported revenue results that missed expectations, largely due to unrealized investment losses. Within the information technology sector, the fund’s overweight holdings of telecommunications equipment provider Ericsson(h) (Sweden) and not owning shares of strong-performing enterprise applications company SAP (Germany), hurt relative performance. The stock price of SAP rose as the company reported above-consensus revenues and earnings, driven by strong growth in its Cloud business.
Elsewhere, the fund’s overweight positions in fertilizer producer Nutrien (Canada), beverage and pharmaceutical products manufacturer Kirin Holdings (Japan), tobacco distributor British American Tobacco (United Kingdom) and online direct sales company JD.com (China) weakened relative returns. The timing of the fund’s ownership in shares of pharmaceutical company Novo Nordisk(h) (Denmark) and real estate company LEG Immobilien(h) (Germany) further dampened relative performance.
Management Review - continued
Respectfully,
Portfolio Manager(s)
Jim Fallon, Matt Krummell, Jonathan Sage, and Jed Stocks
| (b) | Security is not a benchmark constituent. |
| (h) | Security was not held in the portfolio at period end. |
The views expressed in this report are those of the portfolio manager(s) only through the end of the period of the report as stated on the cover and do not necessarily reflect the views of MFS or any other person in the MFS organization. These views are subject to change at any time based on market or other conditions, and MFS disclaims any responsibility to update such views. These views may not be relied upon as investment advice or an indication of trading intent on behalf of any MFS portfolio. References to specific securities are not recommendations of such securities, and may not be representative of any MFS portfolio’s current or future investments.
Performance Summary THROUGH 8/31/23
The following chart illustrates a representative class of the fund’s historical performance in comparison to its benchmark(s). Performance results include the deduction of the maximum applicable sales charge and reflect the percentage change in net asset value, including reinvestment of dividends and capital gains distributions. The performance of other share classes will be greater than or less than that of the class depicted below. Benchmarks are unmanaged and may not be invested in directly. Benchmark returns do not reflect sales charges, commissions or expenses. (See Notes to Performance Summary.)
Performance data shown represents past performance and is no guarantee of future results. Investment return and principal value fluctuate so your shares, when sold, may be worth more or less than the original cost; current performance may be lower or higher than quoted. The performance shown does not reflect the deduction of taxes, if any, that a shareholder would pay on fund distributions or the redemption of fund shares.
Growth of a Hypothetical $10,000 Investment (t)
Performance Summary - continued
Total Returns through 8/31/23
Average annual without sales charge
| Share Class | Class Inception Date | 1-yr | 5-yr | Life (t) |
| A | 9/15/15 | 13.60% | 4.23% | 5.25% |
| B | 9/15/15 | 12.81% | 3.42% | 4.44% |
| C | 9/15/15 | 12.72% | 3.42% | 4.44% |
| I | 9/15/15 | 13.92% | 4.46% | 5.49% |
| R1 | 9/15/15 | 12.68% | 3.41% | 4.44% |
| R2 | 9/15/15 | 13.31% | 3.93% | 4.96% |
| R3 | 9/15/15 | 13.67% | 4.20% | 5.25% |
| R4 | 9/15/15 | 13.83% | 4.45% | 5.50% |
| R6 | 9/15/15 | 13.94% | 4.56% | 5.57% |
Comparative benchmark(s)
| | | | |
| MSCI All Country World (ex-US) Index (net div) (f) | 11.89% | 3.33% | 5.38% |
Average annual with sales charge
| | | | |
A
With Initial Sales Charge (5.75%) | 7.07% | 3.00% | 4.47% |
B
With CDSC (Declining over six years from 4% to 0%) (v) | 8.81% | 3.07% | 4.44% |
C
With CDSC (1% for 12 months) (v) | 11.72% | 3.42% | 4.44% |
CDSC – Contingent Deferred Sales Charge.
Class I, R1, R2, R3, R4, and R6 shares do not have a sales charge.
| (f) | Source: FactSet Research Systems Inc. |
| (t) | For the period from the class inception date through the stated period end. (See Notes to Performance Summary.) |
| (v) | Assuming redemption at the end of the applicable period. |
Benchmark Definition(s)
MSCI All Country World (ex-US) Index(e) (net div) – a market capitalization-weighted index that is designed to measure equity market performance in the developed and emerging markets, excluding the U.S.
It is not possible to invest directly in an index.
| (e) | Morgan Stanley Capital International (“MSCI”) makes no express or implied warranties or representations and shall have no liability whatsoever with respect to any MSCI data contained herein. The MSCI data may not be further redistributed or used as a basis for other indices or any securities or financial products. This report is not approved, reviewed, or produced by MSCI. |
Performance Summary - continued
Notes to Performance Summary
Average annual total return represents the average annual change in value for each share class for the periods presented. Life returns are presented where the share class has less than 10 years of performance history and represent the average annual total return from the class inception date to the stated period end date.
Performance results reflect any applicable expense subsidies and waivers in effect during the periods shown. Without such subsidies and waivers the fund's performance results would be less favorable. Please see the prospectus and financial statements for complete details.
Performance results do not include adjustments made for financial reporting purposes in accordance with U.S. generally accepted accounting principles and may differ from amounts reported in the financial highlights.
From time to time the fund may receive proceeds from litigation settlements, without which performance would be lower.
Expense Table
Fund expenses borne by the shareholders during the period,
March 1, 2023 through August 31, 2023
As a shareholder of the fund, you incur two types of costs: (1) transaction costs, including sales charges (loads) on certain purchase or redemption payments, and (2) ongoing costs, including management fees; distribution and service (12b-1) fees; and other fund expenses. This example is intended to help you understand your ongoing costs (in dollars) of investing in the fund and to compare these costs with the ongoing costs of investing in other mutual funds.
The example is based on an investment of $1,000 invested at the beginning of the period and held for the entire period March 1, 2023 through August 31, 2023.
Actual Expenses
The first line for each share class in the following table provides information about actual account values and actual expenses. You may use the information in this line, together with the amount you invested, to estimate the expenses that you paid over the period. Simply divide your account value by $1,000 (for example, an $8,600 account value divided by $1,000 = 8.6), then multiply the result by the number in the first line under the heading entitled “Expenses Paid During Period” to estimate the expenses you paid on your account during this period.
Hypothetical Example for Comparison Purposes
The second line for each share class in the following table provides information about hypothetical account values and hypothetical expenses based on the fund’s actual expense ratio and an assumed rate of return of 5% per year before expenses, which is not the fund’s actual return. The hypothetical account values and expenses may not be used to estimate the actual ending account balance or expenses you paid for the period. You may use this information to compare the ongoing costs of investing in the fund and other funds. To do so, compare this 5% hypothetical example with the 5% hypothetical examples that appear in the shareholder reports of the other funds.
Please note that the expenses shown in the table are meant to highlight your ongoing costs only and do not reflect any transactional costs, such as sales charges (loads). Therefore, the second line for each share class in the table is useful in comparing ongoing costs only, and will not help you determine the relative total costs of owning different funds. In addition, if these transactional costs were included, your costs would have been higher.
Expense Table - continued
Share
Class | | Annualized
Expense
Ratio | Beginning
Account Value
3/01/23 | Ending
Account Value
8/31/23 | Expenses
Paid During
Period (p)
3/01/23-8/31/23 |
| A | Actual | 0.89% | $1,000.00 | $1,035.56 | $4.57 |
| Hypothetical (h) | 0.89% | $1,000.00 | $1,020.72 | $4.53 |
| B | Actual | 1.64% | $1,000.00 | $1,031.97 | $8.40 |
| Hypothetical (h) | 1.64% | $1,000.00 | $1,016.94 | $8.34 |
| C | Actual | 1.64% | $1,000.00 | $1,032.09 | $8.40 |
| Hypothetical (h) | 1.64% | $1,000.00 | $1,016.94 | $8.34 |
| I | Actual | 0.64% | $1,000.00 | $1,036.91 | $3.29 |
| Hypothetical (h) | 0.64% | $1,000.00 | $1,021.98 | $3.26 |
| R1 | Actual | 1.64% | $1,000.00 | $1,031.45 | $8.40 |
| Hypothetical (h) | 1.64% | $1,000.00 | $1,016.94 | $8.34 |
| R2 | Actual | 1.14% | $1,000.00 | $1,033.63 | $5.84 |
| Hypothetical (h) | 1.14% | $1,000.00 | $1,019.46 | $5.80 |
| R3 | Actual | 0.89% | $1,000.00 | $1,035.97 | $4.57 |
| Hypothetical (h) | 0.89% | $1,000.00 | $1,020.72 | $4.53 |
| R4 | Actual | 0.64% | $1,000.00 | $1,036.87 | $3.29 |
| Hypothetical (h) | 0.64% | $1,000.00 | $1,021.98 | $3.26 |
| R6 | Actual | 0.56% | $1,000.00 | $1,036.84 | $2.88 |
| Hypothetical (h) | 0.56% | $1,000.00 | $1,022.38 | $2.85 |
| (h) | 5% class return per year before expenses. |
| (p) | “Expenses Paid During Period” are equal to each class’s annualized expense ratio, as shown above, multiplied by the average account value over the period, multiplied by 184/365 (to reflect the one-half year period). Expenses paid do not include any applicable sales charges (loads). If these transaction costs had been included, your costs would have been higher. |
Portfolio of Investments
8/31/23
The Portfolio of Investments is a complete list of all securities owned by your fund. It is categorized by broad-based asset classes.
| Issuer | | | Shares/Par | Value ($) |
| Common Stocks – 98.1% |
| Aerospace & Defense – 0.7% | |
| Thales S.A. | | 29,764 | $4,350,617 |
| Airlines – 0.8% | |
| Air Canada (a) | | 294,688 | $4,976,895 |
| Alcoholic Beverages – 1.1% | |
| Ambev S.A. | | 415,500 | $1,161,240 |
| Kirin Holdings Co. Ltd. | | 397,100 | 5,584,155 |
| | | | | $6,745,395 |
| Apparel Manufacturers – 3.4% | |
| Burberry Group PLC | | 70,212 | $1,942,548 |
| Compagnie Financiere Richemont S.A. | | 64,727 | 9,203,273 |
| LVMH Moet Hennessy Louis Vuitton SE | | 11,641 | 9,873,652 |
| | | | | $21,019,473 |
| Automotive – 2.5% | |
| BYD Co. Ltd. | | 92,500 | $2,899,195 |
| DENSO Corp. | | 41,000 | 2,806,413 |
| Kia Corp. | | 34,354 | 2,084,502 |
| Mahindra & Mahindra Ltd. | | 266,022 | 5,062,327 |
| Stellantis N.V. | | 143,690 | 2,676,198 |
| | | | | $15,528,635 |
| Biotechnology – 0.2% | |
| CSL Ltd. | | 7,080 | $1,254,815 |
| Brokerage & Asset Managers – 1.1% | |
| Hong Kong Exchanges & Clearing Ltd. | | 32,700 | $1,267,579 |
| iA Financial Corp., Inc. | | 41,165 | 2,582,562 |
| IG Group Holdings PLC | | 348,703 | 2,988,349 |
| | | | | $6,838,490 |
| Business Services – 1.6% | |
| CGI, Inc. (a) | | 33,863 | $3,531,155 |
| Serco Group PLC | | 1,301,429 | 2,520,785 |
| Tata Consultancy Services Ltd. | | 47,545 | 1,927,845 |
| TIS, Inc. | | 71,800 | 1,696,117 |
| | | | | $9,675,902 |
Portfolio of Investments – continued
| Issuer | | | Shares/Par | Value ($) |
| Common Stocks – continued |
| Chemicals – 1.1% | |
| Nutrien Ltd. | | 71,257 | $4,513,681 |
| UPL Ltd. | | 310,665 | 2,218,359 |
| | | | | $6,732,040 |
| Computer Software – 1.8% | |
| Check Point Software Technologies Ltd. (a) | | 49,411 | $6,650,226 |
| Kingsoft Corp. | | 814,200 | 3,249,595 |
| Wisetech Global Ltd. | | 24,835 | 1,118,383 |
| | | | | $11,018,204 |
| Computer Software - Systems – 5.4% | |
| Amadeus IT Group S.A. | | 31,072 | $2,132,763 |
| Constellation Software, Inc. | | 3,175 | 6,521,674 |
| Fujitsu Ltd. | | 30,000 | 3,753,737 |
| Hitachi Ltd. | | 79,200 | 5,276,915 |
| Hon Hai Precision Industry Co. Ltd. | | 1,505,000 | 5,032,971 |
| Samsung Electronics Co. Ltd. | | 213,805 | 10,821,679 |
| | | | | $33,539,739 |
| Construction – 0.9% | |
| CEMEX S.A.B. de C.V. (a) | | 2,513,374 | $1,982,633 |
| Heidelberg Materials AG | | 41,594 | 3,350,212 |
| | | | | $5,332,845 |
| Consumer Products – 0.8% | |
| AmorePacific Corp. | | 20,542 | $2,081,009 |
| Reckitt Benckiser Group PLC | | 37,794 | 2,729,970 |
| | | | | $4,810,979 |
| Containers – 0.7% | |
| Brambles Ltd. | | 302,911 | $2,938,179 |
| Viscofan S.A. | | 19,613 | 1,276,042 |
| | | | | $4,214,221 |
| Electrical Equipment – 2.5% | |
| Legrand S.A. | | 18,800 | $1,857,146 |
| Mitsubishi Electric Corp. | | 503,300 | 6,569,069 |
| Schneider Electric SE | | 40,531 | 6,969,561 |
| | | | | $15,395,776 |
| Electronics – 5.5% | |
| ASML Holding N.V. | | 20,776 | $13,695,055 |
| Novatek Microelectronics Corp. | | 161,000 | 2,019,672 |
| NXP Semiconductors N.V. | | 11,422 | 2,349,734 |
Portfolio of Investments – continued
| Issuer | | | Shares/Par | Value ($) |
| Common Stocks – continued |
| Electronics – continued | |
| Renesas Electronics Corp. (a) | | 250,800 | $4,224,100 |
| Taiwan Semiconductor Manufacturing Co. Ltd., ADR | | 123,565 | 11,561,977 |
| | | | | $33,850,538 |
| Energy - Independent – 0.2% | |
| Canadian Natural Resources Ltd. | | 20,907 | $1,352,642 |
| Energy - Integrated – 5.9% | |
| Cenovus Energy, Inc. | | 199,845 | $3,984,476 |
| China Petroleum & Chemical Corp. | | 10,700,000 | 6,262,536 |
| Eni S.p.A. | | 586,297 | 9,081,074 |
| LUKOIL PJSC (a)(u) | | 35,153 | 0 |
| Petroleo Brasileiro S.A., ADR | | 332,049 | 4,665,288 |
| Suncor Energy, Inc. (l) | | 124,442 | 4,215,298 |
| TotalEnergies SE | | 132,676 | 8,354,374 |
| | | | | $36,563,046 |
| Engineering - Construction – 0.5% | |
| Doosan Bobcat, Inc. | | 79,227 | $3,224,825 |
| Food & Beverages – 1.6% | |
| AVI Ltd. | | 406,647 | $1,561,990 |
| Ezaki Glico Co. Ltd. | | 119,200 | 3,147,643 |
| Gruma S.A.B. de C.V. | | 162,784 | 2,717,411 |
| Nestle S.A. | | 20,166 | 2,429,006 |
| | | | | $9,856,050 |
| Food & Drug Stores – 2.3% | |
| Loblaw Cos. Ltd. | | 31,946 | $2,773,997 |
| Sugi Holdings Co. Ltd. | | 60,300 | 2,710,070 |
| Tesco PLC | | 2,536,588 | 8,537,866 |
| | | | | $14,021,933 |
| Furniture & Appliances – 0.7% | |
| Howden Joinery Group PLC | | 498,873 | $4,675,329 |
| Gaming & Lodging – 1.5% | |
| Aristocrat Leisure Ltd. | | 108,323 | $2,870,685 |
| Flutter Entertainment PLC (a) | | 6,271 | 1,141,714 |
| Sands China Ltd. (a) | | 515,200 | 1,744,191 |
| Whitbread PLC | | 86,125 | 3,753,146 |
| | | | | $9,509,736 |
| General Merchandise – 0.8% | |
| B&M European Value Retail S.A. | | 681,070 | $4,983,412 |
Portfolio of Investments – continued
| Issuer | | | Shares/Par | Value ($) |
| Common Stocks – continued |
| Insurance – 5.3% | |
| AUB Group Ltd. | | 72,606 | $1,450,399 |
| China Pacific Insurance Co. Ltd. | | 2,507,600 | 5,742,730 |
| Fairfax Financial Holdings Ltd. | | 5,396 | 4,449,823 |
| Manulife Financial Corp. | | 454,548 | 8,403,352 |
| Ping An Insurance Co. of China Ltd., “H” | | 854,000 | 5,112,664 |
| Samsung Fire & Marine Insurance Co. Ltd. | | 29,707 | 5,540,212 |
| Tokio Marine Holding, Inc. | | 106,400 | 2,359,894 |
| | | | | $33,059,074 |
| Internet – 2.7% | |
| Moneysupermarket.com Group PLC | | 874,877 | $2,753,001 |
| NetEase, Inc., ADR | | 54,479 | 5,637,487 |
| Tencent Holdings Ltd. | | 205,700 | 8,524,550 |
| | | | | $16,915,038 |
| Leisure & Toys – 0.8% | |
| Sankyo Co. Ltd. | | 114,700 | $5,002,038 |
| Machinery & Tools – 2.0% | |
| GEA Group AG | | 68,402 | $2,699,852 |
| OSG Corp. | | 220,700 | 2,789,562 |
| Volvo Group | | 344,482 | 6,959,804 |
| | | | | $12,449,218 |
| Major Banks – 8.3% | |
| ABN AMRO Group N.V., GDR | | 425,980 | $6,279,689 |
| Bank of China Ltd. | | 4,278,000 | 1,451,029 |
| Bank of Ireland Group PLC | | 344,822 | 3,439,205 |
| BNP Paribas | | 126,549 | 8,193,614 |
| DBS Group Holdings Ltd. | | 349,500 | 8,611,750 |
| Erste Group Bank AG | | 87,008 | 3,110,626 |
| National Australia Bank Ltd. | | 181,409 | 3,404,073 |
| NatWest Group PLC | | 1,745,718 | 5,095,237 |
| Nedbank Group Ltd. | | 215,820 | 2,466,302 |
| UBS Group AG | | 173,568 | 4,617,477 |
| UniCredit S.p.A. | | 201,080 | 4,920,100 |
| | | | | $51,589,102 |
| Medical & Health Technology & Services – 1.2% | |
| Fresenius Medical Care AG & Co. KGaA | | 60,726 | $2,933,540 |
| OdontoPrev S.A. | | 711,700 | 1,486,047 |
| Sonic Healthcare Ltd. | | 136,717 | 2,848,919 |
| | | | | $7,268,506 |
Portfolio of Investments – continued
| Issuer | | | Shares/Par | Value ($) |
| Common Stocks – continued |
| Medical Equipment – 1.3% | |
| Fisher & Paykel Healthcare Corp. Ltd. | | 146,658 | $1,986,039 |
| Olympus Corp. | | 448,700 | 6,076,933 |
| | | | | $8,062,972 |
| Metals & Mining – 3.3% | |
| Glencore PLC | | 1,427,126 | $7,619,320 |
| Rio Tinto PLC | | 116,131 | 7,168,162 |
| Sojitz Corp. | | 145,800 | 3,138,566 |
| Vale S.A. | | 181,400 | 2,383,965 |
| | | | | $20,310,013 |
| Other Banks & Diversified Financials – 5.0% | |
| Bangkok Bank Public Co. Ltd. | | 710,000 | $3,436,710 |
| China Construction Bank Corp. | | 8,335,000 | 4,463,840 |
| Credicorp Ltd. | | 17,190 | 2,431,182 |
| Emirates NBD PJSC | | 360,775 | 1,605,955 |
| Hana Financial Group, Inc. | | 82,812 | 2,477,938 |
| Julius Baer Group Ltd. | | 62,593 | 4,354,973 |
| KB Financial Group, Inc. | | 57,369 | 2,348,147 |
| Komercní banka A.S. | | 99,404 | 3,110,322 |
| Macquarie Group Ltd. | | 38,459 | 4,423,960 |
| Sberbank of Russia PJSC (a)(u) | | 715,224 | 0 |
| Tisco Financial Group PCL | | 828,500 | 2,436,939 |
| | | | | $31,089,966 |
| Pharmaceuticals – 7.6% | |
| Astellas Pharma, Inc. | | 87,300 | $1,328,746 |
| Bayer AG | | 131,101 | 7,184,738 |
| Chugai Pharmaceutical Co. Ltd. | | 73,300 | 2,245,425 |
| Novartis AG | | 126,943 | 12,834,414 |
| Roche Holding AG | | 35,698 | 10,519,261 |
| Sanofi | | 79,157 | 8,466,659 |
| Santen Pharmaceutical Co. Ltd. | | 498,900 | 4,644,559 |
| | | | | $47,223,802 |
| Printing & Publishing – 1.3% | |
| Transcontinental, Inc., “A” | | 134,901 | $1,320,855 |
| Wolters Kluwer N.V. | | 55,588 | 6,702,789 |
| | | | | $8,023,644 |
| Railroad & Shipping – 0.5% | |
| Sankyu, Inc. | | 90,900 | $3,176,299 |
Portfolio of Investments – continued
| Issuer | | | Shares/Par | Value ($) |
| Common Stocks – continued |
| Real Estate – 1.1% | |
| Canadian Apartment Properties, REIT | | 54,128 | $1,941,669 |
| CapitaLand India Trusts IEU, REIT | | 1,899,464 | 1,630,381 |
| Charter Hall Group, REIT | | 166,368 | 1,168,532 |
| Goodman Group, REIT | | 135,630 | 2,052,911 |
| | | | | $6,793,493 |
| Restaurants – 1.5% | |
| Sodexo | | 67,473 | $7,244,737 |
| Wetherspoons (J.D.) PLC (a) | | 200,518 | 1,836,536 |
| | | | | $9,081,273 |
| Specialty Chemicals – 2.3% | |
| Linde PLC | | 16,823 | $6,511,174 |
| Nitto Denko Corp. | | 92,700 | 6,338,859 |
| Sumitomo Corp. | | 80,100 | 1,651,053 |
| | | | | $14,501,086 |
| Specialty Stores – 2.5% | |
| Alibaba Group Holding Ltd. (a) | | 665,600 | $7,655,501 |
| JD.com, Inc., “A” | | 73,595 | 1,208,698 |
| Multiplan Empreendimentos Imobiliarios S.A. | | 224,095 | 1,119,559 |
| Vipshop Holdings Ltd., ADR (a) | | 110,291 | 1,741,495 |
| Walmart de Mexico S.A.B. de C.V. | | 935,047 | 3,683,593 |
| | | | | $15,408,846 |
| Telecommunications - Wireless – 2.3% | |
| KDDI Corp. | | 291,600 | $8,668,133 |
| PT Telekom Indonesia | | 19,167,800 | 4,694,412 |
| Vodafone Group PLC | | 1,342,777 | 1,245,323 |
| | | | | $14,607,868 |
| Telephone Services – 0.5% | |
| Hellenic Telecommunications Organization S.A. | | 200,025 | $2,993,182 |
| Tobacco – 1.6% | |
| British American Tobacco PLC | | 192,263 | $6,387,325 |
| Japan Tobacco, Inc. | | 163,200 | 3,579,307 |
| | | | | $9,966,632 |
| Trucking – 1.0% | |
| Yamato Holdings Co. Ltd. | | 317,100 | $5,964,082 |
Portfolio of Investments – continued
| Issuer | | | Shares/Par | Value ($) |
| Common Stocks – continued |
| Utilities - Electric Power – 2.4% | |
| CLP Holdings Ltd. | | 199,500 | $1,564,486 |
| E.ON SE | | 530,847 | 6,550,604 |
| Iberdrola S.A. | | 579,350 | 6,885,275 |
| | | | | $15,000,365 |
| Total Common Stocks (Identified Cost, $550,630,099) | | $607,958,036 |
| Preferred Stocks – 0.8% |
| Metals & Mining – 0.8% | | | | |
| Gerdau S.A. (Identified Cost, $4,404,175) | | 939,130 | $4,902,315 |
| | Strike
Price | First
Exercise | | |
| Rights – 0.0% |
| Computer Software - Systems – 0.0% |
| Constellation Software, Inc. (CAD 100 principal amount of Series 1 Debentures for 3.03 rights, Expiration 10/13/23) (a) (Identified Cost, $1,400) | CAD 133 | 8/31/23 | 3,156 | $1,752 |
| Warrants – 0.0% | | | | |
| Computer Software - Systems – 0.0% |
| Constellation Software, Inc. (CAD 100 principal amount of Series 2 Debentures for 1 warrant, Expiration 3/31/40) (a) (Identified Cost, $0) | CAD 11.5 | N/A | 3,156 | $0 |
| | | | | |
| Investment Companies (h) – 1.0% |
| Money Market Funds – 1.0% | |
| MFS Institutional Money Market Portfolio, 5.3% (v) (Identified Cost, $6,449,121) | | | 6,449,120 | $6,449,765 |
| Collateral for Securities Loaned – 0.4% |
| State Street Navigator Securities Lending Government Money Market Portfolio, 5.34% (j) (Identified Cost, $2,187,665) | | | 2,187,665 | $2,187,665 |
|
|
| Other Assets, Less Liabilities – (0.3)% | | (1,560,719) |
| Net Assets – 100.0% | $619,938,814 |
| (a) | Non-income producing security. | | | |
| (h) | An affiliated issuer, which may be considered one in which the fund owns 5% or more of the outstanding voting securities, or a company which is under common control. At period end, the aggregate values of the fund's investments in affiliated issuers and in unaffiliated issuers were $6,449,765 and $615,049,768, respectively. | | | |
| (j) | The rate quoted is the annualized seven-day yield of the fund at period end. | | | |
Portfolio of Investments – continued
| (l) | A portion of this security is on loan. See Note 2 for additional information. | | | |
| (u) | The security was valued using significant unobservable inputs and is considered level 3 under the fair value hierarchy. For further information about the fund’s level 3 holdings, please see Note 2 in the Notes to Financial Statements. | | | |
| (v) | Affiliated issuer that is available only to investment companies managed by MFS. The rate quoted for the MFS Institutional Money Market Portfolio is the annualized seven-day yield of the fund at period end. | | | |
| The following abbreviations are used in this report and are defined: |
| ADR | American Depositary Receipt |
| GDR | Global Depositary Receipt |
| IEU | International Equity Unit |
| PCL | Public Company Limited |
| REIT | Real Estate Investment Trust |
| Abbreviations indicate amounts shown in currencies other than the U.S. dollar. All amounts are stated in U.S. dollars unless otherwise indicated. A list of abbreviations is shown below: |
| CAD | Canadian Dollar |
See Notes to Financial Statements
Financial Statements
Statement of Assets and Liabilities
At 8/31/23
This statement represents your fund’s balance sheet, which details the assets and liabilities comprising the total value of the fund.
| Assets | |
| Investments in unaffiliated issuers, at value, including $2,060,547 of securities on loan (identified cost, $557,223,339) | $615,049,768 |
| Investments in affiliated issuers, at value (identified cost, $6,449,121) | 6,449,765 |
| Foreign currency, at value (identified cost, $27,824) | 27,886 |
| Receivables for | |
| Investments sold | 1,481,028 |
| Fund shares sold | 280,688 |
| Interest and dividends | 2,965,212 |
| Receivable from investment adviser | 26,060 |
| Other assets | 465 |
| Total assets | $626,280,872 |
| Liabilities | |
| Payables for | |
| Investments purchased | $2,567,890 |
| Fund shares reacquired | 1,129,686 |
| Collateral for securities loaned, at value (c) | 2,187,665 |
| Payable to affiliates | |
| Administrative services fee | 545 |
| Shareholder servicing costs | 102,447 |
| Distribution and service fees | 557 |
| Payable for independent Trustees' compensation | 13 |
| Deferred foreign capital gains tax expense payable | 145,901 |
| Accrued expenses and other liabilities | 207,354 |
| Total liabilities | $6,342,058 |
| Net assets | $619,938,814 |
| Net assets consist of | |
| Paid-in capital | $573,798,770 |
| Total distributable earnings (loss) | 46,140,044 |
| Net assets | $619,938,814 |
| Shares of beneficial interest outstanding | 52,460,246 |
| (c) | Non-cash collateral is not included. |
Statement of Assets and Liabilities – continued
| | Net assets | Shares
outstanding | Net asset value
per share (a) |
| Class A | $27,915,757 | 2,338,099 | $11.94 |
| Class B | 153,892 | 13,245 | 11.62 |
| Class C | 417,646 | 36,067 | 11.58 |
| Class I | 251,004,451 | 21,272,735 | 11.80 |
| Class R1 | 878,779 | 76,530 | 11.48 |
| Class R2 | 2,744,199 | 234,884 | 11.68 |
| Class R3 | 1,227,677 | 103,984 | 11.81 |
| Class R4 | 391,215 | 33,126 | 11.81 |
| Class R6 | 335,205,198 | 28,351,576 | 11.82 |
| (a) | Maximum offering price per share was equal to the net asset value per share for all share classes, except for Class A, for which the maximum offering price per share was $12.67 [100 / 94.25 x $11.94]. On sales of $50,000 or more, the maximum offering price of Class A shares is reduced. A contingent deferred sales charge may be imposed on redemptions of Class A, Class B, and Class C shares. Redemption price per share was equal to the net asset value per share for Classes I, R1, R2, R3, R4, and R6. |
See Notes to Financial Statements
Financial Statements
Statement of Operations
Year ended 8/31/23
This statement describes how much your fund earned in investment income and accrued in expenses. It also describes any gains and/or losses generated by fund operations.
| Net investment income (loss) | |
| Income | |
| Dividends | $22,971,400 |
| Dividends from affiliated issuers | 235,703 |
| Other | 51,024 |
| Income on securities loaned | 22,732 |
| Foreign taxes withheld | (2,141,244) |
| Total investment income | $21,139,615 |
| Expenses | |
| Management fee | $2,827,322 |
| Distribution and service fees | 89,127 |
| Shareholder servicing costs | 237,869 |
| Administrative services fee | 92,712 |
| Independent Trustees' compensation | 11,409 |
| Custodian fee | 267,078 |
| Shareholder communications | 19,419 |
| Audit and tax fees | 89,013 |
| Legal fees | 3,286 |
| Miscellaneous | 200,349 |
| Total expenses | $3,837,584 |
| Reduction of expenses by investment adviser | (379,425) |
| Net expenses | $3,458,159 |
| Net investment income (loss) | $17,681,456 |
| Realized and unrealized gain (loss) |
| Realized gain (loss) (identified cost basis) | |
| Unaffiliated issuers | $(21,335,868) |
| Affiliated issuers | (2,239) |
| Foreign currency | (41,596) |
| Net realized gain (loss) | $(21,379,703) |
| Change in unrealized appreciation or depreciation | |
| Unaffiliated issuers (net of $29,433 increase in deferred foreign capital gains tax) | $78,306,099 |
| Affiliated issuers | 369 |
| Translation of assets and liabilities in foreign currencies | 87,578 |
| Net unrealized gain (loss) | $78,394,046 |
| Net realized and unrealized gain (loss) | $57,014,343 |
| Change in net assets from operations | $74,695,799 |
See Notes to Financial Statements
Financial Statements
Statements of Changes in Net Assets
These statements describe the increases and/or decreases in net assets resulting from operations, any distributions, and any shareholder transactions.
| | Year ended |
| | 8/31/23 | 8/31/22 |
| Change in net assets | | |
| From operations | | |
| Net investment income (loss) | $17,681,456 | $13,597,485 |
| Net realized gain (loss) | (21,379,703) | 7,154,585 |
| Net unrealized gain (loss) | 78,394,046 | (104,963,630) |
| Change in net assets from operations | $74,695,799 | $(84,211,560) |
| Total distributions to shareholders | $(14,738,424) | $(29,920,932) |
| Change in net assets from fund share transactions | $70,429,407 | $175,854,988 |
| Total change in net assets | $130,386,782 | $61,722,496 |
| Net assets | | |
| At beginning of period | 489,552,032 | 427,829,536 |
| At end of period | $619,938,814 | $489,552,032 |
See Notes to Financial Statements
Financial Statements
Financial Highlights
The financial highlights table is intended to help you understand the fund's financial performance for the past 5 years. Certain information reflects financial results for a single fund share. The total returns in the table represent the rate that an investor would have earned (or lost) on an investment in the fund share class (assuming reinvestment of all distributions) held for the entire period.
| Class A | Year ended |
| | 8/31/23 | 8/31/22 | 8/31/21 | 8/31/20 | 8/31/19 |
| Net asset value, beginning of period | $10.77 | $13.71 | $10.79 | $10.37 | $11.71 |
| Income (loss) from investment operations |
| Net investment income (loss) (d) | $0.33 | $0.31 | $0.31 | $0.25 | $0.30 |
| Net realized and unrealized gain (loss) | 1.12 | (2.57) | 2.87 | 0.47 | (1.01) |
| Total from investment operations | $1.45 | $(2.26) | $3.18 | $0.72 | $(0.71) |
| Less distributions declared to shareholders |
| From net investment income | $(0.19) | $(0.11) | $(0.26) | $(0.30) | $(0.26) |
| From net realized gain | (0.09) | (0.57) | — | — | (0.37) |
| Total distributions declared to shareholders | $(0.28) | $(0.68) | $(0.26) | $(0.30) | $(0.63) |
| Net asset value, end of period (x) | $11.94 | $10.77 | $13.71 | $10.79 | $10.37 |
| Total return (%) (r)(s)(t)(x) | 13.60 | (17.24) | 29.82 | 6.85 | (5.67) |
Ratios (%) (to average net assets)
and Supplemental data: |
| Expenses before expense reductions | 0.96 | 0.95 | 0.98 | 0.99 | 1.00 |
| Expenses after expense reductions | 0.89 | 0.89 | 0.89 | 0.89 | 0.89 |
| Net investment income (loss) | 2.90 | 2.44 | 2.45 | 2.39 | 2.80 |
| Portfolio turnover | 56 | 52 | 68 | 72 | 58 |
| Net assets at end of period (000 omitted) | $27,916 | $18,999 | $110,106 | $93,455 | $84,917 |
See Notes to Financial Statements
Financial Highlights – continued
| Class B | Year ended |
| | 8/31/23 | 8/31/22 | 8/31/21 | 8/31/20 | 8/31/19 |
| Net asset value, beginning of period | $10.49 | $13.61 | $10.72 | $10.32 | $11.64 |
| Income (loss) from investment operations |
| Net investment income (loss) (d) | $0.23 | $0.23 | $0.22 | $0.17 | $0.24 |
| Net realized and unrealized gain (loss) | 1.10 | (2.55) | 2.85 | 0.47 | (1.02) |
| Total from investment operations | $1.33 | $(2.32) | $3.07 | $0.64 | $(0.78) |
| Less distributions declared to shareholders |
| From net investment income | $(0.11) | $(0.23) | $(0.18) | $(0.24) | $(0.17) |
| From net realized gain | (0.09) | (0.57) | — | — | (0.37) |
| Total distributions declared to shareholders | $(0.20) | $(0.80) | $(0.18) | $(0.24) | $(0.54) |
| Net asset value, end of period (x) | $11.62 | $10.49 | $13.61 | $10.72 | $10.32 |
| Total return (%) (r)(s)(t)(x) | 12.81 | (17.99) | 28.84 | 6.06 | (6.41) |
Ratios (%) (to average net assets)
and Supplemental data: |
| Expenses before expense reductions | 1.71 | 1.70 | 1.72 | 1.74 | 1.75 |
| Expenses after expense reductions | 1.64 | 1.64 | 1.64 | 1.64 | 1.64 |
| Net investment income (loss) | 2.05 | 1.85 | 1.75 | 1.61 | 2.28 |
| Portfolio turnover | 56 | 52 | 68 | 72 | 58 |
| Net assets at end of period (000 omitted) | $154 | $161 | $210 | $148 | $152 |
| Class C | Year ended |
| | 8/31/23 | 8/31/22 | 8/31/21 | 8/31/20 | 8/31/19 |
| Net asset value, beginning of period | $10.48 | $13.59 | $10.70 | $10.28 | $11.59 |
| Income (loss) from investment operations |
| Net investment income (loss) (d) | $0.23 | $0.23 | $0.23 | $0.17 | $0.22 |
| Net realized and unrealized gain (loss) | 1.09 | (2.53) | 2.83 | 0.47 | (1.00) |
| Total from investment operations | $1.32 | $(2.30) | $3.06 | $0.64 | $(0.78) |
| Less distributions declared to shareholders |
| From net investment income | $(0.13) | $(0.24) | $(0.17) | $(0.22) | $(0.16) |
| From net realized gain | (0.09) | (0.57) | — | — | (0.37) |
| Total distributions declared to shareholders | $(0.22) | $(0.81) | $(0.17) | $(0.22) | $(0.53) |
| Net asset value, end of period (x) | $11.58 | $10.48 | $13.59 | $10.70 | $10.28 |
| Total return (%) (r)(s)(t)(x) | 12.72 | (17.91) | 28.78 | 6.08 | (6.42) |
Ratios (%) (to average net assets)
and Supplemental data: |
| Expenses before expense reductions | 1.71 | 1.70 | 1.72 | 1.74 | 1.75 |
| Expenses after expense reductions | 1.64 | 1.64 | 1.64 | 1.64 | 1.64 |
| Net investment income (loss) | 2.10 | 1.90 | 1.82 | 1.64 | 2.04 |
| Portfolio turnover | 56 | 52 | 68 | 72 | 58 |
| Net assets at end of period (000 omitted) | $418 | $330 | $382 | $220 | $240 |
See Notes to Financial Statements
Financial Highlights – continued
| Class I | Year ended |
| | 8/31/23 | 8/31/22 | 8/31/21 | 8/31/20 | 8/31/19 |
| Net asset value, beginning of period | $10.63 | $13.78 | $10.84 | $10.42 | $11.77 |
| Income (loss) from investment operations |
| Net investment income (loss) (d) | $0.36 | $0.37 | $0.38 | $0.31 | $0.31 |
| Net realized and unrealized gain (loss) | 1.10 | (2.59) | 2.84 | 0.44 | (1.00) |
| Total from investment operations | $1.46 | $(2.22) | $3.22 | $0.75 | $(0.69) |
| Less distributions declared to shareholders |
| From net investment income | $(0.20) | $(0.36) | $(0.28) | $(0.33) | $(0.29) |
| From net realized gain | (0.09) | (0.57) | — | — | (0.37) |
| Total distributions declared to shareholders | $(0.29) | $(0.93) | $(0.28) | $(0.33) | $(0.66) |
| Net asset value, end of period (x) | $11.80 | $10.63 | $13.78 | $10.84 | $10.42 |
| Total return (%) (r)(s)(t)(x) | 13.92 | (17.13) | 30.14 | 7.09 | (5.45) |
Ratios (%) (to average net assets)
and Supplemental data: |
| Expenses before expense reductions | 0.71 | 0.70 | 0.72 | 0.75 | 0.75 |
| Expenses after expense reductions | 0.64 | 0.64 | 0.64 | 0.64 | 0.64 |
| Net investment income (loss) | 3.14 | 3.09 | 2.91 | 3.06 | 2.89 |
| Portfolio turnover | 56 | 52 | 68 | 72 | 58 |
| Net assets at end of period (000 omitted) | $251,004 | $176,391 | $22,325 | $5,183 | $1,652 |
| Class R1 | Year ended |
| | 8/31/23 | 8/31/22 | 8/31/21 | 8/31/20 | 8/31/19 |
| Net asset value, beginning of period | $10.44 | $13.51 | $10.65 | $10.24 | $11.63 |
| Income (loss) from investment operations |
| Net investment income (loss) (d) | $0.23 | $0.23 | $0.22 | $0.17 | $0.22 |
| Net realized and unrealized gain (loss) | 1.08 | (2.53) | 2.82 | 0.47 | (1.01) |
| Total from investment operations | $1.31 | $(2.30) | $3.04 | $0.64 | $(0.79) |
| Less distributions declared to shareholders |
| From net investment income | $(0.18) | $(0.20) | $(0.18) | $(0.23) | $(0.23) |
| From net realized gain | (0.09) | (0.57) | — | — | (0.37) |
| Total distributions declared to shareholders | $(0.27) | $(0.77) | $(0.18) | $(0.23) | $(0.60) |
| Net asset value, end of period (x) | $11.48 | $10.44 | $13.51 | $10.65 | $10.24 |
| Total return (%) (r)(s)(t)(x) | 12.68 | (17.95) | 28.83 | 6.13 | (6.44) |
Ratios (%) (to average net assets)
and Supplemental data: |
| Expenses before expense reductions | 1.71 | 1.70 | 1.72 | 1.74 | 1.75 |
| Expenses after expense reductions | 1.64 | 1.64 | 1.64 | 1.64 | 1.64 |
| Net investment income (loss) | 2.08 | 1.95 | 1.74 | 1.63 | 2.09 |
| Portfolio turnover | 56 | 52 | 68 | 72 | 58 |
| Net assets at end of period (000 omitted) | $879 | $314 | $233 | $166 | $146 |
See Notes to Financial Statements
Financial Highlights – continued
| Class R2 | Year ended |
| | 8/31/23 | 8/31/22 | 8/31/21 | 8/31/20 | 8/31/19 |
| Net asset value, beginning of period | $10.55 | $13.72 | $10.80 | $10.38 | $11.73 |
| Income (loss) from investment operations |
| Net investment income (loss) (d) | $0.31 | $0.31 | $0.29 | $0.22 | $0.27 |
| Net realized and unrealized gain (loss) | 1.08 | (2.57) | 2.86 | 0.47 | (1.01) |
| Total from investment operations | $1.39 | $(2.26) | $3.15 | $0.69 | $(0.74) |
| Less distributions declared to shareholders |
| From net investment income | $(0.17) | $(0.34) | $(0.23) | $(0.27) | $(0.24) |
| From net realized gain | (0.09) | (0.57) | — | — | (0.37) |
| Total distributions declared to shareholders | $(0.26) | $(0.91) | $(0.23) | $(0.27) | $(0.61) |
| Net asset value, end of period (x) | $11.68 | $10.55 | $13.72 | $10.80 | $10.38 |
| Total return (%) (r)(s)(t)(x) | 13.31 | (17.55) | 29.50 | 6.56 | (5.95) |
Ratios (%) (to average net assets)
and Supplemental data: |
| Expenses before expense reductions | 1.21 | 1.20 | 1.22 | 1.24 | 1.25 |
| Expenses after expense reductions | 1.14 | 1.14 | 1.14 | 1.14 | 1.14 |
| Net investment income (loss) | 2.76 | 2.61 | 2.30 | 2.12 | 2.54 |
| Portfolio turnover | 56 | 52 | 68 | 72 | 58 |
| Net assets at end of period (000 omitted) | $2,744 | $1,261 | $404 | $156 | $164 |
| Class R3 | Year ended |
| | 8/31/23 | 8/31/22 | 8/31/21 | 8/31/20 | 8/31/19 |
| Net asset value, beginning of period | $10.65 | $13.82 | $10.88 | $10.45 | $11.80 |
| Income (loss) from investment operations |
| Net investment income (loss) (d) | $0.35 | $0.32 | $0.29 | $0.25 | $0.30 |
| Net realized and unrealized gain (loss) | 1.09 | (2.58) | 2.91 | 0.49 | (1.02) |
| Total from investment operations | $1.44 | $(2.26) | $3.20 | $0.74 | $(0.72) |
| Less distributions declared to shareholders |
| From net investment income | $(0.19) | $(0.34) | $(0.26) | $(0.31) | $(0.26) |
| From net realized gain | (0.09) | (0.57) | — | — | (0.37) |
| Total distributions declared to shareholders | $(0.28) | $(0.91) | $(0.26) | $(0.31) | $(0.63) |
| Net asset value, end of period (x) | $11.81 | $10.65 | $13.82 | $10.88 | $10.45 |
| Total return (%) (r)(s)(t)(x) | 13.67 | (17.37) | 29.75 | 6.92 | (5.72) |
Ratios (%) (to average net assets)
and Supplemental data: |
| Expenses before expense reductions | 0.96 | 0.95 | 0.96 | 0.99 | 1.00 |
| Expenses after expense reductions | 0.89 | 0.89 | 0.89 | 0.89 | 0.89 |
| Net investment income (loss) | 3.08 | 2.64 | 2.22 | 2.37 | 2.79 |
| Portfolio turnover | 56 | 52 | 68 | 72 | 58 |
| Net assets at end of period (000 omitted) | $1,228 | $532 | $395 | $64 | $58 |
See Notes to Financial Statements
Financial Highlights – continued
| Class R4 | Year ended |
| | 8/31/23 | 8/31/22 | 8/31/21 | 8/31/20 | 8/31/19 |
| Net asset value, beginning of period | $10.65 | $13.79 | $10.85 | $10.42 | $11.77 |
| Income (loss) from investment operations |
| Net investment income (loss) (d) | $0.35 | $0.38 | $0.35 | $0.27 | $0.33 |
| Net realized and unrealized gain (loss) | 1.11 | (2.59) | 2.87 | 0.49 | (1.02) |
| Total from investment operations | $1.46 | $(2.21) | $3.22 | $0.76 | $(0.69) |
| Less distributions declared to shareholders |
| From net investment income | $(0.21) | $(0.36) | $(0.28) | $(0.33) | $(0.29) |
| From net realized gain | (0.09) | (0.57) | — | — | (0.37) |
| Total distributions declared to shareholders | $(0.30) | $(0.93) | $(0.28) | $(0.33) | $(0.66) |
| Net asset value, end of period (x) | $11.81 | $10.65 | $13.79 | $10.85 | $10.42 |
| Total return (%) (r)(s)(t)(x) | 13.83 | (17.09) | 30.12 | 7.18 | (5.45) |
Ratios (%) (to average net assets)
and Supplemental data: |
| Expenses before expense reductions | 0.71 | 0.69 | 0.72 | 0.74 | 0.75 |
| Expenses after expense reductions | 0.64 | 0.64 | 0.64 | 0.64 | 0.64 |
| Net investment income (loss) | 3.08 | 3.11 | 2.73 | 2.62 | 3.04 |
| Portfolio turnover | 56 | 52 | 68 | 72 | 58 |
| Net assets at end of period (000 omitted) | $391 | $329 | $81 | $62 | $58 |
| Class R6 | Year ended |
| | 8/31/23 | 8/31/22 | 8/31/21 | 8/31/20 | 8/31/19 |
| Net asset value, beginning of period | $10.65 | $13.80 | $10.85 | $10.43 | $11.78 |
| Income (loss) from investment operations |
| Net investment income (loss) (d) | $0.35 | $0.37 | $0.36 | $0.29 | $0.34 |
| Net realized and unrealized gain (loss) | 1.12 | (2.58) | 2.88 | 0.47 | (1.02) |
| Total from investment operations | $1.47 | $(2.21) | $3.24 | $0.76 | $(0.68) |
| Less distributions declared to shareholders |
| From net investment income | $(0.21) | $(0.37) | $(0.29) | $(0.34) | $(0.30) |
| From net realized gain | (0.09) | (0.57) | — | — | (0.37) |
| Total distributions declared to shareholders | $(0.30) | $(0.94) | $(0.29) | $(0.34) | $(0.67) |
| Net asset value, end of period (x) | $11.82 | $10.65 | $13.80 | $10.85 | $10.43 |
| Total return (%) (r)(s)(t)(x) | 13.94 | (17.07) | 30.32 | 7.18 | (5.33) |
Ratios (%) (to average net assets)
and Supplemental data: |
| Expenses before expense reductions | 0.62 | 0.62 | 0.63 | 0.65 | 0.65 |
| Expenses after expense reductions | 0.56 | 0.55 | 0.55 | 0.55 | 0.54 |
| Net investment income (loss) | 3.13 | 3.02 | 2.82 | 2.76 | 3.13 |
| Portfolio turnover | 56 | 52 | 68 | 72 | 58 |
| Net assets at end of period (000 omitted) | $335,205 | $291,234 | $293,695 | $247,726 | $206,790 |
See Notes to Financial Statements
Financial Highlights – continued
| (d) | Per share data is based on average shares outstanding. |
| (r) | Certain expenses have been reduced without which performance would have been lower. |
| (s) | From time to time the fund may receive proceeds from litigation settlements, without which performance would be lower. |
| (t) | Total returns do not include any applicable sales charges. |
| (x) | The net asset values and total returns have been calculated on net assets which include adjustments made in accordance with U.S. generally accepted accounting principles required at period end for financial reporting purposes. |
See Notes to Financial Statements
Notes to Financial Statements
(1) Business and Organization
MFS Blended Research International Equity Fund (the fund) is a diversified series of MFS Series Trust IV (the trust). The trust is organized as a Massachusetts business trust and is registered under the Investment Company Act of 1940, as amended, as an open-end management investment company.
The fund is an investment company and accordingly follows the investment company accounting and reporting guidance of the Financial Accounting Standards Board (FASB) Accounting Standards Codification Topic 946 Financial Services - Investment Companies.
(2) Significant Accounting Policies
General — The preparation of financial statements in conformity with U.S. generally accepted accounting principles requires management to make estimates and assumptions that affect the reported amounts of assets and liabilities, and disclosure of contingent assets and liabilities at the date of the financial statements and the reported amounts of increases and decreases in net assets from operations during the reporting period. Actual results could differ from those estimates. In the preparation of these financial statements, management has evaluated subsequent events occurring after the date of the fund’s Statement of Assets and Liabilities through the date that the financial statements were issued. The fund invests in foreign securities, including securities of emerging market issuers. Investments in foreign securities are vulnerable to the effects of changes in the relative values of the local currency and the U.S. dollar and to the effects of changes in each country’s market, economic, industrial, political, regulatory, geopolitical, environmental, public health, and other conditions. Investments in emerging markets can involve additional and greater risks than the risks associated with investments in developed foreign markets. Emerging markets can have less developed markets, greater custody and operational risk, less developed legal, regulatory, accounting, and auditing systems, greater government involvement in the economy, greater risk of new or inconsistent government treatment of or restrictions on issuers and instruments, and greater political, social, and economic instability than developed markets.
Balance Sheet Offsetting — The fund's accounting policy with respect to balance sheet offsetting is that, absent an event of default by the counterparty or a termination of the agreement, the International Swaps and Derivatives Association (ISDA) Master Agreement, or similar agreement, does not result in an offset of reported amounts of financial assets and financial liabilities in the Statement of Assets and Liabilities across transactions between the fund and the applicable counterparty. The fund's right to setoff may be restricted or prohibited by the bankruptcy or insolvency laws of the particular jurisdiction to which a specific master netting agreement counterparty is subject. Balance sheet offsetting disclosures, to the extent applicable to the fund, have been included in the fund’s Significant Accounting Policies note under the captions for each of the fund’s in-scope financial instruments and transactions.
Investment Valuations — Subject to its oversight, the fund's Board of Trustees has delegated primary responsibility for determining or causing to be determined the value of the fund’s investments to MFS as the fund's adviser, pursuant to the fund’s valuation policy and procedures which have been adopted by the adviser and approved by the Board. In accordance with Rule 2a-5 under the Investment Company Act of 1940, the Board of Trustees designated the adviser as the “valuation designee” of the fund. If the
Notes to Financial Statements - continued
adviser, as valuation designee, determines that reliable market quotations are not readily available for an investment, the investment is valued at fair value as determined in good faith by the adviser in accordance with the adviser’s fair valuation policy and procedures.
Under the fund's valuation policy and procedures, equity securities, including restricted equity securities, are generally valued at the last sale or official closing price on their primary market or exchange as provided by a third-party pricing service. Equity securities, for which there were no sales reported that day, are generally valued at the last quoted daily bid quotation on their primary market or exchange as provided by a third-party pricing service. Short-term instruments with a maturity at issuance of 60 days or less may be valued at amortized cost, which approximates market value.
Open-end investment companies are generally valued at net asset value per share. The values of foreign securities and other assets and liabilities expressed in foreign currencies are converted to U.S. dollars using the mean of bid and asked prices for rates provided by a third-party pricing service.
Under the fund’s valuation policy and procedures, market quotations are not considered to be readily available for debt instruments, floating rate loans, and many types of derivatives. These investments are generally valued at fair value based on information from third-party pricing services or otherwise determined by the adviser in accordance with the adviser’s fair valuation policy and procedures. Securities and other assets generally valued on the basis of information from a third-party pricing service may also be valued at a broker/dealer bid quotation. In determining values, third-party pricing services can utilize both transaction data and market information such as yield, quality, coupon rate, maturity, type of issue, trading characteristics, spreads and other market data. An investment may also be valued at fair value if the adviser determines that the investment’s value has been materially affected by events occurring after the close of the exchange or market on which the investment is principally traded (such as foreign exchange or market) and prior to the determination of the fund’s net asset value, or after the halt of trading of a specific security where trading does not resume prior to the close of the exchange or market on which the security is principally traded. Events that occur after foreign markets close (such as developments in foreign markets and significant movements in the U.S. markets) and prior to the determination of the fund’s net asset value may be deemed to have a material effect on the value of securities traded in foreign markets. Accordingly, the fund’s foreign equity securities may often be valued at fair value. The adviser generally relies on third-party pricing services or other information (such as the correlation with price movements of similar securities in the same or other markets; the type, cost and investment characteristics of the security; the business and financial condition of the issuer; and trading and other market data) to assist in determining whether to fair value and at what value to fair value an investment. The value of an investment for purposes of calculating the fund’s net asset value can differ depending on the source and method used to determine value. When fair valuation is used, the value of an investment used to determine the fund’s net asset value may differ from quoted or published prices for the same investment. There can be no assurance that the fund could obtain the fair value assigned to an investment if it were to sell the investment at the same time at which the fund determines its net asset value per share.
Various inputs are used in determining the value of the fund's assets or liabilities. These inputs are categorized into three broad levels. In certain cases, the inputs used to measure fair value may fall into different levels of the fair value hierarchy. In such cases,
Notes to Financial Statements - continued
an investment's level within the fair value hierarchy is based on the lowest level of input that is significant to the fair value measurement. The fund's assessment of the significance of a particular input to the fair value measurement in its entirety requires judgment, and considers factors specific to the investment. Level 1 includes unadjusted quoted prices in active markets for identical assets or liabilities. Level 2 includes other significant observable market-based inputs (including quoted prices for similar securities, interest rates, prepayment speed, and credit risk). Level 3 includes significant unobservable inputs, which may include the adviser's own assumptions in determining the fair value of investments. The following is a summary of the levels used as of August 31, 2023 in valuing the fund's assets and liabilities:
| Financial Instruments | Level 1 | Level 2 | Level 3 | Total |
| Equity Securities: | | | | |
| Japan | $92,731,675 | $— | $— | $92,731,675 |
| United Kingdom | 64,236,309 | — | — | 64,236,309 |
| France | 55,310,360 | — | — | 55,310,360 |
| China | 53,949,320 | — | — | 53,949,320 |
| Canada | 50,569,831 | — | — | 50,569,831 |
| Switzerland | 43,958,404 | — | — | 43,958,404 |
| South Korea | 28,578,312 | — | — | 28,578,312 |
| Netherlands | 26,677,533 | — | — | 26,677,533 |
| Australia | 23,530,856 | — | — | 23,530,856 |
| Other Countries | 167,445,854 | 5,873,649 | 0 | 173,319,503 |
| Mutual Funds | 8,637,430 | — | — | 8,637,430 |
| Total | $615,625,884 | $5,873,649 | $0 | $621,499,533 |
For further information regarding security characteristics, see the Portfolio of Investments. At August 31, 2023, the fund held two level 3 securities valued at $0, which were also held and valued at $0 at August 31, 2022.
Foreign Currency Translation — Purchases and sales of foreign investments, income, and expenses are converted into U.S. dollars based upon currency exchange rates prevailing on the respective dates of such transactions or on the reporting date for foreign denominated receivables and payables. Gains and losses attributable to foreign currency exchange rates on sales of securities are recorded for financial statement purposes as net realized gains and losses on investments. Gains and losses attributable to foreign exchange rate movements on receivables, payables, income and expenses are recorded for financial statement purposes as foreign currency transaction gains and losses. That portion of both realized and unrealized gains and losses on investments that results from fluctuations in foreign currency exchange rates is not separately disclosed.
Security Loans — Under its Securities Lending Agency Agreement with the fund, State Street Bank and Trust Company, as lending agent, loans the securities of the fund to certain qualified institutions (the “Borrowers”) approved by the fund. Security loans can be terminated at the discretion of either the lending agent or the fund and the related securities must be returned within the earlier of the standard trade settlement period for such securities or within three business days. The loans are collateralized by cash and/or U.S. Treasury and federal agency obligations in an amount typically at least equal to the market value of the securities loaned. On loans collateralized by cash, the cash collateral is invested in a money market fund. The market value of the loaned
Notes to Financial Statements - continued
securities is determined at the close of business of the fund and any additional required collateral is delivered to the fund on the next business day. The lending agent provides the fund with indemnification against Borrower default. In the event of Borrower default, the lending agent will, for the benefit of the fund, either purchase securities identical to those loaned or, when such purchase is commercially impracticable, pay the fund the market value of the loaned securities. In return, the lending agent assumes the fund's rights to the related collateral. If the collateral value is less than the cost to purchase identical securities, the lending agent is responsible for the shortfall, but only to the extent that such shortfall is not due to a decline in collateral value resulting from collateral reinvestment for which the fund bears the risk of loss. At period end, the fund had investment securities on loan, all of which were classified as equity securities in the fund's Portfolio of Investments, with a fair value of $2,060,547. The fair value of the fund's investment securities on loan and a related liability of $2,187,665 for cash collateral received on securities loaned are both presented gross in the Statement of Assets and Liabilities. Additionally, these loans were collateralized by U.S. Treasury Obligations of $145,939 held by the lending agent. The collateral on securities loaned exceeded the value of securities on loan at period end. The liability for cash collateral for securities loaned is carried at fair value, which is categorized as level 2 within the fair value hierarchy. A portion of the income generated upon investment of the collateral is remitted to the Borrowers, and the remainder is allocated between the fund and the lending agent. On loans collateralized by U.S. Treasury and/or federal agency obligations, a fee is received from the Borrower, and is allocated between the fund and the lending agent. Income from securities lending is separately reported in the Statement of Operations. The dividend and interest income earned on the securities loaned is accounted for in the same manner as other dividend and interest income.
Indemnifications — Under the fund's organizational documents, its officers and Trustees may be indemnified against certain liabilities and expenses arising out of the performance of their duties to the fund. Additionally, in the normal course of business, the fund enters into agreements with service providers that may contain indemnification clauses. The fund's maximum exposure under these agreements is unknown as this would involve future claims that may be made against the fund that have not yet occurred.
Investment Transactions and Income — Dividends received in cash are recorded on the ex-dividend date. Certain dividends from foreign securities will be recorded when the fund is informed of the dividend if such information is obtained subsequent to the ex-dividend date. Dividend payments received in additional securities are recorded on the ex-dividend date in an amount equal to the value of the security on such date.
The fund may receive proceeds from litigation settlements. Any proceeds received from litigation involving portfolio holdings are reflected in the Statement of Operations in realized gain/loss if the security has been disposed of by the fund or in unrealized gain/loss if the security is still held by the fund. Any other proceeds from litigation not related to portfolio holdings are reflected as other income in the Statement of Operations.
Investment transactions are recorded on the trade date. In determining the net gain or loss on securities sold, the cost of securities is determined on the identified cost basis.
Tax Matters and Distributions — The fund intends to qualify as a regulated investment company, as defined under Subchapter M of the Internal Revenue Code, and to distribute all of its taxable income, including realized capital gains. As a result,
Notes to Financial Statements - continued
no provision for federal income tax is required. The fund’s federal tax returns, when filed, will remain subject to examination by the Internal Revenue Service for a three year period. Management has analyzed the fund’s tax positions taken on federal and state tax returns for all open tax years and does not believe that there are any uncertain tax positions that require recognition of a tax liability. Foreign taxes, if any, have been accrued by the fund in the accompanying financial statements in accordance with the applicable foreign tax law. Foreign income taxes may be withheld by certain countries in which the fund invests. Additionally, capital gains realized by the fund on securities issued in or by certain foreign countries may be subject to capital gains tax imposed by those countries.
Distributions to shareholders are recorded on the ex-dividend date. Income and capital gain distributions are determined in accordance with income tax regulations, which may differ from U.S. generally accepted accounting principles. Certain capital accounts in the financial statements are periodically adjusted for permanent differences in order to reflect their tax character. These adjustments have no impact on net assets or net asset value per share. Temporary differences which arise from recognizing certain items of income, expense, gain or loss in different periods for financial statement and tax purposes will reverse at some time in the future.
Book/tax differences primarily relate to wash sale loss deferrals.
The tax character of distributions declared to shareholders for the last two fiscal years is as follows:
| | Year ended
8/31/23 | Year ended
8/31/22 |
| Ordinary income (including any short-term capital gains) | $10,343,305 | $21,674,755 |
| Long-term capital gains | 4,395,119 | 8,246,177 |
| Total distributions | $14,738,424 | $29,920,932 |
The federal tax cost and the tax basis components of distributable earnings were as follows:
| As of 8/31/23 | |
| Cost of investments | $572,260,012 |
| Gross appreciation | 74,785,970 |
| Gross depreciation | (25,546,449) |
| Net unrealized appreciation (depreciation) | $49,239,521 |
| Undistributed ordinary income | 18,216,006 |
| Capital loss carryforwards | (21,077,266) |
| Other temporary differences | (238,217) |
| Total distributable earnings (loss) | $46,140,044 |
Notes to Financial Statements - continued
As of August 31, 2023, the fund had capital loss carryforwards available to offset future realized gains. These net capital losses may be carried forward indefinitely and their character is retained as short-term and/or long-term losses. Such losses are characterized as follows:
| Short-Term | $(9,915,198) |
| Long-Term | (11,162,068) |
| Total | $(21,077,266) |
Multiple Classes of Shares of Beneficial Interest — The fund offers multiple classes of shares, which differ in their respective distribution and service fees. The fund's income, realized and unrealized gain (loss), and common expenses are allocated to shareholders based on the daily net assets of each class. Dividends are declared separately for each class. Differences in per share dividend rates are generally due to differences in separate class expenses. Class B and Class C shares will convert to Class A shares approximately eight years after purchase. The fund’s distributions declared to shareholders as reported in the Statements of Changes in Net Assets are presented by class as follows:
| | Year
ended
8/31/23 | | Year
ended
8/31/22 |
| Class A | $546,445 | | $721,057 |
| Class B | 2,838 | | 12,333 |
| Class C | 7,387 | | 21,621 |
| Class I | 5,503,685 | | 8,920,924 |
| Class R1 | 17,970 | | 10,834 |
| Class R2 | 33,852 | | 69,003 |
| Class R3 | 15,862 | | 29,347 |
| Class R4 | 9,228 | | 5,437 |
| Class R6 | 8,601,157 | | 20,130,376 |
| Total | $14,738,424 | | $29,920,932 |
(3) Transactions with Affiliates
Investment Adviser — The fund has an investment advisory agreement with MFS to provide overall investment management and related administrative services and facilities to the fund. The management fee is computed daily and paid monthly at the following annual rates based on the fund's average daily net assets:
| Up to $1 billion | 0.50% |
| In excess of $1 billion and up to $2.5 billion | 0.475% |
| In excess of $2.5 billion | 0.45% |
MFS has agreed in writing to reduce its management fee by a specified amount if certain MFS mutual fund assets exceed thresholds agreed to by MFS and the fund's Board of Trustees. MFS has also agreed in writing to waive at least 0.01% of its management fee as part of this agreement. The agreement to waive at least 0.01% of the management fee will continue until modified by the fund's Board of Trustees, but such agreement will continue at least until December 31, 2023. For the year ended August 31, 2023, this management fee reduction amounted to $73,244, which is
Notes to Financial Statements - continued
included in the reduction of total expenses in the Statement of Operations. The management fee incurred for the year ended August 31, 2023 was equivalent to an annual effective rate of 0.49% of the fund's average daily net assets.
The investment adviser has agreed in writing to pay a portion of the fund’s total annual operating expenses, excluding interest, taxes, extraordinary expenses, brokerage and transaction costs, certain tax reclaim recovery expenses (including contingency fees and closing agreement expenses), and investment-related expenses, such that total fund operating expenses do not exceed the following rates annually of each class’s average daily net assets:
| Classes |
| A | B | C | I | R1 | R2 | R3 | R4 | R6 |
| 0.89% | 1.64% | 1.64% | 0.64% | 1.64% | 1.14% | 0.89% | 0.64% | 0.58% |
This written agreement will continue until modified by the fund’s Board of Trustees, but such agreement will continue at least until December 31, 2024. For the year ended August 31, 2023, this reduction amounted to $306,181, which is included in the reduction of total expenses in the Statement of Operations.
Distributor — MFS Fund Distributors, Inc. (MFD), a wholly-owned subsidiary of MFS, as distributor, received $6,703 for the year ended August 31, 2023, as its portion of the initial sales charge on sales of Class A shares of the fund.
The Board of Trustees has adopted a distribution plan for certain share classes pursuant to Rule 12b-1 of the Investment Company Act of 1940.
The fund's distribution plan provides that the fund will pay MFD for services provided by MFD and financial intermediaries in connection with the distribution and servicing of certain share classes. One component of the plan is a distribution fee paid to MFD and another component of the plan is a service fee paid to MFD. MFD may subsequently pay all, or a portion, of the distribution and/or service fees to financial intermediaries. The distribution and service fees are computed daily and paid monthly.
Distribution Plan Fee Table:
| | Distribution
Fee Rate (d) | Service
Fee Rate (d) | Total
Distribution
Plan (d) | Annual
Effective
Rate (e) | Distribution
and Service
Fee |
| Class A | — | 0.25% | 0.25% | 0.25% | $ 63,291 |
| Class B | 0.75% | 0.25% | 1.00% | 1.00% | 1,515 |
| Class C | 0.75% | 0.25% | 1.00% | 1.00% | 3,864 |
| Class R1 | 0.75% | 0.25% | 1.00% | 1.00% | 7,733 |
| Class R2 | 0.25% | 0.25% | 0.50% | 0.50% | 10,397 |
| Class R3 | — | 0.25% | 0.25% | 0.25% | 2,327 |
| Total Distribution and Service Fees | | | | | $89,127 |
| (d) | In accordance with the distribution plan for certain classes, the fund pays distribution and/or service fees equal to these annual percentage rates of each class’s average daily net assets. The distribution and service fee rates disclosed by class represent the current rates in effect at the end of the reporting period. Any rate changes, if applicable, are detailed below. |
| (e) | The annual effective rates represent actual fees incurred under the distribution plan for the year ended August 31, 2023 based on each class's average daily net assets. MFD has |
Notes to Financial Statements - continued
voluntarily agreed to rebate a portion of each class's 0.25% service fee attributable to accounts for which there is no financial intermediary specified on the account except for accounts attributable to MFS or its affiliates' seed money. There were no service fee rebates for the year ended August 31, 2023.
Certain Class A shares are subject to a contingent deferred sales charge (CDSC) in the event of a shareholder redemption within 18 months of purchase. Class B shares are subject to a CDSC in the event of a shareholder redemption within six years of purchase. Class C shares are subject to a CDSC in the event of a shareholder redemption within 12 months of purchase. All contingent deferred sales charges are paid to MFD and during the year ended August 31, 2023, were as follows:
| | Amount |
| Class A | $371 |
| Class B | 95 |
| Class C | 57 |
Shareholder Servicing Agent — MFS Service Center, Inc. (MFSC), a wholly-owned subsidiary of MFS, receives a fee from the fund for its services as shareholder servicing agent calculated as a percentage of the average daily net assets of the fund as determined periodically under the supervision of the fund's Board of Trustees. For the year ended August 31, 2023, the fee was $4,435, which equated to 0.0008% annually of the fund's average daily net assets. MFSC also receives reimbursement from the fund for out-of-pocket expenses, sub-accounting and other shareholder servicing costs which may be paid to affiliated and unaffiliated service providers. Class R6 shares do not incur sub-accounting fees. For the year ended August 31, 2023, these out-of-pocket expenses, sub-accounting and other shareholder servicing costs amounted to $233,434.
Administrator — MFS provides certain financial, legal, shareholder communications, compliance, and other administrative services to the fund. Under an administrative services agreement, the fund reimburses MFS the costs incurred to provide these services. The fund is charged an annual fixed amount of $17,500 plus a fee based on average daily net assets. The administrative services fee is computed daily and paid monthly. The administrative services fee incurred for the year ended August 31, 2023 was equivalent to an annual effective rate of 0.0164% of the fund's average daily net assets.
Trustees’ and Officers’ Compensation — The fund pays compensation to independent Trustees in the form of a retainer, attendance fees, and additional compensation to Board and Committee chairpersons. Independent Trustees’ compensation is accrued daily and paid subsequent to each Trustee Board meeting. The fund does not pay compensation directly to Trustees or officers of the fund who are also officers of the investment adviser, all of whom receive remuneration from MFS for their services to the fund. Certain officers and Trustees of the fund are officers or directors of MFS, MFD, and MFSC.
Other — The fund invests in the MFS Institutional Money Market Portfolio which is managed by MFS and seeks current income consistent with preservation of capital and liquidity. This money market fund does not pay a management fee to MFS but does incur investment and operating costs.
Notes to Financial Statements - continued
On August 3, 2022, MFS redeemed 6,148 shares of Class R2 for an aggregate amount of $67,198. On June 23, 2023, MFS redeemed 6,359 shares of Class R3 for an aggregate amount of $74,464.
During the year ended August 31, 2023, pursuant to a policy adopted by the Board of Trustees and designed to comply with Rule 17a-7 under the Investment Company Act of 1940 (the “Act”) and relevant guidance, the fund engaged in sale transactions with funds and accounts for which MFS serves as investment adviser or sub-adviser (“cross-trades”) which amounted to $2,029,783. The sales transactions resulted in net realized gains (losses) of $(199,411).
The adviser has voluntarily undertaken to reimburse the fund from its own resources on a quarterly basis for the cost of investment research embedded in the cost of the fund’s securities trades. This agreement may be rescinded at any time. For the year ended August 31, 2023, this reimbursement amounted to $50,635, which is included in “Other” income in the Statement of Operations.
(4) Portfolio Securities
For the year ended August 31, 2023, purchases and sales of investments, other than short-term obligations, aggregated $385,886,326 and $314,127,555, respectively.
(5) Shares of Beneficial Interest
The fund's Declaration of Trust permits the Trustees to issue an unlimited number of full and fractional shares of beneficial interest. Transactions in fund shares were as follows:
| | Year ended
8/31/23 | | Year ended
8/31/22 |
| | Shares | Amount | | Shares | Amount |
| Shares sold | | | | | |
| Class A | 1,185,812 | $13,339,784 | | 1,445,475 | $17,524,904 |
| Class B | 327 | 3,827 | | 668 | 8,309 |
| Class C | 14,132 | 155,634 | | 6,194 | 74,819 |
| Class I | 9,780,227 | 107,922,482 | | 16,753,472 | 213,740,458 |
| Class R1 | 47,712 | 495,278 | | 23,544 | 281,698 |
| Class R2 | 185,751 | 2,154,293 | | 99,816 | 1,250,964 |
| Class R3 | 74,714 | 870,256 | | 24,821 | 282,831 |
| Class R4 | 1,381 | 15,628 | | 24,615 | 270,767 |
| Class R6 | 7,020,399 | 77,491,175 | | 7,030,731 | 81,862,937 |
| | 18,310,455 | $202,448,357 | | 25,409,336 | $315,297,687 |
Notes to Financial Statements - continued
| | Year ended
8/31/23 | | Year ended
8/31/22 |
| | Shares | Amount | | Shares | Amount |
Shares issued to shareholders
in reinvestment of distributions | | | | | |
| Class A | 48,487 | $546,445 | | 56,642 | $721,057 |
| Class B | 257 | 2,838 | | 989 | 12,333 |
| Class C | 672 | 7,387 | | 1,737 | 21,621 |
| Class I | 494,936 | 5,503,685 | | 710,831 | 8,920,924 |
| Class R1 | 1,649 | 17,970 | | 873 | 10,834 |
| Class R2 | 3,064 | 33,852 | | 5,520 | 69,003 |
| Class R3 | 1,423 | 15,862 | | 2,329 | 29,347 |
| Class R4 | 829 | 9,228 | | 433 | 5,437 |
| Class R6 | 771,681 | 8,596,530 | | 1,602,737 | 20,130,376 |
| | 1,322,998 | $14,733,797 | | 2,382,091 | $29,920,932 |
| Shares reacquired | | | | | |
| Class A | (660,168) | $(7,500,187) | | (7,769,579) | $(106,761,644) |
| Class B | (2,669) | (28,943) | | (1,760) | (21,687) |
| Class C | (10,280) | (113,992) | | (4,495) | (57,633) |
| Class I | (5,590,963) | (62,844,924) | | (2,495,424) | (30,029,655) |
| Class R1 | (2,904) | (32,072) | | (11,584) | (154,529) |
| Class R2 | (73,424) | (852,422) | | (15,246) | (175,941) |
| Class R3 | (22,102) | (259,340) | | (5,747) | (65,981) |
| Class R4 | (14) | (152) | | — | — |
| Class R6 | (6,786,078) | (75,120,715) | | (2,572,890) | (32,096,561) |
| | (13,148,602) | $(146,752,747) | | (12,876,725) | $(169,363,631) |
| Net change | | | | | |
| Class A | 574,131 | $6,386,042 | | (6,267,462) | $(88,515,683) |
| Class B | (2,085) | (22,278) | | (103) | (1,045) |
| Class C | 4,524 | 49,029 | | 3,436 | 38,807 |
| Class I | 4,684,200 | 50,581,243 | | 14,968,879 | 192,631,727 |
| Class R1 | 46,457 | 481,176 | | 12,833 | 138,003 |
| Class R2 | 115,391 | 1,335,723 | | 90,090 | 1,144,026 |
| Class R3 | 54,035 | 626,778 | | 21,403 | 246,197 |
| Class R4 | 2,196 | 24,704 | | 25,048 | 276,204 |
| Class R6 | 1,006,002 | 10,966,990 | | 6,060,578 | 69,896,752 |
| | 6,484,851 | $70,429,407 | | 14,914,702 | $175,854,988 |
The fund is one of several mutual funds in which certain MFS funds may invest. The MFS funds do not invest in the underlying funds for the purpose of exercising management or control. At the end of the period, the MFS Lifetime 2040 Fund, the MFS Lifetime 2050 Fund, the MFS Lifetime 2045 Fund, the MFS Lifetime 2035 Fund, the MFS Lifetime 2030 Fund, the MFS Lifetime 2055 Fund, the MFS Lifetime
Notes to Financial Statements - continued
2060 Fund, the MFS Lifetime Income Fund, and the MFS Lifetime 2025 Fund were the owners of record of approximately 10%, 8%, 7%, 6%, 6%, 5%, 3%, 3%, and 2%, respectively, of the value of outstanding voting shares of the fund. In addition, the MFS Lifetime 2065 Fund was the owner of record of less than 1% of the value of outstanding voting shares of the fund.
Effective June 1, 2019, purchases of the fund’s Class B shares were closed to new and existing investors subject to certain exceptions. On March 30, 2023, the fund announced that effective after the close of business on September 29, 2023, purchases of Class R1 and Class R2 shares will be closed to new eligible investors.
(6) Line of Credit
The fund and certain other funds managed by MFS participate in a $1.45 billion unsecured committed line of credit of which $1.2 billion is reserved for use by the fund and certain other MFS U.S. funds. The line of credit is provided by a syndicate of banks under a credit agreement. Borrowings may be made for temporary financing needs. Interest is charged to each fund, based on its borrowings, generally at a rate equal to the highest of 1) Daily Simple SOFR (Secured Overnight Financing Rate) plus 0.10%, 2) the Federal Funds Effective Rate, or 3) the Overnight Bank Funding Rate, each plus an agreed upon spread. A commitment fee, based on the average daily unused portion of the committed line of credit, is allocated among the participating funds. The line of credit expires on March 14, 2024 unless extended or renewed. In addition, the fund and other funds managed by MFS have established unsecured uncommitted borrowing arrangements with certain banks for temporary financing needs. Interest is charged to each fund, based on its borrowings, at rates equal to customary reference rates plus an agreed upon spread. For the year ended August 31, 2023, the fund’s commitment fee and interest expense were $2,760 and $0, respectively, and are included in “Miscellaneous” expense in the Statement of Operations.
(7) Investments in Affiliated Issuers
An affiliated issuer may be considered one in which the fund owns 5% or more of the outstanding voting securities, or a company which is under common control. For the purposes of this report, the following were affiliated issuers:
| Affiliated Issuers | Beginning
Value | Purchases | Sales
Proceeds | Realized
Gain
(Loss) | Change in
Unrealized
Appreciation or
Depreciation | Ending
Value |
| MFS Institutional Money Market Portfolio | $2,763,687 | $147,064,805 | $143,376,857 | $(2,239) | $369 | $6,449,765 |
| Affiliated Issuers | Dividend
Income | Capital Gain
Distributions |
| MFS Institutional Money Market Portfolio | $235,703 | $— |
(8) Russia and Ukraine Conflict
The fund invests in securities and/or derivative instruments that are economically tied to Russia and/or Ukraine. Escalation of the conflict between Russia and Ukraine in late February 2022 caused market volatility and disruption in the tradability of Russian securities, including closure of the local securities market, temporary restriction on
Notes to Financial Statements - continued
securities sales by non-residents, and disruptions to clearance and payment systems. To the extent that the fund is unable to sell securities, whether due to market constraints or to the sanctions imposed on Russia by the United States and other countries, those securities are considered illiquid and the value of those securities reflects their illiquid classification. Management continues to monitor these events and to evaluate the related impacts on fund performance.
Report of Independent Registered Public Accounting Firm
To the Shareholders of MFS Blended Research International Equity Fund and the Board of Trustees of MFS Series Trust IV
Opinion on the Financial Statements
We have audited the accompanying statement of assets and liabilities of MFS Blended Research International Equity Fund (the “Fund”) (one of the funds constituting MFS Series Trust IV (the “Trust”)), including the portfolio of investments, as of August 31, 2023, and the related statement of operations for the year then ended, the statements of changes in net assets for each of the two years in the period then ended, the financial highlights for each of the five years in the period then ended and the related notes (collectively referred to as the “financial statements”). In our opinion, the financial statements present fairly, in all material respects, the financial position of the Fund (one of the funds constituting MFS Series Trust IV) at August 31, 2023, the results of its operations for the year then ended, the changes in its net assets for each of the two years in the period then ended and its financial highlights for each of the five years in the period then ended, in conformity with U.S. generally accepted accounting principles.
Basis for Opinion
These financial statements are the responsibility of the Trust’s management. Our responsibility is to express an opinion on the Fund’s financial statements based on our audits. We are a public accounting firm registered with the Public Company Accounting Oversight Board (United States) (“PCAOB”) and are required to be independent with respect to the Trust in accordance with the U.S. federal securities laws and the applicable rules and regulations of the Securities and Exchange Commission and the PCAOB.
We conducted our audits in accordance with the standards of the PCAOB. Those standards require that we plan and perform the audit to obtain reasonable assurance about whether the financial statements are free of material misstatement, whether due to error or fraud. The Trust is not required to have, nor were we engaged to perform, an audit of the Trust’s internal control over financial reporting. As part of our audits, we are required to obtain an understanding of internal control over financial reporting but not for the purpose of expressing an opinion on the effectiveness of the Trust’s internal control over financial reporting. Accordingly, we express no such opinion.
Report of Independent Registered Public Accounting Firm – continued
Our audits included performing procedures to assess the risks of material misstatement of the financial statements, whether due to error or fraud, and performing procedures that respond to those risks. Such procedures included examining, on a test basis, evidence regarding the amounts and disclosures in the financial statements. Our procedures included confirmation of securities owned as of August 31, 2023, by correspondence with the custodian, brokers and others; when replies were not received from brokers and others, we performed other auditing procedures. Our audits also included evaluating the accounting principles used and significant estimates made by management, as well as evaluating the overall presentation of the financial statements. We believe that our audits provide a reasonable basis for our opinion.
We have served as the auditor of one or more MFS investment companies since 1993.
Boston, Massachusetts
October 16, 2023
Trustees and Officers — Identification and Background
The Trustees and Officers of the Trust, as of October 1, 2023, are listed below, together with their principal occupations during the past five years. (Their titles may have varied during that period.) The address of each Trustee and Officer is 111 Huntington Avenue, Boston, Massachusetts 02199-7618.
| Name, Age | | Position(s) Held with Fund | | Trustee/Officer Since(h) | | Number of MFS Funds overseen by the Trustee | | Principal Occupations During
the Past Five Years | | Other Directorships During
the Past Five Years (j) |
| INTERESTED TRUSTEE | | | | | | | | | | |
Michael W. Roberge (k)
(age 57) | | Trustee | | January 2021 | | 136 | | Massachusetts Financial Services Company, Chairman (since January 2021); Chief Executive Officer (since January 2017); Director; Chairman of the Board (since January 2022); President (until December 2018); Chief Investment Officer (until December 2018) | | N/A |
| INDEPENDENT TRUSTEES | | | | | | | | | | |
John P. Kavanaugh
(age 68) | | Trustee and Chair of Trustees | | January 2009 | | 136 | | Private investor | | N/A |
Steven E. Buller
(age 72) | | Trustee | | February 2014 | | 136 | | Private investor | | N/A |
John A. Caroselli
(age 69) | | Trustee | | March 2017 | | 136 | | Private investor; JC Global Advisors, LLC (management consulting), President (since 2015) | | N/A |
Maureen R. Goldfarb
(age 68) | | Trustee | | January 2009 | | 136 | | Private investor | | N/A |
Peter D. Jones
(age 68) | | Trustee | | January 2019 | | 136 | | Private investor | | N/A |
James W. Kilman, Jr.
(age 62) | | Trustee | | January 2019 | | 136 | | Burford Capital Limited (finance and investment management), Senior Advisor (since May 3, 2021), Chief Financial Officer (2019 - May 2, 2021); KielStrand Capital LLC (family office), Chief Executive Officer (since 2016) | | Alpha-En Corporation, Director (2016-2019) |
Trustees and Officers - continued
| Name, Age | | Position(s) Held with Fund | | Trustee/Officer Since(h) | | Number of MFS Funds overseen by the Trustee | | Principal Occupations During
the Past Five Years | | Other Directorships During
the Past Five Years (j) |
Clarence Otis, Jr.
(age 67) | | Trustee | | March 2017 | | 136 | | Private investor | | VF Corporation, Director; Verizon Communications, Inc., Director; The Travelers Companies, Director |
Maryanne L. Roepke
(age 67) | | Trustee | | May 2014 | | 136 | | Private investor | | N/A |
Laurie J. Thomsen
(age 66) | | Trustee | | March 2005 | | 136 | | Private investor | | The Travelers Companies, Director; Dycom Industries, Inc., Director |
| Name, Age | | Position(s) Held with
Fund | | Trustee/Officer Since(h) | | Number of MFS Funds for which the Person is an Officer | | Principal Occupations During
the Past Five Years |
| OFFICERS | | | | | | | | |
Christopher R. Bohane (k)
(age 49) | | Assistant Secretary and Assistant Clerk | | July 2005 | | 136 | | Massachusetts Financial Services Company, Senior Vice President and Senior Managing Counsel |
Kino Clark (k)
(age 55) | | Assistant Treasurer | | January 2012 | | 136 | | Massachusetts Financial Services Company, Vice President |
John W. Clark, Jr. (k)
(age 56) | | Assistant Treasurer | | April 2017 | | 136 | | Massachusetts Financial Services Company, Vice President |
David L. DiLorenzo (k)
(age 55) | | President | | July 2005 | | 136 | | Massachusetts Financial Services Company, Senior Vice President |
Heidi W. Hardin (k)
(age 56) | | Secretary and Clerk | | April 2017 | | 136 | | Massachusetts Financial Services Company, Executive Vice President and General Counsel |
Brian E. Langenfeld (k)
(age 50) | | Assistant Secretary and Assistant Clerk | | June 2006 | | 136 | | Massachusetts Financial Services Company, Vice President and Managing Counsel |
Trustees and Officers - continued
| Name, Age | | Position(s) Held with
Fund | | Trustee/Officer Since(h) | | Number of MFS Funds for which the Person is an Officer | | Principal Occupations During
the Past Five Years |
Rosa E. Licea-Mailloux (k)
(age 47) | | Chief Compliance Officer | | March 2022 | | 136 | | Massachusetts Financial Services Company, Vice President (since 2018); Director of Corporate Compliance (2018-2021), Senior Director Compliance (2021-2022), Senior Managing Director of North American Compliance & Chief Compliance Officer (since March 2022); Natixis Investment Managers (investment management), Funds Chief Compliance Officer, Deputy General Counsel & Senior Vice President (until 2018) |
Amanda S. Mooradian (k)
(age 44) | | Assistant Secretary and Assistant Clerk | | September 2018 | | 136 | | Massachusetts Financial Services Company, Assistant Vice President and Senior Counsel |
Susan A. Pereira (k)
(age 52) | | Assistant Secretary and Assistant Clerk | | July 2005 | | 136 | | Massachusetts Financial Services Company, Vice President and Managing Counsel |
Kasey L. Phillips (k)
(age 52) | | Assistant Treasurer | | September 2012 | | 136 | | Massachusetts Financial Services Company, Vice President |
Matthew A. Stowe (k)
(age 48) | | Assistant Secretary and Assistant Clerk | | October 2014 | | 136 | | Massachusetts Financial Services Company, Vice President and Senior Managing Counsel |
William B. Wilson (k)
(age 41) | | Assistant Secretary and Assistant Clerk | | October 2022 | | 136 | | Massachusetts Financial Services Company, Assistant Vice President and Senior Counsel |
James O. Yost (k)
(age 63) | | Treasurer | | September 1990 | | 136 | | Massachusetts Financial Services Company, Senior Vice President |
| (h) | Date first appointed to serve as Trustee/Officer of an MFS Fund. Each Trustee has served continuously since appointment unless indicated otherwise. From January 2012 through December 2016, Messrs. DiLorenzo and Yost served as Treasurer and Deputy Treasurer of the Funds, respectively. |
| (j) | Directorships or trusteeships of companies required to report to the Securities and Exchange Commission (i.e., “public companies”). |
| (k) | “Interested person” of the Trust within the meaning of the Investment Company Act of 1940 (referred to as the 1940 Act), which is the principal federal law governing investment companies like the fund, as a result of a position with MFS. The address of MFS is 111 Huntington Avenue, Boston, Massachusetts 02199-7618. |
Trustees and Officers - continued
Each Trustee (other than Messrs. Jones, Kilman and Roberge) has been elected by shareholders and each Trustee and Officer holds office until his or her successor is chosen and qualified or until his or her earlier death, resignation, retirement or removal. Mr. Roberge became a Trustee of the Funds on January 1, 2021 and Messrs. Jones and Kilman became Trustees of the Funds on January 1, 2019. The Trust does not hold annual meetings for the purpose of electing Trustees, and Trustees are not elected for fixed terms. Under the terms of the Board's retirement policy, an Independent Trustee shall retire at the end of the calendar year in which he or she reaches the earlier of 75 years of age or 15 years of service on the Board (or, in the case of any Independent Trustee who joined the Board prior to 2015, 20 years of service on the Board).
Messrs. Buller, Kilman and Otis and Ms. Roepke are members of the Trust’s Audit Committee.
Each of the Interested Trustees and certain Officers hold comparable officer positions with certain affiliates of MFS.
The Statement of Additional Information for a Fund includes further information about the Trustees and is available without charge upon request by calling 1-800-225-2606.
| Investment Adviser | Custodian |
Massachusetts Financial Services Company
111 Huntington Avenue
Boston, MA 02199-7618 | State Street Bank and Trust Company
1 Congress Street, Suite 1
Boston, MA 02114-2016 |
| Distributor | Independent Registered Public Accounting Firm |
MFS Fund Distributors, Inc.
111 Huntington Avenue
Boston, MA 02199-7618 | Ernst & Young LLP
200 Clarendon Street
Boston, MA 02116 |
| Portfolio Manager(s) | |
Jim Fallon
Matt Krummell
Jonathan Sage
Jed Stocks | |
Board Review of Investment Advisory Agreement
MFS Blended Research International Equity Fund
The Investment Company Act of 1940 requires that both the full Board of Trustees and a majority of the non-interested (“independent”) Trustees, voting separately, annually approve the continuation of the Fund’s investment advisory agreement with MFS. The Trustees consider matters bearing on the Fund and its advisory arrangements at their meetings throughout the year, including a review of performance data at each regular meeting. In addition, the independent Trustees met several times over the course of three months beginning in May and ending in July, 2023 (“contract review meetings”) for the specific purpose of considering whether to approve the continuation of the investment advisory agreement for the Fund and the other investment companies that the Board oversees (the “MFS Funds”). The independent Trustees were assisted in their evaluation of the Fund’s investment advisory agreement by independent legal counsel, from whom they received separate legal advice and with whom they met separately from MFS during various contract review meetings. The independent Trustees were also assisted in this process by an independent consultant who was retained by and reported to the independent Trustees.
In connection with their deliberations regarding the continuation of the investment advisory agreement, the Trustees, including the independent Trustees, considered such information and factors as they believed, in light of the legal advice furnished to them and their own business judgment, to be relevant. The investment advisory agreement for the Fund was considered separately, although the Trustees also took into account the common interests of all MFS Funds in their review. As described below, the Trustees considered the nature, quality, and extent of the various investment advisory, administrative, and shareholder services performed by MFS under the existing investment advisory agreement and other arrangements with the Fund.
In connection with their contract review meetings, the Trustees received and relied upon materials that included, among other items: (i) information provided by Broadridge Financial Solutions, Inc. (“Broadridge”), an independent third party, on the investment performance of the Fund for various time periods ended December 31, 2022 and the investment performance of a group of funds with substantially similar investment classifications/objectives (the “Broadridge performance universe”), (ii) information provided by Broadridge on the Fund’s advisory fees and other expenses and the advisory fees and other expenses of comparable funds identified by Broadridge as well as all other funds in the same investment classification/category (the “Broadridge expense group and universe”), (iii) information provided by MFS on the advisory fees of portfolios of other clients of MFS, including institutional separate accounts and other clients, (iv) information as to whether and to what extent applicable expense waivers, reimbursements or fee “breakpoints” are observed for the Fund, (v) information regarding MFS’ financial results and financial condition, including MFS’ and certain of its affiliates’ estimated profitability from services performed for the Fund and the MFS Funds as a whole, and compared to MFS’ institutional business, (vi) MFS’ views regarding the outlook for the mutual fund industry and the strategic business plans of MFS, (vii) descriptions of various functions performed by MFS for the Funds, such as compliance monitoring and portfolio trading practices, and (viii) information regarding the overall organization of MFS, including information about
Board Review of Investment Advisory Agreement - continued
MFS’ senior management and other personnel providing investment advisory, administrative and other services to the Fund and the other MFS Funds. The comparative performance, fee and expense information prepared and provided by Broadridge was not independently verified and the independent Trustees did not independently verify any information provided to them by MFS.
The Trustees’ conclusion as to the continuation of the investment advisory agreement was based on a comprehensive consideration of all information provided to the Trustees and not the result of any single factor. Some of the factors that figured particularly in the Trustees’ deliberations are described below, although individual Trustees may have evaluated the information presented differently from one another, giving different weights to various factors. It is also important to recognize that the fee arrangements for the Fund and other MFS Funds are the result of years of review and discussion between the independent Trustees and MFS, that certain aspects of such arrangements may receive greater scrutiny in some years than in others, and that the Trustees’ conclusions may be based, in part, on their consideration of these same arrangements during the course of the year and in prior years.
Based on information provided by Broadridge and MFS, the Trustees reviewed the Fund’s total return investment performance as well as the Broadridge performance universe over various time periods. The Trustees placed particular emphasis on the total return performance of the Fund’s Class I shares in comparison to the performance of funds in its Broadridge performance universe over the five-year period ended December 31, 2022, which the Trustees believed was a long enough period to reflect differing market conditions. The total return performance of the Fund’s Class I shares was in the 2nd quintile relative to the other funds in the universe for this five-year period (the 1st quintile being the best performers and the 5th quintile being the worst performers). The total return performance of the Fund’s Class I shares was in the 1st quintile for each of the one- and three-year periods ended December 31, 2022 relative to the Broadridge performance universe. Because of the passage of time, these performance results may differ from the performance results for more recent periods, including those shown elsewhere in this report.
In the course of their deliberations, the Trustees took into account information provided by MFS in connection with the contract review meetings, as well as during investment review meetings conducted with portfolio management personnel during the course of the year regarding the Fund’s performance. After reviewing these and related factors, the Trustees concluded, within the context of their overall conclusions regarding the investment advisory agreement, that they were satisfied with MFS’ responses and efforts relating to investment performance.
In assessing the reasonableness of the Fund’s advisory fee, the Trustees considered, among other information, the Fund’s advisory fee and the total expense ratio of the Fund’s Class I shares as a percentage of average daily net assets and the advisory fee and total expense ratios of the Broadridge expense group based on information provided by Broadridge. The Trustees considered that MFS currently observes an expense limitation for the Fund, which may not be changed without the Trustees’ approval. The Trustees also considered that, according to the data provided by Broadridge (which takes into account any fee reductions or expense limitations that were in effect during the Fund’s last fiscal year), the Fund’s effective advisory fee rate and total expense ratio were each lower than the Broadridge expense group median.
Board Review of Investment Advisory Agreement - continued
The Trustees also considered the advisory fees charged by MFS to any institutional separate accounts advised by MFS (“separate accounts”) and unaffiliated investment companies for which MFS serves as subadviser (“subadvised funds”) that have comparable investment strategies to the Fund, if any. In comparing these fees, the Trustees considered information provided by MFS as to the generally broader scope of services provided by MFS to the Fund, as well as the more extensive regulatory burdens imposed on MFS in managing the Fund, in comparison to separate accounts and subadvised funds. The Trustees also considered the higher demands placed on MFS’ investment personnel and trading infrastructure as a result of the daily cash in-flows and out-flows of the Fund in comparison to separate accounts.
The Trustees also considered whether the Fund may benefit from any economies of scale in the management of the Fund in the event of growth in assets of the Fund and/or growth in assets of the MFS Funds as a whole. They noted that the Fund’s advisory fee rate schedule is subject to contractual breakpoints that reduce the Fund’s advisory fee rate on average daily net assets over $1 billion and $2.5 billion. The Trustees also noted that MFS has agreed in writing to waive a portion of the management fees of certain MFS Funds, including the Fund, if the total combined assets of certain funds within the MFS Funds’ complex increase above agreed upon thresholds (the “group fee waiver”), enabling the Fund’s shareholders to share in the benefits from any economies of scale at the complex level. The group fee waiver is reviewed and renewed annually between the Board and MFS. The Trustees concluded that the breakpoints and the group fee waiver were sufficient to allow the Fund to benefit from economies of scale as its assets and overall complex assets grow.
The Trustees also considered information prepared by MFS relating to MFS’ costs and profits with respect to the Fund, the MFS Funds considered as a group, and other investment companies and accounts advised by MFS, as well as MFS’ methodologies used to determine and allocate its costs to the MFS Funds, the Fund and other accounts and products for purposes of estimating profitability.
After reviewing these and other factors described herein, the Trustees concluded, within the context of their overall conclusions regarding the investment advisory agreement, that the advisory fees charged to the Fund represent reasonable compensation in light of the services being provided by MFS to the Fund.
In addition, the Trustees considered MFS’ resources and related efforts to continue to retain, attract and motivate capable personnel to serve the Fund. The Trustees also considered current and developing conditions in the financial services industry, including the presence of large and well-capitalized companies which are spending, and appear to be prepared to continue to spend, substantial sums to engage personnel and to provide services to competing investment companies. In this regard, the Trustees also considered the financial resources of MFS and its ultimate parent, Sun Life Financial Inc. The Trustees also considered the advantages and possible disadvantages to the Fund of having an adviser that also serves other investment companies as well as other accounts.
The Trustees also considered the nature, quality, cost, and extent of administrative, transfer agency, and distribution services provided to the Fund by MFS and its affiliates under agreements and plans other than the investment advisory agreement, including any 12b-1 fees the Fund pays to MFS Fund Distributors, Inc., an affiliate of MFS. The Trustees also considered the nature, extent and quality of certain other services
Board Review of Investment Advisory Agreement - continued
MFS performs or arranges for on the Fund’s behalf, which may include securities lending programs, directed expense payment programs, class action recovery programs, and MFS’ interaction with third-party service providers, principally custodians and sub-custodians. The Trustees concluded that the various non-advisory services provided by MFS and its affiliates on behalf of the Fund were satisfactory.
The Trustees considered so-called “fall-out benefits” to MFS such as reputational value derived from serving as investment manager to the MFS Funds. The Trustees also considered that MFS discontinued its historic practice of obtaining investment research from portfolio brokerage commissions paid by certain MFS Funds effective January 2018, and directly pays or voluntarily reimburses a Fund, if applicable, for the costs of external research acquired through the use of the Fund’s portfolio brokerage commissions.
Based on their evaluation of factors that they deemed to be material, including those factors described above, the Board of Trustees, including the independent Trustees, concluded that the Fund’s investment advisory agreement with MFS should be continued for an additional one-year period, commencing August 1, 2023.
Statement Regarding Liquidity Risk Management Program
The fund has adopted and implemented a liquidity risk management program (the “Program”) as required by Rule 22e-4 under the Investment Company Act of 1940, as amended. The fund’s Board of Trustees (the “Board”) has designated MFS as the administrator of the Program. The Program is reasonably designed to assess and manage the liquidity risk of the fund. Liquidity risk is the risk that the fund could not meet requests to redeem shares issued by the fund without significant dilution of remaining investors' interests.
MFS provided a written report to the Board for consideration at its March 2023 meeting that addressed the operation of the Program and provided an assessment of the adequacy and effectiveness of the Program during the period from January 1, 2022 to December 31, 2022 (the “Covered Period”). The report concluded that during the Covered Period the Program had operated effectively in all material respects and had adequately and effectively been implemented to assess and manage the fund’s liquidity risk. MFS also reported that there were no liquidity events that impacted the fund or its ability to timely meet redemptions without dilution to existing shareholders during the Covered Period.
There can be no assurance that the Program will achieve its objectives in the future. Further information on liquidity risk, and other principal risks to which an investment in the fund may be subject, can be found in the prospectus.
Proxy Voting Policies and Information
MFS votes proxies on behalf of the fund pursuant to proxy voting policies and procedures that are available without charge, upon request, by calling 1-800-225-2606, by visiting mfs.com/proxyvoting, or by visiting the SEC’s Web site at http://www.sec.gov.
Information regarding how the fund voted proxies relating to portfolio securities during the most recent twelve-month period ended June 30 is available by August 31 of each year without charge by visiting mfs.com/proxyvoting, or by visiting the SEC’s Web site at http://www.sec.gov.
Quarterly Portfolio Disclosure
The fund files a complete schedule of portfolio holdings with the SEC for the first and third quarters of each fiscal year as an exhibit to its reports on Form N-PORT. The fund's Form N-PORT reports are available on the SEC's Web site at http://www.sec.gov. A shareholder can obtain the portfolio holdings report for the first and third quarters of the fund's fiscal year at mfs.com/openendfunds by choosing the fund's name and then scrolling to the “Resources” section and clicking on the “Prospectus and Reports” tab.
Further Information
From time to time, MFS may post important information about the fund or the MFS Funds on the MFS Web site (mfs.com). This information is available at https://www.mfs.com/announcements or at mfs.com/openendfunds by choosing the fund’s name and then scrolling to the “Resources” section and clicking on the “Announcements” tab, if any.
Information About Fund Contracts and Legal Claims
The fund has entered into contractual arrangements with an investment adviser, administrator, distributor, shareholder servicing agent, and custodian who each provide services to the fund. Unless expressly stated otherwise, shareholders are not parties to, or intended beneficiaries of these contractual arrangements, and these contractual arrangements are not intended to create any shareholder right to enforce them against the service providers or to seek any remedy under them against the service providers, either directly or on behalf of the fund.
Under the Trust’s By-Laws and Declaration of Trust, any claims asserted against or on behalf of the MFS Funds, including claims against Trustees and Officers, must be brought in state and federal courts located within the Commonwealth of Massachusetts.
Federal Tax Information (unaudited)
The fund will notify shareholders of amounts for use in preparing 2023 income tax forms in January 2024. The following information is provided pursuant to provisions of the Internal Revenue Code.
The fund designates the maximum amount allowable as qualified dividend income eligible to be taxed at the same rate as long-term capital gain.
The fund designates $4,835,000 as capital gain dividends paid during the fiscal year.
Income derived from foreign sources was $22,725,704. The fund intends to pass through foreign tax credits of $1,926,898 for the fiscal year.
| FACTS | WHAT DOES MFS DO WITH YOUR PERSONAL INFORMATION? |
| Why? | Financial companies choose how they share your personal information. Federal law gives consumers the right to limit some but not all sharing. Federal law also requires us to tell you how we collect, share, and protect your personal information. Please read this notice carefully to understand what we do. |
| What? | The types of personal information we collect and share depend on the product or service you have with us. This information can include: |
| • Social Security number and account balances |
| • Account transactions and transaction history |
| • Checking account information and wire transfer instructions |
| When you are no longer our customer, we continue to share your information as described in this notice. |
| How? | All financial companies need to share customers' personal information to run their everyday business. In the section below, we list the reasons financial companies can share their customers' personal information; the reasons MFS chooses to share; and whether you can limit this sharing. |
Reasons we can share your
personal information | Does MFS share? | Can you limit
this sharing? |
For our everyday business purposes –
such as to process your transactions, maintain your
account(s), respond to court orders and legal
investigations, or report to credit bureaus | Yes | No |
For our marketing purposes –
to offer our products and services to you | No | We don't share |
For joint marketing with other
financial companies | No | We don't share |
For our affiliates' everyday business purposes –
information about your transactions and experiences | No | We don't share |
For our affiliates' everyday business purposes –
information about your creditworthiness | No | We don't share |
| For nonaffiliates to market to you | No | We don't share |
| Questions? | Call 800-225-2606 or go to mfs.com. |
| Who we are |
| Who is providing this notice? | MFS Funds, MFS Investment Management, MFS Institutional Advisors, Inc., and MFS Heritage Trust Company. |
| What we do |
How does MFS
protect my personal
information? | To protect your personal information from unauthorized access and use, we use security measures that comply with federal law. These measures include procedural, electronic, and physical safeguards for the protection of the personal information we collect about you. |
How does MFS
collect my personal
information? | We collect your personal information, for example, when you |
| • open an account or provide account information |
| • direct us to buy securities or direct us to sell your securities |
| • make a wire transfer |
| We also collect your personal information from others, such as credit bureaus, affiliates, or other companies. |
| Why can't I limit all sharing? | Federal law gives you the right to limit only |
| • sharing for affiliates' everyday business purposes – information about your creditworthiness |
| • affiliates from using your information to market to you |
| • sharing for nonaffiliates to market to you |
| State laws and individual companies may give you additional rights to limit sharing. |
| Definitions |
| Affiliates | Companies related by common ownership or control. They can be financial and nonfinancial companies. |
| • MFS does not share personal information with affiliates, except for everyday business purposes as described on page one of this notice. |
| Nonaffiliates | Companies not related by common ownership or control. They can be financial and nonfinancial companies. |
| • MFS does not share with nonaffiliates so they can market to you. |
| Joint marketing | A formal agreement between nonaffiliated financial companies that together market financial products or services to you. |
| • MFS doesn't jointly market. |
| Other important information |
| If you own an MFS product or receive an MFS service in the name of a third party such as a bank or broker-dealer, their privacy policy may apply to you instead of ours. |
Save paper with eDelivery.
MFS® will send you prospectuses, reports, and proxies directly via e-mail so you will get information faster with less mailbox clutter.
To sign up:
1. Go to mfs.com.
2. Log in via MFS® Access.
3. Select eDelivery.
If you own your MFS fund shares through a financial institution or a retirement plan, MFS® TALK, MFS® Access, or eDelivery may not be available to you.
CONTACT
WEB SITE
mfs.com
MFS TALK
1-800-637-8255
24 hours a day
ACCOUNT SERVICE AND LITERATURE
Shareholders
1-800-225-2606
Financial advisors
1-800-343-2829
Retirement plan services
1-800-637-1255
MAILING ADDRESS
MFS Service Center, Inc.
P.O. Box 219341
Kansas City, MO 64121-9341
OVERNIGHT MAIL
MFS Service Center, Inc.
Suite 219341
430 W 7th Street
Kansas City, MO 64105-1407
Annual Report
August 31, 2023
MFS® Global New
Discovery Fund
MFS® Global New
Discovery Fund
| 1 |
| 3 |
| 6 |
| 9 |
| 11 |
| 16 |
| 18 |
| 19 |
| 20 |
| 26 |
| 37 |
| 39 |
| 43 |
| 47 |
| 48 |
| 48 |
| 48 |
| 48 |
| 48 |
| 49 |
The report is prepared for the general information of shareholders. It is authorized for distribution to prospective investors only when preceded or accompanied by a current prospectus.
NOT FDIC INSURED • MAY LOSE VALUE • NO BANK GUARANTEE
Portfolio structure
Top ten holdings
| ICON PLC | 2.1% |
| AUB Group Ltd. | 2.0% |
| Howmet Aerospace, Inc. | 2.0% |
| NS Solutions Corp. | 1.9% |
| Cranswick PLC | 1.9% |
| STERIS PLC | 1.9% |
| GFL Environmental, Inc. | 1.9% |
| ASM International N.V. | 1.7% |
| Gerresheimer AG | 1.7% |
| LKQ Corp. | 1.7% |
GICS equity sectors (g)
| Industrials | 26.6% |
| Consumer Discretionary | 13.7% |
| Materials | 11.3% |
| Information Technology | 10.5% |
| Health Care | 9.5% |
| Financials | 8.4% |
| Real Estate | 6.5% |
| Consumer Staples | 4.5% |
| Communication Services | 4.3% |
| Energy | 2.7% |
Issuer country weightings (x)
| United States | 39.0% |
| United Kingdom | 11.9% |
| Japan | 10.2% |
| Germany | 6.3% |
| Canada | 5.1% |
| Netherlands | 3.9% |
| France | 3.5% |
| Australia | 2.9% |
| Brazil | 2.1% |
| Other Countries | 15.1% |
Currency exposure weightings (y)
| United States Dollar | 43.1% |
| Euro | 17.8% |
| British Pound Sterling | 11.9% |
| Japanese Yen | 10.2% |
| Australian Dollar | 2.9% |
| Brazilian Real | 2.1% |
| Swiss Franc | 2.0% |
| Canadian Dollar | 1.7% |
| Norwegian Krone | 1.7% |
| Other Currencies | 6.6% |
Portfolio Composition - continued
| (g) | The Global Industry Classification Standard (GICS®) was developed by and/or is the exclusive property of MSCI, Inc. and S&P Global Market Intelligence Inc. (“S&P Global Market Intelligence”). GICS is a service mark of MSCI and S&P Global Market Intelligence and has been licensed for use by MFS. MFS has applied its own internal sector/industry classification methodology for equity securities and non-equity securities that are unclassified by GICS. |
| (x) | Represents the portfolio’s exposure to issuer countries as a percentage of a portfolio’s net assets. For purposes of this presentation, United States includes Cash & Cash Equivalents. |
| (y) | Represents the portfolio’s exposure to a particular currency as a percentage of a portfolio's net assets. For purposes of this presentation, United States Dollar includes Cash & Cash Equivalents. |
Cash & Cash Equivalents includes any cash, investments in money market funds, short-term securities, and other assets less liabilities. Please see the Statement of Assets and Liabilities for additional information related to the fund’s cash position and other assets and liabilities.
Percentages are based on net assets as of August 31, 2023.
The portfolio is actively managed and current holdings may be different.
Management Review
Summary of Results
For the twelve months ended August 31, 2023, Class A shares of the MFS Global New Discovery Fund (fund) provided a total return of 12.84%, at net asset value. This compares with a return of 8.49% for the fund’s benchmark, the MSCI All Country World Small Mid Cap Index (net div).
Market Environment
During the reporting period, central banks around the world had to combat the strongest inflationary pressures in four decades, fueled by the global fiscal response to the pandemic, disrupted supply chains and the dislocations to energy markets stemming from the war in Ukraine. Interest rates rose substantially, but the effects of a tighter monetary policy may not have been fully experienced yet, given that monetary policy works with long and variable lags. Strains resulting from the abrupt tightening of monetary policy began to affect some parts of the economy, most acutely among small and regional US banks, which suffered from deposit flight as depositors sought higher yields on their savings. Those shifts exposed an asset-liability mismatch that forced the closure of several institutions by regulators. Given the importance of small and mid-sized lenders to the provision of credit in the US, concerns were raised in the aftermath of the crisis that credit availability could become constrained, leading to slower economic growth, although those effects have been limited thus far. China’s abandonment of its Zero-COVID policy ushered in a brief uptick in economic activity in the world’s second-largest economy in early 2023, although its momentum soon stalled as focus turned to the country’s highly-indebted property development sector. In developed markets, consumer demand for services remained stronger than the demand for goods.
Policymakers found themselves in the difficult position of trying to restrain inflation without tipping economies into recession. Despite the challenging macroeconomic and geopolitical environment, central banks remained focused on controlling price pressures while also confronting increasing financial stability concerns. Central banks had to juggle achieving their inflation mandates while using macroprudential tools to keep banking systems liquid, a potentially difficult balancing act, and one that suggested that we may be nearing a peak in policy rates.
Against an environment of relatively tight labor markets, tighter global financial conditions and volatile materials prices, investor anxiety appeared to have increased over the potential that corporate profit margins may be past peak for this cycle. That said, signs that supply chains have generally normalized, coupled with low levels of unemployment across developed markets and hopes that inflation levels have peaked, were supportive factors for the macroeconomic backdrop.
Contributors to Performance
Relative to the MSCI All Country World Small Mid Cap Index, favorable stock selection within the health care sector contributed to performance, led by the fund's overweight position in drug and medication packaging manufacturer Gerresheimer (Germany). The share price of Gerresheimer rose as the company's financial results came in ahead of
Management Review - continued
consensus estimates, driven by an improved product mix and strong top-line performance. The timing of the fund’s ownership in shares of pharmaceutical products manufacturer Selcuk Ecza Deposu Ticaret ve Sanayi (Turkey) further helped relative results.
The combination of security selection and an underweight position in the financials sector also strengthened relative performance, driven by the fund’s overweight position in risk management solutions provider AUB Group (Australia).
Stocks in other sectors that aided relative performance included the fund’s overweight positions in semiconductor equipment manufacturer ASM International (Netherlands), glass packaging products maker Verallia (France), building products manufacturer AZEK, luxury goods retailer Burberry Group (United Kingdom), pumps and pumping equipment company ChampionX, aerospace company Howmet Aerospace and financial software and services provider SimCorp (Denmark).
During the reporting period, the fund’s relative currency exposure, resulting primarily from differences between the fund's and the benchmark's exposures to holdings of securities denominated in foreign currencies, was another contributor to relative performance. All of MFS’ investment decisions are driven by the fundamentals of each individual opportunity and as such, it is common for our funds to have different currency exposure than the benchmark.
Detractors from Performance
Stock selection and a slight underweight position in the information technology sector detracted from relative performance. Here, the timing of the fund’s ownership in shares of global technology consulting firm Thoughtworks Holding hurt relative returns. An overweight position in video game services company Keywords Studios (United Kingdom) further weakened relative results. The stock price of Keywords Studios came under pressure due to concerns regarding how recent generative AI (artificial intelligence) developments will impact the company’s future. Worries about the company’s ability to compete in an environment with greater AI access also appeared to have created unease for clients taking services in-house, which further weighed on the stock.
Stocks in other sectors that were among the top relative detractors included the fund’s overweight positions in broadband communications provider Cable One, industrial and electronics products distributor RS Group (United Kingdom), global payment solutions provider Nuvei (Canada), chemicals producer UPL (India), gaming and racing facilities operator Penn Entertainment(h), travel and tourism technology solutions provider Sabre(h) and dental equipment manufacturer Envista Holdings. The fund’s holdings of business process management solutions provider WNS Holdings(b) (India) further weakened relative performance. The stock price of WNS Holdings declined as the company reported financial results below consensus due to weaker-than-expected operating earnings.
Management Review - continued
Respectfully,
Portfolio Manager(s)
Eric Braz, Peter Fruzzetti, Michael Grossman, and Sandeep Mehta
| (b) | Security is not a benchmark constituent. |
| (h) | Security was not held in the portfolio at period end. |
The views expressed in this report are those of the portfolio manager(s) only through the end of the period of the report as stated on the cover and do not necessarily reflect the views of MFS or any other person in the MFS organization. These views are subject to change at any time based on market or other conditions, and MFS disclaims any responsibility to update such views. These views may not be relied upon as investment advice or an indication of trading intent on behalf of any MFS portfolio. References to specific securities are not recommendations of such securities, and may not be representative of any MFS portfolio’s current or future investments.
Performance Summary THROUGH 8/31/23
The following chart illustrates a representative class of the fund’s historical performance in comparison to its benchmark(s). Performance results include the deduction of the maximum applicable sales charge and reflect the percentage change in net asset value, including reinvestment of dividends and capital gains distributions. The performance of other share classes will be greater than or less than that of the class depicted below. Benchmarks are unmanaged and may not be invested in directly. Benchmark returns do not reflect sales charges, commissions or expenses. (See Notes to Performance Summary.)
Performance data shown represents past performance and is no guarantee of future results. Investment return and principal value fluctuate so your shares, when sold, may be worth more or less than the original cost; current performance may be lower or higher than quoted. The performance shown does not reflect the deduction of taxes, if any, that a shareholder would pay on fund distributions or the redemption of fund shares.
Growth of a Hypothetical $10,000 Investment
Performance Summary - continued
Total Returns through 8/31/23
Average annual without sales charge
| Share Class | Class Inception Date | 1-yr | 5-yr | 10-yr |
| A | 12/16/11 | 12.84% | 4.21% | 7.13% |
| B | 12/16/11 | 12.03% | 3.44% | 6.33% |
| C | 12/16/11 | 11.97% | 3.43% | 6.32% |
| I | 12/16/11 | 13.13% | 4.47% | 7.39% |
| R1 | 12/16/11 | 11.98% | 3.44% | 6.32% |
| R2 | 12/16/11 | 12.56% | 3.94% | 6.85% |
| R3 | 12/16/11 | 12.84% | 4.22% | 7.13% |
| R4 | 12/16/11 | 13.18% | 4.48% | 7.39% |
| R6 | 1/02/13 | 13.24% | 4.57% | 7.49% |
Comparative benchmark(s)
| MSCI All Country World Small Mid Cap Index (net div) (f) | 8.49% | 4.46% | 7.21% |
Average annual with sales charge
| | | | |
A
With Initial Sales Charge (5.75%) | 6.35% | 2.98% | 6.50% |
B
With CDSC (Declining over six years from 4% to 0%) (v) | 8.03% | 3.12% | 6.33% |
C
With CDSC (1% for 12 months) (v) | 10.97% | 3.43% | 6.32% |
CDSC – Contingent Deferred Sales Charge.
Class I, R1, R2, R3, R4, and R6 shares do not have a sales charge.
| (f) | Source: FactSet Research Systems Inc. |
| (v) | Assuming redemption at the end of the applicable period. |
Benchmark Definition(s)
MSCI All Country World Small Mid Cap Index(e) (net div) – a free float weighted index that is designed to measure equity market performance of small and mid cap companies across global developed and emerging market countries.
It is not possible to invest directly in an index.
| (e) | Morgan Stanley Capital International (“MSCI”) makes no express or implied warranties or representations and shall have no liability whatsoever with respect to any MSCI data contained herein. The MSCI data may not be further redistributed or used as a basis for other indices or any securities or financial products. This report is not approved, reviewed, or produced by MSCI. |
Notes to Performance Summary
Average annual total return represents the average annual change in value for each share class for the periods presented.
Performance Summary - continued
Performance results reflect any applicable expense subsidies and waivers in effect during the periods shown. Without such subsidies and waivers the fund's performance results would be less favorable. Please see the prospectus and financial statements for complete details.
Performance results do not include adjustments made for financial reporting purposes in accordance with U.S. generally accepted accounting principles and may differ from amounts reported in the financial highlights.
From time to time the fund may receive proceeds from litigation settlements, without which performance would be lower.
Expense Table
Fund expenses borne by the shareholders during the period,
March 1, 2023 through August 31, 2023
As a shareholder of the fund, you incur two types of costs: (1) transaction costs, including sales charges (loads) on certain purchase or redemption payments, and (2) ongoing costs, including management fees; distribution and service (12b-1) fees; and other fund expenses. This example is intended to help you understand your ongoing costs (in dollars) of investing in the fund and to compare these costs with the ongoing costs of investing in other mutual funds.
The example is based on an investment of $1,000 invested at the beginning of the period and held for the entire period March 1, 2023 through August 31, 2023.
Actual Expenses
The first line for each share class in the following table provides information about actual account values and actual expenses. You may use the information in this line, together with the amount you invested, to estimate the expenses that you paid over the period. Simply divide your account value by $1,000 (for example, an $8,600 account value divided by $1,000 = 8.6), then multiply the result by the number in the first line under the heading entitled “Expenses Paid During Period” to estimate the expenses you paid on your account during this period.
Hypothetical Example for Comparison Purposes
The second line for each share class in the following table provides information about hypothetical account values and hypothetical expenses based on the fund’s actual expense ratio and an assumed rate of return of 5% per year before expenses, which is not the fund’s actual return. The hypothetical account values and expenses may not be used to estimate the actual ending account balance or expenses you paid for the period. You may use this information to compare the ongoing costs of investing in the fund and other funds. To do so, compare this 5% hypothetical example with the 5% hypothetical examples that appear in the shareholder reports of the other funds.
Please note that the expenses shown in the table are meant to highlight your ongoing costs only and do not reflect any transactional costs, such as sales charges (loads). Therefore, the second line for each share class in the table is useful in comparing ongoing costs only, and will not help you determine the relative total costs of owning different funds. In addition, if these transactional costs were included, your costs would have been higher.
Expense Table - continued
Share
Class | | Annualized
Expense
Ratio | Beginning
Account Value
3/01/23 | Ending
Account Value
8/31/23 | Expenses
Paid During
Period (p)
3/01/23-8/31/23 |
| A | Actual | 1.35% | $1,000.00 | $1,051.66 | $6.98 |
| Hypothetical (h) | 1.35% | $1,000.00 | $1,018.40 | $6.87 |
| B | Actual | 2.10% | $1,000.00 | $1,048.08 | $10.84 |
| Hypothetical (h) | 2.10% | $1,000.00 | $1,014.62 | $10.66 |
| C | Actual | 2.10% | $1,000.00 | $1,047.51 | $10.84 |
| Hypothetical (h) | 2.10% | $1,000.00 | $1,014.62 | $10.66 |
| I | Actual | 1.10% | $1,000.00 | $1,052.87 | $5.69 |
| Hypothetical (h) | 1.10% | $1,000.00 | $1,019.66 | $5.60 |
| R1 | Actual | 2.10% | $1,000.00 | $1,047.54 | $10.84 |
| Hypothetical (h) | 2.10% | $1,000.00 | $1,014.62 | $10.66 |
| R2 | Actual | 1.60% | $1,000.00 | $1,050.16 | $8.27 |
| Hypothetical (h) | 1.60% | $1,000.00 | $1,017.14 | $8.13 |
| R3 | Actual | 1.35% | $1,000.00 | $1,051.66 | $6.98 |
| Hypothetical (h) | 1.35% | $1,000.00 | $1,018.40 | $6.87 |
| R4 | Actual | 1.10% | $1,000.00 | $1,053.34 | $5.69 |
| Hypothetical (h) | 1.10% | $1,000.00 | $1,019.66 | $5.60 |
| R6 | Actual | 1.01% | $1,000.00 | $1,053.13 | $5.23 |
| Hypothetical (h) | 1.01% | $1,000.00 | $1,020.11 | $5.14 |
| (h) | 5% class return per year before expenses. |
| (p) | “Expenses Paid During Period” are equal to each class’s annualized expense ratio, as shown above, multiplied by the average account value over the period, multiplied by 184/365 (to reflect the one-half year period). Expenses paid do not include any applicable sales charges (loads). If these transaction costs had been included, your costs would have been higher. |
Portfolio of Investments
8/31/23
The Portfolio of Investments is a complete list of all securities owned by your fund. It is categorized by broad-based asset classes.
| Issuer | | | Shares/Par | Value ($) |
| Common Stocks – 98.0% |
| Aerospace & Defense – 4.7% | |
| Howmet Aerospace, Inc. | | 27,160 | $1,343,605 |
| Melrose Industries PLC | | 102,109 | 663,056 |
| Singapore Technologies Engineering Ltd. | | 187,800 | 529,445 |
| Teledyne Technologies, Inc. (a) | | 1,675 | 700,653 |
| | | | | $3,236,759 |
| Apparel Manufacturers – 2.1% | |
| Burberry Group PLC | | 23,487 | $649,813 |
| Skechers USA, Inc., “A” (a) | | 15,523 | 780,962 |
| | | | | $1,430,775 |
| Automotive – 2.9% | |
| Koito Manufacturing Co. Ltd. | | 26,100 | $444,074 |
| LKQ Corp. | | 22,414 | 1,177,407 |
| Vitesco Technologies Group, “A” (a) | | 4,982 | 393,823 |
| | | | | $2,015,304 |
| Biotechnology – 0.6% | |
| Abcam PLC, ADR (a) | | 18,765 | $424,464 |
| Brokerage & Asset Managers – 3.5% | |
| B3 S.A. - Brasil Bolsa Balcao | | 285,200 | $744,669 |
| Cboe Global Markets, Inc. | | 4,880 | 730,585 |
| Euronext N.V. | | 13,146 | 950,087 |
| | | | | $2,425,341 |
| Business Services – 5.4% | |
| Gruppo Mutuionline S.p.A. | | 11,359 | $322,093 |
| Keywords Studios PLC | | 25,332 | 489,381 |
| NS Solutions Corp. | | 49,300 | 1,338,431 |
| RS Group PLC | | 85,811 | 826,378 |
| Thoughtworks Holding, Inc. (a) | | 47,548 | 236,314 |
| WNS (Holdings) Ltd., ADR (a) | | 7,510 | 490,778 |
| | | | | $3,703,375 |
| Cable TV – 0.7% | |
| Cable One, Inc. | | 738 | $480,121 |
| Chemicals – 3.9% | |
| Borregaard ASA | | 41,642 | $608,667 |
| Element Solutions, Inc. | | 43,681 | 900,702 |
| IMCD Group N.V. | | 4,401 | 607,266 |
Portfolio of Investments – continued
| Issuer | | | Shares/Par | Value ($) |
| Common Stocks – continued |
| Chemicals – continued | |
| UPL Ltd. | | 81,858 | $584,522 |
| | | | | $2,701,157 |
| Computer Software – 4.4% | |
| Dun & Bradstreet Holdings, Inc. | | 32,794 | $357,455 |
| Kinaxis, Inc. (a) | | 3,662 | 451,435 |
| NICE Systems Ltd., ADR (a) | | 2,270 | 442,196 |
| OBIC Co. Ltd. | | 3,200 | 557,105 |
| Oracle Corp. Japan | | 6,000 | 419,396 |
| Paycor HCM, Inc. (a) | | 15,149 | 355,547 |
| SimCorp A/S | | 4,150 | 441,682 |
| | | | | $3,024,816 |
| Computer Software - Systems – 2.9% | |
| Amadeus IT Group S.A. | | 9,953 | $683,168 |
| Kardex AG | | 2,239 | 515,805 |
| Nuvei Corp. | | 16,170 | 292,192 |
| Rapid7, Inc. (a) | | 10,283 | 518,160 |
| | | | | $2,009,325 |
| Construction – 3.8% | |
| AZEK Co., Inc. (a) | | 20,707 | $704,245 |
| Breedon Group PLC | | 167,226 | 740,387 |
| Masco Corp. | | 13,377 | 789,377 |
| Summit Materials, Inc., “A” (a) | | 9,555 | 357,452 |
| | | | | $2,591,461 |
| Consumer Services – 1.9% | |
| Boyd Group Services, Inc. | | 3,866 | $697,236 |
| Bright Horizons Family Solutions, Inc. (a) | | 6,328 | 597,490 |
| | | | | $1,294,726 |
| Containers – 1.9% | |
| Mayr-Melnhof Karton AG | | 2,755 | $390,750 |
| Verallia S.A. | | 18,453 | 882,820 |
| | | | | $1,273,570 |
| Electrical Equipment – 2.3% | |
| nVent Electric PLC | | 14,175 | $801,454 |
| Sensata Technologies Holding PLC | | 20,927 | 787,274 |
| | | | | $1,588,728 |
| Electronics – 1.7% | |
| ASM International N.V. | | 2,475 | $1,194,813 |
Portfolio of Investments – continued
| Issuer | | | Shares/Par | Value ($) |
| Common Stocks – continued |
| Energy - Independent – 1.3% | |
| Diamondback Energy, Inc. | | 6,038 | $916,448 |
| Engineering - Construction – 3.2% | |
| Corporacion Inmobiliaria Vesta S.A.B. de C.V. | | 187,595 | $695,567 |
| Jacobs Solutions, Inc. | | 7,300 | 984,186 |
| JGC Corp. | | 37,900 | 507,174 |
| | | | | $2,186,927 |
| Entertainment – 2.5% | |
| CTS Eventim AG | | 12,511 | $780,063 |
| Lottery Corp. Ltd. | | 181,110 | 591,445 |
| Vivid Seats, Inc., “A” (a) | | 44,672 | 324,319 |
| | | | | $1,695,827 |
| Food & Beverages – 4.5% | |
| Bakkafrost P/F | | 10,458 | $528,718 |
| Cranswick PLC | | 31,090 | 1,327,268 |
| S Foods, Inc. | | 21,000 | 484,243 |
| Toyo Suisan Kaisha Ltd. | | 8,600 | 355,361 |
| Universal Robina Corp. | | 188,410 | 371,695 |
| | | | | $3,067,285 |
| General Merchandise – 0.8% | |
| B&M European Value Retail S.A. | | 76,473 | $559,555 |
| Insurance – 2.7% | |
| Arthur J. Gallagher & Co. | | 2,075 | $478,246 |
| AUB Group Ltd. | | 70,054 | 1,399,420 |
| | | | | $1,877,666 |
| Internet – 0.9% | |
| Cian PLC, ADR (a)(u) | | 63,311 | $0 |
| Scout24 AG | | 8,852 | 610,667 |
| | | | | $610,667 |
| Machinery & Tools – 7.5% | |
| Azbil Corp. | | 12,600 | $420,880 |
| IDEX Corp. | | 2,894 | 655,202 |
| Ingersoll Rand, Inc. | | 15,407 | 1,072,481 |
| RB Global, Inc. | | 11,696 | 721,877 |
| SIG Combibloc Group AG | | 18,691 | 492,587 |
| VAT Group AG | | 971 | 389,565 |
| Wabtec Corp. | | 8,108 | 912,312 |
| Zurn Elkay Water Solutions Corp. | | 17,432 | 516,336 |
| | | | | $5,181,240 |
Portfolio of Investments – continued
| Issuer | | | Shares/Par | Value ($) |
| Common Stocks – continued |
| Medical & Health Technology & Services – 3.4% | |
| AS ONE Corp. | | 7,800 | $306,703 |
| ICON PLC (a) | | 5,506 | 1,431,230 |
| Selcuk Ecza Deposu Ticaret ve Sanayi A.S. | | 273,381 | 604,666 |
| | | | | $2,342,599 |
| Medical Equipment – 5.5% | |
| Bruker BioSciences Corp. | | 9,072 | $595,123 |
| Envista Holdings Corp. (a) | | 22,179 | 710,172 |
| Gerresheimer AG | | 9,062 | 1,178,183 |
| STERIS PLC | | 5,740 | 1,317,847 |
| | | | | $3,801,325 |
| Oil Services – 1.3% | |
| ChampionX Corp. | | 25,412 | $917,119 |
| Other Banks & Diversified Financials – 1.3% | |
| Shizuoka Financial Group, Inc. | | 106,500 | $867,401 |
| Pollution Control – 2.7% | |
| Daiseki Co. Ltd. | | 17,300 | $524,963 |
| GFL Environmental, Inc. | | 40,392 | 1,308,701 |
| | | | | $1,833,664 |
| Printing & Publishing – 0.8% | |
| Wolters Kluwer N.V. | | 4,522 | $545,262 |
| Real Estate – 4.5% | |
| Big Yellow Group PLC, REIT | | 32,864 | $447,545 |
| Catena AB | | 9,893 | 361,438 |
| LEG Immobilien SE (a) | | 5,713 | 412,580 |
| Sun Communities, Inc., REIT | | 5,767 | 705,996 |
| Tritax Big Box PLC, REIT | | 274,867 | 491,660 |
| Unite Group PLC, REIT | | 54,149 | 645,145 |
| | | | | $3,064,364 |
| Restaurants – 1.5% | |
| Sodexo | | 5,167 | $554,793 |
| Yum China Holdings, Inc. | | 8,709 | 467,586 |
| | | | | $1,022,379 |
| Specialty Chemicals – 4.1% | |
| Axalta Coating Systems Ltd. (a) | | 31,912 | $903,110 |
| Croda International PLC | | 5,845 | 408,873 |
| Essentra PLC | | 285,324 | 533,498 |
Portfolio of Investments – continued
| Issuer | | | Shares/Par | Value ($) |
| Common Stocks – continued |
| Specialty Chemicals – continued | |
| Symrise AG | | 9,434 | $983,694 |
| | | | | $2,829,175 |
| Specialty Stores – 4.7% | |
| Burlington Stores, Inc. (a) | | 4,291 | $696,258 |
| Just Eat Takeaway.com (a) | | 22,515 | 317,433 |
| Multiplan Empreendimentos Imobiliarios S.A. | | 141,292 | 705,882 |
| Musti Group OY | | 31,864 | 706,929 |
| NISHIMATSUYA CHAIN Co., Ltd. | | 36,100 | 417,087 |
| ZOZO, Inc. | | 18,700 | 373,948 |
| | | | | $3,217,537 |
| Telecommunications - Wireless – 1.1% | |
| Wireless Infrastructure Italian S.p.A. | | 62,045 | $767,984 |
| Trucking – 1.0% | |
| XPO Logistics, Inc. (a) | | 9,457 | $705,776 |
| Total Common Stocks (Identified Cost, $58,690,584) | | $67,404,935 |
| Investment Companies (h) – 2.1% |
| Money Market Funds – 2.1% | |
| MFS Institutional Money Market Portfolio, 5.3% (v) (Identified Cost, $1,435,272) | | | 1,435,333 | $1,435,476 |
|
|
| Other Assets, Less Liabilities – (0.1)% | | (39,362) |
| Net Assets – 100.0% | $68,801,049 |
| (a) | Non-income producing security. | | | |
| (h) | An affiliated issuer, which may be considered one in which the fund owns 5% or more of the outstanding voting securities, or a company which is under common control. At period end, the aggregate values of the fund's investments in affiliated issuers and in unaffiliated issuers were $1,435,476 and $67,404,935, respectively. | | | |
| (u) | The security was valued using significant unobservable inputs and is considered level 3 under the fair value hierarchy. For further information about the fund’s level 3 holdings, please see Note 2 in the Notes to Financial Statements. | | | |
| (v) | Affiliated issuer that is available only to investment companies managed by MFS. The rate quoted for the MFS Institutional Money Market Portfolio is the annualized seven-day yield of the fund at period end. | | | |
| The following abbreviations are used in this report and are defined: |
| ADR | American Depositary Receipt |
| REIT | Real Estate Investment Trust |
See Notes to Financial Statements
Financial Statements
Statement of Assets and Liabilities
At 8/31/23
This statement represents your fund’s balance sheet, which details the assets and liabilities comprising the total value of the fund.
| Assets | |
| Investments in unaffiliated issuers, at value (identified cost, $58,690,584) | $67,404,935 |
| Investments in affiliated issuers, at value (identified cost, $1,435,272) | 1,435,476 |
| Foreign currency, at value (identified cost, $10,436) | 10,410 |
| Receivables for | |
| Fund shares sold | 49,385 |
| Interest and dividends | 144,785 |
| Receivable from investment adviser | 16,154 |
| Other assets | 90 |
| Total assets | $69,061,235 |
| Liabilities | |
| Payables for | |
| Fund shares reacquired | $147,099 |
| Payable to affiliates | |
| Administrative services fee | 111 |
| Shareholder servicing costs | 21,202 |
| Distribution and service fees | 533 |
| Payable for independent Trustees' compensation | 10 |
| Payable for audit and tax fees | 71,353 |
| Accrued expenses and other liabilities | 19,878 |
| Total liabilities | $260,186 |
| Net assets | $68,801,049 |
| Net assets consist of | |
| Paid-in capital | $66,646,431 |
| Total distributable earnings (loss) | 2,154,618 |
| Net assets | $68,801,049 |
| Shares of beneficial interest outstanding | 3,308,239 |
Statement of Assets and Liabilities – continued
| | Net assets | Shares
outstanding | Net asset value
per share (a) |
| Class A | $24,867,867 | 1,209,324 | $20.56 |
| Class B | 1,518,017 | 81,945 | 18.52 |
| Class C | 1,577,549 | 85,163 | 18.52 |
| Class I | 17,671,038 | 837,120 | 21.11 |
| Class R1 | 130,354 | 7,042 | 18.51 |
| Class R2 | 178,799 | 8,988 | 19.89 |
| Class R3 | 730,544 | 35,535 | 20.56 |
| Class R4 | 92,698 | 4,388 | 21.13 |
| Class R6 | 22,034,183 | 1,038,734 | 21.21 |
| (a) | Maximum offering price per share was equal to the net asset value per share for all share classes, except for Class A, for which the maximum offering price per share was $21.81 [100 / 94.25 x $20.56]. On sales of $50,000 or more, the maximum offering price of Class A shares is reduced. A contingent deferred sales charge may be imposed on redemptions of Class A, Class B, and Class C shares. Redemption price per share was equal to the net asset value per share for Classes I, R1, R2, R3, R4, and R6. |
See Notes to Financial Statements
Financial Statements
Statement of Operations
Year ended 8/31/23
This statement describes how much your fund earned in investment income and accrued in expenses. It also describes any gains and/or losses generated by fund operations.
| Net investment income (loss) | |
| Income | |
| Dividends | $1,037,646 |
| Dividends from affiliated issuers | 67,478 |
| Income on securities loaned | 1,030 |
| Other | 97 |
| Foreign taxes withheld | (77,256) |
| Total investment income | $1,028,995 |
| Expenses | |
| Management fee | $622,266 |
| Distribution and service fees | 96,307 |
| Shareholder servicing costs | 65,907 |
| Administrative services fee | 19,509 |
| Independent Trustees' compensation | 3,237 |
| Custodian fee | 8,926 |
| Shareholder communications | 14,128 |
| Audit and tax fees | 67,594 |
| Legal fees | 360 |
| Registration fees | 123,411 |
| Miscellaneous | 35,505 |
| Total expenses | $1,057,150 |
| Reduction of expenses by investment adviser | (272,082) |
| Net expenses | $785,068 |
| Net investment income (loss) | $243,927 |
| Realized and unrealized gain (loss) |
| Realized gain (loss) (identified cost basis) | |
| Unaffiliated issuers (net of $3,706 foreign capital gains tax) | $(1,747,000) |
| Affiliated issuers | 465 |
| Foreign currency | (7,435) |
| Net realized gain (loss) | $(1,753,970) |
| Change in unrealized appreciation or depreciation | |
| Unaffiliated issuers (net of $11,630 decrease in deferred foreign capital gains tax) | $9,093,416 |
| Affiliated issuers | 216 |
| Translation of assets and liabilities in foreign currencies | 2,561 |
| Net unrealized gain (loss) | $9,096,193 |
| Net realized and unrealized gain (loss) | $7,342,223 |
| Change in net assets from operations | $7,586,150 |
See Notes to Financial Statements
Financial Statements
Statements of Changes in Net Assets
These statements describe the increases and/or decreases in net assets resulting from operations, any distributions, and any shareholder transactions.
| | Year ended |
| | 8/31/23 | 8/31/22 |
| Change in net assets | | |
| From operations | | |
| Net investment income (loss) | $243,927 | $(341,062) |
| Net realized gain (loss) | (1,753,970) | (2,295,855) |
| Net unrealized gain (loss) | 9,096,193 | (34,775,779) |
| Change in net assets from operations | $7,586,150 | $(37,412,696) |
| Total distributions to shareholders | $— | $(7,820,101) |
| Change in net assets from fund share transactions | $(2,518,809) | $(25,748,877) |
| Total change in net assets | $5,067,341 | $(70,981,674) |
| Net assets | | |
| At beginning of period | 63,733,708 | 134,715,382 |
| At end of period | $68,801,049 | $63,733,708 |
See Notes to Financial Statements
Financial Statements
Financial Highlights
The financial highlights table is intended to help you understand the fund's financial performance for the past 5 years. Certain information reflects financial results for a single fund share. The total returns in the table represent the rate that an investor would have earned (or lost) on an investment in the fund share class (assuming reinvestment of all distributions) held for the entire period.
| Class A | Year ended |
| | 8/31/23 | 8/31/22 | 8/31/21 | 8/31/20 | 8/31/19 |
| Net asset value, beginning of period | $18.22 | $27.56 | $21.57 | $18.72 | $21.27 |
| Income (loss) from investment operations |
| Net investment income (loss) (d) | $0.05 | $(0.10) | $(0.06) | $(0.06) | $(0.03) |
| Net realized and unrealized gain (loss) | 2.29 | (7.66) | 6.96 | 3.49 | (0.62) |
| Total from investment operations | $2.34 | $(7.76) | $6.90 | $3.43 | $(0.65) |
| Less distributions declared to shareholders |
| From net investment income | $— | $— | $— | $— | $(0.02) |
| From net realized gain | — | (1.58) | (0.91) | (0.58) | (1.88) |
| Total distributions declared to shareholders | $— | $(1.58) | $(0.91) | $(0.58) | $(1.90) |
| Net asset value, end of period (x) | $20.56 | $18.22 | $27.56 | $21.57 | $18.72 |
| Total return (%) (r)(s)(t)(x) | 12.84 | (29.71) | 32.82 | 18.63 | (1.65) |
Ratios (%) (to average net assets)
and Supplemental data: |
| Expenses before expense reductions | 1.78 | 1.67 | 1.68 | 1.97 | 2.04 |
| Expenses after expense reductions | 1.35 | 1.35 | 1.34 | 1.49 | 1.51 |
| Net investment income (loss) | 0.26 | (0.45) | (0.26) | (0.32) | (0.16) |
| Portfolio turnover | 29 | 36 | 36 | 84 | 55 |
| Net assets at end of period (000 omitted) | $24,868 | $23,856 | $44,743 | $17,029 | $11,255 |
See Notes to Financial Statements
Financial Highlights – continued
| Class B | Year ended |
| | 8/31/23 | 8/31/22 | 8/31/21 | 8/31/20 | 8/31/19 |
| Net asset value, beginning of period | $16.54 | $25.35 | $20.05 | $17.57 | $20.21 |
| Income (loss) from investment operations |
| Net investment income (loss) (d) | $(0.09) | $(0.24) | $(0.25) | $(0.19) | $(0.16) |
| Net realized and unrealized gain (loss) | 2.07 | (6.99) | 6.46 | 3.25 | (0.60) |
| Total from investment operations | $1.98 | $(7.23) | $6.21 | $3.06 | $(0.76) |
| Less distributions declared to shareholders |
| From net investment income | $— | $— | $— | $— | $— |
| From net realized gain | — | (1.58) | (0.91) | (0.58) | (1.88) |
| Total distributions declared to shareholders | $— | $(1.58) | $(0.91) | $(0.58) | $(1.88) |
| Net asset value, end of period (x) | $18.52 | $16.54 | $25.35 | $20.05 | $17.57 |
| Total return (%) (r)(s)(t)(x) | 11.97 | (30.24) | 31.84 | 17.72 | (2.35) |
Ratios (%) (to average net assets)
and Supplemental data: |
| Expenses before expense reductions | 2.53 | 2.43 | 2.46 | 2.72 | 2.79 |
| Expenses after expense reductions | 2.10 | 2.10 | 2.10 | 2.24 | 2.26 |
| Net investment income (loss) | (0.52) | (1.15) | (1.12) | (1.08) | (0.91) |
| Portfolio turnover | 29 | 36 | 36 | 84 | 55 |
| Net assets at end of period (000 omitted) | $1,518 | $1,739 | $2,979 | $2,678 | $2,508 |
| Class C | Year ended |
| | 8/31/23 | 8/31/22 | 8/31/21 | 8/31/20 | 8/31/19 |
| Net asset value, beginning of period | $16.54 | $25.35 | $20.05 | $17.57 | $20.21 |
| Income (loss) from investment operations |
| Net investment income (loss) (d) | $(0.09) | $(0.24) | $(0.25) | $(0.19) | $(0.16) |
| Net realized and unrealized gain (loss) | 2.07 | (6.99) | 6.46 | 3.25 | (0.60) |
| Total from investment operations | $1.98 | $(7.23) | $6.21 | $3.06 | $(0.76) |
| Less distributions declared to shareholders |
| From net investment income | $— | $— | $— | $— | $— |
| From net realized gain | — | (1.58) | (0.91) | (0.58) | (1.88) |
| Total distributions declared to shareholders | $— | $(1.58) | $(0.91) | $(0.58) | $(1.88) |
| Net asset value, end of period (x) | $18.52 | $16.54 | $25.35 | $20.05 | $17.57 |
| Total return (%) (r)(s)(t)(x) | 11.97 | (30.24) | 31.84 | 17.72 | (2.35) |
Ratios (%) (to average net assets)
and Supplemental data: |
| Expenses before expense reductions | 2.54 | 2.43 | 2.46 | 2.72 | 2.78 |
| Expenses after expense reductions | 2.10 | 2.10 | 2.10 | 2.24 | 2.26 |
| Net investment income (loss) | (0.54) | (1.16) | (1.13) | (1.08) | (0.91) |
| Portfolio turnover | 29 | 36 | 36 | 84 | 55 |
| Net assets at end of period (000 omitted) | $1,578 | $2,137 | $3,896 | $3,422 | $3,287 |
See Notes to Financial Statements
Financial Highlights – continued
| Class I | Year ended |
| | 8/31/23 | 8/31/22 | 8/31/21 | 8/31/20 | 8/31/19 |
| Net asset value, beginning of period | $18.66 | $28.15 | $21.96 | $19.00 | $21.54 |
| Income (loss) from investment operations |
| Net investment income (loss) (d) | $0.10 | $(0.06) | $(0.00)(w) | $(0.02) | $0.01 |
| Net realized and unrealized gain (loss) | 2.35 | (7.83) | 7.10 | 3.56 | (0.62) |
| Total from investment operations | $2.45 | $(7.89) | $7.10 | $3.54 | $(0.61) |
| Less distributions declared to shareholders |
| From net investment income | $— | $(0.02) | $— | $— | $(0.05) |
| From net realized gain | — | (1.58) | (0.91) | (0.58) | (1.88) |
| Total distributions declared to shareholders | $— | $(1.60) | $(0.91) | $(0.58) | $(1.93) |
| Net asset value, end of period (x) | $21.11 | $18.66 | $28.15 | $21.96 | $19.00 |
| Total return (%) (r)(s)(t)(x) | 13.13 | (29.55) | 33.16 | 18.94 | (1.41) |
Ratios (%) (to average net assets)
and Supplemental data: |
| Expenses before expense reductions | 1.54 | 1.40 | 1.43 | 1.72 | 1.76 |
| Expenses after expense reductions | 1.10 | 1.10 | 1.09 | 1.24 | 1.26 |
| Net investment income (loss) | 0.50 | (0.26) | (0.02) | (0.09) | 0.05 |
| Portfolio turnover | 29 | 36 | 36 | 84 | 55 |
| Net assets at end of period (000 omitted) | $17,671 | $20,703 | $61,502 | $18,688 | $14,059 |
| Class R1 | Year ended |
| | 8/31/23 | 8/31/22 | 8/31/21 | 8/31/20 | 8/31/19 |
| Net asset value, beginning of period | $16.53 | $25.33 | $20.04 | $17.56 | $20.20 |
| Income (loss) from investment operations |
| Net investment income (loss) (d) | $(0.08) | $(0.23) | $(0.25) | $(0.19) | $(0.16) |
| Net realized and unrealized gain (loss) | 2.06 | (6.99) | 6.45 | 3.25 | (0.60) |
| Total from investment operations | $1.98 | $(7.22) | $6.20 | $3.06 | $(0.76) |
| Less distributions declared to shareholders |
| From net investment income | $— | $— | $— | $— | $— |
| From net realized gain | — | (1.58) | (0.91) | (0.58) | (1.88) |
| Total distributions declared to shareholders | $— | $(1.58) | $(0.91) | $(0.58) | $(1.88) |
| Net asset value, end of period (x) | $18.51 | $16.53 | $25.33 | $20.04 | $17.56 |
| Total return (%) (r)(s)(t)(x) | 11.98 | (30.22) | 31.80 | 17.73 | (2.35) |
Ratios (%) (to average net assets)
and Supplemental data: |
| Expenses before expense reductions | 2.53 | 2.43 | 2.45 | 2.72 | 2.79 |
| Expenses after expense reductions | 2.10 | 2.10 | 2.09 | 2.24 | 2.26 |
| Net investment income (loss) | (0.48) | (1.13) | (1.11) | (1.08) | (0.92) |
| Portfolio turnover | 29 | 36 | 36 | 84 | 55 |
| Net assets at end of period (000 omitted) | $130 | $114 | $160 | $120 | $101 |
See Notes to Financial Statements
Financial Highlights – continued
| Class R2 | Year ended |
| | 8/31/23 | 8/31/22 | 8/31/21 | 8/31/20 | 8/31/19 |
| Net asset value, beginning of period | $17.67 | $26.85 | $21.09 | $18.36 | $20.93 |
| Income (loss) from investment operations |
| Net investment income (loss) (d) | $(0.00)(w) | $(0.13) | $(0.14) | $(0.11) | $(0.07) |
| Net realized and unrealized gain (loss) | 2.22 | (7.47) | 6.81 | 3.42 | (0.62) |
| Total from investment operations | $2.22 | $(7.60) | $6.67 | $3.31 | $(0.69) |
| Less distributions declared to shareholders |
| From net investment income | $— | $— | $— | $— | $— |
| From net realized gain | — | (1.58) | (0.91) | (0.58) | (1.88) |
| Total distributions declared to shareholders | $— | $(1.58) | $(0.91) | $(0.58) | $(1.88) |
| Net asset value, end of period (x) | $19.89 | $17.67 | $26.85 | $21.09 | $18.36 |
| Total return (%) (r)(s)(t)(x) | 12.56 | (29.91) | 32.47 | 18.33 | (1.89) |
Ratios (%) (to average net assets)
and Supplemental data: |
| Expenses before expense reductions | 2.04 | 1.94 | 1.95 | 2.22 | 2.29 |
| Expenses after expense reductions | 1.60 | 1.60 | 1.59 | 1.74 | 1.76 |
| Net investment income (loss) | (0.00) | (0.61) | (0.61) | (0.58) | (0.41) |
| Portfolio turnover | 29 | 36 | 36 | 84 | 55 |
| Net assets at end of period (000 omitted) | $179 | $225 | $237 | $178 | $218 |
| Class R3 | Year ended |
| | 8/31/23 | 8/31/22 | 8/31/21 | 8/31/20 | 8/31/19 |
| Net asset value, beginning of period | $18.22 | $27.56 | $21.57 | $18.72 | $21.26 |
| Income (loss) from investment operations |
| Net investment income (loss) (d) | $0.07 | $(0.08) | $(0.09) | $(0.06) | $(0.03) |
| Net realized and unrealized gain (loss) | 2.27 | (7.68) | 6.99 | 3.49 | (0.62) |
| Total from investment operations | $2.34 | $(7.76) | $6.90 | $3.43 | $(0.65) |
| Less distributions declared to shareholders |
| From net investment income | $— | $— | $— | $— | $(0.01) |
| From net realized gain | — | (1.58) | (0.91) | (0.58) | (1.88) |
| Total distributions declared to shareholders | $— | $(1.58) | $(0.91) | $(0.58) | $(1.89) |
| Net asset value, end of period (x) | $20.56 | $18.22 | $27.56 | $21.57 | $18.72 |
| Total return (%) (r)(s)(t)(x) | 12.84 | (29.71) | 32.82 | 18.63 | (1.63) |
Ratios (%) (to average net assets)
and Supplemental data: |
| Expenses before expense reductions | 1.76 | 1.68 | 1.70 | 1.97 | 2.04 |
| Expenses after expense reductions | 1.35 | 1.35 | 1.34 | 1.49 | 1.51 |
| Net investment income (loss) | 0.34 | (0.37) | (0.35) | (0.31) | (0.16) |
| Portfolio turnover | 29 | 36 | 36 | 84 | 55 |
| Net assets at end of period (000 omitted) | $731 | $189 | $294 | $206 | $152 |
See Notes to Financial Statements
Financial Highlights – continued
| Class R4 | Year ended |
| | 8/31/23 | 8/31/22 | 8/31/21 | 8/31/20 | 8/31/19 |
| Net asset value, beginning of period | $18.67 | $28.15 | $21.96 | $19.00 | $21.56 |
| Income (loss) from investment operations |
| Net investment income (loss) (d) | $0.08 | $(0.03) | $(0.03) | $(0.02) | $0.02 |
| Net realized and unrealized gain (loss) | 2.38 | (7.85) | 7.13 | 3.56 | (0.64) |
| Total from investment operations | $2.46 | $(7.88) | $7.10 | $3.54 | $(0.62) |
| Less distributions declared to shareholders |
| From net investment income | $— | $(0.02) | $— | $— | $(0.06) |
| From net realized gain | — | (1.58) | (0.91) | (0.58) | (1.88) |
| Total distributions declared to shareholders | $— | $(1.60) | $(0.91) | $(0.58) | $(1.94) |
| Net asset value, end of period (x) | $21.13 | $18.67 | $28.15 | $21.96 | $19.00 |
| Total return (%) (r)(s)(t)(x) | 13.18 | (29.53) | 33.16 | 18.94 | (1.43) |
Ratios (%) (to average net assets)
and Supplemental data: |
| Expenses before expense reductions | 1.56 | 1.43 | 1.45 | 1.72 | 1.78 |
| Expenses after expense reductions | 1.10 | 1.10 | 1.09 | 1.24 | 1.26 |
| Net investment income (loss) | 0.41 | (0.13) | (0.11) | (0.08) | 0.08 |
| Portfolio turnover | 29 | 36 | 36 | 84 | 55 |
| Net assets at end of period (000 omitted) | $93 | $82 | $116 | $87 | $73 |
| Class R6 | Year ended |
| | 8/31/23 | 8/31/22 | 8/31/21 | 8/31/20 | 8/31/19 |
| Net asset value, beginning of period | $18.73 | $28.24 | $22.01 | $19.03 | $21.58 |
| Income (loss) from investment operations |
| Net investment income (loss) (d) | $0.12 | $(0.01) | $(0.00)(w) | $0.01 | $0.05 |
| Net realized and unrealized gain (loss) | 2.36 | (7.88) | 7.14 | 3.55 | (0.64) |
| Total from investment operations | $2.48 | $(7.89) | $7.14 | $3.56 | $(0.59) |
| Less distributions declared to shareholders |
| From net investment income | $— | $(0.04) | $— | $— | $(0.08) |
| From net realized gain | — | (1.58) | (0.91) | (0.58) | (1.88) |
| Total distributions declared to shareholders | $— | $(1.62) | $(0.91) | $(0.58) | $(1.96) |
| Net asset value, end of period (x) | $21.21 | $18.73 | $28.24 | $22.01 | $19.03 |
| Total return (%) (r)(s)(t)(x) | 13.24 | (29.49) | 33.27 | 19.01 | (1.26) |
Ratios (%) (to average net assets)
and Supplemental data: |
| Expenses before expense reductions | 1.43 | 1.33 | 1.37 | 1.62 | 1.69 |
| Expenses after expense reductions | 1.01 | 1.00 | 1.01 | 1.15 | 1.16 |
| Net investment income (loss) | 0.62 | (0.03) | (0.01) | 0.03 | 0.24 |
| Portfolio turnover | 29 | 36 | 36 | 84 | 55 |
| Net assets at end of period (000 omitted) | $22,034 | $14,688 | $20,788 | $13,432 | $13,382 |
See Notes to Financial Statements
Financial Highlights – continued
| (d) | Per share data is based on average shares outstanding. |
| (r) | Certain expenses have been reduced without which performance would have been lower. |
| (s) | From time to time the fund may receive proceeds from litigation settlements, without which performance would be lower. |
| (t) | Total returns do not include any applicable sales charges. |
| (w) | Per share amount was less than $0.01. |
| (x) | The net asset values and total returns have been calculated on net assets which include adjustments made in accordance with U.S. generally accepted accounting principles required at period end for financial reporting purposes. |
See Notes to Financial Statements
Notes to Financial Statements
(1) Business and Organization
MFS Global New Discovery Fund (the fund) is a diversified series of MFS Series Trust IV (the trust). The trust is organized as a Massachusetts business trust and is registered under the Investment Company Act of 1940, as amended, as an open-end management investment company.
The fund is an investment company and accordingly follows the investment company accounting and reporting guidance of the Financial Accounting Standards Board (FASB) Accounting Standards Codification Topic 946 Financial Services - Investment Companies.
(2) Significant Accounting Policies
General — The preparation of financial statements in conformity with U.S. generally accepted accounting principles requires management to make estimates and assumptions that affect the reported amounts of assets and liabilities, and disclosure of contingent assets and liabilities at the date of the financial statements and the reported amounts of increases and decreases in net assets from operations during the reporting period. Actual results could differ from those estimates. In the preparation of these financial statements, management has evaluated subsequent events occurring after the date of the fund’s Statement of Assets and Liabilities through the date that the financial statements were issued. The fund invests in foreign securities. Investments in foreign securities are vulnerable to the effects of changes in the relative values of the local currency and the U.S. dollar and to the effects of changes in each country’s market, economic, industrial, political, regulatory, geopolitical, environmental, public health, and other conditions.
Balance Sheet Offsetting — The fund's accounting policy with respect to balance sheet offsetting is that, absent an event of default by the counterparty or a termination of the agreement, the International Swaps and Derivatives Association (ISDA) Master Agreement, or similar agreement, does not result in an offset of reported amounts of financial assets and financial liabilities in the Statement of Assets and Liabilities across transactions between the fund and the applicable counterparty. The fund's right to setoff may be restricted or prohibited by the bankruptcy or insolvency laws of the particular jurisdiction to which a specific master netting agreement counterparty is subject. Balance sheet offsetting disclosures, to the extent applicable to the fund, have been included in the fund’s Significant Accounting Policies note under the captions for each of the fund’s in-scope financial instruments and transactions.
Investment Valuations — Subject to its oversight, the fund's Board of Trustees has delegated primary responsibility for determining or causing to be determined the value of the fund’s investments to MFS as the fund's adviser, pursuant to the fund’s valuation policy and procedures which have been adopted by the adviser and approved by the Board. In accordance with Rule 2a-5 under the Investment Company Act of 1940, the Board of Trustees designated the adviser as the “valuation designee” of the fund. If the adviser, as valuation designee, determines that reliable market quotations are not readily available for an investment, the investment is valued at fair value as determined in good faith by the adviser in accordance with the adviser’s fair valuation policy and procedures.
Notes to Financial Statements - continued
Under the fund's valuation policy and procedures, equity securities, including restricted equity securities, are generally valued at the last sale or official closing price on their primary market or exchange as provided by a third-party pricing service. Equity securities, for which there were no sales reported that day, are generally valued at the last quoted daily bid quotation on their primary market or exchange as provided by a third-party pricing service. Short-term instruments with a maturity at issuance of 60 days or less may be valued at amortized cost, which approximates market value.
Open-end investment companies are generally valued at net asset value per share. The values of foreign securities and other assets and liabilities expressed in foreign currencies are converted to U.S. dollars using the mean of bid and asked prices for rates provided by a third-party pricing service.
Under the fund’s valuation policy and procedures, market quotations are not considered to be readily available for debt instruments, floating rate loans, and many types of derivatives. These investments are generally valued at fair value based on information from third-party pricing services or otherwise determined by the adviser in accordance with the adviser’s fair valuation policy and procedures. Securities and other assets generally valued on the basis of information from a third-party pricing service may also be valued at a broker/dealer bid quotation. In determining values, third-party pricing services can utilize both transaction data and market information such as yield, quality, coupon rate, maturity, type of issue, trading characteristics, spreads and other market data. An investment may also be valued at fair value if the adviser determines that the investment’s value has been materially affected by events occurring after the close of the exchange or market on which the investment is principally traded (such as foreign exchange or market) and prior to the determination of the fund’s net asset value, or after the halt of trading of a specific security where trading does not resume prior to the close of the exchange or market on which the security is principally traded. Events that occur after foreign markets close (such as developments in foreign markets and significant movements in the U.S. markets) and prior to the determination of the fund’s net asset value may be deemed to have a material effect on the value of securities traded in foreign markets. Accordingly, the fund’s foreign equity securities may often be valued at fair value. The adviser generally relies on third-party pricing services or other information (such as the correlation with price movements of similar securities in the same or other markets; the type, cost and investment characteristics of the security; the business and financial condition of the issuer; and trading and other market data) to assist in determining whether to fair value and at what value to fair value an investment. The value of an investment for purposes of calculating the fund’s net asset value can differ depending on the source and method used to determine value. When fair valuation is used, the value of an investment used to determine the fund’s net asset value may differ from quoted or published prices for the same investment. There can be no assurance that the fund could obtain the fair value assigned to an investment if it were to sell the investment at the same time at which the fund determines its net asset value per share.
Various inputs are used in determining the value of the fund's assets or liabilities. These inputs are categorized into three broad levels. In certain cases, the inputs used to measure fair value may fall into different levels of the fair value hierarchy. In such cases, an investment's level within the fair value hierarchy is based on the lowest level of input that is significant to the fair value measurement. The fund's assessment of the significance of a particular input to the fair value measurement in its entirety requires judgment, and considers factors specific to the investment. Level 1 includes unadjusted
Notes to Financial Statements - continued
quoted prices in active markets for identical assets or liabilities. Level 2 includes other significant observable market-based inputs (including quoted prices for similar securities, interest rates, prepayment speed, and credit risk). Level 3 includes significant unobservable inputs, which may include the adviser's own assumptions in determining the fair value of investments. The following is a summary of the levels used as of August 31, 2023 in valuing the fund's assets and liabilities:
| Financial Instruments | Level 1 | Level 2 | Level 3 | Total |
| Equity Securities: | | | | |
| United States | $25,460,964 | $— | $— | $25,460,964 |
| United Kingdom | 8,207,023 | — | — | 8,207,023 |
| Japan | 7,016,766 | — | — | 7,016,766 |
| Germany | 4,359,010 | — | — | 4,359,010 |
| Canada | 3,471,441 | — | — | 3,471,441 |
| Netherlands | 2,664,774 | — | — | 2,664,774 |
| France | 2,387,700 | — | — | 2,387,700 |
| Australia | 1,990,865 | — | — | 1,990,865 |
| Brazil | 1,450,551 | — | — | 1,450,551 |
| Other Countries | 10,395,841 | — | 0 | 10,395,841 |
| Mutual Funds | 1,435,476 | — | — | 1,435,476 |
| Total | $68,840,411 | $— | $0 | $68,840,411 |
For further information regarding security characteristics, see the Portfolio of Investments. At August 31, 2023, the fund held one level 3 security valued at $0, which was also held and valued at $0 at August 31, 2022.
Foreign Currency Translation — Purchases and sales of foreign investments, income, and expenses are converted into U.S. dollars based upon currency exchange rates prevailing on the respective dates of such transactions or on the reporting date for foreign denominated receivables and payables. Gains and losses attributable to foreign currency exchange rates on sales of securities are recorded for financial statement purposes as net realized gains and losses on investments. Gains and losses attributable to foreign exchange rate movements on receivables, payables, income and expenses are recorded for financial statement purposes as foreign currency transaction gains and losses. That portion of both realized and unrealized gains and losses on investments that results from fluctuations in foreign currency exchange rates is not separately disclosed.
Security Loans — Under its Securities Lending Agency Agreement with the fund, State Street Bank and Trust Company, as lending agent, loans the securities of the fund to certain qualified institutions (the “Borrowers”) approved by the fund. Security loans can be terminated at the discretion of either the lending agent or the fund and the related securities must be returned within the earlier of the standard trade settlement period for such securities or within three business days. The loans are collateralized by cash and/or U.S. Treasury and federal agency obligations in an amount typically at least equal to the market value of the securities loaned. On loans collateralized by cash, the cash collateral is invested in a money market fund. The market value of the loaned securities is determined at the close of business of the fund and any additional required collateral is delivered to the fund on the next business day. The lending agent provides the fund with indemnification against Borrower default. In the event of Borrower default, the lending agent will, for the benefit of the fund, either purchase securities
Notes to Financial Statements - continued
identical to those loaned or, when such purchase is commercially impracticable, pay the fund the market value of the loaned securities. In return, the lending agent assumes the fund's rights to the related collateral. If the collateral value is less than the cost to purchase identical securities, the lending agent is responsible for the shortfall, but only to the extent that such shortfall is not due to a decline in collateral value resulting from collateral reinvestment for which the fund bears the risk of loss. A portion of the income generated upon investment of the collateral is remitted to the Borrowers, and the remainder is allocated between the fund and the lending agent. On loans collateralized by U.S. Treasury and/or federal agency obligations, a fee is received from the Borrower, and is allocated between the fund and the lending agent. Income from securities lending is separately reported in the Statement of Operations. The dividend and interest income earned on the securities loaned is accounted for in the same manner as other dividend and interest income. At August 31, 2023, there were no securities on loan or collateral outstanding.
Indemnifications — Under the fund's organizational documents, its officers and Trustees may be indemnified against certain liabilities and expenses arising out of the performance of their duties to the fund. Additionally, in the normal course of business, the fund enters into agreements with service providers that may contain indemnification clauses. The fund's maximum exposure under these agreements is unknown as this would involve future claims that may be made against the fund that have not yet occurred.
Investment Transactions and Income — Dividends received in cash are recorded on the ex-dividend date. Certain dividends from foreign securities will be recorded when the fund is informed of the dividend if such information is obtained subsequent to the ex-dividend date. Dividend payments received in additional securities are recorded on the ex-dividend date in an amount equal to the value of the security on such date.
The fund may receive proceeds from litigation settlements. Any proceeds received from litigation involving portfolio holdings are reflected in the Statement of Operations in realized gain/loss if the security has been disposed of by the fund or in unrealized gain/loss if the security is still held by the fund. Any other proceeds from litigation not related to portfolio holdings are reflected as other income in the Statement of Operations.
Investment transactions are recorded on the trade date. In determining the net gain or loss on securities sold, the cost of securities is determined on the identified cost basis.
Tax Matters and Distributions — The fund intends to qualify as a regulated investment company, as defined under Subchapter M of the Internal Revenue Code, and to distribute all of its taxable income, including realized capital gains. As a result, no provision for federal income tax is required. The fund’s federal tax returns, when filed, will remain subject to examination by the Internal Revenue Service for a three year period. Management has analyzed the fund’s tax positions taken on federal and state tax returns for all open tax years and does not believe that there are any uncertain tax positions that require recognition of a tax liability. Foreign taxes, if any, have been accrued by the fund in the accompanying financial statements in accordance with the applicable foreign tax law. Foreign income taxes may be withheld by certain countries in which the fund invests. Additionally, capital gains realized by the fund on securities issued in or by certain foreign countries may be subject to capital gains tax imposed by those countries.
Notes to Financial Statements - continued
Distributions to shareholders are recorded on the ex-dividend date. Income and capital gain distributions are determined in accordance with income tax regulations, which may differ from U.S. generally accepted accounting principles. Certain capital accounts in the financial statements are periodically adjusted for permanent differences in order to reflect their tax character. These adjustments have no impact on net assets or net asset value per share. Temporary differences which arise from recognizing certain items of income, expense, gain or loss in different periods for financial statement and tax purposes will reverse at some time in the future.
Book/tax differences primarily relate to net operating losses, passive foreign investment companies, and wash sale loss deferrals.
The tax character of distributions declared to shareholders for the last two fiscal years is as follows:
| | Year ended
8/31/23 | Year ended
8/31/22 |
| Ordinary income (including any short-term capital gains) | $— | $3,483,089 |
| Long-term capital gains | — | 4,337,012 |
| Total distributions | $— | $7,820,101 |
The federal tax cost and the tax basis components of distributable earnings were as follows:
| As of 8/31/23 | |
| Cost of investments | $61,194,513 |
| Gross appreciation | 14,101,256 |
| Gross depreciation | (6,455,358) |
| Net unrealized appreciation (depreciation) | $7,645,898 |
| Capital loss carryforwards | (5,489,994) |
| Other temporary differences | (1,286) |
| Total distributable earnings (loss) | $2,154,618 |
As of August 31, 2023, the fund had capital loss carryforwards available to offset future realized gains. These net capital losses may be carried forward indefinitely and their character is retained as short-term and/or long-term losses. Such losses are characterized as follows:
| Short-Term | $(2,918,398) |
| Long-Term | (2,571,596) |
| Total | $(5,489,994) |
Multiple Classes of Shares of Beneficial Interest — The fund offers multiple classes of shares, which differ in their respective distribution and service fees. The fund's income, realized and unrealized gain (loss), and common expenses are allocated to shareholders based on the daily net assets of each class. Dividends are declared separately for each class. Differences in per share dividend rates are generally due to differences in separate class expenses. Class B and Class C shares will convert to
Notes to Financial Statements - continued
Class A shares approximately eight years after purchase. The fund’s distributions declared to shareholders as reported in the Statements of Changes in Net Assets are presented by class as follows:
| | Year
ended
8/31/23 | | Year
ended
8/31/22 |
| Class A | $— | | $2,689,305 |
| Class B | — | | 174,641 |
| Class C | — | | 236,042 |
| Class I | — | | 3,450,777 |
| Class R1 | — | | 10,037 |
| Class R2 | — | | 17,602 |
| Class R3 | — | | 14,661 |
| Class R4 | — | | 6,625 |
| Class R6 | — | | 1,220,411 |
| Total | $— | | $7,820,101 |
(3) Transactions with Affiliates
Investment Adviser — The fund has an investment advisory agreement with MFS to provide overall investment management and related administrative services and facilities to the fund. The management fee is computed daily and paid monthly at the following annual rates based on the fund's average daily net assets:
| Up to $1 billion | 0.975% |
| In excess of $1 billion and up to $2.5 billion | 0.90% |
| In excess of $2.5 billion | 0.85% |
MFS has agreed in writing to reduce its management fee by a specified amount if certain MFS mutual fund assets exceed thresholds agreed to by MFS and the fund's Board of Trustees. MFS has also agreed in writing to waive at least 0.01% of its management fee as part of this agreement. The agreement to waive at least 0.01% of the management fee will continue until modified by the fund's Board of Trustees, but such agreement will continue at least until December 31, 2023. For the year ended August 31, 2023, this management fee reduction amounted to $8,270, which is included in the reduction of total expenses in the Statement of Operations. The management fee incurred for the year ended August 31, 2023 was equivalent to an annual effective rate of 0.96% of the fund's average daily net assets.
The investment adviser has agreed in writing to pay a portion of the fund’s total annual operating expenses, excluding interest, taxes, extraordinary expenses, brokerage and transaction costs, certain tax reclaim recovery expenses (including contingency fees and closing agreement expenses), and investment-related expenses, such that total fund operating expenses do not exceed the following rates annually of each class’s average daily net assets:
| Classes |
| A | B | C | I | R1 | R2 | R3 | R4 | R6 |
| 1.35% | 2.10% | 2.10% | 1.10% | 2.10% | 1.60% | 1.35% | 1.10% | 1.01% |
Notes to Financial Statements - continued
This written agreement will continue until modified by the fund’s Board of Trustees, but such agreement will continue at least until December 31, 2024. For the year ended August 31, 2023, this reduction amounted to $263,812, which is included in the reduction of total expenses in the Statement of Operations.
Distributor — MFS Fund Distributors, Inc. (MFD), a wholly-owned subsidiary of MFS, as distributor, received $4,196 for the year ended August 31, 2023, as its portion of the initial sales charge on sales of Class A shares of the fund.
The Board of Trustees has adopted a distribution plan for certain share classes pursuant to Rule 12b-1 of the Investment Company Act of 1940.
The fund's distribution plan provides that the fund will pay MFD for services provided by MFD and financial intermediaries in connection with the distribution and servicing of certain share classes. One component of the plan is a distribution fee paid to MFD and another component of the plan is a service fee paid to MFD. MFD may subsequently pay all, or a portion, of the distribution and/or service fees to financial intermediaries. The distribution and service fees are computed daily and paid monthly.
Distribution Plan Fee Table:
| | Distribution
Fee Rate (d) | Service
Fee Rate (d) | Total
Distribution
Plan (d) | Annual
Effective
Rate (e) | Distribution
and Service
Fee |
| Class A | — | 0.25% | 0.25% | 0.25% | $ 59,966 |
| Class B | 0.75% | 0.25% | 1.00% | 1.00% | 15,846 |
| Class C | 0.75% | 0.25% | 1.00% | 1.00% | 16,747 |
| Class R1 | 0.75% | 0.25% | 1.00% | 1.00% | 1,212 |
| Class R2 | 0.25% | 0.25% | 0.50% | 0.50% | 1,036 |
| Class R3 | — | 0.25% | 0.25% | 0.25% | 1,500 |
| Total Distribution and Service Fees | | | | | $96,307 |
| (d) | In accordance with the distribution plan for certain classes, the fund pays distribution and/or service fees equal to these annual percentage rates of each class’s average daily net assets. The distribution and service fee rates disclosed by class represent the current rates in effect at the end of the reporting period. Any rate changes, if applicable, are detailed below. |
| (e) | The annual effective rates represent actual fees incurred under the distribution plan for the year ended August 31, 2023 based on each class's average daily net assets. MFD has voluntarily agreed to rebate a portion of each class's 0.25% service fee attributable to accounts for which there is no financial intermediary specified on the account except for accounts attributable to MFS or its affiliates' seed money. There were no service fee rebates for the year ended August 31, 2023. |
Certain Class A shares are subject to a contingent deferred sales charge (CDSC) in the event of a shareholder redemption within 18 months of purchase. Class B shares are subject to a CDSC in the event of a shareholder redemption within six years of
Notes to Financial Statements - continued
purchase. Class C shares are subject to a CDSC in the event of a shareholder redemption within 12 months of purchase. All contingent deferred sales charges are paid to MFD and during the year ended August 31, 2023, were as follows:
| | Amount |
| Class A | $792 |
| Class B | 328 |
| Class C | 51 |
Shareholder Servicing Agent — MFS Service Center, Inc. (MFSC), a wholly-owned subsidiary of MFS, receives a fee from the fund for its services as shareholder servicing agent calculated as a percentage of the average daily net assets of the fund as determined periodically under the supervision of the fund's Board of Trustees. For the year ended August 31, 2023, the fee was $11,394, which equated to 0.0179% annually of the fund's average daily net assets. MFSC also receives reimbursement from the fund for out-of-pocket expenses, sub-accounting and other shareholder servicing costs which may be paid to affiliated and unaffiliated service providers. Class R6 shares do not incur sub-accounting fees. For the year ended August 31, 2023, these out-of-pocket expenses, sub-accounting and other shareholder servicing costs amounted to $54,513.
Administrator — MFS provides certain financial, legal, shareholder communications, compliance, and other administrative services to the fund. Under an administrative services agreement, the fund reimburses MFS the costs incurred to provide these services. The fund is charged an annual fixed amount of $17,500 plus a fee based on average daily net assets. The administrative services fee is computed daily and paid monthly. The administrative services fee incurred for the year ended August 31, 2023 was equivalent to an annual effective rate of 0.0306% of the fund's average daily net assets.
Trustees’ and Officers’ Compensation — The fund pays compensation to independent Trustees in the form of a retainer, attendance fees, and additional compensation to Board and Committee chairpersons. Independent Trustees’ compensation is accrued daily and paid subsequent to each Trustee Board meeting. The fund does not pay compensation directly to Trustees or officers of the fund who are also officers of the investment adviser, all of whom receive remuneration from MFS for their services to the fund. Certain officers and Trustees of the fund are officers or directors of MFS, MFD, and MFSC.
Other — The fund invests in the MFS Institutional Money Market Portfolio which is managed by MFS and seeks current income consistent with preservation of capital and liquidity. This money market fund does not pay a management fee to MFS but does incur investment and operating costs.
At August 31, 2023, MFS held approximately 66% of the outstanding shares of Class R1 and 100% of the outstanding shares of Class R4.
(4) Portfolio Securities
For the year ended August 31, 2023, purchases and sales of investments, other than short-term obligations, aggregated $17,954,263 and $19,660,179, respectively.
Notes to Financial Statements - continued
(5) Shares of Beneficial Interest
The fund's Declaration of Trust permits the Trustees to issue an unlimited number of full and fractional shares of beneficial interest. Transactions in fund shares were as follows:
| | Year ended
8/31/23 | | Year ended
8/31/22 |
| | Shares | Amount | | Shares | Amount |
| Shares sold | | | | | |
| Class A | 238,781 | $4,470,571 | | 374,755 | $8,791,107 |
| Class B | 2 | 27 | | 14 | 250 |
| Class C | 8,249 | 145,346 | | 10,749 | 232,708 |
| Class I | 283,232 | 5,449,784 | | 658,954 | 14,960,270 |
| Class R1 | 160 | 2,720 | | 137 | 2,720 |
| Class R2 | 1,132 | 20,714 | | 3,219 | 78,069 |
| Class R3 | 25,873 | 453,360 | | 1,115 | 24,417 |
| Class R4 | 7,477 | 128,454 | | — | — |
| Class R6 | 483,983 | 9,930,084 | | 208,367 | 4,884,616 |
| | 1,048,889 | $20,601,060 | | 1,257,310 | $28,974,157 |
Shares issued to shareholders
in reinvestment of distributions | | | | | |
| Class A | — | $— | | 107,197 | $2,688,493 |
| Class B | — | — | | 7,630 | 174,641 |
| Class C | — | — | | 10,312 | 236,042 |
| Class I | — | — | | 134,465 | 3,447,694 |
| Class R1 | — | — | | 439 | 10,037 |
| Class R2 | — | — | | 722 | 17,602 |
| Class R3 | — | — | | 585 | 14,661 |
| Class R4 | — | — | | 258 | 6,625 |
| Class R6 | — | — | | 37,602 | 967,130 |
| | — | $— | | 299,210 | $7,562,925 |
| Shares reacquired | | | | | |
| Class A | (338,627) | $(6,243,871) | | (795,983) | $(16,371,684) |
| Class B | (23,187) | (394,481) | | (20,014) | (435,469) |
| Class C | (52,329) | (868,786) | | (45,502) | (920,814) |
| Class I | (555,645) | (10,854,907) | | (1,868,911) | (40,028,971) |
| Class R1 | (5) | (89) | | (1) | (14) |
| Class R2 | (4,901) | (91,970) | | (18) | (430) |
| Class R3 | (728) | (14,346) | | (1,986) | (53,917) |
| Class R4 | (7,477) | (150,789) | | — | — |
| Class R6 | (229,366) | (4,500,630) | | (198,028) | (4,474,660) |
| | (1,212,265) | $(23,119,869) | | (2,930,443) | $(62,285,959) |
Notes to Financial Statements - continued
| | Year ended
8/31/23 | | Year ended
8/31/22 |
| | Shares | Amount | | Shares | Amount |
| Net change | | | | | |
| Class A | (99,846) | $(1,773,300) | | (314,031) | $(4,892,084) |
| Class B | (23,185) | (394,454) | | (12,370) | (260,578) |
| Class C | (44,080) | (723,440) | | (24,441) | (452,064) |
| Class I | (272,413) | (5,405,123) | | (1,075,492) | (21,621,007) |
| Class R1 | 155 | 2,631 | | 575 | 12,743 |
| Class R2 | (3,769) | (71,256) | | 3,923 | 95,241 |
| Class R3 | 25,145 | 439,014 | | (286) | (14,839) |
| Class R4 | — | (22,335) | | 258 | 6,625 |
| Class R6 | 254,617 | 5,429,454 | | 47,941 | 1,377,086 |
| | (163,376) | $(2,518,809) | | (1,373,923) | $(25,748,877) |
Effective June 1, 2019, purchases of the fund’s Class B shares were closed to new and existing investors subject to certain exceptions. On March 30, 2023, the fund announced that effective after the close of business on September 29, 2023, purchases of Class R1 and Class R2 shares will be closed to new eligible investors.
(6) Line of Credit
The fund and certain other funds managed by MFS participate in a $1.45 billion unsecured committed line of credit of which $1.2 billion is reserved for use by the fund and certain other MFS U.S. funds. The line of credit is provided by a syndicate of banks under a credit agreement. Borrowings may be made for temporary financing needs. Interest is charged to each fund, based on its borrowings, generally at a rate equal to the highest of 1) Daily Simple SOFR (Secured Overnight Financing Rate) plus 0.10%, 2) the Federal Funds Effective Rate, or 3) the Overnight Bank Funding Rate, each plus an agreed upon spread. A commitment fee, based on the average daily unused portion of the committed line of credit, is allocated among the participating funds. The line of credit expires on March 14, 2024 unless extended or renewed. In addition, the fund and other funds managed by MFS have established unsecured uncommitted borrowing arrangements with certain banks for temporary financing needs. Interest is charged to each fund, based on its borrowings, at rates equal to customary reference rates plus an agreed upon spread. For the year ended August 31, 2023, the fund’s commitment fee and interest expense were $307 and $0, respectively, and are included in “Miscellaneous” expense in the Statement of Operations.
Notes to Financial Statements - continued
(7) Investments in Affiliated Issuers
An affiliated issuer may be considered one in which the fund owns 5% or more of the outstanding voting securities, or a company which is under common control. For the purposes of this report, the following were affiliated issuers:
| Affiliated Issuers | Beginning
Value | Purchases | Sales
Proceeds | Realized
Gain
(Loss) | Change in
Unrealized
Appreciation or
Depreciation | Ending
Value |
| MFS Institutional Money Market Portfolio | $2,012,274 | $15,448,466 | $16,025,945 | $465 | $216 | $1,435,476 |
| Affiliated Issuers | Dividend
Income | Capital Gain
Distributions |
| MFS Institutional Money Market Portfolio | $67,478 | $— |
(8) Russia and Ukraine Conflict
The fund invests in securities and/or derivative instruments that are economically tied to Russia and/or Ukraine. Escalation of the conflict between Russia and Ukraine in late February 2022 caused market volatility and disruption in the tradability of Russian securities, including closure of the local securities market, temporary restriction on securities sales by non-residents, and disruptions to clearance and payment systems. To the extent that the fund is unable to sell securities, whether due to market constraints or to the sanctions imposed on Russia by the United States and other countries, those securities are considered illiquid and the value of those securities reflects their illiquid classification. Management continues to monitor these events and to evaluate the related impacts on fund performance.
Report of Independent Registered Public Accounting Firm
To the Shareholders of MFS Global New Discovery Fund and the Board of Trustees of MFS Series Trust IV
Opinion on the Financial Statements
We have audited the accompanying statement of assets and liabilities of MFS Global New Discovery Fund (the “Fund”) (one of the funds constituting MFS Series Trust IV (the “Trust”)), including the portfolio of investments, as of August 31, 2023, and the related statement of operations for the year then ended, the statements of changes in net assets for each of the two years in the period then ended, the financial highlights for each of the five years in the period then ended and the related notes (collectively referred to as the “financial statements”). In our opinion, the financial statements present fairly, in all material respects, the financial position of the Fund (one of the funds constituting MFS Series Trust IV) at August 31, 2023, the results of its operations for the year then ended, the changes in its net assets for each of the two years in the period then ended and its financial highlights for each of the five years in the period then ended, in conformity with U.S. generally accepted accounting principles.
Basis for Opinion
These financial statements are the responsibility of the Trust’s management. Our responsibility is to express an opinion on the Fund’s financial statements based on our audits. We are a public accounting firm registered with the Public Company Accounting Oversight Board (United States) (“PCAOB”) and are required to be independent with respect to the Trust in accordance with the U.S. federal securities laws and the applicable rules and regulations of the Securities and Exchange Commission and the PCAOB.
We conducted our audits in accordance with the standards of the PCAOB. Those standards require that we plan and perform the audit to obtain reasonable assurance about whether the financial statements are free of material misstatement, whether due to error or fraud. The Trust is not required to have, nor were we engaged to perform, an audit of the Trust’s internal control over financial reporting. As part of our audits, we are required to obtain an understanding of internal control over financial reporting but not for the purpose of expressing an opinion on the effectiveness of the Trust’s internal control over financial reporting. Accordingly, we express no such opinion.
Report of Independent Registered Public Accounting Firm – continued
Our audits included performing procedures to assess the risks of material misstatement of the financial statements, whether due to error or fraud, and performing procedures that respond to those risks. Such procedures included examining, on a test basis, evidence regarding the amounts and disclosures in the financial statements. Our procedures included confirmation of securities owned as of August 31, 2023, by correspondence with the custodian, brokers and others; when replies were not received from brokers and others, we performed other auditing procedures. Our audits also included evaluating the accounting principles used and significant estimates made by management, as well as evaluating the overall presentation of the financial statements. We believe that our audits provide a reasonable basis for our opinion.
We have served as the auditor of one or more MFS investment companies since 1993.
Boston, Massachusetts
October 16, 2023
Trustees and Officers — Identification and Background
The Trustees and Officers of the Trust, as of October 1, 2023, are listed below, together with their principal occupations during the past five years. (Their titles may have varied during that period.) The address of each Trustee and Officer is 111 Huntington Avenue, Boston, Massachusetts 02199-7618.
| Name, Age | | Position(s) Held with Fund | | Trustee/Officer Since(h) | | Number of MFS Funds overseen by the Trustee | | Principal Occupations During
the Past Five Years | | Other Directorships During
the Past Five Years (j) |
| INTERESTED TRUSTEE | | | | | | | | | | |
Michael W. Roberge (k)
(age 57) | | Trustee | | January 2021 | | 136 | | Massachusetts Financial Services Company, Chairman (since January 2021); Chief Executive Officer (since January 2017); Director; Chairman of the Board (since January 2022); President (until December 2018); Chief Investment Officer (until December 2018) | | N/A |
| INDEPENDENT TRUSTEES | | | | | | | | | | |
John P. Kavanaugh
(age 68) | | Trustee and Chair of Trustees | | January 2009 | | 136 | | Private investor | | N/A |
Steven E. Buller
(age 72) | | Trustee | | February 2014 | | 136 | | Private investor | | N/A |
John A. Caroselli
(age 69) | | Trustee | | March 2017 | | 136 | | Private investor; JC Global Advisors, LLC (management consulting), President (since 2015) | | N/A |
Maureen R. Goldfarb
(age 68) | | Trustee | | January 2009 | | 136 | | Private investor | | N/A |
Peter D. Jones
(age 68) | | Trustee | | January 2019 | | 136 | | Private investor | | N/A |
James W. Kilman, Jr.
(age 62) | | Trustee | | January 2019 | | 136 | | Burford Capital Limited (finance and investment management), Senior Advisor (since May 3, 2021), Chief Financial Officer (2019 - May 2, 2021); KielStrand Capital LLC (family office), Chief Executive Officer (since 2016) | | Alpha-En Corporation, Director (2016-2019) |
Trustees and Officers - continued
| Name, Age | | Position(s) Held with Fund | | Trustee/Officer Since(h) | | Number of MFS Funds overseen by the Trustee | | Principal Occupations During
the Past Five Years | | Other Directorships During
the Past Five Years (j) |
Clarence Otis, Jr.
(age 67) | | Trustee | | March 2017 | | 136 | | Private investor | | VF Corporation, Director; Verizon Communications, Inc., Director; The Travelers Companies, Director |
Maryanne L. Roepke
(age 67) | | Trustee | | May 2014 | | 136 | | Private investor | | N/A |
Laurie J. Thomsen
(age 66) | | Trustee | | March 2005 | | 136 | | Private investor | | The Travelers Companies, Director; Dycom Industries, Inc., Director |
| Name, Age | | Position(s) Held with
Fund | | Trustee/Officer Since(h) | | Number of MFS Funds for which the Person is an Officer | | Principal Occupations During
the Past Five Years |
| OFFICERS | | | | | | | | |
Christopher R. Bohane (k)
(age 49) | | Assistant Secretary and Assistant Clerk | | July 2005 | | 136 | | Massachusetts Financial Services Company, Senior Vice President and Senior Managing Counsel |
Kino Clark (k)
(age 55) | | Assistant Treasurer | | January 2012 | | 136 | | Massachusetts Financial Services Company, Vice President |
John W. Clark, Jr. (k)
(age 56) | | Assistant Treasurer | | April 2017 | | 136 | | Massachusetts Financial Services Company, Vice President |
David L. DiLorenzo (k)
(age 55) | | President | | July 2005 | | 136 | | Massachusetts Financial Services Company, Senior Vice President |
Heidi W. Hardin (k)
(age 56) | | Secretary and Clerk | | April 2017 | | 136 | | Massachusetts Financial Services Company, Executive Vice President and General Counsel |
Brian E. Langenfeld (k)
(age 50) | | Assistant Secretary and Assistant Clerk | | June 2006 | | 136 | | Massachusetts Financial Services Company, Vice President and Managing Counsel |
Trustees and Officers - continued
| Name, Age | | Position(s) Held with
Fund | | Trustee/Officer Since(h) | | Number of MFS Funds for which the Person is an Officer | | Principal Occupations During
the Past Five Years |
Rosa E. Licea-Mailloux (k)
(age 47) | | Chief Compliance Officer | | March 2022 | | 136 | | Massachusetts Financial Services Company, Vice President (since 2018); Director of Corporate Compliance (2018-2021), Senior Director Compliance (2021-2022), Senior Managing Director of North American Compliance & Chief Compliance Officer (since March 2022); Natixis Investment Managers (investment management), Funds Chief Compliance Officer, Deputy General Counsel & Senior Vice President (until 2018) |
Amanda S. Mooradian (k)
(age 44) | | Assistant Secretary and Assistant Clerk | | September 2018 | | 136 | | Massachusetts Financial Services Company, Assistant Vice President and Senior Counsel |
Susan A. Pereira (k)
(age 52) | | Assistant Secretary and Assistant Clerk | | July 2005 | | 136 | | Massachusetts Financial Services Company, Vice President and Managing Counsel |
Kasey L. Phillips (k)
(age 52) | | Assistant Treasurer | | September 2012 | | 136 | | Massachusetts Financial Services Company, Vice President |
Matthew A. Stowe (k)
(age 48) | | Assistant Secretary and Assistant Clerk | | October 2014 | | 136 | | Massachusetts Financial Services Company, Vice President and Senior Managing Counsel |
William B. Wilson (k)
(age 41) | | Assistant Secretary and Assistant Clerk | | October 2022 | | 136 | | Massachusetts Financial Services Company, Assistant Vice President and Senior Counsel |
James O. Yost (k)
(age 63) | | Treasurer | | September 1990 | | 136 | | Massachusetts Financial Services Company, Senior Vice President |
| (h) | Date first appointed to serve as Trustee/Officer of an MFS Fund. Each Trustee has served continuously since appointment unless indicated otherwise. From January 2012 through December 2016, Messrs. DiLorenzo and Yost served as Treasurer and Deputy Treasurer of the Funds, respectively. |
| (j) | Directorships or trusteeships of companies required to report to the Securities and Exchange Commission (i.e., “public companies”). |
| (k) | “Interested person” of the Trust within the meaning of the Investment Company Act of 1940 (referred to as the 1940 Act), which is the principal federal law governing investment companies like the fund, as a result of a position with MFS. The address of MFS is 111 Huntington Avenue, Boston, Massachusetts 02199-7618. |
Trustees and Officers - continued
Each Trustee (other than Messrs. Jones, Kilman and Roberge) has been elected by shareholders and each Trustee and Officer holds office until his or her successor is chosen and qualified or until his or her earlier death, resignation, retirement or removal. Mr. Roberge became a Trustee of the Funds on January 1, 2021 and Messrs. Jones and Kilman became Trustees of the Funds on January 1, 2019. The Trust does not hold annual meetings for the purpose of electing Trustees, and Trustees are not elected for fixed terms. Under the terms of the Board's retirement policy, an Independent Trustee shall retire at the end of the calendar year in which he or she reaches the earlier of 75 years of age or 15 years of service on the Board (or, in the case of any Independent Trustee who joined the Board prior to 2015, 20 years of service on the Board).
Messrs. Buller, Kilman and Otis and Ms. Roepke are members of the Trust’s Audit Committee.
Each of the Interested Trustees and certain Officers hold comparable officer positions with certain affiliates of MFS.
The Statement of Additional Information for a Fund includes further information about the Trustees and is available without charge upon request by calling 1-800-225-2606.
| Investment Adviser | Custodian |
Massachusetts Financial Services Company
111 Huntington Avenue
Boston, MA 02199-7618 | State Street Bank and Trust Company
1 Congress Street, Suite 1
Boston, MA 02114-2016 |
| Distributor | Independent Registered Public Accounting Firm |
MFS Fund Distributors, Inc.
111 Huntington Avenue
Boston, MA 02199-7618 | Ernst & Young LLP
200 Clarendon Street
Boston, MA 02116 |
| Portfolio Manager(s) | |
Eric Braz
Peter Fruzzetti
Michael Grossman
Sandeep Mehta | |
Board Review of Investment Advisory Agreement
MFS Global New Discovery Fund
The Investment Company Act of 1940 requires that both the full Board of Trustees and a majority of the non-interested (“independent”) Trustees, voting separately, annually approve the continuation of the Fund’s investment advisory agreement with MFS. The Trustees consider matters bearing on the Fund and its advisory arrangements at their meetings throughout the year, including a review of performance data at each regular meeting. In addition, the independent Trustees met several times over the course of three months beginning in May and ending in July, 2023 (“contract review meetings”) for the specific purpose of considering whether to approve the continuation of the investment advisory agreement for the Fund and the other investment companies that the Board oversees (the “MFS Funds”). The independent Trustees were assisted in their evaluation of the Fund’s investment advisory agreement by independent legal counsel, from whom they received separate legal advice and with whom they met separately from MFS during various contract review meetings. The independent Trustees were also assisted in this process by an independent consultant who was retained by and reported to the independent Trustees.
In connection with their deliberations regarding the continuation of the investment advisory agreement, the Trustees, including the independent Trustees, considered such information and factors as they believed, in light of the legal advice furnished to them and their own business judgment, to be relevant. The investment advisory agreement for the Fund was considered separately, although the Trustees also took into account the common interests of all MFS Funds in their review. As described below, the Trustees considered the nature, quality, and extent of the various investment advisory, administrative, and shareholder services performed by MFS under the existing investment advisory agreement and other arrangements with the Fund.
In connection with their contract review meetings, the Trustees received and relied upon materials that included, among other items: (i) information provided by Broadridge Financial Solutions, Inc. (“Broadridge”), an independent third party, on the investment performance of the Fund for various time periods ended December 31, 2022 and the investment performance of a group of funds with substantially similar investment classifications/objectives (the “Broadridge performance universe”), (ii) information provided by Broadridge on the Fund’s advisory fees and other expenses and the advisory fees and other expenses of comparable funds identified by Broadridge as well as all other funds in the same investment classification/category (the “Broadridge expense group and universe”), (iii) information provided by MFS on the advisory fees of portfolios of other clients of MFS, including institutional separate accounts and other clients, (iv) information as to whether and to what extent applicable expense waivers, reimbursements or fee “breakpoints” are observed for the Fund, (v) information regarding MFS’ financial results and financial condition, including MFS’ and certain of its affiliates’ estimated profitability from services performed for the Fund and the MFS Funds as a whole, and compared to MFS’ institutional business, (vi) MFS’ views regarding the outlook for the mutual fund industry and the strategic business plans of MFS, (vii) descriptions of various functions performed by MFS for the Funds, such as compliance monitoring and portfolio trading practices, and (viii) information regarding the overall organization of MFS, including information about
Board Review of Investment Advisory Agreement - continued
MFS’ senior management and other personnel providing investment advisory, administrative and other services to the Fund and the other MFS Funds. The comparative performance, fee and expense information prepared and provided by Broadridge was not independently verified and the independent Trustees did not independently verify any information provided to them by MFS.
The Trustees’ conclusion as to the continuation of the investment advisory agreement was based on a comprehensive consideration of all information provided to the Trustees and not the result of any single factor. Some of the factors that figured particularly in the Trustees’ deliberations are described below, although individual Trustees may have evaluated the information presented differently from one another, giving different weights to various factors. It is also important to recognize that the fee arrangements for the Fund and other MFS Funds are the result of years of review and discussion between the independent Trustees and MFS, that certain aspects of such arrangements may receive greater scrutiny in some years than in others, and that the Trustees’ conclusions may be based, in part, on their consideration of these same arrangements during the course of the year and in prior years.
Based on information provided by Broadridge and MFS, the Trustees reviewed the Fund’s total return investment performance as well as the Broadridge performance universe over various time periods. The Trustees placed particular emphasis on the total return performance of the Fund’s Class I shares in comparison to the performance of funds in its Broadridge performance universe over the five-year period ended December 31, 2022, which the Trustees believed was a long enough period to reflect differing market conditions. The total return performance of the Fund’s Class I shares was in the 3rd quintile relative to the other funds in the universe for this five-year period (the 1st quintile being the best performers and the 5th quintile being the worst performers). The total return performance of the Fund’s Class I shares was in the 3rd quintile for the one-year period and the 4th quintile for the three-year period ended December 31, 2022 relative to the Broadridge performance universe. Because of the passage of time, these performance results may differ from the performance results for more recent periods, including those shown elsewhere in this report.
In the course of their deliberations, the Trustees took into account information provided by MFS in connection with the contract review meetings, as well as during investment review meetings conducted with portfolio management personnel during the course of the year regarding the Fund’s performance. After reviewing these and related factors, the Trustees concluded, within the context of their overall conclusions regarding the investment advisory agreement, that they were satisfied with MFS’ responses and efforts relating to investment performance.
In assessing the reasonableness of the Fund’s advisory fee, the Trustees considered, among other information, the Fund’s advisory fee and the total expense ratio of the Fund’s Class I shares as a percentage of average daily net assets and the advisory fee and total expense ratios of the Broadridge expense group based on information provided by Broadridge. The Trustees considered that MFS currently observes an expense limitation for the Fund, which may not be changed without the Trustees’ approval. The Trustees also considered that, according to the data provided by Broadridge (which takes into account any fee reductions or expense limitations that
Board Review of Investment Advisory Agreement - continued
were in effect during the Fund’s last fiscal year), the Fund’s effective advisory fee rate was lower than the Broadridge expense group median and the Fund’s total expense ratio was approximately at the Broadridge expense group median.
The Trustees also considered the advisory fees charged by MFS to any institutional separate accounts advised by MFS (“separate accounts”) and unaffiliated investment companies for which MFS serves as subadviser (“subadvised funds”) that have comparable investment strategies to the Fund, if any. In comparing these fees, the Trustees considered information provided by MFS as to the generally broader scope of services provided by MFS to the Fund, as well as the more extensive regulatory burdens imposed on MFS in managing the Fund, in comparison to separate accounts and subadvised funds. The Trustees also considered the higher demands placed on MFS’ investment personnel and trading infrastructure as a result of the daily cash in-flows and out-flows of the Fund in comparison to separate accounts.
The Trustees also considered whether the Fund may benefit from any economies of scale in the management of the Fund in the event of growth in assets of the Fund and/or growth in assets of the MFS Funds as a whole. They noted that the Fund’s advisory fee rate schedule is subject to contractual breakpoints that reduce the Fund’s advisory fee rate on average daily net assets over $1 billion and $2.5 billion. The Trustees also noted that MFS has agreed in writing to waive a portion of the management fees of certain MFS Funds, including the Fund, if the total combined assets of certain funds within the MFS Funds’ complex increase above agreed upon thresholds (the “group fee waiver”), enabling the Fund’s shareholders to share in the benefits from any economies of scale at the complex level. The group fee waiver is reviewed and renewed annually between the Board and MFS. The Trustees concluded that the breakpoints and the group fee waiver were sufficient to allow the Fund to benefit from economies of scale as its assets and overall complex assets grow.
The Trustees also considered information prepared by MFS relating to MFS’ costs and profits with respect to the Fund, the MFS Funds considered as a group, and other investment companies and accounts advised by MFS, as well as MFS’ methodologies used to determine and allocate its costs to the MFS Funds, the Fund and other accounts and products for purposes of estimating profitability.
After reviewing these and other factors described herein, the Trustees concluded, within the context of their overall conclusions regarding the investment advisory agreement, that the advisory fees charged to the Fund represent reasonable compensation in light of the services being provided by MFS to the Fund.
In addition, the Trustees considered MFS’ resources and related efforts to continue to retain, attract and motivate capable personnel to serve the Fund. The Trustees also considered current and developing conditions in the financial services industry, including the presence of large and well-capitalized companies which are spending, and appear to be prepared to continue to spend, substantial sums to engage personnel and to provide services to competing investment companies. In this regard, the Trustees also considered the financial resources of MFS and its ultimate parent, Sun Life Financial Inc. The Trustees also considered the advantages and possible disadvantages to the Fund of having an adviser that also serves other investment companies as well as other accounts.
Board Review of Investment Advisory Agreement - continued
The Trustees also considered the nature, quality, cost, and extent of administrative, transfer agency, and distribution services provided to the Fund by MFS and its affiliates under agreements and plans other than the investment advisory agreement, including any 12b-1 fees the Fund pays to MFS Fund Distributors, Inc., an affiliate of MFS. The Trustees also considered the nature, extent and quality of certain other services MFS performs or arranges for on the Fund’s behalf, which may include securities lending programs, directed expense payment programs, class action recovery programs, and MFS’ interaction with third-party service providers, principally custodians and sub-custodians. The Trustees concluded that the various non-advisory services provided by MFS and its affiliates on behalf of the Fund were satisfactory.
The Trustees considered so-called “fall-out benefits” to MFS such as reputational value derived from serving as investment manager to the MFS Funds. The Trustees also considered that MFS discontinued its historic practice of obtaining investment research from portfolio brokerage commissions paid by certain MFS Funds effective January 2018, and directly pays or voluntarily reimburses a Fund, if applicable, for the costs of external research acquired through the use of the Fund’s portfolio brokerage commissions.
Based on their evaluation of factors that they deemed to be material, including those factors described above, the Board of Trustees, including the independent Trustees, concluded that the Fund’s investment advisory agreement with MFS should be continued for an additional one-year period, commencing August 1, 2023.
Statement Regarding Liquidity Risk Management Program
The fund has adopted and implemented a liquidity risk management program (the “Program”) as required by Rule 22e-4 under the Investment Company Act of 1940, as amended. The fund’s Board of Trustees (the “Board”) has designated MFS as the administrator of the Program. The Program is reasonably designed to assess and manage the liquidity risk of the fund. Liquidity risk is the risk that the fund could not meet requests to redeem shares issued by the fund without significant dilution of remaining investors' interests.
MFS provided a written report to the Board for consideration at its March 2023 meeting that addressed the operation of the Program and provided an assessment of the adequacy and effectiveness of the Program during the period from January 1, 2022 to December 31, 2022 (the “Covered Period”). The report concluded that during the Covered Period the Program had operated effectively in all material respects and had adequately and effectively been implemented to assess and manage the fund’s liquidity risk. MFS also reported that there were no liquidity events that impacted the fund or its ability to timely meet redemptions without dilution to existing shareholders during the Covered Period.
There can be no assurance that the Program will achieve its objectives in the future. Further information on liquidity risk, and other principal risks to which an investment in the fund may be subject, can be found in the prospectus.
Proxy Voting Policies and Information
MFS votes proxies on behalf of the fund pursuant to proxy voting policies and procedures that are available without charge, upon request, by calling 1-800-225-2606, by visiting mfs.com/proxyvoting, or by visiting the SEC’s Web site at http://www.sec.gov.
Information regarding how the fund voted proxies relating to portfolio securities during the most recent twelve-month period ended June 30 is available by August 31 of each year without charge by visiting mfs.com/proxyvoting, or by visiting the SEC’s Web site at http://www.sec.gov.
Quarterly Portfolio Disclosure
The fund files a complete schedule of portfolio holdings with the SEC for the first and third quarters of each fiscal year as an exhibit to its reports on Form N-PORT. The fund's Form N-PORT reports are available on the SEC's Web site at http://www.sec.gov. A shareholder can obtain the portfolio holdings report for the first and third quarters of the fund's fiscal year at mfs.com/openendfunds by choosing the fund's name and then scrolling to the “Resources” section and clicking on the “Prospectus and Reports” tab.
Further Information
From time to time, MFS may post important information about the fund or the MFS Funds on the MFS Web site (mfs.com). This information is available at https://www.mfs.com/announcements or at mfs.com/openendfunds by choosing the fund’s name and then scrolling to the “Resources” section and clicking on the “Announcements” tab, if any.
Information About Fund Contracts and Legal Claims
The fund has entered into contractual arrangements with an investment adviser, administrator, distributor, shareholder servicing agent, and custodian who each provide services to the fund. Unless expressly stated otherwise, shareholders are not parties to, or intended beneficiaries of these contractual arrangements, and these contractual arrangements are not intended to create any shareholder right to enforce them against the service providers or to seek any remedy under them against the service providers, either directly or on behalf of the fund.
Under the Trust’s By-Laws and Declaration of Trust, any claims asserted against or on behalf of the MFS Funds, including claims against Trustees and Officers, must be brought in state and federal courts located within the Commonwealth of Massachusetts.
Federal Tax Information (unaudited)
The fund will notify shareholders of amounts for use in preparing 2023 income tax forms in January 2024.
| FACTS | WHAT DOES MFS DO WITH YOUR PERSONAL INFORMATION? |
| Why? | Financial companies choose how they share your personal information. Federal law gives consumers the right to limit some but not all sharing. Federal law also requires us to tell you how we collect, share, and protect your personal information. Please read this notice carefully to understand what we do. |
| What? | The types of personal information we collect and share depend on the product or service you have with us. This information can include: |
| • Social Security number and account balances |
| • Account transactions and transaction history |
| • Checking account information and wire transfer instructions |
| When you are no longer our customer, we continue to share your information as described in this notice. |
| How? | All financial companies need to share customers' personal information to run their everyday business. In the section below, we list the reasons financial companies can share their customers' personal information; the reasons MFS chooses to share; and whether you can limit this sharing. |
Reasons we can share your
personal information | Does MFS share? | Can you limit
this sharing? |
For our everyday business purposes –
such as to process your transactions, maintain your
account(s), respond to court orders and legal
investigations, or report to credit bureaus | Yes | No |
For our marketing purposes –
to offer our products and services to you | No | We don't share |
For joint marketing with other
financial companies | No | We don't share |
For our affiliates' everyday business purposes –
information about your transactions and experiences | No | We don't share |
For our affiliates' everyday business purposes –
information about your creditworthiness | No | We don't share |
| For nonaffiliates to market to you | No | We don't share |
| Questions? | Call 800-225-2606 or go to mfs.com. |
| Who we are |
| Who is providing this notice? | MFS Funds, MFS Investment Management, MFS Institutional Advisors, Inc., and MFS Heritage Trust Company. |
| What we do |
How does MFS
protect my personal
information? | To protect your personal information from unauthorized access and use, we use security measures that comply with federal law. These measures include procedural, electronic, and physical safeguards for the protection of the personal information we collect about you. |
How does MFS
collect my personal
information? | We collect your personal information, for example, when you |
| • open an account or provide account information |
| • direct us to buy securities or direct us to sell your securities |
| • make a wire transfer |
| We also collect your personal information from others, such as credit bureaus, affiliates, or other companies. |
| Why can't I limit all sharing? | Federal law gives you the right to limit only |
| • sharing for affiliates' everyday business purposes – information about your creditworthiness |
| • affiliates from using your information to market to you |
| • sharing for nonaffiliates to market to you |
| State laws and individual companies may give you additional rights to limit sharing. |
| Definitions |
| Affiliates | Companies related by common ownership or control. They can be financial and nonfinancial companies. |
| • MFS does not share personal information with affiliates, except for everyday business purposes as described on page one of this notice. |
| Nonaffiliates | Companies not related by common ownership or control. They can be financial and nonfinancial companies. |
| • MFS does not share with nonaffiliates so they can market to you. |
| Joint marketing | A formal agreement between nonaffiliated financial companies that together market financial products or services to you. |
| • MFS doesn't jointly market. |
| Other important information |
| If you own an MFS product or receive an MFS service in the name of a third party such as a bank or broker-dealer, their privacy policy may apply to you instead of ours. |
Save paper with eDelivery.
MFS® will send you prospectuses, reports, and proxies directly via e-mail so you will get information faster with less mailbox clutter.
To sign up:
1. Go to mfs.com.
2. Log in via MFS® Access.
3. Select eDelivery.
If you own your MFS fund shares through a financial institution or a retirement plan, MFS® TALK, MFS® Access, or eDelivery may not be available to you.
CONTACT
WEB SITE
mfs.com
MFS TALK
1-800-637-8255
24 hours a day
ACCOUNT SERVICE AND LITERATURE
Shareholders
1-800-225-2606
Financial advisors
1-800-343-2829
Retirement plan services
1-800-637-1255
MAILING ADDRESS
MFS Service Center, Inc.
P.O. Box 219341
Kansas City, MO 64121-9341
OVERNIGHT MAIL
MFS Service Center, Inc.
Suite 219341
430 W 7th Street
Kansas City, MO 64105-1407
Annual Report
August 31, 2023
| 1 |
| 2 |
| 5 |
| 8 |
| 10 |
| 15 |
| 17 |
| 18 |
| 19 |
| 25 |
| 37 |
| 39 |
| 43 |
| 47 |
| 48 |
| 48 |
| 48 |
| 48 |
| 48 |
| 49 |
The report is prepared for the general information of shareholders. It is authorized for distribution to prospective investors only when preceded or accompanied by a current prospectus.
NOT FDIC INSURED • MAY LOSE VALUE • NO BANK GUARANTEE
Portfolio structure
Top ten holdings
| Arthur J. Gallagher & Co. | 3.1% |
| Monolithic Power Systems, Inc. | 3.1% |
| Verisk Analytics, Inc., “A” | 2.9% |
| Cadence Design Systems, Inc. | 2.8% |
| AMETEK, Inc. | 2.8% |
| MSCI, Inc. | 2.5% |
| Vulcan Materials Co. | 2.4% |
| STERIS PLC | 2.4% |
| Copart, Inc. | 2.0% |
| Synopsys, Inc. | 2.0% |
GICS equity sectors (g)
| Information Technology | 23.3% |
| Industrials | 23.1% |
| Health Care | 16.2% |
| Consumer Discretionary | 12.5% |
| Financials | 8.6% |
| Communication Services | 3.8% |
| Materials | 2.8% |
| Energy | 2.6% |
| Real Estate | 2.4% |
| Consumer Staples | 1.6% |
| Equity Warrants (o) | 0.0% |
| (g) | The Global Industry Classification Standard (GICS®) was developed by and/or is the exclusive property of MSCI, Inc. and S&P Global Market Intelligence Inc. (“S&P Global Market Intelligence”). GICS is a service mark of MSCI and S&P Global Market Intelligence and has been licensed for use by MFS. MFS has applied its own internal sector/industry classification methodology for equity securities and non-equity securities that are unclassified by GICS. |
Cash & Cash Equivalents includes any cash, investments in money market funds, short-term securities, and other assets less liabilities. Please see the Statement of Assets and Liabilities for additional information related to the fund’s cash position and other assets and liabilities.
Percentages are based on net assets as of August 31, 2023.
The portfolio is actively managed and current holdings may be different.
Management Review
Summary of Results
For the twelve months ended August 31, 2023, Class A shares of the MFS Mid Cap Growth Fund (fund) provided a total return of 11.00%, at net asset value. This compares with a return of 13.00% for the fund’s benchmark, the Russell Midcap® Growth Index.
Market Environment
During the reporting period, central banks around the world had to combat the strongest inflationary pressures in four decades, fueled by the global fiscal response to the pandemic, disrupted supply chains and the dislocations to energy markets stemming from the war in Ukraine. Interest rates rose substantially, but the effects of a tighter monetary policy may not have been fully experienced yet, given that monetary policy works with long and variable lags. Strains resulting from the abrupt tightening of monetary policy began to affect some parts of the economy, most acutely among small and regional US banks, which suffered from deposit flight as depositors sought higher yields on their savings. Those shifts exposed an asset-liability mismatch that forced the closure of several institutions by regulators. Given the importance of small and mid-sized lenders to the provision of credit in the US, concerns were raised in the aftermath of the crisis that credit availability could become constrained, leading to slower economic growth, although those effects have been limited thus far. China’s abandonment of its Zero-COVID policy ushered in a brief uptick in economic activity in the world’s second-largest economy in early 2023, although its momentum soon stalled as focus turned to the country’s highly-indebted property development sector. In developed markets, consumer demand for services remained stronger than the demand for goods.
Policymakers found themselves in the difficult position of trying to restrain inflation without tipping economies into recession. Despite the challenging macroeconomic and geopolitical environment, central banks remained focused on controlling price pressures while also confronting increasing financial stability concerns. Central banks had to juggle achieving their inflation mandates while using macroprudential tools to keep banking systems liquid, a potentially difficult balancing act, and one that suggested that we may be nearing a peak in policy rates.
Against an environment of relatively tight labor markets, tighter global financial conditions and volatile materials prices, investor anxiety appeared to have increased over the potential that corporate profit margins may be past peak for this cycle. That said, signs that supply chains have generally normalized, coupled with low levels of unemployment across developed markets and hopes that inflation levels have peaked, were supportive factors for the macroeconomic backdrop.
Detractors from Performance
Relative to the Russell Midcap Growth® Index, stock selection within the real estate and consumer discretionary sectors detracted from performance. Within the real estate sector, the fund's overweight positions in real estate investment trusts Extra Space Storage and SBA Communications held back relative returns. Shares of Extra Space Storage fell due to declining occupancy rates and weaker-than-anticipated rental rates. The stock price of SBA Communications declined due to concerns over slower carrier
Management Review - continued
spending and the overall pressure of rising interest rates. There were no individual stocks within the consumer discretionary sector, either in the fund or in the benchmark, that were among the fund's top relative detractors over the reporting period.
The combination of weak stock selection and an underweight position in the information technology sector also held back relative returns. Within this sector, not owning shares of social networking service provider X (formerly Twitter), network security solutions company Fortinet, and data integration and software solutions provider Palantir Technologies hindered relative results. The stock price of Fortinet advanced despite weakening order trends, deal slippage and declines in contract duration. Shares of Palantir Technologies rose on a company announcement related to AI, despite no clear impact to revenue or earnings. Additionally, the fund’s holdings of data recording products provider NICE(b) (Israel) further weighed on relative performance as the stock price declined amid concerns over the potential negative impact of AI solutions.
Elsewhere, the fund's position in securities exchange services provider NASDAQ(b), not owning shares of freight transportation services provider Old Dominion Freight Line and alternative investment manager Apollo Global Management, and an overweight position in cloud-based software company Paylocity, further dampened relative returns. The share price of NASDAQ fell on the announced acquisition of risk management and regulatory software provider Adenza due to concerns over the valuation paid and confusion over potential synergies.
Contributors to Performance
Security selection within the materials sector was a positive factor for relative performance, however, there were no individual stocks within this sector, either in the fund or in the benchmark, that were among the fund's top relative contributors over the reporting period.
Stocks in other sectors that aided relative results included the fund’s positions in semiconductor equipment manufacturer ASM International(b) (Netherlands), electronic instrument and component supplier AMETEK(b), enterprise software solutions provider Constellation Software(b) and building products manufacturer AZEK(b). The share price of ASM International advanced on better-than-expected earnings growth and a focus beyond the cyclical downturn in memory demand toward the long-term outlook adoption of their GAA (gate all around) technology.
Not owning shares of banking and financial services company SVB Financial Group, medical services provider ResMed and technology services provider EPAM Systems also supported relative returns. The share price of SVB Financial Group plummeted after the bank failure and subsequent sale to First Citizens Bancshares. The stock price of ResMed weakened due to concerns that the adoption of the new GLP-1 class of drugs to fight obesity could obviate the need for sleep apnea equipment.
Additionally, the fund’s overweight positions in integrated circuits and electronic design automation (EDA) software provider Cadence Design Systems, global insurance broker Arthur J. Gallagher and aerospace components supplier Howmet Aerospace further helped relative performance. The share price of Cadence Design Systems advanced on strong earnings and backlog supported by the increased complexity of chip design and growth in AI-related demand.
Management Review - continued
Respectfully,
Portfolio Manager(s)
Eric Braz and Eric Fischman.
Note to Shareholders: Effective April 3, 2023, Paul Gordon is no longer a Portfolio Manager of the fund.
| (b) | Security is not a benchmark constituent. |
| (h) | Security was not held in the portfolio at period end. |
The views expressed in this report are those of the portfolio manager(s) only through the end of the period of the report as stated on the cover and do not necessarily reflect the views of MFS or any other person in the MFS organization. These views are subject to change at any time based on market or other conditions, and MFS disclaims any responsibility to update such views. These views may not be relied upon as investment advice or an indication of trading intent on behalf of any MFS portfolio. References to specific securities are not recommendations of such securities, and may not be representative of any MFS portfolio’s current or future investments.
Performance Summary THROUGH 8/31/23
The following chart illustrates a representative class of the fund’s historical performance in comparison to its benchmark(s). Performance results include the deduction of the maximum applicable sales charge and reflect the percentage change in net asset value, including reinvestment of dividends and capital gains distributions. The performance of other share classes will be greater than or less than that of the class depicted below. Benchmarks are unmanaged and may not be invested in directly. Benchmark returns do not reflect sales charges, commissions or expenses. (See Notes to Performance Summary.)
Performance data shown represents past performance and is no guarantee of future results. Investment return and principal value fluctuate so your shares, when sold, may be worth more or less than the original cost; current performance may be lower or higher than quoted. The performance shown does not reflect the deduction of taxes, if any, that a shareholder would pay on fund distributions or the redemption of fund shares.
Growth of a Hypothetical $10,000 Investment
Performance Summary - continued
Total Returns through 8/31/23
Average annual without sales charge
| Share Class | Class Inception Date | 1-yr | 5-yr | 10-yr |
| A | 12/01/93 | 11.00% | 7.58% | 11.46% |
| B | 12/01/93 | 10.14% | 6.78% | 10.64% |
| C | 8/01/94 | 10.15% | 6.78% | 10.63% |
| I | 1/02/97 | 11.25% | 7.85% | 11.74% |
| R1 | 4/01/05 | 10.14% | 6.78% | 10.63% |
| R2 | 10/31/03 | 10.70% | 7.31% | 11.18% |
| R3 | 4/01/05 | 10.98% | 7.59% | 11.46% |
| R4 | 4/01/05 | 11.24% | 7.85% | 11.74% |
| R6 | 1/02/13 | 11.42% | 7.97% | 11.85% |
Comparative benchmark(s)
| Russell Midcap® Growth Index (f) | 13.00% | 7.95% | 11.03% |
Average annual with sales charge
| | | | |
A
With Initial Sales Charge (5.75%) | 4.62% | 6.32% | 10.80% |
B
With CDSC (Declining over six years from 4% to 0%) (v) | 6.14% | 6.47% | 10.64% |
C
With CDSC (1% for 12 months) (v) | 9.15% | 6.78% | 10.63% |
CDSC – Contingent Deferred Sales Charge.
Class I, R1, R2, R3, R4, and R6 shares do not have a sales charge.
| (f) | Source: FactSet Research Systems Inc. |
| (v) | Assuming redemption at the end of the applicable period. |
Benchmark Definition(s)
Russell Midcap® Growth Index(h) - constructed to provide a comprehensive barometer for growth securities in the mid-cap segment of the U.S. equity universe. Companies in this index generally have higher price-to-book ratios and higher forecasted growth values.
It is not possible to invest directly in an index.
| (h) | Frank Russell Company (“Russell”) is the source and owner of the trademarks, service marks, and copyrights related to the Russell Indexes. Russell® is a trademark of Frank Russell Company. Neither Russell nor its licensors accept any liability for any errors or omissions in the Russell Indexes and/or Russell ratings or underlying data and no party may rely on any Russell Indexes and/or Russell ratings and/or underlying data contained in this document. No further distribution of Russell Data is permitted without Russell's express written consent. Russell does not promote, sponsor, or endorse the content of this document. |
Notes to Performance Summary
Average annual total return represents the average annual change in value for each share class for the periods presented.
Performance Summary - continued
Performance results reflect any applicable expense subsidies and waivers in effect during the periods shown. Without such subsidies and waivers the fund's performance results would be less favorable. Please see the prospectus and financial statements for complete details.
Performance results do not include adjustments made for financial reporting purposes in accordance with U.S. generally accepted accounting principles and may differ from amounts reported in the financial highlights.
From time to time the fund may receive proceeds from litigation settlements, without which performance would be lower.
Expense Table
Fund expenses borne by the shareholders during the period,
March 1, 2023 through August 31, 2023
As a shareholder of the fund, you incur two types of costs: (1) transaction costs, including sales charges (loads) on certain purchase or redemption payments, and (2) ongoing costs, including management fees; distribution and service (12b-1) fees; and other fund expenses. This example is intended to help you understand your ongoing costs (in dollars) of investing in the fund and to compare these costs with the ongoing costs of investing in other mutual funds.
The example is based on an investment of $1,000 invested at the beginning of the period and held for the entire period March 1, 2023 through August 31, 2023.
Actual Expenses
The first line for each share class in the following table provides information about actual account values and actual expenses. You may use the information in this line, together with the amount you invested, to estimate the expenses that you paid over the period. Simply divide your account value by $1,000 (for example, an $8,600 account value divided by $1,000 = 8.6), then multiply the result by the number in the first line under the heading entitled “Expenses Paid During Period” to estimate the expenses you paid on your account during this period.
Hypothetical Example for Comparison Purposes
The second line for each share class in the following table provides information about hypothetical account values and hypothetical expenses based on the fund’s actual expense ratio and an assumed rate of return of 5% per year before expenses, which is not the fund’s actual return. The hypothetical account values and expenses may not be used to estimate the actual ending account balance or expenses you paid for the period. You may use this information to compare the ongoing costs of investing in the fund and other funds. To do so, compare this 5% hypothetical example with the 5% hypothetical examples that appear in the shareholder reports of the other funds.
Please note that the expenses shown in the table are meant to highlight your ongoing costs only and do not reflect any transactional costs, such as sales charges (loads). Therefore, the second line for each share class in the table is useful in comparing ongoing costs only, and will not help you determine the relative total costs of owning different funds. In addition, if these transactional costs were included, your costs would have been higher.
Expense Table - continued
Share
Class | | Annualized
Expense
Ratio | Beginning
Account Value
3/01/23 | Ending
Account Value
8/31/23 | Expenses
Paid During
Period (p)
3/01/23-8/31/23 |
| A | Actual | 1.03% | $1,000.00 | $1,084.49 | $5.41 |
| Hypothetical (h) | 1.03% | $1,000.00 | $1,020.01 | $5.24 |
| B | Actual | 1.78% | $1,000.00 | $1,080.71 | $9.34 |
| Hypothetical (h) | 1.78% | $1,000.00 | $1,016.23 | $9.05 |
| C | Actual | 1.78% | $1,000.00 | $1,080.05 | $9.33 |
| Hypothetical (h) | 1.78% | $1,000.00 | $1,016.23 | $9.05 |
| I | Actual | 0.78% | $1,000.00 | $1,085.68 | $4.10 |
| Hypothetical (h) | 0.78% | $1,000.00 | $1,021.27 | $3.97 |
| R1 | Actual | 1.78% | $1,000.00 | $1,080.00 | $9.33 |
| Hypothetical (h) | 1.78% | $1,000.00 | $1,016.23 | $9.05 |
| R2 | Actual | 1.28% | $1,000.00 | $1,083.22 | $6.72 |
| Hypothetical (h) | 1.28% | $1,000.00 | $1,018.75 | $6.51 |
| R3 | Actual | 1.03% | $1,000.00 | $1,084.17 | $5.41 |
| Hypothetical (h) | 1.03% | $1,000.00 | $1,020.01 | $5.24 |
| R4 | Actual | 0.78% | $1,000.00 | $1,085.81 | $4.10 |
| Hypothetical (h) | 0.78% | $1,000.00 | $1,021.27 | $3.97 |
| R6 | Actual | 0.65% | $1,000.00 | $1,086.71 | $3.42 |
| Hypothetical (h) | 0.65% | $1,000.00 | $1,021.93 | $3.31 |
| (h) | 5% class return per year before expenses. |
| (p) | “Expenses Paid During Period” are equal to each class’s annualized expense ratio, as shown above, multiplied by the average account value over the period, multiplied by 184/365 (to reflect the one-half year period). Expenses paid do not include any applicable sales charges (loads). If these transaction costs had been included, your costs would have been higher. |
Portfolio of Investments
8/31/23
The Portfolio of Investments is a complete list of all securities owned by your fund. It is categorized by broad-based asset classes.
| Issuer | | | Shares/Par | Value ($) |
| Common Stocks – 96.9% |
| Aerospace & Defense – 3.0% | |
| Hexcel Corp. | | 474,304 | $34,766,483 |
| Howmet Aerospace, Inc. | | 5,097,749 | 252,185,643 |
| Teledyne Technologies, Inc. (a) | | 114,528 | 47,907,062 |
| TransDigm Group, Inc. (a) | | 59,930 | 54,167,731 |
| | | | | $389,026,919 |
| Automotive – 2.3% | |
| Copart, Inc. (a) | | 5,943,373 | $266,441,411 |
| LKQ Corp. | | 600,537 | 31,546,209 |
| | | | | $297,987,620 |
| Brokerage & Asset Managers – 0.8% | |
| LPL Financial Holdings, Inc. | | 109,156 | $25,170,282 |
| NASDAQ, Inc. | | 1,468,428 | 77,063,101 |
| | | | | $102,233,383 |
| Business Services – 12.5% | |
| CoStar Group, Inc. (a) | | 3,103,872 | $254,486,465 |
| Equifax, Inc. | | 567,754 | 117,354,752 |
| Factset Research Systems, Inc. | | 240,518 | 104,964,460 |
| FleetCor Technologies, Inc. (a) | | 194,088 | 52,739,532 |
| Morningstar, Inc. | | 560,449 | 130,399,669 |
| MSCI, Inc. | | 605,770 | 329,308,688 |
| TransUnion | | 808,036 | 65,628,684 |
| Tyler Technologies, Inc. (a) | | 482,828 | 192,373,160 |
| Verisk Analytics, Inc., “A” | | 1,572,564 | 380,906,452 |
| | | | | $1,628,161,862 |
| Computer Software – 9.9% | |
| ANSYS, Inc. (a) | | 408,750 | $130,338,112 |
| Autodesk, Inc. (a) | | 435,398 | 96,632,232 |
| Black Knight, Inc. (a) | | 989,987 | 75,001,415 |
| Bumble, Inc., “A” (a) | | 934,143 | 15,674,920 |
| Cadence Design Systems, Inc. (a) | | 1,547,288 | 372,029,927 |
| Datadog, Inc., “A” (a) | | 1,052,448 | 101,540,183 |
| Dun & Bradstreet Holdings, Inc. | | 3,268,938 | 35,631,424 |
| NICE Systems Ltd., ADR (a) | | 598,283 | 116,545,528 |
| Paylocity Holding Corp. (a) | | 494,505 | 99,148,253 |
| Synopsys, Inc. (a) | | 562,924 | 258,320,194 |
| | | | | $1,300,862,188 |
Portfolio of Investments – continued
| Issuer | | | Shares/Par | Value ($) |
| Common Stocks – continued |
| Computer Software - Systems – 4.2% | |
| Arista Networks, Inc. (a) | | 468,223 | $91,411,176 |
| Constellation Software, Inc. | | 115,391 | 237,021,244 |
| HubSpot, Inc. (a) | | 53,698 | 29,347,031 |
| ServiceNow, Inc. (a) | | 323,777 | 190,649,611 |
| | | | | $548,429,062 |
| Construction – 3.9% | |
| AZEK Co., Inc. (a) | | 3,239,009 | $110,158,696 |
| Martin Marietta Materials, Inc. | | 119,367 | 53,286,623 |
| Pool Corp. | | 87,007 | 31,809,759 |
| Vulcan Materials Co. | | 1,457,556 | 318,111,597 |
| | | | | $513,366,675 |
| Consumer Products – 1.6% | |
| Church & Dwight Co., Inc. | | 2,186,341 | $211,572,219 |
| Consumer Services – 1.7% | |
| Bright Horizons Family Solutions, Inc. (a) | | 2,380,785 | $224,793,720 |
| Electrical Equipment – 6.0% | |
| AMETEK, Inc. | | 2,276,190 | $363,075,067 |
| Hubbell, Inc. | | 300,804 | 98,077,144 |
| Littlefuse, Inc. | | 431,412 | 115,221,517 |
| nVent Electric PLC | | 1,373,794 | 77,674,313 |
| Rockwell Automation, Inc. | | 408,298 | 127,421,640 |
| | | | | $781,469,681 |
| Electronics – 5.9% | |
| ASM International N.V. | | 529,641 | $255,685,581 |
| Entegris, Inc. | | 1,134,711 | 114,912,183 |
| Monolithic Power Systems, Inc. | | 771,308 | 402,013,443 |
| | | | | $772,611,207 |
| Energy - Independent – 2.6% | |
| Chesapeake Energy Corp. | | 1,898,981 | $167,509,114 |
| Diamondback Energy, Inc. | | 812,449 | 123,313,509 |
| Hess Corp. | | 278,383 | 43,010,174 |
| | | | | $333,832,797 |
| Engineering - Construction – 0.8% | |
| Quanta Services, Inc. | | 470,172 | $98,674,998 |
| Entertainment – 1.1% | |
| Spotify Technology S.A. (a) | | 973,409 | $149,875,784 |
Portfolio of Investments – continued
| Issuer | | | Shares/Par | Value ($) |
| Common Stocks – continued |
| Gaming & Lodging – 3.1% | |
| DraftKings, Inc. (a) | | 1,915,668 | $56,799,556 |
| Hyatt Hotels Corp. | | 1,556,979 | 175,020,009 |
| Las Vegas Sands Corp. | | 1,235,074 | 67,756,160 |
| Red Rock Resorts, Inc. | | 2,536,030 | 111,407,798 |
| | | | | $410,983,523 |
| General Merchandise – 0.6% | |
| Five Below, Inc. (a) | | 449,472 | $77,291,205 |
| Insurance – 3.1% | |
| Arthur J. Gallagher & Co. | | 1,747,919 | $402,860,371 |
| Internet – 2.1% | |
| Gartner, Inc. (a) | | 643,480 | $225,012,087 |
| Match Group, Inc. (a) | | 1,160,183 | 54,377,777 |
| | | | | $279,389,864 |
| Leisure & Toys – 1.8% | |
| Electronic Arts, Inc. | | 275,798 | $33,090,244 |
| Take-Two Interactive Software, Inc. (a) | | 1,468,302 | 208,792,544 |
| | | | | $241,882,788 |
| Machinery & Tools – 3.4% | |
| IDEX Corp. | | 656,165 | $148,555,756 |
| Ingersoll Rand, Inc. | | 1,715,530 | 119,418,043 |
| Wabtec Corp. | | 1,556,891 | 175,181,376 |
| | | | | $443,155,175 |
| Medical & Health Technology & Services – 4.7% | |
| Henry Schein, Inc. (a) | | 1,352,121 | $103,491,341 |
| ICON PLC (a) | | 881,761 | 229,204,955 |
| IDEXX Laboratories, Inc. (a) | | 259,054 | 132,482,806 |
| Veeva Systems, Inc. (a) | | 740,229 | 154,485,792 |
| | | | | $619,664,894 |
| Medical Equipment – 8.5% | |
| Agilent Technologies, Inc. | | 1,539,202 | $186,351,186 |
| Bruker BioSciences Corp. | | 2,620,747 | 171,921,003 |
| Envista Holdings Corp. (a) | | 2,474,525 | 79,234,291 |
| Maravai Lifesciences Holdings, Inc., “A” (a) | | 878,226 | 9,080,857 |
| Masimo Corp. (a) | | 396,997 | 45,368,817 |
| Mettler-Toledo International, Inc. (a) | | 57,122 | 69,316,405 |
| STERIS PLC | | 1,371,441 | 314,869,139 |
| Waters Corp. (a) | | 407,193 | 114,339,794 |
Portfolio of Investments – continued
| Issuer | | | Shares/Par | Value ($) |
| Common Stocks – continued |
| Medical Equipment – continued | |
| West Pharmaceutical Services, Inc. | | 310,132 | $126,192,711 |
| | | | | $1,116,674,203 |
| Pharmaceuticals – 3.0% | |
| Alnylam Pharmaceuticals, Inc. (a) | | 509,422 | $100,773,860 |
| Argenx SE, ADR (a) | | 219,549 | 110,321,177 |
| Ascendis Pharma, ADR (a) | | 903,090 | 88,520,882 |
| Legend Biotech Corp., ADR (a) | | 1,252,894 | 86,900,728 |
| | | | | $386,516,647 |
| Pollution Control – 1.3% | |
| GFL Environmental, Inc. | | 3,464,389 | $112,246,203 |
| Waste Connections, Inc. | | 382,720 | 52,428,813 |
| | | | | $164,675,016 |
| Printing & Publishing – 2.1% | |
| Warner Music Group Corp. | | 1,052,512 | $35,048,649 |
| Wolters Kluwer N.V. | | 1,953,074 | 235,501,117 |
| | | | | $270,549,766 |
| Restaurants – 1.3% | |
| Chipotle Mexican Grill, Inc., “A” (a) | | 86,880 | $167,386,483 |
| Specialty Stores – 5.2% | |
| Burlington Stores, Inc. (a) | | 272,640 | $44,238,566 |
| Lululemon Athletica, Inc. (a) | | 412,415 | 157,237,343 |
| O'Reilly Automotive, Inc. (a) | | 246,127 | 231,285,542 |
| Tractor Supply Co. | | 542,249 | 118,481,406 |
| Ulta Beauty, Inc. (a) | | 325,429 | 135,062,798 |
| | | | | $686,305,655 |
| Telecommunications - Wireless – 0.4% | |
| SBA Communications Corp., REIT | | 233,747 | $52,483,214 |
| Total Common Stocks (Identified Cost, $8,650,688,207) | | $12,672,716,919 |
Portfolio of Investments – continued
| Issuer | Strike
Price | First
Exercise | Shares/Par | Value ($) |
| Rights – 0.0% |
| Computer Software - Systems – 0.0% |
| Constellation Software, Inc. (CAD 100 principal amount of Series 1 Debentures for 3.03 rights, Expiration 10/13/23) (a) (Identified Cost, $0) | CAD 133 | 8/31/23 | 115,391 | $64,049 |
| Warrants – 0.0% | | | | |
| Computer Software - Systems – 0.0% |
| Constellation Software, Inc. (CAD 100 principal amount of Series 2 Debentures for 1 warrant, Expiration 3/31/2040) (a) (Identified Cost, $0) | CAD 11.5 | N/A | 115,391 | $0 |
| | | | | |
| Investment Companies (h) – 3.2% |
| Money Market Funds – 3.2% | |
| MFS Institutional Money Market Portfolio, 5.3% (v) (Identified Cost, $419,893,870) | | | 419,894,193 | $419,936,182 |
|
|
| Other Assets, Less Liabilities – (0.1)% | | (18,412,358) |
| Net Assets – 100.0% | $13,074,304,792 |
| (a) | Non-income producing security. | | | |
| (h) | An affiliated issuer, which may be considered one in which the fund owns 5% or more of the outstanding voting securities, or a company which is under common control. At period end, the aggregate values of the fund's investments in affiliated issuers and in unaffiliated issuers were $419,936,182 and $12,672,780,968, respectively. | | | |
| (v) | Affiliated issuer that is available only to investment companies managed by MFS. The rate quoted for the MFS Institutional Money Market Portfolio is the annualized seven-day yield of the fund at period end. | | | |
| The following abbreviations are used in this report and are defined: |
| ADR | American Depositary Receipt |
| REIT | Real Estate Investment Trust |
| Abbreviations indicate amounts shown in currencies other than the U.S. dollar. All amounts are stated in U.S. dollars unless otherwise indicated. A list of abbreviations is shown below: |
| CAD | Canadian Dollar |
See Notes to Financial Statements
Financial Statements
Statement of Assets and Liabilities
At 8/31/23
This statement represents your fund’s balance sheet, which details the assets and liabilities comprising the total value of the fund.
| Assets | |
| Investments in unaffiliated issuers, at value (identified cost, $8,650,688,207) | $12,672,780,968 |
| Investments in affiliated issuers, at value (identified cost, $419,893,870) | 419,936,182 |
| Receivables for | |
| Fund shares sold | 8,799,449 |
| Dividends | 7,388,413 |
| Other assets | 8,694 |
| Total assets | $13,108,913,706 |
| Liabilities | |
| Payable to custodian | $3 |
| Payables for | |
| Investments purchased | 15,212,579 |
| Fund shares reacquired | 15,321,366 |
| Payable to affiliates | |
| Investment adviser | 448,973 |
| Administrative services fee | 3,390 |
| Shareholder servicing costs | 2,936,155 |
| Distribution and service fees | 34,817 |
| Payable for independent Trustees' compensation | 674 |
| Accrued expenses and other liabilities | 650,957 |
| Total liabilities | $34,608,914 |
| Net assets | $13,074,304,792 |
| Net assets consist of | |
| Paid-in capital | $9,359,332,635 |
| Total distributable earnings (loss) | 3,714,972,157 |
| Net assets | $13,074,304,792 |
| Shares of beneficial interest outstanding | 489,497,613 |
Statement of Assets and Liabilities – continued
| | Net assets | Shares
outstanding | Net asset value
per share (a) |
| Class A | $1,560,930,980 | 62,361,509 | $25.03 |
| Class B | 8,033,465 | 411,006 | 19.55 |
| Class C | 76,215,737 | 4,034,490 | 18.89 |
| Class I | 3,541,200,845 | 131,210,654 | 26.99 |
| Class R1 | 3,096,983 | 159,292 | 19.44 |
| Class R2 | 23,392,685 | 1,009,614 | 23.17 |
| Class R3 | 592,711,715 | 23,840,600 | 24.86 |
| Class R4 | 268,875,323 | 10,215,692 | 26.32 |
| Class R6 | 6,999,847,059 | 256,254,756 | 27.32 |
| (a) | Maximum offering price per share was equal to the net asset value per share for all share classes, except for Class A, for which the maximum offering price per share was $26.56 [100 / 94.25 x $25.03]. On sales of $50,000 or more, the maximum offering price of Class A shares is reduced. A contingent deferred sales charge may be imposed on redemptions of Class A, Class B, and Class C shares. Redemption price per share was equal to the net asset value per share for Classes I, R1, R2, R3, R4, and R6. |
See Notes to Financial Statements
Financial Statements
Statement of Operations
Year ended 8/31/23
This statement describes how much your fund earned in investment income and accrued in expenses. It also describes any gains and/or losses generated by fund operations.
| Net investment income (loss) | |
| Income | |
| Dividends | $89,091,626 |
| Dividends from affiliated issuers | 13,346,895 |
| Other | 267,956 |
| Income on securities loaned | 1,695 |
| Foreign taxes withheld | (1,118,079) |
| Total investment income | $101,590,093 |
| Expenses | |
| Management fee | $82,111,221 |
| Distribution and service fees | 6,127,552 |
| Shareholder servicing costs | 8,747,225 |
| Administrative services fee | 630,831 |
| Independent Trustees' compensation | 127,090 |
| Custodian fee | 389,544 |
| Shareholder communications | 801,963 |
| Audit and tax fees | 66,699 |
| Legal fees | 69,766 |
| Miscellaneous | 517,933 |
| Total expenses | $99,589,824 |
| Fees paid indirectly | (4,304) |
| Reduction of expenses by investment adviser and distributor | (1,663,241) |
| Net expenses | $97,922,279 |
| Net investment income (loss) | $3,667,814 |
| Realized and unrealized gain (loss) |
| Realized gain (loss) (identified cost basis) | |
| Unaffiliated issuers | $(225,167,497) |
| Affiliated issuers | (14,265) |
| Foreign currency | 36,737 |
| Net realized gain (loss) | $(225,145,025) |
| Change in unrealized appreciation or depreciation | |
| Unaffiliated issuers | $1,583,084,127 |
| Affiliated issuers | 44,524 |
| Translation of assets and liabilities in foreign currencies | 12,296 |
| Net unrealized gain (loss) | $1,583,140,947 |
| Net realized and unrealized gain (loss) | $1,357,995,922 |
| Change in net assets from operations | $1,361,663,736 |
See Notes to Financial Statements
Financial Statements
Statements of Changes in Net Assets
These statements describe the increases and/or decreases in net assets resulting from operations, any distributions, and any shareholder transactions.
| | Year ended |
| | 8/31/23 | 8/31/22 |
| Change in net assets | | |
| From operations | | |
| Net investment income (loss) | $3,667,814 | $(41,117,061) |
| Net realized gain (loss) | (225,145,025) | 57,533,222 |
| Net unrealized gain (loss) | 1,583,140,947 | (4,448,543,700) |
| Change in net assets from operations | $1,361,663,736 | $(4,432,127,539) |
| Total distributions to shareholders | $— | $(537,250,947) |
| Change in net assets from fund share transactions | $(1,488,530,966) | $2,159,735,658 |
| Total change in net assets | $(126,867,230) | $(2,809,642,828) |
| Net assets | | |
| At beginning of period | 13,201,172,022 | 16,010,814,850 |
| At end of period | $13,074,304,792 | $13,201,172,022 |
See Notes to Financial Statements
Financial Statements
Financial Highlights
The financial highlights table is intended to help you understand the fund's financial performance for the past 5 years. Certain information reflects financial results for a single fund share. The total returns in the table represent the rate that an investor would have earned (or lost) on an investment in the fund share class (assuming reinvestment of all distributions) held for the entire period.
| Class A | Year ended |
| | 8/31/23 | 8/31/22 | 8/31/21 | 8/31/20 | 8/31/19 |
| Net asset value, beginning of period | $22.55 | $31.84 | $24.65 | $20.19 | $19.16 |
| Income (loss) from investment operations |
| Net investment income (loss) (d) | $(0.06) | $(0.15) | $(0.18) | $(0.07) | $(0.07) |
| Net realized and unrealized gain (loss) | 2.54 | (8.02) | 7.60 | 4.71 | 1.83 |
| Total from investment operations | $2.48 | $(8.17) | $7.42 | $4.64 | $1.76 |
| Less distributions declared to shareholders |
| From net realized gain | $— | $(1.12) | $(0.23) | $(0.18) | $(0.73) |
| Net asset value, end of period (x) | $25.03 | $22.55 | $31.84 | $24.65 | $20.19 |
| Total return (%) (r)(s)(t)(x) | 11.00 | (26.53) | 30.30 | 23.16 | 10.13 |
Ratios (%) (to average net assets)
and Supplemental data: |
| Expenses before expense reductions (f) | 1.04 | 1.03 | 1.01 | 1.05 | 1.10 |
| Expenses after expense reductions (f) | 1.03 | 1.01 | 1.00 | 1.04 | 1.09 |
| Net investment income (loss) | (0.24) | (0.54) | (0.65) | (0.35) | (0.36) |
| Portfolio turnover | 30 | 21 | 23 | 34 | 21 |
| Net assets at end of period (000 omitted) | $1,560,931 | $1,477,097 | $2,130,372 | $1,483,320 | $1,065,566 |
See Notes to Financial Statements
Financial Highlights – continued
| Class B | Year ended |
| | 8/31/23 | 8/31/22 | 8/31/21 | 8/31/20 | 8/31/19 |
| Net asset value, beginning of period | $17.75 | $25.48 | $19.91 | $16.47 | $15.90 |
| Income (loss) from investment operations |
| Net investment income (loss) (d) | $(0.18) | $(0.28) | $(0.31) | $(0.19) | $(0.17) |
| Net realized and unrealized gain (loss) | 1.98(g) | (6.33)(g) | 6.11 | 3.81 | 1.47 |
| Total from investment operations | $1.80 | $(6.61) | $5.80 | $3.62 | $1.30 |
| Less distributions declared to shareholders |
| From net realized gain | $— | $(1.12) | $(0.23) | $(0.18) | $(0.73) |
| Net asset value, end of period (x) | $19.55 | $17.75 | $25.48 | $19.91 | $16.47 |
| Total return (%) (r)(s)(t)(x) | 10.14 | (27.05) | 29.36 | 22.20 | 9.28 |
Ratios (%) (to average net assets)
and Supplemental data: |
| Expenses before expense reductions (f) | 1.79 | 1.78 | 1.76 | 1.80 | 1.85 |
| Expenses after expense reductions (f) | 1.78 | 1.76 | 1.75 | 1.79 | 1.84 |
| Net investment income (loss) | (0.99) | (1.30) | (1.39) | (1.10) | (1.12) |
| Portfolio turnover | 30 | 21 | 23 | 34 | 21 |
| Net assets at end of period (000 omitted) | $8,033 | $10,002 | $18,021 | $17,725 | $18,581 |
| Class C | Year ended |
| | 8/31/23 | 8/31/22 | 8/31/21 | 8/31/20 | 8/31/19 |
| Net asset value, beginning of period | $17.15 | $24.66 | $19.28 | $15.95 | $15.42 |
| Income (loss) from investment operations |
| Net investment income (loss) (d) | $(0.17) | $(0.27) | $(0.30) | $(0.18) | $(0.16) |
| Net realized and unrealized gain (loss) | 1.91(g) | (6.12)(g) | 5.91(g) | 3.69 | 1.42 |
| Total from investment operations | $1.74 | $(6.39) | $5.61 | $3.51 | $1.26 |
| Less distributions declared to shareholders |
| From net realized gain | $— | $(1.12) | $(0.23) | $(0.18) | $(0.73) |
| Net asset value, end of period (x) | $18.89 | $17.15 | $24.66 | $19.28 | $15.95 |
| Total return (%) (r)(s)(t)(x) | 10.15 | (27.06) | 29.34 | 22.23 | 9.31 |
Ratios (%) (to average net assets)
and Supplemental data: |
| Expenses before expense reductions (f) | 1.79 | 1.78 | 1.76 | 1.80 | 1.85 |
| Expenses after expense reductions (f) | 1.78 | 1.76 | 1.75 | 1.79 | 1.84 |
| Net investment income (loss) | (0.99) | (1.30) | (1.40) | (1.10) | (1.11) |
| Portfolio turnover | 30 | 21 | 23 | 34 | 21 |
| Net assets at end of period (000 omitted) | $76,216 | $85,842 | $137,007 | $109,521 | $78,858 |
See Notes to Financial Statements
Financial Highlights – continued
| Class I | Year ended |
| | 8/31/23 | 8/31/22 | 8/31/21 | 8/31/20 | 8/31/19 |
| Net asset value, beginning of period | $24.26 | $34.07 | $26.30 | $21.48 | $20.28 |
| Income (loss) from investment operations |
| Net investment income (loss) (d) | $0.00(w) | $(0.08) | $(0.12) | $(0.02) | $(0.02) |
| Net realized and unrealized gain (loss) | 2.73 | (8.61) | 8.12 | 5.02 | 1.95 |
| Total from investment operations | $2.73 | $(8.69) | $8.00 | $5.00 | $1.93 |
| Less distributions declared to shareholders |
| From net realized gain | $— | $(1.12) | $(0.23) | $(0.18) | $(0.73) |
| Net asset value, end of period (x) | $26.99 | $24.26 | $34.07 | $26.30 | $21.48 |
| Total return (%) (r)(s)(t)(x) | 11.25 | (26.32) | 30.60 | 23.45 | 10.42 |
Ratios (%) (to average net assets)
and Supplemental data: |
| Expenses before expense reductions (f) | 0.79 | 0.78 | 0.76 | 0.80 | 0.84 |
| Expenses after expense reductions (f) | 0.78 | 0.77 | 0.75 | 0.79 | 0.83 |
| Net investment income (loss) | 0.01 | (0.28) | (0.40) | (0.10) | (0.09) |
| Portfolio turnover | 30 | 21 | 23 | 34 | 21 |
| Net assets at end of period (000 omitted) | $3,541,201 | $4,344,475 | $4,444,325 | $3,837,781 | $1,330,368 |
See Notes to Financial Statements
Financial Highlights – continued
| Class R1 | Year ended |
| | 8/31/23 | 8/31/22 | 8/31/21 | 8/31/20 | 8/31/19 |
| Net asset value, beginning of period | $17.65 | $25.35 | $19.81 | $16.39 | $15.82 |
| Income (loss) from investment operations |
| Net investment income (loss) (d) | $(0.18) | $(0.28) | $(0.31) | $(0.18) | $(0.17) |
| Net realized and unrealized gain (loss) | 1.97(g) | (6.30)(g) | 6.08 | 3.78 | 1.47 |
| Total from investment operations | $1.79 | $(6.58) | $5.77 | $3.60 | $1.30 |
| Less distributions declared to shareholders |
| From net realized gain | $— | $(1.12) | $(0.23) | $(0.18) | $(0.73) |
| Net asset value, end of period (x) | $19.44 | $17.65 | $25.35 | $19.81 | $16.39 |
| Total return (%) (r)(s)(t)(x) | 10.14 | (27.07) | 29.36 | 22.18 | 9.33 |
Ratios (%) (to average net assets)
and Supplemental data: |
| Expenses before expense reductions (f) | 1.79 | 1.78 | 1.76 | 1.80 | 1.85 |
| Expenses after expense reductions (f) | 1.78 | 1.76 | 1.75 | 1.79 | 1.84 |
| Net investment income (loss) | (0.99) | (1.30) | (1.39) | (1.09) | (1.12) |
| Portfolio turnover | 30 | 21 | 23 | 34 | 21 |
| Net assets at end of period (000 omitted) | $3,097 | $3,040 | $5,281 | $4,187 | $3,472 |
| Class R2 | Year ended |
| | 8/31/23 | 8/31/22 | 8/31/21 | 8/31/20 | 8/31/19 |
| Net asset value, beginning of period | $20.93 | $29.70 | $23.06 | $18.95 | $18.08 |
| Income (loss) from investment operations |
| Net investment income (loss) (d) | $(0.10) | $(0.20) | $(0.24) | $(0.12) | $(0.11) |
| Net realized and unrealized gain (loss) | 2.34 | (7.45) | 7.11 | 4.41 | 1.71 |
| Total from investment operations | $2.24 | $(7.65) | $6.87 | $4.29 | $1.60 |
| Less distributions declared to shareholders |
| From net realized gain | $— | $(1.12) | $(0.23) | $(0.18) | $(0.73) |
| Net asset value, end of period (x) | $23.17 | $20.93 | $29.70 | $23.06 | $18.95 |
| Total return (%) (r)(s)(t)(x) | 10.70 | (26.70) | 30.00 | 22.83 | 9.84 |
Ratios (%) (to average net assets)
and Supplemental data: |
| Expenses before expense reductions (f) | 1.29 | 1.28 | 1.26 | 1.30 | 1.35 |
| Expenses after expense reductions (f) | 1.28 | 1.27 | 1.25 | 1.29 | 1.34 |
| Net investment income (loss) | (0.49) | (0.79) | (0.90) | (0.60) | (0.61) |
| Portfolio turnover | 30 | 21 | 23 | 34 | 21 |
| Net assets at end of period (000 omitted) | $23,393 | $21,633 | $29,120 | $15,176 | $11,060 |
See Notes to Financial Statements
Financial Highlights – continued
| Class R3 | Year ended |
| | 8/31/23 | 8/31/22 | 8/31/21 | 8/31/20 | 8/31/19 |
| Net asset value, beginning of period | $22.40 | $31.63 | $24.49 | $20.06 | $19.04 |
| Income (loss) from investment operations |
| Net investment income (loss) (d) | $(0.05) | $(0.14) | $(0.18) | $(0.07) | $(0.06) |
| Net realized and unrealized gain (loss) | 2.51 | (7.97) | 7.55 | 4.68 | 1.81 |
| Total from investment operations | $2.46 | $(8.11) | $7.37 | $4.61 | $1.75 |
| Less distributions declared to shareholders |
| From net realized gain | $— | $(1.12) | $(0.23) | $(0.18) | $(0.73) |
| Net asset value, end of period (x) | $24.86 | $22.40 | $31.63 | $24.49 | $20.06 |
| Total return (%) (r)(s)(t)(x) | 10.98 | (26.52) | 30.29 | 23.16 | 10.14 |
Ratios (%) (to average net assets)
and Supplemental data: |
| Expenses before expense reductions (f) | 1.04 | 1.03 | 1.01 | 1.05 | 1.09 |
| Expenses after expense reductions (f) | 1.03 | 1.01 | 1.00 | 1.04 | 1.09 |
| Net investment income (loss) | (0.24) | (0.54) | (0.65) | (0.35) | (0.34) |
| Portfolio turnover | 30 | 21 | 23 | 34 | 21 |
| Net assets at end of period (000 omitted) | $592,712 | $557,897 | $777,474 | $451,972 | $239,505 |
| Class R4 | Year ended |
| | 8/31/23 | 8/31/22 | 8/31/21 | 8/31/20 | 8/31/19 |
| Net asset value, beginning of period | $23.66 | $33.25 | $25.67 | $20.97 | $19.82 |
| Income (loss) from investment operations |
| Net investment income (loss) (d) | $0.00(w) | $(0.08) | $(0.12) | $(0.02) | $(0.02) |
| Net realized and unrealized gain (loss) | 2.66 | (8.39) | 7.93 | 4.90 | 1.90 |
| Total from investment operations | $2.66 | $(8.47) | $7.81 | $4.88 | $1.88 |
| Less distributions declared to shareholders |
| From net realized gain | $— | $(1.12) | $(0.23) | $(0.18) | $(0.73) |
| Net asset value, end of period (x) | $26.32 | $23.66 | $33.25 | $25.67 | $20.97 |
| Total return (%) (r)(s)(t)(x) | 11.24 | (26.30) | 30.61 | 23.45 | 10.40 |
Ratios (%) (to average net assets)
and Supplemental data: |
| Expenses before expense reductions (f) | 0.79 | 0.78 | 0.76 | 0.80 | 0.84 |
| Expenses after expense reductions (f) | 0.78 | 0.76 | 0.75 | 0.79 | 0.83 |
| Net investment income (loss) | 0.01 | (0.29) | (0.40) | (0.10) | (0.08) |
| Portfolio turnover | 30 | 21 | 23 | 34 | 21 |
| Net assets at end of period (000 omitted) | $268,875 | $300,198 | $389,323 | $242,937 | $173,441 |
See Notes to Financial Statements
Financial Highlights – continued
| Class R6 | Year ended |
| | 8/31/23 | 8/31/22 | 8/31/21 | 8/31/20 | 8/31/19 |
| Net asset value, beginning of period | $24.52 | $34.39 | $26.51 | $21.63 | $20.40 |
| Income (loss) from investment operations |
| Net investment income (loss) (d) | $0.04 | $(0.05) | $(0.09) | $(0.00)(w) | $(0.00)(w) |
| Net realized and unrealized gain (loss) | 2.76 | (8.70) | 8.20 | 5.06 | 1.96 |
| Total from investment operations | $2.80 | $(8.75) | $8.11 | $5.06 | $1.96 |
| Less distributions declared to shareholders |
| From net realized gain | $— | $(1.12) | $(0.23) | $(0.18) | $(0.73) |
| Net asset value, end of period (x) | $27.32 | $24.52 | $34.39 | $26.51 | $21.63 |
| Total return (%) (r)(s)(t)(x) | 11.42 | (26.24) | 30.78 | 23.57 | 10.51 |
Ratios (%) (to average net assets)
and Supplemental data: |
| Expenses before expense reductions (f) | 0.67 | 0.66 | 0.66 | 0.70 | 0.75 |
| Expenses after expense reductions (f) | 0.65 | 0.65 | 0.65 | 0.69 | 0.74 |
| Net investment income (loss) | 0.14 | (0.18) | (0.30) | (0.01) | (0.01) |
| Portfolio turnover | 30 | 21 | 23 | 34 | 21 |
| Net assets at end of period (000 omitted) | $6,999,847 | $6,400,990 | $8,056,150 | $5,343,295 | $3,053,325 |
| (d) | Per share data is based on average shares outstanding. |
| (f) | Ratios do not reflect reductions from fees paid indirectly, if applicable. See Note 2 in the Notes to Financial Statements for additional information. |
| (g) | The per share amount varies from the net realized and unrealized gain/loss for the period because of the timing of sales of fund shares and the per share amount of realized and unrealized gains and losses at such time. |
| (r) | Certain expenses have been reduced without which performance would have been lower. |
| (s) | From time to time the fund may receive proceeds from litigation settlements, without which performance would be lower. |
| (t) | Total returns do not include any applicable sales charges. |
| (w) | Per share amount was less than $0.01. |
| (x) | The net asset values and total returns have been calculated on net assets which include adjustments made in accordance with U.S. generally accepted accounting principles required at period end for financial reporting purposes. |
See Notes to Financial Statements
Notes to Financial Statements
(1) Business and Organization
MFS Mid Cap Growth Fund (the fund) is a diversified series of MFS Series Trust IV (the trust). The trust is organized as a Massachusetts business trust and is registered under the Investment Company Act of 1940, as amended, as an open-end management investment company.
The fund is an investment company and accordingly follows the investment company accounting and reporting guidance of the Financial Accounting Standards Board (FASB) Accounting Standards Codification Topic 946 Financial Services - Investment Companies.
(2) Significant Accounting Policies
General — The preparation of financial statements in conformity with U.S. generally accepted accounting principles requires management to make estimates and assumptions that affect the reported amounts of assets and liabilities, and disclosure of contingent assets and liabilities at the date of the financial statements and the reported amounts of increases and decreases in net assets from operations during the reporting period. Actual results could differ from those estimates. In the preparation of these financial statements, management has evaluated subsequent events occurring after the date of the fund’s Statement of Assets and Liabilities through the date that the financial statements were issued.
Balance Sheet Offsetting — The fund's accounting policy with respect to balance sheet offsetting is that, absent an event of default by the counterparty or a termination of the agreement, the International Swaps and Derivatives Association (ISDA) Master Agreement, or similar agreement, does not result in an offset of reported amounts of financial assets and financial liabilities in the Statement of Assets and Liabilities across transactions between the fund and the applicable counterparty. The fund's right to setoff may be restricted or prohibited by the bankruptcy or insolvency laws of the particular jurisdiction to which a specific master netting agreement counterparty is subject. Balance sheet offsetting disclosures, to the extent applicable to the fund, have been included in the fund’s Significant Accounting Policies note under the captions for each of the fund’s in-scope financial instruments and transactions.
Investment Valuations — Subject to its oversight, the fund's Board of Trustees has delegated primary responsibility for determining or causing to be determined the value of the fund’s investments to MFS as the fund's adviser, pursuant to the fund’s valuation policy and procedures which have been adopted by the adviser and approved by the Board. In accordance with Rule 2a-5 under the Investment Company Act of 1940, the Board of Trustees designated the adviser as the “valuation designee” of the fund. If the adviser, as valuation designee, determines that reliable market quotations are not readily available for an investment, the investment is valued at fair value as determined in good faith by the adviser in accordance with the adviser’s fair valuation policy and procedures.
Under the fund's valuation policy and procedures, equity securities, including restricted equity securities, are generally valued at the last sale or official closing price on their primary market or exchange as provided by a third-party pricing service. Equity securities, for which there were no sales reported that day, are generally valued at the last quoted daily bid quotation on their primary market or exchange as provided by a third-party pricing service. Short-term instruments with a maturity at issuance of 60
Notes to Financial Statements - continued
days or less may be valued at amortized cost, which approximates market value.
Open-end investment companies are generally valued at net asset value per share. The values of foreign securities and other assets and liabilities expressed in foreign currencies are converted to U.S. dollars using the mean of bid and asked prices for rates provided by a third-party pricing service.
Under the fund’s valuation policy and procedures, market quotations are not considered to be readily available for debt instruments, floating rate loans, and many types of derivatives. These investments are generally valued at fair value based on information from third-party pricing services or otherwise determined by the adviser in accordance with the adviser’s fair valuation policy and procedures. Securities and other assets generally valued on the basis of information from a third-party pricing service may also be valued at a broker/dealer bid quotation. In determining values, third-party pricing services can utilize both transaction data and market information such as yield, quality, coupon rate, maturity, type of issue, trading characteristics, spreads and other market data. An investment may also be valued at fair value if the adviser determines that the investment’s value has been materially affected by events occurring after the close of the exchange or market on which the investment is principally traded (such as foreign exchange or market) and prior to the determination of the fund’s net asset value, or after the halt of trading of a specific security where trading does not resume prior to the close of the exchange or market on which the security is principally traded. Events that occur after foreign markets close (such as developments in foreign markets and significant movements in the U.S. markets) and prior to the determination of the fund’s net asset value may be deemed to have a material effect on the value of securities traded in foreign markets. Accordingly, the fund’s foreign equity securities may often be valued at fair value. The adviser generally relies on third-party pricing services or other information (such as the correlation with price movements of similar securities in the same or other markets; the type, cost and investment characteristics of the security; the business and financial condition of the issuer; and trading and other market data) to assist in determining whether to fair value and at what value to fair value an investment. The value of an investment for purposes of calculating the fund’s net asset value can differ depending on the source and method used to determine value. When fair valuation is used, the value of an investment used to determine the fund’s net asset value may differ from quoted or published prices for the same investment. There can be no assurance that the fund could obtain the fair value assigned to an investment if it were to sell the investment at the same time at which the fund determines its net asset value per share.
Various inputs are used in determining the value of the fund's assets or liabilities. These inputs are categorized into three broad levels. In certain cases, the inputs used to measure fair value may fall into different levels of the fair value hierarchy. In such cases, an investment's level within the fair value hierarchy is based on the lowest level of input that is significant to the fair value measurement. The fund's assessment of the significance of a particular input to the fair value measurement in its entirety requires judgment, and considers factors specific to the investment. Level 1 includes unadjusted quoted prices in active markets for identical assets or liabilities. Level 2 includes other significant observable market-based inputs (including quoted prices for similar securities, interest rates, prepayment speed, and credit risk). Level 3 includes significant unobservable inputs, which may include the adviser's own assumptions in determining the fair value of investments. The following is a summary of the levels used as of August 31, 2023 in valuing the fund's assets and liabilities:
Notes to Financial Statements - continued
| Financial Instruments | Level 1 | Level 2 | Level 3 | Total |
| Equity Securities: | | | | |
| United States | $11,377,545,646 | $— | $— | $11,377,545,646 |
| Netherlands | 491,186,698 | — | — | 491,186,698 |
| Canada | 401,760,309 | 0 | — | 401,760,309 |
| Israel | 116,545,528 | — | — | 116,545,528 |
| Belgium | 110,321,177 | — | — | 110,321,177 |
| Denmark | 88,520,882 | — | — | 88,520,882 |
| China | 86,900,728 | — | — | 86,900,728 |
| Mutual Funds | 419,936,182 | — | — | 419,936,182 |
| Total | $13,092,717,150 | $0 | $— | $13,092,717,150 |
For further information regarding security characteristics, see the Portfolio of Investments.
Foreign Currency Translation — Purchases and sales of foreign investments, income, and expenses are converted into U.S. dollars based upon currency exchange rates prevailing on the respective dates of such transactions or on the reporting date for foreign denominated receivables and payables. Gains and losses attributable to foreign currency exchange rates on sales of securities are recorded for financial statement purposes as net realized gains and losses on investments. Gains and losses attributable to foreign exchange rate movements on receivables, payables, income and expenses are recorded for financial statement purposes as foreign currency transaction gains and losses. That portion of both realized and unrealized gains and losses on investments that results from fluctuations in foreign currency exchange rates is not separately disclosed.
Security Loans — Under its Securities Lending Agency Agreement with the fund, JPMorgan Chase and Co., as lending agent, loans the securities of the fund to certain qualified institutions (the “Borrowers”) approved by the fund. Security loans can be terminated at the discretion of either the lending agent or the fund and the related securities must be returned within the earlier of the standard trade settlement period for such securities or within three business days. The loans are collateralized by cash and/or U.S. Treasury and federal agency obligations in an amount typically at least equal to the market value of the securities loaned. On loans collateralized by cash, the cash collateral is invested in a money market fund. The market value of the loaned securities is determined at the close of business of the fund and any additional required collateral is delivered to the fund on the next business day. The lending agent provides the fund with indemnification against Borrower default. In the event of Borrower default, the lending agent will, for the benefit of the fund, either purchase securities identical to those loaned or, when such purchase is commercially impracticable, pay the fund the market value of the loaned securities. In return, the lending agent assumes the fund's rights to the related collateral. If the collateral value is less than the cost to purchase identical securities, the lending agent is responsible for the shortfall, but only to the extent that such shortfall is not due to a decline in collateral value resulting from collateral reinvestment for which the fund bears the risk of loss. A portion of the income generated upon investment of the collateral is remitted to the Borrowers, and the remainder is allocated between the fund and the lending agent. On loans collateralized by U.S. Treasury and/or federal agency obligations, a fee is received from the Borrower, and is allocated between the fund and the lending agent. Income from
Notes to Financial Statements - continued
securities lending is separately reported in the Statement of Operations. The dividend and interest income earned on the securities loaned is accounted for in the same manner as other dividend and interest income. At August 31, 2023, there were no securities on loan or collateral outstanding.
Indemnifications — Under the fund's organizational documents, its officers and Trustees may be indemnified against certain liabilities and expenses arising out of the performance of their duties to the fund. Additionally, in the normal course of business, the fund enters into agreements with service providers that may contain indemnification clauses. The fund's maximum exposure under these agreements is unknown as this would involve future claims that may be made against the fund that have not yet occurred.
Investment Transactions and Income — Dividends received in cash are recorded on the ex-dividend date. Certain dividends from foreign securities will be recorded when the fund is informed of the dividend if such information is obtained subsequent to the ex-dividend date. Dividend payments received in additional securities are recorded on the ex-dividend date in an amount equal to the value of the security on such date.
The fund may receive proceeds from litigation settlements. Any proceeds received from litigation involving portfolio holdings are reflected in the Statement of Operations in realized gain/loss if the security has been disposed of by the fund or in unrealized gain/loss if the security is still held by the fund. Any other proceeds from litigation not related to portfolio holdings are reflected as other income in the Statement of Operations.
Investment transactions are recorded on the trade date. In determining the net gain or loss on securities sold, the cost of securities is determined on the identified cost basis.
Fees Paid Indirectly — The fund's custody fee may be reduced by a credit earned under an arrangement that measures the value of U.S. dollars deposited with the custodian by the fund. The amount of the credit, for the year ended August 31, 2023, is shown as a reduction of total expenses in the Statement of Operations.
Tax Matters and Distributions — The fund intends to qualify as a regulated investment company, as defined under Subchapter M of the Internal Revenue Code, and to distribute all of its taxable income, including realized capital gains. As a result, no provision for federal income tax is required. The fund’s federal tax returns, when filed, will remain subject to examination by the Internal Revenue Service for a three year period. Management has analyzed the fund’s tax positions taken on federal and state tax returns for all open tax years and does not believe that there are any uncertain tax positions that require recognition of a tax liability. Foreign taxes, if any, have been accrued by the fund in the accompanying financial statements in accordance with the applicable foreign tax law. Foreign income taxes may be withheld by certain countries in which the fund invests. Additionally, capital gains realized by the fund on securities issued in or by certain foreign countries may be subject to capital gains tax imposed by those countries.
Distributions to shareholders are recorded on the ex-dividend date. Income and capital gain distributions are determined in accordance with income tax regulations, which may differ from U.S. generally accepted accounting principles. Certain capital accounts in the financial statements are periodically adjusted for permanent differences in order to reflect their tax character. These adjustments have no impact on net assets or net
Notes to Financial Statements - continued
asset value per share. Temporary differences which arise from recognizing certain items of income, expense, gain or loss in different periods for financial statement and tax purposes will reverse at some time in the future.
Book/tax differences primarily relate to net operating losses, wash sale loss deferrals, and redemptions in-kind.
The tax character of distributions declared to shareholders for the last two fiscal years is as follows:
| | Year ended
8/31/23 | Year ended
8/31/22 |
| Long-term capital gains | $— | $537,250,947 |
The federal tax cost and the tax basis components of distributable earnings were as follows:
| As of 8/31/23 | |
| Cost of investments | $9,114,737,922 |
| Gross appreciation | 4,284,542,012 |
| Gross depreciation | (306,562,784) |
| Net unrealized appreciation (depreciation) | $3,977,979,228 |
| Capital loss carryforwards | (262,818,736) |
| Late year ordinary loss deferral | (176,108) |
| Other temporary differences | (12,227) |
| Total distributable earnings (loss) | $3,714,972,157 |
As of August 31, 2023, the fund had capital loss carryforwards available to offset future realized gains. These net capital losses may be carried forward indefinitely and their character is retained as short-term and/or long-term losses. Such losses are characterized as follows:
Multiple Classes of Shares of Beneficial Interest — The fund offers multiple classes of shares, which differ in their respective distribution and service fees. The fund's income, realized and unrealized gain (loss), and common expenses are allocated to shareholders based on the daily net assets of each class. Dividends are declared separately for each class. Differences in per share dividend rates are generally due to differences in separate class expenses. Class B and Class C shares will convert to Class A shares approximately eight years after purchase. Effective March 21, 2022, all Class 529B and Class 529C shares were converted into Class 529A shares. Effective
Notes to Financial Statements - continued
May 20, 2022, all Class 529A shares were redeemed. The fund’s distributions declared to shareholders as reported in the Statements of Changes in Net Assets are presented by class as follows:
| | Year ended
8/31/23 | Year ended
8/31/22 |
| Class A | $— | $73,067,955 |
| Class B | — | 748,546 |
| Class C | — | 6,177,797 |
| Class I | — | 148,116,466 |
| Class R1 | — | 213,962 |
| Class R2 | — | 1,067,690 |
| Class R3 | — | 27,531,600 |
| Class R4 | — | 13,409,624 |
| Class R6 | — | 266,032,167 |
| Class 529A | — | 775,541 |
| Class 529B | — | 20,577 |
| Class 529C | — | 89,022 |
| Total | $— | $537,250,947 |
(3) Transactions with Affiliates
Investment Adviser — The fund has an investment advisory agreement with MFS to provide overall investment management and related administrative services and facilities to the fund. The management fee is computed daily and paid monthly at the following annual rates based on the fund's average daily net assets:
| Up to $1 billion | 0.75% |
| In excess of $1 billion and up to $2.5 billion | 0.70% |
| In excess of $2.5 billion and up to $5 billion | 0.65% |
| In excess of $5 billion and up to $10 billion | 0.62% |
| In excess of $10 billion and up to $20 billion | 0.60% |
| In excess of $20 billion | 0.55% |
MFS has agreed in writing to reduce its management fee by a specified amount if certain MFS mutual fund assets exceed thresholds agreed to by MFS and the fund's Board of Trustees. MFS has also agreed in writing to waive at least 0.01% of its management fee as part of this agreement. The agreement to waive at least 0.01% of the management fee will continue until modified by the fund's Board of Trustees, but such agreement will continue at least until December 31, 2023. For the year ended August 31, 2023, this management fee reduction amounted to $1,662,825, which is included in the reduction of total expenses in the Statement of Operations. The management fee incurred for the year ended August 31, 2023 was equivalent to an annual effective rate of 0.63% of the fund's average daily net assets.
The investment adviser has agreed in writing to pay a portion of the fund’s total annual operating expenses, excluding interest, taxes, extraordinary expenses, brokerage and transaction costs, certain tax reclaim recovery expenses (including contingency fees and
Notes to Financial Statements - continued
closing agreement expenses), and investment-related expenses, such that total fund operating expenses do not exceed the following rates annually of each class’s average daily net assets:
| Classes |
| A | B | C | I | R1 | R2 | R3 | R4 | R6 |
| 1.30% | 2.05% | 2.05% | 1.05% | 2.05% | 1.55% | 1.30% | 1.05% | 0.95% |
This written agreement will continue until modified by the fund’s Board of Trustees, but such agreement will continue at least until December 31, 2024. For the year ended August 31, 2023, the fund’s actual operating expenses did not exceed the limit and therefore, the investment adviser did not pay any portion of the fund’s expenses related to this agreement.
Distributor — MFS Fund Distributors, Inc. (MFD), a wholly-owned subsidiary of MFS, as distributor, received $177,314 for the year ended August 31, 2023, as its portion of the initial sales charge on sales of Class A shares of the fund.
The Board of Trustees has adopted a distribution plan for certain share classes pursuant to Rule 12b-1 of the Investment Company Act of 1940.
The fund's distribution plan provides that the fund will pay MFD for services provided by MFD and financial intermediaries in connection with the distribution and servicing of certain share classes. One component of the plan is a distribution fee paid to MFD and another component of the plan is a service fee paid to MFD. MFD may subsequently pay all, or a portion, of the distribution and/or service fees to financial intermediaries. The distribution and service fees are computed daily and paid monthly.
Distribution Plan Fee Table:
| | Distribution
Fee Rate (d) | Service
Fee Rate (d) | Total
Distribution
Plan (d) | Annual
Effective
Rate (e) | Distribution
and Service
Fee |
| Class A | — | 0.25% | 0.25% | 0.25% | $ 3,696,946 |
| Class B | 0.75% | 0.25% | 1.00% | 1.00% | 87,771 |
| Class C | 0.75% | 0.25% | 1.00% | 1.00% | 784,591 |
| Class R1 | 0.75% | 0.25% | 1.00% | 1.00% | 30,255 |
| Class R2 | 0.25% | 0.25% | 0.50% | 0.50% | 108,864 |
| Class R3 | — | 0.25% | 0.25% | 0.25% | 1,419,125 |
| Total Distribution and Service Fees | | | | | $6,127,552 |
| (d) | In accordance with the distribution plan for certain classes, the fund pays distribution and/or service fees equal to these annual percentage rates of each class’s average daily net assets. The distribution and service fee rates disclosed by class represent the current rates in effect at the end of the reporting period. Any rate changes, if applicable, are detailed below. |
| (e) | The annual effective rates represent actual fees incurred under the distribution plan for the year ended August 31, 2023 based on each class's average daily net assets. MFD has voluntarily agreed to rebate a portion of each class's 0.25% service fee attributable to accounts for which there is no financial intermediary specified on the account except for accounts attributable to MFS or its affiliates' seed money. For the year ended August 31, 2023, this rebate amounted to $415 and $1 for Class A and Class B shares, respectively, and is included in the reduction of total expenses in the Statement of Operations. |
Notes to Financial Statements - continued
Certain Class A shares are subject to a contingent deferred sales charge (CDSC) in the event of a shareholder redemption within 18 months of purchase. Class B shares are subject to a CDSC in the event of a shareholder redemption within six years of purchase. Class C shares are subject to a CDSC in the event of a shareholder redemption within 12 months of purchase. All contingent deferred sales charges are paid to MFD and during the year ended August 31, 2023, were as follows:
| | Amount |
| Class A | $25,248 |
| Class B | 3,980 |
| Class C | 3,859 |
Shareholder Servicing Agent — MFS Service Center, Inc. (MFSC), a wholly-owned subsidiary of MFS, receives a fee from the fund for its services as shareholder servicing agent calculated as a percentage of the average daily net assets of the fund as determined periodically under the supervision of the fund's Board of Trustees. For the year ended August 31, 2023, the fee was $429,600, which equated to 0.0034% annually of the fund's average daily net assets. MFSC also receives reimbursement from the fund for out-of-pocket expenses, sub-accounting and other shareholder servicing costs which may be paid to affiliated and unaffiliated service providers. Class R6 shares do not incur sub-accounting fees. For the year ended August 31, 2023, these out-of-pocket expenses, sub-accounting and other shareholder servicing costs amounted to $8,317,625.
Administrator — MFS provides certain financial, legal, shareholder communications, compliance, and other administrative services to the fund. Under an administrative services agreement, the fund reimburses MFS the costs incurred to provide these services. The fund is charged an annual fixed amount of $17,500 plus a fee based on average daily net assets. The administrative services fee is computed daily and paid monthly. The administrative services fee incurred for the year ended August 31, 2023 was equivalent to an annual effective rate of 0.0049% of the fund's average daily net assets.
Trustees’ and Officers’ Compensation — The fund pays compensation to independent Trustees in the form of a retainer, attendance fees, and additional compensation to Board and Committee chairpersons. Independent Trustees’ compensation is accrued daily and paid subsequent to each Trustee Board meeting. The fund does not pay compensation directly to Trustees or officers of the fund who are also officers of the investment adviser, all of whom receive remuneration from MFS for their services to the fund. Certain officers and Trustees of the fund are officers or directors of MFS, MFD, and MFSC.
Other — The fund invests in the MFS Institutional Money Market Portfolio which is managed by MFS and seeks current income consistent with preservation of capital and liquidity. This money market fund does not pay a management fee to MFS but does incur investment and operating costs.
During the year ended August 31, 2023, pursuant to a policy adopted by the Board of Trustees and designed to comply with Rule 17a-7 under the Investment Company Act of 1940 (the “Act”) and relevant guidance, the fund engaged in purchase and sale
Notes to Financial Statements - continued
transactions with funds and accounts for which MFS serves as investment adviser or sub-adviser (“cross-trades”) which amounted to $16,186,691 and $9,460,328, respectively. The sales transactions resulted in net realized gains (losses) of $(4,497,023).
The adviser has voluntarily undertaken to reimburse the fund from its own resources on a quarterly basis for the cost of investment research embedded in the cost of the fund’s securities trades. This agreement may be rescinded at any time. For the year ended August 31, 2023, this reimbursement amounted to $264,430, which is included in “Other” income in the Statement of Operations.
(4) Portfolio Securities
For the year ended August 31, 2023, purchases and sales of investments, other than short-term obligations, aggregated $3,721,099,279 and $5,062,251,670, respectively.
(5) Shares of Beneficial Interest
The fund's Declaration of Trust permits the Trustees to issue an unlimited number of full and fractional shares of beneficial interest. Transactions in fund shares were as follows:
| | Year ended
8/31/23 | | Year ended
8/31/22 |
| | Shares | Amount | | Shares | Amount |
| Shares sold | | | | | |
| Class A | 6,793,284 | $157,786,486 | | 9,868,708 | $265,315,267 |
| Class B | 4,974 | 93,494 | | 14,516 | 307,178 |
| Class C | 339,404 | 5,947,419 | | 534,315 | 11,139,743 |
| Class I | 32,405,384 | 802,020,268 | | 89,719,506 | 2,507,689,230 |
| Class R1 | 28,035 | 508,425 | | 49,304 | 944,614 |
| Class R2 | 200,572 | 4,328,218 | | 283,121 | 6,705,228 |
| Class R3 | 3,483,597 | 79,637,903 | | 5,565,877 | 152,192,681 |
| Class R4 | 1,244,875 | 30,125,069 | | 3,417,403 | 98,438,861 |
| Class R6 | 47,356,728 | 1,192,536,320 | | 62,579,666 | 1,796,018,041 |
| Class 529A | — | — | | 148,939 | 3,902,308 |
| Class 529C | — | — | | 3,364 | 72,642 |
| | 91,856,853 | $2,272,983,602 | | 172,184,719 | $4,842,725,793 |
Notes to Financial Statements - continued
| | Year ended
8/31/23 | | Year ended
8/31/22 |
| | Shares | Amount | | Shares | Amount |
Shares issued to shareholders
in reinvestment of distributions | | | | | |
| Class A | — | $— | | 2,229,393 | $67,126,982 |
| Class B | — | — | | 31,222 | 743,772 |
| Class C | — | — | | 262,437 | 6,041,311 |
| Class I | — | — | | 4,428,656 | 143,178,436 |
| Class R1 | — | — | | 9,032 | 213,962 |
| Class R2 | — | — | | 37,904 | 1,060,935 |
| Class R3 | — | — | | 920,481 | 27,531,600 |
| Class R4 | — | — | | 420,915 | 13,271,465 |
| Class R6 | — | — | | 7,829,985 | 255,649,000 |
| Class 529A | — | — | | 25,016 | 728,457 |
| Class 529B | — | — | | 882 | 20,577 |
| Class 529C | — | — | | 3,783 | 84,504 |
| | — | $— | | 16,199,706 | $515,651,001 |
| Shares reacquired | | | | | |
| Class A | (9,923,273) | $(229,185,981) | | (13,524,270) | $(365,851,473) |
| Class B | (157,611) | (2,852,374) | | (189,482) | (3,953,877) |
| Class C | (1,310,183) | (22,895,214) | | (1,347,145) | (26,777,702) |
| Class I | (80,289,596) | (1,995,690,788) | | (45,501,419) | (1,269,169,583) |
| Class R1 | (40,959) | (738,986) | | (94,474) | (1,950,615) |
| Class R2 | (224,530) | (4,795,328) | | (267,999) | (6,609,163) |
| Class R3 | (4,547,088) | (105,133,340) | | (6,163,771) | (165,731,977) |
| Class R4 | (3,718,861) | (87,895,279) | | (2,855,925) | (83,173,120) |
| Class R6 | (52,147,027) | (1,312,327,278) | | (43,636,874) | (1,254,373,862) |
| Class 529A | — | — | | (865,908) | (18,927,325) |
| Class 529B | — | — | | (19,553) | (397,842) |
| Class 529C | — | — | | (88,278) | (1,724,597) |
| | (152,359,128) | $(3,761,514,568) | | (114,555,098) | $(3,198,641,136) |
Notes to Financial Statements - continued
| | Year ended
8/31/23 | | Year ended
8/31/22 |
| | Shares | Amount | | Shares | Amount |
| Net change | | | | | |
| Class A | (3,129,989) | $(71,399,495) | | (1,426,169) | $(33,409,224) |
| Class B | (152,637) | (2,758,880) | | (143,744) | (2,902,927) |
| Class C | (970,779) | (16,947,795) | | (550,393) | (9,596,648) |
| Class I | (47,884,212) | (1,193,670,520) | | 48,646,743 | 1,381,698,083 |
| Class R1 | (12,924) | (230,561) | | (36,138) | (792,039) |
| Class R2 | (23,958) | (467,110) | | 53,026 | 1,157,000 |
| Class R3 | (1,063,491) | (25,495,437) | | 322,587 | 13,992,304 |
| Class R4 | (2,473,986) | (57,770,210) | | 982,393 | 28,537,206 |
| Class R6 | (4,790,299) | (119,790,958) | | 26,772,777 | 797,293,179 |
| Class 529A | — | — | | (691,953) | (14,296,560) |
| Class 529B | — | — | | (18,671) | (377,265) |
| Class 529C | — | — | | (81,131) | (1,567,451) |
| | (60,502,275) | $(1,488,530,966) | | 73,829,327 | $2,159,735,658 |
The fund is one of several mutual funds in which certain MFS funds may invest. The MFS funds do not invest in the underlying funds for the purpose of exercising management or control. At the end of the period, the MFS Growth Allocation Fund, the MFS Moderate Allocation Fund, the MFS Aggressive Growth Allocation Fund, and the MFS Conservative Allocation Fund were the owners of record of approximately 4%, 3%, 2%, and 1%, respectively, of the value of outstanding voting shares of the fund. In addition, the MFS Lifetime Income Fund, the MFS Lifetime 2025 Fund, the MFS Lifetime 2030 Fund, the MFS Lifetime 2035 Fund, the MFS Lifetime 2040 Fund, the MFS Lifetime 2045 Fund, the MFS Lifetime 2050 Fund, the MFS Lifetime 2055 Fund, the MFS Lifetime 2060 Fund, and the MFS Lifetime 2065 Fund were each the owners of record of less than 1% of the value of outstanding voting shares of the fund.
Effective June 1, 2019, purchases of the fund’s Class B and Class 529B shares were closed to new and existing investors subject to certain exceptions. Effective after the close of business on March 18, 2022, all sales of Class 529B and Class 529C shares were suspended, and Class 529B and Class 529C shares were converted into Class 529A shares of the fund effective March 21, 2022. Effective after the close of business on May 13, 2022, all sales and redemptions of Class 529A shares were suspended, and all Class 529A shares were redeemed on May 20, 2022. On March 30, 2023, the fund announced that effective after the close of business on September 29, 2023, purchases of Class R1 and Class R2 shares will be closed to new eligible investors.
(6) Line of Credit
The fund and certain other funds managed by MFS participate in a $1.45 billion unsecured committed line of credit of which $1.2 billion is reserved for use by the fund and certain other MFS U.S. funds. The line of credit is provided by a syndicate of banks under a credit agreement. Borrowings may be made for temporary financing needs. Interest is charged to each fund, based on its borrowings, generally at a rate equal to
Notes to Financial Statements - continued
the highest of 1) Daily Simple SOFR (Secured Overnight Financing Rate) plus 0.10%, 2) the Federal Funds Effective Rate, or 3) the Overnight Bank Funding Rate, each plus an agreed upon spread. A commitment fee, based on the average daily unused portion of the committed line of credit, is allocated among the participating funds. The line of credit expires on March 14, 2024 unless extended or renewed. In addition, the fund and other funds managed by MFS have established unsecured uncommitted borrowing arrangements with certain banks for temporary financing needs. Interest is charged to each fund, based on its borrowings, at rates equal to customary reference rates plus an agreed upon spread. For the year ended August 31, 2023, the fund’s commitment fee and interest expense were $68,004 and $0, respectively, and are included in “Miscellaneous” expense in the Statement of Operations.
(7) Investments in Affiliated Issuers
An affiliated issuer may be considered one in which the fund owns 5% or more of the outstanding voting securities, or a company which is under common control. For the purposes of this report, the following were affiliated issuers:
| Affiliated Issuers | Beginning
Value | Purchases | Sales
Proceeds | Realized
Gain
(Loss) | Change in
Unrealized
Appreciation or
Depreciation | Ending
Value |
| MFS Institutional Money Market Portfolio | $457,382,967 | $1,972,766,059 | $2,010,243,103 | $(14,265) | $44,524 | $419,936,182 |
| Affiliated Issuers | Dividend
Income | Capital Gain
Distributions |
| MFS Institutional Money Market Portfolio | $13,346,895 | $— |
(8) Redemptions In-Kind
On each of the dates listed below, the fund recorded a redemption in-kind of portfolio securities and cash. The redeeming shareholder generally receives a pro rata share of the securities held by the fund. The distribution of such securities generated a realized gain for the fund, which is included in Net realized gain (loss) in the Statement of Operations. For tax purposes, no gains or losses were recognized with respect to the portfolio securities redeemed in-kind.
| Redemption In-Kind Date | | Portfolio Securities
and Cash Amount | | Realized Gain (Loss) |
| October 5, 2022 | | $89,074,330 | | $39,934,632 |
| March 13, 2023 | | $20,713,604 | | $9,316,725 |
Report of Independent Registered Public Accounting Firm
To the Board of Trustees of MFS Series Trust IV and the Shareholders of MFS Mid Cap Growth Fund:
Opinion on the Financial Statements and Financial Highlights
We have audited the accompanying statement of assets and liabilities of MFS Mid Cap Growth Fund (the “Fund”), including the portfolio of investments, as of August 31, 2023, the related statement of operations for the year then ended, the statements of changes in net assets for each of the two years in the period then ended, the financial highlights for each of the five years in the period then ended, and the related notes. In our opinion, the financial statements and financial highlights present fairly, in all material respects, the financial position of the Fund as of August 31, 2023, and the results of its operations for the year then ended, the changes in its net assets for each of the two years in the period then ended, and the financial highlights for each of the five years in the period then ended, in conformity with accounting principles generally accepted in the United States of America.
Basis for Opinion
These financial statements and financial highlights are the responsibility of the Fund’s management. Our responsibility is to express an opinion on the Fund's financial statements and financial highlights based on our audits. We are a public accounting firm registered with the Public Company Accounting Oversight Board (United States) (PCAOB) and are required to be independent with respect to the Fund in accordance with the U.S. federal securities laws and the applicable rules and regulations of the Securities and Exchange Commission and the PCAOB.
We conducted our audits in accordance with the standards of the PCAOB. Those standards require that we plan and perform the audit to obtain reasonable assurance about whether the financial statements and financial highlights are free of material misstatement, whether due to error or fraud. The Fund is not required to have, nor were we engaged to perform, an audit of its internal control over financial reporting. As part of our audits we are required to obtain an understanding of internal control over financial reporting but not for the purpose of expressing an opinion on the effectiveness of the Fund's internal control over financial reporting. Accordingly, we express no such opinion.
Our audits included performing procedures to assess the risks of material misstatement of the financial statements and financial highlights, whether due to error or fraud, and performing procedures that respond to those risks. Such procedures included examining, on a test basis, evidence regarding the amounts and disclosures in the financial statements and financial highlights. Our audits also included evaluating the accounting principles used and significant estimates made by management, as well as evaluating the overall presentation of the financial statements and financial highlights.
Report of Independent Registered Public Accounting Firm – continued
Our procedures included confirmation of securities owned as of August 31, 2023, by correspondence with the custodian and brokers; when replies were not received from brokers, we performed other auditing procedures. We believe that our audits provide a reasonable basis for our opinion.
DELOITTE & TOUCHE LLP
Boston, Massachusetts
October 16, 2023
We have served as the auditor of one or more of the MFS investment companies since 1924.
Trustees and Officers — Identification and Background
The Trustees and Officers of the Trust, as of October 1, 2023, are listed below, together with their principal occupations during the past five years. (Their titles may have varied during that period.) The address of each Trustee and Officer is 111 Huntington Avenue, Boston, Massachusetts 02199-7618.
| Name, Age | | Position(s) Held with Fund | | Trustee/Officer Since(h) | | Number of MFS Funds overseen by the Trustee | | Principal Occupations During
the Past Five Years | | Other Directorships During
the Past Five Years (j) |
| INTERESTED TRUSTEE | | | | | | | | | | |
Michael W. Roberge (k)
(age 57) | | Trustee | | January 2021 | | 136 | | Massachusetts Financial Services Company, Chairman (since January 2021); Chief Executive Officer (since January 2017); Director; Chairman of the Board (since January 2022); President (until December 2018); Chief Investment Officer (until December 2018) | | N/A |
| INDEPENDENT TRUSTEES | | | | | | | | | | |
John P. Kavanaugh
(age 68) | | Trustee and Chair of Trustees | | January 2009 | | 136 | | Private investor | | N/A |
Steven E. Buller
(age 72) | | Trustee | | February 2014 | | 136 | | Private investor | | N/A |
John A. Caroselli
(age 69) | | Trustee | | March 2017 | | 136 | | Private investor; JC Global Advisors, LLC (management consulting), President (since 2015) | | N/A |
Maureen R. Goldfarb
(age 68) | | Trustee | | January 2009 | | 136 | | Private investor | | N/A |
Peter D. Jones
(age 68) | | Trustee | | January 2019 | | 136 | | Private investor | | N/A |
James W. Kilman, Jr.
(age 62) | | Trustee | | January 2019 | | 136 | | Burford Capital Limited (finance and investment management), Senior Advisor (since May 3, 2021), Chief Financial Officer (2019 - May 2, 2021); KielStrand Capital LLC (family office), Chief Executive Officer (since 2016) | | Alpha-En Corporation, Director (2016-2019) |
Trustees and Officers - continued
| Name, Age | | Position(s) Held with Fund | | Trustee/Officer Since(h) | | Number of MFS Funds overseen by the Trustee | | Principal Occupations During
the Past Five Years | | Other Directorships During
the Past Five Years (j) |
Clarence Otis, Jr.
(age 67) | | Trustee | | March 2017 | | 136 | | Private investor | | VF Corporation, Director; Verizon Communications, Inc., Director; The Travelers Companies, Director |
Maryanne L. Roepke
(age 67) | | Trustee | | May 2014 | | 136 | | Private investor | | N/A |
Laurie J. Thomsen
(age 66) | | Trustee | | March 2005 | | 136 | | Private investor | | The Travelers Companies, Director; Dycom Industries, Inc., Director |
| Name, Age | | Position(s) Held with
Fund | | Trustee/Officer Since(h) | | Number of MFS Funds for which the Person is an Officer | | Principal Occupations During
the Past Five Years |
| OFFICERS | | | | | | | | |
Christopher R. Bohane (k)
(age 49) | | Assistant Secretary and Assistant Clerk | | July 2005 | | 136 | | Massachusetts Financial Services Company, Senior Vice President and Senior Managing Counsel |
Kino Clark (k)
(age 55) | | Assistant Treasurer | | January 2012 | | 136 | | Massachusetts Financial Services Company, Vice President |
John W. Clark, Jr. (k)
(age 56) | | Assistant Treasurer | | April 2017 | | 136 | | Massachusetts Financial Services Company, Vice President |
David L. DiLorenzo (k)
(age 55) | | President | | July 2005 | | 136 | | Massachusetts Financial Services Company, Senior Vice President |
Heidi W. Hardin (k)
(age 56) | | Secretary and Clerk | | April 2017 | | 136 | | Massachusetts Financial Services Company, Executive Vice President and General Counsel |
Brian E. Langenfeld (k)
(age 50) | | Assistant Secretary and Assistant Clerk | | June 2006 | | 136 | | Massachusetts Financial Services Company, Vice President and Managing Counsel |
Trustees and Officers - continued
| Name, Age | | Position(s) Held with
Fund | | Trustee/Officer Since(h) | | Number of MFS Funds for which the Person is an Officer | | Principal Occupations During
the Past Five Years |
Rosa E. Licea-Mailloux (k)
(age 47) | | Chief Compliance Officer | | March 2022 | | 136 | | Massachusetts Financial Services Company, Vice President (since 2018); Director of Corporate Compliance (2018-2021), Senior Director Compliance (2021-2022), Senior Managing Director of North American Compliance & Chief Compliance Officer (since March 2022); Natixis Investment Managers (investment management), Funds Chief Compliance Officer, Deputy General Counsel & Senior Vice President (until 2018) |
Amanda S. Mooradian (k)
(age 44) | | Assistant Secretary and Assistant Clerk | | September 2018 | | 136 | | Massachusetts Financial Services Company, Assistant Vice President and Senior Counsel |
Susan A. Pereira (k)
(age 52) | | Assistant Secretary and Assistant Clerk | | July 2005 | | 136 | | Massachusetts Financial Services Company, Vice President and Managing Counsel |
Kasey L. Phillips (k)
(age 52) | | Assistant Treasurer | | September 2012 | | 136 | | Massachusetts Financial Services Company, Vice President |
Matthew A. Stowe (k)
(age 48) | | Assistant Secretary and Assistant Clerk | | October 2014 | | 136 | | Massachusetts Financial Services Company, Vice President and Senior Managing Counsel |
William B. Wilson (k)
(age 41) | | Assistant Secretary and Assistant Clerk | | October 2022 | | 136 | | Massachusetts Financial Services Company, Assistant Vice President and Senior Counsel |
James O. Yost (k)
(age 63) | | Treasurer | | September 1990 | | 136 | | Massachusetts Financial Services Company, Senior Vice President |
| (h) | Date first appointed to serve as Trustee/Officer of an MFS Fund. Each Trustee has served continuously since appointment unless indicated otherwise. From January 2012 through December 2016, Messrs. DiLorenzo and Yost served as Treasurer and Deputy Treasurer of the Funds, respectively. |
| (j) | Directorships or trusteeships of companies required to report to the Securities and Exchange Commission (i.e., “public companies”). |
| (k) | “Interested person” of the Trust within the meaning of the Investment Company Act of 1940 (referred to as the 1940 Act), which is the principal federal law governing investment companies like the fund, as a result of a position with MFS. The address of MFS is 111 Huntington Avenue, Boston, Massachusetts 02199-7618. |
Trustees and Officers - continued
Each Trustee (other than Messrs. Jones, Kilman and Roberge) has been elected by shareholders and each Trustee and Officer holds office until his or her successor is chosen and qualified or until his or her earlier death, resignation, retirement or removal. Mr. Roberge became a Trustee of the Funds on January 1, 2021 and Messrs. Jones and Kilman became Trustees of the Funds on January 1, 2019. The Trust does not hold annual meetings for the purpose of electing Trustees, and Trustees are not elected for fixed terms. Under the terms of the Board's retirement policy, an Independent Trustee shall retire at the end of the calendar year in which he or she reaches the earlier of 75 years of age or 15 years of service on the Board (or, in the case of any Independent Trustee who joined the Board prior to 2015, 20 years of service on the Board).
Messrs. Buller, Kilman and Otis and Ms. Roepke are members of the Trust’s Audit Committee.
Each of the Interested Trustees and certain Officers hold comparable officer positions with certain affiliates of MFS.
The Statement of Additional Information for a Fund includes further information about the Trustees and is available without charge upon request by calling 1-800-225-2606.
| Investment Adviser | Custodian |
Massachusetts Financial Services Company
111 Huntington Avenue
Boston, MA 02199-7618 | JPMorgan Chase Bank, NA
4 Metrotech Center
New York, NY 11245 |
| Distributor | Independent Registered Public Accounting Firm |
MFS Fund Distributors, Inc.
111 Huntington Avenue
Boston, MA 02199-7618 | Deloitte & Touche LLP
200 Berkeley Street
Boston, MA 02116 |
| Portfolio Manager(s) | |
Eric Braz
Eric Fischman | |
Board Review of Investment Advisory Agreement
MFS Mid Cap Growth Fund
The Investment Company Act of 1940 requires that both the full Board of Trustees and a majority of the non-interested (“independent”) Trustees, voting separately, annually approve the continuation of the Fund’s investment advisory agreement with MFS. The Trustees consider matters bearing on the Fund and its advisory arrangements at their meetings throughout the year, including a review of performance data at each regular meeting. In addition, the independent Trustees met several times over the course of three months beginning in May and ending in July, 2023 (“contract review meetings”) for the specific purpose of considering whether to approve the continuation of the investment advisory agreement for the Fund and the other investment companies that the Board oversees (the “MFS Funds”). The independent Trustees were assisted in their evaluation of the Fund’s investment advisory agreement by independent legal counsel, from whom they received separate legal advice and with whom they met separately from MFS during various contract review meetings. The independent Trustees were also assisted in this process by an independent consultant who was retained by and reported to the independent Trustees.
In connection with their deliberations regarding the continuation of the investment advisory agreement, the Trustees, including the independent Trustees, considered such information and factors as they believed, in light of the legal advice furnished to them and their own business judgment, to be relevant. The investment advisory agreement for the Fund was considered separately, although the Trustees also took into account the common interests of all MFS Funds in their review. As described below, the Trustees considered the nature, quality, and extent of the various investment advisory, administrative, and shareholder services performed by MFS under the existing investment advisory agreement and other arrangements with the Fund.
In connection with their contract review meetings, the Trustees received and relied upon materials that included, among other items: (i) information provided by Broadridge Financial Solutions, Inc. (“Broadridge”), an independent third party, on the investment performance of the Fund for various time periods ended December 31, 2022 and the investment performance of a group of funds with substantially similar investment classifications/objectives (the “Broadridge performance universe”), (ii) information provided by Broadridge on the Fund’s advisory fees and other expenses and the advisory fees and other expenses of comparable funds identified by Broadridge as well as all other funds in the same investment classification/category (the “Broadridge expense group and universe”), (iii) information provided by MFS on the advisory fees of portfolios of other clients of MFS, including institutional separate accounts and other clients, (iv) information as to whether and to what extent applicable expense waivers, reimbursements or fee “breakpoints” are observed for the Fund, (v) information regarding MFS’ financial results and financial condition, including MFS’ and certain of its affiliates’ estimated profitability from services performed for the Fund and the MFS Funds as a whole, and compared to MFS’ institutional business, (vi) MFS’ views regarding the outlook for the mutual fund industry and the strategic business plans of MFS, (vii) descriptions of various functions performed by MFS for the Funds, such as compliance monitoring and portfolio trading practices, and (viii) information regarding the overall organization of MFS, including information about
Board Review of Investment Advisory Agreement - continued
MFS’ senior management and other personnel providing investment advisory, administrative and other services to the Fund and the other MFS Funds. The comparative performance, fee and expense information prepared and provided by Broadridge was not independently verified and the independent Trustees did not independently verify any information provided to them by MFS.
The Trustees’ conclusion as to the continuation of the investment advisory agreement was based on a comprehensive consideration of all information provided to the Trustees and not the result of any single factor. Some of the factors that figured particularly in the Trustees’ deliberations are described below, although individual Trustees may have evaluated the information presented differently from one another, giving different weights to various factors. It is also important to recognize that the fee arrangements for the Fund and other MFS Funds are the result of years of review and discussion between the independent Trustees and MFS, that certain aspects of such arrangements may receive greater scrutiny in some years than in others, and that the Trustees’ conclusions may be based, in part, on their consideration of these same arrangements during the course of the year and in prior years.
Based on information provided by Broadridge and MFS, the Trustees reviewed the Fund’s total return investment performance as well as the Broadridge performance universe over various time periods. The Trustees placed particular emphasis on the total return performance of the Fund’s Class I shares in comparison to the performance of funds in its Broadridge performance universe over the five-year period ended December 31, 2022, which the Trustees believed was a long enough period to reflect differing market conditions. The total return performance of the Fund’s Class I shares was in the 1st quintile relative to the other funds in the universe for this five-year period (the 1st quintile being the best performers and the 5th quintile being the worst performers). The total return performance of the Fund’s Class I shares was in the 3rd quintile for each of the one- and three-year periods ended December 31, 2022 relative to the Broadridge performance universe. Because of the passage of time, these performance results may differ from the performance results for more recent periods, including those shown elsewhere in this report.
In the course of their deliberations, the Trustees took into account information provided by MFS in connection with the contract review meetings, as well as during investment review meetings conducted with portfolio management personnel during the course of the year regarding the Fund’s performance. After reviewing these and related factors, the Trustees concluded, within the context of their overall conclusions regarding the investment advisory agreement, that they were satisfied with MFS’ responses and efforts relating to investment performance.
In assessing the reasonableness of the Fund’s advisory fee, the Trustees considered, among other information, the Fund’s advisory fee and the total expense ratio of the Fund’s Class I shares as a percentage of average daily net assets and the advisory fee and total expense ratios of the Broadridge expense group based on information provided by Broadridge. The Trustees considered that MFS currently observes an expense limitation for the Fund, which may not be changed without the Trustees’ approval. The Trustees also considered that, according to the data provided by
Board Review of Investment Advisory Agreement - continued
Broadridge (which takes into account any fee reductions or expense limitations that were in effect during the Fund’s last fiscal year), the Fund’s effective advisory fee rate and total expense ratio were each approximately at the Broadridge expense group median.
The Trustees also considered the advisory fees charged by MFS to any institutional separate accounts advised by MFS (“separate accounts”) and unaffiliated investment companies for which MFS serves as subadviser (“subadvised funds”) that have comparable investment strategies to the Fund, if any. In comparing these fees, the Trustees considered information provided by MFS as to the generally broader scope of services provided by MFS to the Fund, as well as the more extensive regulatory burdens imposed on MFS in managing the Fund, in comparison to separate accounts and subadvised funds. The Trustees also considered the higher demands placed on MFS’ investment personnel and trading infrastructure as a result of the daily cash in-flows and out-flows of the Fund in comparison to separate accounts.
The Trustees also considered whether the Fund may benefit from any economies of scale in the management of the Fund in the event of growth in assets of the Fund and/or growth in assets of the MFS Funds as a whole. They noted that the Fund’s advisory fee rate schedule is subject to contractual breakpoints that reduce the Fund’s advisory fee rate on average daily net assets over $1 billion, $2.5 billion, $5 billion, $10 billion, and $20 billion. The Trustees also noted that MFS has agreed in writing to waive a portion of the management fees of certain MFS Funds, including the Fund, if the total combined assets of certain funds within the MFS Funds’ complex increase above agreed upon thresholds (the “group fee waiver”), enabling the Fund’s shareholders to share in the benefits from any economies of scale at the complex level. ��The group fee waiver is reviewed and renewed annually between the Board and MFS. The Trustees concluded that the breakpoints and the group fee waiver were sufficient to allow the Fund to benefit from economies of scale as its assets and overall complex assets grow.
The Trustees also considered information prepared by MFS relating to MFS’ costs and profits with respect to the Fund, the MFS Funds considered as a group, and other investment companies and accounts advised by MFS, as well as MFS’ methodologies used to determine and allocate its costs to the MFS Funds, the Fund and other accounts and products for purposes of estimating profitability.
After reviewing these and other factors described herein, the Trustees concluded, within the context of their overall conclusions regarding the investment advisory agreement, that the advisory fees charged to the Fund represent reasonable compensation in light of the services being provided by MFS to the Fund.
In addition, the Trustees considered MFS’ resources and related efforts to continue to retain, attract and motivate capable personnel to serve the Fund. The Trustees also considered current and developing conditions in the financial services industry, including the presence of large and well-capitalized companies which are spending, and appear to be prepared to continue to spend, substantial sums to engage personnel and to provide services to competing investment companies. In this regard, the Trustees also considered the financial resources of MFS and its ultimate parent, Sun Life Financial Inc. The Trustees also considered the advantages and possible disadvantages to the Fund of having an adviser that also serves other investment companies as well as other accounts.
Board Review of Investment Advisory Agreement - continued
The Trustees also considered the nature, quality, cost, and extent of administrative, transfer agency, and distribution services provided to the Fund by MFS and its affiliates under agreements and plans other than the investment advisory agreement, including any 12b-1 fees the Fund pays to MFS Fund Distributors, Inc., an affiliate of MFS. The Trustees also considered the nature, extent and quality of certain other services MFS performs or arranges for on the Fund’s behalf, which may include securities lending programs, directed expense payment programs, class action recovery programs, and MFS’ interaction with third-party service providers, principally custodians and sub-custodians. The Trustees concluded that the various non-advisory services provided by MFS and its affiliates on behalf of the Fund were satisfactory.
The Trustees considered so-called “fall-out benefits” to MFS such as reputational value derived from serving as investment manager to the MFS Funds. The Trustees also considered that MFS discontinued its historic practice of obtaining investment research from portfolio brokerage commissions paid by certain MFS Funds effective January 2018, and directly pays or voluntarily reimburses a Fund, if applicable, for the costs of external research acquired through the use of the Fund’s portfolio brokerage commissions.
Based on their evaluation of factors that they deemed to be material, including those factors described above, the Board of Trustees, including the independent Trustees, concluded that the Fund’s investment advisory agreement with MFS should be continued for an additional one-year period, commencing August 1, 2023.
Statement Regarding Liquidity Risk Management Program
The fund has adopted and implemented a liquidity risk management program (the “Program”) as required by Rule 22e-4 under the Investment Company Act of 1940, as amended. The fund’s Board of Trustees (the “Board”) has designated MFS as the administrator of the Program. The Program is reasonably designed to assess and manage the liquidity risk of the fund. Liquidity risk is the risk that the fund could not meet requests to redeem shares issued by the fund without significant dilution of remaining investors' interests.
MFS provided a written report to the Board for consideration at its March 2023 meeting that addressed the operation of the Program and provided an assessment of the adequacy and effectiveness of the Program during the period from January 1, 2022 to December 31, 2022 (the “Covered Period”). The report concluded that during the Covered Period the Program had operated effectively in all material respects and had adequately and effectively been implemented to assess and manage the fund’s liquidity risk. MFS also reported that there were no liquidity events that impacted the fund or its ability to timely meet redemptions without dilution to existing shareholders during the Covered Period.
There can be no assurance that the Program will achieve its objectives in the future. Further information on liquidity risk, and other principal risks to which an investment in the fund may be subject, can be found in the prospectus.
Proxy Voting Policies and Information
MFS votes proxies on behalf of the fund pursuant to proxy voting policies and procedures that are available without charge, upon request, by calling 1-800-225-2606, by visiting mfs.com/proxyvoting, or by visiting the SEC’s Web site at http://www.sec.gov.
Information regarding how the fund voted proxies relating to portfolio securities during the most recent twelve-month period ended June 30 is available by August 31 of each year without charge by visiting mfs.com/proxyvoting, or by visiting the SEC’s Web site at http://www.sec.gov.
Quarterly Portfolio Disclosure
The fund files a complete schedule of portfolio holdings with the SEC for the first and third quarters of each fiscal year as an exhibit to its reports on Form N-PORT. The fund's Form N-PORT reports are available on the SEC's Web site at http://www.sec.gov. A shareholder can obtain the portfolio holdings report for the first and third quarters of the fund's fiscal year at mfs.com/openendfunds by choosing the fund's name and then scrolling to the “Resources” section and clicking on the “Prospectus and Reports” tab.
Further Information
From time to time, MFS may post important information about the fund or the MFS Funds on the MFS Web site (mfs.com). This information is available at https://www.mfs.com/announcements or at mfs.com/openendfunds by choosing the fund’s name and then scrolling to the “Resources” section and clicking on the “Announcements” tab, if any.
Information About Fund Contracts and Legal Claims
The fund has entered into contractual arrangements with an investment adviser, administrator, distributor, shareholder servicing agent, and custodian who each provide services to the fund. Unless expressly stated otherwise, shareholders are not parties to, or intended beneficiaries of these contractual arrangements, and these contractual arrangements are not intended to create any shareholder right to enforce them against the service providers or to seek any remedy under them against the service providers, either directly or on behalf of the fund.
Under the Trust’s By-Laws and Declaration of Trust, any claims asserted against or on behalf of the MFS Funds, including claims against Trustees and Officers, must be brought in state and federal courts located within the Commonwealth of Massachusetts.
Federal Tax Information (unaudited)
The fund will notify shareholders of amounts for use in preparing 2023 income tax forms in January 2024.
| FACTS | WHAT DOES MFS DO WITH YOUR PERSONAL INFORMATION? |
| Why? | Financial companies choose how they share your personal information. Federal law gives consumers the right to limit some but not all sharing. Federal law also requires us to tell you how we collect, share, and protect your personal information. Please read this notice carefully to understand what we do. |
| What? | The types of personal information we collect and share depend on the product or service you have with us. This information can include: |
| • Social Security number and account balances |
| • Account transactions and transaction history |
| • Checking account information and wire transfer instructions |
| When you are no longer our customer, we continue to share your information as described in this notice. |
| How? | All financial companies need to share customers' personal information to run their everyday business. In the section below, we list the reasons financial companies can share their customers' personal information; the reasons MFS chooses to share; and whether you can limit this sharing. |
Reasons we can share your
personal information | Does MFS share? | Can you limit
this sharing? |
For our everyday business purposes –
such as to process your transactions, maintain your
account(s), respond to court orders and legal
investigations, or report to credit bureaus | Yes | No |
For our marketing purposes –
to offer our products and services to you | No | We don't share |
For joint marketing with other
financial companies | No | We don't share |
For our affiliates' everyday business purposes –
information about your transactions and experiences | No | We don't share |
For our affiliates' everyday business purposes –
information about your creditworthiness | No | We don't share |
| For nonaffiliates to market to you | No | We don't share |
| Questions? | Call 800-225-2606 or go to mfs.com. |
| Who we are |
| Who is providing this notice? | MFS Funds, MFS Investment Management, MFS Institutional Advisors, Inc., and MFS Heritage Trust Company. |
| What we do |
How does MFS
protect my personal
information? | To protect your personal information from unauthorized access and use, we use security measures that comply with federal law. These measures include procedural, electronic, and physical safeguards for the protection of the personal information we collect about you. |
How does MFS
collect my personal
information? | We collect your personal information, for example, when you |
| • open an account or provide account information |
| • direct us to buy securities or direct us to sell your securities |
| • make a wire transfer |
| We also collect your personal information from others, such as credit bureaus, affiliates, or other companies. |
| Why can't I limit all sharing? | Federal law gives you the right to limit only |
| • sharing for affiliates' everyday business purposes – information about your creditworthiness |
| • affiliates from using your information to market to you |
| • sharing for nonaffiliates to market to you |
| State laws and individual companies may give you additional rights to limit sharing. |
| Definitions |
| Affiliates | Companies related by common ownership or control. They can be financial and nonfinancial companies. |
| • MFS does not share personal information with affiliates, except for everyday business purposes as described on page one of this notice. |
| Nonaffiliates | Companies not related by common ownership or control. They can be financial and nonfinancial companies. |
| • MFS does not share with nonaffiliates so they can market to you. |
| Joint marketing | A formal agreement between nonaffiliated financial companies that together market financial products or services to you. |
| • MFS doesn't jointly market. |
| Other important information |
| If you own an MFS product or receive an MFS service in the name of a third party such as a bank or broker-dealer, their privacy policy may apply to you instead of ours. |
Save paper with eDelivery.
MFS® will send you prospectuses, reports, and proxies directly via e-mail so you will get information faster with less mailbox clutter.
To sign up:
1. Go to mfs.com.
2. Log in via MFS® Access.
3. Select eDelivery.
If you own your MFS fund shares through a financial institution or a retirement plan, MFS® TALK, MFS® Access, or eDelivery may not be available to you.
CONTACT
WEB SITE
mfs.com
MFS TALK
1-800-637-8255
24 hours a day
ACCOUNT SERVICE AND LITERATURE
Shareholders
1-800-225-2606
Financial advisors
1-800-343-2829
Retirement plan services
1-800-637-1255
MAILING ADDRESS
MFS Service Center, Inc.
P.O. Box 219341
Kansas City, MO 64121-9341
OVERNIGHT MAIL
MFS Service Center, Inc.
Suite 219341
430 W 7th Street
Kansas City, MO 64105-1407
Annual Report
August 31, 2023
MFS® U.S. Government
Money Market Fund
MFS® U.S. Government
Money Market Fund
| 1 |
| 2 |
| 3 |
| 4 |
| 5 |
| 6 |
| 7 |
| 8 |
| 9 |
| 15 |
| 17 |
| 21 |
| 25 |
| 25 |
| 25 |
| 25 |
| 25 |
| 26 |
The report is prepared for the general information of shareholders. It is authorized for distribution to prospective investors only when preceded or accompanied by a current prospectus.
NOT FDIC INSURED • MAY LOSE VALUE • NO BANK GUARANTEE
Maturity breakdown (u)
| 0 - 7 days | 41.2% |
| 8 - 29 days | 28.1% |
| 30 - 59 days | 21.1% |
| 60 - 89 days | 9.8% |
| Other Assets Less Liabilities | (0.2)% |
Composition including fixed income credit quality (a)(u)
| A-1+ | 53.7% |
| A-1 | 46.5% |
| Other Assets Less Liabilities | (0.2)% |
| (a) | Ratings are assigned to portfolio securities utilizing ratings from Moody’s, Fitch, and Standard & Poor’s rating agencies and applying the following hierarchy: If all three agencies provide a rating, the middle rating (after dropping the highest and lowest ratings) is assigned; if two of the three agencies rate a security, the lower of the two is assigned. Ratings are shown in the S&P scale. All ratings are subject to change. The fund did not hold unrated securities. The fund is not rated by these agencies. |
| (u) | For purposes of this presentation, accrued interest, where applicable, is included. |
From time to time Other Assets Less Liabilities may be negative due to the timing of cash receipts and disbursements.
Percentages are based on net assets as of August 31, 2023.
The portfolio is actively managed and current holdings may be different.
Performance Summary THROUGH 8/31/23
Total returns as well as the current 7-day yield have been provided for the applicable time periods. Performance results reflect the percentage change in net asset value, including the reinvestment of any dividends and capital gains distributions. (See Notes to Performance Summary.)
Performance data shown represents past performance and is no guarantee of future results. You could lose money by investing in the fund. Although the fund seeks to preserve the value of your investment at $1.00 per share, it cannot guarantee it will do so. An investment in the fund is not insured or guaranteed by the Federal Deposit Insurance Corporation or any other governmental agency. The fund’s sponsor has no legal obligation to provide financial support to the fund, and you should not expect the sponsor will provide financial support to the fund at any time. The performance shown does not reflect the deduction of taxes, if any, that a shareholder would pay on fund distributions or the redemption of fund shares.
| Inception | 1-Year Total Return (without sales charge) | Current 7-day yield |
| 12/19/75 | 3.81% | 4.87% |
Yields quoted are based on the latest seven days ended as of August 31, 2023, with dividends annualized. The yield quotations more closely reflect the current earnings of the fund than the total return quotations. Shares of the fund can be purchased at net asset value without a sales charge.
Certain shares of the fund acquired through an exchange may be subject to a contingent deferred sales charge upon redemption depending on when the shares exchanged were originally purchased. See the notes to financial statements for more details.
Notes to Performance Summary
Performance results reflect any applicable expense subsidies, waivers and adjustments in effect during the periods shown. Without such subsidies and waivers the fund’s performance results would be less favorable. Please see the prospectus and financial statements for complete details. All results are historical and assume the reinvestment of any dividends and capital gain distributions.
Expense Table
Fund expenses borne by the shareholders during the period,
March 1, 2023 through August 31, 2023
As a shareholder of the fund, you incur two types of costs: (1) transaction costs, including sales charges (loads) on certain purchase or redemption payments, and (2) ongoing costs, including management fees; and other fund expenses. This example is intended to help you understand your ongoing costs (in dollars) of investing in the fund and to compare these costs with the ongoing costs of investing in other mutual funds.
The example is based on an investment of $1,000 invested at the beginning of the period and held for the entire period March 1, 2023 through August 31, 2023.
Actual Expenses
The first line in the following table provides information about actual account values and actual expenses. You may use the information in this line, together with the amount you invested, to estimate the expenses that you paid over the period. Simply divide your account value by $1,000 (for example, an $8,600 account value divided by $1,000 = 8.6), then multiply the result by the number in the first line under the heading entitled “Expenses Paid During Period” to estimate the expenses you paid on your account during this period.
Hypothetical Example for Comparison Purposes
The second line of the following table provides information about hypothetical account values and hypothetical expenses based on the fund’s actual expense ratio and an assumed rate of return of 5% per year before expenses, which is not the fund’s actual return. The hypothetical account values and expenses may not be used to estimate the actual ending account balance or expenses you paid for the period. You may use this information to compare the ongoing costs of investing in the fund and other funds. To do so, compare this 5% hypothetical example with the 5% hypothetical examples that appear in the shareholder reports of the other funds.
Please note that the expenses shown in the table are meant to highlight your ongoing costs only and do not reflect any transactional costs, such as sales charges (loads). Therefore, the second line of the table is useful in comparing ongoing costs only, and will not help you determine the relative total costs of owning different funds. In addition, if these transactional costs were included, your costs would have been higher.
| | Annualized
Expense
Ratio | Beginning
Account Value
3/01/23 | Ending
Account Value
8/31/23 | Expenses
Paid During
Period (p)
3/01/23-8/31/23 |
| Actual | 0.45% | $1,000.00 | $1,022.31 | $2.29 |
| Hypothetical (h) | 0.45% | $1,000.00 | $1,022.94 | $2.29 |
| (h) | 5% fund return per year before expenses. |
| (p) | “Expenses Paid During Period” are equal to the fund's annualized expense ratio, as shown above, multiplied by the average account value over the period, multiplied by 184/365 (to reflect the one-half year period). Expenses paid do not include any applicable sales charges (loads). If these transaction costs had been included, your costs would have been higher. |
Portfolio of Investments
8/31/23
The Portfolio of Investments is a complete list of all securities owned by your fund. It is categorized by broad-based asset classes.
| Issuer | | | Shares/Par | Value ($) |
| U.S. Government Agencies and Equivalents (y) – 85.1% |
| Fannie Mae, 5.2%, due 9/05/2023 | | $47,100,000 | $47,072,891 |
| Federal Farm Credit Bank, 5.27%, due 9/13/2023 | | 17,650,000 | 17,619,113 |
| Federal Home Loan Bank, 5.21%, due 9/19/2023 | | 17,200,000 | 17,155,624 |
| Federal Home Loan Bank, 5.3%, due 10/10/2023 | | 23,250,000 | 23,118,018 |
| Freddie Mac, 5.19%, due 9/05/2023 | | 17,200,000 | 17,190,100 |
| U.S. Treasury Bill, 5.27%, due 9/07/2023 | | 37,350,000 | 37,317,288 |
| U.S. Treasury Bill, 5.06%, due 9/12/2023 | | 22,000,000 | 21,966,527 |
| U.S. Treasury Bill, 4.83%, due 9/14/2023 | | 19,250,000 | 19,216,984 |
| U.S. Treasury Bill, 5.3%, due 9/26/2023 | | 33,500,000 | 33,377,644 |
| U.S. Treasury Bill, 5.27%, due 10/10/2023 | | 59,250,000 | 58,914,973 |
| U.S. Treasury Bill, 5.33%, due 11/09/2023 | | 19,500,000 | 19,303,239 |
| U.S. Treasury Bill, 5.35%, due 11/16/2023 | | 18,790,000 | 18,580,276 |
| Total U.S. Government Agencies and Equivalents, at Amortized Cost and Value | | | $330,832,677 |
| Repurchase Agreements – 15.1% | |
BofA Securities, Inc. Repurchase Agreement, 5.27%,
dated 8/31/2023, due 9/01/2023, total to be received $19,533,859
(secured by U.S. Treasury and/or U.S. Government Agency Securities valued at $19,928,310) | | $19,531,000 | $19,531,000 |
Fixed Income Clearing Corp-State Street Bank & Trust Co. Repurchase Agreement, 5.28%,
dated 8/31/2023, due 9/01/2023, total to be received $19,534,865
(secured by U.S. Treasury and/or U.S. Government Agency Securities valued at $19,922,651) | | 19,532,000 | 19,532,000 |
JPMorgan Chase & Co. Repurchase Agreement, 5.28%,
dated 8/31/2023, due 9/01/2023, total to be received $19,536,865
(secured by U.S. Treasury and/or U.S. Government Agency Securities valued at $19,927,603) | | 19,534,000 | 19,534,000 |
| Total Repurchase Agreements, at Cost and Value | | | | $58,597,000 |
|
|
| Other Assets, Less Liabilities – (0.2)% | | | (712,962) |
| Net Assets – 100.0% | | | $388,716,715 |
| (y) | The rate shown represents an annualized yield at time of purchase. |
See Notes to Financial Statements
Financial Statements
Statement of Assets and Liabilities
At 8/31/23
This statement represents your fund’s balance sheet, which details the assets and liabilities comprising the total value of the fund.
| Assets | |
| Investments in unaffiliated issuers, at cost and value | $330,832,677 |
| Investments in unaffiliated repurchase agreements, at cost and value | 58,597,000 |
| Cash | 234 |
| Receivables for | |
| Fund shares sold | 169,907 |
| Interest | 8,589 |
| Receivable from investment adviser and distributor | 35,583 |
| Other assets | 506 |
| Total assets | $389,644,496 |
| Liabilities | |
| Payables for | |
| Distributions | $2,929 |
| Fund shares reacquired | 780,517 |
| Payable to affiliates | |
| Administrative services fee | 361 |
| Shareholder servicing costs | 84,847 |
| Payable for independent Trustees' compensation | 780 |
| Accrued expenses and other liabilities | 58,347 |
| Total liabilities | $927,781 |
| Net assets | $388,716,715 |
| Net assets consist of | |
| Paid-in capital | $388,725,205 |
| Total distributable earnings (loss) | (8,490) |
| Net assets | $388,716,715 |
| Shares of beneficial interest outstanding | 388,723,290 |
| Net asset value per share (net assets of $388,716,715 / 388,723,290 shares of beneficial interest outstanding) | $1.00 |
A contingent deferred sales charge may be imposed on redemptions.
See Notes to Financial Statements
Financial Statements
Statement of Operations
Year ended 8/31/23
This statement describes how much your fund earned in investment income and accrued in expenses. It also describes any gains and/or losses generated by fund operations.
| Net investment income (loss) | |
| Income | |
| Interest | $18,287,573 |
| Other | 8,908 |
| Total investment income | $18,296,481 |
| Expenses | |
| Management fee | $1,766,112 |
| Shareholder servicing costs | 493,028 |
| Administrative services fee | 74,741 |
| Independent Trustees' compensation | 10,677 |
| Custodian fee | 20,088 |
| Shareholder communications | 13,713 |
| Audit and tax fees | 47,954 |
| Legal fees | 3,779 |
| Miscellaneous | 104,267 |
| Total expenses | $2,534,359 |
| Fees paid indirectly | (20,088) |
| Reduction of expenses by investment adviser | (545,097) |
| Net expenses | $1,969,174 |
| Net investment income (loss) | $16,327,307 |
| Change in net assets from operations | $16,327,307 |
See Notes to Financial Statements
Financial Statements
Statements of Changes in Net Assets
These statements describe the increases and/or decreases in net assets resulting from operations, any distributions, and any shareholder transactions.
| | Year ended |
| | 8/31/23 | 8/31/22 |
| Change in net assets | | |
| From operations | | |
| Net investment income (loss) | $16,327,307 | $1,244,698 |
| Net realized gain (loss) | — | (5,979) |
| Change in net assets from operations | $16,327,307 | $1,238,719 |
| Total distributions to shareholders | $(16,327,307) | $(1,285,595) |
| Change in net assets from fund share transactions | $(75,638,632) | $120,193,159 |
| Total change in net assets | $(75,638,632) | $120,146,283 |
| Net assets | | |
| At beginning of period | 464,355,347 | 344,209,064 |
| At end of period | $388,716,715 | $464,355,347 |
See Notes to Financial Statements
Financial Statements
Financial Highlights
The financial highlights table is intended to help you understand the fund's financial performance for the past 5 years. Certain information reflects financial results for a single fund share. The total returns in the table represent the rate that an investor would have earned (or lost) on an investment in the fund share class (assuming reinvestment of all distributions) held for the entire period.
| | Year ended |
| | 8/31/23 | 8/31/22 | 8/31/21 | 8/31/20 | 8/31/19 |
| Net asset value, beginning of period | $1.00 | $1.00 | $1.00 | $1.00 | $1.00 |
| Income (loss) from investment operations |
| Net investment income (loss) (d) | $0.04 | $0.00(w) | $0.00 | $0.00(w) | $0.02 |
| Net realized and unrealized gain (loss) | — | (0.00)(w) | 0.00(w) | 0.01 | 0.00(w) |
| Total from investment operations | $0.04 | $0.00(w) | $0.00(w) | $0.01 | $0.02 |
| Less distributions declared to shareholders |
| From net investment income | $(0.04) | $(0.00)(w) | $— | $(0.01) | $(0.02) |
| From net realized gain | — | (0.00)(w) | — | — | — |
| Total distributions declared to shareholders | $(0.04) | $(0.00)(w) | $— | $(0.01) | $(0.02) |
| Net asset value, end of period | $1.00 | $1.00 | $1.00 | $1.00 | $1.00 |
| Total return (%) (r)(t) | 3.81 | 0.27 | 0.00 | 0.61 | 1.70 |
Ratios (%) (to average net assets)
and Supplemental data: |
| Expenses before expense reductions (f) | 0.57 | 0.59 | 0.55 | 0.60 | 0.62 |
| Expenses after expense reductions (f) | 0.45 | 0.23 | 0.06 | 0.36 | 0.61 |
| Net investment income (loss) | 3.70 | 0.31 | 0.00 | 0.45 | 1.69 |
| Net assets at end of period (000 omitted) | $388,717 | $464,355 | $344,209 | $518,651 | $303,799 |
| (d) | Per share data is based on average shares outstanding. |
| (f) | Ratios do not reflect reductions from fees paid indirectly, if applicable. See Note 2 in the Notes to Financial Statements for additional information. |
| (r) | Certain expenses have been reduced without which performance would have been lower. |
| (t) | Total returns do not include any applicable sales charges. |
| (w) | Per share amount was less than $0.01. |
See Notes to Financial Statements
Notes to Financial Statements
(1) Business and Organization
MFS U.S. Government Money Market Fund (the fund) is a diversified series of MFS Series Trust IV (the trust). The trust is organized as a Massachusetts business trust and is registered under the Investment Company Act of 1940, as amended, as an open-end management investment company.
The fund is an investment company and accordingly follows the investment company accounting and reporting guidance of the Financial Accounting Standards Board (FASB) Accounting Standards Codification Topic 946 Financial Services - Investment Companies.
(2) Significant Accounting Policies
General — The preparation of financial statements in conformity with U.S. generally accepted accounting principles requires management to make estimates and assumptions that affect the reported amounts of assets and liabilities, and disclosure of contingent assets and liabilities at the date of the financial statements and the reported amounts of increases and decreases in net assets from operations during the reporting period. Actual results could differ from those estimates. In the preparation of these financial statements, management has evaluated subsequent events occurring after the date of the fund’s Statement of Assets and Liabilities through the date that the financial statements were issued.
Balance Sheet Offsetting — The fund's accounting policy with respect to balance sheet offsetting is that, absent an event of default by the counterparty or a termination of the agreement, the International Swaps and Derivatives Association (ISDA) Master Agreement, or similar agreement, does not result in an offset of reported amounts of financial assets and financial liabilities in the Statement of Assets and Liabilities across transactions between the fund and the applicable counterparty. The fund's right to setoff may be restricted or prohibited by the bankruptcy or insolvency laws of the particular jurisdiction to which a specific master netting agreement counterparty is subject. Balance sheet offsetting disclosures, to the extent applicable to the fund, have been included in the fund’s Significant Accounting Policies note under the captions for each of the fund’s in-scope financial instruments and transactions.
Investment Valuations — Subject to its oversight, the fund’s Board of Trustees has delegated primary responsibility for determining or causing to be determined the value of the fund’s investments to MFS as the fund’s adviser, pursuant to the fund’s valuation policy and procedures which have been adopted by the adviser and approved by the Board. In accordance with Rule 2a-5 under the Investment Company Act of 1940, the Board of Trustees designated the adviser as the “valuation designee” of the fund. If the adviser, as valuation designee, determines that reliable market quotations are not readily available for an investment, the investment is valued at fair value as determined in good faith by the adviser in accordance with the adviser’s fair valuation policy and procedures.
Under the fund's valuation policies and procedures, market quotations are not considered to be readily available for debt instruments. Debt instruments held by the fund are generally valued at amortized cost, which approximates market value. Amortized cost involves valuing an instrument at its cost as adjusted for amortization of premium or accretion of discount rather than its current market value. The amortized cost value of an instrument can be different from the market value of an instrument.
Notes to Financial Statements - continued
Various inputs are used in determining the value of the fund's assets or liabilities. These inputs are categorized into three broad levels. In certain cases, the inputs used to measure fair value may fall into different levels of the fair value hierarchy. In such cases, an investment's level within the fair value hierarchy is based on the lowest level of input that is significant to the fair value measurement. The fund's assessment of the significance of a particular input to the fair value measurement in its entirety requires judgment, and considers factors specific to the investment. Level 1 includes unadjusted quoted prices in active markets for identical assets or liabilities. Level 2 includes other significant observable market-based inputs (including quoted prices for similar securities, interest rates, prepayment speed, and credit risk). Level 3 includes significant unobservable inputs, which may include the adviser's own assumptions in determining the fair value of investments. The following is a summary of the levels used as of August 31, 2023 in valuing the fund's assets and liabilities:
| Financial Instruments | Level 1 | Level 2 | Level 3 | Total |
| Short-Term Securities | $— | $389,429,677 | $— | $389,429,677 |
For further information regarding security characteristics, see the Portfolio of Investments.
Repurchase Agreements — The fund enters into bilateral repurchase agreements under the terms of Master Repurchase Agreements with approved counterparties, some of which may be novated to the clearing agency, Fixed Income Clearing Corporation (FICC). Each repurchase agreement is recorded at cost. For both bilateral and cleared repurchase agreements, the fund requires that the securities collateral in a repurchase transaction be transferred to a custodian. On a daily basis, the fund monitors the collateral to ensure that its value, including accrued interest, is greater than amounts owed to the fund under each such repurchase agreement. In the event of default, the settlement of a cleared repurchase agreement is guaranteed by FICC. Upon an event of default on a bilateral repurchase agreement, the non-defaulting party may close out all transactions traded under a Master Repurchase Agreement and net amounts owed under each transaction to one net amount payable by one party to the other. Absent an event of default, the Master Repurchase Agreement does not result in an offset of reported amounts of assets and liabilities in the Statement of Assets and Liabilities across transactions between the fund and the applicable counterparty. At August 31, 2023, the fund had investments in repurchase agreements with a gross value of $58,597,000 included in investments in unaffiliated issuers in the Statement of Assets and Liabilities. The value of the related collateral exceeded the value of the repurchase agreements at period end.
Indemnifications — Under the fund's organizational documents, its officers and Trustees may be indemnified against certain liabilities and expenses arising out of the performance of their duties to the fund. Additionally, in the normal course of business, the fund enters into agreements with service providers that may contain indemnification clauses. The fund's maximum exposure under these agreements is unknown as this would involve future claims that may be made against the fund that have not yet occurred.
Investment Transactions and Income — Interest income is recorded on the accrual basis. All premium and discount is amortized or accreted for financial statement purposes in accordance with U.S. generally accepted accounting principles.
Notes to Financial Statements - continued
Investment transactions are recorded on the trade date. In determining the net gain or loss on securities sold, the cost of securities is determined on the identified cost basis.
Fees Paid Indirectly — The fund’s custody fee may be reduced by credits earned under a previous arrangement that measured the value of U.S. dollars deposited with the custodian by the fund. The amount of the credits that were used to reduce the fund's custody fee for the year ended August 31, 2023, is shown as a reduction of total expenses in the Statement of Operations.
Tax Matters and Distributions — The fund intends to qualify as a regulated investment company, as defined under Subchapter M of the Internal Revenue Code, and to distribute all of its taxable income, including realized capital gains. As a result, no provision for federal income tax is required. The fund’s federal tax returns, when filed, will remain subject to examination by the Internal Revenue Service for a three year period. Management has analyzed the fund’s tax positions taken on federal and state tax returns for all open tax years and does not believe that there are any uncertain tax positions that require recognition of a tax liability.
Distributions to shareholders are recorded on the ex-dividend date. Income and capital gain distributions are determined in accordance with income tax regulations, which may differ from U.S. generally accepted accounting principles. Certain capital accounts in the financial statements are periodically adjusted for permanent differences in order to reflect their tax character. These adjustments have no impact on net assets or net asset value per share. Temporary differences which arise from recognizing certain items of income, expense, gain or loss in different periods for financial statement and tax purposes will reverse at some time in the future.
During the year ended August 31, 2023, there were no significant adjustments due to differences between book and tax accounting.
The tax character of distributions declared to shareholders for the last two fiscal years is as follows:
| | Year ended
8/31/23 | Year ended
8/31/22 |
| Ordinary income (including any short-term capital gains) | $16,327,307 | $1,285,595 |
The federal tax cost and the tax basis components of distributable earnings were as follows:
| As of 8/31/23 | |
| Cost of investments | $389,429,677 |
| Undistributed ordinary income | 1,148 |
| Capital loss carryforwards | (5,979) |
| Other temporary differences | (3,659) |
| Total distributable earnings (loss) | $(8,490) |
As of August 31, 2023, the fund had capital loss carryforwards available to offset future realized gains. These net capital losses may be carried forward indefinitely and their character is retained as short-term and/or long-term losses. Such losses are characterized as follows:
Notes to Financial Statements - continued
(3) Transactions with Affiliates
Investment Adviser — The fund has an investment advisory agreement with MFS to provide overall investment management and related administrative services and facilities to the fund. The management fee is computed daily and paid monthly at the following annual rates based on the fund's average daily net assets:
| Up to $1 billion | 0.40% |
| In excess of $1 billion | 0.35% |
MFS has agreed in writing to reduce its management fee by a specified amount if certain MFS mutual fund assets exceed thresholds agreed to by MFS and the fund's Board of Trustees. MFS has also agreed in writing to waive at least 0.01% of its management fee as part of this agreement. The agreement to waive at least 0.01% of the management fee will continue until modified by the fund's Board of Trustees, but such agreement will continue at least until December 31, 2023. For the year ended August 31, 2023, this management fee reduction amounted to $57,435, which is included in the reduction of total expenses in the Statement of Operations. The management fee incurred for the year ended August 31, 2023 was equivalent to an annual effective rate of 0.39% of the fund's average daily net assets.
The investment adviser has agreed in writing to pay a portion of the fund’s total annual operating expenses, excluding interest, taxes, extraordinary expenses, brokerage and transaction costs, and investment-related expenses, such that total fund operating expenses do not exceed 0.45% annually of the fund’s average daily net assets. This written agreement will continue until modified by the fund’s Board of Trustees, but such agreement will continue at least until December 31, 2024. For the year ended August 31, 2023, this reduction amounted to $487,662, which is included in the reduction of total expenses in the Statement of Operations.
Distributor — Certain shares acquired through an exchange may be subject to a contingent deferred sales charge upon redemption depending on when the shares exchanged were originally purchased. Contingent deferred sales charges paid to MFS Distributors, Inc. (MFD) during the year ended August 31, 2023 were $90,816.
Shareholder Servicing Agent — MFS Service Center, Inc. (MFSC), a wholly-owned subsidiary of MFS, receives a fee from the fund for its services as shareholder servicing agent calculated as a percentage of the average daily net assets of the fund as determined periodically under the supervision of the fund's Board of Trustees. For the year ended August 31, 2023, the fee was $227,628, which equated to 0.0516% annually of the fund's average daily net assets. MFSC also receives reimbursement from the fund for out-of-pocket expenses, sub-accounting and other shareholder servicing costs which may be paid to affiliated and unaffiliated service providers. For the year ended August 31, 2023, these out-of-pocket expenses, sub-accounting and other shareholder servicing costs amounted to $265,400.
Administrator — MFS provides certain financial, legal, shareholder communications, compliance, and other administrative services to the fund. Under an administrative services agreement, the fund reimburses MFS the costs incurred to provide these services. The fund is charged an annual fixed amount of $17,500 plus a fee based on average daily net assets. The administrative services fee is computed daily and paid monthly. The administrative services fee incurred for the year ended August 31, 2023 was equivalent to an annual effective rate of 0.0169% of the fund's average daily net assets.
Notes to Financial Statements - continued
Trustees’ and Officers’ Compensation — The fund pays compensation to independent Trustees in the form of a retainer, attendance fees, and additional compensation to Board and Committee chairpersons. Independent Trustees’ compensation is accrued daily and paid subsequent to each Trustee Board meeting. The fund does not pay compensation directly to Trustees or officers of the fund who are also officers of the investment adviser, all of whom receive remuneration from MFS for their services to the fund. Certain officers and Trustees of the fund are officers or directors of MFS, MFD, and MFSC.
Prior to December 31, 2001, the fund had an unfunded defined benefit plan (“DB plan”) for independent Trustees. As of December 31, 2001, the Board took action to terminate the DB plan with respect to then-current and any future independent Trustees, such that the DB plan covers only certain of those former independent Trustees who retired on or before December 31, 2001. The DB plan resulted in a pension expense of $1,391 and is included in “Independent Trustees’ compensation” in the Statement of Operations for the year ended August 31, 2023. The liability for deferred retirement benefits payable to those former independent Trustees under the DB plan amounted to $730 at August 31, 2023, and is included in “Payable for independent Trustees’ compensation” in the Statement of Assets and Liabilities. The deferred retirement benefits compensation fee is accrued daily and paid monthly.
(4) Shares of Beneficial Interest
The fund's Declaration of Trust permits the Trustees to issue an unlimited number of full and fractional shares of beneficial interest. The number of shares sold, reinvested and reacquired corresponds to the net proceeds from the sale of shares, reinvestment of distributions and cost of shares reacquired, respectively, since shares are sold and reacquired at $1.00 per share. Transactions in fund shares were as follows:
| | Year ended
8/31/23 | | Year ended
8/31/22 |
| Shares sold | 224,642,194 | | 379,490,959 |
Shares issued to shareholders in
reinvestment of distributions | 16,262,845 | | 1,279,610 |
| Shares reacquired | (316,543,671) | | (260,577,410) |
| Net change | (75,638,632) | | 120,193,159 |
Effective at the close of business on May 29, 2020, the fund was closed to all purchases subject to certain exceptions.
(5) Line of Credit
The fund and certain other funds managed by MFS participate in a $1.45 billion unsecured committed line of credit of which $1.2 billion is reserved for use by the fund and certain other MFS U.S. funds. The line of credit is provided by a syndicate of banks under a credit agreement. Borrowings may be made for temporary financing needs. Interest is charged to each fund, based on its borrowings, generally at a rate equal to the highest of 1) Daily Simple SOFR (Secured Overnight Financing Rate) plus 0.10%, 2) the Federal Funds Effective Rate, or 3) the Overnight Bank Funding Rate, each plus an agreed upon spread. A commitment fee, based on the average daily unused portion of the committed line of credit, is allocated among the participating funds. The line of credit expires on March 14, 2024 unless extended or renewed. In addition, the fund
Notes to Financial Statements - continued
and other funds managed by MFS have established unsecured uncommitted borrowing arrangements with certain banks for temporary financing needs. Interest is charged to each fund, based on its borrowings, at rates equal to customary reference rates plus an agreed upon spread. For the year ended August 31, 2023, the fund’s commitment fee and interest expense were $2,419 and $0, respectively, and are included in “Miscellaneous” expense in the Statement of Operations.
Report of Independent Registered Public Accounting Firm
To the Board of Trustees of MFS Series Trust IV and the Shareholders of MFS U.S. Government Money Market Fund:
Opinion on the Financial Statements and Financial Highlights
We have audited the accompanying statement of assets and liabilities of MFS U.S. Government Money Market Fund (the “Fund”), including the portfolio of investments, as of August 31, 2023, the related statement of operations for the year then ended, the statements of changes in net assets for each of the two years in the period then ended, the financial highlights for each of the five years in the period then ended, and the related notes. In our opinion, the financial statements and financial highlights present fairly, in all material respects, the financial position of the Fund as of August 31, 2023, and the results of its operations for the year then ended, the changes in its net assets for each of the two years in the period then ended, and the financial highlights for each of the five years in the period then ended, in conformity with accounting principles generally accepted in the United States of America.
Basis for Opinion
These financial statements and financial highlights are the responsibility of the Fund’s management. Our responsibility is to express an opinion on the Fund's financial statements and financial highlights based on our audits. We are a public accounting firm registered with the Public Company Accounting Oversight Board (United States) (PCAOB) and are required to be independent with respect to the Fund in accordance with the U.S. federal securities laws and the applicable rules and regulations of the Securities and Exchange Commission and the PCAOB.
We conducted our audits in accordance with the standards of the PCAOB. Those standards require that we plan and perform the audit to obtain reasonable assurance about whether the financial statements and financial highlights are free of material misstatement, whether due to error or fraud. The Fund is not required to have, nor were we engaged to perform, an audit of its internal control over financial reporting. As part of our audits we are required to obtain an understanding of internal control over financial reporting but not for the purpose of expressing an opinion on the effectiveness of the Fund's internal control over financial reporting. Accordingly, we express no such opinion.
Our audits included performing procedures to assess the risks of material misstatement of the financial statements and financial highlights, whether due to error or fraud, and performing procedures that respond to those risks. Such procedures included examining, on a test basis, evidence regarding the amounts and disclosures in the financial statements and financial highlights. Our audits also included evaluating the accounting principles used and significant estimates made by management, as well as
Report of Independent Registered Public Accounting Firm – continued
evaluating the overall presentation of the financial statements and financial highlights. Our procedures included confirmation of securities owned as of August 31, 2023, by correspondence with the custodian and brokers. We believe that our audits provide a reasonable basis for our opinion.
DELOITTE & TOUCHE LLP
Boston, Massachusetts
October 16, 2023
We have served as the auditor of one or more of the MFS investment companies since 1924.
Trustees and Officers — Identification and Background
The Trustees and Officers of the Trust, as of October 1, 2023, are listed below, together with their principal occupations during the past five years. (Their titles may have varied during that period.) The address of each Trustee and Officer is 111 Huntington Avenue, Boston, Massachusetts 02199-7618.
| Name, Age | | Position(s) Held with Fund | | Trustee/Officer Since(h) | | Number of MFS Funds overseen by the Trustee | | Principal Occupations During
the Past Five Years | | Other Directorships During
the Past Five Years (j) |
| INTERESTED TRUSTEE | | | | | | | | | | |
Michael W. Roberge (k)
(age 57) | | Trustee | | January 2021 | | 136 | | Massachusetts Financial Services Company, Chairman (since January 2021); Chief Executive Officer (since January 2017); Director; Chairman of the Board (since January 2022); President (until December 2018); Chief Investment Officer (until December 2018) | | N/A |
| INDEPENDENT TRUSTEES | | | | | | | | | | |
John P. Kavanaugh
(age 68) | | Trustee and Chair of Trustees | | January 2009 | | 136 | | Private investor | | N/A |
Steven E. Buller
(age 72) | | Trustee | | February 2014 | | 136 | | Private investor | | N/A |
John A. Caroselli
(age 69) | | Trustee | | March 2017 | | 136 | | Private investor; JC Global Advisors, LLC (management consulting), President (since 2015) | | N/A |
Maureen R. Goldfarb
(age 68) | | Trustee | | January 2009 | | 136 | | Private investor | | N/A |
Peter D. Jones
(age 68) | | Trustee | | January 2019 | | 136 | | Private investor | | N/A |
James W. Kilman, Jr.
(age 62) | | Trustee | | January 2019 | | 136 | | Burford Capital Limited (finance and investment management), Senior Advisor (since May 3, 2021), Chief Financial Officer (2019 - May 2, 2021); KielStrand Capital LLC (family office), Chief Executive Officer (since 2016) | | Alpha-En Corporation, Director (2016-2019) |
Trustees and Officers - continued
| Name, Age | | Position(s) Held with Fund | | Trustee/Officer Since(h) | | Number of MFS Funds overseen by the Trustee | | Principal Occupations During
the Past Five Years | | Other Directorships During
the Past Five Years (j) |
Clarence Otis, Jr.
(age 67) | | Trustee | | March 2017 | | 136 | | Private investor | | VF Corporation, Director; Verizon Communications, Inc., Director; The Travelers Companies, Director |
Maryanne L. Roepke
(age 67) | | Trustee | | May 2014 | | 136 | | Private investor | | N/A |
Laurie J. Thomsen
(age 66) | | Trustee | | March 2005 | | 136 | | Private investor | | The Travelers Companies, Director; Dycom Industries, Inc., Director |
| Name, Age | | Position(s) Held with
Fund | | Trustee/Officer Since(h) | | Number of MFS Funds for which the Person is an Officer | | Principal Occupations During
the Past Five Years |
| OFFICERS | | | | | | | | |
Christopher R. Bohane (k)
(age 49) | | Assistant Secretary and Assistant Clerk | | July 2005 | | 136 | | Massachusetts Financial Services Company, Senior Vice President and Senior Managing Counsel |
Kino Clark (k)
(age 55) | | Assistant Treasurer | | January 2012 | | 136 | | Massachusetts Financial Services Company, Vice President |
John W. Clark, Jr. (k)
(age 56) | | Assistant Treasurer | | April 2017 | | 136 | | Massachusetts Financial Services Company, Vice President |
David L. DiLorenzo (k)
(age 55) | | President | | July 2005 | | 136 | | Massachusetts Financial Services Company, Senior Vice President |
Heidi W. Hardin (k)
(age 56) | | Secretary and Clerk | | April 2017 | | 136 | | Massachusetts Financial Services Company, Executive Vice President and General Counsel |
Brian E. Langenfeld (k)
(age 50) | | Assistant Secretary and Assistant Clerk | | June 2006 | | 136 | | Massachusetts Financial Services Company, Vice President and Managing Counsel |
Trustees and Officers - continued
| Name, Age | | Position(s) Held with
Fund | | Trustee/Officer Since(h) | | Number of MFS Funds for which the Person is an Officer | | Principal Occupations During
the Past Five Years |
Rosa E. Licea-Mailloux (k)
(age 47) | | Chief Compliance Officer | | March 2022 | | 136 | | Massachusetts Financial Services Company, Vice President (since 2018); Director of Corporate Compliance (2018-2021), Senior Director Compliance (2021-2022), Senior Managing Director of North American Compliance & Chief Compliance Officer (since March 2022); Natixis Investment Managers (investment management), Funds Chief Compliance Officer, Deputy General Counsel & Senior Vice President (until 2018) |
Amanda S. Mooradian (k)
(age 44) | | Assistant Secretary and Assistant Clerk | | September 2018 | | 136 | | Massachusetts Financial Services Company, Assistant Vice President and Senior Counsel |
Susan A. Pereira (k)
(age 52) | | Assistant Secretary and Assistant Clerk | | July 2005 | | 136 | | Massachusetts Financial Services Company, Vice President and Managing Counsel |
Kasey L. Phillips (k)
(age 52) | | Assistant Treasurer | | September 2012 | | 136 | | Massachusetts Financial Services Company, Vice President |
Matthew A. Stowe (k)
(age 48) | | Assistant Secretary and Assistant Clerk | | October 2014 | | 136 | | Massachusetts Financial Services Company, Vice President and Senior Managing Counsel |
William B. Wilson (k)
(age 41) | | Assistant Secretary and Assistant Clerk | | October 2022 | | 136 | | Massachusetts Financial Services Company, Assistant Vice President and Senior Counsel |
James O. Yost (k)
(age 63) | | Treasurer | | September 1990 | | 136 | | Massachusetts Financial Services Company, Senior Vice President |
| (h) | Date first appointed to serve as Trustee/Officer of an MFS Fund. Each Trustee has served continuously since appointment unless indicated otherwise. From January 2012 through December 2016, Messrs. DiLorenzo and Yost served as Treasurer and Deputy Treasurer of the Funds, respectively. |
| (j) | Directorships or trusteeships of companies required to report to the Securities and Exchange Commission (i.e., “public companies”). |
| (k) | “Interested person” of the Trust within the meaning of the Investment Company Act of 1940 (referred to as the 1940 Act), which is the principal federal law governing investment companies like the fund, as a result of a position with MFS. The address of MFS is 111 Huntington Avenue, Boston, Massachusetts 02199-7618. |
Trustees and Officers - continued
Each Trustee (other than Messrs. Jones, Kilman and Roberge) has been elected by shareholders and each Trustee and Officer holds office until his or her successor is chosen and qualified or until his or her earlier death, resignation, retirement or removal. Mr. Roberge became a Trustee of the Funds on January 1, 2021 and Messrs. Jones and Kilman became Trustees of the Funds on January 1, 2019. The Trust does not hold annual meetings for the purpose of electing Trustees, and Trustees are not elected for fixed terms. Under the terms of the Board's retirement policy, an Independent Trustee shall retire at the end of the calendar year in which he or she reaches the earlier of 75 years of age or 15 years of service on the Board (or, in the case of any Independent Trustee who joined the Board prior to 2015, 20 years of service on the Board).
Messrs. Buller, Kilman and Otis and Ms. Roepke are members of the Trust’s Audit Committee.
Each of the Interested Trustees and certain Officers hold comparable officer positions with certain affiliates of MFS.
The Statement of Additional Information for a Fund includes further information about the Trustees and is available without charge upon request by calling 1-800-225-2606.
| Investment Adviser | Custodian |
Massachusetts Financial Services Company
111 Huntington Avenue
Boston, MA 02199-7618 | State Street Bank and Trust Company
1 Congress Street, Suite 1
Boston, MA 02114-2016 |
| Distributor | Independent Registered Public Accounting Firm |
MFS Fund Distributors, Inc.
111 Huntington Avenue
Boston, MA 02199-7618 | Deloitte & Touche LLP
200 Berkeley Street
Boston, MA 02116 |
Board Review of Investment Advisory Agreement
MFS U.S. Government Money Market Fund
The Investment Company Act of 1940 requires that both the full Board of Trustees and a majority of the non-interested (“independent”) Trustees, voting separately, annually approve the continuation of the Fund’s investment advisory agreement with MFS. The Trustees consider matters bearing on the Fund and its advisory arrangements at their meetings throughout the year, including a review of performance data at each regular meeting. In addition, the independent Trustees met several times over the course of three months beginning in May and ending in July, 2023 (“contract review meetings”) for the specific purpose of considering whether to approve the continuation of the investment advisory agreement for the Fund and the other investment companies that the Board oversees (the “MFS Funds”). The independent Trustees were assisted in their evaluation of the Fund’s investment advisory agreement by independent legal counsel, from whom they received separate legal advice and with whom they met separately from MFS during various contract review meetings. The independent Trustees were also assisted in this process by an independent consultant who was retained by and reported to the independent Trustees.
In connection with their deliberations regarding the continuation of the investment advisory agreement, the Trustees, including the independent Trustees, considered such information and factors as they believed, in light of the legal advice furnished to them and their own business judgment, to be relevant. The investment advisory agreement for the Fund was considered separately, although the Trustees also took into account the common interests of all MFS Funds in their review. As described below, the Trustees considered the nature, quality, and extent of the various investment advisory, administrative, and shareholder services performed by MFS under the existing investment advisory agreement and other arrangements with the Fund.
In connection with their contract review meetings, the Trustees received and relied upon materials that included, among other items: (i) information provided by Broadridge Financial Solutions, Inc. (“Broadridge”), an independent third party, on the investment performance of the Fund for various time periods ended December 31, 2022 and the investment performance of a group of funds with substantially similar investment classifications/objectives (the “Broadridge performance universe”), (ii) information provided by Broadridge on the Fund’s advisory fees and other expenses and the advisory fees and other expenses of comparable funds identified by Broadridge as well as all other funds in the same investment classification/category (the “Broadridge expense group and universe”), (iii) information provided by MFS on the advisory fees of portfolios of other clients of MFS, including institutional separate accounts and other clients, (iv) information as to whether and to what extent applicable expense waivers, reimbursements or fee “breakpoints” are observed for the Fund, (v) information regarding MFS’ financial results and financial condition, including MFS’ and certain of its affiliates’ estimated profitability from services performed for the Fund and the MFS Funds as a whole, and compared to MFS’ institutional business, (vi) MFS’ views regarding the outlook for the mutual fund industry and the strategic business plans of MFS, (vii) descriptions of various functions performed by MFS for the Funds, such as compliance monitoring and portfolio trading practices, and (viii) information regarding the overall organization of MFS, including information about
Board Review of Investment Advisory Agreement - continued
MFS’ senior management and other personnel providing investment advisory, administrative and other services to the Fund and the other MFS Funds. The comparative performance, fee and expense information prepared and provided by Broadridge was not independently verified and the independent Trustees did not independently verify any information provided to them by MFS.
The Trustees’ conclusion as to the continuation of the investment advisory agreement was based on a comprehensive consideration of all information provided to the Trustees and not the result of any single factor. Some of the factors that figured particularly in the Trustees’ deliberations are described below, although individual Trustees may have evaluated the information presented differently from one another, giving different weights to various factors. It is also important to recognize that the fee arrangements for the Fund and other MFS Funds are the result of years of review and discussion between the independent Trustees and MFS, that certain aspects of such arrangements may receive greater scrutiny in some years than in others, and that the Trustees’ conclusions may be based, in part, on their consideration of these same arrangements during the course of the year and in prior years.
Based on information provided by Broadridge and MFS, the Trustees reviewed the Fund’s total return investment performance as well as the Broadridge performance universe over various time periods. The Trustees placed particular emphasis on the total return performance of the Fund’s shares in comparison to the performance of funds in its Broadridge performance universe over the five-year period ended December 31, 2022, which the Trustees believed was a long enough period to reflect differing market conditions.The total return performance of the Fund’s shares was in the 5th quintile relative to the other funds in the universe for this five-year period (the 1st quintile being the best performers and the 5th quintile being the worst performers). The total return performance of the Fund’s shares was in the 5th quintile for the one-year period and the 4th quintile for the three-year period ended December 31, 2022 relative to the Broadridge performance universe. Because of the passage of time, these performance results may differ from the performance results for more recent periods, including those shown elsewhere in this report.
In the course of their deliberations, the Trustees took into account information provided by MFS in connection with the contract review meetings, as well as during investment review meetings conducted with portfolio management personnel during the course of the year regarding the Fund’s performance. In addition, the Trustees noted the market conditions affecting all money market funds, in particular the low interest rate environment during portions of the one-, three- and five-year periods, and MFS’ voluntary waiver of all or a portion of its fees to ensure that the Fund avoided a negative yield during certain periods. After reviewing these and related factors, the Trustees concluded, within the context of their overall conclusions regarding the investment advisory agreement, that they were satisfied with MFS’ responses and efforts relating to investment performance.
In assessing the reasonableness of the Fund’s advisory fee, the Trustees considered, among other information, the Fund’s advisory fee and the total expense ratio of the Fund’s shares as a percentage of average daily net assets and the advisory fee and total expense ratios of the Broadridge expense group based on information provided by Broadridge. The Trustees considered that MFS currently observes an expense limitation for the Fund, which may not be changed without the Trustees’ approval. The Trustees
Board Review of Investment Advisory Agreement - continued
also considered that, according to the data provided by Broadridge (which takes into account any fee reductions or expense limitations that were in effect during the Fund’s last fiscal year), the Fund’s effective advisory fee rate was approximately at the Broadridge expense group median and the Fund’s total expense ratio was higher than the Broadridge expense group median.
The Trustees also considered the advisory fees charged by MFS to any institutional separate accounts advised by MFS (“separate accounts”) and unaffiliated investment companies for which MFS serves as subadviser (“subadvised funds”) that have comparable investment strategies to the Fund, if any. In comparing these fees, the Trustees considered information provided by MFS as to the generally broader scope of services provided by MFS to the Fund, as well as the more extensive regulatory burdens imposed on MFS in managing the Fund, in comparison to separate accounts and subadvised funds.The Trustees also considered the higher demands placed on MFS’ investment personnel and trading infrastructure as a result of the daily cash in-flows and out-flows of the Fund in comparison to separate accounts.
The Trustees also considered whether the Fund may benefit from any economies of scale in the management of the Fund in the event of growth in assets of the Fund and/or growth in assets of the MFS Funds as a whole. They noted that the Fund’s advisory fee rate schedule is subject to a contractual breakpoint that reduces the Fund’s advisory fee rate on average daily net assets over $1 billion. The Trustees also noted that MFS has agreed in writing to waive a portion of the management fees of certain MFS Funds, including the Fund, if the total combined assets of certain funds within the MFS Funds’ complex increase above agreed upon thresholds (the “group fee waiver”), enabling the Fund’s shareholders to share in the benefits from any economies of scale at the complex level. The group fee waiver is reviewed and renewed annually between the Board and MFS. The Trustees concluded that the breakpoint and the group fee waiver were sufficient to allow the Fund to benefit from economies of scale as its assets and overall complex assets grow.
The Trustees also considered information prepared by MFS relating to MFS’ costs and profits with respect to the Fund, the MFS Funds considered as a group, and other investment companies and accounts advised by MFS, as well as MFS’ methodologies used to determine and allocate its costs to the MFS Funds, the Fund and other accounts and products for purposes of estimating profitability.
After reviewing these and other factors described herein, the Trustees concluded, within the context of their overall conclusions regarding the investment advisory agreement, that the advisory fees charged to the Fund represent reasonable compensation in light of the services being provided by MFS to the Fund.
In addition, the Trustees considered MFS’ resources and related efforts to continue to retain, attract and motivate capable personnel to serve the Fund. The Trustees also considered current and developing conditions in the financial services industry, including the presence of large and well-capitalized companies which are spending, and appear to be prepared to continue to spend, substantial sums to engage personnel and to provide services to competing investment companies. In this regard, the Trustees also considered the financial resources of MFS and its ultimate parent, Sun Life Financial Inc. The Trustees also considered the advantages and possible disadvantages to the Fund of having an adviser that also serves other investment companies as well as other accounts.
Board Review of Investment Advisory Agreement - continued
The Trustees also considered the nature, quality, cost, and extent of administrative, transfer agency, and distribution services provided to the Fund by MFS and its affiliates under agreements other than the investment advisory agreement. The Trustees also considered the nature, extent and quality of certain other services MFS performs or arranges for on the Fund’s behalf, which may include securities lending programs, directed expense payment programs, class action recovery programs, and MFS’ interaction with third-party service providers, principally custodians and sub-custodians. The Trustees concluded that the various non-advisory services provided by MFS and its affiliates on behalf of the Fund were satisfactory.
The Trustees considered so-called “fall-out benefits” to MFS such as reputational value derived from serving as investment manager to the MFS Funds. The Trustees also considered that MFS discontinued its historic practice of obtaining investment research from portfolio brokerage commissions paid by certain MFS Funds effective January 2018, and directly pays or voluntarily reimburses a Fund, if applicable, for the costs of external research acquired through the use of the Fund’s portfolio brokerage commissions.
Based on their evaluation of factors that they deemed to be material, including those factors described above, the Board of Trustees, including the independent Trustees, concluded that the Fund’s investment advisory agreement with MFS should be continued for an additional one-year period, commencing August 1, 2023.
Proxy Voting Policies and Information
MFS votes proxies on behalf of the fund pursuant to proxy voting policies and procedures that are available without charge, upon request, by calling 1-800-225-2606, by visiting mfs.com/proxyvoting, or by visiting the SEC’s Web site at http://www.sec.gov.
Information regarding how the fund voted proxies relating to portfolio securities during the most recent twelve-month period ended June 30 is available by August 31 of each year without charge by visiting mfs.com/proxyvoting, or by visiting the SEC’s Web site at http://www.sec.gov.
Portfolio Holdings Information
The fund files monthly portfolio information with the SEC on Form N-MFP. The fund’s Form N-MFP reports are available on the SEC’s Web site at http://www.sec.gov. A shareholder can also access the fund’s portfolio holdings as of each month end and the fund’s Form N-MFP reports at mfs.com/openendfunds after choosing “Click here for access to Money Market fund reports”.
Further Information
From time to time, MFS may post important information about the fund or the MFS Funds on the MFS Web site (mfs.com). This information is available at https://www.mfs.com/announcements or at mfs.com/openendfunds by choosing the fund’s name and then scrolling to the “Resources” section and clicking on the “Announcements” tab, if any.
Information About Fund Contracts and Legal Claims
The fund has entered into contractual arrangements with an investment adviser, administrator, distributor, shareholder servicing agent, and custodian who each provide services to the fund. Unless expressly stated otherwise, shareholders are not parties to, or intended beneficiaries of these contractual arrangements, and these contractual arrangements are not intended to create any shareholder right to enforce them against the service providers or to seek any remedy under them against the service providers, either directly or on behalf of the fund.
Under the Trust’s By-Laws and Declaration of Trust, any claims asserted against or on behalf of the MFS Funds, including claims against Trustees and Officers, must be brought in state and federal courts located within the Commonwealth of Massachusetts.
Federal Tax Information (unaudited)
The fund will notify shareholders of amounts for use in preparing 2023 income tax forms in January 2024. The following information is provided pursuant to provisions of the Internal Revenue Code.
The fund intends to pass through the maximum amount allowable as Section 163(j) Interest Dividends as defined in Treasury Regulation §1.163(j)-1(b).
| FACTS | WHAT DOES MFS DO WITH YOUR PERSONAL INFORMATION? |
| Why? | Financial companies choose how they share your personal information. Federal law gives consumers the right to limit some but not all sharing. Federal law also requires us to tell you how we collect, share, and protect your personal information. Please read this notice carefully to understand what we do. |
| What? | The types of personal information we collect and share depend on the product or service you have with us. This information can include: |
| • Social Security number and account balances |
| • Account transactions and transaction history |
| • Checking account information and wire transfer instructions |
| When you are no longer our customer, we continue to share your information as described in this notice. |
| How? | All financial companies need to share customers' personal information to run their everyday business. In the section below, we list the reasons financial companies can share their customers' personal information; the reasons MFS chooses to share; and whether you can limit this sharing. |
Reasons we can share your
personal information | Does MFS share? | Can you limit
this sharing? |
For our everyday business purposes –
such as to process your transactions, maintain your
account(s), respond to court orders and legal
investigations, or report to credit bureaus | Yes | No |
For our marketing purposes –
to offer our products and services to you | No | We don't share |
For joint marketing with other
financial companies | No | We don't share |
For our affiliates' everyday business purposes –
information about your transactions and experiences | No | We don't share |
For our affiliates' everyday business purposes –
information about your creditworthiness | No | We don't share |
| For nonaffiliates to market to you | No | We don't share |
| Questions? | Call 800-225-2606 or go to mfs.com. |
| Who we are |
| Who is providing this notice? | MFS Funds, MFS Investment Management, MFS Institutional Advisors, Inc., and MFS Heritage Trust Company. |
| What we do |
How does MFS
protect my personal
information? | To protect your personal information from unauthorized access and use, we use security measures that comply with federal law. These measures include procedural, electronic, and physical safeguards for the protection of the personal information we collect about you. |
How does MFS
collect my personal
information? | We collect your personal information, for example, when you |
| • open an account or provide account information |
| • direct us to buy securities or direct us to sell your securities |
| • make a wire transfer |
| We also collect your personal information from others, such as credit bureaus, affiliates, or other companies. |
| Why can't I limit all sharing? | Federal law gives you the right to limit only |
| • sharing for affiliates' everyday business purposes – information about your creditworthiness |
| • affiliates from using your information to market to you |
| • sharing for nonaffiliates to market to you |
| State laws and individual companies may give you additional rights to limit sharing. |
| Definitions |
| Affiliates | Companies related by common ownership or control. They can be financial and nonfinancial companies. |
| • MFS does not share personal information with affiliates, except for everyday business purposes as described on page one of this notice. |
| Nonaffiliates | Companies not related by common ownership or control. They can be financial and nonfinancial companies. |
| • MFS does not share with nonaffiliates so they can market to you. |
| Joint marketing | A formal agreement between nonaffiliated financial companies that together market financial products or services to you. |
| • MFS doesn't jointly market. |
| Other important information |
| If you own an MFS product or receive an MFS service in the name of a third party such as a bank or broker-dealer, their privacy policy may apply to you instead of ours. |
Save paper with eDelivery.
MFS® will send you prospectuses, reports, and proxies directly via e-mail so you will get information faster with less mailbox clutter.
To sign up:
1. Go to mfs.com.
2. Log in via MFS® Access.
3. Select eDelivery.
If you own your MFS fund shares through a financial institution or a retirement plan, MFS® TALK, MFS® Access, or eDelivery may not be available to you.
CONTACT
WEB SITE
mfs.com
MFS TALK
1-800-637-8255
24 hours a day
ACCOUNT SERVICE AND LITERATURE
Shareholders
1-800-225-2606
Financial advisors
1-800-343-2829
Retirement plan services
1-800-637-1255
MAILING ADDRESS
MFS Service Center, Inc.
P.O. Box 219341
Kansas City, MO 64121-9341
OVERNIGHT MAIL
MFS Service Center, Inc.
Suite 219341
430 W 7th Street
Kansas City, MO 64105-1407
Item 1(b):
Not applicable.
ITEM 2. CODE OF ETHICS.
The Registrant has adopted a Code of Ethics (the "Code") pursuant to Section 406 of the Sarbanes-Oxley Act and as defined in Form N-CSR that applies to the Registrant's principal executive officer and principal financial and accounting officer. During the period covered by this report, the Registrant has not amended any provision in the Code that relates to an element of the Code's definition enumerated in paragraph
(b)of Item 2 of this Form N-CSR. During the period covered by this report, the Registrant did not grant a waiver, including an implicit waiver, from any provision of the Code.
A copy of the Code is attached hereto as EX-99.COE.
ITEM 3. AUDIT COMMITTEE FINANCIAL EXPERT.
Messrs. Steven E. Buller, James Kilman, and Clarence Otis, Jr. and Ms. Maryanne L. Roepke, members of the Audit Committee, have been determined by the Board of Trustees in their reasonable business judgment to meet the definition of "audit committee financial expert" as such term is defined in Form N-CSR. In addition, Messrs. Buller, Kilman, and Otis and Ms. Roepke are "independent" members of the Audit Committee (as such term has been defined by the Securities and Exchange Commission in regulations implementing Section 407 of the Sarbanes-Oxley Act of 2002). The Securities and Exchange Commission has stated that the designation of a person as an audit committee financial expert pursuant to this Item 3 on the Form N-CSR does not impose on such a person any duties, obligations or liability that are greater than the duties, obligations or liability imposed on such person as a member of the Audit Committee and the Board of Trustees in the absence of such designation or identification.
ITEM 4. PRINCIPAL ACCOUNTANT FEES AND SERVICES.
Items 4(a) through 4(d) and 4(g):
The Board of Trustees has appointed Deloitte & Touche LLP ("Deloitte") to serve as independent accountants to certain series of the Registrant and Ernst & Young LLP ("E&Y") to serve in the same capacity to certain other series of the Registrant (each a "Fund" and collectively the "Funds"). The tables below set forth the audit fees billed to each Fund as well as fees for non-audit services provided to each Fund and/or to each Fund's investment adviser, Massachusetts Financial Services Company ("MFS"), and to various entities either controlling, controlled by, or under common control with MFS that provide ongoing services to the Funds ("MFS Related Entities").
For the fiscal years ended August 31, 2023 and 2022, audit fees billed to each Fund by Deloitte and E&Y were as follows:
Fees Billed by Deloitte | | Audit Fees |
| 2023 | | 2022 |
MFS Mid Cap Growth Fund | 53,879 | | 49,856 |
MFS U.S. Government Money Market | 38,892 | | 36,005 |
Fund | | | |
Total | 92,771 | | 85,861 |
Fees Billed by E&Y | | Audit Fees |
| 2023 | | 2022 |
MFS Blended Research Emerging Markets | 63,662 | | 58,898 |
Equity Fund | | | |
MFS Blended Research International Equity | 63,662 | | 58,898 |
Fund | | | |
MFS Global New Discovery Fund | 55,694 | | 51,534 |
Total | 183,018 | | 169,330 |
For the fiscal years ended August 31, 2023 and 2022, fees billed by Deloitte and E&Y for audit-related, tax and other services provided to each Fund and for audit-related, tax and other services provided to MFS and MFS Related Entities were as follows:
Fees Billed by Deloitte | | | Audit-Related Fees1 | | Tax Fees2 | | | All Other Fees3 |
| | | | 2023 | | 2022 | | 2023 | | 2022 | 2023 | 2022 |
To MFS Mid Cap Growth | | | 0 | | 0 | | 0 | | 400 | 0 | 0 |
Fund | | | | | | | | | | | | | |
To MFS U.S. Government | | | 0 | | 0 | | 0 | | 400 | 0 | 0 |
Money Market Fund | | | | | | | | | | | | | |
Total fees billed by Deloitte | | | 0 | | 0 | | 0 | | 800 | 0 | 0 |
To above Funds | | | | | | | | | | | | | |
| | | | | | | | | | | |
Fees Billed by Deloitte | | | Audit-Related Fees1 | | Tax Fees2 | | | All Other Fees3 |
| | | | 2023 | | 2022 | | 2023 | | 2022 | 2023 | 2022 |
To MFS and MFS Related | | | 0 | | 0 | | 0 | | 0 | 0 | 7,580 |
Entities of MFS Mid Cap | | | | | | | | | | | | | |
Growth Fund* | | | | | | | | | | | | | |
To MFS and MFS Related | | | 0 | | 0 | | 0 | | 0 | 0 | 7,580 |
Entities of MFS U.S. | | | | | | | | | | | | | |
Government Money Market | | | | | | | | | | | | | |
Fund* | | | | | | | | | | | | | |
| | | | | | | | | |
Fees Billed by Deloitte | | | | | | Aggregate Fees for Non-audit Services | |
| | | | | | | | 2023 | | | | 2022 | |
To MFS Mid Cap Growth Fund, MFS and MFS | | | | 0 | | | | 7,980 | |
Related Entities# | | | | | | | | | | | |
To MFS U.S. Government Money Market | | | | 0 | | | | 7,980 | |
Fund, MFS and MFS Related Entities# | | | | | | | | | | | |
| | | | | | | | |
Fees Billed by E&Y | | Audit-Related Fees1 | | Tax Fees2 | | | All Other Fees4 |
| | | | 2023 | | | 2022 | | 2023 | | 2022 | 2023 | 2022 |
| | | | | | | | | | | |
To MFS Blended Research | | 0 | | | 0 | | 636 | | 644 | 0 | 9 |
Emerging Markets Equity Fund | | | | | | | | | | | | |
To MFS Blended Research | | 0 | | | 0 | | 636 | | 644 | 0 | 68 |
International Equity Fund | | | | | | | | | | | | |
To MFS Global New Discovery | | 0 | | | 0 | | 636 | | 644 | 0 | 18 |
Fund | | | | | | | | | | | | |
Total fees billed by E&Y | | 0 | | 0 | | 1,908 | 1,932 | 0 | 95 |
To above Funds | | | | | | | | | | |
| | | | | | | |
Fees Billed by E&Y | | Audit-Related Fees1 | | Tax Fees2 | All Other Fees4 |
| | 2023 | 2022 | | 2023 | 2022 | 2023 | 2022 |
| | | | | | | | | | |
To MFS and MFS Related | | 0 | | 662,511 | | 0 | 0 | 3,600 | 111,415 |
Entities of MFS Blended Research | | | | | | | | | | |
Emerging Markets Equity Fund* | | | | | | | | | | |
To MFS and MFS Related | | 0 | | 662,511 | | 0 | 0 | 3,600 | 111,415 |
Entities of MFS Blended Research | | | | | | | | | | |
International Equity Fund* | | | | | | | | | | |
To MFS and MFS Related | | 0 | | 662,511 | | 0 | 0 | 3,600 | 111,415 |
Entities of MFS Global New | | | | | | | | | | |
Discovery Fund* | | | | | | | | | | |
| | | | | |
Fees Billed by E&Y | | | Aggregate Fees for Non-audit Services | |
| | | | 2023 | | | | 2022 | |
| | | | | | | | |
To MFS Blended Research Emerging | | | 228,986 | | | | 955,009 | |
Markets Equity Fund, MFS and MFS | | | | | | | | | |
Related Entities# | | | | | | | | | |
To MFS Blended Research International | | | 228,986 | | | | 955,068 | |
Equity Fund, MFS and MFS Related | | | | | | | | | |
Entities# | | | | | | | | | |
To MFS Global New Discovery Fund, | | | 228,986 | | | | 955,018 | |
MFS and MFS Related Entities# | | | | | | | | | |
*This amount reflects the fees billed to MFS and MFS Related Entities for non-audit services relating directly to the operations and financial reporting of the Funds (portions of which services also related to the operations and financial reporting of other funds within the MFS Funds complex).
# This amount reflects the aggregate fees billed by Deloitte or E&Y for non-audit services rendered to the Funds and for non-audit services rendered to MFS and the MFS Related Entities.
1 The fees included under "Audit-Related Fees" are fees related to assurance and related services that are reasonably related to the performance of the audit or review of financial statements, but not reported under ''Audit Fees,'' including accounting consultations, agreed- upon procedure reports, attestation reports, comfort letters and internal control reviews.
2 The fees included under "Tax Fees" are fees associated with tax compliance, tax advice and tax planning, including services relating to the filing or amendment of federal, state or local income tax returns, regulated investment company qualification reviews and tax distribution and analysis.
3 The fees included under "All Other Fees" are fees for products and services provided by Deloitte other than those reported under "Audit Fees," "Audit-Related Fees" and "Tax Fees".
4 The fees included under "All Other Fees" are fees for products and services provided by E&Y other than those reported under "Audit Fees," "Audit-Related Fees" and "Tax Fees," including fees for services related to review of internal controls and review of Rule 38a-1 compliance program.
Item 4(e)(1):
Set forth below are the policies and procedures established by the Audit Committee of the Board of Trustees relating to the pre-approval of audit and non-audit related services:
To the extent required by applicable law, pre-approval by the Audit Committee of the Board is needed for all audit and permissible non-audit services rendered to the Fund and all permissible non-audit services rendered to MFS or MFS Related Entities if the services relate directly to the operations and financial reporting of the Registrant. Pre-approval is currently on an engagement-by-engagement basis. In the event pre- approval of such services is necessary between regular meetings of the Audit Committee and it is not practical to wait to seek pre-approval at the next regular meeting of the Audit Committee, pre-approval of such services may be referred to the Chair of the Audit Committee for approval; provided that the Chair may not pre-approve any individual engagement for such services exceeding $50,000 or multiple engagements for such services in the aggregate exceeding $100,000 in each period between regular meetings of the Audit Committee. Any engagement pre-approved by the Chair between regular meetings of the Audit Committee shall be presented for ratification by the entire Audit Committee at its next regularly scheduled meeting.
Item 4(e)(2):
None, or 0%, of the services relating to the Audit-Related Fees, Tax Fees and All Other Fees paid by the Fund and MFS and MFS Related Entities relating directly to the operations and financial reporting of the Registrant disclosed above were approved by the audit committee pursuant to paragraphs (c)(7)(i)(C) of Rule 2-01 of Regulation S-X (which permits audit committee approval after the start of the engagement with respect to services other than audit, review or attest services, if certain conditions are satisfied).
Item 4(f):
Not applicable.
Item 4(h):
The Registrant's Audit Committee has considered whether the provision by a Registrant's independent registered public accounting firm of non-audit services to MFS and MFS Related Entities that were not pre-approved by the Committee (because such services did not relate directly to the operations and financial reporting of the Registrant) was compatible with maintaining the independence of the independent registered public accounting firm as the Registrant's principal auditors.
Item 4(i):
Not applicable.
Item 4(j):
Not applicable.
ITEM 5. AUDIT COMMITTEE OF LISTED REGISTRANTS.
Not applicable to the Registrant.
ITEM 6. INVESTMENTS
A schedule of investments for each series covered by this Form N-CSR is included as part of the report to shareholders of such series under Item 1(a) of this Form N-CSR.
ITEM 7. DISCLOSURE OF PROXY VOTING POLICIES AND PROCEDURES FOR CLOSED-END MANAGEMENT INVESTMENT COMPANIES.
Not applicable to the Registrant.
ITEM 8. PORTFOLIO MANAGERS OF CLOSED-END MANAGEMENT INVESTMENT COMPANIES.
Not applicable to the Registrant.
ITEM 9. PURCHASES OF EQUITY SECURITIES BY CLOSED-END MANAGEMENT INVESTMENT COMPANY AND AFFILIATED PURCHASERS.
Not applicable to the Registrant.
ITEM 10. SUBMISSION OF MATTERS TO A VOTE OF SECURITY HOLDERS.
There were no material changes to the procedures by which shareholders may send recommendations to the Board for nominees to the Registrant's Board since the Registrant last provided disclosure as to such procedures in response to the requirements of Item 407 (c)(2)(iv) of Regulation S-K or this Item.
ITEM 11. CONTROLS AND PROCEDURES.
(a)Based upon their evaluation of the effectiveness of the registrant's disclosure controls and procedures (as defined in Rule 30a-3(c) under the Investment Company Act of 1940 (the "Act")) as conducted within 90 days of the filing date of this report on Form N-CSR, the Registrant's principal financial officer and principal executive officer have concluded that those disclosure controls and procedures provide reasonable assurance that the material information required to be disclosed by the Registrant on this report is recorded, processed, summarized and reported within the time periods specified in the Securities and Exchange Commission's rules and forms.
(b)There were no changes in the Registrant's internal controls over financial reporting (as defined in Rule 30a-3(d) under the Act) that occurred during the period covered by the report that have materially affected, or are reasonably likely to materially affect, the Registrant's internal control over financial reporting.
ITEM 12. DISCLOSURE OF SECURITIES LENDING ACTIVITIES FOR CLOSED-END MANAGEMENT INVESTMENT COMPANIES.
Not applicable to the Registrant.
ITEM 13. EXHIBITS.
(a)(1) Any code of ethics, or amendment thereto, that is the subject of the disclosure required by Item 2, to the extent that the registrant intends to satisfy the Item 2 requirements through filing of an exhibit: Attached hereto as EX-99.COE.
(2)A separate certification for each principal executive officer and principal financial officer of the registrant as required by Rule 30a-2(a) under the Act (17 CFR 270.30a-2): Attached hereto as EX-99.302CERT.
(3)Any written solicitation to purchase securities under Rule 23c-1 under the Act (17 CFR 270.23c-1) sent or given during the period covered by the report by or on behalf of the registrant to 10 or more persons. Not applicable.
(4)Change in the registrant's independent public accountant. Not applicable.
(b)If the report is filed under Section 13(a) or 15(d) of the Exchange Act, provide the certifications required by Rule 30a-2(b) under the Act (17 CFR 270.30a-2(b)), Rule 13a-14(b) or Rule 15d-14(b) under the Exchange Act (17 CFR 240.13a-14(b) or 240.15d-14(b)) and Section 1350 of Chapter 63 of Title 18 of the United States Code (18 U.S.C. 1350) as an exhibit. A certification furnished pursuant to this paragraph will not be deemed "filed" for the purposes of Section 18 of the Exchange Act (15 U.S.C. 78r), or otherwise subject to the liability of that section. Such certification will not be deemed to be incorporated by reference into any filing under the Securities Act of 1933 or the Exchange Act, except to the extent that the registrant specifically incorporates it by reference. Attached hereto as EX-99.906CERT.
Notice
A copy of the Amended and Restated Declaration of Trust, as amended, of the Registrant is on file with the Secretary of State of The Commonwealth of Massachusetts and notice is hereby given that this instrument is executed on behalf of the Registrant by an officer of the Registrant as an officer and not individually and the obligations of or arising out of this instrument are not binding upon any of the Trustees or shareholders individually, but are binding only upon the assets and property of the respective constituent series of the Registrant.
SIGNATURES
Pursuant to the requirements of the Securities Exchange Act of 1934 and the Investment Company Act of 1940, the registrant has duly caused this report to be signed on its behalf by the undersigned, thereunto duly authorized.
(Registrant) MFS SERIES TRUST IV
By (Signature and Title)*
/S/ DAVID L. DILORENZO
David L. DiLorenzo, President
Date: October 16, 2023
Pursuant to the requirements of the Securities Exchange Act of 1934 and the Investment Company Act of 1940, this report has been signed below by the following persons on behalf of the registrant and in the capacities and on the dates indicated.
By (Signature and Title)*
/S/ DAVID L. DILORENZO
David L. DiLorenzo, President (Principal Executive Officer)
Date: October 16, 2023
By (Signature and Title)*
/S/ JAMES O. YOST
James O. Yost, Treasurer (Principal Financial Officer and Accounting Officer) Date: October 16, 2023
* Print name and title of each signing officer under his or her signature.