UNITED STATES
SECURITIES AND EXCHANGE COMMISSION
Washington, D.C. 20549
FORM N-CSR
CERTIFIED SHAREHOLDER REPORT OF
REGISTERED MANAGEMENT INVESTMENT COMPANIES
Investment Company Act file number 811-02464
MFS SERIES TRUST IX
(Exact name of registrant as specified in charter)
111 Huntington Avenue, Boston, Massachusetts 02199
(Address of principal executive offices) (Zip code)
Christopher R. Bohane
Massachusetts Financial Services Company
111 Huntington Avenue
Boston, Massachusetts 02199
(Name and address of agents for service)
Registrant’s telephone number, including area code: (617) 954-5000
Date of fiscal year end: April 30*
Date of reporting period: April 30, 2018
| * | This Form N-CSR pertains to the following series of the Registrant: MFS Corporate Bond Fund, MFS Limited Maturity Fund, MFS Municipal Limited Maturity Fund, and MFS Total Return Bond Fund. The remaining series of the Registrant, MFS Inflation-Adjusted Bond Fund, has a fiscal year end of October 31. |
| ITEM 1. | REPORTS TO STOCKHOLDERS. |
Annual Report
April 30, 2018

MFS® Corporate Bond Fund

MFB-ANN
MFS® Corporate Bond Fund
CONTENTS
The report is prepared for the general information of shareholders.
It is authorized for distribution to prospective investors only when preceded or accompanied by a current prospectus.
NOT FDIC INSURED • MAY LOSE VALUE • NO BANK GUARANTEE

LETTER FROM THE EXECUTIVE CHAIRMAN
Dear Shareholders:
Rising bond yields have led to a measurable uptick in market volatility — a departure from the low-volatility environment that prevailed for much of 2017. In recent months,
against this backdrop, global markets have given back some of the strong gains recorded during 2017 and early 2018. Global economic growth remains robust, notwithstanding signs of a modest slowdown over the past few months, particularly in Europe.
Although the U.S. Federal Reserve continues to gradually raise interest rates and shrink its balance sheet, monetary policy remains accommodative around the world, with many central banks taking only tentative steps toward tighter policies. Newly enacted U.S. tax reforms have been welcomed by equity markets, while emerging market economies have benefited from a weaker U.S. dollar.
Around the world, inflation remains largely subdued, but tight labor markets and solid global demand have investors on the lookout for its potential resurgence. Increased U.S. protectionism is also a growing concern, as investors fear that trade friction could disrupt the synchronized rise in global growth.
As a global investment manager, MFS® strives to create long-term value and protect capital for clients through an active approach and an investment platform built on nearly a century of expertise. To make that long-term value meaningful for clients, we work to align with you on our beliefs, your needs and the time it takes to deliver on your desired outcomes.
Respectfully,

Robert J. Manning
Executive Chairman
MFS Investment Management
June 18, 2018
The opinions expressed in this letter are subject to change and may not be relied upon for investment advice. No forecasts can be guaranteed.
1
PORTFOLIO COMPOSITION
Portfolio structure (i)

| | | | |
| Fixed income sectors (i) | | | | |
| Investment Grade Corporates | | | 81.5% | |
| High Yield Corporates | | | 8.9% | |
| Emerging Markets Bonds | | | 3.2% | |
| U.S. Treasury Securities | | | 0.9% | |
| Mortgage-Backed Securities | | | 0.9% | |
| Floating Rate Loans | | | 0.3% | |
| Commercial Mortgage-Backed Securities (o) | | | 0.0% | |
| Asset-Backed Securities (o) | | | 0.0% | |
| Residential Mortgage-Backed Securities (o) | | | 0.0% | |
| | | | |
| Composition including fixed income credit quality (a)(i) | |
| AAA | | | 0.8% | |
| AA | | | 1.9% | |
| A | | | 27.2% | |
| BBB | | | 54.3% | |
| BB | | | 8.9% | |
| B | | | 0.8% | |
| CC (o) | | | 0.0% | |
| C (o) | | | 0.0% | |
| D (o) | | | 0.0% | |
| U.S. Government | | | 0.9% | |
| Federal Agencies | | | 0.9% | |
| Not Rated (o) | | | 0.0% | |
| Cash & Cash Equivalents | | | 4.3% | |
| |
| Portfolio facts (i) | | | | |
| Average Duration (d) | | | 6.9 | |
| Average Effective Maturity (m) | | | 10.7 yrs. | |
| (a) | For all securities other than those specifically described below, ratings are assigned to underlying securities utilizing ratings from Moody’s, Fitch, and Standard & Poor’s rating agencies and applying the following hierarchy: If all three agencies provide a rating, the middle rating (after dropping the highest and lowest ratings) is assigned; if two of the three agencies rate a security, the lower of the two is assigned. Ratings are shown in the S&P and Fitch scale (e.g., AAA). Securities rated BBB or higher are considered investment grade. All ratings are subject to change. U.S. Government includes securities issued by the U.S. Department of the Treasury. Federal Agencies includes rated and unrated U.S. Agency fixed-income securities, U.S. Agency mortgage-backed securities, and collateralized mortgage obligations of U.S. Agency mortgage-backed securities. Not Rated includes fixed income securities, including fixed income futures contracts, which have not been rated by any rating agency. The fund may or may not have held all of these instruments on this date. The fund is not rated by these agencies. |
| (d) | Duration is a measure of how much a bond’s price is likely to fluctuate with general changes in interest rates, e.g., if rates rise 1.00%, a bond with a 5-year duration is likely to lose about 5.00% of its value due to the interest rate move. |
2
Portfolio Composition – continued
| (i) | For purposes of this presentation, the components include the value of securities, and reflect the impact of the equivalent exposure of derivative positions, if any. These amounts may be negative from time to time. Equivalent exposure is a calculated amount that translates the derivative position into a reasonable approximation of the amount of the underlying asset that the portfolio would have to hold at a given point in time to have the same price sensitivity that results from the portfolio’s ownership of the derivative contract. When dealing with derivatives, equivalent exposure is a more representative measure of the potential impact of a position on portfolio performance than value. The bond component will include any accrued interest amounts. |
| (m) | In determining an instrument’s effective maturity for purposes of calculating the fund’s dollar-weighted average effective maturity, MFS uses the instrument’s stated maturity or, if applicable, an earlier date on which MFS believes it is probable that a maturity-shortening device (such as a put, pre-refunding or prepayment) will cause the instrument to be repaid. Such an earlier date can be substantially shorter than the instrument’s stated maturity. |
Where the fund holds convertible bonds, they are treated as part of the equity portion of the portfolio.
Cash & Cash Equivalents includes any cash, investments in money market funds, short-term securities, and other assets less liabilities. Please see the Statement of Assets and Liabilities for additional information related to the fund’s cash position and other assets and liabilities.
Percentages are based on net assets as of April 30, 2018.
The portfolio is actively managed and current holdings may be different.
3
MANAGEMENT REVIEW
Summary of Results
For the twelve months ended April 30, 2018, Class A shares of the MFS Corporate Bond Fund (“fund”) provided a total return of 0.08%, at net asset value. This compares with a return of 0.65% for the fund’s benchmark, the Bloomberg Barclays U.S. Credit Bond Index.
Market environment
Despite continued solid global economic growth, financial markets were buffeted by increased volatility late in the reporting period. The increase in volatility dented what appeared to have been high levels of investor confidence, leading to a correction in elevated valuations. Valuations are now more in line with long-term averages after the recent bout of market weakness. So far, the rise in volatility has not disrupted the synchronized upturn in growth, though developed markets showed signs of a modest slowdown in the expansion’s pace in early 2018.
During the period, the US Federal Reserve raised rates by 75 basis points, bringing the total number of hikes to six since the central bank began to normalize monetary policy in late 2015. The growth rate in the US, eurozone and Japan remains above potential, though inflation remains contained, particularly outside the US. In the middle of the period, the European Central Bank announced that it was extending its asset purchase program until the end of September 2018, but cut its pace of asset purchases in half as economic conditions improved. Both the Bank of England (“BOE”) and the Bank of Canada raised rates during the period, the BOE for the first time in a decade. The European political backdrop became a bit less volatile late in the period, with populist parties gaining an increased share of the vote, but thus far falling short of majorities in eurozone member states.
Bond yields rose in most developed economies during the period, but they remain low by historic standards. Credit spreads remain relatively tight, but widened modestly late in the period as market volatility increased. Increasing concern over growing global trade friction risks weighed on the strong global trade volumes seen during the period’s second half. The US announced broad-based tariffs on imports of steel and aluminum during the period, though some nations have been exempted, and later targeted China for tariffs, in retaliation for what it believes is abuse of intellectual property rights. Growing fears of wider trade skirmishes have added to volatility.
Factors Affecting Performance
Relative to the Bloomberg Barclays U.S. Credit Bond Index, the fund’s holding of cash was a key detractor during the reporting period. Additionally, not having exposure to the local authority sector, the fund’s underweight allocation to the energy sector, and overweight allocation to the electric sector, further weighed on relative returns.
Conversely, the fund’s lesser-than-benchmark exposure to “AAA”-rated(r) securities, and greater exposure to “BBB”-rated securities, contributed to relative performance. Strong security selection within the energy sector, most notably in “BBB”-rated issues, and within the technology sector, particularly in “A”-rated securities, was another positive factor that benefited relative performance.
4
Management Review – continued
Respectfully,
Portfolio Manager(s)
Richard Hawkins, Alexander Mackey, and Robert Persons
Note to Shareholders: Effective June 30, 2018, Richard Hawkins will no longer be a Portfolio Manager of the Fund.
| (r) | Bonds rated “BBB”, “Baa”, or higher are considered investment grade; bonds rated “BB”, “Ba”, or below are considered non-investment grade. The sources for bond quality ratings are Moody’s Investors Service, Standard & Poor’s and Fitch, Inc. and are applied using the following hierarchy: If all three agencies provide a rating, the middle rating (after dropping the highest and lowest ratings) is assigned; if two of the three agencies rate a security, the lower of the two is assigned. Ratings are shown in the S&P and Fitch scale (e.g., AAA). For securities which are not rated by any of the three agencies, the security is considered Not Rated. |
The views expressed in this report are those of the portfolio manager(s) only through the end of the period of the report as stated on the cover and do not necessarily reflect the views of MFS or any other person in the MFS organization. These views are subject to change at any time based on market or other conditions, and MFS disclaims any responsibility to update such views. These views may not be relied upon as investment advice or an indication of trading intent on behalf of any MFS portfolio. References to specific securities are not recommendations of such securities, and may not be representative of any MFS portfolio’s current or future investments.
5
PERFORMANCE SUMMARY THROUGH 4/30/18
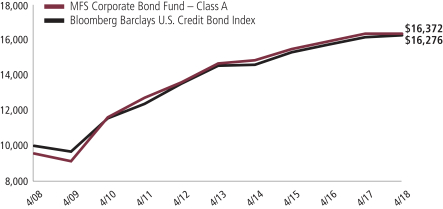
The following chart illustrates a representative class of the fund’s historical performance in comparison to its benchmark(s). Performance results include the deduction of the maximum applicable sales charge and reflect the percentage change in net asset value, including reinvestment of dividends and capital gains distributions. The performance of other share classes will be greater than or less than that of the class depicted below. Benchmarks are unmanaged and may not be invested in directly. Benchmark returns do not reflect sales charges, commissions or expenses. (See Notes to Performance Summary.)
Performance data shown represents past performance and is no guarantee of future results. Investment return and principal value fluctuate so your shares, when sold, may be worth more or less than the original cost; current performance may be lower or higher than quoted. The performance shown does not reflect the deduction of taxes, if any, that a shareholder would pay on fund distributions or the redemption of fund shares.
Growth of a Hypothetical $10,000 Investment
6
Performance Summary – continued
Total Returns through 4/30/18
Average annual without sales charge
| | | | | | | | | | | | | | |
| | | Share Class | | Class Inception Date | | 1-yr | | 5-yr | | 10-yr | | Life (t) | | |
| | | A | | 5/08/74 | | 0.08% | | 2.21% | | 5.51% | | N/A | | |
| | | B | | 9/07/93 | | (0.67)% | | 1.46% | | 4.75% | | N/A | | |
| | | C | | 1/03/94 | | (0.67)% | | 1.46% | | 4.74% | | N/A | | |
| | | I | | 1/02/97 | | 0.33% | | 2.45% | | 5.77% | | N/A | | |
| | | R1 | | 4/01/05 | | (0.67)% | | 1.46% | | 4.74% | | N/A | | |
| | | R2 | | 10/31/03 | | (0.17)% | | 1.97% | | 5.27% | | N/A | | |
| | | R3 | | 4/01/05 | | 0.08% | | 2.21% | | 5.52% | | N/A | | |
| | | R4 | | 4/01/05 | | 0.33% | | 2.48% | | 5.78% | | N/A | | |
| | | R6 | | 6/01/12 | | 0.43% | | 2.56% | | N/A | | 3.50% | | |
| Comparative benchmark(s) | | | | | | | | | | |
| | | Bloomberg Barclays U.S. Credit Bond Index (f) | | 0.65% | | 2.27% | | 4.99% | | N/A | | |
| Average annual with sales charge | | | | | | | | | | |
| | | A
With Initial Sales Charge (4.25%) | | (4.17)% | | 1.32% | | 5.05% | | N/A | | |
| | | B
With CDSC (Declining over six years from 4% to 0%) (v) | | (4.55)% | | 1.10% | | 4.75% | | N/A | | |
| | | C
With CDSC (1% for 12 months) (v) | | (1.65)% | | 1.46% | | 4.74% | | N/A | | |
CDSC – Contingent Deferred Sales Charge.
Class I, R1, R2, R3, R4, and R6 shares do not have a sales charge.
| (f) | Source: FactSet Research Systems Inc. |
| (t) | For the period from the class inception date through the stated period end (for those share classes with less than 10 years of performance history). No comparative benchmark performance information is provided for “life” periods. (See Notes to Performance Summary.) |
| (v) | Assuming redemption at the end of the applicable period. |
Benchmark Definition(s)
Bloomberg Barclays U.S. Credit Bond Index – a market capitalization-weighted index that measures the performance of publicly issued, SEC-registered, U.S. corporate and specified foreign debentures and secured notes that meet specified maturity, liquidity, and quality requirements.
It is not possible to invest directly in an index.
Notes to Performance Summary
Average annual total return represents the average annual change in value for each share class for the periods presented. Life returns are presented where the share class has less than 10 years of performance history and represent the average annual total return from the class inception date to the stated period end date. As the fund’s share classes may have different inception dates, the life returns may represent different time
7
Performance Summary – continued
periods and may not be comparable. As a result, no comparative benchmark performance information is provided for life periods.
Performance results reflect any applicable expense subsidies and waivers in effect during the periods shown. Without such subsidies and waivers the fund’s performance results would be less favorable. Please see the prospectus and financial statements for complete details.
Performance results do not include adjustments made for financial reporting purposes in accordance with U.S. generally accepted accounting principles and may differ from amounts reported in the financial highlights.
From time to time the fund may receive proceeds from litigation settlements, without which performance would be lower.
8
EXPENSE TABLE
Fund expenses borne by the shareholders during the period, November 1, 2017 through April 30, 2018
As a shareholder of the fund, you incur two types of costs: (1) transaction costs, including sales charges (loads) on certain purchase or redemption payments, and (2) ongoing costs, including management fees; distribution and service (12b-1) fees; and other fund expenses. This example is intended to help you understand your ongoing costs (in dollars) of investing in the fund and to compare these costs with the ongoing costs of investing in other mutual funds.
The example is based on an investment of $1,000 invested at the beginning of the period and held for the entire period November 1, 2017 through April 30, 2018.
Actual Expenses
The first line for each share class in the following table provides information about actual account values and actual expenses. You may use the information in this line, together with the amount you invested, to estimate the expenses that you paid over the period. Simply divide your account value by $1,000 (for example, an $8,600 account value divided by $1,000 = 8.6), then multiply the result by the number in the first line under the heading entitled “Expenses Paid During Period” to estimate the expenses you paid on your account during this period.
Hypothetical Example for Comparison Purposes
The second line for each share class in the following table provides information about hypothetical account values and hypothetical expenses based on the fund’s actual expense ratio and an assumed rate of return of 5% per year before expenses, which is not the fund’s actual return. The hypothetical account values and expenses may not be used to estimate the actual ending account balance or expenses you paid for the period. You may use this information to compare the ongoing costs of investing in the fund and other funds. To do so, compare this 5% hypothetical example with the 5% hypothetical examples that appear in the shareholder reports of the other funds.
Please note that the expenses shown in the table are meant to highlight your ongoing costs only and do not reflect any transactional costs, such as sales charges (loads). Therefore, the second line for each share class in the table is useful in comparing ongoing costs only, and will not help you determine the relative total costs of owning different funds. In addition, if these transactional costs were included, your costs would have been higher.
9
Expense Table – continued
| | | | | | | | | | | | | | | | | | |
Share
Class | | | | Annualized
Expense
Ratio | | | Beginning
Account Value
11/01/17 | | | Ending Account Value
4/30/18 | | | Expenses
Paid During
Period (p) 11/01/17-4/30/18 | |
| A | | Actual | | | 0.80% | | | | $1,000.00 | | | | $971.02 | | | | $3.91 | |
| | Hypothetical (h) | | | 0.80% | | | | $1,000.00 | | | | $1,020.83 | | | | $4.01 | |
| B | | Actual | | | 1.55% | | | | $1,000.00 | | | | $967.99 | | | | $7.56 | |
| | Hypothetical (h) | | | 1.55% | | | | $1,000.00 | | | | $1,017.11 | | | | $7.75 | |
| C | | Actual | | | 1.55% | | | | $1,000.00 | | | | $967.24 | | | | $7.56 | |
| | Hypothetical (h) | | | 1.55% | | | | $1,000.00 | | | | $1,017.11 | | | | $7.75 | |
| I | | Actual | | | 0.55% | | | | $1,000.00 | | | | $972.20 | | | | $2.69 | |
| | Hypothetical (h) | | | 0.55% | | | | $1,000.00 | | | | $1,022.07 | | | | $2.76 | |
| R1 | | Actual | | | 1.55% | | | | $1,000.00 | | | | $967.27 | | | | $7.56 | |
| | Hypothetical (h) | | | 1.55% | | | | $1,000.00 | | | | $1,017.11 | | | | $7.75 | |
| R2 | | Actual | | | 1.05% | | | | $1,000.00 | | | | $970.51 | | | | $5.13 | |
| | Hypothetical (h) | | | 1.05% | | | | $1,000.00 | | | | $1,019.59 | | | | $5.26 | |
| R3 | | Actual | | | 0.80% | | | | $1,000.00 | | | | $971.02 | | | | $3.91 | |
| | Hypothetical (h) | | | 0.80% | | | | $1,000.00 | | | | $1,020.83 | | | | $4.01 | |
| R4 | | Actual | | | 0.55% | | | | $1,000.00 | | | | $972.26 | | | | $2.69 | |
| | Hypothetical (h) | | | 0.55% | | | | $1,000.00 | | | | $1,022.07 | | | | $2.76 | |
| R6 | | Actual | | | 0.45% | | | | $1,000.00 | | | | $972.71 | | | | $2.20 | |
| | Hypothetical (h) | | | 0.45% | | | | $1,000.00 | | | | $1,022.56 | | | | $2.26 | |
| (h) | 5% class return per year before expenses. |
| (p) | “Expenses Paid During Period” are equal to each class’s annualized expense ratio, as shown above, multiplied by the average account value over the period, multiplied by 181/365 (to reflect the one-half year period). Expenses paid do not include any applicable sales charges (loads). If these transaction costs had been included, your costs would have been higher. |
10
PORTFOLIO OF INVESTMENTS
4/30/18
The Portfolio of Investments is a complete list of all securities owned by your fund. It is categorized by broad-based asset classes.
| | | | | | | | |
| Bonds - 94.4% | | | | | | | | |
| Issuer | | Shares/Par | | | Value ($) | |
| Aerospace - 1.5% | | | | | | | | |
| Huntington Ingalls Industries, Inc., 3.483%, 12/01/2027 (n) | | $ | 11,950,000 | | | $ | 11,307,568 | |
| Lockheed Martin Corp., 3.55%, 1/15/2026 | | | 9,857,000 | | | | 9,714,446 | |
| Northrop Grumman Corp., 2.55%, 10/15/2022 | | | 31,622,000 | | | | 30,469,983 | |
| Northrop Grumman Corp., 2.93%, 1/15/2025 | | | 27,106,000 | | | | 25,697,213 | |
| | | | | | | | |
| | | | | | | $ | 77,189,210 | |
| Apparel Manufacturers - 0.5% | | | | | | | | |
| Coach, Inc., 4.125%, 7/15/2027 | | $ | 24,765,000 | | | $ | 23,920,586 | |
| | |
| Asset-Backed & Securitized - 0.1% | | | | | | | | |
| Bayview Financial Revolving Mortgage Loan Trust, FLR, 3.501% (LIBOR-1mo. + 1.6%), 12/28/2040 (z) | | $ | 1,067,321 | | | $ | 968,352 | |
| BlackRock Capital Finance LP, 7.75%, 9/25/2026 (z) | | | 26,166 | | | | 1,761 | |
| Greenwich Capital Commercial Funding Corp., 5.752%, 7/10/2038 | | | 729,090 | | | | 729,104 | |
| JPMorgan Chase Commercial Mortgage Securities Corp., 5.785%, 7/15/2042 (n)(q) | | | 1,228,543 | | | | 847,537 | |
| Lehman Brothers Commercial Conduit Mortgage Trust, 1.121%, 2/18/2030 (i) | | | 200,462 | | | | 5 | |
| Morgan Stanley Capital I, Inc., 1.299%, 11/15/2030 (i)(n) | | | 1,673,588 | | | | 48 | |
| | | | | | | | |
| | | | | | | $ | 2,546,807 | |
| Automotive - 4.2% | | | | | | | | |
| Daimler Finance North America LLC, 3.35%, 5/04/2021 (z) | | $ | 39,657,000 | | | $ | 39,610,998 | |
| Ford Motor Credit Co. LLC, 3.47%, 4/05/2021 | | | 10,753,000 | | | | 10,706,676 | |
| General Motors Co., 6.6%, 4/01/2036 | | | 1,500,000 | | | | 1,680,429 | |
| General Motors Co., 5.15%, 4/01/2038 | | | 10,480,000 | | | | 10,066,954 | |
| General Motors Co., 6.25%, 10/02/2043 | | | 10,919,000 | | | | 11,661,988 | |
| General Motors Financial Co., Inc., 2.35%, 10/04/2019 | | | 32,777,000 | | | | 32,433,672 | |
| General Motors Financial Co., Inc., 3.45%, 4/10/2022 | | | 11,528,000 | | | | 11,371,417 | |
| General Motors Financial Co., Inc., 4%, 10/06/2026 | | | 10,385,000 | | | | 9,936,238 | |
| General Motors Financial Co., Inc., 4.35%, 1/17/2027 | | | 6,485,000 | | | | 6,308,084 | |
| Lear Corp., 5.25%, 1/15/2025 | | | 17,224,000 | | | | 18,138,030 | |
| Lear Corp., 3.8%, 9/15/2027 | | | 36,241,000 | | | | 34,506,734 | |
| ZF North America Capital, Inc., 4.75%, 4/29/2025 (n) | | | 22,571,000 | | | | 22,994,206 | |
| | | | | | | | |
| | | | | | | $ | 209,415,426 | |
| Broadcasting - 0.9% | | | | | | | | |
| Netflix, Inc., 4.875%, 4/15/2028 (n) | | $ | 27,000,000 | | | $ | 25,481,250 | |
| Time Warner, Inc., 3.8%, 2/15/2027 | | | 14,214,000 | | | | 13,754,442 | |
11
Portfolio of Investments – continued
| | | | | | | | |
| Issuer | | Shares/Par | | | Value ($) | |
| Bonds - continued | | | | | | | | |
| Broadcasting - continued | | | | | | | | |
| Time Warner, Inc., 5.35%, 12/15/2043 | | $ | 6,056,000 | | | $ | 6,318,728 | |
| | | | | | | | |
| | | | | | | $ | 45,554,420 | |
| Brokerage & Asset Managers - 1.9% | | | | | | | | |
| CME Group, Inc., 3%, 3/15/2025 | | $ | 10,133,000 | | | $ | 9,780,392 | |
| E*TRADE Financial Corp., 2.95%, 8/24/2022 | | | 15,023,000 | | | | 14,557,368 | |
| Intercontinental Exchange, Inc., 2.75%, 12/01/2020 | | | 6,672,000 | | | | 6,609,136 | |
| Intercontinental Exchange, Inc., 2.35%, 9/15/2022 | | | 21,865,000 | | | | 20,856,214 | |
| Intercontinental Exchange, Inc., 4%, 10/15/2023 | | | 16,230,000 | | | | 16,558,804 | |
| Intercontinental Exchange, Inc., 3.75%, 12/01/2025 | | | 10,952,000 | | | | 10,968,614 | |
| TD Ameritrade Holding Corp., 3.3%, 4/01/2027 | | | 16,712,000 | | | | 16,138,642 | |
| | | | | | | | |
| | | | | | | $ | 95,469,170 | |
| Building - 3.1% | | | | | | | | |
| CRH America Finance, Inc., 4.5%, 4/04/2048 (n) | | $ | 18,362,000 | | | $ | 17,639,588 | |
| Martin Marietta Materials, Inc., 4.25%, 7/02/2024 | | | 7,431,000 | | | | 7,571,449 | |
| Martin Marietta Materials, Inc., 3.45%, 6/01/2027 | | | 8,095,000 | | | | 7,625,499 | |
| Martin Marietta Materials, Inc., 3.5%, 12/15/2027 | | | 14,186,000 | | | | 13,306,695 | |
| Masco Corp., 4.45%, 4/01/2025 | | | 5,390,000 | | | | 5,447,134 | |
| Masco Corp., 4.375%, 4/01/2026 | | | 13,202,000 | | | | 13,284,512 | |
| Masco Corp., 4.5%, 5/15/2047 | | | 14,265,000 | | | | 13,133,802 | |
| Owens Corning, 4.2%, 12/15/2022 | | | 4,120,000 | | | | 4,190,946 | |
| Owens Corning, 3.4%, 8/15/2026 | | | 10,397,000 | | | | 9,753,634 | |
| Owens Corning, 4.4%, 1/30/2048 | | | 14,463,000 | | | | 12,905,697 | |
| Standard Industries, Inc., 4.75%, 1/15/2028 (n) | | | 28,645,000 | | | | 26,711,462 | |
| Vulcan Materials Co. , 4.5%, 6/15/2047 | | | 23,394,000 | | | | 21,683,396 | |
| | | | | | | | |
| | | | | | | $ | 153,253,814 | |
| Business Services - 2.0% | | | | | | | | |
| Cisco Systems, Inc., 2.2%, 2/28/2021 | | $ | 14,891,000 | | | $ | 14,624,270 | |
| Equinix, Inc., 5.75%, 1/01/2025 | | | 15,055,000 | | | | 15,619,563 | |
| Equinix, Inc., 5.375%, 5/15/2027 | | | 4,197,000 | | | | 4,270,448 | |
| Fidelity National Information Services, Inc., 3.5%, 4/15/2023 | | | 2,389,000 | | | | 2,368,757 | |
| Fidelity National Information Services, Inc., 5%, 10/15/2025 | | | 2,588,000 | | | | 2,732,605 | |
| Fidelity National Information Services, Inc., 3%, 8/15/2026 | | | 13,572,000 | | | | 12,458,212 | |
| Fidelity National Information Services, Inc., 4.5%, 8/15/2046 | | | 6,787,000 | | | | 6,619,410 | |
| Fiserv, Inc., 2.7%, 6/01/2020 | | | 8,911,000 | | | | 8,835,265 | |
| MSCI, Inc., 5.75%, 8/15/2025 (n) | | | 15,656,000 | | | | 16,355,823 | |
| MSCI, Inc., 4.75%, 8/01/2026 (n) | | | 5,205,000 | | | | 5,157,374 | |
| Tencent Holdings Ltd., 2.985%, 1/19/2023 (n) | | | 12,855,000 | | | | 12,446,096 | |
| | | | | | | | |
| | | | | | | $ | 101,487,823 | |
12
Portfolio of Investments – continued
| | | | | | | | |
| Issuer | | Shares/Par | | | Value ($) | |
| Bonds - continued | | | | | | | | |
| Cable TV - 2.8% | | | | | | | | |
| Charter Communications Operating LLC, 6.384%, 10/23/2035 | | $ | 31,910,000 | | | $ | 34,813,887 | |
| Charter Communications Operating LLC, 5.375%, 5/01/2047 | | | 4,512,000 | | | | 4,247,292 | |
| Cox Communications, Inc., 3.5%, 8/15/2027 (n) | | | 13,693,000 | | �� | | 12,873,423 | |
| Cox Communications, Inc., 4.6%, 8/15/2047 (n) | | | 5,670,000 | | | | 5,335,390 | |
| NBCUniversal Enterprise, Inc., 1.974%, 4/15/2019 (n) | | | 2,215,000 | | | | 2,199,094 | |
| Sirius XM Radio, Inc., 5.375%, 4/15/2025 (n) | | | 1,635,000 | | | | 1,626,825 | |
| Sirius XM Radio, Inc., 5.375%, 7/15/2026 (n) | | | 19,940,000 | | | | 19,591,050 | |
| Sirius XM Radio, Inc., 5%, 8/01/2027 (n) | | | 26,833,000 | | | | 25,558,432 | |
| Time Warner Cable, Inc., 8.25%, 4/01/2019 | | | 6,150,000 | | | | 6,443,894 | |
| Time Warner Cable, Inc., 5%, 2/01/2020 | | | 1,480,000 | | | | 1,518,559 | |
| Time Warner Cable, Inc., 4.5%, 9/15/2042 | | | 9,034,000 | | | | 7,656,874 | |
| Time Warner Entertainment Co. LP, 8.375%, 7/15/2033 | | | 1,734,000 | | | | 2,245,834 | |
| Videotron Ltd., 5%, 7/15/2022 | | | 13,220,000 | | | | 13,500,925 | |
| | | | | | | | |
| | | | | | | $ | 137,611,479 | |
| Chemicals - 1.2% | | | | | | | | |
| Air Liquide Finance Co., 2.25%, 9/27/2023 (n) | | $ | 13,552,000 | | | $ | 12,681,731 | |
| Braskem Netherlands Finance BV, 3.5%, 1/10/2023 (n) | | | 22,940,000 | | | | 21,678,530 | |
| LyondellBasell Industries N.V., 5%, 4/15/2019 | | | 2,378,000 | | | | 2,412,337 | |
| LyondellBasell Industries N.V., 6%, 11/15/2021 | | | 9,720,000 | | | | 10,449,412 | |
| Sherwin-Williams Co., 4.5%, 6/01/2047 | | | 13,884,000 | | | | 13,602,783 | |
| | | | | | | | |
| | | | | | | $ | 60,824,793 | |
| Computer Software - 1.8% | | | | | | | | |
| Microsoft Corp., 3.45%, 8/08/2036 | | $ | 25,000,000 | | | $ | 23,887,588 | |
| Microsoft Corp., 4.1%, 2/06/2037 | | | 13,500,000 | | | | 14,017,354 | |
| Oracle Corp., 3.4%, 7/08/2024 | | | 9,697,000 | | | | 9,622,472 | |
| Oracle Corp., 3.8%, 11/15/2037 | | | 38,015,000 | | | | 36,800,477 | |
| VeriSign, Inc., 4.625%, 5/01/2023 | | | 7,628,000 | | | | 7,647,070 | |
| | | | | | | | |
| | | | | | | $ | 91,974,961 | |
| Computer Software - Systems - 1.2% | | | | | | | | |
| Apple, Inc., 3.2%, 5/11/2027 | | $ | 33,231,000 | | | $ | 32,079,707 | |
| Apple, Inc., 4.5%, 2/23/2036 | | | 10,000,000 | | | | 10,707,782 | |
| Apple, Inc., 4.375%, 5/13/2045 | | | 3,713,000 | | | | 3,844,448 | |
| Apple, Inc., 3.85%, 8/04/2046 | | | 8,346,000 | | | | 7,912,525 | |
| Apple, Inc., 4.25%, 2/09/2047 | | | 4,778,000 | | | | 4,856,498 | |
| | | | | | | | |
| | | | | | | $ | 59,400,960 | |
| Conglomerates - 0.5% | | | | | | | | |
| Roper Technologies, Inc., 3%, 12/15/2020 | | $ | 24,787,000 | | | $ | 24,643,165 | |
| | |
| Consumer Products - 0.3% | | | | | | | | |
| Reckitt Benckiser Treasury Services PLC, 3%, 6/26/2027 (n) | | $ | 18,079,000 | | | $ | 16,723,079 | |
13
Portfolio of Investments – continued
| | | | | | | | |
| Issuer | | Shares/Par | | | Value ($) | |
| Bonds - continued | | | | | | | | |
| Consumer Services - 2.5% | | | | | | | | |
| Alibaba Group Holding Ltd., 4%, 12/06/2037 | | $ | 10,629,000 | | | $ | 10,010,797 | |
| Alibaba Group Holding Ltd., 4.2%, 12/06/2047 | | | 18,955,000 | | | | 17,837,535 | |
| IHS Markit Ltd., 4%, 3/01/2026 (n) | | | 6,085,000 | | | | 5,828,396 | |
| Priceline Group, Inc., 3.65%, 3/15/2025 | | | 17,059,000 | | | | 16,706,046 | |
| Priceline Group, Inc., 3.6%, 6/01/2026 | | | 20,768,000 | | | | 20,131,892 | |
| Priceline Group, Inc., 3.55%, 3/15/2028 | | | 10,204,000 | | | | 9,708,106 | |
| Service Corp. International, 5.375%, 1/15/2022 | | | 1,705,000 | | | | 1,735,690 | |
| Service Corp. International, 5.375%, 5/15/2024 | | | 18,149,000 | | | | 18,652,635 | |
| Visa, Inc., 4.15%, 12/14/2035 | | | 14,578,000 | | | | 15,171,192 | |
| Visa, Inc., 3.65%, 9/15/2047 | | | 11,718,000 | | | | 11,040,842 | |
| | | | | | | | |
| | | | | | | $ | 126,823,131 | |
| Containers - 1.1% | | | | | | | | |
| Ball Corp., 5%, 3/15/2022 | | $ | 5,370,000 | | | $ | 5,564,662 | |
| Ball Corp., 4%, 11/15/2023 | | | 6,003,000 | | | | 5,882,940 | |
| Ball Corp., 5.25%, 7/01/2025 | | | 10,370,000 | | | | 10,681,100 | |
| Berry Global, Inc., 4.5%, 2/15/2026 (n) | | | 12,925,000 | | | | 12,343,375 | |
| Sealed Air Corp., 5.5%, 9/15/2025 (n) | | | 20,780,000 | | | | 21,481,325 | |
| | | | | | | | |
| | | | | | | $ | 55,953,402 | |
| Electrical Equipment - 0.8% | | | | | | | | |
| Arrow Electronics, Inc., 3.5%, 4/01/2022 | | $ | 4,412,000 | | | $ | 4,334,523 | |
| Arrow Electronics, Inc., 3.25%, 9/08/2024 | | | 18,437,000 | | | | 17,334,425 | |
| Arrow Electronics, Inc., 3.875%, 1/12/2028 | | | 19,987,000 | | | | 18,817,922 | |
| | | | | | | | |
| | | | | | | $ | 40,486,870 | |
| Electronics - 2.3% | | | | | | | | |
| Broadcom Corp./Broadcom Cayman Finance Ltd., 3.875%, 1/15/2027 | | $ | 45,163,000 | | | $ | 43,121,185 | |
| Flextronics International Ltd., 4.625%, 2/15/2020 | | | 16,917,000 | | | | 17,241,983 | |
| Flextronics International Ltd., 4.75%, 6/15/2025 | | | 6,626,000 | | | | 6,811,224 | |
| Intel Corp., 3.15%, 5/11/2027 | | | 4,138,000 | | | | 3,990,786 | |
| Intel Corp., 4.1%, 5/11/2047 | | | 22,234,000 | | | | 22,254,541 | |
| NXP B.V./NXP Funding LLC, 4.125%, 6/15/2020 (n) | | | 7,329,000 | | | | 7,365,645 | |
| Tyco Electronics Group S.A., 2.375%, 12/17/2018 | | | 1,303,000 | | | | 1,301,936 | |
| Tyco Electronics Group S.A., 3.5%, 2/03/2022 | | | 11,088,000 | | | | 11,154,353 | |
| | | | | | | | |
| | | | | | | $ | 113,241,653 | |
| Emerging Market Quasi-Sovereign - 1.1% | | | | | | | | |
| Petrobras Global Finance B.V., 5.75%, 2/01/2029 | | $ | 26,947,000 | | | $ | 25,572,703 | |
| Petroleos Mexicanos, 6.5%, 3/13/2027 | | | 4,816,000 | | | | 4,987,498 | |
| State Grid Overseas Investment (2016) Ltd., 2.75%, 5/04/2022 (n) | | | 26,102,000 | | | | 25,265,622 | |
| | | | | | | | |
| | | | | | | $ | 55,825,823 | |
14
Portfolio of Investments – continued
| | | | | | | | |
| Issuer | | Shares/Par | | | Value ($) | |
| Bonds - continued | | | | | | | | |
| Emerging Market Sovereign - 0.3% | | | | | | | | |
| Republic of South Africa, 5.65%, 9/27/2047 | | $ | 13,331,000 | | | $ | 12,773,764 | |
| | |
| Energy - Independent - 0.0% | | | | | | | | |
| Diamondback Energy, Inc., 5.375%, 5/31/2025 (n) | | $ | 1,830,000 | | | $ | 1,855,163 | |
| | |
| Energy - Integrated - 0.3% | | | | | | | | |
| Shell International Finance B.V., 3.75%, 9/12/2046 | | $ | 16,673,000 | | | $ | 15,776,204 | |
| | |
| Entertainment - 0.4% | | | | | | | | |
| Royal Caribbean Cruises Ltd., 3.7%, 3/15/2028 | | $ | 22,622,000 | | | $ | 21,339,689 | |
| | |
| Financial Institutions - 1.3% | | | | | | | | |
| AerCap Ireland Capital Ltd., 4.625%, 10/30/2020 | | $ | 2,323,000 | | | $ | 2,382,774 | |
| AerCap Ireland Capital Ltd., 3.65%, 7/21/2027 | | | 24,414,000 | | | | 22,630,244 | |
| Aircastle Ltd., 4.125%, 5/01/2024 | | | 18,898,000 | | | | 18,520,040 | |
| International Lease Finance Corp., 7.125%, 9/01/2018 (n) | | | 3,221,000 | | | | 3,264,197 | |
| International Lease Finance Corp., 5.875%, 8/15/2022 | | | 15,000,000 | | | | 16,034,399 | |
| | | | | | | | |
| | | | | | | $ | 62,831,654 | |
| Food & Beverages - 4.8% | | | | | | | | |
| Anheuser Busch InBev Worldwide, Inc., 3.75%, 1/15/2022 | | $ | 48,069,000 | | | $ | 48,872,666 | |
| Anheuser-Busch InBev Worldwide, Inc., 4.7%, 2/01/2036 | | | 30,325,000 | | | | 31,235,997 | |
| Anheuser-Busch InBev Worldwide, Inc., 4.375%, 4/15/2038 | | | 10,822,000 | | | | 10,694,338 | |
| Aramark Services, Inc., 5%, 2/01/2028 (n) | | | 3,345,000 | | | | 3,257,194 | |
| Constellation Brands, Inc., 3.2%, 2/15/2023 | | | 17,602,000 | | | | 17,228,795 | |
| Constellation Brands, Inc., 4.25%, 5/01/2023 | | | 39,599,000 | | | | 40,391,880 | |
| Danone S.A., 2.077%, 11/02/2021 (n) | | | 11,063,000 | | | | 10,592,839 | |
| Danone S.A., 2.589%, 11/02/2023 (n) | | | 25,885,000 | | | | 24,432,985 | |
| Kraft Heinz Foods Co., 3.5%, 7/15/2022 | | | 7,915,000 | | | | 7,851,549 | |
| Kraft Heinz Foods Co., 3%, 6/01/2026 | | | 6,972,000 | | | | 6,329,382 | |
| Kraft Heinz Foods Co., 5%, 7/15/2035 | | | 2,799,000 | | | | 2,837,154 | |
| Kraft Heinz Foods Co., 6.5%, 2/09/2040 | | | 12,504,000 | | | | 14,556,612 | |
| Tyson Foods, Inc., 4.5%, 6/15/2022 | | | 8,026,000 | | | | 8,304,005 | |
| Tyson Foods, Inc., 5.15%, 8/15/2044 | | | 3,239,000 | | | | 3,431,436 | |
| Wm. Wrigley Jr. Co., 2.9%, 10/21/2019 (n) | | | 4,831,000 | | | | 4,835,573 | |
| Wm. Wrigley Jr. Co., 3.375%, 10/21/2020 (n) | | | 2,809,000 | | | | 2,824,595 | |
| | | | | | | | |
| | | | | | | $ | 237,677,000 | |
| Forest & Paper Products - 0.4% | | | | | | | | |
| Georgia-Pacific LLC, 5.4%, 11/01/2020 (n) | | $ | 13,758,000 | | | $ | 14,482,697 | |
| International Paper Co., 6%, 11/15/2041 | | | 5,640,000 | | | | 6,329,572 | |
| | | | | | | | |
| | | | | | | $ | 20,812,269 | |
15
Portfolio of Investments – continued
| | | | | | | | |
| Issuer | | Shares/Par | | | Value ($) | |
| Bonds - continued | | | | | | | | |
| Gaming & Lodging - 0.9% | | | | | | | | |
| Hilton Domestic Operating Co., Inc., 5.125%, 5/01/2026 (n) | | $ | 8,944,000 | | | $ | 8,944,000 | |
| Marriott International, Inc., 4%, 4/15/2028 | | | 35,912,000 | | | | 35,150,391 | |
| | | | | | | | |
| | | | | | | $ | 44,094,391 | |
| Insurance - 0.5% | | | | | | | | |
| American International Group, Inc., 3.875%, 1/15/2035 | | $ | 6,000,000 | | | $ | 5,512,482 | |
| American International Group, Inc., 4.7%, 7/10/2035 | | | 9,821,000 | | | | 9,857,203 | |
| American International Group, Inc., 4.5%, 7/16/2044 | | | 12,351,000 | | | | 11,867,078 | |
| | | | | | | | |
| | | | | | | $ | 27,236,763 | |
| Insurance - Health - 1.2% | | | | | | | | |
| Aetna, Inc., 2.8%, 6/15/2023 | | $ | 11,637,000 | | | $ | 11,109,957 | |
| UnitedHealth Group, Inc., 2.7%, 7/15/2020 | | | 27,646,000 | | | | 27,523,050 | |
| UnitedHealth Group, Inc., 4.625%, 7/15/2035 | | | 20,120,000 | | | | 21,505,453 | |
| | | | | | | | |
| | | | | | | $ | 60,138,460 | |
| Insurance - Property & Casualty - 1.3% | | | | | | | | |
| Berkshire Hathaway, Inc., 2.75%, 3/15/2023 | | $ | 8,920,000 | | | $ | 8,693,696 | |
| Chubb INA Holdings, Inc., 2.3%, 11/03/2020 | | | 3,464,000 | | | | 3,401,190 | |
| Chubb INA Holdings, Inc., 2.875%, 11/03/2022 | | | 8,035,000 | | | | 7,879,114 | |
| CNA Financial Corp., 5.875%, 8/15/2020 | | | 6,010,000 | | | | 6,348,962 | |
| Liberty Mutual Group, Inc., 4.85%, 8/01/2044 (n) | | | 11,230,000 | | | | 11,484,910 | |
| Marsh & McLennan Cos., Inc., 2.55%, 10/15/2018 | | | 4,402,000 | | | | 4,400,752 | |
| Marsh & McLennan Cos., Inc., 4.8%, 7/15/2021 | | | 8,500,000 | | | | 8,845,751 | |
| Marsh & McLennan Cos., Inc., 3.5%, 6/03/2024 | | | 6,766,000 | | | | 6,675,763 | |
| Marsh & McLennan Cos., Inc., 4.35%, 1/30/2047 | | | 6,467,000 | | | | 6,476,973 | |
| Swiss Re Ltd., 4.25%, 12/06/2042 (n) | | | 1,842,000 | | | | 1,833,628 | |
| | | | | | | | |
| | | | | | | $ | 66,040,739 | |
| Internet - 0.3% | | | | | | | | |
| Baidu, Inc., 4.375%, 3/29/2028 | | $ | 16,223,000 | | | $ | 16,133,676 | |
| | |
| Machinery & Tools - 0.3% | | | | | | | | |
| CNH Industrial Capital LLC, 3.85%, 11/15/2027 | | $ | 16,974,000 | | | $ | 16,237,257 | |
| | |
| Major Banks - 16.5% | | | | | | | | |
| Bank of America Corp., 1.75%, 6/05/2018 | | $ | 4,800,000 | | | $ | 4,797,936 | |
| Bank of America Corp., 2.738% to 1/23/2021, FLR to 1/23/2022 | | | 47,281,000 | | | | 46,503,060 | |
| Bank of America Corp., 3.124% to 1/20/2022, FLR to 1/20/2023 | | | 17,201,000 | | | | 16,932,032 | |
Bank of America Corp., 3.004% to 12/20/2022, FLR to 12/20/2023 (n) | | | 1,782,000 | | | | 1,729,305 | |
| Bank of America Corp., 4.125%, 1/22/2024 | | | 16,866,000 | | | | 17,264,529 | |
| Bank of America Corp., 4.45%, 3/03/2026 | | | 23,347,000 | | | | 23,466,981 | |
| Bank of America Corp., 3.5%, 4/19/2026 | | | 19,080,000 | | | | 18,424,994 | |
16
Portfolio of Investments – continued
| | | | | | | | |
| Issuer | | Shares/Par | | | Value ($) | |
| Bonds - continued | | | | | | | | |
| Major Banks - continued | | | | | | | | |
| Bank of America Corp., 4.183%, 11/25/2027 | | $ | 25,000,000 | | | $ | 24,288,722 | |
| Bank of America Corp., 3.419% to 12/20/2027, FLR to 12/20/2028 (n) | | | 24,646,000 | | | | 23,144,088 | |
| Bank of America Corp., 6.1% to 3/17/2025, FLR to 12/29/2049 | | | 18,007,000 | | | | 18,659,754 | |
| Bank of America Corp., 5.875% to 3/15/2028, FLR to 12/31/2059 | | | 22,420,000 | | | | 22,375,160 | |
| Bank of New York Mellon Corp., 2.95%, 1/29/2023 | | | 52,612,000 | | | | 51,566,465 | |
| Bank of New York Mellon Corp., 3.442% to 2/07/2027, FLR to 2/07/2028 | | | 23,523,000 | | | | 22,741,640 | |
| Credit Suisse Group AG, 3.869%, 1/12/2029 (n) | | | 12,949,000 | | | | 12,300,232 | |
| Goldman Sachs Group, Inc., 2.625%, 4/25/2021 | | | 11,876,000 | | | | 11,638,955 | |
| Goldman Sachs Group, Inc., 3.85%, 1/26/2027 | | | 25,624,000 | | | | 24,740,517 | |
| Goldman Sachs Group, Inc., 4.017% to 10/31/2037, FLR to 10/31/2038 | | | 4,745,000 | | | | 4,404,554 | |
| Goldman Sachs Group, Inc., 4.8%, 7/08/2044 | | | 7,916,000 | | | | 8,119,388 | |
| Goldman Sachs Group, Inc., 5.15%, 5/22/2045 | | | 3,670,000 | | | | 3,816,191 | |
| HSBC Holdings PLC, 3.4%, 3/08/2021 | | | 15,677,000 | | | | 15,719,266 | |
| HSBC Holdings PLC, 2.65%, 1/05/2022 | | | 4,800,000 | | | | 4,658,745 | |
| HSBC Holdings PLC, 4.375%, 11/23/2026 | | | 12,488,000 | | | | 12,380,414 | |
| HSBC Holdings PLC, 6% to 5/22/2027, FLR to 11/22/2065 | | | 9,768,000 | | | | 9,647,854 | |
| JPMorgan Chase & Co., 4.25%, 10/15/2020 | | | 6,107,000 | | | | 6,266,186 | |
| JPMorgan Chase & Co., 2.295%, 8/15/2021 | | | 15,000,000 | | | | 14,577,319 | |
| JPMorgan Chase & Co., 4.5%, 1/24/2022 | | | 26,589,000 | | | | 27,584,473 | |
| JPMorgan Chase & Co., 3.25%, 9/23/2022 | | | 30,989,000 | | | | 30,677,141 | |
| JPMorgan Chase & Co., 3.2%, 6/15/2026 | | | 9,000,000 | | | | 8,520,359 | |
| JPMorgan Chase & Co., 3.782% to 2/01/2027, FLR to 2/01/2028 | | | 35,000,000 | | | | 33,968,470 | |
| JPMorgan Chase & Co., 3.54% to 5/01/2027, FLR to 5/01/2028 | | | 18,887,000 | | | | 18,023,388 | |
| JPMorgan Chase & Co., 3.964% to 11/15/2047, FLR to 11/15/2048 | | | 12,400,000 | | | | 11,334,224 | |
| JPMorgan Chase & Co., 3.897% to 1/23/2048, FLR to 1/23/2049 | | | 22,011,000 | | | | 19,856,395 | |
| JPMorgan Chase & Co., 6.75% to 2/01/2024, FLR to 1/29/2049 | | | 15,247,000 | | | | 16,523,936 | |
| Morgan Stanley, 2.5%, 4/21/2021 | | | 7,620,000 | | | | 7,446,215 | |
| Morgan Stanley, 5.5%, 7/28/2021 | | | 5,652,000 | | | | 6,006,495 | |
| Morgan Stanley, 2.625%, 11/17/2021 | | | 32,200,000 | | | | 31,353,728 | |
| Morgan Stanley, 3.125%, 1/23/2023 | | | 35,579,000 | | | | 34,770,026 | |
| Morgan Stanley, 3.95%, 4/23/2027 | | | 18,795,000 | | | | 18,060,492 | |
| Morgan Stanley, 3.591% to 7/22/2027, FLR to 7/22/2028 | | | 35,000,000 | | | | 33,274,745 | |
| Morgan Stanley, 3.971% to 7/22/2037, FLR to 7/22/2038 | | | 11,335,000 | | | | 10,605,449 | |
| PNC Bank N.A., 2.6%, 7/21/2020 | | | 20,034,000 | | | | 19,823,053 | |
| Sumitomo Mitsui Financial Group, Inc., 3.102%, 1/17/2023 | | | 35,791,000 | | | | 34,907,926 | |
| UBS Group Funding (Switzerland) AG, 4.253%, 3/23/2028 (n) | | | 26,795,000 | | | | 26,633,786 | |
| Wachovia Corp., 6.605%, 10/01/2025 | | | 7,936,000 | | | | 9,014,138 | |
| Wells Fargo & Co., 4.1%, 6/03/2026 | | | 6,180,000 | | | | 6,045,461 | |
| | | | | | | | |
| | | | | | | $ | 824,594,187 | |
17
Portfolio of Investments – continued
| | | | | | | | |
| Issuer | | Shares/Par | | | Value ($) | |
| Bonds - continued | | | | | | | | |
| Medical & Health Technology & Services - 3.4% | | | | | | | | |
| Becton, Dickinson and Co., 3.734%, 12/15/2024 | | $ | 1,460,000 | | | $ | 1,423,768 | |
| Becton, Dickinson and Co., 4.685%, 12/15/2044 | | | 9,974,000 | | | | 9,805,218 | |
| Becton, Dickinson and Co., 4.669%, 6/06/2047 | | | 26,561,000 | | | | 25,924,589 | |
| CVS Health Corp., 3.7%, 3/09/2023 | | | 26,580,000 | | | | 26,436,159 | |
| CVS Health Corp., 5.05%, 3/25/2048 | | | 10,200,000 | | | | 10,362,145 | |
| HCA, Inc., 4.75%, 5/01/2023 | | | 9,090,000 | | | | 9,157,357 | |
| HCA, Inc., 5.25%, 6/15/2026 | | | 10,033,000 | | | | 10,083,165 | |
| Laboratory Corp. of America Holdings, 3.25%, 9/01/2024 | | | 16,049,000 | | | | 15,466,032 | |
| Laboratory Corp. of America Holdings, 3.6%, 2/01/2025 | | | 4,792,000 | | | | 4,670,070 | |
| Laboratory Corp. of America Holdings, 4.7%, 2/01/2045 | | | 8,278,000 | | | | 8,035,691 | |
| Thermo Fisher Scientific, Inc., 3.15%, 1/15/2023 | | | 1,177,000 | | | | 1,148,931 | |
| Thermo Fisher Scientific, Inc., 3%, 4/15/2023 | | | 9,452,000 | | | | 9,157,445 | |
| Thermo Fisher Scientific, Inc., 2.95%, 9/19/2026 | | | 14,540,000 | | | | 13,466,795 | |
| Thermo Fisher Scientific, Inc., 4.1%, 8/15/2047 | | | 27,051,000 | | | | 25,784,265 | |
| | | | | | | | |
| | | | | | | $ | 170,921,630 | |
| Medical Equipment - 2.7% | | | | | | | | |
| Abbott Laboratories, 2.9%, 11/30/2021 | | $ | 30,627,000 | | | $ | 30,200,729 | |
| Abbott Laboratories, 4.75%, 11/30/2036 | | | 21,877,000 | | | | 23,163,765 | |
| Medtronic, Inc., 3.5%, 3/15/2025 | | | 32,749,000 | | | | 32,424,604 | |
| Medtronic, Inc., 4.375%, 3/15/2035 | | | 3,458,000 | | | | 3,584,728 | |
| Teleflex, Inc., 4.625%, 11/15/2027 | | | 2,045,000 | | | | 1,952,975 | |
| Zimmer Biomet Holdings, Inc., 3.55%, 4/01/2025 | | | 28,500,000 | | | | 27,452,722 | |
| Zimmer Biomet Holdings, Inc., FLR, 2.927% (LIBOR-3mo. + 0.75%), 3/19/2021 | | | 15,874,000 | | | | 15,900,754 | |
| | | | | | | | |
| | | | | | | $ | 134,680,277 | |
| Metals & Mining - 1.9% | | | | | | | | |
| Barrick Gold Corp., 3.85%, 4/01/2022 | | $ | 3,225,000 | | | $ | 3,267,716 | |
| Barrick North America Finance LLC, 4.4%, 5/30/2021 | | | 1,007,000 | | | | 1,040,419 | |
| Glencore Funding LLC, 3%, 10/27/2022 (n) | | | 2,911,000 | | | | 2,783,714 | |
| Glencore Funding LLC, 4.125%, 5/30/2023 (n) | | | 11,974,000 | | | | 11,929,696 | |
| Glencore Funding LLC, 4%, 4/16/2025 (n) | | | 7,423,000 | | | | 7,224,798 | |
| Glencore Funding LLC, 4%, 3/27/2027 (n) | | | 21,861,000 | | | | 20,838,979 | |
| Glencore Funding LLC, 3.875%, 10/27/2027 (n) | | | 10,188,000 | | | | 9,575,497 | |
| Kinross Gold Corp., 5.95%, 3/15/2024 | | | 2,838,000 | | | | 2,958,615 | |
| Kinross Gold Corp., 4.5%, 7/15/2027 (n) | | | 284,000 | | | | 266,960 | |
| Southern Copper Corp., 5.25%, 11/08/2042 | | | 12,322,000 | | | | 12,702,128 | |
| Steel Dynamics, Inc., 5%, 12/15/2026 | | | 21,989,000 | | | | 21,769,110 | |
| | | | | | | | |
| | | | | | | $ | 94,357,632 | |
| Midstream - 2.9% | | | | | | | | |
| APT Pipelines Ltd., 4.25%, 7/15/2027 (n) | | $ | 5,122,000 | | | $ | 5,016,625 | |
| APT Pipelines Ltd., 5%, 3/23/2035 (n) | | | 12,850,000 | | | | 13,130,865 | |
18
Portfolio of Investments – continued
| | | | | | | | |
| Issuer | | Shares/Par | | | Value ($) | |
| Bonds - continued | | | | | | | | |
| Midstream - continued | | | | | | | | |
| Dominion Gas Holdings LLC, 2.8%, 11/15/2020 | | $ | 9,949,000 | | | $ | 9,850,570 | |
| Kinder Morgan Energy Partners LP, 6.85%, 2/15/2020 | | | 4,303,000 | | | | 4,561,868 | |
| Kinder Morgan Energy Partners LP, 3.5%, 3/01/2021 | | | 3,745,000 | | | | 3,737,204 | |
| Kinder Morgan Energy Partners LP, 7.4%, 3/15/2031 | | | 3,627,000 | | | | 4,279,150 | |
| MPLX LP, 4.5%, 4/15/2038 | | | 14,937,000 | | | | 14,445,348 | |
| ONEOK, Inc., 4.95%, 7/13/2047 | | | 38,103,000 | | | | 38,196,295 | |
| Sabine Pass Liquefaction, 4.2%, 3/15/2028 | | | 15,455,000 | | | | 15,017,770 | |
| Sabine Pass Liquefaction LLC, 5.625%, 4/15/2023 | | | 12,865,000 | | | | 13,710,360 | |
| Sabine Pass Liquefaction LLC, 5.625%, 3/01/2025 | | | 1,257,000 | | | | 1,339,169 | |
| Sabine Pass Liquefaction LLC, 5.875%, 6/30/2026 | | | 13,222,000 | | | | 14,359,215 | |
| Sabine Pass Liquefaction LLC, 5%, 3/15/2027 | | | 7,084,000 | | | | 7,309,991 | |
| | | | | | | | |
| | | | | | | $ | 144,954,430 | |
| Mortgage-Backed - 0.9% | | | | | | | | |
| Freddie Mac, 3.136%, 10/25/2024 | | $ | 36,026,000 | | | $ | 35,879,403 | |
| Freddie Mac, 3.244%, 8/25/2027 | | | 1,276,000 | | | | 1,257,183 | |
| Freddie Mac, 3.286%, 11/25/2027 | | | 7,744,000 | | | | 7,639,218 | |
| | | | | | | | |
| | | | | | | $ | 44,775,804 | |
| Natural Gas - Distribution - 1.2% | | | | | | | | |
| NiSource Finance Corp., 3.85%, 2/15/2023 | | $ | 10,894,000 | | | $ | 10,966,310 | |
| NiSource Finance Corp., 4.8%, 2/15/2044 | | | 4,239,000 | | | | 4,424,651 | |
| Sempra Energy, 3.25%, 6/15/2027 | | | 44,879,000 | | | | 42,079,751 | |
| | | | | | | | |
| | | | | | | $ | 57,470,712 | |
| Network & Telecom - 2.5% | | | | | | | | |
| AT&T, Inc., 2.45%, 6/30/2020 | | $ | 5,778,000 | | | $ | 5,706,661 | |
| AT&T, Inc., 3.8%, 3/01/2024 | | | 17,387,000 | | | | 17,269,912 | |
| AT&T, Inc., 4.5%, 5/15/2035 | | | 13,000,000 | | | | 12,393,839 | |
| AT&T, Inc., 4.9%, 8/14/2037 | | | 35,881,000 | | | | 36,332,127 | |
| AT&T, Inc., 4.75%, 5/15/2046 | | | 15,772,000 | | | | 14,689,251 | |
| AT&T, Inc., 5.15%, 11/15/2046 (z) | | | 9,012,000 | | | | 8,859,000 | |
| AT&T, Inc., 5.65%, 2/15/2047 | | | 9,148,000 | | | | 9,671,633 | |
| Verizon Communications, Inc., 1.75%, 8/15/2021 | | | 8,069,000 | | | | 7,691,740 | |
| Verizon Communications, Inc., 3%, 11/01/2021 | | | 12,119,000 | | | | 12,006,777 | |
| | | | | | | | |
| | | | | | | $ | 124,620,940 | |
| Oils - 1.7% | | | | | | | | |
| Andeavor, 4.5%, 4/01/2048 | | $ | 22,565,000 | | | $ | 21,230,547 | |
| Marathon Petroleum Corp., 3.4%, 12/15/2020 | | | 11,333,000 | | | | 11,376,740 | |
| Marathon Petroleum Corp., 4.75%, 9/15/2044 | | | 16,090,000 | | | | 15,880,486 | |
| Valero Energy Corp., 3.4%, 9/15/2026 | | | 20,305,000 | | | | 19,412,593 | |
| Valero Energy Corp., 4.9%, 3/15/2045 | | | 17,086,000 | | | | 17,876,966 | |
| | | | | | | | |
| | | | | | | $ | 85,777,332 | |
19
Portfolio of Investments – continued
| | | | | | | | |
| Issuer | | Shares/Par | | | Value ($) | |
| Bonds - continued | | | | | | | | |
| Other Banks & Diversified Financials - 5.0% | | | | | | | | |
| BPCE S.A., 4.5%, 3/15/2025 (n) | | $ | 6,746,000 | | | $ | 6,704,207 | |
| Capital One Financial Corp., 3.75%, 4/24/2024 | | | 7,016,000 | | | | 6,892,222 | |
| Capital One Financial Corp., 3.3%, 10/30/2024 | | | 38,018,000 | | | | 36,209,357 | |
| Citigroup, Inc., 4.4%, 6/10/2025 | | | 8,354,000 | | | | 8,346,082 | |
| Citigroup, Inc., 3.2%, 10/21/2026 | | | 35,061,000 | | | | 32,679,659 | |
| Citigroup, Inc., 3.52% to 10/27/2027, FLR to 10/27/2028 | | | 40,653,000 | | | | 38,345,384 | |
| Citizens Bank N.A., 2.25%, 3/02/2020 | | | 23,010,000 | | | | 22,632,651 | |
| Citizens Bank N.A., 2.55%, 5/13/2021 | | | 9,910,000 | | | | 9,696,011 | |
| Discover Bank, 7%, 4/15/2020 | | | 17,724,000 | | | | 18,838,259 | |
| Groupe BPCE S.A., 12.5% to 9/30/2019, FLR to 8/29/2049 (n) | | | 3,146,000 | | | | 3,511,722 | |
| ING Groep N.V., 3.95%, 3/29/2027 | | | 14,650,000 | | | | 14,414,920 | |
| Macquarie Bank Ltd., 6.125% to 3/08/2027, FLR to 12/31/2165 (n) | | | 6,524,000 | | | | 6,279,350 | |
| SunTrust Banks, Inc., 2.7%, 1/27/2022 | | | 29,944,000 | | | | 29,160,444 | |
| SunTrust Banks, Inc., 3.3%, 5/15/2026 | | | 14,449,000 | | | | 13,676,112 | |
| | | | | | | | |
| | | | | | | $ | 247,386,380 | |
| Personal Computers & Peripherals - 0.1% | | | | | | | | |
| Equifax, Inc., 2.3%, 6/01/2021 | | $ | 4,376,000 | | | $ | 4,223,353 | |
| | |
| Pharmaceuticals - 0.9% | | | | | | | | |
| Celgene Corp., 2.875%, 8/15/2020 | | $ | 18,498,000 | | | $ | 18,377,108 | |
| Celgene Corp., 2.75%, 2/15/2023 | | | 29,591,000 | | | | 28,249,321 | |
| | | | | | | | |
| | | | | | | $ | 46,626,429 | |
| Pollution Control - 0.1% | | | | | | | | |
| Republic Services, Inc., 5.25%, 11/15/2021 | | $ | 6,200,000 | | | $ | 6,579,619 | |
| | |
| Precious Metals & Minerals - 0.4% | | | | | | | | |
| Teck Resources Ltd., 6%, 8/15/2040 | | $ | 4,507,000 | | | $ | 4,698,547 | |
| Teck Resources Ltd., 6.25%, 7/15/2041 | | | 13,526,000 | | | | 14,337,560 | |
| | | | | | | | |
| | | | | | | $ | 19,036,107 | |
| Railroad & Shipping - 0.1% | | | | | | | | |
| Canadian Pacific Railway Co., 4.5%, 1/15/2022 | | $ | 6,058,000 | | | $ | 6,267,177 | |
| | |
| Retailers - 1.4% | | | | | | | | |
| Best Buy Co., Inc., 5%, 8/01/2018 | | $ | 8,415,000 | | | $ | 8,459,095 | |
| Best Buy Co., Inc., 5.5%, 3/15/2021 | | | 17,673,000 | | | | 18,571,236 | |
| Dollar General Corp., 4.15%, 11/01/2025 | | | 5,508,000 | | | | 5,565,023 | |
| Dollar Tree, Inc., 4%, 5/15/2025 | | | 17,955,000 | | | | 17,784,645 | |
| Home Depot, Inc., 3%, 4/01/2026 | | | 7,218,000 | | | | 6,900,478 | |
| Home Depot, Inc., 4.875%, 2/15/2044 | | | 10,313,000 | | | | 11,504,575 | |
| | | | | | | | |
| | | | | | | $ | 68,785,052 | |
20
Portfolio of Investments – continued
| | | | | | | | |
| Issuer | | Shares/Par | | | Value ($) | |
| Bonds - continued | | | | | | | | |
| Specialty Chemicals - 0.1% | | | | | | | | |
| Ecolab, Inc., 2.25%, 1/12/2020 | | $ | 600,000 | | | $ | 592,555 | |
| Ecolab, Inc., 4.35%, 12/08/2021 | | | 3,263,000 | | | | 3,385,959 | |
| | | | | | | | |
| | | | | | | $ | 3,978,514 | |
| Telecommunications - Wireless - 3.5% | | | | | | | | |
| American Tower Corp., REIT, 4.7%, 3/15/2022 | | $ | 7,973,000 | | | $ | 8,246,150 | |
| American Tower Corp., REIT, 3.5%, 1/31/2023 | | | 3,999,000 | | | | 3,944,647 | |
| American Tower Corp., REIT, 3%, 6/15/2023 | | | 19,876,000 | | | | 19,053,042 | |
| American Tower Corp., REIT, 4%, 6/01/2025 | | | 12,172,000 | | | | 12,015,440 | |
| American Tower Corp., REIT, 3.6%, 1/15/2028 | | | 21,944,000 | | | | 20,495,414 | |
| Crown Castle International Corp., 5.25%, 1/15/2023 | | | 4,570,000 | | | | 4,821,075 | |
| Crown Castle International Corp., 3.15%, 7/15/2023 | | | 16,889,000 | | | | 16,293,499 | |
| Crown Castle International Corp., 4.45%, 2/15/2026 | | | 15,364,000 | | | | 15,359,238 | |
| Crown Castle International Corp., 4%, 3/01/2027 | | | 11,286,000 | | | | 10,905,603 | |
| Crown Castle International Corp., 3.65%, 9/01/2027 | | | 8,862,000 | | | | 8,306,962 | |
| Crown Castle Towers LLC, 4.883%, 8/15/2020 (n) | | | 12,662,000 | | | | 13,065,542 | |
| SBA Tower Trust, 2.898%, 10/11/2044 (n) | | | 9,621,000 | | | | 9,622,601 | |
| T-Mobile USA, Inc., 6%, 4/15/2024 | | | 21,678,000 | | | | 22,707,705 | |
| T-Mobile USA, Inc., 4.75%, 2/01/2028 | | | 9,336,000 | | | | 8,984,033 | |
| | | | | | | | |
| | | | | | | $ | 173,820,951 | |
| Tobacco - 1.2% | | | | | | | | |
| B.A.T. Capital Corp., 3.557%, 8/15/2027 (n) | | $ | 24,315,000 | | | $ | 22,749,007 | |
| Reynolds American, Inc., 8.125%, 6/23/2019 | | | 6,504,000 | | | | 6,869,792 | |
| Reynolds American, Inc., 3.25%, 6/12/2020 | | | 1,586,000 | | | | 1,586,933 | |
| Reynolds American, Inc., 4%, 6/12/2022 | | | 5,408,000 | | | | 5,454,499 | |
| Reynolds American, Inc., 4.45%, 6/12/2025 | | | 19,045,000 | | | | 19,231,866 | |
| Reynolds American, Inc., 5.7%, 8/15/2035 | | | 4,634,000 | | | | 5,115,041 | |
| | | | | | | | |
| | | | | | | $ | 61,007,138 | |
| Transportation - Services - 0.3% | | | | | | | | |
| ERAC USA Finance LLC, 3.85%, 11/15/2024 (n) | | $ | 2,391,000 | | | $ | 2,387,242 | |
| ERAC USA Finance LLC, 7%, 10/15/2037 (n) | | | 6,480,000 | | | | 8,270,510 | |
| ERAC USA Finance LLC, 5.625%, 3/15/2042 (n) | | | 2,420,000 | | | | 2,692,472 | |
| ERAC USA Finance LLC, 4.5%, 2/15/2045 (n) | | | 1,850,000 | | | | 1,786,307 | |
| | | | | | | | |
| | | | | | | $ | 15,136,531 | |
| U.S. Treasury Obligations - 0.9% | | | | | | | | |
| U.S. Treasury Bonds, 3.5%, 2/15/2039 | | $ | 42,854,000 | | | $ | 46,069,724 | |
| | |
| Utilities - Electric Power - 4.9% | | | | | | | | |
| Berkshire Hathaway Energy, 4.5%, 2/01/2045 | | $ | 5,432,000 | | | $ | 5,617,303 | |
| CMS Energy Corp., 6.25%, 2/01/2020 | | | 6,891,000 | | | | 7,241,849 | |
| Dominion Resources, Inc., 2.5%, 12/01/2019 | | | 3,550,000 | | | | 3,507,249 | |
21
Portfolio of Investments – continued
| | | | | | | | |
| Issuer | | Shares/Par | | | Value ($) | |
| Bonds - continued | | | | | | | | |
| Utilities - Electric Power - continued | | | | | | | | |
| Duke Energy Corp., 3.75%, 9/01/2046 | | $ | 13,123,000 | | | $ | 11,773,118 | |
| EDP Finance B.V., 5.25%, 1/14/2021 (n) | | | 6,828,000 | | | | 7,124,765 | |
| EDP Finance BV, 3.625%, 7/15/2024 (n) | | | 10,744,000 | | | | 10,472,424 | |
| Emera U.S. Finance LP, 2.7%, 6/15/2021 | | | 3,920,000 | | | | 3,818,393 | |
| Emera U.S. Finance LP, 3.55%, 6/15/2026 | | | 4,478,000 | | | | 4,254,119 | |
| Enel Finance International N.V., 2.75%, 4/06/2023 (n) | | | 36,129,000 | | | | 34,567,519 | |
| Enel Finance International S.A., 4.75%, 5/25/2047 (n) | | | 32,876,000 | | | | 32,834,525 | |
| Eversource Energy, 2.9%, 10/01/2024 | | | 18,060,000 | | | | 17,174,869 | |
| Exelon Corp., 3.497%, 6/01/2022 | | | 17,819,000 | | | | 17,537,682 | |
| FirstEnergy Corp., 3.9%, 7/15/2027 | | | 11,834,000 | | | | 11,578,928 | |
| NextEra Energy Capital Holdings, Inc., 3.55%, 5/01/2027 | | | 22,319,000 | | | | 21,443,563 | |
| NextEra Energy Operating Co., 4.5%, 9/15/2027 (n) | | | 14,862,000 | | | | 13,858,815 | |
| PPL Capital Funding, Inc., 5%, 3/15/2044 | | | 5,193,000 | | | | 5,561,527 | |
| PPL WEM Holdings PLC, 5.375%, 5/01/2021 (n) | | | 5,693,000 | | | | 5,933,353 | |
| Public Service Enterprise Group, 2%, 11/15/2021 | | | 20,489,000 | | | | 19,465,012 | |
| Southern Co., 2.95%, 7/01/2023 | | | 8,880,000 | | | | 8,558,174 | |
| | | | | | | | |
| | | | | | | $ | 242,323,187 | |
| Total Bonds (Identified Cost, $4,811,961,753) | | | | | | $ | 4,718,686,707 | |
| | |
| Floating Rate Loans (g)(r) - 0.3% | | | | | | | | |
| Medical & Health Technology & Services - 0.3% | | | | | | | | |
| DaVita Healthcare Partners, Inc., Term Loan B, 4.65%, 6/24/2021 (Identified Cost, $13,283,013) | | $ | 13,199,534 | | | $ | 13,298,530 | |
| | |
| Investment Companies (h) - 4.8% | | | | | | | | |
| Money Market Funds - 4.8% | | | | | | | | |
| MFS Institutional Money Market Portfolio, 1.78% (v) (Identified Cost, $239,530,385) | | | 239,564,001 | | | $ | 239,540,044 | |
| | |
| Other Assets, Less Liabilities - 0.5% | | | | | | | 23,754,001 | |
| Net Assets - 100.0% | | | | | | $ | 4,995,279,282 | |
| (g) | The rate shown represents a weighted average coupon rate on settled positions at period end, unless otherwise indicated. |
| (h) | An affiliated issuer may be considered one in which the fund owns 5% or more of the outstanding voting securities, or a company which is under common control. At period end, the aggregate values of the fund’s investments in affiliated issuers and in unaffiliated issuers were $239,540,044 and $4,731,985,237, respectively. |
| (i) | Interest only security for which the fund receives interest on notional principal (Par amount). Par amount shown is the notional principal and does not reflect the cost of the security. |
| (n) | Securities exempt from registration under Rule 144A of the Securities Act of 1933. These securities may be sold in the ordinary course of business in transactions exempt from registration, normally to qualified institutional buyers. At period end, the aggregate value of these securities was $733,735,556, representing 14.7% of net assets. |
22
Portfolio of Investments – continued
| (q) | Interest received was less than stated coupon rate. |
| (r) | Remaining maturities of floating rate loans may be less than stated maturities shown as a result of contractual or optional prepayments by the borrower. Such prepayments cannot be predicted with certainty. These loans may be subject to restrictions on resale. Floating rate loans generally have rates of interest which are determined periodically by reference to a base lending rate plus a premium. |
| (v) | Affiliated issuer that is available only to investment companies managed by MFS. The rate quoted for the MFS Institutional Money Market Portfolio is the annualized seven-day yield of the fund at period end. |
| (z) | Restricted securities are not registered under the Securities Act of 1933 and are subject to legal restrictions on resale. These securities generally may be resold in transactions exempt from registration or to the public if the securities are subsequently registered. Disposal of these securities may involve time-consuming negotiations and prompt sale at an acceptable price may be difficult. The fund holds the following restricted securities: |
��
| | | | | | | | | | |
| Restricted Securities | | Acquisition
Date | | Cost | | | Value | |
| AT&T, Inc., 5.15%, 11/15/2046 | | 4/12/18 | | | $9,230,847 | | | | $8,859,000 | |
| Bayview Financial Revolving Mortgage Loan Trust, FLR, 3.501% (LIBOR-1mo. + 1.6%), 12/28/2040 | | 3/01/06 | | | 1,067,321 | | | | 968,352 | |
| BlackRock Capital Finance LP, 7.75%, 9/25/2026 | | 10/10/96-1/03/97 | | | 25,652 | | | | 1,761 | |
| Daimler Finance North America LLC, 3.35%, 5/04/2021 | | 4/30/18 | | | 39,610,998 | | | | 39,610,998 | |
| Total Restricted Securities | | | | | | | | | $49,440,111 | |
| % of Net assets | | | | | | | | | 1.0% | |
The following abbreviations are used in this report and are defined:
| FLR | | Floating Rate. Interest rate resets periodically based on the parenthetically disclosed reference rate plus a spread (if any). The period-end rate reported may not be the current rate. |
| PLC | | Public Limited Company |
| REIT | | Real Estate Investment Trust |
See Notes to Financial Statements
23
Financial Statements
STATEMENT OF ASSETS AND LIABILITIES
At 4/30/18
This statement represents your fund’s balance sheet, which details the assets and liabilities comprising the total value of the fund.
| | | | |
| Assets | | | | |
Investments in unaffiliated issuers, at value (identified cost, $4,825,244,766) | | | $4,731,985,237 | |
Investments in affiliated issuers, at value (identified cost, $239,530,385) | | | 239,540,044 | |
Cash | | | 57,779 | |
Receivables for | | | | |
Investments sold | | | 17,851,283 | |
Fund shares sold | | | 11,979,875 | |
Interest | | | 46,836,443 | |
Other assets | | | 13,450 | |
Total assets | | | $5,048,264,111 | |
| Liabilities | | | | |
Payables for | | | | |
Distributions | | | $2,306,153 | |
Investments purchased | | | 39,610,998 | |
Fund shares reacquired | | | 8,652,563 | |
Payable to affiliates | | | | |
Investment adviser | | | 210,543 | |
Shareholder servicing costs | | | 1,578,717 | |
Distribution and service fees | | | 77,857 | |
Payable for independent Trustees’ compensation | | | 15,783 | |
Accrued expenses and other liabilities | | | 532,215 | |
Total liabilities | | | $52,984,829 | |
Net assets | | | $4,995,279,282 | |
| Net assets consist of | | | | |
Paid-in capital | | | $5,103,447,249 | |
Unrealized appreciation (depreciation) | | | (93,249,870 | ) |
Accumulated net realized gain (loss) | | | (12,181,407 | ) |
Accumulated distributions in excess of net investment income | | | (2,736,690 | ) |
Net assets | | | $4,995,279,282 | |
Shares of beneficial interest outstanding | | | 369,589,397 | |
24
Statement of Assets and Liabilities – continued
| | | | | | | | | | | | |
| | | Net assets | | | Shares
outstanding | | | Net asset value
per share (a) | |
Class A | | | $1,648,507,892 | | | | 121,893,901 | | | | $13.52 | |
Class B | | | 47,698,208 | | | | 3,534,193 | | | | 13.50 | |
Class C | | | 182,314,824 | | | | 13,522,457 | | | | 13.48 | |
Class I | | | 1,781,450,110 | | | | 131,823,950 | | | | 13.51 | |
Class R1 | | | 6,101,023 | | | | 452,184 | | | | 13.49 | |
Class R2 | | | 43,826,704 | | | | 3,240,311 | | | | 13.53 | |
Class R3 | | | 167,404,336 | | | | 12,377,921 | | | | 13.52 | |
Class R4 | | | 74,026,512 | | | | 5,472,357 | | | | 13.53 | |
Class R6 | | | 1,043,949,673 | | | | 77,272,123 | | | | 13.51 | |
| (a) | Maximum offering price per share was equal to the net asset value per share for all share classes, except for Class A, for which the maximum offering price per share was $14.12 [100 / 95.75 x $13.52]. On sales of $100,000 or more, the maximum offering price of Class A shares is reduced. A contingent deferred sales charge may be imposed on redemptions of Class A, Class B, and Class C shares. Redemption price per share was equal to the net asset value per share for Classes I, R1, R2, R3, R4, and R6. Net asset value per share is calculated using actual net assets and shares outstanding rather than amounts that have been rounded for presentation purposes. |
See Notes to Financial Statements
25
Financial Statements
STATEMENT OF OPERATIONS
Year ended 4/30/18
This statement describes how much your fund earned in investment income and accrued in expenses. It also describes any gains and/or losses generated by fund operations.
| | | | |
| Net investment income (loss) | | | | |
Income | | | | |
Interest | | | $176,700,517 | |
Dividends from affiliated issuers | | | 2,498,360 | |
Total investment income | | | $179,198,877 | |
Expenses | | | | |
Management fee | | | $18,355,944 | |
Distribution and service fees | | | 7,532,684 | |
Shareholder servicing costs | | | 4,636,483 | |
Administrative services fee | | | 640,971 | |
Independent Trustees’ compensation | | | 58,687 | |
Custodian fee | | | 240,054 | |
Shareholder communications | | | 1,047,298 | |
Audit and tax fees | | | 74,104 | |
Legal fees | | | 49,076 | |
Miscellaneous | | | 537,547 | |
Total expenses | | | $33,172,848 | |
Fees paid indirectly | | | (10,153 | ) |
Reduction of expenses by investment adviser and distributor | | | (462,750 | ) |
Net expenses | | | $32,699,945 | |
Net investment income (loss) | | | $146,498,932 | |
| Realized and unrealized gain (loss) | | | | |
Realized gain (loss) (identified cost basis) | | | | |
Unaffiliated issuers | | | $22,391,830 | |
Affiliated issuers | | | (21,482 | ) |
Net realized gain (loss) | | | $22,370,348 | |
Change in unrealized appreciation (depreciation) | | | | |
Unaffiliated issuers | | | $(178,786,130 | ) |
Affiliated issuers | | | (4,158 | ) |
Net unrealized gain (loss) | | | $(178,790,288 | ) |
Net realized and unrealized gain (loss) | | | $(156,419,940 | ) |
Change in net assets from operations | | | $(9,921,008 | ) |
See Notes to Financial Statements
26
Financial Statements
STATEMENTS OF CHANGES IN NET ASSETS
These statements describe the increases and/or decreases in net assets resulting from operations, any distributions, and any shareholder transactions.
| | | | | | | | |
| | | Year ended | |
| | | 4/30/18 | | | 4/30/17 | |
| Change in net assets | | | | | | |
| From operations | | | | | | | | |
Net investment income (loss) | | | $146,498,932 | | | | $109,112,277 | |
Net realized gain (loss) | | | 22,370,348 | | | | 10,729,076 | |
Net unrealized gain (loss) | | | (178,790,288 | ) | | | (19,563,041 | ) |
Change in net assets from operations | | | $(9,921,008 | ) | | | $100,278,312 | |
| Distributions declared to shareholders | | | | | | | | |
From net investment income | | | $(149,082,041 | ) | | | $(115,352,326 | ) |
Change in net assets from fund share transactions | | | $901,620,983 | | | | $1,176,131,453 | |
Total change in net assets | | | $742,617,934 | | | | $1,161,057,439 | |
| Net assets | | | | | | | | |
At beginning of period | | | 4,252,661,348 | | | | 3,091,603,909 | |
At end of period (including accumulated distributions in excess of net investment income of $2,736,690 and $3,590,917, respectively) | | | $4,995,279,282 | | | | $4,252,661,348 | |
See Notes to Financial Statements
27
Financial Statements
FINANCIAL HIGHLIGHTS
The financial highlights table is intended to help you understand the fund’s financial performance for the past 5 years. Certain information reflects financial results for a single fund share. The total returns in the table represent the rate that an investor would have earned (or lost) on an investment in the fund share class (assuming reinvestment of all distributions) held for the entire period.
| | | | | | | | | | | | | | | | | | | | |
| Class A | | Year ended | |
| | | 4/30/18 | | | 4/30/17 | | | 4/30/16 | | | 4/30/15 | | | 4/30/14 | |
Net asset value, beginning of period | | | $13.92 | | | | $13.99 | | | | $14.11 | | | | $14.02 | | | | $14.38 | |
| Income (loss) from investment operations | | | | | | | | | | | | | | | | | |
Net investment income (loss) (d) | | | $0.41 | | | | $0.42 | (c) | | | $0.44 | | | | $0.46 | | | | $0.44 | |
Net realized and unrealized gain (loss) | | | (0.39 | ) | | | (0.04 | ) | | | (0.06 | ) | | | 0.13 | | | | (0.28 | ) |
Total from investment operations | | | $0.02 | | | | $0.38 | | | | $0.38 | | | | $0.59 | | | | $0.16 | |
| Less distributions declared to shareholders | | | | | | | | | | | | | | | | | |
From net investment income | | | $(0.42 | ) | | | $(0.45 | ) | | | $(0.46 | ) | | | $(0.50 | ) | | | $(0.48 | ) |
From net realized gain | | | — | | | | — | | | | (0.04 | ) | | | — | | | | (0.04 | ) |
Total distributions declared to shareholders | | | $(0.42 | ) | | | $(0.45 | ) | | | $(0.50 | ) | | | $(0.50 | ) | | | $(0.52 | ) |
Net asset value, end of period (x) | | | $13.52 | | | | $13.92 | | | | $13.99 | | | | $14.11 | | | | $14.02 | |
Total return (%) (r)(s)(t)(x) | | | 0.08 | | | | 2.73 | (c) | | | 2.83 | | | | 4.27 | | | | 1.18 | |
Ratios (%) (to average net assets) and Supplemental data: | | | | | | | | | | | | | | | | | |
Expenses before expense reductions (f) | | | 0.80 | | | | 0.81 | (c) | | | 0.83 | | | | 0.83 | | | | 0.82 | |
Expenses after expense reductions (f) | | | 0.79 | | | | 0.80 | (c) | | | 0.82 | | | | 0.82 | | | | 0.81 | |
Net investment income (loss) | | | 2.95 | | | | 3.04 | (c) | | | 3.24 | | | | 3.26 | | | | 3.19 | |
Portfolio turnover | | | 38 | | | | 28 | | | | 30 | | | | 29 | | | | 31 | |
Net assets at end of period (000 omitted) | | | $1,648,508 | | | | $1,597,201 | | | | $1,709,595 | | | | $1,572,022 | | | | $1,489,744 | |
See Notes to Financial Statements
28
Financial Highlights – continued
| | | | | | | | | | | | | | | | | | | | |
| Class B | | Year ended | |
| | | 4/30/18 | | | 4/30/17 | | | 4/30/16 | | | 4/30/15 | | | 4/30/14 | |
Net asset value, beginning of period | | | $13.89 | | | | $13.96 | | | | $14.08 | | | | $13.99 | | | | $14.35 | |
| Income (loss) from investment operations | | | | | | | | | | | | | | | | | |
Net investment income (loss) (d) | | | $0.31 | | | | $0.32 | (c) | | | $0.34 | | | | $0.35 | | | | $0.34 | |
Net realized and unrealized gain (loss) | | | (0.39 | ) | | | (0.05 | ) | | | (0.06 | ) | | | 0.13 | | | | (0.29 | ) |
Total from investment operations | | | $(0.08 | ) | | | $0.27 | | | | $0.28 | | | | $0.48 | | | | $0.05 | |
| Less distributions declared to shareholders | | | | | | | | | | | | | | | | | |
From net investment income | | | $(0.31 | ) | | | $(0.34 | ) | | | $(0.36 | ) | | | $(0.39 | ) | | | $(0.37 | ) |
From net realized gain | | | — | | | | — | | | | (0.04 | ) | | | — | | | | (0.04 | ) |
Total distributions declared to shareholders | | | $(0.31 | ) | | | $(0.34 | ) | | | $(0.40 | ) | | | $(0.39 | ) | | | $(0.41 | ) |
Net asset value, end of period (x) | | | $13.50 | | | | $13.89 | | | | $13.96 | | | | $14.08 | | | | $13.99 | |
Total return (%) (r)(s)(t)(x) | | | (0.60 | ) | | | 1.96 | (c) | | | 2.06 | | | | 3.49 | | | | 0.42 | |
Ratios (%) (to average net assets)
and Supplemental data: | | | | | | | | | | | | | | | | | |
Expenses before expense reductions (f) | | | 1.55 | | | | 1.56 | (c) | | | 1.58 | | | | 1.58 | | | | 1.57 | |
Expenses after expense reductions (f) | | | 1.54 | | | | 1.55 | (c) | | | 1.57 | | | | 1.57 | | | | 1.57 | |
Net investment income (loss) | | | 2.20 | | | | 2.30 | (c) | | | 2.50 | | | | 2.52 | | | | 2.44 | |
Portfolio turnover | | | 38 | | | | 28 | | | | 30 | | | | 29 | | | | 31 | |
Net assets at end of period (000 omitted) | | | $47,698 | | | | $61,123 | | | | $72,298 | | | | $80,296 | | | | $87,094 | |
| |
| Class C | | Year ended | |
| | | 4/30/18 | | | 4/30/17 | | | 4/30/16 | | | 4/30/15 | | | 4/30/14 | |
Net asset value, beginning of period | | | $13.88 | | | | $13.94 | | | | $14.06 | | | | $13.97 | | | | $14.33 | |
| Income (loss) from investment operations | | | | | | | | | | | | | | | | | |
Net investment income (loss) (d) | | | $0.31 | | | | $0.32 | (c) | | | $0.34 | | | | $0.35 | | | | $0.34 | |
Net realized and unrealized gain (loss) | | | (0.40 | ) | | | (0.04 | ) | | | (0.06 | ) | | | 0.13 | | | | (0.29 | ) |
Total from investment operations | | | $(0.09 | ) | | | $0.28 | | | | $0.28 | | | | $0.48 | | | | $0.05 | |
| Less distributions declared to shareholders | | | | | | | | | | | | | | | | | |
From net investment income | | | $(0.31 | ) | | | $(0.34 | ) | | | $(0.36 | ) | | | $(0.39 | ) | | | $(0.37 | ) |
From net realized gain | | | — | | | | — | | | | (0.04 | ) | | | — | | | | (0.04 | ) |
Total distributions declared to shareholders | | | $(0.31 | ) | | | $(0.34 | ) | | | $(0.40 | ) | | | $(0.39 | ) | | | $(0.41 | ) |
Net asset value, end of period (x) | | | $13.48 | | | | $13.88 | | | | $13.94 | | | | $14.06 | | | | $13.97 | |
Total return (%) (r)(s)(t)(x) | | | (0.67 | ) | | | 2.04 | (c) | | | 2.06 | | | | 3.50 | | | | 0.42 | |
Ratios (%) (to average net assets)
and Supplemental data: | | | | | | | | | | | | | | | | | |
Expenses before expense reductions (f) | | | 1.55 | | | | 1.56 | (c) | | | 1.58 | | | | 1.58 | | | | 1.57 | |
Expenses after expense reductions (f) | | | 1.54 | | | | 1.56 | (c) | | | 1.57 | | | | 1.57 | | | | 1.57 | |
Net investment income (loss) | | | 2.20 | | | | 2.30 | (c) | | | 2.50 | | | | 2.52 | | | | 2.45 | |
Portfolio turnover | | | 38 | | | | 28 | | | | 30 | | | | 29 | | | | 31 | |
Net assets at end of period (000 omitted) | | | $182,315 | | | | $242,889 | | | | $264,424 | | | | $271,920 | | | | $276,008 | |
See Notes to Financial Statements
29
Financial Highlights – continued
| | | | | | | | | | | | | | | | | | | | |
| Class I | | Year ended | |
| | | 4/30/18 | | | 4/30/17 | | | 4/30/16 | | | 4/30/15 | | | 4/30/14 | |
Net asset value, beginning of period | | | $13.91 | | | | $13.98 | | | | $14.11 | | | | $14.01 | | | | $14.38 | |
| Income (loss) from investment operations | | | | | | | | | | | | | | | | | |
Net investment income (loss) (d) | | | $0.45 | | | | $0.45 | (c) | | | $0.47 | | | | $0.49 | | | | $0.47 | |
Net realized and unrealized gain (loss) | | | (0.40 | ) | | | (0.04 | ) | | | (0.06 | ) | | | 0.14 | | | | (0.29 | ) |
Total from investment operations | | | $0.05 | | | | $0.41 | | | | $0.41 | | | | $0.63 | | | | $0.18 | |
| Less distributions declared to shareholders | | | | | | | | | | | | | | | | | |
From net investment income | | | $(0.45 | ) | | | $(0.48 | ) | | | $(0.50 | ) | | | $(0.53 | ) | | | $(0.51 | ) |
From net realized gain | | | — | | | | — | | | | (0.04 | ) | | | — | | | | (0.04 | ) |
Total distributions declared to shareholders | | | $(0.45 | ) | | | $(0.48 | ) | | | $(0.54 | ) | | | $(0.53 | ) | | | $(0.55 | ) |
Net asset value, end of period (x) | | | $13.51 | | | | $13.91 | | | | $13.98 | | | | $14.11 | | | | $14.01 | |
Total return (%) (r)(s)(t)(x) | | | 0.33 | | | | 2.99 | (c) | | | 3.01 | | | | 4.60 | | | | 1.36 | |
Ratios (%) (to average net assets)
and Supplemental data: | | | | | | | | | | | | | | | | | |
Expenses before expense reductions (f) | | | 0.55 | | | | 0.56 | (c) | | | 0.57 | | | | 0.58 | | | | 0.57 | |
Expenses after expense reductions (f) | | | 0.54 | | | | 0.56 | (c) | | | 0.57 | | | | 0.57 | | | | 0.57 | |
Net investment income (loss) | | | 3.19 | | | | 3.25 | (c) | | | 3.48 | | | | 3.50 | | | | 3.43 | |
Portfolio turnover | | | 38 | | | | 28 | | | | 30 | | | | 29 | | | | 31 | |
Net assets at end of period (000 omitted) | | | $1,781,450 | | | | $2,005,193 | | | | $720,809 | | | | $553,364 | | | | $446,377 | |
| |
| Class R1 | | Year ended | |
| | | 4/30/18 | | | 4/30/17 | | | 4/30/16 | | | 4/30/15 | | | 4/30/14 | |
Net asset value, beginning of period | | | $13.89 | | | | $13.95 | | | | $14.07 | | | | $13.98 | | | | $14.34 | |
| Income (loss) from investment operations | | | | | | | | | | | | | | | | | |
Net investment income (loss) (d) | | | $0.31 | | | | $0.32 | (c) | | | $0.34 | | | | $0.36 | | | | $0.34 | |
Net realized and unrealized gain (loss) | | | (0.40 | ) | | | (0.04 | ) | | | (0.06 | ) | | | 0.12 | | | | (0.29 | ) |
Total from investment operations | | | $(0.09 | ) | | | $0.28 | | | | $0.28 | | | | $0.48 | | | | $0.05 | |
| Less distributions declared to shareholders | | | | | | | | | | | | | | | | | |
From net investment income | | | $(0.31 | ) | | | $(0.34 | ) | | | $(0.36 | ) | | | $(0.39 | ) | | | $(0.37 | ) |
From net realized gain | | | — | | | | — | | | | (0.04 | ) | | | — | | | | (0.04 | ) |
Total distributions declared to shareholders | | | $(0.31 | ) | | | $(0.34 | ) | | | $(0.40 | ) | | | $(0.39 | ) | | | $(0.41 | ) |
Net asset value, end of period (x) | | | $13.49 | | | | $13.89 | | | | $13.95 | | | | $14.07 | | | | $13.98 | |
Total return (%) (r)(s)(t)(x) | | | (0.67 | ) | | | 2.04 | (c) | | | 2.06 | | | | 3.49 | | | | 0.42 | |
Ratios (%) (to average net assets)
and Supplemental data: | | | | | | | | | | | | | | | | | | | | |
Expenses before expense reductions (f) | | | 1.55 | | | | 1.56 | (c) | | | 1.58 | | | | 1.58 | | | | 1.57 | |
Expenses after expense reductions (f) | | | 1.54 | | | | 1.56 | (c) | | | 1.57 | | | | 1.57 | | | | 1.57 | |
Net investment income (loss) | | | 2.20 | | | | 2.30 | (c) | | | 2.50 | | | | 2.53 | | | | 2.44 | |
Portfolio turnover | | | 38 | | | | 28 | | | | 30 | | | | 29 | | | | 31 | |
Net assets at end of period (000 omitted) | | | $6,101 | | | | $6,780 | | | | $7,145 | | | | $7,978 | | | | $21,548 | |
See Notes to Financial Statements
30
Financial Highlights – continued
| | | | | | | | | | | | | | | | | | | | |
| Class R2 | | Year ended | |
| | | 4/30/18 | | | 4/30/17 | | | 4/30/16 | | | 4/30/15 | | | 4/30/14 | |
Net asset value, beginning of period | | | $13.92 | | | | $13.99 | | | | $14.11 | | | | $14.02 | | | | $14.38 | |
| Income (loss) from investment operations | | | | | | | | | | | | | | | | | |
Net investment income (loss) (d) | | | $0.38 | | | | $0.39 | (c) | | | $0.41 | | | | $0.42 | | | | $0.41 | |
Net realized and unrealized gain (loss) | | | (0.39 | ) | | | (0.05 | ) | | | (0.06 | ) | | | 0.13 | | | | (0.29 | ) |
Total from investment operations | | | $(0.01 | ) | | | $0.34 | | | | $0.35 | | | | $0.55 | | | | $0.12 | |
| Less distributions declared to shareholders | | | | | | | | | | | | | | | | | |
From net investment income | | | $(0.38 | ) | | | $(0.41 | ) | | | $(0.43 | ) | | | $(0.46 | ) | | | $(0.44 | ) |
From net realized gain | | | — | | | | — | | | | (0.04 | ) | | | — | | | | (0.04 | ) |
Total distributions declared to shareholders | | | $(0.38 | ) | | | $(0.41 | ) | | | $(0.47 | ) | | | $(0.46 | ) | | | $(0.48 | ) |
Net asset value, end of period (x) | | | $13.53 | | | | $13.92 | | | | $13.99 | | | | $14.11 | | | | $14.02 | |
Total return (%) (r)(s)(t)(x) | | | (0.09 | ) | | | 2.47 | (c) | | | 2.58 | | | | 4.01 | | | | 0.93 | |
Ratios (%) (to average net assets)
and Supplemental data: | | | | | | | | | | | | | | | | | |
Expenses before expense reductions (f) | | | 1.05 | | | | 1.06 | (c) | | | 1.08 | | | | 1.08 | | | | 1.07 | |
Expenses after expense reductions (f) | | | 1.04 | | | | 1.05 | (c) | | | 1.07 | | | | 1.07 | | | | 1.07 | |
Net investment income (loss) | | | 2.70 | | | | 2.79 | (c) | | | 3.00 | | | | 3.01 | | | | 2.94 | |
Portfolio turnover | | | 38 | | | | 28 | | | | 30 | | | | 29 | | | | 31 | |
Net assets at end of period (000 omitted) | | | $43,827 | | | | $49,948 | | | | $58,938 | | | | $74,307 | | | | $77,290 | |
| |
| Class R3 | | Year ended | |
| | | 4/30/18 | | | 4/30/17 | | | 4/30/16 | | | 4/30/15 | | | 4/30/14 | |
Net asset value, beginning of period | | | $13.92 | | | | $13.99 | | | | $14.11 | | | | $14.02 | | | | $14.38 | |
| Income (loss) from investment operations | | | | | | | | | | | | | | | | | |
Net investment income (loss) (d) | | | $0.41 | | | | $0.43 | (c) | | | $0.44 | | | | $0.46 | | | | $0.44 | |
Net realized and unrealized gain (loss) | | | (0.39 | ) | | | (0.05 | ) | | | (0.06 | ) | | | 0.13 | | | | (0.28 | ) |
Total from investment operations | | | $0.02 | | | | $0.38 | | | | $0.38 | | | | $0.59 | | | | $0.16 | |
| Less distributions declared to shareholders | | | | | | | | | | | | | | | | | |
From net investment income | | | $(0.42 | ) | | | $(0.45 | ) | | | $(0.46 | ) | | | $(0.50 | ) | | | $(0.48 | ) |
From net realized gain | | | — | | | | — | | | | (0.04 | ) | | | — | | | | (0.04 | ) |
Total distributions declared to shareholders | | | $(0.42 | ) | | | $(0.45 | ) | | | $(0.50 | ) | | | $(0.50 | ) | | | $(0.52 | ) |
Net asset value, end of period (x) | | | $13.52 | | | | $13.92 | | | | $13.99 | | | | $14.11 | | | | $14.02 | |
Total return (%) (r)(s)(t)(x) | | | 0.08 | | | | 2.73 | (c) | | | 2.83 | | | | 4.27 | | | | 1.18 | |
Ratios (%) (to average net assets)
and Supplemental data: | | | | | | | | | | | | | | | | | |
Expenses before expense reductions (f) | | | 0.81 | | | | 0.81 | (c) | | | 0.83 | | | | 0.83 | | | | 0.82 | |
Expenses after expense reductions (f) | | | 0.80 | | | | 0.80 | (c) | | | 0.82 | | | | 0.82 | | | | 0.82 | |
Net investment income (loss) | | | 2.95 | | | | 3.04 | (c) | | | 3.24 | | | | 3.26 | | | | 3.19 | |
Portfolio turnover | | | 38 | | | | 28 | | | | 30 | | | | 29 | | | | 31 | |
Net assets at end of period (000 omitted) | | | $167,404 | | | | $61,292 | | | | $65,655 | | | | $69,696 | | | | $63,349 | |
See Notes to Financial Statements
31
Financial Highlights – continued
| | | | | | | | | | | | | | | | | | | | |
| Class R4 | | Year ended | |
| | | 4/30/18 | | | 4/30/17 | | | 4/30/16 | | | 4/30/15 | | | 4/30/14 | |
Net asset value, beginning of period | | | $13.93 | | | | $13.99 | | | | $14.11 | | | | $14.02 | | | | $14.38 | |
| Income (loss) from investment operations | | | | | | | | | | | | | | | | | |
Net investment income (loss) (d) | | | $0.45 | | | | $0.46 | (c) | | | $0.48 | | | | $0.49 | | | | $0.48 | |
Net realized and unrealized gain (loss) | | | (0.40 | ) | | | (0.04 | ) | | | (0.06 | ) | | | 0.14 | | | | (0.29 | ) |
Total from investment operations | | | $0.05 | | | | $0.42 | | | | $0.42 | | | | $0.63 | | | | $0.19 | |
| Less distributions declared to shareholders | | | | | | | | | | | | | | | | | |
From net investment income | | | $(0.45 | ) | | | $(0.48 | ) | | | $(0.50 | ) | | | $(0.54 | ) | | | $(0.51 | ) |
From net realized gain | | | — | | | | — | | | | (0.04 | ) | | | — | | | | (0.04 | ) |
Total distributions declared to shareholders | | | $(0.45 | ) | | | $(0.48 | ) | | | $(0.54 | ) | | | $(0.54 | ) | | | $(0.55 | ) |
Net asset value, end of period (x) | | | $13.53 | | | | $13.93 | | | | $13.99 | | | | $14.11 | | | | $14.02 | |
Total return (%) (r)(s)(t)(x) | | | 0.33 | | | | 3.06 | (c) | | | 3.09 | | | | 4.53 | | | | 1.43 | |
Ratios (%) (to average net assets)
and Supplemental data: | | | | | | | | | | | | | | | | | |
Expenses before expense reductions (f) | | | 0.55 | | | | 0.56 | (c) | | | 0.58 | | | | 0.58 | | | | 0.57 | |
Expenses after expense reductions (f) | | | 0.54 | | | | 0.56 | (c) | | | 0.57 | | | | 0.57 | | | | 0.57 | |
Net investment income (loss) | | | 3.19 | | | | 3.29 | (c) | | | 3.49 | | | | 3.51 | | | | 3.44 | |
Portfolio turnover | | | 38 | | | | 28 | | | | 30 | | | | 29 | | | | 31 | |
Net assets at end of period (000 omitted) | | | $74,027 | | | | $169,661 | | | | $148,266 | | | | $150,116 | | | | $139,924 | |
| |
| Class R6 | | Year ended | |
| | | 4/30/18 | | | 4/30/17 | | | 4/30/16 | | | 4/30/15 | | | 4/30/14 | |
Net asset value, beginning of period | | | $13.91 | | | | $13.98 | | | | $14.10 | | | | $14.01 | | | | $14.38 | |
| Income (loss) from investment operations | | | | | | | | | | | | | | | | | |
Net investment income (loss) (d) | | | $0.46 | | | | $0.47 | (c) | | | $0.49 | | | | $0.51 | | | | $0.49 | |
Net realized and unrealized gain (loss) | | | (0.39 | ) | | | (0.04 | ) | | | (0.06 | ) | | | 0.13 | | | | (0.29 | ) |
Total from investment operations | | | $0.07 | | | | $0.43 | | | | $0.43 | | | | $0.64 | | | | $0.20 | |
| Less distributions declared to shareholders | | | | | | | | | | | | | | | | | |
From net investment income | | | $(0.47 | ) | | | $(0.50 | ) | | | $(0.51 | ) | | | $(0.55 | ) | | | $(0.53 | ) |
From net realized gain | | | — | | | | — | | | | (0.04 | ) | | | — | | | | (0.04 | ) |
Total distributions declared to shareholders | | | $(0.47 | ) | | | $(0.50 | ) | | | $(0.55 | ) | | | $(0.55 | ) | | | $(0.57 | ) |
Net asset value, end of period (x) | | | $13.51 | | | | $13.91 | | | | $13.98 | | | | $14.10 | | | | $14.01 | |
Total return (%) (r)(s)(t)(x) | | | 0.43 | | | | 3.09 | (c) | | | 3.20 | | | | 4.64 | | | | 1.47 | |
Ratios (%) (to average net assets)
and Supplemental data: | | | | | | | | | | | | | | | | | |
Expenses before expense reductions (f) | | | 0.45 | | | | 0.46 | (c) | | | 0.46 | | | | 0.47 | | | | 0.46 | |
Expenses after expense reductions (f) | | | 0.44 | | | | 0.45 | (c) | | | 0.45 | | | | 0.46 | | | | 0.46 | |
Net investment income (loss) | | | 3.27 | | | | 3.39 | (c) | | | 3.57 | | | | 3.61 | | | | 3.57 | |
Portfolio turnover | | | 38 | | | | 28 | | | | 30 | | | | 29 | | | | 31 | |
Net assets at end of period (000 omitted) | | | $1,043,950 | | | | $58,575 | | | | $44,475 | | | | $26,041 | | | | $18,414 | |
See Notes to Financial Statements
32
Financial Highlights – continued
| (c) | Amount reflects a one-time reimbursement of expenses by the custodian (or former custodian) without which net investment income and performance would be lower and expenses would be higher. |
| (d) | Per share data is based on average shares outstanding. |
| (f) | Ratios do not reflect reductions from fees paid indirectly, if applicable. |
| (r) | Certain expenses have been reduced without which performance would have been lower. |
| (s) | From time to time the fund may receive proceeds from litigation settlements, without which performance would be lower. |
| (t) | Total returns do not include any applicable sales charges. |
| (x) | The net asset values and total returns have been calculated on net assets which include adjustments made in accordance with U.S. generally accepted accounting principles required at period end for financial reporting purposes. |
See Notes to Financial Statements
33
NOTES TO FINANCIAL STATEMENTS
(1) Business and Organization
MFS Corporate Bond Fund (the fund) is a diversified series of MFS Series Trust IX (the trust). The trust is organized as a Massachusetts business trust and is registered under the Investment Company Act of 1940, as amended, as an open-end management investment company.
The fund is an investment company and accordingly follows the investment company accounting and reporting guidance of the Financial Accounting Standards Board (FASB) Accounting Standards Codification Topic 946 Financial Services – Investment Companies.
(2) Significant Accounting Policies
General – The preparation of financial statements in conformity with U.S. generally accepted accounting principles requires management to make estimates and assumptions that affect the reported amounts of assets and liabilities, and disclosure of contingent assets and liabilities at the date of the financial statements and the reported amounts of increases and decreases in net assets from operations during the reporting period. Actual results could differ from those estimates. In the preparation of these financial statements, management has evaluated subsequent events occurring after the date of the fund’s Statement of Assets and Liabilities through the date that the financial statements were issued. The fund invests in high-yield securities rated below investment grade. Investments in below investment grade quality securities can involve a substantially greater risk of default or can already be in default, and their values can decline significantly. Below investment grade quality securities tend to be more sensitive to adverse news about the issuer, or the market or economy in general, than higher quality debt instruments. The fund invests in foreign securities. Investments in foreign securities are vulnerable to the effects of changes in the relative values of the local currency and the U.S. dollar and to the effects of changes in each country’s market, economic, industry, political, regulatory, geopolitical, and other conditions.
In March 2017, the FASB issued Accounting Standards Update 2017-08, Receivables –Nonrefundable Fees and Other Costs (Subtopic 310-20) – Premium Amortization on Purchased Callable Debt Securities (“ASU 2017-08”). For entities that hold callable debt securities at a premium, ASU 2017-08 requires that the premium be amortized to the earliest call date. ASU 2017-08 will be effective for fiscal years beginning after December 15, 2018, and interim periods within those fiscal years. Management has evaluated the potential impacts of ASU 2017-08 and believes that adoption of ASU 2017-08 will not have a material effect on the fund’s overall financial position or its overall results of operations.
Balance Sheet Offsetting – The fund’s accounting policy with respect to balance sheet offsetting is that, absent an event of default by the counterparty or a termination of the agreement, the International Swaps and Derivatives Association (ISDA) Master Agreement, or similar agreement, does not result in an offset of reported amounts of financial assets and financial liabilities in the Statement of Assets and Liabilities across transactions between the fund and the applicable counterparty. The fund’s right to setoff may be restricted or prohibited by the bankruptcy or insolvency laws of the particular jurisdiction to which a specific master netting agreement counterparty is
34
Notes to Financial Statements – continued
subject. Balance sheet offsetting disclosures, to the extent applicable to the fund, have been included in the fund’s Significant Accounting Policies note under the captions for each of the fund’s in-scope financial instruments and transactions.
Investment Valuations – Debt instruments and floating rate loans, including restricted debt instruments, are generally valued at an evaluated or composite bid as provided by a third-party pricing service. Short-term instruments with a maturity at issuance of 60 days or less may be valued at amortized cost, which approximates market value. Open-end investment companies are generally valued at net asset value per share. Securities and other assets generally valued on the basis of information from a third-party pricing service may also be valued at a broker/dealer bid quotation. Values obtained from third-party pricing services can utilize both transaction data and market information such as yield, quality, coupon rate, maturity, type of issue, trading characteristics, and other market data. The values of foreign securities and other assets and liabilities expressed in foreign currencies are converted to U.S. dollars using the mean of bid and asked prices for rates provided by a third-party pricing service.
The Board of Trustees has delegated primary responsibility for determining or causing to be determined the value of the fund’s investments (including any fair valuation) to the adviser pursuant to valuation policies and procedures approved by the Board. If the adviser determines that reliable market quotations are not readily available, investments are valued at fair value as determined in good faith by the adviser in accordance with such procedures under the oversight of the Board of Trustees. Under the fund’s valuation policies and procedures, market quotations are not considered to be readily available for most types of debt instruments and floating rate loans and many types of derivatives. These investments are generally valued at fair value based on information from third-party pricing services. In addition, investments may be valued at fair value if the adviser determines that an investment’s value has been materially affected by events occurring after the close of the exchange or market on which the investment is principally traded (such as foreign exchange or market) and prior to the determination of the fund’s net asset value, or after the halting of trading of a specific security where trading does not resume prior to the close of the exchange or market on which the security is principally traded. The adviser generally relies on third-party pricing services or other information (such as the correlation with price movements of similar securities in the same or other markets; the type, cost and investment characteristics of the security; the business and financial condition of the issuer; and trading and other market data) to assist in determining whether to fair value and at what value to fair value an investment. The value of an investment for purposes of calculating the fund’s net asset value can differ depending on the source and method used to determine value. When fair valuation is used, the value of an investment used to determine the fund’s net asset value may differ from quoted or published prices for the same investment. There can be no assurance that the fund could obtain the fair value assigned to an investment if it were to sell the investment at the same time at which the fund determines its net asset value per share.
Various inputs are used in determining the value of the fund’s assets or liabilities. These inputs are categorized into three broad levels. In certain cases, the inputs used to measure fair value may fall into different levels of the fair value hierarchy. In such cases, an investment’s level within the fair value hierarchy is based on the lowest level of
35
Notes to Financial Statements – continued
input that is significant to the fair value measurement. The fund’s assessment of the significance of a particular input to the fair value measurement in its entirety requires judgment, and considers factors specific to the investment. Level 1 includes unadjusted quoted prices in active markets for identical assets or liabilities. Level 2 includes other significant observable market-based inputs (including quoted prices for similar securities, interest rates, prepayment speed, and credit risk). Level 3 includes unobservable inputs, which may include the adviser’s own assumptions in determining the fair value of investments. The following is a summary of the levels used as of April 30, 2018 in valuing the fund’s assets or liabilities:
| | | | | | | | | | | | | | | | |
| Financial Instruments | | Level 1 | | | Level 2 | | | Level 3 | | | Total | |
| U.S. Treasury Bonds & U.S. Government Agency & Equivalents | | | $— | | | | $46,069,724 | | | | $— | | | | $46,069,724 | |
| Non-U.S. Sovereign Debt | | | — | | | | 68,599,587 | | | | — | | | | 68,599,587 | |
| U.S. Corporate Bonds | | | — | | | | 3,877,001,204 | | | | — | | | | 3,877,001,204 | |
| Residential Mortgage-Backed Securities | | | — | | | | 44,777,565 | | | | — | | | | 44,777,565 | |
| Commercial Mortgage-Backed Securities | | | — | | | | 1,576,694 | | | | — | | | | 1,576,694 | |
Asset-Backed Securities (including CDOs) | | | — | | | | 968,352 | | | | — | | | | 968,352 | |
| Foreign Bonds | | | — | | | | 679,693,581 | | | | — | | | | 679,693,581 | |
| Floating Rate Loans | | | — | | | | 13,298,530 | | | | — | | | | 13,298,530 | |
| Mutual Funds | | | 239,540,044 | | | | — | | | | — | | | | 239,540,044 | |
| Total | | | $239,540,044 | | | | $4,731,985,237 | | | | $— | | | | $4,971,525,281 | |
For further information regarding security characteristics, see the Portfolio of Investments.
Loans and Other Direct Debt Instruments – The fund invests in loans and loan participations or other receivables. These investments may include standby financing commitments, including revolving credit facilities, which contractually obligate the fund to supply additional cash to the borrower on demand. The fund generally provides this financial support in order to preserve its existing investment or to obtain a more senior secured interest in the assets of the borrower. Loan participations involve a risk of insolvency of the lending bank or other financial intermediary.
Indemnifications – Under the fund’s organizational documents, its officers and Trustees may be indemnified against certain liabilities and expenses arising out of the performance of their duties to the fund. Additionally, in the normal course of business, the fund enters into agreements with service providers that may contain indemnification clauses. The fund’s maximum exposure under these agreements is unknown as this would involve future claims that may be made against the fund that have not yet occurred.
Investment Transactions and Income – Investment transactions are recorded on the trade date. Interest income is recorded on the accrual basis. All premium and discount is amortized or accreted for financial statement purposes in accordance with U.S. generally accepted accounting principles. The fund earns certain fees in connection with its floating rate loan purchasing activities. These fees are in addition to interest
36
Notes to Financial Statements – continued
payments earned and may include amendment fees, commitment fees, facility fees, consent fees, and prepayment fees. Commitment fees are recorded on an accrual basis as income in the accompanying financial statements. Interest payments received in additional securities are recorded on the ex-interest date in an amount equal to the value of the security on such date.
The fund may receive proceeds from litigation settlements. Any proceeds received from litigation involving portfolio holdings are reflected in the Statement of Operations in realized gain/loss if the security has been disposed of by the fund or in unrealized gain/loss if the security is still held by the fund. Any other proceeds from litigation not related to portfolio holdings are reflected as other income in the Statement of Operations.
Fees Paid Indirectly – The fund’s custody fee may be reduced by a credit earned under an arrangement that measures the value of U.S. dollars deposited with the custodian by the fund. The amount of the credit, for the year ended April 30, 2018, is shown as a reduction of total expenses in the Statement of Operations.
Tax Matters and Distributions – The fund intends to qualify as a regulated investment company, as defined under Subchapter M of the Internal Revenue Code, and to distribute all of its taxable income, including realized capital gains. As a result, no provision for federal income tax is required. The fund’s federal tax returns, when filed, will remain subject to examination by the Internal Revenue Service for a three year period. Management has analyzed the fund’s tax positions taken on federal and state tax returns for all open tax years and does not believe that there are any uncertain tax positions that require recognition of a tax liability. Foreign taxes, if any, have been accrued by the fund in the accompanying financial statements in accordance with the applicable foreign tax law. Foreign income taxes may be withheld by certain countries in which the fund invests. Additionally, capital gains realized by the fund on securities issued in or by certain foreign countries may be subject to capital gains tax imposed by those countries.
Distributions to shareholders are recorded on the ex-dividend date. Income and capital gain distributions are determined in accordance with income tax regulations, which may differ from U.S. generally accepted accounting principles. Certain capital accounts in the financial statements are periodically adjusted for permanent differences in order to reflect their tax character. These adjustments have no impact on net assets or net asset value per share. Temporary differences which arise from recognizing certain items of income, expense, gain or loss in different periods for financial statement and tax purposes will reverse at some time in the future. Distributions in excess of net investment income or net realized gains are temporary overdistributions for financial statement purposes resulting from differences in the recognition or classification of income or distributions for financial statement and tax purposes.
Book/tax differences primarily relate to amortization and accretion of debt securities.
37
Notes to Financial Statements – continued
The tax character of distributions declared to shareholders for the last two fiscal years is as follows:
| | | | | | | | |
| | | Year ended
4/30/18 | | | Year ended
4/30/17 | |
| Ordinary income (including any short-term capital gains) | | | $149,082,041 | | | | $115,352,326 | |
The federal tax cost and the tax basis components of distributable earnings were as follows:
| | | | |
| As of 4/30/18 | | | |
| Cost of investments | | | $5,076,282,218 | |
| Gross appreciation | | | 27,126,435 | |
| Gross depreciation | | | (131,883,372 | ) |
| Net unrealized appreciation (depreciation) | | | $(104,756,937 | ) |
| Undistributed ordinary income | | | 10,496,975 | |
| Post-October capital loss deferral | | | (816,522 | ) |
| Other temporary differences | | | (13,091,483 | ) |
Multiple Classes of Shares of Beneficial Interest – The fund offers multiple classes of shares, which differ in their respective distribution and service fees. The fund’s income and common expenses are allocated to shareholders based on the value of settled shares outstanding of each class. The fund’s realized and unrealized gain (loss) are allocated to shareholders based on the daily net assets of each class. Dividends are declared separately for each class. Differences in per share dividend rates are generally due to differences in separate class expenses. Class B shares will convert to Class A shares approximately eight years after purchase. Effective April 23, 2018, Class C shares will convert to Class A shares approximately ten years after purchase. The fund’s distributions declared to shareholders as reported in the Statements of Changes in Net Assets are presented by class as follows:
| | | | | | | | |
| | | From net investment
income | |
| | | Year
ended
4/30/18 | | | Year
ended
4/30/17 | |
| Class A | | | $49,883,497 | | | | $54,890,580 | |
| Class B | | | 1,254,388 | | | | 1,676,152 | |
| Class C | | | 5,088,946 | | | | 6,449,209 | |
| Class I | | | 58,881,872 | | | | 41,196,697 | |
| Class R1 | | | 144,844 | | | | 169,923 | |
| Class R2 | | | 1,339,112 | | | | 1,667,753 | |
| Class R3 | | | 2,944,142 | | | | 2,063,656 | |
| Class R4 | | | 4,491,711 | | | | 5,502,187 | |
| Class R6 | | | 25,053,529 | | | | 1,736,169 | |
| Total | | | $149,082,041 | | | | $115,352,326 | |
38
Notes to Financial Statements – continued
(3) Transactions with Affiliates
Investment Adviser – The fund has an investment advisory agreement with MFS to provide overall investment management and related administrative services and facilities to the fund. The management fee is computed daily and paid monthly at the following annual rates based on the fund’s average daily net assets:
| | | | |
| Up to $1.1 billion | | | 0.39 | % |
| In excess of $1.1 billion | | | 0.38 | % |
MFS has agreed in writing to reduce its management fee by a specified amount if certain MFS mutual fund assets exceed thresholds agreed to by MFS and the fund’s Board of Trustees. For the year ended April 30, 2018, this management fee reduction amounted to $407,711, which is included in the reduction of total expenses in the Statement of Operations. The management fee incurred for the year ended April 30, 2018 was equivalent to an annual effective rate of 0.37% of the fund’s average daily net assets.
Distributor – MFS Fund Distributors, Inc. (MFD), a wholly-owned subsidiary of MFS, as distributor, received $158,467 for the year ended April 30, 2018, as its portion of the initial sales charge on sales of Class A shares of the fund.
The Board of Trustees has adopted a distribution plan for certain share classes pursuant to Rule 12b-1 of the Investment Company Act of 1940.
The fund’s distribution plan provides that the fund will pay MFD for services provided by MFD and financial intermediaries in connection with the distribution and servicing of certain share classes. One component of the plan is a distribution fee paid to MFD and another component of the plan is a service fee paid to MFD. MFD may subsequently pay all, or a portion, of the distribution and/or service fees to financial intermediaries.
Distribution Plan Fee Table:
| | | | | | | | | | | | | | | | | | | | |
| | | Distribution
Fee Rate (d) | | | Service
Fee Rate (d) | | | Total
Distribution
Plan (d) | | | Annual
Effective
Rate (e) | | | Distribution
and Service
Fee | |
| Class A | | | — | | | | 0.25% | | | | 0.25% | | | | 0.25% | | | | $4,160,295 | |
| Class B | | | 0.75% | | | | 0.25% | | | | 1.00% | | | | 1.00% | | | | 556,972 | |
| Class C | | | 0.75% | | | | 0.25% | | | | 1.00% | | | | 1.00% | | | | 2,261,132 | |
| Class R1 | | | 0.75% | | | | 0.25% | | | | 1.00% | | | | 1.00% | | | | 64,340 | |
| Class R2 | | | 0.25% | | | | 0.25% | | | | 0.50% | | | | 0.50% | | | | 243,582 | |
| Class R3 | | | — | | | | 0.25% | | | | 0.25% | | | | 0.25% | | | | 246,363 | |
| Total Distribution and Service Fees | | | | | | | | | | | | $7,532,684 | |
| (d) | In accordance with the distribution plan for certain classes, the fund pays distribution and/or service fees equal to these annual percentage rates of each class’s average daily net assets. The distribution and service fee rates disclosed by class represent the current rates in effect at the end of the reporting period. Any rate changes, if applicable, are detailed below. |
| (e) | The annual effective rates represent actual fees incurred under the distribution plan for the year ended April 30, 2018 based on each class’s average daily net assets. MFD has voluntarily agreed to rebate a portion of each class’s 0.25% service fee attributable to accounts for which MFD retains the 0.25% service fee except for accounts attributable to MFS or its affiliates’ seed money. For the year ended April 30, 2018, this rebate amounted to $53,994, $310, $706, |
39
Notes to Financial Statements – continued
| | $14, and $15 for Class A, Class B, Class C, Class R2, and Class R3, respectively, and is included in the reduction of total expenses in the Statement of Operations. |
Certain Class A shares are subject to a contingent deferred sales charge (CDSC) in the event of a shareholder redemption within 18 months of purchase. Class B shares are subject to a CDSC in the event of a shareholder redemption within six years of purchase. Class C shares are subject to a CDSC in the event of a shareholder redemption within 12 months of purchase. All contingent deferred sales charges are paid to MFD and during the year ended April 30, 2018, were as follows:
| | | | |
| | | Amount | |
| Class A | | | $77,465 | |
| Class B | | | 68,174 | |
| Class C | | | 19,326 | |
Shareholder Servicing Agent – MFS Service Center, Inc. (MFSC), a wholly-owned subsidiary of MFS, receives a fee from the fund for its services as shareholder servicing agent calculated as a percentage of the average daily net assets of the fund as determined periodically under the supervision of the fund’s Board of Trustees. For the year ended April 30, 2018, the fee was $432,542, which equated to 0.0090% annually of the fund’s average daily net assets. MFSC also receives payment from the fund for out-of-pocket expenses, sub-accounting and other shareholder servicing costs which may be paid to affiliated and unaffiliated service providers. Class R6 shares do not incur sub-accounting fees. For the year ended April 30, 2018, these out-of-pocket expenses, sub-accounting and other shareholder servicing costs amounted to $4,203,941.
Administrator – MFS provides certain financial, legal, shareholder communications, compliance, and other administrative services to the fund. Under an administrative services agreement, the fund reimburses MFS the costs incurred to provide these services. The fund is charged an annual fixed amount of $17,500 plus a fee based on average daily net assets. The administrative services fee incurred for the year ended April 30, 2018 was equivalent to an annual effective rate of 0.0134% of the fund’s average daily net assets.
Trustees’ and Officers’ Compensation – The fund pays compensation to independent Trustees in the form of a retainer, attendance fees, and additional compensation to Board and Committee chairpersons. The fund does not pay compensation directly to Trustees or officers of the fund who are also officers of the investment adviser, all of whom receive remuneration for their services to the fund from MFS. Certain officers and Trustees of the fund are officers or directors of MFS, MFD, and MFSC.
Prior to December 31, 2001, the fund had an unfunded defined benefit plan (“DB plan”) for independent Trustees. As of December 31, 2001, the Board took action to terminate the DB plan with respect to then-current and any future independent Trustees, such that the DB plan covers only certain of those former independent Trustees who retired on or before December 31, 2001. Effective January 1, 2002, accrued benefits under the DB plan for then-current independent Trustees who continued were credited to an unfunded retirement deferral plan (the “Retirement Deferral plan”), which was established for and exists solely with respect to these credited amounts, and is not available for other deferrals by these or other
40
Notes to Financial Statements – continued
independent Trustees. Although the Retirement Deferral plan is unfunded, amounts deferred under the plan are periodically adjusted for investment experience as if they had been invested in shares of the fund. The DB plan resulted in a pension expense of $3,244 and the Retirement Deferral plan resulted in an expense of $306. Both amounts are included in “Independent Trustees’ compensation” in the Statement of Operations for the year ended April 30, 2018. The liability for deferred retirement benefits payable to certain independent Trustees under both plans amounted to $15,574 at April 30, 2018, and is included in “Payable for independent Trustees’ compensation” in the Statement of Assets and Liabilities.
Other – This fund and certain other funds managed by MFS (the funds) have entered into a service agreement (the ISO Agreement) which provides for payment of fees solely by the funds to Tarantino LLC in return for the provision of services of an Independent Senior Officer (ISO) for the funds. Frank L. Tarantino serves as the ISO and is an officer of the funds and the sole member of Tarantino LLC. The funds can terminate the ISO Agreement with Tarantino LLC at any time under the terms of the ISO Agreement. For the year ended April 30, 2018, the fee paid by the fund under this agreement was $7,914 and is included in “Miscellaneous” expense in the Statement of Operations. MFS has agreed to bear all expenses associated with office space, other administrative support, and supplies provided to the ISO.
The fund invests in the MFS Institutional Money Market Portfolio which is managed by MFS and seeks current income consistent with preservation of capital and liquidity. This money market fund does not pay a management fee to MFS.
On March 16, 2017, MFS redeemed 86,129 shares of Class I for an aggregate amount of $1,179,105.
(4) Portfolio Securities
For the year ended April 30, 2018, purchases and sales of investments, other than short-term obligations, were as follows:
| | | | | | | | |
| | | Purchases | | | Sales | |
| U.S. Government securities | | | $125,513,814 | | | | $117,774,432 | |
| Non-U.S. Government securities | | | $2,417,384,033 | | | | $1,610,217,053 | |
41
Notes to Financial Statements – continued
(5) Shares of Beneficial Interest
The fund’s Declaration of Trust permits the Trustees to issue an unlimited number of full and fractional shares of beneficial interest. Transactions in fund shares were as follows:
| | | | | | | | | | | | | | | | |
| | | Year ended
4/30/18 | | | Year ended
4/30/17 | |
| | | Shares | | | Amount | | | Shares | | | Amount | |
| Shares sold | | | | | | | | | | | | | | | | |
Class A | | | 36,625,637 | | | | $511,901,113 | | | | 43,275,849 | | | | $604,285,516 | |
Class B | | | 207,453 | | | | 2,896,532 | | | | 415,882 | | | | 5,829,135 | |
Class C | | | 1,971,926 | | | | 27,537,501 | | | | 3,650,048 | | | | 51,046,388 | |
Class I | | | 75,710,906 | | | | 1,060,423,077 | | | | 121,326,111 | | | | 1,687,489,235 | |
Class R1 | | | 161,297 | | | | 2,241,256 | | | | 112,809 | | | | 1,571,358 | |
Class R2 | | | 721,719 | | | | 10,129,272 | | | | 774,206 | | | | 10,828,688 | |
Class R3 | | | 10,032,176 | | | | 140,649,290 | | | | 940,755 | | | | 13,162,478 | |
Class R4 | | | 2,216,023 | | | | 31,085,126 | | | | 4,430,292 | | | | 62,192,360 | |
Class R6 | | | 80,212,626 | | | | 1,121,933,287 | | | | 1,729,902 | | | | 23,933,059 | |
| | | 207,859,763 | | | | $2,908,796,454 | | | | 176,655,854 | | | | $2,460,338,217 | |
| | | | |
| Shares issued to shareholders in reinvestment of distributions | | | | | | | | | | | | | | | | |
Class A | | | 3,408,878 | | | | $47,647,180 | | | | 3,752,234 | | | | $52,508,291 | |
Class B | | | 86,259 | | | | 1,204,212 | | | | 114,438 | | | | 1,598,234 | |
Class C | | | 328,276 | | | | 4,577,246 | | | | 397,613 | | | | 5,545,735 | |
Class I | | | 2,793,122 | | | | 39,023,021 | | | | 2,478,105 | | | | 34,555,573 | |
Class R1 | | | 10,372 | | | | 144,713 | | | | 12,148 | | | | 169,558 | |
Class R2 | | | 90,607 | | | | 1,267,468 | | | | 112,881 | | | | 1,579,804 | |
Class R3 | | | 211,711 | | | | 2,939,390 | | | | 147,169 | | | | 2,059,110 | |
Class R4 | | | 273,160 | | | | 3,836,638 | | | | 371,198 | | | | 5,194,054 | |
Class R6 | | | 1,762,527 | | | | 24,544,835 | | | | 91,787 | | | | 1,282,388 | |
| | | 8,964,912 | | | | $125,184,703 | | | | 7,477,573 | | | | $104,492,747 | |
| | | | |
| Shares reacquired | | | | | | | | | | | | | | | | |
Class A | | | (32,849,699 | ) | | | $(459,223,762 | ) | | | (54,555,793 | ) | | | $(760,048,870 | ) |
Class B | | | (1,158,512 | ) | | | (16,148,945 | ) | | | (1,311,838 | ) | | | (18,278,326 | ) |
Class C | | | (6,277,077 | ) | | | (86,845,430 | ) | | | (5,516,287 | ) | | | (76,625,651 | ) |
Class I | | | (90,796,610 | ) | | | (1,266,384,743 | ) | | | (31,250,235 | ) | | | (435,337,120 | ) |
Class R1 | | | (207,591 | ) | | | (2,897,793 | ) | | | (148,989 | ) | | | (2,077,558 | ) |
Class R2 | | | (1,158,949 | ) | | | (16,241,466 | ) | | | (1,514,029 | ) | | | (21,140,945 | ) |
Class R3 | | | (2,268,040 | ) | | | (31,601,997 | ) | | | (1,380,292 | ) | | | (19,268,712 | ) |
Class R4 | | | (9,199,421 | ) | | | (129,134,085 | ) | | | (3,217,421 | ) | | | (44,764,480 | ) |
Class R6 | | | (8,913,161 | ) | | | (123,881,953 | ) | | | (793,884 | ) | | | (11,157,849 | ) |
| | | (152,829,060 | ) | | | $(2,132,360,174 | ) | | | (99,688,768 | ) | | | $(1,388,699,511 | ) |
42
Notes to Financial Statements – continued
| | | | | | | | | | | | | | | | |
| | | Year ended
4/30/18 | | | Year ended
4/30/17 | |
| | | Shares | | | Amount | | | Shares | | | Amount | |
| Net change | | | | | | | | | | | | | | | | |
Class A | | | 7,184,816 | | | | $100,324,531 | | | | (7,527,710 | ) | | | $(103,255,063 | ) |
Class B | | | (864,800 | ) | | | (12,048,201 | ) | | | (781,518 | ) | | | (10,850,957 | ) |
Class C | | | (3,976,875 | ) | | | (54,730,683 | ) | | | (1,468,626 | ) | | | (20,033,528 | ) |
Class I | | | (12,292,582 | ) | | | (166,938,645 | ) | | | 92,553,981 | | | | 1,286,707,688 | |
Class R1 | | | (35,922 | ) | | | (511,824 | ) | | | (24,032 | ) | | | (336,642 | ) |
Class R2 | | | (346,623 | ) | | | (4,844,726 | ) | | | (626,942 | ) | | | (8,732,453 | ) |
Class R3 | | | 7,975,847 | | | | 111,986,683 | | | | (292,368 | ) | | | (4,047,124 | ) |
Class R4 | | | (6,710,238 | ) | | | (94,212,321 | ) | | | 1,584,069 | | | | 22,621,934 | |
Class R6 | | | 73,061,992 | | | | 1,022,596,169 | | | | 1,027,805 | | | | 14,057,598 | |
| | | 63,995,615 | | | | $901,620,983 | | | | 84,444,659 | | | | $1,176,131,453 | |
Class T shares were not publicly available for sale during the period. Please see the fund’s prospectus for details.
(6) Line of Credit
The fund and certain other funds managed by MFS participate in a $1.25 billion unsecured committed line of credit, subject to a $1 billion sublimit, provided by a syndication of banks under a credit agreement. Borrowings may be made for temporary financing needs. Interest is charged to each fund, based on its borrowings, generally at a rate equal to the higher of the Overnight Federal Reserve funds rate or daily one month LIBOR plus an agreed upon spread. A commitment fee, based on the average daily, unused portion of the committed line of credit, is allocated among the participating funds at the end of each calendar quarter. In addition, the fund and other funds managed by MFS have established unsecured uncommitted borrowing arrangements with certain banks for temporary financing needs. Interest is charged to each fund, based on its borrowings, at a rate equal to the Overnight Federal Reserve funds rate plus an agreed upon spread. For the year ended April 30, 2018, the fund’s commitment fee and interest expense were $29,176 and $0, respectively, and are included in “Miscellaneous” expense in the Statement of Operations.
(7) Investments in Affiliated Issuers
An affiliated issuer may be considered one in which the fund owns 5% or more of the outstanding voting securities, or a company which is under common control. For the purposes of this report, the fund assumes the following to be affiliated issuers:
| | | | | | | | | | | | | | | | | | | | |
| Affiliated Issuers | | | | | Beginning
Shares/Par
Amount | | | Acquisitions
Shares/Par
Amount | | | Dispositions
Shares/Par
Amount | | | Ending
Shares/Par
Amount | |
| MFS Institutional Money Market Portfolio | | | | | | | 138,260,099 | | | | 1,819,314,674 | | | | (1,718,010,772 | ) | | | 239,564,001 | |
| | | | | |
| Affiliated Issuers | | Realized
Gain (Loss) | | | Change in
Unrealized
Appreciation
(Depreciation) | | | Capital Gain
Distributions | | | Dividend
Income | | | Ending Value | |
| MFS Institutional Money Market Portfolio | | | $(21,482 | ) | | | $(4,158 | ) | | | $— | | | | $2,498,360 | | | | $239,540,044 | |
43
REPORT OF INDEPENDENT REGISTERED PUBLIC ACCOUNTING FIRM
To the Board of Trustees of MFS Series Trust IX and the Shareholders of MFS Corporate Bond Fund:
Opinion on the Financial Statements and Financial Highlights
We have audited the accompanying statement of assets and liabilities of MFS Corporate Bond Fund (the “Fund”), including the portfolio of investments, as of April 30, 2018, the related statement of operations for the year then ended, the statements of changes in net assets for each of the two years in the period then ended, the financial highlights for each of the five years in the period then ended, and the related notes. In our opinion, the financial statements and financial highlights present fairly, in all material respects, the financial position of the Fund as of April 30, 2018, and the results of its operations for the year then ended, the changes in its net assets for each of the two years in the period then ended, and the financial highlights for each of the five years in the period then ended, in conformity with accounting principles generally accepted in the United States of America.
Basis for Opinion
These financial statements and financial highlights are the responsibility of the Fund’s management. Our responsibility is to express an opinion on the Fund’s financial statements and financial highlights based on our audits. We are a public accounting firm registered with the Public Company Accounting Oversight Board (United States) (PCAOB) and are required to be independent with respect to the Fund in accordance with the U.S. federal securities laws and the applicable rules and regulations of the Securities and Exchange Commission and the PCAOB.
We conducted our audits in accordance with the standards of the PCAOB. Those standards require that we plan and perform the audit to obtain reasonable assurance about whether the financial statements and financial highlights are free of material misstatement, whether due to error or fraud. The Fund is not required to have, nor were we engaged to perform, an audit of its internal control over financial reporting. As part of our audits we are required to obtain an understanding of internal control over financial reporting but not for the purpose of expressing an opinion on the effectiveness of the Fund’s internal control over financial reporting. Accordingly, we express no such opinion.
Our audits included performing procedures to assess the risks of material misstatement of the financial statements and financial highlights, whether due to error or fraud, and performing procedures that respond to those risks. Such procedures included examining, on a test basis, evidence regarding the amounts and disclosures in the financial statements and financial highlights. Our audits also included evaluating the accounting principles used and significant estimates made by management, as well as evaluating the overall presentation of the financial statements and financial highlights. Our procedures included confirmation of securities owned as of April 30, 2018, by correspondence with the custodian, brokers, and agent banks; when replies were not received from brokers or agent banks, we performed other auditing procedures. We believe that our audits provide a reasonable basis for our opinion.
DELOITTE & TOUCHE LLP
Boston, Massachusetts
June 18, 2018
We have served as the auditor of one or more of the MFS investment companies since 1924.
44
TRUSTEES AND OFFICERS — IDENTIFICATION AND BACKGROUND
The Trustees and Officers of the Trust, as of June 1, 2018, are listed below, together with their principal occupations during the past five years. (Their titles may have varied during that period.) The address of each Trustee and Officer is 111 Huntington Avenue, Boston, Massachusetts 02199-7618.
| | | | | | | | | | |
Name, Age | | Position(s) Held
with Fund | | Trustee/Officer Since (h) | | Number of MFS Funds overseen by the Trustee | | Principal
Occupations During the Past Five Years | | Other Directorships
During the Past
Five Years (j) |
| INTERESTED TRUSTEES |
Robert J. Manning (k) (age 54) | | Trustee | | February 2004 | | 135 | | Massachusetts Financial Services Company, Executive Chairman (since January 2017); Director; Chairman of the Board; Chief Executive Officer (until 2015); Co-Chief Executive Officer (2015-2016) | | N/A |
Robin A. Stelmach (k) (age 56) | | Trustee | | January 2014 | | 135 | | Massachusetts Financial Services Company, Vice Chair (since January 2017); Chief Operating Officer and Executive Vice President (until January 2017) | | N/A |
| INDEPENDENT TRUSTEES |
John P. Kavanaugh (age 63) | | Trustee and Chair of Trustees | | January 2009 | | 135 | | Private investor | | N/A |
45
Trustees and Officers – continued
| | | | | | | | | | |
Name, Age | | Position(s) Held
with Fund | | Trustee/Officer Since (h) | | Number of MFS Funds overseen by the Trustee | | Principal
Occupations During the Past Five Years | | Other Directorships
During the Past
Five Years (j) |
Steven E. Buller (age 66) | | Trustee | | February 2014 | | 135 | | Financial Accounting Standards Advisory Council, Chairman (2014-2015); Public Company Accounting Oversight Board, Standing Advisory Group, Member (until 2014); BlackRock, Inc. (investment management), Managing Director (until 2014), BlackRock Finco UK (investment management), Director (until 2014) | | N/A |
John A. Caroselli (age 63) | | Trustee | | March 2017 | | 135 | | JC Global Advisors, LLC (management consulting), President (since 2015); First Capital Corporation (commercial finance), Executive Vice President (until 2015) | | N/A |
Maureen R. Goldfarb (age 63) | | Trustee | | January 2009 | | 135 | | Private investor | | N/A |
Michael Hegarty (age 73) | | Trustee | | December 2004 | | 135 | | Private investor | | Rouse Properties Inc., Director (until 2016); Capmark Financial Group Inc., Director (until 2015) |
Clarence Otis, Jr. (age 62) | | Trustee | | March 2017 | | 135 | | Darden Restaurants, Inc., Chief Executive Officer (until 2014) | | VF Corporation, Director; Verizon Communications, Inc., Director; The Travelers Companies, Director; Federal Reserve Bank of Atlanta, Director (until 2015) |
46
Trustees and Officers – continued
| | | | | | | | | | |
Name, Age | | Position(s) Held
with Fund | | Trustee/Officer Since (h) | | Number of MFS Funds overseen by the Trustee | | Principal
Occupations During the Past Five Years | | Other Directorships
During the Past
Five Years (j) |
Maryanne L. Roepke (age 62) | | Trustee | | May 2014 | | 135 | | American Century Investments (investment management), Senior Vice President and Chief Compliance Officer (until 2014) | | N/A |
Laurie J. Thomsen (age 60) | | Trustee | | March 2005 | | 135 | | Private investor | | The Travelers Companies, Director; Dycom Industries, Inc., Director (since 2015) |
| | | | | | | | |
Name, Age | | Position(s) Held with Fund | | Trustee/Officer
Since (h) | | Number of MFS
Funds for which the
Person is an Officer | | Principal
Occupations During the Past Five Years |
| OFFICERS | | | | | | | | |
Christopher R. Bohane (k) (age 44) | | Assistant Secretary and Assistant Clerk | | July 2005 | | 135 | | Massachusetts Financial Services Company, Vice President and Assistant General Counsel |
Kino Clark (k) (age 49) | | Assistant Treasurer | | January 2012 | | 135 | | Massachusetts Financial Services Company, Vice President |
John W. Clark, Jr. (k) (age 51) | | Assistant Treasurer | | April 2017 | | 135 | | Massachusetts Financial Services Company, Vice President (since March 2017); Deutsche Bank (financial services), Department Head – Treasurer’s Office (until February 2017) |
Thomas H. Connors (k) (age 58) | | Assistant Secretary and Assistant Clerk | | September 2012 | | 135 | | Massachusetts Financial Services Company, Vice President and Senior Counsel |
47
Trustees and Officers – continued
| | | | | | | | |
Name, Age | | Position(s) Held with Fund | | Trustee/Officer
Since (h) | | Number of MFS
Funds for which the
Person is an Officer | | Principal
Occupations During the Past Five Years |
Ethan D. Corey (k) (age 54) | | Assistant Secretary and Assistant Clerk | | July 2005 | | 135 | | Massachusetts Financial Services Company, Senior Vice President and Associate General Counsel |
David L. DiLorenzo (k) (age 49) | | President | | July 2005 | | 135 | | Massachusetts Financial Services Company, Senior Vice President |
Heidi W. Hardin (k) (age 50) | | Secretary and Clerk | | April 2017 | | 135 | | Massachusetts Financial Services Company, Executive Vice President and General Counsel (since March 2017); Harris Associates (investment management), General Counsel (from September 2015 to January 2017); Janus Capital Management LLC (investment management), Senior Vice President and General Counsel (until September 2015) |
Brian E. Langenfeld (k) (age 45) | | Assistant Secretary and Assistant Clerk | | June 2006 | | 135 | | Massachusetts Financial Services Company, Vice President and Senior Counsel |
Susan A. Pereira (k) (age 47) | | Assistant Secretary and Assistant Clerk | | July 2005 | | 135 | | Massachusetts Financial Services Company, Vice President and Senior Counsel |
Kasey L. Phillips (k) (age 47) | | Assistant Treasurer | | September 2012 | | 135 | | Massachusetts Financial Services Company, Vice President |
48
Trustees and Officers – continued
| | | | | | | | |
Name, Age | | Position(s) Held with Fund | | Trustee/Officer
Since (h) | | Number of MFS
Funds for which the
Person is an Officer | | Principal
Occupations During the Past Five Years |
Matthew A. Stowe (k) (age 43) | | Assistant Secretary and Assistant Clerk | | October 2014 | | 135 | | Massachusetts Financial Services Company, Vice President and Assistant General Counsel |
Frank L. Tarantino (age 74) | | Independent Senior Officer | | June 2004 | | 135 | | Tarantino LLC (provider of compliance services), Principal |
Richard S. Weitzel (k) (age 47) | | Assistant Secretary and Assistant Clerk | | October 2007 | | 135 | | Massachusetts Financial Services Company, Senior Vice President and Associate General Counsel |
Martin J. Wolin (k) (age 50) | | Chief Compliance Officer | | July 2015 | | 135 | | Massachusetts Financial Services Company, Senior Vice President and Chief Compliance Officer (since July 2015); Mercer (financial service provider), Chief Risk and Compliance Officer, North America and Latin America (until June 2015) |
James O. Yost (k) (age 57) | | Treasurer | | September 1990 | | 135 | | Massachusetts Financial Services Company, Senior Vice President |
| (h) | Date first appointed to serve as Trustee/officer of an MFS Fund. Each Trustee has served continuously since appointment unless indicated otherwise. For the period from December 15, 2004 until February 22, 2005, Mr. Manning served as Advisory Trustee. Prior to January 2012, Messrs. DiLorenzo and Yost served as Assistant Treasurers of the Funds. From January 2012 through December 2016, Messrs. DiLorenzo and Yost served as Treasurer and Deputy Treasurer of the Funds, respectively. |
| (j) | Directorships or trusteeships of companies required to report to the Securities and Exchange Commission (i.e., “public companies”). |
| (k) | “Interested person” of the Trust within the meaning of the Investment Company Act of 1940 (referred to as the 1940 Act), which is the principal federal law governing investment companies like the fund, as a result of a position with MFS. The address of MFS is 111 Huntington Avenue, Boston, Massachusetts 02199-7618. |
49
Trustees and Officers – continued
Each Trustee has been elected by shareholders and each Trustee and officer holds office until his or her successor is chosen and qualified or until his or her earlier death, resignation, retirement or removal. The Trust does not hold annual meetings for the purpose of electing Trustees, and Trustees are not elected for fixed terms. Under the terms of the Board’s retirement policy, an Independent Trustee shall retire at the end of the calendar year in which he or she reaches the earlier of 75 years of age or 15 years of service on the Board (or, in the case of any Independent Trustee who joined the Board prior to 2015, 20 years of service on the Board).
Messrs. Buller and Otis and Ms. Roepke are members of the Trust’s Audit Committee.
Each of the Interested Trustees and certain Officers hold comparable officer positions with certain affiliates of MFS.
The Statement of Additional Information for a Fund includes further information about the Trustees and is available without charge upon request by calling 1-800-225-2606.
| | |
| Investment Adviser | | Custodian |
Massachusetts Financial Services Company
111 Huntington Avenue
Boston, MA 02199-7618 | | JPMorgan Chase Bank, NA 4 Metrotech Center New York, NY 11245 |
| Distributor | | Independent Registered Public Accounting Firm |
MFS Fund Distributors, Inc.
111 Huntington Avenue
Boston, MA 02199-7618 | | Deloitte & Touche LLP 200 Berkeley Street Boston, MA 02116 |
| Portfolio Manager(s) | | |
Richard Hawkins | | |
Alexander Mackey | | |
| Robert Persons | | |
50
PROXY VOTING POLICIES AND INFORMATION
MFS votes proxies on behalf of the fund pursuant to proxy voting policies and procedures that are available without charge, upon request, by calling 1-800-225-2606, by visiting mfs.com/proxyvoting, or by visiting the SEC’s Web site at http://www.sec.gov.
Information regarding how the fund voted proxies relating to portfolio securities during the most recent twelve-month period ended June 30 is available by August 31 of each year without charge by visiting mfs.com/proxyvoting, or by visiting the SEC’s Web site at http://www.sec.gov.
QUARTERLY PORTFOLIO DISCLOSURE
The fund will file a complete schedule of portfolio holdings with the Securities and Exchange Commission (the Commission) for the first and third quarters of each fiscal year on Form N-Q. A shareholder can obtain the quarterly portfolio holdings report at mfs.com. The fund’s Form N-Q is also available on the EDGAR database on the Commission’s Internet Web site at http://www.sec.gov, and may be reviewed and copied at the:
Public Reference Room
Securities and Exchange Commission
100 F Street, NE, Room 1580
Washington, D.C. 20549
Information on the operation of the Public Reference Room may be obtained by calling the Commission at 1-800-SEC-0330. Copies of the fund’s Form N-Q also may be obtained, upon payment of a duplicating fee, by electronic request at the following e-mail address: publicinfo@sec.gov or by writing the Public Reference Section at the above address.
FURTHER INFORMATION
From time to time, MFS may post important information about the fund or the MFS funds on the MFS web site (mfs.com). This information is available at https://www.mfs.com/en-us/what-we-do/announcements.html or at mfs.com/openendfunds by choosing the fund’s name.
51
INFORMATION ABOUT FUND CONTRACTS AND LEGAL CLAIMS
The fund has entered into contractual arrangements with an investment adviser, administrator, distributor, shareholder servicing agent, 529 program manager (if applicable), and custodian who each provide services to the fund. Unless expressly stated otherwise, shareholders are not parties to, or intended beneficiaries of these contractual arrangements, and these contractual arrangements are not intended to create any shareholder right to enforce them against the service providers or to seek any remedy under them against the service providers, either directly or on behalf of the fund.
Under the Trust’s By-Laws and Declaration of Trust, any claims asserted against or on behalf of the MFS Funds, including claims against Trustees and Officers, must be brought in state and federal courts located within the Commonwealth of Massachusetts.
FEDERAL TAX INFORMATION (unaudited)
The fund will notify shareholders of amounts for use in preparing 2018 income tax forms in January 2019.
52
rev. 3/16
| | | | |
| | | |
FACTS | | WHAT DOES MFS DO WITH YOUR PERSONAL INFORMATION? | |  |
| | |
| Why? | | Financial companies choose how they share your personal information. Federal law gives consumers the right to limit some but not all sharing. Federal law also requires us to tell you how we collect, share, and protect your personal information. Please read this notice carefully to understand what we do. |
| | |
| What? | | The types of personal information we collect and share depend on the product or service you have with us. This information can include: • Social Security number and account balances • Account transactions and transaction history • Checking account information and wire transfer instructions When you are no longer our customer, we continue to share your information as described in this notice. |
| | |
| How? | | All financial companies need to share customers’ personal information to run their everyday business. In the section below, we list the reasons financial companies can share their customers’ personal information; the reasons MFS chooses to share; and whether you can limit this sharing. |
| | | | |
Reasons we can share your
personal information | | Does MFS
share? | | Can you limit
this sharing? |
For our everyday business purposes – such as to process your transactions, maintain your account(s), respond to court orders and legal investigations, or report to credit bureaus | | Yes | | No |
For our marketing purposes – to offer our products and services to you | | No | | We don’t share |
For joint marketing with other financial companies | | No | | We don’t share |
For our affiliates’ everyday business purposes – information about your transactions and experiences | | No | | We don’t share |
For our affiliates’ everyday business purposes – information about your creditworthiness | | No | | We don’t share |
| For nonaffiliates to market to you | | No | | We don’t share |
| | |
| Questions? | | Call 800-225-2606 or go to mfs.com. |
53
| | |
| Who we are |
| Who is providing this notice? | | MFS Funds, MFS Investment Management, MFS Institutional Advisors, Inc., and MFS Heritage Trust Company. |
| | |
| What we do |
| How does MFS protect my personal information? | | To protect your personal information from unauthorized access and use, we use security measures that comply with federal law. These measures include procedural, electronic, and physical safeguards for the protection of the personal information we collect about you. |
| How does MFS collect my personal information? | | We collect your personal information, for example, when you • open an account or provide account information • direct us to buy securities or direct us to sell your securities • make a wire transfer We also collect your personal information from others, such as credit bureaus, affiliates, or other companies. |
| Why can’t I limit all sharing? | | Federal law gives you the right to limit only • sharing for affiliates’ everyday business purposes – information about your creditworthiness • affiliates from using your information to market to you • sharing for nonaffiliates to market to you State laws and individual companies may give you additional rights to limit sharing. |
| | |
| Definitions |
| Affiliates | | Companies related by common ownership or control. They can be financial and nonfinancial companies. • MFS does not share personal information with affiliates, except for everyday business purposes as described on page one of this notice. |
| Nonaffiliates | | Companies not related by common ownership or control. They can be financial and nonfinancial companies. • MFS does not share with nonaffiliates so they can market to you. |
| Joint marketing | | A formal agreement between nonaffiliated financial companies that together market financial products or services to you. • MFS doesn’t jointly market. |
| | |
| Other important information |
| If you own an MFS product or receive an MFS service in the name of a third party such as a bank or broker-dealer, their privacy policy may apply to you instead of ours. |
54
Save paper with eDelivery.

| MFS® will send you prospectuses, |
reports, and proxies directly via e-mail so you will get information faster with less mailbox clutter.
To sign up:
1. Go to mfs.com.
2. Log in via MFS® Access.
3. Select eDelivery.
If you own your MFS fund shares through a financial institution or a retirement plan, MFS® TALK, MFS® Access, or eDelivery may not be available to you.
CONTACT
WEB SITE
mfs.com
MFS TALK
1-800-637-8255
24 hours a day
ACCOUNT SERVICE AND LITERATURE
Shareholders
1-800-225-2606
Financial advisors
1-800-343-2829
Retirement plan services
1-800-637-1255
MAILING ADDRESS
MFS Service Center, Inc.
P.O. Box 55824
Boston, MA 02205-5824
OVERNIGHT MAIL
MFS Service Center, Inc.
c/o DST Asset Manager Solutions, Inc.
30 Dan Road
Canton, MA 02021-2809
Annual Report
April 30, 2018

MFS® Limited Maturity Fund

MQL-ANN
MFS® Limited Maturity Fund
CONTENTS
The report is prepared for the general information of shareholders.
It is authorized for distribution to prospective investors only when preceded or accompanied by a current prospectus.
NOT FDIC INSURED • MAY LOSE VALUE • NO BANK GUARANTEE

LETTER FROM THE EXECUTIVE CHAIRMAN
Dear Shareholders:
Rising bond yields have led to a measurable uptick in market volatility — a departure from the low-volatility environment that prevailed for much of 2017. In recent months,
against this backdrop, global markets have given back some of the strong gains recorded during 2017 and early 2018. Global economic growth remains robust, notwithstanding signs of a modest slowdown over the past few months, particularly in Europe.
Although the U.S. Federal Reserve continues to gradually raise interest rates and shrink its balance sheet, monetary policy remains accommodative around the world, with many central banks taking only tentative steps toward tighter policies. Newly enacted U.S. tax reforms have been welcomed by equity markets, while emerging market economies have benefited from a weaker U.S. dollar.
Around the world, inflation remains largely subdued, but tight labor markets and solid global demand have investors on the lookout for its potential resurgence. Increased U.S. protectionism is also a growing concern, as investors fear that trade friction could disrupt the synchronized rise in global growth.
As a global investment manager, MFS® strives to create long-term value and protect capital for clients through an active approach and an investment platform built on nearly a century of expertise. To make that long-term value meaningful for clients, we work to align with you on our beliefs, your needs and the time it takes to deliver on your desired outcomes.
Respectfully,

Robert J. Manning
Executive Chairman
MFS Investment Management
June 18, 2018
The opinions expressed in this letter are subject to change and may not be relied upon for investment advice. No forecasts can be guaranteed.
1
PORTFOLIO COMPOSITION
Portfolio structure (i)

| | | | |
| Fixed income sectors (i) | | | | |
| Investment Grade Corporates | | | 54.5% | |
| Asset-Backed Securities | | | 12.1% | |
| Collateralized Debt Obligations | | | 11.4% | |
| U.S. Treasury Securities | | | 8.3% | |
| Commercial Mortgage-Backed Securities | | | 4.2% | |
| Non-U.S. Government Bonds | | | 3.0% | |
| Emerging Markets Bonds | | | 2.4% | |
| Residential Mortgage-Backed Securities | | | 1.9% | |
| Mortgage-Backed Securities | | | 0.8% | |
| Municipal Bonds | | | 0.6% | |
| U.S. Government Agencies | | | 0.3% | |
| High Yield Corporates (o) | | | 0.0% | |
| | | | |
| Composition including fixed income credit quality (a)(i) | |
| AAA | | | 9.2% | |
| AA | | | 19.6% | |
| A | | | 30.8% | |
| BBB | | | 29.1% | |
| BB | | | 0.1% | |
| B | | | 0.1% | |
| CC | | | 0.1% | |
| C (o) | | | 0.0% | |
| D | | | 0.2% | |
| U.S. Government | | | 8.3% | |
| Federal Agencies | | | 1.2% | |
| Not Rated | | | 0.8% | |
| Cash & Cash Equivalents | | | 0.5% | |
| |
| Portfolio facts (i) | | | | |
| Average Duration (d) | | | 1.7 | |
| Average Effective Maturity (m) | | | 3.1 yrs. | |
|
| Issuer country weightings (i)(x) | |
| United States | | | 74.9% | |
| United Kingdom | | | 5.6% | |
| France | | | 2.8% | |
| Japan | | | 2.4% | |
| Canada | | | 2.1% | |
| Netherlands | | | 2.1% | |
| Switzerland | | | 1.9% | |
| China | | | 1.6% | |
| Sweden | | | 1.2% | |
| Other Countries | | | 5.4% | |
2
Portfolio Composition – continued
| (a) | For all securities other than those specifically described below, ratings are assigned to underlying securities utilizing ratings from Moody’s, Fitch, and Standard & Poor’s rating agencies and applying the following hierarchy: If all three agencies provide a rating, the middle rating (after dropping the highest and lowest ratings) is assigned; if two of the three agencies rate a security, the lower of the two is assigned. Ratings are shown in the S&P and Fitch scale (e.g., AAA). Securities rated BBB or higher are considered investment grade. All ratings are subject to change. U.S. Government includes securities issued by the U.S. Department of the Treasury. Federal Agencies includes rated and unrated U.S. Agency fixed-income securities, U.S. Agency mortgage-backed securities, and collateralized mortgage obligations of U.S. Agency mortgage-backed securities. Not Rated includes fixed income securities, including fixed income futures contracts, which have not been rated by any rating agency. The fund may or may not have held all of these instruments on this date. The fund is not rated by these agencies. |
| (d) | Duration is a measure of how much a bond’s price is likely to fluctuate with general changes in interest rates, e.g., if rates rise 1.00%, a bond with a 5-year duration is likely to lose about 5.00% of its value due to the interest rate move. |
| (i) | For purposes of this presentation, the components include the value of securities, and reflect the impact of the equivalent exposure of derivative positions, if any. These amounts may be negative from time to time. Equivalent exposure is a calculated amount that translates the derivative position into a reasonable approximation of the amount of the underlying asset that the portfolio would have to hold at a given point in time to have the same price sensitivity that results from the portfolio’s ownership of the derivative contract. When dealing with derivatives, equivalent exposure is a more representative measure of the potential impact of a position on portfolio performance than value. The bond component will include any accrued interest amounts. |
| (m) | In determining an instrument’s effective maturity for purposes of calculating the fund’s dollar-weighted average effective maturity, MFS uses the instrument’s stated maturity or, if applicable, an earlier date on which MFS believes it is probable that a maturity-shortening device (such as a put, pre-refunding or prepayment) will cause the instrument to be repaid. Such an earlier date can be substantially shorter than the instrument’s stated maturity. |
| (x) | Represents the portfolio’s exposure to issuer countries as a percentage of a portfolio’s net assets. For purposes of this presentation, United States includes Cash & Cash Equivalents. |
Where the fund holds convertible bonds, they are treated as part of the equity portion of the portfolio.
Cash & Cash Equivalents includes any cash, investments in money market funds, short-term securities, and other assets less liabilities. Please see the Statement of Assets and Liabilities for additional information related to the fund’s cash position and other assets and liabilities.
Percentages are based on net assets as of April 30, 2018.
The portfolio is actively managed and current holdings may be different.
3
MANAGEMENT REVIEW
Summary of Results
For the twelve months ended April 30, 2018, Class A shares of the MFS Limited Maturity Fund (“fund”) provided a total return of 0.36%, at net asset value. This compares with a return of –0.05% for the fund’s benchmark, the Bloomberg Barclays 1-3 Year U.S. Government/Credit Bond Index.
Market Environment
Despite continued solid global economic growth, financial markets were buffeted by increased volatility late in the reporting period. The increase in volatility dented what appeared to have been high levels of investor confidence, leading to a correction in elevated valuations. Valuations are now more in line with long-term averages after the recent bout of market weakness. So far, the rise in volatility has not disrupted the synchronized upturn in growth, though developed markets showed signs of a modest slowdown in the expansion’s pace in early 2018.
During the period, the US Federal Reserve raised rates by 75 basis points, bringing the total number of hikes to six since the central bank began to normalize monetary policy in late 2015. The growth rate in the US, eurozone and Japan remains above potential, though inflation remains contained, particularly outside the US. In the middle of the period, the European Central Bank announced that it was extending its asset purchase program until the end of September 2018, but cut its pace of asset purchases in half as economic conditions improved. Both the Bank of England (“BOE”) and the Bank of Canada raised rates during the period, the BOE for the first time in a decade. The European political backdrop became a bit less volatile late in the period, with populist parties gaining an increased share of the vote, but thus far falling short of majorities in eurozone member states.
Bond yields rose in most developed economies during the period, but they remain low by historic standards. Credit spreads remain relatively tight, but widened modestly late in the period as market volatility increased. Increasing concern over growing global trade friction risks weighed on the strong global trade volumes seen during the period’s second half. The US announced broad-based tariffs on imports of steel and aluminum during the period, though some nations have been exempted, and later targeted China for tariffs, in retaliation for what it believes is abuse of intellectual property rights. Growing fears of wider trade skirmishes have added to volatility.
Factors Affecting Performance
Relative to the Bloomberg Barclays 1-3 Year U.S. Government/Credit Bond Index, the fund’s greater exposure to the asset backed securities (ABS), industrials and financials sectors, and a lesser exposure to the treasury sector, contributed to relative performance. Strong security selection within both “A” and “BBB” rated (r) securities also benefited relative results. The fund’s shorter duration (d) stance further helped
4
Management Review – continued
relative performance as interest rates rose during the period. Relative to the benchmark, the fund’s positioning along the yield curve (y) detracted from performance.
Respectfully,
Portfolio Manager(s)
Philipp Burgener and Alexander Mackey
| (d) | Duration is a measure of how much a bond’s price is likely to fluctuate with general changes in interest rates, e.g., if rates rise 1.00%, a bond with a 5-year duration is likely to lose about 5.00% of its value. |
| (r) | Bonds rated “BBB”, “Baa”, or higher are considered investment grade; bonds rated “BB”, “Ba”, or below are considered non-investment grade. The sources for bond quality ratings are Moody’s Investors Service, Standard & Poor’s and Fitch, Inc. and are applied using the following hierarchy: If all three agencies provide a rating, the middle rating (after dropping the highest and lowest ratings) is assigned; if two of the three agencies rate a security, the lower of the two is assigned. Ratings are shown in the S&P and Fitch scale (e.g., AAA). For securities which are not rated by any of the three agencies, the security is considered Not Rated. |
| (y) | A yield curve graphically depicts the yields of different maturity bonds of the same credit quality and type; a normal yield curve is upward sloping, with short-term rates lower than long-term rates. |
The views expressed in this report are those of the portfolio manager(s) only through the end of the period of the report as stated on the cover and do not necessarily reflect the views of MFS or any other person in the MFS organization. These views are subject to change at any time based on market or other conditions, and MFS disclaims any responsibility to update such views. These views may not be relied upon as investment advice or an indication of trading intent on behalf of any MFS portfolio. References to specific securities are not recommendations of such securities, and may not be representative of any MFS portfolio’s current or future investments.
5
PERFORMANCE SUMMARY THROUGH 4/30/18
The following chart illustrates a representative class of the fund’s historical performance in comparison to its benchmark(s). Performance results include the deduction of the maximum applicable sales charge and reflect the percentage change in net asset value, including reinvestment of dividends and capital gains distributions. The performance of other share classes will be greater than or less than that of the class depicted below. Benchmarks are unmanaged and may not be invested in directly. Benchmark returns do not reflect sales charges, commissions or expenses. (See Notes to Performance Summary.)
Performance data shown represents past performance and is no guarantee of future results. Investment return and principal value fluctuate so your shares, when sold, may be worth more or less than the original cost; current performance may be lower or higher than quoted. The performance shown does not reflect the deduction of taxes, if any, that a shareholder would pay on fund distributions or the redemption of fund shares.
Growth of a Hypothetical $10,000 Investment
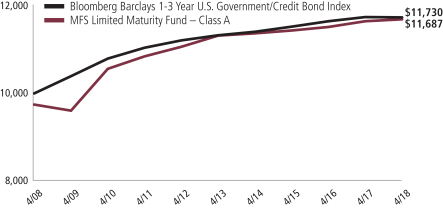
6
Performance Summary – continued
Total Returns through 4/30/18
Average annual without sales charge
| | | | | | | | | | | | | | |
| | | Share Class | | Class Inception Date | | 1-yr | | 5-yr | | 10-yr | | Life (t) | | |
| | | A | | 2/26/92 | | 0.36% | | 0.64% | | 1.83% | | N/A | | |
| | | B | | 9/07/93 | | (0.39)% | | (0.12)% | | 1.06% | | N/A | | |
| | | C | | 7/01/94 | | (0.49)% | | (0.21)% | | 0.95% | | N/A | | |
| | | I | | 1/02/97 | | 0.51% | | 0.79% | | 1.96% | | N/A | | |
| | | R1 | | 4/01/05 | | (0.49)% | | (0.21)% | | 0.97% | | N/A | | |
| | | R2 | | 10/31/03 | | 0.11% | | 0.36% | | 1.56% | | N/A | | |
| | | R3 | | 4/01/05 | | 0.26% | | 0.58% | | 1.73% | | N/A | | |
| | | R4 | | 4/01/05 | | 0.51% | | 0.76% | | 1.96% | | N/A | | |
| | | R6 | | 9/04/12 | | 0.58% | | 0.87% | | N/A | | 1.01% | | |
| | | 529A | | 7/31/02 | | 0.31% | | 0.56% | | 1.74% | | N/A | | |
| | | 529B | | 7/31/02 | | (0.29)% | | (0.14)% | | 1.00% | | N/A | | |
| | | 529C | | 7/31/02 | | (0.53)% | | (0.29)% | | 0.88% | | N/A | | |
| Comparative benhmark(s) | | | | | | | | | | |
| | | Bloomberg Barclays 1-3 Year U.S. Government/Credit Bond
Index (f) | | (0.05)% | | 0.71% | | 1.61% | | N/A | | |
| Average annual with sales charge | | | | | | | | | | |
| | | A
With Initial Sales Charge (2.50%) | | (2.14)% | | 0.14% | | 1.57% | | N/A | | |
| | | B
With CDSC (Declining over six years from 4% to 0%) (v) | | (4.33)% | | (0.51)% | | 1.06% | | N/A | | |
| | | C
With CDSC (1% for 12 months) (v) | | (1.47)% | | (0.21)% | | 0.95% | | N/A | | |
| | | 529A
With Initial Sales Charge (2.50%) | | (2.20)% | | 0.05% | | 1.48% | | N/A | | |
| | | 529B
With CDSC (Declining over six years from 4% to 0%) (v) | | (4.24)% | | (0.53)% | | 1.00% | | N/A | | |
| | | 529C
With CDSC (1% for 12 months) (v) | | (1.52)% | | (0.29)% | | 0.88% | | N/A | | |
CDSC – Contingent Deferred Sales Charge.
Class I, R1, R2, R3, R4, and R6 shares do not have a sales charge.
| (f) | Source: FactSet Research Systems Inc. |
| (t) | For the period from the class inception date through the stated period end (for those share classes with less than 10 years of performance history). No comparative benchmark performance information is provided for “life” periods. (See Notes to Performance Summary.) |
| (v) | Assuming redemption at the end of the applicable period. |
7
Performance Summary – continued
Benchmark Definition(s)
Bloomberg Barclays 1-3 Year U.S. Government/Credit Bond Index – a market capitalization-weighted index that measures the performance of the short-term (1 to 3 years) investment-grade corporate and U.S. government bond markets.
It is not possible to invest directly in an index.
Notes to Performance Summary
Class 529 shares are only available in conjunction with qualified tuition programs, such as the MFS 529 Savings Plan. There also is an additional fee, which is detailed in the program description, on qualified tuition programs. If this fee was reflected, the performance for Class 529 shares would have been lower. This annual fee is waived for Oregon residents and for those accounts with assets of $25,000 or more.
Average annual total return represents the average annual change in value for each share class for the periods presented. Life returns are presented where the share class has less than 10 years of performance history and represent the average annual total return from the class inception date to the stated period end date. As the fund’s share classes may have different inception dates, the life returns may represent different time periods and may not be comparable. As a result, no comparative benchmark performance information is provided for life periods.
Performance results reflect any applicable expense subsidies and waivers in effect during the periods shown. Without such subsidies and waivers the fund’s performance results would be less favorable. Please see the prospectus and financial statements for complete details.
Performance results do not include adjustments made for financial reporting purposes in accordance with U.S. generally accepted accounting principles and may differ from amounts reported in the financial highlights.
From time to time the fund may receive proceeds from litigation settlements, without which performance would be lower.
8
EXPENSE TABLE
Fund expenses borne by the shareholders during the period, November 1, 2017 through April 30, 2018
As a shareholder of the fund, you incur two types of costs: (1) transaction costs, including sales charges (loads) on certain purchase or redemption payments, and (2) ongoing costs, including management fees; distribution and service (12b-1) fees; and other fund expenses. This example is intended to help you understand your ongoing costs (in dollars) of investing in the fund and to compare these costs with the ongoing costs of investing in other mutual funds.
The example is based on an investment of $1,000 invested at the beginning of the period and held for the entire period November 1, 2017 through April 30, 2018.
The expenses include the payment of a portion of the transfer-agent-related expenses of MFS funds that invest in the fund. For further information, please see the Notes to Financial Statements.
Actual Expenses
The first line for each share class in the following table provides information about actual account values and actual expenses. You may use the information in this line, together with the amount you invested, to estimate the expenses that you paid over the period. Simply divide your account value by $1,000 (for example, an $8,600 account value divided by $1,000 = 8.6), then multiply the result by the number in the first line under the heading entitled “Expenses Paid During Period” to estimate the expenses you paid on your account during this period.
Hypothetical Example for Comparison Purposes
The second line for each share class in the following table provides information about hypothetical account values and hypothetical expenses based on the fund’s actual expense ratio and an assumed rate of return of 5% per year before expenses, which is not the fund’s actual return. The hypothetical account values and expenses may not be used to estimate the actual ending account balance or expenses you paid for the period. You may use this information to compare the ongoing costs of investing in the fund and other funds. To do so, compare this 5% hypothetical example with the 5% hypothetical examples that appear in the shareholder reports of the other funds.
Please note that the expenses shown in the table are meant to highlight your ongoing costs only and do not reflect any transactional costs, such as sales charges (loads). Therefore, the second line for each share class in the table is useful in comparing ongoing costs only, and will not help you determine the relative total costs of owning different funds. In addition, if these transactional costs were included, your costs would have been higher.
9
Expense Table – continued
| | | | | | | | | | | | | | | | | | |
Share
Class | | | | Annualized
Expense
Ratio | | | Beginning
Account Value
11/01/17 | | | Ending Account Value
4/30/18 | | | Expenses
Paid During
Period (p) 11/01/17-4/30/18 | |
| A | | Actual | | | 0.72% | | | | $1,000.00 | | | | $997.27 | | | | $3.57 | |
| | Hypothetical (h) | | | 0.72% | | | | $1,000.00 | | | | $1,021.22 | | | | $3.61 | |
| B | | Actual | | | 1.47% | | | | $1,000.00 | | | | $991.81 | | | | $7.26 | |
| | Hypothetical (h) | | | 1.47% | | | | $1,000.00 | | | | $1,017.50 | | | | $7.35 | |
| C | | Actual | | | 1.57% | | | | $1,000.00 | | | | $991.33 | | | | $7.75 | |
| | Hypothetical (h) | | | 1.57% | | | | $1,000.00 | | | | $1,017.01 | | | | $7.85 | |
| I | | Actual | | | 0.57% | | | | $1,000.00 | | | | $996.27 | | | | $2.82 | |
| | Hypothetical (h) | | | 0.57% | | | | $1,000.00 | | | | $1,021.97 | | | | $2.86 | |
| R1 | | Actual | | | 1.57% | | | | $1,000.00 | | | | $991.31 | | | | $7.75 | |
| | Hypothetical (h) | | | 1.57% | | | | $1,000.00 | | | | $1,017.01 | | | | $7.85 | |
| R2 | | Actual | | | 0.97% | | | | $1,000.00 | | | | $994.32 | | | | $4.80 | |
| | Hypothetical (h) | | | 0.97% | | | | $1,000.00 | | | | $1,019.98 | | | | $4.86 | |
| R3 | | Actual | | | 0.83% | | | | $1,000.00 | | | | $995.10 | | | | $4.11 | |
| | Hypothetical (h) | | | 0.83% | | | | $1,000.00 | | | | $1,020.68 | | | | $4.16 | |
| R4 | | Actual | | | 0.57% | | | | $1,000.00 | | | | $996.32 | | | | $2.82 | |
| | Hypothetical (h) | | | 0.57% | | | | $1,000.00 | | | | $1,021.97 | | | | $2.86 | |
| R6 | | Actual | | | 0.50% | | | | $1,000.00 | | | | $996.67 | | | | $2.48 | |
| | Hypothetical (h) | | | 0.50% | | | | $1,000.00 | | | | $1,022.32 | | | | $2.51 | |
| 529A | | Actual | | | 0.77% | | | | $1,000.00 | | | | $995.32 | | | | $3.81 | |
| | Hypothetical (h) | | | 0.77% | | | | $1,000.00 | | | | $1,020.98 | | | | $3.86 | |
| 529B | | Actual | | | 1.51% | | | | $1,000.00 | | | | $993.15 | | | | $7.46 | |
| | Hypothetical (h) | | | 1.51% | | | | $1,000.00 | | | | $1,017.31 | | | | $7.55 | |
| 529C | | Actual | | | 1.62% | | | | $1,000.00 | | | | $991.12 | | | | $8.00 | |
| | Hypothetical (h) | | | 1.62% | | | | $1,000.00 | | | | $1,016.76 | | | | $8.10 | |
| (h) | 5% class return per year before expenses. |
| (p) | “Expenses Paid During Period” are equal to each class’s annualized expense ratio, as shown above, multiplied by the average account value over the period, multiplied by 181/365 (to reflect the one-half year period). Expenses paid do not include any applicable sales charges (loads). If these transaction costs had been included, your costs would have been higher. |
Notes to Expense Table
Each class with a Rule 12b-1 service fee is subject to a rebate of a portion of such fee. Such rebates are included in the expense ratios above. For Class 529A, 529B and 529C shares, this rebate reduced the expense ratios above by 0.01%. See Note 3 in the Notes to Financial Statements for additional information.
10
PORTFOLIO OF INVESTMENTS
4/30/18
The Portfolio of Investments is a complete list of all securities owned by your fund. It is categorized by broad-based asset classes.
| | | | | | | | |
| Bonds - 99.0% | | | | | | | | |
| Issuer | | Shares/Par | | | Value ($) | |
| Asset-Backed & Securitized - 29.4% | | | | | | | | |
| A Voce CLO Ltd., 2014-1A, “A2R”, FLR, 3.898% (LIBOR-3mo. + 1.55%), 7/15/2026 (n) | | $ | 4,318,000 | | | $ | 4,312,460 | |
| A Voce CLO Ltd., 2014-1A, “BR”, FLR, 4.498% (LIBOR-3mo. + 2.15%), 7/15/2026 (n) | | | 5,584,000 | | | | 5,592,365 | |
| AIMCO Properties CLO LP, 2014-AA, “B1R”, FLR, 3.959% (LIBOR-3mo. + 1.6%), 7/20/2026 (n) | | | 4,342,000 | | | | 4,334,028 | |
| AIMCO Properties CLO LP, 2014-AA, “B2R”, 3.49%, 7/20/2026 (n) | | | 1,381,000 | | | | 1,380,012 | |
| Americredit Automobile Receivables Trust, 2017-2, “C”, 2.97%, 3/20/2023 | | | 4,648,000 | | | | 4,609,427 | |
| Ares CLO Ltd., 2013-3A, “B1R”, FLR, 3.853% (LIBOR-3mo. + 1.5%), 10/17/2024 (n) | | | 5,304,000 | | | | 5,298,712 | |
| ARI Fleet Lease Trust, 2016-A, “A2”, 1.82%, 7/15/2024 (n) | | | 986,392 | | | | 984,507 | |
| Atrium CDO Corp., 2010-A, “B1R”, FLR, 3.798% (LIBOR-3mo. + 1.45%), 7/16/2025 (n) | | | 6,523,000 | | | | 6,516,392 | |
| Atrium CDO Corp., 2011-A, “BR”, FLR, 3.862% (LIBOR-3mo. + 1.5%), 10/23/2025 (n) | | | 4,318,000 | | | | 4,311,951 | |
| Avery Point CLO Ltd., 2014-1A, “CR”, FLR, 4.71% (LIBOR-3mo. + 2.35%), 4/25/2026 (n) | | | 4,335,000 | | | | 4,368,275 | |
| Babson CLO Ltd., 2013-IIA, “BR”, FLR, 3.853% (LIBOR-3mo. + 1.5%), 10/17/2026 (n) | | | 6,471,000 | | | | 6,464,445 | |
| Ballyrock Ltd., CLO, 2018-1A, “A2”, FLR, 3.955% (LIBOR-3mo. + 1.6%), 4/20/2031 (n) | | | 4,282,847 | | | | 4,282,847 | |
| Ballyrock Ltd., CLO, 2018-1A, “B”, FLR, 4.255% (LIBOR-3mo. + 1.9%), 4/20/2031 (n) | | | 1,814,958 | | | | 1,814,958 | |
| Bancorp Commercial Mortgage Trust, 2018-CR3, “B”, FLR, 3.447% (LIBOR-1mo. + 1.55%), 1/15/2033 (n) | | | 3,903,904 | | | | 3,906,966 | |
| Bayview Commercial Asset Trust, FLR, 2.207% (LIBOR-1mo. + 0.31%), 8/25/2035 (z) | | | 437,924 | | | | 415,694 | |
| Bayview Commercial Asset Trust, FLR, 2.142% (LIBOR-1mo. + 0.27%), 4/25/2036 (z) | | | 380,464 | | | | 359,927 | |
| Bayview Financial Acquisition Trust, 5.638%, 11/28/2036 | | | 596,004 | | | | 607,302 | |
| Bayview Financial Revolving Mortgage Loan Trust, FLR, 3.501% (LIBOR-1mo. + 1.6%), 12/28/2040 (z) | | | 511,074 | | | | 463,684 | |
| Business Jet Securities LLC, 2018-1, “A”, 4.335%, 2/15/2033 (z) | | | 5,969,274 | | | | 5,983,935 | |
| Capital One Multi-Asset Execution Trust, 2016-A4, “A4”, 1.33%, 6/15/2022 | | | 4,755,000 | | | | 4,670,938 | |
| CD Commercial Mortgage Trust, 2017-CD4, “XA”, 1.479%, 5/10/2050 (i) | | | 44,640,410 | | | | 3,801,934 | |
11
Portfolio of Investments – continued
| | | | | | | | |
| Issuer | | Shares/Par | | | Value ($) | |
| Bonds - continued | | | | | | | | |
| Asset-Backed & Securitized - continued | | | | | | | | |
| Cent CLO LP, 2014-21A, “A2AR”, FLR, 4.066% (LIBOR-3mo. + 1.7%), 7/27/2026 (n) | | $ | 2,612,650 | | | $ | 2,605,376 | |
| Cent CLO LP, 2014-21A, “BR”, FLR, 4.766% (LIBOR-3mo. + 2.4%), 7/27/2026 (n) | | | 3,547,925 | | | | 3,545,002 | |
| Chesapeake Funding II LLC, 2016-1A, “A2”, FLR, 3.043% (LIBOR-1mo. + 1.15%), 3/15/2028 (n) | | | 1,832,971 | | | | 1,839,276 | |
| Chesapeake Funding II LLC, 2017-2A, “B”, 2.81%, 5/15/2029 (n) | | | 3,442,000 | | | | 3,405,625 | |
| Chesapeake Funding II LLC, 2017-2A, “C”, 3.01%, 5/15/2029 (n) | | | 1,560,000 | | | | 1,543,650 | |
| Chesapeake Funding II LLC, 2017-3A, “B”, 2.57%, 8/15/2029 (n) | | | 2,403,000 | | | | 2,371,754 | |
| Chesapeake Funding II LLC, 2017-4A, “B”, 2.59%, 11/15/2029 (n) | | | 1,815,000 | | | | 1,780,795 | |
| Chesapeake Funding II LLC, 2017-4A, “C”, 2.76%, 11/15/2029 (n) | | | 2,592,000 | | | | 2,539,168 | |
| Chrysler Capital Auto Receivables Trust 2016-B, “A2”, 1.36%, 1/15/2020 (n) | | | 252,005 | | | | 251,949 | |
| CNH Equipment Trust, 2016-C, “A4”, 1.76%, 9/15/2023 | | | 6,146,680 | | | | 5,968,026 | |
| Colony Starwood Homes, 2016-2A, “A”, FLR, 3.147% (LIBOR-1mo. + 1.25%), 12/17/2033 (n) | | | 5,785,692 | | | | 5,830,111 | |
| Commercial Mortgage Asset Trust, 1.466%, 1/17/2032 (i)(z) | | | 62,376 | | | | 19 | |
| CPS Auto Trust, 2016-D, “B”, 2.11%, 3/15/2021 (n) | | | 5,201,000 | | | | 5,159,286 | |
| CPS Auto Trust, 2017-C, “C”, 2.86%, 6/15/2023 (n) | | | 3,270,000 | | | | 3,234,870 | |
| Credit Acceptance Auto Loan Trust, 2015-2A, “A”, 2.4%, 2/15/2023 (n) | | | 1,200,461 | | | | 1,200,196 | |
| Credit Acceptance Auto Loan Trust, 2016-3A, “A”, 2.15%, 4/15/2024 (n) | | | 5,913,000 | | | | 5,860,916 | |
| Credit Acceptance Auto Loan Trust, 2017-2A, “B”, 3.02%, 4/15/2026 (n) | | | 6,441,000 | | | | 6,313,518 | |
| Credit-Based Asset Servicing & Securitization LLC, 3.78%, 12/25/2035 | | | 72,791 | | | | 72,509 | |
| Credit-Based Asset Servicing & Securitization LLC, 3.668%, 1/25/2037 (q) | | | 2,122,995 | | | | 1,026,975 | |
| Credit-Based Asset Servicing & Securitization LLC, 3.874%, 3/25/2037 (q) | | | 3,009,696 | | | | 1,689,892 | |
| Cutwater Ltd., 2014-1A, “A2R”, FLR, 4.048% (LIBOR-3mo. + 1.7%), 7/15/2026 (n) | | | 4,500,000 | | | | 4,496,738 | |
| Dell Equipment Finance Trust, 2017-2, “B”, 2.47%, 10/24/2022 (n) | | | 1,718,000 | | | | 1,688,884 | |
| DLL Securitization Trust, 2017-A, “A3”, 2.14%, 12/15/2021 (n) | | | 2,222,000 | | | | 2,187,521 | |
| Drive Auto Receivables Trust, 2017-1, “B”, 2.36%, 3/15/2021 | | | 2,066,000 | | | | 2,060,532 | |
| Dryden Senior Loan Fund, 2014-34A, “BR”, FLR, 3.898% (LIBOR-3mo. + 1.55%), 10/15/2026 (n) | | | 2,366,000 | | | | 2,363,944 | |
| Dryden Senior Loan Fund, 2014-34A, “CR”, CLO, FLR, 4.498% (LIBOR-3mo. + 2.15%), 10/15/2026 (n) | | | 3,033,734 | | | | 3,049,176 | |
| DT Auto Owner Trust, 2017-2A, “C”, 3.03%, 1/17/2023 (n) | | | 5,100,000 | | | | 5,085,989 | |
| DT Auto Owner Trust, 2017-3A, “C”, 3.01%, 5/15/2023 (n) | | | 3,606,000 | | | | 3,588,627 | |
12
Portfolio of Investments – continued
| | | | | | | | |
| Issuer | | Shares/Par | | | Value ($) | |
| Bonds - continued | | | | | | | | |
| Asset-Backed & Securitized - continued | | | | | | | | |
| Eaton Vance CLO Ltd., 2014-1A, “BR”, FLR, 3.948% (LIBOR-3mo. + 1.6%), 7/15/2026 (n) | | $ | 3,142,924 | | | $ | 3,141,038 | |
| Eaton Vance CLO Ltd., 2014-1A, “CR”, FLR, 4.598% (LIBOR-3mo. + 2.25%), 7/15/2026 (n) | | | 6,285,849 | | | | 6,280,311 | |
| Enterprise Fleet Financing LLC, 1.74%, 2/22/2022 (n) | | | 1,829,972 | | | | 1,820,606 | |
| Enterprise Fleet Financing LLC, 2017-1, “A2”, 2.13%, 7/20/2022 (n) | | | 2,295,232 | | | | 2,282,984 | |
| Exeter Automobile Receivables Trust, 2016-3A, “A”, 1.84%, 11/16/2020 (n) | | | 1,492,992 | | | | 1,488,918 | |
| Exeter Automobile Receivables Trust, 2017-1A, “A”, 1.96%, 3/15/2021 (n) | | | 842,892 | | | | 840,377 | |
| Exeter Automobile Receivables Trust, 2018-1A, “B”, 2.75%, 4/15/2022 (n) | | | 4,730,000 | | | | 4,686,807 | |
| Exeter Automobile Receivables Trust, 2018-2A, “C”, 3.69%, 3/15/2023 (z) | | | 5,790,000 | | | | 5,789,111 | |
| Flagship Credit Auto Trust, 2016-1, “A”, 2.77%, 12/15/2020 (n) | | | 973,551 | | | | 973,781 | |
| Ford Credit Auto Owner Trust, 2014-1,“A”, 2.26%, 11/15/2025 (n) | | | 1,498,000 | | | | 1,490,721 | |
| GMF Floorplan Owner Revolving Trust, 2017-A1, “A”, 2.22%, 1/18/2022 (n) | | | 4,200,000 | | | | 4,147,993 | |
| Granite Point Mortgage Trust Inc., 2.796%, 12/19/2035 (z) | | | 5,834,000 | | | | 5,825,249 | |
| GS Mortgage Securities Trust, 4.592%, 8/10/2043 (n) | | | 7,374,000 | | | | 7,581,844 | |
| GS Mortgage Securities Trust, 2017-GS6, “XA”, 1.196%, 5/10/2050 (i) | | | 40,233,932 | | | | 3,071,346 | |
| GS Mortgage Securities Trust, 2017-GS7, “XA”, 1.287%, 8/10/2050 (i) | | | 38,849,790 | | | | 3,091,542 | |
| HarbourView CLO VII, Ltd., “B1R”, FLR, 3.522% (LIBOR-3mo. + 1.65%), 11/18/2026 (n) | | | 6,679,491 | | | | 6,651,577 | |
| HarbourView CLO VII, Ltd., 7A, “CR”, FLR, 4.252% (LIBOR-3mo. + 2.38%), 11/18/2026 (n) | | | 4,308,491 | | | | 4,300,731 | |
| Hertz Fleet Lease Funding LP, 2016-1, “A2”, 1.96%, 4/10/2030 (n) | | | 2,020,212 | | | | 2,020,234 | |
| Hertz Fleet Lease Funding LP, 2018-1, “B”, 3.64%, 5/10/2032 (z) | | | 2,752,000 | | | | 2,751,605 | |
| Hertz Fleet Lease Funding LP, 2018-1, “C”, 3.77%, 5/10/2032 (z) | | | 1,580,000 | | | | 1,579,598 | |
| IMPAC CMB Trust, FLR, 2.637% (LIBOR-1mo. + 0.74%), 11/25/2034 | | | 135,933 | | | | 135,711 | |
| IMPAC CMB Trust, FLR, 2.817% (LIBOR-1mo. + 0.92%), 11/25/2034 | | | 143,087 | | | | 139,063 | |
| IMPAC Secured Assets Corp., FLR, 2.247% (LIBOR-1mo. + 0.35%), 5/25/2036 | | | 486,388 | | | | 462,229 | |
| Interstar Millennium Trust, FLR, 2.507% (LIBOR-3mo. + 0.40%), 3/14/2036 | | | 86,705 | | | | 82,962 | |
| Invitation Homes Trust, 2018-SFR1, “B”, 2.845% (LIBOR-1mo. + 0.95%), 3/17/2037 (n) | | | 3,498,000 | | | | 3,497,995 | |
13
Portfolio of Investments – continued
| | | | | | | | |
| Issuer | | Shares/Par | | | Value ($) | |
| Bonds - continued | | | | | | | | |
| Asset-Backed & Securitized - continued | | | | | | | | |
| Invitation Homes Trust, 2018-SFR2, “A”, 2.745% (LIBOR-1mo. + 0.85%), 12/17/2036 (n) | | $ | 6,997,883 | | | $ | 7,008,812 | |
| JPMorgan Chase & Co., 4.717%, 2/15/2046 (n) | | | 6,740,324 | | | | 6,976,684 | |
| JPMorgan Chase Commercial Mortgage Securities Corp., 1.238%, 9/15/2050 (i) | | | 80,505,708 | | | | 5,709,586 | |
| Lehman Brothers Commercial Conduit Mortgage Trust, 1.698%, 10/15/2035 (i) | | | 1,372,851 | | | | 3,401 | |
| Loomis, Sayles & Co., CLO, “A2”, FLR, 3.753% (LIBOR-3mo. + 1.4%), 4/15/2028 (z) | | | 4,537,081 | | | | 4,537,081 | |
| Loomis, Sayles & Co., CLO, 2015-2A, “A1R”, FLR, 3.253% (LIBOR-3mo. + 0.9%), 4/15/2028 (n) | | | 4,029,889 | | | | 4,029,889 | |
| Madison Park Funding Ltd., 2014-13A, “BR2”, FLR, 3.855% (LIBOR-3mo. + 1.5%), 4/19/2030 (z) | | | 6,806,093 | | | | 6,799,205 | |
| Madison Park Funding XIV Ltd., 2014-14A, “C1R”, FLR, 4.409% (LIBOR-3mo. + 2.05%), 7/20/2026 (n) | | | 6,034,000 | | | | 6,027,761 | |
| Magnetite CLO Ltd., 2015-16A, “BR”, FLR, 3.555% (LIBOR-3mo. + 1.2%), 1/18/2028 (n) | | | 8,857,000 | | | | 8,779,856 | |
| Magnetite XI Ltd., 2014-11A, “BR”, FLR, 4.455% (LIBOR-3mo. + 2.1%), 1/18/2027 (n) | | | 3,038,000 | | | | 3,051,802 | |
| Merrill Lynch Mortgage Investors, Inc., 4.319%, 2/25/2037 (q) | | | 1,862,361 | | | | 373,697 | |
| Morgan Stanley Bank of America Merrill Lynch Trust, 2017-C33, “XA”, 1.603%, 5/15/2050 (i) | | | 44,255,712 | | | | 3,735,178 | |
| Morgan Stanley Capital I Trust, 2017-H1, “XA”, 1.615%, 6/15/2050 (i) | | | 18,976,088 | | | | 1,701,423 | |
| Morgan Stanley Capital I, Inc., 1.836%, 3/15/2031 (i)(z) | | | 30,862 | | | | 1 | |
| Mountain Hawk CLO Ltd., 2014-3A, “BR”, FLR, 4.155% (LIBOR-3mo. + 1.8%), 4/18/2025 (n) | | | 8,600,000 | | | | 8,596,397 | |
| Nationstar HECM Loan Trust, 2018-1A, “M1”, 3.238%, 2/25/2028 (n) | | | 3,427,000 | | | | 3,426,993 | |
| Navient Student Loan Trust, 2016-3A, “A1”, FLR, 2.497% (LIBOR-1mo. + 0.6%), 6/25/2065 (n) | | | 450,555 | | | | 451,063 | |
| Neuberger Berman CLO Ltd., 2016-21A, “CR”, FLR, 3.959% (LIBOR-3mo. + 1.6%), 4/20/2027 (n) | | | 5,023,883 | | | | 5,021,401 | |
| NextGear Floorplan Master Owner Trust, 2017-1A, “A2”, 2.54%, 4/18/2022 (n) | | | 3,461,000 | | | | 3,421,354 | |
| NextGear Floorplan Master Owner Trust, 2017-2A, “B”, 3.02%, 10/17/2022 (n) | | | 2,577,000 | | | | 2,549,161 | |
| Oaktree CLO Ltd., 2014-2A, “BR”, FLR, 4.909% (LIBOR-3mo. + 2.55%), 10/20/2026 (n) | | | 4,321,000 | | | | 4,340,362 | |
| OneMain Direct Auto Receivables Trust, 2016-1A, “A”, 2.04%, 1/15/2021 (n) | | | 136,271 | | | | 136,209 | |
| OneMain Financial Issuance Trust, 2017-1A, “A1”, 2.37%, 9/14/2032 (n) | | | 5,148,000 | | | | 5,051,089 | |
14
Portfolio of Investments – continued
| | | | | | | | |
| Issuer | | Shares/Par | | | Value ($) | |
| Bonds - continued | | | | | | | | |
| Asset-Backed & Securitized - continued | | | | | | | | |
| Option One Mortgage Loan Trust, 5.611%, 1/25/2037 (q) | | $ | 99,254 | | | $ | 99,229 | |
| Oscar U.S. Funding Trust, 2016-2A, “A”, 2.31%, 11/15/2019 (n) | | | 523,516 | | | | 522,053 | |
| Oscar U.S. Funding Trust, 2017-1A, “A3”, 2.82%, 6/10/2021 (n) | | | 4,420,000 | | | | 4,378,337 | |
| Oscar U.S. Funding Trust, 2017-2A, “A2B”, FLR, 2.547% (LIBOR-1mo. + 0.65%), 11/10/2020 (n) | | | 3,317,441 | | | | 3,319,929 | |
| Ownit Mortgage Loan Asset-Backed Certificates, 3.373%, 10/25/2035 (q) | | | 1,424,569 | | | | 895,732 | |
| PFS Financing Corp., 2017-C, “A”, FLR, 2.367% (LIBOR-1mo. + 0.47%), 10/15/2021 (n) | | | 2,254,000 | | | | 2,259,635 | |
| Santander Drive Auto Receivable Trust, 2018-1, “B”, 2.63%, 7/15/2022 | | | 4,585,000 | | | | 4,551,336 | |
| Santander Drive Auto Receivables Trust, 2017-2, “C”, 2.79%, 8/15/2022 | | | 2,821,000 | | | | 2,804,202 | |
| Santander Retail Auto Lease Trust, 2017-A, “B”, 2.68%, 1/20/2022 (n) | | | 3,246,000 | | | | 3,199,634 | |
| Shackelton Ltd., CLO, 2013-4RA, “B”, FLR, 4.242% (LIBOR-3mo. + 1.9%), 4/13/2031 (z) | | | 2,268,542 | | | | 2,268,501 | |
| Sierra Receivables Funding Co. LLC, 2015-1A, “A”, 2.4%, 3/22/2032 (n) | | | 997,523 | | | | 989,022 | |
| Silver Spring CLO Ltd., FLR, 5.098% (LIBOR-3mo. + 2.75%), 10/15/2026 (n) | | | 3,436,000 | | | | 3,430,363 | |
| SPS Servicer Advance Receivables Trust, 2016-T1, “AT1”, 2.53%, 11/16/2048 (n) | | | 7,440,000 | | | | 7,426,050 | |
| Starwood Waypoint Homes Trust, 2017-1, “B”, FLR, 3.066% (LIBOR-1mo. + 1.17%), 1/17/2035 (n) | | | 5,019,511 | | | | 5,034,853 | |
| Thacher Park CLO Ltd. 2014-1A. “CR”, FLR, 4.559% (LIBOR-3mo. + 2.2%), 10/20/2026 (n) | | | 4,301,000 | | | | 4,307,667 | |
| Thornburg Mortgage Securities Trust, FLR, 2.577% (LIBOR-1mo. + 0.68%), 4/25/2043 | | | 372,731 | | | | 373,304 | |
| TICP Ltd., CLO, 2018-3R, “B”, FLR, 3.709% (LIBOR-3mo. + 1.35%), 4/20/2028 (z) | | | 2,132,575 | | | | 2,132,534 | |
| TICP Ltd., CLO, 2018-3R, “C”, FLR, 4.159% (LIBOR-3mo. + 1.8%), 4/20/2028 (z) | | | 3,742,444 | | | | 3,742,358 | |
| Tricon American Homes 2015-SFR1, Trust “1A”, 2.589%, 11/17/2033 (n) | | | 3,976,805 | | | | 3,853,780 | |
| UBS Commercial Mortgage Trust, 2017-C1, “XA”, 1.022%, 11/15/2050 (i) | | | 30,892,244 | | | | 2,109,316 | |
| Verizon Owner Trust, 2016-1A, “A”, 1.42%, 1/20/2021 (n) | | | 5,740,000 | | | | 5,690,999 | |
| Verizon Owner Trust, 2017-3A, “B”, 2.38%, 4/20/2022 (n) | | | 3,075,000 | | | | 3,013,005 | |
| Veros Auto Receivables Trust, 2017-1, “A”, 2.84%, 4/17/2023 (n) | | | 1,732,921 | | | | 1,725,289 | |
| Volvo Financial Equipment Master Owner Trust, 2017-A, “A”, FLR, 2.397% (LIBOR-1mo. + 0.50%), 11/15/2022 (n) | | | 3,389,000 | | | | 3,397,701 | |
15
Portfolio of Investments – continued
| | | | | | | | |
| Issuer | | Shares/Par | | | Value ($) | |
| Bonds - continued | | | | | | | | |
| Asset-Backed & Securitized - continued | | | | | | | | |
| West CLO Ltd., 2013-1A, “A2BR”, 3.393%, 11/07/2025 (n) | | $ | 4,332,000 | | | $ | 4,287,860 | |
| WF-RBS Commercial Mortgage Trust, 2011-C3, “A4”, 4.375%, 3/15/2044 (n) | | | 7,732,177 | | | | 7,950,468 | |
| | | | | | | | |
| | | | | | | $ | 404,866,978 | |
| Automotive - 4.0% | | | | | | | | |
| American Honda Finance Corp., 1.6%, 7/13/2018 | | $ | 2,630,000 | | | $ | 2,628,033 | |
| BMW US Capital LLC, 3.1%, 4/12/2021 (n) | | | 6,163,000 | | | | 6,145,798 | |
| Daimler Finance North America LLC, 1.65%, 5/18/2018 (n) | | | 3,220,000 | | | | 3,218,697 | |
| Ford Motor Credit Co. LLC, 2.262%, 3/28/2019 | | | 5,308,000 | | | | 5,272,917 | |
| Ford Motor Credit Co. LLC, 2.021%, 5/03/2019 | | | 4,860,000 | | | | 4,809,208 | |
| Ford Motor Credit Co. LLC, 2.343%, 11/02/2020 | | | 4,305,000 | | | | 4,196,159 | |
| General Motors Financial Co., Inc., 2.65%, 4/13/2020 | | | 13,401,000 | | | | 13,269,445 | |
| General Motors Financial Co., Inc., 3.15%, 6/30/2022 | | | 2,972,000 | | | | 2,891,435 | |
| Hyundai Capital America, 2.4%, 10/30/2018 (n) | | | 2,600,000 | | | | 2,590,142 | |
| Toyota Motor Credit Corp., 1.7%, 2/19/2019 | | | 4,820,000 | | | | 4,789,833 | |
| Toyota Motor Credit Corp., FLR, 2.743% (LIBOR-3mo. + 0.39%), 1/17/2019 | | | 5,320,000 | | | | 5,329,167 | |
| | | | | | | | |
| | | | | | | $ | 55,140,834 | |
| Broadcasting - 0.1% | | | | | | | | |
| SES Global Americas Holdings GP, 2.5%, 3/25/2019 (n) | | $ | 1,862,000 | | | $ | 1,848,834 | |
| | |
| Brokerage & Asset Managers - 0.6% | | | | | | | | |
| E*TRADE Financial Corp., 2.95%, 8/24/2022 | | $ | 3,753,000 | | | $ | 3,636,677 | |
| Intercontinental Exchange, Inc., 2.75%, 12/01/2020 | | | 4,908,000 | | | | 4,861,757 | |
| | | | | | | | |
| | | | | | | $ | 8,498,434 | |
| Building - 0.3% | | | | | | | | |
| Stanley Black & Decker, Inc., 1.622%, 11/17/2018 | | $ | 4,230,000 | | | $ | 4,212,170 | |
| | |
| Cable TV - 0.7% | | | | | | | | |
| Time Warner Cable, Inc., 5%, 2/01/2020 | | $ | 8,592,000 | | | $ | 8,815,848 | |
| | |
| Chemicals - 0.8% | | | | | | | | |
| Dow Chemical Co., 8.55%, 5/15/2019 | | $ | 2,900,000 | | | $ | 3,070,913 | |
| E.I. du Pont de Nemours & Co., 2.2%, 5/01/2020 | | | 5,132,000 | | | | 5,059,170 | |
| LyondellBasell Industries N.V., 5%, 4/15/2019 | | | 2,963,000 | | | | 3,005,784 | |
| | | | | | | | |
| | | | | | | $ | 11,135,867 | |
| Computer Software - 0.3% | | | | | | | | |
| Diamond 1 Finance Corp./Diamond 2 Finance Corp., 3.48%, 6/01/2019 (n) | | $ | 3,590,000 | | | $ | 3,598,049 | |
16
Portfolio of Investments – continued
| | | | | | | | |
| Issuer | | Shares/Par | | | Value ($) | |
| Bonds - continued | | | | | | | | |
| Conglomerates - 0.1% | | | | | | | | |
| Roper Technologies, Inc., 2.8%, 12/15/2021 | | $ | 1,810,000 | | | $ | 1,769,426 | |
| | |
| Consumer Products - 1.2% | | | | | | | | |
| Newell Brands, Inc., 2.6%, 3/29/2019 | | $ | 523,000 | | | $ | 520,880 | |
| Reckitt Benckiser Treasury Services PLC, 2.125%, 9/21/2018 (n) | | | 5,585,000 | | | | 5,575,807 | |
| Reckitt Benckiser Treasury Services PLC, 2.375%, 6/24/2022 (n) | | | 10,735,000 | | | | 10,265,015 | |
| | | | | | | | |
| | | | | | | $ | 16,361,702 | |
| Consumer Services - 0.5% | | | | | | | | |
| Alibaba Group Holding Ltd., 2.8%, 6/06/2023 | | $ | 5,754,000 | | | $ | 5,528,809 | |
| QVC, Inc., 5.125%, 7/02/2022 | | | 1,135,000 | | | | 1,168,609 | |
| | | | | | | | |
| | | | | | | $ | 6,697,418 | |
| Electrical Equipment - 0.3% | | | | | | | | |
| Molex Electronic Technologies LLC, 2.878%, 4/15/2020 (n) | | $ | 4,611,000 | | | $ | 4,565,471 | |
| | |
| Electronics - 0.1% | | | | | | | | |
| Tyco Electronics Group S.A., 2.375%, 12/17/2018 | | $ | 1,500,000 | | | $ | 1,498,775 | |
| | |
| Emerging Market Quasi-Sovereign - 0.6% | | | | | | | | |
| Corporacion Financiera de Desarrollo S.A., 3.25%, 7/15/2019 (n) | | $ | 3,762,000 | | | $ | 3,762,000 | |
| State Grid International Development Co. Ltd., 1.75%, 5/22/2018 (n) | | | 4,456,000 | | | | 4,453,181 | |
| | | | | | | | |
| | | | | | | $ | 8,215,181 | |
| Energy - Integrated - 0.6% | | | | | | | | |
| BP Capital Markets PLC, 2.521%, 1/15/2020 | | $ | 3,049,000 | | | $ | 3,033,386 | |
| Shell International Finance B.V., 1.375%, 5/10/2019 | | | 5,690,000 | | | | 5,625,761 | |
| | | | | | | | |
| | | | | | | $ | 8,659,147 | |
| Entertainment - 0.2% | | | | | | | | |
| Royal Caribbean Cruises Ltd., 2.65%, 11/28/2020 | �� | $ | 3,003,000 | | | $ | 2,939,577 | |
| | |
| Financial Institutions - 0.1% | | | | | | | | |
| LeasePlan Corp. N.V., 2.5%, 5/16/2018 (n) | | $ | 1,208,000 | | | $ | 1,207,988 | |
| | |
| Food & Beverages - 1.6% | | | | | | | | |
| Anheuser-Busch InBev Finance, Inc., 2.65%, 2/01/2021 | | $ | 5,173,000 | | | $ | 5,112,983 | |
| General Mills, Inc., 3.2%, 4/16/2021 | | | 2,054,000 | | | | 2,053,166 | |
| Mondelez International, Inc., FLR, 2.969% (LIBOR-3mo. + 0.61%), 10/28/2019 (n) | | | 7,400,000 | | | | 7,432,615 | |
| Pernod Ricard S.A., 5.75%, 4/07/2021 (n) | | | 1,900,000 | | | | 2,025,494 | |
| Want Want China Finance Co., 1.875%, 5/14/2018 (n) | | | 5,038,000 | | | | 5,035,995 | |
17
Portfolio of Investments – continued
| | | | | | | | |
| Issuer | | Shares/Par | | | Value ($) | |
| Bonds - continued | | | | | | | | |
| Food & Beverages - continued | | | | | | | | |
| Wm. Wrigley Jr. Co., 2.4%, 10/21/2018 (n) | | $ | 525,000 | | | $ | 523,959 | |
| | | | | | | | |
| | | | | | | $ | 22,184,212 | |
| Insurance - 1.1% | | | | | | | | |
| American International Group, Inc., 2.3%, 7/16/2019 | | $ | 2,039,000 | | | $ | 2,021,826 | |
| American International Group, Inc., 3.3%, 3/01/2021 | | | 5,141,000 | | | | 5,126,545 | |
| Metropolitan Life Global Funding I, 2%, 4/14/2020 (n) | | | 4,840,000 | | | | 4,756,304 | |
| Metropolitan Life Global Funding I, FLR, 2.608% (LIBOR-3mo. + 0.43%), 12/19/2018 (n) | | | 3,700,000 | | | | 3,709,406 | |
| | | | | | | | |
| | | | | | | $ | 15,614,081 | |
| Insurance - Health - 0.5% | | | | | | | | |
| UnitedHealth Group, Inc., 1.95%, 10/15/2020 | | $ | 6,409,000 | | | $ | 6,254,891 | |
| | |
| Insurance - Property & Casualty - 0.0% | | | | | | | | |
| Ambac Assurance Corp., 5.1%, 6/07/2020 (z) | | $ | 23,513 | | | $ | 31,155 | |
| Ambac LSNI, LLC, FLR, 6.811% (LIBOR-3mo. + 5%), 2/12/2023 (z) | | | 113,041 | | | | 114,171 | |
| | | | | | | | |
| | | | | | | $ | 145,326 | |
| International Market Quasi-Sovereign - 2.8% | | | | | | | | |
| Caisse d’Amortissement de la Dette Sociale, 1.875%, 1/13/2020 (n) | | $ | 9,000,000 | | | $ | 8,876,277 | |
| Dexia Credit Local S.A., 2.25%, 1/30/2019 (n) | | | 2,070,000 | | | | 2,064,845 | |
| Dexia Credit Local S.A., 2.25%, 2/18/2020 (n) | | | 3,150,000 | | | | 3,116,846 | |
| Dexia Credit Local S.A., 1.875%, 9/15/2021 (n) | | | 7,590,000 | | | | 7,297,975 | |
| Electricite de France, 2.15%, 1/22/2019 (n) | | | 3,953,000 | | | | 3,930,405 | |
| Kommunalbanken A.S., 1.375%, 10/26/2020 (n) | | | 3,870,000 | | | | 3,738,984 | |
| Swedish Export Credit Corp., 1.125%, 8/28/2019 | | | 10,280,000 | | | | 10,085,207 | |
| | | | | | | | |
| | | | | | | $ | 39,110,539 | |
| International Market Sovereign - 0.2% | | | | | | | | |
| Republic of Finland, 1%, 4/23/2019 (n) | | $ | 2,510,000 | | | $ | 2,474,055 | |
| | |
| Internet - 0.5% | | | | | | | | |
| Baidu, Inc., 3.25%, 8/06/2018 | | $ | 892,000 | | | $ | 892,259 | |
| Baidu, Inc., 2.75%, 6/09/2019 | | | 2,189,000 | | | | 2,177,133 | |
| Baidu, Inc., 3.875%, 9/29/2023 | | | 3,736,000 | | | | 3,704,965 | |
| | | | | | | | |
| | | | | | | $ | 6,774,357 | |
| Major Banks - 15.6% | | | | | | | | |
| ABN AMRO Bank N.V., 2.1%, 1/18/2019 (n) | | $ | 7,840,000 | | | $ | 7,801,615 | |
| ABN AMRO Bank N.V., 2.65%, 1/19/2021 (n) | | | 5,197,000 | | | | 5,105,387 | |
| Bank of America Corp., 2.151%, 11/09/2020 | | | 3,310,000 | | | | 3,231,503 | |
| Bank of America Corp., 2.369% to 7/21/2020, FLR to 7/21/2021 | | | 12,687,000 | | | | 12,445,455 | |
18
Portfolio of Investments – continued
| | | | | | | | |
| Issuer | | Shares/Par | | | Value ($) | |
| Bonds - continued | | | | | | | | |
| Major Banks - continued | | | | | | | | |
| Bank of America Corp., 2.881% to 4/24/2022, FLR to 4/24/2023 | | $ | 7,801,000 | | | $ | 7,588,864 | |
| Barclays PLC, 3.25%, 1/12/2021 | | | 10,346,000 | | | | 10,252,503 | |
| Citibank N.A., 2.125%, 10/20/2020 | | | 5,897,000 | | | | 5,749,637 | |
| Commonwealth Bank of Australia, 1.75%, 11/02/2018 | | | 1,390,000 | | | | 1,383,801 | |
| Commonwealth Bank of Australia, 2.3%, 9/06/2019 | | | 6,503,000 | | | | 6,450,644 | |
| Credit Agricole, “A”, FLR, 3.767% (LIBOR-3mo. + 1.43%), 1/10/2022 (n) | | | 3,030,000 | | | | 3,100,973 | |
| Credit Suisse Group AG, 3.574%, 1/09/2023 (n) | | | 4,820,000 | | | | 4,753,928 | |
| DNB Bank A.S.A., 2.125%, 10/02/2020 (n) | | | 6,394,000 | | | | 6,227,387 | |
| Goldman Sachs Group, Inc., 2%, 4/25/2019 | | | 1,150,000 | | | | 1,142,790 | |
| Goldman Sachs Group, Inc., 2.55%, 10/23/2019 | | | 15,694,000 | | | | 15,618,162 | |
| Goldman Sachs Group, Inc., 2.6%, 12/27/2020 | | | 6,253,000 | | | | 6,160,554 | |
| Goldman Sachs Group, Inc., 3%, 4/26/2022 | | | 4,780,000 | | | | 4,671,569 | |
| HSBC Holdings PLC, 3.262% to 3/13/2022, FLR to 3/13/2023 | | | 4,311,000 | | | | 4,241,574 | |
| HSBC Holdings PLC, 3.033% to 3/13/2022, FLR to 11/22/2023 | | | 3,245,000 | | | | 3,154,336 | |
| ING Bank N.V., 2%, 11/26/2018 (n) | | | 4,970,000 | | | | 4,952,427 | |
| ING Bank N.V., 2.3%, 3/22/2019 (n) | | | 4,000,000 | | | | 3,985,241 | |
| JPMorgan Chase & Co., 2.2%, 10/22/2019 | | | 5,340,000 | | | | 5,291,573 | |
| JPMorgan Chase & Co., 2.776% to 4/25/2022, FLR to 4/25/2023 | | | 7,272,000 | | | | 7,068,078 | |
| Mitsubishi UFJ Financial Group, Inc., 2.95%, 3/01/2021 | | | 1,604,000 | | | | 1,589,338 | |
| Mitsubishi UFJ Financial Group, Inc., 2.998%, 2/22/2022 | | | 3,172,000 | | | | 3,120,415 | |
| Mizuho Bank Ltd., FLR, 3.549% (LIBOR-3mo. + 1.19%), 10/20/2018 (n) | | | 4,060,000 | | | | 4,079,164 | |
| Morgan Stanley, 2.375%, 7/23/2019 | | | 15,440,000 | | | | 15,367,776 | |
| Morgan Stanley, 2.65%, 1/27/2020 | | | 9,508,000 | | | | 9,450,294 | |
| National Australia Bank Ltd., 1.375%, 7/12/2019 | | | 4,140,000 | | | | 4,069,619 | |
| PNC Bank N.A., 2.25%, 7/02/2019 | | | 5,130,000 | | | | 5,100,056 | |
| Sumitomo Mitsui Financial Group, Inc., 3.102%, 1/17/2023 | | | 4,012,000 | | | | 3,913,012 | |
| Svenska Handelsbanken AB, 2.25%, 6/17/2019 | | | 6,504,000 | | | | 6,461,882 | |
| Toronto-Dominion Bank, 1.75%, 7/23/2018 | | | 2,820,000 | | | | 2,816,268 | |
| Toronto-Dominion Bank, 1.45%, 9/06/2018 | | | 7,260,000 | | | | 7,236,607 | |
| Toronto-Dominion Bank. FLR, 2.47% (LIBOR-3mo. + 0.65%), 8/13/2019 | | | 3,170,000 | | | | 3,187,188 | |
| UBS AG, 2.375%, 8/14/2019 | | | 4,186,000 | | | | 4,162,875 | |
| UBS Group Funding (Switzerland) AG, 3.491%, 5/23/2023 (n) | | | 8,600,000 | | | | 8,428,495 | |
| UBS Group Funding Ltd., 3%, 4/15/2021 (n) | | | 6,146,000 | | | | 6,065,073 | |
| | | | | | | | |
| | | | | | | $ | 215,426,063 | |
| Medical & Health Technology & Services - 2.2% | | | | | | | | |
| Becton Dickinson and Co., FLR, 2.944% (LIBOR-3mo. + 0.88%), 12/29/2020 | | $ | 3,028,000 | | | $ | 3,035,630 | |
| Becton, Dickinson and Co., 2.675%, 12/15/2019 | | | 6,464,000 | | | | 6,416,196 | |
| Becton, Dickinson and Co., 2.404%, 6/05/2020 | | | 2,975,000 | | | | 2,916,065 | |
| Becton, Dickinson and Co., 2.894%, 6/06/2022 | | | 3,466,000 | | | | 3,353,142 | |
19
Portfolio of Investments – continued
| | | | | | | | |
| Issuer | | Shares/Par | | | Value ($) | |
| Bonds - continued | | | | | | | | |
| Medical & Health Technology & Services - continued | | | | | | | | |
| CVS Health Corp., 3.7%, 3/09/2023 | | $ | 3,451,000 | | | $ | 3,432,324 | |
| CVS Health Corp., FLR, 2.687% (LIBOR-3mo. + 0.65%), 3/09/2020 | | | 2,171,000 | | | | 2,181,133 | |
| CVS Health Corp., FLR, 2.777% (LIBOR-3mo. + 0.72%), 3/09/2021 | | | 4,264,000 | | | | 4,303,186 | |
| Laboratory Corp. of America Holdings, 2.625%, 2/01/2020 | | | 5,170,000 | | | | 5,122,870 | |
| | | | | | | | |
| | | | | | | $ | 30,760,546 | |
| Medical Equipment - 1.5% | | | | | | | | |
| Abbott Laboratories, 2.35%, 11/22/2019 | | $ | 12,735,000 | | | $ | 12,624,035 | |
| Zimmer Biomet Holdings, Inc., 2.7%, 4/01/2020 | | | 6,421,000 | | | | 6,359,904 | |
| Zimmer Biomet Holdings, Inc., FLR, 2.927% (LIBOR-3mo. + 0.75%), 3/19/2021 | | | 1,298,000 | | | | 1,300,188 | |
| | | | | | | | |
| | | | | | | $ | 20,284,127 | |
| Metals & Mining - 0.2% | | | | | | | | |
| Glencore Funding LLC , 3%, 10/27/2022 (n) | | $ | 2,204,000 | | | $ | 2,107,628 | |
| | |
| Midstream - 1.5% | | | | | | | | |
| Andeavor Logistics LP/Tesoro Logistics Finance Corp., 3.5%, 12/01/2022 | | $ | 5,818,000 | | | $ | 5,723,592 | |
| El Paso LLC, 6.5%, 9/15/2020 | | | 6,336,000 | | | | 6,774,806 | |
| EnLink Midstream Partners LP, 2.7%, 4/01/2019 | | | 2,163,000 | | | | 2,154,301 | |
| Enterprise Products Operating LP, 6.5%, 1/31/2019 | | | 1,280,000 | | | | 1,313,568 | |
| MPLX LP, 3.375%, 3/15/2023 | | | 1,725,000 | | | | 1,698,122 | |
| ONEOK Partners LP, 3.2%, 9/15/2018 | | | 3,550,000 | | | | 3,555,311 | |
| | | | | | | | |
| | | | | | | $ | 21,219,700 | |
| Mortgage-Backed - 0.8% | | | | | | | | |
| Fannie Mae, 2.072%, 5/25/2018 | | $ | 164,381 | | | $ | 164,155 | |
| Fannie Mae, 4.5%, 10/01/2018 - 3/01/2023 | | | 350,469 | | | | 355,699 | |
| Fannie Mae, 5.5%, 1/01/2019 - 2/01/2019 | | | 11,326 | | | | 11,345 | |
| Fannie Mae, 5%, 12/01/2020 - 7/01/2023 | | | 417,661 | | | | 429,288 | |
| Fannie Mae, 3%, 12/01/2031 | | | 2,611,665 | | | | 2,593,793 | |
| Fannie Mae, 3.71%, 2/01/2033 | | | 24,809 | | | | 25,312 | |
| Fannie Mae, 3.657%, 3/01/2033 | | | 78,104 | | | | 79,224 | |
| Fannie Mae, 3.5%, 5/01/2033 | | | 235,971 | | | | 247,573 | |
| Fannie Mae, 2%, 5/25/2044 | | | 7,514,556 | | | | 7,162,806 | |
| Freddie Mac, 5%, 5/01/2018 - 8/01/2020 | | | 176,167 | | | | 179,929 | |
| Freddie Mac, 5.5%, 6/01/2019 - 11/01/2019 | | | 54,888 | | | | 55,468 | |
| Freddie Mac, 1.018%, 4/25/2024 (i) | | | 328,125 | | | | 14,203 | |
| Ginnie Mae, 2.75%, 7/20/2032 | | | 70,325 | | | | 72,943 | |
| | | | | | | | |
| | | | | | | $ | 11,391,738 | |
20
Portfolio of Investments – continued
| | | | | | | | |
| Issuer | | Shares/Par | | | Value ($) | |
| Bonds - continued | | | | | | | | |
| Municipals - 0.6% | | | | | | | | |
| New Jersey Economic Development Authority State Pension Funding Rev., Capital Appreciation, “B”, AGM, 0%, 2/15/2023 | | $ | 10,353,000 | | | $ | 8,588,745 | |
| | |
| Network & Telecom - 1.6% | | | | | | | | |
| AT&T, Inc., 2.3%, 3/11/2019 | | $ | 4,270,000 | | | $ | 4,260,969 | |
| AT&T, Inc., 2.45%, 6/30/2020 | | | 6,250,000 | | | | 6,172,833 | |
| AT&T, Inc., 3.2%, 3/01/2022 | | | 5,118,000 | | | | 5,057,127 | |
| AT&T, Inc., FLR, 2.866% (LIBOR-3mo. + 0.91%), 11/27/2018 | | | 3,850,000 | | | | 3,865,214 | |
| British Telecommunications PLC, 2.35%, 2/14/2019 | | | 2,970,000 | | | | 2,957,659 | |
| | | | | | | | |
| | | | | | | $ | 22,313,802 | |
| Oils - 0.2% | | | | | | | | |
| Phillips 66, FLR, 2.606% (LIBOR-3mo. + 0.60%), 2/26/2021 | | $ | 3,020,000 | | | $ | 3,025,840 | |
| | |
| Other Banks & Diversified Financials - 8.9% | | | | | | | | |
| Banque Federative du Credit Mutuel, 2.75%, 1/22/2019 (n) | | $ | 1,021,000 | | | $ | 1,020,785 | |
| Banque Federative du Credit Mutuel, 2%, 4/12/2019 (n) | | | 5,610,000 | | | | 5,570,323 | |
| Banque Federative du Credit Mutuel, 2.2%, 7/20/2020 (n) | | | 6,421,000 | | | | 6,279,506 | |
| BPCE S.A., 2.5%, 7/15/2019 | | | 5,559,000 | | | | 5,522,283 | |
| Branch Banking & Trust Co., 1.45%, 5/10/2019 | | | 5,620,000 | | | | 5,552,067 | |
| Capital One Financial Corp., 2.5%, 5/12/2020 | | | 4,324,000 | | | | 4,258,163 | |
| Capital One Financial Corp., 2.4%, 10/30/2020 | | | 2,132,000 | | | | 2,083,541 | |
| Citigroup, Inc., 2.4%, 2/18/2020 | | | 10,463,000 | | | | 10,349,587 | |
| Citigroup, Inc., 3.142% to 1/24/2022, FLR to 1/24/2023 | | | 5,909,000 | | | | 5,798,750 | |
| Citizens Bank N.A., 2.3%, 12/03/2018 | | | 5,000,000 | | | | 4,991,769 | |
| Citizens Bank N.A., 2.25%, 3/02/2020 | | | 3,450,000 | | | | 3,393,422 | |
| Citizens Bank N.A., 2.55%, 5/13/2021 | | | 845,000 | | | | 826,754 | |
| Compass Bank, 2.875%, 6/29/2022 | | | 6,688,000 | | | | 6,438,320 | |
| Discover Bank, 3.1%, 6/04/2020 | | | 3,205,000 | | | | 3,188,873 | |
| Fifth Third Bancorp, 2.3%, 3/01/2019 | | | 1,859,000 | | | | 1,852,533 | |
| Fifth Third Bancorp, 2.3%, 3/15/2019 | | | 3,120,000 | | | | 3,111,455 | |
| First Republic Bank, 2.375%, 6/17/2019 | | | 1,333,000 | | | | 1,323,327 | |
| Groupe BPCE S.A., 2.5%, 12/10/2018 | | | 2,520,000 | | | | 2,518,443 | |
| Intesa Sanpaolo S.p.A., FLR, 2.982% (LIBOR-3mo. + 0.63%), 7/17/2019 | | | 10,767,000 | | | | 10,773,338 | |
| Lloyds Bank PLC, 1.75%, 5/14/2018 | | | 2,040,000 | | | | 2,039,598 | |
| Lloyds Bank PLC, 2.3%, 11/27/2018 | | | 1,700,000 | | | | 1,696,816 | |
| Lloyds Bank PLC, FLR, 3.362% (LIBOR-3mo. + 1%), 1/22/2019 | | | 6,220,000 | | | | 6,256,840 | |
| National Bank of Canada, FLR, 2.947% (LIBOR-3mo. + 0.84%), 12/14/2018 | | | 5,040,000 | | | | 5,063,148 | |
| Santander UK Group Holdings PLC, 2.875%, 8/05/2021 | | | 4,560,000 | | | | 4,458,809 | |
| Santander UK PLC, 3.05%, 8/23/2018 | | | 2,403,000 | | | | 2,406,617 | |
| SunTrust Banks, Inc., 2.7%, 1/27/2022 | | | 5,086,000 | | | | 4,952,913 | |
21
Portfolio of Investments – continued
| | | | | | | | |
| Issuer | | Shares/Par | | | Value ($) | |
| Bonds - continued | | | | | | | | |
| Other Banks & Diversified Financials - continued | | | | | | | | |
| U.S. Bank NA Cincinnati, 2.05%, 10/23/2020 | | $ | 7,302,000 | | | $ | 7,136,297 | |
| UniCredito Italiano S.p.A., 3.75%, 4/12/2022 (n) | | | 3,485,000 | | | | 3,456,703 | |
| | | | | | | | |
| | | | | | | $ | 122,320,980 | |
| Pharmaceuticals - 2.8% | | | | | | | | |
| AbbVie, Inc., 1.8%, 5/14/2018 | | $ | 5,760,000 | | | $ | 5,759,078 | |
| Actavis Funding SCS, 3%, 3/12/2020 | | | 2,399,000 | | | | 2,382,768 | |
| Amgen, Inc., 2.2%, 5/11/2020 | | | 4,949,000 | | | | 4,868,876 | |
| Celgene Corp., 2.875%, 8/15/2020 | | | 6,424,000 | | | | 6,382,017 | |
| Celgene Corp., 2.75%, 2/15/2023 | | | 4,506,000 | | | | 4,301,695 | |
| Gilead Sciences, Inc., 1.85%, 9/04/2018 | | | 4,760,000 | | | | 4,752,855 | |
| Shire Acquisitions Investments Ireland Designated Activity Co., 1.9%, 9/23/2019 | | | 10,330,000 | | | | 10,147,581 | |
| | | | | | | | |
| | | | | | | $ | 38,594,870 | |
| Real Estate - Apartment - 0.1% | | | | | | | | |
| ERP Operating LP, 4.75%, 7/15/2020 | | $ | 1,200,000 | | | $ | 1,236,912 | |
| | |
| Retailers - 0.5% | | | | | | | | |
| Alimentation Couche-Tard, Inc., 2.35%, 12/13/2019 (n) | | $ | 6,472,000 | | | $ | 6,385,301 | |
| | |
| Supranational - 0.4% | | | | | | | | |
| Corporacion Andina de Fomento, 2%, 5/10/2019 | | $ | 4,870,000 | | | $ | 4,831,682 | |
| | |
| Telecommunications - Wireless - 1.8% | | | | | | | | |
| American Tower Corp., REIT, 2.8%, 6/01/2020 | | $ | 2,158,000 | | | $ | 2,139,987 | |
| American Tower Corp., REIT, 3%, 6/15/2023 | | | 5,297,000 | | | | 5,077,680 | |
| Crown Castle International Corp., 3.4%, 2/15/2021 | | | 2,140,000 | | | | 2,141,757 | |
| Crown Castle International Corp., 3.15%, 7/15/2023 | | | 2,734,000 | | | | 2,637,600 | |
| Crown Castle Towers LLC, 4.883%, 8/15/2020 (n) | | | 6,579,000 | | | | 6,788,675 | |
| SBA Tower Trust, 2.898%, 10/08/2019 (n) | | | 4,150,000 | | | | 4,150,690 | |
| SBA Tower Trust, 2.877%, 7/10/2046 (n) | | | 1,843,000 | | | | 1,808,886 | |
| | | | | | | | |
| | | | | | | $ | 24,745,275 | |
| Tobacco - 1.7% | | | | | | | | |
| BAT Capital Corp., 2.297%, 8/14/2020 (n) | | $ | 7,295,000 | | | $ | 7,137,286 | |
| Imperial Tobacco Finance PLC, 2.05%, 7/20/2018 (n) | | | 4,696,000 | | | | 4,687,828 | |
| Imperial Tobacco Finance PLC, 2.95%, 7/21/2020 (n) | | | 8,541,000 | | | | 8,464,654 | |
| Reynolds American, Inc., 2.3%, 6/12/2018 | | | 3,640,000 | | | | 3,639,253 | |
| | | | | | | | |
| | | | | | | $ | 23,929,021 | |
| Transportation - Services - 0.4% | | | | | | | | |
| TTX Co., 2.6%, 6/15/2020 (n) | | $ | 5,870,000 | | | $ | 5,794,562 | |
22
Portfolio of Investments – continued
| | | | | | | | |
| Issuer | | Shares/Par | | | Value ($) | |
| | | | | | | | |
| Bonds - continued | | | | | | | | |
| U.S. Government Agencies and Equivalents - 0.3% | | | | | | | | |
| Hashemite Kingdom of Jordan, 1.945%, 6/23/2019 | | $ | 4,500,000 | | | $ | 4,473,011 | |
| | |
| U.S. Treasury Obligations - 8.3% | | | | | | | | |
| U.S. Treasury Notes, 2.25%, 3/31/2020 | | $ | 54,291,000 | | | $ | 54,053,477 | |
| U.S. Treasury Notes, 1.375%, 10/31/2020 | | | 20,116,000 | | | | 19,532,950 | |
| U.S. Treasury Notes, 2.375%, 3/15/2021 | | | 41,165,000 | | | | 40,893,247 | |
| | | | | | | | |
| | | | | | | $ | 114,479,674 | |
| Utilities - Electric Power - 3.0% | | | | | | | | |
| Dominion Energy, Inc., 2.962%, 7/01/2019 | | $ | 2,840,000 | | | $ | 2,832,012 | |
| Dominion Energy, Inc., 1.6%, 8/15/2019 | | | 1,640,000 | | | | 1,610,539 | |
| Dominion Energy, Inc., 2.579%, 7/01/2020 | | | 4,253,000 | | | | 4,186,994 | |
| Dominion Resources, Inc., 2.5%, 12/01/2019 | | | 7,000,000 | | | | 6,915,701 | |
| Emera U.S. Finance LP, 2.15%, 6/15/2019 | | | 4,397,000 | | | | 4,349,900 | |
| Eversource Energy, 2.5%, 3/15/2021 | | | 3,117,000 | | | | 3,056,149 | |
| FirstEnergy Corp., 2.85%, 7/15/2022 | | | 2,128,000 | | | | 2,049,765 | |
| NextEra Energy Capital Holdings, Inc., 2.3%, 4/01/2019 | | | 3,623,000 | | | | 3,608,544 | |
| Southern Co., 2.45%, 9/01/2018 | | | 2,700,000 | | | | 2,697,822 | |
| Southern Co., 1.85%, 7/01/2019 | | | 5,610,000 | | | | 5,538,861 | |
| Xcel Energy, Inc., 2.4%, 3/15/2021 | | | 4,070,000 | | | | 3,980,083 | |
| | | | | | | | |
| | | | | | | $ | 40,826,370 | |
| Total Bonds (Identified Cost, $1,383,053,224) | | | | | | $ | 1,365,325,007 | |
| | |
| Investment Companies (h) - 1.9% | | | | | | | | |
| Money Market Funds - 1.9% | | | | | | | | |
MFS Institutional Money Market Portfolio, 1.78% (v)
(Identified Cost, $26,521,573) | | | 26,523,962 | | | $ | 26,521,309 | |
| | |
| Other Assets, Less Liabilities - (0.9)% | | | | | | | (13,003,122 | ) |
| Net Assets - 100.0% | | | | | | $ | 1,378,843,194 | |
| (h) | An affiliated issuer may be considered one in which the fund owns 5% or more of the outstanding voting securities, or a company which is under common control. At period end, the aggregate values of the fund’s investments in affiliated issuers and in unaffiliated issuers were $26,521,309 and $1,365,325,007, respectively. |
| (i) | Interest only security for which the fund receives interest on notional principal (Par amount). Par amount shown is the notional principal and does not reflect the cost of the security. |
| (n) | Securities exempt from registration under Rule 144A of the Securities Act of 1933. These securities may be sold in the ordinary course of business in transactions exempt from registration, normally to qualified institutional buyers. At period end, the aggregate value of these securities was $528,738,343, representing 38.3% of net assets. |
| (q) | Interest received was less than stated coupon rate. |
23
Portfolio of Investments – continued
| (v) | Affiliated issuer that is available only to investment companies managed by MFS. The rate quoted for the MFS Institutional Money Market Portfolio is the annualized seven-day yield of the fund at period end. |
| (z) | Restricted securities are not registered under the Securities Act of 1933 and are subject to legal restrictions on resale. These securities generally may be resold in transactions exempt from registration or to the public if the securities are subsequently registered. Disposal of these securities may involve time-consuming negotiations and prompt sale at an acceptable price may be difficult. The fund holds the following restricted securities: |
| | | | | | | | | | |
| Restricted Securities | | Acquisition
Date | | Cost | | | Value | |
| Ambac Assurance Corp., 5.1%, 6/07/2020 | | 2/14/18 | | | $9,757 | | | | $31,155 | |
| Ambac LSNI, LLC, FLR, 6.811% (LIBOR-3mo. + 5%), 2/12/2023 | | 2/14/18 | | | 25,253 | | | | 114,171 | |
| Bayview Commercial Asset Trust, FLR, 2.207% (LIBOR-1mo. + 0.31%), 8/25/2035 | | 6/09/05 | | | 437,924 | | | | 415,694 | |
| Bayview Commercial Asset Trust, FLR, 2.142% (LIBOR-1mo. + 0.27%), 4/25/2036 | | 2/23/06 | | | 380,464 | | | | 359,927 | |
| Bayview Financial Revolving Mortgage Loan Trust, FLR, 3.501% (LIBOR-1mo. + 1.6%), 12/28/2040 | | 3/01/06 | | | 511,075 | | | | 463,685 | |
| Business Jet Securities LLC, 2018-1, “A”, 4.335%, 2/15/2033 | | 2/21/18 | | | 5,969,170 | | | | 5,983,935 | |
| Commercial Mortgage Asset Trust, 1.466%, 1/17/2032 | | 8/25/03 | | | 0 | | | | 19 | |
| Exeter Automobile Receivables Trust, 2018-2A, “C”, 3.69%, 3/15/2023 | | 4/17/18 | | | 5,789,114 | | | | 5,789,111 | |
| Granite Point Mortgage Trust Inc., 2.796%, 12/19/2035 | | 4/26/18 | | | 5,834,000 | | | | 5,825,249 | |
| Hertz Fleet Lease Funding LP, 2018-1, “B”, 3.64%, 5/10/2032 | | 4/25/18 | | | 2,751,605 | | | | 2,751,605 | |
| Hertz Fleet Lease Funding LP, 2018-1, “C”, 3.77%, 5/10/2032 | | 4/25/18 | | | 1,579,598 | | | | 1,579,598 | |
| Loomis, Sayles & Co., CLO, “A2”, FLR, 3.753% (LIBOR-3mo. + 1.4%), 4/15/2028 | | 4/03/18 | | | 4,537,081 | | | | 4,537,081 | |
| Madison Park Funding Ltd., 2014-13A, “BR2”, FLR, 3.855% (LIBOR-3mo. + 1.5%), 4/19/2030 | | 4/11/18 | | | 6,806,093 | | | | 6,799,205 | |
| Morgan Stanley Capital I, Inc., 1.836%, 3/15/2031 | | 6/10/03 | | | 10 | | | | 1 | |
| Shackelton Ltd., CLO, 2013-4RA, “B”, FLR, 4.242% (LIBOR-3mo. + 1.9%), 4/13/2031 | | 4/04/18 | | | 2,268,542 | | | | 2,268,501 | |
| TICP Ltd., CLO, 2018-3R, “B”, FLR, 3.709% (LIBOR-3mo. + 1.35%), 4/20/2028 | | 4/05/18 | | | 2,132,575 | | | | 2,132,535 | |
| TICP Ltd., CLO, 2018-3R, “C”, FLR, 4.159% (LIBOR-3mo. + 1.8%), 4/20/2028 | | 4/05/18 | | | 3,742,444 | | | | 3,742,358 | |
| Total Restricted Securities | | | | | | | | | $42,793,830 | |
| % of Net assets | | | | | | | | | 3.1% | |
24
Portfolio of Investments – continued
The following abbreviations are used in this report and are defined:
| AGM | | Assured Guaranty Municipal |
| CDO | | Collateralized Debt Obligation |
| CLO | | Collateralized Loan Obligation |
| FLR | | Floating Rate. Interest rate resets periodically based on the parenthetically disclosed reference rate plus a spread (if any). The period-end rate reported may not be the current rate. |
| PLC | | Public Limited Company |
| REIT | | Real Estate Investment Trust |
See Notes to Financial Statements
25
Financial Statements
STATEMENT OF ASSETS AND LIABILITIES
At 4/30/18
This statement represents your fund’s balance sheet, which details the assets and liabilities comprising the total value of the fund.
| | | | |
| Assets | | | | |
Investments in unaffiliated issuers, at value (identified cost, $1,383,053,224) | | | $1,365,325,007 | |
Investments in affiliated issuers, at value (identified cost, $26,521,573) | | | 26,521,309 | |
Cash | | | 150,767 | |
Receivables for | | | | |
Fund shares sold | | | 3,281,902 | |
Interest | | | 6,193,002 | |
Other assets | | | 4,008 | |
Total assets | | | $1,401,475,995 | |
| Liabilities | | | | |
Payables for | | | | |
Distributions | | | $277,115 | |
Investments purchased | | | 18,933,706 | |
Fund shares reacquired | | | 2,764,530 | |
Payable to affiliates | | | | |
Investment adviser | | | 61,285 | |
Shareholder servicing costs | | | 430,063 | |
Distribution and service fees | | | 21,484 | |
Program manager fee | | | 847 | |
Payable for independent Trustees’ compensation | | | 2,413 | |
Accrued expenses and other liabilities | | | 141,358 | |
Total liabilities | | | $22,632,801 | |
Net assets | | | $1,378,843,194 | |
| Net assets consist of | | | | |
Paid-in capital | | | $1,444,688,297 | |
Unrealized appreciation (depreciation) | | | (17,728,481 | ) |
Accumulated net realized gain (loss) | | | (47,387,950 | ) |
Accumulated distributions in excess of net investment income | | | (728,672 | ) |
Net assets | | | $1,378,843,194 | |
Shares of beneficial interest outstanding | | | 234,209,300 | |
26
Statement of Assets and Liabilities – continued
| | | | | | | | | | | | |
| | | Net assets | | | Shares
outstanding | | | Net asset value
per share (a) | |
Class A | | | $486,143,764 | | | | 82,462,707 | | | | $5.90 | |
Class B | | | 3,779,449 | | | | 642,564 | | | | 5.88 | |
Class C | | | 56,372,096 | | | | 9,568,607 | | | | 5.89 | |
Class I | | | 141,291,111 | | | | 24,072,022 | | | | 5.87 | |
Class R1 | | | 294,257 | | | | 50,063 | | | | 5.88 | |
Class R2 | | | 2,907,547 | | | | 493,351 | | | | 5.89 | |
Class R3 | | | 2,139,856 | | | | 362,816 | | | | 5.90 | |
Class R4 | | | 6,536,963 | | | | 1,109,078 | | | | 5.89 | |
Class R6 | | | 524,652,735 | | | | 89,193,593 | | | | 5.88 | |
Class 529A | | | 108,692,091 | | | | 18,442,046 | | | | 5.89 | |
Class 529B | | | 4,378,593 | | | | 745,206 | | | | 5.88 | |
Class 529C | | | 41,654,732 | | | | 7,067,247 | | | | 5.89 | |
| (a) | Maximum offering price per share was equal to the net asset value per share for all share classes, except for Classes A and 529A, for which the maximum offering prices per share were $6.05 [100 / 97.50 x $5.90] and $6.04 [100 / 97.50 x $5.89], respectively. On sales of $50,000 or more, the maximum offering prices of Class A and Class 529A shares are reduced. A contingent deferred sales charge may be imposed on redemptions of Class A, Class B, Class C, Class 529B, and Class 529C shares. Redemption price per share was equal to the net asset value per share for Classes I, R1, R2, R3, R4, R6, and 529A. Net asset value per share is calculated using actual net assets and shares outstanding rather than amounts that have been rounded for presentation purposes. |
See Notes to Financial Statements
27
Financial Statements
STATEMENT OF OPERATIONS
Year ended 4/30/18
This statement describes how much your fund earned in investment income and accrued in expenses. It also describes any gains and/or losses generated by fund operations.
| | | | |
| Net investment income (loss) | | | | |
Income | | | | |
Interest | | | $34,513,356 | |
Dividends from affiliated issuers | | | 344,402 | |
Total investment income | | | $34,857,758 | |
Expenses | | | | |
Management fee | | | $5,800,197 | |
Distribution and service fees | | | 2,858,058 | |
Shareholder servicing costs | | | 1,416,223 | |
Program manager fees | | | 113,902 | |
Administrative services fee | | | 234,361 | |
Independent Trustees’ compensation | | | 24,913 | |
Custodian fee | | | 157,510 | |
Shareholder communications | | | 109,341 | |
Audit and tax fees | | | 64,762 | |
Legal fees | | | 16,746 | |
Miscellaneous | | | 243,753 | |
Total expenses | | | $11,039,766 | |
Fees paid indirectly | | | (6,016 | ) |
Reduction of expenses by investment adviser and distributor | | | (787,731 | ) |
Net expenses | | | $10,246,019 | |
Net investment income (loss) | | | $24,611,739 | |
| Realized and unrealized gain (loss) | | | | |
Realized gain (loss) (identified cost basis) | | | | |
Unaffiliated issuers | | | $(2,189,941 | ) |
Affiliated issuers | | | (6,224 | ) |
Futures contracts | | | 158,311 | |
Net realized gain (loss) | | | $(2,037,854 | ) |
Change in unrealized appreciation (depreciation) | | | | |
Unaffiliated issuers | | | $(16,417,956 | ) |
Affiliated issuers | | | (5,227 | ) |
Futures contracts | | | (299,635 | ) |
Net unrealized gain (loss) | | | $(16,722,818 | ) |
Net realized and unrealized gain (loss) | | | $(18,760,672 | ) |
Change in net assets from operations | | | $5,851,067 | |
See Notes to Financial Statements
28
Financial Statements
STATEMENTS OF CHANGES IN NET ASSETS
These statements describe the increases and/or decreases in net assets resulting from operations, any distributions, and any shareholder transactions.
| | | | | | | | |
| | | Year ended | |
| | | 4/30/18 | | | 4/30/17 | |
| Change in net assets | | | | | | |
| From operations | | | | | | | | |
Net investment income (loss) | | | $24,611,739 | | | | $16,775,997 | |
Net realized gain (loss) | | | (2,037,854 | ) | | | (781,764 | ) |
Net unrealized gain (loss) | | | (16,722,818 | ) | | | (105,864 | ) |
Change in net assets from operations | | | $5,851,067 | | | | $15,888,369 | |
| Distributions declared to shareholders | | | | | | | | |
From net investment income | | | $(27,335,499 | ) | | | $(19,164,833 | ) |
Change in net assets from fund share transactions | | | $(140,861,695 | ) | | | $110,731,449 | |
Total change in net assets | | | $(162,346,127 | ) | | | $107,454,985 | |
| Net assets | | | | | | | | |
At beginning of period | | | 1,541,189,321 | | | | 1,433,734,336 | |
At end of period (including accumulated distributions in excess of net investment income of $728,672 and undistributed net investment income of $162,122) | | | $1,378,843,194 | | | | $1,541,189,321 | |
See Notes to Financial Statements
29
Financial Statements
FINANCIAL HIGHLIGHTS
The financial highlights table is intended to help you understand the fund’s financial performance for the past 5 years. Certain information reflects financial results for a single fund share. The total returns in the table represent the rate that an investor would have earned (or lost) on an investment in the fund share class (assuming reinvestment of all distributions) held for the entire period.
| | | | | | | | | | | | | | | | | | | | |
| Class A | | Year ended | |
| | | 4/30/18 | | | 4/30/17 | | | 4/30/16 | | | 4/30/15 | | | 4/30/14 | |
Net asset value, beginning of period | | | $5.99 | | | | $6.00 | | | | $6.03 | | | | $6.06 | | | | $6.13 | |
| Income (loss) from investment operations | | | | | | | | | | | | | | | | | |
Net investment income (loss) (d) | | | $0.10 | | | | $0.07 | (c) | | | $0.06 | | | | $0.05 | | | | $0.08 | |
Net realized and unrealized gain (loss) | | | (0.08 | ) | | | (0.00 | )(w) | | | (0.02 | ) | | | (0.01 | ) | | | (0.05 | ) |
Total from investment operations | | | $0.02 | | | | $0.07 | | | | $0.04 | | | | $0.04 | | | | $0.03 | |
| Less distributions declared to shareholders | | | | | | | | | | | | | | | | | |
From net investment income | | | $(0.11 | ) | | | $(0.08 | ) | | | $(0.07 | ) | | | $(0.07 | ) | | | $(0.10 | ) |
Net asset value, end of period (x) | | | $5.90 | | | | $5.99 | | | | $6.00 | | | | $6.03 | | | | $6.06 | |
Total return (%) (r)(s)(t)(x) | | | 0.36 | | | | 1.12 | (c) | | | 0.68 | | | | 0.61 | | | | 0.44 | |
| Ratios (%) (to average net assets) and Supplemental data: | | | | | | | | | | | | | | | | | |
Expenses before expense reductions (f) | | | 0.83 | | | | 0.82 | (c) | | | 0.85 | | | | 0.86 | | | | 0.84 | |
Expenses after expense reductions (f) | | | 0.72 | | | | 0.72 | (c) | | | 0.74 | | | | 0.75 | | | | 0.73 | |
Net investment income (loss) | | | 1.68 | | | | 1.11 | (c) | | | 0.94 | | | | 0.84 | | | | 1.29 | |
Portfolio turnover | | | 57 | | | | 54 | | | | 30 | | | | 37 | | | | 29 | |
Net assets at end of period (000 omitted) | | | $486,144 | | | | $514,304 | | | | $462,778 | | | | $459,032 | | | | $576,712 | |
See Notes to Financial Statements
30
Financial Highlights – continued
| | | | | | | | | | | | | | | | | | | | |
| Class B | | Year ended | |
| | | 4/30/18 | | | 4/30/17 | | | 4/30/16 | | | 4/30/15 | | | 4/30/14 | |
Net asset value, beginning of period | | | $5.97 | | | | $5.98 | | | | $6.01 | | | | $6.04 | | | | $6.11 | |
| Income (loss) from investment operations | | | | | | | | | | | | | | | | | |
Net investment income (loss) (d) | | | $0.06 | | | | $0.02 | (c) | | | $0.01 | | | | $0.01 | | | | $0.03 | |
Net realized and unrealized gain (loss) | | | (0.08 | ) | | | (0.00 | )(w) | | | (0.01 | ) | | | (0.02 | ) | | | (0.05 | ) |
Total from investment operations | | | $(0.02 | ) | | | $0.02 | | | | $0.00 | (w) | | | $(0.01 | ) | | | $(0.02 | ) |
| Less distributions declared to shareholders | | | | | | | | | | | | | | | | | |
From net investment income | | | $(0.07 | ) | | | $(0.03 | ) | | | $(0.03 | ) | | | $(0.02 | ) | | | $(0.05 | ) |
Net asset value, end of period (x) | | | $5.88 | | | | $5.97 | | | | $5.98 | | | | $6.01 | | | | $6.04 | |
Total return (%) (r)(s)(t)(x) | | | (0.39 | ) | | | 0.35 | (c) | | | (0.07 | ) | | | (0.14 | ) | | | (0.32 | ) |
| Ratios (%) (to average net assets) and Supplemental data: | | | | | | | | | | | | | | | | | |
Expenses before expense reductions (f) | | | 1.58 | | | | 1.58 | (c) | | | 1.60 | | | | 1.61 | | | | 1.59 | |
Expenses after expense reductions (f) | | | 1.48 | | | | 1.47 | (c) | | | 1.50 | | | | 1.51 | | | | 1.49 | |
Net investment income (loss) | | | 0.93 | | | | 0.37 | (c) | | | 0.20 | | | | 0.09 | | | | 0.54 | |
Portfolio turnover | | | 57 | | | | 54 | | | | 30 | | | | 37 | | | | 29 | |
Net assets at end of period (000 omitted) | | | $3,779 | | | | $5,286 | | | | $6,477 | | | | $6,463 | | | | $7,814 | |
| |
| Class C | | Year ended | |
| | | 4/30/18 | | | 4/30/17 | | | 4/30/16 | | | 4/30/15 | | | 4/30/14 | |
Net asset value, beginning of period | | | $5.98 | | | | $5.99 | | | | $6.02 | | | | $6.05 | | | | $6.12 | |
| Income (loss) from investment operations | | | | | | | | | | | | | | | | | |
Net investment income (loss) (d) | | | $0.05 | | | | $0.02 | (c) | | | $0.01 | | | | $(0.00 | )(w) | | | $0.03 | |
Net realized and unrealized gain (loss) | | | (0.08 | ) | | | (0.00 | )(w) | | | (0.02 | ) | | | (0.01 | ) | | | (0.06 | ) |
Total from investment operations | | | $(0.03 | ) | | | $0.02 | | | | $(0.01 | ) | | | $(0.01 | ) | | | $(0.03 | ) |
| Less distributions declared to shareholders | | | | | | | | | | | | | | | | | |
From net investment income | | | $(0.06 | ) | | | $(0.03 | ) | | | $(0.02 | ) | | | $(0.02 | ) | | | $(0.04 | ) |
Net asset value, end of period (x) | | | $5.89 | | | | $5.98 | | | | $5.99 | | | | $6.02 | | | | $6.05 | |
Total return (%) (r)(s)(t)(x) | | | (0.49 | ) | | | 0.26 | (c) | | | (0.17 | ) | | | (0.24 | ) | | | (0.41 | ) |
| Ratios (%) (to average net assets) and Supplemental data: | | | | | | | | | | | | | | | | | |
Expenses before expense reductions (f) | | | 1.58 | | | | 1.58 | (c) | | | 1.60 | | | | 1.61 | | | | 1.59 | |
Expenses after expense reductions (f) | | | 1.58 | | | | 1.57 | (c) | | | 1.59 | | | | 1.60 | | | | 1.59 | |
Net investment income (loss) | | | 0.83 | | | | 0.27 | (c) | | | 0.09 | | | | (0.00 | )(w) | | | 0.46 | |
Portfolio turnover | | | 57 | | | | 54 | | | | 30 | | | | 37 | | | | 29 | |
Net assets at end of period (000 omitted) | | | $56,372 | | | | $95,767 | | | | $119,063 | | | | $137,178 | | | | $171,276 | |
See Notes to Financial Statements
31
Financial Highlights – continued
| | | | | | | | | | | | | | | | | | | | |
| Class I | | Year ended | |
| | | 4/30/18 | | | 4/30/17 | | | 4/30/16 | | | 4/30/15 | | | 4/30/14 | |
Net asset value, beginning of period | | | $5.96 | | | | $5.97 | | | | $6.00 | | | | $6.03 | | | | $6.10 | |
| Income (loss) from investment operations | | | | | | | | | | | | | | | | | |
Net investment income (loss) (d) | | | $0.11 | | | | $0.08 | (c) | | | $0.07 | | | | $0.06 | | | | $0.09 | |
Net realized and unrealized gain (loss) | | | (0.08 | ) | | | (0.00 | )(w) | | | (0.02 | ) | | | (0.01 | ) | | | (0.05 | ) |
Total from investment operations | | | $0.03 | | | | $0.08 | | | | $0.05 | | | | $0.05 | | | | $0.04 | |
| Less distributions declared to shareholders | | | | | | | | | | | | | | | | | |
From net investment income | | | $(0.12 | ) | | | $(0.09 | ) | | | $(0.08 | ) | | | $(0.08 | ) | | | $(0.11 | ) |
Net asset value, end of period (x) | | | $5.87 | | | | $5.96 | | | | $5.97 | | | | $6.00 | | | | $6.03 | |
Total return (%) (r)(s)(t)(x) | | | 0.51 | | | | 1.27 | (c) | | | 0.83 | | | | 0.76 | | | | 0.59 | |
| Ratios (%) (to average net assets) and Supplemental data: | | | | | | | | | | | | | | | | | |
Expenses before expense reductions (f) | | | 0.58 | | | | 0.58 | (c) | | | 0.60 | | | | 0.61 | | | | 0.59 | |
Expenses after expense reductions (f) | | | 0.58 | | | | 0.57 | (c) | | | 0.59 | | | | 0.60 | | | | 0.59 | |
Net investment income (loss) | | | 1.81 | | | | 1.28 | (c) | | | 1.10 | | | | 1.00 | | | | 1.41 | |
Portfolio turnover | | | 57 | | | | 54 | | | | 30 | | | | 37 | | | | 29 | |
Net assets at end of period (000 omitted) | | | $141,291 | | | | $257,580 | | | | $222,997 | | | | $296,392 | | | | $237,785 | |
| |
| Class R1 | | Year ended | |
| | | 4/30/18 | | | 4/30/17 | | | 4/30/16 | | | 4/30/15 | | | 4/30/14 | |
Net asset value, beginning of period | | | $5.97 | | | | $5.98 | | | | $6.01 | | | | $6.04 | | | | $6.11 | |
| Income (loss) from investment operations | | | | | | | | | | | | | | | | | |
Net investment income (loss) (d) | | | $0.05 | | | | $0.02 | (c) | | | $0.01 | | | | $0.00 | (w) | | | $0.03 | |
Net realized and unrealized gain (loss) | | | (0.08 | ) | | | (0.00 | )(w) | | | (0.02 | ) | | | (0.01 | ) | | | (0.06 | ) |
Total from investment operations | | | $(0.03 | ) | | | $0.02 | | | | $(0.01 | ) | | | $(0.01 | ) | | | $(0.03 | ) |
| Less distributions declared to shareholders | | | | | | | | | | | | | | | | | |
From net investment income | | | $(0.06 | ) | | | $(0.03 | ) | | | $(0.02 | ) | | | $(0.02 | ) | | | $(0.04 | ) |
Net asset value, end of period (x) | | | $5.88 | | | | $5.97 | | | | $5.98 | | | | $6.01 | | | | $6.04 | |
Total return (%) (r)(s)(t)(x) | | | (0.49 | ) | | | 0.26 | (c) | | | (0.17 | ) | | | (0.24 | ) | | | (0.41 | ) |
| Ratios (%) (to average net assets) and Supplemental data: | | | | | | | | | | | | | | | | | |
Expenses before expense reductions (f) | | | 1.58 | | | | 1.58 | (c) | | | 1.60 | | | | 1.61 | | | | 1.59 | |
Expenses after expense reductions (f) | | | 1.58 | | | | 1.57 | (c) | | | 1.60 | | | | 1.60 | | | | 1.59 | |
Net investment income (loss) | | | 0.83 | | | | 0.26 | (c) | | | 0.09 | | | | (0.00 | )(w) | | | 0.44 | |
Portfolio turnover | | | 57 | | | | 54 | | | | 30 | | | | 37 | | | | 29 | |
Net assets at end of period (000 omitted) | | | $294 | | | | $328 | | | | $484 | | | | $632 | | | | $712 | |
See Notes to Financial Statements
32
Financial Highlights – continued
| | | | | | | | | | | | | | | | | | | | |
| Class R2 | | Year ended | |
| | | 4/30/18 | | | 4/30/17 | | | 4/30/16 | | | 4/30/15 | | | 4/30/14 | |
Net asset value, beginning of period | | | $5.98 | | | | $6.00 | | | | $6.02 | | | | $6.06 | | | | $6.13 | |
| Income (loss) from investment operations | | | | | | | | | | | | | | | | | |
Net investment income (loss) (d) | | | $0.08 | | | | $0.05 | (c) | | | $0.04 | | | | $0.04 | | | | $0.06 | |
Net realized and unrealized gain (loss) | | | (0.07 | ) | | | (0.01 | ) | | | (0.00 | )(w) | | | (0.03 | ) | | | (0.05 | ) |
Total from investment operations | | | $0.01 | | | | $0.04 | | | | $0.04 | | | | $0.01 | | | | $0.01 | |
| Less distributions declared to shareholders | | | | | | | | | | | | | | | | | |
From net investment income | | | $(0.10 | ) | | | $(0.06 | ) | | | $(0.06 | ) | | | $(0.05 | ) | | | $(0.08 | ) |
Net asset value, end of period (x) | | | $5.89 | | | | $5.98 | | | | $6.00 | | | | $6.02 | | | | $6.06 | |
Total return (%) (r)(s)(t)(x) | | | 0.11 | | | | 0.70 | (c) | | | 0.60 | | | | 0.20 | | | | 0.19 | |
| Ratios (%) (to average net assets) and Supplemental data: | | | | | | | | | | | | | | | | | |
Expenses before expense reductions (f) | | | 1.08 | | | | 1.08 | (c) | | | 1.10 | | | | 1.11 | | | | 1.09 | |
Expenses after expense reductions (f) | | | 0.98 | | | | 0.97 | (c) | | | 0.99 | | | | 1.00 | | | | 0.99 | |
Net investment income (loss) | | | 1.42 | | | | 0.87 | (c) | | | 0.69 | | | | 0.59 | | | | 1.04 | |
Portfolio turnover | | | 57 | | | | 54 | | | | 30 | | | | 37 | | | | 29 | |
Net assets at end of period (000 omitted) | | | $2,908 | | | | $3,504 | | | | $3,517 | | | | $3,955 | | | | $4,520 | |
| |
| Class R3 | | Year ended | |
| | | 4/30/18 | | | 4/30/17 | | | 4/30/16 | | | 4/30/15 | | | 4/30/14 | |
Net asset value, beginning of period | | | $5.99 | | | | $6.00 | | | | $6.03 | | | | $6.05 | | | | $6.12 | |
| Income (loss) from investment operations | | | | | | | | | | | | | | | | | |
Net investment income (loss) (d) | | | $0.09 | | | | $0.06 | (c) | | | $0.05 | | | | $0.05 | | | | $0.07 | |
Net realized and unrealized gain (loss) | | | (0.07 | ) | | | (0.00 | )(w) | | | (0.02 | ) | | | (0.01 | ) | | | (0.05 | ) |
Total from investment operations | | | $0.02 | | | | $0.06 | | | | $0.03 | | | | $0.04 | | | | $0.02 | |
| Less distributions declared to shareholders | | | | | | | | | | | | | | | | | |
From net investment income | | | $(0.11 | ) | | | $(0.07 | ) | | | $(0.06 | ) | | | $(0.06 | ) | | | $(0.09 | ) |
Net asset value, end of period (x) | | | $5.90 | | | | $5.99 | | | | $6.00 | | | | $6.03 | | | | $6.05 | |
Total return (%) (r)(s)(t)(x) | | | 0.26 | | | | 1.02 | (c) | | | 0.58 | | | | 0.68 | | | | 0.34 | |
| Ratios (%) (to average net assets) and Supplemental data: | | | | | | | | | | | | | | | | | |
Expenses before expense reductions (f) | | | 0.83 | | | | 0.83 | (c) | | | 0.85 | | | | 0.86 | | | | 0.84 | |
Expenses after expense reductions (f) | | | 0.83 | | | | 0.82 | (c) | | | 0.84 | | | | 0.85 | | | | 0.84 | |
Net investment income (loss) | | | 1.57 | | | | 1.01 | (c) | | | 0.84 | | | | 0.76 | | | | 1.19 | |
Portfolio turnover | | | 57 | | | | 54 | | | | 30 | | | | 37 | | | | 29 | |
Net assets at end of period (000 omitted) | | | $2,140 | | | | $2,769 | | | | $3,288 | | | | $3,653 | | | | $8,528 | |
See Notes to Financial Statements
33
Financial Highlights – continued
| | | | | | | | | | | | | | | | | | | | |
| Class R4 | | Year ended | |
| | | 4/30/18 | | | 4/30/17 | | | 4/30/16 | | | 4/30/15 | | | 4/30/14 | |
Net asset value, beginning of period | | | $5.98 | | | | $6.00 | | | | $6.03 | | | | $6.06 | | | | $6.13 | |
| Income (loss) from investment operations | | | | | | | | | | | | | | | | | |
Net investment income (loss) (d) | | | $0.11 | | | | $0.08 | (c) | | | $0.07 | | | | $0.05 | | | | $0.09 | |
Net realized and unrealized gain (loss) | | | (0.08 | ) | | | (0.01 | ) | | | (0.02 | ) | | | (0.00 | )(w) | | | (0.05 | ) |
Total from investment operations | | | $0.03 | | | | $0.07 | | | | $0.05 | | | | $0.05 | | | | $0.04 | |
| Less distributions declared to shareholders | | | | | | | | | | | | | | | | | |
From net investment income | | | $(0.12 | ) | | | $(0.09 | ) | | | $(0.08 | ) | | | $(0.08 | ) | | | $(0.11 | ) |
Net asset value, end of period (x) | | | $5.89 | | | | $5.98 | | | | $6.00 | | | | $6.03 | | | | $6.06 | |
Total return (%) (r)(s)(t)(x) | | | 0.51 | | | | 1.10 | (c) | | | 0.84 | | | | 0.77 | | | | 0.59 | |
| Ratios (%) (to average net assets) and Supplemental data: | | | | | | | | | | | | | | | | | |
Expenses before expense reductions (f) | | | 0.58 | | | | 0.58 | (c) | | | 0.60 | | | | 0.61 | | | | 0.59 | |
Expenses after expense reductions (f) | | | 0.58 | | | | 0.57 | (c) | | | 0.59 | | | | 0.61 | | | | 0.59 | |
Net investment income (loss) | | | 1.84 | | | | 1.27 | (c) | | | 1.09 | | | | 0.89 | | | | 1.44 | |
Portfolio turnover | | | 57 | | | | 54 | | | | 30 | | | | 37 | | | | 29 | |
Net assets at end of period (000 omitted) | | | $6,537 | | | | $6,516 | | | | $6,946 | | | | $7,234 | | | | $923 | |
| |
| Class R6 | | Year ended | |
| | | 4/30/18 | | | 4/30/17 | | | 4/30/16 | | | 4/30/15 | | | 4/30/14 | |
Net asset value, beginning of period | | | $5.97 | | | | $5.99 | | | | $6.01 | | | | $6.04 | | | | $6.11 | |
| Income (loss) from investment operations | | | | | | | | | | | | | | | | | |
Net investment income (loss) (d) | | | $0.11 | | | | $0.08 | (c) | | | $0.07 | | | | $0.07 | | | | $0.09 | |
Net realized and unrealized gain (loss) | | | (0.08 | ) | | | (0.01 | ) | | | (0.01 | ) | | | (0.02 | ) | | | (0.05 | ) |
Total from investment operations | | | $0.03 | | | | $0.07 | | | | $0.06 | | | | $0.05 | | | | $0.04 | |
| Less distributions declared to shareholders | | | | | | | | | | | | | | | | | |
From net investment income | | | $(0.12 | ) | | | $(0.09 | ) | | | $(0.08 | ) | | | $(0.08 | ) | | | $(0.11 | ) |
Net asset value, end of period (x) | | | $5.88 | | | | $5.97 | | | | $5.99 | | | | $6.01 | | | | $6.04 | |
Total return (%) (r)(s)(t)(x) | | | 0.58 | | | | 1.17 | (c) | | | 1.08 | | | | 0.85 | | | | 0.66 | |
| Ratios (%) (to average net assets) and Supplemental data: | | | | | | | | | | | | | | | | | |
Expenses before expense reductions (f) | | | 0.51 | | | | 0.51 | (c) | | | 0.52 | | | | 0.52 | | | | 0.52 | |
Expenses after expense reductions (f) | | | 0.50 | | | | 0.50 | (c) | | | 0.51 | | | | 0.51 | | | | 0.52 | |
Net investment income (loss) | | | 1.91 | | | | 1.34 | (c) | | | 1.17 | | | | 1.08 | | | | 1.50 | |
Portfolio turnover | | | 57 | | | | 54 | | | | 30 | | | | 37 | | | | 29 | |
Net assets at end of period (000 omitted) | | | $524,653 | | | | $516,582 | | | | $520,011 | | | | $493,576 | | | | $442,446 | |
See Notes to Financial Statements
34
Financial Highlights – continued
| | | | | | | | | | | | | | | | | | | | |
| Class 529A | | Year ended | |
| | | 4/30/18 | | | 4/30/17 | | | 4/30/16 | | | 4/30/15 | | | 4/30/14 | |
Net asset value, beginning of period | | | $5.98 | | | | $6.00 | | | | $6.03 | | | | $6.06 | | | | $6.13 | |
| Income (loss) from investment operations | | | | | | | | | | | | | | | | | |
Net investment income (loss) (d) | | | $0.10 | | | | $0.06 | (c) | | | $0.05 | | | | $0.05 | | | | $0.08 | |
Net realized and unrealized gain (loss) | | | (0.08 | ) | | | (0.01 | ) | | | (0.01 | ) | | | (0.02 | ) | | | (0.06 | ) |
Total from investment operations | | | $0.02 | | | | $0.05 | | | | $0.04 | | | | $0.03 | | | | $0.02 | |
| Less distributions declared to shareholders | | | | | | | | | | | | | | | | | |
From net investment income | | | $(0.11 | ) | | | $(0.07 | ) | | | $(0.07 | ) | | | $(0.06 | ) | | | $(0.09 | ) |
Net asset value, end of period (x) | | | $5.89 | | | | $5.98 | | | | $6.00 | | | | $6.03 | | | | $6.06 | |
Total return (%) (r)(s)(t)(x) | | | 0.31 | | | | 0.90 | (c) | | | 0.63 | | | | 0.56 | | | | 0.39 | |
| Ratios (%) (to average net assets) and Supplemental data: | | | | | | | | | | | | | | | | | |
Expenses before expense reductions (f) | | | 0.91 | | | | 0.92 | (c) | | | 0.95 | | | | 0.96 | | | | 0.94 | |
Expenses after expense reductions (f) | | | 0.77 | | | | 0.76 | (c) | | | 0.79 | | | | 0.80 | | | | 0.78 | |
Net investment income (loss) | | | 1.65 | | | | 1.08 | (c) | | | 0.90 | | | | 0.79 | | | | 1.24 | |
Portfolio turnover | | | 57 | | | | 54 | | | | 30 | | | | 37 | | | | 29 | |
Net assets at end of period (000 omitted) | | | $108,692 | | | | $89,431 | | | | $55,996 | | | | $47,228 | | | | $41,642 | |
| |
| Class 529B | | Year ended | |
| | | 4/30/18 | | | 4/30/17 | | | 4/30/16 | | | 4/30/15 | | | 4/30/14 | |
Net asset value, beginning of period | | | $5.96 | | | | $5.98 | | | | $6.00 | | | | $6.04 | | | | $6.10 | |
| Income (loss) from investment operations | | | | | | | | | | | | | | | | | |
Net investment income (loss) (d) | | | $0.05 | | | | $0.02 | (c) | | | $0.01 | | | | $0.00 | (w) | | | $0.03 | |
Net realized and unrealized gain (loss) | | | (0.07 | ) | | | (0.01 | ) | | | (0.01 | ) | | | (0.02 | ) | | | (0.04 | ) |
Total from investment operations | | | $(0.02 | ) | | | $0.01 | | | | $0.00 | (w) | | | $(0.02 | ) | | | $(0.01 | ) |
| Less distributions declared to shareholders | | | | | | | | | | | | | | | | | |
From net investment income | | | $(0.06 | ) | | | $(0.03 | ) | | | $(0.02 | ) | | | $(0.02 | ) | | | $(0.05 | ) |
Net asset value, end of period (x) | | | $5.88 | | | | $5.96 | | | | $5.98 | | | | $6.00 | | | | $6.04 | |
Total return (%) (r)(s)(t)(x) | | | (0.29 | ) | | | 0.13 | (c) | | | 0.03 | | | | (0.37 | ) | | | (0.21 | ) |
| Ratios (%) (to average net assets) and Supplemental data: | | | | | | | | | | | | | | | | | |
Expenses before expense reductions (f) | | | 1.66 | | | | 1.68 | (c) | | | 1.70 | | | | 1.71 | | | | 1.69 | |
Expenses after expense reductions (f) | | | 1.52 | | | | 1.52 | (c) | | | 1.55 | | | | 1.56 | | | | 1.54 | |
Net investment income (loss) | | | 0.90 | | | | 0.33 | (c) | | | 0.14 | | | | 0.04 | | | | 0.49 | |
Portfolio turnover | | | 57 | | | | 54 | | | | 30 | | | | 37 | | | | 29 | |
Net assets at end of period (000 omitted) | | | $4,379 | | | | $3,807 | | | | $2,354 | | | | $2,184 | | | | $1,912 | |
See Notes to Financial Statements
35
Financial Highlights – continued
| | | | | | | | | | | | | | | | | | | | |
| Class 529C | | Year ended | |
| | | 4/30/18 | | | 4/30/17 | | | 4/30/16 | | | 4/30/15 | | | 4/30/14 | |
Net asset value, beginning of period | | | $5.98 | | | | $6.00 | | | | $6.02 | | | | $6.06 | | | | $6.13 | |
| Income (loss) from investment operations | | | | | | | | | | | | | | | | | |
Net investment income (loss) (d) | | | $0.05 | | | | $0.01 | (c) | | | $0.00 | (w) | | | $(0.00 | )(w) | | | $0.02 | |
Net realized and unrealized gain (loss) | | | (0.08 | ) | | | (0.01 | ) | | | (0.00 | )(w) | | | (0.03 | ) | | | (0.05 | ) |
Total from investment operations | | | $(0.03 | ) | | | $(0.00 | )(w) | | | $(0.00 | )(w) | | | $(0.03 | ) | | | $(0.03 | ) |
| Less distributions declared to shareholders | | | | | | | | | | | | | | | | | |
From net investment income | | | $(0.06 | ) | | | $(0.02 | ) | | | $(0.02 | ) | | | $(0.01 | ) | | | $(0.04 | ) |
Net asset value, end of period (x) | | | $5.89 | | | | $5.98 | | | | $6.00 | | | | $6.02 | | | | $6.06 | |
Total return (%) (r)(s)(t)(x) | | | (0.53 | ) | | | 0.05 | (c) | | | (0.05 | ) | | | (0.45 | ) | | | (0.46 | ) |
| Ratios (%) (to average net assets) and Supplemental data: | | | | | | | | | | | | | | | | | |
Expenses before expense reductions (f) | | | 1.66 | | | | 1.67 | (c) | | | 1.70 | | | | 1.71 | | | | 1.69 | |
Expenses after expense reductions (f) | | | 1.62 | | | | 1.61 | (c) | | | 1.63 | | | | 1.65 | | | | 1.63 | |
Net investment income (loss) | | | 0.79 | | | | 0.23 | (c) | | | 0.05 | | | | (0.05 | ) | | | 0.40 | |
Portfolio turnover | | | 57 | | | | 54 | | | | 30 | | | | 37 | | | | 29 | |
Net assets at end of period (000 omitted) | | | $41,655 | | | | $45,315 | | | | $29,824 | | | | $27,100 | | | | $24,133 | |
| (c) | Amount reflects a one-time reimbursement of expenses by the custodian (or former custodian) without which net investment income and performance would be lower and expenses would be higher. |
| (d) | Per share data is based on average shares outstanding. |
| (f) | Ratios do not reflect reductions from fees paid indirectly, if applicable. |
| (r) | Certain expenses have been reduced without which performance would have been lower. |
| (s) | From time to time the fund may receive proceeds from litigation settlements, without which performance would be lower. |
| (t) | Total returns do not include any applicable sales charges. |
| (w) | Per share amount was less than $0.01 and total return or ratio was less than 0.01%, as applicable. |
| (x) | The net asset values and total returns have been calculated on net assets which include adjustments made in accordance with U.S. generally accepted accounting principles required at period end for financial reporting purposes. |
See Notes to Financial Statements
36
NOTES TO FINANCIAL STATEMENTS
(1) Business and Organization
MFS Limited Maturity Fund (the fund) is a diversified series of MFS Series Trust IX (the trust). The trust is organized as a Massachusetts business trust and is registered under the Investment Company Act of 1940, as amended, as an open-end management investment company.
The fund is an investment company and accordingly follows the investment company accounting and reporting guidance of the Financial Accounting Standards Board (FASB) Accounting Standards Codification Topic 946 Financial Services – Investment Companies.
(2) Significant Accounting Policies
General – The preparation of financial statements in conformity with U.S. generally accepted accounting principles requires management to make estimates and assumptions that affect the reported amounts of assets and liabilities, and disclosure of contingent assets and liabilities at the date of the financial statements and the reported amounts of increases and decreases in net assets from operations during the reporting period. Actual results could differ from those estimates. In the preparation of these financial statements, management has evaluated subsequent events occurring after the date of the fund’s Statement of Assets and Liabilities through the date that the financial statements were issued. The fund invests in foreign securities. Investments in foreign securities are vulnerable to the effects of changes in the relative values of the local currency and the U.S. dollar and to the effects of changes in each country’s market, economic, industry, political, regulatory, geopolitical, and other conditions.
In March 2017, the FASB issued Accounting Standards Update 2017-08, Receivables – Nonrefundable Fees and Other Costs (Subtopic 310-20) – Premium Amortization on Purchased Callable Debt Securities (“ASU 2017-08”). For entities that hold callable debt securities at a premium, ASU 2017-08 requires that the premium be amortized to the earliest call date. ASU 2017-08 will be effective for fiscal years beginning after December 15, 2018, and interim periods within those fiscal years. Management has evaluated the potential impacts of ASU 2017-08 and believes that adoption of ASU 2017-08 will not have a material effect on the fund’s overall financial position or its overall results of operations.
Balance Sheet Offsetting – The fund’s accounting policy with respect to balance sheet offsetting is that, absent an event of default by the counterparty or a termination of the agreement, the International Swaps and Derivatives Association (ISDA) Master Agreement, or similar agreement, does not result in an offset of reported amounts of financial assets and financial liabilities in the Statement of Assets and Liabilities across transactions between the fund and the applicable counterparty. The fund’s right to setoff may be restricted or prohibited by the bankruptcy or insolvency laws of the particular jurisdiction to which a specific master netting agreement counterparty is subject. Balance sheet offsetting disclosures, to the extent applicable to the fund, have been included in the fund’s Significant Accounting Policies note under the captions for each of the fund’s in-scope financial instruments and transactions.
37
Notes to Financial Statements – continued
Investment Valuations – Debt instruments and floating rate loans, including restricted debt instruments, are generally valued at an evaluated or composite bid as provided by a third-party pricing service. Short-term instruments with a maturity at issuance of 60 days or less may be valued at amortized cost, which approximates market value. Futures contracts are generally valued at last posted settlement price on their primary exchange as provided by a third-party pricing service. Futures contracts for which there were no trades that day for a particular position are generally valued at the closing bid quotation on their primary exchange as provided by a third-party pricing service. Open-end investment companies are generally valued at net asset value per share. Securities and other assets generally valued on the basis of information from a third-party pricing service may also be valued at a broker/dealer bid quotation. Values obtained from third-party pricing services can utilize both transaction data and market information such as yield, quality, coupon rate, maturity, type of issue, trading characteristics, and other market data. The values of foreign securities and other assets and liabilities expressed in foreign currencies are converted to U.S. dollars using the mean of bid and asked prices for rates provided by a third-party pricing service.
The Board of Trustees has delegated primary responsibility for determining or causing to be determined the value of the fund’s investments (including any fair valuation) to the adviser pursuant to valuation policies and procedures approved by the Board. If the adviser determines that reliable market quotations are not readily available, investments are valued at fair value as determined in good faith by the adviser in accordance with such procedures under the oversight of the Board of Trustees. Under the fund’s valuation policies and procedures, market quotations are not considered to be readily available for most types of debt instruments and floating rate loans and many types of derivatives. These investments are generally valued at fair value based on information from third-party pricing services. In addition, investments may be valued at fair value if the adviser determines that an investment’s value has been materially affected by events occurring after the close of the exchange or market on which the investment is principally traded (such as foreign exchange or market) and prior to the determination of the fund’s net asset value, or after the halting of trading of a specific security where trading does not resume prior to the close of the exchange or market on which the security is principally traded. The adviser generally relies on third-party pricing services or other information (such as the correlation with price movements of similar securities in the same or other markets; the type, cost and investment characteristics of the security; the business and financial condition of the issuer; and trading and other market data) to assist in determining whether to fair value and at what value to fair value an investment. The value of an investment for purposes of calculating the fund’s net asset value can differ depending on the source and method used to determine value. When fair valuation is used, the value of an investment used to determine the fund’s net asset value may differ from quoted or published prices for the same investment. There can be no assurance that the fund could obtain the fair value assigned to an investment if it were to sell the investment at the same time at which the fund determines its net asset value per share.
Various inputs are used in determining the value of the fund’s assets or liabilities. These inputs are categorized into three broad levels. In certain cases, the inputs used to measure fair value may fall into different levels of the fair value hierarchy. In such cases,
38
Notes to Financial Statements – continued
an investment’s level within the fair value hierarchy is based on the lowest level of input that is significant to the fair value measurement. The fund’s assessment of the significance of a particular input to the fair value measurement in its entirety requires judgment, and considers factors specific to the investment. Level 1 includes unadjusted quoted prices in active markets for identical assets or liabilities. Level 2 includes other significant observable market-based inputs (including quoted prices for similar securities, interest rates, prepayment speed, and credit risk). Level 3 includes unobservable inputs, which may include the adviser’s own assumptions in determining the fair value of investments. The following is a summary of the levels used as of April 30, 2018 in valuing the fund’s assets or liabilities:
| | | | | | | | | | | | | | | | |
| Financial Instruments | | Level 1 | | | Level 2 | | | Level 3 | | | Total | |
| U.S. Treasury Bonds & U.S. Government Agency & Equivalents | | | $— | | | | $118,952,685 | | | | $— | | | | $118,952,685 | |
| Non-U.S. Sovereign Debt | | | — | | | | 54,631,457 | | | | — | | | | 54,631,457 | |
| Municipal Bonds | | | — | | | | 8,588,745 | | | | — | | | | 8,588,745 | |
| U.S. Corporate Bonds | | | — | | | | 485,462,900 | | | | — | | | | 485,462,900 | |
| Residential Mortgage-Backed | | | | | | | | | | | | | | | | |
| Securities | | | — | | | | 42,030,704 | | | | — | | | | 42,030,704 | |
| Commercial Mortgage-Backed | | | | | | | | | | | | | | | | |
| Securities | | | — | | | | 56,702,806 | | | | — | | | | 56,702,806 | |
| Asset-Backed Securities (including CDOs) | | | — | | | | 317,525,207 | | | | — | | | | 317,525,207 | |
| Foreign Bonds | | | — | | | | 281,430,503 | | | | — | | | | 281,430,503 | |
| Mutual Funds | | | 26,521,309 | | | | — | | | | — | | | | 26,521,309 | |
| Total | | | $26,521,309 | | | | $1,365,325,007 | | | | $— | | | | $1,391,846,316 | |
For further information regarding security characteristics, see the Portfolio of Investments.
Derivatives – The fund uses derivatives for different purposes, primarily to increase or decrease exposure to a particular market or segment of the market, or security, to increase or decrease interest rate or currency exposure, or as alternatives to direct investments. Derivatives are used for hedging or non-hedging purposes. While hedging can reduce or eliminate losses, it can also reduce or eliminate gains. When the fund uses derivatives as an investment to increase market exposure, or for hedging purposes, gains and losses from derivative instruments may be substantially greater than the derivative’s original cost.
The derivative instruments used by the fund during the period were futures contracts. Depending on the type of derivative, the fund may exit a derivative position by entering into an offsetting transaction with a counterparty or exchange, negotiating an agreement with the derivative counterparty, or novating the position to a third party. At April 30, 2018, the fund did not have any outstanding derivative instruments.
39
Notes to Financial Statements – continued
The following table presents, by major type of derivative contract, the realized gain (loss) on derivatives held by the fund for the year ended April 30, 2018 as reported in the Statement of Operations:
| | | | |
| Risk | | Futures Contracts | |
| Interest Rate | | | $158,311 | |
The following table presents, by major type of derivative contract, the change in unrealized appreciation (depreciation) on derivatives held by the fund for the year ended April 30, 2018 as reported in the Statement of Operations:
| | | | |
| Risk | | Futures Contracts | |
| Interest Rate | | | $(299,635 | ) |
Derivative counterparty credit risk is managed through formal evaluation of the creditworthiness of all potential counterparties. On certain, but not all, uncleared derivatives, the fund attempts to reduce its exposure to counterparty credit risk whenever possible by entering into an ISDA Master Agreement on a bilateral basis. The ISDA Master Agreement gives each party to the agreement the right to terminate all transactions traded under such agreement if there is a specified deterioration in the credit quality of the other party. Upon an event of default or a termination of the ISDA Master Agreement, the non-defaulting party has the right to close out all transactions traded under such agreement and to net amounts owed under each agreement to one net amount payable by one party to the other. This right to close out and net payments across all transactions traded under the ISDA Master Agreement could result in a reduction of the fund’s credit risk to such counterparty equal to any amounts payable by the fund under the applicable transactions, if any.
Collateral and margin requirements differ by type of derivative. For cleared derivatives (e.g., futures contracts, cleared swaps, and exchange-traded options), margin requirements are set by the clearing broker and the clearing house and collateral, in the form of cash or securities, is posted by the fund directly with the clearing broker. Collateral terms are counterparty agreement specific for uncleared derivatives (e.g., forward foreign currency exchange contracts, uncleared swap agreements, and uncleared options) and collateral, in the form of cash and securities, is held in segregated accounts with the fund’s custodian in connection with these agreements. For derivatives traded under an ISDA Master Agreement, which contains a collateral support annex, the collateral requirements are netted across all transactions traded under such counterparty-specific agreement and one amount is posted from one party to the other to collateralize such obligations. Cash that has been segregated or delivered to cover the fund’s collateral or margin obligations under derivative contracts, if any, will be reported separately in the Statement of Assets and Liabilities as restricted cash for uncleared derivatives and/or deposits with brokers for cleared derivatives. Securities pledged as collateral or margin for the same purpose, if any, are noted in the Portfolio of Investments. The fund may be required to make payments of interest on uncovered collateral or margin obligations with the broker. Any such payments are included in “Miscellaneous” expense in the Statement of Operations.
40
Notes to Financial Statements – continued
Futures Contracts – The fund entered into futures contracts which may be used to hedge against or obtain broad market exposure, interest rate exposure, currency exposure, or to manage duration. A futures contract represents a commitment for the future purchase or sale of an asset at a specified price on a specified date.
Upon entering into a futures contract, the fund is required to deposit with the broker, either in cash or securities, an initial margin in an amount equal to a certain percentage of the notional amount of the contract. Subsequent payments (variation margin) are made or received by the fund each day, depending on the daily fluctuations in the value of the contract, and are recorded for financial statement purposes as unrealized gain or loss by the fund until the contract is closed or expires at which point the gain or loss on futures contracts is realized.
The fund bears the risk of interest rates, exchange rates or securities prices moving unexpectedly, in which case, the fund may not achieve the anticipated benefits of the futures contracts and may realize a loss. While futures contracts may present less counterparty risk to the fund since the contracts are exchange traded and the exchange’s clearinghouse guarantees payments to the broker, there is still counterparty credit risk due to the insolvency of the broker. The fund’s maximum risk of loss due to counterparty credit risk is equal to the margin posted by the fund to the broker plus any gains or minus any losses on the outstanding futures contracts.
Indemnifications – Under the fund’s organizational documents, its officers and Trustees may be indemnified against certain liabilities and expenses arising out of the performance of their duties to the fund. Additionally, in the normal course of business, the fund enters into agreements with service providers that may contain indemnification clauses. The fund’s maximum exposure under these agreements is unknown as this would involve future claims that may be made against the fund that have not yet occurred.
Investment Transactions and Income – Investment transactions are recorded on the trade date. Interest income is recorded on the accrual basis. All premium and discount is amortized or accreted for financial statement purposes in accordance with U.S. generally accepted accounting principles. Interest payments received in additional securities are recorded on the ex-interest date in an amount equal to the value of the security on such date.
The fund may receive proceeds from litigation settlements. Any proceeds received from litigation involving portfolio holdings are reflected in the Statement of Operations in realized gain/loss if the security has been disposed of by the fund or in unrealized gain/loss if the security is still held by the fund. Any other proceeds from litigation not related to portfolio holdings are reflected as other income in the Statement of Operations.
The fund invests a significant portion of its assets in asset-backed and/or mortgage-backed securities. For these securities, the value of the debt instrument also depends on the credit quality and adequacy of the underlying assets or collateral as well as whether there is a security interest in the underlying assets or collateral. Enforcing rights, if any, against the underlying assets or collateral may be difficult. U.S. Government securities not supported as to the payment of principal or interest by the
41
Notes to Financial Statements – continued
U.S. Treasury, such as those issued by Fannie Mae, Freddie Mac, and the Federal Home Loan Banks, are subject to greater credit risk than are U.S. Government securities supported by the U.S. Treasury, such as those issued by Ginnie Mae.
The fund purchased or sold debt securities on a when-issued or delayed delivery basis, or in a “To Be Announced” (TBA) or “forward commitment” transaction with delivery or payment to occur at a later date beyond the normal settlement period. At the time a fund enters into a commitment to purchase or sell a security, the transaction is recorded and the value of the security acquired is reflected in the fund’s net asset value. The price of such security and the date that the security will be delivered and paid for are fixed at the time the transaction is negotiated. The value of the security may vary with market fluctuations. No interest accrues to the fund until payment takes place. At the time that a fund enters into this type of transaction, the fund is required to have sufficient cash and/or liquid securities to cover its commitments. Losses may arise due to changes in the value of the underlying securities or if the counterparty does not perform under the contract’s terms, or if the issuer does not issue the securities due to political, economic or other factors. Additionally, losses may arise due to declines in the value of the securities prior to settlement date.
To mitigate this risk of loss on TBA securities and other types of forward settling mortgage-backed securities, the fund whenever possible enters into a Master Securities Forward Transaction Agreement (“MSFTA”) on a bilateral basis with each of the counterparties with whom it undertakes a significant volume of transactions. The MSFTA gives each party to the agreement the right to terminate all transactions traded under such agreement if there is a certain deterioration in the credit quality of the other party. Upon an event of default or a termination of the MSFTA, the non-defaulting party has the right to close out all transactions traded under such agreement and to net amounts owed under each transaction to one net amount payable by one party to the other. This right to close out and net payments across all transactions traded under the MSFTA could result in a reduction of the fund’s credit risk to such counterparty equal to any amounts payable by the fund under the applicable transactions, if any.
For mortgage-backed securities traded under a MSFTA, the collateral and margining requirements are contract specific. Collateral amounts across all transactions traded under such agreement are netted and one amount is posted from one party to the other to collateralize such obligations. Cash that has been pledged to cover the fund’s collateral or margin obligations under a MSFTA, if any, will be reported separately on the Statement of Assets and Liabilities as restricted cash. Securities pledged as collateral or margin for the same purpose, if any, are noted in the Portfolio of Investments.
Fees Paid Indirectly – The fund’s custody fee may be reduced by a credit earned under an arrangement that measures the value of U.S. dollars deposited with the custodian by the fund. The amount of the credit, for the year ended April 30, 2018, is shown as a reduction of total expenses in the Statement of Operations.
Tax Matters and Distributions – The fund intends to qualify as a regulated investment company, as defined under Subchapter M of the Internal Revenue Code, and to distribute all of its taxable income, including realized capital gains. As a result, no provision for federal income tax is required. The fund’s federal tax returns, when
42
Notes to Financial Statements – continued
filed, will remain subject to examination by the Internal Revenue Service for a three year period. Management has analyzed the fund’s tax positions taken on federal and state tax returns for all open tax years and does not believe that there are any uncertain tax positions that require recognition of a tax liability. Foreign taxes, if any, have been accrued by the fund in the accompanying financial statements in accordance with the applicable foreign tax law. Foreign income taxes may be withheld by certain countries in which the fund invests. Additionally, capital gains realized by the fund on securities issued in or by certain foreign countries may be subject to capital gains tax imposed by those countries.
Distributions to shareholders are recorded on the ex-dividend date. Income and capital gain distributions are determined in accordance with income tax regulations, which may differ from U.S. generally accepted accounting principles. Certain capital accounts in the financial statements are periodically adjusted for permanent differences in order to reflect their tax character. These adjustments have no impact on net assets or net asset value per share. Temporary differences which arise from recognizing certain items of income, expense, gain or loss in different periods for financial statement and tax purposes will reverse at some time in the future. Distributions in excess of net investment income or net realized gains are temporary overdistributions for financial statement purposes resulting from differences in the recognition or classification of income or distributions for financial statement and tax purposes.
Book/tax differences primarily relate to expiration of capital loss carryforwards and amortization and accretion of debt securities.
The tax character of distributions declared to shareholders for the last two fiscal years is as follows:
| | | | | | | | |
| | | Year ended
4/30/18 | | | Year ended
4/30/17 | |
| Ordinary income (including any short-term capital gains) | | | $27,335,499 | | | | $19,164,833 | |
The federal tax cost and the tax basis components of distributable earnings were as follows:
| | | | |
| As of 4/30/18 | | | |
| Cost of investments | | | $1,411,783,683 | |
| Gross appreciation | | | 760,171 | |
| Gross depreciation | | | (20,697,538 | ) |
| Net unrealized appreciation (depreciation) | | | $(19,937,367 | ) |
| Undistributed ordinary income | | | 1,791,765 | |
| Capital loss carryforwards | | | (45,353,622 | ) |
| Other temporary differences | | | (2,345,879 | ) |
Under the Regulated Investment Company Modernization Act of 2010 (the “Act”), net capital losses recognized for fund fiscal years beginning after April 30, 2011 may be carried forward indefinitely, and their character is retained as short-term and/or long-term losses (“post-enactment losses”). Previously, net capital losses were carried forward for eight years and treated as short-term losses (“pre-enactment losses”). As a
43
Notes to Financial Statements – continued
transition rule, the Act requires that all post-enactment net capital losses be used before pre-enactment net capital losses.
As of April 30, 2018, the fund had capital loss carryforwards available to offset future realized gains as follows:
| | | | |
Pre-enactment losses which expire as
follows: | | | |
| 4/30/19 | | | $(9,431,348 | ) |
| |
Post-enactment losses which are
characterized as follows: | | | |
| Short-Term | | | $(3,347,945 | ) |
| Long-Term | | | (32,574,329 | ) |
| Total | | | $(35,922,274 | ) |
Multiple Classes of Shares of Beneficial Interest – The fund offers multiple classes of shares, which differ in their respective distribution, service, and program manager fees. The fund’s income and common expenses are allocated to shareholders based on the value of settled shares outstanding of each class. The fund’s realized and unrealized gain (loss) are allocated to shareholders based on the daily net assets of each class. Dividends are declared separately for each class. Differences in per share dividend rates are generally due to differences in separate class expenses. Class B and Class 529B shares will convert to Class A and Class 529A shares, respectively, approximately eight years after purchase. Effective April 23, 2018, Class C and Class 529C shares will convert to Class A and Class 529A shares, respectively, approximately ten years after purchase. The fund’s distributions declared to shareholders as reported in the Statements of Changes in Net Assets are presented by class as follows:
| | | | | | | | |
| | | From net investment
income | |
| | | Year
ended
4/30/18 | | | Year
ended
4/30/17 | |
| Class A | | | $9,390,310 | | | | $6,131,627 | |
| Class B | | | 48,732 | | | | 32,008 | |
| Class C | | | 809,309 | | | | 470,823 | |
| Class I | | | 3,569,145 | | | | 3,403,742 | |
| Class R1 | | | 3,230 | | | | 1,643 | |
| Class R2 | | | 52,079 | | | | 35,821 | |
| Class R3 | | | 43,287 | | | | 34,638 | |
| Class R4 | | | 134,676 | | | | 96,619 | |
| Class R6 | | | 11,105,701 | | | | 7,836,782 | |
| Class 529A | | | 1,693,455 | | | | 949,323 | |
| Class 529B | | | 42,140 | | | | 15,653 | |
| Class 529C | | | 443,435 | | | | 156,154 | |
| Total | | | $27,335,499 | | | | $19,164,833 | |
44
Notes to Financial Statements – continued
(3) Transactions with Affiliates
Investment Adviser – The fund has an investment advisory agreement with MFS to provide overall investment management and related administrative services and facilities to the fund. The management fee is computed daily and paid monthly at an annual rate of 0.40% of the fund’s average daily net assets.
MFS has agreed in writing to reduce its management fee by a specified amount if certain MFS mutual fund assets exceed thresholds agreed to by MFS and the fund’s Board of Trustees. For the year ended April 30, 2018, this management fee reduction amounted to $122,566, which is included in the reduction of total expenses in the Statement of Operations. The management fee incurred for the year ended April 30, 2018 was equivalent to an annual effective rate of 0.39% of the fund’s average daily net assets.
Distributor – MFS Fund Distributors, Inc. (MFD), a wholly-owned subsidiary of MFS, as distributor, received $58,675 and $7,151 for the year ended April 30, 2018, as its portion of the initial sales charge on sales of Class A and Class 529A shares of the fund, respectively.
The Board of Trustees has adopted a distribution plan for certain share classes pursuant to Rule 12b-1 of the Investment Company Act of 1940.
The fund’s distribution plan provides that the fund will pay MFD for services provided by MFD and financial intermediaries in connection with the distribution and servicing of certain share classes. One component of the plan is a distribution fee paid to MFD and another component of the plan is a service fee paid to MFD. MFD may subsequently pay all, or a portion, of the distribution and/or service fees to financial intermediaries.
Distribution Plan Fee Table:
| | | | | | | | | | | | | | | | | | | | |
| | | Distribution
Fee Rate (d) | | | Service
Fee Rate (d) | | | Total
Distribution
Plan (d) | | | Annual
Effective
Rate (e) | | | Distribution
and Service
Fee | |
| Class A | | | — | | | | 0.25% | | | | 0.25% | | | | 0.15% | | | | $1,254,130 | |
| Class B | | | 0.75% | | | | 0.25% | | | | 1.00% | | | | 0.90% | | | | 44,197 | |
| Class C | | | 0.75% | | | | 0.25% | | | | 1.00% | | | | 1.00% | | | | 810,737 | |
| Class R1 | | | 0.75% | | | | 0.25% | | | | 1.00% | | | | 1.00% | | | | 3,180 | |
| Class R2 | | | 0.25% | | | | 0.25% | | | | 0.50% | | | | 0.40% | | | | 16,305 | |
| Class R3 | | | — | | | | 0.25% | | | | 0.25% | | | | 0.25% | | | | 6,189 | |
| Class 529A | | | — | | | | 0.25% | | | | 0.25% | | | | 0.15% | | | | 231,207 | |
| Class 529B | | | 0.75% | | | | 0.25% | | | | 1.00% | | | | 0.90% | | | | 39,515 | |
| Class 529C | | | 0.75% | | | | 0.25% | | | | 1.00% | | | | 0.99% | | | | 452,598 | |
| Total Distribution and Service Fees | | | | $2,858,058 | |
| (d) | In accordance with the distribution plan for certain classes, the fund pays distribution and/or service fees equal to these annual percentage rates of each class’s average daily net assets. The distribution and service fee rates disclosed by class represent the current rates in effect at the end of the reporting period. Any rate changes, if applicable, are detailed below. |
| (e) | The annual effective rates represent actual fees incurred under the distribution plan for the year ended April 30, 2018 based on each class’s average daily net assets. 0.10% of the Class A and Class 529A service fee is currently being waived under a written waiver arrangement. For the year ended April 30, 2018, this waiver amounted to $594,130 and is included in the |
45
Notes to Financial Statements – continued
| | reduction of total expenses in the Statement of Operations. This written waiver agreement will continue until modified by the fund’s Board of Trustees, but such agreement will continue until at least August 31, 2018. For one year from the date of purchase of Class B and Class 529B shares, assets attributable to such Class B and Class 529B shares were subject to the 0.25% annual Class B and Class 529B service fee. On assets attributable to all other Class B and Class 529B shares, 0.15% of the Class B and Class 529B service fees were being paid by the fund and 0.10% of the Class B and Class 529B service fees were being waived under a written waiver agreement. This Class B and Class 529B agreement terminated on August 27, 2017. For the period May 1, 2017 through August 27, 2017, this waiver amounted to $2,076 and is included in the reduction of total expenses in the Statement of Operations. Effective August 28, 2017, MFD has agreed in writing to reduce the Class B and Class 529B service fee rate to 0.15% for all Class B and Class 529B shares. This written agreement will continue until modified by the fund’s Board of Trustees, but such agreement will continue at least until August 31, 2018. For the period August 28, 2017 to April 30, 2018, this waiver amounted to $6,070, and is included in the reduction of total expenses on the Statement of Operations. 0.10% of the Class R2 distribution fee is currently being waived under a written waiver agreement. For the year ended April 30, 2018,this waiver amounted to $3,261 and is included in the reduction of total expenses in the Statement of Operations. This written waiver agreement will continue until modified by the fund’s Board of Trustees, but such agreement will continue at least until August 31, 2018. MFD has voluntarily agreed to rebate a portion of each class’s 0.25% service fee attributable to accounts for which MFD retains the 0.25% service fee except for accounts attributable to MFS or its affiliates’ seed money. For the year ended April 30, 2018, this rebate amounted to $7,591, $62, $586, $4,612, $279, and $3,442 for Class A, Class B, Class C, Class 529A, Class 529B, and Class 529C, respectively, and is included in the reduction of total expenses in the Statement of Operations. |
Certain Class A shares are subject to a contingent deferred sales charge (CDSC) in the event of a shareholder redemption within 18 months of purchase. Class B and Class 529B shares are subject to a CDSC in the event of a shareholder redemption within six years of purchase. Class C and Class 529C shares are subject to a CDSC in the event of a shareholder redemption within 12 months of purchase. All contingent deferred sales charges are paid to MFD and during the year ended April 30, 2018, were as follows:
| | | | |
| | | Amount | |
| Class A | | | $40,986 | |
| Class B | | | 11,195 | |
| Class C | | | 12,904 | |
| Class 529B | | | 1,148 | |
| Class 529C | | | 1,949 | |
The fund has entered into and may from time to time enter into contracts with program managers and other parties which administer the tuition programs through which an investment in the fund’s 529 share classes is made. For the period from May 1, 2017 through December 10, 2017, the fund had entered into an agreement with MFD pursuant to which MFD received an annual fee of up to 0.10% of the average daily net assets attributable to each 529 share class. MFD had agreed to waive a portion of this fee in an amount equal to 0.05% of the average daily net assets for each 529 share class. This waiver agreement terminated on December 10, 2017. For the period from May 1, 2017 through December 10, 2017, this waiver amounted to $43,056 and is included in the reduction of total expenses in the Statement of
46
Notes to Financial Statements – continued
Operations. Effective December 11, 2017, the fund has entered into an agreement with MFD pursuant to which MFD receives an annual fee of up to 0.05% of the average daily net assets attributable to each 529 share class. The program manager fee incurred for the year ended April 30, 2018 was equivalent to an annual effective rate of 0.05% of the average daily net assets attributable to each 529 share class. The services provided by MFD, or a third party with which MFD contracts, include recordkeeping and tax reporting and account services, as well as services designed to maintain the program’s compliance with the Internal Revenue Code and other regulatory requirements. Program manager fees and waivers for the year ended April 30, 2018, were as follows:
| | | | | | | | |
| | | Fee | | | Waiver | |
| Class 529A | | | $74,105 | | | | $27,864 | |
| Class 529B | | | 3,154 | | | | 1,178 | |
| Class 529C | | | 36,643 | | | | 14,014 | |
| Total Program Manager Fees and Waivers | | | $113,902 | | | | $43,056 | |
Shareholder Servicing Agent – MFS Service Center, Inc. (MFSC), a wholly-owned subsidiary of MFS, receives a fee from the fund for its services as shareholder servicing agent calculated as a percentage of the average daily net assets of the fund as determined periodically under the supervision of the fund’s Board of Trustees. For the year ended April 30, 2018, the fee was $350,353, which equated to 0.0242% annually of the fund’s average daily net assets. MFSC also receives payment from the fund for out-of-pocket expenses, sub-accounting and other shareholder servicing costs which may be paid to affiliated and unaffiliated service providers. Class R6 shares do not incur sub-accounting fees. For the year ended April 30, 2018, these out-of-pocket expenses, sub-accounting and other shareholder servicing costs amounted to $835,978.
Under a Special Servicing Agreement among MFS, certain MFS funds which invest in other MFS funds (“MFS fund-of-funds”) and certain underlying funds in which a MFS fund-of-funds invests (“underlying funds”), each underlying fund may pay a portion of each MFS fund-of-funds’ transfer agent-related expenses, including sub-accounting fees payable to financial intermediaries, to the extent such payments do not exceed the benefits realized or expected to be realized by the underlying fund from the investment in the underlying fund by the MFS fund-of-funds. For the year ended April 30, 2018, these costs for the fund amounted to $229,892 and are included in “Shareholder servicing costs” in the Statement of Operations.
Administrator – MFS provides certain financial, legal, shareholder communications, compliance, and other administrative services to the fund. Under an administrative services agreement, the fund reimburses MFS the costs incurred to provide these services. The fund is charged an annual fixed amount of $17,500 plus a fee based on average daily net assets. The administrative services fee incurred for the year ended April 30, 2018 was equivalent to an annual effective rate of 0.0162% of the fund’s average daily net assets.
Trustees’ and Officers’ Compensation – The fund pays compensation to independent Trustees in the form of a retainer, attendance fees, and additional compensation to Board and Committee chairpersons. The fund does not pay compensation directly to Trustees or officers of the fund who are also officers of the
47
Notes to Financial Statements – continued
investment adviser, all of whom receive remuneration for their services to the fund from MFS. Certain officers and Trustees of the fund are officers or directors of MFS, MFD, and MFSC.
Prior to December 31, 2001, the fund had an unfunded defined benefit plan (“DB plan”) for independent Trustees. As of December 31, 2001, the Board took action to terminate the DB plan with respect to then-current and any future independent Trustees, such that the DB plan covers only certain of those former independent Trustees who retired on or before December 31, 2001. The DB plan resulted in a pension expense of $560 and is included in “Independent Trustees’ compensation” in the Statement of Operations for the year ended April 30, 2018. The liability for deferred retirement benefits payable to certain independent Trustees under the DB plan amounted to $2,389 at April 30, 2018, and is included in “Payable for independent Trustees’ compensation” in the Statement of Assets and Liabilities.
Other – This fund and certain other funds managed by MFS (the funds) have entered into a service agreement (the ISO Agreement) which provides for payment of fees solely by the funds to Tarantino LLC in return for the provision of services of an Independent Senior Officer (ISO) for the funds. Frank L. Tarantino serves as the ISO and is an officer of the funds and the sole member of Tarantino LLC. The funds can terminate the ISO Agreement with Tarantino LLC at any time under the terms of the ISO Agreement. For the year ended April 30, 2018, the fee paid by the fund under this agreement was $2,591 and is included in “Miscellaneous” expense in the Statement of Operations. MFS has agreed to bear all expenses associated with office space, other administrative support, and supplies provided to the ISO.
The fund invests in the MFS Institutional Money Market Portfolio which is managed by MFS and seeks current income consistent with preservation of capital and liquidity. This money market fund does not pay a management fee to MFS.
(4) Portfolio Securities
For the year ended April 30, 2018, purchases and sales of investments, other than short-term obligations, were as follows:
| | | | | | | | |
| | | Purchases | | | Sales | |
| U.S. Government securities | | | $251,828,827 | | | | $228,217,774 | |
| Non-U.S. Government securities | | | $554,899,349 | | | | $667,654,577 | |
48
Notes to Financial Statements – continued
(5) Shares of Beneficial Interest
The fund’s Declaration of Trust permits the Trustees to issue an unlimited number of full and fractional shares of beneficial interest. Transactions in fund shares were as follows:
| | | | | | | | | | | | | | | | |
| | | Year ended
4/30/18 | | | Year ended
4/30/17 | |
| | | Shares | | | Amount | | | Shares | | | Amount | |
| Shares sold | | | | | | | | | | | | | | | | |
Class A | | | 60,311,162 | | | | $359,743,014 | | | | 65,450,413 | | | | $391,609,380 | |
Class B | | | 139,593 | | | | 828,657 | | | | 343,827 | | | | 2,057,377 | |
Class C | | | 2,434,731 | | | | 14,493,800 | | | | 5,030,462 | | | | 30,129,857 | |
Class I | | | 17,291,879 | | | | 102,786,052 | | | | 33,940,663 | | | | 202,351,855 | |
Class R1 | | | 10,062 | | | | 59,774 | | | | 5,503 | | | | 32,862 | |
Class R2 | | | 146,843 | | | | 876,146 | | | | 207,012 | | | | 1,239,100 | |
Class R3 | | | 70,449 | | | | 418,402 | | | | 101,815 | | | | 610,054 | |
Class R4 | | | 144,065 | | | | 861,437 | | | | 151,806 | | | | 909,691 | |
Class R6 | | | 14,425,891 | | | | 85,915,339 | | | | 10,752,335 | | | | 64,383,541 | |
Class 529A | | | 8,726,544 | | | | 51,901,061 | | | | 10,258,761 | | | | 61,530,230 | |
Class 529B | | | 469,212 | | | | 2,788,469 | | | | 600,494 | | | | 3,590,354 | |
Class 529C | | | 3,888,099 | | | | 23,161,100 | | | | 5,190,030 | | | | 31,138,847 | |
| | | 108,058,530 | | | | $643,833,251 | | | | 132,033,121 | | | | $789,583,148 | |
Shares issued to shareholders in
reinvestment of distributions | | | | | | | | | | | | | |
Class A | | | 1,258,484 | | | | $7,497,328 | | | | 827,589 | | | | $4,957,144 | |
Class B | | | 7,122 | | | | 42,324 | | | | 4,593 | | | | 27,445 | |
Class C | | | 125,032 | | | | 744,172 | | | | 68,831 | | | | 411,852 | |
Class I | | | 457,529 | | | | 2,715,715 | | | | 369,349 | | | | 2,203,049 | |
Class R1 | | | 544 | | | | 3,230 | | | | 275 | | | | 1,643 | |
Class R2 | | | 7,415 | | | | 44,176 | | | | 5,315 | | | | 31,816 | |
Class R3 | | | 7,258 | | | | 43,286 | | | | 5,768 | | | | 34,590 | |
Class R4 | | | 22,615 | | | | 134,675 | | | | 16,133 | | | | 96,619 | |
Class R6 | | | 1,801,858 | | | | 10,709,414 | | | | 1,268,844 | | | | 7,584,064 | |
Class 529A | | | 283,224 | | | | 1,686,209 | | | | 157,673 | | | | 943,859 | |
Class 529B | | | 7,055 | | | | 41,846 | | | | 2,607 | | | | 15,546 | |
Class 529C | | | 73,614 | | | | 438,135 | | | | 26,000 | | | | 155,547 | |
| | | 4,051,750 | | | | $24,100,510 | | | | 2,752,977 | | | | $16,463,174 | |
49
Notes to Financial Statements – continued
| | | | | | | | | | | | | | | | |
| | | Year ended
4/30/18 | | | Year ended
4/30/17 | |
| | | Shares | | | Amount | | | Shares | | | Amount | |
| | | |
| Shares reacquired | | | | | | | | | | | | | |
Class A | | | (65,024,156 | ) | | | $(387,844,378 | ) | | | (57,505,556 | ) | | | $(344,084,864 | ) |
Class B | | | (389,325 | ) | | | (2,315,805 | ) | | | (545,608 | ) | | | (3,257,526 | ) |
Class C | | | (9,001,534 | ) | | | (53,514,092 | ) | | | (8,953,078 | ) | | | (53,562,504 | ) |
Class I | | | (36,892,213 | ) | | | (219,519,398 | ) | | | (28,434,559 | ) | | | (169,473,278 | ) |
Class R1 | | | (15,443 | ) | | | (91,677 | ) | | | (31,871 | ) | | | (190,864 | ) |
Class R2 | | | (246,538 | ) | | | (1,471,246 | ) | | | (213,311 | ) | | | (1,276,063 | ) |
Class R3 | | | (177,298 | ) | | | (1,056,781 | ) | | | (192,983 | ) | | | (1,158,922 | ) |
Class R4 | | | (146,410 | ) | | | (873,542 | ) | | | (237,267 | ) | | | (1,420,790 | ) |
Class R6 | | | (13,523,862 | ) | | | (80,460,298 | ) | | | (12,412,902 | ) | | | (74,290,176 | ) |
Class 529A | | | (5,512,363 | ) | | | (32,884,940 | ) | | | (4,808,023 | ) | | | (28,791,127 | ) |
Class 529B | | | (369,222 | ) | | | (2,195,987 | ) | | | (358,688 | ) | | | (2,141,373 | ) |
Class 529C | | | (4,466,784 | ) | | | (26,567,312 | ) | | | (2,616,215 | ) | | | (15,667,386 | ) |
| | | (135,765,148 | ) | | | $(808,795,456 | ) | | | (116,310,061 | ) | | | $(695,314,873 | ) |
| | | |
| Net change | | | | | | | | | | | | | |
Class A | | | (3,454,510 | ) | | | $(20,604,036 | ) | | | 8,772,446 | | | | $52,481,660 | |
Class B | | | (242,610 | ) | | | (1,444,824 | ) | | | (197,188 | ) | | | (1,172,704 | ) |
Class C | | | (6,441,771 | ) | | | (38,276,120 | ) | | | (3,853,785 | ) | | | (23,020,795 | ) |
Class I | | | (19,142,805 | ) | | | (114,017,631 | ) | | | 5,875,453 | | | | 35,081,626 | |
Class R1 | | | (4,837 | ) | | | (28,673 | ) | | | (26,093 | ) | | | (156,359 | ) |
Class R2 | | | (92,280 | ) | | | (550,924 | ) | | | (984 | ) | | | (5,147 | ) |
Class R3 | | | (99,591 | ) | | | (595,093 | ) | | | (85,400 | ) | | | (514,278 | ) |
Class R4 | | | 20,270 | | | | 122,570 | | | | (69,328 | ) | | | (414,480 | ) |
Class R6 | | | 2,703,887 | | | | 16,164,455 | | | | (391,723 | ) | | | (2,322,571 | ) |
Class 529A | | | 3,497,405 | | | | 20,702,330 | | | | 5,608,411 | | | | 33,682,962 | |
Class 529B | | | 107,045 | | | | 634,328 | | | | 244,413 | | | | 1,464,527 | |
Class 529C | | | (505,071 | ) | | | (2,968,077 | ) | | | 2,599,815 | | | | 15,627,008 | |
| | | (23,654,868 | ) | | | $(140,861,695 | ) | | | 18,476,037 | | | | $110,731,449 | |
Effective May 1, 2006, the sale of Class B shares of the fund have been suspended except in certain circumstances. Please see the fund’s prospectus for details.
Class T shares were not publicly available for sale during the period. Please see the fund’s prospectus for details.
The fund is one of several mutual funds in which certain MFS funds may invest. The MFS funds do not invest in the underlying funds for the purpose of exercising management or control. At the end of the period, the MFS Conservative Allocation Fund, the MFS Lifetime Income Fund, and the MFS Lifetime 2020 Fund were the owners of record of approximately 21%, 8%, and 4%, respectively, of the value of outstanding voting shares of the fund. In addition, the MFS Lifetime 2025 Fund was the owner of record of less than 1% of the value of outstanding voting shares of the fund.
50
Notes to Financial Statements – continued
(6) Line of Credit
The fund and certain other funds managed by MFS participate in a $1.25 billion unsecured committed line of credit, subject to a $1 billion sublimit, provided by a syndication of banks under a credit agreement. Borrowings may be made for temporary financing needs. Interest is charged to each fund, based on its borrowings, generally at a rate equal to the higher of the Overnight Federal Reserve funds rate or daily one month LIBOR plus an agreed upon spread. A commitment fee, based on the average daily, unused portion of the committed line of credit, is allocated among the participating funds at the end of each calendar quarter. In addition, the fund and other funds managed by MFS have established unsecured uncommitted borrowing arrangements with certain banks for temporary financing needs. Interest is charged to each fund, based on its borrowings, at a rate equal to the Overnight Federal Reserve funds rate plus an agreed upon spread. For the year ended April 30, 2018, the fund’s commitment fee and interest expense were $10,341 and $0, respectively, and are included in “Miscellaneous” expense in the Statement of Operations.
(7) Investments in Affiliated Issuers
An affiliated issuer may be considered one in which the fund owns 5% or more of the outstanding voting securities, or a company which is under common control. For the purposes of this report, the fund assumes the following to be affiliated issuers:
| | | | | | | | | | | | | | | | | | | | |
| Affiliated Issuers | | | | | Beginning
Shares/Par
Amount | | | Acquisitions
Shares/Par
Amount | | | Dispositions
Shares/Par
Amount | | | Ending
Shares/Par
Amount | |
| MFS Institutional Money Market Portfolio | | | | | | | 55,980,291 | | | | 694,055,093 | | | | (723,511,422 | ) | | | 26,523,962 | |
| | | | | |
| Affiliated Issuers | | Realized
Gain (Loss) | | | Change in
Unrealized
Appreciation
(Depreciation) | | | Capital Gain
Distributions | | | Dividend
Income | | | Ending
Value | |
| MFS Institutional Money Market Portfolio | | | $(6,224 | ) | | | $(5,227 | ) | | | $— | | | | $344,402 | | | | $26,521,309 | |
51
REPORT OF INDEPENDENT REGISTERED PUBLIC ACCOUNTING FIRM
To the Board of Trustees of MFS Series Trust IX and the Shareholders of MFS Limited Maturity Fund:
Opinion on the Financial Statements and Financial Highlights
We have audited the accompanying statement of assets and liabilities of MFS Limited Maturity Fund (the “Fund”), including the portfolio of investments, as of April 30, 2018, the related statement of operations for the year then ended, the statements of changes in net assets for each of the two years in the period then ended, the financial highlights for each of the five years in the period then ended, and the related notes. In our opinion, the financial statements and financial highlights present fairly, in all material respects, the financial position of the Fund as of April 30, 2018, and the results of its operations for the year then ended, the changes in its net assets for each of the two years in the period then ended, and the financial highlights for each of the five years in the period then ended, in conformity with accounting principles generally accepted in the United States of America.
Basis for Opinion
These financial statements and financial highlights are the responsibility of the Fund’s management. Our responsibility is to express an opinion on the Fund’s financial statements and financial highlights based on our audits. We are a public accounting firm registered with the Public Company Accounting Oversight Board (United States) (PCAOB) and are required to be independent with respect to the Fund in accordance with the U.S. federal securities laws and the applicable rules and regulations of the Securities and Exchange Commission and the PCAOB.
We conducted our audits in accordance with the standards of the PCAOB. Those standards require that we plan and perform the audit to obtain reasonable assurance about whether the financial statements and financial highlights are free of material misstatement, whether due to error or fraud. The Fund is not required to have, nor were we engaged to perform, an audit of its internal control over financial reporting. As part of our audits we are required to obtain an understanding of internal control over financial reporting but not for the purpose of expressing an opinion on the effectiveness of the Fund’s internal control over financial reporting. Accordingly, we express no such opinion.
Our audits included performing procedures to assess the risks of material misstatement of the financial statements and financial highlights, whether due to error or fraud, and performing procedures that respond to those risks. Such procedures included examining, on a test basis, evidence regarding the amounts and disclosures in the financial statements and financial highlights. Our audits also included evaluating the accounting principles used and significant estimates made by management, as well as evaluating the overall presentation of the financial statements and financial highlights. Our procedures included confirmation of securities owned as of April 30, 2018, by correspondence with the custodian and brokers; when replies were not received from brokers, we performed other auditing procedures. We believe that our audits provide a reasonable basis for our opinion.
DELOITTE & TOUCHE LLP
Boston, Massachusetts
June 18, 2018
We have served as the auditor of one or more of the MFS investment companies since 1924.
52
TRUSTEES AND OFFICERS — IDENTIFICATION AND BACKGROUND
The Trustees and Officers of the Trust, as of June 1, 2018, are listed below, together with their principal occupations during the past five years. (Their titles may have varied during that period.) The address of each Trustee and Officer is 111 Huntington Avenue, Boston, Massachusetts 02199-7618.
| | | | | | | | | | |
Name, Age | | Position(s) Held
with Fund | | Trustee/Officer Since (h) | | Number of MFS Funds overseen by the Trustee | | Principal
Occupations During the Past Five Years | | Other Directorships
During the Past
Five Years (j) |
| INTERESTED TRUSTEES |
Robert J. Manning (k) (age 54) | | Trustee | | February 2004 | | 135 | | Massachusetts Financial Services Company, Executive Chairman (since January 2017); Director; Chairman of the Board; Chief Executive Officer (until 2015); Co-Chief Executive Officer (2015-2016) | | N/A |
Robin A. Stelmach (k) (age 56) | | Trustee | | January 2014 | | 135 | | Massachusetts Financial Services Company, Vice Chair (since January 2017); Chief Operating Officer and Executive Vice President (until January 2017) | | N/A |
| INDEPENDENT TRUSTEES |
John P. Kavanaugh (age 63) | | Trustee and Chair of Trustees | | January 2009 | | 135 | | Private investor | | N/A |
53
Trustees and Officers – continued
| | | | | | | | | | |
Name, Age | | Position(s) Held
with Fund | | Trustee/Officer Since (h) | | Number of MFS Funds overseen by the Trustee | | Principal
Occupations During the Past Five Years | | Other Directorships
During the Past
Five Years (j) |
Steven E. Buller (age 66) | | Trustee | | February 2014 | | 135 | | Financial Accounting Standards Advisory Council, Chairman (2014-2015); Public Company Accounting Oversight Board, Standing Advisory Group, Member (until 2014); BlackRock, Inc. (investment management), Managing Director (until 2014), BlackRock Finco UK (investment management), Director (until 2014) | | N/A |
John A. Caroselli (age 63) | | Trustee | | March 2017 | | 135 | | JC Global Advisors, LLC (management consulting), President (since 2015); First Capital Corporation (commercial finance), Executive Vice President (until 2015) | | N/A |
Maureen R. Goldfarb (age 63) | | Trustee | | January 2009 | | 135 | | Private investor | | N/A |
Michael Hegarty (age 73) | | Trustee | | December 2004 | | 135 | | Private investor | | Rouse Properties Inc., Director (until 2016); Capmark Financial Group Inc., Director (until 2015) |
Clarence Otis, Jr. (age 62) | | Trustee | | March 2017 | | 135 | | Darden Restaurants, Inc., Chief Executive Officer (until 2014) | | VF Corporation, Director; Verizon Communications, Inc., Director; The Travelers Companies, Director; Federal Reserve Bank of Atlanta, Director (until 2015) |
54
Trustees and Officers – continued
| | | | | | | | | | |
Name, Age | | Position(s) Held
with Fund | | Trustee/Officer Since (h) | | Number of MFS Funds overseen by the Trustee | | Principal
Occupations During the Past Five Years | | Other Directorships
During the Past
Five Years (j) |
Maryanne L. Roepke (age 62) | | Trustee | | May 2014 | | 135 | | American Century Investments (investment management), Senior Vice President and Chief Compliance Officer (until 2014) | | N/A |
Laurie J. Thomsen (age 60) | | Trustee | | March 2005 | | 135 | | Private investor | | The Travelers Companies, Director; Dycom Industries, Inc., Director (since 2015) |
| | | | | | | | |
Name, Age | | Position(s) Held with Fund | | Trustee/Officer
Since (h) | | Number of MFS
Funds for which the
Person is an Officer | | Principal
Occupations During the Past Five Years |
| OFFICERS | | | | | | | | |
Christopher R. Bohane (k) (age 44) | | Assistant Secretary and Assistant Clerk | | July 2005 | | 135 | | Massachusetts Financial Services Company, Vice President and Assistant General Counsel |
Kino Clark (k) (age 49) | | Assistant Treasurer | | January 2012 | | 135 | | Massachusetts Financial Services Company, Vice President |
John W. Clark, Jr. (k) (age 51) | | Assistant Treasurer | | April 2017 | | 135 | | Massachusetts Financial Services Company, Vice President (since March 2017); Deutsche Bank (financial services), Department Head – Treasurer’s Office (until February 2017) |
Thomas H. Connors (k) (age 58) | | Assistant Secretary and Assistant Clerk | | September 2012 | | 135 | | Massachusetts Financial Services Company, Vice President and Senior Counsel |
55
Trustees and Officers – continued
| | | | | | | | |
Name, Age | | Position(s) Held with Fund | | Trustee/Officer
Since (h) | | Number of MFS
Funds for which the
Person is an Officer | | Principal
Occupations During the Past Five Years |
Ethan D. Corey (k) (age 54) | | Assistant Secretary and Assistant Clerk | | July 2005 | | 135 | | Massachusetts Financial Services Company, Senior Vice President and Associate General Counsel |
David L. DiLorenzo (k) (age 49) | | President | | July 2005 | | 135 | | Massachusetts Financial Services Company, Senior Vice President |
Heidi W. Hardin (k) (age 50) | | Secretary and Clerk | | April 2017 | | 135 | | Massachusetts Financial Services Company, Executive Vice President and General Counsel (since March 2017); Harris Associates (investment management), General Counsel (from September 2015 to January 2017); Janus Capital Management LLC (investment management), Senior Vice President and General Counsel (until September 2015) |
Brian E. Langenfeld (k) (age 45) | | Assistant Secretary and Assistant Clerk | | June 2006 | | 135 | | Massachusetts Financial Services Company, Vice President and Senior Counsel |
Susan A. Pereira (k) (age 47) | | Assistant Secretary and Assistant Clerk | | July 2005 | | 135 | | Massachusetts Financial Services Company, Vice President and Senior Counsel |
Kasey L. Phillips (k) (age 47) | | Assistant Treasurer | | September 2012 | | 135 | | Massachusetts Financial Services Company, Vice President |
56
Trustees and Officers – continued
| | | | | | | | |
Name, Age | | Position(s) Held with Fund | | Trustee/Officer
Since (h) | | Number of MFS
Funds for which the
Person is an Officer | | Principal
Occupations During the Past Five Years |
Matthew A. Stowe (k) (age 43) | | Assistant Secretary and Assistant Clerk | | October 2014 | | 135 | | Massachusetts Financial Services Company, Vice President and Assistant General Counsel |
Frank L. Tarantino (age 74) | | Independent Senior Officer | | June 2004 | | 135 | | Tarantino LLC (provider of compliance services), Principal |
Richard S. Weitzel (k) (age 47) | | Assistant Secretary and Assistant Clerk | | October 2007 | | 135 | | Massachusetts Financial Services Company, Senior Vice President and Associate General Counsel |
Martin J. Wolin (k) (age 50) | | Chief Compliance Officer | | July 2015 | | 135 | | Massachusetts Financial Services Company, Senior Vice President and Chief Compliance Officer (since July 2015); Mercer (financial service provider), Chief Risk and Compliance Officer, North America and Latin America (until June 2015) |
James O. Yost (k) (age 57) | | Treasurer | | September 1990 | | 135 | | Massachusetts Financial Services Company, Senior Vice President |
| (h) | Date first appointed to serve as Trustee/officer of an MFS Fund. Each Trustee has served continuously since appointment unless indicated otherwise. For the period from December 15, 2004 until February 22, 2005, Mr. Manning served as Advisory Trustee. Prior to January 2012, Messrs. DiLorenzo and Yost served as Assistant Treasurers of the Funds. From January 2012 through December 2016, Messrs. DiLorenzo and Yost served as Treasurer and Deputy Treasurer of the Funds, respectively. |
| (j) | Directorships or trusteeships of companies required to report to the Securities and Exchange Commission (i.e., “public companies”). |
| (k) | “Interested person” of the Trust within the meaning of the Investment Company Act of 1940 (referred to as the 1940 Act), which is the principal federal law governing investment companies like the fund, as a result of a position with MFS. The address of MFS is 111 Huntington Avenue, Boston, Massachusetts 02199-7618. |
57
Trustees and Officers – continued
Each Trustee has been elected by shareholders and each Trustee and officer holds office until his or her successor is chosen and qualified or until his or her earlier death, resignation, retirement or removal. The Trust does not hold annual meetings for the purpose of electing Trustees, and Trustees are not elected for fixed terms. Under the terms of the Board’s retirement policy, an Independent Trustee shall retire at the end of the calendar year in which he or she reaches the earlier of 75 years of age or 15 years of service on the Board (or, in the case of any Independent Trustee who joined the Board prior to 2015, 20 years of service on the Board).
Messrs. Buller and Otis and Ms. Roepke are members of the Trust’s Audit Committee.
Each of the Interested Trustees and certain Officers hold comparable officer positions with certain affiliates of MFS.
The Statement of Additional Information for a Fund includes further information about the Trustees and is available without charge upon request by calling 1-800-225-2606.
| | |
| Investment Adviser | | Custodian |
Massachusetts Financial Services Company
111 Huntington Avenue
Boston, MA 02199-7618 | | JPMorgan Chase Bank, NA 4 Metrotech Center New York, NY 11245 |
| Distributor | | Independent Registered Public Accounting Firm |
MFS Fund Distributors, Inc.
111 Huntington Avenue
Boston, MA 02199-7618 | | Deloitte & Touche LLP 200 Berkeley Street Boston, MA 02116 |
| Portfolio Manager(s) | | |
Philipp Burgener | | |
Alexander Mackey | | |
58
PROXY VOTING POLICIES AND INFORMATION
MFS votes proxies on behalf of the fund pursuant to proxy voting policies and procedures that are available without charge, upon request, by calling 1-800-225-2606, by visiting mfs.com/proxyvoting, or by visiting the SEC’s Web site at http://www.sec.gov.
Information regarding how the fund voted proxies relating to portfolio securities during the most recent twelve-month period ended June 30 is available by August 31 of each year without charge by visiting mfs.com/proxyvoting, or by visiting the SEC’s Web site at http://www.sec.gov.
QUARTERLY PORTFOLIO DISCLOSURE
The fund will file a complete schedule of portfolio holdings with the Securities and Exchange Commission (the Commission) for the first and third quarters of each fiscal year on Form N-Q. A shareholder can obtain the quarterly portfolio holdings report at mfs.com. The fund’s Form N-Q is also available on the EDGAR database on the Commission’s Internet Web site at http://www.sec.gov, and may be reviewed and copied at the:
Public Reference Room
Securities and Exchange Commission
100 F Street, NE, Room 1580
Washington, D.C. 20549
Information on the operation of the Public Reference Room may be obtained by calling the Commission at 1-800-SEC-0330. Copies of the fund’s Form N-Q also may be obtained, upon payment of a duplicating fee, by electronic request at the following e-mail address: publicinfo@sec.gov or by writing the Public Reference Section at the above address.
FURTHER INFORMATION
From time to time, MFS may post important information about the fund or the MFS funds on the MFS web site (mfs.com). This information is available at https://www.mfs.com/en-us/what-we-do/announcements.html or at mfs.com/openendfunds by choosing the fund’s name.
59
INFORMATION ABOUT FUND CONTRACTS AND LEGAL CLAIMS
The fund has entered into contractual arrangements with an investment adviser, administrator, distributor, shareholder servicing agent, 529 program manager (if applicable), and custodian who each provide services to the fund. Unless expressly stated otherwise, shareholders are not parties to, or intended beneficiaries of these contractual arrangements, and these contractual arrangements are not intended to create any shareholder right to enforce them against the service providers or to seek any remedy under them against the service providers, either directly or on behalf of the fund.
Under the Trust’s By-Laws and Declaration of Trust, any claims asserted against or on behalf of the MFS Funds, including claims against Trustees and Officers, must be brought in state and federal courts located within the Commonwealth of Massachusetts.
FEDERAL TAX INFORMATION (unaudited)
The fund will notify shareholders of amounts for use in preparing 2018 income tax forms in January 2019.
60
rev. 3/16
| | | | |
| | | |
FACTS | | WHAT DOES MFS DO WITH YOUR PERSONAL INFORMATION? | |  |
| | |
| Why? | | Financial companies choose how they share your personal information. Federal law gives consumers the right to limit some but not all sharing. Federal law also requires us to tell you how we collect, share, and protect your personal information. Please read this notice carefully to understand what we do. |
| | |
| What? | | The types of personal information we collect and share depend on the product or service you have with us. This information can include: • Social Security number and account balances • Account transactions and transaction history • Checking account information and wire transfer instructions When you are no longer our customer, we continue to share your information as described in this notice. |
| | |
| How? | | All financial companies need to share customers’ personal information to run their everyday business. In the section below, we list the reasons financial companies can share their customers’ personal information; the reasons MFS chooses to share; and whether you can limit this sharing. |
| | | | |
Reasons we can share your
personal information | | Does MFS
share? | | Can you limit
this sharing? |
For our everyday business purposes – such as to process your transactions, maintain your account(s), respond to court orders and legal investigations, or report to credit bureaus | | Yes | | No |
For our marketing purposes – to offer our products and services to you | | No | | We don’t share |
For joint marketing with other financial companies | | No | | We don’t share |
For our affiliates’ everyday business purposes – information about your transactions and experiences | | No | | We don’t share |
For our affiliates’ everyday business purposes – information about your creditworthiness | | No | | We don’t share |
| For nonaffiliates to market to you | | No | | We don’t share |
| | |
| Questions? | | Call 800-225-2606 or go to mfs.com. |
61
| | |
| Who we are |
| Who is providing this notice? | | MFS Funds, MFS Investment Management, MFS Institutional Advisors, Inc., and MFS Heritage Trust Company. |
| | |
| What we do |
| How does MFS protect my personal information? | | To protect your personal information from unauthorized access and use, we use security measures that comply with federal law. These measures include procedural, electronic, and physical safeguards for the protection of the personal information we collect about you. |
| How does MFS collect my personal information? | | We collect your personal information, for example, when you • open an account or provide account information • direct us to buy securities or direct us to sell your securities • make a wire transfer We also collect your personal information from others, such as credit bureaus, affiliates, or other companies. |
| Why can’t I limit all sharing? | | Federal law gives you the right to limit only • sharing for affiliates’ everyday business purposes – information about your creditworthiness • affiliates from using your information to market to you • sharing for nonaffiliates to market to you State laws and individual companies may give you additional rights to limit sharing. |
| | |
| Definitions |
| Affiliates | | Companies related by common ownership or control. They can be financial and nonfinancial companies. • MFS does not share personal information with affiliates, except for everyday business purposes as described on page one of this notice. |
| Nonaffiliates | | Companies not related by common ownership or control. They can be financial and nonfinancial companies. • MFS does not share with nonaffiliates so they can market to you. |
| Joint marketing | | A formal agreement between nonaffiliated financial companies that together market financial products or services to you. • MFS doesn’t jointly market. |
| | |
| Other important information |
| If you own an MFS product or receive an MFS service in the name of a third party such as a bank or broker-dealer, their privacy policy may apply to you instead of ours. |
62
Save paper with eDelivery.

| MFS® will send you prospectuses, |
reports, and proxies directly via e-mail so you will get information faster with less mailbox clutter.
To sign up:
1. Go to mfs.com.
2. Log in via MFS® Access.
3. Select eDelivery.
If you own your MFS fund shares through a financial institution or a retirement plan, MFS® TALK, MFS® Access, or eDelivery may not be available to you.
CONTACT
WEB SITE
mfs.com
MFS TALK
1-800-637-8255
24 hours a day
ACCOUNT SERVICE AND LITERATURE
Shareholders
1-800-225-2606
Financial advisors
1-800-343-2829
Retirement plan services
1-800-637-1255
MAILING ADDRESS
MFS Service Center, Inc.
P.O. Box 55824
Boston, MA 02205-5824
OVERNIGHT MAIL
MFS Service Center, Inc.
c/o DST Asset Manager Solutions, Inc.
30 Dan Road
Canton, MA 02021-2809
Annual Report
April 30, 2018

MFS® Municipal Limited Maturity Fund

MTL-ANN
MFS® Municipal Limited Maturity Fund
CONTENTS
The report is prepared for the general information of shareholders.
It is authorized for distribution to prospective investors only when preceded or accompanied by a current prospectus.
NOT FDIC INSURED • MAY LOSE VALUE • NO BANK GUARANTEE

LETTER FROM THE EXECUTIVE CHAIRMAN
Dear Shareholders:
Rising bond yields have led to a measurable uptick in market volatility — a departure from the low-volatility environment that prevailed for much of 2017. In recent months,
against this backdrop, global markets have given back some of the strong gains recorded during 2017 and early 2018. Global economic growth remains robust, notwithstanding signs of a modest slowdown over the past few months, particularly in Europe.
Although the U.S. Federal Reserve continues to gradually raise interest rates and shrink its balance sheet, monetary policy remains accommodative around the world, with many central banks taking only tentative steps toward tighter policies. Newly enacted U.S. tax reforms have been welcomed by equity markets, while emerging market economies have benefited from a weaker U.S. dollar.
Around the world, inflation remains largely subdued, but tight labor markets and solid global demand have investors on the lookout for its potential resurgence. Increased U.S. protectionism is also a growing concern, as investors fear that trade friction could disrupt the synchronized rise in global growth.
As a global investment manager, MFS® strives to create long-term value and protect capital for clients through an active approach and an investment platform built on nearly a century of expertise. To make that long-term value meaningful for clients, we work to align with you on our beliefs, your needs and the time it takes to deliver on your desired outcomes.
Respectfully,

Robert J. Manning
Executive Chairman
MFS Investment Management
June 18, 2018
The opinions expressed in this letter are subject to change and may not be relied upon for investment advice. No forecasts can be guaranteed.
1
PORTFOLIO COMPOSITION
Portfolio structure (i)

| | | | |
| Top ten industries (i) | | | | |
| General Obligations – General Purpose | | | 18.3% | |
| Healthcare Revenue – Hospitals | | | 10.1% | |
| Universities – Colleges | | | 6.5% | |
| General Obligations – Schools | | | 5.8% | |
| Water & Sewer Utility Revenue | | | 5.2% | |
| Special Tax – Transportation | | | 5.2% | |
| Utilities – Municipal Owned | | | 5.1% | |
| Utilities – Other | | | 4.4% | |
| State & Local Agencies | | | 4.3% | |
| Municipal Student Loans | | | 3.7% | |
| | | | |
| Composition including fixed income credit quality (a)(i) | |
| AAA | | | 6.9% | |
| AA | | | 25.9% | |
| A | | | 35.2% | |
| BBB | | | 21.2% | |
| BB | | | 3.1% | |
| B | | | 0.2% | |
| CCC | | | 0.2% | |
| CC | | | 0.6% | |
| C | | | 0.9% | |
| D | | | 2.2% | |
| Not Rated | | | 2.8% | |
| Cash & Cash Equivalents | | | 0.8% | |
| |
| Portfolio facts (i) | | | | |
| Average Duration (d) | | | 3.6 | |
| Average Effective Maturity (m) | | | 4.7 yrs. | |
| (a) | For all securities other than those specifically described below, ratings are assigned to underlying securities utilizing ratings from Moody’s, Fitch, and Standard & Poor’s rating agencies and applying the following hierarchy: If all three agencies provide a rating, the middle rating (after dropping the highest and lowest ratings) is assigned; if two of the three agencies rate a security, the lower of the two is assigned. Ratings are shown in the S&P and Fitch scale (e.g., AAA). Securities rated BBB or higher are considered investment grade. All ratings are subject to change. Not Rated includes fixed income securities, including fixed income futures contracts, which have not been rated by any rating agency. The fund may or may not have held all of these instruments on this date. The fund is not rated by these agencies. |
| (d) | Duration is a measure of how much a bond’s price is likely to fluctuate with general changes in interest rates, e.g., if rates rise 1.00%, a bond with a 5-year duration is likely to lose about 5.00% of its value due to the interest rate move. |
2
Portfolio Composition – continued
| (i) | For purposes of this presentation, the components include the value of securities, and reflect the impact of the equivalent exposure of derivative positions, if any. These amounts may be negative from time to time. Equivalent exposure is a calculated amount that translates the derivative position into a reasonable approximation of the amount of the underlying asset that the portfolio would have to hold at a given point in time to have the same price sensitivity that results from the portfolio’s ownership of the derivative contract. When dealing with derivatives, equivalent exposure is a more representative measure of the potential impact of a position on portfolio performance than value. The bond component will include any accrued interest amounts. |
| (m) | In determining an instrument’s effective maturity for purposes of calculating the fund’s dollar-weighted average effective maturity, MFS uses the instrument’s stated maturity or, if applicable, an earlier date on which MFS believes it is probable that a maturity-shortening device (such as a put, pre-refunding or prepayment) will cause the instrument to be repaid. Such an earlier date can be substantially shorter than the instrument’s stated maturity. |
Where the fund holds convertible bonds, they are treated as part of the equity portion of the portfolio.
Cash & Cash Equivalents includes any cash, investments in money market funds, short-term securities, and other assets less liabilities. Please see the Statement of Assets and Liabilities for additional information related to the fund’s cash position and other assets and liabilities.
Percentages are based on net assets as of April 30, 2018.
The portfolio is actively managed and current holdings may be different.
3
MANAGEMENT REVIEW
Summary of Results
For the twelve months ended April 30, 2018, Class A shares of the MFS Municipal Limited Maturity Fund (“fund”) provided a total return of 0.60%, at net asset value. This compares with a return of –0.06% for the fund’s benchmark, the Bloomberg Barclays 1-9 Year Municipal Bond Index.
Market Environment
Despite continued solid global economic growth, financial markets were buffeted by increased volatility late in the reporting period. The increase in volatility dented what appeared to have been high levels of investor confidence, leading to a correction in elevated valuations. Valuations are now more in line with long-term averages after the recent bout of market weakness. So far, the rise in volatility has not disrupted the synchronized upturn in growth, though developed markets showed signs of a modest slowdown in the expansion’s pace in early 2018.
During the period, the US Federal Reserve (“Fed”) raised rates by 75 basis points, bringing the total number of hikes to six since the central bank began to normalize monetary policy in late 2015. The growth rate in the US, eurozone and Japan remains above potential, though inflation remains contained, particularly outside the US. In the middle of the period, the European Central Bank announced that it was extending its asset purchase program until the end of September 2018, but cut its pace of asset purchases in half as economic conditions improved. Both the Bank of England (“BOE”) and the Bank of Canada raised rates during the period, the BOE for the first time in a decade. The European political backdrop became a bit less volatile late in the period, with populist parties gaining an increased share of the vote, but thus far falling short of majorities in eurozone member states.
Bond yields rose in most developed economies during the period, but they remain low by historic standards. Credit spreads remain relatively tight, but widened modestly late in the period as market volatility increased. Increasing concern over growing global trade friction risks weighed on the strong global trade volumes seen during the period’s second half. The US announced broad-based tariffs on imports of steel and aluminum during the period, though some nations have been exempted, and later targeted China for tariffs, in retaliation for what it believes is abuse of intellectual property rights. Growing fears of wider trade skirmishes have added to volatility.
10-Year US Treasury yields were largely range-bound during the first half of the reporting period before spiking higher during the latter half of the reporting period, with most of the rise occurring from December 2017 – January 2018 amid the passage of the Tax Cuts and Jobs Act, which cut individual and corporate tax rates, as well as a larger-than-expected fiscal spending package. This appeared to have led investors to increase expectations for better economic growth and a potential increase in inflationary pressures, pushing bond yields higher. While yields moderated somewhat in February and March due to increased equity market volatility and concerns about escalating trade wars, an increase in energy prices, and other measures of possible inflationary pressures, caused yields to jump higher in April, with the 10-Year US Treasury yield briefly rising above 3% but finishing the period slightly lower.
4
Management Review – continued
The Fed, continuing its efforts to normalize monetary policy, raised the Federal Funds rate three times during the reporting period, including one rate increase under new Federal Reserve Chairman Jerome Powell, who replaced Janet Yellen in February 2018. Generally, markets viewed the transition to the new Fed chairman without much concern – having served as a Fed governor since 2012, Powell is a known quantity among investors.
Another major event that occurred during the period was Hurricane Maria making landfall on the island of Puerto Rico. The hurricane had a devastating impact on the island’s residents and the government’s ability to provide basic human services such as water, power and healthcare. The prospects for long-term recovery are still uncertain and the government and many of its agencies and instrumentalities, which were already operating under an oversight board established by the Puerto Rico Oversight, Management and Economic Stability Act, are in the process of amending their financial plans in light of the recent events. As such, prices of the majority of debt issued from the jurisdiction of Puerto Rico, both insured and uninsured, declined in the weeks following the Hurricane, but have since recovered somewhat.
For the reporting period, the municipal market largely took its cue from the direction of US Treasury rates. Yields were largely range-bound early in the period, and then accelerated higher towards the end of the reporting period, pushed higher by the same factors impacting US Treasury yields – optimism over stronger US growth in the wake of the tax reform and increased fiscal spending. Yields moderated towards the end of the reporting period amid an increase in equity market volatility and concerns about the impact of a trade war on the global economy, before surging higher in April amid signs of possible inflationary pressures.
Against this backdrop, the municipal yield curve flattened, with yields on shorter-dated municipal bonds rising more than yields on longer-dated bonds. As a result, the broader US investment grade municipal bond market provided modestly positive returns with long-dated bonds dramatically outperforming short-dated bonds, and lower-quality bonds outperforming higher-quality bonds.
The US economic backdrop appears supportive of municipal bond fundamentals; valuations appear tight within the context of longer-term municipal performance, but on a tax-adjusted basis, municipal bonds offer satisfactory relative value compared with broader fixed income markets.
Factors Affecting Performance
Relative to the Bloomberg Barclays 1-9 Year Municipal Bond Index, drivers of positive relative performance included the fund’s greater exposure to “BBB” rated (r) securities, particularly within the local, education and health care sectors, and favorable security selection within both “A” and “AA” rated credit quality segments. In addition, the fund’s positioning along the yield curve (y) further contributed to relative returns.
Conversely, security selection in the solid waste/resource recovery sector, particularly within “BBB” rated securities, held back relative returns.
Respectfully,
Portfolio Manager(s)
Jason Kosty and Geoffrey Schechter
5
Management Review – continued
| (r) | Bonds rated “BBB”, “Baa”, or higher are considered investment grade; bonds rated “BB”, “Ba”, or below are considered non-investment grade. The source for bond quality ratings is Moody’s Investors Service, Standard & Poor’s and Fitch, Inc. and are applied using the following hierarchy: If all three agencies provide a rating, the middle rating (after dropping the highest and lowest ratings) is assigned; if two of the three agencies rate a security, the lower of the two is assigned. Ratings are shown in the S&P and Fitch scale (e.g., AAA). For securities which are not rated by any of the three agencies, the security is considered Not Rated. |
| (y) | A yield curve graphically depicts the yields of different maturity bonds of the same credit quality and type; a normal yield curve is upward sloping, with short-term rates lower than long-term rates. |
The views expressed in this report are those of the portfolio manager(s) only through the end of the period of the report as stated on the cover and do not necessarily reflect the views of MFS or any other person in the MFS organization. These views are subject to change at any time based on market or other conditions, and MFS disclaims any responsibility to update such views. These views may not be relied upon as investment advice or an indication of trading intent on behalf of any MFS portfolio. References to specific securities are not recommendations of such securities, and may not be representative of any MFS portfolio’s current or future investments.
6
PERFORMANCE SUMMARY THROUGH 4/30/18
The following chart illustrates a representative class of the fund’s historical performance in comparison to its benchmark(s). Performance results include the deduction of the maximum applicable sales charge and reflect the percentage change in net asset value, including reinvestment of dividends and capital gains distributions. The performance of other share classes will be greater than or less than that of the class depicted below. Benchmarks are unmanaged and may not be invested in directly. Benchmark returns do not reflect sales charges, commissions or expenses. (See Notes to Performance Summary.)
Performance data shown represents past performance and is no guarantee of future results. Investment return and principal value fluctuate so your shares, when sold, may be worth more or less than the original cost; current performance may be lower or higher than quoted. The performance shown does not reflect the deduction of taxes, if any, that a shareholder would pay on fund distributions or the redemption of fund shares.
Growth of a Hypothetical $10,000 Investment
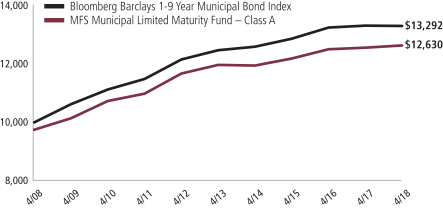
7
Performance Summary – continued
Total Returns through 4/30/18
Average annual without sales charge
| | | | | | | | | | | | | | |
| | | Share Class | | Class Inception Date | | 1-yr | | 5-yr | | 10-yr | | Life (t) | | |
| | | A | | 3/17/92 | | 0.60% | | 1.10% | | 2.62% | | N/A | | |
| | | B | | 9/07/93 | | (0.15)% | | 0.35% | | 1.86% | | N/A | | |
| | | C | | 7/01/94 | | (0.25)% | | 0.24% | | 1.75% | | N/A | | |
| | | I | | 8/30/10 | | 0.75% | | 1.25% | | N/A | | 1.91% | | |
| | | R6 | | 9/01/17 | | N/A | | N/A | | N/A | | (1.06)% | | |
| Comparative benchmark(s) | | | | | | | | | | |
| | | Bloomberg Barclays 1-9 Year Municipal Bond Index (f) | | (0.06)% | | 1.29% | | 2.89% | | N/A | | |
| Average annual with sales charge | | | | | | | | | | |
| | | A
With Initial Sales Charge (2.50%) | | (1.92)% | | 0.59% | | 2.36% | | N/A | | |
| | | B
With CDSC (Declining over six years from 4% to 0%) (v) | | (4.09)% | | (0.04)% | | 1.86% | | N/A | | |
| | | C
With CDSC (1% for 12 months) (v) | | (1.23)% | | 0.24% | | 1.75% | | N/A | | |
| CDSC | – Contingent Deferred Sales Charge. |
Class I and R6 shares do not have a sales charge.
| (f) | Source: FactSet Research Systems Inc. |
| (t) | For the period from the class inception date through the stated period end (for those share classes with less than 10 years of performance history). No comparative benchmark performance information is provided for “life” periods. (See Notes to Performance Summary.) |
| (v) | Assuming redemption at the end of the applicable period. |
Benchmark Definition(s)
Bloomberg Barclays 1-9 Year Municipal Bond Index – a market capitalization-weighted index that measures the performance of the medium-term (1 to 9 years) tax-exempt bond market.
It is not possible to invest directly in an index.
Notes to Performance Summary
Average annual total return represents the average annual change in value for each share class for the periods presented. Life returns are presented where the share class has less than 10 years of performance history and represent the average annual total return from the class inception date to the stated period end date. As the fund’s share classes may have different inception dates, the life returns may represent different time periods and may not be comparable. As a result, no comparative benchmark performance information is provided for life periods.
Performance results reflect any applicable expense subsidies and waivers in effect during the periods shown. Without such subsidies and waivers the fund’s performance results would be less favorable. Please see the prospectus and financial statements for complete details.
8
Performance Summary – continued
Performance results do not include adjustments made for financial reporting purposes in accordance with U.S. generally accepted accounting principles and may differ from amounts reported in the financial highlights.
A portion of income may be subject to state, federal, and/or alternative minimum tax. Capital gains, if any, are subject to a capital gains tax.
From time to time the fund may receive proceeds from litigation settlements, without which performance would be lower.
9
EXPENSE TABLE
Fund expenses borne by the shareholders during the period, November 1, 2017 through April 30, 2018
As a shareholder of the fund, you incur two types of costs: (1) transaction costs, including sales charges (loads) on certain purchase or redemption payments, and (2) ongoing costs, including management fees; distribution and service (12b-1) fees; and other fund expenses. This example is intended to help you understand your ongoing costs (in dollars) of investing in the fund and to compare these costs with the ongoing costs of investing in other mutual funds.
The example is based on an investment of $1,000 invested at the beginning of the period and held for the entire period November 1, 2017 through April 30, 2018.
Actual Expenses
The first line for each share class in the following table provides information about actual account values and actual expenses. You may use the information in this line, together with the amount you invested, to estimate the expenses that you paid over the period. Simply divide your account value by $1,000 (for example, an $8,600 account value divided by $1,000 = 8.6), then multiply the result by the number in the first line under the heading entitled “Expenses Paid During Period” to estimate the expenses you paid on your account during this period.
Hypothetical Example for Comparison Purposes
The second line for each share class in the following table provides information about hypothetical account values and hypothetical expenses based on the fund’s actual expense ratio and an assumed rate of return of 5% per year before expenses, which is not the fund’s actual return. The hypothetical account values and expenses may not be used to estimate the actual ending account balance or expenses you paid for the period. You may use this information to compare the ongoing costs of investing in the fund and other funds. To do so, compare this 5% hypothetical example with the 5% hypothetical examples that appear in the shareholder reports of the other funds.
Please note that the expenses shown in the table are meant to highlight your ongoing costs only and do not reflect any transactional costs, such as sales charges (loads). Therefore, the second line for each share class in the table is useful in comparing ongoing costs only, and will not help you determine the relative total costs of owning different funds. In addition, if these transactional costs were included, your costs would have been higher.
10
Expense Table – continued
| | | | | | | | | | | | | | | | | | |
Share
Class | | | | Annualized
Expense
Ratio | | | Beginning
Account Value
11/01/17 | | | Ending Account Value
4/30/18 | | | Expenses
Paid During
Period (p) 11/01/17-4/30/18 | |
| A | | Actual | | | 0.69% | | | | $1,000.00 | | | | $990.58 | | | | $3.41 | |
| | Hypothetical (h) | | | 0.69% | | | | $1,000.00 | | | | $1,021.37 | | | | $3.46 | |
| B | | Actual | | | 1.44% | | | | $1,000.00 | | | | $986.91 | | | | $7.09 | |
| | Hypothetical (h) | | | 1.44% | | | | $1,000.00 | | | | $1,017.65 | | | | $7.20 | |
| C | | Actual | | | 1.54% | | | | $1,000.00 | | | | $986.43 | | | | $7.58 | |
| | Hypothetical (h) | | | 1.54% | | | | $1,000.00 | | | | $1,017.16 | | | | $7.70 | |
| I | | Actual | | | 0.54% | | | | $1,000.00 | | | | $991.28 | | | | $2.67 | |
| | Hypothetical (h) | | | 0.54% | | | | $1,000.00 | | | | $1,022.12 | | | | $2.71 | |
| R6 | | Actual | | | 0.45% | | | | $1,000.00 | | | | $992.96 | | | | $2.22 | |
| | Hypothetical (h) | | | 0.45% | | | | $1,000.00 | | | | $1,022.56 | | | | $2.26 | |
| (h) | 5% class return per year before expenses. |
| (p) | “Expenses Paid During Period” are equal to each class’s annualized expense ratio, as shown above, multiplied by the average account value over the period, multiplied by 181/365 (to reflect the one-half year period). Expenses paid do not include any applicable sales charges (loads). If these transaction costs had been included, your costs would have been higher. |
11
PORTFOLIO OF INVESTMENTS
4/30/18
The Portfolio of Investments is a complete list of all securities owned by your fund. It is categorized by jurisdiction.
| | | | | | | | |
| Municipal Bonds - 97.8% | | | | | | | | |
| Issuer | | Shares/Par | | | Value ($) | |
| Alabama - 1.4% | | | | | | | | |
| Alabama 21st Century Authority, Tobacco Settlement Rev., “A”, 5%, 6/01/2018 | | $ | 2,335,000 | | | $ | 2,341,865 | |
| Alabama Building Renovation Finance Authority Rev., 4%, 9/01/2018 | | | 1,000,000 | | | | 1,007,490 | |
| Alabama Building Renovation Finance Authority Rev., 4%, 9/01/2019 | | | 1,615,000 | | | | 1,660,834 | |
| Auburn University, General Fee Rev., “A”, 5%, 6/01/2021 | | | 2,170,000 | | | | 2,363,521 | |
| Black Belt Energy Gas District, AL, Gas Prepay Rev., “A”, 4%, 12/01/2048 (Put Date 12/01/2023) | | | 3,750,000 | | | | 3,992,812 | |
| Black Belt Energy Gas District, AL, Gas Prepay Rev., “B-1”, FLR, 2.164% (67% of LIBOR-1mo. + 0.9%), 12/01/2048 (Put Date 12/01/2023) | | | 11,480,000 | | | | 11,480,000 | |
| Houston County, AL, Health Care Authority (Southeast Alabama Medical Center), “A”, 5%, 10/01/2025 | | | 1,165,000 | | | | 1,288,630 | |
| Phenix City, AL, Water & Sewer Rev., “A”, BAM, 5%, 8/15/2025 | | | 2,225,000 | | | | 2,479,317 | |
| | | | | | | | |
| | | | | | | $ | 26,614,469 | |
| Alaska - 0.4% | | | | | | | | |
| Alaska Industrial Development & Export Authority Power Rev. (Snettisham Hydroelectric Project), 5%, 1/01/2021 | | $ | 1,400,000 | | | $ | 1,502,354 | |
| Alaska Industrial Development & Export Authority Power Rev. (Snettisham Hydroelectric Project), 5%, 1/01/2022 | | | 1,200,000 | | | | 1,310,088 | |
| Valdez, AK, Marine Terminal Rev. (BP Pipelines Project), “B”, 5%, 1/01/2021 | | | 4,000,000 | | | | 4,284,920 | |
| | | | | | | | |
| | | | | | | $ | 7,097,362 | |
| Arizona - 1.2% | | | | | | | | |
| Arizona Health Facilities Authority Rev. (Phoenix Children’s | | | | | | | | |
| Hospital), “A-1”, FLR, 3.6% (MUNIPSA + 1.85%), 2/01/2048 (Put Date 2/05/2020) | | $ | 3,000,000 | | | $ | 3,049,980 | |
| Chandler, AZ, 5%, 7/01/2022 (Prerefunded 7/01/2018) | | | 1,000,000 | | | | 1,005,210 | |
| Mohave County, AZ, Kingman Unified School District Number 20, Refunding , BAM, 5%, 7/01/2024 | | | 2,530,000 | | | | 2,878,305 | |
| Phoenix, AZ, Civic Improvement Corp., Water System Rev., FGIC, 5.5%, 7/01/2021 | | | 1,260,000 | | | | 1,392,476 | |
| Phoenix, AZ, Industrial Development Authority Education Rev. (Basis Schools, Inc. Projects), “A”, 3%, 7/01/2020 | | | 775,000 | | | | 765,855 | |
| Phoenix, AZ, Industrial Development Authority Education Rev. (Basis Schools, Inc. Projects), “A”, 4%, 7/01/2025 | | | 1,240,000 | | | | 1,244,551 | |
12
Portfolio of Investments – continued
| | | | | | | | |
| Issuer | | Shares/Par | | | Value ($) | |
| Municipal Bonds - continued | | | | | | | | |
| Arizona - continued | | | | | | | | |
| Phoenix, AZ, Industrial Development Authority Education Rev. (Great Hearts Academies), “A”, 2.95%, 7/01/2026 | | $ | 3,480,000 | | | $ | 3,335,441 | |
| Phoenix, AZ, Industrial Development Authority Education Rev. (Legacy Traditional Schools Project), 3%, 7/01/2020 | | | 410,000 | | | | 405,752 | |
| Salt River, AZ, Agricultural Improvement & Power District, “A” , 5%, 1/01/2025 | | | 3,800,000 | | | | 4,402,452 | |
| Yavapai County, AZ, Industrial Development Authority Rev. (Regional Medical Center), “A”, 5%, 8/01/2018 | | | 525,000 | | | | 528,633 | |
| Yavapai County, AZ, Industrial Development Authority Rev. | | | | | | | | |
| (Waste Management, Inc.), 2.125%, 6/01/2027 (Put Date 6/01/2018) | | | 3,000,000 | | | | 3,000,150 | |
| | | | | | | | |
| | | | | | | $ | 22,008,805 | |
| Arkansas - 0.7% | | | | | | | | |
| Arkansas Development Finance Authority Hospital Rev. (Washington Regional Medical Center), “B”, 5%, 2/01/2020 | | $ | 355,000 | | | $ | 372,122 | |
| Arkansas Development Finance Authority Hospital Rev. (Washington Regional Medical Center), “B”, 5%, 2/01/2021 | | | 465,000 | | | | 497,838 | |
| Arkansas Development Finance Authority Hospital Rev. (Washington Regional Medical Center), “B”, 5%, 2/01/2022 | | | 380,000 | | | | 413,622 | |
| Arkansas Four-Lane Highway Construction & Improvement Rev., 5%, 6/15/2021 | | | 5,000,000 | | | | 5,446,550 | |
| Independence County, AR, Pollution Control Rev. (Entergy Arkansas, Inc. Project), 2.375%, 1/01/2021 | | | 3,250,000 | | | | 3,258,710 | |
| Pulaski County, AR, Public Facilities Board, Healthcare Rev. (Baptist Health), 5%, 12/01/2022 | | | 300,000 | | | | 333,912 | |
| Pulaski County, AR, Public Facilities Board, Healthcare Rev. (Baptist Health), 5%, 12/01/2023 | | | 1,665,000 | | | | 1,877,754 | |
| | | | | | | | |
| | | | | | | $ | 12,200,508 | |
| California - 5.4% | | | | | | | | |
| California Department of Water Resources, Power Supply Rev., “L”, 5%, 5/01/2018 | | $ | 3,510,000 | | | $ | 3,510,000 | |
| California Department of Water Resources, Power Supply Rev., “M”, 4%, 5/01/2019 | | | 3,000,000 | | | | 3,070,650 | |
| California Educational Facilities Authority Rev. (Chapman University), 5%, 4/01/2019 | | | 1,000,000 | | | | 1,029,780 | |
| California Educational Facilities Authority Rev. (Chapman University), 5%, 4/01/2020 | | | 1,250,000 | | | | 1,324,175 | |
| California Educational Facilities Authority Rev. (University of Redlands), “A”, 4%, 10/01/2018 | | | 400,000 | | | | 403,756 | |
| California Educational Facilities Authority Rev. (University of San Francisco), ETM, 5%, 10/01/2021 | | | 245,000 | | | | 268,794 | |
13
Portfolio of Investments – continued
| | | | | | | | |
| Issuer | | Shares/Par | | | Value ($) | |
| Municipal Bonds - continued | | | | | | | | |
| California - continued | | | | | | | | |
| California Educational Facilities Authority Rev., Unrefunded Balance (University of San Francisco), 5%, 10/01/2021 | | $ | 255,000 | | | $ | 279,146 | |
| California Health Facilities Financing Authority Refunding Rev. (Stanford Health Care), “A”, 5%, 11/15/2023 | | | 1,500,000 | | | | 1,717,770 | |
| California Health Facilities Financing Authority Rev. (St. Joseph Health System), “C”, 5%, 7/01/2043 (Put Date 10/15/2019) | | | 2,750,000 | | | | 2,866,710 | |
| California Health Facilities Financing Authority Rev. (St. Joseph Health System), “D”, 5%, 7/01/2043 (Put Date 10/15/2020) | | | 2,400,000 | | | | 2,572,080 | |
| California Municipal Finance Authority Rev. (Biola University), 5%, 10/01/2018 | | | 235,000 | | | | 237,538 | |
| California Municipal Finance Authority Rev. (NorthBay Healthcare Group), “A”, 5%, 11/01/2025 | | | 1,130,000 | | | | 1,263,826 | |
| California Municipal Finance Authority Rev. (NorthBay Healthcare Group), “A”, 5%, 11/01/2026 | | | 1,000,000 | | | | 1,125,070 | |
| California Public Finance Authority, University Housing Rev. (NCCD Claremont Properties LLC, Claremont Colleges Project), “A”, 5%, 7/01/2027 | | | 750,000 | | | | 823,935 | |
| California Public Finance Authority, University Housing Rev. (NCCD Claremont Properties LLC, Claremont Colleges Project), “A”, 5%, 7/01/2032 | | | 700,000 | | | | 754,901 | |
| California School Finance Authority, Charter School Rev. (Aspire Public Schools), 5%, 8/01/2024 | | | 350,000 | | | | 386,652 | |
| California School Finance Authority, Charter School Rev. (Aspire Public Schools), 5%, 8/01/2025 | | | 365,000 | | | | 407,179 | |
| California School Finance Authority, Charter School Rev. (Aspire Public Schools), 5%, 8/01/2026 | | | 300,000 | | | | 332,823 | |
| California School Finance Authority, School Facility Rev., (Alliance For College-Ready Public School Projects), “A”, 4%, 7/01/2021 | | | 750,000 | | | | 783,300 | |
| California School Finance Authority, School Facility Rev., (Alliance For College-Ready Public School Projects), “A”, 4%, 7/01/2022 | | | 1,120,000 | | | | 1,175,138 | |
| California School Finance Authority, School Facility Rev., (Alliance For College-Ready Public School Projects), “A”, 4%, 7/01/2023 | | | 1,245,000 | | | | 1,312,641 | |
| California Statewide Communities Development Authority Refunding Rev. (California Baptist University), “A”, 3%, 11/01/2022 | | | 310,000 | | | | 309,352 | |
| California Statewide Communities Development Authority Refunding Rev. (California Baptist University), “A”, 3.5%, 11/01/2027 | | | 1,335,000 | | | | 1,323,279 | |
| Chula Vista, CA, Industrial Development Rev. (San Diego Gas & Electric Co.), “A”, 1.65%, 7/01/2018 | | | 3,500,000 | | | | 3,497,655 | |
| Corona-Norco, CA, Unified School District, Public Financing | | | | | | | | |
| Authority Special Tax Rev. (Riverside County), “A”, 4%, 9/01/2018 | | | 400,000 | | | | 402,928 | |
14
Portfolio of Investments – continued
| | | | | | | | |
| Issuer | | Shares/Par | | | Value ($) | |
| Municipal Bonds - continued | | | | | | | | |
| California - continued | | | | | | | | |
| Elk Grove, CA, Finance Authority Special Tax Rev., 5%, 9/01/2022 | | $ | 450,000 | | | $ | 500,382 | |
| Jurupa, CA, Public Financing Authority Tax Rev., “A”, 5%, 9/01/2019 | | | 475,000 | | | | 494,242 | |
| Jurupa, CA, Public Financing Authority Tax Rev., “A”, 5%, 9/01/2020 | | | 550,000 | | | | 587,637 | |
| La Verne, CA, Brethren Hillcrest Homes, COP, 4%, 5/15/2018 | | | 235,000 | | | | 235,190 | |
| La Verne, CA, Brethren Hillcrest Homes, COP, 4%, 5/15/2019 | | | 565,000 | | | | 577,583 | |
| La Verne, CA, Brethren Hillcrest Homes, COP, 5%, 5/15/2021 | | | 310,000 | | | | 335,736 | |
| Long Beach, CA, Bond Finance Authority, Natural Gas Purchase Rev., “A”, 5.25%, 11/15/2020 | | | 930,000 | | | | 996,728 | |
| Los Angeles County, CA, Public Works Financing Authority Lease Rev. (Multiple Capital Projects II), 5%, 8/01/2018 | | | 500,000 | | | | 504,210 | |
| Los Angeles County, CA, Redevelopment Refunding Authority Tax Allocation Rev. “D”, AGM, 5%, 9/01/2022 | | | 1,865,000 | | | | 2,080,333 | |
| Los Angeles County, CA, Redevelopment Refunding Authority Tax Allocation Rev. “D”, AGM, 5%, 9/01/2023 | | | 1,865,000 | | | | 2,115,208 | |
| Los Angeles County, CA, Sanitation Districts Financing Authority Rev. (Capital Projects), “A”, 5%, 10/01/2020 | | | 5,000,000 | | | | 5,379,900 | |
| Los Angeles, CA, Department of Airports Rev. (Los Angeles International), “B” , 5%, 5/15/2026 | | | 1,350,000 | | | | 1,561,343 | |
| Los Angeles, CA, Department of Water & Power Rev., “A”, 5%, 7/01/2019 | | | 1,000,000 | | | | 1,038,680 | |
| Los Angeles, CA, Regional Airports Improvement Corp., Facilities Lease Rev. (LAXFUEL Corp.), ASSD GTY, 5%, 1/01/2019 | | | 2,575,000 | | | | 2,588,596 | |
| Los Angeles, CA, Regional Airports Improvement Corp., Facilities Lease Rev. (LAXFUEL Corp.), ASSD GTY, 5%, 1/01/2020 | | | 2,705,000 | | | | 2,719,282 | |
| Oxnard, CA, Financing Authority, Wastewater Rev., AGM, 5%, 6/01/2021 | | | 750,000 | | | | 815,475 | |
| Pittsburg, CA, Redevelopment Successor Agency, Tax Allocation (Los Medanos Community Development Project), “A”, AGM, 5%, 9/01/2024 | | | 4,000,000 | | | | 4,576,960 | |
| Sacramento, CA, City Financing Authority, Special Tax Rev. (Westlake and Regency Park), “A”, AGM, 4%, 9/01/2018 | | | 1,210,000 | | | | 1,218,252 | |
| Sacramento, CA, City Financing Authority, Special Tax Rev. (Westlake and Regency Park), “A”, AGM, 4%, 9/01/2019 | | | 1,300,000 | | | | 1,333,774 | |
| Sacramento, CA, Municipal Utility District, “X”, 5%, 8/15/2020 | | | 1,750,000 | | | | 1,876,455 | |
| San Bernardino, CA, City Unified School District, “A”, AGM, 5%, 8/01/2020 | | | 750,000 | | | | 801,060 | |
| San Bernardino, CA, City Unified School District, “A”, AGM, 5%, 8/01/2021 | | | 1,200,000 | | | | 1,311,420 | |
| San Bernardino, CA, City Unified School District, “A”, AGM, 5%, 8/01/2023 | | | 1,100,000 | | | | 1,247,147 | |
15
Portfolio of Investments – continued
| | | | | | | | |
| Issuer | | Shares/Par | | | Value ($) | |
| Municipal Bonds - continued | | | | | | | | |
| California - continued | | | | | | | | |
| San Diego County, CA, Regional Airport Authority Rev., “B”, 5%, 7/01/2020 | | $ | 500,000 | | | $ | 530,830 | |
| San Francisco, CA, Bay Area Toll Authority, Bridge Rev., “C”, 1.875%, 4/01/2047 (Put Date 4/01/2019) | | | 3,090,000 | | | | 3,092,317 | |
| San Francisco, CA, City & County Airports Commission, International Airport Rev., “D”, 5%, 5/01/2025 (Prerefunded 5/03/2021) | | | 285,000 | | | | 310,234 | |
| San Francisco, CA, City & County Airports Commission, International Airport Rev., “D”, 5%, 5/01/2025 | | | 715,000 | | | | 776,233 | |
| San Pablo, CA, Redevelopment Agency Rev., “A”, 5%, 6/15/2020 | | | 1,000,000 | | | | 1,063,860 | |
| San Ramon CA, Public Financing Authority, Capital Appreciation, “A”, AAC, 0%, 2/01/2026 | | | 1,690,000 | | | | 1,306,488 | |
| Santa Cruz County, CA, Redevelopment Successor Agency Tax Allocation, 5%, 9/01/2018 | | | 600,000 | | | | 606,522 | |
| Santa Cruz County, CA, Redevelopment Successor Agency Tax Allocation, 5%, 9/01/2019 | | | 625,000 | | | | 651,419 | |
| Santa Cruz County, CA, Redevelopment Successor Agency Tax Allocation, 5%, 9/01/2020 | | | 985,000 | | | | 1,054,265 | |
| Santa Cruz County, CA, Redevelopment Successor Agency Tax Allocation, 5%, 9/01/2021 | | | 1,350,000 | | | | 1,478,453 | |
| State of California, 5%, 8/01/2026 | | | 3,490,000 | | | | 4,145,038 | |
| State of California, “B”, FLR, 2.078% (LIBOR-1mo. + 0.76%), 12/01/2031 (Put Date 12/01/2021) | | | 5,000,000 | | | | 5,048,050 | |
| State of California, General Obligation, 5%, 3/01/2026 | | | 5,750,000 | | | | 6,686,502 | |
| University of California, “AK”, 5%, 5/15/2048 (Put Date 5/15/2023) | | | 5,000,000 | | | | 5,689,500 | |
| | | | | | | | |
| | | | | | | $ | 98,514,382 | |
| Colorado - 1.5% | | | | | | | | |
| Colorado Educational & Cultural Facilities Authority Rev. (Colorado Springs Charter Academy Project), 5.25%, 7/01/2028 | | $ | 2,165,000 | | | $ | 2,262,057 | |
| Colorado Educational & Cultural Facilities Authority Rev. (Liberty Common Charter School), 4%, 1/15/2019 | | | 155,000 | | | | 157,795 | |
| Colorado Educational & Cultural Facilities Authority Rev. (Montessori Charter School Project), 3.25%, 7/15/2022 | | | 1,325,000 | | | | 1,347,922 | |
| Colorado Educational & Cultural Facilities Authority Rev. (Pinnacle Charter School, Inc. K-8 Facility Project), 4%, 6/01/2018 | | | 300,000 | | | | 300,483 | |
| Colorado Educational & Cultural Facilities Authority Rev. (Pinnacle Charter School, Inc. K-8 Facility Project), 4%, 6/01/2020 | | | 310,000 | | | | 320,577 | |
| Colorado Educational & Cultural Facilities Authority Rev. (Pinnacle Charter School, Inc. K-8 Facility Project), 4%, 6/01/2022 | | | 545,000 | | | | 575,651 | |
| Colorado Educational & Cultural Facilities Authority Rev. (Union Colony Charter School Project), 4%, 4/01/2023 | | | 130,000 | | | | 136,431 | |
16
Portfolio of Investments – continued
| | | | | | | | |
| Issuer | | Shares/Par | | | Value ($) | |
| Municipal Bonds - continued | | | | | | | | |
| Colorado - continued | | | | | | | | |
| Colorado Health Facilities Authority Rev. (Covenant Retirement Communities, Inc.), “A”, 5%, 12/01/2021 | | $ | 55,000 | | | $ | 60,015 | |
| Colorado Health Facilities Authority Rev. (Covenant Retirement Communities, Inc.), “A”, 5%, 12/01/2021 | | | 1,160,000 | | | | 1,252,916 | |
| Colorado Health Facilities Authority Rev. (Covenant Retirement Communities, Inc.), “A”, 5%, 12/01/2022 | | | 1,750,000 | | | | 1,915,970 | |
| Colorado Housing & Finance Authority Rev., “B-1”, GNMA, 4%, 11/01/2048 | | | 1,845,000 | | | | 1,945,110 | |
| Colorado Housing & Finance Authority, Solid Waste Rev. (Waste Management, Inc.), 5.7%, 7/01/2018 | | | 2,120,000 | | | | 2,131,935 | |
| Colorado Springs, CO, Utility Rev., “A”, VRDN, 1.72%, 11/01/2037 | | | 3,250,000 | | | | 3,250,000 | |
| Denver, CO, City & County Airport Systems Rev., “B”, 5%, 11/15/2018 | | | 300,000 | | | | 305,502 | |
| Denver, CO, City & County Airport Systems Rev., “B”, 5%, 11/15/2019 | | | 445,000 | | | | 466,200 | |
| Denver, CO, City & County Excise Tax Rev., “A”, ASSD GTY, 6%, 9/01/2021 (Prerefunded 9/01/2019) | | | 1,500,000 | | | | 1,581,600 | |
| Denver, CO, Convention Center Hotel Authority Rev., 5%, 12/01/2024 | | | 1,500,000 | | | | 1,693,185 | |
| Denver, CO, Convention Center Hotel Authority Rev., 5%, 12/01/2025 | | | 2,000,000 | | | | 2,278,100 | |
| Park Creek Metropolitan District, CO, Senior Limited Property Tax Supported Rev., “A”, 5%, 12/01/2021 | | | 1,640,000 | | | | 1,782,500 | |
| Park Creek Metropolitan District, CO, Senior Limited Property Tax Supported Rev., “A”, 5%, 12/01/2023 | | | 1,000,000 | | | | 1,118,390 | |
| Park Creek Metropolitan District, CO, Senior Limited Property Tax Supported Rev., “A”, NATL, 5%, 12/01/2025 | | | 500,000 | | | | 569,525 | |
| Park Creek Metropolitan District, CO, Senior Limited Property Tax Supported Rev., “A”, NATL, 5%, 12/01/2026 | | | 1,300,000 | | | | 1,495,377 | |
| Park Creek Metropolitan District, CO, Senior Limited Property Tax Supported Rev., “A”, NATL, 5%, 12/01/2027 | | | 1,270,000 | | | | 1,452,601 | |
| | | | | | | | |
| | | | | | | $ | 28,399,842 | |
| Connecticut - 2.9% | | | | | | | | |
| Connecticut Health & Educational Facilities Authority Rev. (Connecticut State University), “N”, 5%, 11/01/2024 | | $ | 1,930,000 | | | $ | 2,124,274 | |
| Connecticut Health & Educational Facilities Authority Rev. (Masonicare), “F”, 5%, 7/01/2023 | | | 2,800,000 | | | | 3,078,600 | |
| Connecticut Health & Educational Facilities Authority Rev. (Masonicare), “F”, 5%, 7/01/2024 | | | 1,840,000 | | | | 2,041,241 | |
| Connecticut Health & Educational Facilities Authority Rev. (Quinnipiac University), “M”, AGM, 5%, 7/01/2019 | | | 2,350,000 | | | | 2,434,224 | |
17
Portfolio of Investments – continued
| | | | | | | | |
| Issuer | | Shares/Par | | | Value ($) | |
| Municipal Bonds - continued | | | | | | | | |
| Connecticut - continued | | | | | | | | |
| Connecticut Health & Educational Facilities Authority Rev. (Yale University), “C-2”, 5%, 7/01/2057 (Put Date 2/01/2023) | | $ | 20,000,000 | | | $ | 22,395,600 | |
| Connecticut Housing Finance Authority, Mortgage Finance Program, “A-2”, 4%, 11/15/2041 | | | 3,870,000 | | | | 4,035,597 | |
| Hartford County, CT, Metropolitan District, “C”, AGM, 5%, 11/01/2020 | | | 1,830,000 | | | | 1,955,227 | |
| Hartford County, CT, Metropolitan District, “C”, AGM, 5%, 11/01/2021 | | | 3,775,000 | | | | 4,116,940 | |
| Hartford County, CT, Metropolitan District, “C”, AGM, 5%, 11/01/2023 | | | 3,000,000 | | | | 3,384,630 | |
| Hartford County, CT, Metropolitan District, “C”, AGM, 5%, 11/01/2024 | | | 5,600,000 | | | | 6,391,504 | |
| State of Connecticut, “A”, 5%, 9/01/2023 | | | 2,005,000 | | | | 2,220,898 | |
| | | | | | | | |
| | | | | | | $ | 54,178,735 | |
| Delaware - 0.0% | | | | | | | | |
| Delaware Economic Development Authority Rev. (Delaware Military Academy, Inc. Project), 4%, 9/01/2024 | | $ | 215,000 | | | $ | 221,295 | |
| Delaware Economic Development Authority Rev. (Newark Charter School, Inc.), “A”, 2.8%, 9/01/2026 | | | 480,000 | | | | 460,258 | |
| | | | | | | | |
| | | | | | | $ | 681,553 | |
| District of Columbia - 0.1% | | | | | | | | |
| District of Columbia Rev. (Methodist Home of the District of Columbia Issue), 4.5%, 1/01/2025 | | $ | 45,000 | | | $ | 44,059 | |
| District of Columbia University Rev. (Georgetown University), 5%, 4/01/2026 | | | 1,045,000 | | | | 1,214,405 | |
| | | | | | | | |
| | | | | | | $ | 1,258,464 | |
| Florida - 3.0% | | | | | | | | |
| Bellalago, FL, Educational Facilities Benefit District (Osceola | | | | | | | | |
| County) Capital Improvement Refunding Rev., 3.375%, 5/01/2021 | | $ | 1,005,000 | | | $ | 1,022,949 | |
| Bellalago, FL, Educational Facilities Benefit District (Osceola | | | | | | | | |
| County) Capital Improvement Refunding Rev., 3.6%, 5/01/2022 | | | 1,040,000 | | | | 1,069,671 | |
| Bellalago, FL, Educational Facilities Benefit District (Osceola | | | | | | | | |
| County) Capital Improvement Refunding Rev., 3.75%, 5/01/2023 | | | 1,080,000 | | | | 1,120,381 | |
| Broward County, FL, School Board Certificates of Participation, “C”, 5%, 7/01/2022 | | | 2,500,000 | | | | 2,768,575 | |
| Broward County, FL, School Board Certificates of Participation, “C”, 5%, 7/01/2023 | | | 2,500,000 | | | | 2,811,250 | |
| Collier County, FL, Industrial Development Authority Continuing | | | | | | | | |
| Care Community Rev. (The Arlington of Naples Project), “B”, 5.25%, 5/15/2022 | | | 60,000 | | | | 60,146 | |
18
Portfolio of Investments – continued
| | | | | | | | |
| Issuer | | Shares/Par | | | Value ($) | |
| Municipal Bonds - continued | | | | | | | | |
| Florida - continued | | | | | | | | |
| Daytona Beach, FL, Halifax Hospital Medical Center Rev., 5%, 6/01/2020 | | $ | 370,000 | | | $ | 390,021 | |
| Daytona Beach, FL, Halifax Hospital Medical Center Rev., 5%, 6/01/2024 | | | 535,000 | | | | 599,104 | |
| Daytona Beach, FL, Halifax Hospital Medical Center Rev., 5%, 6/01/2025 | | | 615,000 | | | | 696,278 | |
| Florida Citizens Property Insurance Corp., “A-1”, 5%, 6/01/2019 | | | 4,000,000 | | | | 4,131,920 | |
| Florida Citizens Property Insurance Corp., “A-1”, 5%, 6/01/2020 | | | 1,435,000 | | | | 1,520,167 | |
| Florida Higher Educational Facilities, Financial Authority Rev. (University of Tampa Project), “A”, 5%, 4/01/2021 | | | 1,300,000 | | | | 1,394,926 | |
| Florida Higher Educational Facilities, Financial Authority Rev. (University of Tampa Project), “A”, 5%, 4/01/2022 | | | 600,000 | | | | 655,116 | |
| Florida Municipal Power Agency Rev. (St. Lucie Project), “A”, 5%, 10/01/2019 | | | 2,365,000 | | | | 2,467,783 | |
| Florida Municipal Power Agency Rev. (St. Lucie Project), “A”, 5%, 10/01/2020 | | | 1,330,000 | | | | 1,419,975 | |
| Miami Beach, FL, Health Facilities Authority Hospital Rev. (Mount Sinai Medical Center of Florida), 5%, 11/15/2020 | | | 300,000 | | | | 318,621 | |
| Miami Beach, FL, Health Facilities Authority Hospital Rev. (Mount Sinai Medical Center of Florida), 5%, 11/15/2021 | | | 200,000 | | | | 216,256 | |
| Miami Beach, FL, Health Facilities Authority Hospital Rev. (Mount Sinai Medical Center of Florida), 5%, 11/15/2024 | | | 400,000 | | | | 444,648 | |
| Miami-Dade County, FL, Aviation Rev., “A”, 5%, 10/01/2018 | | | 2,000,000 | | | | 2,025,400 | |
| Miami-Dade County, FL, Aviation Rev., “A”, 5%, 10/01/2019 | | | 1,875,000 | | | | 1,951,931 | |
| Miami-Dade County, FL, Industrial Development Authority Rev. (Pinecrest Academy Project), 5%, 9/15/2024 | | | 380,000 | | | | 408,907 | |
| Orange County, FL, Health Facilities Authority Rev. (Presbyterian Retirement Communities Project), 4%, 8/01/2018 | | | 1,600,000 | | | | 1,608,432 | |
| Orange County, FL, Health Facilities Authority Rev. (Presbyterian Retirement Communities Project), 5%, 8/01/2020 | | | 1,730,000 | | | | 1,833,229 | |
| Orange County, FL, Health Facilities Authority Rev. (Presbyterian Retirement Communities Project), 5%, 8/01/2021 | | | 1,825,000 | | | | 1,967,569 | |
| Orange County, FL, Health Facilities Authority Rev. (Presbyterian Retirement Communities Project), 5%, 8/01/2022 | | | 1,810,000 | | | | 1,978,203 | |
| Palm Beach County, FL, Health Facilities Authority Hospital Rev. (BRRH Corp. Obligated Group), 5%, 12/01/2020 | | | 600,000 | | | | 637,248 | |
| Palm Beach County, FL, Health Facilities Authority Hospital Rev. (BRRH Corp. Obligated Group), 5%, 12/01/2021 | | | 1,200,000 | | | | 1,297,404 | |
| Sarasota County, FL, Health Facility Authority Retirement Facility Improvement Rev. (Village on the Isle Project), “B-2”, 2.7%, 1/01/2022 | | | 1,100,000 | | | | 1,093,521 | |
| South Florida, Water Management District, COP, 5%, 10/01/2024 | | | 2,000,000 | | | | 2,280,580 | |
19
Portfolio of Investments – continued
| | | | | | | | |
| Issuer | | Shares/Par | | | Value ($) | |
| Municipal Bonds - continued | | | | | | | | |
| Florida - continued | | | | | | | | |
| South Miami, FL, Health Facilities Baptist Authority Hospital Refunding Rev. (Baptist Health South Florida Obligated Group), 5%, 8/15/2022 | | $ | 1,930,000 | | | $ | 2,124,892 | |
| South Miami, FL, Health Facilities Baptist Authority Hospital Refunding Rev. (Baptist Health South Florida Obligated Group), 5%, 8/15/2023 | | | 2,100,000 | | | | 2,346,246 | |
| Sumter County, FL, Industrial Development Authority Hospital Rev. (Central Florida Health Alliance Projects), “A”, 5%, 7/01/2018 | | | 200,000 | | | | 201,002 | |
| Sumter County, FL, Industrial Development Authority Hospital Rev. (Central Florida Health Alliance Projects), “A”, 5%, 7/01/2019 | | | 500,000 | | | | 517,100 | |
| Tampa, FL, Solid Waste System Rev., 5%, 10/01/2020 | | | 3,000,000 | | | | 3,189,810 | |
| Tampa, FL, Solid Waste System Rev., 5%, 10/01/2021 | | | 1,000,000 | | | | 1,084,370 | |
| West Palm Beach, FL, Utility System Rev., “C”, VRDN, 1.81%, 10/01/2038 | | | 4,775,000 | | | | 4,775,000 | |
| | | | | | | | |
| | | | | | | $ | 54,428,631 | |
| Georgia - 3.5% | | | | | | | | |
| Atlanta, GA, Airport Rev., “B”, 5%, 1/01/2020 | | $ | 400,000 | | | $ | 420,068 | |
| Burke County, GA, Development Authority Pollution Control Rev. (Georgia Power Company Plant Vogtle Project), 1.85%, 12/01/2049 (Put Date 8/22/2019) | | | 7,500,000 | | | | 7,439,550 | |
| DeKalb County, GA, Water & Sewer Rev., “A”, 5%, 10/01/2021 | | | 1,000,000 | | | | 1,092,960 | |
| Fulton County, GA, Development Authority Rev. (Georgia Tech Athletic Association), “A”, 5%, 10/01/2019 | | | 5,000,000 | | | | 5,208,700 | |
| Fulton County, GA, Water & Sewer Rev., 5%, 1/01/2021 | | | 5,030,000 | | | | 5,411,274 | |
| Gainesville, GA, Hall County Hospital Authority (Northeast Georgia Health System, Inc.), “B”, FLR, 2.7% (MUNIPSA + 0.95%), 8/15/2035 (Put Date 2/18/2020) | | | 2,500,000 | | | | 2,514,900 | |
| Georgia Housing & Finance Authority Rev., Single Family Mortgage, “B-2”, 3.5%, 6/01/2039 | | | 3,680,000 | | | | 3,760,666 | |
| Georgia Main Street Natural Gas, Inc., Gas Project Rev., “A”, 5%, 3/15/2019 | | | 2,500,000 | | | | 2,564,700 | |
| Georgia Main Street Natural Gas, Inc., Gas Project Rev., “A”, 5%, 3/15/2022 | | | 8,670,000 | | | | 9,464,432 | |
| Georgia Main Street Natural Gas, Inc., Gas Project Rev., “B”, FLR, 2.008% (67% of LIBOR-1mo. + 0.75%), 4/01/2048 (Put Date 9/01/2023) | | | 10,000,000 | | | | 9,968,300 | |
| Georgia Main Street Natural Gas, Inc., Gas Project Rev., “C”, 4%, 8/01/2048 (Put Date 12/01/2023) | | | 8,815,000 | | | | 9,354,566 | |
20
Portfolio of Investments – continued
| | | | | | | | |
| Issuer | | Shares/Par | | | Value ($) | |
| Municipal Bonds - continued | | | | | | | | |
| Georgia - continued | | | | | | | | |
| Georgia Municipal Gas Authority Rev. (Gas Portfolio III Project), “Q”, 5%, 10/01/2021 | | $ | 1,750,000 | | | $ | 1,896,458 | |
| Glynn-Brunswick Memorial Hospital Authority Rev., Anticipation Certificates (Southeast Georgia Health System Project), 5%, 8/01/2023 | | | 1,750,000 | | | | 1,955,607 | |
| Monroe County, GA, Development Authority Pollution Control Rev. (Georgia Power Co. Plant Scherer Project), 2.05%, 7/01/2049 (Put Date 11/19/2021) | | | 2,750,000 | | | | 2,690,820 | |
| | | | | | | | |
| | | | | | | $ | 63,743,001 | |
| Guam - 0.5% | | | | | | | | |
| Guam Education Financing Foundation, Refunding, COP (Guam Public School Facilities Project), “A”, 5%, 10/01/2020 | | $ | 1,500,000 | | | $ | 1,569,345 | |
| Guam Education Financing Foundation, Refunding, COP (Guam Public School Facilities Project), “A”, 5%, 10/01/2021 | | | 2,385,000 | | | | 2,528,291 | |
| Guam Government Business Privilege Tax Rev., “A”, 5%, 1/01/2027 | | | 3,185,000 | | | | 3,332,179 | |
| Guam Government Ltd. Obligation Rev., “A”, 5%, 12/01/2018 | | | 750,000 | | | | 760,507 | |
| Guam Power Authority Rev., “A”, AGM, 5%, 10/01/2021 | | | 1,500,000 | | | | 1,618,680 | |
| | | | | | | | |
| | | | | | | $ | 9,809,002 | |
| Hawaii - 0.3% | | | | | | | | |
| State of Hawaii, “FH”, 5%, 10/01/2025 | | $ | 5,000,000 | | | $ | 5,866,900 | |
| | |
| Illinois - 12.1% | | | | | | | | |
| Chicago, IL, “A”, 5%, 1/01/2022 | | $ | 1,000,000 | | | $ | 1,046,210 | |
| Chicago, IL, “A”, AAC, 5%, 1/01/2024 | | | 4,320,000 | | | | 4,342,162 | |
| Chicago, IL, “A”, AGM, 5%, 1/01/2027 | | | 145,000 | | | | 146,085 | |
| Chicago, IL, “A”, AGM, 5%, 1/01/2028 | | | 3,430,000 | | | | 3,571,625 | |
| Chicago, IL, (Modern Schools Across Chicago Program), “A”, AAC, 5%, 12/01/2024 | | | 1,515,000 | | | | 1,520,499 | |
| Chicago, IL, (Modern Schools Across Chicago Program), “D”, AAC, 5%, 12/01/2022 | | | 2,730,000 | | | | 2,739,937 | |
| Chicago, IL, (Modern Schools Across Chicago Program), “G”, AAC, 5%, 12/01/2023 | | | 415,000 | | | | 416,527 | |
| Chicago, IL, (Modern Schools Across Chicago Program), “H”, AAC, 5%, 12/01/2020 | | | 1,165,000 | | | | 1,169,276 | |
| Chicago, IL, (Modern Schools Across Chicago Program), “H”, AAC, 5%, 12/01/2021 | | | 2,000,000 | | | | 2,007,340 | |
| Chicago, IL, Board of Education (School Reform), “A”, NATL, 5.25%, 12/01/2023 | | | 3,875,000 | | | | 4,192,556 | |
| Chicago, IL, Board of Education (School Reform), “A”, NATL, 5.25%, 12/01/2023 | | | 5,425,000 | | | | 5,869,579 | |
21
Portfolio of Investments – continued
| | | | | | | | |
| Issuer | | Shares/Par | | | Value ($) | |
| Municipal Bonds - continued | | | | | | | | |
| Illinois - continued | | | | | | | | |
| Chicago, IL, Board of Education (School Reform), Capital Appreciation, “A”, NATL, 0%, 12/01/2022 | | $ | 785,000 | | | $ | 648,614 | |
| Chicago, IL, Board of Education (School Reform), Capital Appreciation, “A”, NATL, 0%, 12/01/2023 | | | 675,000 | | | | 531,475 | |
| Chicago, IL, Board of Education (School Reform), Capital Appreciation, “A”, NATL, 0%, 12/01/2028 | | | 4,435,000 | | | | 2,738,213 | |
| Chicago, IL, Board of Education (School Reform), Capital Appreciation, “B-1”, NATL, 0%, 12/01/2019 | | | 550,000 | | | | 523,490 | |
| Chicago, IL, Board of Education (School Reform), Capital Appreciation, “B-1”, NATL, 0%, 12/01/2022 | | | 360,000 | | | | 297,454 | |
| Chicago, IL, Board of Education (School Reform), Capital Appreciation, “B-1”, NATL, 0%, 12/01/2023 | | | 8,170,000 | | | | 6,432,813 | |
| Chicago, IL, Board of Education (School Reform), Capital Appreciation, “B-1”, NATL, 0%, 12/01/2026 | | | 1,925,000 | | | | 1,310,694 | |
| Chicago, IL, Board of Education, “B”, AGM, 5%, 12/01/2027 | | | 1,755,000 | | | | 1,775,130 | |
| Chicago, IL, Board of Education, “C”, ASSD GTY, 5.25%, 12/01/2025 | | | 4,140,000 | | | | 4,231,784 | |
| Chicago, IL, Board of Education, Unlimited Tax General Obligation Refunding Dedicated Rev., “C”, 5%, 12/01/2027 | | | 3,000,000 | | | | 3,099,060 | |
| Chicago, IL, City Colleges of Chicago Capital Improvement Project, Capital Appreciation, NATL, 0%, 1/01/2026 | | | 6,640,000 | | | | 4,767,454 | |
| Chicago, IL, General Obligation, “A”, AAC, 5.5%, 12/01/2019 | | | 200,000 | | | | 206,842 | |
| Chicago, IL, Metropolitan Pier & Exposition Authority, State Tax Rev., Capital Appreciation, “A”, NATL, 0%, 6/15/2024 | | | 7,075,000 | | | | 5,489,351 | |
| Chicago, IL, O’Hare International Airport Rev., Senior Lien, “A”, 5%, 1/01/2023 | | | 820,000 | | | | 903,230 | |
| Chicago, IL, O’Hare International Airport Rev., Senior Lien, “A”, 5%, 1/01/2025 | | | 5,000,000 | | | | 5,609,350 | |
| Chicago, IL, Tax Increment Rev. (Pilsen Development Project), “A”, 5%, 6/01/2021 | | | 3,375,000 | | | | 3,639,229 | |
| Chicago, IL, Tax Increment Rev. (Pilsen Development Project), “A”, 5%, 6/01/2022 | | | 4,250,000 | | | | 4,661,400 | |
| Chicago, IL, Transit Authority Refunding Rev., 5%, 6/01/2026 | | | 2,500,000 | | | | 2,816,225 | |
| Chicago, IL, Wastewater Transmission Rev., Second Lien, “A”, AGM, 5%, 1/01/2027 | | | 1,500,000 | | | | 1,701,615 | |
| Chicago, IL, Wastewater Transmission Rev., Second Lien, “B”, AGM, 5%, 1/01/2027 | | | 2,000,000 | | | | 2,268,820 | |
| Chicago, IL, Water Rev., AGM, 5%, 11/01/2027 | | | 4,160,000 | | | | 4,739,821 | |
| City of Country Club Hills, Cook County, IL, Refunding, BAM, 4%, 12/01/2024 | | | 1,180,000 | | | | 1,220,698 | |
| City of Country Club Hills, Cook County, IL, Refunding, BAM, 4%, 12/01/2025 | | | 1,230,000 | | | | 1,267,306 | |
| Cook County, IL, “C”, AGM, 5%, 11/15/2025 | | | 10,000,000 | | | | 10,926,500 | |
22
Portfolio of Investments – continued
| | | | | | | | |
| Issuer | | Shares/Par | | | Value ($) | |
| Municipal Bonds - continued | | | | | | | | |
| Illinois - continued | | | | | | | | |
| Cook County, IL, General Obligation Refunding, 5%, 11/15/2020 | | $ | 700,000 | | | $ | 748,083 | |
| Cook County, IL, General Obligation Refunding, 5%, 11/15/2021 | | | 600,000 | | | | 654,282 | |
| Illinois Finance Authority Rev. (DePaul University), 5%, 10/01/2020 | | | 3,330,000 | | | | 3,543,919 | |
| Illinois Finance Authority Rev. (DePaul University), ETM, 5%, 10/01/2020 | | | 5,000 | | | | 5,346 | |
| Illinois Finance Authority Rev. (Edward-Elmhurst Healthcare), “A”, 5%, 1/01/2023 | | | 400,000 | | | | 434,924 | |
| Illinois Finance Authority Rev. (Edward-Elmhurst Healthcare), “A”, 5%, 1/01/2024 | | | 350,000 | | | | 384,667 | |
| Illinois Finance Authority Rev. (Edward-Elmhurst Healthcare), “A”, 5%, 1/01/2025 | | | 825,000 | | | | 915,544 | |
| Illinois Finance Authority Rev. (Franciscan Communities, Inc.), “A”, 3.2%, 5/15/2018 | | | 1,405,000 | | | | 1,405,590 | |
| Illinois Finance Authority Rev. (Franciscan Communities, Inc.), “A”, 4%, 5/15/2023 | | | 1,000,000 | | | | 1,052,150 | |
| Illinois Finance Authority Rev. (Mercy Health Corp.), 5%, 12/01/2025 | | | 5,000,000 | | | | 5,605,000 | |
| Illinois Finance Authority Rev. (Mercy Health Corp.), 5%, 12/01/2026 | | | 2,700,000 | | | | 3,033,342 | |
| Illinois Finance Authority Rev. (Presbyterian Homes Obligated Group), “B”, FLR, 2.668% (70% of LIBOR 1-Mo. + 1.35%), 5/01/2036 (Put Date 5/01/2021) | | | 700,000 | | | | 702,478 | |
| Illinois Finance Authority Rev. (Presence Health Network), “C”, 5%, 2/15/2023 | | | 3,900,000 | | | | 4,276,155 | |
| Illinois Finance Authority Rev. (Resurrection Health Care Corp.), AGM, 5%, 5/15/2024 (Prerefunded 5/15/2018) | | | 325,000 | | | | 325,387 | |
| Illinois Finance Authority Rev. (Resurrection Health Care Corp.), AGM, 5%, 5/15/2024 (Prerefunded 5/15/2018) | | | 4,675,000 | | | | 4,680,563 | |
| Illinois Finance Authority Rev. (Roosevelt University Project), 5.25%, 4/01/2019 | | | 570,000 | | | | 578,362 | |
| Illinois Finance Authority Rev. (Silver Cross Hospital & Medical Centers), 6.75%, 8/15/2021 (Prerefunded 8/15/2019) | | | 830,000 | | | | 870,828 | |
| Illinois Finance Authority Rev. (Silver Cross Hospital & Medical Centers), “C”, 5%, 8/15/2021 | | | 1,000,000 | | | | 1,066,950 | |
| Illinois Finance Authority Rev. (Southern Illinois Healthcare Enterprises, Inc.), “C”, 5%, 3/01/2025 | | | 750,000 | | | | 848,917 | |
| Illinois Finance Authority Rev. (Southern Illinois Healthcare Enterprises, Inc.), “C”, 5%, 3/01/2026 | | | 750,000 | | | | 857,332 | |
| Illinois Finance Authority Rev. (Southern Illinois Healthcare Enterprises, Inc.), “C”, 5%, 3/01/2027 | | | 1,000,000 | | | | 1,151,590 | |
| Illinois Finance Authority Rev., Clean Water Initiative Revolving Fund, 5%, 1/01/2019 | | | 1,000,000 | | | | 1,021,070 | |
23
Portfolio of Investments – continued
| | | | | | | | |
| Issuer | | Shares/Par | | | Value ($) | |
| Municipal Bonds - continued | | | | | | | | |
| Illinois - continued | | | | | | | | |
| Illinois Railsplitter Tobacco Settlement Authority Rev., 5%, 6/01/2023 | | $ | 2,500,000 | | | $ | 2,758,725 | |
| Illinois Railsplitter Tobacco Settlement Authority Rev., 5.5%, 6/01/2023 (Prerefunded 6/01/2021) | | | 1,605,000 | | | | 1,765,420 | |
| Illinois Railsplitter Tobacco Settlement Authority Rev., 6%, 6/01/2028 (Prerefunded 6/01/2021) | | | 1,135,000 | | | | 1,265,275 | |
| Illinois Sports Facilities Authority, AAC, 5.5%, 6/15/2030 | | | 705,000 | | | | 706,206 | |
| Illinois Sports Facilities Authority, State Tax Supported Refunding Rev., AGM, 5%, 6/15/2027 | | | 945,000 | | | | 1,019,201 | |
| Illinois Toll Highway Authority Rev., “B”, 5%, 12/01/2018 | | | 6,000,000 | | | | 6,109,260 | |
| Kane, Cook & DuPage Counties, IL, School District Rev., Capital Appreciation, “B”, ETM, 0%, 1/01/2021 | | | 3,230,000 | | | | 3,043,920 | |
| Kane, Cook & DuPage Counties, IL, School District Rev., Capital Appreciation, “B”, Unrefunded, 0%, 1/01/2021 | | | 4,215,000 | | | | 3,901,741 | |
| Madison County, IL, Edwardsville Community Unit School District #007, BAM, 4%, 12/01/2020 | | | 785,000 | | | | 812,444 | |
| Madison County, IL, Edwardsville Community Unit School District #007, BAM, 5%, 12/01/2028 | | | 450,000 | | | | 493,335 | |
| Madison County, IL, Edwardsville Community Unit School District #007, BAM, 5%, 12/01/2029 | | | 465,000 | | | | 508,487 | |
| Metropolitan Pier & Exposition Authority Rev. (McCormick Place), “A”, Capital Appreciation, AGM, 0%, 6/15/2026 | | | 1,360,000 | | | | 993,099 | |
| Metropolitan Pier & Exposition Authority, Dedicated State Tax Rev. (McCormick Place), NATL, 5.5%, 6/15/2029 | | | 2,935,000 | | | | 3,257,644 | |
| Metropolitan Pier & Exposition Authority, Dedicated State Tax Rev. Capital Appreciation, 0%, 6/15/2018 | | | 215,000 | | | | 214,209 | |
| Metropolitan Pier & Exposition Authority, Dedicated State Tax Rev. Capital Appreciation, ETM, NATL, 0%, 6/15/2018 | | | 7,180,000 | | | | 7,164,060 | |
| Quad Cities, IL, Regional Economic Development Authority Rev. (Augustana College), 3%, 10/01/2018 | | | 620,000 | | | | 622,226 | |
| Quad Cities, IL, Regional Economic Development Authority Rev. (Augustana College), 4%, 10/01/2020 | | | 500,000 | | | | 515,790 | |
| Romeoville, IL, Rev. (Lewis University Project), 5%, 10/01/2019 | | | 475,000 | | | | 493,273 | |
| Romeoville, IL, Rev. (Lewis University Project), 5%, 10/01/2020 | | | 520,000 | | | | 551,892 | |
| Romeoville, IL, Rev. (Lewis University Project), 5%, 10/01/2022 | | | 500,000 | | | | 548,630 | |
| Southwestern, IL, Development Authority Health Facility Rev. (Hospital Sisters Services, Inc.), “A”, 5%, 2/15/2025 | | | 1,000,000 | | | | 1,144,370 | |
| Southwestern, IL, Development Authority Health Facility Rev. (Hospital Sisters Services, Inc.), “A”, 5%, 2/15/2026 | | | 3,000,000 | | | | 3,474,630 | |
| State of Illinois, 5%, 6/01/2020 | | | 2,250,000 | | | | 2,324,407 | |
| State of Illinois, 5%, 1/01/2022 | | | 500,000 | | | | 511,670 | |
| State of Illinois, 5%, 1/01/2024 | | | 3,000,000 | | | | 3,059,310 | |
| State of Illinois, 5%, 11/01/2027 | | | 8,310,000 | | | | 8,654,366 | |
24
Portfolio of Investments – continued
| | | | | | | | |
| Issuer | | Shares/Par | | | Value ($) | |
| Municipal Bonds - continued | | | | | | | | |
| Illinois - continued | | | | | | | | |
| State of Illinois, AGM, 5%, 2/01/2027 | | $ | 910,000 | | | $ | 995,322 | |
| State of Illinois, BAM, 5%, 8/01/2021 | | | 8,870,000 | | | | 9,468,459 | |
| State of Illinois, NATL, 5%, 4/01/2021 | | | 2,145,000 | | | | 2,149,633 | |
| State of Illinois, NATL, 6%, 11/01/2026 | | | 2,565,000 | | | | 2,884,265 | |
| State of Illinois, “A”, 5%, 11/01/2018 | | | 8,815,000 | | | | 8,914,874 | |
| State of Illinois, “A”, 5%, 12/01/2020 | | | 1,630,000 | | | | 1,696,325 | |
| State of Illinois, “A”, 4%, 1/01/2025 | | | 1,775,000 | | | | 1,738,311 | |
| State of Illinois, “B”, 5%, 12/01/2020 | | | 900,000 | | | | 936,621 | |
| State of Illinois, “D”, 5%, 11/01/2028 | | | 3,440,000 | | | | 3,566,351 | |
| Will County, IL, Forest Preservation District, 5%, 12/15/2019 | | | 1,250,000 | | | | 1,310,662 | |
| | | | | | | | |
| | | | | | | $ | 222,565,256 | |
| Indiana - 1.4% | | | | | | | | |
| Ball State University Board of Trustees (Student Fee), “R”, 5%, 7/01/2024 | | $ | 1,000,000 | | | $ | 1,136,450 | |
| Indiana Bond Bank Special Program, Gas Rev., “A”, 5.25%, 10/15/2021 | | | 1,000,000 | | | | 1,093,540 | |
| Indiana Economic Development Finance Authority Rev. (Republic Services, Inc. Project), 1.65%, 12/01/2037 (Put Date 6/01/2018) | | | 950,000 | | | | 949,687 | |
| Indiana Economic Development Finance Authority Rev. (Republic Services, Inc. Project), “A”, 1.65%, 5/01/2034 (Put Date 6/01/2018) | | | 3,620,000 | | | | 3,618,805 | |
| Indiana Finance Authority Rev. (Butler University), “A”, 5%, 2/01/2022 | | | 1,000,000 | | | | 1,080,660 | |
| Indiana Finance Authority, Wastewater Utility Rev. (CWA Authority Project), “A”, 5%, 10/01/2019 | | | 335,000 | | | | 349,127 | |
| Indiana Finance Authority, Water Utility Rev. (Citizens Energy Group Project), “B”, 2.95%, 10/01/2022 | | | 5,000,000 | | | | 5,090,350 | |
| Indiana Health Facility Financing Authority Rev. (Ascension Health Subordinate Credit Group), “A-8”, 1.25%, 11/01/2027 (Put Date 5/01/2020) | | | 1,890,000 | | | | 1,852,559 | |
| Knox County, IN, Economic Development Rev. (Good Samaritan Hospital), “A”, 3%, 4/01/2019 | | | 525,000 | | | | 524,990 | |
| Knox County, IN, Economic Development Rev. (Good Samaritan Hospital), “A”, 5%, 4/01/2020 | | | 1,690,000 | | | | 1,748,220 | |
| State of Indiana Finance Authority, Environmental Rev. (Duke Energy Indiana, Inc.), “A-2”, 3.375%, 3/01/2019 | | | 3,000,000 | | | | 3,034,500 | |
| Valparaiso, IN, Exempt Facilities Rev. (Pratt Paper LLC Project), 5.875%, 1/01/2024 | | | 1,400,000 | | | | 1,549,884 | |
| Whiting, IN, Environmental Facilities Rev. (BP Products North America, Inc. Project), “A”, 5%, 3/01/2046 (Put Date 3/01/2023) | | | 3,000,000 | | | | 3,355,110 | |
| | | | | | | | |
| | | | | | | $ | 25,383,882 | |
25
Portfolio of Investments – continued
| | | | | | | | |
| Issuer | | Shares/Par | | | Value ($) | |
| Municipal Bonds - continued | | | | | | | | |
| Iowa - 0.2% | | | | | | | | |
| Iowa Finance Authority, Single Family Mortgage Rev., “A”, FNMA, 4%, 7/01/2047 | | $ | 775,000 | | | $ | 817,021 | |
| Iowa Higher Education Loan Authority Rev., Private College Facilities (Grinnell College Project), 5%, 12/01/2026 | | | 425,000 | | | | 505,865 | |
| Iowa Student Loan Liquidity Corp. Rev., “A-1”, 4.625%, 12/01/2019 | | | 890,000 | | | | 903,893 | |
| Iowa Student Loan Liquidity Corp. Rev., “A-1”, 4.875%, 12/01/2020 | | | 2,395,000 | | | | 2,440,265 | |
| | | | | | | | |
| | | | | | | $ | 4,667,044 | |
| Kansas - 0.3% | | | | | | | | |
| Coffeyville, KS, Electric Utility System Rev. “B”, NATL, 5%, 6/01/2021 | | $ | 1,200,000 | | | $ | 1,280,304 | |
| Coffeyville, KS, Electric Utility System Rev. “B”, NATL, 5%, 6/01/2022 | | | 1,200,000 | | | | 1,298,700 | |
| Coffeyville, KS, Electric Utility System Rev. “B”, NATL, 5%, 6/01/2024 | | | 1,300,000 | | | | 1,435,135 | |
| Wyandotte County/Kansas City, KS, Unified Government Utility System Improvement Rev., “A”, 5%, 9/01/2019 | | | 1,000,000 | | | | 1,041,190 | |
| | | | | | | | |
| | | | | | | $ | 5,055,329 | |
| Kentucky - 1.9% | | | | | | | | |
| City of Owensboro, KY, Electric Light and Power System Rev., 4%, 1/01/2026 | | $ | 2,100,000 | | | $ | 2,251,683 | |
| City of Owensboro, KY, Electric Light and Power System Rev., 4%, 1/01/2027 | | | 1,250,000 | | | | 1,340,762 | |
| Kentucky Economic Development Finance Authority Hospital Rev. (Owensboro Health, Inc.), “A”, 5%, 6/01/2025 | | | 1,750,000 | | | | 1,914,465 | |
| Kentucky Economic Development Finance Authority Hospital Rev. (Owensboro Health, Inc.), “A”, 5%, 6/01/2026 | | | 2,000,000 | | | | 2,202,120 | |
| Kentucky Economic Development Finance Authority Hospital Rev. (Owensboro Health, Inc.), “A”, 5%, 6/01/2027 | | | 2,625,000 | | | | 2,905,297 | |
| Kentucky Economic Development Finance Authority Rev. (Baptist Healthcare System), “A”, 5%, 8/15/2018 | | | 1,000,000 | | | | 1,007,780 | |
| Kentucky Economic Development Finance Authority Rev. (Masonic Home Independent Living II, Inc. - The Meadow Project and Grove Pointe Project), “A”, 2.5%, 5/15/2022 | | | 2,520,000 | | | | 2,514,229 | |
| Kentucky Economic Development Finance Authority Solid Waste Refunding Rev. (Republic Services, Inc.), “A”, 1.65%, 4/01/2031 (Put Date 6/01/2018) | | | 2,000,000 | | | | 2,000,000 | |
| Kentucky Higher Education Student Loan Corp. Rev., “A”, 3%, 6/01/2029 | | | 2,860,000 | | | | 2,872,241 | |
26
Portfolio of Investments – continued
| | | | | | | | |
| Issuer | | Shares/Par | | | Value ($) | |
| Municipal Bonds - continued | | | | | | | | |
| Kentucky - continued | | | | | | | | |
| Kentucky Property & Buildings Commission Rev. (Project Number 100), “A”, 5%, 8/01/2020 | | $ | 5,000,000 | | | $ | 5,297,250 | |
| Louisville & Jefferson County, KY, Metro Government College Improvement Refunding Rev. (Bellarmine University Project), “A”, 4%, 5/01/2026 | | | 1,190,000 | | | | 1,221,952 | |
| Louisville & Jefferson County, KY, Metro Government College Improvement Refunding Rev. (Bellarmine University Project), “A”, 4%, 5/01/2027 | | | 1,105,000 | | | | 1,128,426 | |
| Trimble, KY, Pollution Control Rev. (Louisville Gas & Electric Co.), “B”, 2.55%, 11/01/2027 (Put Date 5/03/2021) | | | 8,000,000 | | | | 7,995,440 | |
| | | | | | | | |
| | | | | | | $ | 34,651,645 | |
| Louisiana - 0.7% | | | | | | | | |
| Louisiana Citizens Property Insurance Corp. Rev., AGM, 5%, 6/01/2021 | | $ | 1,460,000 | | | $ | 1,581,545 | |
| Louisiana Citizens Property Insurance Corp. Rev., AGM, 5%, 6/01/2022 | | | 1,165,000 | | | | 1,286,824 | |
| Louisiana Gas & Fuels Tax Rev., “A-1”, 5%, 5/01/2018 | | | 2,525,000 | | | | 2,525,000 | |
| Louisiana Tobacco Settlement Authority Rev., “2013-A”, 5%, 5/15/2023 | | | 2,160,000 | | | | 2,395,656 | |
| New Orleans, LA, Water Rev., 5%, 12/01/2019 | | | 700,000 | | | | 731,052 | |
| St. Charles Parish, LA, Gulf Zone Opportunity Zone Rev. (Valero Energy Corp.), 4%, 12/01/2040 (Put Date 6/01/2022) | | | 4,335,000 | | | | 4,587,427 | |
| | | | | | | | |
| | | | | | | $ | 13,107,504 | |
| Maine - 0.3% | | | | | | | | |
| Portland, ME, General Airport Rev., 4%, 7/01/2018 | | $ | 440,000 | | | $ | 441,500 | |
| Portland, ME, General Airport Rev., 4%, 7/01/2020 | | | 200,000 | | | | 207,648 | |
| State of Maine, “B”, 5%, 6/01/2020 | | | 5,000,000 | | | | 5,313,600 | |
| | | | | | | | |
| | | | | | | $ | 5,962,748 | |
| Maryland - 1.6% | | | | | | | | |
| Baltimore, MD, Convention Center Hotel Refunding Rev., 5%, 9/01/2024 | | $ | 850,000 | | | $ | 958,808 | |
| Baltimore, MD, Convention Center Hotel Refunding Rev., 5%, 9/01/2026 | | | 2,000,000 | | | | 2,284,920 | |
| Howard County, MD, Special Obligation Bonds (Downtown Columbia Project), “A”, 4%, 2/15/2028 | | | 500,000 | | | | 511,065 | |
| Maryland Department of Housing & Community Development, “D”, 4%, 9/01/2036 | | | 3,000,000 | | | | 3,110,610 | |
| Maryland Economic Development Corp. Adjustable Mode Rev. Refunding (Constellation Energy Group, Inc. Project), “B”, 2.55%, 12/01/2025 (Put Date 6/01/2020) | | | 2,710,000 | | | | 2,703,442 | |
27
Portfolio of Investments – continued
| | | | | | | | |
| Issuer | | Shares/Par | | | Value ($) | |
| Municipal Bonds - continued | | | | | | | | |
| Maryland - continued | | | | | | | | |
| Maryland Economic Development Corp., Student Housing Rev. (University of Maryland College Park), AGM, 4%, 6/01/2024 | | $ | 1,350,000 | | | $ | 1,453,275 | |
| Maryland Economic Development Corp., Student Housing Rev. (University of Maryland College Park), AGM, 4%, 6/01/2025 | | | 1,600,000 | | | | 1,726,784 | |
| Maryland Economic Development Corp., Student Housing Rev. (University of Maryland College Park), AGM, 4%, 6/01/2026 | | | 650,000 | | | | 703,599 | |
| Prince George’s County, MD, Public Improvement, “A”, 5%, 9/15/2024 | | | 7,000,000 | | | | 8,073,310 | |
| Rockville, MD, Mayor & Council Economic Development Rev. (Ingleside at King Farm Project), “C-3”, 2.5%, 11/01/2024 | | | 630,000 | | | | 603,238 | |
| University System of Maryland, Auxiliary Facility & Tuition Rev., “D”, 5%, 10/01/2022 | | | 1,000,000 | | | | 1,118,490 | |
| Washington Suburban Sanitary District, MD, Consolidated Public Improvement, 5%, 6/01/2021 | | | 5,500,000 | | | | 5,983,615 | |
| | | | | | | | |
| | | | | | | $ | 29,231,156 | |
| Massachusetts - 3.1% | | | | | | | | |
| Commonwealth of Massachusetts, General Obligation, “B”, 5%, 8/01/2021 | | $ | 6,185,000 | | | $ | 6,749,072 | |
| Massachusetts Development Finance Agency Rev. (Partners Healthcare System), “S”, 5%, 7/01/2022 | | | 2,510,000 | | | | 2,779,649 | |
| Massachusetts Development Finance Agency Rev. (Partners Healthcare System), “S”, 5%, 7/01/2023 | | | 1,400,000 | | | | 1,575,028 | |
| Massachusetts Development Finance Agency Rev. (Sabis International Charter School Issue), 4%, 4/15/2020 | | | 45,000 | | | | 46,027 | |
| Massachusetts Development Finance Agency Rev. (Sabis International Charter School Issue), 5%, 4/15/2025 | | | 145,000 | | | | 160,106 | |
| Massachusetts Development Finance Agency Rev. (Simmons College), “H”, SYNCORA, 5.25%, 10/01/2018 | | | 1,485,000 | | | | 1,506,622 | |
| Massachusetts Development Finance Agency Rev. (Simmons College), “H”, SYNCORA, 5.25%, 10/01/2019 | | | 1,605,000 | | | | 1,681,238 | |
| Massachusetts Development Finance Agency Rev. (Suffolk University), 5%, 7/01/2025 | | | 1,500,000 | | | | 1,709,655 | |
| Massachusetts Development Finance Agency Rev. (Suffolk University), 5%, 7/01/2026 | | | 1,750,000 | | | | 2,001,703 | |
| Massachusetts Development Finance Agency Rev. (Suffolk University), 5%, 7/01/2027 | | | 2,000,000 | | | | 2,294,160 | |
| Massachusetts Development Finance Agency Rev. (UMass Memorial Health Care Obligated Group), “I”, 5%, 7/01/2024 | | | 1,000,000 | | | | 1,118,910 | |
| Massachusetts Development Finance Agency, Solid Waste Disposal Rev. (Dominion Energy Brayton), 5.75%, 12/01/2042 (Prerefunded 5/01/2019) | | | 220,000 | | | | 228,327 | |
28
Portfolio of Investments – continued
| | | | | | | | |
| Issuer | | Shares/Par | | | Value ($) | |
| Municipal Bonds - continued | | | | | | | | |
| Massachusetts - continued | | | | | | | | |
| Massachusetts Educational Financing Authority Education Loan Rev., “A”, 5%, 1/01/2021 | | $ | 5,500,000 | | | $ | 5,825,765 | |
| Massachusetts Educational Financing Authority Rev., “J”, 4.75%, 7/01/2019 | | | 1,235,000 | | | | 1,269,518 | |
| Massachusetts Educational Financing Authority Rev., “J”, 5%, 7/01/2020 | | | 4,400,000 | | | | 4,629,196 | |
| Massachusetts Educational Financing Authority, Education Loan Rev., “I”, 5%, 1/01/2025 | | | 3,450,000 | | | | 3,808,973 | |
| Massachusetts Educational Financing Authority, Education Loan Rev., “J”, 5%, 7/01/2018 | | | 1,085,000 | | | | 1,089,893 | |
| Massachusetts Educational Financing Authority, Education Loan Rev., “J”, 3.5%, 7/01/2033 | | | 5,165,000 | | | | 5,051,628 | |
| Massachusetts Educational Financing Authority, Education Loan Rev., “K”, 3.625%, 7/01/2032 | | | 3,585,000 | | | | 3,575,034 | |
| Massachusetts School Building Authority, Senior Dedicated Sales Tax Rev., “A”, 5%, 8/15/2022 | | | 8,405,000 | | | | 9,380,568 | |
| | | | | | | | |
| | | | | | | $ | 56,481,072 | |
| Michigan - 2.5% | | | | | | | | |
| Detroit, MI, Sewage Disposal System Rev., Senior Lien, “B”, NATL, 5.25%, 7/01/2022 | | $ | 3,000,000 | | | $ | 3,008,490 | |
| Michigan Finance Authority (City of Detroit Financial Recovery Income Tax Rev.), “F”, 3.875%, 10/01/2023 | | | 540,000 | | | | 551,502 | |
| Michigan Finance Authority (City of Detroit Financial Recovery Income Tax Rev.), “F”, 4%, 10/01/2024 | | | 675,000 | | | | 700,906 | |
| Michigan Finance Authority Hospital Refunding Rev. (Trinity Health Credit Group), 5%, 12/01/2022 | | | 1,250,000 | | | | 1,388,437 | |
| Michigan Finance Authority Hospital Refunding Rev. (Trinity Health Credit Group), 5%, 12/01/2023 | | | 1,500,000 | | | | 1,690,830 | |
| Michigan Finance Authority Rev. (Unemployment Obligation Assessment), “B”, 5%, 7/01/2020 | | | 9,000,000 | | | | 9,333,180 | |
| Michigan Finance Authority, Detroit Water & Sewerage Department, Sewage Disposal System Rev., “C”, 5%, 7/01/2026 | | | 1,000,000 | | | | 1,115,060 | |
| Michigan Finance Authority, Detroit Water & Sewerage Department, Sewage Disposal System Rev., “C-7”, NATL, 5%, 7/01/2019 | | | 1,000,000 | | | | 1,031,040 | |
| Michigan Finance Authority, Detroit Water & Sewerage Department, Sewage Disposal System Rev., “C-7”, NATL, 5%, 7/01/2020 | | | 1,500,000 | | | | 1,584,315 | |
| Michigan Finance Authority, Detroit Water & Sewerage Department, Sewage Disposal System Rev., “C-7”, NATL, 5%, 7/01/2021 | | | 1,000,000 | | | | 1,077,460 | |
29
Portfolio of Investments – continued
| | | | | | | | |
| Issuer | | Shares/Par | | | Value ($) | |
| Municipal Bonds - continued | | | | | | | | |
| Michigan - continued | | | | | | | | |
| Michigan Finance Authority, Detroit Water & Sewerage Department, Sewage Disposal System Rev., “D-1”, 5%, 7/01/2021 | | $ | 400,000 | | | $ | 432,000 | |
| Michigan Finance Authority, Detroit Water & Sewerage Department, Water System Rev., “D-1”, AGM, 5%, 7/01/2020 | | | 1,500,000 | | | | 1,587,255 | |
| Michigan Finance Authority, Detroit Water & Sewerage Department, Water System Rev., “D-1”, AGM, 5%, 7/01/2021 | | | 3,500,000 | | | | 3,781,120 | |
| Michigan Strategic Fund Ltd. Obligation Rev. (Detroit Edison Co.), 5.625%, 7/01/2020 | | | 1,000,000 | | | | 1,068,890 | |
| Regents of the University of Michigan General Rev., “A”, 5%, 4/01/2023 | | | 3,000,000 | | | | 3,389,160 | |
| Regents of the University of Michigan General Rev., “A”, 5%, 4/01/2024 | | | 3,250,000 | | | | 3,732,560 | |
| Regents of the University of Michigan General Rev., “A”, 5%, 4/01/2025 | | | 5,000,000 | | | | 5,837,400 | |
| Royal Oak, MI, Hospital Finance Authority Rev. (William Beaumont Hospital), “D”, 5%, 9/01/2021 | | | 2,460,000 | | | | 2,679,137 | |
| State of Michigan, 5%, 11/15/2018 | | | 1,000,000 | | | | 1,017,260 | |
| Wayne County, MI, Airport Authority Rev. (Detroit Metropolitan Wayne County Airport), “D”, 5%, 12/01/2024 | | | 250,000 | | | | 282,038 | |
| Wayne County, MI, Airport Authority Rev. (Detroit Metropolitan Wayne County Airport), “D”, 5%, 12/01/2025 | | | 350,000 | | | | 400,201 | |
| Wayne County, MI, Airport Authority Rev. (Detroit Metropolitan Wayne County Airport), “G”, 5%, 12/01/2023 | | | 400,000 | | | | 447,576 | |
| | | | | | | | |
| | | | | | | $ | 46,135,817 | |
| Minnesota - 1.1% | | | | | | | | |
| Minneapolis-St. Paul, MN, Metropolitan Airports Commission, Senior Airport Rev., “C”, 5%, 1/01/2025 | | $ | 250,000 | | | $ | 288,470 | |
| Minneapolis-St. Paul, MN, Metropolitan Airports Commission, Senior Airport Rev., “C”, 5%, 1/01/2026 | | | 200,000 | | | | 233,910 | |
| Minneapolis-St. Paul, MN, Metropolitan Airports Commission, Subordinate Airport Rev., “B”, 5%, 1/01/2020 | | | 1,750,000 | | | | 1,831,340 | |
| Minneapolis-St. Paul, MN, Metropolitan Airports Commission, Subordinate Airport Rev., “B”, 5%, 1/01/2021 | | | 2,000,000 | | | | 2,140,300 | |
| Minnesota Public Facilities Authority, Revolving Fund Rev., “C”, 5%, 3/01/2019 | | | 9,215,000 | | | | 9,462,976 | |
| State of Minnesota, “B”, 5%, 8/01/2021 | | | 5,000,000 | | | | 5,456,000 | |
| | | | | | | | |
| | | | | | | $ | 19,412,996 | |
| Mississippi - 1.9% | | | | | | | | |
| City of Jackson, MS, Water & Sewer System Rev., BAM, 4%, 9/01/2018 | | $ | 400,000 | | | $ | 402,368 | |
30
Portfolio of Investments – continued
| | | | | | | | |
| Issuer | | Shares/Par | | | Value ($) | |
| Municipal Bonds - continued | | | | | | | | |
| Mississippi - continued | | | | | | | | |
| City of Jackson, MS, Water & Sewer System Rev., BAM, 4%, 9/01/2020 | | $ | 625,000 | | | $ | 644,500 | |
| City of Jackson, MS, Water & Sewer System Rev., BAM, 4%, 9/01/2019 | | | 700,000 | | | | 713,825 | |
| Gulfport, MS, Hospital Facilities Rev. (Memorial Hospital at Gulfport Project), 5%, 7/01/2024 | | | 2,065,000 | | | | 2,268,919 | |
| Gulfport, MS, Hospital Facilities Rev. (Memorial Hospital at Gulfport Project), 5%, 7/01/2025 | | | 3,590,000 | | | | 3,978,797 | |
| Gulfport, MS, Hospital Facilities Rev. (Memorial Hospital at Gulfport Project), 5%, 7/01/2026 | | | 2,485,000 | | | | 2,771,893 | |
| Gulfport, MS, Hospital Facilities Rev. (Memorial Hospital at Gulfport Project), 5%, 7/01/2027 | | | 1,395,000 | | | | 1,541,363 | |
| Mississippi Development Bank Special Obligation (Magnolia Regional Health Center Project), “A”, 5%, 10/01/2020 | | | 660,000 | | | | 684,255 | |
| Mississippi Development Bank Special Obligation (Magnolia Regional Health Center Project), “A”, 5.5%, 10/01/2021 | | | 1,165,000 | | | | 1,234,702 | |
| Mississippi Development Bank Special Obligation (Magnolia Regional Health Center Project), “A”, 5.5%, 10/01/2022 | | | 585,000 | | | | 613,103 | |
| Mississippi Development Bank Special Obligation (Magnolia Regional Health Center Project), “A”, 6%, 10/01/2023 | | | 700,000 | | | | 738,976 | |
| Mississippi Development Bank Special Obligation (Marshall County Industrial Development Authority Mississippi Highway Construction Project), 5%, 1/01/2021 | | | 1,685,000 | | | | 1,803,203 | |
| Mississippi Development Bank Special Obligation (Municipal Energy Agency Power Supply Project), “A”, AGM, 5%, 3/01/2023 | | | 1,000,000 | | | | 1,101,570 | |
| Mississippi Development Bank, Special Obligation Refunding (Hinds Community College District), AGM, 4%, 10/01/2028 | | | 1,400,000 | | | | 1,473,556 | |
| Mississippi Hospital Equipment & Facilities Authority Rev. (Baptist Memorial Healthcare), “A”, 5%, 9/01/2022 | | | 7,000,000 | | | | 7,599,900 | |
| Mississippi Hospital Equipment & Facilities Authority Rev. (Baptist Memorial Healthcare), “B-2”, 2.05%, 9/01/2022 (Put Date 7/11/2018) | | | 6,500,000 | | | | 6,496,100 | |
| State of Mississippi, “B”, 5%, 12/01/2025 | | | 415,000 | | | | 484,986 | |
| | | | | | | | |
| | | | | | | $ | 34,552,016 | |
| Missouri - 0.6% | | | | | | | | |
| Grundy County, MO, Industrial Development Authority Health Facilities Rev. (Wright Memorial Hospital), 6.125%, 9/01/2025 | | $ | 435,000 | | | $ | 445,470 | |
| Missouri Health & Educational Facilities Authority Rev. (A.T. Still University of Health Services), 4%, 10/01/2018 | | | 675,000 | | | | 680,690 | |
| Missouri Health & Educational Facilities Authority Rev. (Lutheran Senior Service Projects), “A”, 5%, 2/01/2025 | | | 215,000 | | | | 238,859 | |
31
Portfolio of Investments – continued
| | | | | | | | |
| Issuer | | Shares/Par | | | Value ($) | |
| Municipal Bonds - continued | | | | | | | | |
| Missouri - continued | | | | | | | | |
| Missouri Health & Educational Facilities Authority Rev. (Lutheran Senior Services Projects), “A”, 4%, 2/01/2020 | | $ | 535,000 | | | $ | 548,434 | |
| Missouri Health & Educational Facilities Authority Rev. (Lutheran Senior Services Projects), “A”, 5%, 2/01/2021 | | | 565,000 | | | | 599,166 | |
| Missouri Health & Educational Facilities Authority Rev. (Lutheran Senior Services Projects), “A”, 5%, 2/01/2022 | | | 550,000 | | | | 591,926 | |
| Missouri Health & Educational Facilities Authority Rev. (St. Louis College of Pharmacy), 5%, 5/01/2018 | | | 400,000 | | | | 400,000 | |
| Missouri Health & Educational Facilities Authority Rev. (St. Louis College of Pharmacy), 5%, 5/01/2019 | | | 450,000 | | | | 465,214 | |
| Missouri Housing Development Commission, Single Family Mortgage Rev. (Special Home Ownership Loan Program), “B”, GNMA, 4%, 11/01/2040 | | | 905,000 | | | | 936,775 | |
| St. Louis County, MO, Industrial Development Authority Rev., (Friendship Village Sunset Hills), “B”, 2.85%, 9/01/2018 | | | 1,500,000 | | | | 1,507,170 | |
| University of Missouri Curators Facilities Rev, “A”, 5%, 11/01/2019 | | | 5,000,000 | | | | 5,229,250 | |
| | | | | | | | |
| | | | | | | $ | 11,642,954 | |
| Nebraska - 0.7% | | | | | | | | |
| Central Plains Energy Project, NE, Gas Project Refunding Rev. (Project No.3), “A”, 5%, 9/01/2028 | | $ | 5,000,000 | | | $ | 5,734,000 | |
| Central Plains Energy Project, NE, Gas Project Rev. (Project No.1), “A”, 5.25%, 12/01/2018 | | | 2,345,000 | | | | 2,387,492 | |
| Nebraska Central Plains Energy Project, Gas Project Rev., 5%, 9/01/2020 | | | 1,710,000 | | | | 1,815,336 | |
| Nebraska Central Plains Energy Project, Gas Project Rev., 5%, 9/01/2021 | | | 2,000,000 | | | | 2,163,420 | |
| Nebraska Investment Finance Authority, Single Family Housing Rev., “A”, 3%, 3/01/2044 | | | 570,000 | | | | 573,836 | |
| | | | | | | | |
| | | | | | | $ | 12,674,084 | |
| Nevada - 0.1% | | | | | | | | |
| Director of the State of Nevada Department of Business & Industry Rev. (Republic Services, Inc.), 5.625%, 12/01/2026 (Put Date 6/01/2018) | | $ | 1,950,000 | | | $ | 1,955,948 | |
| | |
| New Hampshire - 0.3% | | | | | | | | |
| New Hampshire Health & Educational Facilities Authority Rev. (Memorial Hospital), 5.25%, 6/01/2026 | | $ | 4,405,000 | | | $ | 4,787,839 | |
| | |
| New Jersey - 6.6% | | | | | | | | |
| Atlantic City, NJ, Tax Appeal Refunding Rev., “A”, BAM, 5%, 3/01/2024 | | $ | 345,000 | | | $ | 380,866 | |
32
Portfolio of Investments – continued
| | | | | | | | |
| Issuer | | Shares/Par | | | Value ($) | |
| Municipal Bonds - continued | | | | | | | | |
| New Jersey - continued | | | | | | | | |
| Atlantic City, NJ, Tax Appeal Refunding Rev., “A”, BAM, 5%, 3/01/2027 | | $ | 200,000 | | | $ | 227,494 | |
| City of Trenton, NJ, General Obligation Refunding , AGM, 4%, 7/15/2022 | | | 1,325,000 | | | | 1,389,740 | |
| City of Trenton, NJ, General Obligation Refunding , AGM, 4%, 7/15/2023 | | | 1,000,000 | | | | 1,053,230 | |
| New Jersey Building Authority, State Building Rev. Unrefunded Balance, “A”, BAM, 5%, 6/15/2025 | | | 1,205,000 | | | | 1,351,853 | |
| New Jersey Building Authority, State Building Rev. Unrefunded Balance, “A”, BAM, 5%, 6/15/2026 | | | 900,000 | | | | 1,019,817 | |
| New Jersey Building Authority, State Building Rev., “A”, ETM, BAM, 5%, 6/15/2025 | | | 795,000 | | | | 924,426 | |
| New Jersey Building Authority, State Building Rev., “A”, ETM, BAM, 5%, 6/15/2026 | | | 600,000 | | | | 706,698 | |
| New Jersey Casino Reinvestment Development Authority, Luxury Tax Rev., 5%, 11/01/2018 | | | 1,000,000 | | | | 1,013,470 | |
| New Jersey Casino Reinvestment Development Authority, Luxury Tax Rev., 5%, 11/01/2020 | | | 1,000,000 | | | | 1,060,160 | |
| New Jersey Casino Reinvestment Development Authority, Luxury Tax Rev., 5%, 11/01/2021 | | | 2,465,000 | | | | 2,662,397 | |
| New Jersey Casino Reinvestment Development Authority, Luxury Tax Rev., AGM, 5%, 11/01/2024 | | | 1,000,000 | | | | 1,096,240 | |
| New Jersey Economic Development Authority Refunding Rev. (Provident Group - Montclair Properties LLC - Montclair State University Student Housing Project), ASSD GTY, 5%, 6/01/2025 | | | 1,000,000 | | | | 1,128,070 | |
| New Jersey Economic Development Authority Refunding Rev. (Provident Group - Montclair Properties LLC - Montclair State University Student Housing Project), ASSD GTY, 5%, 6/01/2026 | | | 1,000,000 | | | | 1,140,240 | |
| New Jersey Economic Development Authority Rev., 5%, 6/15/2018 | | | 4,000,000 | | | | 4,013,480 | |
| New Jersey Economic Development Authority Rev. (Provident Group - Rowan Properties LLC - Rowan University Student Housing Project), “A”, 5%, 1/01/2021 | | | 95,000 | | | | 100,526 | |
| New Jersey Economic Development Authority Rev. (Provident Group - Rowan Properties LLC - Rowan University Student Housing Project), “A”, 5%, 1/01/2022 | | | 560,000 | | | | 599,570 | |
| New Jersey Economic Development Authority Rev. (Provident Group - Rowan Properties LLC - Rowan University Student Housing Project), “A”, 5%, 1/01/2023 | | | 640,000 | | | | 695,008 | |
| New Jersey Economic Development Authority Rev. (The Goethals Bridge Replacement Project), 5%, 7/01/2020 | | | 500,000 | | | | 529,195 | |
| New Jersey Economic Development Authority Rev. (The Goethals Bridge Replacement Project), 5%, 1/01/2021 | | | 300,000 | | | | 320,001 | |
33
Portfolio of Investments – continued
| | | | | | | | |
| Issuer | | Shares/Par | | | Value ($) | |
| Municipal Bonds - continued | | | | | | | | |
| New Jersey - continued | | | | | | | | |
| New Jersey Economic Development Authority Rev. (The Goethals Bridge Replacement Project), 5%, 7/01/2021 | | $ | 425,000 | | | $ | 458,057 | |
| New Jersey Economic Development Authority Rev., School Facilities Construction, “DDD”, 5%, 6/15/2025 | | | 1,610,000 | | | | 1,747,220 | |
| New Jersey Economic Development Authority Rev., School Facilities Construction, “DDD”, 5%, 6/15/2026 | | | 2,000,000 | | | | 2,180,840 | |
| New Jersey Economic Development Authority Rev., School Facilities Construction, “DDD”, 5%, 6/15/2027 | | | 1,500,000 | | | | 1,642,410 | |
| New Jersey Economic Development Authority Rev., School Facilities Construction, “DDD”, 5%, 6/15/2028 | | | 3,000,000 | | | | 3,272,730 | |
| New Jersey Economic Development Authority, Special Facilities Rev. (Continental Airlines, Inc.), 4.875%, 9/15/2019 | | | 495,000 | | | | 506,281 | |
| New Jersey Economic Development Motor Vehicle Surcharges Subordinate Refunding Rev., “A”, 3.125%, 7/01/2029 | | | 1,115,000 | | | | 1,083,646 | |
| New Jersey Economic Development Motor Vehicle Surcharges Subordinate Refunding Rev., “A”, BAM, 5%, 7/01/2027 | | | 8,495,000 | | | | 9,671,897 | |
| New Jersey Economic Development Motor Vehicle Surcharges Subordinate Refunding Rev., “A”, BAM, 5%, 7/01/2028 | | | 2,425,000 | | | | 2,752,714 | |
| New Jersey Health Care Facilities, Financing Authority Rev. (University Hospital), “A”, AGM, 5%, 7/01/2023 | | | 1,615,000 | | | | 1,791,229 | |
| New Jersey Health Care Facilities, Financing Authority Rev. (University Hospital), “A”, AGM, 5%, 7/01/2024 | | | 2,150,000 | | | | 2,412,106 | |
| New Jersey Health Care Facilities, Financing Authority Rev. (University Hospital), “A”, AGM, 5%, 7/01/2026 | | | 1,420,000 | | | | 1,618,488 | |
| New Jersey Health Care Facilities, Financing Authority, State Contract Refunding Bonds, (Hospital Asset Transformation Program), 5%, 10/01/2027 | | | 2,000,000 | | | | 2,203,360 | |
| New Jersey Higher Education Student Assistance Authority, Student Loan Rev., “1A”, 2.75%, 12/01/2027 | | | 4,600,000 | | | | 4,456,664 | |
| New Jersey Higher Education Student Assistance Authority, Student Loan Rev., “1A”, 3.5%, 12/01/2029 | | | 2,345,000 | | | | 2,347,814 | |
| New Jersey Higher Education Student Assistance Authority, Student Loan Rev., “1B”, 2.95%, 12/01/2028 | | | 8,270,000 | | | | 8,151,987 | |
| New Jersey Tobacco Settlement Financing Corp., “A”, 5%, 6/01/2023 | | | 1,750,000 | | | | 1,936,358 | |
| New Jersey Tobacco Settlement Financing Corp., “B”, 3.2%, 6/01/2027 | | | 11,000,000 | | | | 10,974,040 | |
| New Jersey Transportation Trust Fund Authority, “B”, AAC, 5.5%, 9/01/2026 | | | 1,985,000 | | | | 2,310,143 | |
| New Jersey Transportation Trust Fund Authority, “D”, 5%, 12/15/2018 | | | 2,500,000 | | | | 2,543,550 | |
| New Jersey Transportation Trust Fund Authority, Federal Highway Reimbursement Rev., “A-1”, 5%, 6/15/2030 | | | 6,415,000 | | | | 6,434,373 | |
34
Portfolio of Investments – continued
| | | | | | | | |
| Issuer | | Shares/Par | | | Value ($) | |
| Municipal Bonds - continued | | | | | | | | |
| New Jersey - continued | | | | | | | | |
| New Jersey Transportation Trust Fund Authority, Federal Highway Reimbursement Rev., “A-1”, 5%, 6/15/2031 | | $ | 5,135,000 | | | $ | 5,150,456 | |
| New Jersey Transportation Trust Fund Authority, Federal Highway Reimbursement Rev., “A-2”, 5%, 6/15/2020 | | | 5,000,000 | | | | 5,232,050 | |
| New Jersey Transportation Trust Fund Authority, Transportation Systems, “B”, AAC, 5.25%, 12/15/2023 | | | 155,000 | | | | 172,737 | |
| New Jersey Transportation Trust Fund Authority, Transportation Systems, “B”, NATL, 5.5%, 12/15/2020 | | | 1,910,000 | | | | 2,045,820 | |
| New Jersey Transportation Trust Fund Authority, Transportation Systems, “B”, NATL, 5.5%, 12/15/2021 | | | 5,000,000 | | | | 5,450,650 | |
| Newark, NJ, Housing Authority Rev. (South Ward Police Facility), AGM, 5%, 12/01/2024 | | | 1,440,000 | | | | 1,609,877 | |
| Newark, NJ, Housing Authority Rev. (South Ward Police Facility), AGM, 5%, 12/01/2025 | | | 1,850,000 | | | | 2,093,812 | |
| Newark, NJ, Housing Authority Rev. (South Ward Police Facility), AGM, 5%, 12/01/2026 | | | 1,725,000 | | | | 1,968,829 | |
| North Hudson, NJ, Sewerage Authority, Gross Rev. Lease Certificates, “A”, 4%, 6/01/2018 | | | 2,250,000 | | | | 2,253,757 | |
| North Hudson, NJ, Sewerage Authority, Gross Rev. Lease Certificates, “A”, ETM, 5%, 6/01/2019 | | | 3,580,000 | | | | 3,696,135 | |
| | | | | | | | |
| | | | | | | $ | 121,582,511 | |
| New Mexico - 0.7% | | | | | | | | |
| New Mexico Finance Authority State Transportation Rev., 5%, 6/15/2018 | | $ | 2,000,000 | | | $ | 2,007,640 | |
| New Mexico Mortgage Finance Authority, Single Family Mortgage Program, “A-1”, FNMA, 4%, 1/01/2049 | | | 1,145,000 | | | | 1,207,597 | |
| New Mexico Municipal Energy Acquisition Authority, Gas Supply Rev., “A”, 5%, 11/01/2039 (Put Date 8/01/2019) | | | 9,315,000 | | | | 9,634,970 | |
| | | | | | | | |
| | | | | | | $ | 12,850,207 | |
| New York - 6.9% | | | | | | | | |
| Build NYC Resource Corp., Solid Waste Disposal Rev. (Pratt Paper New York, Inc. Project), 3.75%, 1/01/2020 | | $ | 770,000 | | | $ | 781,003 | |
| Hempstead, NY, Local Development Corp. Rev. (Adelphi University Project), 5%, 6/01/2022 | | | 1,140,000 | | | | 1,226,777 | |
| Metropolitan Transportation Authority Rev., NY, Anticipation Note, “A-2”, 4%, 8/15/2019 | | | 15,000,000 | | | | 15,431,850 | |
| Nassau County, NY, Local Economic Assistance Corp. Rev. (Catholic Health Services of Long Island Obligated Group Project), 4%, 7/01/2018 | | | 800,000 | | | | 802,432 | |
35
Portfolio of Investments – continued
| | | | | | | | |
| Issuer | | Shares/Par | | | Value ($) | |
| Municipal Bonds - continued | | | | | | | | |
| New York - continued | | | | | | | | |
| Nassau County, NY, Local Economic Assistance Corp. Rev. (Catholic Health Services of Long Island Obligated Group Project), 5%, 7/01/2020 | | $ | 1,000,000 | | | $ | 1,056,430 | |
| New Rochelle, NY, Corp. for Local Development Rev. (Iona College Project), “A”, 5%, 7/01/2021 | | | 200,000 | | | | 212,914 | |
| New Rochelle, NY, Corp. for Local Development Rev. (Iona College Project), “A”, 5%, 7/01/2022 | | | 250,000 | | | | 270,035 | |
| New York Dormitory Authority Rev. (Memorial Sloan-Kettering Cancer), “1”, 5%, 7/01/2027 | | | 3,000,000 | | | | 3,610,740 | |
| New York Dormitory Authority Rev. (Orange Regional Medical Center Obligated Group Rev.), 5%, 12/01/2023 | | | 1,300,000 | | | | 1,420,770 | |
| New York Dormitory Authority Rev. (Orange Regional Medical Center Obligated Group Rev.), 5%, 12/01/2025 | | | 2,400,000 | | | | 2,671,608 | |
| New York Dormitory Authority Rev. (Pace University), “A”, ETM, 4%, 5/01/2018 | | | 55,000 | | | | 55,000 | |
| New York Dormitory Authority Rev., Non-State Supported Debt (Mount Sinai Hospital), “A”, 5%, 7/01/2018 | | | 1,000,000 | | | | 1,005,160 | |
| New York Dormitory Authority Rev., Unrefunded Balance, (Pace University), “A”, 4%, 5/01/2018 | | | 1,945,000 | | | | 1,945,000 | |
| New York Energy Research & Development Authority, Pollution | | | | | | | | |
| Control Rev. (New York Electric & Gas Corp.), “A”, 2.375%, 12/01/2027 (Put Date 5/01/2020) | | | 10,000,000 | | | | 9,989,300 | |
| New York Environmental Facilities Corp. Rev., “C”, 5%, 5/15/2020 | | | 3,395,000 | | | | 3,609,802 | |
| New York Environmental Facilities Corp. Rev., “C”, ETM, 5%, 11/15/2020 | | | 5,000 | | | | 5,369 | |
| New York Environmental Facilities Corp. Rev., Unrefunded Balance, “C”, 5%, 11/15/2020 | | | 2,820,000 | | | | 3,036,153 | |
| New York Thruway Authority General Rev., Junior Indebtedness Obligations, “A”, 5%, 5/01/2019 | | | 2,675,000 | | | | 2,757,871 | |
| New York Thruway Authority, Second General Highway & Bridge Trust Fund, “A-1”, 5%, 4/01/2019 | | | 1,350,000 | | | | 1,389,960 | |
| New York Transportation Development Corp., Special Facilities Rev. (Delta Airlines, Inc. LaGuardia Airport Terminals C&D Redevelopment Project), 5%, 1/01/2026 | | | 15,000,000 | | | | 16,745,400 | |
| New York, NY, 5%, 8/01/2023 | | | 1,435,000 | | | | 1,621,650 | |
| New York, NY, “A-4”, VRDN, 1.75%, 8/01/2038 | | | 8,000,000 | | | | 8,000,000 | |
| New York, NY, “G-3”, VRDN, 1.75%, 4/01/2042 | | | 15,000,000 | | | | 15,000,000 | |
| New York, NY, “G-4”, VRDN, 1.75%, 4/01/2042 | | | 6,000,000 | | | | 6,000,000 | |
| New York, NY, “I”, 5%, 8/01/2022 | | | 7,500,000 | | | | 8,337,150 | |
| New York, NY, City Housing Development Corp., “B1”, 5%, 7/01/2018 | | | 3,250,000 | | | | 3,267,225 | |
36
Portfolio of Investments – continued
| | | | | | | | |
| Issuer | | Shares/Par | | | Value ($) | |
| Municipal Bonds - continued | | | | | | | | |
| New York - continued | | | | | | | | |
| New York, NY, City Housing Development Corp., “B1”, 5%, 7/01/2019 | | $ | 1,250,000 | | | $ | 1,295,100 | |
| Niagara, NY, Area Development Corp. Rev. (Niagara University), “A”, 5%, 5/01/2018 | | | 250,000 | | | | 250,000 | |
| Onondaga, NY, Civic Development Corp. Rev. (St. Joseph’s Hospital Health Center), “A”, ETM, 5%, 7/01/2019 | | | 250,000 | | | | 254,440 | |
| Port Authority of NY & NJ, (170th Series), 5%, 12/01/2019 | | | 1,410,000 | | | | 1,475,918 | |
| Suffolk County, NY, “B”, AGM, 5%, 10/15/2025 | | | 7,000,000 | | | | 8,064,910 | |
| Tobacco Settlement Asset Securitization Corp., NY, “1”, 5%, 6/01/2025 | | | 1,000,000 | | | | 1,139,020 | |
| Tobacco Settlement Asset Securitization Corp., NY, “1”, 5%, 6/01/2026 | | | 2,000,000 | | | | 2,297,460 | |
| Tobacco Settlement Asset Securitization Corp., NY, “1”, 5%, 6/01/2027 | | | 1,500,000 | | | | 1,734,300 | |
| | | | | | | | |
| | | | | | | $ | 126,760,747 | |
| North Carolina - 1.1% | | | | | | | | |
| Charlotte, NC, COP (Convention Facility Project), “A”, 5%, 12/01/2020 | | $ | 4,100,000 | | | $ | 4,404,589 | |
| Durham County, NC, 5%, 4/01/2019 | | | 1,000,000 | | | | 1,029,600 | |
| North Carolina Capital Facilities Finance Agency Student Housing Rev. (The NCA&T University Foundation, LLC Project) , “A”, ASSD GTY, 5%, 6/01/2022 | | | 665,000 | | | | 719,696 | |
| North Carolina Capital Facilities Finance Agency Student Housing Rev. (The NCA&T University Foundation, LLC Project) , “A”, ASSD GTY, 5%, 6/01/2023 | | | 325,000 | | | | 355,092 | |
| North Carolina Capital Facilities Finance Agency Student Housing Rev. (The NCA&T University Foundation, LLC Project) , “A”, ASSD GTY, 5%, 6/01/2024 | | | 700,000 | | | | 773,171 | |
| North Carolina Turnpike Authority, Triangle Expressway System Turnpike Rev. , AGM, 5%, 1/01/2026 | | | 1,500,000 | | | | 1,721,685 | |
| North Carolina Turnpike Authority, Triangle Expressway System Turnpike Rev. , AGM, 5%, 1/01/2027 | | | 4,000,000 | | | | 4,622,720 | |
| Orange County, NC, Public Facilities Co., Limited Obligation, 5%, 10/01/2020 | | | 500,000 | | | | 535,415 | |
| Raleigh Durham, NC, Airport Authority Refunidng Rev., “C”, VRDN, 1.72%, 5/01/2036 | | | 4,550,000 | | | | 4,550,000 | |
| Raleigh Durham, NC, Airport Authority Rev., “A”, 5%, 5/01/2025 | | | 645,000 | | | | 738,570 | |
| Raleigh Durham, NC, Airport Authority Rev., “A”, 5%, 5/01/2026 | | | 1,000,000 | | | | 1,156,660 | |
| | | | | | | | |
| | | | | | | $ | 20,607,198 | |
37
Portfolio of Investments – continued
| | | | | | | | |
| Issuer | | Shares/Par | | | Value ($) | |
| Municipal Bonds - continued | | | | | | | | |
| North Dakota - 0.1% | | | | | | | | |
| Burleigh County, ND, Health Care Rev. (Alexius Medical Center Project), “A”, ETM, 3%, 7/01/2018 | | $ | 1,180,000 | | | $ | 1,182,124 | |
| | |
| Ohio - 2.1% | | | | | | | | |
| Buckeye, OH, Tobacco Settlement Financing Authority Rev., “A-2”, 5.125%, 6/01/2024 | | $ | 3,775,000 | | | $ | 3,712,033 | |
| Cleveland, OH, Airport System Rev., “A”, AGM, 5%, 1/01/2025 | | | 1,250,000 | | | | 1,416,075 | |
| Cleveland-Cuyahoga County, OH, Port Authority Development Rev. (Port of Cleveland Bond Fund), “C”, 5%, 5/15/2021 (Prerefunded 11/15/2020) | | | 375,000 | | | | 400,661 | |
| Cleveland-Cuyahoga County, OH, Port Authority Development Rev. (Port of Cleveland Bond Fund), “C”, 5%, 11/15/2021 (Prerefunded 11/15/2020) | | | 385,000 | | | | 411,346 | |
| Cleveland-Cuyahoga County, OH, Port Authority Development Rev. (Port of Cleveland Bond Fund), “C”, 5%, 11/15/2022 (Prerefunded 11/15/2020) | | | 405,000 | | | | 432,714 | |
| Cleveland-Cuyahoga County, OH, Port Authority Development Rev. (Port of Cleveland Bond Fund), “C”, ETM, 3%, 5/15/2018 | | | 335,000 | | | | 335,127 | |
| Cleveland-Cuyahoga County, OH, Port Authority Development Rev. (Port of Cleveland Bond Fund), “C”, ETM, 3%, 5/15/2019 | | | 345,000 | | | | 348,343 | |
| Cleveland-Cuyahoga County, OH, Port Authority Development | | | | | | | | |
| Rev. (Port of Cleveland Bond Fund), “C”, ETM, 3%, 11/15/2019 | | | 300,000 | | | | 304,014 | |
| Cleveland-Cuyahoga County, OH, Port Authority Development Rev. (Port of Cleveland Bond Fund), “C”, ETM, 4%, 5/15/2020 | | | 360,000 | | | | 372,978 | |
| Cleveland-Cuyahoga County, OH, Port Authority Development | | | | | | | | |
| Rev. (Port of Cleveland Bond Fund), “C”, ETM, 4%, 11/15/2020 | | | 365,000 | | | | 381,024 | |
| Columbus, OH, 5%, 7/01/2022 | | | 2,350,000 | | | | 2,619,310 | |
| Cuyahoga County, OH, Hospital Rev. (The Metrohealth System), 5%, 2/15/2026 | | | 2,000,000 | | | | 2,197,100 | |
| Cuyahoga County, OH, Hospital Rev. (The Metrohealth System), 5%, 2/15/2027 | | | 2,150,000 | | | | 2,373,191 | |
| Ohio Air Quality Development Authority, Facilities Rev. (Pratt Paper LLC Project), 3.75%, 1/15/2028 | | | 115,000 | | | | 113,979 | |
| Ohio Higher Education, “C”, 5%, 8/01/2021 | | | 8,000,000 | | | | 8,721,680 | |
| Ohio Higher Educational Facility Commission Rev. (Xavier University Project), “C”, 5%, 5/01/2023 | | | 625,000 | | | | 685,038 | |
| Ohio Hospital Refunding Rev. (Cleveland Clinic Health System Obligated Group), “A”, 5%, 1/01/2028 | | | 2,000,000 | | | | 2,392,660 | |
| Ohio Tax Exempt Private Activity (Portsmouth Bypass Project), 5%, 12/31/2021 | | | 1,000,000 | | | | 1,086,610 | |
| Ohio Tax Exempt Private Activity (Portsmouth Bypass Project), 5%, 12/31/2022 | | | 775,000 | | | | 855,453 | |
| Ohio Water Development Authority, Water Pollution Control Rev., 5.25%, 6/01/2020 | | | 2,000,000 | | | | 2,137,280 | |
38
Portfolio of Investments – continued
| | | | | | | | |
| Issuer | | Shares/Par | | | Value ($) | |
| Municipal Bonds - continued | | | | | | | | |
| Ohio - continued | | | | | | | | |
| State of Ohio, Major New State Infrastructure Project Rev., 5%, 12/15/2023 | | $ | 6,625,000 | | | $ | 7,525,271 | |
| | | | | | | | |
| | | | | | | $ | 38,821,887 | |
| Oklahoma - 0.3% | | | | | | | | |
| Tulsa, OK, Airport Improvement Trust Rev., “A”, BAM, 5%, 6/01/2020 | | $ | 1,500,000 | | | $ | 1,582,425 | |
| Tulsa, OK, Airport Improvement Trust Rev., “A”, BAM, 5%, 6/01/2021 | | | 700,000 | | | | 751,562 | |
| Tulsa, OK, Airport Improvement Trust Rev., “A”, BAM, 5%, 6/01/2022 | | | 600,000 | | | | 652,728 | |
| Tulsa, OK, Industrial Authority Rev. (University of Tulsa), 5.5%, 10/01/2022 | | | 1,000,000 | | | | 1,042,680 | |
| Tulsa, OK, Industrial Authority, Senior Living Community Rev. (Montereau, Inc.), 5%, 11/15/2025 | | | 800,000 | | | | 890,080 | |
| Tulsa, OK, Industrial Authority, Senior Living Community Rev. (Montereau, Inc.), 5%, 11/15/2026 | | | 500,000 | | | | 559,230 | |
| | | | | | | | |
| | | | | | | $ | 5,478,705 | |
| Oregon - 0.9% | | | | | | | | |
| Forest Grove, OR, Campus Improvement Rev. (Pacific University Project), “A”, 4%, 5/01/2021 | | $ | 350,000 | | | $ | 366,618 | |
| Forest Grove, OR, Campus Improvement Rev. (Pacific University Project), “A”, 5%, 5/01/2023 | | | 500,000 | | | | 556,640 | |
| Lake Oswego, OR, 4%, 6/01/2019 | | | 1,195,000 | | | | 1,223,513 | |
| Lake Oswego, OR, 4%, 6/01/2020 | | | 1,830,000 | | | | 1,907,244 | |
| Lake Oswego, OR, 4%, 6/01/2021 | | | 2,330,000 | | | | 2,465,653 | |
| Oregon Health & Science University Rev., “A”, 5%, 7/01/2018 | | | 785,000 | | | | 789,129 | |
| Port of Portland, OR, International Airport Rev., “24B”, 5%, 7/01/2024 | | | 1,500,000 | | | | 1,703,760 | |
| Port of Portland, OR, International Airport Rev., “24B”, 5%, 7/01/2025 | | | 1,000,000 | | | | 1,152,380 | |
| State of Oregon, “A”, 5%, 5/01/2025 | | | 2,000,000 | | | | 2,330,320 | |
| State of Oregon, “A”, 5%, 5/01/2026 | | | 2,000,000 | | | | 2,360,400 | |
| Washington County, OR, School District, AGM, 5.25%, 6/15/2018 | | | 1,000,000 | | | | 1,004,020 | |
| | | | | | | | |
| | | | | | | $ | 15,859,677 | |
| Pennsylvania - 7.4% | | | | | | | | |
| Allegheny County, PA, Hospital Development Authority Rev. (University of Pittsburgh Medical Center), “A1”, FLR, 1.908% (LIBOR-3mo. + 0.72%), 2/01/2021 | | $ | 985,000 | | | $ | 987,817 | |
| Allentown, PA, Neighborhood Improvement Zone Development Authority Tax Rev. (City Center Refunding Project), 5%, 5/01/2022 | | | 1,000,000 | | | | 1,075,200 | |
39
Portfolio of Investments – continued
| | | | | | | | |
| Issuer | | Shares/Par | | | Value ($) | |
| Municipal Bonds - continued | | | | | | | | |
| Pennsylvania - continued | | | | | | | | |
| Berks County, PA, Industrial Development Authority Health System Rev. (Tower Health Project), 5%, 11/01/2025 | | $ | 1,250,000 | | | $ | 1,422,125 | |
| Berks County, PA, Industrial Development Authority Health System Rev. (Tower Health Project), 5%, 11/01/2027 | | | 1,500,000 | | | | 1,735,590 | |
| Bethlehem Area School District, PA, (Northampton and Lehigh Counties), “A” , 5%, 2/01/2025 | | | 4,575,000 | | | | 5,198,755 | |
| Bethlehem, PA, Water Authority Rev., BAM, 5%, 11/15/2018 | | | 1,000,000 | | | | 1,017,210 | |
| Bethlehem, PA, Water Authority Rev., BAM, 5%, 11/15/2019 | | | 500,000 | | | | 523,585 | |
| Cambria County, PA, ETM, BAM, 4%, 8/01/2019 | | | 900,000 | | | | 923,391 | |
| Cambria County, PA, Unrefunded Balance, BAM, 4%, 8/01/2019 | | | 1,445,000 | | | | 1,471,227 | |
| Capital Region, PA, Water Rev., “A”, BAM, 5%, 7/15/2024 | | | 750,000 | | | | 851,550 | |
| Capital Region, PA, Water Rev., “A”, BAM, 5%, 7/15/2029 | | | 450,000 | | | | 514,994 | |
| Commonwealth of Pennsylvania, AGM, 5%, 9/15/2025 | | | 9,000,000 | | | | 10,303,470 | |
| Commonwealth of Pennsylvania, AGM, 5%, 9/15/2026 | | | 6,035,000 | | | | 6,994,927 | |
| Commonwealth of Pennsylvania, Tobacco Master Settlement Financing Authority Rev., 5%, 6/01/2027 | | | 3,000,000 | | | | 3,427,620 | |
| Cumberland County, PA, Municipal Authority Rev. (Diakon Lutheran Social Ministries Project), 5%, 1/01/2021 | | | 585,000 | | | | 622,598 | |
| Cumberland County, PA, Municipal Authority Rev. (Diakon Lutheran Social Ministries Project), 5%, 1/01/2022 | | | 1,025,000 | | | | 1,110,034 | |
| Cumberland County, PA, Municipal Authority Rev. (Diakon Lutheran Social Ministries Project), 5%, 1/01/2023 | | | 730,000 | | | | 803,088 | |
| Cumberland County, PA, Municipal Authority Rev. (Presbyterian Homes, Inc.), “C”, 4%, 12/01/2026 | | | 1,400,000 | | | | 1,436,008 | |
| Dallas, PA, Municipal Authority, University Rev. (Misericordia University Project), 5%, 5/01/2019 | | | 445,000 | | | | 456,290 | |
| Dallas, PA, Municipal Authority, University Rev. (Misericordia University Project), 5%, 5/01/2020 | | | 500,000 | | | | 523,310 | |
| East Hempfield, PA, Industrial Development Authority Rev. (Willow Valley Communities Project), 5%, 12/01/2025 | | | 500,000 | | | | 568,070 | |
| East Hempfield, PA, Industrial Development Authority Rev. (Willow Valley Communities Project), 5%, 12/01/2023 | | | 300,000 | | | | 334,365 | |
| East Hempfield, PA, Industrial Development Authority Rev. (Willow Valley Communities Project), 5%, 12/01/2024 | | | 600,000 | | | | 674,976 | |
| Lancaster County School District, PA, “B”, AGM, 5%, 6/01/2025 | | | 2,000,000 | | | | 2,284,920 | |
| Lancaster County, PA, Hospital Authority Health Center Rev. (Masonic Villages Project), 5%, 11/01/2021 | | | 300,000 | | | | 326,646 | |
| Lancaster County, PA, Hospital Authority Health Center Rev. (Masonic Villages Project), 5%, 11/01/2022 | | | 320,000 | | | | 354,403 | |
| Lancaster County, PA, Hospital Authority Health Center Rev. (Masonic Villages Project), 5%, 11/01/2024 | | | 700,000 | | | | 797,146 | |
| Lancaster County, PA, Hospital Authority Health Center Rev. (Masonic Villages Project), 5%, 11/01/2025 | | | 265,000 | | | | 301,093 | |
40
Portfolio of Investments – continued
| | | | | | | | |
| Issuer | | Shares/Par | | | Value ($) | |
| Municipal Bonds - continued | | | | | | | | |
| Pennsylvania - continued | | | | | | | | |
| Lehigh County, PA, Water and Sewer Authority Rev. (Allentown Concession), Capital Appreciation, “B”, 0%, 12/01/2021 | | $ | 1,295,000 | | | $ | 1,158,714 | |
| Lehigh County, PA, Water and Sewer Authority Rev. (Allentown Concession), Capital Appreciation, “B”, 0%, 12/01/2022 | | | 1,345,000 | | | | 1,159,834 | |
| Lehigh County, PA, Water and Sewer Authority Rev. (Allentown Concession), Capital Appreciation, “B”, 0%, 12/01/2023 | | | 1,060,000 | | | | 879,652 | |
| Luzerne County, PA, “A”, AGM, 5%, 12/15/2019 | | | 305,000 | | | | 316,685 | |
| Luzerne County, PA, “A”, AGM, 5%, 11/15/2020 | | | 1,355,000 | | | | 1,442,208 | |
| Luzerne County, PA, “A”, AGM, 5%, 11/15/2021 | | | 3,000,000 | | | | 3,253,350 | |
| Luzerne County, PA, “A”, AGM, 5%, 12/15/2021 | | | 445,000 | | | | 483,257 | |
| Luzerne County, PA, “A”, AGM, 5%, 12/15/2023 | | | 400,000 | | | | 445,452 | |
| Luzerne County, PA, “A”, AGM, 5%, 12/15/2024 | | | 410,000 | | | | 458,626 | |
| Luzerne County, PA, “A”, AGM, 5%, 12/15/2026 | | | 370,000 | | | | 418,618 | |
| Luzerne County, PA, “A”, AGM, 5%, 12/15/2029 | | | 655,000 | | | | 738,054 | |
| Luzerne County, PA, “B”, AGM, 5%, 5/15/2020 | | | 2,200,000 | | | | 2,316,578 | |
| Luzerne County, PA, “B”, AGM, 5%, 5/15/2021 | | | 2,055,000 | | | | 2,208,036 | |
| Monroe County, PA, Hospital Authority Rev. (Pocono Medical Center), “A”, 5%, 1/01/2023 (Prerefunded 1/01/2022) | | | 1,225,000 | | | | 1,344,621 | |
| Montgomery County, PA, Industrial Development Authority Health System Rev. (Albert Einstein Healthcare Network Issue), “A”, 5%, 1/15/2021 | | | 2,000,000 | | | | 2,101,960 | |
| Montgomery County, PA, Industrial Development Authority Health System Rev. (Albert Einstein Healthcare Network Issue), “A”, 5%, 1/15/2022 | | | 3,485,000 | | | | 3,706,019 | |
| Montgomery County, PA, Industrial Development Authority Pollution Control Rev. (Peco Energy Company Project), “A”, 2.55%, 6/01/2029 (Put Date 6/01/2020) | | | 880,000 | | | | 877,510 | |
| Pennsylvania Economic Development Finance Authority Rev, Solid Waste Disposal Rev. (Waste Management, Inc. Project), 2%, 8/01/2045 (Put Date 5/01/2018) | | | 13,000,000 | | | | 13,000,000 | |
| Pennsylvania Economic Development Finance Authority Rev, Solid Waste Disposal Rev. (Waste Management, Inc. Project), “A”, 1.7%, 8/01/2037 (Put Date 8/03/2020) | | | 2,000,000 | | | | 1,963,420 | |
| Pennsylvania Economic Development Financing Authority Rev., Solid Waste Refunding (Republic Services, Inc. Project), “A”, 1.75%, 4/01/2019 (Put Date 7/02/2018) | | | 2,550,000 | | | | 2,548,725 | |
| Pennsylvania Economic Development Financing Authority Rev., Solid Waste Refunding (Republic Services, Inc. Project), “B”, 1.65%, 12/01/2030 (Put Date 7/02/2018) | | | 2,100,000 | | | | 2,100,105 | |
| Pennsylvania Economic Development Financing Authority, Exempt Facilities Rev. (Amtrak Project), “A”, 3%, 11/01/2018 | | | 265,000 | | | | 266,383 | |
| Pennsylvania Economic Development Financing Authority, Exempt Facilities Rev. (Amtrak Project), “A”, 5%, 11/01/2019 | | | 1,325,000 | | | | 1,382,346 | |
41
Portfolio of Investments – continued
| | | | | | | | |
| Issuer | | Shares/Par | | | Value ($) | |
| Municipal Bonds - continued | | | | | | | | |
| Pennsylvania - continued | | | | | | | | |
| Pennsylvania Higher Educational Facilities Authority Rev. (Edinboro University Foundation), ETM, 5%, 7/01/2018 | | $ | 1,005,000 | | | $ | 1,010,156 | |
| Philadelphia, PA, Airport Refunding Rev., “B”, 5%, 7/01/2022 | | | 2,955,000 | | | | 3,256,380 | |
| Philadelphia, PA, Airport Refunding Rev., “B”, 5%, 7/01/2023 | | | 2,880,000 | | | | 3,214,829 | |
| Philadelphia, PA, Authority for Industrial Development City Agreement Rev. (Cultural and Commercial Corridors Program), “A”, 5%, 12/01/2024 | | | 5,675,000 | | | | 6,409,515 | |
| Philadelphia, PA, Gas Works Rev. (1998 General Ordinance), “15”, 5%, 8/01/2027 | | | 1,750,000 | | | | 2,030,735 | |
| Philadelphia, PA, School District, “A”, 5%, 9/01/2025 | | | 1,000,000 | | | | 1,116,740 | |
| Philadelphia, PA, School District, “A”, 5%, 9/01/2026 | | | 635,000 | | | | 709,606 | |
| Philadelphia, PA, School District, “A”, 5%, 9/01/2027 | | | 1,850,000 | | | | 2,083,303 | |
| Philadelphia, PA, School District, “F”, 5%, 9/01/2026 | | | 5,000,000 | | | | 5,587,450 | |
| Philadelphia, PA, Water & Wastewater Rev., “A”, 5%, 7/01/2022 | | | 1,510,000 | | | | 1,669,063 | |
| Scranton, PA, School District Rev., FLR, 2.131% (68% of LIBOR-1mo. + 0.85%), 4/01/2031 (Put Date 4/01/2021) | | | 5,675,000 | | | | 5,681,242 | |
| Southcentral, PA, General Authority Hospital Rev. (Hanover Hospital, Inc.), 5%, 12/01/2018 | | | 1,330,000 | | | | 1,354,139 | |
| West Mifflin, PA, Area School District, AGM, 5%, 4/01/2024 | | | 1,250,000 | | | | 1,370,325 | |
| West Mifflin, PA, Area School District, AGM, 5%, 4/01/2025 | | | 1,000,000 | | | | 1,104,950 | |
| West Mifflin, PA, Area School District, AGM, 5%, 4/01/2027 | | | 1,000,000 | | | | 1,114,650 | |
| West Shore, PA, Area Authority Rev. (Messiah Village Project) “A”, 5%, 7/01/2020 | | | 855,000 | | | | 904,359 | |
| West Shore, PA, Area Authority Rev. (Messiah Village Project) “A”, 5%, 7/01/2022 | | | 930,000 | | | | 1,016,741 | |
| West Shore, PA, Area Authority Rev. (Messiah Village Project) “A”, 5%, 7/01/2025 | | | 1,605,000 | | | | 1,787,488 | |
| York County, PA, School of Technology Authority Lease Rev., “A”, BAM, 5%, 2/15/2025 | | | 850,000 | | | | 969,315 | |
| York County, PA, School of Technology Authority Lease Rev., “A”, BAM, 5%, 2/15/2026 | | | 1,000,000 | | | | 1,125,350 | |
| | | | | | | | |
| | | | | | | $ | 135,126,897 | |
| Puerto Rico - 5.7% | | | | | | | | |
| Commonwealth of Puerto Rico Aqueduct & Sewer Authority Rev., “A”, ASSD GTY, 5%, 7/01/2028 | | $ | 1,135,000 | | | $ | 1,137,667 | |
| Commonwealth of Puerto Rico Highway & Transportation Authority Rev., “AA-1”, AGM, 4.95%, 7/01/2026 | | | 1,830,000 | | | | 1,877,068 | |
| Commonwealth of Puerto Rico Highway & Transportation Authority Rev., “BB”, AAC, 5.25%, 7/01/2018 | | | 550,000 | | | | 552,018 | |
| Commonwealth of Puerto Rico Highway & Transportation Authority Rev., “BB”, AGM, 5.25%, 7/01/2022 | | | 4,070,000 | | | | 4,341,510 | |
42
Portfolio of Investments – continued
| | | | | | | | |
| Issuer | | Shares/Par | | | Value ($) | |
| Municipal Bonds - continued | | | | | | | | |
| Puerto Rico - continued | | | | | | | | |
| Commonwealth of Puerto Rico Highway & Transportation Authority Rev., “CC”, AGM, 5.5%, 7/01/2030 | | $ | 2,535,000 | | | $ | 2,872,104 | |
| Commonwealth of Puerto Rico Highway & Transportation Authority Rev., “E”, AGM, 5.5%, 7/01/2020 | | | 3,880,000 | | | | 4,081,605 | |
| Commonwealth of Puerto Rico Highway & Transportation Authority Rev., “E”, AGM, 5.5%, 7/01/2023 | | | 500,000 | | | | 543,150 | |
| Commonwealth of Puerto Rico Highway & Transportation Authority Rev., “L”, NATL, 5.25%, 7/01/2024 | | | 740,000 | | | | 755,547 | |
| Commonwealth of Puerto Rico Highway & Transportation Authority Rev., “N”, AGM, 5.5%, 7/01/2025 | | | 1,740,000 | | | | 1,919,551 | |
| Commonwealth of Puerto Rico Highway & Transportation Authority Rev., “Y”, AGM, 6.25%, 7/01/2021 | | | 3,860,000 | | | | 4,117,076 | |
| Commonwealth of Puerto Rico Highway & Transportation Authority Rev., Capital Appreciation, “A”, AAC, 0%, 7/01/2018 | | | 70,000 | | | | 69,533 | |
| Commonwealth of Puerto Rico Highway & Transportation Authority Rev., Capital Appreciation, “N”, AAC, 0%, 7/01/2019 | | | 350,000 | | | | 333,470 | |
| Commonwealth of Puerto Rico Highway & Transportation Authority Rev., Capital Appreciation, “N”, AAC, 0%, 7/01/2020 | | | 610,000 | | | | 556,350 | |
| Commonwealth of Puerto Rico, “A”, NATL, 5.5%, 7/01/2020 | | | 8,220,000 | | | | 8,515,838 | |
| Commonwealth of Puerto Rico, “A”, NATL, 5.5%, 7/01/2021 | | | 8,765,000 | | | | 9,085,624 | |
| Commonwealth of Puerto Rico, Public Improvement, “A”, AAC, 5.5%, 7/01/2019 | | | 1,265,000 | | | | 1,298,649 | |
| Commonwealth of Puerto Rico, Public Improvement, “A”, ASSD GTY, 3.021%, 7/01/2018 | | | 2,480,000 | | | | 2,482,406 | |
| Commonwealth of Puerto Rico, Public Improvement, “A”, ASSD GTY, 5.5%, 7/01/2029 | | | 1,905,000 | | | | 2,155,393 | |
| Commonwealth of Puerto Rico, Public Improvement, “C”, AGM, 5.25%, 7/01/2027 | | | 200,000 | | | | 201,368 | |
| Commonwealth of Puerto Rico, Public Improvement, “C-7”, NATL, 6%, 7/01/2027 | | | 2,000,000 | | | | 2,003,320 | |
| Puerto Rico Electric Power Authority Rev., “DDD”, AGM, 3.625%, 7/01/2023 | | | 335,000 | | | | 334,598 | |
| Puerto Rico Electric Power Authority Rev., “DDD”, AGM, 5%, 7/01/2023 | | | 1,365,000 | | | | 1,410,536 | |
| Puerto Rico Electric Power Authority Rev., “DDD”, AGM, 3.65%, 7/01/2024 | | | 3,930,000 | | | | 3,908,385 | |
| Puerto Rico Electric Power Authority Rev., “MM”, NATL, 5%, 7/01/2018 | | | 1,005,000 | | | | 1,008,115 | |
| Puerto Rico Electric Power Authority Rev., “MM”, NATL, 5%, 7/01/2020 | | | 40,000 | | | | 41,028 | |
| Puerto Rico Electric Power Authority Rev., “NN”, NATL, 5.25%, 7/01/2021 | | | 5,115,000 | | | | 5,264,614 | |
43
Portfolio of Investments – continued
| | | | | | | | |
| Issuer | | Shares/Par | | | Value ($) | |
| Municipal Bonds - continued | | | | | | | | |
| Puerto Rico - continued | | | | | | | | |
| Puerto Rico Electric Power Authority Rev., “NN”, NATL, 5.25%, 7/01/2022 | | $ | 1,095,000 | | | $ | 1,129,974 | |
| Puerto Rico Electric Power Authority Rev., “NN”, NATL, 5.25%, 7/01/2023 | | | 435,000 | | | | 445,823 | |
| Puerto Rico Electric Power Authority Rev., “PP”, NATL, 5%, 7/01/2024 | | | 110,000 | | | | 110,004 | |
| Puerto Rico Electric Power Authority Rev., “PP”, NATL, 5%, 7/01/2025 | | | 115,000 | | | | 114,995 | |
| Puerto Rico Electric Power Authority Rev., “RR”, NATL, 5%, 7/01/2022 | | | 300,000 | | | | 300,099 | |
| Puerto Rico Electric Power Authority Rev., “RR”, NATL, 5%, 7/01/2023 | | | 370,000 | | | | 370,059 | |
| Puerto Rico Electric Power Authority Rev., “RR”, NATL, 5%, 7/01/2024 | | | 705,000 | | | | 705,028 | |
| Puerto Rico Electric Power Authority Rev., “SS”, NATL, 5%, 7/01/2019 | | | 1,625,000 | | | | 1,627,194 | |
| Puerto Rico Electric Power Authority Rev., “SS”, NATL, 5%, 7/01/2020 | | | 345,000 | | | | 345,324 | |
| Puerto Rico Electric Power Authority Rev., “SS”, NATL, 5%, 7/01/2023 | | | 860,000 | | | | 860,138 | |
| Puerto Rico Electric Power Authority Rev., “TT”, NATL, 5%, 7/01/2024 | | | 530,000 | | | | 530,021 | |
| Puerto Rico Electric Power Authority Rev., “TT”, NATL, 5%, 7/01/2026 | | | 25,000 | | | | 24,915 | |
| Puerto Rico Electric Power Authority Rev., “UU”, AGM, 5%, 7/01/2022 | | | 260,000 | | | | 260,814 | |
| Puerto Rico Electric Power Authority Rev., “UU”, AGM, 5%, 7/01/2023 | | | 1,075,000 | | | | 1,078,150 | |
| Puerto Rico Electric Power Authority Rev., “UU”, AGM, 5%, 7/01/2024 | | | 1,310,000 | | | | 1,313,655 | |
| Puerto Rico Electric Power Authority Rev., “UU”, NATL, 4%, 7/01/2018 | | | 1,300,000 | | | | 1,301,924 | |
| Puerto Rico Electric Power Authority Rev., “UU”, NATL, 4.5%, 7/01/2018 | | | 100,000 | | | | 100,229 | |
| Puerto Rico Electric Power Authority Rev., “UU”, NATL, 5%, 7/01/2019 | | | 6,490,000 | | | | 6,618,437 | |
| Puerto Rico Electric Power Authority Rev., “VV”, NATL, 5.25%, 7/01/2025 | | | 195,000 | | | | 198,477 | |
| Puerto Rico Electric Power Authority Rev., “VV”, NATL, 5.25%, 7/01/2026 | | | 460,000 | | | | 466,054 | |
| Puerto Rico Industrial, Tourist, Educational, Medical & Environmental Control Facilities Financing Authority, Higher Education Rev. (Ana G. Mendez University System Project), 4%, 4/01/2020 | | | 110,000 | | | | 107,525 | |
44
Portfolio of Investments – continued
| | | | | | | | |
| Issuer | | Shares/Par | | | Value ($) | |
| Municipal Bonds - continued | | | | | | | | |
| Puerto Rico - continued | | | | | | | | |
| Puerto Rico Industrial, Tourist, Educational, Medical & Environmental Control Facilities Financing Authority, Higher Education Rev. (Ana G. Mendez University System Project), 5%, 3/01/2021 | | $ | 25,000 | | | $ | 24,906 | |
| Puerto Rico Industrial, Tourist, Educational, Medical & Environmental Control Facilities Financing Authority, Higher Education Rev. (Ana G. Mendez University System Project), 5%, 4/01/2021 | | | 380,000 | | | | 376,348 | |
| Puerto Rico Industrial, Tourist, Educational, Medical & Environmental Control Facilities Financing Authority, Higher Education Rev. (Ana G. Mendez University System Project), 5.375%, 12/01/2021 | | | 310,000 | | | | 308,838 | |
| Puerto Rico Industrial, Tourist, Educational, Medical & Environmental Control Facilities Financing Authority, Higher Education Rev. (Ana G. Mendez University System Project), 5%, 4/01/2022 | | | 295,000 | | | | 287,625 | |
| Puerto Rico Industrial, Tourist, Educational, Medical & Environmental Control Facilities Financing Authority, Higher Education Rev. (Ana G. Mendez University System Project), 5%, 3/01/2026 | | | 90,000 | | | | 84,827 | |
| Puerto Rico Industrial, Tourist, Educational, Medical & Environmental Control Facilities Financing Authority, Higher Education Rev. (Ana G. Mendez University System Project), 5%, 4/01/2027 | | | 390,000 | | | | 363,675 | |
| Puerto Rico Infrastructure Financing Authority Special Tax Rev., “C”, AAC, 5.5%, 7/01/2018 | | | 310,000 | | | | 311,262 | |
| Puerto Rico Infrastructure Financing Authority Special Tax Rev., “C”, AAC, 5.5%, 7/01/2023 | | | 3,980,000 | | | | 4,142,663 | |
| Puerto Rico Infrastructure Financing Authority Special Tax Rev., “C”, AAC, 5.5%, 7/01/2024 | | | 4,900,000 | | | | 5,093,991 | |
| Puerto Rico Infrastructure Financing Authority Special Tax Rev., “C”, AAC, 5.5%, 7/01/2025 | | | 615,000 | | | | 638,893 | |
| Puerto Rico Infrastructure Financing Authority Special Tax Rev., “C”, AAC, 5.5%, 7/01/2026 | | | 2,270,000 | | | | 2,352,787 | |
| Puerto Rico Infrastructure Financing Authority Special Tax Rev., “C”, AAC, 5.5%, 7/01/2027 | | | 1,535,000 | | | | 1,587,313 | |
| Puerto Rico Municipal Finance Agency, “A”, AGM, 5%, 8/01/2027 | | | 135,000 | | | | 135,284 | |
| Puerto Rico Public Buildings Authority Government Facilities Rev., “M-3”, NATL, 6%, 7/01/2027 | | | 390,000 | | | | 390,647 | |
| Puerto Rico Public Buildings Authority Rev., “H”, AAC, 5.5%, 7/01/2018 | | | 6,390,000 | | | | 6,416,007 | |
| Puerto Rico Public Buildings Authority Rev., “M-2”, AAC, 10%, 7/01/2035 | | | 3,210,000 | | | | 3,370,018 | |
45
Portfolio of Investments – continued
| | | | | | | | |
| Issuer | | Shares/Par | | | Value ($) | |
| Municipal Bonds - continued | | | | | | | | |
| Puerto Rico - continued | | | | | | | | |
| University of Puerto Rico Rev., “P”, NATL, 5%, 6/01/2025 | | $ | 245,000 | | | $ | 244,990 | |
| | | | | | | | |
| | | | | | | $ | 105,005,436 | |
| Rhode Island - 1.5% | | | | | | | | |
| Providence, RI, “A”, 4%, 7/15/2019 | | $ | 400,000 | | | $ | 410,076 | |
| Providence, RI, “A”, 5%, 1/15/2020 | | | 1,625,000 | | | | 1,708,119 | |
| Providence, RI, “A”, 5%, 1/15/2021 | | | 1,000,000 | | | | 1,076,870 | |
| Rhode Island Health & Educational Building Corp. Rev., “A”, (Providence Public Building Authority), 5%, 5/15/2019 | | | 2,000,000 | | | | 2,052,260 | |
| Rhode Island Health & Educational Building Corp. Rev., “A”, (Providence Public Building Authority), 5%, 5/15/2021 | | | 2,240,000 | | | | 2,407,485 | |
| Rhode Island Health & Educational Building Corp. Rev., (Lifespan Obligated Group), 5%, 5/15/2026 | | | 5,000,000 | | | | 5,640,800 | |
| Rhode Island Student Loan Authority, Student Loan Rev., “A”, 2.125%, 12/01/2018 | | | 3,200,000 | | | | 3,198,976 | |
| Rhode Island Student Loan Authority, Student Loan Rev., “A”, 2.5%, 12/01/2019 | | | 4,590,000 | | | | 4,601,980 | |
| Rhode Island Student Loan Authority, Student Loan Rev., “A”, 5%, 12/01/2020 | | | 2,000,000 | | | | 2,123,640 | |
| Rhode Island Student Loan Authority, Student Loan Rev., “A”, 5%, 12/01/2021 | | | 880,000 | | | | 947,681 | |
| Rhode Island Student Loan Authority, Student Loan Rev., “A”, 5%, 12/01/2022 | | | 550,000 | | | | 598,703 | |
| Rhode Island Student Loan Authority, Student Loan Rev., “A”, 3.8%, 12/01/2031 | | | 1,510,000 | | | | 1,535,866 | |
| Rhode Island Student Loan Authority, Student Loan Rev., “A”, 3.5%, 12/01/2034 | | | 1,785,000 | | | | 1,781,251 | |
| | | | | | | | |
| | | | | | | $ | 28,083,707 | |
| South Carolina - 0.8% | | | | | | | | |
| Berkeley County, SC, School District Rev., 5%, 12/01/2018 | | $ | 630,000 | | | $ | 642,096 | |
| Charleston County, SC, Transportation Sales Tax, 5%, 11/01/2022 | | | 3,095,000 | | | | 3,468,381 | |
| Lexington County, SC, Health Services District, Inc., Hospital Refunding Rev., 5%, 11/01/2023 | | | 650,000 | | | | 721,688 | |
| Richland County, SC, Environmental Improvement Rev. (International Paper), “A”, 3.875%, 4/01/2023 | | | 4,545,000 | | | | 4,825,699 | |
| Richland County, SC, School District No. 1, 4%, 3/01/2019 | | | 1,270,000 | | | | 1,293,749 | |
| Scago, SC, Educational Facilities Installment Purchase Rev. (School District of Pickens County Project), 5%, 12/01/2023 | | | 1,300,000 | | | | 1,462,513 | |
| Sumter, SC, Two School Facilities, Inc. (Sumter School District), BAM, 5%, 12/01/2024 | | | 1,000,000 | | | | 1,116,080 | |
46
Portfolio of Investments – continued
| | | | | | | | |
| Issuer | | Shares/Par | | | Value ($) | |
| Municipal Bonds - continued | | | | | | | | |
| South Carolina - continued | | | | | | | | |
| Sumter, SC, Two School Facilities, Inc. (Sumter School District), BAM, 5%, 12/01/2025 | | $ | 1,500,000 | | | $ | 1,694,430 | |
| | | | | | | | |
| | | | | | | $ | 15,224,636 | |
| Tennessee - 2.1% | | | | | | | | |
| Chattanooga, TN, Industrial Development Board, Lease Rental Rev. (Southside Redevelopment Corp.), 5%, 10/01/2018 | | $ | 5,120,000 | | | $ | 5,190,349 | |
| Clarksville, TN, Sub Lien Water, Sewer & Gas Rev., 5%, 2/01/2019 | | | 920,000 | | | | 942,144 | |
| Clarksville, TN, Water, Sewer & Gas Rev., 5%, 2/01/2021 | | | 720,000 | | | | 777,038 | |
| Knox County, TN, Health, Educational & Housing Facility Board Rev. (University Health Systems, Inc.), 5%, 4/01/2023 | | | 850,000 | | | | 931,592 | |
| Knox County, TN, Health, Educational & Housing Facility Board Rev. (University Health Systems, Inc.), 5%, 4/01/2024 | | | 750,000 | | | | 829,425 | |
| Knox County, TN, Health, Educational & Housing Facility Board Rev. (University Health Systems, Inc.), 5%, 4/01/2025 | | | 1,350,000 | | | | 1,507,599 | |
| Maury County, TN, General Obligation School Bonds , 5%, 4/01/2022 | | | 1,535,000 | | | | 1,695,914 | |
| Metropolitan Government of Nashville & Davidson County, TN, 5%, 7/01/2023 | | | 8,000,000 | | | | 9,050,000 | |
| Metropolitan Government of Nashville & Davidson County, TN, Electric System Rev., “B”, 5%, 5/15/2021 | | | 7,500,000 | | | | 8,157,225 | |
| Tennessee Energy Acquisition Corp., Gas Project Rev., “A”, 4%, 5/01/2048 (Put Date 5/01/2023) | | | 7,500,000 | | | | 7,960,125 | |
| Tennessee Energy Acquisition Corp., Gas Rev., “A”, 5.25%, 9/01/2019 | | | 1,000,000 | | | | 1,040,550 | |
| | | | | | | | |
| | | | | | | $ | 38,081,961 | |
| Texas - 5.1% | | | | | | | | |
| Arlington, TX, Independent School District Rev., “A”, Texas PSF, 5%, 2/15/2019 | | $ | 1,275,000 | | | $ | 1,307,181 | |
| Austin, TX, Convention Enterprises, Inc. Convention Center Refunding Rev., “A”, 5%, 1/01/2025 | | | 1,740,000 | | | | 1,972,307 | |
| Austin, TX, Convention Enterprises, Inc. Convention Center Refunding Rev., “B”, 5%, 1/01/2024 | | | 1,200,000 | | | | 1,346,700 | |
| Brownsville, TX, Independent School District, “A”, Texas PSF, 5%, 2/15/2021 | | | 6,595,000 | | | | 7,122,798 | |
| Clifton, TX, Higher Education Finance Corp., Education Rev. (Uplift Education), “A”, 3.375%, 12/01/2024 | | | 2,390,000 | | | | 2,385,053 | |
| Dallas Fort Worth, TX, International Airport Rev., “F”, 4%, 11/01/2018 | | | 5,415,000 | | | | 5,472,616 | |
| Decatur, TX, Hospital Authority Rev. (Wise Regional Health System), “A”, 4%, 9/01/2020 | | | 650,000 | | | | 667,167 | |
47
Portfolio of Investments – continued
| | | | | | | | |
| Issuer | | Shares/Par | | | Value ($) | |
| Municipal Bonds - continued | | | | | | | | |
| Texas - continued | | | | | | | | |
| Decatur, TX, Hospital Authority Rev. (Wise Regional Health System), “A”, 5%, 9/01/2023 | | $ | 525,000 | | | $ | 564,554 | |
| Fort Worth, TX, Water & Sewer Rev., Refunding & Improvement, 5%, 2/15/2020 | | | 2,940,000 | | | | 3,101,876 | |
| Harris County, TX, Cultural Education Facilities Finance Corp. Rev. (YMCA Greater Houston Area), “A”, 5%, 6/01/2018 | | | 430,000 | | | | 431,011 | |
| Harris County, TX, Cultural Education Facilities Finance Corp., | | | | | | | | |
| Medical Facilities Rev. (Baylor College Medicine), “D”, 5%, 11/15/2019 (Prerefunded 11/15/2018) | | | 600,000 | | | | 610,128 | |
| Harris County, TX, Cultural Education Facilities Finance Corp., | | | | | | | | |
| Medical Facilities Rev. (Baylor College Medicine), “D”, ETM, 5%, 11/15/2018 | | | 470,000 | | | | 477,934 | |
| Harris County, TX, Houston Sports Authority Rev., “C”, 5%, 11/15/2020 | | | 575,000 | | | | 610,984 | |
| Harris County, TX, Houston Sports Authority Rev., “C”, 5%, 11/15/2021 | | | 1,000,000 | | | | 1,078,460 | |
| Houston, TX, Airport System Rev., “B”, 5%, 7/01/2020 | | | 1,000,000 | | | | 1,065,830 | |
| Houston, TX, Airport System Rev., Special Facilities Rev. (United Airlines, Inc. Terminal E Project), 4.5%, 7/01/2020 | | | 475,000 | | | | 494,570 | |
| Houston, TX, Airport System Rev., Special Facilities Rev. (United Airlines, Inc. Terminal E Project), 4.75%, 7/01/2024 | | | 1,010,000 | | | | 1,084,407 | |
| Houston, TX, Airport System Rev., Special Facilities Rev. (United Airlines, Inc. Terminal Improvement Projects), “B-2”, 5%, 7/15/2020 | | | 705,000 | | | | 742,055 | |
| Houston, TX, Higher Education Finance Corp. Refunding Rev. (Kipp, Inc.), “A”, Texas PSF, 4%, 2/15/2020 | | | 880,000 | | | | 908,670 | |
| Houston, TX, Higher Education Finance Corp. Rev. (Kipp, Inc.), “A”, Texas PSF, 4%, 2/15/2019 | | | 840,000 | | | | 853,742 | |
| Irving, TX, Hospital Authority Rev. (Baylor Scott & White Medical Center-Irving), “A”, 5%, 10/15/2024 | | | 250,000 | | | | 278,048 | |
| Irving, TX, Hospital Authority Rev. (Baylor Scott & White Medical Center-Irving), “A”, 5%, 10/15/2025 | | | 500,000 | | | | 562,425 | |
| Irving, TX, Hospital Authority Rev. (Baylor Scott & White Medical Center-Irving), “A”, 5%, 10/15/2028 | | | 350,000 | | | | 389,074 | |
| Klein, TX, Independent School District, Texas PSF, 5%, 8/01/2021 (Prerefunded 8/01/2018) | | | 895,000 | | | | 902,249 | |
| Klein, TX, Independent School District, Texas PSF, 5%, 8/01/2021 | | | 105,000 | | | | 105,845 | |
| Lone Star College System, TX, 5%, 2/15/2027 | | | 3,750,000 | | | | 4,360,425 | |
| Lone Star College System, TX, “A”, 5%, 8/15/2018 | | | 4,250,000 | | | | 4,289,822 | |
| Mesquite, TX, Health Facilities Development Corp., Retirement Facility Rev. (Christian Care Centers, Inc.), 5%, 2/15/2026 | | | 3,125,000 | | | | 3,358,094 | |
48
Portfolio of Investments – continued
| | | | | | | | |
| Issuer | | Shares/Par | | | Value ($) | |
| Municipal Bonds - continued | | | | | | | | |
| Texas - continued | | | | | | | | |
| Mission, TX, Economic Development Corp., Solid Waste Disposal Rev. (Republic Services, Inc. Project), 1.65%, 1/01/2026 (Put Date 5/01/2018) | | $ | 7,000,000 | | | $ | 7,000,000 | |
| Mission, TX, Economic Development Corp., Solid Waste Disposal Rev. (Republic Services, Inc. Project), “A”, 2.05%, 1/01/2020 (Put Date 7/02/2018) | | | 10,350,000 | | | | 10,350,517 | |
| New Hope, TX, Cultural Education Facilities Finance Corp., Retirement Facility Rev. (MRC Senior Living - The Langford Project), “B-1”, 3.25%, 11/15/2022 | | | 55,000 | | | | 54,042 | |
| New Hope, TX, Cultural Education Facilities Finance Corp., Retirement Facility Rev. (MRC Senior Living - The Langford Project), “B-2”, 3%, 11/15/2021 | | | 30,000 | | | | 29,781 | |
| New Hope, TX, Cultural Education Facilities Finance Corp., Retirement Facility Rev. (Westminster Project), 1.25%, 11/01/2018 | | | 200,000 | | | | 199,212 | |
| New Hope, TX, Cultural Education Facilities Finance Corp., Student Housing Rev. (Texas A&M University Project), “A”, AGM, 4%, 4/01/2019 | | | 300,000 | | | | 305,292 | |
| New Hope, TX, Cultural Education Facilities Finance Corp., Student Housing Rev. (Texas A&M University Project), “A”, AGM, 4%, 4/01/2021 | | | 400,000 | | | | 413,900 | |
| North Texas Municipal Water District, Upper East Fork Wastewater Interceptor System Rev., 5%, 6/01/2024 | | | 1,915,000 | | | | 2,190,434 | |
| Regents of the University of North Texas Rev. Financing System, “A”, 5%, 4/15/2026 | | | 1,000,000 | | | | 1,172,200 | |
| Tarrant County, TX, 5%, 7/15/2018 | | | 2,770,000 | | | | 2,788,393 | |
| Tarrant County, TX, Cultural Education Facilities Finance Corp. Hospital Rev. (Scott & White Healthcare Project), “A”, 5%, 8/15/2022 | | | 1,160,000 | | | | 1,285,106 | |
| Tarrant County, TX, Cultural Education Facilities Finance Corp. Hospital Rev. (Scott & White Healthcare Project), “A”, ETM, 5%, 8/15/2018 | | | 500,000 | | | | 504,685 | |
| Tarrant County, TX, Cultural Education Facilities Finance Corp. Retirement Facility Rev. (Air Force Village Foundation, Inc.), ETM, 5.75%, 11/15/2019 | | | 430,000 | | | | 444,568 | |
| Tarrant County, TX, Cultural Education Facilities Finance Corp. Retirement Facility Rev. (Barton Creek Senior Living Center, Inc. Querencia Project), 5%, 11/15/2025 | | | 1,675,000 | | | | 1,818,196 | |
| Tarrant County, TX, Cultural Education Facilities Finance Corp. Retirement Facility Rev. (Barton Creek Senior Living Center, Inc., Querencia Project), 5%, 11/15/2019 | | | 1,260,000 | | | | 1,303,117 | |
| Tarrant County, TX, Cultural Education Facilities Finance Corp. Retirement Facility Rev. (Barton Creek Senior Living Center, Inc., Querencia Project), 5%, 11/15/2020 | | | 785,000 | | | | 824,823 | |
49
Portfolio of Investments – continued
| | | | | | | | |
| Issuer | | Shares/Par | | | Value ($) | |
| Municipal Bonds - continued | | | | | | | | |
| Texas - continued | | | | | | | | |
| Tarrant County, TX, Cultural Education Facilities Finance Corp. Retirement Facility Rev. (Barton Creek Senior Living Center, Inc., Querencia Project), 5%, 11/15/2021 | | $ | 1,390,000 | | | $ | 1,478,265 | |
| Tarrant County, TX, Cultural Education Facilities Finance Corp. Retirement Facility Rev. (Barton Creek Senior Living Center, Inc., Querencia Project), 5%, 11/15/2022 | | | 1,460,000 | | | | 1,568,215 | |
| Tarrant County, TX, Cultural Education Facilities Finance Corp. Retirement Facility Rev. (Buckner Senior Living - Ventana Project), “B-3”, 3.875%, 11/15/2022 | | | 80,000 | | | | 80,108 | |
| Tarrant County, TX, Cultural Education Facilities, Finance Corp. Rev. (Trinity Terrace Project), “A-2”, 2.5%, 12/01/2018 | | | 1,570,000 | | | | 1,569,529 | |
| Texas Technical College System Rev., AGM, 5%, 10/15/2024 | | | 1,425,000 | | | | 1,618,786 | |
| Texas Technical College System Rev., AGM, 5%, 10/15/2025 | | | 1,550,000 | | | | 1,783,538 | |
| Travis County, TX, Health Facilities Development Corp. First Mortgage Refunding Rev. (Longhorn Village Project), “A”, 7%, 1/01/2032 (Prerefunded 1/01/2021) | | | 1,715,000 | | | | 1,928,209 | |
| Travis County, TX, Health Facilities Development Corp. First Mortgage Refunding Rev. (Longhorn Village Project), “A”, 7.125%, 1/01/2046 (Prerefunded 1/01/2021) | | | 2,215,000 | | | | 2,497,501 | |
| Waco, TX, 5%, 2/01/2027 | | | 3,220,000 | | | | 3,804,462 | |
| | | | | | | | |
| | | | | | | $ | 93,556,904 | |
| U.S. Virgin Islands - 0.9% | | | | | | | | |
| Virgin Islands Public Finance Authority Rev. (Federal Highway Grant Anticipation Loan Note), 5%, 9/01/2023 | | $ | 1,500,000 | | | $ | 1,602,465 | |
| Virgin Islands Public Finance Authority Rev. (Federal Highway Grant Anticipation Loan Note), 5%, 9/01/2024 | | | 1,500,000 | | | | 1,606,215 | |
| Virgin Islands Public Finance Authority Rev., Matching Fund Loan Note, “A”, AGM, 5%, 10/01/2025 | | | 3,595,000 | | | | 3,785,175 | |
| Virgin Islands Public Finance Authority Rev., Matching Fund Loan Note, “B”, AGM, 5%, 10/01/2025 | | | 3,625,000 | | | | 3,746,474 | |
| Virgin Islands Public Finance Authority Rev.,“B”, AGM, 5%, 10/01/2019 | | | 5,000,000 | | | | 5,147,800 | |
| | | | | | | | |
| | | | | | | $ | 15,888,129 | |
| Utah - 0.4% | | | | | | | | |
| Intermountain Power Agency, UT, Power Supply Rev., “A”, 5%, 7/01/2022 | | $ | 750,000 | | | $ | 753,975 | |
| Salt Lake City, UT, Airport Rev. (Salt Lake City International Airport), “A”, 5%, 7/01/2025 | | | 1,990,000 | | | | 2,270,928 | |
| Salt Lake City, UT, Airport Rev. (Salt Lake City International Airport), “A”, 5%, 7/01/2026 | | | 1,200,000 | | | | 1,381,980 | |
50
Portfolio of Investments – continued
| | | | | | | | |
| Issuer | | Shares/Par | | | Value ($) | |
| Municipal Bonds - continued | | | | | | | | |
| Utah - continued | | | | | | | | |
| Salt Lake City, UT, Airport Rev. (Salt Lake City International Airport), “A”, 5%, 7/01/2027 | | $ | 2,000,000 | | | $ | 2,327,040 | |
| | | | | | | | |
| | | | | | | $ | 6,733,923 | |
| Vermont - 0.4% | | | | | | | | |
| Burlington, VT, Airport Rev., “A”, 5%, 7/01/2022 | | $ | 2,050,000 | | | $ | 2,183,127 | |
| Burlington, VT, Airport Rev., “A”, AGM, 5%, 7/01/2019 | | | 100,000 | | | | 103,338 | |
| State of Vermont, Student Assistance Corp. Education Loan Rev., “A”, 5%, 6/15/2023 | | | 1,000,000 | | | | 1,077,480 | |
| State of Vermont, Student Assistance Corp. Education Loan Rev., “A”, 5%, 6/15/2024 | | | 850,000 | | | | 922,581 | |
| State of Vermont, Student Assistance Corp. Education Loan Rev., “A”, 5%, 6/15/2025 | | | 875,000 | | | | 958,204 | |
| State of Vermont, Student Assistance Corp. Education Loan Rev., “A”, 5%, 6/15/2026 | | | 2,100,000 | | | | 2,346,057 | |
| | | | | | | | |
| | | | | | | $ | 7,590,787 | |
| Virginia - 1.5% | | | | | | | | |
| Commonwealth of Virginia, Board of Transportation, Capital Project Refunding Rev., “A”, 5%, 5/15/2025 | | $ | 2,750,000 | | | $ | 3,191,045 | |
| Commonwealth of Virginia, Transportation Board Grant Anticipation Rev., 5%, 9/15/2018 | | | 500,000 | | | | 506,035 | |
| Commonwealth of Virginia, Transportation Board Rev., Capital Projects, 5%, 5/15/2020 | | | 2,175,000 | | | | 2,307,218 | |
| Portsmouth, VA, Refunding and Public Improvement, “A”, 5%, 2/01/2021 | | | 1,375,000 | | | | 1,484,312 | |
| Richmond, VA, General Obligation Public Improvement Refunding, “D”, 5%, 3/01/2024 | | | 930,000 | | | | 1,060,256 | |
| Richmond, VA, General Obligation Public Improvement Refunding, “D”, 5%, 3/01/2025 | | | 2,000,000 | | | | 2,314,820 | |
| Virginia Public Building Authority, Public Facilities Rev., “B”, 5%, 8/01/2024 | | | 10,000,000 | | | | 11,468,400 | |
| Virginia Public School Authority, “C”, 5%, 8/01/2018 | | | 1,000,000 | | | | 1,008,050 | |
| Virginia Small Business Financing Authority Rev. (Hampton University), 5%, 10/01/2020 | | | 1,150,000 | | | | 1,224,992 | |
| Virginia Small Business Financing Authority Rev. (Hampton University), 5%, 10/01/2021 | | | 1,000,000 | | | | 1,085,400 | |
| Virginia Small Business Financing Authority Rev. (Hampton University), 5%, 10/01/2022 | | | 750,000 | | | | 827,550 | |
| Washington County, VA, Hospital Facilities Industrial Development Authority Rev. (Mountain States Health Alliance), “C”, 7.25%, 7/01/2019 | | | 420,000 | | | | 433,940 | |
| | | | | | | | |
| | | | | | | $ | 26,912,018 | |
51
Portfolio of Investments – continued
| | | | | | | | |
| Issuer | | Shares/Par | | | Value ($) | |
| Municipal Bonds - continued | | | | | | | | |
| Washington - 1.9% | | | | | | | | |
| Energy Northwest, WA, Columbia Generating Station Electric | | | | | | | | |
| Rev., “A”, 5%, 7/01/2023 | | $ | 4,295,000 | | | $ | 4,852,019 | |
| Energy Northwest, WA, Wind Project Rev., 5%, 7/01/2018 | | | 1,400,000 | | | | 1,407,042 | |
| Energy Northwest, WA, Wind Project Rev., 5%, 7/01/2019 | | | 2,025,000 | | | | 2,095,450 | |
| Energy Northwest, WA, Wind Project Rev., 5%, 7/01/2020 | | | 2,230,000 | | | | 2,359,719 | |
| Energy Northwest, WA, Wind Project Rev., 5%, 7/01/2021 | | | 2,455,000 | | | | 2,648,282 | |
| Energy Northwest, WA, Wind Project Rev., 5%, 7/01/2022 | | | 2,000,000 | | | | 2,195,660 | |
| Energy Northwest, WA, Wind Project Rev., 5%, 7/01/2023 | | | 1,500,000 | | | | 1,667,490 | |
| Pierce County, WA, “A”, 5%, 7/01/2022 | | | 3,290,000 | | | | 3,632,423 | |
| Port of Seattle, WA, Special Facilities Rev. (Seatac Fuel Facilities LLC), 5%, 6/01/2019 | | | 700,000 | | | | 721,259 | |
| Port of Seattle, WA, Special Facilities Rev. (Seatac Fuel Facilities LLC), 5%, 6/01/2020 | | | 1,175,000 | | | | 1,239,801 | |
| Port of Seattle, WA, Special Facilities Rev. (Seatac Fuel Facilities LLC), 5%, 6/01/2022 | | | 1,740,000 | | | | 1,897,122 | |
| State of Washington, Higher Education Facilities Authority Rev., (Whiteman College Project), VRDN, 1.73%, 10/01/2029 | | | 8,200,000 | | | | 8,200,000 | |
| Washington Health Care Facilities Authority Rev. (Providence Health & Services), “B”, 5%, 10/01/2042 (Put Date 10/01/2021) | | | 1,000,000 | | | | 1,095,730 | |
| Washington Housing Finance Commission Nonprofit Housing Rev. (Emerald Heights Project), 5%, 7/01/2020 | | | 1,175,000 | | | | 1,247,709 | |
| | | | | | | | |
| | | | | | | $ | 35,259,706 | |
| West Virginia - 0.6% | | | | | | | | |
| West Virginia Economic Development Authority, Solid Waste Disposal Facilities Rev. (Wheeling Power Co. - Mitchell Project), “A”, 3%, 6/01/2037 (Put Date 4/01/2022) | | $ | 11,500,000 | | | $ | 11,421,685 | |
| | |
| Wisconsin - 1.1% | | | | | | | | |
| Wisconsin Health & Educational Facilities Authority Rev. (Ascension Health Alliance Senior Credit Group), “B”, 5%, 11/15/2043 (Put Date 6/01/2021) | | $ | 5,000,000 | | | $ | 5,397,650 | |
| Wisconsin Health & Educational Facilities Authority Rev. (Aurora Healthcare, Inc.), “A”, 5%, 7/15/2022 | | | 6,000,000 | | | | 6,472,140 | |
| Wisconsin Health & Educational Facilities Authority Rev. (Unity Point Health Facilities), “A”, 5%, 12/01/2020 | | | 800,000 | | | | 858,176 | |
| Wisconsin Public Finance Authority Limited Obligation Grant Rev. (American Dream at Meadowlands Project), “A”, 6.25%, 8/01/2027 | | | 2,780,000 | | | | 2,937,515 | |
| Wisconsin Public Finance Authority Senior Living Refunding Bonds Rev. (Mary’s Woods at Marylhurst Project), “B-2”, 3.5%, 11/15/2023 | | | 295,000 | | | | 297,575 | |
52
Portfolio of Investments – continued
| | | | | | | | |
| Issuer | | Shares/Par | | | Value ($) | |
| Municipal Bonds - continued | | | | | | | | |
| Wisconsin - continued | | | | | | | | |
| Wisconsin Public Finance Authority Senior Living Refunding Bonds Rev. (Mary’s Woods at Marylhurst Project), “B-3”, 3%, 11/15/2022 | | $ | 405,000 | | | $ | 406,090 | |
| Wisconsin Public Finance Authority, Airport Facilities Rev. (Transportation Infrastructure Properties LLC), “B”, 5%, 7/01/2022 | | | 3,045,000 | | | | 3,205,045 | |
| | | | | | | | |
| | | | | | | $ | 19,574,191 | |
Total Municipal Bonds
(Identified Cost, $1,796,726,436) | | | | | | $ | 1,794,671,980 | |
| | |
| Other Municipal Bonds - 0.2% | | | | | | | | |
| Multi-Family Housing Revenue - 0.2% | | | | | | | | |
Freddie Mac, 1.6% to 6/15/2022, FLR to 8/15/2051
(Identified Cost, $4,000,000) | | | 4,000,000 | | | $ | 3,863,840 | |
| | |
| Investment Companies (h) - 2.9% | | | | | | | | |
| Money Market Funds - 2.9% | | | | | | | | |
MFS Institutional Money Market Portfolio, 1.78% (v)
(Identified Cost, $52,935,932) | | | 52,943,186 | | | $ | 52,937,892 | |
| | |
| Other Assets, Less Liabilities - (0.9)% | | | | | | | (15,745,856 | ) |
| Net Assets - 100.0% | | | | | | $ | 1,835,727,856 | |
| (h) | An affiliated issuer may be considered one in which the fund owns 5% or more of the outstanding voting securities, or a company which is under common control. At period end, the aggregate values of the fund’s investments in affiliated issuers and in unaffiliated issuers were $52,937,892 and $1,798,535,820, respectively. |
| (v) | Affiliated issuer that is available only to investment companies managed by MFS. The rate quoted for the MFS Institutional Money Market Portfolio is the annualized seven-day yield of the fund at period end. |
The following abbreviations are used in this report and are defined:
| AAC | | Ambac Assurance Corp. |
| AGM | | Assured Guaranty Municipal |
| ASSD GTY | | Assured Guaranty Insurance Co. |
| COP | | Certificate of Participation |
| FGIC | | Financial Guaranty Insurance Co. |
| FLR | | Floating Rate. Interest rate resets periodically based on the parenthetically disclosed reference rate plus a spread (if any). The period-end rate reported may not be the current rate. |
| FNMA | | Federal National Mortgage Assn. |
| GNMA | | Government National Mortgage Assn. |
53
Portfolio of Investments – continued
| NATL | | National Public Finance Guarantee Corp. |
| PSF | | Permanent School Fund |
| SYNCORA | | Syncora Guarantee Inc. |
| VRDN | | Variable rate demand note that may be puttable to the issuer at the option of the holder. The stated interest rate, which generally resets either daily or weekly, represents the rate in effect at period end and may not be the current rate. |
See Notes to Financial Statements
54
Financial Statements
STATEMENT OF ASSETS AND LIABILITIES
At 4/30/18
This statement represents your fund’s balance sheet, which details the assets and liabilities comprising the total value of the fund.
| | | | |
| Assets | | | | |
Investments in unaffiliated issuers, at value (identified cost, $1,800,726,436) | | | $1,798,535,820 | |
Investments in affiliated issuers, at value (identified cost, $52,935,932) | | | 52,937,892 | |
Receivables for | | | | |
Investments sold | | | 23,225,438 | |
Fund shares sold | | | 4,382,909 | |
Interest | | | 22,015,892 | |
Other assets | | | 4,919 | |
Total assets | | | $1,901,102,870 | |
| Liabilities | | | | |
Payable to custodian | | | $439 | |
Payables for | | | | |
Distributions | | | 599,060 | |
Investments purchased | | | 60,711,440 | |
Fund shares reacquired | | | 3,167,446 | |
Payable to affiliates | | | | |
Investment adviser | | | 81,553 | |
Shareholder servicing costs | | | 622,070 | |
Distribution and service fees | | | 22,999 | |
Payable for independent Trustees’ compensation | | | 1,430 | |
Accrued expenses and other liabilities | | | 168,577 | |
Total liabilities | | | $65,375,014 | |
Net assets | | | $1,835,727,856 | |
| Net assets consist of | | | | |
Paid-in capital | | | $1,847,869,832 | |
Unrealized appreciation (depreciation) | | | (2,188,656 | ) |
Accumulated net realized gain (loss) | | | (9,068,666 | ) |
Accumulated distributions in excess of net investment income | | | (884,654 | ) |
Net assets | | | $1,835,727,856 | |
Shares of beneficial interest outstanding | | | 229,916,501 | |
| | | | | | | | | | | | |
| | | Net assets | | | Shares
outstanding | | | Net asset value
per share (a) | |
| Class A | | | $692,006,167 | | | | 86,611,849 | | | | $7.99 | |
| Class B | | | 1,007,720 | | | | 126,262 | | | | 7.98 | |
| Class C | | | 105,269,104 | | | | 13,167,957 | | | | 7.99 | |
| Class I | | | 756,720,039 | | | | 94,814,317 | | | | 7.98 | |
| Class R6 | | | 280,724,826 | | | | 35,196,116 | | | | 7.98 | |
| (a) | Maximum offering price per share was equal to the net asset value per share for all share classes, except for Class A, for which the maximum offering price per share was $8.19 [100 / 97.50 x $7.99]. On sales of $50,000 or more, the maximum offering price of Class A shares is reduced. A contingent deferred sales charge may be imposed on redemptions of Class A, Class B, and Class C shares. Redemption price per share was equal to the net asset value per share for Classes I and R6. Net asset value per share is calculated using actual net assets and shares outstanding rather than amounts that have been rounded for presentation purposes. |
See Notes to Financial Statements
55
Financial Statements
STATEMENT OF OPERATIONS
Year ended 4/30/18
This statement describes how much your fund earned in investment income and accrued in expenses. It also describes any gains and/or losses generated by fund operations.
| | | | |
| Net investment income (loss) | | | | |
Income | | | | |
Interest | | | $47,433,480 | |
Dividends from affiliated issuers | | | 579,975 | |
Total investment income | | | $48,013,455 | |
Expenses | | | | |
Management fee | | | $6,988,188 | |
Distribution and service fees | | | 2,886,699 | |
Shareholder servicing costs | | | 1,529,622 | |
Administrative services fee | | | 279,701 | |
Independent Trustees’ compensation | | | 32,412 | |
Custodian fee | | | 209,363 | |
Shareholder communications | | | 69,458 | |
Audit and tax fees | | | 54,682 | |
Legal fees | | | 28,525 | |
Miscellaneous | | | 270,405 | |
Total expenses | | | $12,349,055 | |
Fees paid indirectly | | | (1,304 | ) |
Reduction of expenses by investment adviser and distributor | | | (826,756 | ) |
Net expenses | | | $11,520,995 | |
Net investment income (loss) | | | $36,492,460 | |
| Realized and unrealized gain (loss) | | | | |
Realized gain (loss) (identified cost basis) | | | | |
Unaffiliated issuers | | | $313,538 | |
Affiliated issuers | | | (3,984 | ) |
Net realized gain (loss) | | | $309,554 | |
Change in unrealized appreciation (depreciation) | | | | |
Unaffiliated issuers | | | $(27,333,696 | ) |
Affiliated issuers | | | 1,191 | |
Net unrealized gain (loss) | | | $(27,332,505 | ) |
Net realized and unrealized gain (loss) | | | $(27,022,951 | ) |
Change in net assets from operations | | | $9,469,509 | |
See Notes to Financial Statements
56
Financial Statements
STATEMENTS OF CHANGES IN NET ASSETS
These statements describe the increases and/or decreases in net assets resulting from operations, any distributions, and any shareholder transactions.
| | | | | | | | |
| | | Year ended | |
| | | 4/30/18 | | | 4/30/17 | |
| Change in net assets | | | | | | |
| From operations | | | | | | | | |
Net investment income (loss) | | | $36,492,460 | | | | $31,288,084 | |
Net realized gain (loss) | | | 309,554 | | | | (4,299,515 | ) |
Net unrealized gain (loss) | | | (27,332,505 | ) | | | (20,423,494 | ) |
Change in net assets from operations | | | $9,469,509 | | | | $6,565,075 | |
| Distributions declared to shareholders | | | | | | | | |
From net investment income | | | $(36,913,288 | ) | | | $(30,938,335 | ) |
Change in net assets from fund share transactions | | | $209,657,195 | | | | $180,922,419 | |
Total change in net assets | | | $182,213,416 | | | | $156,549,159 | |
| Net assets | | | | | | | | |
At beginning of period | | | 1,653,514,440 | | | | 1,496,965,281 | |
At end of period (including accumulated distributions in excess of net investment income of $884,654 and $663,334, respectively) | | | $1,835,727,856 | | | | $1,653,514,440 | |
See Notes to Financial Statements
57
Financial Statements
FINANCIAL HIGHLIGHTS
The financial highlights table is intended to help you understand the fund’s financial performance for the past 5 years (or life of a particular share class, if shorter). Certain information reflects financial results for a single fund share. The total returns in the table represent the rate that an investor would have earned (or lost) on an investment in the fund share class (assuming reinvestment of all distributions) held for the entire period.
| | | | | | | | | | | | | | | | | | | | |
| Class A | | Year ended | |
| | | 4/30/18 | | | 4/30/17 | | | 4/30/16 | | | 4/30/15 | | | 4/30/14 | |
Net asset value, beginning of period | | | $8.11 | | | | $8.23 | | | | $8.16 | | | | $8.13 | | | | $8.28 | |
| Income (loss) from investment operations | | | | | | | | | |
Net investment income (loss) (d) | | | $0.17 | | | | $0.16 | (c) | | | $0.15 | | | | $0.13 | | | | $0.14 | |
Net realized and unrealized gain (loss) | | | (0.12 | ) | | | (0.12 | ) | | | 0.06 | | | | 0.03 | | | | (0.15 | ) |
Total from investment operations | | | $0.05 | | | | $0.04 | | | | $0.21 | | | | $0.16 | | | | $(0.01 | ) |
| Less distributions declared to shareholders | | | | | | | | | |
From net investment income | | | $(0.17 | ) | | | $(0.16 | ) | | | $(0.14 | ) | | | $(0.13 | ) | | | $(0.14 | ) |
Net asset value, end of period (x) | | | $7.99 | | | | $8.11 | | | | $8.23 | | | | $8.16 | | | | $8.13 | |
Total return (%) (r)(s)(t)(x) | | | 0.60 | | | | 0.47 | (c) | | | 2.63 | | | | 1.94 | | | | (0.13 | ) |
Ratios (%) (to average net assets)
and Supplemental data: | | | | | | | | | | | | | |
Expenses before expense reductions (f) | | | 0.79 | | | | 0.80 | (c) | | | 0.80 | | | | 0.80 | | | | 0.79 | |
Expenses after expense reductions (f) | | | 0.69 | | | | 0.69 | (c) | | | 0.69 | | | | 0.69 | | | | 0.69 | |
Net investment income (loss) | | | 2.06 | | | | 1.95 | (c) | | | 1.82 | | | | 1.63 | | | | 1.75 | |
Portfolio turnover | | | 33 | | | | 27 | | | | 24 | | | | 15 | | | | 34 | |
Net assets at end of period (000 omitted) | | | $692,006 | | | | $647,875 | | | | $703,594 | | | | $677,065 | | | | $685,309 | |
See Notes to Financial Statements
58
Financial Highlights – continued
| | | | | | | | | | | | | | | | | | | | |
| Class B | | Year ended | |
| | | 4/30/18 | | | 4/30/17 | | | 4/30/16 | | | 4/30/15 | | | 4/30/14 | |
Net asset value, beginning of period | | | $8.10 | | | | $8.22 | | | | $8.15 | | | | $8.12 | | | | $8.27 | |
| Income (loss) from investment operations | | | | | | | | | |
Net investment income (loss) (d) | | | $0.11 | | | | $0.10 | (c) | | | $0.09 | | | | $0.07 | | | | $0.08 | |
Net realized and unrealized gain (loss) | | | (0.12 | ) | | | (0.12 | ) | | | 0.06 | | | | 0.03 | | | | (0.15 | ) |
Total from investment operations | | | $(0.01 | ) | | | $(0.02 | ) | | | $0.15 | | | | $0.10 | | | | $(0.07 | ) |
| Less distributions declared to shareholders | | | | | | | | | |
From net investment income | | | $(0.11 | ) | | | $(0.10 | ) | | | $(0.08 | ) | | | $(0.07 | ) | | | $(0.08 | ) |
Net asset value, end of period (x) | | | $7.98 | | | | $8.10 | | | | $8.22 | | | | $8.15 | | | | $8.12 | |
Total return (%) (r)(s)(t)(x) | | | (0.15 | ) | | | (0.28 | )(c) | | | 1.87 | | | | 1.18 | | | | (0.86 | ) |
Ratios (%) (to average net assets)
and Supplemental data: | | | | | | | | | | | | | | | | | |
Expenses before expense reductions (f) | | | 1.55 | | | | 1.55 | (c) | | | 1.55 | | | | 1.55 | | | | 1.55 | |
Expenses after expense reductions (f) | | | 1.44 | | | | 1.44 | (c) | | | 1.45 | | | | 1.45 | | | | 1.44 | |
Net investment income (loss) | | | 1.32 | | | | 1.21 | (c) | | | 1.08 | | | | 0.88 | | | | 1.01 | |
Portfolio turnover | | | 33 | | | | 27 | | | | 24 | | | | 15 | | | | 34 | |
Net assets at end of period (000 omitted) | | | $1,008 | | | | $1,367 | | | | $1,945 | | | | $1,708 | | | | $1,972 | |
| | | | | | | | | | | | | | | | | | | | |
| Class C | | Year ended | |
| | | 4/30/18 | | | 4/30/17 | | | 4/30/16 | | | 4/30/15 | | | 4/30/14 | |
Net asset value, beginning of period | | | $8.11 | | | | $8.24 | | | | $8.16 | | | | $8.13 | | | | $8.28 | |
| Income (loss) from investment operations | | | | | | | | | | | | | | | | | |
Net investment income (loss) (d) | | | $0.10 | | | | $0.09 | (c) | | | $0.08 | | | | $0.06 | | | | $0.07 | |
Net realized and unrealized gain (loss) | | | (0.12 | ) | | | (0.13 | ) | | | 0.07 | | | | 0.03 | | | | (0.15 | ) |
Total from investment operations | | | $(0.02 | ) | | | $(0.04 | ) | | | $0.15 | | | | $0.09 | | | | $(0.08 | ) |
| Less distributions declared to shareholders | | | | | | | | | | | | | | | | | |
From net investment income | | | $(0.10 | ) | | | $(0.09 | ) | | | $(0.07 | ) | | | $(0.06 | ) | | | $(0.07 | ) |
Net asset value, end of period (x) | | | $7.99 | | | | $8.11 | | | | $8.24 | | | | $8.16 | | | | $8.13 | |
Total return (%) (r)(s)(t)(x) | | | (0.25 | ) | | | (0.50 | )(c) | | | 1.88 | | | | 1.08 | | | | (0.97 | ) |
Ratios (%) (to average net assets)
and Supplemental data: | | | | | | | | | | | | | | | | | |
Expenses before expense reductions (f) | | | 1.55 | | | | 1.55 | (c) | | | 1.55 | | | | 1.55 | | | | 1.54 | |
Expenses after expense reductions (f) | | | 1.54 | | | | 1.54 | (c) | | | 1.54 | | | | 1.54 | | | | 1.54 | |
Net investment income (loss) | | | 1.22 | | | | 1.11 | (c) | | | 0.97 | | | | 0.78 | | | | 0.91 | |
Portfolio turnover | | | 33 | | | | 27 | | | | 24 | | | | 15 | | | | 34 | |
Net assets at end of period (000 omitted) | | | $105,269 | | | | $128,146 | | | | $139,554 | | | | $140,213 | | | | $148,207 | |
See Notes to Financial Statements
59
Financial Highlights – continued
| | | | | | | | | | | | | | | | | | | | |
| Class I | | Year ended | |
| | | 4/30/18 | | | 4/30/17 | | | 4/30/16 | | | 4/30/15 | | | 4/30/14 | |
Net asset value, beginning of period | | | $8.10 | | | | $8.22 | | | | $8.15 | | | | $8.12 | | | | $8.27 | |
| Income (loss) from investment operations | | | | | | | | | | | | | | | | | |
Net investment income (loss) (d) | | | $0.18 | | | | $0.17 | (c) | | | $0.16 | | | | $0.14 | | | | $0.15 | |
Net realized and unrealized gain (loss) | | | (0.12 | ) | | | (0.12 | ) | | | 0.06 | | | | 0.03 | | | | (0.15 | ) |
Total from investment operations | | | $0.06 | | | | $0.05 | | | | $0.22 | | | | $0.17 | | | | $— | |
| Less distributions declared to shareholders | | | | | | | | | | | | | | | | | |
From net investment income | | | $(0.18 | ) | | | $(0.17 | ) | | | $(0.15 | ) | | | $(0.14 | ) | | | $(0.15 | ) |
Net asset value, end of period (x) | | | $7.98 | | | | $8.10 | | | | $8.22 | | | | $8.15 | | | | $8.12 | |
Total return (%) (r)(s)(t)(x) | | | 0.75 | | | | 0.61 | (c) | | | 2.79 | | | | 2.10 | | | | 0.02 | |
Ratios (%) (to average net assets)
and Supplemental data: | | | | | | | | | | | | | | | | | |
Expenses before expense reductions (f) | | | 0.54 | | | | 0.55 | (c) | | | 0.55 | | | | 0.55 | | | | 0.54 | |
Expenses after expense reductions (f) | | | 0.54 | | | | 0.54 | (c) | | | 0.54 | | | | 0.54 | | | | 0.54 | |
Net investment income (loss) | | | 2.21 | | | | 2.11 | (c) | | | 1.96 | | | | 1.77 | | | | 1.88 | |
Portfolio turnover | | | 33 | | | | 27 | | | | 24 | | | | 15 | | | | 34 | |
Net assets at end of period (000 omitted) | | | $756,720 | | | | $876,126 | | | | $651,872 | | | | $807,983 | | | | $678,857 | |
| | | | |
| Class R6 | | Year ended | |
| | | 4/30/18 (i) | |
Net asset value, beginning of period | | | $8.19 | |
| Income (loss) from investment operations | |
Net investment income (loss) (d) | | | $0.12 | |
Net realized and unrealized gain (loss) | | | (0.21 | ) |
Total from investment operations | | | $(0.09 | ) |
| Less distributions declared to shareholders | |
From net investment income | | | $(0.12 | ) |
Net asset value, end of period (x) | | | $7.98 | |
Total return (%) (r)(s)(t)(x) | | | (1.06 | )(n) |
Ratios (%) (to average net assets)
and Supplemental data: | |
Expenses before expense reductions (f) | | | 0.46 | (a) |
Expenses after expense reductions (f) | | | 0.45 | (a) |
Net investment income (loss) | | | 2.30 | (a) |
Portfolio turnover | | | 33 | |
Net assets at end of period (000 omitted) | | | $280,725 | |
See Notes to Financial Statements
60
Financial Highlights – continued
| (c) | Amount reflects a one-time reimbursement of expenses by the custodian (or former custodian) without which net investment income and performance would be lower and expenses would be higher. |
| (d) | Per share data is based on average shares outstanding. |
| (f) | Ratios do not reflect reductions from fees paid indirectly, if applicable. |
| (i) | For the period from the inception of Class R6, September 1, 2017, through the stated period end. |
| (r) | Certain expenses have been reduced without which performance would have been lower. |
| (s) | From time to time the fund may receive proceeds from litigation settlements, without which performance would be lower. |
| (t) | Total returns do not include any applicable sales charges. |
| (x) | The net asset values and total returns have been calculated on net assets which include adjustments made in accordance with U.S. generally accepted accounting principles required at period end for financial reporting purposes. |
See Notes to Financial Statements
61
NOTES TO FINANCIAL STATEMENTS
(1) Business and Organization
MFS Municipal Limited Maturity Fund (the fund) is a diversified series of MFS Series Trust IX (the trust). The trust is organized as a Massachusetts business trust and is registered under the Investment Company Act of 1940, as amended, as an open-end management investment company.
The fund is an investment company and accordingly follows the investment company accounting and reporting guidance of the Financial Accounting Standards Board (FASB) Accounting Standards Codification Topic 946 Financial Services – Investment Companies.
(2) Significant Accounting Policies
General – The preparation of financial statements in conformity with U.S. generally accepted accounting principles requires management to make estimates and assumptions that affect the reported amounts of assets and liabilities, and disclosure of contingent assets and liabilities at the date of the financial statements and the reported amounts of increases and decreases in net assets from operations during the reporting period. Actual results could differ from those estimates. In the preparation of these financial statements, management has evaluated subsequent events occurring after the date of the fund’s Statement of Assets and Liabilities through the date that the financial statements were issued. The fund invests primarily in municipal instruments which generally trade in the over-the-counter market. The value of municipal instruments can be affected by changes in their actual or perceived credit quality. The credit quality of, and the ability to pay principal and interest when due by, an issuer of a municipal instrument depends on the credit quality of the entity supporting the municipal instrument, how essential any services supported by the municipal instrument are, the sufficiency of any revenues or taxes that support the municipal instrument, and/or the willingness or ability of the appropriate government entity to approve any appropriations necessary to support the municipal instrument. Many municipal instruments are supported by insurance which typically guarantees the timely payment of all principal and interest due on the underlying municipal instrument. The value of a municipal instrument can be volatile and significantly affected by adverse tax changes or court rulings, legislative or political changes, changes in specific or general market and economic conditions in the region where the instrument is issued, and the financial condition of municipal issuers and of municipal instrument insurers of which there are a limited number. Also, because many municipal instruments are issued to finance similar projects, conditions in certain industries can significantly affect the fund and the overall municipal market. If the Internal Revenue Service determines an issuer of a municipal instrument has not complied with the applicable tax requirements, interest from the security could become taxable, the security could decline in value, and distributions made by the fund could be taxable to shareholders.
In March 2017, the FASB issued Accounting Standards Update 2017-08, Receivables – Nonrefundable Fees and Other Costs (Subtopic 310-20) – Premium Amortization on Purchased Callable Debt Securities (“ASU 2017-08”). For entities that hold callable debt securities at a premium, ASU 2017-08 requires that the premium be amortized to the earliest call date. ASU 2017-08 will be effective for fiscal years beginning after
62
Notes to Financial Statements – continued
December 15, 2018, and interim periods within those fiscal years. Management has evaluated the potential impacts of ASU 2017-08 and believes that adoption of ASU 2017-08 will not have a material effect on the fund’s overall financial position or its overall results of operations.
Balance Sheet Offsetting – The fund’s accounting policy with respect to balance sheet offsetting is that, absent an event of default by the counterparty or a termination of the agreement, the International Swaps and Derivatives Association (ISDA) Master Agreement, or similar agreement, does not result in an offset of reported amounts of financial assets and financial liabilities in the Statement of Assets and Liabilities across transactions between the fund and the applicable counterparty. The fund’s right to setoff may be restricted or prohibited by the bankruptcy or insolvency laws of the particular jurisdiction to which a specific master netting agreement counterparty is subject. Balance sheet offsetting disclosures, to the extent applicable to the fund, have been included in the fund’s Significant Accounting Policies note under the captions for each of the fund’s in-scope financial instruments and transactions.
Investment Valuations – Debt instruments and floating rate loans, including restricted debt instruments, are generally valued at an evaluated or composite bid as provided by a third-party pricing service. Short-term instruments with a maturity at issuance of 60 days or less may be valued at amortized cost, which approximates market value. Open-end investment companies are generally valued at net asset value per share. Securities and other assets generally valued on the basis of information from a third-party pricing service may also be valued at a broker/dealer bid quotation. Values obtained from third-party pricing services can utilize both transaction data and market information such as yield, quality, coupon rate, maturity, type of issue, trading characteristics, and other market data.
The Board of Trustees has delegated primary responsibility for determining or causing to be determined the value of the fund’s investments (including any fair valuation) to the adviser pursuant to valuation policies and procedures approved by the Board. If the adviser determines that reliable market quotations are not readily available, investments are valued at fair value as determined in good faith by the adviser in accordance with such procedures under the oversight of the Board of Trustees. Under the fund’s valuation policies and procedures, market quotations are not considered to be readily available for most types of debt instruments and floating rate loans and many types of derivatives. These investments are generally valued at fair value based on information from third-party pricing services. In addition, investments may be valued at fair value if the adviser determines that an investment’s value has been materially affected by events occurring after the close of the exchange or market on which the investment is principally traded (such as foreign exchange or market) and prior to the determination of the fund’s net asset value, or after the halting of trading of a specific security where trading does not resume prior to the close of the exchange or market on which the security is principally traded. The adviser generally relies on third-party pricing services or other information (such as the correlation with price movements of similar securities in the same or other markets; the type, cost and investment characteristics of the security; the business and financial condition of the issuer; and trading and other market data) to assist in determining whether to fair value and at what value to fair value an investment. The value of an investment for purposes of calculating the fund’s
63
Notes to Financial Statements – continued
net asset value can differ depending on the source and method used to determine value. When fair valuation is used, the value of an investment used to determine the fund’s net asset value may differ from quoted or published prices for the same investment. There can be no assurance that the fund could obtain the fair value assigned to an investment if it were to sell the investment at the same time at which the fund determines its net asset value per share.
Various inputs are used in determining the value of the fund’s assets or liabilities. These inputs are categorized into three broad levels. In certain cases, the inputs used to measure fair value may fall into different levels of the fair value hierarchy. In such cases, an investment’s level within the fair value hierarchy is based on the lowest level of input that is significant to the fair value measurement. The fund’s assessment of the significance of a particular input to the fair value measurement in its entirety requires judgment, and considers factors specific to the investment. Level 1 includes unadjusted quoted prices in active markets for identical assets or liabilities. Level 2 includes other significant observable market-based inputs (including quoted prices for similar securities, interest rates, prepayment speed, and credit risk). Level 3 includes unobservable inputs, which may include the adviser’s own assumptions in determining the fair value of investments. The following is a summary of the levels used as of April 30, 2018 in valuing the fund’s assets or liabilities:
| | | | | | | | | | | | | | | | |
| Financial Instruments | | Level 1 | | | Level 2 | | | Level 3 | | | Total | |
| Municipal Bonds | | | $— | | | | $1,798,535,820 | | | | $— | | | | $1,798,535,820 | |
| Mutual Funds | | | 52,937,892 | | | | — | | | | — | | | | 52,937,892 | |
| Total | | | $52,937,892 | | | | $1,798,535,820 | | | | $— | | | | $1,851,473,712 | |
For further information regarding security characteristics, see the Portfolio of Investments.
Indemnifications – Under the fund’s organizational documents, its officers and Trustees may be indemnified against certain liabilities and expenses arising out of the performance of their duties to the fund. Additionally, in the normal course of business, the fund enters into agreements with service providers that may contain indemnification clauses. The fund’s maximum exposure under these agreements is unknown as this would involve future claims that may be made against the fund that have not yet occurred.
Investment Transactions and Income – Investment transactions are recorded on the trade date. Interest income is recorded on the accrual basis. All premium and discount is amortized or accreted for financial statement purposes in accordance with U.S. generally accepted accounting principles. Interest payments received in additional securities are recorded on the ex-interest date in an amount equal to the value of the security on such date.
The fund may receive proceeds from litigation settlements. Any proceeds received from litigation involving portfolio holdings are reflected in the Statement of Operations in realized gain/loss if the security has been disposed of by the fund or in unrealized gain/loss if the security is still held by the fund. Any other proceeds from litigation not related to portfolio holdings are reflected as other income in the Statement of Operations.
64
Notes to Financial Statements – continued
Fees Paid Indirectly – The fund’s custody fee may be reduced by a credit earned under an arrangement that measures the value of U.S. dollars deposited with the custodian by the fund. The amount of the credit, for the year ended April 30, 2018, is shown as a reduction of total expenses in the Statement of Operations.
Tax Matters and Distributions – The fund intends to qualify as a regulated investment company, as defined under Subchapter M of the Internal Revenue Code, and to distribute all of its taxable and tax-exempt income, including realized capital gains. As a result, no provision for federal income tax is required. The fund’s federal tax returns, when filed, will remain subject to examination by the Internal Revenue Service for a three year period. Management has analyzed the fund’s tax positions taken on federal and state tax returns for all open tax years and does not believe that there are any uncertain tax positions that require recognition of a tax liability.
Distributions to shareholders are recorded on the ex-dividend date. Income and capital gain distributions are determined in accordance with income tax regulations, which may differ from U.S. generally accepted accounting principles. Certain capital accounts in the financial statements are periodically adjusted for permanent differences in order to reflect their tax character. These adjustments have no impact on net assets or net asset value per share. Temporary differences which arise from recognizing certain items of income, expense, gain or loss in different periods for financial statement and tax purposes will reverse at some time in the future. Distributions in excess of net investment income or net realized gains are temporary overdistributions for financial statement purposes resulting from differences in the recognition or classification of income or distributions for financial statement and tax purposes.
Book/tax differences primarily relate to amortization and accretion of debt securities.
The tax character of distributions declared to shareholders for the last two fiscal years is as follows:
| | | | | | | | |
| | | Year ended
4/30/18 | | | Year ended
4/30/17 | |
| Ordinary income (including any short-term capital gains) | | | $563,002 | | | | $10,677 | |
| Tax-exempt income | | | 36,350,286 | | | | 30,927,658 | |
| Total distributions | | | $36,913,288 | | | | $30,938,335 | |
The federal tax cost and the tax basis components of distributable earnings were as follows:
| | | | |
| As of 4/30/18 | | | |
| Cost of investments | | | $1,850,856,855 | |
| Gross appreciation | | | 13,652,796 | |
| Gross depreciation | | | (13,035,939 | ) |
| Net unrealized appreciation (depreciation) | | | $616,857 | |
| Undistributed ordinary income | | | 150,812 | |
| Undistributed tax-exempt income | | | 2,348,987 | |
| Capital loss carryforwards | | | (11,874,179 | ) |
| Other temporary differences | | | (3,384,453 | ) |
65
Notes to Financial Statements – continued
As of April 30, 2018, the fund had capital loss carryforwards available to offset future realized gains. These net capital losses may be carried forward indefinitely and their character is retained as short-term and/or long-term losses. Such losses are characterized as follows:
Multiple Classes of Shares of Beneficial Interest – The fund offers multiple classes of shares, which differ in their respective distribution and service fees. The fund’s income and common expenses are allocated to shareholders based on the value of settled shares outstanding of each class. The fund’s realized and unrealized gain (loss) are allocated to shareholders based on the daily net assets of each class. Dividends are declared separately for each class. Differences in per share dividend rates are generally due to differences in separate class expenses. Class B shares will convert to Class A shares approximately eight years after purchase. Effective April 23, 2018, Class C shares will convert to Class A shares approximately ten years after purchase. The fund’s distributions declared to shareholders as reported in the Statements of Changes in Net Assets are presented by class as follows:
| | | | | | | | |
| | | From net investment
income | |
| | | Year
ended
4/30/18 (i) | | | Year
ended
4/30/17 | |
| Class A | | | $14,066,117 | | | | $13,676,488 | |
| Class B | | | 16,177 | | | | 20,262 | |
| Class C | | | 1,474,474 | | | | 1,490,183 | |
| Class I | | | 19,845,772 | | | | 15,751,402 | |
| Class R6 | | | 1,510,748 | | | | — | |
| Total | | | $36,913,288 | | | | $30,938,335 | |
| (i) | For Class R6, the period is from the class inception, September 1, 2017, through the stated period end. |
(3) Transactions with Affiliates
Investment Adviser – The fund has an investment advisory agreement with MFS to provide overall investment management and related administrative services and facilities to the fund. The management fee is computed daily and paid monthly at an annual rate of 0.40% of the fund’s average daily net assets.
MFS has agreed in writing to reduce its management fee by a specified amount if certain MFS mutual fund assets exceed thresholds agreed to by MFS and the fund’s Board of Trustees. For the year ended April 30, 2018, this management fee reduction amounted to $148,216, which is included in the reduction of total expenses in the Statement of Operations. The management fee incurred for the year ended April 30, 2018 was equivalent to an annual effective rate of 0.39% of the fund’s average daily net assets.
For the period May 1, 2017 through August 27, 2017, the investment adviser had agreed in writing to pay a portion of the fund’s operating expenses, excluding management fee, distribution and service fees, interest, taxes, extraordinary expenses, brokerage and transaction costs, and investment-related expenses, such that fund
66
Notes to Financial Statements – continued
operating expenses did not exceed 0.15% annually of the fund’s average daily net assets. This written agreement was terminated on August 27, 2017. For the period May 1, 2017 through August 27, 2017, the fund’s actual operating expenses did not exceed the limit and therefore, the investment adviser did not pay any portion of the fund’s expenses related to this agreement.
Effective August 28, 2017, the investment adviser has agreed in writing to pay a portion of the fund’s total annual operating expenses, excluding interest, taxes, extraordinary expenses, brokerage and transaction costs, and investment-related expenses, such that total fund operating expenses do not exceed the following rates annually of each class’s average daily net assets:
| | | | | | | | | | | | | | | | | | |
| Class A | | | Class B | | | Class C | | | Class I | | | Class R6 | |
| | 0.69% | | | | 1.44 | % | | | 1.54 | % | | | 0.54 | % | | | 0.46 | % |
This written agreement will continue until modified by the fund’s Board of Trustees, but such agreement will continue at least until August 31, 2018. For the period August 28, 2017 through April 30, 2018, the fund’s actual operating expenses did not exceed the limit and therefore, the investment adviser did not pay any portion of the fund’s expenses related to this agreement.
Distributor – MFS Fund Distributors, Inc. (MFD), a wholly-owned subsidiary of MFS, as distributor, received $64,294 for the year ended April 30, 2018, as its portion of the initial sales charge on sales of Class A shares of the fund.
The Board of Trustees has adopted a distribution plan for certain share classes pursuant to Rule 12b-1 of the Investment Company Act of 1940.
The fund’s distribution plan provides that the fund will pay MFD for services provided by MFD and financial intermediaries in connection with the distribution and servicing of certain share classes. One component of the plan is a distribution fee paid to MFD and another component of the plan is a service fee paid to MFD. MFD may subsequently pay all, or a portion, of the distribution and/or service fees to financial intermediaries.
Distribution Plan Fee Table:
| | | | | | | | | | | | | | | | | | | | |
| | | Distribution
Fee Rate (d) | | | Service
Fee Rate (d) | | | Total
Distribution
Plan (d) | | | Annual
Effective
Rate (e) | | | Distribution
and Service
Fee | |
| Class A | | | — | | | | 0.25% | | | | 0.25% | | | | 0.15% | | | | $1,685,444 | |
| Class B | | | 0.75% | | | | 0.25% | | | | 1.00% | | | | 0.90% | | | | 12,050 | |
| Class C | | | 0.75% | | | | 0.25% | | | | 1.00% | | | | 1.00% | | | | 1,189,205 | |
| Total Distribution and Service Fees | | | | $2,886,699 | |
| (d) | In accordance with the distribution plan for certain classes, the fund pays distribution and/or service fees equal to these annual percentage rates of each class’s average daily net assets. The distribution and service fee rates disclosed by class represent the current rates in effect at the end of the reporting period. Any rate changes, if applicable, are detailed below. |
| (e) | The annual effective rates represent actual fees incurred under the distribution plan for the year ended April 30, 2018 based on each class’s average daily net assets. 0.10% of the Class A service fee is currently being waived under a written waiver arrangement. For the year ended April 30, 2018, this waiver amounted to $674,173 and is included in the reduction of total expenses in the Statement of Operations. This written waiver agreement will continue until modified by the fund’s Board of Trustees, but such agreement will continue at least until |
67
Notes to Financial Statements – continued
| | August 31, 2018. For one year from the date of purchase of Class B shares, assets attributable to such Class B shares were subject to the 0.25% annual Class B service fee. On assets attributable to all other Class B shares, 0.15% of the Class B service fee was paid by the fund and 0.10% of the Class B service fee was being waived under a written waiver agreement. This agreement terminated on August 27, 2017. For the period May 1, 2017 through August 27, 2017, this waiver amounted to $374 and is included in the reduction of total expenses in the Statement of Operations. Effective August 28, 2017, MFD has agreed in writing to reduce the Class B service fee rate to 0.15% for all Class B shares. This written agreement will continue until modified by the fund’s Board of Trustees, but such agreement will continue at least until August 31, 2018. For the period August 28, 2017 to April 30, 2018, this waiver amounted to $816 and is included in the reduction of total expenses on the Statement of Operations. MFD has voluntarily agreed to rebate a portion of each class’s 0.25% service fee attributable to accounts for which MFD retains the 0.25% service fee except for accounts attributable to MFS or its affiliates’ seed money. For the year ended April 30, 2018, this rebate amounted to $3,162 and $15 for Class A and Class C, respectively, and is included in the reduction of total expenses in the Statement of Operations. |
Certain Class A shares are subject to a contingent deferred sales charge (CDSC) in the event of a shareholder redemption within 18 months of purchase. Class B shares are subject to a CDSC in the event of a shareholder redemption within six years of purchase. Class C shares are subject to a CDSC in the event of a shareholder redemption within 12 months of purchase. All contingent deferred sales charges are paid to MFD and during the year ended April 30, 2018, were as follows:
| | | | |
| | | Amount | |
| Class A | | | $56,134 | |
| Class B | | | 1,786 | |
| Class C | | | 11,098 | |
Shareholder Servicing Agent – MFS Service Center, Inc. (MFSC), a wholly-owned subsidiary of MFS, receives a fee from the fund for its services as shareholder servicing agent calculated as a percentage of the average daily net assets of the fund as determined periodically under the supervision of the fund’s Board of Trustees. For the year ended April 30, 2018, the fee was $65,189, which equated to 0.0037% annually of the fund’s average daily net assets. MFSC also receives payment from the fund for out-of-pocket expenses, sub-accounting and other shareholder servicing costs which may be paid to affiliated and unaffiliated service providers. Class R6 shares do not incur sub-accounting fees. For the year ended April 30, 2018, these out-of-pocket expenses, sub-accounting and other shareholder servicing costs amounted to $1,464,433.
Administrator – MFS provides certain financial, legal, shareholder communications, compliance, and other administrative services to the fund. Under an administrative services agreement, the fund reimburses MFS the costs incurred to provide these services. The fund is charged an annual fixed amount of $17,500 plus a fee based on average daily net assets. The administrative services fee incurred for the year ended April 30, 2018 was equivalent to an annual effective rate of 0.0160% of the fund’s average daily net assets.
Trustees’ and Officers’ Compensation – The fund pays compensation to independent Trustees in the form of a retainer, attendance fees, and additional compensation to Board and Committee chairpersons. The fund does not pay compensation directly to Trustees or officers of the fund who are also officers of the
68
Notes to Financial Statements – continued
investment adviser, all of whom receive remuneration for their services to the fund from MFS. Certain officers and Trustees of the fund are officers or directors of MFS, MFD, and MFSC.
Prior to December 31, 2001, the fund had an unfunded defined benefit plan (“DB plan”) for independent Trustees. As of December 31, 2001, the Board took action to terminate the DB plan with respect to then-current and any future independent Trustees, such that the DB plan covers only certain of those former independent Trustees who retired on or before December 31, 2001. The DB plan resulted in a pension expense of $165 and is included in “Independent Trustees’ compensation” in the Statement of Operations for the year ended April 30, 2018. The liability for deferred retirement benefits payable to certain independent Trustees under the DB plan amounted to $1,415 at April 30, 2018, and is included in “Payable for independent Trustees’ compensation” in the Statement of Assets and Liabilities.
Other – This fund and certain other funds managed by MFS (the funds) have entered into a service agreement (the ISO Agreement) which provides for payment of fees solely by the funds to Tarantino LLC in return for the provision of services of an Independent Senior Officer (ISO) for the funds. Frank L. Tarantino serves as the ISO and is an officer of the funds and the sole member of Tarantino LLC. The funds can terminate the ISO Agreement with Tarantino LLC at any time under the terms of the ISO Agreement. For the year ended April 30, 2018, the fee paid by the fund under this agreement was $2,955 and is included in “Miscellaneous” expense in the Statement of Operations. MFS has agreed to bear all expenses associated with office space, other administrative support, and supplies provided to the ISO.
The fund invests in the MFS Institutional Money Market Portfolio which is managed by MFS and seeks current income consistent with preservation of capital and liquidity. This money market fund does not pay a management fee to MFS.
On August 31, 2017, MFS purchased 6,105 shares of Class R6 for an aggregate amount of $50,000 as an initial investment in the class.
The fund is permitted to engage in purchase and sale transactions with funds and accounts for which MFS serves as investment adviser or sub-adviser (“cross-trades”) pursuant to a policy adopted by the Board of Trustees. This policy has been designed to ensure that cross-trades conducted by the fund comply with Rule 17a-7 under the Investment Company Act of 1940. During the year ended April 30, 2018, the fund engaged in purchase transactions pursuant to this policy, which amounted to $10,004.
(4) Portfolio Securities
For the year ended April 30, 2018, purchases and sales of investments, other than short-term obligations, aggregated $786,753,952 and $557,919,377, respectively.
69
Notes to Financial Statements – continued
(5) Shares of Beneficial Interest
The fund’s Declaration of Trust permits the Trustees to issue an unlimited number of full and fractional shares of beneficial interest. Transactions in fund shares were as follows:
| | | | | | | | | | | | | | | | |
| | | Year ended
4/30/18 (i) | | | Year ended
4/30/17 | |
| | | Shares | | | Amount | | | Shares | | | Amount | |
| Shares sold | | | | | | | | | | | | | | | | |
Class A | | | 30,011,627 | | | | $243,393,478 | | | | 37,290,782 | | | | $303,326,566 | |
Class B | | | 17,603 | | | | 141,979 | | | | 22,597 | | | | 181,428 | |
Class C | | | 1,789,440 | | | | 14,531,149 | | | | 2,779,373 | | | | 22,719,404 | |
Class I | | | 55,969,021 | | | | 453,762,080 | | | | 65,802,877 | | | | 533,188,265 | |
Class R6 | | | 36,677,320 | | | | 294,119,999 | | | | — | | | | — | |
| | | 124,465,011 | | | | $1,005,948,685 | | | | 105,895,629 | | | | $859,415,663 | |
| | | |
Shares issued to shareholders in
reinvestment of distributions | | | | | | | | | | | | | |
Class A | | | 1,600,860 | | | | $12,973,636 | | | | 1,523,843 | | | | $12,417,927 | |
Class B | | | 1,655 | | | | 13,408 | | | | 1,977 | | | | 16,098 | |
Class C | | | 159,242 | | | | 1,291,771 | | | | 156,105 | | | | 1,272,227 | |
Class I | | | 1,895,917 | | | | 15,364,209 | | | | 1,487,630 | | | | 12,094,973 | |
Class R6 | | | 185,507 | | | | 1,483,176 | | | | — | | | | — | |
| | | 3,843,181 | | | | $31,126,200 | | | | 3,169,555 | | | | $25,801,225 | |
| | | |
| Shares reacquired | | | | | | | | | | | | | |
Class A | | | (24,903,275 | ) | | | $(201,852,682 | ) | | | (44,378,845 | ) | | | $(359,627,209 | ) |
Class B | | | (61,829 | ) | | | (500,336 | ) | | | (92,267 | ) | | | (747,652 | ) |
Class C | | | (4,575,855 | ) | | | (37,092,097 | ) | | | (4,083,119 | ) | | | (33,187,772 | ) |
Class I | | | (71,206,467 | ) | | | (574,632,357 | ) | | | (38,400,449 | ) | | | (310,731,836 | ) |
Class R6 | | | (1,666,711 | ) | | | (13,340,218 | ) | | | — | | | | — | |
| | | (102,414,137 | ) | | | $(827,417,690 | ) | | | (86,954,680 | ) | | | $(704,294,469 | ) |
| | | |
| Net change | | | | | | | | | | | | | |
Class A | | | 6,709,212 | | | | $54,514,432 | | | | (5,564,220 | ) | | | $(43,882,716 | ) |
Class B | | | (42,571 | ) | | | (344,949 | ) | | | (67,693 | ) | | | (550,126 | ) |
Class C | | | (2,627,173 | ) | | | (21,269,177 | ) | | | (1,147,641 | ) | | | (9,196,141 | ) |
Class I | | | (13,341,529 | ) | | | (105,506,068 | ) | | | 28,890,058 | | | | 234,551,402 | |
Class R6 | | | 35,196,116 | | | | 282,262,957 | | | | — | | | | — | |
| | | 25,894,055 | | | | $209,657,195 | | | | 22,110,504 | | | | $180,922,419 | |
| (i) | For Class R6, the period is from the class inception, September 1, 2017, through the stated period end. |
Effective May 1, 2006, the sale of Class B shares of the fund have been suspended except in certain circumstances. Please see the fund’s prospectus for details.
Class T shares were not publicly available for sale during the period. Please see the fund’s prospectus for details.
70
Notes to Financial Statements – continued
(6) Line of Credit
The fund and certain other funds managed by MFS participate in a $1.25 billion unsecured committed line of credit, subject to a $1 billion sublimit, provided by a syndication of banks under a credit agreement. Borrowings may be made for temporary financing needs. Interest is charged to each fund, based on its borrowings, generally at a rate equal to the higher of the Overnight Federal Reserve funds rate or daily one month LIBOR plus an agreed upon spread. A commitment fee, based on the average daily, unused portion of the committed line of credit, is allocated among the participating funds at the end of each calendar quarter. In addition, the fund and other funds managed by MFS have established unsecured uncommitted borrowing arrangements with certain banks for temporary financing needs. Interest is charged to each fund, based on its borrowings, at a rate equal to the Overnight Federal Reserve funds rate plus an agreed upon spread. For the year ended April 30, 2018, the fund’s commitment fee and interest expense were $11,942 and $0, respectively, and are included in “Miscellaneous” expense in the Statement of Operations.
(7) Investments in Affiliated Issuers
An affiliated issuer may be considered one in which the fund owns 5% or more of the outstanding voting securities, or a company which is under common control. For the purposes of this report, the fund assumes the following to be affiliated issuers:
| | | | | | | | | | | | | | | | | | | | |
| Affiliated Issuers | | | | | Beginning
Shares/Par
Amount | | | Acquisitions
Shares/Par
Amount | | | Dispositions
Shares/Par
Amount | | | Ending
Shares/Par
Amount | |
| MFS Institutional Money Market Portfolio | | | | | | | 7,703,418 | | | | 541,898,401 | | | | (496,658,633 | ) | | | 52,943,186 | |
| | | | | |
| Affiliated Issuers | | Realized
Gain (Loss) | | | Change in
Unrealized
Appreciation
(Depreciation) | | | Capital Gain
Distributions | | | Dividend
Income | | | Ending
Value | |
| MFS Institutional Money Market Portfolio | | | $(3,984 | ) | | | $1,191 | | | | $— | | | | $579,975 | | | | $52,937,892 | |
71
REPORT OF INDEPENDENT REGISTERED PUBLIC ACCOUNTING FIRM
To the Board of Trustees of MFS Series Trust IX and the Shareholders of MFS Municipal Limited Maturity Fund:
Opinion on the Financial Statements and Financial Highlights
We have audited the accompanying statement of assets and liabilities of MFS Municipal Limited Maturity Fund (the “Fund”), including the portfolio of investments, as of April 30, 2018, the related statement of operations for the year then ended, the statements of changes in net assets for each of the two years in the period then ended, the financial highlights for each of the five years in the period then ended, and the related notes. In our opinion, the financial statements and financial highlights present fairly, in all material respects, the financial position of the Fund as of April 30, 2018, and the results of its operations for the year then ended, the changes in its net assets for each of the two years in the period then ended, and the financial highlights for each of the five years in the period then ended, in conformity with accounting principles generally accepted in the United States of America.
Basis for Opinion
These financial statements and financial highlights are the responsibility of the Fund’s management. Our responsibility is to express an opinion on the Fund’s financial statements and financial highlights based on our audits. We are a public accounting firm registered with the Public Company Accounting Oversight Board (United States) (PCAOB) and are required to be independent with respect to the Fund in accordance with the U.S. federal securities laws and the applicable rules and regulations of the Securities and Exchange Commission and the PCAOB.
We conducted our audits in accordance with the standards of the PCAOB. Those standards require that we plan and perform the audit to obtain reasonable assurance about whether the financial statements and financial highlights are free of material misstatement, whether due to error or fraud. The Fund is not required to have, nor were we engaged to perform, an audit of its internal control over financial reporting. As part of our audits we are required to obtain an understanding of internal control over financial reporting but not for the purpose of expressing an opinion on the effectiveness of the Fund’s internal control over financial reporting. Accordingly, we express no such opinion. Our audits included performing procedures to assess the risks of material misstatement of the financial statements and financial highlights, whether due to error or fraud, and performing procedures that respond to those risks. Such procedures included examining, on a test basis, evidence regarding the amounts and disclosures in the financial statements and financial highlights.
Our audits also included evaluating the accounting principles used and significant estimates made by management, as well as evaluating the overall presentation of the financial statements and financial highlights. Our procedures included confirmation of securities owned as of April 30, 2018, by correspondence with the custodian and brokers; when replies were not received from brokers, we performed other auditing procedures. We believe that our audits provide a reasonable basis for our opinion.
DELOITTE & TOUCHE LLP
Boston, Massachusetts
June 18, 2018
We have served as the auditor of one or more of the MFS investment companies since 1924.
72
TRUSTEES AND OFFICERS — IDENTIFICATION AND BACKGROUND
The Trustees and Officers of the Trust, as of June 1, 2018, are listed below, together with their principal occupations during the past five years. (Their titles may have varied during that period.) The address of each Trustee and Officer is 111 Huntington Avenue, Boston, Massachusetts 02199-7618.
| | | | | | | | | | |
Name, Age | | Position(s) Held
with Fund | | Trustee/Officer Since (h) | | Number of MFS Funds overseen by the Trustee | | Principal
Occupations During the Past Five Years | | Other Directorships
During the Past
Five Years (j) |
| INTERESTED TRUSTEES |
Robert J. Manning (k) (age 54) | | Trustee | | February 2004 | | 135 | | Massachusetts Financial Services Company, Executive Chairman (since January 2017); Director; Chairman of the Board; Chief Executive Officer (until 2015); Co-Chief Executive Officer (2015-2016) | | N/A |
Robin A. Stelmach (k) (age 56) | | Trustee | | January 2014 | | 135 | | Massachusetts Financial Services Company, Vice Chair (since January 2017); Chief Operating Officer and Executive Vice President (until January 2017) | | N/A |
| INDEPENDENT TRUSTEES |
John P. Kavanaugh (age 63) | | Trustee and Chair of Trustees | | January 2009 | | 135 | | Private investor | | N/A |
73
Trustees and Officers – continued
| | | | | | | | | | |
Name, Age | | Position(s) Held
with Fund | | Trustee/Officer Since (h) | | Number of MFS Funds overseen by the Trustee | | Principal
Occupations During the Past Five Years | | Other Directorships
During the Past
Five Years (j) |
Steven E. Buller (age 66) | | Trustee | | February 2014 | | 135 | | Financial Accounting Standards Advisory Council, Chairman (2014-2015); Public Company Accounting Oversight Board, Standing Advisory Group, Member (until 2014); BlackRock, Inc. (investment management), Managing Director (until 2014), BlackRock Finco UK (investment management), Director (until 2014) | | N/A |
John A. Caroselli (age 63) | | Trustee | | March 2017 | | 135 | | JC Global Advisors, LLC (management consulting), President (since 2015); First Capital Corporation (commercial finance), Executive Vice President (until 2015) | | N/A |
Maureen R. Goldfarb (age 63) | | Trustee | | January 2009 | | 135 | | Private investor | | N/A |
Michael Hegarty (age 73) | | Trustee | | December 2004 | | 135 | | Private investor | | Rouse Properties Inc., Director (until 2016); Capmark Financial Group Inc., Director (until 2015) |
Clarence Otis, Jr. (age 62) | | Trustee | | March 2017 | | 135 | | Darden Restaurants, Inc., Chief Executive Officer (until 2014) | | VF Corporation, Director; Verizon Communications, Inc., Director; The Travelers Companies, Director; Federal Reserve Bank of Atlanta, Director (until 2015) |
74
Trustees and Officers – continued
| | | | | | | | | | |
Name, Age | | Position(s) Held
with Fund | | Trustee/Officer Since (h) | | Number of MFS Funds overseen by the Trustee | | Principal
Occupations During the Past Five Years | | Other Directorships
During the Past
Five Years (j) |
Maryanne L. Roepke (age 62) | | Trustee | | May 2014 | | 135 | | American Century Investments (investment management), Senior Vice President and Chief Compliance Officer (until 2014) | | N/A |
Laurie J. Thomsen (age 60) | | Trustee | | March 2005 | | 135 | | Private investor | | The Travelers Companies, Director; Dycom Industries, Inc., Director (since 2015) |
| | | | | | | | |
Name, Age | | Position(s) Held with Fund | | Trustee/Officer
Since (h) | | Number of MFS
Funds for which the
Person is an Officer | | Principal
Occupations During the Past Five Years |
| OFFICERS | | | | | | | | |
Christopher R. Bohane (k) (age 44) | | Assistant Secretary and Assistant Clerk | | July 2005 | | 135 | | Massachusetts Financial Services Company, Vice President and Assistant General Counsel |
Kino Clark (k) (age 49) | | Assistant Treasurer | | January 2012 | | 135 | | Massachusetts Financial Services Company, Vice President |
John W. Clark, Jr. (k) (age 51) | | Assistant Treasurer | | April 2017 | | 135 | | Massachusetts Financial Services Company, Vice President (since March 2017); Deutsche Bank (financial services), Department Head – Treasurer’s Office (until February 2017) |
Thomas H. Connors (k) (age 58) | | Assistant Secretary and Assistant Clerk | | September 2012 | | 135 | | Massachusetts Financial Services Company, Vice President and Senior Counsel |
75
Trustees and Officers – continued
| | | | | | | | |
Name, Age | | Position(s) Held with Fund | | Trustee/Officer
Since (h) | | Number of MFS
Funds for which the
Person is an Officer | | Principal
Occupations During the Past Five Years |
Ethan D. Corey (k) (age 54) | | Assistant Secretary and Assistant Clerk | | July 2005 | | 135 | | Massachusetts Financial Services Company, Senior Vice President and Associate General Counsel |
David L. DiLorenzo (k) (age 49) | | President | | July 2005 | | 135 | | Massachusetts Financial Services Company, Senior Vice President |
Heidi W. Hardin (k) (age 50) | | Secretary and Clerk | | April 2017 | | 135 | | Massachusetts Financial Services Company, Executive Vice President and General Counsel (since March 2017); Harris Associates (investment management), General Counsel (from September 2015 to January 2017); Janus Capital Management LLC (investment management), Senior Vice President and General Counsel (until September 2015) |
Brian E. Langenfeld (k) (age 45) | | Assistant Secretary and Assistant Clerk | | June 2006 | | 135 | | Massachusetts Financial Services Company, Vice President and Senior Counsel |
Susan A. Pereira (k) (age 47) | | Assistant Secretary and Assistant Clerk | | July 2005 | | 135 | | Massachusetts Financial Services Company, Vice President and Senior Counsel |
Kasey L. Phillips (k) (age 47) | | Assistant Treasurer | | September 2012 | | 135 | | Massachusetts Financial Services Company, Vice President |
76
Trustees and Officers – continued
| | | | | | | | |
Name, Age | | Position(s) Held with Fund | | Trustee/Officer
Since (h) | | Number of MFS
Funds for which the
Person is an Officer | | Principal
Occupations During the Past Five Years |
Matthew A. Stowe (k) (age 43) | | Assistant Secretary and Assistant Clerk | | October 2014 | | 135 | | Massachusetts Financial Services Company, Vice President and Assistant General Counsel |
Frank L. Tarantino (age 74) | | Independent Senior Officer | | June 2004 | | 135 | | Tarantino LLC (provider of compliance services), Principal |
Richard S. Weitzel (k) (age 47) | | Assistant Secretary and Assistant Clerk | | October 2007 | | 135 | | Massachusetts Financial Services Company, Senior Vice President and Associate General Counsel |
Martin J. Wolin (k) (age 50) | | Chief Compliance Officer | | July 2015 | | 135 | | Massachusetts Financial Services Company, Senior Vice President and Chief Compliance Officer (since July 2015); Mercer (financial service provider), Chief Risk and Compliance Officer, North America and Latin America (until June 2015) |
James O. Yost (k) (age 57) | | Treasurer | | September 1990 | | 135 | | Massachusetts Financial Services Company, Senior Vice President |
| (h) | Date first appointed to serve as Trustee/officer of an MFS Fund. Each Trustee has served continuously since appointment unless indicated otherwise. For the period from December 15, 2004 until February 22, 2005, Mr. Manning served as Advisory Trustee. Prior to January 2012, Messrs. DiLorenzo and Yost served as Assistant Treasurers of the Funds. From January 2012 through December 2016, Messrs. DiLorenzo and Yost served as Treasurer and Deputy Treasurer of the Funds, respectively. |
| (j) | Directorships or trusteeships of companies required to report to the Securities and Exchange Commission (i.e., “public companies”). |
| (k) | “Interested person” of the Trust within the meaning of the Investment Company Act of 1940 (referred to as the 1940 Act), which is the principal federal law governing investment companies like the fund, as a result of a position with MFS. The address of MFS is 111 Huntington Avenue, Boston, Massachusetts 02199-7618. |
77
Trustees and Officers – continued
Each Trustee has been elected by shareholders and each Trustee and officer holds office until his or her successor is chosen and qualified or until his or her earlier death, resignation, retirement or removal. The Trust does not hold annual meetings for the purpose of electing Trustees, and Trustees are not elected for fixed terms. Under the terms of the Board’s retirement policy, an Independent Trustee shall retire at the end of the calendar year in which he or she reaches the earlier of 75 years of age or 15 years of service on the Board (or, in the case of any Independent Trustee who joined the Board prior to 2015, 20 years of service on the Board).
Messrs. Buller and Otis and Ms. Roepke are members of the Trust’s Audit Committee.
Each of the Interested Trustees and certain Officers hold comparable officer positions with certain affiliates of MFS.
The Statement of Additional Information for a Fund includes further information about the Trustees and is available without charge upon request by calling 1-800-225-2606.
| | |
| Investment Adviser | | Custodian |
Massachusetts Financial Services Company
111 Huntington Avenue
Boston, MA 02199-7618 | | JPMorgan Chase Bank, NA 4 Metrotech Center New York, NY 11245 |
| Distributor | | Independent Registered Public Accounting Firm |
MFS Fund Distributors, Inc.
111 Huntington Avenue
Boston, MA 02199-7618 | | Deloitte & Touche LLP 200 Berkeley Street Boston, MA 02116 |
| Portfolio Manager(s) | | |
| Jason Kosty | | |
| Geoffrey Schechter | | |
78
PROXY VOTING POLICIES AND INFORMATION
MFS votes proxies on behalf of the fund pursuant to proxy voting policies and procedures that are available without charge, upon request, by calling 1-800-225-2606, by visiting mfs.com/proxyvoting, or by visiting the SEC’s Web site at http://www.sec.gov.
Information regarding how the fund voted proxies relating to portfolio securities during the most recent twelve-month period ended June 30 is available by August 31 of each year without charge by visiting mfs.com/proxyvoting, or by visiting the SEC’s Web site at http://www.sec.gov.
QUARTERLY PORTFOLIO DISCLOSURE
The fund will file a complete schedule of portfolio holdings with the Securities and Exchange Commission (the Commission) for the first and third quarters of each fiscal year on Form N-Q. A shareholder can obtain the quarterly portfolio holdings report at mfs.com. The fund’s Form N-Q is also available on the EDGAR database on the Commission’s Internet Web site at http://www.sec.gov, and may be reviewed and copied at the:
Public Reference Room
Securities and Exchange Commission
100 F Street, NE, Room 1580
Washington, D.C. 20549
Information on the operation of the Public Reference Room may be obtained by calling the Commission at 1-800-SEC-0330. Copies of the fund’s Form N-Q also may be obtained, upon payment of a duplicating fee, by electronic request at the following e-mail address: publicinfo@sec.gov or by writing the Public Reference Section at the above address.
FURTHER INFORMATION
From time to time, MFS may post important information about the fund or the MFS funds on the MFS web site (mfs.com). This information is available at https://www.mfs.com/en-us/what-we-do/announcements.html or at mfs.com/openendfunds by choosing the fund’s name.
79
INFORMATION ABOUT FUND CONTRACTS AND LEGAL CLAIMS
The fund has entered into contractual arrangements with an investment adviser, administrator, distributor, shareholder servicing agent, 529 program manager (if applicable), and custodian who each provide services to the fund. Unless expressly stated otherwise, shareholders are not parties to, or intended beneficiaries of these contractual arrangements, and these contractual arrangements are not intended to create any shareholder right to enforce them against the service providers or to seek any remedy under them against the service providers, either directly or on behalf of the fund.
Under the Trust’s By-Laws and Declaration of Trust, any claims asserted against or on behalf of the MFS Funds, including claims against Trustees and Officers, must be brought in state and federal courts located within the Commonwealth of Massachusetts.
FEDERAL TAX INFORMATION (unaudited)
The fund will notify shareholders of amounts for use in preparing 2018 income tax forms in January 2019. The following information is provided pursuant to provisions of the Internal Revenue Code.
Of the dividends paid from net investment income during the fiscal year, 98.47% is designated as exempt interest dividends for federal income tax purposes. If the fund has earned income on private activity bonds, a portion of the dividends paid may be considered a tax preference item for purposes of computing a shareholder’s alternative minimum tax.
80
rev. 3/16
| | | | |
| | | |
FACTS | | WHAT DOES MFS DO WITH YOUR PERSONAL INFORMATION? | |  |
| | |
| Why? | | Financial companies choose how they share your personal information. Federal law gives consumers the right to limit some but not all sharing. Federal law also requires us to tell you how we collect, share, and protect your personal information. Please read this notice carefully to understand what we do. |
| | |
| What? | | The types of personal information we collect and share depend on the product or service you have with us. This information can include: • Social Security number and account balances • Account transactions and transaction history • Checking account information and wire transfer instructions When you are no longer our customer, we continue to share your information as described in this notice. |
| | |
| How? | | All financial companies need to share customers’ personal information to run their everyday business. In the section below, we list the reasons financial companies can share their customers’ personal information; the reasons MFS chooses to share; and whether you can limit this sharing. |
| | | | |
Reasons we can share your
personal information | | Does MFS
share? | | Can you limit
this sharing? |
For our everyday business purposes – such as to process your transactions, maintain your account(s), respond to court orders and legal investigations, or report to credit bureaus | | Yes | | No |
For our marketing purposes – to offer our products and services to you | | No | | We don’t share |
For joint marketing with other financial companies | | No | | We don’t share |
For our affiliates’ everyday business purposes – information about your transactions and experiences | | No | | We don’t share |
For our affiliates’ everyday business purposes – information about your creditworthiness | | No | | We don’t share |
| For nonaffiliates to market to you | | No | | We don’t share |
| | |
| Questions? | | Call 800-225-2606 or go to mfs.com. |
81
| | |
| Who we are |
| Who is providing this notice? | | MFS Funds, MFS Investment Management, MFS Institutional Advisors, Inc., and MFS Heritage Trust Company. |
| | |
| What we do |
| How does MFS protect my personal information? | | To protect your personal information from unauthorized access and use, we use security measures that comply with federal law. These measures include procedural, electronic, and physical safeguards for the protection of the personal information we collect about you. |
| How does MFS collect my personal information? | | We collect your personal information, for example, when you • open an account or provide account information • direct us to buy securities or direct us to sell your securities • make a wire transfer We also collect your personal information from others, such as credit bureaus, affiliates, or other companies. |
| Why can’t I limit all sharing? | | Federal law gives you the right to limit only • sharing for affiliates’ everyday business purposes – information about your creditworthiness • affiliates from using your information to market to you • sharing for nonaffiliates to market to you State laws and individual companies may give you additional rights to limit sharing. |
| | |
| Definitions |
| Affiliates | | Companies related by common ownership or control. They can be financial and nonfinancial companies. • MFS does not share personal information with affiliates, except for everyday business purposes as described on page one of this notice. |
| Nonaffiliates | | Companies not related by common ownership or control. They can be financial and nonfinancial companies. • MFS does not share with nonaffiliates so they can market to you. |
| Joint marketing | | A formal agreement between nonaffiliated financial companies that together market financial products or services to you. • MFS doesn’t jointly market. |
| | |
| Other important information |
| If you own an MFS product or receive an MFS service in the name of a third party such as a bank or broker-dealer, their privacy policy may apply to you instead of ours. |
82
Save paper with eDelivery.

| MFS® will send you prospectuses, |
reports, and proxies directly via e-mail so you will get information faster with less mailbox clutter.
To sign up:
1. Go to mfs.com.
2. Log in via MFS® Access.
3. Select eDelivery.
If you own your MFS fund shares through a financial institution or a retirement plan, MFS® TALK, MFS® Access, or eDelivery may not be available to you.
CONTACT
WEB SITE
mfs.com
MFS TALK
1-800-637-8255
24 hours a day
ACCOUNT SERVICE AND LITERATURE
Shareholders
1-800-225-2606
Financial advisors
1-800-343-2829
Retirement plan services
1-800-637-1255
MAILING ADDRESS
MFS Service Center, Inc.
P.O. Box 55824
Boston, MA 02205-5824
OVERNIGHT MAIL
MFS Service Center, Inc.
c/o DST Asset Manager Solutions, Inc.
30 Dan Road
Canton, MA 02021-2809
Annual Report
April 30, 2018

MFS® Total Return Bond Fund

RBF-ANN
MFS® Total Return Bond Fund
CONTENTS
The report is prepared for the general information of shareholders.
It is authorized for distribution to prospective investors only when preceded or accompanied by a current prospectus.
NOT FDIC INSURED • MAY LOSE VALUE • NO BANK GUARANTEE

LETTER FROM THE EXECUTIVE CHAIRMAN
Dear Shareholders:
Rising bond yields have led to a measurable uptick in market volatility — a departure from the low-volatility environment that prevailed for much of 2017. In recent months,
against this backdrop, global markets have given back some of the strong gains recorded during 2017 and early 2018. Global economic growth remains robust, notwithstanding signs of a modest slowdown over the past few months, particularly in Europe.
Although the U.S. Federal Reserve continues to gradually raise interest rates and shrink its balance sheet, monetary policy remains accommodative around the world, with many central banks taking only tentative steps toward tighter policies. Newly enacted U.S. tax reforms have been welcomed by equity markets, while emerging market economies have benefited from a weaker U.S. dollar.
Around the world, inflation remains largely subdued, but tight labor markets and solid global demand have investors on the lookout for its potential resurgence. Increased U.S. protectionism is also a growing concern, as investors fear that trade friction could disrupt the synchronized rise in global growth.
As a global investment manager, MFS® strives to create long-term value and protect capital for clients through an active approach and an investment platform built on nearly a century of expertise. To make that long-term value meaningful for clients, we work to align with you on our beliefs, your needs and the time it takes to deliver on your desired outcomes.
Respectfully,

Robert J. Manning
Executive Chairman
MFS Investment Management
June 18, 2018
The opinions expressed in this letter are subject to change and may not be relied upon for investment advice. No forecasts can be guaranteed.
1
PORTFOLIO COMPOSITION
Portfolio structure (i)
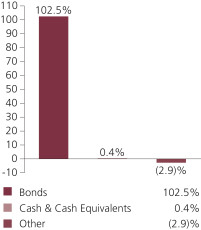
| | | | |
| Fixed income sectors (i) | | | | |
| Investment Grade Corporates | | | 33.9% | |
| U.S. Treasury Securities | | | 28.0% | |
| Mortgage-Backed Securities | | | 14.6% | |
| Commercial Mortgage-Backed Securities | | | 8.9% | |
| Collateralized Debt Obligations | | | 5.9% | |
| High Yield Corporates | | | 5.0% | |
| Asset-Backed Securities | | | 2.8% | |
| Municipal Bonds | | | 1.2% | |
| Emerging Markets Bonds | | | 1.2% | |
| U.S. Government Agencies | | | 1.0% | |
| | | | |
| Composition including fixed income credit quality (a)(i) | |
| AAA | | | 12.2% | |
| AA | | | 4.7% | |
| A | | | 16.3% | |
| BBB | | | 19.1% | |
| BB | | | 4.5% | |
| B | | | 1.4% | |
| CCC (o) | | | 0.0% | |
| CC (o) | | | 0.0% | |
| C (o) | | | 0.0% | |
| D | | | 0.1% | |
| U.S. Government | | | 25.1% | |
| Federal Agencies | | | 15.6% | |
| Not Rated | | | 3.5% | |
| Cash & Cash Equivalents | | | 0.4% | |
| Other | | | (2.9)% | |
| |
| Portfolio facts (i) | | | | |
| Average Duration (d) | | | 6.0 | |
| Average Effective Maturity (m) | | | 9.2 yrs. | |
| (a) | For all securities other than those specifically described below, ratings are assigned to underlying securities utilizing ratings from Moody’s, Fitch, and Standard & Poor’s rating agencies and applying the following hierarchy: If all three agencies provide a rating, the middle rating (after dropping the highest and lowest ratings) is assigned; if two of the three agencies rate a security, the lower of the two is assigned. Ratings are shown in the S&P and Fitch scale (e.g., AAA). Securities rated BBB or higher are considered investment grade. All ratings are subject to change. U.S. Government includes securities issued by the U.S. Department of the Treasury. Federal Agencies includes rated and unrated U.S. Agency fixed-income securities, U.S. Agency mortgage-backed securities, and collateralized mortgage obligations of U.S. Agency mortgage-backed securities. Not Rated includes fixed income securities, including fixed income futures contracts, which have not been rated by any rating agency. The fund may or may not have held all of these instruments on this date. The fund is not rated by these agencies. |
2
Portfolio Composition – continued
| (d) | Duration is a measure of how much a bond’s price is likely to fluctuate with general changes in interest rates, e.g., if rates rise 1.00%, a bond with a 5-year duration is likely to lose about 5.00% of its value due to the interest rate move. |
| (i) | For purposes of this presentation, the components include the value of securities, and reflect the impact of the equivalent exposure of derivative positions, if any. These amounts may be negative from time to time. Equivalent exposure is a calculated amount that translates the derivative position into a reasonable approximation of the amount of the underlying asset that the portfolio would have to hold at a given point in time to have the same price sensitivity that results from the portfolio’s ownership of the derivative contract. When dealing with derivatives, equivalent exposure is a more representative measure of the potential impact of a position on portfolio performance than value. The bond component will include any accrued interest amounts. |
| (m) | In determining an instrument’s effective maturity for purposes of calculating the fund’s dollar-weighted average effective maturity, MFS uses the instrument’s stated maturity or, if applicable, an earlier date on which MFS believes it is probable that a maturity-shortening device (such as a put, pre-refunding or prepayment) will cause the instrument to be repaid. Such an earlier date can be substantially shorter than the instrument’s stated maturity. |
Where the fund holds convertible bonds, they are treated as part of the equity portion of the portfolio.
Cash & Cash Equivalents includes any cash, investments in money market funds, short-term securities, and other assets less liabilities. Please see the Statement of Assets and Liabilities for additional information related to the fund’s cash position and other assets and liabilities.
Other includes equivalent exposure from currency derivatives and/or any offsets to derivative positions and may be negative.
Percentages are based on net assets as of April 30, 2018.
The portfolio is actively managed and current holdings may be different.
3
MANAGEMENT REVIEW
Summary of Results
For the twelve months ended April 30, 2018, Class A shares of the MFS Total Return Bond Fund (“fund”) provided a total return of –0.22%, at net asset value. This compares with a return of –0.32% for the fund’s benchmark, the Bloomberg Barclays U.S. Aggregate Bond Index.
Market Environment
Despite continued solid global economic growth, financial markets were buffeted by increased volatility late in the reporting period. The increase in volatility dented what appeared to have been high levels of investor confidence, leading to a correction in elevated valuations. Valuations are now more in line with long-term averages after the recent bout of market weakness. So far, the rise in volatility has not disrupted the synchronized upturn in growth, though developed markets showed signs of a modest slowdown in the expansion’s pace in early 2018.
During the period, the US Federal Reserve raised rates by 75 basis points, bringing the total number of hikes to six since the central bank began to normalize monetary policy in late 2015. The growth rate in the US, eurozone and Japan remains above potential, though inflation remains contained, particularly outside the US. In the middle of the period, the European Central Bank announced that it was extending its asset purchase program until the end of September 2018, but cut its pace of asset purchases in half as economic conditions improved. Both the Bank of England (“BOE”) and the Bank of Canada raised rates during the period, the BOE for the first time in a decade. The European political backdrop became a bit less volatile late in the period, with populist parties gaining an increased share of the vote, but thus far falling short of majorities in eurozone member states.
Bond yields rose in most developed economies during the period, but they remain low by historic standards. Credit spreads remain relatively tight, but widened modestly late in the period as market volatility increased. Increasing concern over growing global trade friction risks weighed on the strong global trade volumes seen during the period’s second half. The US announced broad-based tariffs on imports of steel and aluminum during the period, though some nations have been exempted, and later targeted China for tariffs, in retaliation for what it believes is abuse of intellectual property rights. Growing fears of wider trade skirmishes have added to volatility.
Factors Affecting Performance
Relative to the Bloomberg Barclays U.S. Aggregate Bond Index, the fund’s asset allocation, most notably a greater exposure to the industrials sector and a lesser exposure to US Treasuries, contributed to relative returns. The fund’s shorter duration (d) stance was also a significant factor supporting relative returns as interest rates generally rose over the reporting period. Security selection in both the industrials and financials sectors, particularly within “BBB” rated (r) securities, further benefited relative results.
4
Management Review – continued
Conversely, the fund’s yield curve (y) positioning, in particular a greater exposure to shifts centered around the 30-year key rate duration point, detracted from relative results.
Respectfully,
Portfolio Manager(s)
Joshua Marston and Robert Persons
| (d) | Duration is a measure of how much a bond’s price is likely to fluctuate with general changes in interest rates, e.g., if rates rise 1.00%, a bond with a 5-year duration is likely to lose about 5.00% of its value. |
| (r) | Bonds rated “BBB”, “Baa”, or higher are considered investment grade; bonds rated “BB”, “Ba”, or below are considered non-investment grade. The sources for bond quality ratings are Moody’s Investors Service, Standard & Poor’s and Fitch, Inc. and are applied using the following hierarchy: If all three agencies provide a rating, the middle rating (after dropping the highest and lowest ratings) is assigned; if two of the three agencies rate a security, the lower of the two is assigned. Ratings are shown in the S&P and Fitch scale (e.g., AAA). For securities which are not rated by any of the three agencies, the security is considered Not Rated. |
| (y) | A yield curve graphically depicts the yields of different maturity bonds of the same credit quality and type; a normal yield curve is upward sloping, with short-term rates lower than long-term rates. |
The views expressed in this report are those of the portfolio manager(s) only through the end of the period of the report as stated on the cover and do not necessarily reflect the views of MFS or any other person in the MFS organization. These views are subject to change at any time based on market or other conditions, and MFS disclaims any responsibility to update such views. These views may not be relied upon as investment advice or an indication of trading intent on behalf of any MFS portfolio. References to specific securities are not recommendations of such securities, and may not be representative of any MFS portfolio’s current or future investments.
5
PERFORMANCE SUMMARY THROUGH 4/30/18
The following chart illustrates a representative class of the fund’s historical performance in comparison to its benchmark(s). Performance results include the deduction of the maximum applicable sales charge and reflect the percentage change in net asset value, including reinvestment of dividends and capital gains distributions. The performance of other share classes will be greater than or less than that of the class depicted below. Benchmarks are unmanaged and may not be invested in directly. Benchmark returns do not reflect sales charges, commissions or expenses. (See Notes to Performance Summary.)
Performance data shown represents past performance and is no guarantee of future results. Investment return and principal value fluctuate so your shares, when sold, may be worth more or less than the original cost; current performance may be lower or higher than quoted. The performance shown does not reflect the deduction of taxes, if any, that a shareholder would pay on fund distributions or the redemption of fund shares.
Growth of a Hypothetical $10,000 Investment
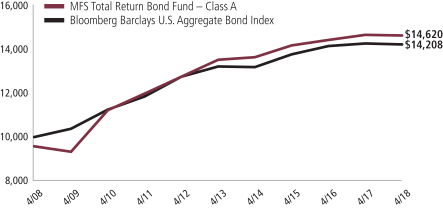
6
Performance Summary – continued
Total Returns through 4/30/18
Average annual without sales charge
| | | | | | | | | | | | |
| | | Share Class | | Class Inception Date | | 1-yr | | 5-yr | | 10-yr | | |
| | | A | | 1/04/99 | | (0.22)% | | 1.59% | | 4.32% | | |
| | | B | | 12/29/00 | | (0.87)% | | 0.83% | | 3.53% | | |
| | | C | | 12/29/00 | | (0.97)% | | 0.73% | | 3.44% | | |
| | | I | | 1/04/99 | | 0.03% | | 1.74% | | 4.49% | | |
| | | R1 | | 4/01/05 | | (0.97)% | | 0.73% | | 3.44% | | |
| | | R2 | | 10/31/03 | | (0.48)% | | 1.23% | | 3.97% | | |
| | | R3 | | 4/01/05 | | (0.32)% | | 1.49% | | 4.23% | | |
| | | R4 | | 4/01/05 | | 0.03% | | 1.76% | | 4.49% | | |
| | | R6 | | 5/01/06 | | 0.04% | | 1.83% | | 4.50% | | |
| | | 529A | | 7/31/02 | | (0.15)% | | 1.57% | | 4.27% | | |
| | | 529B | | 7/31/02 | | (1.02)% | | 0.68% | | 3.37% | | |
| | | 529C | | 7/31/02 | | (1.02)% | | 0.68% | | 3.39% | | |
| Comparative benchmark(s) | | | | | | | | |
| | | Bloomberg Barclays U.S. Aggregate Bond Index (f) | | (0.32)% | | 1.47% | | 3.57% | | |
| Average annual with sales charge | | | | | | | | |
| | | A
With Initial Sales Charge (4.25%) | | (4.46)% | | 0.71% | | 3.87% | | |
| | | B
With CDSC (Declining over six years from 4% to 0%) (v) | | (4.77)% | | 0.47% | | 3.53% | | |
| | | C
With CDSC (1% for 12 months) (v) | | (1.94)% | | 0.73% | | 3.44% | | |
| | | 529A
With Initial Sales Charge (4.25%) | | (4.40)% | | 0.69% | | 3.82% | | |
| | | 529B
With CDSC (Declining over six years from 4% to 0%) (v) | | (4.92)% | | 0.31% | | 3.37% | | |
| | | 529C
With CDSC (1% for 12 months) (v) | | (1.99)% | | 0.68% | | 3.39% | | |
CDSC – Contingent Deferred Sales Charge.
Class I, R1, R2, R3, R4, and R6 shares do not have a sales charge.
On May 30, 2012, Class W shares were redesignated Class R5 shares. Total returns for Class R5 shares prior to May 30, 2012 reflect the performance history of Class W shares which had different fees and expenses than Class R5 shares. Effective August 26, 2016, Class R5 shares were renamed Class R6 shares.
| (f) | Source: FactSet Research Systems Inc. |
| (v) | Assuming redemption at the end of the applicable period. |
7
Performance Summary – continued
Benchmark Definition(s)
Bloomberg Barclays U.S. Aggregate Bond Index – a market capitalization-weighted index that measures the performance of the U.S. investment-grade, fixed rate bond market, with index components for government and corporate securities, mortgage pass-through securities, and asset-backed securities with at least one year to final maturity.
It is not possible to invest directly in an index.
Notes to Performance Summary
Class 529 shares are only available in conjunction with qualified tuition programs, such as the MFS 529 Savings Plan. There also is an additional fee, which is detailed in the program description, on qualified tuition programs. If this fee was reflected, the performance for Class 529 shares would have been lower. This annual fee is waived for Oregon residents and for those accounts with assets of $25,000 or more.
Average annual total return represents the average annual change in value for each share class for the periods presented.
Performance results reflect any applicable expense subsidies and waivers in effect during the periods shown. Without such subsidies and waivers the fund’s performance results would be less favorable. Please see the prospectus and financial statements for complete details.
Performance results do not include adjustments made for financial reporting purposes in accordance with U.S. generally accepted accounting principles and may differ from amounts reported in the financial highlights.
From time to time the fund may receive proceeds from litigation settlements, without which performance would be lower.
8
EXPENSE TABLE
Fund expenses borne by the shareholders during the period, November 1, 2017 through April 30, 2018
As a shareholder of the fund, you incur two types of costs: (1) transaction costs, including sales charges (loads) on certain purchase or redemption payments, and (2) ongoing costs, including management fees; distribution and service (12b-1) fees; and other fund expenses. This example is intended to help you understand your ongoing costs (in dollars) of investing in the fund and to compare these costs with the ongoing costs of investing in other mutual funds.
The example is based on an investment of $1,000 invested at the beginning of the period and held for the entire period November 1, 2017 through April 30, 2018.
Actual Expenses
The first line for each share class in the following table provides information about actual account values and actual expenses. You may use the information in this line, together with the amount you invested, to estimate the expenses that you paid over the period. Simply divide your account value by $1,000 (for example, an $8,600 account value divided by $1,000 = 8.6), then multiply the result by the number in the first line under the heading entitled “Expenses Paid During Period” to estimate the expenses you paid on your account during this period.
Hypothetical Example for Comparison Purposes
The second line for each share class in the following table provides information about hypothetical account values and hypothetical expenses based on the fund’s actual expense ratio and an assumed rate of return of 5% per year before expenses, which is not the fund’s actual return. The hypothetical account values and expenses may not be used to estimate the actual ending account balance or expenses you paid for the period. You may use this information to compare the ongoing costs of investing in the fund and other funds. To do so, compare this 5% hypothetical example with the 5% hypothetical examples that appear in the shareholder reports of the other funds.
Please note that the expenses shown in the table are meant to highlight your ongoing costs only and do not reflect any transactional costs, such as sales charges (loads). Therefore, the second line for each share class in the table is useful in comparing ongoing costs only, and will not help you determine the relative total costs of owning different funds. In addition, if these transactional costs were included, your costs would have been higher.
9
Expense Table – continued
| | | | | | | | | | | | | | | | | | |
Share
Class | | | | Annualized
Expense
Ratio | | | Beginning
Account Value
11/01/17 | | | Ending Account Value
4/30/18 | | | Expenses Paid During
Period (p)
11/01/17-4/30/18 | |
| A | | Actual | | | 0.74% | | | | $1,000.00 | | | | $979.38 | | | | $3.63 | |
| | Hypothetical (h) | | | 0.74% | | | | $1,000.00 | | | | $1,021.12 | | | | $3.71 | |
| B | | Actual | | | 1.49% | | | | $1,000.00 | | | | $976.68 | | | | $7.30 | |
| | Hypothetical (h) | | | 1.49% | | | | $1,000.00 | | | | $1,017.41 | | | | $7.45 | |
| C | | Actual | | | 1.59% | | | | $1,000.00 | | | | $976.19 | | | | $7.79 | |
| | Hypothetical (h) | | | 1.59% | | | | $1,000.00 | | | | $1,016.91 | | | | $7.95 | |
| I | | Actual | | | 0.59% | | | | $1,000.00 | | | | $981.06 | | | | $2.90 | |
| | Hypothetical (h) | | | 0.59% | | | | $1,000.00 | | | | $1,021.87 | | | | $2.96 | |
| R1 | | Actual | | | 1.59% | | | | $1,000.00 | | | | $975.28 | | | | $7.79 | |
| | Hypothetical (h) | | | 1.59% | | | | $1,000.00 | | | | $1,016.91 | | | | $7.95 | |
| R2 | | Actual | | | 1.09% | | | | $1,000.00 | | | | $978.58 | | | | $5.35 | |
| | Hypothetical (h) | | | 1.09% | | | | $1,000.00 | | | | $1,019.39 | | | | $5.46 | |
| R3 | | Actual | | | 0.84% | | | | $1,000.00 | | | | $978.89 | | | | $4.12 | |
| | Hypothetical (h) | | | 0.84% | | | | $1,000.00 | | | | $1,020.63 | | | | $4.21 | |
| R4 | | Actual | | | 0.59% | | | | $1,000.00 | | | | $981.06 | | | | $2.90 | |
| | Hypothetical (h) | | | 0.59% | | | | $1,000.00 | | | | $1,021.87 | | | | $2.96 | |
| R6 | | Actual | | | 0.48% | | | | $1,000.00 | | | | $980.65 | | | | $2.36 | |
| | Hypothetical (h) | | | 0.48% | | | | $1,000.00 | | | | $1,022.41 | | | | $2.41 | |
| 529A | | Actual | | | 0.76% | | | | $1,000.00 | | | | $979.23 | | | | $3.73 | |
| | Hypothetical (h) | | | 0.76% | | | | $1,000.00 | | | | $1,021.03 | | | | $3.81 | |
| 529B | | Actual | | | 1.64% | | | | $1,000.00 | | | | $975.94 | | | | $8.03 | |
| | Hypothetical (h) | | | 1.64% | | | | $1,000.00 | | | | $1,016.66 | | | | $8.20 | |
| 529C | | Actual | | | 1.64% | | | | $1,000.00 | | | | $975.94 | | | | $8.03 | |
| | Hypothetical (h) | | | 1.64% | | | | $1,000.00 | | | | $1,016.66 | | | | $8.20 | |
| (h) | 5% class return per year before expenses. |
| (p) | “Expenses Paid During Period” are equal to each class’s annualized expense ratio, as shown above, multiplied by the average account value over the period, multiplied by 181/365 (to reflect the one-half year period). Expenses paid do not include any applicable sales charges (loads). If these transaction costs had been included, your costs would have been higher. |
Notes to Expense Table
Each class with a Rule 12b-1 service fee is subject to a rebate of a portion of such fee. Such rebates are included in the expense ratios above and are outside of the expense limitation arrangement. For Class 529A shares, this rebate reduced the expense ratio above by 0.03%. See Note 3 in the Notes to Financial Statements for additional information.
10
PORTFOLIO OF INVESTMENTS
4/30/18
The Portfolio of Investments is a complete list of all securities owned by your fund. It is categorized by broad-based asset classes.
| | | | | | | | |
| Bonds - 99.0% | | | | | | | | |
| Issuer | | Shares/Par | | | Value ($) | |
| Aerospace - 0.4% | | | | | | | | |
| Lockheed Martin Corp., 4.7%, 5/15/2046 | | $ | 7,505,000 | | | $ | 8,007,775 | |
| TransDigm, Inc., 6.5%, 7/15/2024 | | | 10,772,000 | | | | 10,953,777 | |
| | | | | | | | |
| | | | | | | $ | 18,961,552 | |
| Asset-Backed & Securitized - 17.4% | | | | | | | | |
| AIMCO Properties CLO LP, 2015-AA, “BR”, FLR, 3.648% (LIBOR-3mo. + 1.30%), 1/15/2028 (z) | | $ | 16,000,000 | | | $ | 15,865,840 | |
| Allegro CLO Ltd., 2014-1A, “A2R”, FLR, 4.012% (LIBOR-3mo. + 1.65%), 1/21/2027 (n) | | | 14,040,367 | | | | 14,059,995 | |
| Allegro CLO Ltd., 2014-1A, “BR”, FLR, 4.762% (LIBOR-3mo. + 2.4%), 1/21/2027 (n) | | | 12,968,776 | | | | 12,982,289 | |
| ALM V Ltd., 2012-5A, “A2R3”, FLR, 3.605% (LIBOR-3mo. + 1.25%), 10/18/2027 (z) | | | 8,340,000 | | | | 8,333,345 | |
| ALM V Ltd., 2012-5A, “BR3”, FLR, 4.005% (LIBOR-3mo. + 1.7%), 10/18/2027 (z) | | | 3,070,000 | | | | 3,070,353 | |
| ARI Fleet Lease Trust, 2016-A, “A2”, 1.82%, 7/15/2024 (n) | | | 1,945,813 | | | | 1,942,095 | |
| Atrium XII Corp., 2012-A, “B1R”, FLR, 3.712% (LIBOR-3mo. + 1.35%), 4/22/2027 (n) | | | 15,670,000 | | | | 15,574,444 | |
| Babson CLO Ltd., 2013-IIA, “BR”, FLR, 3.612% (LIBOR-3mo. + 1.25%), 1/20/2028 (n) | | | 23,804,982 | | | | 23,786,609 | |
| Babson CLO Ltd., 2014-IIA, “CR”, FLR, 4.553% (LIBOR-3mo. + 2.2%), 10/17/2026 (n) | | | 7,130,000 | | | | 7,128,332 | |
| Ballyrock Ltd., CLO, FLR, 3.065% (LIBOR-3mo. + 1.18%), 5/20/2025 (z) | | | 2,684,548 | | | | 2,684,148 | |
| Bancorp Commercial Mortgage Trust, 2018-CR3, “A”, 2.747%, 1/15/2033 (z) | | | 13,934,734 | | | | 13,934,720 | |
| Bancorp Commercial Mortgage Trust, 2018-CR3, “AS”, 3.147%, 1/15/2033 (z) | | | 8,360,841 | | | | 8,360,827 | |
| Bancorp Commercial Mortgage Trust, 2018-CR3, “D”, FLR, 4.597% (LIBOR-1mo. + 2.7%), 1/15/2033 (z) | | | 2,229,557 | | | | 2,235,427 | |
| Bayview Commercial Asset Trust, 0%, 12/25/2036 (i)(z) | | | 4,346,541 | | | | 435 | |
| Bayview Commercial Asset Trust, FLR, 2.207% (LIBOR-1mo. + 0.31%), 8/25/2035 (z) | | | 224,036 | | | | 212,663 | |
| Bayview Commercial Asset Trust, FLR, 2.142% (LIBOR-1mo. + 0.27%), 4/25/2036 (z) | | | 180,003 | | | | 170,286 | |
| Bayview Financial Acquisition Trust, 5.638%, 11/28/2036 | | | 377,218 | | | | 384,368 | |
| Bayview Financial Revolving Mortgage Loan Trust, FLR, 3.501% (LIBOR-1mo. + 1.6%), 12/28/2040 (z) | | | 1,815,799 | | | | 1,647,427 | |
| Business Jet Securities LLC, 2018-1, “A”, 4.335%, 2/15/2033 (z) | | | 22,760,375 | | | | 22,816,279 | |
11
Portfolio of Investments – continued
| | | | | | | | |
| Issuer | | Shares/Par | | | Value ($) | |
| Bonds - continued | | | | | | | | |
| Asset-Backed & Securitized - continued | | | | | | | | |
| Cavalry CLO IV Ltd., 2014-4A, “B1R”, FLR, 3.698% (LIBOR-3mo. + 1.35%), 10/15/2026 (z) | | $ | 6,670,000 | | | $ | 6,666,011 | |
| Cavalry CLO IV Ltd./Cavalry CLO IV LLC, FLR, 4.248% (LIBOR-3mo. + 1.9%), 10/15/2026 (z) | | | 7,790,000 | | | | 7,785,677 | |
| Cavalry CLO IV Ltd./Cavalry CLO IV LLC, FLR, 4.248% (LIBOR-3mo. + 1.9%), 10/15/2026 (z) | | | 5,560,000 | | | | 5,556,610 | |
| Cent CLO LP, 2014-16AR, “A1AR”, FLR, 3.608% (LIBOR-3mo. + 1.25%), 8/01/2024 (n) | | | 3,774,691 | | | | 3,772,887 | |
| Cent CLO LP, 2014-21A, “A2AR”, FLR, 4.066% (LIBOR-3mo. + 1.7%), 7/27/2026 (n) | | | 11,508,562 | | | | 11,476,522 | |
| Chesapeake Funding II LLC, 2016-1A, “A1”, 2.11%, 3/15/2028 (n) | | | 6,255,750 | | | | 6,238,406 | |
| Chesapeake Funding II LLC, 2017-4A, “A1”, 2.12%, 11/15/2029 (z) | | | 14,025,000 | | | | 13,852,825 | |
| Chesapeake Funding II LLC, 2018-1A, “A1”, 3.04%, 4/15/2030 (z) | | | 14,170,000 | | | | 14,136,236 | |
| Citigroup Commercial Mortgage Trust, 2014-GC25, “A4”, 3.635%, 10/10/2047 | | | 4,461,971 | | | | 4,480,657 | |
| Citigroup Commercial Mortgage Trust, 2015-GC27, “A5”, 3.137%, 2/10/2048 | | | 11,154,926 | | | | 10,864,246 | |
| Citigroup Commercial Mortgage Trust, 2017-C4, 3.471%, 10/12/2050 | | | 19,556,963 | | | | 19,168,550 | |
| Commercial Mortgage Asset Trust, 1.466%, 1/17/2032 (i)(z) | | | 54,660 | | | | 17 | |
| Commercial Mortgage Pass-Through Certificates, “A4”, 3.183%, 2/10/2048 | | | 9,743,000 | | | | 9,502,136 | |
| Commercial Mortgage Trust, 2014-CR19, “A5”, 3.796%, 8/10/2047 | | | 14,087,504 | | | | 14,288,436 | |
| Commercial Mortgage Trust, 2014-UBS4, “A5”, 3.694%, 8/10/2047 | | | 11,544,000 | | | | 11,648,698 | |
| Commercial Mortgage Trust, 2015-CR22, “A5”, 3.309%, 3/10/2048 | | | 10,360,000 | | | | 10,159,436 | |
| Commercial Mortgage Trust, 2015-DC1, “A5”, 3.35%, 2/10/2048 | | | 9,577,577 | | | | 9,412,103 | |
| Commercial Mortgage Trust, 2015-LC21, “A4”, 3.708%, 7/10/2048 | | | 9,963,398 | | | | 10,018,963 | |
| Commercial Mortgage Trust, 2015-PC1, “A5”, 3.902%, 7/10/2050 | | | 4,781,393 | | | | 4,859,113 | |
| Commercial Mortgage Trust, 2016-COR1, “A4”, 3.091%, 10/10/2049 | | | 19,844,365 | | | | 19,016,819 | |
| Commercial Mortgage Trust, 2017-CD4, “A4”, 3.514%, 5/10/2050 | | | 17,818,591 | | | | 17,562,819 | |
| Commercial Mortgage Trust, 2017-COR2, “A3”, 3.51%, 9/10/2050 | | | 26,790,000 | | | | 26,298,390 | |
| Countrywide Asset-Backed Certificates, 4.646%, 4/25/2036 | | | 148,239 | | | | 135,650 | |
12
Portfolio of Investments – continued
| | | | | | | | |
| Issuer | | Shares/Par | | | Value ($) | |
| Bonds - continued | | | | | | | | |
| Asset-Backed & Securitized - continued | | | | | | | | |
| Credit-Based Asset Servicing & Securitization LLC, 3.78%, 12/25/2035 | | $ | 98,402 | | | $ | 98,020 | |
| Credit-Based Asset Servicing & Securitization LLC, 3.668%, 1/25/2037 (q) | | | 1,440,336 | | | | 696,747 | |
| Credit-Based Asset Servicing & Securitization LLC, 3.874%, 3/25/2037 (q) | | | 1,598,901 | | | | 897,755 | |
| CSAIL Commercial Mortgage Trust, 2015-C2, “A4”, 3.504%, 6/15/2057 | | | 3,687,246 | | | | 3,653,667 | |
| Cutwater Ltd., 2014-1A, “BR”, FLR, 4.748% (LIBOR-3mo. + 2.4%), 7/15/2026 (n) | | | 5,280,000 | | | | 5,272,038 | |
| Drive Auto Receivables Trust, 2017-1, “C”, 2.84%, 4/15/2022 | | | 7,678,000 | | | | 7,661,614 | |
| Eaton Vance CLO Ltd., 2014-1A, “CR”, FLR, 4.598% (LIBOR-3mo. + 2.25%), 7/15/2026 (n) | | | 7,930,434 | | | | 7,923,447 | |
| Falcon Franchise Loan LLC, 7.966%, 1/05/2023 (i)(z) | | | 8,865 | | | | 349 | |
| First Union-Lehman Brothers Bank of America, 1.187%, 11/18/2035 (i) | | | 323,201 | | | | 6,841 | |
| Flatiron CLO Ltd., 2013-1A, “A1R”, FLR, 3.513% (LIBOR-3mo. + 1.16%), 1/17/2026 (n) | | | 10,111,818 | | | | 10,107,076 | |
| Flatiron CLO Ltd., 2015-1A, “BR”, FLR, 3.748% (LIBOR-3mo. + 1.4%), 4/15/2027 (n) | | | 18,297,137 | | | | 18,288,935 | |
| Flatiron CLO Ltd., 2015-1A, “CR”, FLR, 4.248% (LIBOR-3mo. + 1.9%), 4/15/2027 (n) | | | 4,000,000 | | | | 3,999,021 | |
| Ford Credit Auto Owner Trust, 2014-1,“A”, 2.26%, 11/15/2025 (n) | | | 5,379,000 | | | | 5,352,861 | |
| Ford Credit Auto Owner Trust, 2014-2,“A”, 2.31%, 4/15/2026 (n) | | | 13,841,000 | | | | 13,738,878 | |
| GMAC Mortgage Corp. Loan Trust, 5.805%, 10/25/2036 | | | 475,833 | | | | 481,899 | |
| GMF Floorplan Owner Revolving Trust, 2017-1, “A2”, FLR, 2.467% (LIBOR-1mo. + 0.57%), 1/18/2022 (n) | | | 28,421,000 | | | | 28,569,599 | |
| GMF Floorplan Owner Revolving Trust, 2017-2, “C”, 2.63%, 7/15/2022 (z) | | | 8,001,000 | | | | 7,832,368 | |
| Granite Point Mortgage Trust Inc., 2.796%, 12/19/2035 (z) | | | 11,360,000 | | | | 11,342,960 | |
| GS Mortgage Securities Trust, 2015-GC30, “A4”, 3.382%, 5/10/2050 | | | 11,461,699 | | | | 11,296,656 | |
| GS Mortgage Securities Trust, 2017-GS6, “A3”, 3.433%, 5/10/2050 | | | 29,467,329 | | | | 28,836,227 | |
| GS Mortgage Securities Trust, 2017-GS7, “A4”, 3.43%, 8/10/2050 | | | 31,130,000 | | | | 30,205,757 | |
| HarbourView CLO VII, Ltd., 7A, “CR”, FLR, 4.252% (LIBOR-3mo. + 2.38%), 11/18/2026 (n) | | | 8,220,000 | | | | 8,205,196 | |
| IMPAC CMB Trust, FLR, 2.637% (LIBOR-1mo. + 0.74%), 11/25/2034 | | | 65,533 | | | | 65,426 | |
| IMPAC CMB Trust, FLR, 2.817% (LIBOR-1mo. + 0.92%), 11/25/2034 | | | 32,767 | | | | 31,845 | |
13
Portfolio of Investments – continued
| | | | | | | | |
| Issuer | | Shares/Par | | | Value ($) | |
| Bonds - continued | | | | | | | | |
| Asset-Backed & Securitized - continued | | | | | | | | |
| IMPAC Secured Assets Corp., FLR, 2.247% (LIBOR-1mo. + 0.35%), 5/25/2036 | | $ | 304,645 | | | $ | 289,513 | |
| JPMBB Commercial Mortgage Securities Trust, 2014-C26, 3.494%, 1/15/2048 | | | 13,025,174 | | | | 12,951,808 | |
| JPMBB Commercial Mortgage Securities Trust, 2015-C28, “A4”, 3.227%, 10/15/2048 | | | 23,872,958 | | | | 23,320,399 | |
| JPMBB Commercial Mortgage Securities Trust, 2017-C7, 3.409%, 10/15/2050 | | | 11,500,000 | | | | 11,214,394 | |
| JPMorgan Chase Commercial Mortgage Securities Corp., 5.785%, 7/15/2042 (n)(q) | | | 993,444 | | | | 685,349 | |
| JPMorgan Chase Commercial Mortgage Securities Corp., 3.454%, 9/15/2050 | | | 12,800,212 | | | | 12,551,239 | |
| JPMorgan Chase Commercial Mortgage Trust, 2007-LD11, | | | | | | | | |
| “AM”, 6.181%, 6/15/2049 | | | 5,662,596 | | | | 5,753,177 | |
| Lehman Brothers Commercial Conduit Mortgage Trust, 1.698%, 10/15/2035 (i) | | | 704,309 | | | | 1,745 | |
| Loomis, Sayles & Co., CLO, 2015-2A, “A1R”, FLR, 3.253% | | | | | | | | |
| (LIBOR-3mo. + 0.9%), 4/15/2028 (n) | | | 19,665,011 | | | | 19,665,011 | |
| Merrill Lynch Mortgage Investors, Inc., 4.319%, 2/25/2037 (q) | | | 2,019,221 | | | | 405,172 | |
| Morgan Stanley Bank of America Merrill Lynch Trust, 2015-C21, | | | | | | | | |
| “A4”, 3.338%, 3/15/2048 | | | 8,114,737 | | | | 7,963,420 | |
| Morgan Stanley Bank of America Merrill Lynch Trust, 2017-C34, | | | | | | | | |
| “A4”, 3.536%, 11/15/2052 | | | 34,856,806 | | | | 34,197,486 | |
| Morgan Stanley Capital I Trust, 2017-H1, “A5”, 3.53%, 6/15/2050 | | | 26,134,745 | | | | 25,710,555 | |
| Morgan Stanley Capital I, Inc., 1.836%, 3/15/2031 (i)(z) | | | 21,309 | | | | 1 | |
| Nextgear Floorplan Master Owner Trust, 2015-2A, “A”, 2.38%, 10/15/2020 (n) | | | 12,068,000 | | | | 12,048,908 | |
| NextGear Floorplan Master Owner Trust, 2018-1A, “A2”, 3.22%, 2/15/2023 (z) | | | 7,285,000 | | | | 7,261,630 | |
| Oaktree CLO Ltd., 2014-2A, “BR”, FLR, 4.909% (LIBOR-3mo. + 2.55%), 10/20/2026 (n) | | | 2,795,000 | | | | 2,807,524 | |
| OCP CLO Ltd., 2015-9A, “A2R”, FLR, 3.698% (LIBOR-3mo. + 1.35%), 7/15/2027 (z) | | | 13,240,000 | | | | 13,227,965 | |
| Option One Mortgage Loan Trust, 5.611%, 1/25/2037 (q) | | | 58,478 | | | | 58,464 | |
| Ownit Mortgage Loan Asset-Backed Certificates, 3.373%, 10/25/2035 (q) | | | 662,752 | | | | 416,721 | |
| Parallel Ltd., 2015-1A, “C1R”, FLR, 4.109% (LIBOR-3mo. + 1.75%), 7/20/2027 (n) | | | 3,700,000 | | | | 3,699,959 | |
| Parallel Ltd., 2015-1A, “C2R”, FLR, 4.109% (LIBOR-3mo. + 1.75%), 7/20/2027 (n) | | | 3,990,000 | | | | 3,989,956 | |
| Race Point CLO Ltd., 2013-8A, “AR”, FLR, 3.225% (LIBOR-3mo. + 1.34%), 2/20/2030 (n) | | | 11,190,527 | | | | 11,364,602 | |
14
Portfolio of Investments – continued
| | | | | | | | |
| Issuer | | Shares/Par | | | Value ($) | |
| Bonds - continued | | | | | | | | |
| Asset-Backed & Securitized - continued | | | | | | | | |
| Residential Funding Mortgage Securities, Inc., 5.32%, 12/25/2035 | | $ | 2,124,441 | | | $ | 2,015,268 | |
| Shackleton CLO Ltd., 2014-6A, “CR”, FLR, 4.603% (LIBOR-3mo. + 2.25%), 7/17/2026 (n) | | | 9,257,351 | | | | 9,304,712 | |
| Silver Spring CLO Ltd., 2014-1A, “C2R”, 4.561%, 10/15/2026 (n) | | | 6,065,000 | | | | 5,884,396 | |
| Thornburg Mortgage Securities Trust, FLR, 2.577% (LIBOR-1mo. + 0.68%), 4/25/2043 | | | 7,148 | | | | 7,159 | |
| TICP CLO Ltd., 2018-IA, “A2”, FLR, 3.862% (LIBOR-3mo. + 1.5%), 4/26/2028 (z) | | | 16,262,022 | | | | 16,233,563 | |
| UBS Commercial Mortgage Trust 2017-C7, “A4”, 3.679%, 12/15/2050 | | | 25,000,000 | | | | 24,758,765 | |
| Voya CLO Ltd., 2013-3A, “BR”, FLR, 4.505% (LIBOR-3mo. + 2.15%), 1/18/2026 (n) | | | 11,625,000 | | | | 11,684,729 | |
| Wells Fargo Commercial Mortgage Trust, 2015-C28, “A4”, 3.54%, 5/15/2048 | | | 15,451,790 | | | | 15,343,425 | |
| Wells Fargo Commercial Mortgage Trust, 2016-LC25, “A4”, 3.64%, 12/15/2059 | | | 25,027,917 | | | | 24,866,009 | |
| West CLO Ltd., 2014-1A, “A2R”, FLR, 3.705% (LIBOR-3mo. + 1.35%), 7/18/2026 (n) | | | 16,679,192 | | | | 16,591,793 | |
| West CLO Ltd., 2014-1A, “CR”, FLR, 5.355% (LIBOR-3mo. + 3%), 7/18/2026 (n) | | | 3,420,000 | | | | 3,418,449 | |
| | | | | | | | |
| | | | | | | $ | 936,349,537 | |
| Automotive - 0.6% | | | | | | | | |
| General Motors Co., 4.875%, 10/02/2023 | | $ | 5,739,000 | | | $ | 5,913,324 | |
| General Motors Co., 5.2%, 4/01/2045 | | | 4,792,000 | | | | 4,528,286 | |
| General Motors Financial Co., Inc., 3.45%, 4/10/2022 | | | 8,435,000 | | | | 8,320,429 | |
| General Motors Financial Co., Inc., 4.35%, 4/09/2025 | | | 7,992,000 | | | | 7,910,910 | |
| General Motors Financial Co., Inc., 4%, 10/06/2026 | | | 6,951,000 | | | | 6,650,630 | |
| | | | | | | | |
| | | | | | | $ | 33,323,579 | |
| Broadcasting - 0.5% | | | | | | | | |
| Netflix, Inc., 4.875%, 4/15/2028 (n) | | $ | 20,000,000 | | | $ | 18,875,000 | |
| Time Warner, Inc., 3.8%, 2/15/2027 | | | 5,558,000 | | | | 5,378,302 | |
| | | | | | | | |
| | | | | | | $ | 24,253,302 | |
| Brokerage & Asset Managers - 1.8% | | | | | | | | |
| Charles Schwab Corp., 3.2%, 3/02/2027 | | $ | 17,641,000 | | | $ | 16,896,810 | |
| Charles Schwab Corp., 3.2%, 1/25/2028 | | | 10,052,000 | | | | 9,518,095 | |
| E*TRADE Financial Corp., 2.95%, 8/24/2022 | | | 1,706,000 | | | | 1,653,123 | |
| E*TRADE Financial Corp., 3.8%, 8/24/2027 | | | 17,677,000 | | | | 16,919,625 | |
| Intercontinental Exchange, Inc., 3.1%, 9/15/2027 | | | 15,960,000 | | | | 15,004,044 | |
| Raymond James Financial, 3.625%, 9/15/2026 | | | 4,094,000 | | | | 3,963,849 | |
| Raymond James Financial, Inc., 4.95%, 7/15/2046 | | | 16,355,000 | | | | 17,111,109 | |
| TD Ameritrade Holding Corp., 5.6%, 12/01/2019 | | | 5,050,000 | | | | 5,252,615 | |
15
Portfolio of Investments – continued
| | | | | | | | |
| Issuer | | Shares/Par | | | Value ($) | |
| Bonds - continued | | | | | | | | |
| Brokerage & Asset Managers - continued | | | | | | | | |
| TD Ameritrade Holding Corp., 2.95%, 4/01/2022 | | $ | 4,376,000 | | | $ | 4,301,097 | |
| TD Ameritrade Holding Corp., 3.3%, 4/01/2027 | | | 5,845,000 | | | | 5,644,469 | |
| | | | | | | | |
| | | | | | | $ | 96,264,836 | |
| Building - 1.4% | | | | | | | | |
| CRH America Finance, Inc., 3.95%, 4/04/2028 (z) | | $ | 18,023,000 | | | $ | 17,595,802 | |
| Martin Marietta Materials, Inc., 4.25%, 7/02/2024 | | | 12,268,000 | | | | 12,499,870 | |
| Martin Marietta Materials, Inc., 3.45%, 6/01/2027 | | | 2,718,000 | | | | 2,560,359 | |
| Martin Marietta Materials, Inc., 4.25%, 12/15/2047 | | | 8,147,000 | | | | 7,349,952 | |
| Masco Corp., 4.375%, 4/01/2026 | | | 11,111,000 | | | | 11,180,444 | |
| Standard Industries, Inc., 5.375%, 11/15/2024 (n) | | | 5,145,000 | | | | 5,212,528 | |
| Standard Industries, Inc., 6%, 10/15/2025 (n) | | | 5,145,000 | | | | 5,337,937 | |
| Standard Industries, Inc., 4.75%, 1/15/2028 (n) | | | 12,000,000 | | | | 11,190,000 | |
| | | | | | | | |
| | | | | | | $ | 72,926,892 | |
| Business Services - 0.3% | | | | | | | | |
| Equinix, Inc., 5.375%, 5/15/2027 | | $ | 3,584,000 | | | $ | 3,646,720 | |
| Fidelity National Information Services, Inc., 3%, 8/15/2026 | | | 14,166,000 | | | | 13,003,466 | |
| | | | | | | | |
| | | | | | | $ | 16,650,186 | |
| Cable TV - 1.4% | | | | | | | | |
| CCO Holdings LLC/CCO Holdings Capital Corp., 5.75%, 1/15/2024 | | $ | 5,556,000 | | | $ | 5,608,226 | |
| Charter Communications Operating LLC/Charter Communications Operating Capital Corp., 4.908%, 7/23/2025 | | | 10,635,000 | | | | 10,805,925 | |
| Comcast Corp., 3.15%, 2/15/2028 | | | 3,150,000 | | | | 2,942,329 | |
| Cox Communications, Inc., 3.15%, 8/15/2024 (n) | | | 14,525,000 | | | | 13,820,641 | |
| Sirius XM Radio, Inc., 5.375%, 7/15/2026 (n) | | | 11,390,000 | | | | 11,190,675 | |
| Time Warner Cable, Inc., 4.5%, 9/15/2042 | | | 10,161,000 | | | | 8,612,076 | |
| Time Warner Entertainment Co. LP, 8.375%, 7/15/2033 | | | 4,688,000 | | | | 6,071,782 | |
| Videotron Ltd., 5%, 7/15/2022 | | | 9,853,000 | | | | 10,062,376 | |
| Videotron Ltd., 5.125%, 4/15/2027 (n) | | | 8,000,000 | | | | 7,840,000 | |
| | | | | | | | |
| | | | | | | $ | 76,954,030 | |
| Computer Software - 0.8% | | | | | | | | |
| Microsoft Corp., 2%, 8/08/2023 | | $ | 14,694,000 | | | $ | 13,834,206 | |
| Microsoft Corp., 3.125%, 11/03/2025 | | | 14,939,000 | | | | 14,540,827 | |
| Microsoft Corp., 4.1%, 2/06/2037 | | | 13,341,000 | | | | 13,852,261 | |
| | | | | | | | |
| | | | | | | $ | 42,227,294 | |
| Computer Software - Systems - 0.6% | | | | | | | | |
| Apple, Inc., 3.35%, 2/09/2027 | | $ | 10,772,000 | | | $ | 10,541,984 | |
| Apple, Inc., 2.9%, 9/12/2027 | | | 14,444,000 | | | | 13,592,142 | |
| Apple, Inc., 4.375%, 5/13/2045 | | | 6,657,000 | | | | 6,892,671 | |
16
Portfolio of Investments – continued
| | | | | | | | |
| Issuer | | Shares/Par | | | Value ($) | |
| Bonds - continued | | | | | | | | |
| Computer Software - Systems - continued | | | | | | | | |
| Apple, Inc., 4.25%, 2/09/2047 | | $ | 2,472,000 | | | $ | 2,512,612 | |
| | | | | | | | |
| | | | | | | $ | 33,539,409 | |
| Conglomerates - 0.3% | | | | | | | | |
| Johnson Controls International PLC, 5.7%, 3/01/2041 | | $ | 3,439,000 | | | $ | 3,815,516 | |
| Johnson Controls International PLC, 4.625%, 7/02/2044 | | | 3,760,000 | | | | 3,791,857 | |
| United Technologies Corp., 4.05%, 5/04/2047 | | | 10,950,000 | | | | 10,096,924 | |
| | | | | | | | |
| | | | | | | $ | 17,704,297 | |
| Consumer Products - 0.9% | | | | | | | | |
| Reckitt Benckiser Treasury Services PLC, 3.625%, 9/21/2023 (n) | | $ | 12,239,000 | | | $ | 12,188,508 | |
| Reckitt Benckiser Treasury Services PLC, 2.75%, 6/26/2024 (n) | | | 38,107,000 | | | | 36,017,911 | |
| | | | | | | | |
| | | | | | | $ | 48,206,419 | |
| Consumer Services - 0.5% | | | | | | | | |
| Priceline Group, Inc., 2.75%, 3/15/2023 | | $ | 3,459,000 | | | $ | 3,301,863 | |
| Priceline Group, Inc., 3.65%, 3/15/2025 | | | 22,057,000 | | | | 21,600,636 | |
| | | | | | | | |
| | | | | | | $ | 24,902,499 | |
| Containers - 0.4% | | | | | | | | |
| Berry Global Group, Inc., 5.125%, 7/15/2023 | | $ | 10,515,000 | | | $ | 10,580,719 | |
| Sealed Air Corp., 5.125%, 12/01/2024 (n) | | | 9,876,000 | | | | 10,024,140 | |
| | | | | | | | |
| | | | | | | $ | 20,604,859 | |
| Emerging Market Quasi-Sovereign - 0.5% | | | | | | | | |
| State Grid Overseas Investment (2016) Ltd., 2.75%, 5/04/2022 (n) | | $ | 29,692,000 | | | $ | 28,740,589 | |
| | |
| Emerging Market Sovereign - 0.6% | | | | | | | | |
| Republic of Argentina, 6.875%, 1/11/2048 | | $ | 21,524,000 | | | $ | 19,124,074 | |
| Republic of South Africa, 4.85%, 9/27/2027 | | | 13,595,000 | | | | 13,167,519 | |
| | | | | | | | |
| | | | | | | $ | 32,291,593 | |
| Energy - Integrated - 0.2% | | | | | | | | |
| Shell International Finance B.V., 4%, 5/10/2046 | | $ | 7,702,000 | | | $ | 7,531,064 | |
| Shell International Finance B.V., 3.75%, 9/12/2046 | | | 5,018,000 | | | | 4,748,095 | |
| | | | | | | | |
| | | | | | | $ | 12,279,159 | |
| Entertainment - 0.2% | | | | | | | | |
| Six Flags Entertainment Corp., 4.875%, 7/31/2024 (n) | | $ | 12,910,000 | | | $ | 12,615,652 | |
| | |
| Food & Beverages - 1.6% | | | | | | | | |
| Anheuser Busch InBev Worldwide, Inc., 3.75%, 1/15/2022 | | $ | 7,736,000 | | | $ | 7,865,338 | |
| Anheuser-Busch InBev Finance, Inc., 2.65%, 2/01/2021 | | | 14,961,000 | | | | 14,787,424 | |
| Anheuser-Busch InBev Finance, Inc., 4.9%, 2/01/2046 | | | 24,462,000 | | | | 25,378,231 | |
17
Portfolio of Investments – continued
| | | | | | | | |
| Issuer | | Shares/Par | | | Value ($) | |
| Bonds - continued | | | | | | | | |
| Food & Beverages - continued | | | | | | | | |
| Anheuser-Busch InBev Worldwide, Inc., 3.7%, 2/01/2024 | | $ | 5,084,000 | | | $ | 5,099,727 | |
| General Mills, Inc., 4%, 4/17/2025 | | | 11,853,000 | | | | 11,767,942 | |
| Kraft Heinz Foods Co., 5.2%, 7/15/2045 | | | 2,298,000 | | | | 2,281,039 | |
| Kraft Heinz Foods Co., 4.375%, 6/01/2046 | | | 9,786,000 | | | | 8,804,683 | |
| Wm. Wrigley Jr. Co., 3.375%, 10/21/2020 (n) | | | 11,439,000 | | | | 11,502,506 | |
| | | | | | | | |
| | | | | | | $ | 87,486,890 | |
| Forest & Paper Products - 0.1% | | | | | | | | |
| Packaging Corp. of America, 3.65%, 9/15/2024 | | $ | 4,483,000 | | | $ | 4,398,261 | |
| | |
| Gaming & Lodging - 0.3% | | | | | | | | |
| GLP Capital LP/GLP Financing II, Inc., 5.375%, 11/01/2023 | | $ | 6,977,000 | | | $ | 7,212,474 | |
| GLP Capital LP/GLP Financing II, Inc., 5.375%, 4/15/2026 | | | 6,000,000 | | | | 6,045,000 | |
| | | | | | | | |
| | | | | | | $ | 13,257,474 | |
| Insurance - 1.0% | | | | | | | | |
| American International Group, Inc., 3.75%, 7/10/2025 | | $ | 17,703,000 | | | $ | 17,337,266 | |
| American International Group, Inc., 3.9%, 4/01/2026 | | | 7,925,000 | | | | 7,748,639 | |
| American International Group, Inc., 4.7%, 7/10/2035 | | | 5,448,000 | | | | 5,468,083 | |
| American International Group, Inc., 4.5%, 7/16/2044 | | | 4,835,000 | | | | 4,645,561 | |
| Lincoln National Corp., 3.8%, 3/01/2028 | | | 3,822,000 | | | | 3,716,392 | |
| Lincoln National Corp., 4.35%, 3/01/2048 | | | 2,730,000 | | | | 2,610,964 | |
| Met Life Glob Funding I , 3.45%, 12/18/2026 (n) | | | 3,094,000 | | | | 2,992,930 | |
| Principal Financial Group, Inc., 3.4%, 5/15/2025 | | | 10,529,000 | | | | 10,229,532 | |
| | | | | | | | |
| | | | | | | $ | 54,749,367 | |
| Insurance - Health - 0.3% | | | | | | | | |
| UnitedHealth Group, Inc., 2.375%, 10/15/2022 | | $ | 18,854,000 | | | $ | 18,084,458 | |
| | |
| Insurance - Property & Casualty - 1.0% | | | | | | | | |
| Allied World Assurance, 5.5%, 11/15/2020 | | $ | 3,362,000 | | | $ | 3,567,056 | |
| Allied World Assurance Co. Holdings Ltd., 4.35%, 10/29/2025 | | | 13,217,000 | | | | 12,928,061 | |
| Ambac Assurance Corp., 5.1%, 6/07/2020 (z) | | | 13,854 | | | | 18,356 | |
| Ambac LSNI, LLC, FLR, 6.811% (LIBOR-3mo. + 5%), 2/12/2023 (z) | | | 66,601 | | | | 67,267 | |
| Liberty Mutual Group, Inc., 4.85%, 8/01/2044 (n) | | | 11,271,000 | | | | 11,526,840 | |
| Marsh & McLennan Cos., Inc., 4.2%, 3/01/2048 | | | 22,209,000 | | | | 21,677,544 | |
| Swiss Re Ltd., 4.25%, 12/06/2042 (n) | | | 2,719,000 | | | | 2,706,642 | |
| | | | | | | | |
| | | | | | | $ | 52,491,766 | |
| Major Banks - 8.3% | | | | | | | | |
| ABN AMRO Bank N.V., 4.8%, 4/18/2026 (n) | | $ | 13,800,000 | | | $ | 14,022,332 | |
| Bank of America Corp., 3.3%, 1/11/2023 | | | 13,781,000 | | | | 13,623,023 | |
Bank of America Corp., 3.004% to 12/20/2022,
FLR to 12/20/2023 (n) | | | 7,493,000 | | | | 7,271,428 | |
18
Portfolio of Investments – continued
| | | | | | | | |
| Issuer | | Shares/Par | | | Value ($) | |
| Bonds - continued | | | | | | | | |
| Major Banks - continued | | | | | | | | |
| Bank of America Corp., 4.125%, 1/22/2024 | | $ | 8,133,000 | | | $ | 8,325,176 | |
| Bank of America Corp., 3.95%, 4/21/2025 | | | 4,458,000 | | | | 4,367,145 | |
| Bank of America Corp., 4.45%, 3/03/2026 | | | 11,782,000 | | | | 11,842,548 | |
Bank of America Corp., 3.419% to 12/20/2027,
FLR to 12/20/2028 (n) | | | 11,952,000 | | | | 11,223,652 | |
| Bank of America Corp., 4.443% to 01/20/2047, FLR to 1/20/2048 | | | 26,034,000 | | | | 26,089,533 | |
| Bank of America Corp., 6.5% to 10/23/2014, FLR to 10/23/2049 | | | 4,793,000 | | | | 5,080,580 | |
| Bank of America Corp., 6.1% to 3/17/2025, FLR to 12/29/2049 | | | 16,050,000 | | | | 16,631,812 | |
| Bank of America Corp., 5.875% to 3/15/2028, FLR to 12/31/2059 | | | 14,429,000 | | | | 14,400,142 | |
| Bank of New York Mellon Corp., 3.442% to 2/07/2027, FLR to 2/07/2028 | | | 25,625,000 | | | | 24,773,818 | |
| Barclays PLC, 4.375%, 1/12/2026 | | | 5,620,000 | | | | 5,549,109 | |
| Credit Suisse Group AG, 6.5%, 8/08/2023 (n) | | | 2,753,000 | | | | 2,980,122 | |
| Credit Suisse Group Fund Guernsey Ltd., 3.75%, 3/26/2025 | | | 11,024,000 | | | | 10,674,302 | |
| Goldman Sachs Group, Inc., 3.625%, 1/22/2023 | | | 15,548,000 | | | | 15,483,965 | |
| Goldman Sachs Group, Inc., 3.85%, 1/26/2027 | | | 8,201,000 | | | | 7,918,240 | |
| JPMorgan Chase & Co., 4.25%, 10/15/2020 | | | 2,264,000 | | | | 2,323,014 | |
| JPMorgan Chase & Co., 4.5%, 1/24/2022 | | | 3,300,000 | | | | 3,423,550 | |
| JPMorgan Chase & Co., 3.125%, 1/23/2025 | | | 5,071,000 | | | | 4,833,713 | |
| JPMorgan Chase & Co., 2.95%, 10/01/2026 | | | 22,838,000 | | | | 21,137,375 | |
| JPMorgan Chase & Co., 3.509% to 1/23/2028, FLR to 1/23/2029 | | | 11,009,000 | | | | 10,427,977 | |
| JPMorgan Chase & Co., 4.005% to 4/23/2028, FLR to 4/23/2029 | | | 19,869,000 | | | | 19,499,268 | |
| Lloyds Bank PLC, 3.75%, 1/11/2027 | | | 15,056,000 | | | | 14,403,253 | |
| Morgan Stanley, 5.5%, 7/28/2021 | | | 18,554,000 | | | | 19,717,712 | |
| Morgan Stanley, 4%, 7/23/2025 | | | 4,648,000 | | | | 4,634,125 | |
| Morgan Stanley, 3.875%, 1/27/2026 | | | 13,472,000 | | | | 13,277,883 | |
| Morgan Stanley, 3.125%, 7/27/2026 | | | 13,910,000 | | | | 12,951,446 | |
| Morgan Stanley, 4.3%, 1/27/2045 | | | 2,634,000 | | | | 2,549,392 | |
| Morgan Stanley, 4.375%, 1/22/2047 | | | 18,187,000 | | | | 17,680,478 | |
| PNC Bank N.A., 3.1%, 10/25/2027 | | | 21,548,000 | | | | 20,300,260 | |
| Royal Bank of Scotland Group PLC, 6%, 12/19/2023 | | | 8,134,000 | | | | 8,639,132 | |
Royal Bank of Scotland Group PLC, 8% to 8/10/2025,
FLR to 12/29/2049 | | | 2,205,000 | | | | 2,411,719 | |
Royal Bank of Scotland Group PLC, 7.5% to 8/10/2020,
FLR to 12/31/2165 | | | 7,305,000 | | | | 7,672,076 | |
| Sumitomo Mitsui Financial Group, Inc., 2.442%, 10/19/2021 | | | 13,825,000 | | | | 13,387,882 | |
| UBS Group Funding (Jersey) Ltd., 4.125%, 9/24/2025 (n) | | | 7,081,000 | | | | 7,045,789 | |
| UBS Group Funding (Switzerland) AG, 4.253%, 3/23/2028 (n) | | | 10,148,000 | | | | 10,086,944 | |
| UBS Group Funding Ltd., 3%, 4/15/2021 (n) | | | 13,057,000 | | | | 12,885,072 | |
| Wachovia Corp., 6.605%, 10/01/2025 | | | 2,193,000 | | | | 2,490,928 | |
| Wells Fargo & Co., 3.069%, 1/24/2023 | | | 16,413,000 | | | | 15,974,696 | |
| | | | | | | | |
| | | | | | | $ | 448,010,611 | |
19
Portfolio of Investments – continued
| | | | | | | | |
| Issuer | | Shares/Par | | | Value ($) | |
| Bonds - continued | | | | | | | | |
| Medical & Health Technology & Services - 2.5% | | | | | | | | |
| Catholic Health Initiatives, 2.95%, 11/01/2022 | | $ | 9,078,000 | | | $ | 8,758,822 | |
| CVS Health Corp., 4.78%, 3/25/2038 | | | 24,759,000 | | | | 24,483,338 | |
| CVS Health Corp., 5.125%, 7/20/2045 | | | 9,221,000 | | | | 9,577,554 | |
| Hackensack Meridian Health, Inc., 4.211%, 7/01/2048 | | | 8,428,000 | | | | 8,380,176 | |
| Hackensack Meridian Health, Inc., 4.5%, 7/01/2057 | | | 10,194,000 | | | | 10,736,687 | |
| HCA, Inc., 5.25%, 6/15/2026 | | | 19,763,000 | | | | 19,861,815 | |
| Laboratory Corp. of America Holdings, 3.6%, 2/01/2025 | | | 3,653,000 | | | | 3,560,051 | |
| Laboratory Corp. of America Holdings, 4.7%, 2/01/2045 | | | 7,367,000 | | | | 7,151,357 | |
| Life Technologies Corp., 5%, 1/15/2021 | | | 18,787,000 | | | | 19,445,902 | |
| Northwell Healthcare, Inc., 3.979%, 11/01/2046 | | | 3,110,000 | | | | 2,866,271 | |
| Northwell Healthcare, Inc., 4.26%, 11/01/2047 | | | 9,132,000 | | | | 8,800,107 | |
| Thermo Fisher Scientific, Inc., 3%, 4/15/2023 | | | 6,240,000 | | | | 6,045,541 | |
| Thermo Fisher Scientific, Inc., 2.95%, 9/19/2026 | | | 4,605,000 | | | | 4,265,103 | |
| | | | | | | | |
| | | | | | | $ | 133,932,724 | |
| Medical Equipment - 1.1% | | | | | | | | |
| Abbott Laboratories, 3.4%, 11/30/2023 | | $ | 20,815,000 | | | $ | 20,548,186 | |
| Abbott Laboratories, 4.9%, 11/30/2046 | | | 14,191,000 | | | | 15,355,808 | |
| Medtronic, Inc., 4.625%, 3/15/2045 | | | 9,183,000 | | | | 9,705,341 | |
| Zimmer Biomet Holdings, Inc., 2.7%, 4/01/2020 | | | 15,902,000 | | | | 15,750,692 | |
| | | | | | | | |
| | | | | | | $ | 61,360,027 | |
| Metals & Mining - 1.0% | | | | | | | | |
| Freeport-McMoRan Copper & Gold, Inc., 3.875%, 3/15/2023 | | $ | 3,076,000 | | | $ | 2,949,115 | |
| Freeport-McMoRan Copper & Gold, Inc., 5.4%, 11/14/2034 | | | 3,849,000 | | | | 3,550,703 | |
| Freeport-McMoRan, Inc., 6.875%, 2/15/2023 | | | 10,661,000 | | | | 11,433,923 | |
| Glencore Funding LLC, 4.125%, 5/30/2023 (n) | | | 7,920,000 | | | | 7,890,696 | |
| Glencore Funding LLC, 4%, 4/16/2025 (n) | | | 4,966,000 | | | | 4,833,402 | |
| Glencore Funding LLC, 4%, 3/27/2027 (n) | | | 13,000,000 | | | | 12,392,238 | |
| Kinross Gold Corp., 5.95%, 3/15/2024 | | | 2,209,000 | | | | 2,302,883 | |
| Kinross Gold Corp., 4.5%, 7/15/2027 (n) | | | 1,334,000 | | | | 1,253,960 | |
| Steel Dynamics, Inc., 5.125%, 10/01/2021 | | | 7,688,000 | | | | 7,824,846 | |
| | | | | | | | |
| | | | | | | $ | 54,431,766 | |
| Midstream - 1.4% | | | | | | | | |
| Enbridge, Inc., 4.25%, 12/01/2026 | | $ | 8,135,000 | | | $ | 8,057,055 | |
| Kinder Morgan (Delaware), Inc., 7.75%, 1/15/2032 | | | 8,098,000 | | | | 10,118,214 | |
| Kinder Morgan Energy Partners LP, 6.375%, 3/01/2041 | | | 6,862,000 | | | | 7,644,419 | |
| Kinder Morgan Energy Partners LP, 5.4%, 9/01/2044 | | | 8,327,000 | | | | 8,213,503 | |
| MPLX LP, 4.7%, 4/15/2048 | | | 10,919,000 | | | | 10,333,856 | |
| Phillips 66 Partners LP, 4.68%, 2/15/2045 | | | 2,692,000 | | | | 2,572,734 | |
| Sabine Pass Liquefaction, 4.2%, 3/15/2028 | | | 5,452,000 | | | | 5,297,760 | |
| Sabine Pass Liquefaction LLC, 5.625%, 2/01/2021 | | | 9,992,000 | | | | 10,488,197 | |
20
Portfolio of Investments – continued
| | | | | | | | |
| Issuer | | Shares/Par | | | Value ($) | |
| Bonds - continued | | | | | | | | |
| Midstream - continued | | | | | | | | |
| Sabine Pass Liquefaction LLC, 5%, 3/15/2027 | | $ | 10,181,000 | | | $ | 10,505,790 | |
| | | | | | | | |
| | | | | | | $ | 73,231,528 | |
| Mortgage-Backed - 14.5% | | | | | | | | |
| Fannie Mae, 2.578%, 9/25/2018 | | $ | 1,933,612 | | | $ | 1,929,377 | |
| Fannie Mae, 5.5%, 11/01/2018 - 12/01/2038 | | | 13,437,827 | | | | 14,666,265 | |
| Fannie Mae, 5.18%, 3/01/2019 | | | 440,336 | | | | 444,115 | |
| Fannie Mae, 5%, 1/01/2020 - 3/01/2042 | | | 15,862,667 | | | | 17,013,642 | |
| Fannie Mae, 5.19%, 9/01/2020 | | | 2,057,378 | | | | 2,107,258 | |
| Fannie Mae, 4.58%, 1/01/2021 | | | 3,971,300 | | | | 4,075,284 | |
| Fannie Mae, 2.41%, 5/01/2023 | | | 2,497,768 | | | | 2,415,704 | |
| Fannie Mae, 2.55%, 5/01/2023 | | | 1,289,096 | | | | 1,254,724 | |
| Fannie Mae, 3.93%, 10/01/2023 | | | 1,213,664 | | | | 1,251,629 | |
| Fannie Mae, 5.25%, 8/01/2024 | | | 883,341 | | | | 944,233 | |
| Fannie Mae, 4.5%, 5/01/2025 - 6/01/2044 | | | 68,092,556 | | | | 71,626,171 | |
| Fannie Mae, 2.684%, 12/25/2026 | | | 11,638,000 | | | | 10,936,090 | |
| Fannie Mae, 3.95%, 1/01/2027 | | | 657,324 | | | | 681,159 | |
| Fannie Mae, 4.01%, 1/01/2029 | | | 3,885,360 | | | | 4,065,299 | |
| Fannie Mae, 6.5%, 11/01/2031 - 1/01/2033 | | | 125,001 | | | | 139,260 | |
| Fannie Mae, 3%, 12/01/2031 - 11/01/2046 | | | 44,600,490 | | | | 43,221,739 | |
| Fannie Mae, 6%, 5/01/2034 - 10/01/2038 | | | 4,882,411 | | | | 5,448,015 | |
| Fannie Mae, 4%, 9/01/2040 - 2/01/2045 | | | 129,072,097 | | | | 132,403,001 | |
| Fannie Mae, 3.5%, 11/01/2041 - 1/01/2047 | | | 84,051,263 | | | | 83,704,254 | |
| Freddie Mac, 5%, 5/01/2018 - 7/01/2041 | | | 8,176,450 | | | | 8,774,996 | |
| Freddie Mac, 2.303%, 9/25/2018 | | | 1,978,272 | | | | 1,973,690 | |
| Freddie Mac, 2.323%, 10/25/2018 | | | 4,819,269 | | | | 4,807,395 | |
| Freddie Mac, 2.13%, 1/25/2019 | | | 12,715,760 | | | | 12,660,098 | |
| Freddie Mac, 5.5%, 6/01/2019 - 1/01/2038 | | | 3,147,574 | | | | 3,437,933 | |
| Freddie Mac, 2.456%, 8/25/2019 | | | 8,243,898 | | | | 8,219,010 | |
| Freddie Mac, 1.869%, 11/25/2019 | | | 7,400,401 | | | | 7,306,525 | |
| Freddie Mac, 4.251%, 1/25/2020 | | | 4,342,703 | | | | 4,436,069 | |
| Freddie Mac, 2.313%, 3/25/2020 | | | 8,336,413 | | | | 8,252,540 | |
| Freddie Mac, 3.034%, 10/25/2020 | | | 8,349,237 | | | | 8,366,062 | |
| Freddie Mac, 2.856%, 1/25/2021 | | | 3,765,630 | | | | 3,753,289 | |
| Freddie Mac, 2.791%, 1/25/2022 | | | 7,153,871 | | | | 7,090,974 | |
| Freddie Mac, 2.716%, 6/25/2022 | | | 3,677,393 | | | | 3,629,995 | |
| Freddie Mac, 2.355%, 7/25/2022 | | | 10,625,468 | | | | 10,308,278 | |
| Freddie Mac, 3.32%, 2/25/2023 | | | 5,070,913 | | | | 5,123,069 | |
| Freddie Mac, 3.25%, 4/25/2023 | | | 7,830,787 | | | | 7,884,586 | |
| Freddie Mac, 3.06%, 7/25/2023 | | | 5,298,995 | | | | 5,284,935 | |
| Freddie Mac, 3.531%, 7/25/2023 | | | 2,816,666 | | | | 2,876,636 | |
| Freddie Mac, 3.458%, 8/25/2023 | | | 16,280,782 | | | | 16,503,309 | |
| Freddie Mac, 2.67%, 12/25/2024 | | | 4,982,063 | | | | 4,822,830 | |
21
Portfolio of Investments – continued
| | | | | | | | |
| Issuer | | Shares/Par | | | Value ($) | |
| Bonds - continued | | | | | | | | |
| Mortgage-Backed - continued | | | | | | | | |
| Freddie Mac, 2.811%, 1/25/2025 | | $ | 7,744,684 | | | $ | 7,552,222 | |
| Freddie Mac, 3.329%, 5/25/2025 | | | 9,013,328 | | | | 9,066,922 | |
| Freddie Mac, 4%, 7/01/2025 - 4/01/2044 | | | 17,624,843 | | | | 18,104,736 | |
| Freddie Mac, 4.5%, 7/01/2025 - 5/01/2042 | | | 12,356,363 | | | | 12,998,058 | |
| Freddie Mac, 2.745%, 1/25/2026 | | | 5,732,258 | | | | 5,513,658 | |
| Freddie Mac, 2.673%, 3/25/2026 | | | 15,673,350 | | | | 14,983,563 | |
| Freddie Mac, 3.3%, 10/25/2026 | | | 4,957,000 | | | | 4,929,879 | |
| Freddie Mac, 3.224%, 3/25/2027 | | | 9,573,000 | | | | 9,441,704 | |
| Freddie Mac, 3.117%, 6/25/2027 | | | 17,177,017 | | | | 16,777,368 | |
| Freddie Mac, 6%, 11/01/2033 - 7/01/2038 | | | 1,413,783 | | | | 1,574,550 | |
| Freddie Mac, 3.5%, 2/01/2042 - 12/01/2046 | | | 67,204,608 | | | | 66,991,978 | |
| Freddie Mac, 3%, 10/01/2042 - 10/01/2046 | | | 39,957,742 | | | | 38,669,193 | |
| Ginnie Mae, 5.5%, 11/15/2032 - 1/20/2042 | | | 2,234,847 | | | | 2,419,189 | |
| Ginnie Mae, 6%, 2/15/2034 - 1/15/2038 | | | 2,056,246 | | | | 2,311,091 | |
| Ginnie Mae, 4.5%, 4/15/2039 - 2/20/2042 | | | 19,668,514 | | | | 20,719,429 | |
| Ginnie Mae, 4%, 10/20/2040 - 2/20/2041 | | | 5,879,286 | | | | 6,076,150 | |
| Ginnie Mae, 3.5%, 11/15/2040 - 4/15/2042 | | | 10,132,282 | | | | 10,196,245 | |
| | | | | | | | |
| | | | | | | $ | 782,165,373 | |
| Municipals - 1.2% | | | | | | | | |
| New Jersey Economic Development Authority State Pension | | | | | | | | |
| Funding Rev., Capital Appreciation, “B”, 0%, 2/15/2023 | | $ | 29,043,000 | | | $ | 24,093,782 | |
| Oklahoma Development Finance Authority, Health System Rev. | | | | | | | | |
| (OU Medicine Project), “C”, 5.45%, 8/15/2028 | | | 8,467,000 | | | | 8,875,872 | |
| Philadelphia, PA, School District, “B”, 6.615%, 6/01/2030 | | | 6,320,000 | | | | 7,397,054 | |
| Philadelphia, PA, School District, “B”, 6.765%, 6/01/2040 | | | 4,260,000 | | | | 5,425,238 | |
| State of California (Build America Bonds), 7.625%, 3/01/2040 | | | 1,250,000 | | | | 1,866,888 | |
| State of California (Build America Bonds), 7.6%, 11/01/2040 | | | 9,570,000 | | | | 14,524,006 | |
| University of California Limited Project Rev., “J”, 4.131%, 5/15/2045 | | | 2,920,000 | | | | 2,977,816 | |
| | | | | | | | |
| | | | | | | $ | 65,160,656 | |
| Natural Gas - Distribution - 0.6% | | | | | | | | |
| Boston Gas Co., 3.15%, 8/01/2027 (n) | | $ | 18,948,000 | | | $ | 18,002,655 | |
| KeySpan Gas East Corp., 2.742%, 8/15/2026 (z) | | | 14,712,000 | | | | 13,566,012 | |
| | | | | | | | |
| | | | | | | $ | 31,568,667 | |
| Network & Telecom - 1.1% | | | | | | | | |
| AT&T, Inc, 5.25%, 3/01/2037 | | $ | 20,055,000 | | | $ | 20,494,188 | |
| AT&T, Inc., 4.5%, 5/15/2035 | | | 18,013,000 | | | | 17,173,094 | |
| AT&T, Inc., 4.75%, 5/15/2046 | | | 11,628,000 | | | | 10,829,737 | |
| AT&T, Inc., 5.15%, 2/14/2050 | | | 10,115,000 | | | | 10,248,281 | |
| | | | | | | | |
| | | | | | | $ | 58,745,300 | |
22
Portfolio of Investments – continued
| | | | | | | | |
| Issuer | | Shares/Par | | | Value ($) | |
| Bonds - continued | | | | | | | | |
| Oils - 0.5% | | | | | | | | |
| Andeavor, 3.8%, 4/01/2028 | | $ | 4,605,000 | | | $ | 4,432,814 | |
| Marathon Petroleum Corp., 4.75%, 9/15/2044 | | | 18,425,000 | | | | 18,185,081 | |
| Marathon Petroleum Corp., 5.85%, 12/15/2045 | | | 5,043,000 | | | | 5,494,975 | |
| | | | | | | | |
| | | | | | | $ | 28,112,870 | |
| Other Banks & Diversified Financials - 1.7% | | | | | | | | |
| BBVA Bancomer S.A. de C.V., 6.75%, 9/30/2022 (n) | | $ | 3,408,000 | | | $ | 3,693,590 | |
| BPCE S.A., 4.5%, 3/15/2025 (n) | | | 7,513,000 | | | | 7,466,455 | |
| Citigroup, Inc., 4.4%, 6/10/2025 | | | 6,407,000 | | | | 6,400,928 | |
| Compass Bank, 2.875%, 6/29/2022 | | | 17,025,000 | | | | 16,389,413 | |
| Groupe BPCE S.A., 12.5% to 9/30/2019, FLR to 8/29/2049 (n) | | | 13,740,000 | | | | 15,337,275 | |
| ING Groep N.V., 3.95%, 3/29/2027 | | | 4,571,000 | | | | 4,497,652 | |
| Macquarie Bank Ltd., 6.125% to 3/08/2027, FLR to 12/31/2165 (n) | | | 15,364,000 | | | | 14,787,850 | |
| SunTrust Banks, Inc., 2.7%, 1/27/2022 | | | 11,499,000 | | | | 11,198,101 | |
| SunTrust Banks, Inc., 3.3%, 5/15/2026 | | | 12,250,000 | | | | 11,594,738 | |
| | | | | | | | |
| | | | | | | $ | 91,366,002 | |
| Pharmaceuticals - 0.1% | | | | | | | | |
| Gilead Sciences, Inc., 2.35%, 2/01/2020 | | $ | 1,062,000 | | | $ | 1,053,556 | |
| Gilead Sciences, Inc., 4.75%, 3/01/2046 | | | 4,995,000 | | | | 5,168,706 | |
| | | | | | | | |
| | | | | | | $ | 6,222,262 | |
| Railroad & Shipping - 0.1% | | | | | | | | |
| Preferred Term Securities XIX Ltd., CDO, FLR, 2.474% (LIBOR-3mo. + 0.35%), 12/22/2035 (z) | | $ | 5,210,422 | | | $ | 4,806,614 | |
| | |
| Real Estate - Apartment - 0.1% | | | | | | | | |
| Mid-America Apartment Communities, Inc., REIT, 4.3%, 10/15/2023 | | $ | 2,876,000 | | | $ | 2,937,472 | |
| | |
| Real Estate - Retail - 0.4% | | | | | | | | |
| Brixmor Operating Partnership LP, REIT, 3.875%, 8/15/2022 | | $ | 8,618,000 | | | $ | 8,590,095 | |
| Realty Income Corp., 3.65%, 1/15/2028 | | | 12,491,000 | | | | 11,894,288 | |
| | | | | | | | |
| | | | | | | $ | 20,484,383 | |
| Retailers - 0.3% | | | | | | | | |
| Best Buy Co., Inc., 5.5%, 3/15/2021 | | $ | 14,246,000 | | | $ | 14,970,058 | |
| | |
| Telecommunications - Wireless - 1.2% | | | | | | | | |
| American Tower Corp., REIT, 3.55%, 7/15/2027 | | $ | 23,507,000 | | | $ | 21,925,489 | |
| Crown Castle International Corp., 2.25%, 9/01/2021 | | | 7,361,000 | | | | 7,066,895 | |
| Crown Castle International Corp., 3.2%, 9/01/2024 | | | 4,931,000 | | | | 4,687,368 | |
| Crown Castle International Corp., 3.7%, 6/15/2026 | | | 3,950,000 | | | | 3,756,409 | |
23
Portfolio of Investments – continued
| | | | | | | | |
| Issuer | | Shares/Par | | | Value ($) | |
| Bonds - continued | | | | | | | | |
| Telecommunications - Wireless - continued | | | | | | | | |
| Crown Castle International Corp., 4%, 3/01/2027 | | $ | 1,862,000 | | | $ | 1,799,241 | |
| Crown Castle International Corp., 3.8%, 2/15/2028 | | | 4,853,000 | | | | 4,609,683 | |
| Crown Castle Towers LLC, 4.883%, 8/15/2020 (n) | | | 13,376,000 | | | | 13,802,297 | |
| SBA Tower Trust, 2.898%, 10/11/2044 (n) | | | 7,030,000 | | | | 7,031,170 | |
| | | | | | | | |
| | | | | | | $ | 64,678,552 | |
| Tobacco - 1.0% | | | | | | | | |
| BAT Capital Corp., 3.222%, 8/15/2024 (z) | | $ | 37,270,000 | | | $ | 35,413,385 | |
| Imperial Tobacco Finance PLC, 3.75%, 7/21/2022 (n) | | | 15,574,000 | | | | 15,586,951 | |
| Reynolds American, Inc., 8.125%, 6/23/2019 | | | 4,620,000 | | | | 4,879,834 | |
| | | | | | | | |
| | | | | | | $ | 55,880,170 | |
| Transportation - Services - 0.3% | | | | | | | | |
| ERAC USA Finance LLC, 3.85%, 11/15/2024 (n) | | $ | 1,863,000 | | | $ | 1,860,072 | |
| ERAC USA Finance LLC, 7%, 10/15/2037 (n) | | | 11,169,000 | | | | 14,255,143 | |
| ERAC USA Finance LLC, 4.5%, 2/15/2045 (n) | | | 1,327,000 | | | | 1,281,313 | |
| | | | | | | | |
| | | | | | | $ | 17,396,528 | |
| U.S. Government Agencies and Equivalents - 1.0% | | | | | | | | |
| Small Business Administration, 6.35%, 4/01/2021 | | $ | 823 | | | $ | 851 | |
| Small Business Administration, 6.34%, 5/01/2021 | | | 1,639 | | | | 1,688 | |
| Small Business Administration, 6.44%, 6/01/2021 | | | 2,651 | | | | 2,742 | |
| Small Business Administration, 5.34%, 11/01/2021 | | | 14,602 | | | | 14,929 | |
| Small Business Administration, 6.07%, 3/01/2022 | | | 9,182 | | | | 9,510 | |
| Small Business Administration, 4.35%, 7/01/2023 | | | 109,481 | | | | 112,281 | |
| Small Business Administration, 4.98%, 11/01/2023 | | | 143,388 | | | | 149,038 | |
| Small Business Administration, 4.89%, 12/01/2023 | | | 148,302 | | | | 152,970 | |
| Small Business Administration, 4.93%, 1/01/2024 | | | 177,226 | | | | 183,224 | |
| Small Business Administration, 4.34%, 3/01/2024 | | | 230,066 | | | | 234,851 | |
| Small Business Administration, 5.18%, 5/01/2024 | | | 170,258 | | | | 176,427 | |
| Small Business Administration, 5.52%, 6/01/2024 | | | 187,348 | | | | 194,453 | |
| Small Business Administration, 5.19%, 7/01/2024 | | | 230,153 | | | | 238,477 | |
| Small Business Administration, 4.86%, 10/01/2024 | | | 114,987 | | | | 118,288 | |
| Small Business Administration, 4.57%, 6/01/2025 | | | 393,877 | | | | 401,738 | |
| Small Business Administration, 4.76%, 9/01/2025 | | | 1,086,554 | | | | 1,114,724 | |
| Small Business Administration, 5.39%, 12/01/2025 | | | 95,953 | | | | 99,995 | |
| Small Business Administration, 5.35%, 2/01/2026 | | | 543,741 | | | | 567,083 | |
| Small Business Administration, 3.25%, 11/01/2030 | | | 1,921,667 | | | | 1,938,105 | |
| Small Business Administration, 2.85%, 9/01/2031 | | | 3,152,002 | | | | 3,114,607 | |
| Small Business Administration, 2.37%, 8/01/2032 | | | 2,344,011 | | | | 2,290,294 | |
| Small Business Administration, 2.13%, 1/01/2033 | | | 3,511,825 | | | | 3,395,547 | |
| Small Business Administration, 2.21%, 2/01/2033 | | | 979,409 | | | | 947,357 | |
| Small Business Administration, 2.22%, 3/01/2033 | | | 3,505,785 | | | | 3,396,008 | |
24
Portfolio of Investments – continued
| | | | | | | | |
| Issuer | | Shares/Par | | | Value ($) | |
| Bonds - continued | | | | | | | | |
| U.S. Government Agencies and Equivalents - continued | | | | | |
| Small Business Administration, 2.08%, 4/01/2033 | | $ | 5,593,276 | | | $ | 5,402,148 | |
| Small Business Administration, 2.45%, 6/01/2033 | | | 7,255,032 | | | | 7,078,495 | |
| Small Business Administration, 3.15%, 7/01/2033 | | | 9,272,204 | | | | 9,308,457 | |
| Small Business Administration, 3.16%, 8/01/2033 | | | 8,818,895 | | | | 8,861,099 | |
| Small Business Administration, 3.62%, 9/01/2033 | | | 4,831,815 | | | | 4,915,583 | |
| | | | | | �� | | |
| | | | | | | $ | 54,420,969 | |
| U.S. Treasury Obligations - 25.0% | | | | | | | | |
| U.S. Treasury Bonds, 4.5%, 2/15/2036 | | $ | 9,176,000 | | | $ | 11,105,111 | |
| U.S. Treasury Bonds, 5%, 5/15/2037 | | | 2,338,000 | | | | 3,018,942 | |
| U.S. Treasury Bonds, 4.375%, 2/15/2038 | | | 3,136,000 | | | | 3,776,797 | |
| U.S. Treasury Bonds, 3.5%, 2/15/2039 | | | 37,732,000 | | | | 40,563,374 | |
| U.S. Treasury Bonds, 4.5%, 8/15/2039 | | | 82,205,100 | | | | 101,227,874 | |
| U.S. Treasury Bonds, 2.875%, 5/15/2043 | | | 87,127,000 | | | | 83,978,857 | |
| U.S. Treasury Bonds, 2.5%, 2/15/2045 | | | 29,323,000 | | | | 26,159,323 | |
| U.S. Treasury Bonds, 2.875%, 11/15/2046 | | | 27,653,000 | | | | 26,495,031 | |
| U.S. Treasury Notes, 1%, 11/30/2018 | | | 276,884,000 | | | | 275,110,212 | |
| U.S. Treasury Notes, 2.75%, 2/15/2019 | | | 62,952,900 | | | | 63,206,187 | |
| U.S. Treasury Notes, 1%, 6/30/2019 | | | 62,935,000 | | | | 61,971,308 | |
| U.S. Treasury Notes, 1.625%, 6/30/2019 (f) | | | 294,589,000 | | | | 292,183,958 | |
| U.S. Treasury Notes, 1.625%, 11/30/2020 | | | 88,567,000 | | | | 86,442,775 | |
| U.S. Treasury Notes, 1.75%, 11/30/2021 | | | 165,691,000 | | | | 160,318,986 | |
| U.S. Treasury Notes, 1.75%, 9/30/2022 | | | 103,311,000 | | | | 98,980,817 | |
| U.S. Treasury Notes, 2%, 11/15/2026 | | | 9,150,000 | | | | 8,506,283 | |
| | | | | | | | |
| | | | | | | $ | 1,343,045,835 | |
| Utilities - Electric Power - 2.5% | | | | | | | | |
| AEP Transmission Co. LLC, 3.1%, 12/01/2026 (n) | | $ | 2,544,000 | | | $ | 2,419,083 | |
| AEP Transmission Co. LLC, 3.1%, 12/01/2026 | | | 6,464,000 | | | | 6,146,601 | |
| AEP Transmission Co. LLC, 4%, 12/01/2046 | | | 7,883,000 | | | | 7,714,126 | |
| Berkshire Hathaway Energy Co., 5.15%, 11/15/2043 | | | 7,489,000 | | | | 8,524,464 | |
| Dominion Resources, Inc., 3.625%, 12/01/2024 | | | 15,261,000 | | | | 15,013,644 | |
| Dominion Resources, Inc., 3.9%, 10/01/2025 | | | 2,892,000 | | | | 2,859,745 | |
| Enel Finance International N.V., 3.625%, 5/25/2027 (n) | | | 27,962,000 | | | | 26,407,244 | |
| Enel Finance International N.V., 3.5%, 4/06/2028 (z) | | | 30,206,000 | | | | 28,047,280 | |
| Exelon Corp., 3.497%, 6/01/2022 | | | 2,252,000 | | | | 2,216,446 | |
| Firstenergy Corp., 4.85%, 7/15/2047 | | | 17,208,000 | | | | 17,898,917 | |
| PPL Capital Funding, Inc., 5%, 3/15/2044 | | | 3,924,000 | | | | 4,202,471 | |
| PPL Corp., 3.5%, 12/01/2022 | | | 3,299,000 | | | | 3,287,025 | |
| PPL WEM Holdings PLC, 5.375%, 5/01/2021 (n) | | | 10,545,000 | | | | 10,990,200 | |
| | | | | | | | |
| | | | | | | $ | 135,727,246 | |
| Total Bonds (Identified Cost, $5,438,049,982) | | | | | | $ | 5,327,919,513 | |
25
Portfolio of Investments – continued
| | | | | | | | |
| Investment Companies (h) - 0.9% | | | | | | | | |
| Issuer | | Shares/Par | | | Value ($) | |
| Money Market Funds - 0.9% | | | | | | | | |
| MFS Institutional Money Market Portfolio, 1.78% (v) (Identified Cost, $49,539,698) | | | 49,547,756 | | | $ | 49,542,800 | |
| | |
| Other Assets, Less Liabilities - 0.1% | | | | | | | 7,704,042 | |
| Net Assets - 100.0% | | | | | | $ | 5,385,166,355 | |
| (f) | All or a portion of the security has been segregated as collateral for open futures contracts. |
| (h) | An affiliated issuer may be considered one in which the fund owns 5% or more of the outstanding voting securities, or a company which is under common control. At period end, the aggregate values of the fund’s investments in affiliated issuers and in unaffiliated issuers were $49,542,800 and $5,327,919,513, respectively. |
| (i) | Interest only security for which the fund receives interest on notional principal (Par amount). Par amount shown is the notional principal and does not reflect the cost of the security. |
| (n) | Securities exempt from registration under Rule 144A of the Securities Act of 1933. These securities may be sold in the ordinary course of business in transactions exempt from registration, normally to qualified institutional buyers. At period end, the aggregate value of these securities was $746,153,450, representing 13.9% of net assets. |
| (q) | Interest received was less than stated coupon rate. |
| (v) | Affiliated issuer that is available only to investment companies managed by MFS. The rate quoted for the MFS Institutional Money Market Portfolio is the annualized seven-day yield of the fund at period end. |
| (z) | Restricted securities are not registered under the Securities Act of 1933 and are subject to legal restrictions on resale. These securities generally may be resold in transactions exempt from registration or to the public if the securities are subsequently registered. Disposal of these securities may involve time-consuming negotiations and prompt sale at an acceptable price may be difficult. The fund holds the following restricted securities: |
| | | | | | | | | | |
| Restricted Securities | | Acquisition
Date | | Cost | | | Value | |
| AIMCO Properties CLO LP, 2015-AA, “BR”, FLR, 3.648% (LIBOR-3mo. + 1.30%), 1/15/2028 | | 12/12/17 | | | $16,000,000 | | | | $15,865,840 | |
| ALM V Ltd., 2012-5A, “A2R3”, FLR, 3.605% (LIBOR-3mo. + 1.25%), 10/18/2027 | | 10/04/17 | | | 8,340,000 | | | | 8,333,345 | |
| ALM V Ltd., 2012-5A, “BR3”, FLR, 4.005% | | | | | | | | | | |
| (LIBOR-3mo. + 1.7%), 10/18/2027 | | 10/04/17 | | | 3,070,000 | | | | 3,070,353 | |
| Ambac Assurance Corp., 5.1%, 6/07/2020 | | 2/14/18 | | | 5,749 | | | | 18,356 | |
| Ambac LSNI, LLC, FLR, 6.811% (LIBOR-3mo. + 5%), 2/12/2023 | | 2/14/18 | | | 14,878 | | | | 67,267 | |
| Ballyrock Ltd., CLO, FLR, 3.065% (LIBOR-3mo. + 1.18%), 5/20/2025 | | 5/10/16 | | | 2,667,446 | | | | 2,684,148 | |
| Bancorp Commercial Mortgage Trust, 2018-CR3, | | | | | | | | | | |
| “A”, 2.747%, 1/15/2033 | | 3/13/18 | | | 13,934,734 | | | | 13,934,720 | |
| Bancorp Commercial Mortgage Trust, 2018-CR3, “AS”, 3.147%, 1/15/2033 | | 3/13/18 | | | 8,360,841 | | | | 8,360,827 | |
26
Portfolio of Investments – continued
| | | | | | | | | | |
| Restricted Securities - continued | | Acquisition
Date | | Cost | | | Value | |
| Bancorp Commercial Mortgage Trust, 2018-CR3, “D”, FLR, 4.597% (LIBOR-1mo. + 2.7%), 1/15/2033 | | 3/13/18 | | | $2,229,557 | | | | $2,235,427 | |
| BAT Capital Corp., 3.222%, 8/15/2024 | | 8/08/17-8/09/17 | | | 37,312,258 | | | | 35,413,385 | |
| Bayview Commercial Asset Trust, 0%, 12/25/2036 | | 10/25/06 | | | 506 | | | | 435 | |
| Bayview Commercial Asset Trust, FLR, 2.207% (LIBOR-1mo. + 0.31%), 8/25/2035 | | 6/09/05 | | | 224,036 | | | | 212,663 | |
| Bayview Commercial Asset Trust, FLR, 2.142% (LIBOR-1mo. + 0.27%), 4/25/2036 | | 2/23/06 | | | 180,003 | | | | 170,286 | |
| Bayview Financial Revolving Mortgage Loan Trust, FLR, 3.501% (LIBOR-1mo. + 1.6%), 12/28/2040 | | 3/01/06 | | | 1,815,799 | | | | 1,647,427 | |
| Business Jet Securities LLC, 2018-1, “A”, 4.335%, 2/15/2033 | | 2/21/18 | | | 22,759,980 | | | | 22,816,279 | |
| Cavalry CLO IV Ltd., 2014-4A, “B1R”, FLR, 3.698% (LIBOR-3mo. + 1.35%), 10/15/2026 | | 10/04/17 | | | 6,670,000 | | | | 6,666,011 | |
| Cavalry CLO IV Ltd./Cavalry CLO IV LLC, FLR, 4.248% (LIBOR-3mo. + 1.9%), 10/15/2026 | | 10/04/17 | | | 7,790,000 | | | | 7,785,677 | |
| Cavalry CLO IV Ltd./Cavalry CLO IV LLC, FLR, 4.248% (LIBOR-3mo. + 1.9%), 10/15/2026 | | 10/04/17 | | | 5,560,000 | | | | 5,556,610 | |
| Chesapeake Funding II LLC, 2017-4A, “A1”, 2.12%, 11/15/2029 | | 10/24/17 | | | 14,024,050 | | | | 13,852,825 | |
| Chesapeake Funding II LLC, 2018-1A, “A1”, 3.04%, 4/15/2030 | | 4/11/18 | | | 14,169,553 | | | | 14,136,236 | |
| Commercial Mortgage Asset Trust, 1.466%, 1/17/2032 | | 8/25/03-4/09/12 | | | 0 | | | | 17 | |
| CRH America Finance, Inc., 3.95%, 4/04/2028 | | 3/27/18 | | | 17,910,317 | | | | 17,595,802 | |
| Enel Finance International N.V., 3.5%, 4/06/2028 | | 10/03/17 | | | 29,848,867 | | | | 28,047,280 | |
| Falcon Franchise Loan LLC, 7.966%, 1/05/2023 | | 1/18/02-3/23/11 | | | 0 | | | | 349 | |
| GMF Floorplan Owner Revolving Trust, 2017-2, | | | | | | | | | | |
| “C”, 2.63%, 7/15/2022 | | 8/15/17 | | | 7,999,371 | | | | 7,832,368 | |
| Granite Point Mortgage Trust Inc., 2.796%, 12/19/2035 | | 4/26/18 | | | 11,360,000 | | | | 11,342,960 | |
| KeySpan Gas East Corp., 2.742%, 8/15/2026 | | 8/02/16 | | | 14,712,000 | | | | 13,566,012 | |
| Morgan Stanley Capital I, Inc., 1.836%, 3/15/2031 | | 6/10/03 | | | 7 | | | | 1 | |
| NextGear Floorplan Master Owner Trust, 2018-1A, “A2”, 3.22%, 2/15/2023 | | 3/06/18 | | | 7,284,156 | | | | 7,261,630 | |
| OCP CLO Ltd., 2015-9A, “A2R”, FLR, 3.698% (LIBOR-3mo. + 1.35%) 7/15/2027 | | 10/27/17 | | | 13,240,000 | | | | 13,227,965 | |
| Preferred Term Securities XIX Ltd., CDO, FLR, 2.474% (LIBOR-3mo. + 0.35%), 12/22/2035 | | 9/08/05-3/28/11 | | | 5,166,811 | | | | 4,806,614 | |
| TICP CLO Ltd., 2018-IA, “A2”, FLR, 3.862% (LIBOR-3mo. + 1.5%), 4/26/2028 | | 4/17/18 | | | 16,262,022 | | | | 16,233,563 | |
| Total Restricted Securities | | | | | | | | | $282,742,678 | |
| % of Net assets | | | | | | | | | 5.3% | |
27
Portfolio of Investments – continued
The following abbreviations are used in this report and are defined:
| CDO | | Collateralized Debt Obligation |
| CLO | | Collateralized Loan Obligation |
| FLR | | Floating Rate. Interest rate resets periodically based on the parenthetically disclosed reference rate plus a spread (if any). The period-end rate reported may not be the current rate. |
| PLC | | Public Limited Company |
| REIT | | Real Estate Investment Trust |
Derivative Contracts at 4/30/18
Futures Contracts
| | | | | | | | | | | | | | | | | | | | | | |
| Description | | Long/
Short | | | Currency | | | Contracts | | Notional
Amount | | | Expiration
Date | | | Value/
Unrealized
Appreciation
(Depreciation) | |
| Asset Derivatives | | | | | | | | | | | | | | | | | | | | | | |
| Interest Rate Futures | | | | | | | | | | | | | | | | | | | | | | |
| U.S. Treasury Ultra Note 10 yr | | | Short | | | | USD | | | 1,750 | | | $223,808,594 | | | | June - 2018 | | | | $829,585 | |
| | | | | | | | | | | | | | | | | | | | | | |
| Liability Derivatives | | | | | | | | | | | | | | | | | | | | | | |
| Interest Rate Futures | | | | | | | | | | | | | | | | | | | | | | |
| U.S. Treasury Note 2 yr | | | Long | | | | USD | | | 870 | | | $184,480,781 | | | | June - 2018 | | | | $(484,478 | ) |
| U.S. Treasury Note 5 yr | | | Long | | | | USD | | | 1,175 | | | 133,371,680 | | | | June - 2018 | | | | (735,170 | ) |
| U.S. Treasury Ultra Bond 30 yr | | | Long | | | | USD | | | 400 | | | 62,850,000 | | | | June - 2018 | | | | (389,798 | ) |
| | | | | | | | | | | | | | | | | | | | | | |
| | | | | | | | | | | | | | | | | | | | | $(1,609,446 | ) |
| | | | | | | | | | | | | | | | | | | | | | |
At April 30, 2018, the fund had liquid securities with an aggregate value of $792,480 to cover any collateral or margin obligations for certain derivative contracts.
See Notes to Financial Statements
28
Financial Statements
STATEMENT OF ASSETS AND LIABILITIES
At 4/30/18
This statement represents your fund’s balance sheet, which details the assets and liabilities comprising the total value of the fund.
| | | | |
| Assets | | | | |
Investments in unaffiliated issuers, at value (identified cost, $5,438,049,982) | | | $5,327,919,513 | |
Investments in affiliated issuers, at value (identified cost, $49,539,698) | | | 49,542,800 | |
Cash | | | 19,221 | |
Receivables for | | | | |
Investments sold | | | 256,262 | |
Fund shares sold | | | 12,683,714 | |
Interest | | | 35,101,184 | |
Other assets | | | 13,661 | |
Total assets | | | $5,425,536,355 | |
| Liabilities | | | | |
Payables for | | | | |
Distributions | | | $1,885,159 | |
Daily variation margin on open futures contracts | | | 65,151 | |
Investments purchased | | | 31,014,115 | |
Fund shares reacquired | | | 5,494,450 | |
Payable to affiliates | | | | |
Investment adviser | | | 150,122 | |
Shareholder servicing costs | | | 1,308,961 | |
Distribution and service fees | | | 46,621 | |
Program manager fee | | | 68 | |
Payable for independent Trustees’ compensation | | | 12 | |
Accrued expenses and other liabilities | | | 405,341 | |
Total liabilities | | | $40,370,000 | |
Net assets | | | $5,385,166,355 | |
| Net assets consist of | | | | |
Paid-in capital | | | $5,553,724,335 | |
Unrealized appreciation (depreciation) | | | (110,907,228 | ) |
Accumulated net realized gain (loss) | | | (61,789,910 | ) |
Undistributed net investment income | | | 4,139,158 | |
Net assets | | | $5,385,166,355 | |
Shares of beneficial interest outstanding | | | 518,082,310 | |
29
Statement of Assets and Liabilities – continued
| | | | | | | | | | | | |
| | | Net assets | | | Shares
outstanding | | | Net asset value
per share (a) | |
Class A | | | $1,761,170,608 | | | | 169,462,755 | | | | $10.39 | |
Class B | | | 18,206,977 | | | | 1,749,395 | | | | 10.41 | |
Class C | | | 100,767,769 | | | | 9,683,740 | | | | 10.41 | |
Class I | | | 1,180,740,658 | | | | 113,584,796 | | | | 10.40 | |
Class R1 | | | 1,293,158 | | | | 124,240 | | | | 10.41 | |
Class R2 | | | 44,339,146 | | | | 4,267,898 | | | | 10.39 | |
Class R3 | | | 75,763,851 | | | | 7,290,662 | | | | 10.39 | |
Class R4 | | | 103,144,465 | | | | 9,921,500 | | | | 10.40 | |
Class R6 | | | 2,087,409,420 | | | | 200,810,294 | | | | 10.39 | |
Class 529A | | | 8,816,195 | | | | 849,334 | | | | 10.38 | |
Class 529B | | | 303,846 | | | | 29,193 | | | | 10.41 | |
Class 529C | | | 3,210,262 | | | | 308,503 | | | | 10.41 | |
| (a) | Maximum offering price per share was equal to the net asset value per share for all share classes, except for Classes A and 529A, for which the maximum offering prices per share were $10.85 [100 / 95.75 x $10.39] and $10.84 [100 / 95.75 x $10.38], respectively. On sales of $100,000 or more, the maximum offering prices of Class A and Class 529A shares are reduced. A contingent deferred sales charge may be imposed on redemptions of Class A, Class B, Class C, Class 529B, and Class 529C shares. Redemption price per share was equal to the net asset value per share for Classes I, R1, R2, R3, R4, R6, and 529A. Net asset value per share is calculated using actual net assets and shares outstanding rather than amounts that have been rounded for presentation purposes. |
See Notes to Financial Statements
30
Financial Statements
STATEMENT OF OPERATIONS
Year ended 4/30/18
This statement describes how much your fund earned in investment income and accrued in expenses. It also describes any gains and/or losses generated by fund operations.
| | | | |
| Net investment income (loss) | | | | |
Income | | | | |
Interest | | | $158,267,923 | |
Dividends from affiliated issuers | | | 1,359,465 | |
Total investment income | | | $159,627,388 | |
Expenses | | | | |
Management fee | | | $24,354,884 | |
Distribution and service fees | | | 6,283,366 | |
Shareholder servicing costs | | | 3,804,107 | |
Program manager fees | | | 10,021 | |
Administrative services fee | | | 640,971 | |
Independent Trustees’ compensation | | | 55,663 | |
Custodian fee | | | 245,931 | |
Shareholder communications | | | 537,170 | |
Audit and tax fees | | | 78,250 | |
Legal fees | | | 51,783 | |
Miscellaneous | | | 467,796 | |
Total expenses | | | $36,529,942 | |
Fees paid indirectly | | | (12,434 | ) |
Reduction of expenses by investment adviser and distributor | | | (3,641,056 | ) |
Net expenses | | | $32,876,452 | |
Net investment income (loss) | | | $126,750,936 | |
| Realized and unrealized gain (loss) | | | | |
Realized gain (loss) (identified cost basis) | | | | |
Unaffiliated issuers | | | $956,960 | |
Affiliated issuers | | | (20,360 | ) |
Futures contracts | | | 9,105,153 | |
Net realized gain (loss) | | | $10,041,753 | |
Change in unrealized appreciation (depreciation) | | | | |
Unaffiliated issuers | | | $(145,823,985 | ) |
Affiliated issuers | | | (14,456 | ) |
Futures contracts | | | (2,652,372 | ) |
Net unrealized gain (loss) | | | $(148,490,813 | ) |
Net realized and unrealized gain (loss) | | | $(138,449,060 | ) |
Change in net assets from operations | | | $(11,698,124 | ) |
See Notes to Financial Statements
31
Financial Statements
STATEMENTS OF CHANGES IN NET ASSETS
These statements describe the increases and/or decreases in net assets resulting from operations, any distributions, and any shareholder transactions.
| | | | | | | | |
| | | Year ended | |
| | | 4/30/18 | | | 4/30/17 | |
| Change in net assets | | | | | | |
| From operations | | | | | | | | |
Net investment income (loss) | | | $126,750,936 | | | | $120,695,266 | |
Net realized gain (loss) | | | 10,041,753 | | | | (369,855 | ) |
Net unrealized gain (loss) | | | (148,490,813 | ) | | | (40,658,882 | ) |
Change in net assets from operations | | | $(11,698,124 | ) | | | $79,666,529 | |
| Distributions declared to shareholders | | | | | | | | |
From net investment income | | | $(131,036,423 | ) | | | $(132,051,214 | ) |
Change in net assets from fund share transactions | | | $710,732,013 | | | | $254,861,942 | |
Total change in net assets | | | $567,997,466 | | | | $202,477,257 | |
| Net assets | | | | | | | | |
At beginning of period | | | 4,817,168,889 | | | | 4,614,691,632 | |
At end of period (including undistributed net investment income of $4,139,158 and $2,448,679, respectively) | | | $5,385,166,355 | | | | $4,817,168,889 | |
See Notes to Financial Statements
32
Financial Statements
FINANCIAL HIGHLIGHTS
The financial highlights table is intended to help you understand the fund’s financial performance for the past 5 years. Certain information reflects financial results for a single fund share. The total returns in the table represent the rate that an investor would have earned (or lost) on an investment in the fund share class (assuming reinvestment of all distributions) held for the entire period.
| | | | | | | | | | | | | | | | | | | | |
| Class A | | Year ended | |
| | | 4/30/18 | | | 4/30/17 | | | 4/30/16 | | | 4/30/15 | | | 4/30/14 | |
Net asset value, beginning of period | | | $10.67 | | | | $10.79 | | | | $10.96 | | | | $10.89 | | | | $11.13 | |
| Income (loss) from investment operations | | | | | | | | | |
Net investment income (loss) (d) | | | $0.25 | | | | $0.27 | | | | $0.28 | | | | $0.27 | | | | $0.30 | |
Net realized and unrealized gain (loss) | | | (0.27 | ) | | | (0.10 | ) | | | (0.10 | ) | | | 0.15 | | | | (0.21 | ) |
Total from investment operations | | | $(0.02 | ) | | | $0.17 | | | | $0.18 | | | | $0.42 | | | | $0.09 | |
| Less distributions declared to shareholders | | | | | | | | | |
From net investment income | | | $(0.26 | ) | | | $(0.29 | ) | | | $(0.31 | ) | | | $(0.31 | ) | | | $(0.33 | ) |
From net realized gain | | | — | | | | — | | | | (0.04 | ) | | | (0.04 | ) | | | (0.00 | )(w) |
Total distributions declared to shareholders | | | $(0.26 | ) | | | $(0.29 | ) | | | $(0.35 | ) | | | $(0.35 | ) | | | $(0.33 | ) |
Net asset value, end of period (x) | | | $10.39 | | | | $10.67 | | | | $10.79 | | | | $10.96 | | | | $10.89 | |
Total return (%) (r)(s)(t)(x) | | | (0.22 | ) | | | 1.63 | | | | 1.76 | | | | 3.89 | | | | 0.92 | |
Ratios (%) (to average net assets)
and Supplemental data: | | | | | | | | | | | | | |
Expenses before expense reductions (f) | | | 0.88 | | | | 0.90 | | | | 0.89 | | | | 0.89 | | | | 0.90 | |
Expenses after expense reductions (f) | | | 0.74 | | | | 0.74 | | | | 0.74 | | | | 0.77 | | | | 0.79 | |
Net investment income (loss) | | | 2.36 | | | | 2.49 | | | | 2.63 | | | | 2.46 | | | | 2.74 | |
Portfolio turnover | | | 27 | | | | 40 | | | | 53 | | | | 72 | | | | 52 | |
Net assets at end of period (000 omitted) | | | $1,761,171 | | | | $1,706,798 | | | | $1,829,002 | | | | $1,495,612 | | | | $1,153,059 | |
See Notes to Financial Statements
33
Financial Highlights – continued
| | | | | | | | | | | | | | | | | | | | |
| Class B | | Year ended | |
| | | 4/30/18 | | | 4/30/17 | | | 4/30/16 | | | 4/30/15 | | | 4/30/14 | |
Net asset value, beginning of period | | | $10.68 | | | | $10.80 | | | | $10.97 | | | | $10.90 | | | | $11.15 | |
| Income (loss) from investment operations | | | | | | | | | |
Net investment income (loss) (d) | | | $0.17 | | | | $0.19 | | | | $0.20 | | | | $0.19 | | | | $0.22 | |
Net realized and unrealized gain (loss) | | | (0.26 | ) | | | (0.10 | ) | | | (0.10 | ) | | | 0.14 | | | | (0.22 | ) |
Total from investment operations | | | $(0.09 | ) | | | $0.09 | | | | $0.10 | | | | $0.33 | | | | $— | |
| Less distributions declared to shareholders | | | | | | | | | |
From net investment income | | | $(0.18 | ) | | | $(0.21 | ) | | | $(0.23 | ) | | | $(0.22 | ) | | | $(0.25 | ) |
From net realized gain | | | — | | | | — | | | | (0.04 | ) | | | (0.04 | ) | | | (0.00 | )(w) |
Total distributions declared to shareholders | | | $(0.18 | ) | | | $(0.21 | ) | | | $(0.27 | ) | | | $(0.26 | ) | | | $(0.25 | ) |
Net asset value, end of period (x) | | | $10.41 | | | | $10.68 | | | | $10.80 | | | | $10.97 | | | | $10.90 | |
Total return (%) (r)(s)(t)(x) | | | (0.87 | ) | | | 0.87 | | | | 1.01 | | | | 3.12 | | | | 0.08 | |
Ratios (%) (to average net assets)
and Supplemental data: | | | | | | | | | | | | | |
Expenses before expense reductions (f) | | | 1.63 | | | | 1.64 | | | | 1.65 | | | | 1.64 | | | | 1.65 | |
Expenses after expense reductions (f) | | | 1.49 | | | | 1.49 | | | | 1.49 | | | | 1.52 | | | | 1.54 | |
Net investment income (loss) | | | 1.61 | | | | 1.75 | | | | 1.89 | | | | 1.72 | | | | 2.00 | |
Portfolio turnover | | | 27 | | | | 40 | | | | 53 | | | | 72 | | | | 52 | |
Net assets at end of period (000 omitted) | | | $18,207 | | | | $24,514 | | | | $29,351 | | | | $30,730 | | | | $33,000 | |
| |
| Class C | | Year ended | |
| | | 4/30/18 | | | 4/30/17 | | | 4/30/16 | | | 4/30/15 | | | 4/30/14 | |
Net asset value, beginning of period | | | $10.68 | | | | $10.80 | | | | $10.97 | | | | $10.90 | | | | $11.15 | |
| Income (loss) from investment operations | | | | | | | | | |
Net investment income (loss) (d) | | | $0.16 | | | | $0.18 | | | | $0.19 | | | | $0.18 | | | | $0.20 | |
Net realized and unrealized gain (loss) | | | (0.26 | ) | | | (0.10 | ) | | | (0.10 | ) | | | 0.14 | | | | (0.21 | ) |
Total from investment operations | | | $(0.10 | ) | | | $0.08 | | | | $0.09 | | | | $0.32 | | | | $(0.01 | ) |
| Less distributions declared to shareholders | | | | | | | | | |
From net investment income | | | $(0.17 | ) | | | $(0.20 | ) | | | $(0.22 | ) | | | $(0.21 | ) | | | $(0.24 | ) |
From net realized gain | | | — | | | | — | | | | (0.04 | ) | | | (0.04 | ) | | | (0.00 | )(w) |
Total distributions declared to shareholders | | | $(0.17 | ) | | | $(0.20 | ) | | | $(0.26 | ) | | | $(0.25 | ) | | | $(0.24 | ) |
Net asset value, end of period (x) | | | $10.41 | | | | $10.68 | | | | $10.80 | | | | $10.97 | | | | $10.90 | |
Total return (%) (r)(s)(t)(x) | | | (0.97 | ) | | | 0.77 | | | | 0.91 | | | | 3.02 | | | | (0.03 | ) |
Ratios (%) (to average net assets)
and Supplemental data: | | | | | | | | | | | | | |
Expenses before expense reductions (f) | | | 1.63 | | | | 1.64 | | | | 1.64 | | | | 1.64 | | | | 1.65 | |
Expenses after expense reductions (f) | | | 1.59 | | | | 1.59 | | | | 1.59 | | | | 1.62 | | | | 1.65 | |
Net investment income (loss) | | | 1.51 | | | | 1.65 | | | | 1.78 | | | | 1.61 | | | | 1.90 | |
Portfolio turnover | | | 27 | | | | 40 | | | | 53 | | | | 72 | | | | 52 | |
Net assets at end of period (000 omitted) | | | $100,768 | | | | $134,650 | | | | $150,596 | | | | $135,948 | | | | $115,495 | |
See Notes to Financial Statements
34
Financial Highlights – continued
| | | | | | | | | | | | | | | | | | | | |
| Class I | | Year ended | |
| | | 4/30/18 | | | 4/30/17 | | | 4/30/16 | | | 4/30/15 | | | 4/30/14 | |
Net asset value, beginning of period | | | $10.67 | | | | $10.79 | | | | $10.96 | | | | $10.89 | | | | $11.14 | |
| Income (loss) from investment operations | | | | | | | | | |
Net investment income (loss) (d) | | | $0.27 | | | | $0.28 | | | | $0.30 | | | | $0.29 | | | | $0.31 | |
Net realized and unrealized gain (loss) | | | (0.26 | ) | | | (0.09 | ) | | | (0.10 | ) | | | 0.14 | | | | (0.21 | ) |
Total from investment operations | | | $0.01 | | | | $0.19 | | | | $0.20 | | | | $0.43 | | | | $0.10 | |
| Less distributions declared to shareholders | | | | | | | | | |
From net investment income | | | $(0.28 | ) | | | $(0.31 | ) | | | $(0.33 | ) | | | $(0.32 | ) | | | $(0.35 | ) |
From net realized gain | | | — | | | | — | | | | (0.04 | ) | | | (0.04 | ) | | | (0.00 | )(w) |
Total distributions declared to shareholders | | | $(0.28 | ) | | | $(0.31 | ) | | | $(0.37 | ) | | | $(0.36 | ) | | | $(0.35 | ) |
Net asset value, end of period (x) | | | $10.40 | | | | $10.67 | | | | $10.79 | | | | $10.96 | | | | $10.89 | |
Total return (%) (r)(s)(t)(x) | | | 0.03 | | | | 1.78 | | | | 1.92 | | | | 4.05 | | | | 0.98 | |
Ratios (%) (to average net assets)
and Supplemental data: | | | | | | | | | | | | | |
Expenses before expense reductions (f) | | | 0.63 | | | | 0.65 | | | | 0.64 | | | | 0.64 | | | | 0.65 | |
Expenses after expense reductions (f) | | | 0.59 | | | | 0.59 | | | | 0.59 | | | | 0.62 | | | | 0.64 | |
Net investment income (loss) | | | 2.51 | | | | 2.62 | | | | 2.78 | | | | 2.60 | | | | 2.89 | |
Portfolio turnover | | | 27 | | | | 40 | | | | 53 | | | | 72 | | | | 52 | |
Net assets at end of period (000 omitted) | | | $1,180,741 | | | | $1,256,542 | | | | $914,984 | | | | $1,274,021 | | | | $976,838 | |
| |
| Class R1 | | Year ended | |
| | | 4/30/18 | | | 4/30/17 | | | 4/30/16 | | | 4/30/15 | | | 4/30/14 | |
Net asset value, beginning of period | | | $10.68 | | | | $10.81 | | | | $10.97 | | | | $10.90 | | | | $11.15 | |
| Income (loss) from investment operations | | | | | | | | | |
Net investment income (loss) (d) | | | $0.16 | | | | $0.18 | | | | $0.19 | | | | $0.18 | | | | $0.20 | |
Net realized and unrealized gain (loss) | | | (0.26 | ) | | | (0.11 | ) | | | (0.09 | ) | | | 0.14 | | | | (0.21 | ) |
Total from investment operations | | | $(0.10 | ) | | | $0.07 | | | | $0.10 | | | | $0.32 | | | | $(0.01 | ) |
| Less distributions declared to shareholders | | | | | | | | | |
From net investment income | | | $(0.17 | ) | | | $(0.20 | ) | | | $(0.22 | ) | | | $(0.21 | ) | | | $(0.24 | ) |
From net realized gain | | | — | | | | — | | | | (0.04 | ) | | | (0.04 | ) | | | (0.00 | )(w) |
Total distributions declared to shareholders | | | $(0.17 | ) | | | $(0.20 | ) | | | $(0.26 | ) | | | $(0.25 | ) | | | $(0.24 | ) |
Net asset value, end of period (x) | | | $10.41 | | | | $10.68 | | | | $10.81 | | | | $10.97 | | | | $10.90 | |
Total return (%) (r)(s)(t)(x) | | | (0.97 | ) | | | 0.67 | | | | 1.00 | | | | 3.02 | | | | (0.03 | ) |
Ratios (%) (to average net assets)
and Supplemental data: | | | | | | | | | | | | | |
Expenses before expense reductions (f) | | | 1.63 | | | | 1.64 | | | | 1.64 | | | | 1.64 | | | | 1.65 | |
Expenses after expense reductions (f) | | | 1.59 | | | | 1.59 | | | | 1.59 | | | | 1.62 | | | | 1.64 | |
Net investment income (loss) | | | 1.50 | | | | 1.66 | | | | 1.78 | | | | 1.60 | | | | 1.89 | |
Portfolio turnover | | | 27 | | | | 40 | | | | 53 | | | | 72 | | | | 52 | |
Net assets at end of period (000 omitted) | | | $1,293 | | | | $2,466 | | | | $3,584 | | | | $4,153 | | | | $3,093 | |
See Notes to Financial Statements
35
Financial Highlights – continued
| | | | | | | | | | | | | | | | | | | | |
| Class R2 | | Year ended | |
| | | 4/30/18 | | | 4/30/17 | | | 4/30/16 | | | 4/30/15 | | | 4/30/14 | |
Net asset value, beginning of period | | | $10.66 | | | | $10.78 | | | | $10.95 | | | | $10.88 | | | | $11.13 | |
| Income (loss) from investment operations | | | | | | | | | |
Net investment income (loss) (d) | | | $0.21 | | | | $0.23 | | | | $0.24 | | | | $0.23 | | | | $0.26 | |
Net realized and unrealized gain (loss) | | | (0.26 | ) | | | (0.09 | ) | | | (0.09 | ) | | | 0.15 | | | | (0.22 | ) |
Total from investment operations | | | $(0.05 | ) | | | $0.14 | | | | $0.15 | | | | $0.38 | | | | $0.04 | |
| Less distributions declared to shareholders | | | | | | | | | |
From net investment income | | | $(0.22 | ) | | | $(0.26 | ) | | | $(0.28 | ) | | | $(0.27 | ) | | | $(0.29 | ) |
From net realized gain | | | — | | | | — | | | | (0.04 | ) | | | (0.04 | ) | | | (0.00 | )(w) |
Total distributions declared to shareholders | | | $(0.22 | ) | | | $(0.26 | ) | | | $(0.32 | ) | | | $(0.31 | ) | | | $(0.29 | ) |
Net asset value, end of period (x) | | | $10.39 | | | | $10.66 | | | | $10.78 | | | | $10.95 | | | | $10.88 | |
Total return (%) (r)(s)(t)(x) | | | (0.48 | ) | | | 1.27 | | | | 1.41 | | | | 3.53 | | | | 0.47 | |
Ratios (%) (to average net assets)
and Supplemental data: | | | | | | | | | | | | | |
Expenses before expense reductions (f) | | | 1.13 | | | | 1.15 | | | | 1.14 | | | | 1.14 | | | | 1.15 | |
Expenses after expense reductions (f) | | | 1.09 | | | | 1.09 | | | | 1.09 | | | | 1.12 | | | | 1.15 | |
Net investment income (loss) | | | 2.01 | | | | 2.15 | | | | 2.29 | | | | 2.12 | | | | 2.40 | |
Portfolio turnover | | | 27 | | | | 40 | | | | 53 | | | | 72 | | | | 52 | |
Net assets at end of period (000 omitted) | | | $44,339 | | | | $48,893 | | | | $49,042 | | | | $49,623 | | | | $42,233 | |
| |
| Class R3 | | Year ended | |
| | | 4/30/18 | | | 4/30/17 | | | 4/30/16 | | | 4/30/15 | | | 4/30/14 | |
Net asset value, beginning of period | | | $10.67 | | | | $10.79 | | | | $10.95 | | | | $10.88 | | | | $11.13 | |
| Income (loss) from investment operations | | | | | | | | | |
Net investment income (loss) (d) | | | $0.24 | | | | $0.26 | | | | $0.27 | | | | $0.26 | | | | $0.29 | |
Net realized and unrealized gain (loss) | | | (0.27 | ) | | | (0.10 | ) | | | (0.09 | ) | | | 0.15 | | | | (0.22 | ) |
Total from investment operations | | | $(0.03 | ) | | | $0.16 | | | | $0.18 | | | | $0.41 | | | | $0.07 | |
| Less distributions declared to shareholders | | | | | | | | | |
From net investment income | | | $(0.25 | ) | | | $(0.28 | ) | | | $(0.30 | ) | | | $(0.30 | ) | | | $(0.32 | ) |
From net realized gain | | | — | | | | — | | | | (0.04 | ) | | | (0.04 | ) | | | (0.00 | )(w) |
Total distributions declared to shareholders | | | $(0.25 | ) | | | $(0.28 | ) | | | $(0.34 | ) | | | $(0.34 | ) | | | $(0.32 | ) |
Net asset value, end of period (x) | | | $10.39 | | | | $10.67 | | | | $10.79 | | | | $10.95 | | | | $10.88 | |
Total return (%) (r)(s)(t)(x) | | | (0.32 | ) | | | 1.52 | | | | 1.76 | | | | 3.79 | | | | 0.72 | |
Ratios (%) (to average net assets)
and Supplemental data: | | | | | | | | | | | | | |
Expenses before expense reductions (f) | | | 0.88 | | | | 0.90 | | | | 0.89 | | | | 0.89 | | | | 0.90 | |
Expenses after expense reductions (f) | | | 0.84 | | | | 0.84 | | | | 0.84 | | | | 0.87 | | | | 0.89 | |
Net investment income (loss) | | | 2.25 | | | | 2.40 | | | | 2.53 | | | | 2.36 | | | | 2.65 | |
Portfolio turnover | | | 27 | | | | 40 | | | | 53 | | | | 72 | | | | 52 | |
Net assets at end of period (000 omitted) | | | $75,764 | | | | $90,449 | | | | $88,496 | | | | $71,742 | | | | $48,842 | |
See Notes to Financial Statements
36
Financial Highlights – continued
| | | | | | | | | | | | | | | | | | | | |
| Class R4 | | Year ended | |
| | | 4/30/18 | | | 4/30/17 | | | 4/30/16 | | | 4/30/15 | | | 4/30/14 | |
Net asset value, beginning of period | | | $10.67 | | | | $10.79 | | | | $10.96 | �� | | | $10.88 | | | | $11.13 | |
| Income (loss) from investment operations | | | | | | | | | |
Net investment income (loss) (d) | | | $0.27 | | | | $0.28 | | | | $0.30 | | | | $0.28 | | | | $0.31 | |
Net realized and unrealized gain (loss) | | | (0.26 | ) | | | (0.09 | ) | | | (0.10 | ) | | | 0.16 | | | | (0.22 | ) |
Total from investment operations | | | $0.01 | | | | $0.19 | | | | $0.20 | | | | $0.44 | | | | $0.09 | |
| Less distributions declared to shareholders | | | | | | | | | |
From net investment income | | | $(0.28 | ) | | | $(0.31 | ) | | | $(0.33 | ) | | | $(0.32 | ) | | | $(0.34 | ) |
From net realized gain | | | — | | | | — | | | | (0.04 | ) | | | (0.04 | ) | | | (0.00 | )(w) |
Total distributions declared to shareholders | | | $(0.28 | ) | | | $(0.31 | ) | | | $(0.37 | ) | | | $(0.36 | ) | | | $(0.34 | ) |
Net asset value, end of period (x) | | | $10.40 | | | | $10.67 | | | | $10.79 | | | | $10.96 | | | | $10.88 | |
Total return (%) (r)(s)(t)(x) | | | 0.03 | | | | 1.78 | | | | 1.92 | | | | 4.15 | | | | 0.97 | |
Ratios (%) (to average net assets)
and Supplemental data: | | | | | | | | | | | | | |
Expenses before expense reductions (f) | | | 0.63 | | | | 0.65 | | | | 0.64 | | | | 0.64 | | | | 0.65 | |
Expenses after expense reductions (f) | | | 0.59 | | | | 0.59 | | | | 0.59 | | | | 0.61 | | | | 0.65 | |
Net investment income (loss) | | | 2.50 | | | | 2.64 | | | | 2.79 | | | | 2.59 | | | | 2.90 | |
Portfolio turnover | | | 27 | | | | 40 | | | | 53 | | | | 72 | | | | 52 | |
Net assets at end of period (000 omitted) | | | $103,144 | | | | $118,494 | | | | $116,248 | | | | $150,418 | | | | $68,289 | |
| |
Class R6 | | Year ended | |
| | | 4/30/18 | | | 4/30/17 | | | 4/30/16 | | | 4/30/15 | | | 4/30/14 | |
Net asset value, beginning of period | | | $10.67 | | | | $10.79 | | | | $10.96 | | | | $10.89 | | | | $11.14 | |
| Income (loss) from investment operations | | | | | | | | | |
Net investment income (loss) (d) | | | $0.28 | | | | $0.30 | | | | $0.31 | | | | $0.30 | | | | $0.32 | |
Net realized and unrealized gain (loss) | | | (0.27 | ) | | | (0.10 | ) | | | (0.10 | ) | | | 0.14 | | | | (0.22 | ) |
Total from investment operations | | | $0.01 | | | | $0.20 | | | | $0.21 | | | | $0.44 | | | | $0.10 | |
| Less distributions declared to shareholders | | | | | | | | | |
From net investment income | | | $(0.29 | ) | | | $(0.32 | ) | | | $(0.34 | ) | | | $(0.33 | ) | | | $(0.35 | ) |
From net realized gain | | | — | | | | — | | | | (0.04 | ) | | | (0.04 | ) | | | (0.00 | )(w) |
Total distributions declared to shareholders | | | $(0.29 | ) | | | $(0.32 | ) | | | $(0.38 | ) | | | $(0.37 | ) | | | $(0.35 | ) |
Net asset value, end of period (x) | | | $10.39 | | | | $10.67 | | | | $10.79 | | | | $10.96 | | | | $10.89 | |
Total return (%) (r)(s)(t)(x) | | | 0.04 | | | | 1.89 | | | | 2.03 | | | | 4.15 | | | | 1.07 | |
Ratios (%) (to average net assets)
and Supplemental data: | | | | | | | | | | | | | |
Expenses before expense reductions (f) | | | 0.52 | | | | 0.53 | | | | 0.53 | | | | 0.54 | | | | 0.55 | |
Expenses after expense reductions (f) | | | 0.48 | | | | 0.48 | | | | 0.48 | | | | 0.53 | | | | 0.55 | |
Net investment income (loss) | | | 2.61 | | | | 2.76 | | | | 2.90 | | | | 2.72 | | | | 2.99 | |
Portfolio turnover | | | 27 | | | | 40 | | | | 53 | | | | 72 | | | | 52 | |
Net assets at end of period (000 omitted) | | | $2,087,409 | | | | $1,422,342 | | | | $1,423,635 | | | | $1,371,926 | | | | $1,542,574 | |
See Notes to Financial Statements
37
Financial Highlights – continued
| | | | | | | | | | | | | | | | | | | | |
| Class 529A | | Year ended | |
| | | 4/30/18 | | | 4/30/17 | | | 4/30/16 | | | 4/30/15 | | | 4/30/14 | |
Net asset value, beginning of period | | | $10.65 | | | | $10.77 | | | | $10.94 | | | | $10.87 | | | | $11.11 | |
| Income (loss) from investment operations | | | | | | | | | |
Net investment income (loss) (d) | | | $0.25 | | | | $0.27 | | | | $0.28 | | | | $0.27 | | | | $0.29 | |
Net realized and unrealized gain (loss) | | | (0.26 | ) | | | (0.10 | ) | | | (0.10 | ) | | | 0.14 | | | | (0.21 | ) |
Total from investment operations | | | $(0.01 | ) | | | $0.17 | | | | $0.18 | | | | $0.41 | | | | $0.08 | |
| Less distributions declared to shareholders | | | | | | | | | |
From net investment income | | | $(0.26 | ) | | | $(0.29 | ) | | | $(0.31 | ) | | | $(0.30 | ) | | | $(0.32 | ) |
From net realized gain | | | — | | | | — | | | | (0.04 | ) | | | (0.04 | ) | | | (0.00 | )(w) |
Total distributions declared to shareholders | | | $(0.26 | ) | | | $(0.29 | ) | | | $(0.35 | ) | | | $(0.34 | ) | | | $(0.32 | ) |
Net asset value, end of period (x) | | | $10.38 | | | | $10.65 | | | | $10.77 | | | | $10.94 | | | | $10.87 | |
Total return (%) (r)(s)(t)(x) | | | (0.15 | ) | | | 1.60 | | | | 1.72 | | | | 3.84 | | | | 0.86 | |
Ratios (%) (to average net assets)
and Supplemental data: | | | | | | | | | | | | | |
Expenses before expense reductions (f) | | | 0.96 | | | | 1.00 | | | | 0.99 | | | | 0.99 | | | | 1.00 | |
Expenses after expense reductions (f) | | | 0.76 | | | | 0.76 | | | | 0.78 | | | | 0.81 | | | | 0.84 | |
Net investment income (loss) | | | 2.34 | | | | 2.47 | | | | 2.60 | | | | 2.43 | | | | 2.72 | |
Portfolio turnover | | | 27 | | | | 40 | | | | 53 | | | | 72 | | | | 52 | |
Net assets at end of period (000 omitted) | | | $8,816 | | | | $7,879 | | | | $6,132 | | | | $4,713 | | | | $4,032 | |
| |
| Class 529B | | Year ended | |
| | | 4/30/18 | | | 4/30/17 | | | 4/30/16 | | | 4/30/15 | | | 4/30/14 | |
Net asset value, beginning of period | | | $10.68 | | | | $10.81 | | | | $10.97 | | | | $10.90 | | | | $11.15 | |
| Income (loss) from investment operations | | | | | | | | | |
Net investment income (loss) (d) | | | $0.15 | | | | $0.17 | | | | $0.19 | | | | $0.17 | | | | $0.20 | |
Net realized and unrealized gain (loss) | | | (0.26 | ) | | | (0.10 | ) | | | (0.09 | ) | | | 0.15 | | | | (0.22 | ) |
Total from investment operations | | | $(0.11 | ) | | | $0.07 | | | | $0.10 | | | | $0.32 | | | | $(0.02 | ) |
| Less distributions declared to shareholders | | | | | | | | | |
From net investment income | | | $(0.16 | ) | | | $(0.20 | ) | | | $(0.22 | ) | | | $(0.21 | ) | | | $(0.23 | ) |
From net realized gain | | | — | | | | — | | | | (0.04 | ) | | | (0.04 | ) | | | (0.00 | )(w) |
Total distributions declared to shareholders | | | $(0.16 | ) | | | $(0.20 | ) | | | $(0.26 | ) | | | $(0.25 | ) | | | $(0.23 | ) |
Net asset value, end of period (x) | | | $10.41 | | | | $10.68 | | | | $10.81 | | | | $10.97 | | | | $10.90 | |
Total return (%) (r)(s)(t)(x) | | | (1.02 | ) | | | 0.62 | | | | 0.95 | | | | 2.96 | | | | (0.08 | ) |
Ratios (%) (to average net assets)
and Supplemental data: | | | | | | | | | | | | | |
Expenses before expense reductions (f) | | | 1.71 | | | | 1.74 | | | | 1.74 | | | | 1.74 | | | | 1.75 | |
Expenses after expense reductions (f) | | | 1.64 | | | | 1.64 | | | | 1.64 | | | | 1.67 | | | | 1.69 | |
Net investment income (loss) | | | 1.45 | | | | 1.60 | | | | 1.74 | | | | 1.56 | | | | 1.84 | |
Portfolio turnover | | | 27 | | | | 40 | | | | 53 | | | | 72 | | | | 52 | |
Net assets at end of period (000 omitted) | | | $304 | | | | $297 | | | | $339 | | | | $396 | | | | $395 | |
See Notes to Financial Statements
38
Financial Highlights – continued
| | | | | | | | | | | | | | | | | | | | |
| Class 529C | | Year ended | |
| | | 4/30/18 | | | 4/30/17 | | | 4/30/16 | | | 4/30/15 | | | 4/30/14 | |
Net asset value, beginning of period | | | $10.68 | | | | $10.80 | | | | $10.97 | | | | $10.90 | | | | $11.15 | |
| Income (loss) from investment operations | | | | | | | | | |
Net investment income (loss) (d) | | | $0.16 | | | | $0.17 | | | | $0.19 | | | | $0.17 | | | | $0.20 | |
Net realized and unrealized gain (loss) | | | (0.27 | ) | | | (0.09 | ) | | | (0.10 | ) | | | 0.15 | | | | (0.22 | ) |
Total from investment operations | | | $(0.11 | ) | | | $0.08 | | | | $0.09 | | | | $0.32 | | | | $(0.02 | ) |
| Less distributions declared to shareholders | | | | | | | | | |
From net investment income | | | $(0.16 | ) | | | $(0.20 | ) | | | $(0.22 | ) | | | $(0.21 | ) | | | $(0.23 | ) |
From net realized gain | | | — | | | | — | | | | (0.04 | ) | | | (0.04 | ) | | | (0.00 | )(w) |
Total distributions declared to shareholders | | | $(0.16 | ) | | | $(0.20 | ) | | | $(0.26 | ) | | | $(0.25 | ) | | | $(0.23 | ) |
Net asset value, end of period (x) | | | $10.41 | | | | $10.68 | | | | $10.80 | | | | $10.97 | | | | $10.90 | |
Total return (%) (r)(s)(t)(x) | | | (1.02 | ) | | | 0.72 | | | | 0.86 | | | | 2.97 | | | | (0.08 | ) |
Ratios (%) (to average net assets)
and Supplemental data: | | | | | | | | | | | | | |
Expenses before expense reductions (f) | | | 1.71 | | | | 1.75 | | | | 1.74 | | | | 1.74 | | | | 1.75 | |
Expenses after expense reductions (f) | | | 1.64 | | | | 1.64 | | | | 1.64 | | | | 1.67 | | | | 1.70 | |
Net investment income (loss) | | | 1.45 | | | | 1.59 | | | | 1.73 | | | | 1.56 | | | | 1.84 | |
Portfolio turnover | | | 27 | | | | 40 | | | | 53 | | | | 72 | | | | 52 | |
Net assets at end of period (000 omitted) | | | $3,210 | | | | $3,843 | | | | $3,283 | | | | $2,933 | | | | $2,905 | |
| (d) | Per share data is based on average shares outstanding. |
| (f) | Ratios do not reflect reductions from fees paid indirectly, if applicable. |
| (r) | Certain expenses have been reduced without which performance would have been lower. |
| (s) | From time to time the fund may receive proceeds from litigation settlements, without which performance would be lower. |
| (t) | Total returns do not include any applicable sales charges. |
| (w) | Per share amount was less than $0.01. |
| (x) | The net asset values and total returns have been calculated on net assets which include adjustments made in accordance with U.S. generally accepted accounting principles required at period end for financial reporting purposes. |
See Notes to Financial Statements
39
NOTES TO FINANCIAL STATEMENTS
(1) Business and Organization
MFS Total Return Bond Fund (the fund) is a diversified series of MFS Series Trust IX (the trust). The trust is organized as a Massachusetts business trust and is registered under the Investment Company Act of 1940, as amended, as an open-end management investment company.
The fund is an investment company and accordingly follows the investment company accounting and reporting guidance of the Financial Accounting Standards Board (FASB) Accounting Standards Codification Topic 946 Financial Services – Investment Companies.
(2) Significant Accounting Policies
General – The preparation of financial statements in conformity with U.S. generally accepted accounting principles requires management to make estimates and assumptions that affect the reported amounts of assets and liabilities, and disclosure of contingent assets and liabilities at the date of the financial statements and the reported amounts of increases and decreases in net assets from operations during the reporting period. Actual results could differ from those estimates. In the preparation of these financial statements, management has evaluated subsequent events occurring after the date of the fund’s Statement of Assets and Liabilities through the date that the financial statements were issued.
In March 2017, the FASB issued Accounting Standards Update 2017-08, Receivables – Nonrefundable Fees and Other Costs (Subtopic 310-20) – Premium Amortization on Purchased Callable Debt Securities (“ASU 2017-08”). For entities that hold callable debt securities at a premium, ASU 2017-08 requires that the premium be amortized to the earliest call date. ASU 2017-08 will be effective for fiscal years beginning after December 15, 2018, and interim periods within those fiscal years. Management has evaluated the potential impacts of ASU 2017-08 and believes that adoption of ASU 2017-08 will not have a material effect on the fund’s overall financial position or its overall results of operations.
Balance Sheet Offsetting – The fund’s accounting policy with respect to balance sheet offsetting is that, absent an event of default by the counterparty or a termination of the agreement, the International Swaps and Derivatives Association (ISDA) Master Agreement, or similar agreement, does not result in an offset of reported amounts of financial assets and financial liabilities in the Statement of Assets and Liabilities across transactions between the fund and the applicable counterparty. The fund’s right to setoff may be restricted or prohibited by the bankruptcy or insolvency laws of the particular jurisdiction to which a specific master netting agreement counterparty is subject. Balance sheet offsetting disclosures, to the extent applicable to the fund, have been included in the fund’s Significant Accounting Policies note under the captions for each of the fund’s in-scope financial instruments and transactions.
Investment Valuations – Debt instruments and floating rate loans, including restricted debt instruments, are generally valued at an evaluated or composite bid as provided by a third-party pricing service. Short-term instruments with a maturity at issuance of 60 days or less may be valued at amortized cost, which approximates
40
Notes to Financial Statements – continued
market value. Futures contracts are generally valued at last posted settlement price on their primary exchange as provided by a third-party pricing service. Futures contracts for which there were no trades that day for a particular position are generally valued at the closing bid quotation on their primary exchange as provided by a third-party pricing service. Open-end investment companies are generally valued at net asset value per share. Securities and other assets generally valued on the basis of information from a third-party pricing service may also be valued at a broker/dealer bid quotation. Values obtained from third-party pricing services can utilize both transaction data and market information such as yield, quality, coupon rate, maturity, type of issue, trading characteristics, and other market data. The values of foreign securities and other assets and liabilities expressed in foreign currencies are converted to U.S. dollars using the mean of bid and asked prices for rates provided by a third-party pricing service.
The Board of Trustees has delegated primary responsibility for determining or causing to be determined the value of the fund’s investments (including any fair valuation) to the adviser pursuant to valuation policies and procedures approved by the Board. If the adviser determines that reliable market quotations are not readily available, investments are valued at fair value as determined in good faith by the adviser in accordance with such procedures under the oversight of the Board of Trustees. Under the fund’s valuation policies and procedures, market quotations are not considered to be readily available for most types of debt instruments and floating rate loans and many types of derivatives. These investments are generally valued at fair value based on information from third-party pricing services. In addition, investments may be valued at fair value if the adviser determines that an investment’s value has been materially affected by events occurring after the close of the exchange or market on which the investment is principally traded (such as foreign exchange or market) and prior to the determination of the fund’s net asset value, or after the halting of trading of a specific security where trading does not resume prior to the close of the exchange or market on which the security is principally traded. The adviser generally relies on third-party pricing services or other information (such as the correlation with price movements of similar securities in the same or other markets; the type, cost and investment characteristics of the security; the business and financial condition of the issuer; and trading and other market data) to assist in determining whether to fair value and at what value to fair value an investment. The value of an investment for purposes of calculating the fund’s net asset value can differ depending on the source and method used to determine value. When fair valuation is used, the value of an investment used to determine the fund’s net asset value may differ from quoted or published prices for the same investment. There can be no assurance that the fund could obtain the fair value assigned to an investment if it were to sell the investment at the same time at which the fund determines its net asset value per share.
Various inputs are used in determining the value of the fund’s assets or liabilities. These inputs are categorized into three broad levels. In certain cases, the inputs used to measure fair value may fall into different levels of the fair value hierarchy. In such cases, an investment’s level within the fair value hierarchy is based on the lowest level of input that is significant to the fair value measurement. The fund’s assessment of the significance of a particular input to the fair value measurement in its entirety requires judgment, and considers factors specific to the investment. Level 1 includes unadjusted
41
Notes to Financial Statements – continued
quoted prices in active markets for identical assets or liabilities. Level 2 includes other significant observable market-based inputs (including quoted prices for similar securities, interest rates, prepayment speed, and credit risk). Level 3 includes unobservable inputs, which may include the adviser’s own assumptions in determining the fair value of investments. Other financial instruments are derivative instruments, such as futures contracts. The following is a summary of the levels used as of April 30, 2018 in valuing the fund’s assets or liabilities:
| | | | | | | | | | | | | | | | |
| Financial Instruments | | Level 1 | | | Level 2 | | | Level 3 | | | Total | |
| U.S. Treasury Bonds & U.S. Government Agency & Equivalents | | | $— | | | | $1,397,466,804 | | | | $— | | | | $1,397,466,804 | |
| Non-U.S. Sovereign Debt | | | — | | | | 61,032,182 | | | | — | | | | 61,032,182 | |
| Municipal Bonds | | | — | | | | 65,160,656 | | | | — | | | | 65,160,656 | |
| U.S. Corporate Bonds | | | — | | | | 1,670,666,559 | | | | — | | | | 1,670,666,559 | |
| Residential Mortgage-Backed Securities | | | — | | | | 787,859,867 | | | | — | | | | 787,859,867 | |
| Commercial Mortgage-Backed Securities | | | — | | | | 477,144,483 | | | | — | | | | 477,144,483 | |
| Asset-Backed Securities (including CDOs) | | | — | | | | 458,317,175 | | | | — | | | | 458,317,175 | |
| Foreign Bonds | | | — | | | | 410,271,787 | | | | — | | | | 410,271,787 | |
| Mutual Funds | | | 49,542,800 | | | | — | | | | — | | | | 49,542,800 | |
| Total | | | $49,542,800 | | | | $5,327,919,513 | | | | $— | | | | $5,377,462,313 | |
| | | | |
| Other Financial Instruments | | | | | | | | | | | | |
| Futures Contracts – Assets | | | $829,585 | | | | $— | | | | $— | | | | $829,585 | |
| Futures Contracts – Liabilities | | | (1,609,446 | ) | | | — | | | | — | | | | (1,609,446 | ) |
For further information regarding security characteristics, see the Portfolio of Investments.
Foreign Currency Translation – Purchases and sales of foreign investments, income, and expenses are converted into U.S. dollars based upon currency exchange rates prevailing on the respective dates of such transactions or on the reporting date for foreign denominated receivables and payables. Gains and losses attributable to foreign currency exchange rates on sales of securities are recorded for financial statement purposes as net realized gains and losses on investments. Gains and losses attributable to foreign exchange rate movements on receivables, payables, income and expenses are recorded for financial statement purposes as foreign currency transaction gains and losses. That portion of both realized and unrealized gains and losses on investments that results from fluctuations in foreign currency exchange rates is not separately disclosed.
Derivatives – The fund uses derivatives for different purposes, primarily to increase or decrease exposure to a particular market or segment of the market, or security, to increase or decrease interest rate or currency exposure, or as alternatives to direct investments. Derivatives are used for hedging or non-hedging purposes. While hedging can reduce or eliminate losses, it can also reduce or eliminate gains. When the fund uses derivatives as an investment to increase market exposure, or for hedging purposes, gains and losses from derivative instruments may be substantially greater than the derivative’s original cost.
42
Notes to Financial Statements – continued
The derivative instruments used by the fund during the period were futures contracts. Depending on the type of derivative, the fund may exit a derivative position by entering into an offsetting transaction with a counterparty or exchange, negotiating an agreement with the derivative counterparty, or novating the position to a third party. The fund may be unable to promptly close out a futures position in instances where the daily fluctuation in the price for that type of future exceeds the daily limit set by the exchange. The fund’s period end derivatives, as presented in the Portfolio of Investments and the associated Derivative Contract tables, generally are indicative of the volume of its derivative activity during the period.
The following table presents, by major type of derivative contract, the fair value, on a gross basis, of the asset and liability components of derivatives held by the fund at April 30, 2018 as reported in the Statement of Assets and Liabilities:
| | | | | | | | | | |
| | | | | Fair Value (a) | |
| Risk | | Derivative Contracts | | Asset Derivatives | | | Liability Derivatives | |
| Interest Rate | | Interest Rate Futures | | | $829,585 | | | | $(1,609,446) | |
| (a) | Values presented in this table for futures contracts correspond to the values reported in the fund’s Portfolio of Investments. Only the current day net variation margin for futures contracts is separately reported within the fund’s Statement of Assets and Liabilities. |
The following table presents, by major type of derivative contract, the realized gain (loss) on derivatives held by the fund for the year ended April 30, 2018 as reported in the Statement of Operations:
| | | | |
| Risk | | Futures Contracts | |
| Interest Rate | | | $9,105,153 | |
The following table presents, by major type of derivative contract, the change in unrealized appreciation (depreciation) on derivatives held by the fund for the year ended April 30, 2018 as reported in the Statement of Operations:
| | | | |
| Risk | | Futures Contracts | |
| Interest Rate | | | $(2,652,372 | ) |
Derivative counterparty credit risk is managed through formal evaluation of the creditworthiness of all potential counterparties. On certain, but not all, uncleared derivatives, the fund attempts to reduce its exposure to counterparty credit risk whenever possible by entering into an ISDA Master Agreement on a bilateral basis. The ISDA Master Agreement gives each party to the agreement the right to terminate all transactions traded under such agreement if there is a specified deterioration in the credit quality of the other party. Upon an event of default or a termination of the ISDA Master Agreement, the non-defaulting party has the right to close out all transactions traded under such agreement and to net amounts owed under each agreement to one net amount payable by one party to the other. This right to close out and net payments across all transactions traded under the ISDA Master Agreement could result in a reduction of the fund’s credit risk to such counterparty equal to any amounts payable by the fund under the applicable transactions, if any.
Collateral and margin requirements differ by type of derivative. For cleared derivatives (e.g., futures contracts, cleared swaps, and exchange-traded options), margin
43
Notes to Financial Statements – continued
requirements are set by the clearing broker and the clearing house and collateral, in the form of cash or securities, is posted by the fund directly with the clearing broker. Collateral terms are counterparty agreement specific for uncleared derivatives (e.g., forward foreign currency exchange contracts, uncleared swap agreements, and uncleared options) and collateral, in the form of cash and securities, is held in segregated accounts with the fund’s custodian in connection with these agreements. For derivatives traded under an ISDA Master Agreement, which contains a collateral support annex, the collateral requirements are netted across all transactions traded under such counterparty-specific agreement and one amount is posted from one party to the other to collateralize such obligations. Cash that has been segregated or delivered to cover the fund’s collateral or margin obligations under derivative contracts, if any, will be reported separately in the Statement of Assets and Liabilities as restricted cash for uncleared derivatives and/or deposits with brokers for cleared derivatives. Securities pledged as collateral or margin for the same purpose, if any, are noted in the Portfolio of Investments. The fund may be required to make payments of interest on uncovered collateral or margin obligations with the broker. Any such payments are included in “Miscellaneous” expense in the Statement of Operations.
Futures Contracts – The fund entered into futures contracts which may be used to hedge against or obtain broad market exposure, interest rate exposure, currency exposure, or to manage duration. A futures contract represents a commitment for the future purchase or sale of an asset at a specified price on a specified date.
Upon entering into a futures contract, the fund is required to deposit with the broker, either in cash or securities, an initial margin in an amount equal to a certain percentage of the notional amount of the contract. Subsequent payments (variation margin) are made or received by the fund each day, depending on the daily fluctuations in the value of the contract, and are recorded for financial statement purposes as unrealized gain or loss by the fund until the contract is closed or expires at which point the gain or loss on futures contracts is realized.
The fund bears the risk of interest rates, exchange rates or securities prices moving unexpectedly, in which case, the fund may not achieve the anticipated benefits of the futures contracts and may realize a loss. While futures contracts may present less counterparty risk to the fund since the contracts are exchange traded and the exchange’s clearinghouse guarantees payments to the broker, there is still counterparty credit risk due to the insolvency of the broker. The fund’s maximum risk of loss due to counterparty credit risk is equal to the margin posted by the fund to the broker plus any gains or minus any losses on the outstanding futures contracts.
Dollar Roll Transactions – The fund enters into dollar roll transactions, with respect to mortgage-backed securities issued by Ginnie Mae, Fannie Mae, and Freddie Mac, in which the fund sells mortgage-backed securities to financial institutions and simultaneously agrees to purchase similar (same issuer, type and coupon) securities at a later date at an agreed-upon price. During the period between the sale and repurchase in a dollar roll transaction the fund will not be entitled to receive interest and principal payments on the securities sold but is compensated by interest earned on the proceeds of the initial sale and by a lower purchase price on the securities to be repurchased which enhances the fund’s total return. The fund accounts for dollar roll transactions as purchases and sales and realizes gains and losses on these transactions.
44
Notes to Financial Statements – continued
Indemnifications – Under the fund’s organizational documents, its officers and Trustees may be indemnified against certain liabilities and expenses arising out of the performance of their duties to the fund. Additionally, in the normal course of business, the fund enters into agreements with service providers that may contain indemnification clauses. The fund’s maximum exposure under these agreements is unknown as this would involve future claims that may be made against the fund that have not yet occurred.
Investment Transactions and Income – Investment transactions are recorded on the trade date. Interest income is recorded on the accrual basis. All premium and discount is amortized or accreted for financial statement purposes in accordance with U.S. generally accepted accounting principles. Interest payments received in additional securities are recorded on the ex-interest date in an amount equal to the value of the security on such date.
The fund may receive proceeds from litigation settlements. Any proceeds received from litigation involving portfolio holdings are reflected in the Statement of Operations in realized gain/loss if the security has been disposed of by the fund or in unrealized gain/loss if the security is still held by the fund. Any other proceeds from litigation not related to portfolio holdings are reflected as other income in the Statement of Operations.
The fund invests a significant portion of its assets in asset-backed and/or mortgage-backed securities. For these securities, the value of the debt instrument also depends on the credit quality and adequacy of the underlying assets or collateral as well as whether there is a security interest in the underlying assets or collateral. Enforcing rights, if any, against the underlying assets or collateral may be difficult. U.S. Government securities not supported as to the payment of principal or interest by the U.S. Treasury, such as those issued by Fannie Mae, Freddie Mac, and the Federal Home Loan Banks, are subject to greater credit risk than are U.S. Government securities supported by the U.S. Treasury, such as those issued by Ginnie Mae.
The fund purchased or sold debt securities on a when-issued or delayed delivery basis, or in a “To Be Announced” (TBA) or “forward commitment” transaction with delivery or payment to occur at a later date beyond the normal settlement period. At the time a fund enters into a commitment to purchase or sell a security, the transaction is recorded and the value of the security acquired is reflected in the fund’s net asset value. The price of such security and the date that the security will be delivered and paid for are fixed at the time the transaction is negotiated. The value of the security may vary with market fluctuations. No interest accrues to the fund until payment takes place. At the time that a fund enters into this type of transaction, the fund is required to have sufficient cash and/or liquid securities to cover its commitments. Losses may arise due to changes in the value of the underlying securities or if the counterparty does not perform under the contract’s terms, or if the issuer does not issue the securities due to political, economic or other factors. Additionally, losses may arise due to declines in the value of the securities prior to settlement date.
To mitigate this risk of loss on TBA securities and other types of forward settling mortgage-backed securities, the fund whenever possible enters into a Master Securities Forward Transaction Agreement (“MSFTA”) on a bilateral basis with each of the
45
Notes to Financial Statements – continued
counterparties with whom it undertakes a significant volume of transactions. The MSFTA gives each party to the agreement the right to terminate all transactions traded under such agreement if there is a certain deterioration in the credit quality of the
other party. Upon an event of default or a termination of the MSFTA, the non-defaulting party has the right to close out all transactions traded under such agreement and to net amounts owed under each transaction to one net amount payable by one party to the other. This right to close out and net payments across all transactions traded under the MSFTA could result in a reduction of the fund’s credit risk to such counterparty equal to any amounts payable by the fund under the applicable transactions, if any.
For mortgage-backed securities traded under a MSFTA, the collateral and margining requirements are contract specific. Collateral amounts across all transactions traded under such agreement are netted and one amount is posted from one party to the other to collateralize such obligations. Cash that has been pledged to cover the fund’s collateral or margin obligations under a MSFTA, if any, will be reported separately on the Statement of Assets and Liabilities as restricted cash. Securities pledged as collateral or margin for the same purpose, if any, are noted in the Portfolio of Investments.
Fees Paid Indirectly – The fund’s custody fee may be reduced by a credit earned under an arrangement that measures the value of U.S. dollars deposited with the custodian by the fund. The amount of the credit, for the year ended April 30, 2018, is shown as a reduction of total expenses in the Statement of Operations.
Tax Matters and Distributions – The fund intends to qualify as a regulated investment company, as defined under Subchapter M of the Internal Revenue Code, and to distribute all of its taxable income, including realized capital gains. As a result, no provision for federal income tax is required. The fund’s federal tax returns, when filed, will remain subject to examination by the Internal Revenue Service for a three year period. Management has analyzed the fund’s tax positions taken on federal and state tax returns for all open tax years and does not believe that there are any uncertain tax positions that require recognition of a tax liability. Foreign taxes, if any, have been accrued by the fund in the accompanying financial statements in accordance with the applicable foreign tax law. Foreign income taxes may be withheld by certain countries in which the fund invests. Additionally, capital gains realized by the fund on securities issued in or by certain foreign countries may be subject to capital gains tax imposed by those countries.
Distributions to shareholders are recorded on the ex-dividend date. Income and capital gain distributions are determined in accordance with income tax regulations, which may differ from U.S. generally accepted accounting principles. Certain capital accounts in the financial statements are periodically adjusted for permanent differences in order to reflect their tax character. These adjustments have no impact on net assets or net asset value per share. Temporary differences which arise from recognizing certain items of income, expense, gain or loss in different periods for financial statement and tax purposes will reverse at some time in the future. Distributions in excess of net investment income or net realized gains are temporary overdistributions for financial statement purposes resulting from differences in the recognition or classification of income or distributions for financial statement and tax purposes.
46
Notes to Financial Statements – continued
Book/tax differences primarily relate to amortization and accretion of debt securities.
The tax character of distributions declared to shareholders for the last two fiscal years is as follows:
| | | | | | | | |
| | | Year ended
4/30/18 | | | Year ended
4/30/17 | |
| Ordinary income (including any short-term capital gains) | | | $131,036,423 | | | | $132,051,214 | |
The federal tax cost and the tax basis components of distributable earnings were as follows:
| | | | |
| As of 4/30/18 | | | |
| Cost of investments | | | $5,503,314,626 | |
| Gross appreciation | | | 24,807,132 | |
| Gross depreciation | | | (151,439,306 | ) |
| Net unrealized appreciation (depreciation) | | | $(126,632,174 | ) |
| Undistributed ordinary income | | | 16,738,019 | |
| Capital loss carryforwards | | | (46,315,178 | ) |
| Other temporary differences | | | (12,348,647 | ) |
As of April 30, 2018, the fund had capital loss carryforwards available to offset future realized gains. These net capital losses may be carried forward indefinitely and their character is retained as short-term and/or long-term losses. Such losses are characterized as follows:
| | | | |
| Short-Term | | | $(21,723,934 | ) |
| Long-Term | | | (24,591,244 | ) |
| Total | | | $(46,315,178 | ) |
Multiple Classes of Shares of Beneficial Interest – The fund offers multiple classes of shares, which differ in their respective distribution, service, and program manager fees. The fund’s income and common expenses are allocated to shareholders based on the value of settled shares outstanding of each class. The fund’s realized and unrealized gain (loss) are allocated to shareholders based on the daily net assets of each class. Dividends are declared separately for each class. Differences in per share dividend rates are generally due to differences in separate class expenses. Class B and Class 529B shares will convert to Class A and Class 529A shares, respectively, approximately eight years after purchase. Effective April 23, 2018, Class C and Class 529C shares will
convert to Class A and Class 529A shares, respectively, approximately ten years after
47
Notes to Financial Statements – continued
purchase. The fund’s distributions declared to shareholders as reported in the Statements of Changes in Net Assets are presented by class as follows:
| | | | | | | | |
| | | From net investment
income | |
| | | Year
ended
4/30/18 | | | Year
ended
4/30/17 | |
| Class A | | | $42,118,451 | | | | $50,023,033 | |
| Class B | | | 365,907 | | | | 557,918 | |
| Class C | | | 1,935,562 | | | | 2,848,121 | |
| Class I | | | 28,762,383 | | | | 28,391,683 | |
| Class R1 | | | 28,504 | | | | 60,069 | |
| Class R2 | | | 986,547 | | | | 1,171,393 | |
| Class R3 | | | 1,989,720 | | | | 2,412,185 | |
| Class R4 | | | 2,930,459 | | | | 3,539,486 | |
| Class R6 | | | 51,653,877 | | | | 42,786,755 | |
| Class 529A | | | 203,927 | | | | 187,332 | |
| Class 529B | | | 5,113 | | | | 5,849 | |
| Class 529C | | | 55,973 | | | | 67,390 | |
| Total | | | $131,036,423 | | | | $132,051,214 | |
(3) Transactions with Affiliates
Investment Adviser – The fund has an investment advisory agreement with MFS to provide overall investment management and related administrative services and facilities to the fund. The management fee is computed daily and paid monthly at the following annual rates based on the fund’s average daily net assets:
| | | | |
| Up to $2.5 billion | | | 0.50 | % |
| In excess of $2.5 billion and up to $5 billion | | | 0.45 | % |
| In excess of $5 billion | | | 0.40 | % |
MFS has agreed in writing to reduce its management fee by a specified amount if certain MFS mutual fund assets exceed thresholds agreed to by MFS and the fund’s Board of Trustees. For the year ended April 30, 2018, this management fee reduction amounted to $437,295, which is included in the reduction of total expenses in the Statement of Operations. The management fee incurred for the year ended April 30, 2018 was equivalent to an annual effective rate of 0.46% of the fund’s average daily net assets.
The investment adviser has agreed in writing to pay a portion of the fund’s total annual operating expenses, excluding interest, taxes, extraordinary expenses, brokerage and transaction costs, and investment-related expenses, such that total fund operating expenses do not exceed the following rates annually of each class’s average daily net assets:
| | | | | | | | | | | | | | | | | | | | | | | | | | | | | | | | | | | | | | | | | | | | |
| Classes | |
| A | | B | | | C | | | I | | | R1 | | | R2 | | | R3 | | | R4 | | | R6 | | | 529A | | | 529B | | | 529C | |
| 0.74% | | | 1.49% | | | | 1.59% | | | | 0.59% | | | | 1.59% | | | | 1.09% | | | | 0.84% | | | | 0.59% | | | | 0.50% | | | | 0.79% | | | | 1.64% | | | | 1.64% | |
48
Notes to Financial Statements – continued
This written agreement will continue until modified by the fund’s Board of Trustees, but such agreement will continue at least until August 31, 2018. For the year ended April 30, 2018, this reduction amounted to $1,439,826, which is included in the reduction of total expenses in the Statement of Operations.
Distributor – MFS Fund Distributors, Inc. (MFD), a wholly-owned subsidiary of MFS, as distributor, received $174,222 and $1,265 for the year ended April 30, 2018, as its portion of the initial sales charge on sales of Class A and Class 529A shares of the fund, respectively.
The Board of Trustees has adopted a distribution plan for certain share classes pursuant to Rule 12b-1 of the Investment Company Act of 1940.
The fund’s distribution plan provides that the fund will pay MFD for services provided by MFD and financial intermediaries in connection with the distribution and servicing of certain share classes. One component of the plan is a distribution fee paid to MFD and another component of the plan is a service fee paid to MFD. MFD may subsequently pay all, or a portion, of the distribution and/or service fees to financial intermediaries.
Distribution Plan Fee Table:
| | | | | | | | | | | | | | | | | | | | |
| | | Distribution
Fee Rate (d) | | | Service Fee Rate (d) | | | Total
Distribution
Plan (d) | | | Annual
Effective
Rate (e) | | | Distribution
and Service
Fee | |
| Class A | | | — | | | | 0.25% | | | | 0.25% | | | | 0.15% | | | | $4,317,787 | |
| Class B | | | 0.75% | | | | 0.25% | | | | 1.00% | | | | 0.90% | | | | 217,076 | |
| Class C | | | 0.75% | | | | 0.25% | | | | 1.00% | | | | 1.00% | | | | 1,220,145 | |
| Class R1 | | | 0.75% | | | | 0.25% | | | | 1.00% | | | | 1.00% | | | | 18,034 | |
| Class R2 | | | 0.25% | | | | 0.25% | | | | 0.50% | | | | 0.50% | | | | 236,423 | |
| Class R3 | | | — | | | | 0.25% | | | | 0.25% | | | | 0.25% | | | | 212,978 | |
| Class 529A | | | — | | | | 0.25% | | | | 0.25% | | | | 0.12% | | | | 21,109 | |
| Class 529B | | | 0.75% | | | | 0.25% | | | | 1.00% | | | | 1.00% | | | | 3,333 | |
| Class 529C | | | 0.75% | | | | 0.25% | | | | 1.00% | | | | 1.00% | | | | 36,481 | |
| Total Distribution and Service Fees | | | | $6,283,366 | |
| (d) | In accordance with the distribution plan for certain classes, the fund pays distribution and/or service fees equal to these annual percentage rates of each class’s average daily net assets. The distribution and service fee rates disclosed by class represent the current rates in effect at the end of the reporting period. Any rate changes, if applicable, are detailed below. |
| (e) | The annual effective rates represent actual fees incurred under the distribution plan for the year ended April 30, 2018 based on each class’s average daily net assets. 0.10% of the Class A, Class B, and Class 529A service fee is currently being waived under a written waiver agreement. For the year ended April 30, 2018, this waiver amounted to $1,757,253 and is included in the reduction of total expenses in the Statement of Operations. 0.10% of the Class B service fee is currently being waived under a written waiver agreement. For the year ended April 30, 2018, this waiver amounted to $21,708 and is included in the reduction of total expenses in the Statement of Operations. These written waiver agreements will continue until modified by the fund’s Board of Trustees, but such agreements will continue at least until August 31, 2018. MFD has voluntarily agreed to rebate a portion of each class’s 0.25% service fee attributable to accounts for which MFD retains the 0.25% service fee except for accounts attributable to MFS or its affiliates’ seed money. For the year ended April 30, 2018, this rebate |
49
Notes to Financial Statements – continued
| | amounted to $79, $237, $1, $2,527, $3, and $26 for Class B, Class C, Class R3, Class 529A, Class 529B, and Class 529C, respectively, and is included in the reduction of total expenses in the Statement of Operations. |
Certain Class A shares are subject to a contingent deferred sales charge (CDSC) in the event of a shareholder redemption within 18 months of purchase. Class B and Class 529B shares are subject to a CDSC in the event of a shareholder redemption within six years of purchase. Class C and Class 529C shares are subject to a CDSC in the event of a shareholder redemption within 12 months of purchase. All contingent deferred sales charges are paid to MFD and during the year ended April 30, 2018, were as follows:
| | | | |
| | | Amount | |
| Class A | | | $93,246 | |
| Class B | | | 25,122 | |
| Class C | | | 20,830 | |
| Class 529B | | | 598 | |
| Class 529C | | | 299 | |
The fund has entered into and may from time to time enter into contracts with program managers and other parties which administer the tuition programs through which an investment in the fund’s 529 share classes is made. For the period from May 1, 2017 through December 10, 2017, the fund had entered into an agreement with MFD pursuant to which MFD received an annual fee of up to 0.10% of the average daily net assets attributable to each 529 share class. MFD had agreed to waive a portion of this fee in an amount equal to 0.05% of the average daily net assets for each 529 share class. This waiver agreement terminated on December 10, 2017. For the period from May 1, 2017 through December 10, 2017, this waiver amounted to $3,809 and is included in the reduction of total expenses in the Statement of Operations. Effective December 11, 2017, the fund has entered into an agreement with MFD pursuant to which MFD receives an annual fee of up to 0.05% of the average daily net assets attributable to each 529 share class. The program manager fee incurred for the year ended April 30, 2018 was equivalent to an annual effective rate of 0.05% of the average daily net assets attributable to each 529 share class. The services provided by MFD, or a third party with which MFD contracts, include recordkeeping and tax reporting and account services, as well as services designed to maintain the program’s compliance with the Internal Revenue Code and other regulatory requirements. Program manager fees and waivers for the year ended April 30, 2018, were as follows:
| | | | | | | | |
| | | Fee | | | Waiver | |
| Class 529A | | | $6,764 | | | | $2,543 | |
| Class 529B | | | 269 | | | | 103 | |
| Class 529C | | | 2,988 | | | | 1,163 | |
| Total Program Manager Fees and Waivers | | | $10,021 | | | | $3,809 | |
Shareholder Servicing Agent – MFS Service Center, Inc. (MFSC), a wholly-owned subsidiary of MFS, receives a fee from the fund for its services as shareholder servicing agent calculated as a percentage of the average daily net assets of the fund as determined periodically under the supervision of the fund’s Board of Trustees. For the
50
Notes to Financial Statements – continued
year ended April 30, 2018, the fee was $219,374, which equated to 0.0043% annually of the fund’s average daily net assets. MFSC also receives payment from the fund for out-of-pocket expenses, sub-accounting and other shareholder servicing costs which may be paid to affiliated and unaffiliated service providers. Class R6 shares do not incur sub-accounting fees. For the year ended April 30, 2018, these out-of-pocket expenses, sub-accounting and other shareholder servicing costs amounted to $3,584,733.
Administrator – MFS provides certain financial, legal, shareholder communications, compliance, and other administrative services to the fund. Under an administrative services agreement, the fund reimburses MFS the costs incurred to provide these services. The fund is charged an annual fixed amount of $17,500 plus a fee based on average daily net assets. The administrative services fee incurred for the year ended April 30, 2018 was equivalent to an annual effective rate of 0.0124% of the fund’s average daily net assets.
Trustees’ and Officers’ Compensation – The fund pays compensation to independent Trustees in the form of a retainer, attendance fees, and additional compensation to Board and Committee chairpersons. The fund does not pay compensation directly to Trustees or officers of the fund who are also officers of the investment adviser, all of whom receive remuneration for their services to the fund from MFS. Certain officers and Trustees of the fund are officers or directors of MFS, MFD, and MFSC.
Other – This fund and certain other funds managed by MFS (the funds) have entered into a service agreement (the ISO Agreement) which provides for payment of fees solely by the funds to Tarantino LLC in return for the provision of services of an Independent Senior Officer (ISO) for the funds. Frank L. Tarantino serves as the ISO and is an officer of the funds and the sole member of Tarantino LLC. The funds can terminate the ISO Agreement with Tarantino LLC at any time under the terms of the ISO Agreement. For the year ended April 30, 2018, the fee paid by the fund under this agreement was $8,608 and is included in “Miscellaneous” expense in the Statement of Operations. MFS has agreed to bear all expenses associated with office space, other administrative support, and supplies provided to the ISO.
The fund invests in the MFS Institutional Money Market Portfolio which is managed by MFS and seeks current income consistent with preservation of capital and liquidity. This money market fund does not pay a management fee to MFS.
The fund is permitted to engage in purchase and sale transactions with funds and accounts for which MFS serves as investment adviser or sub-adviser (“cross-trades”) pursuant to a policy adopted by the Board of Trustees. This policy has been designed to ensure that cross-trades conducted by the fund comply with Rule 17a-7 under the Investment Company Act of 1940. During the year ended April 30, 2018, the fund engaged in purchase transactions pursuant to this policy, which amounted to $5,385,334.
(4) Portfolio Securities
For the year ended April 30, 2018, purchases and sales of investments, other than short-term obligations, were as follows:
| | | | | | | | |
| | | Purchases | | | Sales | |
| U.S. Government securities | | | $741,818,950 | | | | $523,463,044 | |
| Non-U.S. Government securities | | | $1,466,319,327 | | | | $834,799,932 | |
51
Notes to Financial Statements – continued
(5) Shares of Beneficial Interest
The fund’s Declaration of Trust permits the Trustees to issue an unlimited number of full and fractional shares of beneficial interest. Transactions in fund shares were as follows:
| | | | | | | | | | | | | | | | |
| | | Year ended
4/30/18 | | | Year ended
4/30/17 | |
| | | Shares | | | Amount | | | Shares | | | Amount | |
| Shares sold | | | | | | | | | | | | | | | | |
Class A | | | 60,202,673 | | | | $641,770,684 | | | | 71,617,565 | | | | $768,759,457 | |
Class B | | | 178,879 | | | | 1,909,896 | | | | 371,154 | | | | 4,016,756 | |
Class C | | | 1,793,076 | | | | 19,160,176 | | | | 3,034,499 | | | | 32,810,244 | |
Class I | | | 64,005,696 | | | | 683,381,684 | | | | 92,648,421 | | | | 994,616,434 | |
Class R1 | | | 33,868 | | | | 361,253 | | | | 82,393 | | | | 886,322 | |
Class R2 | | | 840,720 | | | | 8,955,817 | | | | 1,253,524 | | | | 13,492,039 | |
Class R3 | | | 1,669,491 | | | | 17,807,616 | | | | 2,713,833 | | | | 29,104,733 | |
Class R4 | | | 3,022,567 | | | | 32,264,206 | | | | 5,750,985 | | | | 61,666,750 | |
Class R6 | | | 83,636,879 | | | | 895,804,561 | | | | 14,225,879 | | | | 152,539,673 | |
Class 529A | | | 254,510 | | | | 2,705,282 | | | | 261,046 | | | | 2,792,026 | |
Class 529B | | | 12,773 | | | | 137,109 | | | | 2,664 | | | | 28,580 | |
Class 529C | | | 59,498 | | | | 635,175 | | | | 160,548 | | | | 1,730,281 | |
| | | 215,710,630 | | | | $2,304,893,459 | | | | 192,122,511 | | | | $2,062,443,295 | |
| | | |
Shares issued to shareholders in
reinvestment of distributions | | | | | | | | | | | | | |
Class A | | | 3,407,169 | | | | $36,289,932 | | | | 4,033,052 | | | | $43,390,964 | |
Class B | | | 29,570 | | | | 315,657 | | | | 43,415 | | | | 467,960 | |
Class C | | | 152,113 | | | | 1,622,961 | | | | 207,748 | | | | 2,238,120 | |
Class I | | | 1,684,521 | | | | 17,953,532 | | | | 1,599,256 | | | | 17,143,809 | |
Class R1 | | | 2,666 | | | | 28,498 | | | | 5,561 | | | | 59,990 | |
Class R2 | | | 86,750 | | | | 923,961 | | | | 102,257 | | | | 1,099,359 | |
Class R3 | | | 185,971 | | | | 1,982,206 | | | | 223,098 | | | | 2,399,101 | |
Class R4 | | | 236,938 | | | | 2,526,631 | | | | 286,489 | | | | 3,080,891 | |
Class R6 | | | 4,814,076 | | | | 51,259,996 | | | | 3,908,994 | | | | 42,053,326 | |
Class 529A | | | 19,102 | | | | 203,191 | | | | 17,393 | | | | 186,678 | |
Class 529B | | | 476 | | | | 5,077 | | | | 540 | | | | 5,820 | |
Class 529C | | | 5,191 | | | | 55,392 | | | | 6,216 | | | | 66,908 | |
| | | 10,624,543 | | | | $113,167,034 | | | | 10,434,019 | | | | $112,192,926 | |
52
Notes to Financial Statements – continued
| | | | | | | | | | | | | | | | |
| | | Year ended
4/30/18 | | | Year ended
4/30/17 | |
| | | Shares | | | Amount | | | Shares | | | Amount | |
| Shares reacquired | | | | | | | | | | | | | |
Class A | | | (54,163,398 | ) | | | $(578,252,462 | ) | | | (85,148,816 | ) | | | $(911,887,291 | ) |
Class B | | | (754,143 | ) | | | (8,046,696 | ) | | | (836,091 | ) | | | (8,980,932 | ) |
Class C | | | (4,869,629 | ) | | | (51,731,014 | ) | | | (4,574,600 | ) | | | (49,031,260 | ) |
Class I | | | (69,882,252 | ) | | | (748,274,083 | ) | | | (61,261,269 | ) | | | (662,143,758 | ) |
Class R1 | | | (143,167 | ) | | | (1,536,453 | ) | | | (188,788 | ) | | | (2,017,608 | ) |
Class R2 | | | (1,245,185 | ) | | | (13,258,140 | ) | | | (1,317,663 | ) | | | (14,184,392 | ) |
Class R3 | | | (3,045,586 | ) | | | (32,494,552 | ) | | | (2,659,535 | ) | | | (28,453,748 | ) |
Class R4 | | | (4,444,641 | ) | | | (47,536,741 | ) | | | (5,702,760 | ) | | | (61,149,542 | ) |
Class R6 | | | (20,950,439 | ) | | | (223,092,840 | ) | | | (16,737,968 | ) | | | (179,513,655 | ) |
Class 529A | | | (163,883 | ) | | | (1,742,241 | ) | | | (107,947 | ) | | | (1,149,687 | ) |
Class 529B | | | (11,882 | ) | | | (126,867 | ) | | | (6,763 | ) | | | (72,669 | ) |
Class 529C | | | (116,014 | ) | | | (1,236,391 | ) | | | (110,840 | ) | | | (1,189,737 | ) |
| | | (159,790,219 | ) | | | $(1,707,328,480 | ) | | | (178,653,040 | ) | | | $(1,919,774,279 | ) |
| | | |
| Net change | | | | | | | | | | | | | |
Class A | | | 9,446,444 | | | | $99,808,154 | | | | (9,498,199 | ) | | | $(99,736,870 | ) |
Class B | | | (545,694 | ) | | | (5,821,143 | ) | | | (421,522 | ) | | | (4,496,216 | ) |
Class C | | | (2,924,440 | ) | | | (30,947,877 | ) | | | (1,332,353 | ) | | | (13,982,896 | ) |
Class I | | | (4,192,035 | ) | | | (46,938,867 | ) | | | 32,986,408 | | | | 349,616,485 | |
Class R1 | | | (106,633 | ) | | | (1,146,702 | ) | | | (100,834 | ) | | | (1,071,296 | ) |
Class R2 | | | (317,715 | ) | | | (3,378,362 | ) | | | 38,118 | | | | 407,006 | |
Class R3 | | | (1,190,124 | ) | | | (12,704,730 | ) | | | 277,396 | | | | 3,050,086 | |
Class R4 | | | (1,185,136 | ) | | | (12,745,904 | ) | | | 334,714 | | | | 3,598,099 | |
Class R6 | | | 67,500,516 | | | | 723,971,717 | | | | 1,396,905 | | | | 15,079,344 | |
Class 529A | | | 109,729 | | | | 1,166,232 | | | | 170,492 | | | | 1,829,017 | |
Class 529B | | | 1,367 | | | | 15,319 | | | | (3,559 | ) | | | (38,269 | ) |
Class 529C | | | (51,325 | ) | | | (545,824 | ) | | | 55,924 | | | | 607,452 | |
| | | 66,544,954 | | | | $710,732,013 | | | | 23,903,490 | | | | $254,861,942 | |
Class T shares were not publicly available for sale during the period. Please see the fund’s prospectus for details.
The fund is one of several mutual funds in which certain MFS funds may invest. The MFS funds do not invest in the underlying funds for the purpose of exercising management or control. At the end of the period, the MFS Moderate Allocation Fund, the MFS Conservative Allocation Fund, the MFS Growth Allocation Fund, the MFS Lifetime Income Fund, the MFS Lifetime 2020 Fund, the MFS Lifetime 2030 Fund, and the MFS Lifetime 2025 Fund were the owners of record of approximately 8%, 8%, 3%, 2%, 1%, 1%, and 1%, respectively, of the value of outstanding voting shares of the fund. In addition, the MFS Lifetime 2035 Fund, the MFS Lifetime 2040 Fund, the MFS Lifetime 2045 Fund, the MFS Lifetime 2050 Fund, the MFS Lifetime 2055 Fund, and the MFS Lifetime 2060 Fund were each the owners of record of less than 1% of the value of outstanding voting shares of the fund.
53
Notes to Financial Statements – continued
(6) Line of Credit
The fund and certain other funds managed by MFS participate in a $1.25 billion unsecured committed line of credit, subject to a $1 billion sublimit, provided by a syndication of banks under a credit agreement. Borrowings may be made for temporary financing needs. Interest is charged to each fund, based on its borrowings, generally at a rate equal to the higher of the Overnight Federal Reserve funds rate or daily one month LIBOR plus an agreed upon spread. A commitment fee, based on the average daily, unused portion of the committed line of credit, is allocated among the participating funds at the end of each calendar quarter. In addition, the fund and other funds managed by MFS have established unsecured uncommitted borrowing arrangements with certain banks for temporary financing needs. Interest is charged to each fund, based on its borrowings, at a rate equal to the Overnight Federal Reserve funds rate plus an agreed upon spread. For the year ended April 30, 2018, the fund’s commitment fee and interest expense were $32,524 and $0, respectively, and are included in “Miscellaneous” expense in the Statement of Operations.
(7) Investments in Affiliated Issuers
An affiliated issuer may be considered one in which the fund owns 5% or more of the outstanding voting securities, or a company which is under common control. For the purposes of this report, the fund assumes the following to be affiliated issuers:
| | | | | | | | | | | | | | | | | | | | |
| Affiliated Issuers | | | | | Beginning
Shares/Par
Amount | | | Acquisitions
Shares/Par
Amount | | | Dispositions
Shares/Par
Amount | | | Ending
Shares/Par
Amount | |
MFS Institutional Money Market Portfolio | | | | | | | 175,685,739 | | | | 1,502,195,716 | | | | (1,628,333,699 | ) | | | 49,547,756 | |
| | | | | |
| Affiliated Issuers | | Realized
Gain (Loss) | | | Change in
Unrealized
Appreciation
(Depreciation) | | | Capital Gain
Distributions | | | Dividend
Income | | | Ending
Value | |
| MFS Institutional Money Market Portfolio | | | $(20,360 | ) | | | $(14,456 | ) | | | $— | | | | $1,359,465 | | | | $49,542,800 | |
54
REPORT OF INDEPENDENT REGISTERED PUBLIC ACCOUNTING FIRM
To the Board of Trustees of MFS Series Trust IX and the Shareholders of MFS Total Return Bond Fund:
Opinion on the Financial Statements and Financial Highlights
We have audited the accompanying statement of assets and liabilities of MFS Total Return Bond Fund (the “Fund”), including the portfolio of investments, as of April 30, 2018, the related statement of operations for the year then ended, the statements of changes in net assets for each of the two years in the period then ended, the financial highlights for each of the five years in the period then ended, and the related notes. In our opinion, the financial statements and financial highlights present fairly, in all material respects, the financial position of the Fund as of April 30, 2018, and the results of its operations for the year then ended, the changes in its net assets for each of the two years in the period then ended, and the financial highlights for each of the five years in the period then ended, in conformity with accounting principles generally accepted in the United States of America.
Basis for Opinion
These financial statements and financial highlights are the responsibility of the Fund’s management. Our responsibility is to express an opinion on the Fund’s financial statements and financial highlights based on our audits. We are a public accounting firm registered with the Public Company Accounting Oversight Board (United States) (PCAOB) and are required to be independent with respect to the Fund in accordance with the U.S. federal securities laws and the applicable rules and regulations of the Securities and Exchange Commission and the PCAOB.
We conducted our audits in accordance with the standards of the PCAOB. Those standards require that we plan and perform the audit to obtain reasonable assurance about whether the financial statements and financial highlights are free of material misstatement, whether due to error or fraud. The Fund is not required to have, nor were we engaged to perform, an audit of its internal control over financial reporting. As part of our audits we are required to obtain an understanding of internal control over financial reporting but not for the purpose of expressing an opinion on the effectiveness of the Fund’s internal control over financial reporting. Accordingly, we express no such opinion.
Our audits included performing procedures to assess the risks of material misstatement of the financial statements and financial highlights, whether due to error or fraud, and performing procedures that respond to those risks. Such procedures included examining, on a test basis, evidence regarding the amounts and disclosures in the financial statements and financial highlights. Our audits also included evaluating the accounting principles used and significant estimates made by management, as well as evaluating the overall presentation of the financial statements and financial highlights. Our procedures included confirmation of securities owned as of April 30, 2018, by correspondence with the custodian and brokers; when replies were not received from brokers, we performed other auditing procedures. We believe that our audits provide a reasonable basis for our opinion.
DELOITTE & TOUCHE LLP
Boston, Massachusetts
June 18, 2018
We have served as the auditor of one or more of the MFS investment companies since 1924.
55
TRUSTEES AND OFFICERS — IDENTIFICATION AND BACKGROUND
The Trustees and Officers of the Trust, as of June 1, 2018, are listed below, together with their principal occupations during the past five years. (Their titles may have varied during that period.) The address of each Trustee and Officer is 111 Huntington Avenue, Boston, Massachusetts 02199-7618.
| | | | | | | | | | |
Name, Age | | Position(s) Held
with Fund | | Trustee/Officer Since (h) | | Number of MFS Funds overseen by the Trustee | | Principal
Occupations During the Past Five Years | | Other Directorships
During the Past
Five Years (j) |
| INTERESTED TRUSTEES |
Robert J. Manning (k) (age 54) | | Trustee | | February 2004 | | 135 | | Massachusetts Financial Services Company, Executive Chairman (since January 2017); Director; Chairman of the Board; Chief Executive Officer (until 2015); Co-Chief Executive Officer (2015-2016) | | N/A |
Robin A. Stelmach (k) (age 56) | | Trustee | | January 2014 | | 135 | | Massachusetts Financial Services Company, Vice Chair (since January 2017); Chief Operating Officer and Executive Vice President (until January 2017) | | N/A |
| INDEPENDENT TRUSTEES |
John P. Kavanaugh (age 63) | | Trustee and Chair of Trustees | | January 2009 | | 135 | | Private investor | | N/A |
56
Trustees and Officers – continued
| | | | | | | | | | |
Name, Age | | Position(s) Held
with Fund | | Trustee/Officer Since (h) | | Number of MFS Funds overseen by the Trustee | | Principal
Occupations During the Past Five Years | | Other Directorships
During the Past
Five Years (j) |
Steven E. Buller (age 66) | | Trustee | | February 2014 | | 135 | | Financial Accounting Standards Advisory Council, Chairman (2014-2015); Public Company Accounting Oversight Board, Standing Advisory Group, Member (until 2014); BlackRock, Inc. (investment management), Managing Director (until 2014), BlackRock Finco UK (investment management), Director (until 2014) | | N/A |
John A. Caroselli (age 63) | | Trustee | | March 2017 | | 135 | | JC Global Advisors, LLC (management consulting), President (since 2015); First Capital Corporation (commercial finance), Executive Vice President (until 2015) | | N/A |
Maureen R. Goldfarb (age 63) | | Trustee | | January 2009 | | 135 | | Private investor | | N/A |
Michael Hegarty (age 73) | | Trustee | | December 2004 | | 135 | | Private investor | | Rouse Properties Inc., Director (until 2016); Capmark Financial Group Inc., Director (until 2015) |
Clarence Otis, Jr. (age 62) | | Trustee | | March 2017 | | 135 | | Darden Restaurants, Inc., Chief Executive Officer (until 2014) | | VF Corporation, Director; Verizon Communications, Inc., Director; The Travelers Companies, Director; Federal Reserve Bank of Atlanta, Director (until 2015) |
57
Trustees and Officers – continued
| | | | | | | | | | |
Name, Age | | Position(s) Held
with Fund | | Trustee/Officer Since (h) | | Number of MFS Funds overseen by the Trustee | | Principal
Occupations During the Past Five Years | | Other Directorships
During the Past
Five Years (j) |
Maryanne L. Roepke (age 62) | | Trustee | | May 2014 | | 135 | | American Century Investments (investment management), Senior Vice President and Chief Compliance Officer (until 2014) | | N/A |
Laurie J. Thomsen (age 60) | | Trustee | | March 2005 | | 135 | | Private investor | | The Travelers Companies, Director; Dycom Industries, Inc., Director (since 2015) |
| | | | | | | | |
Name, Age | | Position(s) Held with Fund | | Trustee/Officer
Since (h) | | Number of MFS
Funds for which the
Person is an Officer | | Principal
Occupations During the Past Five Years |
| OFFICERS | | | | | | | | |
Christopher R. Bohane (k) (age 44) | | Assistant Secretary and Assistant Clerk | | July 2005 | | 135 | | Massachusetts Financial Services Company, Vice President and Assistant General Counsel |
Kino Clark (k) (age 49) | | Assistant Treasurer | | January 2012 | | 135 | | Massachusetts Financial Services Company, Vice President |
John W. Clark, Jr. (k) (age 51) | | Assistant Treasurer | | April 2017 | | 135 | | Massachusetts Financial Services Company, Vice President (since March 2017); Deutsche Bank (financial services), Department Head – Treasurer’s Office (until February 2017) |
Thomas H. Connors (k) (age 58) | | Assistant Secretary and Assistant Clerk | | September 2012 | | 135 | | Massachusetts Financial Services Company, Vice President and Senior Counsel |
58
Trustees and Officers – continued
| | | | | | | | |
Name, Age | | Position(s) Held with Fund | | Trustee/Officer
Since (h) | | Number of MFS
Funds for which the
Person is an Officer | | Principal
Occupations During the Past Five Years |
Ethan D. Corey (k) (age 54) | | Assistant Secretary and Assistant Clerk | | July 2005 | | 135 | | Massachusetts Financial Services Company, Senior Vice President and Associate General Counsel |
David L. DiLorenzo (k) (age 49) | | President | | July 2005 | | 135 | | Massachusetts Financial Services Company, Senior Vice President |
Heidi W. Hardin (k) (age 50) | | Secretary and Clerk | | April 2017 | | 135 | | Massachusetts Financial Services Company, Executive Vice President and General Counsel (since March 2017); Harris Associates (investment management), General Counsel (from September 2015 to January 2017); Janus Capital Management LLC (investment management), Senior Vice President and General Counsel (until September 2015) |
Brian E. Langenfeld (k) (age 45) | | Assistant Secretary and Assistant Clerk | | June 2006 | | 135 | | Massachusetts Financial Services Company, Vice President and Senior Counsel |
Susan A. Pereira (k) (age 47) | | Assistant Secretary and Assistant Clerk | | July 2005 | | 135 | | Massachusetts Financial Services Company, Vice President and Senior Counsel |
Kasey L. Phillips (k) (age 47) | | Assistant Treasurer | | September 2012 | | 135 | | Massachusetts Financial Services Company, Vice President |
59
Trustees and Officers – continued
| | | | | | | | |
Name, Age | | Position(s) Held with Fund | | Trustee/Officer
Since (h) | | Number of MFS
Funds for which the
Person is an Officer | | Principal
Occupations During the Past Five Years |
Matthew A. Stowe (k) (age 43) | | Assistant Secretary and Assistant Clerk | | October 2014 | | 135 | | Massachusetts Financial Services Company, Vice President and Assistant General Counsel |
Frank L. Tarantino (age 74) | | Independent Senior Officer | | June 2004 | | 135 | | Tarantino LLC (provider of compliance services), Principal |
Richard S. Weitzel (k) (age 47) | | Assistant Secretary and Assistant Clerk | | October 2007 | | 135 | | Massachusetts Financial Services Company, Senior Vice President and Associate General Counsel |
Martin J. Wolin (k) (age 50) | | Chief Compliance Officer | | July 2015 | | 135 | | Massachusetts Financial Services Company, Senior Vice President and Chief Compliance Officer (since July 2015); Mercer (financial service provider), Chief Risk and Compliance Officer, North America and Latin America (until June 2015) |
James O. Yost (k) (age 57) | | Treasurer | | September 1990 | | 135 | | Massachusetts Financial Services Company, Senior Vice President |
| (h) | Date first appointed to serve as Trustee/officer of an MFS Fund. Each Trustee has served continuously since appointment unless indicated otherwise. For the period from December 15, 2004 until February 22, 2005, Mr. Manning served as Advisory Trustee. Prior to January 2012, Messrs. DiLorenzo and Yost served as Assistant Treasurers of the Funds. From January 2012 through December 2016, Messrs. DiLorenzo and Yost served as Treasurer and Deputy Treasurer of the Funds, respectively. |
| (j) | Directorships or trusteeships of companies required to report to the Securities and Exchange Commission (i.e., “public companies”). |
| (k) | “Interested person” of the Trust within the meaning of the Investment Company Act of 1940 (referred to as the 1940 Act), which is the principal federal law governing investment companies like the fund, as a result of a position with MFS. The address of MFS is 111 Huntington Avenue, Boston, Massachusetts 02199-7618. |
60
Trustees and Officers – continued
Each Trustee has been elected by shareholders and each Trustee and officer holds office until his or her successor is chosen and qualified or until his or her earlier death, resignation, retirement or removal. The Trust does not hold annual meetings for the purpose of electing Trustees, and Trustees are not elected for fixed terms. Under the terms of the Board’s retirement policy, an Independent Trustee shall retire at the end of the calendar year in which he or she reaches the earlier of 75 years of age or 15 years of service on the Board (or, in the case of any Independent Trustee who joined the Board prior to 2015, 20 years of service on the Board).
Messrs. Buller and Otis and Ms. Roepke are members of the Trust’s Audit Committee.
Each of the Interested Trustees and certain Officers hold comparable officer positions with certain affiliates of MFS.
The Statement of Additional Information for a Fund includes further information about the Trustees and is available without charge upon request by calling 1-800-225-2606.
| | |
| Investment Adviser | | Custodian |
Massachusetts Financial Services Company
111 Huntington Avenue
Boston, MA 02199-7618 | | JPMorgan Chase Bank, NA 4 Metrotech Center New York, NY 11245 |
| Distributor | | Independent Registered Public Accounting Firm |
MFS Fund Distributors, Inc.
111 Huntington Avenue
Boston, MA 02199-7618 | | Deloitte & Touche LLP 200 Berkeley Street Boston, MA 02116 |
| Portfolio Manager(s) | | |
Joshua Marston | | |
Robert Persons | | |
61
PROXY VOTING POLICIES AND INFORMATION
MFS votes proxies on behalf of the fund pursuant to proxy voting policies and procedures that are available without charge, upon request, by calling 1-800-225-2606, by visiting mfs.com/proxyvoting, or by visiting the SEC’s Web site at http://www.sec.gov.
Information regarding how the fund voted proxies relating to portfolio securities during the most recent twelve-month period ended June 30 is available by August 31 of each year without charge by visiting mfs.com/proxyvoting, or by visiting the SEC’s Web site at http://www.sec.gov.
QUARTERLY PORTFOLIO DISCLOSURE
The fund will file a complete schedule of portfolio holdings with the Securities and Exchange Commission (the Commission) for the first and third quarters of each fiscal year on Form N-Q. A shareholder can obtain the quarterly portfolio holdings report at mfs.com. The fund’s Form N-Q is also available on the EDGAR database on the Commission’s Internet Web site at http://www.sec.gov, and may be reviewed and copied at the:
Public Reference Room
Securities and Exchange Commission
100 F Street, NE, Room 1580
Washington, D.C. 20549
Information on the operation of the Public Reference Room may be obtained by calling the Commission at 1-800-SEC-0330. Copies of the fund’s Form N-Q also may be obtained, upon payment of a duplicating fee, by electronic request at the following e-mail address: publicinfo@sec.gov or by writing the Public Reference Section at the above address.
FURTHER INFORMATION
From time to time, MFS may post important information about the fund or the MFS funds on the MFS web site (mfs.com). This information is available at https://www.mfs.com/en-us/what-we-do/announcements.html or at mfs.com/openendfunds by choosing the fund’s name.
62
INFORMATION ABOUT FUND CONTRACTS AND LEGAL CLAIMS
The fund has entered into contractual arrangements with an investment adviser, administrator, distributor, shareholder servicing agent, 529 program manager (if applicable), and custodian who each provide services to the fund. Unless expressly stated otherwise, shareholders are not parties to, or intended beneficiaries of these contractual arrangements, and these contractual arrangements are not intended to create any shareholder right to enforce them against the service providers or to seek any remedy under them against the service providers, either directly or on behalf of the fund.
Under the Trust’s By-Laws and Declaration of Trust, any claims asserted against or on behalf of the MFS Funds, including claims against Trustees and Officers, must be brought in state and federal courts located within the Commonwealth of Massachusetts.
FEDERAL TAX INFORMATION (unaudited)
The fund will notify shareholders of amounts for use in preparing 2018 income tax forms in January 2019.
63
rev. 3/16
| | | | |
| | | |
FACTS | | WHAT DOES MFS DO WITH YOUR PERSONAL INFORMATION? | |  |
| | |
| Why? | | Financial companies choose how they share your personal information. Federal law gives consumers the right to limit some but not all sharing. Federal law also requires us to tell you how we collect, share, and protect your personal information. Please read this notice carefully to understand what we do. |
| | |
| What? | | The types of personal information we collect and share depend on the product or service you have with us. This information can include: • Social Security number and account balances • Account transactions and transaction history • Checking account information and wire transfer instructions When you are no longer our customer, we continue to share your information as described in this notice. |
| | |
| How? | | All financial companies need to share customers’ personal information to run their everyday business. In the section below, we list the reasons financial companies can share their customers’ personal information; the reasons MFS chooses to share; and whether you can limit this sharing. |
| | | | |
Reasons we can share your
personal information | | Does MFS
share? | | Can you limit
this sharing? |
For our everyday business purposes – such as to process your transactions, maintain your account(s), respond to court orders and legal investigations, or report to credit bureaus | | Yes | | No |
For our marketing purposes – to offer our products and services to you | | No | | We don’t share |
For joint marketing with other financial companies | | No | | We don’t share |
For our affiliates’ everyday business purposes – information about your transactions and experiences | | No | | We don’t share |
For our affiliates’ everyday business purposes – information about your creditworthiness | | No | | We don’t share |
| For nonaffiliates to market to you | | No | | We don’t share |
| | |
| Questions? | | Call 800-225-2606 or go to mfs.com. |
64
| | |
| Who we are |
| Who is providing this notice? | | MFS Funds, MFS Investment Management, MFS Institutional Advisors, Inc., and MFS Heritage Trust Company. |
| | |
| What we do |
| How does MFS protect my personal information? | | To protect your personal information from unauthorized access and use, we use security measures that comply with federal law. These measures include procedural, electronic, and physical safeguards for the protection of the personal information we collect about you. |
| How does MFS collect my personal information? | | We collect your personal information, for example, when you • open an account or provide account information • direct us to buy securities or direct us to sell your securities • make a wire transfer We also collect your personal information from others, such as credit bureaus, affiliates, or other companies. |
| Why can’t I limit all sharing? | | Federal law gives you the right to limit only • sharing for affiliates’ everyday business purposes – information about your creditworthiness • affiliates from using your information to market to you • sharing for nonaffiliates to market to you State laws and individual companies may give you additional rights to limit sharing. |
| | |
| Definitions |
| Affiliates | | Companies related by common ownership or control. They can be financial and nonfinancial companies. • MFS does not share personal information with affiliates, except for everyday business purposes as described on page one of this notice. |
| Nonaffiliates | | Companies not related by common ownership or control. They can be financial and nonfinancial companies. • MFS does not share with nonaffiliates so they can market to you. |
| Joint marketing | | A formal agreement between nonaffiliated financial companies that together market financial products or services to you. • MFS doesn’t jointly market. |
| | |
| Other important information |
| If you own an MFS product or receive an MFS service in the name of a third party such as a bank or broker-dealer, their privacy policy may apply to you instead of ours. |
65
Save paper with eDelivery.

| MFS® will send you prospectuses, |
reports, and proxies directly via e-mail so you will get information faster with less mailbox clutter.
To sign up:
1. Go to mfs.com.
2. Log in via MFS® Access.
3. Select eDelivery.
If you own your MFS fund shares through a financial institution or a retirement plan, MFS® TALK, MFS® Access, or eDelivery may not be available to you.
CONTACT
WEB SITE
mfs.com
MFS TALK
1-800-637-8255
24 hours a day
ACCOUNT SERVICE AND LITERATURE
Shareholders
1-800-225-2606
Financial advisors
1-800-343-2829
Retirement plan services
1-800-637-1255
MAILING ADDRESS
MFS Service Center, Inc.
P.O. Box 55824
Boston, MA 02205-5824
OVERNIGHT MAIL
MFS Service Center, Inc.
c/o DST Asset Manager Solutions, Inc.
30 Dan Road
Canton, MA 02021-2809
The Registrant has adopted a Code of Ethics (the “Code”) pursuant to Section 406 of the Sarbanes-Oxley Act and as defined in Form N-CSR that applies to the Registrant’s principal executive officer and principal financial and accounting officer. During the period covered by this report, the Registrant has not amended any provision in its Code of Ethics (the “Code”) that relates to an element of the Code’s definition enumerated in paragraph (b) of Item 2 of this Form N-CSR. During the period covered by this report, the Registrant did not grant a waiver, including an implicit waiver, from any provision of the Code.
A copy of the Code of Ethics is filed as an exhibit to this Form N-CSR.
| ITEM 3. | AUDIT COMMITTEE FINANCIAL EXPERT. |
Messrs. Steven E. Buller and Clarence Otis, Jr. and Ms. Maryanne L. Roepke, members of the Audit Committee, have been determined by the Board of Trustees in their reasonable business judgment to meet the definition of “audit committee financial expert” as such term is defined in Form N-CSR. In addition, Messrs. Buller and Otis and Ms. Roepke are “independent” members of the Audit Committee (as such term has been defined by the Securities and Exchange Commission in regulations implementing Section 407 of the Sarbanes-Oxley Act of 2002). The Securities and Exchange Commission has stated that the designation of a person as an audit committee financial expert pursuant to this Item 3 on the Form N-CSR does not impose on such a person any duties, obligations or liability that are greater than the duties, obligations or liability imposed on such person as a member of the Audit Committee and the Board of Trustees in the absence of such designation or identification.
| ITEM 4. | PRINCIPAL ACCOUNTANT FEES AND SERVICES. |
Items 4(a) through 4(d) and 4(g):
The Board of Trustees has appointed Deloitte & Touche LLP (“Deloitte”) to serve as independent accountants to a series of the Registrant (each a “Fund” and collectively the “Funds”). The tables below set forth the audit fees billed to each Fund as well as fees for non-audit services provided to each Fund and/or to the Fund’s investment adviser, Massachusetts Financial Services Company (“MFS”), and to various entities either controlling, controlled by, or under common control with MFS that provide ongoing services to the Fund (“MFS Related Entities”).
For the fiscal years ended April 30, 2018 and 2017, audit fees billed to each Fund by Deloitte were as follows:
| | | | | | | | |
| | | Audit Fees | |
| | | 2018 | | | 2017 | |
Fees billed by Deloitte: | | | | | | | | |
MFS Corporate Bond Fund | | | 64,578 | | | | 63,205 | |
MFS Limited Maturity Fund | | | 56,049 | | | | 54,860 | |
MFS Municipal Limited Maturity Fund | | | 46,781 | | | | 45,302 | |
MFS Total Return Bond Fund | | | 67,912 | | | | 66,467 | |
| | | | | | | | |
Total | | | 235,320 | | | | 229,834 | |
For the fiscal years ended April 30, 2018 and 2017, fees billed by Deloitte for audit-related, tax and other services provided to each Fund and for audit-related, tax and other services provided to MFS and MFS Related Entities were as follows:
| | | | | | | | | | | | | | | | | | | | | | | | |
| | | Audit-Related Fees1 | | | Tax Fees2 | | | All Other Fees3 | |
| | | 2018 | | | 2017 | | | 2018 | | | 2017 | | | 2018 | | | 2017 | |
Fees billed by Deloitte: | | | | | | | | | | | | | | | | | | | | | | | | |
To MFS Corporate Bond Fund | | | 0 | | | | 0 | | | | 7,142 | | | | 6,988 | | | | 0 | | | | 0 | |
To MFS Limited Maturity Fund | | | 0 | | | | 0 | | | | 7,043 | | | | 6,891 | | | | 0 | | | | 0 | |
To MFS Municipal Limited Maturity Fund | | | 0 | | | | 0 | | | | 6,453 | | | | 6,314 | | | | 0 | | | | 0 | |
To MFS Total Return Bond Fund | | | 0 | | | | 0 | | | | 7,043 | | | | 6,891 | | | | 0 | | | | 0 | |
Total fees billed by Deloitte To above Funds: | | | 0 | | | | 0 | | | | 27,681 | | | | 27,084 | | | | 0 | | | | 0 | |
| | | |
| | | Audit-Related Fees1 | | | Tax Fees2 | | | All Other Fees3 | |
| | | 2018 | | | 2017 | | | 2018 | | | 2017 | | | 2018 | | | 2017 | |
Fees billed by Deloitte: | | | | | | | | | | | | | | | | | | | | | | | | |
To MFS and MFS Related Entities of MFS Corporate Bond Fund* | | | 0 | | | | 0 | | | | 0 | | | | 0 | | | | 5,390 | | | | 0 | |
To MFS and MFS Related Entities of MFS Limited Maturity Fund* | | | 0 | | | | 0 | | | | 0 | | | | 0 | | | | 5,390 | | | | 0 | |
To MFS and MFS Related Entities of MFS Municipal Limited Maturity Fund* | | | 0 | | | | 0 | | | | 0 | | | | 0 | | | | 5,390 | | | | 0 | |
To MFS and MFS Related Entities of MFS Total Return Bond Fund* | | | 0 | | | | 0 | | | | 0 | | | | 0 | | | | 5,390 | | | | 0 | |
| | | | | | | | |
| | | Aggregate Fees for Non-audit
Services | |
| | | 2018 | | | 2017 | |
Fees billed by Deloitte: | | | | | | | | |
To MFS Corporate Bond Fund, MFS and MFS Related Entities# | | | 22,098 | | | | 902,170 | |
To MFS Limited Maturity Fund, MFS and MFS Related Entities# | | | 21,999 | | | | 902,073 | |
To MFS Municipal Limited Maturity Fund, MFS and MFS Related Entities# | | | 21,409 | | | | 901,496 | |
To MFS Total Return Bond Fund, MFS and MFS Related Entities# | | | 21,999 | | | | 902,073 | |
| * | This amount reflects the fees billed to MFS and MFS Related Entities for non-audit services relating directly to the operations and financial reporting of the Funds (portions of which services also related to the operations and financial reporting of other funds within the MFS Funds complex). |
| # | This amount reflects the aggregate fees billed by Deloitte, as the case may be, for non-audit services rendered to the Funds and for non-audit services rendered to MFS and the MFS Related Entities. |
| 1 | The fees included under “Audit-Related Fees” are fees related to assurance and related services that are reasonably related to the performance of the audit or review of financial statements, but not reported under “Audit Fees,” including accounting consultations, agreed-upon procedure reports, attestation reports, comfort letters and internal control reviews. |
| 2 | The fees included under “Tax Fees” are fees associated with tax compliance, tax advice and tax planning, including services relating to the filing or amendment of federal, state or local income tax returns, regulated investment company qualification reviews and tax distribution and analysis. |
| 3 | The fees included under “All Other Fees” are fees for products and services provided by Deloitte other than those reported under “Audit Fees,” “Audit-Related Fees” and “Tax Fees”. |
Item 4(e)(1):
Set forth below are the policies and procedures established by the Audit Committee of the Board of Trustees relating to the pre-approval of audit and non-audit related services:
To the extent required by applicable law, pre-approval by the Audit Committee of the Board is needed for all audit and permissible non-audit services rendered to the Fund and all permissible non-audit services rendered to MFS or MFS Related Entities if the services relate directly to the operations and financial reporting of the Registrant. Pre-approval is currently on an engagement-by-engagement basis. In the event pre-approval of such services is necessary between regular meetings of the Audit Committee and it is not practical to wait to seek pre-approval at the next regular meeting of the Audit Committee, pre-approval of such services may be referred to the Chair of the Audit Committee for approval; provided that the Chair may not pre-approve any individual engagement for such services exceeding $50,000 or multiple engagements for such services in the aggregate exceeding $100,000 in each period between regular meetings of the Audit Committee. Any engagement pre-approved by the Chair between regular meetings of the Audit Committee shall be presented for ratification by the entire Audit Committee at its next regularly scheduled meeting.
Item 4(e)(2):
None, or 0%, of the services relating to the Audit-Related Fees, Tax Fees and All Other Fees paid by the Fund and MFS and MFS Related Entities relating directly to the operations and financial reporting of the Registrant disclosed above were approved by the audit committee pursuant to paragraphs (c)(7)(i)(C) of Rule 2-01 of Regulation S-X (which permits audit committee approval after the start of the engagement with respect to services other than audit, review or attest services, if certain conditions are satisfied).
Item 4(f): Not applicable.
Item 4(h): The Registrant’s Audit Committee has considered whether the provision by a Registrant’s independent registered public accounting firm of non-audit services to MFS and MFS Related Entities that were not pre-approved by the Committee (because such services did not relate directly to the operations and financial reporting of the Registrant) was compatible with maintaining the independence of the independent registered public accounting firm as the Registrant’s principal auditors.
| ITEM 5. | AUDIT COMMITTEE OF LISTED REGISTRANTS. |
Not applicable to the Registrant.
A schedule of investments of the Registrant is included as part of the report to shareholders of such series under Item 1 of this Form N-CSR.
| ITEM 7. | DISCLOSURE OF PROXY VOTING POLICIES AND PROCEDURES FOR CLOSED-END MANAGEMENT INVESTMENT COMPANIES. |
Not applicable to the Registrant.
| ITEM 8. | PORTFOLIO MANAGERS OF CLOSED-END MANAGEMENT INVESTMENT COMPANIES. |
Not applicable to the Registrant.
| ITEM 9. | PURCHASES OF EQUITY SECURITIES BY CLOSED-END MANAGEMENT INVESTMENT COMPANY AND AFFILIATED PURCHASERS. |
Not applicable to the Registrant.
| ITEM 10. | SUBMISSION OF MATTERS TO A VOTE OF SECURITY HOLDERS. |
There were no material changes to the procedures by which shareholders may send recommendations to the Board for nominees to the Registrant’s Board since the Registrant last provided disclosure as to such procedures in response to the requirements of Item 407 (c)(2)(iv) of Regulation S-K or this Item.
| ITEM 11. | CONTROLS AND PROCEDURES. |
| (a) | Based upon their evaluation of the effectiveness of the registrant’s disclosure controls and procedures (as defined in Rule 30a-3(c) under the Investment Company Act of 1940 (the “Act”)) as conducted within 90 days of the filing date of this report on Form N-CSR, the registrant’s principal financial officer and principal executive officer have concluded that those disclosure controls and procedures provide reasonable assurance that the material information required to be disclosed by the registrant on this report is recorded, processed, summarized and reported within the time periods specified in the Securities and Exchange Commission’s rules and forms. |
| (b) | There were no changes in the registrant’s internal controls over financial reporting (as defined in Rule 30a-3(d) under the Act) that occurred during the second fiscal quarter of the period covered by the report that have materially affected, or are reasonably likely to materially affect, the registrant’s internal control over financial reporting. |
| ITEM 12. | DISCLOSURE OF SECURITIES LENDING ACTIVITIES FOR CLOSED-END MANAGEMENT INVESTMENT COMPANIES. |
Not applicable to the Registrant.
| (a) | File the exhibits listed below as part of this form. Letter or number the exhibits in the sequence indicated. |
| | (1) | Any code of ethics, or amendment thereto, that is the subject of the disclosure required by Item 2, to the extent that the registrant intends to satisfy the Item 2 requirements through filing of an exhibit: Code of Ethics attached hereto. |
| | (2) | A separate certification for each principal executive officer and principal financial officer of the registrant as required by Rule 30a-2(a) under the Act (17 CFR 270.30a-2): Attached hereto. |
| (b) | If the report is filed under Section 13(a) or 15(d) of the Exchange Act, provide the certifications required by Rule 30a-2(b) under the Act (17 CFR 270.30a-2(b)), Rule 13a-14(b) or Rule 15d-14(b) under the Exchange Act (17 CFR 240.13a-14(b) or 240.15d-14(b)) and Section 1350 of Chapter 63 of Title 18 of the United States Code (18 U.S.C. 1350) as an exhibit. A certification furnished pursuant to this paragraph will not be deemed “filed” for the purposes of Section 18 of the Exchange Act (15 U.S.C. 78r), or otherwise subject to the liability of that section. Such certification will not be deemed to be incorporated by reference into any filing under the Securities Act of 1933 or the Exchange Act, except to the extent that the registrant specifically incorporates it by reference: Attached hereto. |
Notice
A copy of the Amended and Restated Declaration of Trust, as amended, of the Registrant is on file with the Secretary of State of The Commonwealth of Massachusetts and notice is hereby given that this instrument is executed on behalf of the Registrant by an officer of the Registrant as an officer and not individually and the obligations of or arising out of this instrument are not binding upon any of the Trustees or shareholders individually, but are binding only upon the assets and property of the respective constituent series of the Registrant.
SIGNATURES
Pursuant to the requirements of the Securities Exchange Act of 1934 and the Investment Company Act of 1940, the registrant has duly caused this report to be signed on its behalf by the undersigned, thereunto duly authorized.
(Registrant) MFS SERIES TRUST IX
| | |
| By (Signature and Title)* | | DAVID L. DILORENZO |
| | David L. DiLorenzo, President |
Date: June 18, 2018
Pursuant to the requirements of the Securities Exchange Act of 1934 and the Investment Company Act of 1940, this report has been signed below by the following persons on behalf of the registrant and in the capacities and on the dates indicated.
| | |
| By (Signature and Title)* | | DAVID L. DILORENZO |
| | David L. DiLorenzo, President (Principal Executive Officer) |
Date: June 18, 2018
| | |
| By (Signature and Title)* | | JAMES O. YOST |
| | James O. Yost, Treasurer (Principal Financial Officer and Accounting Officer) |
Date: June 18, 2018
| * | Print name and title of each signing officer under his or her signature. |