UNITED STATES
SECURITIES AND EXCHANGE COMMISSION
Washington, D.C. 20549
FORMN-CSR
CERTIFIED SHAREHOLDER REPORT OF
REGISTERED MANAGEMENT INVESTMENT COMPANIES
Investment Company Act file number811-02464
MFS SERIES TRUST IX
(Exact name of registrant as specified in charter)
111 Huntington Avenue, Boston, Massachusetts 02199
(Address of principal executive offices) (Zip code)
Christopher R. Bohane
Massachusetts Financial Services Company
111 Huntington Avenue
Boston, Massachusetts 02199
(Name and address of agents for service)
Registrant’s telephone number, including area code: (617)954-5000
Date of fiscal year end: April 30*
Date of reporting period: April 30, 2020
| * | This FormN-CSR pertains to the following series of the Registrant: MFS Corporate Bond Fund, MFS Limited Maturity Fund, MFS Municipal Limited Maturity Fund, and MFS Total Return Bond Fund. The remaining series of the Registrant has a fiscal year end of October 31. |
| ITEM 1. | REPORTS TO STOCKHOLDERS. |
Annual Report
April 30, 2020

MFS® Corporate Bond Fund

Beginning on January 1, 2021, as permitted by regulations adopted by the U.S. Securities and Exchange Commission, paper copies of the fund’s annual and semiannual shareholder reports will no longer be sent by mail, unless you specifically request paper copies of the reports. Instead, the complete reports will be made available on the fund’s Web site (funds.mfs.com), and you will be notified by mail each time a report is posted and provided with a Web site link to access the report.
If you are already signed up to receive shareholder reports by email, you will not be affected by this change and you need not take any action. You may sign up to receive shareholder reports and other communications from the fund by email by contacting your financial intermediary (such as a broker-dealer or bank) or, if you hold your shares directly with the fund, by calling 1-800-225-2606 or by logging on to MFS Access at mfs.com.
Beginning on January 1, 2019, you may elect to receive all future reports in paper free of charge. Contact your financial intermediary to request that you continue to receive paper copies of your shareholder reports. If you invest directly with the fund, you can call 1-800-225-2606 or send an email request to orderliterature@mfs.com to let the fund know that you wish to continue receiving paper copies of your shareholder reports. Your election to receive reports in paper will apply to all funds held in your account if you invest through your financial intermediary or all funds held with the MFS fund complex if you invest directly.
MFB-ANN
MFS® Corporate Bond Fund
CONTENTS
The report is prepared for the general information of shareholders. It is authorized for distribution to prospective investors only when preceded or accompanied by a current prospectus.
NOT FDIC INSURED• MAY LOSE VALUE• NO BANK GUARANTEE

LETTER FROM THE EXECUTIVE CHAIR
Dear Shareholders:
Markets experienced dramatic swings in early 2020 as the coronavirus pandemic crippled the global economy for a time. Optimism over the development of vaccines
and therapeutics, along with a decline in cases in countries hit early in the outbreak, has brightened the economic and market outlook during the second quarter, though a great deal of uncertainty remains on how long the aftereffects of the lockdowns will linger.
Global central banks have taken aggressive, coordinated steps to cushion the economic and market fallout related to the virus, and governments are undertaking unprecedented levels of fiscal stimulus. As uncertainty recedes, these measures can help build a supportive environment and encourage economic recovery. In the aftermath of the crisis, there are likely to be societal changes as
households, businesses, and governments adjust to a new reality, and these alterations could change the investment landscape. For investors, occurrences such as theCOVID-19 outbreak demonstrate the importance of having a deep understanding of company fundamentals, and our global research platform has been built to do just that.
Here at MFS®, we aim to help our clients navigate the growing complexity of the markets and world economies. Our long-term investment philosophy and commitment to the responsible allocation of capital allow us to tune out the noise and uncover what we believe are the best, most durable investment opportunities in the market. Through our powerful global investment platform, we combine collective expertise, thoughtful risk management, and long-term discipline to create sustainable value for investors.
Respectfully,

Robert J. Manning
Executive Chair
MFS Investment Management
June 16, 2020
The opinions expressed in this letter are subject to change and may not be relied upon for investment advice. No forecasts can be guaranteed.
1
PORTFOLIO COMPOSITION
Portfolio structure (i)
| | | | |
| Fixed income sectors (i) | | | | |
| Investment Grade Corporates | | | 87.0% | |
| High Yield Corporates | | | 8.6% | |
| U.S. Treasury Securities | | | 2.1% | |
| Municipal Bonds | | | 0.7% | |
| Mortgage-Backed Securities | | | 0.1% | |
| Commercial Mortgage-Backed Securities (o) | | | 0.0% | |
| Asset-Backed Securities (o) | | | 0.0% | |
| | | | |
| Composition including fixed income credit quality (a)(i) | |
| AAA | | | 0.8% | |
| AA | | | 3.2% | |
| A | | | 24.8% | |
| BBB | | | 58.9% | |
| BB | | | 8.2% | |
| B | | | 0.4% | |
| D (o) | | | 0.0% | |
| U.S. Government | | | 2.2% | |
| Federal Agencies | | | 0.1% | |
| Not Rated | | | (0.1)% | |
| Cash & Cash Equivalents | | | 1.4% | |
| Other | | | 0.1% | |
| |
| Portfolio facts (i) | | | | |
| Average Duration (d) | | | 8.1 | |
| Average Effective Maturity (m) | | | 11.3 yrs. | |
| (a) | For all securities other than those specifically described below, ratings are assigned to underlying securities utilizing ratings from Moody’s, Fitch, and Standard & Poor’s rating agencies and applying the following hierarchy: If all three agencies provide a rating, the middle rating (after dropping the highest and lowest ratings) is assigned; if two of the three agencies rate a security, the lower of the two is assigned. Ratings are shown in the S&P and Fitch scale (e.g., AAA). Securities rated BBB or higher are considered investment grade. All ratings are subject to change. U.S. Government includes securities issued by the U.S. Department of the Treasury. Federal Agencies includes rated and unrated U.S. Agencyfixed-income securities, U.S. Agency mortgage-backed securities, and collateralized mortgage obligations of U.S. Agency mortgage-backed securities. Not Rated includes fixed income securities and fixed income derivatives, which have not been rated by any rating agency. The fund may or may not have held all of these instruments on this date. The fund is not rated by these agencies. |
| (d) | Duration is a measure of how much a bond’s price is likely to fluctuate with general changes in interest rates, e.g., if rates rise 1.00%, a bond with a5-year duration is likely to lose about 5.00% of its value due to the interest rate move. |
2
Portfolio Composition – continued
| (i) | For purposes of this presentation, the components include the value of securities, and reflect the impact of the equivalent exposure of derivative positions, if any. These amounts may be negative from time to time. Equivalent exposure is a calculated amount that translates the derivative position into a reasonable approximation of the amount of the underlying asset that the portfolio would have to hold at a given point in time to have the same price sensitivity that results from the portfolio’s ownership of the derivative contract. When dealing with derivatives, equivalent exposure is a more representative measure of the potential impact of a position on portfolio performance than value. The bond component will include any accrued interest amounts. |
| (m) | In determining each instrument’s effective maturity for purposes of calculating the fund’s dollar-weighted average effective maturity, MFS uses the instrument’s stated maturity or, if applicable, an earlier date on which MFS believes it is probable that a maturity-shortening device (such as a put,pre-refunding or prepayment) will cause the instrument to be repaid. Such an earlier date can be substantially shorter than the instrument’s stated maturity. |
Where the fund holds convertible bonds, they are treated as part of the equity portion of the portfolio.
Cash & Cash Equivalents includes any cash, investments in money market funds, short-term securities, and other assets less liabilities. Please see the Statement of Assets and Liabilities for additional information related to the fund’s cash position and other assets and liabilities.
Other includes equivalent exposure from currency derivatives and/or any offsets to derivative positions.
Percentages are based on net assets as of April 30, 2020.
The portfolio is actively managed and current holdings may be different.
3
MANAGEMENT REVIEW
Summary of Results
For the twelve months ended April 30, 2020, Class A shares of the MFS Corporate Bond Fund (fund) provided a total return of 10.00%, at net asset value. This compares with a return of 9.37% for the fund’s benchmark, the Bloomberg Barclays U.S. Credit Bond Index.
Market Environment
Market volatility soared at the end of the period as COVID-19, the illness caused by the novel coronavirus first detected in China, spread around the world in early 2020. Government-imposed social distancing measures taken to slow the spread of the virus forced the shutdown of large portions of the global economy. In an attempt to limit the economic fallout of the crisis, central bankers and policymakers have taken a variety of actions unprecedented in both size and speed, but despite their best efforts, a global recession has begun. Given the unique circumstances surrounding the genesis of the downturn, it is difficult to forecast how long the crisis will linger.
High levels of investor uncertainty saw equity prices plunge, market volatility rise and large segments of global fixed income markets freeze as investors sought liquidity wherever they could find it. As the global economy rapidly slowed, a disagreement between Saudi Arabia and Russia over OPEC+ production cuts resulted in the Saudis shelving the OPEC+ arrangement and increasing oil output at the same time that global oil demand was plummeting, which compounded market turmoil. The resulting drop in prices undercut oil exporters, many of which are in emerging markets, as well as a large segment of the high-yield credit market.
Central banks around the world responded quickly and massively to the crisis with programs to improve liquidity and support markets. They proved largely successful in helping to restore market function, easing volatility and stimulating a market rebound at the end of the period. Monetary easing measures were complimented by large fiscal stimulus plans in developed countries. Even emerging market countries were able to implement counter-cyclical policies, a departure from the usual market-dictated response to risk-off crises, due to relatively manageable external liabilities and balance of payments in many countries and persistently low inflation.
As is often the case in a serious crisis, market vulnerabilities have been revealed. For example, companies that have added significant leverage to their balance sheets in recent years by borrowing to fund dividend payments and stock buybacks may find it difficult to follow that path in the future, and investors may not reward them if they do. Recapitalizations by some of these highly leveraged firms could dilute existing shareholders. Very long supply chains designed to squeeze out every bit of savings may be shifted closer to home markets if companies seek to emphasize resiliency over cost after a series of supply disruptions. The aftereffects of the global pandemic could impact consumer, business and government behavior in ways it will be difficult to forecast.
Factors Affecting Performance
Relative to the Bloomberg Barclays U.S. Credit Bond Index, the fund’s underweight allocation to both theenergyandgovernment owned, no guaranteesectors, as well as
4
Management Review – continued
its overweight exposure to theelectric sector, aided results. Favorable security selection within both the “A” and “BBB” rated (r) credit quality segments also contributed to relative performance.
Conversely, positioning along the yield curve (y) and the fund’s shorter duration (d) stance hurt relative performance over the reporting period. Bond selection within both theconsumer cyclicalandinstitutional financesectors further weighed on relative returns.
Respectfully,
Portfolio Manager(s)
Alexander Mackey, Henry Peabody, and Robert Persons
Note to Shareholders: Effective December 31, 2019, Henry Peabody was added as a Portfolio Manager of the Fund.
| (d) | Duration is a measure of how much a bond’s price is likely to fluctuate with general changes in interest rates, e.g., if rates rise 1.00%, a bond with a5-year duration is likely to lose about 5.00% of its value. |
| (r) | Bonds rated “BBB”, “Baa”, or higher are considered investment grade; bonds rated “BB”, “Ba”, or below are considerednon-investment grade. The sources for bond quality ratings are Moody’s Investors Service, Standard & Poor’s and Fitch, Inc. and are applied using the following hierarchy: If all three agencies provide a rating, the middle rating (after dropping the highest and lowest ratings) is assigned; if two of the three agencies rate a security, the lower of the two is assigned. Ratings are shown in the S&P and Fitch scale (e.g., AAA). For securities which are not rated by any of the three agencies, the security is considered Not Rated. |
| (y) | A yield curve graphically depicts the yields of different maturity bonds of the same credit quality and type; a normal yield curve is upward sloping, with short-term rates lower than long-term rates. |
The views expressed in this report are those of the portfolio manager(s) only through the end of the period of the report as stated on the cover and do not necessarily reflect the views of MFS or any other person in the MFS organization. These views are subject to change at any time based on market or other conditions, and MFS disclaims any responsibility to update such views. These views may not be relied upon as investment advice or an indication of trading intent on behalf of any MFS portfolio. References to specific securities are not recommendations of such securities, and may not be representative of any MFS portfolio’s current or future investments.
5
PERFORMANCE SUMMARYTHROUGH4/30/20
The following chart illustrates a representative class of the fund’s historical performance in comparison to its benchmark(s). Performance results include the deduction of the maximum applicable sales charge and reflect the percentage change in net asset value, including reinvestment of dividends and capital gains distributions. The performance of other share classes will be greater than or less than that of the class depicted below. Benchmarks are unmanaged and may not be invested in directly. Benchmark returns do not reflect sales charges, commissions or expenses. (See Notes to Performance Summary.)
Performance data shown represents past performance and is no guarantee of future results. Investment return and principal value fluctuate so your shares, when sold, may be worth more or less than the original cost; current performance may be lower or higher than quoted. The performance shown does not reflect the deduction of taxes, if any, that a shareholder would pay on fund distributions or the redemption of fund shares.
Growth of a Hypothetical $10,000 Investment
6
Performance Summary – continued
Total Returns through 4/30/20
Average annual without sales charge
| | | | | | | | | | | | | | |
| | | Share Class | | Class Inception Date | | 1-yr | | 5-yr | | 10-yr | | Life (t) | | |
| | | A | | 5/08/74 | | 10.00% | | 4.35% | | 5.12% | | N/A | | |
| | | B | | 9/07/93 | | 9.20% | | 3.58% | | 4.34% | | N/A | | |
| | | C | | 1/03/94 | | 9.21% | | 3.59% | | 4.35% | | N/A | | |
| | | I | | 1/02/97 | | 10.28% | | 4.60% | | 5.36% | | N/A | | |
| | | R1 | | 4/01/05 | | 9.20% | | 3.59% | | 4.35% | | N/A | | |
| | | R2 | | 10/31/03 | | 9.73% | | 4.09% | | 4.86% | | N/A | | |
| | | R3 | | 4/01/05 | | 10.00% | | 4.35% | | 5.12% | | N/A | | |
| | | R4 | | 4/01/05 | | 10.35% | | 4.62% | | 5.38% | | N/A | | |
| | | R6 | | 6/01/12 | | 10.38% | | 4.72% | | N/A | | 4.76% | | |
| | | | | |
| Comparative benchmark(s) | | | | | | | | | | |
| | | Bloomberg Barclays U.S. Credit Bond Index (f) | | 9.37% | | 4.33% | | 5.04% | | N/A | | |
| | | | | |
| Average annual with sales charge | | | | | | | | | | |
| | | A
With Initial Sales Charge (4.25%) | | 5.33% | | 3.45% | | 4.66% | | N/A | | |
| | | B
With CDSC (Declining over six years from 4% to 0%) (v) | | 5.20% | | 3.23% | | 4.34% | | N/A | | |
| | | C
With CDSC (1% for 12 months) (v) | | 8.21% | | 3.59% | | 4.35% | | N/A | | |
CDSC – Contingent Deferred Sales Charge.
Class I, R1, R2, R3, R4, and R6 shares do not have a sales charge.
| (f) | Source: FactSet Research Systems Inc. |
| (t) | For the period from the class inception date through the stated period end (for those share classes with less than 10 years of performance history). No comparative benchmark performance information is provided for “life” periods. (See Notes to Performance Summary.) |
| (v) | Assuming redemption at the end of the applicable period. |
Benchmark Definition(s)
Bloomberg Barclays U.S. Credit Bond Index – a market capitalization-weighted index that measures the performance of publicly issued, SEC-registered, U.S. corporate and specified foreign debentures and secured notes that meet specified maturity, liquidity, and quality requirements. BLOOMBERG® is a trademark and service mark of Bloomberg Finance L.P. and its affiliates (collectively “Bloomberg”). BARCLAYS® is a trademark and service mark of Barclays Bank Plc (collectively with its affiliates, “Barclays”), used under license. Bloomberg or Bloomberg’s licensors, including Barclays, own all proprietary rights in the Bloomberg Barclays Indices. Neither Bloomberg nor Barclays approves or endorses this material, or guarantees the accuracy or completeness of any information herein, or makes any warranty, express or implied, as to the results to be obtained therefrom, and, to the maximum extent allowed by law, neither shall have any liability or responsibility for injury or damages arising in connection therewith.
It is not possible to invest directly in an index.
7
Performance Summary – continued
Notes to Performance Summary
Average annual total return represents the average annual change in value for each share class for the periods presented. Life returns are presented where the share class has less than 10 years of performance history and represent the average annual total return from the class inception date to the stated period end date. As the fund’s share classes may have different inception dates, the life returns may represent different time periods and may not be comparable. As a result, no comparative benchmark performance information is provided for life periods.
Performance results reflect any applicable expense subsidies and waivers in effect during the periods shown. Without such subsidies and waivers the fund’s performance results would be less favorable. Please see the prospectus and financial statements for complete details.
Performance results do not include adjustments made for financial reporting purposes in accordance with U.S. generally accepted accounting principles and may differ from amounts reported in the financial highlights.
From time to time the fund may receive proceeds from litigation settlements, without which performance would be lower.
8
EXPENSE TABLE
Fund expenses borne by the shareholders during the period, November 1, 2019 through April 30, 2020
As a shareholder of the fund, you incur two types of costs: (1) transaction costs, including sales charges (loads) on certain purchase or redemption payments, and (2) ongoing costs, including management fees; distribution and service(12b-1) fees; and other fund expenses. This example is intended to help you understand your ongoing costs (in dollars) of investing in the fund and to compare these costs with the ongoing costs of investing in other mutual funds.
The example is based on an investment of $1,000 invested at the beginning of the period and held for the entire period November 1, 2019 through April 30, 2020.
Actual Expenses
The first line for each share class in the following table provides information about actual account values and actual expenses. You may use the information in this line, together with the amount you invested, to estimate the expenses that you paid over the period. Simply divide your account value by $1,000 (for example, an $8,600 account value divided by $1,000 = 8.6), then multiply the result by the number in the first line under the heading entitled “Expenses Paid During Period” to estimate the expenses you paid on your account during this period.
Hypothetical Example for Comparison Purposes
The second line for each share class in the following table provides information about hypothetical account values and hypothetical expenses based on the fund’s actual expense ratio and an assumed rate of return of 5% per year before expenses, which is not the fund’s actual return. The hypothetical account values and expenses may not be used to estimate the actual ending account balance or expenses you paid for the period. You may use this information to compare the ongoing costs of investing in the fund and other funds. To do so, compare this 5% hypothetical example with the 5% hypothetical examples that appear in the shareholder reports of the other funds.
Please note that the expenses shown in the table are meant to highlight your ongoing costs only and do not reflect any transactional costs, such as sales charges (loads). Therefore, the second line for each share class in the table is useful in comparing ongoing costs only, and will not help you determine the relative total costs of owning different funds. In addition, if these transactional costs were included, your costs would have been higher.
9
Expense Table – continued
| | | | | | | | | | | | | | | | | | |
Share
Class | | | | Annualized
Expense
Ratio | | | Beginning
Account Value
11/01/19 | | | Ending
Account Value
4/30/20 | | | Expenses
Paid During
Period (p) 11/01/19-4/30/20 | |
| A | | Actual | | | 0.78% | | | | $1,000.00 | | | | $1,023.70 | | | | $3.92 | |
| | Hypothetical (h) | | | 0.78% | | | | $1,000.00 | | | | $1,020.98 | | | | $3.92 | |
| B | | Actual | | | 1.53% | | | | $1,000.00 | | | | $1,019.91 | | | | $7.68 | |
| | Hypothetical (h) | | | 1.53% | | | | $1,000.00 | | | | $1,017.26 | | | | $7.67 | |
| C | | Actual | | | 1.53% | | | | $1,000.00 | | | | $1,019.92 | | | | $7.68 | |
| | Hypothetical (h) | | | 1.53% | | | | $1,000.00 | | | | $1,017.26 | | | | $7.67 | |
| I | | Actual | | | 0.53% | | | | $1,000.00 | | | | $1,024.98 | | | | $2.67 | |
| | Hypothetical (h) | | | 0.53% | | | | $1,000.00 | | | | $1,022.23 | | | | $2.66 | |
| R1 | | Actual | | | 1.53% | | | | $1,000.00 | | | | $1,019.91 | | | | $7.68 | |
| | Hypothetical (h) | | | 1.53% | | | | $1,000.00 | | | | $1,017.26 | | | | $7.67 | |
| R2 | | Actual | | | 1.03% | | | | $1,000.00 | | | | $1,021.74 | | | | $5.18 | |
| | Hypothetical (h) | | | 1.03% | | | | $1,000.00 | | | | $1,019.74 | | | | $5.17 | |
| R3 | | Actual | | | 0.78% | | | | $1,000.00 | | | | $1,023.70 | | | | $3.92 | |
| | Hypothetical (h) | | | 0.78% | | | | $1,000.00 | | | | $1,020.98 | | | | $3.92 | |
| R4 | | Actual | | | 0.53% | | | | $1,000.00 | | | | $1,024.97 | | | | $2.67 | |
| | Hypothetical (h) | | | 0.53% | | | | $1,000.00 | | | | $1,022.23 | | | | $2.66 | |
| R6 | | Actual | | | 0.43% | | | | $1,000.00 | | | | $1,025.49 | | | | $2.17 | |
| | Hypothetical (h) | | | 0.43% | | | | $1,000.00 | | | | $1,022.73 | | | | $2.16 | |
| (h) | 5% class return per year before expenses. |
| (p) | “Expenses Paid During Period” are equal to each class’s annualized expense ratio, as shown above, multiplied by the average account value over the period, multiplied by 182/366 (to reflect theone-half year period). Expenses paid do not include any applicable sales charges (loads). If these transaction costs had been included, your costs would have been higher. |
10
PORTFOLIO OF INVESTMENTS
4/30/20
The Portfolio of Investments is a complete list of all securities owned by your fund. It is categorized by broad-based asset classes.
| | | | | | | | |
| | |
| Issuer | | Shares/Par | | | Value ($) | |
| Bonds - 97.8% | | | | | | |
| Aerospace - 4.1% | | | | | | |
| BAE Systems PLC, 3.4%, 4/15/2030 (n) | | $ | 17,185,000 | | | $ | 18,601,625 | |
| Boeing Co., 5.705%, 5/01/2040 | | | 28,564,000 | | | | 28,564,000 | |
| Huntington Ingalls Industries, Inc., 3.483%, 12/01/2027 | | | 11,950,000 | | | | 12,251,103 | |
| Huntington Ingalls Industries, Inc., 4.2%, 5/01/2030 (n) | | | 8,584,000 | | | | 9,076,865 | |
| L3Harris Technologies, Inc., 3.85%, 6/15/2023 (n) | | | 21,957,000 | | | | 23,008,728 | |
| L3Harris Technologies, Inc., 2.9%, 12/15/2029 | | | 13,420,000 | | | | 13,699,779 | |
| Lockheed Martin Corp., 3.55%, 1/15/2026 | | | 7,857,000 | | | | 8,824,509 | |
| Northrop Grumman Corp., 2.55%, 10/15/2022 | | | 31,622,000 | | | | 32,731,932 | |
| Northrop Grumman Corp., 2.93%, 1/15/2025 | | | 27,106,000 | | | | 28,805,350 | |
| Raytheon Technologies Corp., 4.125%, 11/16/2028 | | | 9,190,000 | | | | 10,666,291 | |
| TransDigm, Inc., 6.25%, 3/15/2026 (n) | | | 20,921,000 | | | | 20,476,429 | |
| | | | | | | | |
| | | | | | | $ | 206,706,611 | |
| Apparel Manufacturers - 0.5% | | | | | | |
| NIKE, Inc., “B”, 3.25%, 3/27/2040 | | $ | 14,118,000 | | | $ | 15,339,339 | |
| Tapestry, Inc., 4.125%, 7/15/2027 | | | 8,644,000 | | | | 7,385,915 | |
| | | | | | | | |
| | | | | | | $ | 22,725,254 | |
| Asset-Backed & Securitized - 0.0% | | | | | | |
| Bayview Financial Revolving Mortgage Loan Trust, FLR, 2.04% (LIBOR - 1mo. + 1.6%), 12/28/2040 (n) | | $ | 676,692 | | | $ | 660,795 | |
| Greenwich Capital Commercial Funding Corp., 5.62%, 7/10/2038 | | | 324,318 | | | | 322,210 | |
| JPMorgan Chase Commercial Mortgage Securities Corp., 5.963%, 7/15/2042 (n) | | | 1,158,636 | | | | 757,489 | |
| Lehman Brothers Commercial Conduit Mortgage Trust, 1.112%, 2/18/2030 (i) | | | 129,683 | | | | 3 | |
| | | | | | | | |
| | | | | | | $ | 1,740,497 | |
| Automotive - 2.7% | | | | | | |
| Allison Transmission, Inc., 5.875%, 6/01/2029 (n) | | $ | 18,222,000 | | | $ | 17,666,776 | |
| General Motors Co., 6.25%, 10/02/2043 | | | 10,919,000 | | | | 9,557,734 | |
| General Motors Financial Co., Inc., 4%, 10/06/2026 | | | 3,707,000 | | | | 3,366,558 | |
| Hyundai Capital America, 3%, 2/10/2027 (n) | | | 28,430,000 | | | | 25,407,366 | |
| Hyundai Capital America, 6.375%, 4/08/2030 (n) | | | 8,601,000 | | | | 9,279,274 | |
| Lear Corp., 3.8%, 9/15/2027 | | | 36,241,000 | | | | 33,651,525 | |
| Toyota Motor Credit Corp., 3.375%, 4/01/2030 | | | 20,667,000 | | | | 22,609,094 | |
| ZF North America Capital, Inc., 4.75%, 4/29/2025 (n) | | | 16,628,000 | | | | 15,477,342 | |
| | | | | | | | |
| | | | | | | $ | 137,015,669 | |
11
Portfolio of Investments – continued
| | | | | | | | |
| | |
| Issuer | | Shares/Par | | | Value ($) | |
| Bonds - continued | | | | | | |
| Broadcasting - 0.8% | | | | | | |
| Discovery, Inc., 4.125%, 5/15/2029 | | $ | 7,075,000 | | | $ | 7,433,506 | |
| Discovery, Inc., 5.3%, 5/15/2049 | | | 9,152,000 | | | | 10,610,344 | |
| Fox Corp., 4.03%, 1/25/2024 | | | 5,337,000 | | | | 5,765,700 | |
| Fox Corp., 5.476%, 1/25/2039 | | | 13,338,000 | | | | 16,836,264 | |
| | | | | | | | |
| | | | | | | $ | 40,645,814 | |
| Brokerage & Asset Managers - 2.7% | | | | | | |
| Charles Schwab Corp., 3.85%, 5/21/2025 | | $ | 22,971,000 | | | $ | 25,833,431 | |
| Charles Schwab Corp., 5.375%, 4/30/2070 | | | 15,336,000 | | | | 15,700,230 | |
| E*TRADE Financial Corp., 2.95%, 8/24/2022 | | | 10,906,000 | | | | 11,134,841 | |
| Intercontinental Exchange, Inc., 2.35%, 9/15/2022 | | | 19,865,000 | | | | 20,298,792 | |
| Intercontinental Exchange, Inc., 4%, 10/15/2023 | | | 14,230,000 | | | | 15,654,437 | |
| Intercontinental Exchange, Inc., 3.75%, 12/01/2025 | | | 8,952,000 | | | | 9,907,366 | |
| NASDAQ, Inc., 3.25%, 4/28/2050 | | | 13,783,000 | | | | 13,825,897 | |
| TD Ameritrade Holding Corp., 3.3%, 4/01/2027 | | | 7,004,000 | | | | 7,484,218 | |
| TD Ameritrade Holding Corp., 2.75%, 10/01/2029 | | | 12,545,000 | | | | 12,930,965 | |
| | | | | | | | |
| | | | | | | $ | 132,770,177 | |
| Building - 1.9% | | | | | | |
| CRH America Finance, Inc., 4.5%, 4/04/2048 (n) | | $ | 16,362,000 | | | $ | 17,529,343 | |
| Martin Marietta Materials, Inc., 4.25%, 7/02/2024 | | | 7,431,000 | | | | 7,926,518 | |
| Martin Marietta Materials, Inc., 3.45%, 6/01/2027 | | | 8,095,000 | | | | 8,266,018 | |
| Martin Marietta Materials, Inc., 3.5%, 12/15/2027 | | | 14,186,000 | | | | 14,735,428 | |
| Masco Corp., 4.45%, 4/01/2025 | | | 3,390,000 | | | | 3,571,889 | |
| Masco Corp., 4.375%, 4/01/2026 | | | 11,202,000 | | | | 11,664,733 | |
| Masco Corp., 4.5%, 5/15/2047 | | | 12,265,000 | | | | 11,848,571 | |
| Vulcan Materials Co., 4.5%, 6/15/2047 | | | 19,500,000 | | | | 21,127,790 | |
| | | | | | | | |
| | | | | | | $ | 96,670,290 | |
| Business Services - 2.0% | | | | | | |
| Equinix, Inc., 2.625%, 11/18/2024 | | $ | 17,822,000 | | | $ | 18,320,125 | |
| Equinix, Inc., 5.375%, 5/15/2027 | | | 4,197,000 | | | | 4,483,235 | |
| Fidelity National Information Services, Inc., 3.5%, 4/15/2023 | | | 2,389,000 | | | | 2,535,309 | |
| Fidelity National Information Services, Inc., 3%, 8/15/2026 | | | 13,572,000 | | | | 14,409,041 | |
| Fiserv, Inc., 4.4%, 7/01/2049 | | | 13,643,000 | | | | 16,281,981 | |
| MSCI, Inc., 4.75%, 8/01/2026 (n) | | | 5,205,000 | | | | 5,440,682 | |
| MSCI, Inc., 5.375%, 5/15/2027 (n) | | | 15,000,000 | | | | 16,162,500 | |
| MSCI, Inc., 4%, 11/15/2029 (n) | | | 11,808,000 | | | | 12,346,327 | |
| MSCI, Inc., 3.625%, 9/01/2030 (n) | | | 2,669,000 | | | | 2,702,363 | |
| NXP B.V./NXP Funding LLC, 3.15%, 5/01/2027 (n) | | | 9,345,000 | | | | 9,441,794 | |
| | | | | | | | |
| | | | | | | $ | 102,123,357 | |
12
Portfolio of Investments – continued
| | | | | | | | |
| | |
| Issuer | | Shares/Par | | | Value ($) | |
| Bonds - continued | | | | | | |
| Cable TV - 4.0% | | | | | | |
| Charter Communications Operating LLC/Charter Communications Operating Capital Corp., 6.384%, 10/23/2035 | | $ | 19,932,000 | | | $ | 25,594,306 | |
| Charter Communications Operating LLC/Charter Communications Operating Capital Corp., 5.375%, 5/01/2047 | | | 39,961,000 | | | | 48,088,647 | |
| Comcast Corp., 4.6%, 10/15/2038 | | | 28,500,000 | | | | 35,819,318 | |
| Comcast Corp., 3.45%, 2/01/2050 | | | 10,000,000 | | | | 11,219,662 | |
| Cox Communications, Inc., 3.5%, 8/15/2027 (n) | | | 11,693,000 | | | | 12,369,577 | |
| Cox Communications, Inc., 4.6%, 8/15/2047 (n) | | | 3,670,000 | | | | 4,211,088 | |
| Sirius XM Holdings, Inc., 5.5%, 7/01/2029 (n) | | | 8,869,000 | | | | 9,353,248 | |
| Sirius XM Radio, Inc., 5.375%, 7/15/2026 (n) | | | 19,940,000 | | | | 20,687,750 | |
| Sirius XM Radio, Inc., 5%, 8/01/2027 (n) | | | 9,137,000 | | | | 9,362,592 | |
| Time Warner Cable, Inc., 4.5%, 9/15/2042 | | | 7,034,000 | | | | 7,427,812 | |
| Videotron Ltd., 5%, 7/15/2022 | | | 13,220,000 | | | | 13,583,550 | |
| | | | | | | | |
| | | | | | | $ | 197,717,550 | |
| Chemicals - 0.5% | | | | | | |
| Air Liquide Finance Co., 2.25%, 9/27/2023 (n) | | $ | 11,552,000 | | | $ | 11,814,271 | |
| Sherwin-Williams Co., 4.5%, 6/01/2047 | | | 11,884,000 | | | | 14,366,735 | |
| | | | | | | | |
| | | | | | | $ | 26,181,006 | |
| Computer Software - 1.9% | | | | | | |
| Dell International LLC/EMC Corp., 4.9%, 10/01/2026 (n) | | $ | 27,891,000 | | | $ | 28,835,918 | |
| Microsoft Corp., 3.45%, 8/08/2036 | | | 20,000,000 | | | | 23,303,548 | |
| Microsoft Corp., 4.1%, 2/06/2037 | | | 13,500,000 | | | | 16,821,295 | |
| VeriSign, Inc., 4.625%, 5/01/2023 | | | 7,628,000 | | | | 7,677,582 | |
| VeriSign, Inc., 4.75%, 7/15/2027 | | | 17,901,000 | | | | 19,068,324 | |
| | | | | | | | |
| | | | | | | $ | 95,706,667 | |
| Computer Software - Systems - 1.9% | | | | | | |
| Apple, Inc., 2.05%, 9/11/2026 | | $ | 31,675,000 | | | $ | 33,397,091 | |
| Apple, Inc., 3.2%, 5/11/2027 | | | 31,231,000 | | | | 34,803,733 | |
| Apple, Inc., 4.5%, 2/23/2036 | | | 10,000,000 | | | | 12,761,091 | |
| Apple, Inc., 3.85%, 8/04/2046 | | | 8,346,000 | | | | 10,198,958 | |
| Apple, Inc., 4.25%, 2/09/2047 | | | 4,778,000 | | | | 6,262,624 | |
| | | | | | | | |
| | | | | | | $ | 97,423,497 | |
| Conglomerates - 0.9% | | | | | | |
| Roper Technologies, Inc., 4.2%, 9/15/2028 | | $ | 12,199,000 | | | $ | 13,706,283 | |
| Roper Technologies, Inc., 2.95%, 9/15/2029 | | | 9,027,000 | | | | 9,451,400 | |
| Westinghouse Air Brake Technologies Corp., 4.4%, 3/15/2024 | | | 6,283,000 | | | | 6,308,202 | |
| Westinghouse Air Brake Technologies Corp., 4.95%, 9/15/2028 | | | 16,536,000 | | | | 16,358,275 | |
| | | | | | | | |
| | | | | | | $ | 45,824,160 | |
13
Portfolio of Investments – continued
| | | | | | | | |
| | |
| Issuer | | Shares/Par | | | Value ($) | |
| Bonds - continued | | | | | | |
| Consumer Products - 0.4% | | | | | | |
| Kimberly-Clark Corp., 3.1%, 3/26/2030 | | $ | 4,641,000 | | | $ | 5,181,600 | |
| Reckitt Benckiser Treasury Services PLC, 3%, 6/26/2027 (n) | | | 16,079,000 | | | | 16,778,990 | |
| | | | | | | | |
| | | | | | | $ | 21,960,590 | |
| Consumer Services - 3.5% | | | | | | |
| Booking Holdings, Inc., 3.65%, 3/15/2025 | | $ | 6,166,000 | | | $ | 6,379,666 | |
| Booking Holdings, Inc., 3.6%, 6/01/2026 | | | 18,768,000 | | | | 19,612,353 | |
| Booking Holdings, Inc., 3.55%, 3/15/2028 | | | 19,096,000 | | | | 19,295,884 | |
| Experian Finance PLC, 2.75%, 3/08/2030 (n) | | | 39,907,000 | | | | 39,840,146 | |
| IHS Markit Ltd., 3.625%, 5/01/2024 | | | 5,742,000 | | | | 5,902,661 | |
| IHS Markit Ltd., 4.75%, 2/15/2025 (n) | | | 9,259,000 | | | | 10,021,849 | |
| IHS Markit Ltd., 4%, 3/01/2026 (n) | | | 6,085,000 | | | | 6,450,086 | |
| IHS Markit Ltd., 4.25%, 5/01/2029 | | | 8,611,000 | | | | 9,202,490 | |
| Service Corp. International, 5.125%, 6/01/2029 | | | 18,430,000 | | | | 19,167,200 | |
| Visa, Inc., 4.15%, 12/14/2035 | | | 12,578,000 | | | | 15,872,790 | |
| Visa, Inc., 3.65%, 9/15/2047 | | | 9,718,000 | | | | 11,852,456 | |
| Western Union Co., 2.85%, 1/10/2025 | | | 10,521,000 | | | | 10,421,618 | |
| | | | | | | | |
| | | | | | | $ | 174,019,199 | |
| Containers - 0.5% | | | | | | |
| Ball Corp., 4%, 11/15/2023 | | $ | 11,867,000 | | | $ | 12,276,412 | |
| Ball Corp., 5.25%, 7/01/2025 | | | 5,467,000 | | | | 6,041,035 | |
| Ball Corp., 4.875%, 3/15/2026 | | | 8,127,000 | | | | 8,736,525 | |
| | | | | | | | |
| | | | | | | $ | 27,053,972 | |
| Electrical Equipment - 0.7% | | | | | | |
| Arrow Electronics, Inc., 3.25%, 9/08/2024 | | $ | 16,437,000 | | | $ | 16,591,797 | |
| Arrow Electronics, Inc., 3.875%, 1/12/2028 | | | 17,987,000 | | | | 17,998,933 | |
| | | | | | | | |
| | | | | | | $ | 34,590,730 | |
| Electronics - 2.6% | | | | | | |
| Broadcom Corp./Broadcom Cayman Finance Ltd., 3.875%, 1/15/2027 | | $ | 51,503,000 | | | $ | 53,690,772 | |
| Broadcom Corp./Broadcom Cayman Finance Ltd., 3.5%, 1/15/2028 | | | 11,864,000 | | | | 12,017,608 | |
| Broadcom, Inc., 4.25%, 4/15/2026 (n) | | | 23,498,000 | | | | 25,183,596 | |
| Sensata Technologies, Inc., 4.375%, 2/15/2030 (n) | | | 30,720,000 | | | | 29,798,400 | |
| Texas Instruments, Inc., 2.25%, 9/04/2029 | | | 10,428,000 | | | | 10,848,887 | |
| | | | | | | | |
| | | | | | | $ | 131,539,263 | |
| Energy - Integrated - 1.1% | | | | | | |
| Eni S.p.A., 4.75%, 9/12/2028 (n) | | $ | 14,052,000 | | | $ | 14,720,091 | |
| Eni S.p.A., 4.25%, 5/09/2029 (n) | | | 12,206,000 | | | | 12,454,809 | |
| Exxon Mobil Corp., 4.227%, 3/19/2040 | | | 9,178,000 | | | | 11,000,972 | |
14
Portfolio of Investments – continued
| | | | | | | | |
| | |
| Issuer | | Shares/Par | | | Value ($) | |
| Bonds - continued | | | | | | |
| Energy - Integrated - continued | | | | | | |
| Exxon Mobil Corp., 3.452%, 4/15/2051 | | $ | 13,144,000 | | | $ | 14,376,644 | |
| | | | | | | | |
| | | | | | | $ | 52,552,516 | |
| Entertainment - 0.3% | | | | | | |
| Royal Caribbean Cruises Ltd., 3.7%, 3/15/2028 | | $ | 22,622,000 | | | $ | 14,803,835 | |
| | |
| Financial Institutions - 1.4% | | | | | | |
| AerCap Ireland Capital DAC, 4.875%, 1/16/2024 | | $ | 11,687,000 | | | $ | 10,847,765 | |
| AerCap Ireland Capital DAC, 3.65%, 7/21/2027 | | | 29,033,000 | | | | 24,438,598 | |
| Avolon Holdings Funding Ltd., 4.375%, 5/01/2026 (n) | | | 11,590,000 | | | | 9,932,047 | |
| Avolon Holdings Funding Ltd., 3.25%, 2/15/2027 (n) | | | 13,674,000 | | | | 10,582,643 | |
| International Lease Finance Corp., 5.875%, 8/15/2022 | | | 13,000,000 | | | | 12,689,849 | |
| | | | | | | | |
| | | | | | | $ | 68,490,902 | |
| Food & Beverages - 4.7% | | | | | | |
| Anheuser-Busch InBev Worldwide, Inc., 4.375%, 4/15/2038 | | $ | 8,822,000 | | | $ | 9,499,909 | |
| Anheuser-Busch InBev Worldwide, Inc., 5.55%, 1/23/2049 | | | 10,639,000 | | | | 13,301,564 | |
| Campbell Soup Co., 2.375%, 4/24/2030 | | | 4,704,000 | | | | 4,774,115 | |
| Campbell Soup Co., 3.125%, 4/24/2050 | | | 6,884,000 | | | | 6,868,217 | |
| Constellation Brands, Inc., 3.2%, 2/15/2023 | | | 17,602,000 | | | | 18,334,740 | |
| Constellation Brands, Inc., 4.25%, 5/01/2023 | | | 37,599,000 | | | | 40,298,549 | |
| Constellation Brands, Inc., 2.875%, 5/01/2030 | | | 4,163,000 | | | | 4,231,901 | |
| Constellation Brands, Inc., 3.75%, 5/01/2050 | | | 5,973,000 | | | | 6,073,907 | |
| Danone S.A., 2.077%, 11/02/2021 (n) | | | 11,063,000 | | | | 11,184,436 | |
| Danone S.A., 2.589%, 11/02/2023 (n) | | | 23,885,000 | | | | 24,753,204 | |
| Diageo Capital PLC, 2.375%, 10/24/2029 | | | 21,271,000 | | | | 21,943,167 | |
| Diageo Capital PLC, 2%, 4/29/2030 | | | 21,083,000 | | | | 21,038,153 | |
| JBS USA LLC/JBS USA Finance, Inc., 6.75%, 2/15/2028 (n) | | | 17,787,000 | | | | 19,048,810 | |
| JBS USA Lux S.A./JBS USA Finance, Inc., 6.5%, 4/15/2029 (n) | | | 13,224,000 | | | | 13,984,512 | |
| Keurig Dr Pepper, Inc., 3.2%, 5/01/2030 | | | 2,379,000 | | | | 2,534,461 | |
| Keurig Dr Pepper, Inc., 3.8%, 5/01/2050 | | | 4,914,000 | | | | 5,234,983 | |
| PepsiCo, Inc., 3.5%, 3/19/2040 | | | 10,448,000 | | | | 12,250,009 | |
| | | | | | | | |
| | | | | | | $ | 235,354,637 | |
| Gaming & Lodging - 2.1% | | | | | | |
| GLP Capital LP/GLP Financing II, Inc., 5.75%, 6/01/2028 | | $ | 24,600,000 | | | $ | 24,231,000 | |
| GLP Capital LP/GLP Financing II, Inc., 5.3%, 1/15/2029 | | | 5,895,000 | | | | 5,655,663 | |
| Hilton Domestic Operating Co., Inc., 4.875%, 1/15/2030 | | | 17,700,000 | | | | 16,903,500 | |
| Las Vegas Sands Corp., 3.9%, 8/08/2029 | | | 16,926,000 | | | | 15,570,641 | |
| Marriott International, Inc., 5.75%, 5/01/2025 | | | 2,086,000 | | | | 2,180,007 | |
| Marriott International, Inc., 3.75%, 10/01/2025 | | | 8,873,000 | | | | 8,378,530 | |
| Marriott International, Inc., 4%, 4/15/2028 | | | 33,912,000 | | | | 31,922,715 | |
| | | | | | | | |
| | | | | | | $ | 104,842,056 | |
15
Portfolio of Investments – continued
| | | | | | | | |
| | |
| Issuer | | Shares/Par | | | Value ($) | |
| Bonds - continued | | | | | | |
| Insurance - 0.3% | | | | | | |
| American International Group, Inc., 3.875%, 1/15/2035 | | $ | 4,195,000 | | | $ | 4,478,974 | |
| American International Group, Inc., 4.7%, 7/10/2035 | | | 7,821,000 | | | | 9,026,918 | |
| | | | | | | | |
| | | | | | | $ | 13,505,892 | |
| Insurance - Health - 1.0% | | | | | | |
| Centene Corp., 4.625%, 12/15/2029 (n) | | $ | 8,155,000 | | | $ | 8,929,725 | |
| Centene Corp., 3.375%, 2/15/2030 (n) | | | 8,010,000 | | | | 8,070,075 | |
| UnitedHealth Group, Inc., 4.625%, 7/15/2035 | | | 18,120,000 | | | | 22,812,777 | |
| UnitedHealth Group, Inc., 3.5%, 8/15/2039 | | | 6,918,000 | | | | 7,729,298 | |
| | | | | | | | |
| | | | | | | $ | 47,541,875 | |
| Insurance - Property & Casualty - 2.8% | | | | | | |
| Aon Corp., 3.75%, 5/02/2029 | | $ | 25,796,000 | | | $ | 28,285,982 | |
| Berkshire Hathaway, Inc., 2.75%, 3/15/2023 | | | 6,920,000 | | | | 7,327,795 | |
| Fairfax Financial Holdings Ltd., 4.625%, 4/29/2030 (n) | | | 27,016,000 | | | | 26,685,452 | |
| Hartford Financial Services Group, Inc., 3.6%, 8/19/2049 | | | 18,720,000 | | | | 19,849,423 | |
| Liberty Mutual Group, Inc., 3.951%, 10/15/2050 (n) | | | 5,333,000 | | | | 5,423,429 | |
| Marsh & McLennan Cos., Inc., 3.5%, 6/03/2024 | | | 6,766,000 | | | | 7,236,799 | |
| Marsh & McLennan Cos., Inc., 4.75%, 3/15/2039 | | | 13,978,000 | | | | 17,462,657 | |
| Marsh & McLennan Cos., Inc., 4.35%, 1/30/2047 | | | 6,467,000 | | | | 8,007,257 | |
| Progressive Corp., 3.95%, 3/26/2050 | | | 6,881,000 | | | | 8,647,090 | |
| Willis North America, Inc., 2.95%, 9/15/2029 | | | 10,826,000 | | | | 11,001,551 | |
| | | | | | | | |
| | | | | | | $ | 139,927,435 | |
| Machinery & Tools - 0.9% | | | | | | |
| Caterpillar, Inc., 3.25%, 4/09/2050 | | $ | 16,258,000 | | | $ | 17,819,490 | |
| CNH Industrial Capital LLC, 4.2%, 1/15/2024 | | | 9,230,000 | | | | 9,632,189 | |
| CNH Industrial Capital LLC, 3.85%, 11/15/2027 | | | 16,974,000 | | | | 16,914,201 | |
| | | | | | | | |
| | | | | | | $ | 44,365,880 | |
| Major Banks - 13.1% | | | | | | |
| Bank of America Corp., 2.738% to 1/23/2021, FLR (LIBOR - 3mo. + 2.738%) to 1/23/2022 | | $ | 35,281,000 | | | $ | 35,499,473 | |
| Bank of America Corp., 3.124% to 1/20/2022, FLR (LIBOR - 3mo. + 1.16%) to 1/20/2023 | | | 17,201,000 | | | | 17,655,966 | |
| Bank of America Corp., 3.004%, 12/20/2023 | | | 1,782,000 | | | | 1,841,611 | |
| Bank of America Corp., 4.125%, 1/22/2024 | | | 14,866,000 | | | | 16,133,206 | |
| Bank of America Corp., 4.45%, 3/03/2026 | | | 4,537,000 | | | | 5,007,732 | |
| Bank of America Corp., 3.5%, 4/19/2026 | | | 19,080,000 | | | | 20,744,945 | |
| Bank of America Corp., 4.183%, 11/25/2027 | | | 25,000,000 | | | | 27,254,728 | |
| Bank of America Corp., 3.419% to 12/20/2027, FLR (LIBOR - 3mo. + 1.04%) to 12/20/2028 | | | 15,825,000 | | | | 16,984,534 | |
| Bank of America Corp., 3.97% to 3/5/2028, FLR (LIBOR - 3mo. + 1.07%) to 3/05/2029 | | | 7,314,000 | | | | 8,138,293 | |
16
Portfolio of Investments – continued
| | | | | | | | |
| | |
| Issuer | | Shares/Par | | | Value ($) | |
| Bonds - continued | | | | | | |
| Major Banks - continued | | | | | | |
| Bank of America Corp., 2.496% to 2/13/2030, FLR (LIBOR - 3mo. + 0.99%) to 2/13/2031 | | $ | 44,479,000 | | | $ | 45,033,342 | |
| Bank of America Corp., 6.1% to 3/17/2025, FLR (LIBOR - 3mo. + 3.898%) to 12/29/2049 | | | 18,007,000 | | | | 19,062,210 | |
| Bank of America Corp., 5.875% to 3/15/2028, FLR (LIBOR - 3mo. + 2.931%) to 12/31/2059 | | | 22,420,000 | | | | 22,872,211 | |
| Bank of New York Mellon Corp., 2.95%, 1/29/2023 | | | 52,612,000 | | | | 55,144,317 | |
| HSBC Holdings PLC, 4.375%, 11/23/2026 | | | 10,488,000 | | | | 11,378,294 | |
| JPMorgan Chase & Co., 2.295%, 8/15/2021 | | | 15,000,000 | | | | 15,048,132 | |
| JPMorgan Chase & Co., 3.25%, 9/23/2022 | | | 30,989,000 | | | | 32,428,491 | |
| JPMorgan Chase & Co., 3.2%, 6/15/2026 | | | 9,000,000 | | | | 9,592,959 | |
| JPMorgan Chase & Co., 3.782% to 2/01/2027, FLR (LIBOR - 3mo. + 1.337%) to 2/01/2028 | | | 35,000,000 | | | | 38,250,234 | |
| JPMorgan Chase & Co., 3.54%, 5/01/2028 | | | 18,887,000 | | | | 20,357,655 | |
| JPMorgan Chase & Co., 3.964%, 11/15/2048 | | | 12,400,000 | | | | 14,667,226 | |
| JPMorgan Chase & Co., 3.897% to 1/23/2048, FLR (LIBOR - 3mo. + 1.22%) to 1/23/2049 | | | 20,011,000 | | | | 23,345,986 | |
| JPMorgan Chase & Co., 6.75% to 2/01/2024, FLR (LIBOR - 3mo. + 3.78%) to 1/29/2049 | | | 15,247,000 | | | | 16,368,874 | |
| Morgan Stanley, 3.125%, 1/23/2023 | | | 22,096,000 | | | | 22,982,820 | |
| Morgan Stanley, 4.431% to 1/23/2029, FLR (LIBOR - 3mo. + 1.63%) to 1/23/2030 | | | 8,224,000 | | | | 9,511,978 | |
| Morgan Stanley, 2.699% to 1/22/2030, FLR (SOFR + 1.143%) to 1/22/2031 | | | 36,469,000 | | | | 37,265,810 | |
| Morgan Stanley, 3.622% to 4/1/2030, FLR (SOFR + 3.12%) to 4/01/2031 | | | 25,610,000 | | | | 28,105,033 | |
| PNC Bank N.A., 2.7%, 10/22/2029 | | | 14,140,000 | | | | 14,637,373 | |
| Royal Bank of Canada, 2.55%, 7/16/2024 | | | 57,450,000 | | | | 59,257,791 | |
| Wachovia Corp., 6.605%, 10/01/2025 | | | 7,936,000 | | | | 9,226,029 | |
| | | | | | | | |
| | | | | | | $ | 653,797,253 | |
| Medical & Health Technology & Services - 4.3% | | | | | | |
| Alcon, Inc., 3.8%, 9/23/2049 (n) | | $ | 5,170,000 | | | $ | 5,624,930 | |
| Becton, Dickinson and Co., 3.734%, 12/15/2024 | | | 1,460,000 | | | | 1,576,648 | |
| Becton, Dickinson and Co., 4.685%, 12/15/2044 | | | 7,796,000 | | | | 9,473,263 | |
| Becton, Dickinson and Co., 4.669%, 6/06/2047 | | | 26,561,000 | | | | 33,248,572 | |
| Cigna Corp., 4.125%, 11/15/2025 | | | 17,420,000 | | | | 19,530,919 | |
| Cigna Corp., 3.2%, 3/15/2040 | | | 5,994,000 | | | | 6,086,237 | |
| HCA, Inc., 4.75%, 5/01/2023 | | | 7,090,000 | | | | 7,556,814 | |
| HCA, Inc., 5.25%, 6/15/2026 | | | 8,407,000 | | | | 9,373,496 | |
| HCA, Inc., 5.875%, 2/01/2029 | | | 8,893,000 | | | | 10,189,599 | |
| HCA, Inc., 3.5%, 9/01/2030 | | | 4,369,000 | | | | 4,176,123 | |
| HCA, Inc., 5.125%, 6/15/2039 | | | 3,223,000 | | | | 3,758,968 | |
17
Portfolio of Investments – continued
| | | | | | | | |
| | |
| Issuer | | Shares/Par | | | Value ($) | |
| Bonds - continued | | | | | | |
| Medical & Health Technology & Services - continued | | | | | | |
| IQVIA Holdings, Inc., 5%, 5/15/2027 (n) | | $ | 19,833,000 | | | $ | 20,372,259 | |
| Laboratory Corp. of America Holdings, 3.25%, 9/01/2024 | | | 16,049,000 | | | | 17,287,950 | |
| Laboratory Corp. of America Holdings, 3.6%, 2/01/2025 | | | 4,792,000 | | | | 5,190,962 | |
| Laboratory Corp. of America Holdings, 4.7%, 2/01/2045 | | | 8,278,000 | | | | 10,039,326 | |
| Thermo Fisher Scientific, Inc., 3%, 4/15/2023 | | | 9,452,000 | | | | 9,931,327 | |
| Thermo Fisher Scientific, Inc., 2.95%, 9/19/2026 | | | 14,540,000 | | | | 15,732,518 | |
| Thermo Fisher Scientific, Inc., 4.497%, 3/25/2030 | | | 20,000,000 | | | | 24,314,289 | |
| | | | | | | | |
| | | | | | | $ | 213,464,200 | |
| Medical Equipment - 1.3% | | | | | | |
| Abbott Laboratories, 4.75%, 11/30/2036 | | $ | 21,877,000 | | | $ | 28,600,111 | |
| Boston Scientific Corp., 3.75%, 3/01/2026 | | | 10,442,000 | | | | 11,380,900 | |
| Teleflex, Inc., 4.625%, 11/15/2027 | | | 2,045,000 | | | | 2,096,125 | |
| Zimmer Biomet Holdings, Inc., 3.55%, 4/01/2025 | | | 20,267,000 | | | | 21,071,685 | |
| | | | | | | | |
| | | | | | | $ | 63,148,821 | |
| Metals & Mining - 0.8% | | | | | | |
| Glencore Funding LLC, 3%, 10/27/2022 (n) | | $ | 2,911,000 | | | $ | 2,888,149 | |
| Glencore Funding LLC, 4.125%, 5/30/2023 (n) | | | 11,974,000 | | | | 12,113,706 | |
| Steel Dynamics, Inc., 5%, 12/15/2026 | | | 21,989,000 | | | | 22,596,404 | |
| | | | | | | | |
| | | | | | | $ | 37,598,259 | |
| Midstream - 3.0% | | | | | | |
| Cheniere Energy, Inc., 4.5%, 10/01/2029 (n) | | $ | 4,186,000 | | | $ | 3,861,585 | |
| Cheniere Energy, Inc., 3.7%, 11/15/2029 (n) | | | 10,673,000 | | | | 9,765,196 | |
| Enterprise Products Operating LLC, 4.2%, 1/31/2050 | | | 14,055,000 | | | | 13,940,404 | |
| Enterprise Products Operating LLC, 3.7%, 1/31/2051 | | | 26,285,000 | | | | 24,658,166 | |
| Kinder Morgan (Delaware), Inc., 5.55%, 6/01/2045 | | | 8,136,000 | | | | 9,337,948 | |
| MPLX LP, 4.5%, 4/15/2038 | | | 12,937,000 | | | | 11,550,792 | |
| ONEOK, Inc., 4.95%, 7/13/2047 | | | 38,103,000 | | | | 32,017,251 | |
| Sabine Pass Liquefaction LLC, 5.625%, 4/15/2023 | | | 10,865,000 | | | | 11,330,245 | |
| Sabine Pass Liquefaction LLC, 5.875%, 6/30/2026 | | | 13,222,000 | | | | 14,112,861 | |
| Sabine Pass Liquefaction LLC, 5%, 3/15/2027 | | | 5,405,000 | | | | 5,540,555 | |
| Sabine Pass Liquefaction LLC, 4.2%, 3/15/2028 | | | 13,455,000 | | | | 13,167,087 | |
| | | | | | | | |
| | | | | | | $ | 149,282,090 | |
| Mortgage-Backed - 0.0% | | | | | | |
| Freddie Mac, 3.244%, 8/25/2027 | | $ | 1,276,000 | | | $ | 1,444,991 | |
| | |
| Municipals - 0.7% | | | | | | |
| New Jersey Economic Development Authority State Pension Funding Rev., “A”, 7.425%, 2/15/2029 | | $ | 29,000,000 | | | $ | 34,313,670 | |
18
Portfolio of Investments – continued
| | | | | | | | |
| | |
| Issuer | | Shares/Par | | | Value ($) | |
| Bonds - continued | | | | | | |
| Natural Gas - Distribution - 2.0% | | | | | | |
| NiSource Finance Corp., 3.85%, 2/15/2023 | | $ | 10,894,000 | | | $ | 11,434,582 | |
| NiSource Finance Corp., 4.8%, 2/15/2044 | | | 4,239,000 | | | | 5,248,902 | |
| NiSource, Inc., 2.95%, 9/01/2029 | | | 27,307,000 | | | | 28,651,992 | |
| NiSource, Inc., 5.65%, 2/01/2045 | | | 8,731,000 | | | | 12,132,869 | |
| Sempra Energy, 3.25%, 6/15/2027 | | | 42,879,000 | | | | 44,830,673 | |
| | | | | | | | |
| | | | | | | $ | 102,299,018 | |
| Natural Gas - Pipeline - 0.4% | | | | | | |
| APT Pipelines Ltd., 4.25%, 7/15/2027 (n) | | $ | 5,122,000 | | | $ | 5,365,098 | |
| APT Pipelines Ltd., 5%, 3/23/2035 (n) | | | 12,850,000 | | | | 14,151,176 | |
| | | | | | | | |
| | | | | | | $ | 19,516,274 | |
| Network & Telecom - 1.8% | | | | | | |
| AT&T, Inc., 3.8%, 3/01/2024 | | $ | 15,387,000 | | | $ | 16,432,955 | |
| AT&T, Inc., 4.5%, 5/15/2035 | | | 13,000,000 | | | | 14,553,672 | |
| AT&T, Inc., 5.35%, 12/15/2043 | | | 4,056,000 | | | | 4,962,848 | |
| AT&T, Inc., 5.15%, 11/15/2046 | | | 11,464,000 | | | | 13,762,144 | |
| Verizon Communications, Inc., 4.812%, 3/15/2039 | | | 20,000,000 | | | | 25,725,543 | |
| Verizon Communications, Inc., 4%, 3/22/2050 | | | 13,120,000 | | | | 16,342,976 | |
| | | | | | | | |
| | | | | | | $ | 91,780,138 | |
| Oils - 1.0% | | | | | | |
| Marathon Petroleum Corp., 4.75%, 9/15/2044 | | $ | 11,210,000 | | | $ | 10,188,814 | |
| Valero Energy Corp., 3.4%, 9/15/2026 | | | 20,305,000 | | | | 20,218,493 | |
| Valero Energy Corp., 4.9%, 3/15/2045 | | | 17,086,000 | | | | 18,311,061 | |
| | | | | | | | |
| | | | | | | $ | 48,718,368 | |
| Other Banks & Diversified Financials - 0.5% | | | | | | |
| Branch Banking & Trust Co., 2.25%, 3/11/2030 | | $ | 18,575,000 | | | $ | 18,076,566 | |
| Groupe BPCE S.A., 4.5%, 3/15/2025 (n) | | | 6,746,000 | | | | 7,104,195 | |
| | | | | | | | |
| | | | | | | $ | 25,180,761 | |
| Personal Computers & Peripherals - 0.6% | | | | | | |
| Equifax, Inc., 2.6%, 12/01/2024 | | $ | 18,674,000 | | | $ | 18,941,521 | |
| Equifax, Inc., 3.1%, 5/15/2030 | | | 12,869,000 | | | | 12,984,297 | |
| | | | | | | | |
| | | | | | | $ | 31,925,818 | |
| Pharmaceuticals - 0.5% | | | | | | |
| Elanco Animal Health, Inc., 5.65%, 8/28/2028 | | $ | 24,093,000 | | | $ | 26,682,998 | |
| | |
| Pollution Control - 0.9% | | | | | | |
| Republic Services, Inc., 5.25%, 11/15/2021 | | $ | 6,200,000 | | | $ | 6,578,120 | |
| Republic Services, Inc., 2.5%, 8/15/2024 | | | 13,800,000 | | | | 14,368,144 | |
| Republic Services, Inc., 3.95%, 5/15/2028 | | | 22,233,000 | | | | 25,360,787 | |
| | | | | | | | |
| | | | | | | $ | 46,307,051 | |
19
Portfolio of Investments – continued
| | | | | | | | |
| | |
| Issuer | | Shares/Par | | | Value ($) | |
| Bonds - continued | | | | | | |
| Railroad & Shipping - 0.5% | | | | | | |
| Canadian Pacific Railway Co., 4.5%, 1/15/2022 | | $ | 4,058,000 | | | $ | 4,228,946 | |
| CSX Corp., 2.4%, 2/15/2030 | | | 18,044,000 | | | | 18,553,492 | |
| | | | | | | | |
| | | | | | | $ | 22,782,438 | |
| Real Estate - Other - 0.3% | | | | | | |
| Prologis, Inc., REIT, 2.25%, 4/15/2030 | | $ | 14,222,000 | | | $ | 14,257,955 | |
| | |
| Real Estate - Retail - 0.5% | | | | | | |
| VEREIT Operating Partnership LP, REIT, 3.1%, 12/15/2029 | | $ | 28,035,000 | | | $ | 24,004,381 | |
| | |
| Restaurants - 0.1% | | | | | | |
| McDonald’s Corp., 4.2%, 4/01/2050 | | $ | 6,100,000 | | | $ | 7,264,927 | |
| | |
| Retailers - 3.2% | | | | | | |
| Alimentation Couche-Tard, Inc., 2.95%, 1/25/2030 (n) | | $ | 9,114,000 | | | $ | 8,921,013 | |
| Alimentation Couche-Tard, Inc., 3.8%, 1/25/2050 (n) | | | 22,781,000 | | | | 21,378,424 | |
| Costco Wholesale Corp., 1.6%, 4/20/2030 | | | 17,863,000 | | | | 17,728,706 | |
| Dollar General Corp., 4.15%, 11/01/2025 | | | 5,508,000 | | | | 6,126,848 | |
| Dollar General Corp., 4.125%, 4/03/2050 | | | 18,013,000 | | | | 21,076,204 | |
| Dollar Tree, Inc., 4%, 5/15/2025 | | | 15,955,000 | | | | 17,238,068 | |
| Dollar Tree, Inc., 4.2%, 5/15/2028 | | | 7,633,000 | | | | 8,219,101 | |
| Home Depot, Inc., 3%, 4/01/2026 | | | 7,218,000 | | | | 7,902,837 | |
| Home Depot, Inc., 3.3%, 4/15/2040 | | | 26,138,000 | | | | 28,558,424 | |
| Home Depot, Inc., 4.875%, 2/15/2044 | | | 8,313,000 | | | | 10,965,964 | |
| Target Corp., 2.65%, 9/15/2030 | | | 8,801,000 | | | | 9,446,722 | |
| | | | | | | | |
| | | | | | | $ | 157,562,311 | |
| Specialty Chemicals - 0.1% | | | | | | |
| Ecolab, Inc., 4.35%, 12/08/2021 | | $ | 3,263,000 | | | $ | 3,452,738 | |
| | |
| Specialty Stores - 0.3% | | | | | | |
| TJX Cos., Inc., 3.875%, 4/15/2030 | | $ | 8,351,000 | | | $ | 9,337,965 | |
| TJX Cos., Inc., 4.5%, 4/15/2050 | | | 5,902,000 | | | | 7,272,791 | |
| | | | | | | | |
| | | | | | | $ | 16,610,756 | |
| Telecommunications - Wireless - 3.5% | | | | | | |
| American Tower Corp., REIT, 4.7%, 3/15/2022 | | $ | 7,973,000 | | | $ | 8,457,545 | |
| American Tower Corp., REIT, 3.5%, 1/31/2023 | | | 3,999,000 | | | | 4,226,142 | |
| American Tower Corp., REIT, 3%, 6/15/2023 | | | 19,876,000 | | | | 20,770,003 | |
| American Tower Corp., REIT, 4%, 6/01/2025 | | | 12,172,000 | | | | 13,404,067 | |
| American Tower Corp., REIT, 3.6%, 1/15/2028 | | | 21,944,000 | | | | 24,025,260 | |
| American Tower Corp., REIT, 3.8%, 8/15/2029 | | | 10,621,000 | | | | 11,872,712 | |
| Crown Castle International Corp., 5.25%, 1/15/2023 | | | 4,570,000 | | | | 4,987,918 | |
| Crown Castle International Corp., 3.15%, 7/15/2023 | | | 16,889,000 | | | | 17,691,653 | |
20
Portfolio of Investments – continued
| | | | | | | | |
| | |
| Issuer | | Shares/Par | | | Value ($) | |
| Bonds - continued | | | | | | |
| Telecommunications - Wireless - continued | | | | | | |
| Crown Castle International Corp., 4.45%, 2/15/2026 | | $ | 15,364,000 | | | $ | 17,251,859 | |
| Crown Castle International Corp., 4%, 3/01/2027 | | | 9,286,000 | | | | 10,275,707 | |
| Crown Castle International Corp., 3.65%, 9/01/2027 | | | 8,862,000 | | | | 9,654,066 | |
| T-Mobile USA, Inc., 4.75%, 2/01/2028 | | | 9,336,000 | | | | 9,802,987 | |
| T-Mobile USA, Inc., 4.5%, 4/15/2050 (n) | | | 20,774,000 | | | | 24,313,889 | |
| | | | | | | | |
| | | | | | | $ | 176,733,808 | |
| Telephone Services - 0.5% | | | | | | |
| Deutsche Telekom AG, 3.625%, 1/21/2050 (n) | | $ | 21,146,000 | | | $ | 23,230,345 | |
| | |
| Tobacco - 0.7% | | | | | | |
| B.A.T Capital Corp., 4.906%, 4/02/2030 | | $ | 28,095,000 | | | $ | 31,626,945 | |
| Reynolds American, Inc., 4%, 6/12/2022 | | | 5,408,000 | | | | 5,626,445 | |
| | | | | | | | |
| | | | | | | $ | 37,253,390 | |
| Transportation - Services - 0.1% | | | | | | |
| ERAC USA Finance LLC, 7%, 10/15/2037 (n) | | $ | 4,480,000 | | | $ | 5,756,593 | |
| | |
| U.S. Treasury Obligations - 2.3% | | | | | | |
| U.S. Treasury Bonds, 3.5%, 2/15/2039 (f) | | $ | 7,664,000 | | | $ | 11,012,809 | |
| U.S. Treasury Bonds, 3%, 2/15/2048 | | | 72,267,100 | | | | 101,450,587 | |
| | | | | | | | |
| | | | | | | $ | 112,463,396 | |
| Utilities - Electric Power - 8.6% | | | | | | |
| Berkshire Hathaway Energy, 4.5%, 2/01/2045 | | $ | 5,432,000 | | | $ | 7,062,190 | |
| Duke Energy Carolinas LLC, 2.45%, 2/01/2030 | | | 27,869,000 | | | | 29,687,339 | |
| Duke Energy Corp., 3.75%, 9/01/2046 | | | 11,123,000 | | | | 12,611,492 | |
| Duke Energy Corp., 4.2%, 6/15/2049 | | | 27,233,000 | | | | 33,055,615 | |
| Duke Energy Progress LLC, 3.45%, 3/15/2029 | | | 11,143,000 | | | | 12,658,951 | |
| EDP Finance B.V., 3.625%, 7/15/2024 (n) | | | 10,744,000 | | | | 11,297,002 | |
| Enel Finance International N.V., 2.75%, 4/06/2023 (n) | | | 34,129,000 | | | | 34,453,580 | |
| Enel Finance International N.V., 2.65%, 9/10/2024 | | | 35,433,000 | | | | 35,584,124 | |
| Enel Finance International N.V., 3.625%, 5/25/2027 (n) | | | 8,585,000 | | | | 8,983,422 | |
| Enel Finance International N.V., 4.75%, 5/25/2047 (n) | | | 9,461,000 | | | | 10,944,425 | |
| Evergy, Inc., 2.9%, 9/15/2029 | | | 30,865,000 | | | | 31,643,412 | |
| Eversource Energy, 2.9%, 10/01/2024 | | | 18,060,000 | | | | 18,886,042 | |
| Exelon Corp., 3.497%, 6/01/2022 | | | 17,819,000 | | | | 18,360,089 | |
| FirstEnergy Corp., 3.9%, 7/15/2027 | | | 9,834,000 | | | | 10,825,147 | |
| FirstEnergy Corp., 3.4%, 3/01/2050 | | | 21,588,000 | | | | 22,989,562 | |
| Georgia Power Co., 3.7%, 1/30/2050 | | | 2,816,000 | | | | 3,186,109 | |
| NextEra Energy Capital Holdings, Inc., 3.15%, 4/01/2024 | | | 11,886,000 | | | | 12,612,234 | |
| NextEra Energy Capital Holdings, Inc., 3.55%, 5/01/2027 | | | 20,319,000 | | | | 22,359,778 | |
| NextEra Energy Operating Co., 4.5%, 9/15/2027 (n) | | | 12,862,000 | | | | 13,199,628 | |
| NextEra Energy, Inc., 4.25%, 7/15/2024 (n) | | | 6,958,000 | | | | 7,081,852 | |
21
Portfolio of Investments – continued
| | | | | | | | |
| | |
| Issuer | | Shares/Par | | | Value ($) | |
| Bonds - continued | | | | | | |
| Utilities - Electric Power - continued | | | | | | |
| PPL Capital Funding, Inc., 5%, 3/15/2044 | | $ | 3,193,000 | | | $ | 3,791,938 | |
| Southern Co., 2.95%, 7/01/2023 | | | 6,880,000 | | | | 7,252,830 | |
| Southern Co., 3.7%, 4/30/2030 | | | 31,250,000 | | | | 34,641,092 | |
| Virginia Electric & Power Co., 2.875%, 7/15/2029 | | | 11,354,000 | | | | 12,222,472 | |
| Xcel Energy, Inc., 2.6%, 12/01/2029 | | | 9,180,000 | | | | 9,553,202 | |
| Xcel Energy, Inc., 3.5%, 12/01/2049 | | | 5,510,000 | | | | 6,046,753 | |
| | | | | | | | |
| | | | | | | $ | 430,990,280 | |
| Total Bonds (Identified Cost, $4,616,541,490) | | | | | | $ | 4,891,622,359 | |
| | |
| Investment Companies (h) - 1.3% | | | | | | |
| Money Market Funds - 1.3% | | | | | | |
| MFS Institutional Money Market Portfolio, 0.41% (v) (Identified Cost, $64,112,840) | | | 64,112,958 | | | $ | 64,119,369 | |
| | |
| Other Assets, Less Liabilities - 0.9% | | | | | 46,689,605 | |
| Net Assets - 100.0% | | | | | | $ | 5,002,431,333 | |
| (f) | All or a portion of the security has been segregated as collateral for open futures contracts. |
| (h) | An affiliated issuer, which may be considered one in which the fund owns 5% or more of the outstanding voting securities, or a company which is under common control. At period end, the aggregate values of the fund’s investments in affiliated issuers and in unaffiliated issuers were $64,119,369 and $4,891,622,359, respectively. |
| (i) | Interest only security for which the fund receives interest on notional principal (Par amount). Par amount shown is the notional principal and does not reflect the cost of the security. |
| (n) | Securities exempt from registration under Rule 144A of the Securities Act of 1933. These securities may be sold in the ordinary course of business in transactions exempt from registration, normally to qualified institutional buyers. At period end, the aggregate value of these securities was $845,318,909, representing 16.9% of net assets. |
| (v) | Affiliated issuer that is available only to investment companies managed by MFS. The rate quoted for the MFS Institutional Money Market Portfolio is the annualizedseven-day yield of the fund at period end. |
The following abbreviations are used in this report and are defined:
| FLR | | Floating Rate. Interest rate resets periodically based on the parenthetically disclosed reference rate plus a spread (if any). Theperiod-end rate reported may not be the current rate. All reference rates are USD unless otherwise noted. |
| LIBOR | | London Interbank Offered Rate |
| REIT | | Real Estate Investment Trust |
| SOFR | | Secured Overnight Financing Rate |
22
Portfolio of Investments – continued
Derivative Contracts at 4/30/20
Futures Contracts
| | | | | | | | | | | | | | | | | | | | | | |
| Description | | Long/
Short | | | Currency | | | Contracts | | Notional
Amount | | | Expiration
Date | | | Value/
Unrealized
Appreciation
(Depreciation) | |
| Asset Derivatives | | | | | | | | | | | | | | | | | | | | | | |
| | | | | | |
| Interest Rate Futures | | | | | | | | | | | | | | | | | | | | | | |
| U.S. Treasury Bond | | | Long | | | | USD | | | 1,400 | | | $253,443,750 | | | | June - 2020 | | | | $19,985,322 | |
| U.S. Treasury Note 2 yr | | | Long | | | | USD | | | 1,400 | | | 308,601,562 | | | | June - 2020 | | | | 4,495,553 | |
| | | | | | | | | | | | | | | | | | | | | | |
| | | | | | | | | | | | | | | | | | | | | $24,480,875 | |
| | | | | | | | | | | | | | | | | | | | | | |
| Liability Derivatives | | | | | | | | | | | | | | | | | | | | | | |
| | | | | | |
| Interest Rate Futures | | | | | | | | | | | | | | | | | | | | | | |
| U.S. Treasury Note 10 yr | | | Short | | | | USD | | | 2,850 | | | $396,328,125 | | | | June - 2020 | | | | $(16,704,924 | ) |
| U.S. Treasury Ultra Note 10 yr | | | Short | | | | USD | | | 1,100 | | | 172,734,375 | | | | June - 2020 | | | | (10,797,522 | ) |
| | | | | | | | | | | | | | | | | | | | | | |
| | | | | | | | | | | | | | | | | | | | | $(27,502,446 | ) |
| | | | | | | | | | | | | | | | | | | | | | |
At April 30, 2020, the fund had liquid securities with an aggregate value of $3,569,384 to cover any collateral or margin obligations for certain derivative contracts.
See Notes to Financial Statements
23
Financial Statements
STATEMENT OF ASSETS AND LIABILITIES
At 4/30/20
This statement represents your fund’s balance sheet, which details the assets and liabilities comprising the total value of the fund.
| | | | |
| Assets | | | | |
Investments in unaffiliated issuers, at value (identified cost, $4,616,541,490) | | | $4,891,622,359 | |
Investments in affiliated issuers, at value (identified cost, $64,112,840) | | | 64,119,369 | |
Receivables for | | | | |
Investments sold | | | 51,099,141 | |
Fund shares sold | | | 16,219,936 | |
Interest and dividends | | | 42,820,039 | |
Other assets | | | 10,219 | |
Total assets | | | $5,065,891,063 | |
| |
| Liabilities | | | | |
Payables for | | | | |
Distributions | | | $779,894 | |
Net daily variation margin on open futures contracts | | | 835,939 | |
Investments purchased | | | 37,890,403 | |
Fund shares reacquired | | | 21,644,885 | |
Payable to affiliates | | | | |
Investment adviser | | | 101,216 | |
Administrative services fee | | | 3,408 | |
Shareholder servicing costs | | | 1,829,606 | |
Distribution and service fees | | | 39,617 | |
Payable for independent Trustees’ compensation | | | 3,747 | |
Accrued expenses and other liabilities | | | 331,015 | |
Total liabilities | | | $63,459,730 | |
Net assets | | | $5,002,431,333 | |
| |
| Net assets consist of | | | | |
Paid-in capital | | | $4,714,230,147 | |
Total distributable earnings (loss) | | | 288,201,186 | |
Net assets | | | $5,002,431,333 | |
Shares of beneficial interest outstanding | | | 336,338,406 | |
24
Statement of Assets and Liabilities – continued
| | | | | | | | | | | | |
| | | |
| | | Net assets | | | Shares
outstanding | | | Net asset value
per share (a) | |
Class A | | | $1,996,170,380 | | | | 134,130,774 | | | | $14.88 | |
Class B | | | 21,384,285 | | | | 1,439,750 | | | | 14.85 | |
Class C | | | 143,987,649 | | | | 9,705,366 | | | | 14.84 | |
Class I | | | 1,306,407,213 | | | | 87,867,015 | | | | 14.87 | |
Class R1 | | | 5,970,367 | | | | 402,089 | | | | 14.85 | |
Class R2 | | | 31,345,792 | | | | 2,105,949 | | | | 14.88 | |
Class R3 | | | 165,319,332 | | | | 11,108,262 | | | | 14.88 | |
Class R4 | | | 63,775,032 | | | | 4,283,809 | | | | 14.89 | |
Class R6 | | | 1,268,071,283 | | | | 85,295,392 | | | | 14.87 | |
| (a) | Maximum offering price per share was equal to the net asset value per share for all share classes, except for Class A, for which the maximum offering price per share was $15.54 [100 / 95.75 x $14.88]. On sales of $100,000 or more, the maximum offering price of Class A shares is reduced. A contingent deferred sales charge may be imposed on redemptions of Class A, Class B, and Class C shares. Redemption price per share was equal to the net asset value per share for Classes I, R1, R2, R3, R4, and R6. |
See Notes to Financial Statements
25
Financial Statements
STATEMENT OF OPERATIONS
Year ended 4/30/20
This statement describes how much your fund earned in investment income and accrued in expenses. It also describes any gains and/or losses generated by fund operations.
| | | | |
| Net investment income (loss) | | | | |
Income | | | | |
Interest | | | $167,928,596 | |
Dividends from affiliated issuers | | | 1,852,595 | |
Other | | | 724,325 | |
Total investment income | | | $170,505,516 | |
Expenses | | | | |
Management fee | | | $17,755,127 | |
Distribution and service fees | | | 7,051,243 | |
Shareholder servicing costs | | | 3,781,236 | |
Administrative services fee | | | 569,729 | |
Independent Trustees’ compensation | | | 48,118 | |
Custodian fee | | | 199,667 | |
Shareholder communications | | | 751,462 | |
Audit and tax fees | | | 76,981 | |
Legal fees | | | 38,973 | |
Miscellaneous | | | 442,135 | |
Total expenses | | | $30,714,671 | |
Fees paid indirectly | | | (9,823 | ) |
Reduction of expenses by investment adviser and distributor | | | (516,716 | ) |
Net expenses | | | $30,188,132 | |
Net investment income (loss) | | | $140,317,384 | |
| |
| Realized and unrealized gain (loss) | | | | |
Realized gain (loss) (identified cost basis) | | | | |
Unaffiliated issuers | | | $87,328,907 | |
Affiliated issuers | | | (25,688 | ) |
Futures contracts | | | (3,939,076 | ) |
Net realized gain (loss) | | | $83,364,143 | |
Change in unrealized appreciation or depreciation | | | | |
Unaffiliated issuers | | | $208,094,724 | |
Affiliated issuers | | | 152 | |
Futures contracts | | | (3,021,571 | ) |
Net unrealized gain (loss) | | | $205,073,305 | |
Net realized and unrealized gain (loss) | | | $288,437,448 | |
Change in net assets from operations | | | $428,754,832 | |
See Notes to Financial Statements
26
Financial Statements
STATEMENTS OF CHANGES IN NET ASSETS
These statements describe the increases and/or decreases in net assets resulting from operations, any distributions, and any shareholder transactions.
| | | | | | | | |
| | | Year ended | |
| | | 4/30/20 | | | 4/30/19 | |
| Change in net assets | | | | | | |
| | |
| From operations | | | | | | | | |
Net investment income (loss) | | | $140,317,384 | | | | $140,346,096 | |
Net realized gain (loss) | | | 83,364,143 | | | | (47,314,886 | ) |
Net unrealized gain (loss) | | | 205,073,305 | | | | 159,816,185 | |
Change in net assets from operations | | | $428,754,832 | | | | $252,847,395 | |
Total distributions to shareholders | | | $(142,294,173 | ) | | | $(142,404,906 | ) |
Change in net assets from fund share transactions | | | $544,665,462 | | | | $(934,416,559 | ) |
Total change in net assets | | | $831,126,121 | | | | $(823,974,070 | ) |
| | |
| Net assets | | | | | | | | |
At beginning of period | | | 4,171,305,212 | | | | 4,995,279,282 | |
At end of period | | | $5,002,431,333 | | | | $4,171,305,212 | |
See Notes to Financial Statements
27
Financial Statements
FINANCIAL HIGHLIGHTS
The financial highlights table is intended to help you understand the fund’s financial performance for the past 5 years. Certain information reflects financial results for a single fund share. The total returns in the table represent the rate that an investor would have earned (or lost) on an investment in the fund share class (assuming reinvestment of all distributions) held for the entire period.
| | | | | | | | | | | | | | | | | | | | |
| Class A | | Year ended | |
| | | | | |
| | | 4/30/20 | | | 4/30/19 | | | 4/30/18 | | | 4/30/17 | | | 4/30/16 | |
Net asset value, beginning of period | | | $13.93 | | | | $13.52 | | | | $13.92 | | | | $13.99 | | | | $14.11 | |
|
| Income (loss) from investment operations | |
Net investment income (loss) (d) | | | $0.42 | | | | $0.43 | | | | $0.41 | | | | $0.42 | (c) | | | $0.44 | |
Net realized and unrealized gain (loss) | | | 0.96 | | | | 0.41 | | | | (0.39 | ) | | | (0.04 | ) | | | (0.06 | ) |
Total from investment operations | | | $1.38 | | | | $0.84 | | | | $0.02 | | | | $0.38 | | | | $0.38 | |
|
| Less distributions declared to shareholders | |
From net investment income | | | $(0.43 | ) | | | $(0.43 | ) | | | $(0.42 | ) | | | $(0.45 | ) | | | $(0.46 | ) |
From net realized gain | | | — | | | | — | | | | — | | | | — | | | | (0.04 | ) |
Total distributions declared to shareholders | | | $(0.43 | ) | | | $(0.43 | ) | | | $(0.42 | ) | | | $(0.45 | ) | | | $(0.50 | ) |
Net asset value, end of period (x) | | | $14.88 | | | | $13.93 | | | | $13.52 | | | | $13.92 | | | | $13.99 | |
Total return (%) (r)(s)(t)(x) | | | 10.00 | | | | 6.39 | | | | 0.08 | | | | 2.73 | (c) | | | 2.83 | |
|
Ratios (%) (to average net assets)
and Supplemental data: | |
Expenses before expense reductions (f) | | | 0.79 | | | | 0.79 | | | | 0.80 | | | | 0.81 | (c) | | | 0.83 | |
Expenses after expense reductions (f) | | | 0.77 | | | | 0.78 | | | | 0.79 | | | | 0.80 | (c) | | | 0.82 | |
Net investment income (loss) | | | 2.91 | | | | 3.16 | | | | 2.95 | | | | 3.04 | (c) | | | 3.24 | |
Portfolio turnover | | | 36 | | | | 38 | | | | 38 | | | | 28 | | | | 30 | |
Net assets at end of period (000 omitted) | | | $1,996,170 | | | | $1,654,534 | | | | $1,648,508 | | | | $1,597,201 | | | | $1,709,595 | |
See Notes to Financial Statements
28
Financial Highlights – continued
| | | | | | | | | | | | | | | | | | | | |
| Class B | | Year ended | |
| | | | | |
| | | 4/30/20 | | | 4/30/19 | | | 4/30/18 | | | 4/30/17 | | | 4/30/16 | |
Net asset value, beginning of period | | | $13.90 | | | | $13.50 | | | | $13.89 | | | | $13.96 | | | | $14.08 | |
|
| Income (loss) from investment operations | |
Net investment income (loss) (d) | | | $0.32 | | | | $0.32 | | | | $0.31 | | | | $0.32 | (c) | | | $0.34 | |
Net realized and unrealized gain (loss) | | | 0.95 | | | | 0.41 | | | | (0.39 | ) | | | (0.05 | ) | | | (0.06 | ) |
Total from investment operations | | | $1.27 | | | | $0.73 | | | | $(0.08 | ) | | | $0.27 | | | | $0.28 | |
|
| Less distributions declared to shareholders | |
From net investment income | | | $(0.32 | ) | | | $(0.33 | ) | | | $(0.31 | ) | | | $(0.34 | ) | | | $(0.36 | ) |
From net realized gain | | | — | | | | — | | | | — | | | | — | | | | (0.04 | ) |
Total distributions declared to shareholders | | | $(0.32 | ) | | | $(0.33 | ) | | | $(0.31 | ) | | | $(0.34 | ) | | | $(0.40 | ) |
Net asset value, end of period (x) | | | $14.85 | | | | $13.90 | | | | $13.50 | | | | $13.89 | | | | $13.96 | |
Total return (%) (r)(s)(t)(x) | | | 9.20 | | | | 5.53 | | | | (0.60 | ) | | | 1.96 | (c) | | | 2.06 | |
|
Ratios (%) (to average net assets)
and Supplemental data: | |
Expenses before expense reductions (f) | | | 1.54 | | | | 1.54 | | | | 1.55 | | | | 1.56 | (c) | | | 1.58 | |
Expenses after expense reductions (f) | | | 1.53 | | | | 1.53 | | | | 1.54 | | | | 1.55 | (c) | | | 1.57 | |
Net investment income (loss) | | | 2.18 | | | | 2.41 | | | | 2.20 | | | | 2.30 | (c) | | | 2.50 | |
Portfolio turnover | | | 36 | | | | 38 | | | | 38 | | | | 28 | | | | 30 | |
Net assets at end of period (000 omitted) | | | $21,384 | | | | $33,983 | | | | $47,698 | | | | $61,123 | | | | $72,298 | |
| |
| Class C | | Year ended | |
| | | | | |
| | | 4/30/20 | | | 4/30/19 | | | 4/30/18 | | | 4/30/17 | | | 4/30/16 | |
Net asset value, beginning of period | | | $13.89 | | | | $13.48 | | | | $13.88 | | | | $13.94 | | | | $14.06 | |
|
| Income (loss) from investment operations | |
Net investment income (loss) (d) | | | $0.31 | | | | $0.32 | | | | $0.31 | | | | $0.32 | (c) | | | $0.34 | |
Net realized and unrealized gain (loss) | | | 0.96 | | | | 0.42 | | | | (0.40 | ) | | | (0.04 | ) | | | (0.06 | ) |
Total from investment operations | | | $1.27 | | | | $0.74 | | | | $(0.09 | ) | | | $0.28 | | | | $0.28 | |
|
| Less distributions declared to shareholders | |
From net investment income | | | $(0.32 | ) | | | $(0.33 | ) | | | $(0.31 | ) | | | $(0.34 | ) | | | $(0.36 | ) |
From net realized gain | | | — | | | | — | | | | — | | | | — | | | | (0.04 | ) |
Total distributions declared to shareholders | | | $(0.32 | ) | | | $(0.33 | ) | | | $(0.31 | ) | | | $(0.34 | ) | | | $(0.40 | ) |
Net asset value, end of period (x) | | | $14.84 | | | | $13.89 | | | | $13.48 | | | | $13.88 | | | | $13.94 | |
Total return (%) (r)(s)(t)(x) | | | 9.21 | | | | 5.61 | | | | (0.67 | ) | | | 2.04 | (c) | | | 2.06 | |
|
Ratios (%) (to average net assets)
and Supplemental data: | |
Expenses before expense reductions (f) | | | 1.54 | | | | 1.54 | | | | 1.55 | | | | 1.56 | (c) | | | 1.58 | |
Expenses after expense reductions (f) | | | 1.53 | | | | 1.53 | | | | 1.54 | | | | 1.56 | (c) | | | 1.57 | |
Net investment income (loss) | | | 2.16 | | | | 2.41 | | | | 2.20 | | | | 2.30 | (c) | | | 2.50 | |
Portfolio turnover | | | 36 | | | | 38 | | | | 38 | | | | 28 | | | | 30 | |
Net assets at end of period (000 omitted) | | | $143,988 | | | | $143,872 | | | | $182,315 | | | | $242,889 | | | | $264,424 | |
See Notes to Financial Statements
29
Financial Highlights – continued
| | | | | | | | | | | | | | | | | | | | |
| Class I | | Year ended | |
| | | | | |
| | | 4/30/20 | | | 4/30/19 | | | 4/30/18 | | | 4/30/17 | | | 4/30/16 | |
Net asset value, beginning of period | | | $13.92 | | | | $13.51 | | | | $13.91 | | | | $13.98 | | | | $14.11 | |
|
| Income (loss) from investment operations | |
Net investment income (loss) (d) | | | $0.46 | | | | $0.46 | | | | $0.45 | | | | $0.45 | (c) | | | $0.47 | |
Net realized and unrealized gain (loss) | | | 0.96 | | | | 0.42 | | | | (0.40 | ) | | | (0.04 | ) | | | (0.06 | ) |
Total from investment operations | | | $1.42 | | | | $0.88 | | | | $0.05 | | | | $0.41 | | | | $0.41 | |
|
| Less distributions declared to shareholders | |
From net investment income | | | $(0.47 | ) | | | $(0.47 | ) | | | $(0.45 | ) | | | $(0.48 | ) | | | $(0.50 | ) |
From net realized gain | | | — | | | | — | | | | — | | | | — | | | | (0.04 | ) |
Total distributions declared to shareholders | | | $(0.47 | ) | | | $(0.47 | ) | | | $(0.45 | ) | | | $(0.48 | ) | | | $(0.54 | ) |
Net asset value, end of period (x) | | | $14.87 | | | | $13.92 | | | | $13.51 | | | | $13.91 | | | | $13.98 | |
Total return (%) (r)(s)(t)(x) | | | 10.28 | | | | 6.66 | | | | 0.33 | | | | 2.99 | (c) | | | 3.01 | |
|
Ratios (%) (to average net assets)
and Supplemental data: | |
Expenses before expense reductions (f) | | | 0.53 | | | | 0.54 | | | | 0.55 | | | | 0.56 | (c) | | | 0.57 | |
Expenses after expense reductions (f) | | | 0.52 | | | | 0.53 | | | | 0.54 | | | | 0.56 | (c) | | | 0.57 | |
Net investment income (loss) | | | 3.15 | | | | 3.40 | | | | 3.19 | | | | 3.25 | (c) | | | 3.48 | |
Portfolio turnover | | | 36 | | | | 38 | | | | 38 | | | | 28 | | | | 30 | |
Net assets at end of period (000 omitted) | | | $1,306,407 | | | | $1,021,313 | | | | $1,781,450 | | | | $2,005,193 | | | | $720,809 | |
| |
| Class R1 | | Year ended | |
| | | | | |
| | | 4/30/20 | | | 4/30/19 | | | 4/30/18 | | | 4/30/17 | | | 4/30/16 | |
Net asset value, beginning of period | | | $13.90 | | | | $13.49 | | | | $13.89 | | | | $13.95 | | | | $14.07 | |
|
| Income (loss) from investment operations | |
Net investment income (loss) (d) | | | $0.31 | | | | $0.32 | | | | $0.31 | | | | $0.32 | (c) | | | $0.34 | |
Net realized and unrealized gain (loss) | | | 0.96 | | | | 0.42 | | | | (0.40 | ) | | | (0.04 | ) | | | (0.06 | ) |
Total from investment operations | | | $1.27 | | | | $0.74 | | | | $(0.09 | ) | | | $0.28 | | | | $0.28 | |
|
| Less distributions declared to shareholders | |
From net investment income | | | $(0.32 | ) | | | $(0.33 | ) | | | $(0.31 | ) | | | $(0.34 | ) | | | $(0.36 | ) |
From net realized gain | | | — | | | | — | | | | — | | | | — | | | | (0.04 | ) |
Total distributions declared to shareholders | | | $(0.32 | ) | | | $(0.33 | ) | | | $(0.31 | ) | | | $(0.34 | ) | | | $(0.40 | ) |
Net asset value, end of period (x) | | | $14.85 | | | | $13.90 | | | | $13.49 | | | | $13.89 | | | | $13.95 | |
Total return (%) (r)(s)(t)(x) | | | 9.20 | | | | 5.60 | | | | (0.67 | ) | | | 2.04 | (c) | | | 2.06 | |
|
Ratios (%) (to average net assets)
and Supplemental data: | |
Expenses before expense reductions (f) | | | 1.54 | | | | 1.54 | | | | 1.55 | | | | 1.56 | (c) | | | 1.58 | |
Expenses after expense reductions (f) | | | 1.53 | | | | 1.53 | | | | 1.54 | | | | 1.56 | (c) | | | 1.57 | |
Net investment income (loss) | | | 2.16 | | | | 2.41 | | | | 2.20 | | | | 2.30 | (c) | | | 2.50 | |
Portfolio turnover | | | 36 | | | | 38 | | | | 38 | | | | 28 | | | | 30 | |
Net assets at end of period (000 omitted) | | | $5,970 | | | | $6,187 | | | | $6,101 | | | | $6,780 | | | | $7,145 | |
See Notes to Financial Statements
30
Financial Highlights – continued
| | | | | | | | | | | | | | | | | | | | |
| Class R2 | | Year ended | |
| | | | | |
| | | 4/30/20 | | | 4/30/19 | | | 4/30/18 | | | 4/30/17 | | | 4/30/16 | |
Net asset value, beginning of period | | | $13.93 | | | | $13.53 | | | | $13.92 | | | | $13.99 | | | | $14.11 | |
| | | | |
| Income (loss) from investment operations | | | | | | | | | | | | | | | | | |
Net investment income (loss) (d) | | | $0.39 | | | | $0.39 | | | | $0.38 | | | | $0.39 | (c) | | | $0.41 | |
Net realized and unrealized gain (loss) | | | 0.95 | | | | 0.41 | | | | (0.39 | ) | | | (0.05 | ) | | | (0.06 | ) |
Total from investment operations | | | $1.34 | | | | $0.80 | | | | $(0.01 | ) | | | $0.34 | | | | $0.35 | |
| | | | |
| Less distributions declared to shareholders | | | | | | | | | | | | | | | | | |
From net investment income | | | $(0.39 | ) | | | $(0.40 | ) | | | $(0.38 | ) | | | $(0.41 | ) | | | $(0.43 | ) |
From net realized gain | | | — | | | | — | | | | — | | | | — | | | | (0.04 | ) |
Total distributions declared to shareholders | | | $(0.39 | ) | | | $(0.40 | ) | | | $(0.38 | ) | | | $(0.41 | ) | | | $(0.47 | ) |
Net asset value, end of period (x) | | | $14.88 | | | | $13.93 | | | | $13.53 | | | | $13.92 | | | | $13.99 | |
Total return (%) (r)(s)(t)(x) | | | 9.73 | | | | 6.05 | | | | (0.09 | ) | | | 2.47 | (c) | | | 2.58 | |
| | | | |
Ratios (%) (to average net assets)
and Supplemental data: | | | | | | | | | | | | | | | | | |
Expenses before expense reductions (f) | | | 1.04 | | | | 1.04 | | | | 1.05 | | | | 1.06 | (c) | | | 1.08 | |
Expenses after expense reductions (f) | | | 1.03 | | | | 1.03 | | | | 1.04 | | | | 1.05 | (c) | | | 1.07 | |
Net investment income (loss) | | | 2.67 | | | | 2.91 | | | | 2.70 | | | | 2.79 | (c) | | | 3.00 | |
Portfolio turnover | | | 36 | | | | 38 | | | | 38 | | | | 28 | | | | 30 | |
Net assets at end of period (000 omitted) | | | $31,346 | | | | $38,593 | | | | $43,827 | | | | $49,948 | | | | $58,938 | |
| |
| Class R3 | | Year ended | |
| | | | | |
| | | 4/30/20 | | | 4/30/19 | | | 4/30/18 | | | 4/30/17 | | | 4/30/16 | |
Net asset value, beginning of period | | | $13.93 | | | | $13.52 | | | | $13.92 | | | | $13.99 | | | | $14.11 | |
|
| Income (loss) from investment operations | |
Net investment income (loss) (d) | | | $0.42 | | | | $0.43 | | | | $0.41 | | | | $0.43 | (c) | | | $0.44 | |
Net realized and unrealized gain (loss) | | | 0.96 | | | | 0.41 | | | | (0.39 | ) | | | (0.05 | ) | | | (0.06 | ) |
Total from investment operations | | | $1.38 | | | | $0.84 | | | | $0.02 | | | | $0.38 | | | | $0.38 | |
| | | | |
| Less distributions declared to shareholders | | | | | | | | | | | | | | | | | |
From net investment income | | | $(0.43 | ) | | | $(0.43 | ) | | | $(0.42 | ) | | | $(0.45 | ) | | | $(0.46 | ) |
From net realized gain | | | — | | | | — | | | | — | | | | — | | | | (0.04 | ) |
Total distributions declared to shareholders | | | $(0.43 | ) | | | $(0.43 | ) | | | $(0.42 | ) | | | $(0.45 | ) | | | $(0.50 | ) |
Net asset value, end of period (x) | | | $14.88 | | | | $13.93 | | | | $13.52 | | | | $13.92 | | | | $13.99 | |
Total return (%) (r)(s)(t)(x) | | | 10.00 | | | | 6.39 | | | | 0.08 | | | | 2.73 | (c) | | | 2.83 | |
|
Ratios (%) (to average net assets)
and Supplemental data: | |
Expenses before expense reductions (f) | | | 0.79 | | | | 0.79 | | | | 0.81 | | | | 0.81 | (c) | | | 0.83 | |
Expenses after expense reductions (f) | | | 0.78 | | | | 0.78 | | | | 0.80 | | | | 0.80 | (c) | | | 0.82 | |
Net investment income (loss) | | | 2.91 | | | | 3.16 | | | | 2.95 | | | | 3.04 | (c) | | | 3.24 | |
Portfolio turnover | | | 36 | | | | 38 | | | | 38 | | | | 28 | | | | 30 | |
Net assets at end of period (000 omitted) | | | $165,319 | | | | $163,142 | | | | $167,404 | | | | $61,292 | | | | $65,655 | |
See Notes to Financial Statements
31
Financial Highlights – continued
| | | | | | | | | | | | | | | | | | | | |
| Class R4 | | Year ended | |
| | | | | |
| | | 4/30/20 | | | 4/30/19 | | | 4/30/18 | | | 4/30/17 | | | 4/30/16 | |
Net asset value, beginning of period | | | $13.93 | | | | $13.53 | | | | $13.93 | | | | $13.99 | | | | $14.11 | |
|
| Income (loss) from investment operations | |
Net investment income (loss) (d) | | | $0.46 | | | | $0.46 | | | | $0.45 | | | | $0.46 | (c) | | | $0.48 | |
Net realized and unrealized gain (loss) | | | 0.97 | | | | 0.41 | | | | (0.40 | ) | | | (0.04 | ) | | | (0.06 | ) |
Total from investment operations | | | $1.43 | | | | $0.87 | | | | $0.05 | | | | $0.42 | | | | $0.42 | |
|
| Less distributions declared to shareholders | |
From net investment income | | | $(0.47 | ) | | | $(0.47 | ) | | | $(0.45 | ) | | | $(0.48 | ) | | | $(0.50 | ) |
From net realized gain | | | — | | | | — | | | | — | | | | — | | | | (0.04 | ) |
Total distributions declared to shareholders | | | $(0.47 | ) | | | $(0.47 | ) | | | $(0.45 | ) | | | $(0.48 | ) | | | $(0.54 | ) |
Net asset value, end of period (x) | | | $14.89 | | | | $13.93 | | | | $13.53 | | | | $13.93 | | | | $13.99 | |
Total return (%) (r)(s)(t)(x) | | | 10.35 | | | | 6.57 | | | | 0.33 | | | | 3.06 | (c) | | | 3.09 | |
|
Ratios (%) (to average net assets)
and Supplemental data: | |
Expenses before expense reductions (f) | | | 0.53 | | | | 0.54 | | | | 0.55 | | | | 0.56 | (c) | | | 0.58 | |
Expenses after expense reductions (f) | | | 0.52 | | | | 0.53 | | | | 0.54 | | | | 0.56 | (c) | | | 0.57 | |
Net investment income (loss) | | | 3.17 | | | | 3.41 | | | | 3.19 | | | | 3.29 | (c) | | | 3.49 | |
Portfolio turnover | | | 36 | | | | 38 | | | | 38 | | | | 28 | | | | 30 | |
Net assets at end of period (000 omitted) | | | $63,775 | | | | $75,519 | | | | $74,027 | | | | $169,661 | | | | $148,266 | |
| |
| Class R6 | | Year ended | |
| | | | | |
| | | 4/30/20 | | | 4/30/19 | | | 4/30/18 | | | 4/30/17 | | | 4/30/16 | |
Net asset value, beginning of period | | | $13.92 | | | | $13.51 | | | | $13.91 | | | | $13.98 | | | | $14.10 | |
|
| Income (loss) from investment operations | |
Net investment income (loss) (d) | | | $0.47 | | | | $0.47 | | | | $0.46 | | | | $0.47 | (c) | | | $0.49 | |
Net realized and unrealized gain (loss) | | | 0.96 | | | | 0.42 | | | | (0.39 | ) | | | (0.04 | ) | | | (0.06 | ) |
Total from investment operations | | | $1.43 | | | | $0.89 | | | | $0.07 | | | | $0.43 | | | | $0.43 | |
|
| Less distributions declared to shareholders | |
From net investment income | | | $(0.48 | ) | | | $(0.48 | ) | | | $(0.47 | ) | | | $(0.50 | ) | | | $(0.51 | ) |
From net realized gain | | | — | | | | — | | | | — | | | | — | | | | (0.04 | ) |
Total distributions declared to shareholders | | | $(0.48 | ) | | | $(0.48 | ) | | | $(0.47 | ) | | | $(0.50 | ) | | | $(0.55 | ) |
Net asset value, end of period (x) | | | $14.87 | | | | $13.92 | | | | $13.51 | | | | $13.91 | | | | $13.98 | |
Total return (%) (r)(s)(t)(x) | | | 10.38 | | | | 6.76 | | | | 0.43 | | | | 3.09 | (c) | | | 3.20 | |
|
Ratios (%) (to average net assets)
and Supplemental data: | |
Expenses before expense reductions (f) | | | 0.44 | | | | 0.44 | | | | 0.45 | | | | 0.46 | (c) | | | 0.46 | |
Expenses after expense reductions (f) | | | 0.43 | | | | 0.43 | | | | 0.44 | | | | 0.45 | (c) | | | 0.45 | |
Net investment income (loss) | | | 3.25 | | | | 3.51 | | | | 3.27 | | | | 3.39 | (c) | | | 3.57 | |
Portfolio turnover | | | 36 | | | | 38 | | | | 38 | | | | 28 | | | | 30 | |
Net assets at end of period (000 omitted) | | | $1,268,071 | | | | $1,034,161 | | | | $1,043,950 | | | | $58,575 | | | | $44,475 | |
See Notes to Financial Statements
32
Financial Highlights – continued
| (c) | Amount reflects aone-time reimbursement of expenses by the custodian (or former custodian) without which net investment income and performance would be lower and expenses would be higher. |
| (d) | Per share data is based on average shares outstanding. |
| (f) | Ratios do not reflect reductions from fees paid indirectly, if applicable. |
| (r) | Certain expenses have been reduced without which performance would have been lower. |
| (s) | From time to time the fund may receive proceeds from litigation settlements, without which performance would be lower. |
| (t) | Total returns do not include any applicable sales charges. |
| (x) | The net asset values and total returns have been calculated on net assets which include adjustments made in accordance with U.S. generally accepted accounting principles required at period end for financial reporting purposes. |
See Notes to Financial Statements
33
NOTES TO FINANCIAL STATEMENTS
(1) Business and Organization
MFS Corporate Bond Fund (the fund) is a diversified series of MFS Series Trust IX (the trust). The trust is organized as a Massachusetts business trust and is registered under the Investment Company Act of 1940, as amended, as anopen-end management investment company.
The fund is an investment company and accordingly follows the investment company accounting and reporting guidance of the Financial Accounting Standards Board (FASB) Accounting Standards Codification Topic 946 Financial Services – Investment Companies.
(2) Significant Accounting Policies
General– The preparation of financial statements in conformity with U.S. generally accepted accounting principles requires management to make estimates and assumptions that affect the reported amounts of assets and liabilities, and disclosure of contingent assets and liabilities at the date of the financial statements and the reported amounts of increases and decreases in net assets from operations during the reporting period. Actual results could differ from those estimates. In the preparation of these financial statements, management has evaluated subsequent events occurring after the date of the fund’s Statement of Assets and Liabilities through the date that the financial statements were issued. The fund invests in foreign securities. Investments in foreign securities are vulnerable to the effects of changes in the relative values of the local currency and the U.S. dollar and to the effects of changes in each country’s market, economic, industrial, political, regulatory, geopolitical, and other conditions.
In March 2020, the FASB issued Accounting Standards Update2020-04, Reference Rate Reform (Topic 848) – Facilitation of the Effects of Reference Rate Reform on Financial Reporting (“ASU2020-04”), which provides optional, temporary relief with respect to the financial reporting of contracts subject to certain types of modifications due to the planned discontinuation of the London Interbank Offered Rate (LIBOR) and other IBOR-based reference rates as of the end of 2021. The temporary relief provided by ASU2020-04 is effective for certain reference rate-related contract modifications that occur during the period from March 12, 2020 through December 31, 2022. Management is evaluating the impact of ASU2020-04 on the fund’s investments, derivatives, debt and other contracts that will undergo reference rate-related modifications as a result of the reference rate reform.
In March 2017, the FASB issued Accounting Standards Update 2017-08, Receivables – Nonrefundable Fees and Other Costs (Subtopic 310-20) – Premium Amortization on Purchased Callable Debt Securities (“ASU 2017-08”). For callable debt securities purchased at a premium that have explicit, non-contingent call features and that are callable at fixed prices on preset dates, ASU 2017-08 requires the premium to be amortized to the earliest call date. The fund adopted ASU 2017-08 as of the beginning of the reporting period on a modified retrospective basis. The adoption resulted in a change in accounting principle, since the fund had historically amortized such premiums to maturity for U.S. GAAP. As a result of the adoption, the fund recognized a cumulative effect adjustment that decreased the beginning of period cost of
34
Notes to Financial Statements – continued
investments and increased the unrealized appreciation on investments by offsetting amounts. Adoption had no impact on the fund’s net assets or any prior period information presented in the financial statements. With respect to the fund’s results of operations, amortization of premium to first call date under ASU 2017-08 accelerates amortization with the intent of more closely aligning the recognition of income on such bonds with the economics of the instrument.
Balance Sheet Offsetting– The fund’s accounting policy with respect to balance sheet offsetting is that, absent an event of default by the counterparty or a termination of the agreement, the International Swaps and Derivatives Association (ISDA) Master Agreement, or similar agreement, does not result in an offset of reported amounts of financial assets and financial liabilities in the Statement of Assets and Liabilities across transactions between the fund and the applicable counterparty. The fund’s right to setoff may be restricted or prohibited by the bankruptcy or insolvency laws of the particular jurisdiction to which a specific master netting agreement counterparty is subject. Balance sheet offsetting disclosures, to the extent applicable to the fund, have been included in the fund’s Significant Accounting Policies note under the captions for each of the fund’sin-scope financial instruments and transactions.
Investment Valuations– Debt instruments and floating rate loans, including restricted debt instruments, are generally valued at an evaluated or composite bid as provided by a third-party pricing service. Short-term instruments with a maturity at issuance of 60 days or less may be valued at amortized cost, which approximates market value. Futures contracts are generally valued at last posted settlement price on their primary exchange as provided by a third-party pricing service. Futures contracts for which there were no trades that day for a particular position are generally valued at the closing bid quotation on their primary exchange as provided by a third-party pricing service.Open-end investment companies are generally valued at net asset value per share. Securities and other assets generally valued on the basis of information from a third-party pricing service may also be valued at a broker/dealer bid quotation. In determining values, third-party pricing services can utilize both transaction data and market information such as yield, quality, coupon rate, maturity, type of issue, trading characteristics, and other market data. The values of foreign securities and other assets and liabilities expressed in foreign currencies are converted to U.S. dollars using the mean of bid and asked prices for rates provided by a third-party pricing service.
The Board of Trustees has delegated primary responsibility for determining or causing to be determined the value of the fund’s investments (including any fair valuation) to the adviser pursuant to valuation policies and procedures approved by the Board. If the adviser determines that reliable market quotations are not readily available, investments are valued at fair value as determined in good faith by the adviser in accordance with such procedures under the oversight of the Board of Trustees. Under the fund’s valuation policies and procedures, market quotations are not considered to be readily available for most types of debt instruments and floating rate loans and many types of derivatives. These investments are generally valued at fair value based on information from third-party pricing services. In addition, investments may be valued at fair value if the adviser determines that an investment’s value has been materially affected by events occurring after the close of the exchange or market on which the investment is principally traded (such as foreign exchange or market) and prior to the determination
35
Notes to Financial Statements – continued
of the fund’s net asset value, or after the halt of trading of a specific security where trading does not resume prior to the close of the exchange or market on which the security is principally traded. The adviser generally relies on third-party pricing services or other information (such as the correlation with price movements of similar securities in the same or other markets; the type, cost and investment characteristics of the security; the business and financial condition of the issuer; and trading and other market data) to assist in determining whether to fair value and at what value to fair value an investment. The value of an investment for purposes of calculating the fund’s net asset value can differ depending on the source and method used to determine value. When fair valuation is used, the value of an investment used to determine the fund’s net asset value may differ from quoted or published prices for the same investment. There can be no assurance that the fund could obtain the fair value assigned to an investment if it were to sell the investment at the same time at which the fund determines its net asset value per share.
Various inputs are used in determining the value of the fund’s assets or liabilities. These inputs are categorized into three broad levels. In certain cases, the inputs used to measure fair value may fall into different levels of the fair value hierarchy. In such cases, an investment’s level within the fair value hierarchy is based on the lowest level of input that is significant to the fair value measurement. The fund’s assessment of the significance of a particular input to the fair value measurement in its entirety requires judgment, and considers factors specific to the investment. Level 1 includes unadjusted quoted prices in active markets for identical assets or liabilities. Level 2 includes other significant observable market-based inputs (including quoted prices for similar securities, interest rates, prepayment speed, and credit risk). Level 3 includes unobservable inputs, which may include the adviser’s own assumptions in determining the fair value of investments. Other financial instruments are derivative instruments, such as futures contracts. The following is a summary of the levels used as of April 30, 2020 in valuing the fund’s assets or liabilities:
| | | | | | | | | | | | | | | | |
| | | | |
| Financial Instruments | | Level 1 | | | Level 2 | | | Level 3 | | | Total | |
| U.S. Treasury Bonds & U.S. Government Agencies & Equivalents | | | $— | | | | $112,463,396 | | | | $— | | | | $112,463,396 | |
| Municipal Bonds | | | — | | | | 34,313,670 | | | | — | | | | 34,313,670 | |
| U.S. Corporate Bonds | | | — | | | | 4,061,763,625 | | | | — | | | | 4,061,763,625 | |
| Residential Mortgage-Backed Securities | | | — | | | | 1,444,991 | | | | — | | | | 1,444,991 | |
| Commercial Mortgage-Backed Securities | | | — | | | | 1,079,702 | | | | — | | | | 1,079,702 | |
| Asset-Backed Securities (including CDOs) | | | — | | | | 660,795 | | | | — | | | | 660,795 | |
| Foreign Bonds | | | — | | | | 679,896,180 | | | | — | | | | 679,896,180 | |
| Mutual Funds | | | 64,119,369 | | | | — | | | | — | | | | 64,119,369 | |
| Total | | | $64,119,369 | | | | $4,891,622,359 | | | | $— | | | | $4,955,741,728 | |
| | | | |
| Other Financial Instruments | | | | | | | | | | | | |
| Futures Contracts – Assets | | | $24,480,875 | | | | $— | | | | $— | | | | $24,480,875 | |
| Futures Contracts – Liabilities | | | (27,502,446 | ) | | | — | | | | — | | | | (27,502,446 | ) |
For further information regarding security characteristics, see the Portfolio of Investments.
36
Notes to Financial Statements – continued
Derivatives– The fund uses derivatives primarily to increase or decrease exposure to a particular market or segment of the market, or security, to increase or decrease interest rate or currency exposure, or as alternatives to direct investments. Derivatives are used for hedging ornon-hedging purposes. While hedging can reduce or eliminate losses, it can also reduce or eliminate gains. When the fund uses derivatives as an investment to increase market exposure, or for hedging purposes, gains and losses from derivative instruments may be substantially greater than the derivative’s original cost.
The derivative instruments used by the fund during the period were futures contracts. Depending on the type of derivative, the fund may exit a derivative position by entering into an offsetting transaction with a counterparty or exchange, negotiating an agreement with the derivative counterparty, or novating the position to a third party. The fund may be unable to promptly close out a futures position in instances where the daily fluctuation in the price for that type of future exceeds the daily limit set by the exchange. The fund’s period end derivatives, as presented in the Portfolio of Investments and the associated Derivative Contract tables, generally are indicative of the volume of its derivative activity during the period.
The following table presents, by major type of derivative contract, the fair value, on a gross basis, of the asset and liability components of derivatives held by the fund at April 30, 2020 as reported in the Statement of Assets and Liabilities:
| | | | | | | | | | |
| | | | | Fair Value (a) | |
| | | |
| Risk | | Derivative Contracts | | Asset Derivatives | | | Liability Derivatives | |
| Interest Rate | | Interest Rate Futures | | | $24,480,875 | | | $ | (27,502,446 | ) |
| (a) | Values presented in this table for futures contracts correspond to the values reported in the fund’s Portfolio of Investments. Only the current day net variation margin for futures contracts is separately reported within the fund’s Statement of Assets and Liabilities. |
The following table presents, by major type of derivative contract, the realized gain (loss) on derivatives held by the fund for the year ended April 30, 2020 as reported in the Statement of Operations:
| | | | |
| |
| Risk | | Futures Contracts | |
| Interest Rate | | | $(3,939,076 | ) |
The following table presents, by major type of derivative contract, the change in unrealized appreciation or depreciation on derivatives held by the fund for the year ended April 30, 2020 as reported in the Statement of Operations:
| | | | |
| |
| Risk | | Futures Contracts | |
| Interest Rate | | | $(3,021,571 | ) |
Derivative counterparty credit risk is managed through formal evaluation of the creditworthiness of all potential counterparties. On certain, but not all, uncleared derivatives, the fund attempts to reduce its exposure to counterparty credit risk whenever possible by entering into an ISDA Master Agreement on a bilateral basis. The ISDA Master Agreement gives each party to the agreement the right to terminate all transactions traded under such agreement if there is a specified deterioration in the credit quality of the other party. Upon an event of default or a termination of the ISDA Master Agreement, thenon-defaulting party has the right to close out all transactions
37
Notes to Financial Statements – continued
traded under such agreement and to net amounts owed under each agreement to one net amount payable by one party to the other. This right to close out and net payments across all transactions traded under the ISDA Master Agreement could result in a reduction of the fund’s credit risk to such counterparty equal to any amounts payable by the fund under the applicable transactions, if any.
Collateral and margin requirements differ by type of derivative. For cleared derivatives (e.g., futures contracts, cleared swaps, and exchange-traded options), margin requirements are set by the clearing broker and the clearing house and collateral, in the form of cash or securities, is posted by the fund directly with the clearing broker. Collateral terms are counterparty agreement specific for uncleared derivatives (e.g., forward foreign currency exchange contracts, uncleared swap agreements, and uncleared options) and collateral, in the form of cash and securities, is held in segregated accounts with the fund’s custodian in connection with these agreements.
For derivatives traded under an ISDA Master Agreement, which contains a collateral support annex, the collateral requirements are netted across all transactions traded under such counterparty-specific agreement and an amount is posted from one party to the other to collateralize such obligations. Cash that has been segregated or delivered to cover the fund’s collateral or margin obligations under derivative contracts, if any, will be reported separately in the Statement of Assets and Liabilities as restricted cash for uncleared derivatives and/or deposits with brokers for cleared derivatives. Securities pledged as collateral or margin for the same purpose, if any, are noted in the Portfolio of Investments. The fund may be required to make payments of interest on uncovered collateral or margin obligations with the broker. Any such payments are included in “Miscellaneous” expense in the Statement of Operations.
Futures Contracts– The fund entered into futures contracts which may be used to hedge against or obtain broad market exposure, interest rate exposure, currency exposure, or to manage duration. A futures contract represents a commitment for the future purchase or sale of an asset at a specified price on a specified date.
Upon entering into a futures contract, the fund is required to deposit with the broker, either in cash or securities, an initial margin in an amount equal to a specified percentage of the notional amount of the contract. Subsequent payments (variation margin) are made or received by the fund each day, depending on the daily fluctuations in the value of the contract, and are recorded for financial statement purposes as unrealized gain or loss by the fund until the contract is closed or expires at which point the gain or loss on futures contracts is realized.
The fund bears the risk of interest rates, exchange rates or securities prices moving unexpectedly, in which case, the fund may not achieve the anticipated benefits of the futures contracts and may realize a loss. While futures contracts may present less counterparty risk to the fund since the contracts are exchange traded and the exchange’s clearinghouse guarantees payments to the broker, there is still counterparty credit risk due to the insolvency of the broker. The fund’s maximum risk of loss due to counterparty credit risk is equal to the margin posted by the fund to the broker plus any gains or minus any losses on the outstanding futures contracts.
38
Notes to Financial Statements – continued
Indemnifications– Under the fund’s organizational documents, its officers and Trustees may be indemnified against certain liabilities and expenses arising out of the performance of their duties to the fund. Additionally, in the normal course of business, the fund enters into agreements with service providers that may contain indemnification clauses. The fund’s maximum exposure under these agreements is unknown as this would involve future claims that may be made against the fund that have not yet occurred.
Investment Transactions and Income– Investment transactions are recorded on the trade date. Interest income is recorded on the accrual basis. All premium and discount is amortized or accreted for financial statement purposes in accordance with U.S. generally accepted accounting principles. Interest payments received in additional securities are recorded on theex-interest date in an amount equal to the value of the security on such date.
The fund may receive proceeds from litigation settlements. Any proceeds received from litigation involving portfolio holdings are reflected in the Statement of Operations in realized gain/loss if the security has been disposed of by the fund or in unrealized gain/loss if the security is still held by the fund. Any other proceeds from litigation not related to portfolio holdings are reflected as other income in the Statement of Operations.
Fees Paid Indirectly– The fund’s custody fee may be reduced by a credit earned under an arrangement that measures the value of U.S. dollars deposited with the custodian by the fund. The amount of the credit, for the year ended April 30, 2020, is shown as a reduction of total expenses in the Statement of Operations.
Tax Matters and Distributions– The fund intends to qualify as a regulated investment company, as defined under Subchapter M of the Internal Revenue Code, and to distribute all of its taxable income, including realized capital gains. As a result, no provision for federal income tax is required. The fund’s federal tax returns, when filed, will remain subject to examination by the Internal Revenue Service for a three year period. Management has analyzed the fund’s tax positions taken on federal and state tax returns for all open tax years and does not believe that there are any uncertain tax positions that require recognition of a tax liability. Foreign taxes, if any, have been accrued by the fund in the accompanying financial statements in accordance with the applicable foreign tax law. Foreign income taxes may be withheld by certain countries in which the fund invests. Additionally, capital gains realized by the fund on securities issued in or by certain foreign countries may be subject to capital gains tax imposed by those countries.
Distributions to shareholders are recorded on theex-dividend date. Income and capital gain distributions are determined in accordance with income tax regulations, which may differ from U.S. generally accepted accounting principles. Certain capital accounts in the financial statements are periodically adjusted for permanent differences in order to reflect their tax character. These adjustments have no impact on net assets or net asset value per share. Temporary differences which arise from recognizing certain items of income, expense, gain or loss in different periods for financial statement and tax purposes will reverse at some time in the future.
39
Notes to Financial Statements – continued
Book/tax differences primarily relate to amortization and accretion of debt securities and derivative transactions.
The tax character of distributions declared to shareholders for the last two fiscal years is as follows:
| | | | | | | | |
| | |
| | | Year ended
4/30/20 | | | Year ended
4/30/19 | |
| Ordinary income (including any short-term capital gains) | | | $142,294,173 | | | | $142,404,906 | |
The federal tax cost and the tax basis components of distributable earnings were as follows:
| | | | |
| |
| As of 4/30/20 | | | |
| |
| Cost of investments | | | $4,682,999,579 | |
| Gross appreciation | | | 328,111,149 | |
| |
| Gross depreciation | | | (58,390,571 | ) |
| Net unrealized appreciation (depreciation) | | | $269,720,578 | |
| |
| Undistributed ordinary income | | | 12,322,068 | |
| Undistributed long-term capital gain | | | 18,209,835 | |
| Other temporary differences | | | (12,051,295 | ) |
Multiple Classes of Shares of Beneficial Interest– The fund offers multiple classes of shares, which differ in their respective distribution and service fees. The fund’s income and common expenses are allocated to shareholders based on the value of settled shares outstanding of each class. The fund’s realized and unrealized gain (loss) are allocated to shareholders based on the daily net assets of each class. Dividends are declared separately for each class. Differences in per share dividend rates are generally due to differences in separate class expenses. Class B shares will convert to Class A shares approximately eight years after purchase. Class C shares will convert to Class A shares approximately ten years after purchase. The fund’s distributions declared to shareholders as reported in the Statements of Changes in Net Assets are presented by class as follows:
| | | | | | | | |
| | |
| | | Year
ended
4/30/20 | | | Year
ended
4/30/19 | |
| Class A | | | $54,493,969 | | | | $51,706,427 | |
| Class B | | | 653,854 | | | | 981,120 | |
| Class C | | | 3,216,758 | | | | 3,880,305 | |
| Class I | | | 37,011,421 | | | | 40,528,619 | |
| Class R1 | | | 147,830 | | | | 145,590 | |
| Class R2 | | | 972,399 | | | | 1,187,320 | |
| Class R3 | | | 4,962,249 | | | | 5,106,591 | |
| Class R4 | | | 2,351,769 | | | | 2,573,407 | |
| Class R6 | | | 38,483,924 | | | | 36,295,527 | |
| Total | | | $142,294,173 | | | | $142,404,906 | |
40
Notes to Financial Statements – continued
(3) Transactions with Affiliates
Investment Adviser– The fund has an investment advisory agreement with MFS to provide overall investment management and related administrative services and facilities to the fund. The management fee is computed daily and paid monthly at the following annual rates based on the fund’s average daily net assets:
| | | | |
| Up to $1.1 billion | | | 0.39 | % |
| In excess of $1.1 billion and up to $5 billion | | | 0.38 | % |
| In excess of $5 billion and up to $10 billion | | | 0.35 | % |
| In excess of $10 billion | | | 0.34 | % |
MFS has agreed in writing to reduce its management fee by a specified amount if certain MFS mutual fund assets exceed thresholds agreed to by MFS and the fund’s Board of Trustees. For the year ended April 30, 2020, this management fee reduction amounted to $465,587, which is included in the reduction of total expenses in the Statement of Operations. The management fee incurred for the year ended April 30, 2020 was equivalent to an annual effective rate of 0.37% of the fund’s average daily net assets.
Distributor– MFS Fund Distributors, Inc. (MFD), a wholly-owned subsidiary of MFS, as distributor, received $167,066 for the year ended April 30, 2020, as its portion of the initial sales charge on sales of Class A shares of the fund.
The Board of Trustees has adopted a distribution plan for certain share classes pursuant to Rule12b-1 of the Investment Company Act of 1940.
The fund’s distribution plan provides that the fund will pay MFD for services provided by MFD and financial intermediaries in connection with the distribution and servicing of certain share classes. One component of the plan is a distribution fee paid to MFD and another component of the plan is a service fee paid to MFD. MFD may subsequently pay all, or a portion, of the distribution and/or service fees to financial intermediaries.
Distribution Plan Fee Table:
| | | | | | | | | | | | | | | | | | | | |
| | | | | |
| | | Distribution
Fee Rate (d) | | | Service
Fee Rate (d) | | | Total
Distribution
Plan (d) | | | Annual
Effective
Rate (e) | | | Distribution
and Service
Fee | |
| Class A | | | — | | | | 0.25% | | | | 0.25% | | | | 0.25% | | | | $4,631,903 | |
| Class B | | | 0.75% | | | | 0.25% | | | | 1.00% | | | | 1.00% | | | | 294,072 | |
| Class C | | | 0.75% | | | | 0.25% | | | | 1.00% | | | | 1.00% | | | | 1,457,449 | |
| Class R1 | | | 0.75% | | | | 0.25% | | | | 1.00% | | | | 1.00% | | | | 67,162 | |
| Class R2 | | | 0.25% | | | | 0.25% | | | | 0.50% | | | | 0.50% | | | | 179,701 | |
| Class R3 | | | — | | | | 0.25% | | | | 0.25% | | | | 0.25% | | | | 420,956 | |
| Total Distribution and Service Fees | | | | | | | | | | | | $7,051,243 | |
| (d) | In accordance with the distribution plan for certain classes, the fund pays distribution and/or service fees equal to these annual percentage rates of each class’s average daily net assets. The distribution and service fee rates disclosed by class represent the current rates in effect at the end of the reporting period. Any rate changes, if applicable, are detailed below. |
| (e) | The annual effective rates represent actual fees incurred under the distribution plan for the year ended April 30, 2020 based on each class’s average daily net assets. MFD has voluntarily agreed to rebate a portion of each class’s 0.25% service fee attributable to accounts for which there is no financial intermediary specified on the account except for accounts attributable to |
41
Notes to Financial Statements – continued
| | MFS or its affiliates’ seed money. For the year ended April 30, 2020, this rebate amounted to $50,494, $268, $297, $53, and $17 for Class A, Class B, Class C, Class R2, and Class R3, respectively, and is included in the reduction of total expenses in the Statement of Operations. |
Certain Class A shares are subject to a contingent deferred sales charge (CDSC) in the event of a shareholder redemption within 18 months of purchase. Class B shares are subject to a CDSC in the event of a shareholder redemption within six years of purchase. Class C shares are subject to a CDSC in the event of a shareholder redemption within 12 months of purchase. All contingent deferred sales charges are paid to MFD and during the year ended April 30, 2020, were as follows:
| | | | |
| |
| | | Amount | |
| Class A | | | $53,457 | |
| Class B | | | 13,750 | |
| Class C | | | 27,702 | |
Shareholder Servicing Agent– MFS Service Center, Inc. (MFSC), a wholly-owned subsidiary of MFS, receives a fee from the fund for its services as shareholder servicing agent calculated as a percentage of the average daily net assets of the fund as determined periodically under the supervision of the fund’s Board of Trustees. For the year ended April 30, 2020, the fee was $279,962, which equated to 0.0060% annually of the fund’s average daily net assets. MFSC also receives payment from the fund forout-of-pocket expenses,sub-accounting and other shareholder servicing costs which may be paid to affiliated and unaffiliated service providers. Class R6 shares do not incursub-accounting fees. For the year ended April 30, 2020, theseout-of-pocket expenses,sub-accounting and other shareholder servicing costs amounted to $3,501,274.
Administrator– MFS provides certain financial, legal, shareholder communications, compliance, and other administrative services to the fund. Under an administrative services agreement, the fund reimburses MFS the costs incurred to provide these services. The fund is charged an annual fixed amount of $17,500 plus a fee based on average daily net assets. The administrative services fee incurred for the year ended April 30, 2020 was equivalent to an annual effective rate of 0.0123% of the fund’s average daily net assets.
Trustees’ and Officers’ Compensation– The fund pays compensation to independent Trustees in the form of a retainer, attendance fees, and additional compensation to Board and Committee chairpersons. The fund does not pay compensation directly to Trustees or officers of the fund who are also officers of the investment adviser, all of whom receive remuneration from MFS for their services to the fund. Certain officers and Trustees of the fund are officers or directors of MFS, MFD, and MFSC.
Prior to December 31, 2001, the fund had an unfunded defined benefit plan (“DB plan”) for independent Trustees. As of December 31, 2001, the Board took action to terminate the DB plan with respect to then-current and any future independent Trustees, such that the DB plan covers only certain of those former independent Trustees who retired on or before December 31, 2001. The DB plan resulted in a net decrease in pension expense of $65 and is included in “Independent Trustees’ compensation” in the Statement of Operations for the year ended April 30, 2020. The liability for deferred retirement benefits payable to those former independent Trustees
42
Notes to Financial Statements – continued
under the DB plan amounted to $3,396 at April 30, 2020, and is included in “Payable for independent Trustees’ compensation” in the Statement of Assets and Liabilities.
Other– This fund and certain other funds managed by MFS (the funds) had entered into a service agreement (the ISO Agreement) which provided for payment of fees solely by the funds to Tarantino LLC in return for the provision of services of an Independent Senior Officer (ISO) for the funds. Frank L. Tarantino served as the ISO and was an officer of the funds and the sole member of Tarantino LLC. Effective June 30, 2019, Mr. Tarantino retired from his position as ISO for the funds, and the ISO Agreement was terminated. For the year ended April 30, 2020, the fee paid by the fund under this agreement was $2,465 and is included in “Miscellaneous” expense in the Statement of Operations. MFS had agreed to bear all expenses associated with office space, other administrative support, and supplies provided to the ISO.
The fund invests in the MFS Institutional Money Market Portfolio which is managed by MFS and seeks current income consistent with preservation of capital and liquidity. This money market fund does not pay a management fee to MFS but does incur investment and operating costs.
(4) Portfolio Securities
For the year ended April 30, 2020, purchases and sales of investments, other than short-term obligations, were as follows:
| | | | | | | | |
| | |
| | | Purchases | | | Sales | |
| U.S. Government securities | | | $219,978,633 | | | | $361,119,694 | |
| Non-U.S. Government securities | | | 1,986,139,944 | | | | 1,283,148,142 | |
(5) Shares of Beneficial Interest
The fund’s Declaration of Trust permits the Trustees to issue an unlimited number of full and fractional shares of beneficial interest. Transactions in fund shares were as follows:
| | | | | | | | | | | | | | | | |
| | | Year ended
4/30/20 | | | Year ended
4/30/19 | |
| | | | |
| | | Shares | | | Amount | | | Shares | | | Amount | |
| Shares sold | | | | | | | | | | | | | | | | |
Class A | | | 38,718,178 | | | | $565,408,533 | | | | 25,853,146 | | | | $348,530,862 | |
Class B | | | 80,249 | | | | 1,160,198 | | | | 88,851 | | | | 1,191,055 | |
Class C | | | 2,116,568 | | | | 30,814,940 | | | | 897,088 | | | | 12,036,718 | |
Class I | | | 42,528,281 | | | | 617,067,106 | | | | 33,002,893 | | | | 444,618,807 | |
Class R1 | | | 131,587 | | | | 1,911,136 | | | | 89,218 | | | | 1,199,941 | |
Class R2 | | | 667,849 | | | | 9,745,645 | | | | 565,221 | | | | 7,624,292 | |
Class R3 | | | 3,012,382 | | | | 44,042,540 | | | | 2,302,943 | | | | 31,094,828 | |
Class R4 | | | 1,321,969 | | | | 19,388,861 | | | | 1,417,715 | | | | 19,127,329 | |
Class R6 | | | 27,430,142 | | | | 400,517,626 | | | | 18,292,619 | | | | 246,564,409 | |
| | | 116,007,205 | | | | $1,690,056,585 | | | | 82,509,694 | | | | $1,111,988,241 | |
43
Notes to Financial Statements – continued
| | | | | | | | | | | | | | | | |
| | | Year ended
4/30/20 | | | Year ended
4/30/19 | |
| | | | |
| | | Shares | | | Amount | | | Shares | | | Amount | |
Shares issued to shareholders in
reinvestment of distributions | | | | | | | | | | | | | |
Class A | | | 3,614,742 | | | | $52,919,077 | | | | 3,682,157 | | | | $49,693,000 | |
Class B | | | 43,036 | | | | 627,526 | | | | 70,482 | | | | 948,450 | |
Class C | | | 199,481 | | | | 2,909,324 | | | | 260,312 | | | | 3,500,905 | |
Class I | | | 2,128,495 | | | | 31,141,118 | | | | 2,294,138 | | | | 30,921,579 | |
Class R1 | | | 10,116 | | | | 147,754 | | | | 10,801 | | | | 145,443 | |
Class R2 | | | 64,122 | | | | 938,083 | | | | 83,498 | | | | 1,126,564 | |
Class R3 | | | 339,081 | | | | 4,961,707 | | | | 377,976 | | | | 5,100,888 | |
Class R4 | | | 138,059 | | | | 2,020,959 | | | | 151,727 | | | | 2,047,938 | |
Class R6 | | | 2,566,377 | | | | 37,541,301 | | | | 2,642,681 | | | | 35,623,999 | |
| | | 9,103,509 | | | | $133,206,849 | | | | 9,573,772 | | | | $129,108,766 | |
| | | | |
| Shares reacquired | | | | | | | | | | | | | | | | |
Class A | | | (26,968,583 | ) | | | $(390,571,503 | ) | | | (32,662,767 | ) | | | $(439,200,710 | ) |
Class B | | | (1,127,898 | ) | | | (16,359,922 | ) | | | (1,249,163 | ) | | | (16,755,978 | ) |
Class C | | | (2,970,161 | ) | | | (42,873,246 | ) | | | (4,320,379 | ) | | | (57,840,190 | ) |
Class I | | | (30,169,351 | ) | | | (437,411,596 | ) | | | (93,741,391 | ) | | | (1,257,981,691 | ) |
Class R1 | | | (184,794 | ) | | | (2,680,016 | ) | | | (107,023 | ) | | | (1,436,196 | ) |
Class R2 | | | (1,396,009 | ) | | | (20,262,574 | ) | | | (1,119,043 | ) | | | (15,049,927 | ) |
Class R3 | | | (3,953,802 | ) | | | (56,911,619 | ) | | | (3,348,239 | ) | | | (44,949,211 | ) |
Class R4 | | | (2,595,907 | ) | | | (37,561,048 | ) | | | (1,622,111 | ) | | | (21,695,682 | ) |
Class R6 | | | (19,012,314 | ) | | | (273,966,448 | ) | | | (23,896,236 | ) | | | (320,603,981 | ) |
| | | (88,378,819 | ) | | | $(1,278,597,972 | ) | | | (162,066,352 | ) | | | $(2,175,513,566 | ) |
| | | | |
| Net change | | | | | | | | | | | | | | | | |
Class A | | | 15,364,337 | | | | $227,756,107 | | | | (3,127,464 | ) | | | $(40,976,848 | ) |
Class B | | | (1,004,613 | ) | | | (14,572,198 | ) | | | (1,089,830 | ) | | | (14,616,473 | ) |
Class C | | | (654,112 | ) | | | (9,148,982 | ) | | | (3,162,979 | ) | | | (42,302,567 | ) |
Class I | | | 14,487,425 | | | | 210,796,628 | | | | (58,444,360 | ) | | | (782,441,305 | ) |
Class R1 | | | (43,091 | ) | | | (621,126 | ) | | | (7,004 | ) | | | (90,812 | ) |
Class R2 | | | (664,038 | ) | | | (9,578,846 | ) | | | (470,324 | ) | | | (6,299,071 | ) |
Class R3 | | | (602,339 | ) | | | (7,907,372 | ) | | | (667,320 | ) | | | (8,753,495 | ) |
Class R4 | | | (1,135,879 | ) | | | (16,151,228 | ) | | | (52,669 | ) | | | (520,415 | ) |
Class R6 | | | 10,984,205 | | | | 164,092,479 | | | | (2,960,936 | ) | | | (38,415,573 | ) |
| | | 36,731,895 | | | | $544,665,462 | | | | (69,982,886 | ) | | | $(934,416,559 | ) |
Class T shares were not publicly available for sale during the period. Please see the fund’s prospectus for details.
Effective June 1, 2019, purchases of the fund’s Class B shares are closed to new and existing investors subject to certain exceptions. Please see the fund’s prospectus for details.
44
Notes to Financial Statements – continued
(6) Line of Credit
The fund and certain other funds managed by MFS participate in a $1.25 billion unsecured committed line of credit, subject to a $1 billion sublimit, provided by a syndicate of banks under a credit agreement. Borrowings may be made for temporary financing needs. Interest is charged to each fund, based on its borrowings, generally at a rate equal to the highest of one month LIBOR, the Federal Funds Effective Rate and the Overnight Bank Funding Rate, plus an agreed upon spread. A commitment fee, based on the average daily, unused portion of the committed line of credit, is allocated among the participating funds. In addition, the fund and other funds managed by MFS have established unsecured uncommitted borrowing arrangements with certain banks for temporary financing needs. Interest is charged to each fund, based on its borrowings, at rates equal to customary reference rates plus an agreed upon spread. For the year ended April 30, 2020, the fund’s commitment fee and interest expense were $23,514 and $0, respectively, and are included in “Miscellaneous” expense in the Statement of Operations.
(7) Investments in Affiliated Issuers
An affiliated issuer may be considered one in which the fund owns 5% or more of the outstanding voting securities, or a company which is under common control. For the purposes of this report, the following were affiliated issuers:
| | | | | | | | | | | | | | | | | | | | | | | | |
| | | | | | |
| Affiliated Issuers | | Beginning
Value | | | Purchases | | | Sales
Proceeds | | | Realized
Gain
(Loss) | | | Change in
Unrealized
Appreciation or
Depreciation | | | Ending
Value | |
| MFS Institutional Money Market Portfolio | | | $117,124,607 | | | | $1,303,692,360 | | | | $1,356,672,062 | | | | $(25,688 | ) | | | $152 | | | | $64,119,369 | |
| | | | | | |
| Affiliated Issuers | | | | | | | | | | | | | | Dividend
Income | | | Capital Gain
Distributions | |
| MFS Institutional Money Market Portfolio | | | | | | | | | | | | $1,852,595 | | | | $— | |
(8) Impacts ofCOVID-19
The pandemic related to the global spread of novel coronavirus disease(COVID-19), which was first detected in December 2019, has resulted in significant disruptions to global business activity and the global economy, as well as the economies of individual countries, the financial performance of individual companies and sectors, and the securities and commodities markets in general. This pandemic, the full effects of which are still unknown, has resulted in substantial market volatility and may have adversely impacted the prices and liquidity of the fund’s investments and the fund’s performance.
45
REPORT OF INDEPENDENT REGISTERED PUBLIC ACCOUNTING FIRM
To the Board of Trustees of MFS Series Trust IX and the Shareholders of MFS Corporate Bond Fund:
Opinion on the Financial Statements and Financial Highlights
We have audited the accompanying statement of assets and liabilities of MFS Corporate Bond Fund (the “Fund”), including the portfolio of investments, as of April 30, 2020, the related statement of operations for the year then ended, the statements of changes in net assets for each of the two years in the period then ended, the financial highlights for each of the five years in the period then ended, and the related notes. In our opinion, the financial statements and financial highlights present fairly, in all material respects, the financial position of the Fund as of April 30, 2020, and the results of its operations for the year then ended, the changes in its net assets for each of the two years in the period then ended, and the financial highlights for each of the five years in the period then ended, in conformity with accounting principles generally accepted in the United States of America.
Basis for Opinion
These financial statements and financial highlights are the responsibility of the Fund’s management. Our responsibility is to express an opinion on the Fund’s financial statements and financial highlights based on our audits. We are a public accounting firm registered with the Public Company Accounting Oversight Board (United States) (PCAOB) and are required to be independent with respect to the Fund in accordance with the U.S. federal securities laws and the applicable rules and regulations of the Securities and Exchange Commission and the PCAOB.
We conducted our audits in accordance with the standards of the PCAOB. Those standards require that we plan and perform the audit to obtain reasonable assurance about whether the financial statements and financial highlights are free of material misstatement, whether due to error or fraud. The Fund is not required to have, nor were we engaged to perform, an audit of its internal control over financial reporting. As part of our audits we are required to obtain an understanding of internal control over financial reporting but not for the purpose of expressing an opinion on the effectiveness of the Fund’s internal control over financial reporting. Accordingly, we express no such opinion.
Our audits included performing procedures to assess the risks of material misstatement of the financial statements and financial highlights, whether due to error or fraud, and performing procedures that respond to those risks. Such procedures included examining, on a test basis, evidence regarding the amounts and disclosures in the financial statements and financial highlights. Our audits also included evaluating the accounting principles used and significant estimates made by management, as well as evaluating the overall presentation of the financial statements and financial highlights. Our procedures included confirmation of securities owned as of April 30, 2020, by
46
Report of Independent Registered Public Accounting Firm – continued
correspondence with the custodian and brokers; when replies were not received from brokers, we performed other auditing procedures. We believe that our audits provide a reasonable basis for our opinion.
DELOITTE & TOUCHE LLP
Boston, Massachusetts
June 16, 2020
We have served as the auditor of one or more of the MFS investment companies since 1924.
47
TRUSTEES AND OFFICERS — IDENTIFICATION AND BACKGROUND
The Trustees and Officers of the Trust, as of June 1, 2020, are listed below, together with their principal occupations during the past five years. (Their titles may have varied during that period.) The address of each Trustee and Officer is 111 Huntington Avenue, Boston, Massachusetts 02199-7618.
| | | | | | | | | | |
Name, Age | | Position(s)
Held with Fund | | Trustee/Officer Since (h) | | Number of
MFS Funds
overseen
by the
Trustee | | Principal
Occupations During the Past Five Years | | Other Directorships
During the Past
Five Years (j) |
| INTERESTED TRUSTEES |
Robert J. Manning (k)
(age 56) | | Trustee | | February 2004 | | 133 | | Massachusetts Financial Services Company, Executive Chairman (since January 2017); Director; Chairman of the Board; Chief Executive Officer (until 2015);Co-Chief Executive Officer (2015-2016) | | N/A |
| | | | | |
Robin A. Stelmach (k) (age 58) | | Trustee | | January 2014 | | 133 | | Massachusetts Financial Services Company, Vice Chair (since January 2017); Chief Operating Officer and Executive Vice President (until January 2017) | | N/A |
| INDEPENDENT TRUSTEES |
John P. Kavanaugh (age 65) | | Trustee and Chair of Trustees | | January 2009 | | 133 | | Private investor | | N/A |
| | | | | |
Steven E. Buller (age 68) | | Trustee | | February 2014 | | 133 | | Financial Accounting Standards Advisory Council, Chairman (2014-2015); Public Company Accounting Oversight Board, Standing Advisory Group, Member (until 2014); BlackRock, Inc. (investment management), Managing Director (until 2014), BlackRock Finco UK (investment management), Director (until 2014) | | N/A |
48
Trustees and Officers – continued
| | | | | | | | | | |
Name, Age | | Position(s)
Held with Fund | | Trustee/Officer Since (h) | | Number of
MFS Funds
overseen
by the
Trustee | | Principal
Occupations During the Past Five Years | | Other Directorships
During the Past
Five Years (j) |
John A. Caroselli (age 65) | | Trustee | | March 2017 | | 133 | | JC Global Advisors, LLC (management consulting), President (since 2015); First Capital Corporation (commercial finance), Executive Vice President (until 2015) | | N/A |
| | | | | |
Maureen R. Goldfarb (age 65) | | Trustee | | January 2009 | | 133 | | Private investor | | N/A |
| | | | | |
Peter D. Jones
(age 64) | | Trustee | | January 2019 | | 133 | | Franklin Templeton Distributors, Inc. (investment management), President (until 2015); Franklin Templeton Institutional, LLC (investment management), Chairman (until 2015) | | N/A |
| | | | | |
James W. Kilman, Jr.
(age 59) | | Trustee | | January 2019 | | 133 | | Burford Capital Limited (finance and investment management), Chief Financial Officer (since 2019); KielStrand Capital LLC (family office), Chief Executive Officer (since 2016); Morgan Stanley & Co. (financial services), Vice Chairman of Investment Banking,Co-Head of Diversified Financials Coverage – Financial Institutions Investment Banking Group (until 2016) | | Alpha-En Corporation, Director(2016-2019) |
49
Trustees and Officers – continued
| | | | | | | | | | |
Name, Age | | Position(s)
Held with Fund | | Trustee/Officer Since (h) | | Number of
MFS Funds
overseen
by the
Trustee | | Principal
Occupations During the Past Five Years | | Other Directorships
During the Past
Five Years (j) |
Clarence Otis, Jr. (age 64) | | Trustee | | March 2017 | | 133 | | Darden Restaurants, Inc., Chief Executive Officer (until 2014) | | VF Corporation, Director; Verizon Communications, Inc., Director; The Travelers Companies, Director; Federal Reserve Bank of Atlanta, Director (until 2015) |
| | | | | |
Maryanne L. Roepke (age 64) | | Trustee | | May 2014 | | 133 | | American Century Investments (investment management), Senior Vice President and Chief Compliance Officer (until 2014) | | N/A |
| | | | | |
Laurie J. Thomsen
(age 62) | | Trustee | | March 2005 | | 133 | | Private investor | | The Travelers Companies, Director; Dycom Industries, Inc., Director (since 2015) |
| | | | | | | | |
Name, Age | | Position(s) Held with Fund | | Trustee/Officer
Since (h) | | Number of
MFS Funds
for which
the Person
is an Officer | | Principal
Occupations During the Past Five Years |
| OFFICERS | | | | | | | | |
Christopher R. Bohane (k)
(age 46) | | Assistant Secretary and Assistant Clerk | | July 2005 | | 133 | | Massachusetts Financial Services Company, Senior Vice President and Associate General Counsel |
| | | | |
Kino Clark (k) (age 51) | | Assistant Treasurer | | January 2012 | | 133 | | Massachusetts Financial Services Company, Vice President |
| | | | |
John W. Clark, Jr. (k) (age 53) | | Assistant Treasurer | | April 2017 | | 133 | | Massachusetts Financial Services Company, Vice President (since March 2017); Deutsche Bank (financial services), Department Head – Treasurer’s Office (until February 2017) |
50
Trustees and Officers – continued
| | | | | | | | |
Name, Age | | Position(s) Held with Fund | | Trustee/Officer
Since (h) | | Number of
MFS Funds
for which
the Person
is an Officer | | Principal
Occupations During the Past Five Years |
Thomas H. Connors (k) (age 60) | | Assistant Secretary and Assistant Clerk | | September 2012 | | 133 | | Massachusetts Financial Services Company, Vice President and Senior Counsel |
| | | | |
David L. DiLorenzo (k)
(age 51) | | President | | July 2005 | | 133 | | Massachusetts Financial Services Company, Senior Vice President |
| | | | |
Heidi W. Hardin (k) (age 52) | | Secretary and Clerk | | April 2017 | | 133 | | Massachusetts Financial Services Company, Executive Vice President and General Counsel (since March 2017); Harris Associates (investment management), General Counsel (from September 2015 to January 2017); Janus Capital Management LLC (investment management), Senior Vice President and General Counsel (until September 2015) |
| | | | |
Brian E. Langenfeld (k) (age 47) | | Assistant Secretary and Assistant Clerk | | June 2006 | | 133 | | Massachusetts Financial Services Company, Vice President and Senior Counsel |
| | | | |
Amanda S. Mooradian (k) (age 41) | | Assistant Secretary and Assistant Clerk | | September 2018 | | 133 | | Massachusetts Financial Services Company, Assistant Vice President and Senior Counsel |
| | | | |
Susan A. Pereira (k)
(age 49) | | Assistant Secretary and Assistant Clerk | | July 2005 | | 133 | | Massachusetts Financial Services Company, Vice President and Assistant General Counsel |
| | | | |
Kasey L. Phillips (k) (age 49) | | Assistant Treasurer | | September 2012 | | 133 | | Massachusetts Financial Services Company, Vice President |
| | | | |
Matthew A. Stowe (k) (age 45) | | Assistant Secretary and Assistant Clerk | | October 2014 | | 133 | | Massachusetts Financial Services Company, Vice President and Assistant General Counsel |
| | | | |
Martin J. Wolin (k) (age 52) | | Chief Compliance Officer | | July 2015 | | 133 | | Massachusetts Financial Services Company, Senior Vice President and Chief Compliance Officer (since July 2015); Mercer (financial service provider), Chief Risk and Compliance Officer, North America and Latin America (until June 2015) |
51
Trustees and Officers – continued
| | | | | | | | |
Name, Age | | Position(s) Held with Fund | | Trustee/Officer
Since (h) | | Number of
MFS Funds
for which
the Person
is an Officer | | Principal
Occupations During the Past Five Years |
James O. Yost (k)
(age 59) | | Treasurer | | September 1990 | | 133 | | Massachusetts Financial Services Company, Senior Vice President |
| (h) | Date first appointed to serve as Trustee/officer of an MFS Fund. Each Trustee has served continuously since appointment unless indicated otherwise. For the period from December 15, 2004 until February 22, 2005, Mr. Manning served as Advisory Trustee. From January 2012 through December 2016, Messrs. DiLorenzo and Yost served as Treasurer and Deputy Treasurer of the Funds, respectively. |
| (j) | Directorships or trusteeships of companies required to report to the Securities and Exchange Commission (i.e., “public companies”). |
| (k) | “Interested person” of the Trust within the meaning of the Investment Company Act of 1940 (referred to as the 1940 Act), which is the principal federal law governing investment companies like the fund, as a result of a position with MFS. The address of MFS is 111 Huntington Avenue, Boston, Massachusetts 02199-7618. |
Each Trustee (other than Messrs. Jones and Kilman) has been elected by shareholders and each Trustee and Officer holds office until his or her successor is chosen and qualified or until his or her earlier death, resignation, retirement or removal. Messrs. Jones and Kilman became Trustees of the Funds on January 1, 2019. The Trust does not hold annual meetings for the purpose of electing Trustees, and Trustees are not elected for fixed terms. Under the terms of the Board’s retirement policy, an Independent Trustee shall retire at the end of the calendar year in which he or she reaches the earlier of 75 years of age or 15 years of service on the Board (or, in the case of any Independent Trustee who joined the Board prior to 2015, 20 years of service on the Board).
Messrs. Buller, Kilman and Otis and Ms. Roepke are members of the Trust’s Audit Committee.
Each of the Interested Trustees and certain Officers hold comparable officer positions with certain affiliates of MFS.
The Statement of Additional Information for a Fund includes further information about the Trustees and is available without charge upon request by calling1-800-225-2606.
| | |
| Investment Adviser | | Custodian |
Massachusetts Financial Services Company
111 Huntington Avenue Boston, MA 02199-7618 | | JPMorgan Chase Bank, NA 4 Metrotech Center New York, NY 11245 |
| Distributor | | Independent Registered Public Accounting Firm |
MFS Fund Distributors, Inc.
111 Huntington Avenue Boston, MA 02199-7618 | | Deloitte & Touche LLP 200 Berkeley Street Boston, MA 02116 |
| Portfolio Manager(s) | | |
Alexander Mackey Henry Peabody Robert Persons | | |
52
STATEMENT REGARDING LIQUIDITY RISK MANAGEMENT PROGRAM
The fund has adopted and implemented a liquidity risk management program (the “Program”) as required by Rule 22e-4 under the Investment Company Act of 1940, as amended. The fund’s Board of Trustees (the “Board”) has designated MFS as the administrator of the Program. The Program is reasonably designed to assess and manage the liquidity risk of the fund. Liquidity risk is the risk that the fund could not meet requests to redeem shares issued by the fund without significant dilution of remaining investors’ interests.
MFS provided a written report to the Board for consideration at its April 2020 meeting that addressed the operation of the Program and provided an assessment of the adequacy and effectiveness of the Program during the period from the adoption of the Program on December 1, 2018 to December 31, 2019 (the “Covered Period”). The report concluded that during the Covered Period the Program had operated effectively and had adequately and effectively been implemented to assess and manage the fund’s liquidity risk. MFS also reported that there were no liquidity events that impacted the fund or its ability to timely meet redemptions without dilution to existing shareholders during the Covered Period.
There can be no assurance that the Program will achieve its objectives in the future. Further information on liquidity risk, and other principal risks to which an investment in the fund may be subject, can be found in the prospectus.
53
PROXY VOTING POLICIES AND INFORMATION
MFS votes proxies on behalf of the fund pursuant to proxy voting policies and procedures that are available without charge, upon request, by calling1-800-225-2606, by visitingmfs.com/proxyvoting,or by visiting the SEC’s Web site athttp://www.sec.gov.
Information regarding how the fund voted proxies relating to portfolio securities during the most recent twelve-month period ended June 30 is available by August 31 of each year without charge by visitingmfs.com/proxyvoting,or by visiting the SEC’s Web site athttp://www.sec.gov.
QUARTERLY PORTFOLIO DISCLOSURE
The fund files a complete schedule of portfolio holdings with the SEC for the first and third quarters of each fiscal year as an exhibit to its reports on Form N-PORT. The fund’s Form N-PORT reports are available on the SEC’s website athttp://www.sec.gov. A shareholder can obtain the portfolio holdings report for the first and third quarters of the fund’s fiscal year atmfs.com/openendfunds by choosing the fund’s name and then selecting the “Resources” tab and clicking on “Prospectus and Reports”.
FURTHER INFORMATION
From time to time, MFS may post important information about the fund or the MFS funds on the MFS web site (mfs.com). This information is available athttps://www.mfs.com/en-us/what-we-do/announcements.htmlor atmfs.com/openendfundsby choosing the fund’s name.
INFORMATION ABOUT FUND CONTRACTS AND LEGAL CLAIMS
The fund has entered into contractual arrangements with an investment adviser, administrator, distributor, shareholder servicing agent, 529 program manager (if applicable), and custodian who each provide services to the fund. Unless expressly stated otherwise, shareholders are not parties to, or intended beneficiaries of these contractual arrangements, and these contractual arrangements are not intended to create any shareholder right to enforce them against the service providers or to seek any remedy under them against the service providers, either directly or on behalf of the fund.
Under the Trust’s By-Laws and Declaration of Trust, any claims asserted against or on behalf of the MFS Funds, including claims against Trustees and Officers, must be brought in state and federal courts located within the Commonwealth of Massachusetts.
FEDERAL TAX INFORMATION (unaudited)
The fund will notify shareholders of amounts for use in preparing 2020 income tax forms in January 2021. The following information is provided pursuant to provisions of the Internal Revenue Code.
The fund designates $593,328 as capital gain dividends paid during the fiscal year.
54
rev. 3/16
| | | | |
| | | |
FACTS | | WHAT DOES MFS DO WITH YOUR PERSONAL INFORMATION? | |  |
| | |
| Why? | | Financial companies choose how they share your personal information. Federal law gives consumers the right to limit some but not all sharing. Federal law also requires us to tell you how we collect, share, and protect your personal information. Please read this notice carefully to understand what we do. |
| | |
| What? | | The types of personal information we collect and share depend on the product or service you have with us. This information can include: • Social Security number and account balances • Account transactions and transaction history • Checking account information and wire transfer instructions When you areno longer our customer, we continue to share your information as described in this notice. |
| | |
| How? | | All financial companies need to share customers’ personal information to run their everyday business. In the section below, we list the reasons financial companies can share their customers’ personal information; the reasons MFS chooses to share; and whether you can limit this sharing. |
| | | | |
Reasons we can share your
personal information | | Does MFS
share? | | Can you limit
this sharing? |
For our everyday business purposes – such as to process your transactions, maintain your account(s), respond to court orders and legal investigations, or report to credit bureaus | | Yes | | No |
For our marketing purposes – to offer our products and services to you | | No | | We don’t share |
For joint marketing with other financial companies | | No | | We don’t share |
For our affiliates’ everyday business purposes – information about your transactions and experiences | | No | | We don’t share |
For our affiliates’ everyday business purposes – information about your creditworthiness | | No | | We don’t share |
| For nonaffiliates to market to you | | No | | We don’t share |
| | |
| | |
| Questions? | | Call800-225-2606 or go tomfs.com. |
55
| | |
| Who we are |
| Who is providing this notice? | | MFS Funds, MFS Investment Management, MFS Institutional Advisors, Inc., and MFS Heritage Trust Company. |
| | |
| What we do |
| How does MFS protect my personal information? | | To protect your personal information from unauthorized access and use, we use security measures that comply with federal law. These measures include procedural, electronic, and physical safeguards for the protection of the personal information we collect about you. |
| How does MFS collect my personal information? | | We collect your personal information, for example, when you • open an account or provide account information • direct us to buy securities or direct us to sell your securities • make a wire transfer We also collect your personal information from others, such as credit bureaus, affiliates, or other companies. |
| Why can’t I limit all sharing? | | Federal law gives you the right to limit only • sharing for affiliates’ everyday business purposes – information about your creditworthiness • affiliates from using your information to market to you • sharing for nonaffiliates to market to you State laws and individual companies may give you additional rights to limit sharing. |
| | |
| Definitions |
| Affiliates | | Companies related by common ownership or control. They can be financial and nonfinancial companies. • MFS does not share personal information with affiliates, except for everyday business purposes as described on page one of this notice. |
| Nonaffiliates | | Companies not related by common ownership or control. They can be financial and nonfinancial companies. • MFS does not share with nonaffiliates so they can market to you. |
| Joint marketing | | A formal agreement between nonaffiliated financial companies that together market financial products or services to you. • MFS doesn’t jointly market. |
| | |
| Other important information |
| If you own an MFS product or receive an MFS service in the name of a third party such as a bank or broker-dealer, their privacy policy may apply to you instead of ours. |
56
Save paper with eDelivery.

| MFS® will send you prospectuses, |
reports, and proxies directly viae-mail so you will get information faster with less mailbox clutter.
To sign up:
1. Go to mfs.com.
2. Log in via MFS® Access.
3. Select eDelivery.
If you own your MFS fund shares through a financial institution or a retirement plan, MFS® TALK, MFS® Access, or eDelivery may not be available to you.
CONTACT
WEB SITE
mfs.com
MFS TALK
1-800-637-8255
24 hours a day
ACCOUNT SERVICE AND LITERATURE
Shareholders
1-800-225-2606
Financial advisors
1-800-343-2829
Retirement plan services
1-800-637-1255
MAILING ADDRESS
MFS Service Center, Inc.
P.O. Box 219341
Kansas City, MO 64121-9341
OVERNIGHT MAIL
MFS Service Center, Inc.
Suite 219341
430 W 7th Street
Kansas City, MO 64105-1407
Annual Report
April 30, 2020

MFS® Limited Maturity Fund

Beginning on January 1, 2021, as permitted by regulations adopted by the U.S. Securities and Exchange Commission, paper copies of the fund’s annual and semiannual shareholder reports will no longer be sent by mail, unless you specifically request paper copies of the reports. Instead, the complete reports will be made available on the fund’s Web site (funds.mfs.com), and you will be notified by mail each time a report is posted and provided with a Web site link to access the report.
If you are already signed up to receive shareholder reports by email, you will not be affected by this change and you need not take any action. You may sign up to receive shareholder reports and other communications from the fund by email by contacting your financial intermediary (such as a broker-dealer or bank) or, if you hold your shares directly with the fund, by calling 1-800-225-2606 or by logging on to MFS Access at mfs.com.
Beginning on January 1, 2019, you may elect to receive all future reports in paper free of charge. Contact your financial intermediary to request that you continue to receive paper copies of your shareholder reports. If you invest directly with the fund, you can call 1-800-225-2606 or send an email request to orderliterature@mfs.com to let the fund know that you wish to continue receiving paper copies of your shareholder reports. Your election to receive reports in paper will apply to all funds held in your account if you invest through your financial intermediary or all funds held with the MFS fund complex if you invest directly.
MQL-ANN
MFS® Limited Maturity Fund
CONTENTS
The report is prepared for the general information of shareholders. It is authorized for distribution to prospective investors only when preceded or accompanied by a current prospectus.
NOT FDIC INSURED• MAY LOSE VALUE• NO BANK GUARANTEE

LETTER FROM THE EXECUTIVE CHAIR
Dear Shareholders:
Markets experienced dramatic swings in early 2020 as the coronavirus pandemic crippled the global economy for a time. Optimism over the development of vaccines
and therapeutics, along with a decline in cases in countries hit early in the outbreak, has brightened the economic and market outlook during the second quarter, though a great deal of uncertainty remains on how long the aftereffects of the lockdowns will linger.
Global central banks have taken aggressive, coordinated steps to cushion the economic and market fallout related to the virus, and governments are undertaking unprecedented levels of fiscal stimulus. As uncertainty recedes, these measures can help build a supportive environment and encourage economic recovery. In the aftermath of the crisis, there are likely to be societal changes as
households, businesses, and governments adjust to a new reality, and these alterations could change the investment landscape. For investors, occurrences such as theCOVID-19 outbreak demonstrate the importance of having a deep understanding of company fundamentals, and our global research platform has been built to do just that.
Here at MFS®, we aim to help our clients navigate the growing complexity of the markets and world economies. Our long-term investment philosophy and commitment to the responsible allocation of capital allow us to tune out the noise and uncover what we believe are the best, most durable investment opportunities in the market. Through our powerful global investment platform, we combine collective expertise, thoughtful risk management, and long-term discipline to create sustainable value for investors.
Respectfully,

Robert J. Manning
Executive Chair
MFS Investment Management
June 16, 2020
The opinions expressed in this letter are subject to change and may not be relied upon for investment advice. No forecasts can be guaranteed.
1
PORTFOLIO COMPOSITION
Portfolio structure (i)
| | | | |
| Fixed income sectors (i) | | | | |
| Investment Grade Corporates | | | 50.1% | |
| U.S. Treasury Securities | | | 30.0% | |
| Asset-Backed Securities | | | 10.2% | |
| Collateralized Debt Obligations | | | 10.1% | |
| Commercial Mortgage-Backed Securities | | | 8.0% | |
| High Yield Corporates | | | 2.1% | |
| Residential Mortgage-Backed Securities | | | 2.0% | |
| Emerging Markets Bonds | | | 1.6% | |
| Mortgage-Backed Securities | | | 1.3% | |
| Municipal Bonds | | | 1.2% | |
| Non-U.S. Government Bonds | | | 0.6% | |
| | | | |
| Composition including fixed income credit quality (a)(i) | |
| AAA | | | 13.0% | |
| AA | | | 13.1% | |
| A | | | 24.0% | |
| BBB | | | 29.3% | |
| BB | | | 2.2% | |
| B (o) | | | 0.0% | |
| CCC (o) | | | 0.0% | |
| CC (o) | | | 0.0% | |
| U.S. Government | | | 12.7% | |
| Federal Agencies | | | 1.3% | |
| Not Rated | | | 21.6% | |
| Cash & Cash Equivalents | | | 0.2% | |
| Other | | | (17.4)% | |
| |
| Portfolio facts (i) | | | | |
| Average Duration (d) | | | 2.0 | |
| Average Effective Maturity (m) | | | 2.3 yrs. | |
2
Portfolio Composition – continued
| (a) | For all securities other than those specifically described below, ratings are assigned to underlying securities utilizing ratings from Moody’s, Fitch, and Standard & Poor’s rating agencies and applying the following hierarchy: If all three agencies provide a rating, the middle rating (after dropping the highest and lowest ratings) is assigned; if two of the three agencies rate a security, the lower of the two is assigned. Ratings are shown in the S&P and Fitch scale (e.g., AAA). Securities rated BBB or higher are considered investment grade. All ratings are subject to change. U.S. Government includes securities issued by the U.S. Department of the Treasury. Federal Agencies includes rated and unrated U.S. Agencyfixed-income securities, U.S. Agency mortgage-backed securities, and collateralized mortgage obligations of U.S. Agency mortgage-backed securities. Not Rated includes fixed income securities and fixed income derivatives, which have not been rated by any rating agency. The fund may or may not have held all of these instruments on this date. The fund is not rated by these agencies. |
| (d) | Duration is a measure of how much a bond’s price is likely to fluctuate with general changes in interest rates, e.g., if rates rise 1.00%, a bond with a5-year duration is likely to lose about 5.00% of its value due to the interest rate move. |
| (i) | For purposes of this presentation, the components include the value of securities, and reflect the impact of the equivalent exposure of derivative positions, if any. These amounts may be negative from time to time. Equivalent exposure is a calculated amount that translates the derivative position into a reasonable approximation of the amount of the underlying asset that the portfolio would have to hold at a given point in time to have the same price sensitivity that results from the portfolio’s ownership of the derivative contract. When dealing with derivatives, equivalent exposure is a more representative measure of the potential impact of a position on portfolio performance than value. The bond component will include any accrued interest amounts. |
| (m) | In determining each instrument’s effective maturity for purposes of calculating the fund’s dollar-weighted average effective maturity, MFS uses the instrument’s stated maturity or, if applicable, an earlier date on which MFS believes it is probable that a maturity-shortening device (such as a put,pre-refunding or prepayment) will cause the instrument to be repaid. Such an earlier date can be substantially shorter than the instrument’s stated maturity. |
Where the fund holds convertible bonds, they are treated as part of the equity portion of the portfolio.
Cash & Cash Equivalents includes any cash, investments in money market funds, short-term securities, and other assets less liabilities. Please see the Statement of Assets and Liabilities for additional information related to the fund’s cash position and other assets and liabilities.
Other includes equivalent exposure from currency derivatives and/or any offsets to derivative positions and may be negative.
Percentages are based on net assets as of April 30, 2020.
The portfolio is actively managed and current holdings may be different.
3
MANAGEMENT REVIEW
Summary of Results
For the twelve months ended April 30, 2020, Class A shares of the MFS Limited Maturity Fund (fund) provided a total return of 2.21%, at net asset value. This compares with a return of 4.94% for the fund’s benchmark, the Bloomberg Barclays1-3 Year U.S. Government/Credit Bond Index.
Market Environment
Market volatility soared at the end of the period asCOVID-19, the illness caused by the novel coronavirus first detected in China, spread around the world in early 2020. Government-imposed social distancing measures taken to slow the spread of the virus forced the shutdown of large portions of the global economy. In an attempt to limit the economic fallout of the crisis, central bankers and policymakers have taken a variety of actions unprecedented in both size and speed, but despite their best efforts, a global recession has undoubtedly begun. Given the unique circumstances surrounding the genesis of the downturn, it is difficult to forecast how long the crisis will linger.
High levels of investor uncertainty saw equity prices plunge, market volatility rise and large segments of global fixed income markets freeze as investors sought liquidity wherever they could find it. As the global economy rapidly slowed, a disagreement between Saudi Arabia and Russia over OPEC+ production cuts resulted in the Saudis shelving the OPEC+ arrangement and increasing oil output at the same time that global oil demand was plummeting, which compounded market turmoil. The resulting drop in prices undercut oil exporters, many of which are in emerging markets, as well as a large segment of the high-yield credit market.
Central banks around the world responded quickly and massively to the crisis with programs to improve liquidity and support markets. They proved largely successful in helping to restore market function, easing volatility and stimulating a market rebound at the end of the period. Monetary easing measures were complimented by large fiscal stimulus plans in developed countries. Even emerging market countries were able to implement counter-cyclical policies, a departure from the usual market-dictated response to risk-off crises, due to relatively manageable external liabilities and balance of payments in many countries and persistently low inflation.
As is often the case in a serious crisis, market vulnerabilities have been revealed. For example, companies that have added significant leverage to their balance sheets in recent years by borrowing to fund dividend payments and stock buybacks may find it difficult to follow that path in the future, and investors may not reward them if they do. Recapitalizations by some of these highly leveraged firms could dilute existing shareholders. Very long supply chains designed to squeeze out every bit of savings may be shifted closer to home markets if companies seek to emphasize resiliency over cost after a series of supply disruptions. The aftereffects of the global pandemic could impact consumer, business and government behavior in ways it will be difficult to forecast.
4
Management Review – continued
Factors Affecting Performance
Relative to the Bloomberg Barclays1-3 Year U.S. Government/Credit Bond Index, the fund’sout-of-benchmark exposure tocommercial mortgage-backed securities(CMBS),collateralized mortgage obligations (CMO), andasset-backed securities (ABS) held back performance. The combination of a greater allocation and security selection within theindustrialssector also weighed on relative performance. Additionally, the fund’s lesser exposure to thetreasury sector further hindered relative results. From a quality perspective, an overweight allocation to both “BBB” and “A” rated (r) bonds and holdings ofnon-rated issuers detracted from relative returns.
Conversely, an underweight allocation to “AAA” rated bonds and an overweight allocation to “BB” rated securities helped in relative terms.
Respectfully,
Portfolio Manager(s)
Philipp Burgener and Alexander Mackey
| (r) | Bonds rated “BBB”, “Baa”, or higher are considered investment grade; bonds rated “BB”, “Ba”, or below are considerednon-investment grade. The sources for bond quality ratings are Moody’s Investors Service, Standard & Poor’s and Fitch, Inc. and are applied using the following hierarchy: If all three agencies provide a rating, the middle rating (after dropping the highest and lowest ratings) is assigned; if two of the three agencies rate a security, the lower of the two is assigned. Ratings are shown in the S&P and Fitch scale (e.g., AAA). For securities which are not rated by any of the three agencies, the security is considered Not Rated. |
The views expressed in this report are those of the portfolio manager(s) only through the end of the period of the report as stated on the cover and do not necessarily reflect the views of MFS or any other person in the MFS organization. These views are subject to change at any time based on market or other conditions, and MFS disclaims any responsibility to update such views. These views may not be relied upon as investment advice or an indication of trading intent on behalf of any MFS portfolio. References to specific securities are not recommendations of such securities, and may not be representative of any MFS portfolio’s current or future investments.
5
PERFORMANCE SUMMARYTHROUGH4/30/20
The following chart illustrates a representative class of the fund’s historical performance in comparison to its benchmark(s). Performance results include the deduction of the maximum applicable sales charge and reflect the percentage change in net asset value, including reinvestment of dividends and capital gains distributions. The performance of other share classes will be greater than or less than that of the class depicted below. Benchmarks are unmanaged and may not be invested in directly. Benchmark returns do not reflect sales charges, commissions or expenses. (See Notes to Performance Summary.)
Performance data shown represents past performance and is no guarantee of future results. Investment return and principal value fluctuate so your shares, when sold, may be worth more or less than the original cost; current performance may be lower or higher than quoted. The performance shown does not reflect the deduction of taxes, if any, that a shareholder would pay on fund distributions or the redemption of fund shares.
Growth of a Hypothetical $10,000 Investment
6
Performance Summary – continued
Total Returns through 4/30/20
Average annual without sales charge
| | | | | | | | | | | | | | |
| | | Share Class | | Class Inception Date | | 1-yr | | 5-yr | | 10-yr | | Life (t) | | |
| | | A | | 2/26/92 | | 2.21% | | 1.55% | | 1.58% | | N/A | | |
| | | B | | 9/07/93 | | 1.45% | | 0.83% | | 0.84% | | N/A | | |
| | | C | | 7/01/94 | | 1.35% | | 0.73% | | 0.74% | | N/A | | |
| | | I | | 1/02/97 | | 2.54% | | 1.74% | | 1.73% | | N/A | | |
| | | R1 | | 4/01/05 | | 1.52% | | 0.73% | | 0.74% | | N/A | | |
| | | R2 | | 10/31/03 | | 1.96% | | 1.30% | | 1.33% | | N/A | | |
| | | R3 | | 4/01/05 | | 2.28% | | 1.49% | | 1.51% | | N/A | | |
| | | R4 | | 4/01/05 | | 2.20% | | 1.78% | | 1.77% | | N/A | | |
| | | R6 | | 9/04/12 | | 2.43% | | 1.81% | | N/A | | 1.56% | | |
| | | 529A | | 7/31/02 | | 2.16% | | 1.50% | | 1.52% | | N/A | | |
| | | 529B | | 7/31/02 | | 1.55% | | 0.80% | | 0.78% | | N/A | | |
| | | 529C | | 7/31/02 | | 1.31% | | 0.68% | | 0.67% | | N/A | | |
| | | | | |
| Comparative benchmark(s) | | | | | | | | | | |
| | | Bloomberg Barclays1-3 Year U.S. Government/Credit Bond
Index (f) | | 4.94% | | 2.01% | | 1.66% | | N/A | | |
| | | | | |
| Average annual with sales charge | | | | | | | | | | |
| | | A
With Initial Sales Charge (2.50%) | | (0.34)% | | 1.04% | | 1.32% | | N/A | | |
| | | B
With CDSC (Declining over six years from 4% to 0%) (v) | | (2.54)% | | 0.44% | | 0.84% | | N/A | | |
| | | C
With CDSC (1% for 12 months) (v) | | 0.35% | | 0.73% | | 0.74% | | N/A | | |
| | | 529A
With Initial Sales Charge (2.50%) | | (0.39)% | | 0.99% | | 1.27% | | N/A | | |
| | | 529B
With CDSC (Declining over six years from 4% to 0%) (v) | | (2.44)% | | 0.41% | | 0.78% | | N/A | | |
| | | 529C
With CDSC (1% for 12 months) (v) | | 0.31% | | 0.68% | | 0.67% | | N/A | | |
CDSC – Contingent Deferred Sales Charge.
Class I, R1, R2, R3, R4, and R6 shares do not have a sales charge.
| (f) | Source: FactSet Research Systems Inc. |
| (t) | For the period from the class inception date through the stated period end (for those share classes with less than 10 years of performance history). No comparative benchmark performance information is provided for “life” periods. (See Notes to Performance Summary.) |
| (v) | Assuming redemption at the end of the applicable period. |
7
Performance Summary – continued
Benchmark Definition(s)
Bloomberg Barclays 1-3 Year U.S. Government/Credit Bond Index – a market capitalization-weighted index that measures the performance of the short-term (1 to 3 years) investment-grade corporate and U.S. government bond markets. BLOOMBERG® is a trademark and service mark of Bloomberg Finance L.P. and its affiliates (collectively “Bloomberg”). BARCLAYS® is a trademark and service mark of Barclays Bank Plc (collectively with its affiliates, “Barclays”), used under license. Bloomberg or Bloomberg’s licensors, including Barclays, own all proprietary rights in the Bloomberg Barclays Indices. Neither Bloomberg nor Barclays approves or endorses this material, or guarantees the accuracy or completeness of any information herein, or makes any warranty, express or implied, as to the results to be obtained therefrom, and, to the maximum extent allowed by law, neither shall have any liability or responsibility for injury or damages arising in connection therewith.
It is not possible to invest directly in an index.
Notes to Performance Summary
Class 529 shares are only available in conjunction with qualified tuition programs, such as the MFS 529 Savings Plan. There also is an additional fee, which is detailed in the program description, on qualified tuition programs. If this fee was reflected, the performance for Class 529 shares would have been lower. This annual fee is waived for Oregon residents and for those accounts with assets of $25,000 or more.
Average annual total return represents the average annual change in value for each share class for the periods presented. Life returns are presented where the share class has less than 10 years of performance history and represent the average annual total return from the class inception date to the stated period end date. As the fund’s share classes may have different inception dates, the life returns may represent different time periods and may not be comparable. As a result, no comparative benchmark performance information is provided for life periods.
Performance results reflect any applicable expense subsidies and waivers in effect during the periods shown. Without such subsidies and waivers the fund’s performance results would be less favorable. Please see the prospectus and financial statements for complete details.
Performance results do not include adjustments made for financial reporting purposes in accordance with U.S. generally accepted accounting principles and may differ from amounts reported in the financial highlights.
From time to time the fund may receive proceeds from litigation settlements, without which performance would be lower.
8
EXPENSE TABLE
Fund expenses borne by the shareholders during the period, November 1, 2019 through April 30, 2020
As a shareholder of the fund, you incur two types of costs: (1) transaction costs, including sales charges (loads) on certain purchase or redemption payments, and (2) ongoing costs, including management fees; distribution and service(12b-1) fees; and other fund expenses. This example is intended to help you understand your ongoing costs (in dollars) of investing in the fund and to compare these costs with the ongoing costs of investing in other mutual funds.
The example is based on an investment of $1,000 invested at the beginning of the period and held for the entire period November 1, 2019 through April 30, 2020.
The expenses include the payment of a portion of the transfer-agent-related expenses of MFS funds that invest in the fund. For further information, please see the Notes to Financial Statements.
Actual Expenses
The first line for each share class in the following table provides information about actual account values and actual expenses. You may use the information in this line, together with the amount you invested, to estimate the expenses that you paid over the period. Simply divide your account value by $1,000 (for example, an $8,600 account value divided by $1,000 = 8.6), then multiply the result by the number in the first line under the heading entitled “Expenses Paid During Period” to estimate the expenses you paid on your account during this period.
Hypothetical Example for Comparison Purposes
The second line for each share class in the following table provides information about hypothetical account values and hypothetical expenses based on the fund’s actual expense ratio and an assumed rate of return of 5% per year before expenses, which is not the fund’s actual return. The hypothetical account values and expenses may not be used to estimate the actual ending account balance or expenses you paid for the period. You may use this information to compare the ongoing costs of investing in the fund and other funds. To do so, compare this 5% hypothetical example with the 5% hypothetical examples that appear in the shareholder reports of the other funds.
Please note that the expenses shown in the table are meant to highlight your ongoing costs only and do not reflect any transactional costs, such as sales charges (loads). Therefore, the second line for each share class in the table is useful in comparing ongoing costs only, and will not help you determine the relative total costs of owning different funds. In addition, if these transactional costs were included, your costs would have been higher.
9
Expense Table – continued
| | | | | | | | | | | | | | | | | | |
Share
Class | | | | Annualized
Expense
Ratio | | | Beginning
Account Value
11/01/19 | | | Ending
Account Value
4/30/20 | | | Expenses
Paid During
Period (p)
11/01/19-4/30/20 | |
| A | | Actual | | | 0.62% | | | | $1,000.00 | | | | $998.73 | | | | $3.08 | |
| | Hypothetical (h) | | | 0.62% | | | | $1,000.00 | | | | $1,021.78 | | | | $3.12 | |
| B | | Actual | | | 1.37% | | | | $1,000.00 | | | | $994.96 | | | | $6.80 | |
| | Hypothetical (h) | | | 1.37% | | | | $1,000.00 | | | | $1,018.05 | | | | $6.87 | |
| C | | Actual | | | 1.47% | | | | $1,000.00 | | | | $994.48 | | | | $7.29 | |
| | Hypothetical (h) | | | 1.47% | | | | $1,000.00 | | | | $1,017.55 | | | | $7.37 | |
| I | | Actual | | | 0.47% | | | | $1,000.00 | | | | $1,001.11 | | | | $2.34 | |
| | Hypothetical (h) | | | 0.47% | | | | $1,000.00 | | | | $1,022.53 | | | | $2.36 | |
| R1 | | Actual | | | 1.47% | | | | $1,000.00 | | | | $996.12 | | | | $7.30 | |
| | Hypothetical (h) | | | 1.47% | | | | $1,000.00 | | | | $1,017.55 | | | | $7.37 | |
| R2 | | Actual | | | 0.87% | | | | $1,000.00 | | | | $997.48 | | | | $4.32 | |
| | Hypothetical (h) | | | 0.87% | | | | $1,000.00 | | | | $1,020.54 | | | | $4.37 | |
| R3 | | Actual | | | 0.72% | | | | $1,000.00 | | | | $999.91 | | | | $3.58 | |
| | Hypothetical (h) | | | 0.72% | | | | $1,000.00 | | | | $1,021.28 | | | | $3.62 | |
| R4 | | Actual | | | 0.47% | | | | $1,000.00 | | | | $999.53 | | | | $2.34 | |
| | Hypothetical (h) | | | 0.47% | | | | $1,000.00 | | | | $1,022.53 | | | | $2.36 | |
| R6 | | Actual | | | 0.40% | | | | $1,000.00 | | | | $999.82 | | | | $1.99 | |
| | Hypothetical (h) | | | 0.40% | | | | $1,000.00 | | | | $1,022.87 | | | | $2.01 | |
| 529A | | Actual | | | 0.66% | | | | $1,000.00 | | | | $998.48 | | | | $3.28 | |
| | Hypothetical (h) | | | 0.66% | | | | $1,000.00 | | | | $1,021.58 | | | | $3.32 | |
| 529B | | Actual | | | 1.41% | | | | $1,000.00 | | | | $996.28 | | | | $7.00 | |
| | Hypothetical (h) | | | 1.41% | | | | $1,000.00 | | | | $1,017.85 | | | | $7.07 | |
| 529C | | Actual | | | 1.51% | | | | $1,000.00 | | | | $994.27 | | | | $7.49 | |
| | Hypothetical (h) | | | 1.51% | | | | $1,000.00 | | | | $1,017.35 | | | | $7.57 | |
| (h) | 5% class return per year before expenses. |
| (p) | “Expenses Paid During Period” are equal to each class’s annualized expense ratio, as shown above, multiplied by the average account value over the period, multiplied by 182/366 (to reflect theone-half year period). Expenses paid do not include any applicable sales charges (loads). If these transaction costs had been included, your costs would have been higher. |
Notes to Expense Table
Each class with a Rule12b-1 service fee is subject to a rebate of a portion of such fee. Such rebates are included in the expense ratios above and are outside of the expense limitation arrangement. For Class 529A, Class 529B, and Class 529C shares, this rebate reduced the expense ratios above by 0.01%. See Note 3 in the Notes to Financial Statements for additional information.
10
PORTFOLIO OF INVESTMENTS
4/30/20
The Portfolio of Investments is a complete list of all securities owned by your fund. It is categorized by broad-based asset classes.
| | | | | | | | |
| | |
| Issuer | | Shares/Par | | | Value ($) | |
| Bonds - 99.3% | | | | | | |
| Aerospace - 1.9% | | | | | | |
| Boeing Co., 2.3%, 8/01/2021 | | $ | 9,476,000 | | | $ | 9,315,526 | |
| Boeing Co., 4.508%, 5/01/2023 | | | 7,250,000 | | | | 7,250,000 | |
| Boeing Co., 4.875%, 5/01/2025 | | | 9,930,000 | | | | 9,930,000 | |
| Huntington Ingalls Industries, Inc., 3.844%, 5/01/2025 (n) | | | 6,464,000 | | | | 6,796,066 | |
| Raytheon Technologies Corp., 3.65%, 8/16/2023 | | | 1,242,000 | | | | 1,342,284 | |
| | | | | | | | |
| | | | | | | $ | 34,633,876 | |
| Asset-Backed & Securitized - 30.2% | | | | | | |
| Allegro CLO Ltd.,2014-1RA, “A2”, FLR, 2.709% (LIBOR - 3mo. + 1.6%), 10/21/2028 (n) | | $ | 776,747 | | | $ | 723,857 | |
| ALM Loan Funding, CLO,2015-16A, “BR2”, FLR, 3.118% (LIBOR - 3mo. + 1.9%), 7/15/2027 (n) | | | 4,819,336 | | | | 4,463,361 | |
| AmeriCredit Automobile Receivables Trust,2017-2, “C”, 2.97%, 3/20/2023 | | | 4,648,000 | | | | 4,682,322 | |
| AmeriCredit Automobile Receivables Trust,2020-1, “C”, 1.59%, 10/20/2025 | | | 2,663,000 | | | | 2,543,228 | |
| Arbor Realty Trust, Inc., CLO,2019-FL1, “A”, FLR, 1.964% (LIBOR - 1mo. + 1.15%), 5/15/2037 (n) | | | 7,374,000 | | | | 6,882,722 | |
| AREIT CRE Trust, 2019-CRE3, “A”, FLR, 1.814% (LIBOR - 1mo. + 1.02%), 9/14/2036 (n) | | | 9,440,000 | | | | 8,662,352 | |
| AREIT CRE Trust, 2019-CRE3, “AS” FLR, 2.094% (LIBOR - 1mo. + 1.3%), 9/14/2036 (n) | | | 2,301,000 | | | | 2,012,185 | |
| AREIT CRE Trust, 2019-CRE3, “B”, FLR, 2.344% (LIBOR - 1mo. + 1.55%), 9/14/2036 (n) | | | 1,136,500 | | | | 942,461 | |
| AREIT CRE Trust, 2019-CRE3, “C”, FLR, 2.694% (LIBOR - 1mo. + 1.9%), 9/14/2036 (n) | | | 940,000 | | | | 741,129 | |
| ARI Fleet Lease Trust,2020-A, “A3”, 1.8%, 8/15/2028 (n) | | | 1,517,000 | | | | 1,476,603 | |
| Avery Point CLO Ltd.,2014-1A, “CR”, FLR, 3.341% (LIBOR -3mo. + 2.35%), 4/25/2026 (n) | | | 4,335,000 | | | | 4,165,723 | |
| Avis Budget Rental Car Funding LLC,2019-1A, “A”, 3.45%, 3/20/2023 (n) | | | 9,410,000 | | | | 9,136,751 | |
| Ballyrock Ltd., CLO,2018-1A, “A2”, FLR, 2.735% (LIBOR - 3mo. + 1.6%), 4/20/2031 (n) | | | 4,282,847 | | | | 4,016,117 | |
| Ballyrock Ltd., CLO,2018-1A, “B”, FLR, 3.035% (LIBOR - 3mo. + 1.9%), 4/20/2031 (n) | | | 1,814,958 | | | | 1,572,306 | |
| Bancorp Commercial Mortgage Trust, 2018-CRE3, “B”, FLR, 2.364% (LIBOR - 1mo. + 1.55%), 1/15/2033 (n) | | | 3,903,904 | | | | 3,616,372 | |
| Bancorp Commercial Mortgage Trust, 2018-CRE4, “AS”, FLR, 1.914% (LIBOR - 1mo. + 1.1%), 9/15/2035 (n) | | | 4,618,000 | | | | 4,141,719 | |
11
Portfolio of Investments – continued
| | | | | | | | |
| | |
| Issuer | | Shares/Par | | | Value ($) | |
| Bonds - continued | | | | | | |
| Asset-Backed & Securitized - continued | | | | | | |
| Bancorp Commercial Mortgage Trust, 2019-CRE5, “A”, FLR, 1.814% (LIBOR - 1mo. + 1%), 3/15/2036 (n) | | $ | 7,176,389 | | | $ | 6,737,883 | |
| Bancorp Commercial Mortgage Trust, 2019-CRE5, “AS”, FLR, 2.164% (LIBOR - 1mo. + 1.35%), 3/15/2036 (n) | | | 4,071,346 | | | | 3,678,294 | |
| Bancorp Commercial Mortgage Trust, 2019-CRE5, “B”, FLR, 2.314% (LIBOR - 1mo. + 1.5%), 3/15/2036 (n) | | | 5,637,249 | | | | 5,032,598 | |
| Bancorp Commercial Mortgage Trust, 2019-CRE6, “AS”, FLR, 2.114% (LIBOR - 1mo. + 1.3%), 9/15/2036 (n) | | | 5,167,826 | | | | 4,933,848 | |
| Bancorp Commercial Mortgage Trust, 2019-CRE6, “B”, FLR, 2.364% (LIBOR - 1mo. + 1.55%), 9/15/2036 (n) | | | 6,510,236 | | | | 6,041,062 | |
| Barclays Commercial Mortgage Securities LLC,2018-C2, “XA”, 0.936%, 12/15/2051 (i)(n) | | | 64,043,141 | | | | 3,321,393 | |
| Bayview Commercial Asset Trust, FLR, 0.797% (LIBOR - 1mo. + 0.31%), 8/25/2035 (n) | | | 321,597 | | | | 280,731 | |
| Bayview Financial Acquisition Trust, 5.638%, 11/28/2036 | | | 197,927 | | | | 197,809 | |
| Bayview Financial Revolving Mortgage Loan Trust, FLR, 2.04%(LIBOR - 1mo. + 1.6%), 12/28/2040 (n) | | | 324,027 | | | | 316,414 | |
| Bowman Park CLO Ltd.,2014-1A, “B2R”, 3.545%, 11/23/2025 (n) | | | 4,149,881 | | | | 4,129,132 | |
| BSPRT Ltd.,2018-FL4, “A”, FLR, 2.914% (LIBOR - 1mo. + 2.1%), 9/15/2035 (n) | | | 5,552,000 | | | | 4,446,754 | |
| BSPRT Ltd.,2019-FL5, “C”, FLR, 2.814% (LIBOR - 1mo. + 2%), 5/15/2029 (n) | | | 3,000,000 | | | | 2,435,316 | |
| Business Jet Securities LLC,2018-1, “A”, 4.335%, 2/15/2033 (n) | | | 2,852,531 | | | | 2,463,811 | |
| BXMT Ltd.,2017-FL1, “A”, FLR, 1.621% (LIBOR - 1mo. + 0.87%), 6/15/2035 (n) | | | 2,279,649 | | | | 2,219,662 | |
| BXMT Ltd.,2020-FL2, “B”, FLR, 2.151% (LIBOR - 1mo. + 1.4%), 2/16/2037 (n) | | | 5,795,500 | | | | 5,215,409 | |
| BXMT Ltd.,2020-FL2, “A”, FLR, 1.65% (LIBOR - 1mo. + 0.9%), 2/16/2037 (n) | | | 9,075,500 | | | | 8,549,983 | |
| Capital Automotive,2020-1A, “A4”, REIT, 3.19%, 2/15/2050 (n) | | | 2,210,483 | | | | 2,124,925 | |
| Caravana Auto Receivables Trust,2019-1A, “B”, 3.29%, 8/15/2023 (n) | | | 9,358,000 | | | | 9,425,329 | |
| CarMax Auto Owner Trust,2020-2, “B”, 2.9%, 8/15/2025 (n) | | | 1,569,000 | | | | 1,569,000 | |
| CD Commercial Mortgage Trust,2017-CD4, “XA”, 1.459%, 5/10/2050 (i) | | | 44,045,147 | | | | 2,429,376 | |
| Chesapeake Funding II LLC,2017-2A, “B”, 2.81%, 5/15/2029 (n) | | | 3,442,000 | | | | 3,449,158 | |
| Chesapeake Funding II LLC,2017-2A, “C”, 3.01%, 5/15/2029 (n) | | | 1,560,000 | | | | 1,563,952 | |
| Chesapeake Funding II LLC,2017-3A, “B”, 2.57%, 8/15/2029 (n) | | | 2,403,000 | | | | 2,401,375 | |
| Chesapeake Funding II LLC,2017-4A, “B”, 2.59%, 11/15/2029 (n) | | | 1,815,000 | | | | 1,764,637 | |
| Chesapeake Funding II LLC,2017-4A, “C”, 2.76%, 11/15/2029 (n) | | | 2,592,000 | | | | 2,511,143 | |
| Commercial Mortgage Pass-Through Certificates, 2019-BN24 ,“XA”, 0.768%, 11/15/2062 (i) | | | 35,123,831 | | | | 1,706,569 | |
| CPS Auto Trust,2017-C, “C”, 2.86%, 6/15/2023 (n) | | | 1,490,986 | | | | 1,491,427 | |
12
Portfolio of Investments – continued
| | | | | | | | |
| | |
| Issuer | | Shares/Par | | | Value ($) | |
| Bonds - continued | | | | | | |
| Asset-Backed & Securitized - continued | | | | | | |
| Credit Acceptance Auto Loan Trust,2017-2A, “B”, 3.02%, 4/15/2026 (n) | | $ | 6,441,000 | | | $ | 6,442,020 | |
| Credit-Based Asset Servicing & Securitization LLC, 3.433%, 1/25/2037 | | | 1,913,965 | | | | 785,712 | |
| Credit-Based Asset Servicing & Securitization LLC, 3.647%, 3/25/2037 | | | 2,639,113 | | | | 1,246,997 | |
| Cutwater CLO Ltd.,2015-1A, “AR”, FLR, 2.438% (LIBOR - 3mo. + 1.22%), 1/15/2029 (n) | | | 6,896,503 | | | | 6,706,663 | |
| Cutwater Ltd.,2014-1A, “A2R”, FLR, 2.918% (LIBOR - 3mo. + 1.7%), 7/15/2026 (n) | | | 4,750,000 | | | | 4,654,249 | |
| Dell Equipment Finance Trust,2017-2, “B”, 2.47%, 10/24/2022 (n) | | | 2,718,000 | | | | 2,722,070 | |
| Dell Equipment Finance Trust,2018-2, “B”, 3.55%, 10/22/2023 (n) | | | 6,388,000 | | | | 6,483,894 | |
| Dell Equipment Finance Trust,2020-1, “A2”, 2.26%, 6/22/2022 (n) | | | 3,479,000 | | | | 3,478,304 | |
| DLL Securitization Trust,2017-A, “A3”, 2.14%, 12/15/2021 (n) | | | 981,725 | | | | 981,413 | |
| DT Auto Owner Trust,2017-1A, “D”, 3.55%, 11/15/2022 (n) | | | 1,366,681 | | | | 1,368,486 | |
| DT Auto Owner Trust,2017-3A, “D”, 3.58%, 5/15/2023 (n) | | | 5,260,716 | | | | 5,264,579 | |
| DT Auto Owner Trust,2018-2A, “C”, 3.67%, 3/15/2024 (n) | | | 1,871,999 | | | | 1,874,006 | |
| Exantas Capital Corp. CLO Ltd., 2019-RS07, “B”, FLR, 2.45%(LIBOR - 1mo. + 1.7%), 4/15/2036 (n) | | | 6,220,000 | | | | 5,291,252 | |
| Exeter Automobile Receivables Trust,2018-2A, “C”, 3.69%, 3/15/2023 (n) | | | 5,790,000 | | | | 5,821,702 | |
| Exeter Automobile Receivables Trust,2019-3A, “C”, 2.79%, 5/15/2024 (n) | | | 8,645,000 | | | | 8,464,713 | |
| Exeter Automobile Receivables Trust,2020-1, 2.26%, 4/15/2024 (n) | | | 1,460,000 | | | | 1,439,286 | |
| Exeter Automobile Receivables Trust,2020-1A, 2.49%, 1/15/2025 (n) | | | 1,990,000 | | | | 1,915,836 | |
| Figueroa CLO Ltd.,2014-1A, “BR”, FLR, 2.719% (LIBOR - 3mo. + 1.5%), 1/15/2027 (n) | | | 7,400,000 | | | | 7,149,066 | |
| Flagship CLO,2014-8A, “BRR”, FLR, 2.576% (LIBOR - 3mo. + 1.4%), 1/16/2026 (n) | | | 5,578,297 | | | | 5,300,905 | |
| Fort CRE LLC,2018-1A, “A1”, FLR, 1.975% (LIBOR - 1mo. + 1.35%), 11/16/2035 (n) | | | 7,873,500 | | | | 7,346,164 | |
| Freedom Financial,2019-1, “A”, 3.42%, 6/18/2026 (n) | | | 739,339 | | | | 724,129 | |
| General Motors,2019-1, “B”, 2.86%, 4/15/2024 (n) | | | 4,100,000 | | | | 4,020,901 | |
| General Motors,2019-1, “C”, 3.06%, 4/15/2024 (n) | | | 3,153,000 | | | | 3,075,522 | |
| GLS Auto Receivables Trust,2020-1A, “A”, 2.17%, 2/15/2024 (n) | | | 3,552,405 | | | | 3,508,864 | |
| GM Financial Automobile Leasing Trust,2020-1, “B”, 1.84%, 12/20/2023 | | | 2,495,000 | | | | 2,443,509 | |
| GM Financial Automobile Leasing Trust,2020-1, “C”, 2.04%, 12/20/2023 | | | 1,830,000 | | | | 1,772,428 | |
13
Portfolio of Investments – continued
| | | | | | | | |
| | |
| Issuer | | Shares/Par | | | Value ($) | |
| Bonds - continued | | | | | | |
| Asset-Backed & Securitized - continued | | | | | | |
| Grand Avenue CRE Ltd.,2019-FL1, “A”, FLR, 1.934% (LIBOR - 1mo. + 1.12%), 6/15/2037 (n) | | $ | 5,043,000 | | | $ | 4,839,470 | |
| Granite Point Mortgage Trust, Inc.,2018-FL1, “A” FLR, 1.573% (LIBOR - 1mo. + 0.9%), 11/21/2035 (n) | | | 2,449,997 | | | | 2,420,083 | |
| GS Mortgage Securities Trust,2010-C1, “A2”, 4.592%, 8/10/2043 (n) | | | 2,171,688 | | | | 2,174,267 | |
| GS Mortgage Securities Trust, 2015-GC32, “A2”, 3.062%, 7/10/2048 | | | 2,589,999 | | | | 2,590,723 | |
| GS Mortgage Securities Trust,2017-GS6, “XA”, 1.039%, 5/10/2050 (i) | | | 39,981,419 | | | | 2,240,523 | |
| GS Mortgage Securities Trust,2017-GS7, “XA”, 1.274%, 8/10/2050 (i) | | | 38,596,825 | | | | 2,249,149 | |
| Hertz Fleet Lease Funding LP,2017-1, “A2”, 2.13%, 4/10/2031 (n) | | | 2,168,701 | | | | 2,125,426 | |
| Hertz Fleet Lease Funding LP,2018-1, “B”, 3.64%, 5/10/2032 (n) | | | 2,752,000 | | | | 2,583,832 | |
| Hertz Fleet Lease Funding LP,2018-1, “C”, 3.77%, 5/10/2032 (n) | | | 1,580,000 | | | | 1,465,464 | |
| IMPAC CMB Trust, FLR, 1.227% (LIBOR - 1mo. + 0.74%), 11/25/2034 | | | 86,035 | | | | 82,938 | |
| IMPAC CMB Trust, FLR, 1.407% (LIBOR - 1mo. + 0.92%), 11/25/2034 | | | 90,563 | | | | 85,330 | |
| IMPAC Secured Assets Corp., FLR, 0.837% (LIBOR - 1mo. + 0.35%), 5/25/2036 | | | 221,985 | | | | 189,524 | |
| Interstar Millennium Trust, FLR, 1.141% (LIBOR - 3mo. + 0.4%), 3/14/2036 | | | 54,209 | | | | 50,788 | |
| Invitation Homes Trust, 2018-SFR1, “B”, FLR, 1.7% (LIBOR - 1mo. + 0.95%), 3/17/2037 (n) | | | 3,498,000 | | | | 3,279,323 | |
| Invitation Homes Trust, 2018-SFR2, “A”, FLR, 1.601% (LIBOR - 1mo. + 0.85%), 12/17/2036 (n) | | | 6,445,041 | | | | 6,231,103 | |
| Invitation Homes Trust, 2018-SFR2, “A”, FLR, 1.714% (LIBOR - 1mo. + 0.9%), 6/17/2037 (n) | | | 12,038,180 | | | | 11,627,588 | |
| JPMorgan Chase & Co., 4.717%, 2/15/2046 (n) | | | 5,722,376 | | | | 5,797,677 | |
| JPMorgan Chase Commercial Mortgage Securities Corp., 1.213%, 9/15/2050 (i) | | | 39,730,695 | | | | 2,103,518 | |
| KKR Real Estate Financial Trust, Inc.,2018-FL1, “C”, FLR, 2.751%(LIBOR - 1mo. + 2%), 6/15/2036 (n) | | | 3,789,000 | | | | 3,259,646 | |
| LoanCore Ltd., 2018-CRE1, “AS”, FLR, 2.314% (LIBOR - 1mo. + 1.5%), 5/15/2028 (n) | | | 5,578,000 | | | | 5,138,576 | |
| LoanCore Ltd., 2018-CRE1, “C”, FLR, 3.364% (LIBOR - 1mo. + 2.55%), 5/15/2028 (n) | | | 1,859,500 | | | | 1,569,990 | |
| LoanCore Ltd., 2019-CRE3, “A”, FLR, 1.864% (LIBOR - 1mo. + 1.05%), 4/15/2034 (n) | | | 5,044,500 | | | | 4,705,156 | |
| LoanCore Ltd., 2019-CRE3, “AS”, FLR, 2.184% (LIBOR - 1mo. + 1.37%), 4/15/2034 (n) | | | 7,368,000 | | | | 6,606,772 | |
14
Portfolio of Investments – continued
| | | | | | | | |
| | |
| Issuer | | Shares/Par | | | Value ($) | |
| Bonds - continued | | | | | | |
| Asset-Backed & Securitized - continued | | | | | | |
| Loomis, Sayles & Co., CLO, “A2”, FLR, 2.618% (LIBOR - 3mo. + 1.4%), 4/15/2028 (n) | | $ | 8,246,053 | | | $ | 7,751,809 | |
| Loomis, Sayles & Co., CLO,2015-2A, “A1R”, FLR, 2.118% (LIBOR - 3mo. + 0.9%), 4/15/2028 (n) | | | 4,001,385 | | | | 3,821,322 | |
| Madison Park Funding Ltd.,2014-13A, “BR2”, FLR, 2.635% (LIBOR - 3mo. + 1.5%), 4/19/2030 (n) | | | 6,806,093 | | | | 6,468,504 | |
| Madison Park Funding Ltd.,2014-15A, “A2R”, FLR, 2.491% (LIBOR - 3mo. + 1.5%), 1/27/2026 (n) | | | 7,414,000 | | | | 7,156,378 | |
| Magnetite CLO Ltd.,2015-16A, “BR”, FLR, 2.335% (LIBOR - 3mo. + 1.2%), 1/18/2028 (n) | | | 9,726,000 | | | | 9,201,282 | |
| Man GLG U.S. CLO Ltd.,2018-2A, “BR”, FLR, 3.668% (LIBOR - 3mo. + 2.45%), 10/15/2028 | | | 6,297,302 | | | | 5,656,356 | |
| Merrill Lynch Mortgage Investors, Inc., 3.792%, 2/25/2037 (a)(d)(q) | | | 1,789,859 | | | | 329,183 | |
| MF1 CLO Ltd.,2019-FL2, “A”, FLR, 1.617% (LIBOR - 1mo. + 1.13%), 12/25/2034 (n) | | | 5,056,000 | | | | 4,616,447 | |
| MF1 CLO Ltd.,2019-FL2, “AS”, FLR, 1.917% (LIBOR - 1mo. + 1.43%), 12/25/2034 (n) | | | 5,056,000 | | | | 4,579,173 | |
| MidOcean Credit CLO,2012-1A, “A2RR”, FLR, 2.519% (LIBOR - 3mo. + 1.3%), 1/15/2024 (n) | | | 8,303,141 | | | | 7,864,951 | |
| Morgan Stanley Bank of America Merrill Lynch Trust, 2.655%, 2/15/2046 | | | 5,146,113 | | | | 5,168,847 | |
| Morgan Stanley Bank of America Merrill Lynch Trust,2017-C33, “XA”, 1.573%, 5/15/2050 (i) | | | 43,214,769 | | | | 2,582,402 | |
| Morgan Stanley Capital I Trust,2017-H1, “XA”, 1.588%, 6/15/2050 (i) | | | 18,646,785 | | | | 1,212,360 | |
| Morgan Stanley Capital I Trust,2018-H4, “XA”, 1.032%, 12/15/2051 (i) | | | 54,237,700 | | | | 3,089,108 | |
| Mountain Hawk CLO Ltd.,2014-3A, “BR”, FLR, 2.935% (LIBOR - 3mo. + 1.8%), 4/18/2025 (n) | | | 8,600,000 | | | | 8,347,349 | |
| Nationstar HECM Loan Trust,2018-2A, “M1”, 3.551%, 7/25/2028 (n) | | | 3,332,000 | | | | 3,315,133 | |
| Nationstar HECM Loan Trust,2018-3, “A”, 3.554%, 11/25/2028 (n) | | | 1,468,156 | | | | 1,470,229 | |
| Nationstar HECM Loan Trust,2018-3A, “M1”, 3.903%, 11/25/2028 (n) | | | 3,700,000 | | | | 3,697,928 | |
| Nationstar HECM Loan Trust,2019-1A, “A”, 2.651%, 6/25/2029 (n) | | | 1,679,793 | | | | 1,673,787 | |
| Navistar Financial Dealer Note Master Owner Trust,2018-1, “B”, FLR, 1.287% (LIBOR - 1mo. + 0.8%), 9/25/2023 (n) | | | 924,000 | | | | 901,536 | |
| Navistar Financial Dealer Note Master Owner Trust,2018-1, “C”, FLR, 1.537% (LIBOR - 1mo. + 1.05%), 9/25/2023 (n) | | | 1,039,000 | | | | 1,013,136 | |
| Navistar Financial Dealer Note Master Owner Trust,2019-1, “C”, FLR, 1.437% (LIBOR - 1mo. + 0.95%), 5/25/2024 (n) | | | 1,471,000 | | | | 1,437,171 | |
15
Portfolio of Investments – continued
| | | | | | | | |
| | |
| Issuer | | Shares/Par | | | Value ($) | |
| Bonds - continued | | | | | | |
| Asset-Backed & Securitized - continued | | | | | | |
| Neuberger Berman CLO Ltd.,2016-21A, “CR”, FLR, 2.735% (LIBOR - 3mo. + 1.6%), 4/20/2027 (n) | | $ | 5,023,883 | | | $ | 4,660,189 | |
| NextGear Floorplan Master Owner Trust,2017-2A, “B”, 3.02%, 10/17/2022 (n) | | | 2,577,000 | | | | 2,559,142 | |
| NextGear Floorplan Master Owner Trust,2019-2A, “A2”, 2.07%, 10/15/2024 (n) | | | 3,908,000 | | | | 3,769,463 | |
| OneMain Financial Issuance Trust,17-1A, “B”, 2.79%, 9/14/2032 (n) | | | 4,500,000 | | | | 4,156,459 | |
| OneMain Financial Issuance Trust,2020-1A, “A”, 3.84%, 5/14/2032 (n) | | | 7,992,153 | | | | 7,992,153 | |
| Oscar U.S. Funding Trust,2017-1A, “A3”, 2.82%, 6/10/2021 (n) | | | 6,409 | | | | 6,451 | |
| Oscar U.S. Funding Trust,2018-2A, “A3”, 3.39%, 9/12/2022 (n) | | | 2,710,000 | | | | 2,750,035 | |
| Ownit Mortgage Loan Asset-Backed Certificates, 3.121%, 10/25/2035 | | | 1,247,954 | | | | 751,626 | |
| Palmer Square Loan Funding Ltd.,2020-1A, “A2”, FLR, 3.033% (LIBOR - 3mo. + 1.35%), 2/20/2028 (n) | | | 13,000,000 | | | | 12,296,531 | |
| PFS Financing Corp.,2019-B, “A”, FLR, 1.364% (LIBOR - 1mo. + 0.55%), 9/15/2023 (n) | | | 7,509,000 | | | | 7,275,652 | |
| Santander Drive Auto Receivables Trust,2017-2, “C”, 2.79%, 8/15/2022 | | | 708,658 | | | | 708,758 | |
| Santander Drive Auto Receivables Trust,2018-1, “B”, 2.63%, 7/15/2022 | | | 37,246 | | | | 37,258 | |
| Santander Drive Auto Receivables Trust,2019-2, “B”, 2.79%, 1/16/2024 | | | 4,920,000 | | | | 4,929,735 | |
| Santander Retail Auto Lease Trust,2017-A, “B”, 2.68%, 1/20/2022 (n) | | | 3,246,000 | | | | 3,250,686 | |
| Securitized Term Auto Receivable Trust, 2019-CRTA, “B”, 2.453%, 3/25/2026 (n) | | | 1,376,848 | | | | 1,379,326 | |
| Securitized Term Auto Receivable Trust, 2019-CRTA, “C”, 2.849%, 3/25/2026 (n) | | | 1,763,937 | | | | 1,767,102 | |
| Shackelton CLO Ltd.,2013-4RA, “B”, FLR, 3.211% (LIBOR - 3mo. + 1.9%), 4/13/2031 (n) | | | 2,268,542 | | | | 1,957,629 | |
| Shackleton CLO Ltd.,2015-8A, “CR”, FLR, 2.785% (LIBOR - 3mo. + 1.65%), 10/20/2027 (n) | | | 2,414,922 | | | | 2,135,025 | |
| Shelter Growth CRE,2019-FL2, “A”, FLR, 1.914% (LIBOR - 1mo. + 1.1%), 5/15/2036 (n) | | | 9,381,839 | | | | 8,676,916 | |
| SPS Servicer Advance Receivables Trust, 2.24%, 10/15/2051 (n) | | | 4,500,000 | | | | 4,440,774 | |
| SPS Servicer Advance Receivables Trust, 2.34%, 10/15/2051 (n) | | | 817,000 | | | | 806,158 | |
| SPS Servicer Advance Receivables Trust, 2.39%, 10/15/2051 (n) | | | 982,000 | | | | 968,981 | |
| Starwood Waypoint Homes Trust,2017-1, “B”, FLR, 1.984% (LIBOR - 1mo. + 1.17%), 1/17/2035 (n) | | | 5,019,511 | | | | 4,842,824 | |
| Thacher Park CLO Ltd.,2014-1A, “CR”, FLR, 3.335% (LIBOR - 3mo. + 2.2%), 10/20/2026 (n) | | | 4,301,000 | | | | 4,096,900 | |
16
Portfolio of Investments – continued
| | | | | | | | |
| | |
| Issuer | | Shares/Par | | | Value ($) | |
| Bonds - continued | | | | | | |
| Asset-Backed & Securitized - continued | | | | | | |
| Thornburg Mortgage Securities Trust, FLR, 1.167% (LIBOR - 1mo. + 0.68%), 4/25/2043 | | $ | 178,888 | | | $ | 173,910 | |
| TICP CLO Ltd.,2018-3R, “B”, FLR, 2.485% (LIBOR - 3mo. + 1.35%), 4/20/2028 (n) | | | 2,132,575 | | | | 2,010,835 | |
| TICP CLO Ltd.,2018-3R, “C”, FLR, 2.935% (LIBOR - 3mo. + 1.8%), 4/20/2028 (n) | | | 3,742,444 | | | | 3,470,787 | |
| TPG Real Estate Finance,2018-FL2, “AS”, FLR, 2.201% (LIBOR - 1mo. + 1.45%), 11/15/2037 (n) | | | 6,176,000 | | | | 5,685,896 | |
| Tricon American Homes Trust, 2015-SFR1, “1A”, 2.589%, 11/17/2033 (n) | | | 11,206,955 | | | | 11,230,794 | |
| UBS Commercial Mortgage Trust,2017-C1, “XA”, 1.158%, 11/15/2050 (i) | | | 30,659,322 | | | | 1,561,427 | |
| UBS Commercial Mortgage Trust,2018-C14, “XA”, 1.176%, 12/15/2051 (i) | | | 26,054,602 | | | | 1,694,617 | |
| Verizon Owner Trust,2017-3A, “B”, 2.38%, 4/20/2022 (n) | | | 3,075,000 | | | | 3,083,541 | |
| Veros Auto Receivables Trust,2018-1, “A”, 3.63%, 5/15/2023 (n) | | | 357,579 | | | | 357,587 | |
| Veros Auto Receivables Trust,2020-1, “A”, 1.67%, 9/15/2023 (n) | | | 4,980,095 | | | | 4,936,271 | |
| West CLO Ltd.,2013-1A, “A2BR”, 3.393%, 11/07/2025 (n) | | | 1,140,522 | | | | 1,140,527 | |
| West CLO Ltd.,2014-2A, “A1BR”, 2.724%, 1/16/2027 (n) | | | 2,095,353 | | | | 2,084,876 | |
| WF-RBS Commercial Mortgage Trust,2011-C3, “A4”, 4.375%, 3/15/2044 (n) | | | 7,430,817 | | | | 7,484,161 | |
| Wind River CLO Ltd.,2012-1A, “BR2”, FLR, 2.668% (LIBOR - 3mo. + 1.45%), 1/15/2026 (n) | | | 7,668,906 | | | | 7,517,499 | |
| Wind River CLO Ltd.,2015-2A, “CR”, FLR, 2.919% (LIBOR - 3mo. + 1.7%), 10/15/2027 (n) | | | 2,785,924 | | | | 2,549,095 | |
| | | | | | | | |
| | | | | | | $ | 556,467,721 | |
| Automotive - 4.1% | | | | | | |
| BMW U.S. Capital LLC, 3.1%, 4/12/2021 (n) | | $ | 6,163,000 | | | $ | 6,191,702 | |
| Ford Motor Credit Co. LLC, 5.085%, 1/07/2021 | | | 3,414,000 | | | | 3,337,185 | |
| Ford Motor Credit Co. LLC, 5.75%, 2/01/2021 | | | 4,369,000 | | | | 4,259,775 | |
| Ford Motor Credit Co. LLC, 3.087%, 1/09/2023 | | | 3,353,000 | | | | 3,016,652 | |
| Ford Motor Credit Co. LLC, 4.063%, 11/01/2024 | | | 7,180,000 | | | | 6,246,600 | |
| Harley-Davidson Financial Services, 4.05%, 2/04/2022 (n) | | | 4,372,000 | | | | 4,380,617 | |
| Harley-Davidson Financial Services, FLR, 2.52% (LIBOR - 3mo. + 0.94%), 3/02/2021 (n) | | | 4,773,000 | | | | 4,692,189 | |
| Hyundai Capital America, 3.75%, 7/08/2021 (n) | | | 3,173,000 | | | | 3,184,232 | |
| Hyundai Capital America, 2.85%, 11/01/2022 (n) | | | 4,203,000 | | | | 4,100,993 | |
| Hyundai Capital America, 2.375%, 2/10/2023 (n) | | | 2,145,000 | | | | 2,063,977 | |
| Hyundai Capital America, 5.75%, 4/06/2023 (n) | | | 5,059,000 | | | | 5,352,983 | |
| Toyota Motor Credit Corp., 2.9%, 3/30/2023 | | | 6,900,000 | | | | 7,232,518 | |
| Toyota Motor Credit Corp., 3%, 4/01/2025 | | | 9,200,000 | | | | 9,807,937 | |
| Volkswagen Group of America Co., 3.875%, 11/13/2020 (n) | | | 3,789,000 | | | | 3,795,155 | |
17
Portfolio of Investments – continued
| | | | | | | | |
| | |
| Issuer | | Shares/Par | | | Value ($) | |
| Bonds - continued | | | | | | |
| Automotive - continued | | | | | | |
| Volkswagen Group of America Co., 4%, 11/12/2021 (n) | | $ | 3,789,000 | | | $ | 3,848,594 | |
| Volkswagen Group of America Co., 2.85%, 9/26/2024 (n) | | | 4,128,000 | | | | 4,052,886 | |
| | | | | | | | |
| | | | | | | $ | 75,563,995 | |
| Broadcasting - 0.5% | | | | | | |
| Fox Corp., 3.666%, 1/25/2022 | | $ | 2,478,000 | | | $ | 2,568,004 | |
| Fox Corp., 3.05%, 4/07/2025 | | | 2,523,000 | | | | 2,677,589 | |
| Interpublic Group of Companies, Inc., 3.5%, 10/01/2020 | | | 4,621,000 | | | | 4,650,711 | |
| | | | | | | | |
| | | | | | | $ | 9,896,304 | |
| Brokerage & Asset Managers - 1.9% | | | | | | |
| E*TRADE Financial Corp., 2.95%, 8/24/2022 | | $ | 12,941,000 | | | $ | 13,212,542 | |
| Intercontinental Exchange, Inc., 2.75%, 12/01/2020 | | | 8,540,000 | | | | 8,614,725 | |
| National Securities Clearing Corp., 1.2%, 4/23/2023 (n) | | | 9,500,000 | | | | 9,504,343 | |
| National Securities Clearing Corp., 1.5%, 4/23/2025 (n) | | | 3,257,000 | | | | 3,273,744 | |
| | | | | | | | |
| | | | | | | $ | 34,605,354 | |
| Business Services - 0.0% | | | | | | |
| NXP Semiconductors N.V., 2.7%, 5/01/2025 (n) | | $ | 666,000 | | | $ | 673,388 | |
| | |
| Cable TV - 0.7% | | | | | | |
| Comcast Corp., 3.1%, 4/01/2025 | | $ | 3,000,000 | | | $ | 3,236,602 | |
| SES S.A., 3.6%, 4/04/2023 (n) | | | 10,292,000 | | | | 10,114,279 | |
| | | | | | | | |
| | | | | | | $ | 13,350,881 | |
| Chemicals - 0.7% | | | | | | |
| DuPont de Nemours, Inc., 2.169%, 5/01/2023 | | $ | 12,777,000 | | | $ | 12,862,241 | |
| | |
| Computer Software - 1.0% | | | | | | |
| Dell International LLC/EMC Corp., 5.85%, 7/15/2025 (n) | | $ | 1,522,000 | | | $ | 1,655,528 | |
| Dell Investments LLC/EMC Corp., 4.42%, 6/15/2021 | | | 11,246,000 | | | | 11,428,626 | |
| Dell Investments LLC/EMC Corp., 4%, 7/15/2024 (n) | | | 4,900,000 | | | | 4,974,638 | |
| | | | | | | | |
| | | | | | | $ | 18,058,792 | |
| Computer Software - Systems - 0.3% | | | | | | |
| Apple, Inc., 1.7%, 9/11/2022 | | $ | 4,996,000 | | | $ | 5,125,558 | |
| | |
| Conglomerates - 0.9% | | | | | | |
| Roper Technologies, Inc., 2.8%, 12/15/2021 | | $ | 5,166,000 | | | $ | 5,269,837 | |
| Westinghouse Air Brake Technologies Corp., 4.4%, 3/15/2024 | | | 9,068,000 | | | | 9,104,373 | |
| Westinghouse Air Brake Technologies Corp., FLR, 2.04% (LIBOR - 3mo. + 1.05%), 9/15/2021 | | | 2,310,000 | | | | 2,228,715 | |
| | | | | | | | |
| | | | | | | $ | 16,602,925 | |
18
Portfolio of Investments – continued
| | | | | | | | |
| | |
| Issuer | | Shares/Par | | | Value ($) | |
| Bonds - continued | | | | | | |
| Consumer Products - 0.5% | | | | | | |
| Reckitt Benckiser Treasury Services PLC, 2.375%, 6/24/2022 (n) | | $ | 8,307,000 | | | $ | 8,457,927 | |
| | |
| Consumer Services - 0.8% | | | | | | |
| Alibaba Group Holding Ltd., 2.8%, 6/06/2023 | | $ | 5,754,000 | | | $ | 5,947,492 | |
| Booking Holdings, Inc., 4.1%, 4/13/2025 | | | 3,164,000 | | | | 3,360,676 | |
| QVC, Inc., 5.125%, 7/02/2022 | | | 4,761,000 | | | | 4,677,683 | |
| | | | | | | | |
| | | | | | | $ | 13,985,851 | |
| Electronics - 0.7% | | | | | | |
| Broadcom Corp./Broadcom Cayman Finance Ltd., 3.625%, 1/15/2024 | | $ | 3,547,000 | | | $ | 3,703,318 | |
| Broadcom, Inc., 4.7%, 4/15/2025 (n) | | | 2,207,000 | | | | 2,433,552 | |
| Microchip Technology, Inc., 3.922%, 6/01/2021 | | | 5,910,000 | | | | 6,005,704 | |
| | | | | | | | |
| | | | | | | $ | 12,142,574 | |
| Emerging Market Quasi-Sovereign - 0.5% | | | | | | |
| Bharat Petroleum Corp. Ltd., 4.625%, 10/25/2022 | | $ | 5,946,000 | | | $ | 5,917,459 | |
| Indian Oil Corp. Ltd., 5.75%, 8/01/2023 | | | 2,973,000 | | | | 3,039,804 | |
| | | | | | | | |
| | | | | | | $ | 8,957,263 | |
| Energy - Integrated - 1.7% | | | | | | |
| Cenovus Energy, Inc., 3%, 8/15/2022 | | $ | 5,195,000 | | | $ | 4,584,985 | |
| Cenovus Energy, Inc., 3.8%, 9/15/2023 | | | 2,432,000 | | | | 2,029,176 | |
| Eni S.p.A., 4%, 9/12/2023 (n) | | | 5,011,000 | | | | 5,106,727 | |
| Exxon Mobil Corp., 1.571%, 4/15/2023 | | | 9,200,000 | | | | 9,317,601 | |
| Exxon Mobil Corp., 2.992%, 3/19/2025 | | | 8,910,000 | | | | 9,515,263 | |
| | | | | | | | |
| | | | | | | $ | 30,553,752 | |
| Entertainment - 0.2% | | | | | | |
| Royal Caribbean Cruises Ltd., 2.65%, 11/28/2020 | | $ | 3,003,000 | | | $ | 2,732,117 | |
| | |
| Financial Institutions - 1.3% | | | | | | |
| AerCap Ireland Capital DAC, 4.45%, 12/16/2021 | | $ | 5,924,000 | | | $ | 5,523,775 | |
| AerCap Ireland Capital DAC, 4.875%, 1/16/2024 | | | 6,254,000 | | | | 5,804,905 | |
| Avolon Holdings Funding Ltd., 3.625%, 5/01/2022 (n) | | | 6,364,000 | | | | 5,825,856 | |
| Avolon Holdings Funding Ltd., 3.95%, 7/01/2024 (n) | | | 5,703,000 | | | | 4,906,968 | |
| Century Housing Corp., 3.995%, 11/01/2021 | | | 2,421,000 | | | | 2,530,325 | |
| | | | | | | | |
| | | | | | | $ | 24,591,829 | |
| Food & Beverages - 1.4% | | | | | | |
| Conagra Brands, Inc., 3.8%, 10/22/2021 | | $ | 3,274,000 | | | $ | 3,376,739 | |
| Conagra Brands, Inc., FLR, 1.847% (LIBOR - 3mo. + 0.75%), 10/22/2020 | | | 1,225,000 | | | | 1,223,374 | |
| Constellation Brands, Inc., 4.25%, 5/01/2023 | | | 5,791,000 | | | | 6,206,785 | |
19
Portfolio of Investments – continued
| | | | | | | | |
| | |
| Issuer | | Shares/Par | | | Value ($) | |
| Bonds - continued | | | | | | |
| Food & Beverages - continued | | | | | | |
| Constellation Brands, Inc., FLR, 2.391% (LIBOR - 3mo. + 0.7%), 11/15/2021 | | $ | 2,341,000 | | | $ | 2,303,612 | |
| Diageo Capital PLC, 3%, 5/18/2020 | | | 3,777,000 | | | | 3,780,582 | |
| Diageo Capital PLC, 1.375%, 9/29/2025 | | | 3,816,000 | | | | 3,814,290 | |
| Mondelez International, Inc., 2.125%, 4/13/2023 | | | 3,448,000 | | | | 3,509,643 | |
| Pernod Ricard S.A., 5.75%, 4/07/2021 (n) | | | 1,900,000 | | | | 1,970,291 | |
| | | | | | | | |
| | | | | | | $ | 26,185,316 | |
| Gaming & Lodging - 1.1% | | | | | | |
| GLP Capital LP/GLP Financing II, Inc., 5.375%, 11/01/2023 | | $ | 4,936,000 | | | $ | 4,787,920 | |
| Las Vegas Sands Corp., 3.2%, 8/08/2024 | | | 5,950,000 | | | | 5,782,794 | |
| Marriott International, Inc., 2.3%, 1/15/2022 | | | 7,903,000 | | | | 7,654,833 | |
| Marriott International, Inc., 5.75%, 5/01/2025 | | | 1,105,000 | | | | 1,154,797 | |
| Marriott International, Inc., 3.75%, 10/01/2025 | | | 1,655,000 | | | | 1,562,771 | |
| | | | | | | | |
| | | | | | | $ | 20,943,115 | |
| Industrial - 0.1% | | | | | | |
| Howard University, Washington D.C., 2.638%, 10/01/2021 | | $ | 366,000 | | | $ | 368,719 | |
| Howard University, Washington D.C., 2.738%, 10/01/2022 | | | 385,000 | | | | 389,292 | |
| Howard University, Washington D.C., 2.801%, 10/01/2023 | | | 424,000 | | | | 433,020 | |
| Howard University, Washington D.C., 2.416%, 10/01/2024 | | | 467,000 | | | | 476,213 | |
| Howard University, Washington D.C., 2.516%, 10/01/2025 | | | 578,000 | | | | 577,776 | |
| | | | | | | | |
| | | | | | | $ | 2,245,020 | |
| Insurance - Health - 0.4% | | | | | | |
| UnitedHealth Group, Inc., 1.95%, 10/15/2020 | | $ | 6,409,000 | | | $ | 6,409,148 | |
| | |
| Insurance - Property & Casualty - 0.5% | | | | | | |
| Ambac Assurance Corp., 5.1%, 6/07/2020 (n) | | $ | 23,513 | | | $ | 31,273 | |
| Ambac LSNI, LLC, FLR, 6.45% (LIBOR - 3mo. + 5%), 2/12/2023 (n) | | | 88,422 | | | | 84,001 | |
| Aon PLC, 2.2%, 11/15/2022 | | | 3,374,000 | | | | 3,436,690 | |
| Marsh & McLennan Cos., Inc., 2.75%, 1/30/2022 | | | 4,842,000 | | | | 4,990,041 | |
| | | | | | | | |
| | | | | | | $ | 8,542,005 | |
| International Market Quasi-Sovereign - 0.6% | | | | | | |
| Dexia Credit Local S.A. (Kingdom of Belgium), 1.875%, 9/15/2021 (n) | | $ | 7,590,000 | | | $ | 7,719,683 | |
| Kommunalbanken A.S. (Kingdom of Norway), 1.375%, 10/26/2020 (n) | | | 3,870,000 | | | | 3,887,376 | |
| | | | | | | | |
| | | | | | | $ | 11,607,059 | |
| Internet - 0.2% | | | | | | |
| Baidu, Inc., 3.875%, 9/29/2023 | | $ | 3,736,000 | | | $ | 3,894,033 | |
20
Portfolio of Investments – continued
| | | | | | | | |
| | |
| Issuer | | Shares/Par | | | Value ($) | |
| Bonds - continued | | | | | | |
| Machinery & Tools - 0.7% | | | | | | |
| CNH Industrial Capital LLC, 4.2%, 1/15/2024 | | $ | 6,502,000 | | | $ | 6,785,319 | |
| CNH Industrial N.V., 4.5%, 8/15/2023 | | | 4,043,000 | | | | 4,139,586 | |
| Deere & Co., 2.75%, 4/15/2025 | | | 2,375,000 | | | | 2,528,532 | |
| | | | | | | | |
| | | | | | | $ | 13,453,437 | |
| Major Banks - 13.2% | | | | | | |
| ABN AMRO Bank N.V., 2.65%, 1/19/2021 (n) | | $ | 5,197,000 | | | $ | 5,244,189 | |
| Bank of America Corp., 2.369%, 7/21/2021 | | | 12,687,000 | | | | 12,694,022 | |
| Bank of America Corp., 2.738% to 1/23/2021, FLR (LIBOR - 3mo. + 2.738%) to 1/23/2022 | | | 16,298,000 | | | | 16,398,923 | |
| Bank of America Corp., 2.881%, 4/24/2023 | | | 7,801,000 | | | | 7,971,011 | |
| Bank of America Corp., 4.2%, 8/26/2024 | | | 3,106,000 | | | | 3,360,678 | |
| Bank of Montreal, 2.05%, 11/01/2022 | | | 4,809,000 | | | | 4,894,687 | |
| Barclays PLC, 4.61%, 2/15/2023 | | | 14,012,000 | | | | 14,558,945 | |
| Barclays PLC, 2.852%, 5/07/2026 | | | 2,564,000 | | | | 2,564,000 | |
| Citibank N.A., 2.125%, 10/20/2020 | | | 7,397,000 | | | | 7,428,010 | |
| Credit Agricole, “A”, FLR, 2.741% (LIBOR - 3mo. + 1.43%), 1/10/2022 (n) | | | 3,030,000 | | | | 3,020,780 | |
| Credit Suisse Group AG, 3.574%, 1/09/2023 (n) | | | 4,820,000 | | | | 4,933,151 | |
| DNB Bank A.S.A., 2.125%, 10/02/2020 (n) | | | 6,394,000 | | | | 6,424,167 | |
| Goldman Sachs Group, Inc., 3%, 4/26/2022 | | | 11,318,000 | | | | 11,465,707 | |
| Goldman Sachs Group, Inc., 3.5%, 4/01/2025 | | | 5,300,000 | | | | 5,639,553 | |
| HSBC Holdings PLC, 3.262% to 3/13/2022, FLR (LIBOR - 3mo. + 1.055%) to 3/13/2023 | | | 4,311,000 | | | | 4,420,526 | |
| HSBC Holdings PLC, 3.033% to 11/22/2022, FLR (LIBOR - 3mo. + 0.923%) to 11/22/2023 | | | 3,245,000 | | | | 3,339,873 | |
| JPMorgan Chase & Co., 3.25%, 9/23/2022 | | | 6,867,000 | | | | 7,185,984 | |
| JPMorgan Chase & Co., 3.207% to 4/01/2022, FLR (LIBOR - 3mo. + 0.695%) to 4/01/2023 | | | 9,760,000 | | | | 10,068,397 | |
| JPMorgan Chase & Co., 2.776% to 4/25/2022, FLR (LIBOR - 3mo. + 0.935%) to 4/25/2023 | | | 7,272,000 | | | | 7,446,044 | |
| JPMorgan Chase & Co., 3.375%, 5/01/2023 | | | 4,455,000 | | | | 4,665,018 | |
| JPMorgan Chase & Co., 2.005% to 3/13/2025, FLR (SOFR + 1.585%) to 3/13/2026 | | | 7,223,000 | | | | 7,293,107 | |
| KeyBank N.A., 3.3%, 2/01/2022 | | | 2,685,000 | | | | 2,770,316 | |
| Mitsubishi UFJ Financial Group, Inc., 2.95%, 3/01/2021 | | | 932,000 | | | | 946,456 | |
| Mitsubishi UFJ Financial Group, Inc., 3.535%, 7/26/2021 | | | 4,535,000 | | | | 4,648,325 | |
| Mitsubishi UFJ Financial Group, Inc., 2.623%, 7/18/2022 | | | 7,462,000 | | | | 7,613,100 | |
| Morgan Stanley, 5.5%, 7/28/2021 | | | 7,039,000 | | | | 7,382,664 | |
| NatWest Markets PLC, 3.625%, 9/29/2022 (n) | | | 2,861,000 | | | | 2,952,693 | |
| Royal Bank of Canada, 1.6%, 4/17/2023 | | | 10,000,000 | | | | 10,047,001 | |
| Royal Bank of Scotland Group PLC, 4.269% to 3/22/2024, FLR (LIBOR - 3mo. + 1.762%) to 3/22/2025 | | | 4,424,000 | | | | 4,685,124 | |
21
Portfolio of Investments – continued
| | | | | | | | |
| | |
| Issuer | | Shares/Par | | | Value ($) | |
| Bonds - continued | | | | | | |
| Major Banks - continued | | | | | | |
| State Street Corp., 2.825% to 3/30/2022, FLR (SOFR + 2.69%) to 3/30/2023 (n) | | $ | 2,834,000 | | | $ | 2,912,484 | |
| State Street Corp., 2.901% to 3/30/2025, FLR (SOFR + 2.7%) to 3/30/2026 (n) | | | 1,300,000 | | | | 1,380,723 | |
| UBS Group Funding (Switzerland) AG, 2.65%, 2/01/2022 (n) | | | 8,927,000 | | | | 9,080,282 | |
| UBS Group Funding (Switzerland) AG, 3.491%, 5/23/2023 (n) | | | 12,134,000 | | | | 12,487,331 | |
| UBS Group Funding Ltd., 3%, 4/15/2021 (n) | | | 6,146,000 | | | | 6,211,732 | |
| UniCredito Italiano S.p.A., 6.572%, 1/14/2022 (n) | | | 4,734,000 | | | | 4,882,742 | |
| UniCredito Italiano S.p.A., 3.75%, 4/12/2022 (n) | | | 4,503,000 | | | | 4,548,453 | |
| Wells Fargo & Co., 2.164% to 2/11/2025, FLR (LIBOR - 3mo. + 0.75%) to 2/11/2026 | | | 9,707,000 | | | | 9,753,909 | |
| | | | | | | | |
| | | | | | | $ | 243,320,107 | |
| Medical & Health Technology & Services - 1.0% | | | | | | |
| Becton, Dickinson and Co., 2.404%, 6/05/2020 | | $ | 2,975,000 | | | $ | 2,974,498 | |
| Becton, Dickinson and Co., 2.894%, 6/06/2022 | | | 3,466,000 | | | | 3,553,889 | |
| Cigna Corp., FLR, 1.493% (LIBOR - 3mo. + 0.65%), 9/17/2021 | | | 4,598,000 | | | | 4,520,433 | |
| HCA, Inc., 5%, 3/15/2024 | | | 7,222,000 | | | | 7,834,227 | |
| | | | | | | | |
| | | | | | | $ | 18,883,047 | |
| Medical Equipment - 0.1% | | | | | | |
| Zimmer Biomet Holdings, Inc., FLR, 1.802% (LIBOR - 3mo. + 0.75%), 3/19/2021 | | $ | 1,298,000 | | | $ | 1,283,983 | |
| | |
| Metals & Mining - 1.4% | | | | | | |
| Anglo American Capital PLC, 3.625%, 9/11/2024 (n) | | $ | 3,044,000 | | | $ | 3,047,160 | |
| Anglo American Capital PLC, 5.375%, 4/01/2025 (n) | | | 4,500,000 | | | | 4,841,412 | |
| Glencore Finance (Canada) Ltd., 4.95%, 11/15/2021 (n) | | | 2,282,000 | | | | 2,345,417 | |
| Glencore Funding LLC, 3%, 10/27/2022 (n) | | | 2,204,000 | | | | 2,186,699 | |
| Glencore Funding LLC, 4.125%, 3/12/2024 (n) | | | 4,410,000 | | | | 4,523,826 | |
| Steel Dynamics, Inc., 4.125%, 9/15/2025 | | | 9,352,000 | | | | 9,351,336 | |
| | | | | | | | |
| | | | | | | $ | 26,295,850 | |
| Midstream - 1.6% | | | | | | |
| El Paso LLC, 6.5%, 9/15/2020 | | $ | 6,336,000 | | | $ | 6,408,972 | |
| Energy Transfer Operating Co., 2.9%, 5/15/2025 | | | 2,394,000 | | | | 2,228,381 | |
| MPLX LP, 3.5%, 12/01/2022 (n) | | | 8,713,000 | | | | 8,605,419 | |
| MPLX LP, 3.375%, 3/15/2023 | | | 1,725,000 | | | | 1,694,458 | |
| MPLX LP, FLR, 1.899% (LIBOR - 3mo. + 0.9%), 9/09/2021 | | | 3,497,000 | | | | 3,289,952 | |
| Western Midstream Operating LP, 3.1%, 2/01/2025 | | | 3,357,000 | | | | 3,063,263 | |
| Western Midstream Operating LP, FLR, 2.161% (LIBOR - 3mo. + 0.85%), 1/13/2023 | | | 4,795,000 | | | | 3,908,437 | |
| | | | | | | | |
| | | | | | | $ | 29,198,882 | |
22
Portfolio of Investments – continued
| | | | | | | | |
| | |
| Issuer | | Shares/Par | | | Value ($) | |
| Bonds - continued | | | | | | |
| Mortgage-Backed - 1.3% | | | | | | |
| Fannie Mae, 5%, 12/01/2020 - 7/01/2023 | | $ | 107,307 | | | $ | 112,633 | |
| Fannie Mae, 4.5%, 3/01/2023 - 5/01/2033 | | | 305,575 | | | | 316,213 | |
| Fannie Mae, 3%, 12/01/2031 | | | 1,899,752 | | | | 2,026,149 | |
| Fannie Mae, 3.71%, 2/01/2033 | | | 20,414 | | | | 20,623 | |
| Fannie Mae, 3.605%, 3/01/2033 | | | 54,360 | | | | 54,604 | |
| Fannie Mae, 2%, 5/25/2044 | | | 4,421,485 | | | | 4,530,029 | |
| Freddie Mac, 5%, 8/01/2020 | | | 3,838 | | | | 4,027 | |
| Freddie Mac, 1.015%, 4/25/2024 (i) | | | 323,123 | | | | 8,691 | |
| Freddie Mac, 3%, 4/15/2033 - 6/15/2045 | | | 12,825,915 | | | | 13,772,274 | |
| Freddie Mac, 2%, 7/15/2042 | | | 2,413,039 | | | | 2,467,744 | |
| Ginnie Mae, 3.25%, 7/20/2032 | | | 50,202 | | | | 51,910 | |
| | | | | | | | |
| | | | | | | $ | 23,364,897 | |
| Municipals - 1.2% | | | | | | |
| Illinois Sales Tax Securitization Corp., Second Lien, “B”, 2.128%, 1/01/2023 | | $ | 1,205,000 | | | $ | 1,171,152 | |
| Illinois Sales Tax Securitization Corp., Second Lien, “B”, 2.225%, 1/01/2024 | | | 2,890,000 | | | | 2,770,845 | |
| New Jersey Economic Development Authority State Pension Funding Rev., Capital Appreciation, “B”, 0%, 2/15/2023 | | | 10,353,000 | | | | 9,910,927 | |
| New Jersey Transportation Trust Fund Authority, Transportation System, “B”, 2.384%, 6/15/2022 | | | 1,770,000 | | | | 1,792,001 | |
| New Jersey Transportation Trust Fund Authority, Transportation System, “B”, 2.551%, 6/15/2023 | | | 1,835,000 | | | | 1,866,800 | |
| New Jersey Transportation Trust Fund Authority, Transportation System, “B”, 2.631%, 6/15/2024 | | | 1,720,000 | | | | 1,756,567 | |
| Texas Transportation Commission, Central Texas Turnpike System First Tier Refunding Rev., Taxable, “B”, 1.98%, 8/15/2042 | | | 2,735,000 | | | | 2,705,599 | |
| | | | | | | | |
| | | | | | | $ | 21,973,891 | |
| Network & Telecom - 0.3% | | | | | | |
| AT&T, Inc., 3.2%, 3/01/2022 | | $ | 5,118,000 | | | $ | 5,307,127 | |
| | |
| Oil Services - 0.0% | | | | | | |
| Halliburton Co., 3.8%, 11/15/2025 | | $ | 443,000 | | | $ | 427,847 | |
| | |
| Oils - 0.8% | | | | | | |
| Marathon Petroleum Corp., 4.75%, 12/15/2023 | | $ | 6,948,000 | | | $ | 7,005,558 | |
| Phillips 66, FLR, 2.246% (LIBOR - 3mo. + 0.6%), 2/26/2021 | | | 3,020,000 | | | | 2,960,398 | |
| Valero Energy Corp., 2.85%, 4/15/2025 | | | 3,872,000 | | | | 3,840,649 | |
| | | | | | | | |
| | | | | | | $ | 13,806,605 | |
23
Portfolio of Investments – continued
| | | | | | | | |
| | |
| Issuer | | Shares/Par | | | Value ($) | |
| Bonds - continued | | | | | | |
| Other Banks & Diversified Financials - 3.8% | | | | | | |
| American Express Co., 3.7%, 11/05/2021 | | $ | 4,725,000 | | | $ | 4,876,652 | |
| Banque Federative du Credit Mutuel S.A., 2.2%, 7/20/2020 (n) | | | 6,421,000 | | | | 6,440,128 | |
| BBVA USA, 3.5%, 6/11/2021 | | | 4,852,000 | | | | 4,892,882 | |
| BBVA USA, 2.875%, 6/29/2022 | | | 6,688,000 | | | | 6,721,890 | |
| BBVA USA Bancshares, Inc., 2.5%, 8/27/2024 | | | 4,237,000 | | | | 4,146,763 | |
| Citigroup, Inc., 4.5%, 1/14/2022 | | | 7,500,000 | | | | 7,865,100 | |
| Discover Bank, 3.1%, 6/04/2020 | | | 3,205,000 | | | | 3,205,556 | |
| Groupe BPCE S.A., 4%, 9/12/2023 (n) | | | 3,667,000 | | | | 3,854,576 | |
| Groupe BPCE S.A., FLR, 2.024% (LIBOR - 3mo. + 1.24%), 9/12/2023 (n) | | | 3,667,000 | | | | 3,578,222 | |
| National Bank of Canada, 2.15%, 10/07/2022 (n) | | | 5,017,000 | | | | 5,083,961 | |
| SunTrust Banks, Inc., 2.7%, 1/27/2022 | | | 5,086,000 | | | | 5,197,851 | |
| SunTrust Banks, Inc., 2.8%, 5/17/2022 | | | 7,376,000 | | | | 7,606,903 | |
| UBS AG, 1.75%, 4/21/2022 (n) | | | 7,075,000 | | | | 7,104,872 | |
| | | | | | | | |
| | | | | | | $ | 70,575,356 | |
| Personal Computers & Peripherals - 0.1% | | | | | | |
| Equifax, Inc., 2.6%, 12/15/2025 | | $ | 2,681,000 | | | $ | 2,715,311 | |
| | |
| Pharmaceuticals - 1.9% | | | | | | |
| AbbVie, Inc., 2.15%, 11/19/2021 (n) | | $ | 3,374,000 | | | $ | 3,417,339 | |
| Allergan Funding SCS, 3.45%, 3/15/2022 | | | 7,454,000 | | | | 7,639,654 | |
| Bayer U.S. Finance II LLC, 3.5%, 6/25/2021 (n) | | | 11,136,000 | | | | 11,363,050 | |
| Bristol-Myers Squibb Co., 2.875%, 8/15/2020 (n) | | | 6,424,000 | | | | 6,457,402 | |
| Bristol-Myers Squibb Co., 2.75%, 2/15/2023 (n) | | | 4,506,000 | | | | 4,736,315 | |
| Bristol-Myers Squibb Co., FLR, 2.072% (LIBOR - 3mo. + 0.38%), 5/16/2022 (n) | | | 1,477,000 | | | | 1,469,399 | |
| | | | | | | | |
| | | | | | | $ | 35,083,159 | |
| Printing & Publishing - 0.2% | | | �� | | | |
| Moody’s Corp., 3.25%, 6/07/2021 | | $ | 4,108,000 | | | $ | 4,188,500 | |
| | |
| Restaurants - 0.1% | | | | | | |
| McDonald’s Corp., 3.3%, 7/01/2025 | | $ | 2,400,000 | | | $ | 2,614,828 | |
| | |
| Retailers - 0.3% | | | | | | |
| Alimentation Couche-Tard, Inc., 2.7%, 7/26/2022 (n) | | $ | 4,277,000 | | | $ | 4,300,851 | |
| Macy’s Retail Holdings, Inc., 3.875%, 1/15/2022 | | | 1,102,000 | | | | 927,057 | |
| | | | | | | | |
| | | | | | | $ | 5,227,908 | |
| Specialty Stores - 0.3% | | | | | | |
| TJX Cos., Inc., 3.5%, 4/15/2025 | | $ | 4,800,000 | | | $ | 5,176,589 | |
24
Portfolio of Investments – continued
| | | | | | | | |
| | |
| Issuer | | Shares/Par | | | Value ($) | |
| Bonds - continued | | | | | | |
| Telecommunications - Wireless - 1.5% | | | | | | |
| American Tower Corp., REIT, 2.8%, 6/01/2020 | | $ | 2,158,000 | | | $ | 2,158,024 | |
| American Tower Corp., REIT, 2.25%, 1/15/2022 | | | 6,500,000 | | | | 6,590,834 | |
| Crown Castle International Corp., 3.4%, 2/15/2021 | | | 2,140,000 | | | | 2,159,753 | |
| Crown Castle International Corp., 3.15%, 7/15/2023 | | | 5,334,000 | | | | 5,587,499 | |
| SBA Tower Trust, 2.877%, 7/09/2021 (n) | | | 1,843,000 | | | | 1,851,289 | |
| T-Mobile USA, Inc., 3.5%, 4/15/2025 (n) | | | 8,673,000 | | | | 9,171,004 | |
| | | | | | | | |
| | | | | | | $ | 27,518,403 | |
| Tobacco - 1.0% | | | | | | |
| B.A.T Capital Corp., 2.764%, 8/15/2022 | | $ | 2,445,000 | | | $ | 2,477,268 | |
| Imperial Tobacco Finance PLC, 2.95%, 7/21/2020 (n) | | | 3,152,000 | | | | 3,157,866 | |
| Imperial Tobacco Finance PLC, 3.75%, 7/21/2022 (n) | | | 8,283,000 | | | | 8,392,400 | |
| Philip Morris International, Inc., 1.125%, 5/01/2023 | | | 3,763,000 | | | | 3,756,536 | |
| | | | | | | | |
| | | | | | | $ | 17,784,070 | |
| Transportation - Services - 1.1% | | | | | | |
| Adani Ports & Special Economic Zone Ltd., 3.95%, 1/19/2022 | | $ | 10,067,000 | | | $ | 9,785,728 | |
| ERAC USA Finance LLC, 2.7%, 11/01/2023 (n) | | | 2,674,000 | | | | 2,635,541 | |
| ERAC USA Finance LLC, 3.85%, 11/15/2024 (n) | | | 1,144,000 | | | | 1,177,698 | |
| ERAC USA Finance LLC, 3.8%, 11/01/2025 (n) | | | 1,536,000 | | | | 1,569,314 | |
| TTX Co., 2.6%, 6/15/2020 (n) | | | 5,870,000 | | | | 5,868,850 | |
| | | | | | | | |
| | | | | | | $ | 21,037,131 | |
| U.S. Treasury Obligations - 12.6% | | | | | | |
| U.S. Treasury Notes, 2.625%, 12/15/2021 | | $ | 90,125,000 | | | $ | 93,673,672 | |
| U.S. Treasury Notes, 1.875%, 2/28/2022 | | | 6,075,000 | | | | 6,260,335 | |
| U.S. Treasury Notes, 1.875%, 4/30/2022 | | | 33,048,000 | | | | 34,142,715 | |
| U.S. Treasury Notes, 2.375%, 1/31/2023 (f) | | | 91,675,000 | | | | 97,050,163 | |
| | | | | | | | |
| | | | | | | $ | 231,126,885 | |
| Utilities - Electric Power - 2.6% | | | | | | |
| Dominion Energy, Inc., 2.579%, 7/01/2020 | | $ | 4,253,000 | | | $ | 4,254,304 | |
| Emera U.S. Finance LP, 2.7%, 6/15/2021 | | | 1,609,000 | | | | 1,618,148 | |
| Enel Finance International N.V., 2.875%, 5/25/2022 (n) | | | 9,251,000 | | | | 9,304,042 | |
| Florida Power & Light Co., 2.85%, 4/01/2025 | | | 2,177,000 | | | | 2,358,934 | |
| Florida Power & Light Co., FLR, 2.137% (LIBOR - 3mo. + 0.4%), 5/06/2022 | | | 4,927,000 | | | | 4,883,199 | |
| NextEra Energy Capital Holdings, Inc., 2.403%, 9/01/2021 | | | 8,713,000 | | | | 8,857,374 | |
| NextEra Energy, Inc., 2.9%, 4/01/2022 | | | 4,867,000 | | | | 5,027,825 | |
| WEC Energy Group, Inc., 3.375%, 6/15/2021 | | | 4,274,000 | | | | 4,380,153 | |
| WEC Energy Group, Inc., 3.1%, 3/08/2022 | | | 2,849,000 | | | | 2,937,645 | |
| Xcel Energy, Inc., 2.4%, 3/15/2021 | | | 4,070,000 | | | | 4,102,366 | |
| | | | | | | | |
| | | | | | | $ | 47,723,990 | |
| Total Bonds (Identified Cost, $1,842,201,933) | | | $ | 1,827,175,847 | |
25
Portfolio of Investments – continued
| | | | | | | | |
| | |
| Issuer | | Shares/Par | | | Value ($) | |
| Investment Companies (h) - 2.3% | | | | | | |
| Money Market Funds - 2.3% | | | | | | |
MFS Institutional Money Market Portfolio, 0.41% (v)
(Identified Cost, $43,169,426) | | | 43,162,402 | | | $ | 43,166,718 | |
| | |
| Other Assets, Less Liabilities - (1.6)% | | | | | (29,530,754) | |
| Net Assets - 100.0% | | | | | | $ | 1,840,811,811 | |
| (a) | Non-income producing security. |
| (f) | All or a portion of the security has been segregated as collateral for open futures contracts and cleared swap agreements. |
| (h) | An affiliated issuer, which may be considered one in which the fund owns 5% or more of the outstanding voting securities, or a company which is under common control. At period end, the aggregate values of the fund’s investments in affiliated issuers and in unaffiliated issuers were $43,166,718 and $1,827,175,847, respectively. |
| (i) | Interest only security for which the fund receives interest on notional principal (Par amount). Par amount shown is the notional principal and does not reflect the cost of the security. |
| (n) | Securities exempt from registration under Rule 144A of the Securities Act of 1933. These securities may be sold in the ordinary course of business in transactions exempt from registration, normally to qualified institutional buyers. At period end, the aggregate value of these securities was $810,813,438, representing 44.0% of net assets. |
| (q) | Interest received was less than stated coupon rate. |
| (v) | Affiliated issuer that is available only to investment companies managed by MFS. The rate quoted for the MFS Institutional Money Market Portfolio is the annualizedseven-day yield of the fund at period end. |
The following abbreviations are used in this report and are defined:
| CLO | | Collateralized Loan Obligation |
| FLR | | Floating Rate. Interest rate resets periodically based on the parenthetically disclosed reference rate plus a spread (if any). Theperiod-end rate reported may not be the current rate. All reference rates are USD unless otherwise noted. |
| LIBOR | | London Interbank Offered Rate |
| REIT | | Real Estate Investment Trust |
| SOFR | | Secured Overnight Financing Rate |
Derivative Contracts at 4/30/20
Futures Contracts
| | | | | | | | | | | | | | | | | | | | | | |
| Description | | Long/
Short | | | Currency | | | Contracts | | Notional
Amount | | | Expiration
Date | | | Value/
Unrealized
Appreciation
(Depreciation) | |
| Asset Derivatives | | | | | | | | | | | | | | | | | | | | | | |
| | | | | | |
| Interest Rate Futures | | | | | | | | | | | | | | | | | | | | | | |
| U.S. Treasury Note 2 yr | | | Long | | | | USD | | | 440 | | | $96,989,063 | | | | June - 2020 | | | | $1,412,897 | |
| | | | | | | | | | | | | | | | | | | | | | |
26
Portfolio of Investments – continued
Cleared Swap Agreements
| | | | | | | | | | | | | | | | | | | | | | |
Maturity
Date | | Notional Amount | | Counter-
party | | Cash
Flows to
Receive/
Frequency | | Cash
Flows to
Pay/
Frequency | | Unrealized
Appreciation
(Depreciation) | | | Net
Unamortized
Upfront
Payments
(Receipts) | | | Value | |
| Asset Derivatives | | | | | | | | | |
| |
| Interest Rate Swaps | | | | | |
| 7/15/21 | | USD | | 132,200,000 | | centrally cleared | | 1.88%/
Semi-annually | | 1.22%(3-Month LIBOR)/Quarterly | | | $2,955,277 | | | | $— | | | | $2,955,277 | |
| 9/19/21 | | USD | | 85,600,000 | | centrally cleared | | 1.57%/
Semi-annually | | 0.72%(1-Month LIBOR)/Monthly | | | 1,766,548 | | | | — | | | | 1,766,548 | |
| | | | | | | | | | | | | | | | | | | | | | |
| | | | | | | | | | | | | $4,721,825 | | | | $— | | | | $4,721,825 | |
| | | | | | | | | | | | | | | | | | | | | | |
At April 30, 2020, the fund had liquid securities with an aggregate value of $2,165,957 to cover any collateral or margin obligations for certain derivative contracts.
See Notes to Financial Statements
27
Financial Statements
STATEMENT OF ASSETS AND LIABILITIES
At 4/30/20
This statement represents your fund’s balance sheet, which details the assets and liabilities comprising the total value of the fund.
| | | | |
| Assets | | | | |
Investments in unaffiliated issuers, at value (identified cost, $1,842,201,933) | | | $1,827,175,847 | |
Investments in affiliated issuers, at value (identified cost, $43,169,426) | | | 43,166,718 | |
Receivables for | | | | |
Net daily variation margin on open futures contracts | | | 10,313 | |
Fund shares sold | | | 9,654,097 | |
Interest | | | 9,787,784 | |
Receivable from investment adviser | | | 123,570 | |
Other assets | | | 4,201 | |
Total assets | | | $1,889,922,530 | |
| |
| Liabilities | | | | |
Payable to custodian | | | $5,762 | |
Payables for | | | | |
Distributions | | | 324,548 | |
Net daily variation margin on open cleared swap agreements | | | 64,278 | |
Investments purchased | | | 45,976,217 | |
Fund shares reacquired | | | 1,939,053 | |
Payable to affiliates | | | | |
Administrative services fee | | | 1,501 | |
Shareholder servicing costs | | | 599,823 | |
Distribution and service fees | | | 11,167 | |
Program manager fees | | | 550 | |
Payable for independent Trustees’ compensation | | | 132 | |
Accrued expenses and other liabilities | | | 187,688 | |
Total liabilities | | | $49,110,719 | |
Net assets | | | $1,840,811,811 | |
| |
| Net assets consist of | | | | |
Paid-in capital | | | $1,886,586,288 | |
Total distributable earnings (loss) | | | (45,774,477 | ) |
Net assets | | | $1,840,811,811 | |
Shares of beneficial interest outstanding | | | 310,127,957 | |
28
Statement of Assets and Liabilities – continued
| | | | | | | | | | | | |
| | | |
| | | Net assets | | | Shares
outstanding | | | Net asset value
per share (a) | |
Class A | | | $730,945,087 | | | | 122,983,269 | | | | $5.94 | |
Class B | | | 2,713,934 | | | | 457,590 | | | | 5.93 | |
Class C | | | 42,280,995 | | | | 7,116,985 | | | | 5.94 | |
Class I | | | 258,164,128 | | | | 43,625,648 | | | | 5.92 | |
Class R1 | | | 1,593,464 | | | | 268,833 | | | | 5.93 | |
Class R2 | | | 1,579,317 | | | | 265,707 | | | | 5.94 | |
Class R3 | | | 1,512,128 | | | | 254,252 | | | | 5.95 | |
Class R4 | | | 241,763 | | | | 40,548 | | | | 5.96 | |
Class R6 | | | 599,945,010 | | | | 101,153,703 | | | | 5.93 | |
Class 529A | | | 155,470,928 | | | | 26,158,884 | | | | 5.94 | |
Class 529B | | | 3,506,957 | | | | 591,440 | | | | 5.93 | |
Class 529C | | | 42,858,100 | | | | 7,211,098 | | | | 5.94 | |
| (a) | Maximum offering price per share was equal to the net asset value per share for all share classes, except for Classes A and 529A, for which the maximum offering prices per share were $6.09 [100 / 97.50 x $5.94] and $6.09 [100 / 97.50 x $5.94], respectively. On sales of $50,000 or more, the maximum offering prices of Class A and Class 529A shares are reduced. A contingent deferred sales charge may be imposed on redemptions of Class A, Class B, Class C, Class 529B, and Class 529C shares. Redemption price per share was equal to the net asset value per share for Classes I, R1, R2, R3, R4, R6, and 529A. |
See Notes to Financial Statements
29
Financial Statements
STATEMENT OF OPERATIONS
Year ended 4/30/20
This statement describes how much your fund earned in investment income and accrued in expenses. It also describes any gains and/or losses generated by fund operations.
| | | | |
| Net investment income (loss) | | | | |
Income | | | | |
Interest | | | $50,949,451 | |
Other | | | 1,182,148 | |
Dividends from affiliated issuers | | | 827,213 | |
Total investment income | | | $52,958,812 | |
Expenses | | | | |
Management fee | | | $6,659,124 | |
Distribution and service fees | | | 2,987,790 | |
Shareholder servicing costs | | | 1,537,623 | |
Program manager fees | | | 91,765 | |
Administrative services fee | | | 239,251 | |
Independent Trustees’ compensation | | | 28,777 | |
Custodian fee | | | 134,748 | |
Shareholder communications | | | 151,357 | |
Audit and tax fees | | | 67,308 | |
Legal fees | | | 14,668 | |
Miscellaneous | | | 322,088 | |
Total expenses | | | $12,234,499 | |
Fees paid indirectly | | | (3,751 | ) |
Reduction of expenses by investment adviser and distributor | | | (1,924,900 | ) |
Net expenses | | | $10,305,848 | |
Net investment income (loss) | | | $42,652,964 | |
| |
| Realized and unrealized gain (loss) | | | | |
Realized gain (loss) (identified cost basis) | | | | |
Unaffiliated issuers | | | $5,323,337 | |
Affiliated issuers | | | 8,234 | |
Futures contracts | | | 498,123 | |
Swap agreements | | | (266,095 | ) |
Foreign currency | | | (37 | ) |
Net realized gain (loss) | | | $5,563,562 | |
Change in unrealized appreciation or depreciation | | | | |
Unaffiliated issuers | | | $(16,178,593 | ) |
Affiliated issuers | | | (2,964 | ) |
Futures contracts | | | 1,412,897 | |
Swap agreements | | | 4,721,825 | |
Net unrealized gain (loss) | | | $(10,046,835 | ) |
Net realized and unrealized gain (loss) | | | $(4,483,273 | ) |
Change in net assets from operations | | | $38,169,691 | |
See Notes to Financial Statements
30
Financial Statements
STATEMENTS OF CHANGES IN NET ASSETS
These statements describe the increases and/or decreases in net assets resulting from operations, any distributions, and any shareholder transactions.
| | | | | | | | |
| | | Year ended | |
| | | 4/30/20 | | | 4/30/19 | |
| Change in net assets | | | | | | |
| | |
| From operations | | | | | | | | |
Net investment income (loss) | | | $42,652,964 | | | | $33,749,977 | |
Net realized gain (loss) | | | 5,563,562 | | | | (912,411 | ) |
Net unrealized gain (loss) | | | (10,046,835 | ) | | | 18,871,826 | |
Change in net assets from operations | | | $38,169,691 | | | | $51,709,392 | |
Total distributions to shareholders | | | $(44,522,134 | ) | | | $(34,717,671 | ) |
Change in net assets from fund share transactions | | | $259,495,537 | | | | $191,833,802 | |
Total change in net assets | | | $253,143,094 | | | | $208,825,523 | |
| | |
| Net assets | | | | | | | | |
At beginning of period | | | 1,587,668,717 | | | | 1,378,843,194 | |
At end of period | | | $1,840,811,811 | | | | $1,587,668,717 | |
See Notes to Financial Statements
31
Financial Statements
FINANCIAL HIGHLIGHTS
The financial highlights table is intended to help you understand the fund’s financial performance for the past 5 years. Certain information reflects financial results for a single fund share. The total returns in the table represent the rate that an investor would have earned (or lost) on an investment in the fund share class (assuming reinvestment of all distributions) held for the entire period.
| | | | | | | | | | | | | | | | | | | | |
| Class A | | Year ended | |
| | | | | |
| | | 4/30/20 | | | 4/30/19 | | | 4/30/18 | | | 4/30/17 | | | 4/30/16 | |
Net asset value, beginning of period | | | $5.96 | | | | $5.90 | | | | $5.99 | | | | $6.00 | | | | $6.03 | |
| | | | |
| Income (loss) from investment operations | | | | | | | | | | | | | | | | | |
Net investment income (loss) (d) | | | $0.14 | | | | $0.14 | | | | $0.10 | | | | $0.07 | (c) | | | $0.06 | |
Net realized and unrealized gain (loss) | | | (0.01 | ) | | | 0.06 | | | | (0.08 | ) | | | (0.00 | )(w) | | | (0.02 | ) |
Total from investment operations | | | $0.13 | | | | $0.20 | | | | $0.02 | | | | $0.07 | | | | $0.04 | |
| | | | |
| Less distributions declared to shareholders | | | | | | | | | | | | | | | | | |
From net investment income | | | $(0.15 | ) | | | $(0.14 | ) | | | $(0.11 | ) | | | $(0.08 | ) | | | $(0.07 | ) |
Net asset value, end of period (x) | | | $5.94 | | | | $5.96 | | | | $5.90 | | | | $5.99 | | | | $6.00 | |
Total return (%) (r)(s)(t)(x) | | | 2.21 | | | | 3.43 | | | | 0.36 | | | | 1.12 | (c) | | | 0.68 | |
| | | | |
Ratios (%) (to average net assets)
and Supplemental data: | | | | | | | | | | | | | | | | | |
Expenses before expense reductions (f) | | | 0.80 | | | | 0.82 | | | | 0.83 | | | | 0.82 | (c) | | | 0.85 | |
Expenses after expense reductions (f) | | | 0.64 | | | | 0.71 | | | | 0.72 | | | | 0.72 | (c) | | | 0.74 | |
Net investment income (loss) | | | 2.41 | | | | 2.30 | | | | 1.68 | | | | 1.11 | (c) | | | 0.94 | |
Portfolio turnover | | | 41 | | | | 55 | | | | 57 | | | | 54 | | | | 30 | |
Net assets at end of period (000 omitted) | | | $730,945 | | | | $606,885 | | | | $486,144 | | | | $514,304 | | | | $462,778 | |
See Notes to Financial Statements
32
Financial Highlights – continued
| | | | | | | | | | | | | | | | | | | | |
| Class B | | Year ended | |
| | | | | |
| | | 4/30/20 | | | 4/30/19 | | | 4/30/18 | | | 4/30/17 | | | 4/30/16 | |
Net asset value, beginning of period | | | $5.95 | | | | $5.88 | | | | $5.97 | | | | $5.98 | | | | $6.01 | |
|
| Income (loss) from investment operations | |
Net investment income (loss) (d) | | | $0.10 | | | | $0.09 | | | | $0.06 | | | | $0.02 | (c) | | | $0.01 | |
Net realized and unrealized gain (loss) | | | (0.01 | ) | | | 0.07 | | | | (0.08 | ) | | | (0.00 | )(w) | | | (0.01 | ) |
Total from investment operations | | | $0.09 | | | | $0.16 | | | | $(0.02 | ) | | | $0.02 | | | | $0.00 | (w) |
|
| Less distributions declared to shareholders | |
From net investment income | | | $(0.11 | ) | | | $(0.09 | ) | | | $(0.07 | ) | | | $(0.03 | ) | | | $(0.03 | ) |
Net asset value, end of period (x) | | | $5.93 | | | | $5.95 | | | | $5.88 | | | | $5.97 | | | | $5.98 | |
Total return (%) (r)(s)(t)(x) | | | 1.45 | | | | 2.83 | | | | (0.39 | ) | | | 0.35 | (c) | | | (0.07 | ) |
|
Ratios (%) (to average net assets)
and Supplemental data: | |
Expenses before expense reductions (f) | | | 1.55 | | | | 1.57 | | | | 1.58 | | | | 1.58 | (c) | | | 1.60 | |
Expenses after expense reductions (f) | | | 1.39 | | | | 1.46 | | | | 1.48 | | | | 1.47 | (c) | | | 1.50 | |
Net investment income (loss) | | | 1.67 | | | | 1.56 | | | | 0.93 | | | | 0.37 | (c) | | | 0.20 | |
Portfolio turnover | | | 41 | | | | 55 | | | | 57 | | | | 54 | | | | 30 | |
Net assets at end of period (000 omitted) | | | $2,714 | | | | $3,703 | | | | $3,779 | | | | $5,286 | | | | $6,477 | |
| |
| Class C | | Year ended | |
| | | | | |
| | | 4/30/20 | | | 4/30/19 | | | 4/30/18 | | | 4/30/17 | | | 4/30/16 | |
Net asset value, beginning of period | | | $5.96 | | | | $5.89 | | | | $5.98 | | | | $5.99 | | | | $6.02 | |
|
| Income (loss) from investment operations | |
Net investment income (loss) (d) | | | $0.09 | | | | $0.09 | | | | $0.05 | | | | $0.02 | (c) | | | $0.01 | |
Net realized and unrealized gain (loss) | | | (0.01 | ) | | | 0.07 | | | | (0.08 | ) | | | (0.00 | )(w) | | | (0.02 | ) |
Total from investment operations | | | $0.08 | | | | $0.16 | | | | $(0.03 | ) | | | $0.02 | | | | $(0.01 | ) |
|
| Less distributions declared to shareholders | |
From net investment income | | | $(0.10 | ) | | | $(0.09 | ) | | | $(0.06 | ) | | | $(0.03 | ) | | | $(0.02 | ) |
Net asset value, end of period (x) | | | $5.94 | | | | $5.96 | | | | $5.89 | | | | $5.98 | | | | $5.99 | |
Total return (%) (r)(s)(t)(x) | | | 1.35 | | | | 2.73 | | | | (0.49 | ) | | | 0.26 | (c) | | | (0.17 | ) |
|
Ratios (%) (to average net assets)
and Supplemental data: | |
Expenses before expense reductions (f) | | | 1.55 | | | | 1.57 | | | | 1.58 | | | | 1.58 | (c) | | | 1.60 | |
Expenses after expense reductions (f) | | | 1.49 | | | | 1.56 | | | | 1.58 | | | | 1.57 | (c) | | | 1.59 | |
Net investment income (loss) | | | 1.57 | | | | 1.45 | | | | 0.83 | | | | 0.27 | (c) | | | 0.09 | |
Portfolio turnover | | | 41 | | | | 55 | | | | 57 | | | | 54 | | | | 30 | |
Net assets at end of period (000 omitted) | | | $42,281 | | | | $47,447 | | | | $56,372 | | | | $95,767 | | | | $119,063 | |
See Notes to Financial Statements
33
Financial Highlights – continued
| | | | | | | | | | | | | | | | | | | | |
| Class I | | Year ended | |
| | | | | |
| | | 4/30/20 | | | 4/30/19 | | | 4/30/18 | | | 4/30/17 | | | 4/30/16 | |
Net asset value, beginning of period | | | $5.93 | | | | $5.87 | | | | $5.96 | | | | $5.97 | | | | $6.00 | |
|
| Income (loss) from investment operations | |
Net investment income (loss) (d) | | | $0.15 | | | | $0.14 | | | | $0.11 | | | | $0.08 | (c) | | | $0.07 | |
Net realized and unrealized gain (loss) | | | (0.00 | )(w) | | | 0.07 | | | | (0.08 | ) | | | (0.00 | )(w) | | | (0.02 | ) |
Total from investment operations | | | $0.15 | | | | $0.21 | | | | $0.03 | | | | $0.08 | | | | $0.05 | |
|
| Less distributions declared to shareholders | |
From net investment income | | | $(0.16 | ) | | | $(0.15 | ) | | | $(0.12 | ) | | | $(0.09 | ) | | | $(0.08 | ) |
Net asset value, end of period (x) | | | $5.92 | | | | $5.93 | | | | $5.87 | | | | $5.96 | | | | $5.97 | |
Total return (%) (r)(s)(t)(x) | | | 2.54 | | | | 3.59 | | | | 0.51 | | | | 1.27 | (c) | | | 0.83 | |
|
Ratios (%) (to average net assets)
and Supplemental data: | |
Expenses before expense reductions (f) | | | 0.55 | | | | 0.57 | | | | 0.58 | �� | | | 0.58 | (c) | | | 0.60 | |
Expenses after expense reductions (f) | | | 0.49 | | | | 0.56 | | | | 0.58 | | | | 0.57 | (c) | | | 0.59 | |
Net investment income (loss) | | | 2.56 | | | | 2.46 | | | | 1.81 | | | | 1.28 | (c) | | | 1.10 | |
Portfolio turnover | | | 41 | | | | 55 | | | | 57 | | | | 54 | | | | 30 | |
Net assets at end of period (000 omitted) | | | $258,164 | | | | $187,021 | | | | $141,291 | | | | $257,580 | | | | $222,997 | |
| |
| Class R1 | | Year ended | |
| | | | | |
| | | 4/30/20 | | | 4/30/19 | | | 4/30/18 | | | 4/30/17 | | | 4/30/16 | |
Net asset value, beginning of period | | | $5.94 | | | | $5.88 | | | | $5.97 | | | | $5.98 | | | | $6.01 | |
|
| Income (loss) from investment operations | |
Net investment income (loss) (d) | | | $0.09 | | | | $0.09 | | | | $0.05 | | | | $0.02 | (c) | | | $0.01 | |
Net realized and unrealized gain (loss) | | | (0.00 | )(w) | | | 0.06 | | | | (0.08 | ) | | | (0.00 | )(w) | | | (0.02 | ) |
Total from investment operations | | | $0.09 | | | | $0.15 | | | | $(0.03 | ) | | | $0.02 | | | | $(0.01 | ) |
|
| Less distributions declared to shareholders | |
From net investment income | | | $(0.10 | ) | | | $(0.09 | ) | | | $(0.06 | ) | | | $(0.03 | ) | | | $(0.02 | ) |
Net asset value, end of period (x) | | | $5.93 | | | | $5.94 | | | | $5.88 | | | | $5.97 | | | | $5.98 | |
Total return (%) (r)(s)(t)(x) | | | 1.52 | | | | 2.55 | | | | (0.49 | ) | | | 0.26 | (c) | | | (0.17 | ) |
|
Ratios (%) (to average net assets)
and Supplemental data: | |
Expenses before expense reductions (f) | | | 1.55 | | | | 1.57 | | | | 1.58 | | | | 1.58 | (c) | | | 1.60 | |
Expenses after expense reductions (f) | | | 1.48 | | | | 1.56 | | | | 1.58 | | | | 1.57 | (c) | | | 1.60 | |
Net investment income (loss) | | | 1.57 | | | | 1.47 | | | | 0.83 | | | | 0.26 | (c) | | | 0.09 | |
Portfolio turnover | | | 41 | | | | 55 | | | | 57 | | | | 54 | | | | 30 | |
Net assets at end of period (000 omitted) | | | $1,593 | | | | $451 | | | | $294 | | | | $328 | | | | $484 | |
See Notes to Financial Statements
34
Financial Highlights – continued
| | | | | | | | | | | | | | | | | | | | |
| Class R2 | | Year ended | |
| | | | | |
| | | 4/30/20 | | | 4/30/19 | | | 4/30/18 | | | 4/30/17 | | | 4/30/16 | |
Net asset value, beginning of period | | | $5.96 | | | | $5.89 | | | | $5.98 | | | | $6.00 | | | | $6.02 | |
|
| Income (loss) from investment operations | |
Net investment income (loss) (d) | | | $0.13 | | | | $0.12 | | | | $0.08 | | | | $0.05 | (c) | | | $0.04 | |
Net realized and unrealized gain (loss) | | | (0.01 | ) | | | 0.07 | | | | (0.07 | ) | | | (0.01 | ) | | | (0.00 | )(w) |
Total from investment operations | | | $0.12 | | | | $0.19 | | | | $0.01 | | | | $0.04 | | | | $0.04 | |
|
| Less distributions declared to shareholders | |
From net investment income | | | $(0.14 | ) | | | $(0.12 | ) | | | $(0.10 | ) | | | $(0.06 | ) | | | $(0.06 | ) |
Net asset value, end of period (x) | | | $5.94 | | | | $5.96 | | | | $5.89 | | | | $5.98 | | | | $6.00 | |
Total return (%) (r)(s)(t)(x) | | | 1.96 | | | | 3.34 | | | | 0.11 | | | | 0.70 | (c) | | | 0.60 | |
|
Ratios (%) (to average net assets)
and Supplemental data: | |
Expenses before expense reductions (f) | | | 1.05 | | | | 1.07 | | | | 1.08 | | | | 1.08 | (c) | | | 1.10 | |
Expenses after expense reductions (f) | | | 0.90 | | | | 0.96 | | | | 0.98 | | | | 0.97 | (c) | | | 0.99 | |
Net investment income (loss) | | | 2.17 | | | | 2.04 | | | | 1.42 | | | | 0.87 | (c) | | | 0.69 | |
Portfolio turnover | | | 41 | | | | 55 | | | | 57 | | | | 54 | | | | 30 | |
Net assets at end of period (000 omitted) | | | $1,579 | | | | $2,524 | | | | $2,908 | | | | $3,504 | | | | $3,517 | |
| |
| Class R3 | | Year ended | |
| | | | | |
| | | 4/30/20 | | | 4/30/19 | | | 4/30/18 | | | 4/30/17 | | | 4/30/16 | |
Net asset value, beginning of period | | | $5.96 | | | | $5.90 | | | | $5.99 | | | | $6.00 | | | | $6.03 | |
|
| Income (loss) from investment operations | |
Net investment income (loss) (d) | | | $0.14 | | | | $0.13 | | | | $0.09 | | | | $0.06 | (c) | | | $0.05 | |
Net realized and unrealized gain (loss) | | | (0.00 | )(w) | | | 0.06 | | | | (0.07 | ) | | | (0.00 | )(w) | | | (0.02 | ) |
Total from investment operations | | | $0.14 | | | | $0.19 | | | | $0.02 | | | | $0.06 | | | | $0.03 | |
|
| Less distributions declared to shareholders | |
From net investment income | | | $(0.15 | ) | | | $(0.13 | ) | | | $(0.11 | ) | | | $(0.07 | ) | | | $(0.06 | ) |
Net asset value, end of period (x) | | | $5.95 | | | | $5.96 | | | | $5.90 | | | | $5.99 | | | | $6.00 | |
Total return (%) (r)(s)(t)(x) | | | 2.28 | | | | 3.32 | | | | 0.26 | | | | 1.02 | (c) | | | 0.58 | |
|
Ratios (%) (to average net assets)
and Supplemental data: | |
Expenses before expense reductions (f) | | | 0.80 | | | | 0.82 | | | | 0.83 | | | | 0.83 | (c) | | | 0.85 | |
Expenses after expense reductions (f) | | | 0.75 | | | | 0.81 | | | | 0.83 | | | | 0.82 | (c) | | | 0.84 | |
Net investment income (loss) | | | 2.32 | | | | 2.19 | | | | 1.57 | | | | 1.01 | (c) | | | 0.84 | |
Portfolio turnover | | | 41 | | | | 55 | | | | 57 | | | | 54 | | | | 30 | |
Net assets at end of period (000 omitted) | | | $1,512 | | | | $2,249 | | | | $2,140 | | | | $2,769 | | | | $3,288 | |
See Notes to Financial Statements
35
Financial Highlights – continued
| | | | | | | | | | | | | | | | | | | | |
| Class R4 | | Year ended | |
| | | | | |
| | | 4/30/20 | | | 4/30/19 | | | 4/30/18 | | | 4/30/17 | | | 4/30/16 | |
Net asset value, beginning of period | | | $5.99 | | | | $5.89 | | | | $5.98 | | | | $6.00 | | �� | | $6.03 | |
|
| Income (loss) from investment operations | |
Net investment income (loss) (d) | | | $0.15 | | | | $0.15 | | | | $0.11 | | | | $0.08 | (c) | | | $0.07 | |
Net realized and unrealized gain (loss) | | | (0.02 | ) | | | 0.10 | (g) | | | (0.08 | ) | | | (0.01 | ) | | | (0.02 | ) |
Total from investment operations | | | $0.13 | | | | $0.25 | | | | $0.03 | | | | $0.07 | | | | $0.05 | |
|
| Less distributions declared to shareholders | |
From net investment income | | | $(0.16 | ) | | | $(0.15 | ) | | | $(0.12 | ) | | | $(0.09 | ) | | | $(0.08 | ) |
Net asset value, end of period (x) | | | $5.96 | | | | $5.99 | | | | $5.89 | | | | $5.98 | | | | $6.00 | |
Total return (%) (r)(s)(t)(x) | | | 2.20 | | | | 4.28 | | | | 0.51 | | | | 1.10 | (c) | | | 0.84 | |
|
Ratios (%) (to average net assets)
and Supplemental data: | |
Expenses before expense reductions (f) | | | 0.55 | | | | 0.63 | | | | 0.58 | | | | 0.58 | (c) | | | 0.60 | |
Expenses after expense reductions (f) | | | 0.49 | | | | 0.62 | | | | 0.58 | | | | 0.57 | (c) | | | 0.59 | |
Net investment income (loss) | | | 2.58 | | | | 2.60 | | | | 1.84 | | | | 1.27 | (c) | | | 1.09 | |
Portfolio turnover | | | 41 | | | | 55 | | | | 57 | | | | 54 | | | | 30 | |
Net assets at end of period (000 omitted) | | | $242 | | | | $304 | | | | $6,537 | | | | $6,516 | | | | $6,946 | |
| |
| Class R6 | | Year ended | |
| | | | | |
| | | 4/30/20 | | | 4/30/19 | | | 4/30/18 | | | 4/30/17 | | | 4/30/16 | |
Net asset value, beginning of period | | | $5.95 | | | | $5.88 | | | | $5.97 | | | | $5.99 | | | | $6.01 | |
|
| Income (loss) from investment operations | |
Net investment income (loss) (d) | | | $0.16 | | | | $0.15 | | | | $0.11 | | | | $0.08 | (c) | | | $0.07 | |
Net realized and unrealized gain (loss) | | | (0.02 | ) | | | 0.07 | | | | (0.08 | ) | | | (0.01 | ) | | | (0.01 | ) |
Total from investment operations | | | $0.14 | | | | $0.22 | | | | $0.03 | | | | $0.07 | | | | $0.06 | |
|
| Less distributions declared to shareholders | |
From net investment income | | | $(0.16 | ) | | | $(0.15 | ) | | | $(0.12 | ) | | | $(0.09 | ) | | | $(0.08 | ) |
Net asset value, end of period (x) | | | $5.93 | | | | $5.95 | | | | $5.88 | | | | $5.97 | | | | $5.99 | |
Total return (%) (r)(s)(t)(x) | | | 2.43 | | | | 3.82 | | | | 0.58 | | | | 1.17 | (c) | | | 1.08 | |
|
Ratios (%) (to average net assets)
and Supplemental data: | |
Expenses before expense reductions (f) | | | 0.48 | | | | 0.50 | | | | 0.51 | | | | 0.51 | (c) | | | 0.52 | |
Expenses after expense reductions (f) | | | 0.42 | | | | 0.49 | | | | 0.50 | | | | 0.50 | (c) | | | 0.51 | |
Net investment income (loss) | | | 2.64 | | | | 2.51 | | | | 1.91 | | | | 1.34 | (c) | | | 1.17 | |
Portfolio turnover | | | 41 | | | | 55 | | | | 57 | | | | 54 | | | | 30 | |
Net assets at end of period (000 omitted) | | | $599,945 | | | | $561,643 | | | | $524,653 | | | | $516,582 | | | | $520,011 | |
See Notes to Financial Statements
36
Financial Highlights – continued
| | | | | | | | | | | | | | | | | | | | |
| Class 529A | | Year ended | |
| | | | | |
| | | 4/30/20 | | | 4/30/19 | | | 4/30/18 | | | 4/30/17 | | | 4/30/16 | |
Net asset value, beginning of period | | | $5.96 | | | | $5.89 | | | | $5.98 | | | | $6.00 | | | | $6.03 | |
|
| Income (loss) from investment operations | |
Net investment income (loss) (d) | | | $0.14 | | | | $0.13 | | | | $0.10 | | | | $0.06 | (c) | | | $0.05 | |
Net realized and unrealized gain (loss) | | | (0.01 | ) | | | 0.08 | | | | (0.08 | ) | | | (0.01 | ) | | | (0.01 | ) |
Total from investment operations | | | $0.13 | | | | $0.21 | | | | $0.02 | | | | $0.05 | | | | $0.04 | |
|
| Less distributions declared to shareholders | |
From net investment income | | | $(0.15 | ) | | | $(0.14 | ) | | | $(0.11 | ) | | | $(0.07 | ) | | | $(0.07 | ) |
Net asset value, end of period (x) | | | $5.94 | | | | $5.96 | | | | $5.89 | | | | $5.98 | | | | $6.00 | |
Total return (%) (r)(s)(t)(x) | | | 2.16 | | | | 3.55 | | | | 0.31 | | | | 0.90 | (c) | | | 0.63 | |
|
Ratios (%) (to average net assets)
and Supplemental data: | |
Expenses before expense reductions (f) | | | 0.85 | | | | 0.87 | | | | 0.91 | | | | 0.92 | (c) | | | 0.95 | |
Expenses after expense reductions (f) | | | 0.68 | | | | 0.75 | | | | 0.77 | | | | 0.76 | (c) | | | 0.79 | |
Net investment income (loss) | | | 2.38 | | | | 2.26 | | | | 1.65 | | | | 1.08 | (c) | | | 0.90 | |
Portfolio turnover | | | 41 | | | | 55 | | | | 57 | | | | 54 | | | | 30 | |
Net assets at end of period (000 omitted) | | | $155,471 | | | | $128,741 | | | | $108,692 | | | | $89,431 | | | | $55,996 | |
| |
| Class 529B | | Year ended | |
| | | | | |
| | | 4/30/20 | | | 4/30/19 | | | 4/30/18 | | | 4/30/17 | | | 4/30/16 | |
Net asset value, beginning of period | | | $5.94 | | | | $5.88 | | | | $5.96 | | | | $5.98 | | | | $6.00 | |
|
| Income (loss) from investment operations | |
Net investment income (loss) (d) | | | $0.10 | | | | $0.09 | | | | $0.05 | | | | $0.02 | (c) | | | $0.01 | |
Net realized and unrealized gain (loss) | | | (0.01 | ) | | | 0.06 | | | | (0.07 | ) | | | (0.01 | ) | | | (0.01 | ) |
Total from investment operations | | | $0.09 | | | | $0.15 | | | | $(0.02 | ) | | | $0.01 | | | | $0.00 | (w) |
|
| Less distributions declared to shareholders | |
From net investment income | | | $(0.10 | ) | | | $(0.09 | ) | | | $(0.06 | ) | | | $(0.03 | ) | | | $(0.02 | ) |
Net asset value, end of period (x) | | | $5.93 | | | | $5.94 | | | | $5.88 | | | | $5.96 | | | | $5.98 | |
Total return (%) (r)(s)(t)(x) | | | 1.55 | | | | 2.59 | | | | (0.29 | ) | | | 0.13 | (c) | | | 0.03 | |
|
Ratios (%) (to average net assets)
and Supplemental data: | |
Expenses before expense reductions (f) | | | 1.60 | | | | 1.62 | | | | 1.66 | | | | 1.68 | (c) | | | 1.70 | |
Expenses after expense reductions (f) | | | 1.43 | | | | 1.50 | | | | 1.52 | | | | 1.52 | (c) | | | 1.55 | |
Net investment income (loss) | | | 1.63 | | | | 1.50 | | | | 0.90 | | | | 0.33 | (c) | | | 0.14 | |
Portfolio turnover | | | 41 | | | | 55 | | | | 57 | | | | 54 | | | | 30 | |
Net assets at end of period (000 omitted) | | | $3,507 | | | | $3,903 | | | | $4,379 | | | | $3,807 | | | | $2,354 | |
See Notes to Financial Statements
37
Financial Highlights – continued
| | | | | | | | | | | | | | | | | | | | |
| Class 529C | | Year ended | |
| | | | | |
| | | 4/30/20 | | | 4/30/19 | | | 4/30/18 | | | 4/30/17 | | | 4/30/16 | |
Net asset value, beginning of period | | | $5.96 | | | | $5.89 | | | | $5.98 | | | | $6.00 | | | | $6.02 | |
|
| Income (loss) from investment operations | |
Net investment income (loss) (d) | | | $0.09 | | | | $0.08 | | | | $0.05 | | | | $0.01 | (c) | | | $0.00 | (w) |
Net realized and unrealized gain (loss) | | | (0.01 | ) | | | 0.08 | | | | (0.08 | ) | | | (0.01 | ) | | | (0.00 | )(w) |
Total from investment operations | | | $0.08 | | | | $0.16 | | | | $(0.03 | ) | | | $(0.00 | )(w) | | | $(0.00 | )(w) |
|
| Less distributions declared to shareholders | |
From net investment income | | | $(0.10 | ) | | | $(0.09 | ) | | | $(0.06 | ) | | | $(0.02 | ) | | | $(0.02 | ) |
Net asset value, end of period (x) | | | $5.94 | | | | $5.96 | | | | $5.89 | | | | $5.98 | | | | $6.00 | |
Total return (%) (r)(s)(t)(x) | | | 1.31 | | | | 2.68 | | | | (0.53 | ) | | | 0.05 | (c) | | | (0.05 | ) |
|
Ratios (%) (to average net assets)
and Supplemental data: | |
Expenses before expense reductions (f) | | | 1.60 | | | | 1.62 | | | | 1.66 | | | | 1.67 | (c) | | | 1.70 | |
Expenses after expense reductions (f) | | | 1.53 | | | | 1.60 | | | | 1.62 | | | | 1.61 | (c) | | | 1.63 | |
Net investment income (loss) | | | 1.53 | | | | 1.40 | | | | 0.79 | | | | 0.23 | (c) | | | 0.05 | |
Portfolio turnover | | | 41 | | | | 55 | | | | 57 | | | | 54 | | | | 30 | |
Net assets at end of period (000 omitted) | | | $42,858 | | | | $42,799 | | | | $41,655 | | | | $45,315 | | | | $29,824 | |
| (c) | Amount reflects aone-time reimbursement of expenses by the custodian (or former custodian) without which net investment income and performance would be lower and expenses would be higher. |
| (d) | Per share data is based on average shares outstanding. |
| (f) | Ratios do not reflect reductions from fees paid indirectly, if applicable. |
| (g) | The per share amount varies from the net realized and unrealized gain/loss for the period because of the timing of sales of fund shares and the per share amount of realized and unrealized gains and losses at such time. |
| (r) | Certain expenses have been reduced without which performance would have been lower. |
| (s) | From time to time the fund may receive proceeds from litigation settlements, without which performance would be lower. |
| (t) | Total returns do not include any applicable sales charges. |
| (w) | Per share amount was less than $0.01 and total return or ratio was less than 0.01%, as applicable. |
| (x) | The net asset values and total returns have been calculated on net assets which include adjustments made in accordance with U.S. generally accepted accounting principles required at period end for financial reporting purposes. |
See Notes to Financial Statements
38
NOTES TO FINANCIAL STATEMENTS
(1) Business and Organization
MFS Limited Maturity Fund (the fund) is a diversified series of MFS Series Trust IX (the trust). The trust is organized as a Massachusetts business trust and is registered under the Investment Company Act of 1940, as amended, as anopen-end management investment company.
The fund is an investment company and accordingly follows the investment company accounting and reporting guidance of the Financial Accounting Standards Board (FASB) Accounting Standards Codification Topic 946 Financial Services – Investment Companies.
(2) Significant Accounting Policies
General– The preparation of financial statements in conformity with U.S. generally accepted accounting principles requires management to make estimates and assumptions that affect the reported amounts of assets and liabilities, and disclosure of contingent assets and liabilities at the date of the financial statements and the reported amounts of increases and decreases in net assets from operations during the reporting period. Actual results could differ from those estimates. In the preparation of these financial statements, management has evaluated subsequent events occurring after the date of the fund’s Statement of Assets and Liabilities through the date that the financial statements were issued. The fund invests in foreign securities. Investments in foreign securities are vulnerable to the effects of changes in the relative values of the local currency and the U.S. dollar and to the effects of changes in each country’s market, economic, industrial, political, regulatory, geopolitical, and other conditions.
In March 2020, the FASB issued Accounting Standards Update 2020-04, Reference Rate Reform (Topic 848) – Facilitation of the Effects of Reference Rate Reform on Financial Reporting (“ASU 2020-04”), which provides optional, temporary relief with respect to the financial reporting of contracts subject to certain types of modifications due to the planned discontinuation of the London Interbank Offered Rate (LIBOR) and other IBOR-based reference rates as of the end of 2021. The temporary relief provided by ASU 2020-04 is effective for certain reference rate-related contract modifications that occur during the period from March 12, 2020 through December 31, 2022. Management is evaluating the impact of ASU 2020-04 on the fund’s investments, derivatives, debt and other contracts that will undergo reference rate-related modifications as a result of the reference rate reform.
In March 2017, the FASB issued Accounting Standards Update2017-08, Receivables –Nonrefundable Fees and Other Costs (Subtopic310-20) – Premium Amortization on Purchased Callable Debt Securities (“ASU2017-08”). For callable debt securities purchased at a premium that have explicit,non-contingent call features and that are callable at fixed prices on preset dates, ASU2017-08 requires the premium to be amortized to the earliest call date. The fund adopted ASU2017-08 as of the beginning of the reporting period on a modified retrospective basis. The adoption resulted in a change in accounting principle, since the fund had historically amortized such premiums to maturity for U.S. GAAP. As a result of the adoption, the fund recognized a cumulative effect adjustment that decreased the beginning of period cost of investments and increased the unrealized appreciation on investments by offsetting
39
Notes to Financial Statements – continued
amounts. Adoption had no impact on the fund’s net assets or any prior period information presented in the financial statements. With respect to the fund’s results of operations, amortization of premium to first call date under ASU2017-08 accelerates amortization with the intent of more closely aligning the recognition of income on such bonds with the economics of the instrument.
Balance Sheet Offsetting– The fund’s accounting policy with respect to balance sheet offsetting is that, absent an event of default by the counterparty or a termination of the agreement, the International Swaps and Derivatives Association (ISDA) Master Agreement, or similar agreement, does not result in an offset of reported amounts of financial assets and financial liabilities in the Statement of Assets and Liabilities across transactions between the fund and the applicable counterparty. The fund’s right to setoff may be restricted or prohibited by the bankruptcy or insolvency laws of the particular jurisdiction to which a specific master netting agreement counterparty is subject. Balance sheet offsetting disclosures, to the extent applicable to the fund, have been included in the fund’s Significant Accounting Policies note under the captions for each of the fund’sin-scope financial instruments and transactions.
Investment Valuations– Debt instruments and floating rate loans, including restricted debt instruments, are generally valued at an evaluated or composite bid as provided by a third-party pricing service. Short-term instruments with a maturity at issuance of 60 days or less may be valued at amortized cost, which approximates market value. Futures contracts are generally valued at last posted settlement price on their primary exchange as provided by a third-party pricing service. Futures contracts for which there were no trades that day for a particular position are generally valued at the closing bid quotation on their primary exchange as provided by a third-party pricing service. Swap agreements are generally valued using valuations provided by athird-party pricing service, which for cleared swaps includes an evaluation of any trading activity at the clearinghouses.Open-end investment companies are generally valued at net asset value per share. Securities and other assets generally valued on the basis of information from a third-party pricing service may also be valued at a broker/dealer bid quotation. In determining values, third-party pricing services can utilize both transaction data and market information such as yield, quality, coupon rate, maturity, type of issue, trading characteristics, and other market data. The values of foreign securities and other assets and liabilities expressed in foreign currencies are converted to U.S. dollars using the mean of bid and asked prices for rates provided by athird-party pricing service.
The Board of Trustees has delegated primary responsibility for determining or causing to be determined the value of the fund’s investments (including any fair valuation) to the adviser pursuant to valuation policies and procedures approved by the Board. If the adviser determines that reliable market quotations are not readily available, investments are valued at fair value as determined in good faith by the adviser in accordance with such procedures under the oversight of the Board of Trustees. Under the fund’s valuation policies and procedures, market quotations are not considered to be readily available for most types of debt instruments and floating rate loans and many types of derivatives. These investments are generally valued at fair value based on information from third-party pricing services. In addition, investments may be valued at fair value if the adviser determines that an investment’s value has been materially affected by
40
Notes to Financial Statements – continued
events occurring after the close of the exchange or market on which the investment is principally traded (such as foreign exchange or market) and prior to the determination of the fund’s net asset value, or after the halt of trading of a specific security where trading does not resume prior to the close of the exchange or market on which the security is principally traded. The adviser generally relies on third-party pricing services or other information (such as the correlation with price movements of similar securities in the same or other markets; the type, cost and investment characteristics of the security; the business and financial condition of the issuer; and trading and other market data) to assist in determining whether to fair value and at what value to fair value an investment. The value of an investment for purposes of calculating the fund’s net asset value can differ depending on the source and method used to determine value. When fair valuation is used, the value of an investment used to determine the fund’s net asset value may differ from quoted or published prices for the same investment. There can be no assurance that the fund could obtain the fair value assigned to an investment if it were to sell the investment at the same time at which the fund determines its net asset value per share.
Various inputs are used in determining the value of the fund’s assets or liabilities. These inputs are categorized into three broad levels. In certain cases, the inputs used to measure fair value may fall into different levels of the fair value hierarchy. In such cases, an investment’s level within the fair value hierarchy is based on the lowest level of input that is significant to the fair value measurement. The fund’s assessment of the significance of a particular input to the fair value measurement in its entirety requires judgment, and considers factors specific to the investment. Level 1 includes unadjusted quoted prices in active markets for identical assets or liabilities. Level 2 includes other significant observable market-based inputs (including quoted prices for similar securities, interest rates, prepayment speed, and credit risk). Level 3 includes unobservable inputs, which may include the adviser’s own assumptions in determining the fair value of investments. Other financial instruments are derivative instruments, such as futures contracts and swap agreements. The following is a summary of the levels used as of April 30, 2020 in valuing the fund’s assets or liabilities:
| | | | | | | | | | | | | | | | |
| | | | |
| Financial Instruments | | Level 1 | | | Level 2 | | | Level 3 | | | Total | |
| U.S. Treasury Bonds & U.S. Government Agencies & Equivalents | | | $— | | | | $231,126,885 | | | | $— | | | | $231,126,885 | |
| Non - U.S. Sovereign Debt | | | — | | | | 20,564,322 | | | | — | | | | 20,564,322 | |
| Municipal Bonds | | | — | | | | 21,973,891 | | | | — | | | | 21,973,891 | |
| U.S. Corporate Bonds | | | — | | | | 668,222,350 | | | | — | | | | 668,222,350 | |
| Residential Mortgage-Backed Securities | | | — | | | | 64,230,034 | | | | — | | | | 64,230,034 | |
| Commercial Mortgage-Backed Securities | | | — | | | | 147,297,128 | | | | — | | | | 147,297,128 | |
| Asset-Backed Securities (including CDOs) | | | — | | | | 368,305,456 | | | | — | | | | 368,305,456 | |
| Foreign Bonds | | | — | | | | 305,455,781 | | | | — | | | | 305,455,781 | |
| Mutual Funds | | | 43,166,718 | | | | — | | | | — | | | | 43,166,718 | |
| Total | | | $43,166,718 | | | | $1,827,175,847 | | | | $— | | | | $1,870,342,565 | |
| | | | |
| Other Financial Instruments | | | | | | | | | | | | |
| Futures Contracts – Assets | | | $1,412,897 | | | | $— | | | | $— | | | | $1,412,897 | |
| Swap Agreements – Assets | | | — | | | | 4,721,825 | | | | — | | | | 4,721,825 | |
41
Notes to Financial Statements – continued
For further information regarding security characteristics, see the Portfolio of Investments.
Derivatives– The fund uses derivatives primarily to increase or decrease exposure to a particular market or segment of the market, or security, to increase or decrease interest rate or currency exposure, or as alternatives to direct investments. Derivatives are used for hedging ornon-hedging purposes. While hedging can reduce or eliminate losses, it can also reduce or eliminate gains. When the fund uses derivatives as an investment to increase market exposure, or for hedging purposes, gains and losses from derivative instruments may be substantially greater than the derivative’s original cost.
The derivative instruments used by the fund during the period were futures contracts and swap agreements. Depending on the type of derivative, the fund may exit a derivative position by entering into an offsetting transaction with a counterparty or exchange, negotiating an agreement with the derivative counterparty, or novating the position to a third party. The fund may be unable to promptly close out a futures position in instances where the daily fluctuation in the price for that type of future exceeds the daily limit set by the exchange. The fund’s period end derivatives, as presented in the Portfolio of Investments and the associated Derivative Contract tables, generally are indicative of the volume of its derivative activity during the period.
| | | | | | |
| | | | | Fair Value (a) | |
| | |
| Risk | | Derivative Contracts | | Asset Derivatives | |
| Interest Rate | | Interest Rate Futures | | | $1,412,897 | |
| Interest Rate | | Interest Rate Swaps | | | 4,721,825 | |
| Total | | | | | $6,134,722 | |
| (a) | Values presented in this table for futures contracts and cleared swap agreements correspond to the values reported in the fund’s Portfolio of Investments. Only the current day net variation margin for futures contracts and cleared swap agreements is separately reported within the fund’s Statement of Assets and Liabilities. |
The following table presents, by major type of derivative contract, the realized gain (loss) on derivatives held by the fund for the year ended April 30, 2020 as reported in the Statement of Operations:
| | | | | | | | |
| | |
| Risk | | Futures
Contracts | | | Swap
Agreements | |
| Interest Rate | | | $498,123 | | | | $(978,676 | ) |
| Credit | | | — | | | | 712,581 | |
| Total | | | $498,123 | | | | $(266,095 | ) |
The following table presents, by major type of derivative contract, the change in unrealized appreciation or depreciation on derivatives held by the fund for the year ended April 30, 2020 as reported in the Statement of Operations:
| | | | | | | | |
| | |
| Risk | | Futures
Contracts | | | Swap
Agreements | |
| Interest Rate | | | $1,412,897 | | | | $4,721,825 | |
Derivative counterparty credit risk is managed through formal evaluation of the creditworthiness of all potential counterparties. On certain, but not all, uncleared
42
Notes to Financial Statements – continued
derivatives, the fund attempts to reduce its exposure to counterparty credit risk whenever possible by entering into an ISDA Master Agreement on a bilateral basis. The ISDA Master Agreement gives each party to the agreement the right to terminate all transactions traded under such agreement if there is a specified deterioration in the credit quality of the other party. Upon an event of default or a termination of the ISDA Master Agreement, thenon-defaulting party has the right to close out all transactions traded under such agreement and to net amounts owed under each agreement to one net amount payable by one party to the other. This right to close out and net payments across all transactions traded under the ISDA Master Agreement could result in a reduction of the fund’s credit risk to such counterparty equal to any amounts payable by the fund under the applicable transactions, if any.
Collateral and margin requirements differ by type of derivative. For cleared derivatives (e.g., futures contracts, cleared swaps, and exchange-traded options), margin requirements are set by the clearing broker and the clearing house and collateral, in the form of cash or securities, is posted by the fund directly with the clearing broker. Collateral terms are counterparty agreement specific for uncleared derivatives (e.g., forward foreign currency exchange contracts, uncleared swap agreements, and uncleared options) and collateral, in the form of cash and securities, is held in segregated accounts with the fund’s custodian in connection with these agreements. For derivatives traded under an ISDA Master Agreement, which contains a collateral support annex, the collateral requirements are netted across all transactions traded under such counterparty-specific agreement and an amount is posted from one party to the other to collateralize such obligations. Cash that has been segregated or delivered to cover the fund’s collateral or margin obligations under derivative contracts, if any, will be reported separately in the Statement of Assets and Liabilities as restricted cash for uncleared derivatives and/or deposits with brokers for cleared derivatives. Securities pledged as collateral or margin for the same purpose, if any, are noted in the Portfolio of Investments. The fund may be required to make payments of interest on uncovered collateral or margin obligations with the broker. Any such payments are included in “Miscellaneous” expense in the Statement of Operations.
Futures Contracts– The fund entered into futures contracts which may be used to hedge against or obtain broad market exposure, interest rate exposure, currency exposure, or to manage duration. A futures contract represents a commitment for the future purchase or sale of an asset at a specified price on a specified date.
Upon entering into a futures contract, the fund is required to deposit with the broker, either in cash or securities, an initial margin in an amount equal to a specified percentage of the notional amount of the contract. Subsequent payments (variation margin) are made or received by the fund each day, depending on the daily fluctuations in the value of the contract, and are recorded for financial statement purposes as unrealized gain or loss by the fund until the contract is closed or expires at which point the gain or loss on futures contracts is realized.
The fund bears the risk of interest rates, exchange rates or securities prices moving unexpectedly, in which case, the fund may not achieve the anticipated benefits of the futures contracts and may realize a loss. While futures contracts may present less counterparty risk to the fund since the contracts are exchange traded and the
43
Notes to Financial Statements – continued
exchange’s clearinghouse guarantees payments to the broker, there is still counterparty credit risk due to the insolvency of the broker. The fund’s maximum risk of loss due to counterparty credit risk is equal to the margin posted by the fund to the broker plus any gains or minus any losses on the outstanding futures contracts.
Swap Agreements– During the period the fund entered into swap agreements. Swap agreements generally involve a periodic exchange of cash payments on a net basis, at specified intervals or upon the occurrence of specified events, between the fund and a counterparty. Certain swap agreements may be entered into as a bilateral contract (“uncleared swaps”) while others are required to be centrally cleared (“cleared swaps”). In a cleared swap transaction, the ultimate counterparty to the transaction is a clearinghouse (the “clearinghouse”). The contract is transferred and accepted by the clearinghouse immediately following execution of the swap contract with an executing broker. Thereafter, throughout the term of the cleared swap, the fund interfaces indirectly with the clearinghouse through a clearing broker and has counterparty risk to the clearing broker as well.
Both cleared and uncleared swap agreements are marked to market daily. The value of uncleared swap agreements is reported in the Statement of Assets and Liabilities as “Uncleared swaps, at value” which includes any related interest accruals to be paid or received by the fund. For cleared swaps, payments (variation margin) are made or received by the fund each day, depending on the daily fluctuations in the value of the cleared swap, such that only the current day net receivable or payable for variation margin is reported in the Statement of Assets and Liabilities.
For both cleared and uncleared swaps, the periodic exchange of net cash payments, at specified intervals or upon the occurrence of specified events as stipulated by the agreement, is recorded as realized gain or loss on swap agreements in the Statement of Operations. Premiums paid or received at the inception of the agreements are amortized using the effective interest method over the term of the agreement as realized gain or loss on swap agreements in the Statement of Operations. A liquidation payment received or made upon early termination is recorded as a realized gain or loss on swap agreements in the Statement of Operations. The change in unrealized appreciation or depreciation on swap agreements in the Statement of Operations reflects the aggregate change over the reporting period in the value of swaps net of any unamortized premiums paid or received.
Risks related to swap agreements include the possible lack of a liquid market, unfavorable market and interest rate movements of the underlying instrument and the failure of the counterparty to perform under the terms of the agreements. The fund’s maximum risk of loss from counterparty credit risk is the discounted net value of the cash flows to be received from/paid to the counterparty over the contract’s remaining life, to the extent that the amount is positive. To address counterparty risk, uncleared swap agreements are limited to only highly-rated counterparties. Risk is further reduced by having an ISDA Master Agreement between the fund and the counterparty providing for netting as described above and, where applicable, by the posting of collateral by the counterparty to the fund to cover the fund’s exposure to the counterparty under such ISDA Master Agreement. The fund’s counterparty risk due to
44
Notes to Financial Statements – continued
cleared swaps is mitigated by the fact that the clearinghouse is the true counterparty to the transaction and the regulatory requirement safeguards in the event of a clearing broker bankruptcy.
The fund entered into interest rate swap agreements in order to manage its exposure to interest or foreign exchange rate fluctuations. Interest rate swap agreements involve the periodic exchange of cash flows, between the fund and a counterparty, based on the difference between two interest rates applied to a notional principal amount. The two interest rates exchanged may either be a fixed rate and a floating rate or two floating rates based on different indices.
The fund entered into credit default swap agreements in order to manage its exposure to the market or certain sectors of the market, to reduce its credit risk exposure to defaults of corporate and sovereign issuers or to create exposure to corporate or sovereign issuers to which it is not otherwise exposed. In a credit default swap agreement, the protection buyer can make an upfront payment and will make a stream of payments to the protection seller based on a fixed percentage applied to the agreement notional amount in exchange for the right to receive a specified return upon the occurrence of a defined credit event on the reference obligation (which may be either a single security or a basket of securities issued by corporate or sovereign issuers) and, with respect to the cases where physical settlement applies, the delivery by the buyer to the seller of a defined deliverable obligation. Although agreement-specific, credit events generally consist of a combination of the following: bankruptcy, failure to pay, restructuring, obligation acceleration, obligation default, or repudiation/moratorium, each as defined in the 2003 ISDA Credit Derivatives Definitions as amended by the relevant agreement. Restructuring is generally not applicable when the reference obligation is issued by a North American corporation and obligation acceleration, obligation default, or repudiation/moratorium are generally only applicable when the reference obligation is issued by a sovereign entity or an entity in an emerging country. Upon determination of the final price for the deliverable obligation (or upon delivery of the deliverable obligation in the case of physical settlement), the difference between the value of the deliverable obligation and the swap agreement’s notional amount is recorded as realized gain or loss on swap agreements in the Statement of Operations.
Indemnifications– Under the fund’s organizational documents, its officers and Trustees may be indemnified against certain liabilities and expenses arising out of the performance of their duties to the fund. Additionally, in the normal course of business, the fund enters into agreements with service providers that may contain indemnification clauses. The fund’s maximum exposure under these agreements is unknown as this would involve future claims that may be made against the fund that have not yet occurred.
Investment Transactions and Income– Investment transactions are recorded on the trade date. Interest income is recorded on the accrual basis. All premium and discount is amortized or accreted for financial statement purposes in accordance with U.S. generally accepted accounting principles. Interest payments received in additional securities are recorded on theex-interest date in an amount equal to the value of the security on such date.
45
Notes to Financial Statements – continued
The fund may receive proceeds from litigation settlements. Any proceeds received from litigation involving portfolio holdings are reflected in the Statement of Operations in realized gain/loss if the security has been disposed of by the fund or in unrealized gain/loss if the security is still held by the fund. Any other proceeds from litigation not related to portfolio holdings are reflected as other income in the Statement of Operations.
The fund invests a significant portion of its assets in asset-backed and/or mortgage-backed securities. For these securities, the value of the debt instrument also depends on the credit quality and adequacy of the underlying assets or collateral as well as whether there is a security interest in the underlying assets or collateral. Enforcing rights, if any, against the underlying assets or collateral may be difficult. U.S. Government securities not supported as to the payment of principal or interest by the U.S. Treasury, such as those issued by Fannie Mae, Freddie Mac, and the Federal Home Loan Banks, are subject to greater credit risk than are U.S. Government securities supported by the U.S. Treasury, such as those issued by Ginnie Mae.
The fund purchased or sold debt securities on a when-issued or delayed delivery basis, or in a “To Be Announced” (TBA) or “forward commitment” transaction with delivery or payment to occur at a later date beyond the normal settlement period. When the fund sells securities on a when-issued, delayed delivery, TBA, or forward commitment basis, the fund typically owns or has the right to acquire securities equivalent in kind and amount to the delivered securities. At the time a fund enters into a commitment to purchase or sell a security, the transaction is recorded and the value of the security acquired or sold is reflected in the fund’s net asset value. The price of such security and the date that the security will be delivered and paid for are fixed at the time the transaction is negotiated. The value of the security may vary with market fluctuations. No interest accrues to the fund until payment takes place. At the time that a fund enters into this type of transaction, the fund is required to have sufficient cash and/or liquid securities to cover its commitments. Losses may arise due to changes in the value of the underlying securities prior to settlement date or if the counterparty does not perform under the contract’s terms, or if the issuer does not issue the securities due to political, economic or other factors.
To mitigate the counterparty credit risk on TBA securities and other types of forward settling mortgage-backed securities, the fund whenever possible enters into a Master Securities Forward Transaction Agreement (“MSFTA”) on a bilateral basis with each of the counterparties with whom it undertakes a significant volume of transactions. The MSFTA gives each party to the agreement the right to terminate all transactions traded under such agreement if there is a specified deterioration in the credit quality of the other party. Upon an event of default or a termination of the MSFTA, thenon-defaulting party has the right to close out all transactions traded under such agreement and to net amounts owed under each transaction to one net amount payable by one party to the other. This right to close out and net payments across all transactions traded under the MSFTA could result in a reduction of the fund’s credit risk to such counterparty equal to any amounts payable by the fund under the applicable transactions, if any.
46
Notes to Financial Statements – continued
For mortgage-backed securities traded under a MSFTA, the collateral and margining requirements are contract specific. Collateral amounts across all transactions traded under such agreement are netted and an amount is posted from one party to the other to collateralize such obligations. Cash that has been pledged to cover the fund’s collateral or margin obligations under a MSFTA, if any, will be reported separately on the Statement of Assets and Liabilities as restricted cash. Securities pledged as collateral or margin for the same purpose, if any, are noted in the Portfolio of Investments.
Fees Paid Indirectly– The fund’s custody fee may be reduced by a credit earned under an arrangement that measures the value of U.S. dollars deposited with the custodian by the fund. The amount of the credit, for the year ended April 30, 2020, is shown as a reduction of total expenses in the Statement of Operations.
Tax Matters and Distributions– The fund intends to qualify as a regulated investment company, as defined under Subchapter M of the Internal Revenue Code, and to distribute all of its taxable income, including realized capital gains. As a result, no provision for federal income tax is required. The fund’s federal tax returns, when filed, will remain subject to examination by the Internal Revenue Service for a three year period. Management has analyzed the fund’s tax positions taken on federal and state tax returns for all open tax years and does not believe that there are any uncertain tax positions that require recognition of a tax liability. Foreign taxes, if any, have been accrued by the fund in the accompanying financial statements in accordance with the applicable foreign tax law. Foreign income taxes may be withheld by certain countries in which the fund invests. Additionally, capital gains realized by the fund on securities issued in or by certain foreign countries may be subject to capital gains tax imposed by those countries.
Distributions to shareholders are recorded on theex-dividend date. Income and capital gain distributions are determined in accordance with income tax regulations, which may differ from U.S. generally accepted accounting principles. Certain capital accounts in the financial statements are periodically adjusted for permanent differences in order to reflect their tax character. These adjustments have no impact on net assets or net asset value per share. Temporary differences which arise from recognizing certain items of income, expense, gain or loss in different periods for financial statement and tax purposes will reverse at some time in the future.
Book/tax differences primarily relate to amortization and accretion of debt securities and derivative transactions.
The tax character of distributions declared to shareholders for the last two fiscal years is as follows:
| | | | | | | | |
| | |
| | | Year ended
4/30/20 | | | Year ended
4/30/19 | |
Ordinary income (including any
short-term capital gains) | | | $44,522,134 | | | | $34,717,671 | |
47
Notes to Financial Statements – continued
The federal tax cost and the tax basis components of distributable earnings were as follows:
| | | | |
| |
| As of 4/30/20 | | | |
| |
| Cost of investments | | | $1,890,817,117 | |
| Gross appreciation | | | 26,883,501 | |
| |
| Gross depreciation | | | (41,223,331 | ) |
| Net unrealized appreciation (depreciation) | | | $(14,339,830 | ) |
| |
| Undistributed ordinary income | | | 2,612,803 | |
| Capital loss carryforwards | | | (30,483,603 | ) |
| Other temporary differences | | | (3,563,847 | ) |
As of April 30, 2020, the fund had capital loss carryforwards available to offset future realized gains. These net capital losses may be carried forward indefinitely and their character is retained as short-term and/or long-term losses. Such losses are characterized as follows:
Multiple Classes of Shares of Beneficial Interest– The fund offers multiple classes of shares, which differ in their respective distribution, service, and program manager fees. The fund’s income and common expenses are allocated to shareholders based on the value of settled shares outstanding of each class. The fund’s realized and unrealized gain (loss) are allocated to shareholders based on the daily net assets of each class. Dividends are declared separately for each class. Differences in per share dividend rates are generally due to differences in separate class expenses. Class B and Class 529B shares will convert to Class A and Class 529A shares, respectively, approximately eight years after purchase. Class C and Class 529C shares will convert to Class A and Class 529A shares, respectively, approximately ten years after purchase. The fund’s distributions declared to shareholders as reported in the Statements of Changes in Net Assets are presented by class as follows:
| | | | | | | | |
| | |
| | | Year
ended
4/30/20 | | | Year
ended
4/30/19 | |
| Class A | | | $16,934,771 | | | | $12,701,370 | |
| Class B | | | 58,262 | | | | 59,359 | |
| Class C | | | 725,269 | | | | 802,337 | |
| Class I | | | 6,221,183 | | | | 3,853,501 | |
| Class R1 | | | 19,997 | | | | 5,742 | |
| Class R2 | | | 47,141 | | | | 56,099 | |
| Class R3 | | | 42,496 | | | | 47,850 | |
| Class R4 | | | 5,854 | | | | 12,087 | |
| Class R6 | | | 16,331,155 | | | | 13,868,958 | |
| Class 529A | | | 3,360,183 | | | | 2,650,949 | |
| Class 529B | | | 61,296 | | | | 59,973 | |
| Class 529C | | | 714,527 | | | | 599,446 | |
| Total | | | $44,522,134 | | | | $34,717,671 | |
48
Notes to Financial Statements – continued
(3) Transactions with Affiliates
Investment Adviser– The fund has an investment advisory agreement with MFS to provide overall investment management and related administrative services and facilities to the fund. For the period from May 1, 2019 through July 31, 2019, the management fee was computed daily and paid monthly at an annual rate of 0.40% of the fund’s average daily net assets. Effective August 1, 2019, the management fee is computed daily and paid monthly at the following annual rates based on the fund’s average daily net assets:
| | | | |
| Up to $1 billion | | | 0.40 | % |
| In excess of $1 billion and up to $2.5 billion | | | 0.35 | % |
| In excess of $2.5 billion | | | 0.33 | % |
MFS has agreed in writing to reduce its management fee by a specified amount if certain MFS mutual fund assets exceed thresholds agreed to by MFS and the fund’s Board of Trustees. For the year ended April 30, 2020, this management fee reduction amounted to $174,202, which is included in the reduction of total expenses in the Statement of Operations. The management fee incurred for the year ended April 30, 2020 was equivalent to an annual effective rate of 0.37% of the fund’s average daily net assets.
Effective August 1, 2019, the investment adviser has agreed in writing to pay a portion of the fund’s total annual operating expenses, excluding interest, taxes, extraordinary expenses, brokerage and transaction costs, and investment-related expenses, such that total fund operating expenses do not exceed the following rates annually of each class’s average daily net assets:
| | | | | | | | | | | | | | | | | | | | | | | | | | | | | | | | | | | | | | | | | | | | |
| Classes | |
| | | | | | | | | | | |
| A | | B | | | C | | | I | | | R1 | | | R2 | | | R3 | | | R4 | | | R6 | | | 529A | | | 529B | | | 529C | |
| 0.62% | | | 1.37% | | | | 1.47% | | | | 0.47% | | | | 1.47% | | | | 0.87% | | | | 0.72% | | | | 0.47% | | | | 0.40% | | | | 0.67% | | | | 1.42% | | | | 1.52% | |
This written agreement will continue until modified by the fund’s Board of Trustees, but such agreement will continue at least until August 31, 2020. For the period from August 1, 2019 through April 30, 2020, this reduction amounted to $906,704, which is included in the reduction of total expenses in the Statement of Operations.
Distributor– MFS Fund Distributors, Inc. (MFD), a wholly-owned subsidiary of MFS, as distributor, received $110,078 and $7,942 for the year ended April 30, 2020, as its portion of the initial sales charge on sales of Class A and Class 529A shares of the fund, respectively.
The Board of Trustees has adopted a distribution plan for certain share classes pursuant to Rule12b-1 of the Investment Company Act of 1940.
The fund’s distribution plan provides that the fund will pay MFD for services provided by MFD and financial intermediaries in connection with the distribution and servicing of certain share classes. One component of the plan is a distribution fee paid to MFD and another component of the plan is a service fee paid to MFD. MFD may subsequently pay all, or a portion, of the distribution and/or service fees to financial intermediaries.
49
Notes to Financial Statements – continued
Distribution Plan Fee Table:
| | | | | | | | | | | | | | | | | | | | |
| | | | | |
| | | Distribution
Fee Rate (d) | | | Service
Fee Rate (d) | | | Total
Distribution
Plan (d) | | | Annual
Effective
Rate (e) | | | Distribution
and Service
Fee | |
| Class A | | | — | | | | 0.25% | | | | 0.25% | | | | 0.15% | | | | $1,683,871 | |
| Class B | | | 0.75% | | | | 0.25% | | | | 1.00% | | | | 0.90% | | | | 32,577 | |
| Class C | | | 0.75% | | | | 0.25% | | | | 1.00% | | | | 1.00% | | | | 430,784 | |
| Class R1 | | | 0.75% | | | | 0.25% | | | | 1.00% | | | | 1.00% | | | | 12,163 | |
| Class R2 | | | 0.25% | | | | 0.25% | | | | 0.50% | | | | 0.40% | | | | 10,283 | |
| Class R3 | | | — | | | | 0.25% | | | | 0.25% | | | | 0.25% | | | | 4,355 | |
| Class 529A | | | — | | | | 0.25% | | | | 0.25% | | | | 0.14% | | | | 340,352 | |
| Class 529B | | | 0.75% | | | | 0.25% | | | | 1.00% | | | | 0.89% | | | | 35,801 | |
| Class 529C | | | 0.75% | | | | 0.25% | | | | 1.00% | | | | 0.99% | | | | 437,604 | |
| Total Distribution and Service Fees | | | | | | | | | | | | $2,987,790 | |
| (d) | In accordance with the distribution plan for certain classes, the fund pays distribution and/or service fees equal to these annual percentage rates of each class’s average daily net assets. The distribution and service fee rates disclosed by class represent the current rates in effect at the end of the reporting period. Any rate changes, if applicable, are detailed below. |
| (e) | The annual effective rates represent actual fees incurred under the distribution plan for the year ended April 30, 2020 based on each class’s average daily net assets. 0.10% of the Class A, Class B, Class 529A, and Class 529B service fee is currently being waived under a written waiver agreement. For the year ended April 30, 2020, this waiver amounted to $673,543, $3,261, $136,139, and $3,582, for Class A, Class B, Class 529A, and Class 529B, respectively, and is included in the reduction of total expenses in the Statement of Operations. This written waiver agreement will continue until modified by the fund’s Board of Trustees, but such agreement will continue at least until August 31, 2020. 0.10% of the Class R2 distribution fee is currently being waived under a written waiver agreement. For the year ended April 30, 2020, this waiver amounted to $2,057 and is included in the reduction of total expenses in the Statement of Operations. This written waiver agreement will continue until modified by the fund’s Board of Trustees, but such agreement will continue at least until August 31, 2020. MFD has voluntarily agreed to rebate a portion of each class’s 0.25% service fee attributable to accounts for which there is no financial intermediary specified on the account except for accounts attributable to MFS or its affiliates’ seed money. For the year ended April 30, 2020, this rebate amounted to $8,858, $462, $12,149, $461, and $3,482, for Class A, Class C, Class 529A, Class 529B, and Class 529C, respectively, and is included in the reduction of total expenses in the Statement of Operations. |
Certain Class A shares are subject to a contingent deferred sales charge (CDSC) in the event of a shareholder redemption within 18 months of purchase. Class B and Class 529B shares are subject to a CDSC in the event of a shareholder redemption within six years of purchase. Class C and Class 529C shares are subject to a CDSC in
50
Notes to Financial Statements – continued
the event of a shareholder redemption within 12 months of purchase. All contingent deferred sales charges are paid to MFD and during the year ended April 30, 2020, were as follows:
| | | | |
| |
| | | Amount | |
| Class A | | | $65,473 | |
| Class B | | | 1,646 | |
| Class C | | | 7,235 | |
| Class 529B | | | 956 | |
| Class 529C | | | 2,359 | |
The fund has entered into and may from time to time enter into contracts with program managers and other parties which administer the tuition programs through which an investment in the fund’s 529 share classes is made. The fund has entered into an agreement with MFD pursuant to which MFD receives an annual fee of up to 0.05% of the average daily net assets attributable to each 529 share class. The services provided by MFD, or a third party with which MFD contracts, include recordkeeping and tax reporting and account services, as well as services designed to maintain the program’s compliance with the Internal Revenue Code and other regulatory requirements. Program manager fees for the year ended April 30, 2020, were as follows:
| | | | |
| |
| | | Fee | |
| Class 529A | | | $68,072 | |
| Class 529B | | | 1,791 | |
| Class 529C | | | 21,902 | |
| Total Program Manager Fees | | | $91,765 | |
Shareholder Servicing Agent– MFS Service Center, Inc. (MFSC), a wholly-owned subsidiary of MFS, receives a fee from the fund for its services as shareholder servicing agent calculated as a percentage of the average daily net assets of the fund as determined periodically under the supervision of the fund’s Board of Trustees. For the year ended April 30, 2020, the fee was $375,441, which equated to 0.0216% annually of the fund’s average daily net assets. MFSC also receives payment from the fund forout-of-pocket expenses,sub-accounting and other shareholder servicing costs which may be paid to affiliated and unaffiliated service providers. Class R6 shares do not incursub-accounting fees. For the year ended April 30, 2020, theseout-of-pocket expenses,sub-accounting and other shareholder servicing costs amounted to $940,594.
Under a Special Servicing Agreement among MFS, certain MFS funds which invest in other MFS funds (“MFSfund-of-funds”) and certain underlying funds in which a MFSfund-of-funds invests (“underlying funds”), each underlying fund may pay a portion of each MFSfund-of-funds’ transfer agent-related expenses, includingsub-accounting fees payable to financial intermediaries, to the extent such payments do not exceed the benefits realized or expected to be realized by the underlying fund from the investment in the underlying fund by the MFSfund-of-funds. For the year ended April 30, 2020, these costs for the fund amounted to $221,588 and are included in “Shareholder servicing costs” in the Statement of Operations.
Administrator– MFS provides certain financial, legal, shareholder communications, compliance, and other administrative services to the fund. Under an administrative
51
Notes to Financial Statements – continued
services agreement, the fund reimburses MFS the costs incurred to provide these services. The fund is charged an annual fixed amount of $17,500 plus a fee based on average daily net assets. The administrative services fee incurred for the year ended April 30, 2020 was equivalent to an annual effective rate of 0.0138% of the fund’s average daily net assets.
Trustees’ and Officers’ Compensation– The fund pays compensation to independent Trustees in the form of a retainer, attendance fees, and additional compensation to Board and Committee chairpersons. The fund does not pay compensation directly to Trustees or officers of the fund who are also officers of the investment adviser, all of whom receive remuneration from MFS for their services to the fund. Certain officers and Trustees of the fund are officers or directors of MFS, MFD, and MFSC.
Other– This fund and certain other funds managed by MFS (the funds) had entered into a service agreement (the ISO Agreement) which provided for payment of fees solely by the funds to Tarantino LLC in return for the provision of services of an Independent Senior Officer (ISO) for the funds. Frank L. Tarantino served as the ISO and was an officer of the funds and the sole member of Tarantino LLC. Effective June 30, 2019, Mr. Tarantino retired from his position as ISO for the funds, and the ISO Agreement was terminated. For the year ended April 30, 2020, the fee paid by the fund under this agreement was $1,034 and is included in “Miscellaneous” expense in the Statement of Operations. MFS had agreed to bear all expenses associated with office space, other administrative support, and supplies provided to the ISO.
The fund is permitted to engage in purchase and sale transactions with funds and accounts for which MFS serves as investment adviser or sub-adviser (“cross-trades”) pursuant to a policy adopted by the Board of Trustees. This policy has been designed to ensure that cross-trades conducted by the fund comply with Rule 17a-7 under the Investment Company Act of 1940. During the year ended April 30, 2020, the fund engaged in purchase transactions pursuant to this policy, which amounted to $938,421.
The fund invests in the MFS Institutional Money Market Portfolio which is managed by MFS and seeks current income consistent with preservation of capital and liquidity. This money market fund does not pay a management fee to MFS but does incur investment and operating costs.
(4) Portfolio Securities
For the year ended April 30, 2020, purchases and sales of investments, other than short-term obligations, were as follows:
| | | | | | | | |
| | |
| | | Purchases | | | Sales | |
| U.S. Government securities | | | $216,147,644 | | | | $183,472,924 | |
| Non-U.S. Government securities | | | 781,877,330 | | | | 515,149,431 | |
52
Notes to Financial Statements – continued
(5) Shares of Beneficial Interest
The fund’s Declaration of Trust permits the Trustees to issue an unlimited number of full and fractional shares of beneficial interest. Transactions in fund shares were as follows:
| | | | | | | | | | | | | | | | |
| | | Year ended
4/30/20 | | | Year ended
4/30/19 | |
| | | | |
| | | Shares | | | Amount | | | Shares | | | Amount | |
| Shares sold | | | | | | | | | | | | | | | | |
Class A | | | 93,515,963 | | | | $559,683,637 | | | | 82,001,343 | | | | $483,785,604 | |
Class B | | | 178,227 | | | | 1,060,728 | | | | 283,465 | | | | 1,667,962 | |
Class C | | | 3,511,375 | | | | 20,984,229 | | | | 3,283,396 | | | | 19,330,905 | |
Class I | | | 44,734,305 | | | | 266,497,872 | | | | 26,334,952 | | | | 154,740,628 | |
Class R1 | | | 194,999 | | | | 1,168,168 | | | | 27,921 | | | | 164,052 | |
Class R2 | | | 77,155 | | | | 460,678 | | | | 119,292 | | | | 704,451 | |
Class R3 | | | 50,676 | | | | 303,510 | | | | 57,614 | | | | 341,537 | |
Class R4 | | | 12,830 | | | | 76,745 | | | | 12,682 | | | | 75,136 | |
Class R6 | | | 18,622,712 | | | | 111,036,663 | | | | 14,053,268 | | | | 82,792,883 | |
Class 529A | | | 11,615,557 | | | | 69,234,009 | | | | 9,313,531 | | | | 54,980,394 | |
Class 529B | | | 321,428 | | | | 1,916,822 | | | | 324,559 | | | | 1,910,113 | |
Class 529C | | | 3,887,603 | | | | 23,249,622 | | | | 3,501,082 | | | | 20,672,767 | |
| | | 176,722,830 | | | | $1,055,672,683 | | | | 139,313,105 | | | | $821,166,432 | |
| | | |
Shares issued to shareholders in
reinvestment of distributions | | | | | | | | | | | | | |
Class A | | | 2,345,802 | | | | $14,059,044 | | | | 1,731,784 | | | | $10,235,705 | |
Class B | | | 9,067 | | | | 54,265 | | | | 9,123 | | | | 53,799 | |
Class C | | | 111,398 | | | | 667,579 | | | | 130,861 | | | | 772,576 | |
Class I | | | 917,486 | | | | 5,475,553 | | | | 508,598 | | | | 2,994,164 | |
Class R1 | | | 3,345 | | | | 19,994 | | | | 974 | | | | 5,742 | |
Class R2 | | | 7,387 | | | | 44,290 | | | | 8,044 | | | | 47,500 | |
Class R3 | | | 7,084 | | | | 42,492 | | | | 8,091 | | | | 47,848 | |
Class R4 | | | 974 | | | | 5,853 | | | | 2,035 | | | | 12,085 | |
Class R6 | | | 2,624,852 | | | | 15,702,791 | | | | 2,263,204 | | | | 13,343,053 | |
Class 529A | | | 558,251 | | | | 3,345,366 | | | | 447,094 | | | | 2,640,713 | |
Class 529B | | | 10,148 | | | | 60,660 | | | | 10,088 | | | | 59,418 | |
Class 529C | | | 118,404 | | | | 709,906 | | | | 100,554 | | | | 594,198 | |
| | | 6,714,198 | | | | $40,187,793 | | | | 5,220,450 | | | | $30,806,801 | |
53
Notes to Financial Statements – continued
| | | | | | | | | | | | | | | | |
| | | Year ended
4/30/20 | | | Year ended
4/30/19 | |
| | | | |
| | | Shares | | | Amount | | | Shares | | | Amount | |
| Shares reacquired | | | | | | | | | | | | | | | | |
Class A | | | (74,716,582 | ) | | | $(446,986,518 | ) | | | (64,357,748 | ) | | | $(379,828,657 | ) |
Class B | | | (352,399 | ) | | | (2,095,377 | ) | | | (312,457 | ) | | | (1,841,013 | ) |
Class C | | | (4,471,948 | ) | | | (26,734,513 | ) | | | (5,016,704 | ) | | | (29,601,778 | ) |
Class I | | | (33,550,250 | ) | | | (199,481,971 | ) | | | (19,391,465 | ) | | | (114,056,386 | ) |
Class R1 | | | (5,438 | ) | | | (32,150 | ) | | | (3,031 | ) | | | (17,799 | ) |
Class R2 | | | (242,498 | ) | | | (1,451,234 | ) | | | (197,024 | ) | | | (1,161,860 | ) |
Class R3 | | | (180,684 | ) | | | (1,085,591 | ) | | | (51,345 | ) | | | (302,743 | ) |
Class R4 | | | (23,945 | ) | | | (143,497 | ) | | | (1,073,106 | ) | | | (6,321,154 | ) |
Class R6 | | | (14,542,280 | ) | | | (86,617,866 | ) | | | (11,061,646 | ) | | | (65,066,561 | ) |
Class 529A | | | (7,621,558 | ) | | | (45,691,517 | ) | | | (6,596,037 | ) | | | (38,892,234 | ) |
Class 529B | | | (396,985 | ) | | | (2,370,900 | ) | | | (423,004 | ) | | | (2,487,180 | ) |
Class 529C | | | (3,977,066 | ) | | | (23,673,805 | ) | | | (3,486,726 | ) | | | (20,562,066 | ) |
| | | (140,081,633 | ) | | | $(836,364,939 | ) | | | (111,970,293 | ) | | | $(660,139,431 | ) |
| | | | |
| Net change | | | | | | | | | | | | | | | | |
Class A | | | 21,145,183 | | | | $126,756,163 | | | | 19,375,379 | | | | $114,192,652 | |
Class B | | | (165,105 | ) | | | (980,384 | ) | | | (19,869 | ) | | | (119,252 | ) |
Class C | | | (849,175 | ) | | | (5,082,705 | ) | | | (1,602,447 | ) | | | (9,498,297 | ) |
Class I | | | 12,101,541 | | | | 72,491,454 | | | | 7,452,085 | | | | 43,678,406 | |
Class R1 | | | 192,906 | | | | 1,156,012 | | | | 25,864 | | | | 151,995 | |
Class R2 | | | (157,956 | ) | | | (946,266 | ) | | | (69,688 | ) | | | (409,909 | ) |
Class R3 | | | (122,924 | ) | | | (739,589 | ) | | | 14,360 | | | | 86,642 | |
Class R4 | | | (10,141 | ) | | | (60,899 | ) | | | (1,058,389 | ) | | | (6,233,933 | ) |
Class R6 | | | 6,705,284 | | | | 40,121,588 | | | | 5,254,826 | | | | 31,069,375 | |
Class 529A | | | 4,552,250 | | | | 26,887,858 | | | | 3,164,588 | | | | 18,728,873 | |
Class 529B | | | (65,409 | ) | | | (393,418 | ) | | | (88,357 | ) | | | (517,649 | ) |
Class 529C | | | 28,941 | | | | 285,723 | | | | 114,910 | | | | 704,899 | |
| | | 43,355,395 | | | | $259,495,537 | | | | 32,563,262 | | | | $191,833,802 | |
Class T shares were not publicly available for sale during the period. Please see the fund’s prospectus for details.
Effective May 1, 2006, purchases of the fund’s Class B shares were closed to new and existing investors subject to certain exceptions. Effective June 1, 2019, purchases of the fund’s Class 529B shares are closed to new and existing investors subject to certain exceptions. Please see the fund’s prospectus for details.
The fund is one of several mutual funds in which certain MFS funds may invest. The MFS funds do not invest in the underlying funds for the purpose of exercising management or control. At the end of the period, the MFS Conservative Allocation Fund, the MFS Lifetime Income Fund, the MFS Lifetime 2020 Fund, and the MFS Lifetime 2025 Fund were the owners of record of approximately 16%, 6%, 3%, and 2%, respectively, of the value of outstanding voting shares of the fund.
54
Notes to Financial Statements – continued
(6) Line of Credit
The fund and certain other funds managed by MFS participate in a $1.25 billion unsecured committed line of credit, subject to a $1 billion sublimit, provided by a syndicate of banks under a credit agreement. Borrowings may be made for temporary financing needs. Interest is charged to each fund, based on its borrowings, generally at a rate equal to the highest of one month LIBOR, the Federal Funds Effective Rate and the Overnight Bank Funding Rate, plus an agreed upon spread. A commitment fee, based on the average daily, unused portion of the committed line of credit, is allocated among the participating funds. In addition, the fund and other funds managed by MFS have established unsecured uncommitted borrowing arrangements with certain banks for temporary financing needs. Interest is charged to each fund, based on its borrowings, at rates equal to customary reference rates plus an agreed upon spread. For the year ended April 30, 2020, the fund’s commitment fee and interest expense were $8,875 and $0, respectively, and are included in “Miscellaneous” expense in the Statement of Operations.
(7) Investments in Affiliated Issuers
An affiliated issuer may be considered one in which the fund owns 5% or more of the outstanding voting securities, or a company which is under common control. For the purposes of this report, the following were affiliated issuers:
| | | | | | | | | | | | | | | | | | | | | | | | |
| | | | | | |
| Affiliated Issuers | | Beginning
Value | | | Purchases | | | Sales
Proceeds | | | Realized
Gain
(Loss) | | | Change in
Unrealized
Appreciation or
Depreciation | | | Ending
Value | |
| MFS Institutional Money Market Portfolio | | | $44,994,362 | | | | $791,327,987 | | | | $793,160,901 | | | | $8,234 | | | | $(2,964 | ) | | | $43,166,718 | |
| | | | | | |
| Affiliated Issuers | | | | | | | | | | | | | | Dividend
Income | | | Capital Gain
Distributions | |
| MFS Institutional Money Market Portfolio | | | | | | | | | | | | | | | | $827,213 | | | | $— | |
(8) Impacts ofCOVID-19
The pandemic related to the global spread of novel coronavirus disease(COVID-19), which was first detected in December 2019, has resulted in significant disruptions to global business activity and the global economy, as well as the economies of individual countries, the financial performance of individual companies and sectors, and the securities and commodities markets in general. This pandemic, the full effects of which are still unknown, has resulted in substantial market volatility and may have adversely impacted the prices and liquidity of the fund’s investments and the fund’s performance.
55
REPORT OF INDEPENDENT REGISTERED PUBLIC ACCOUNTING FIRM
To the Board of Trustees of MFS Series Trust IX and the Shareholders of MFS Limited Maturity Fund:
Opinion on the Financial Statements and Financial Highlights
We have audited the accompanying statement of assets and liabilities of MFS Limited Maturity Fund (the “Fund”), including the portfolio of investments, as of April 30, 2020, the related statement of operations for the year then ended, the statements of changes in net assets for each of the two years in the period then ended, the financial highlights for each of the five years in the period then ended, and the related notes. In our opinion, the financial statements and financial highlights present fairly, in all material respects, the financial position of the Fund as of April 30, 2020, and the results of its operations for the year then ended, the changes in its net assets for each of the two years in the period then ended, and the financial highlights for each of the five years in the period then ended, in conformity with accounting principles generally accepted in the United States of America.
Basis for Opinion
These financial statements and financial highlights are the responsibility of the Fund’s management. Our responsibility is to express an opinion on the Fund’s financial statements and financial highlights based on our audits. We are a public accounting firm registered with the Public Company Accounting Oversight Board (United States) (PCAOB) and are required to be independent with respect to the Fund in accordance with the U.S. federal securities laws and the applicable rules and regulations of the Securities and Exchange Commission and the PCAOB.
We conducted our audits in accordance with the standards of the PCAOB. Those standards require that we plan and perform the audit to obtain reasonable assurance about whether the financial statements and financial highlights are free of material misstatement, whether due to error or fraud. The Fund is not required to have, nor were we engaged to perform, an audit of its internal control over financial reporting. As part of our audits we are required to obtain an understanding of internal control over financial reporting but not for the purpose of expressing an opinion on the effectiveness of the Fund’s internal control over financial reporting. Accordingly, we express no such opinion.
Our audits included performing procedures to assess the risks of material misstatement of the financial statements and financial highlights, whether due to error or fraud, and performing procedures that respond to those risks. Such procedures included examining, on a test basis, evidence regarding the amounts and disclosures in the financial statements and financial highlights. Our audits also included evaluating the accounting principles used and significant estimates made by management, as well as evaluating the overall presentation of the financial statements and financial highlights. Our procedures included confirmation of securities owned as of April 30, 2020, by
56
Report of Independent Registered Public Accounting Firm – continued
correspondence with the custodian and brokers; when replies were not received from brokers, we performed other auditing procedures. We believe that our audits provide a reasonable basis for our opinion.
DELOITTE & TOUCHE LLP
Boston, Massachusetts
June 16, 2020
We have served as the auditor of one or more of the MFS investment companies since 1924.
57
TRUSTEES AND OFFICERS — IDENTIFICATION AND BACKGROUND
The Trustees and Officers of the Trust, as of June 1, 2020, are listed below, together with their principal occupations during the past five years. (Their titles may have varied during that period.) The address of each Trustee and Officer is 111 Huntington Avenue, Boston, Massachusetts 02199-7618.
| | | | | | | | | | |
Name, Age | | Position(s)
Held with Fund | | Trustee/Officer Since (h) | | Number of
MFS Funds
overseen
by the
Trustee | | Principal
Occupations During the Past Five Years | | Other Directorships
During the Past
Five Years (j) |
| INTERESTED TRUSTEES |
Robert J. Manning (k)
(age 56) | | Trustee | | February 2004 | | 133 | | Massachusetts Financial Services Company, Executive Chairman (since January 2017); Director; Chairman of the Board; Chief Executive Officer (until 2015);Co-Chief Executive Officer (2015-2016) | | N/A |
| | | | | |
Robin A. Stelmach (k) (age 58) | | Trustee | | January 2014 | | 133 | | Massachusetts Financial Services Company, Vice Chair (since January 2017); Chief Operating Officer and Executive Vice President (until January 2017) | | N/A |
| INDEPENDENT TRUSTEES |
John P. Kavanaugh (age 65) | | Trustee and Chair of Trustees | | January 2009 | | 133 | | Private investor | | N/A |
| | | | | |
Steven E. Buller (age 68) | | Trustee | | February 2014 | | 133 | | Financial Accounting Standards Advisory Council, Chairman (2014-2015); Public Company Accounting Oversight Board, Standing Advisory Group, Member (until 2014); BlackRock, Inc. (investment management), Managing Director (until 2014), BlackRock Finco UK (investment management), Director (until 2014) | | N/A |
58
Trustees and Officers – continued
| | | | | | | | | | |
Name, Age | | Position(s)
Held with Fund | | Trustee/Officer Since (h) | | Number of
MFS Funds
overseen
by the
Trustee | | Principal
Occupations During the Past Five Years | | Other Directorships
During the Past
Five Years (j) |
John A. Caroselli (age 65) | | Trustee | | March 2017 | | 133 | | JC Global Advisors, LLC (management consulting), President (since 2015); First Capital Corporation (commercial finance), Executive Vice President (until 2015) | | N/A |
| | | | | |
Maureen R. Goldfarb (age 65) | | Trustee | | January 2009 | | 133 | | Private investor | | N/A |
| | | | | |
Peter D. Jones
(age 64) | | Trustee | | January 2019 | | 133 | | Franklin Templeton Distributors, Inc. (investment management), President (until 2015); Franklin Templeton Institutional, LLC (investment management), Chairman (until 2015) | | N/A |
| | | | | |
James W. Kilman, Jr.
(age 59) | | Trustee | | January 2019 | | 133 | | Burford Capital Limited (finance and investment management), Chief Financial Officer (since 2019); KielStrand Capital LLC (family office), Chief Executive Officer (since 2016); Morgan Stanley & Co. (financial services), Vice Chairman of Investment Banking,Co-Head of Diversified Financials Coverage – Financial Institutions Investment Banking Group (until 2016) | | Alpha-En Corporation, Director(2016-2019) |
59
Trustees and Officers – continued
| | | | | | | | | | |
Name, Age | | Position(s)
Held with Fund | | Trustee/Officer Since (h) | | Number of
MFS Funds
overseen
by the
Trustee | | Principal
Occupations During the Past Five Years | | Other Directorships
During the Past
Five Years (j) |
Clarence Otis, Jr. (age 64) | | Trustee | | March 2017 | | 133 | | Darden Restaurants, Inc., Chief Executive Officer (until 2014) | | VF Corporation, Director; Verizon Communications, Inc., Director; The Travelers Companies, Director; Federal Reserve Bank of Atlanta, Director (until 2015) |
| | | | | |
Maryanne L. Roepke (age 64) | | Trustee | | May 2014 | | 133 | | American Century Investments (investment management), Senior Vice President and Chief Compliance Officer (until 2014) | | N/A |
| | | | | |
Laurie J. Thomsen
(age 62) | | Trustee | | March 2005 | | 133 | | Private investor | | The Travelers Companies, Director; Dycom Industries, Inc., Director (since 2015) |
| | | | | | | | |
Name, Age | | Position(s) Held with Fund | | Trustee/Officer
Since (h) | | Number of
MFS Funds
for which
the Person
is an Officer | | Principal
Occupations During the Past Five Years |
| OFFICERS | | | | | | | | |
Christopher R. Bohane (k)
(age 46) | | Assistant Secretary and Assistant Clerk | | July 2005 | | 133 | | Massachusetts Financial Services Company, Senior Vice President and Associate General Counsel |
| | | | |
Kino Clark (k) (age 51) | | Assistant Treasurer | | January 2012 | | 133 | | Massachusetts Financial Services Company, Vice President |
| | | | |
John W. Clark, Jr. (k) (age 53) | | Assistant Treasurer | | April 2017 | | 133 | | Massachusetts Financial Services Company, Vice President (since March 2017); Deutsche Bank (financial services), Department Head – Treasurer’s Office (until February 2017) |
60
Trustees and Officers – continued
| | | | | | | | |
Name, Age | | Position(s) Held with Fund | | Trustee/Officer
Since (h) | | Number of
MFS Funds
for which
the Person
is an Officer | | Principal
Occupations During the Past Five Years |
Thomas H. Connors (k) (age 60) | | Assistant Secretary and Assistant Clerk | | September 2012 | | 133 | | Massachusetts Financial Services Company, Vice President and Senior Counsel |
| | | | |
David L. DiLorenzo (k)
(age 51) | | President | | July 2005 | | 133 | | Massachusetts Financial Services Company, Senior Vice President |
| | | | |
Heidi W. Hardin (k) (age 52) | | Secretary and Clerk | | April 2017 | | 133 | | Massachusetts Financial Services Company, Executive Vice President and General Counsel (since March 2017); Harris Associates (investment management), General Counsel (from September 2015 to January 2017); Janus Capital Management LLC (investment management), Senior Vice President and General Counsel (until September 2015) |
| | | | |
Brian E. Langenfeld (k) (age 47) | | Assistant Secretary and Assistant Clerk | | June 2006 | | 133 | | Massachusetts Financial Services Company, Vice President and Senior Counsel |
| | | | |
Amanda S. Mooradian (k) (age 41) | | Assistant Secretary and Assistant Clerk | | September 2018 | | 133 | | Massachusetts Financial Services Company, Assistant Vice President and Senior Counsel |
| | | | |
Susan A. Pereira (k)
(age 49) | | Assistant Secretary and Assistant Clerk | | July 2005 | | 133 | | Massachusetts Financial Services Company, Vice President and Assistant General Counsel |
| | | | |
Kasey L. Phillips (k) (age 49) | | Assistant Treasurer | | September 2012 | | 133 | | Massachusetts Financial Services Company, Vice President |
| | | | |
Matthew A. Stowe (k) (age 45) | | Assistant Secretary and Assistant Clerk | | October 2014 | | 133 | | Massachusetts Financial Services Company, Vice President and Assistant General Counsel |
| | | | |
Martin J. Wolin (k) (age 52) | | Chief Compliance Officer | | July 2015 | | 133 | | Massachusetts Financial Services Company, Senior Vice President and Chief Compliance Officer (since July 2015); Mercer (financial service provider), Chief Risk and Compliance Officer, North America and Latin America (until June 2015) |
61
Trustees and Officers – continued
| | | | | | | | |
Name, Age | | Position(s) Held with Fund | | Trustee/Officer
Since (h) | | Number of
MFS Funds
for which
the Person
is an Officer | | Principal
Occupations During the Past Five Years |
James O. Yost (k)
(age 59) | | Treasurer | | September 1990 | | 133 | | Massachusetts Financial Services Company, Senior Vice President |
| (h) | Date first appointed to serve as Trustee/officer of an MFS Fund. Each Trustee has served continuously since appointment unless indicated otherwise. For the period from December 15, 2004 until February 22, 2005, Mr. Manning served as Advisory Trustee. From January 2012 through December 2016, Messrs. DiLorenzo and Yost served as Treasurer and Deputy Treasurer of the Funds, respectively. |
| (j) | Directorships or trusteeships of companies required to report to the Securities and Exchange Commission (i.e., “public companies”). |
| (k) | “Interested person” of the Trust within the meaning of the Investment Company Act of 1940 (referred to as the 1940 Act), which is the principal federal law governing investment companies like the fund, as a result of a position with MFS. The address of MFS is 111 Huntington Avenue, Boston, Massachusetts 02199-7618. |
Each Trustee (other than Messrs. Jones and Kilman) has been elected by shareholders and each Trustee and Officer holds office until his or her successor is chosen and qualified or until his or her earlier death, resignation, retirement or removal. Messrs. Jones and Kilman became Trustees of the Funds on January 1, 2019. The Trust does not hold annual meetings for the purpose of electing Trustees, and Trustees are not elected for fixed terms. Under the terms of the Board’s retirement policy, an Independent Trustee shall retire at the end of the calendar year in which he or she reaches the earlier of 75 years of age or 15 years of service on the Board (or, in the case of any Independent Trustee who joined the Board prior to 2015, 20 years of service on the Board).
Messrs. Buller, Kilman and Otis and Ms. Roepke are members of the Trust’s Audit Committee.
Each of the Interested Trustees and certain Officers hold comparable officer positions with certain affiliates of MFS.
The Statement of Additional Information for a Fund includes further information about the Trustees and is available without charge upon request by calling1-800-225-2606.
| | |
| Investment Adviser | | Custodian |
Massachusetts Financial Services Company
111 Huntington Avenue Boston, MA 02199-7618 | | JPMorgan Chase Bank, NA 4 Metrotech Center New York, NY 11245 |
| Distributor | | Independent Registered Public Accounting Firm |
MFS Fund Distributors, Inc.
111 Huntington Avenue Boston, MA 02199-7618 | | Deloitte & Touche LLP 200 Berkeley Street Boston, MA 02116 |
| Portfolio Manager(s) | | |
Philipp Burgener Alexander Mackey | | |
62
STATEMENT REGARDING LIQUIDITY RISK MANAGEMENT PROGRAM
The fund has adopted and implemented a liquidity risk management program (the “Program”) as required by Rule22e-4 under the Investment Company Act of 1940, as amended. The fund’s Board of Trustees (the “Board”) has designated MFS as the administrator of the Program. The Program is reasonably designed to assess and manage the liquidity risk of the fund. Liquidity risk is the risk that the fund could not meet requests to redeem shares issued by the fund without significant dilution of remaining investors’ interests.
MFS provided a written report to the Board for consideration at its April 2020 meeting that addressed the operation of the Program and provided an assessment of the adequacy and effectiveness of the Program during the period from the adoption of the Program on December 1, 2018 to December 31, 2019 (the “Covered Period”). The report concluded that during the Covered Period the Program had operated effectively and had adequately and effectively been implemented to assess and manage the fund’s liquidity risk. MFS also reported that there were no liquidity events that impacted the fund or its ability to timely meet redemptions without dilution to existing shareholders during the Covered Period.
There can be no assurance that the Program will achieve its objectives in the future. Further information on liquidity risk, and other principal risks to which an investment in the fund may be subject, can be found in the prospectus.
63
PROXY VOTING POLICIES AND INFORMATION
MFS votes proxies on behalf of the fund pursuant to proxy voting policies and procedures that are available without charge, upon request, by calling1-800-225-2606, by visitingmfs.com/proxyvoting,or by visiting the SEC’s Web site athttp://www.sec.gov.
Information regarding how the fund voted proxies relating to portfolio securities during the most recent twelve-month period ended June 30 is available by August 31 of each year without charge by visitingmfs.com/proxyvoting,or by visiting the SEC’s Web site athttp://www.sec.gov.
QUARTERLY PORTFOLIO DISCLOSURE
The fund files a complete schedule of portfolio holdings with the SEC for the first and third quarters of each fiscal year as an exhibit to its reports on Form N-PORT. The fund’s Form N-PORT reports are available on the SEC’s website athttp://www.sec.gov. A shareholder can obtain the portfolio holdings report for the first and third quarters of the fund’s fiscal year atmfs.com/openendfunds by choosing the fund’s name and then selecting the “Resources” tab and clicking on “Prospectus and Reports”.
FURTHER INFORMATION
From time to time, MFS may post important information about the fund or the MFS funds on the MFS web site (mfs.com). This information is available athttps://www.mfs.com/en-us/what-we-do/announcements.htmlor atmfs.com/openendfundsby choosing the fund’s name.
INFORMATION ABOUT FUND CONTRACTS AND LEGAL CLAIMS
The fund has entered into contractual arrangements with an investment adviser, administrator, distributor, shareholder servicing agent, 529 program manager (if applicable), and custodian who each provide services to the fund. Unless expressly stated otherwise, shareholders are not parties to, or intended beneficiaries of these contractual arrangements, and these contractual arrangements are not intended to create any shareholder right to enforce them against the service providers or to seek any remedy under them against the service providers, either directly or on behalf of the fund.
Under the Trust’s By-Laws and Declaration of Trust, any claims asserted against or on behalf of the MFS Funds, including claims against Trustees and Officers, must be brought in state and federal courts located within the Commonwealth of Massachusetts.
FEDERAL TAX INFORMATION (unaudited)
The fund will notify shareholders of amounts for use in preparing 2020 income tax forms in January 2021.
64
rev. 3/16
| | | | |
| | | |
FACTS | | WHAT DOES MFS DO WITH YOUR PERSONAL INFORMATION? | |  |
| | |
| Why? | | Financial companies choose how they share your personal information. Federal law gives consumers the right to limit some but not all sharing. Federal law also requires us to tell you how we collect, share, and protect your personal information. Please read this notice carefully to understand what we do. |
| | |
| What? | | The types of personal information we collect and share depend on the product or service you have with us. This information can include: • Social Security number and account balances • Account transactions and transaction history • Checking account information and wire transfer instructions When you areno longer our customer, we continue to share your information as described in this notice. |
| | |
| How? | | All financial companies need to share customers’ personal information to run their everyday business. In the section below, we list the reasons financial companies can share their customers’ personal information; the reasons MFS chooses to share; and whether you can limit this sharing. |
| | | | |
Reasons we can share your
personal information | | Does MFS
share? | | Can you limit
this sharing? |
For our everyday business purposes – such as to process your transactions, maintain your account(s), respond to court orders and legal investigations, or report to credit bureaus | | Yes | | No |
For our marketing purposes – to offer our products and services to you | | No | | We don’t share |
For joint marketing with other financial companies | | No | | We don’t share |
For our affiliates’ everyday business purposes – information about your transactions and experiences | | No | | We don’t share |
For our affiliates’ everyday business purposes – information about your creditworthiness | | No | | We don’t share |
| For nonaffiliates to market to you | | No | | We don’t share |
| | |
| | |
| Questions? | | Call800-225-2606 or go tomfs.com. |
65
| | |
| Who we are |
| Who is providing this notice? | | MFS Funds, MFS Investment Management, MFS Institutional Advisors, Inc., and MFS Heritage Trust Company. |
| | |
| What we do |
| How does MFS protect my personal information? | | To protect your personal information from unauthorized access and use, we use security measures that comply with federal law. These measures include procedural, electronic, and physical safeguards for the protection of the personal information we collect about you. |
| How does MFS collect my personal information? | | We collect your personal information, for example, when you • open an account or provide account information • direct us to buy securities or direct us to sell your securities • make a wire transfer We also collect your personal information from others, such as credit bureaus, affiliates, or other companies. |
| Why can’t I limit all sharing? | | Federal law gives you the right to limit only • sharing for affiliates’ everyday business purposes – information about your creditworthiness • affiliates from using your information to market to you • sharing for nonaffiliates to market to you State laws and individual companies may give you additional rights to limit sharing. |
| | |
| Definitions |
| Affiliates | | Companies related by common ownership or control. They can be financial and nonfinancial companies. • MFS does not share personal information with affiliates, except for everyday business purposes as described on page one of this notice. |
| Nonaffiliates | | Companies not related by common ownership or control. They can be financial and nonfinancial companies. • MFS does not share with nonaffiliates so they can market to you. |
| Joint marketing | | A formal agreement between nonaffiliated financial companies that together market financial products or services to you. • MFS doesn’t jointly market. |
| | |
| Other important information |
| If you own an MFS product or receive an MFS service in the name of a third party such as a bank or broker-dealer, their privacy policy may apply to you instead of ours. |
66
Save paper with eDelivery.

| MFS® will send you prospectuses, |
reports, and proxies directly viae-mail so you will get information faster with less mailbox clutter.
To sign up:
1. Go to mfs.com.
2. Log in via MFS® Access.
3. Select eDelivery.
If you own your MFS fund shares through a financial institution or a retirement plan, MFS® TALK, MFS® Access, or eDelivery may not be available to you.
CONTACT
WEB SITE
mfs.com
MFS TALK
1-800-637-8255
24 hours a day
ACCOUNT SERVICE AND LITERATURE
Shareholders
1-800-225-2606
Financial advisors
1-800-343-2829
Retirement plan services
1-800-637-1255
MAILING ADDRESS
MFS Service Center, Inc.
P.O. Box 219341
Kansas City, MO 64121-9341
OVERNIGHT MAIL
MFS Service Center, Inc.
Suite 219341
430 W 7th Street
Kansas City, MO 64105-1407
Annual Report
April 30, 2020

MFS® Municipal Limited
Maturity Fund

Beginning on January 1, 2021, as permitted by regulations adopted by the U.S. Securities and Exchange Commission, paper copies of the fund’s annual and semiannual shareholder reports will no longer be sent by mail, unless you specifically request paper copies of the reports. Instead, the complete reports will be made available on the fund’s Web site (funds.mfs.com), and you will be notified by mail each time a report is posted and provided with a Web site link to access the report.
If you are already signed up to receive shareholder reports by email, you will not be affected by this change and you need not take any action. You may sign up to receive shareholder reports and other communications from the fund by email by contacting your financial intermediary (such as a broker-dealer or bank) or, if you hold your shares directly with the fund, by calling 1-800-225-2606 or by logging on to MFS Access at mfs.com.
Beginning on January 1, 2019, you may elect to receive all future reports in paper free of charge. Contact your financial intermediary to request that you continue to receive paper copies of your shareholder reports. If you invest directly with the fund, you can call 1-800-225-2606 or send an email request to orderliterature@mfs.com to let the fund know that you wish to continue receiving paper copies of your shareholder reports. Your election to receive reports in paper will apply to all funds held in your account if you invest through your financial intermediary or all funds held with the MFS fund complex if you invest directly.
MTL-ANN
MFS® Municipal Limited Maturity Fund
CONTENTS
The report is prepared for the general information of shareholders. It is authorized for distribution to prospective investors only when preceded or accompanied by a current prospectus.
NOT FDIC INSURED• MAY LOSE VALUE• NO BANK GUARANTEE

LETTER FROM THE EXECUTIVE CHAIR
Dear Shareholders:
Markets experienced dramatic swings in early 2020 as the coronavirus pandemic crippled the global economy for a time. Optimism over the development of vaccines
and therapeutics, along with a decline in cases in countries hit early in the outbreak, has brightened the economic and market outlook during the second quarter, though a great deal of uncertainty remains on how long the aftereffects of the lockdowns will linger.
Global central banks have taken aggressive, coordinated steps to cushion the economic and market fallout related to the virus, and governments are undertaking unprecedented levels of fiscal stimulus. As uncertainty recedes, these measures can help build a supportive environment and encourage economic recovery. In the aftermath of the crisis, there are likely to be societal changes as
households, businesses, and governments adjust to a new reality, and these alterations could change the investment landscape. For investors, occurrences such as theCOVID-19 outbreak demonstrate the importance of having a deep understanding of company fundamentals, and our global research platform has been built to do just that.
Here at MFS®, we aim to help our clients navigate the growing complexity of the markets and world economies. Our long-term investment philosophy and commitment to the responsible allocation of capital allow us to tune out the noise and uncover what we believe are the best, most durable investment opportunities in the market. Through our powerful global investment platform, we combine collective expertise, thoughtful risk management, and long-term discipline to create sustainable value for investors.
Respectfully,

Robert J. Manning
Executive Chair
MFS Investment Management
June 16, 2020
The opinions expressed in this letter are subject to change and may not be relied upon for investment advice. No forecasts can be guaranteed.
1
PORTFOLIO COMPOSITION
Portfolio structure (i)
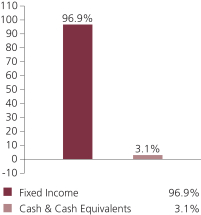
| | | | |
| Top ten industries (i) | | | | |
| General Obligations – General Purpose | | | 14.0% | |
| Healthcare Revenue – Hospitals | | | 11.7% | |
| General Obligations – Schools | | | 9.2% | |
| Utilities – Other | | | 6.0% | |
| Investor Owned Utilities | | | 5.1% | |
| Airports | | | 4.8% | |
| Special Tax – Transportation | | | 4.8% | |
| Municipal Student Loans | | | 4.5% | |
| State & Local Agencies | | | 4.3% | |
| Universities – Colleges | | | 3.6% | |
| | | | |
| Composition including fixed income credit quality (a)(i) | |
| AAA | | | 5.7% | |
| AA | | | 22.9% | |
| A | | | 40.0% | |
| BBB | | | 18.1% | |
| BB | | | 5.3% | |
| B | | | 0.1% | |
| CC | | | 0.1% | |
| C | | | 0.8% | |
| D | | | 1.2% | |
| Not Rated | | | 2.7% | |
| Cash & Cash Equivalents | | | 3.1% | |
| |
| Portfolio facts (i) | | | | |
| Average Duration (d) | | | 3.6 | |
| Average Effective Maturity (m) | | | 4.6 yrs. | |
| (a) | For all securities other than those specifically described below, ratings are assigned to underlying securities utilizing ratings from Moody’s, Fitch, and Standard & Poor’s rating agencies and applying the following hierarchy: If all three agencies provide a rating, the middle rating (after dropping the highest and lowest ratings) is assigned; if two of the three agencies rate a security, the lower of the two is assigned. Ratings are shown in the S&P and Fitch scale (e.g., AAA). Securities rated BBB or higher are considered investment grade. All ratings are subject to change. Not Rated includes fixed income securities and fixed income derivatives, which have not been rated by any rating agency. The fund may or may not have held all of these instruments on this date. The fund is not rated by these agencies. |
| (d) | Duration is a measure of how much a bond’s price is likely to fluctuate with general changes in interest rates, e.g., if rates rise 1.00%, a bond with a5-year duration is likely to lose about 5.00% of its value due to the interest rate move. |
2
Portfolio Composition – continued
| (i) | For purposes of this presentation, the components include the value of securities, and reflect the impact of the equivalent exposure of derivative positions, if any. These amounts may be negative from time to time. Equivalent exposure is a calculated amount that translates the derivative position into a reasonable approximation of the amount of the underlying asset that the portfolio would have to hold at a given point in time to have the same price sensitivity that results from the portfolio’s ownership of the derivative contract. When dealing with derivatives, equivalent exposure is a more representative measure of the potential impact of a position on portfolio performance than value. The bond component will include any accrued interest amounts. |
| (m) | In determining each instrument’s effective maturity for purposes of calculating the fund’s dollar-weighted average effective maturity, MFS uses the instrument’s stated maturity or, if applicable, an earlier date on which MFS believes it is probable that a maturity-shortening device (such as a put,pre-refunding or prepayment) will cause the instrument to be repaid. Such an earlier date can be substantially shorter than the instrument’s stated maturity. |
Cash & Cash Equivalents includes any cash, investments in money market funds, short-term securities, and other assets less liabilities. Please see the Statement of Assets and Liabilities for additional information related to the fund’s cash position and other assets and liabilities.
Percentages are based on net assets as of April 30, 2020.
The portfolio is actively managed and current holdings may be different.
3
MANAGEMENT REVIEW
Summary of Results
For the twelve months ended April 30, 2020, Class A shares of the MFS Municipal Limited Maturity Fund (fund) provided a total return of 0.78%, at net asset value. This compares with a return of 2.17% for the fund’s benchmark, the Bloomberg Barclays1-9 Year Municipal Bond Index.
Market Environment
Market volatility soared at the end of the period as COVID-19, the illness caused by the novel coronavirus first detected in China, spread around the world in early 2020. Government-imposed social distancing measures taken to slow the spread of the virus forced the shutdown of large portions of the global economy. In an attempt to limit the economic fallout of the crisis, central bankers and policymakers have taken a variety of actions unprecedented in both size and speed, but despite their best efforts, a global recession has begun. Given the unique circumstances surrounding the genesis of the downturn, it is difficult to forecast how long the crisis will linger.
High levels of investor uncertainty saw equity prices plunge, market volatility rise and large segments of global fixed income markets freeze as investors sought liquidity wherever they could find it. As the global economy rapidly slowed, a disagreement between Saudi Arabia and Russia over OPEC+ production cuts resulted in the Saudis shelving the OPEC+ arrangement and increasing oil output at the same time that global oil demand was plummeting, which compounded market turmoil. The resulting drop in prices undercut oil exporters, many of which are in emerging markets, as well as a large segment of the high-yield credit market.
Central banks around the world responded quickly and massively to the crisis with programs to improve liquidity and support markets. They proved largely successful in helping to restore market function, easing volatility and stimulating a market rebound at the end of the period. Monetary easing measures were complimented by large fiscal stimulus plans in developed countries. Even emerging market countries were able to implement counter-cyclical policies, a departure from the usual market-dictated response to risk-off crises, due to relatively manageable external liabilities and balance of payments in many countries and persistently low inflation.
As is often the case in a serious crisis, market vulnerabilities have been revealed. For example, companies that have added significant leverage to their balance sheets in recent years by borrowing to fund dividend payments and stock buybacks may find it difficult to follow that path in the future, and investors may not reward them if they do. Recapitalizations by some of these highly leveraged firms could dilute existing shareholders. Very long supply chains designed to squeeze out every bit of savings may be shifted closer to home markets if companies seek to emphasize resiliency over cost after a series of supply disruptions. The aftereffects of the global pandemic could impact consumer, business and government behavior in ways it will be difficult to forecast.
Over the past year, municipal bonds delivered mixed results, with higher-quality tiers outperforming lower-quality ones. Sectors with issuers providing essential services, such as utilities, performed well as transportation-related and hospitals, among other
4
Management Review – continued
sectors, lagged. The favorable fundamental and technical backdrop that had driven strong asset class returns for most of the period changed abruptly in March, impacted by the economic slowdown associated with limiting the pandemic. The revenues of municipalities were, and continue to be, impacted by declining tax receipts and higher expenses related to virus containment efforts. The slowdown will affect the fundamentals of many sectors. Federal assistance will help alleviate some of the challenges, although the selection of sectors and issuers will likely increase in importance over the coming months. Near-term uncertainty remains high, but with valuations at relatively wide levels, the asset class’s long-term outlook is favorable.
Factors Affecting Performance
During the reporting period, the fund’s asset allocation decisions weakened performance relative to the Bloomberg Barclays1-9 Year Municipal Bond Index. From a quality perspective, an overweight allocation to “BBB” rated (r) bonds, holdings ofnon-rated issuers and an underweight allocation to “AAA” rated securities weighed on relative returns. From a sector perspective, the fund’s greater allocation toindustrial revenue bonds hindered relative results. Security selection was another factor that detracted from relative performance, notably in theeducation,healthcare andspecial tax sectors.
Conversely, the fund’s longer duration (d) stance supported relative performance as interest rates generally declined over the reporting period.
Respectfully,
Portfolio Manager(s)
Jason Kosty and Geoffrey Schechter
| (d) | Duration is a measure of how much a bond’s price is likely to fluctuate with general changes in interest rates, e.g., if rates rise 1.00%, a bond with a5-year duration is likely to lose about 5.00% of its value. |
| (r) | Bonds rated “BBB”, “Baa”, or higher are considered investment grade; bonds rated “BB”, “Ba”, or below are considerednon-investment grade. The sources for bond quality ratings are Moody’s Investors Service, Standard & Poor’s and Fitch, Inc. and are applied using the following hierarchy: If all three agencies provide a rating, the middle rating (after dropping the highest and lowest ratings) is assigned; if two of the three agencies rate a security, the lower of the two is assigned. Ratings are shown in the S&P and Fitch scale (e.g., AAA). For securities which are not rated by any of the three agencies, the security is considered Not Rated. |
The views expressed in this report are those of the portfolio manager(s) only through the end of the period of the report as stated on the cover and do not necessarily reflect the views of MFS or any other person in the MFS organization. These views are subject to change at any time based on market or other conditions, and MFS disclaims any responsibility to update such views. These views may not be relied upon as investment advice or an indication of trading intent on behalf of any MFS portfolio. References to specific securities are not recommendations of such securities, and may not be representative of any MFS portfolio’s current or future investments.
5
PERFORMANCE SUMMARYTHROUGH 4/30/20
The following chart illustrates a representative class of the fund’s historical performance in comparison to its benchmark(s). Performance results include the deduction of the maximum applicable sales charge and reflect the percentage change in net asset value, including reinvestment of dividends and capital gains distributions. The performance of other share classes will be greater than or less than that of the class depicted below. Benchmarks are unmanaged and may not be invested in directly. Benchmark returns do not reflect sales charges, commissions or expenses. (See Notes to Performance Summary.)
Performance data shown represents past performance and is no guarantee of future results. Investment return and principal value fluctuate so your shares, when sold, may be worth more or less than the original cost; current performance may be lower or higher than quoted. The performance shown does not reflect the deduction of taxes, if any, that a shareholder would pay on fund distributions or the redemption of fund shares.
Growth of a Hypothetical $10,000 Investment
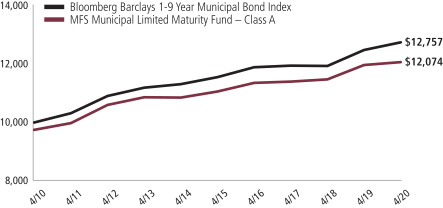
6
Performance Summary – continued
Total Returns through 4/30/20
Average annual without sales charge
| | | | | | | | | | | | | | |
| | | Share Class | | Class Inception Date | | 1-yr | | 5-yr | | 10-yr | | Life (t) | | |
| | | A | | 3/17/92 | | 0.78% | | 1.76% | | 2.16% | | N/A | | |
| | | B | | 9/07/93 | | 0.03% | | 1.00% | | 1.40% | | N/A | | |
| | | C | | 7/01/94 | | (0.07)% | | 0.90% | | 1.30% | | N/A | | |
| | | I | | 8/30/10 | | 0.92% | | 1.91% | | N/A | | 2.08% | | |
| | | R6 | | 9/01/17 | | 1.00% | | N/A | | N/A | | 1.68% | | |
| | | | | |
| Comparative benchmark(s) | | | | | | | | | | |
| | | Bloomberg Barclays1-9 Year Municipal Bond Index (f) | | 2.17% | | 1.99% | | 2.46% | | N/A | | |
| | | | | |
| Average annual with sales charge | | | | | | | | | | |
| | | A
With Initial Sales Charge (2.50%) | | (1.74)% | | 1.24% | | 1.90% | | N/A | | |
| | | B
With CDSC (Declining over six years from 4% to 0%) (v) | | (3.92)% | | 0.62% | | 1.40% | | N/A | | |
| | | C
With CDSC (1% for 12 months) (v) | | (1.06)% | | 0.90% | | 1.30% | | N/A | | |
CDSC – Contingent Deferred Sales Charge.
Class I and R6 shares do not have a sales charge.
| (f) | Source: FactSet Research Systems Inc. |
| (t) | For the period from the class inception date through the stated period end (for those share classes with less than 10 years of performance history). No comparative benchmark performance information is provided for “life” periods. (See Notes to Performance Summary.) |
| (v) | Assuming redemption at the end of the applicable period. |
Benchmark Definition(s)
Bloomberg Barclays 1-9 Year Municipal Bond Index – a market capitalization-weighted index that measures the performance of the medium-term (1 to 9 years) tax-exempt bond market. BLOOMBERG® is a trademark and service mark of Bloomberg Finance L.P. and its affiliates (collectively “Bloomberg”). BARCLAYS® is a trademark and service mark of Barclays Bank Plc (collectively with its affiliates, “Barclays”), used under license. Bloomberg or Bloomberg’s licensors, including Barclays, own all proprietary rights in the Bloomberg Barclays Indices. Neither Bloomberg nor Barclays approves or endorses this material, or guarantees the accuracy or completeness of any information herein, or makes any warranty, express or implied, as to the results to be obtained therefrom, and, to the maximum extent allowed by law, neither shall have any liability or responsibility for injury or damages arising in connection therewith.
It is not possible to invest directly in an index.
Notes to Performance Summary
Average annual total return represents the average annual change in value for each share class for the periods presented. Life returns are presented where the share class has less than 10 years of performance history and represent the average annual total
7
Performance Summary – continued
return from the class inception date to the stated period end date. As the fund’s share classes may have different inception dates, the life returns may represent different time periods and may not be comparable. As a result, no comparative benchmark performance information is provided for life periods.
Performance results reflect any applicable expense subsidies and waivers in effect during the periods shown. Without such subsidies and waivers the fund’s performance results would be less favorable. Please see the prospectus and financial statements for complete details.
Performance results do not include adjustments made for financial reporting purposes in accordance with U.S. generally accepted accounting principles and may differ from amounts reported in the financial highlights.
A portion of income may be subject to state, federal, and/or alternative minimum tax. Capital gains, if any, are subject to a capital gains tax.
From time to time the fund may receive proceeds from litigation settlements, without which performance would be lower.
8
EXPENSE TABLE
Fund expenses borne by the shareholders during the period, November 1, 2019 through April 30, 2020
As a shareholder of the fund, you incur two types of costs: (1) transaction costs, including sales charges (loads) on certain purchase or redemption payments, and (2) ongoing costs, including management fees; distribution and service(12b-1) fees; and other fund expenses. This example is intended to help you understand your ongoing costs (in dollars) of investing in the fund and to compare these costs with the ongoing costs of investing in other mutual funds.
The example is based on an investment of $1,000 invested at the beginning of the period and held for the entire period November 1, 2019 through April 30, 2020.
Actual Expenses
The first line for each share class in the following table provides information about actual account values and actual expenses. You may use the information in this line, together with the amount you invested, to estimate the expenses that you paid over the period. Simply divide your account value by $1,000 (for example, an $8,600 account value divided by $1,000 = 8.6), then multiply the result by the number in the first line under the heading entitled “Expenses Paid During Period” to estimate the expenses you paid on your account during this period.
Hypothetical Example for Comparison Purposes
The second line for each share class in the following table provides information about hypothetical account values and hypothetical expenses based on the fund’s actual expense ratio and an assumed rate of return of 5% per year before expenses, which is not the fund’s actual return. The hypothetical account values and expenses may not be used to estimate the actual ending account balance or expenses you paid for the period. You may use this information to compare the ongoing costs of investing in the fund and other funds. To do so, compare this 5% hypothetical example with the 5% hypothetical examples that appear in the shareholder reports of the other funds.
Please note that the expenses shown in the table are meant to highlight your ongoing costs only and do not reflect any transactional costs, such as sales charges (loads). Therefore, the second line for each share class in the table is useful in comparing ongoing costs only, and will not help you determine the relative total costs of owning different funds. In addition, if these transactional costs were included, your costs would have been higher.
9
Expense Table – continued
| | | | | | | | | | | | | | | | | | |
Share
Class | | | | Annualized
Expense Ratio | | | Beginning
Account Value
11/01/19 | | | Ending Account Value 4/30/20 | | | Expenses Paid During Period (p) 11/01/19-4/30/20 | |
| A | | Actual | | | 0.67% | | | | $1,000.00 | | | | $981.48 | | | | $3.30 | |
| | Hypothetical (h) | | | 0.67% | | | | $1,000.00 | | | | $1,021.53 | | | | $3.37 | |
| B | | Actual | | | 1.42% | | | | $1,000.00 | | | | $977.84 | | | | $6.98 | |
| | Hypothetical (h) | | | 1.42% | | | | $1,000.00 | | | | $1,017.80 | | | | $7.12 | |
| C | | Actual | | | 1.52% | | | | $1,000.00 | | | | $977.35 | | | | $7.47 | |
| | Hypothetical (h) | | | 1.52% | | | | $1,000.00 | | | | $1,017.30 | | | | $7.62 | |
| I | | Actual | | | 0.52% | | | | $1,000.00 | | | | $982.17 | | | | $2.56 | |
| | Hypothetical (h) | | | 0.52% | | | | $1,000.00 | | | | $1,022.28 | | | | $2.61 | |
| R6 | | Actual | | | 0.44% | | | | $1,000.00 | | | | $983.76 | | | | $2.17 | |
| | Hypothetical (h) | | | 0.44% | | | | $1,000.00 | | | | $1,022.68 | | | | $2.21 | |
| (h) | 5% class return per year before expenses. |
| (p) | “Expenses Paid During Period” are equal to each class’s annualized expense ratio, as shown above, multiplied by the average account value over the period, multiplied by 182/366 (to reflect theone-half year period). Expenses paid do not include any applicable sales charges (loads). If these transaction costs had been included, your costs would have been higher. |
10
PORTFOLIO OF INVESTMENTS
4/30/20
The Portfolio of Investments is a complete list of all securities owned by your fund. It is categorized by jurisdiction.
| | | | | | | | |
| | |
| Issuer | | Shares/Par | | | Value ($) | |
| Municipal Bonds - 95.5% | | | | | | |
| Alabama - 2.5% | | | | | | |
| Alabama Community College System, Board of Trustees Rev. (Wallace State Community College - Hanceville Rev.), BAM, 2%, 11/01/2020 | | $ | 405,000 | | | $ | 407,102 | |
| Alabama Community College System, Board of Trustees Rev. (Wallace State Community College - Hanceville Rev.), BAM, 3%, 11/01/2021 | | | 1,060,000 | | | | 1,089,076 | |
| Alabama Community College System, Board of Trustees Rev. (Wallace State Community College - Hanceville Rev.), BAM, 3.5%, 11/01/2026 | | | 1,245,000 | | | | 1,373,870 | |
| Alabama Community College System, Board of Trustees Rev. (Wallace State Community College - Hanceville Rev.), BAM, 3.5%, 11/01/2027 | | | 1,290,000 | | | | 1,437,782 | |
| Alabama Community College System, Board of Trustees Rev. (Wallace State Community College - Hanceville Rev.), BAM, 4%, 11/01/2028 | | | 1,330,000 | | | | 1,546,497 | |
| Alabama Community College System, Board of Trustees Rev. (Wallace State Community College - Hanceville Rev.), BAM, 4%, 11/01/2029 | | | 1,385,000 | | | | 1,618,954 | |
| Alabama Housing Finance Authority, Multi-Family Housing Rev. (Villas at Titusville II), “B”, 1.5%, 11/01/2022 (Put Date 5/01/2022) | | | 3,000,000 | | | | 3,001,920 | |
| Alabama Public School & College Authority Rev., “B”, 5%, 1/01/2023 | | | 14,390,000 | | | | 15,802,091 | |
| Auburn University, General Fee Rev., “A”, 5%, 6/01/2021 | | | 2,170,000 | | | | 2,266,153 | |
| Black Belt Energy Gas District, AL, Gas Prepay Rev., “A”, 4%, 12/01/2048 (Put Date 12/01/2023) | | | 3,750,000 | | | | 3,919,237 | |
| Black Belt Energy Gas District, AL, Gas Prepay Rev.,“A-1”, 4%, 10/01/2049 (Put Date 10/01/2026) | | | 2,555,000 | | | | 2,738,219 | |
| Black Belt Energy Gas District, AL, Gas Prepay Rev.,“B-1”, FLR, 1.56% (67% of LIBOR - 1mo. + 0.9%), 12/01/2048 (Put Date 12/01/2023) | | | 11,480,000 | | | | 10,854,914 | |
| Houston County, AL, Health Care Authority (Southeast Alabama Medical Center), “A”, 5%, 10/01/2025 | | | 1,165,000 | | | | 1,306,979 | |
| Phenix City, AL, Water & Sewer Rev., “A”, BAM, 5%, 8/15/2025 | | | 2,225,000 | | | | 2,546,735 | |
| Southeast Alabama Gas Supply District Rev. (Project No. 2), “A”, 4%, 6/01/2049 (Put Date 6/01/2024) | | | 10,000,000 | | | | 10,505,900 | |
| University of West Alabama, General Fee Rev., AGM, 4%, 1/01/2022 | | | 150,000 | | | | 156,798 | |
11
Portfolio of Investments – continued
| | | | | | | | |
| | |
| Issuer | | Shares/Par | | | Value ($) | |
| Municipal Bonds - continued | | | | | | |
| Alabama - continued | | | | | | |
| University of West Alabama, General Fee Rev., AGM, 4%, 1/01/2023 | | $ | 125,000 | | | $ | 131,055 | |
| University of West Alabama, General Fee Rev., AGM, 4%, 1/01/2024 | | | 100,000 | | | | 106,344 | |
| University of West Alabama, General Fee Rev., AGM, 4%, 1/01/2025 | | | 150,000 | | | | 161,577 | |
| University of West Alabama, General Fee Rev., AGM, 5%, 1/01/2026 | | | 180,000 | | | | 205,258 | |
| University of West Alabama, General Fee Rev., AGM, 5%, 1/01/2027 | | | 100,000 | | | | 115,967 | |
| University of West Alabama, General Fee Rev., AGM, 5%, 1/01/2028 | | | 200,000 | | | | 235,498 | |
| University of West Alabama, General Fee Rev., AGM, 5%, 1/01/2029 | | | 200,000 | | | | 238,402 | |
| University of West Alabama, General Fee Rev., AGM, 5%, 1/01/2030 | | | 425,000 | | | | 511,198 | |
| | | | | | | | |
| | | | | | | $ | 62,277,526 | |
| Alaska - 0.5% | | | | | | |
| Alaska Industrial Development & Export Authority Power Rev. (Snettisham Hydroelectric Project), 5%, 1/01/2021 | | $ | 1,400,000 | | | $ | 1,425,256 | |
| Alaska Industrial Development & Export Authority Power Rev. (Snettisham Hydroelectric Project), 5%, 1/01/2022 | | | 1,200,000 | | | | 1,252,152 | |
| Alaska Municipal Bond Bank, General Obligation, Series 3, 5%, 10/01/2023 | | | 2,305,000 | | | | 2,552,557 | |
| Alaska Municipal Bond Bank, General Obligation, Series 3, 5%, 10/01/2025 | | | 2,570,000 | | | | 2,983,128 | |
| Valdez, AK, Marine Terminal Rev. (BP Pipelines Project), “B”, 5%, 1/01/2021 | | | 4,000,000 | | | | 4,051,880 | |
| | | | | | | | |
| | | | | | | $ | 12,264,973 | |
| Arizona - 1.4% | | | | | | |
| Arizona Industrial Development Authority Senior Living Rev. (Great Lakes Senior Living Facilities LLC, First Tier), “A”, 5%, 1/01/2029 | | $ | 895,000 | | | $ | 905,606 | |
| Chandler, AZ, Industrial Development Authority Rev. (Intel Corp. Project), 2.7%, 12/01/2037 (Put Date 8/14/2023) | | | 5,150,000 | | | | 5,276,535 | |
| Chandler, AZ, Industrial Development Authority Rev. (Intel Corp. Project), 5%, 6/01/2049 (Put Date 6/03/2024) | | | 7,500,000 | | | | 8,348,925 | |
| Glendale, AZ, Industrial Development Authority, Graduate & Professional Student Loan Program Rev. (Midwestern University Foundation), “A”, 5%, 7/01/2024 | | | 1,300,000 | | | | 1,480,726 | |
12
Portfolio of Investments – continued
| | | | | | | | |
| | |
| Issuer | | Shares/Par | | | Value ($) | |
| Municipal Bonds - continued | | | | | | |
| Arizona - continued | | | | | | |
| Glendale, AZ, Industrial Development Authority, Graduate & Professional Student Loan Program Rev. (Midwestern University Foundation), “A”, 5%, 7/01/2025 | | $ | 1,400,000 | | | $ | 1,630,566 | |
| Glendale, AZ, Industrial Development Authority, Graduate & Professional Student Loan Program Rev. (Midwestern University Foundation), “A”, 5%, 7/01/2026 | | | 1,200,000 | | | | 1,426,200 | |
| Glendale, AZ, Industrial Development Authority, Graduate & Professional Student Loan Program Rev. (Midwestern University Foundation), “A”, 5%, 7/01/2027 | | | 1,120,000 | | | | 1,356,600 | |
| Glendale, AZ, Industrial Development Authority, Graduate & Professional Student Loan Program Rev. (Midwestern University Foundation), “A”, 3%, 7/01/2035 | | | 1,100,000 | | | | 1,131,009 | |
| La Paz County, AZ, Industrial Development Authority Education Facility Lease Rev. (Charter School Solutions-Harmony Public Schools Project), “A”, 5%, 2/15/2028 | | | 945,000 | | | | 1,024,049 | |
| Maricopa County, AZ, Industrial Development Authority Education Rev. (Legacy Traditional Schools Projects), “A”, 4%, 7/01/2023 | | | 125,000 | | | | 133,265 | |
| Maricopa County, AZ, Industrial Development Authority Education Rev. (Legacy Traditional Schools Projects), “A”, 4%, 7/01/2024 | | | 135,000 | | | | 145,855 | |
| Maricopa County, AZ, Industrial Development Authority Education Rev. (Legacy Traditional Schools Projects), “A”, 4%, 7/01/2025 | | | 175,000 | | | | 190,853 | |
| Maricopa County, AZ, Industrial Development Authority Education Rev. (Legacy Traditional Schools Projects), “A”, 4%, 7/01/2026 | | | 200,000 | | | | 220,056 | |
| Maricopa County, AZ, Industrial Development Authority Education Rev. (Legacy Traditional Schools Projects), “A”, 4%, 7/01/2027 | | | 200,000 | | | | 221,806 | |
| Maricopa County, AZ, Industrial Development Authority Education Rev. (Legacy Traditional Schools Projects), “A”, 4%, 7/01/2028 | | | 325,000 | | | | 361,621 | |
| Maricopa County, AZ, Industrial Development Authority Education Rev. (Legacy Traditional Schools Projects), “A”, 4%, 7/01/2029 | | | 250,000 | | | | 279,403 | |
| Phoenix, AZ, Civic Improvement Corp., Water System Rev., FGIC, 5.5%, 7/01/2021 | | | 1,260,000 | | | | 1,327,826 | |
| Phoenix, AZ, Industrial Development Authority, Arizona Student Housing Rev. (Downtown Student Housing LLC), “A”, 5%, 7/01/2023 | | | 150,000 | | | | 160,443 | |
| Phoenix, AZ, Industrial Development Authority, Arizona Student Housing Rev. (Downtown Student Housing LLC), “A”, 5%, 7/01/2024 | | | 400,000 | | | | 434,212 | |
| Phoenix, AZ, Industrial Development Authority, Arizona Student Housing Rev. (Downtown Student Housing LLC), “A”, 5%, 7/01/2026 | | | 250,000 | | | | 277,518 | |
| Phoenix, AZ, Industrial Development Authority, Arizona Student Housing Rev. (Downtown Student Housing LLC), “A”, 5%, 7/01/2027 | | | 600,000 | | | | 672,792 | |
13
Portfolio of Investments – continued
| | | | | | | | |
| | |
| Issuer | | Shares/Par | | | Value ($) | |
| Municipal Bonds - continued | | | | | | |
| Arizona - continued | | | | | | |
| Phoenix, AZ, Industrial Development Authority, Arizona Student Housing Rev. (Downtown Student Housing LLC), “A”, 5%, 7/01/2028 | | $ | 150,000 | | | $ | 169,518 | |
| Phoenix, AZ, Industrial Development Authority, Education Facility Rev. (Basis Schools Projects), “A”, 3%, 7/01/2020 | | | 250,000 | | | | 249,503 | |
| Phoenix, AZ, Industrial Development Authority, Education Facility Rev. (Basis Schools Projects), “A”, 4%, 7/01/2025 | | | 1,240,000 | | | | 1,206,669 | |
| Phoenix, AZ, Industrial Development Authority, Education Facility Rev. (Great Hearts Academies Project), “A”, 2.95%, 7/01/2026 | | | 2,790,000 | | | | 2,731,828 | |
| Phoenix, AZ, Industrial Development Authority, Education Facility Rev. (Legacy Traditional Schools Project), 3%, 7/01/2020 | | | 150,000 | | | | 149,777 | |
| Pima County, AZ, Industrial Development Authority Rev. (Tucson Electric Power Co.), “A”, 4%, 9/01/2029 | | | 1,950,000 | | | | 1,992,919 | |
| Yavapai County, AZ, Industrial Development Authority Rev. (Waste Management, Inc.),“A-2”, 2.2%, 3/01/2028 (Put Date 6/03/2024) | | | 1,200,000 | | | | 1,173,768 | |
| | | | | | | | |
| | | | | | | $ | 34,679,848 | |
| Arkansas - 0.7% | | | | | | |
| Arkansas Development Finance Authority, Hospital Rev. (Washington Regional Medical Center), “B”, 5%, 2/01/2021 | | $ | 465,000 | | | $ | 477,615 | |
| Arkansas Development Finance Authority, Hospital Rev. (Washington Regional Medical Center), “B”, 5%, 2/01/2022 | | | 380,000 | | | | 399,954 | |
| Arkansas Four-Lane Highway Construction & Improvement Rev., 5%, 6/15/2021 | | | 5,000,000 | | | | 5,229,500 | |
| Conway, AR, Health Facilities Board, Hospital Improvement Rev. (Conway Regional Medical Center), 5%, 8/01/2021 | | | 245,000 | | | | 254,332 | |
| Conway, AR, Health Facilities Board, Hospital Improvement Rev. (Conway Regional Medical Center), 5%, 8/01/2022 | | | 250,000 | | | | 266,585 | |
| Conway, AR, Health Facilities Board, Hospital Improvement Rev. (Conway Regional Medical Center), 5%, 8/01/2024 | | | 400,000 | | | | 446,820 | |
| Conway, AR, Health Facilities Board, Hospital Improvement Rev. (Conway Regional Medical Center), 5%, 8/01/2026 | | | 665,000 | | | | 767,942 | |
| Conway, AR, Health Facilities Board, Hospital Improvement Rev. (Conway Regional Medical Center), “A”, 5%, 8/01/2024 | | | 530,000 | | | | 592,037 | |
| Fayetteville, AR, Sales and Use Tax, Capital Improvement Rev., “A”, 5%, 11/01/2025 | | | 1,000,000 | | | | 1,197,440 | |
| Fayetteville, AR, Sales and Use Tax, Capital Improvement Rev., “A”, 5%, 11/01/2026 | | | 1,900,000 | | | | 2,331,889 | |
| Independence County, AR, Pollution Control Rev. (Entergy Arkansas, Inc. Project), 2.375%, 1/01/2021 | | | 3,250,000 | | | | 3,257,898 | |
| Pulaski County, AR, Public Facilities Board, Healthcare Rev. (Baptist Health), 5%, 12/01/2022 | | | 300,000 | | | | 322,644 | |
14
Portfolio of Investments – continued
| | | | | | | | |
| | |
| Issuer | | Shares/Par | | | Value ($) | |
| Municipal Bonds - continued | | | | | | |
| Arkansas - continued | | | | | | |
| Pulaski County, AR, Public Facilities Board, Healthcare Rev. (Baptist Health), 5%, 12/01/2023 | | $ | 1,665,000 | | | $ | 1,833,431 | |
| | | | | | | | |
| | | | | | | $ | 17,378,087 | |
| California - 3.6% | | | | | | |
| California Educational Facilities Authority Rev. (University of San Francisco), ETM, 5%, 10/01/2021 | | $ | 245,000 | | | $ | 258,740 | |
| California Educational Facilities Authority Rev., Unrefunded Balance (University of San Francisco), 5%, 10/01/2021 | | | 255,000 | | | | 269,300 | |
| California Health Facilities Financing Authority Rev. (St. Joseph Health System), “D”, 5%, 7/01/2043 (Put Date 10/15/2020) | | | 2,400,000 | | | | 2,441,616 | |
| California Infrastructure & Economic Development Bank Rev. (Colburn School), 1.75%, 8/01/2055 (Put Date 8/01/2026) | | | 11,375,000 | | | | 11,294,237 | |
| California Municipal Finance Authority Rev. (NorthBay Healthcare Group), “A”, 5%, 11/01/2025 | | | 1,130,000 | | | | 1,288,008 | |
| California Municipal Finance Authority Rev. (NorthBay Healthcare Group), “A”, 5%, 11/01/2026 | | | 1,000,000 | | | | 1,159,790 | |
| California Pollution Control Financing Authority, Solid Waste Disposal Rev. (Republic Services, Inc. Project),“A-1”, 1.95%, 11/01/2042 (Put Date 7/15/2020) | | | 7,040,000 | | | | 7,040,915 | |
| California Pollution Control Financing Authority, Solid Waste Disposal Rev. (Waste Management, Inc.), “A”, 2.5%, 11/01/2038 (Put Date 5/01/2024) | | | 1,365,000 | | | | 1,351,678 | |
| California Pollution Control Financing Authority, Solid Waste Disposal Rev. (Waste Management, Inc.),“A-1”, 3.375%, 7/01/2025 | | | 5,000,000 | | | | 5,132,250 | |
| California School Finance Authority, Charter School Rev. (Aspire Public Schools), 5%, 8/01/2024 | | | 350,000 | | | | 369,653 | |
| California School Finance Authority, Charter School Rev. (Aspire Public Schools), 5%, 8/01/2025 | | | 365,000 | | | | 387,564 | |
| California School Finance Authority, Charter School Rev. (Aspire Public Schools), 5%, 8/01/2026 | | | 300,000 | | | | 316,935 | |
| California School Finance Authority, School Facility Rev. (Alliance for College-Ready Public Schools Projects), “A”, 4%, 7/01/2021 | | | 750,000 | | | | 772,140 | |
| California School Finance Authority, School Facility Rev. (Alliance for College-Ready Public Schools Projects), “A”, 4%, 7/01/2022 | | | 1,120,000 | | | | 1,137,046 | |
| California School Finance Authority, School Facility Rev. (Alliance for College-Ready Public Schools Projects), “A”, 4%, 7/01/2023 | | | 1,245,000 | | | | 1,264,721 | |
| California Statewide Communities Development Authority Rev. (California Baptist University), “A”, 3%, 11/01/2022 | | | 195,000 | | | | 191,233 | |
| California Statewide Communities Development Authority Rev. (California Baptist University), “A”, 3.5%, 11/01/2027 | | | 1,335,000 | | | | 1,281,760 | |
| Elk Grove, CA, Finance Authority Special Tax Rev., 5%, 9/01/2022 | | | 450,000 | | | | 490,644 | |
15
Portfolio of Investments – continued
| | | | | | | | |
| | |
| Issuer | | Shares/Par | | | Value ($) | |
| Municipal Bonds - continued | | | | | | |
| California - continued | | | | | | |
| Golden State, CA, Tobacco Securitization Corp., Tobacco Settlement Rev., “A”, 3.5%, 6/01/2036 | | $ | 1,425,000 | | | $ | 1,402,385 | |
| Jurupa, CA, Public Financing Authority, Special Tax Rev., “A”, 5%, 9/01/2020 | | | 550,000 | | | | 557,205 | |
| La Verne, CA, Brethren Hillcrest Homes, COP, 5%, 5/15/2021 | | | 310,000 | | | | 312,347 | |
| Long Beach, CA, Bond Finance Authority, Natural Gas Purchase Rev., “A”, 5.25%, 11/15/2020 | | | 930,000 | | | | 946,015 | |
| Los Angeles County, CA, Redevelopment Refunding Authority Tax Allocation Rev., “D”, AGM, 5%, 9/01/2022 | | | 1,865,000 | | | | 2,024,439 | |
| Los Angeles County, CA, Redevelopment Refunding Authority Tax Allocation Rev., “D”, AGM, 5%, 9/01/2023 | | | 1,865,000 | | | | 2,086,543 | |
| Los Angeles County, CA, Sanitation Districts Financing Authority Rev. (Capital Projects), “A”, 5%, 10/01/2020 | | | 5,000,000 | | | | 5,087,500 | |
| Los Angeles, CA, Department of Airports Rev. (Los Angeles International), “B”, 5%, 5/15/2026 | | | 1,350,000 | | | | 1,563,975 | |
| Oxnard, CA, Financing Authority, Wastewater Rev., AGM, 5%, 6/01/2021 | | | 750,000 | | | | 783,233 | |
| Sacramento, CA, Municipal Utility District, “X”, 5%, 8/15/2020 | | | 1,750,000 | | | | 1,771,087 | |
| San Bernardino, CA, City Unified School District, “A”, AGM, 5%, 8/01/2020 | | | 750,000 | | | | 757,763 | |
| San Bernardino, CA, City Unified School District, “A”, AGM, 5%, 8/01/2021 | | | 1,200,000 | | | | 1,258,764 | |
| San Bernardino, CA, City Unified School District, “A”, AGM, 5%, 8/01/2023 | | | 1,100,000 | | | | 1,227,644 | |
| San Diego County, CA, Regional Airport Authority Rev., “B”, 5%, 7/01/2020 | | | 500,000 | | | | 503,065 | |
| San Diego, CA, Association of Governments Capital Grant Receipts Rev.(Mid-Coast Corridor Transit Project), 1.8%, 11/15/2027 | | | 3,535,000 | | | | 3,550,024 | |
| San Francisco, CA, City & County Airports Commission, International Airport Rev. (SFO Fuel Company LLC), “A”, 5%, 1/01/2027 | | | 2,205,000 | | | | 2,577,755 | |
| San Francisco, CA, City & County Airports Commission, International Airport Rev., Unrefunded Balance, “D”, 5%, 5/01/2025 | | | 715,000 | | | | 739,896 | |
| San Pablo, CA, Redevelopment Agency Rev., “A”, 5%, 6/15/2020 | | | 1,000,000 | | | | 1,004,530 | |
| San Ramon CA, Public Financing Authority, Capital Appreciation, “A”, AAC, 0%, 2/01/2026 | | | 1,690,000 | | | | 1,502,156 | |
| Santa Cruz County, CA, Redevelopment Successor Agency Tax Allocation, 5%, 9/01/2020 | | | 985,000 | | | | 998,711 | |
| Santa Cruz County, CA, Redevelopment Successor Agency Tax Allocation, 5%, 9/01/2021 | | | 1,350,000 | | | | 1,423,643 | |
| State of California, 5%, 8/01/2026 | | | 3,490,000 | | | | 4,207,998 | |
16
Portfolio of Investments – continued
| | | | | | | | |
| | |
| Issuer | | Shares/Par | | | Value ($) | |
| Municipal Bonds - continued | | | | | | |
| California - continued | | | | | | |
| State of California, 5%, 8/01/2027 | | $ | 5,750,000 | | | $ | 6,670,517 | |
| State of California, “B”, FLR, 1.455% (70% of LIBOR - 1mo. + 0.76%), 12/01/2031 (Put Date 12/01/2021) | | | 5,000,000 | | | | 4,960,750 | |
| State of California, Various Purpose General Obligation Refunding, 5%, 4/01/2031 | | | 3,500,000 | | | | 4,383,995 | |
| Sweetwater, CA, Union High School District, 5%, 8/01/2031 | | | 1,665,000 | | | | 1,922,625 | |
| | | | | | | | |
| | | | | | | $ | 90,672,795 | |
| Colorado - 1.3% | | | | | | |
| Arvada, CO, Vauxmont Metropolitan District Rev., AGM, 5%, 12/01/2021 (w) | | $ | 150,000 | | | $ | 155,928 | |
| Arvada, CO, Vauxmont Metropolitan District Rev., AGM, 5%, 12/15/2021 | | | 100,000 | | | | 105,514 | |
| Arvada, CO, Vauxmont Metropolitan District Rev., AGM, 5%, 12/01/2022 (w) | | | 165,000 | | | | 176,088 | |
| Arvada, CO, Vauxmont Metropolitan District Rev., AGM, 5%, 12/15/2022 | | | 100,000 | | | | 108,406 | |
| Arvada, CO, Vauxmont Metropolitan District Rev., AGM, 5%, 12/01/2023 (w) | | | 195,000 | | | | 213,295 | |
| Arvada, CO, Vauxmont Metropolitan District Rev., AGM, 5%,��12/15/2023 | | | 120,000 | | | | 133,295 | |
| Arvada, CO, Vauxmont Metropolitan District Rev., AGM, 5%, 12/01/2024 (w) | | | 400,000 | | | | 447,572 | |
| Arvada, CO, Vauxmont Metropolitan District Rev., AGM, 5%, 12/15/2024 | | | 135,000 | | | | 153,225 | |
| Arvada, CO, Vauxmont Metropolitan District Rev., AGM, 5%, 12/01/2025 (w) | | | 175,000 | | | | 199,411 | |
| Arvada, CO, Vauxmont Metropolitan District Rev., AGM, 5%, 12/15/2025 | | | 125,000 | | | | 144,535 | |
| Arvada, CO, Vauxmont Metropolitan District Rev., AGM, 5%, 12/01/2026 (w) | | | 195,000 | | | | 226,366 | |
| Arvada, CO, Vauxmont Metropolitan District Rev., AGM, 5%, 12/15/2026 | | | 135,000 | | | | 155,845 | |
| Arvada, CO, Vauxmont Metropolitan District Rev., AGM, 5%, 12/01/2027 (w) | | | 200,000 | | | | 235,418 | |
| Colorado Educational & Cultural Facilities Authority Rev. (Classical Academy Project), “A”, 5%, 12/01/2029 | | | 1,040,000 | | | | 1,153,526 | |
| Colorado Educational & Cultural Facilities Authority Rev. (Colorado Springs Charter Academy Project), 5.25%, 7/01/2028 | | | 1,855,000 | | | | 1,862,865 | |
| Colorado Educational & Cultural Facilities Authority Rev. (Montessori Charter School Project), 3.25%, 7/15/2022 | | | 760,000 | | | | 768,854 | |
| Colorado Educational & Cultural Facilities Authority Rev. (Pinnacle Charter School Building Corp.), 5%, 6/01/2029 | | | 630,000 | | | | 671,063 | |
17
Portfolio of Investments – continued
| | | | | | | | |
| | |
| Issuer | | Shares/Par | | | Value ($) | |
| Municipal Bonds - continued | | | | | | |
| Colorado - continued | | | | | | |
| Colorado Educational & Cultural Facilities Authority Rev. (Pinnacle Charter School, Inc.K-8 Facility Project), 4%, 6/01/2020 | | $ | 310,000 | | | $ | 310,614 | |
| Colorado Educational & Cultural Facilities Authority Rev. (Pinnacle Charter School, Inc.K-8 Facility Project), 4%, 6/01/2022 | | | 545,000 | | | | 566,195 | |
| Colorado Educational & Cultural Facilities Authority Rev. (Union Colony School Project), 4%, 4/01/2023 | | | 100,000 | | | | 103,089 | |
| Colorado Health Facilities Authority Rev. (CommonSpirit Health),“A-1”, 5%, 8/01/2026 | | | 1,500,000 | | | | 1,732,200 | |
| Colorado Health Facilities Authority Rev. (CommonSpirit Health),“A-1”, 5%, 8/01/2027 | | | 2,000,000 | | | | 2,333,380 | |
| Colorado Health Facilities Authority Rev. (CommonSpirit Health),“A-2”, 5%, 8/01/2026 | | | 2,160,000 | | | | 2,494,368 | |
| Colorado Health Facilities Authority Rev. (Covenant Retirement Communities, Inc.), “A”, 5%, 12/01/2021 | | | 1,160,000 | | | | 1,181,054 | |
| Colorado Health Facilities Authority Rev. (Covenant Retirement Communities, Inc.), “A”, 5%, 12/01/2022 | | | 1,750,000 | | | | 1,796,673 | |
| Colorado Health Facilities Authority Rev., Improvement Bonds (Valley View Hospital Association Project), 2.8%, 5/15/2042 (Put Date 5/15/2023) | | | 4,675,000 | | | | 4,810,668 | |
| Denver, CO, Convention Center Hotel Authority Rev., 5%, 12/01/2024 | | | 1,500,000 | | | | 1,541,235 | |
| Denver, CO, Convention Center Hotel Authority Rev., 5%, 12/01/2025 | | | 2,000,000 | | | | 2,054,500 | |
| Park Creek Metropolitan District, CO, Senior Limited Property Tax Supported Rev., “A”, 5%, 12/01/2021 | | | 1,640,000 | | | | 1,734,284 | |
| Park Creek Metropolitan District, CO, Senior Limited Property Tax Supported Rev., “A”, 5%, 12/01/2023 | | | 1,000,000 | | | | 1,121,360 | |
| Park Creek Metropolitan District, CO, Senior Limited Property Tax Supported Rev., “A”, NATL, 5%, 12/01/2025 | | | 500,000 | | | | 591,135 | |
| Park Creek Metropolitan District, CO, Senior Limited Property Tax Supported Rev., “A”, NATL, 5%, 12/01/2026 | | | 1,300,000 | | | | 1,567,839 | |
| Park Creek Metropolitan District, CO, Senior Limited Property Tax Supported Rev., “A”, NATL, 5%, 12/01/2027 | | | 1,270,000 | | | | 1,521,168 | |
| | | | | | | | |
| | | | | | | $ | 32,370,968 | |
| Connecticut - 1.9% | | | | | | |
| Connecticut Health & Educational Facilities Authority Rev. (Connecticut State University), “N”, 5%, 11/01/2024 | | $ | 1,930,000 | | | $ | 2,175,438 | |
| Connecticut Health & Educational Facilities Authority Rev. (Masonicare), “F”, 5%, 7/01/2023 | | | 2,800,000 | | | | 2,793,308 | |
| Connecticut Health & Educational Facilities Authority Rev. (Masonicare), “F”, 5%, 7/01/2024 | | | 1,840,000 | | | | 1,832,143 | |
| Connecticut Health & Educational Facilities Authority Rev. (University of Hartford), “N”, 5%, 7/01/2021 | | | 100,000 | | | | 104,179 | |
18
Portfolio of Investments – continued
| | | | | | | | |
| | |
| Issuer | | Shares/Par | | | Value ($) | |
| Municipal Bonds - continued | | | | | | |
| Connecticut - continued | | | | | | |
| Connecticut Health & Educational Facilities Authority Rev. (University of Hartford), “N”, 5%, 7/01/2022 | | $ | 380,000 | | | $ | 391,636 | |
| Connecticut Health & Educational Facilities Authority Rev. (University of Hartford), “N”, 5%, 7/01/2023 | | | 415,000 | | | | 431,364 | |
| Connecticut Health & Educational Facilities Authority Rev. (University of Hartford), “N”, 5%, 7/01/2024 | | | 375,000 | | | | 392,205 | |
| Connecticut Health & Educational Facilities Authority Rev. (University of Hartford), “N”, 5%, 7/01/2025 | | | 390,000 | | | | 409,375 | |
| Connecticut Health & Educational Facilities Authority Rev. (University of Hartford), “N”, 5%, 7/01/2026 | | | 575,000 | | | | 604,900 | |
| Connecticut Health & Educational Facilities Authority Rev. (University of Hartford), “N”, 5%, 7/01/2027 | | | 430,000 | | | | 453,590 | |
| Connecticut Health & Educational Facilities Authority Rev. (University of Hartford), “N”, 5%, 7/01/2028 | | | 235,000 | | | | 248,585 | |
| Connecticut Health & Educational Facilities Authority Rev., “F”, 4%, 7/01/2021 | | | 565,000 | | | | 559,068 | |
| Hartford County, CT, Metropolitan District, “C”, AGM, 5%, 11/01/2020 | | | 1,830,000 | | | | 1,868,009 | |
| Hartford County, CT, Metropolitan District, “C”, AGM, 5%, 11/01/2021 | | | 3,775,000 | | | | 4,004,973 | |
| Hartford County, CT, Metropolitan District, “C”, AGM, 5%, 11/01/2023 | | | 3,000,000 | | | | 3,367,290 | |
| Hartford County, CT, Metropolitan District, “C”, AGM, 5%, 11/01/2024 | | | 5,600,000 | | | | 6,433,728 | |
| New Haven, CT, General Obligation, “B”, BAM, 5%, 8/01/2027 | | | 3,520,000 | | | | 4,033,885 | |
| New Haven, CT, General Obligation, “A”, AGM, 5%, 8/15/2024 | | | 1,280,000 | | | | 1,423,782 | |
| State of Connecticut, “A”, 5%, 9/01/2023 | | | 2,005,000 | | | | 2,222,422 | |
| State of Connecticut, “D”, BAM, 4%, 8/15/2030 | | | 11,250,000 | | | | 12,255,525 | |
| University of Connecticut, General Obligation, “A”, BAM, 5%, 1/15/2028 | | | 1,720,000 | | | | 2,019,916 | |
| | | | | | | | |
| | | | | | | $ | 48,025,321 | |
| Delaware - 0.0% | | | | | | |
| Delaware Economic Development Authority Rev. (Delaware Military Academy, Inc. Project), 4%, 9/01/2024 | | $ | 215,000 | | | $ | 218,257 | |
| Delaware Economic Development Authority Rev. (Newark Charter School, Inc.), “A”, 2.8%, 9/01/2026 | | | 380,000 | | | | 365,537 | |
| | | | | | | | |
| | | | | | | $ | 583,794 | |
| District of Columbia - 0.2% | | | | | | |
| District of Columbia University Rev. (Georgetown University), 5%, 4/01/2026 | | $ | 1,045,000 | | | $ | 1,184,372 | |
19
Portfolio of Investments – continued
| | | | | | | | |
| | |
| Issuer | | Shares/Par | | | Value ($) | |
| Municipal Bonds - continued | | | | | | |
| District of Columbia - continued | | | | | | |
| District of Columbia, Housing Finance Agency, Multi-Family Development Program,“B-1”, FHA, 2.55%, 9/01/2023 (Put Date 3/01/2022) | | $ | 5,000,000 | | | $ | 5,088,250 | |
| | | | | | | | |
| | | | | | | $ | 6,272,622 | |
| Florida - 3.2% | | | | | | |
| Alachua County, FL, Health Facilities Authority, Health Facilities Rev. (Shands Teaching Hospital and Clinics, Inc. at the University of Florida),“B-1”, 5%, 12/01/2020 | | $ | 500,000 | | | $ | 511,755 | |
| Alachua County, FL, Health Facilities Authority, Health Facilities Rev. (Shands Teaching Hospital and Clinics, Inc. at the University of Florida),“B-1”, 5%, 12/01/2021 | | | 600,000 | | | | 636,432 | |
| Alachua County, FL, Health Facilities Authority, Health Facilities Rev. (Shands Teaching Hospital and Clinics, Inc. at the University of Florida),“B-1”, 5%, 12/01/2022 | | | 600,000 | | | | 644,034 | |
| Bellalago, FL, Educational Facilities Benefit District (Osceola County) Capital Improvement Refunding Rev., 3.375%, 5/01/2021 | | | 1,005,000 | | | | 1,025,984 | |
| Bellalago, FL, Educational Facilities Benefit District (Osceola County) Capital Improvement Refunding Rev., 3.6%, 5/01/2022 | | | 1,040,000 | | | | 1,080,196 | |
| Bellalago, FL, Educational Facilities Benefit District (Osceola County) Capital Improvement Refunding Rev., 3.75%, 5/01/2023 | | | 1,080,000 | | | | 1,144,811 | |
| Broward County, FL, School Board, COP, “A”, AGM, 5%, 7/01/2028 | | | 4,505,000 | | | | 5,335,046 | |
| Daytona Beach, FL, Halifax Hospital Medical Center Rev., 5%, 6/01/2024 | | | 535,000 | | | | 595,712 | |
| Daytona Beach, FL, Halifax Hospital Medical Center Rev., 5%, 6/01/2025 | | | 615,000 | | | | 695,983 | |
| Florida Citizens Property Insurance Corp.,“A-1”, 5%, 6/01/2020 | | | 1,435,000 | | | | 1,439,420 | |
| Florida Higher Educational Facilities Financial Authority Rev. (University of Tampa Project), “A”, 5%, 4/01/2021 | | | 1,300,000 | | | | 1,346,293 | |
| Florida Higher Educational Facilities Financial Authority Rev. (University of Tampa Project), “A”, 5%, 4/01/2022 | | | 600,000 | | | | 638,298 | |
| Florida Higher Educational Facilities Financing Authority Rev. (Florida Institute of Technology), 5%, 10/01/2027 | | | 480,000 | | | | 515,573 | |
| Florida Higher Educational Facilities Financing Authority Rev. (Florida Institute of Technology), 5%, 10/01/2028 | | | 1,500,000 | | | | 1,612,035 | |
| Florida Higher Educational Facilities Financing Authority Rev. (Florida Institute of Technology), 5%, 10/01/2029 | | | 1,295,000 | | | | 1,391,892 | |
| Florida Higher Educational Facilities Financing Authority Rev. (Florida Institute of Technology), 5%, 10/01/2030 | | | 1,990,000 | | | | 2,129,380 | |
| Florida Housing Finance Corp, Multi-Family Housing Rev. (Azure Estates), “J”, 1.45%, 3/01/2023 (Put Date 3/01/2022) | | | 11,000,000 | | | | 11,094,270 | |
| Florida Municipal Power Agency Rev. (St. Lucie Project), “A”, 5%, 10/01/2020 | | | 1,330,000 | | | | 1,352,716 | |
20
Portfolio of Investments – continued
| | | | | | | | |
| | |
| Issuer | | Shares/Par | | | Value ($) | |
| Municipal Bonds - continued | | | | | | |
| Florida - continued | | | | | | |
| Lee Memorial Health System, FL, Hospital Rev.,“A-2”, 5%, 4/01/2033 (Put Date 4/01/2026) | | $ | 5,135,000 | | | $ | 5,645,625 | |
| Miami Beach, FL, Health Facilities Authority Hospital Rev. (Mount Sinai Medical Center of Florida), 5%, 11/15/2020 | | | 300,000 | | | | 304,947 | |
| Miami Beach, FL, Health Facilities Authority Hospital Rev. (Mount Sinai Medical Center of Florida), 5%, 11/15/2021 | | | 200,000 | | | | 209,302 | |
| Miami Beach, FL, Health Facilities Authority Hospital Rev. (Mount Sinai Medical Center of Florida), 5%, 11/15/2024 | | | 400,000 | | | | 449,552 | |
| Miami-Dade County, FL, Aviation Rev., “A”, 5%, 10/01/2029 (Prerefunded 10/01/2022) | | | 17,000,000 | | | | 18,596,810 | |
| Miami-Dade County, FL, Housing Finance Authority Multi-Family Rev. (Cabana Club Apartments), 1.4%, 4/01/2023 (Put Date 4/01/2022) | | | 1,170,000 | | | | 1,169,754 | |
| Miami-Dade County, FL, Housing Finance Authority Multi-Family Rev. (Liberty Square Phase Two LLC Project), 1.42%, 11/01/2040 (Put Date 5/01/2022) | | | 5,250,000 | | | | 5,254,358 | |
| Miami-Dade County, FL, Industrial Development Authority Rev. (Pinecrest Academy Project), 5%, 9/15/2024 | | | 380,000 | | | | 397,309 | |
| Miami-Dade County, FL, Seaport Rev., “B”, 5%, 10/01/2023 | | | 1,500,000 | | | | 1,660,575 | |
| Orange County, FL, Health Facilities Authority Rev. (Presbyterian Retirement Communities Project), 5%, 8/01/2020 | | | 1,730,000 | | | | 1,734,342 | |
| Orange County, FL, Health Facilities Authority Rev. (Presbyterian Retirement Communities Project), 5%, 8/01/2021 | | | 1,825,000 | | | | 1,846,772 | |
| Orange County, FL, Health Facilities Authority Rev. (Presbyterian Retirement Communities Project), 5%, 8/01/2022 | | | 1,810,000 | | | | 1,845,223 | |
| Palm Beach County, FL, Health Facilities Authority Hospital Rev. (Baptist Health South Florida Obligated Group), 5%, 8/15/2020 | | | 725,000 | | | | 731,851 | |
| Palm Beach County, FL, Health Facilities Authority Hospital Rev. (Baptist Health South Florida Obligated Group), 5%, 8/15/2022 | | | 500,000 | | | | 530,350 | |
| Palm Beach County, FL, Health Facilities Authority Hospital Rev. (BRRH Corp. Obligated Group), 5%, 12/01/2020 | | | 600,000 | | | | 614,562 | |
| Palm Beach County, FL, Health Facilities Authority Hospital Rev. (BRRH Corp. Obligated Group), 5%, 12/01/2021 | | | 1,200,000 | | | | 1,278,912 | |
| Tampa, FL, Solid Waste System Rev., 5%, 10/01/2020 | | | 3,000,000 | | | | 3,048,510 | |
| Tampa, FL, Solid Waste System Rev., 5%, 10/01/2021 | | | 1,000,000 | | | | 1,053,040 | |
| | | | | | | | |
| | | | | | | $ | 79,561,624 | |
| Georgia - 4.2% | | | | | | |
| Atlanta, GA, Water & Wastewater Rev., “B”, 5%, 11/01/2025 | | $ | 1,000,000 | | | $ | 1,195,680 | |
| Bartow County, GA, Development Authority Pollution Control Rev. (Georgia Power Co. Plant Bowen Project), 2.05%, 9/01/2029 (Put Date 11/19/2021) | | | 4,135,000 | | | | 4,136,282 | |
21
Portfolio of Investments – continued
| | | | | | | | |
| | |
| Issuer | | Shares/Par | | | Value ($) | |
| Municipal Bonds - continued | | | | | | |
| Georgia - continued | | | | | | |
| Bartow County, GA, Development Authority Pollution Control Rev. (Georgia Power Co. Plant Bowen Project), 1.55%, 8/01/2043 (Put Date 8/19/2022) | | $ | 3,000,000 | | | $ | 2,922,900 | |
| Brookhaven, GA, Development Authority Rev. (Children’s Healthcare of Atlanta, Inc.), “A”, 5%, 7/01/2026 | | | 1,250,000 | | | | 1,485,625 | |
| Brookhaven, GA, Development Authority Rev. (Children’s Healthcare of Atlanta, Inc.), “A”, 5%, 7/01/2027 | | | 1,550,000 | | | | 1,880,910 | |
| Brookhaven, GA, Development Authority Rev. (Children’s Healthcare of Atlanta, Inc.), “A”, 5%, 7/01/2028 | | | 1,665,000 | | | | 2,058,106 | |
| Brookhaven, GA, Development Authority Rev. (Children’s Healthcare of Atlanta, Inc.), “A”, 5%, 7/01/2029 | | | 1,680,000 | | | | 2,107,577 | |
| Brookhaven, GA, Development Authority Rev. (Children’s Healthcare of Atlanta, Inc.), “A”, 5%, 7/01/2030 | | | 1,250,000 | | | | 1,551,075 | |
| Burke County, GA, Development Authority Pollution Control Rev. (Georgia Power Co. Plant Vogtle Project), 2.25%, 10/01/2032 (Put Date 5/25/2023) | | | 2,885,000 | | | | 2,840,542 | |
| Burke County, GA, Development Authority Pollution Control Rev. (Georgia Power Co. Plant Vogtle Project), 1.55%, 12/01/2049 (Put Date 8/19/2022) | | | 4,000,000 | | | | 3,896,320 | |
| Burke County, GA, Development Authority Pollution Control Rev. (Georgia Power Co. Plant Vogtle Project), 2.925%, 11/01/2053 (Put Date 3/12/2024) | | | 5,000,000 | | | | 5,017,550 | |
| DeKalb County, GA, Water & Sewer Rev., “A”, 5%, 10/01/2021 | | | 1,000,000 | | | | 1,057,390 | |
| Fulton County, GA, Water & Sewer Rev., 5%, 1/01/2021 | | | 5,030,000 | | | | 5,166,363 | |
| Georgia Main Street Natural Gas, Inc., Gas Project Rev., “A”, 5%, 5/15/2020 | | | 500,000 | | | | 500,335 | |
| Georgia Main Street Natural Gas, Inc., Gas Project Rev., “A”, 5%, 5/15/2021 | | | 700,000 | | | | 715,792 | |
| Georgia Main Street Natural Gas, Inc., Gas Project Rev., “A”, 5%, 3/15/2022 | | | 8,670,000 | | | | 9,166,618 | |
| Georgia Main Street Natural Gas, Inc., Gas Project Rev., “B”, 4%, 8/01/2048 | | | 8,815,000 | | | | 9,334,203 | |
| Georgia Main Street Natural Gas, Inc., Gas Project Rev., “B”, FLR, 1.41% (67% of LIBOR - 1mo. + 0.75%), 4/01/2048 (Put Date 9/01/2023) | | | 10,000,000 | | | | 9,595,200 | |
| Georgia Main Street Natural Gas, Inc., Gas Supply Rev., “B”, 4%, 8/01/2049 (Put Date 12/02/2024) | | | 3,610,000 | | | | 3,871,689 | |
| Georgia Main Street Natural Gas, Inc., Gas Supply Rev., “C”, 4%, 3/01/2050 (Put Date 9/01/2026) | | | 16,910,000 | | | | 18,107,735 | |
| Georgia Main Street Natural Gas, Inc., Gas Supply Rev., “D”, FLR, 1.08% (67% of LIBOR - 1mo. + 0.83%), 8/01/2048 (Put Date 12/01/2023) | | | 8,420,000 | | | | 8,073,517 | |
| Georgia Municipal Gas Authority Rev. (Gas Portfolio III Project), “Q”, 5%, 10/01/2021 | | | 1,750,000 | | | | 1,846,618 | |
22
Portfolio of Investments – continued
| | | | | | | | |
| | |
| Issuer | | Shares/Par | | | Value ($) | |
| Municipal Bonds - continued | | | | | | |
| Georgia - continued | | | | | | |
| Glynn-Brunswick Memorial Hospital Authority Rev., Anticipation Certificates (Southeast Georgia Health System Project), 5%, 8/01/2023 | | $ | 1,750,000 | | | $ | 1,911,630 | |
| Monroe County, GA, Development Authority Pollution Control Rev. (Georgia Power Co. Plant Scherer Project), 2.25%, 7/01/2025 | | | 5,500,000 | | | | 5,620,505 | |
| Monroe County, GA, Development Authority Pollution Control Rev. (Georgia Power Co. Plant Scherer Project), 2.05%, 7/01/2049 (Put Date 11/19/2021) | | | 2,750,000 | | | | 2,750,852 | |
| | | | | | | | |
| | | | | | | $ | 106,811,014 | |
| Guam - 0.4% | | | | | | |
| Guam Education Financing Foundation (Guam Public School Facilities Project), “A”, COP, 5%, 10/01/2020 | | $ | 1,500,000 | | | $ | 1,504,335 | |
| Guam Education Financing Foundation (Guam Public School Facilities Project), “A”, COP, 5%, 10/01/2021 | | | 2,425,000 | | | | 2,444,812 | |
| Guam Government Business Privilege Tax Rev., “A”, 5%, 1/01/2027 | | | 3,185,000 | | | | 3,210,416 | |
| Guam International Airport Authority, “A”, 5%, 10/01/2022 | | | 580,000 | | | | 572,182 | |
| Guam International Airport Authority, “A”, 5%, 10/01/2023 | | | 825,000 | | | | 803,567 | |
| Guam Port Authority Rev., “B”, 5%, 7/01/2023 | | | 500,000 | | | | 514,595 | |
| Guam Power Authority Rev., “A”, AGM, 5%, 10/01/2021 | | | 1,500,000 | | | | 1,537,635 | |
| | | | | | | | |
| | | | | | | $ | 10,587,542 | |
| Hawaii - 0.1% | | | | | | |
| City & County of Honolulu, HI, General Obligation, “A”, 5%, 9/01/2027 | | $ | 2,015,000 | | | $ | 2,507,849 | |
| | |
| Idaho - 0.2% | | | | | | |
| Idaho Health Facilities Authority Rev. (St. Luke’s Health System Project), “A”, 5%, 3/01/2026 | | $ | 2,000,000 | | | $ | 2,294,160 | |
| Idaho Health Facilities Authority Rev. (St. Luke’s Health System Project), “A”, 5%, 3/01/2027 | | | 2,100,000 | | | | 2,436,126 | |
| | | | | | | | |
| | | | | | | $ | 4,730,286 | |
| Illinois - 10.8% | | | | | | |
| Bolingbrook, IL, Special Service Areas Taxes, AGM, 4%, 3/01/2025 | | $ | 1,500,000 | | | $ | 1,671,300 | |
| Bolingbrook, IL, Special Service Areas Taxes, AGM, 4%, 3/01/2027 | | | 1,500,000 | | | | 1,717,305 | |
| Chicago, IL, “A”, 5%, 1/01/2022 | | | 1,000,000 | | | | 1,013,270 | |
| Chicago, IL, “A”, 5%, 1/01/2025 | | | 4,550,000 | | | | 4,655,605 | |
| Chicago, IL, “A”, 5%, 1/01/2028 | | | 5,000,000 | | | | 5,087,400 | |
| Chicago, IL, “A”, 5.25%, 1/01/2028 | | | 3,160,000 | | | | 3,204,019 | |
| Chicago, IL, “A”, 5%, 1/01/2029 | | | 3,000,000 | | | | 3,042,810 | |
| Chicago, IL, “A”, 5%, 1/01/2031 | | | 2,000,000 | | | | 2,010,720 | |
| Chicago, IL, “C”, 5%, 1/01/2024 | | | 1,210,000 | | | | 1,222,076 | |
23
Portfolio of Investments – continued
| | | | | | | | |
| | |
| Issuer | | Shares/Par | | | Value ($) | |
| Municipal Bonds - continued | | | | | | |
| Illinois - continued | | | | | | |
| Chicago, IL, Board of Education (School Reform), “A”, NATL, 5.25%, 12/01/2023 | | $ | 3,875,000 | | | $ | 4,042,865 | |
| Chicago, IL, Board of Education (School Reform), “A”, NATL, 5.25%, 12/01/2023 | | | 5,425,000 | | | | 5,660,011 | |
| Chicago, IL, Board of Education (School Reform), Capital Appreciation, “A”, NATL, 0%, 12/01/2022 | | | 785,000 | | | | 723,778 | |
| Chicago, IL, Board of Education (School Reform), Capital Appreciation, “A”, NATL, 0%, 12/01/2023 | | | 675,000 | | | | 601,087 | |
| Chicago, IL, Board of Education (School Reform), Capital Appreciation, “A”, NATL, 0%, 12/01/2028 | | | 4,435,000 | | | | 3,238,437 | |
| Chicago, IL, Board of Education (School Reform), Capital Appreciation,“B-1”, NATL, 0%, 12/01/2022 | | | 1,855,000 | | | | 1,710,329 | |
| Chicago, IL, Board of Education (School Reform), Capital Appreciation,“B-1”, NATL, 0%, 12/01/2023 | | | 8,170,000 | | | | 7,275,385 | |
| Chicago, IL, Board of Education (School Reform), Capital Appreciation,“B-1”, NATL, 0%, 12/01/2026 | | | 1,925,000 | | | | 1,528,662 | |
| Chicago, IL, Board of Education, “A”, AAC, 5.5%, 12/01/2024 | | | 5,430,000 | | | | 5,811,729 | |
| Chicago, IL, Board of Education, Unlimited Tax General Obligation Refunding Dedicated Rev., “A”, AGM, 5%, 12/01/2025 | | | 2,500,000 | | | | 2,889,175 | |
| Chicago, IL, Board of Education, Unlimited Tax General Obligation Refunding Dedicated Rev., “A”, AGM, 5%, 12/01/2026 | | | 1,500,000 | | | | 1,767,120 | |
| Chicago, IL, Board of Education, Unlimited Tax General Obligation Refunding Dedicated Rev., “A”, AGM, 5%, 12/01/2027 | | | 2,750,000 | | | | 3,288,835 | |
| Chicago, IL, Board of Education, Unlimited Tax General Obligation Refunding Dedicated Rev., “A”, AGM, 5%, 12/01/2028 | | | 2,250,000 | | | | 2,720,137 | |
| Chicago, IL, Board of Education, Unlimited Tax General Obligation Refunding Dedicated Rev., “C”, 5%, 12/01/2027 | | | 3,000,000 | | | | 3,041,340 | |
| Chicago, IL, Board of Education, Unlimited Tax General Obligation Refunding Dedicated Rev., “C”, AGM, 5%, 12/01/2027 | | | 10,000,000 | | | | 11,959,400 | |
| Chicago, IL, City Colleges of Chicago Capital Improvement Project, Capital Appreciation, NATL, 0%, 1/01/2026 | | | 6,640,000 | | | | 5,205,694 | |
| Chicago, IL, Metropolitan Pier & Exposition Authority, State Tax Rev., Capital Appreciation, “A”, NATL, 0%, 6/15/2024 | | | 7,075,000 | | | | 6,250,904 | |
| Chicago, IL, Metropolitan Pier & Exposition Authority, State Tax Rev., Capital Appreciation, “A”, NATL, 0%, 12/15/2026 | | | 1,275,000 | | | | 1,024,207 | |
| Chicago, IL, Midway Airport Rev., Second Lien, “A”, 5.5%, 1/01/2030 | | | 3,060,000 | | | | 3,261,562 | |
| Chicago, IL, O’Hare International Airport Rev., Senior Lien, “A”, 5%, 1/01/2023 | | | 820,000 | | | | 878,597 | |
| Chicago, IL, O’Hare International Airport Rev., Senior Lien, “A”, 5%, 1/01/2025 | | | 5,000,000 | | | | 5,566,050 | |
| Chicago, IL, O’Hare International Airport, Passenger Facility Charge Rev., “B”, 5%, 1/01/2030 | | | 580,000 | | | | 600,497 | |
24
Portfolio of Investments – continued
| | | | | | | | |
| | |
| Issuer | | Shares/Par | | | Value ($) | |
| Municipal Bonds - continued | | | | | | |
| Illinois - continued | | | | | | |
| Chicago, IL, Tax Increment Rev. (Pilsen Development Project), “A”, 5%, 6/01/2021 | | $ | 3,375,000 | | | $ | 3,394,170 | |
| Chicago, IL, Tax Increment Rev. (Pilsen Development Project), “A”, 5%, 6/01/2022 | | | 4,250,000 | | | | 4,291,267 | |
| Chicago, IL, Transit Authority Refunding Rev., 5%, 6/01/2026 | | | 2,500,000 | | | | 2,954,800 | |
| Chicago, IL, Wastewater Transmission Rev., Second Lien, “A”, AGM, 5%, 1/01/2027 | | | 1,500,000 | | | | 1,789,365 | |
| Chicago, IL, Wastewater Transmission Rev., Second Lien, “B”, AGM, 5%, 1/01/2027 | | | 2,000,000 | | | | 2,392,740 | |
| Chicago, IL, Water Rev., AGM, 5%, 11/01/2027 | | | 4,160,000 | | | | 4,819,277 | |
| Chicago, IL, Water Rev., Second Lien, AGM, 5%, 11/01/2028 | | | 1,400,000 | | | | 1,616,412 | |
| City of Country Club Hills, Cook County, IL, Refunding, BAM, 4%, 12/01/2024 | | | 1,180,000 | | | | 1,277,822 | |
| City of Country Club Hills, Cook County, IL, Refunding, BAM, 4%, 12/01/2025 | | | 1,230,000 | | | | 1,348,793 | |
| Cook County, IL, General Obligation Refunding, 5%, 11/15/2020 | | | 700,000 | | | | 707,049 | |
| Cook County, IL, General Obligation Refunding, 5%, 11/15/2021 | | | 600,000 | | | | 612,840 | |
| Cook County, IL, General Obligation Refunding, “C”, AGM, 5%, 11/15/2025 | | | 10,000,000 | | | | 10,808,900 | |
| Cook County, IL, School District No. 111, General Obligation, AGM, 4%, 12/01/2029 | | | 550,000 | | | | 620,988 | |
| Cook County, IL, School District No. 111, General Obligation, BAM, 5%, 12/01/2029 | | | 935,000 | | | | 1,154,762 | |
| Cook County, IL, School District No. 111, General Obligation, BAM, 5%, 12/01/2030 | | | 1,040,000 | | | | 1,277,318 | |
| Illinois Finance Authority Rev. (Advocate Health Care Network),“A-1”, 4%, 11/01/2030 | | | 2,325,000 | | | | 2,524,415 | |
| Illinois Finance Authority Rev. (Advocate Health Care Network),“A-2”, 4%, 11/01/2030 | | | 2,330,000 | | | | 2,529,681 | |
| Illinois Finance Authority Rev. (DePaul University), ETM, 5%, 10/01/2020 | | | 5,000 | | | | 5,087 | |
| Illinois Finance Authority Rev. (DePaul University), Unrefunded Balance, 5%, 10/01/2020 | | | 3,330,000 | | | | 3,382,847 | |
| Illinois Finance Authority Rev. (Edward-Elmhurst Healthcare), “A”, 5%, 1/01/2023 | | | 400,000 | | | | 431,060 | |
| Illinois Finance Authority Rev. (Edward-Elmhurst Healthcare), “A”, 5%, 1/01/2024 | | | 350,000 | | | | 386,131 | |
| Illinois Finance Authority Rev. (Edward-Elmhurst Healthcare), “A”, 5%, 1/01/2025 | | | 825,000 | | | | 926,137 | |
| Illinois Finance Authority Rev. (Franciscan Communities, Inc.), “A”, 4%, 5/15/2023 | | | 70,000 | | | | 76,363 | |
| Illinois Finance Authority Rev. (Franciscan Communities, Inc.), “A”, 4%, 5/15/2023 | | | 495,000 | | | | 476,388 | |
25
Portfolio of Investments – continued
| | | | | | | | |
| | |
| Issuer | | Shares/Par | | | Value ($) | |
| Municipal Bonds - continued | | | | | | |
| Illinois - continued | | | | | | |
| Illinois Finance Authority Rev. (Northshore University Health System), “A”, 5%, 8/15/2023 | | $ | 1,000,000 | | | $ | 1,099,700 | |
| Illinois Finance Authority Rev. (Presbyterian Homes Obligated Group), “B”, FLR, 2.039% (70% of LIBOR - 1mo. + 1.35%), 5/01/2036 (Put Date 5/01/2021) | | | 700,000 | | | | 694,834 | |
| Illinois Finance Authority Rev. (Presence Health Network), “C”, 5%, 2/15/2023 | | | 3,900,000 | | | | 4,237,233 | |
| Illinois Finance Authority Rev. (Silver Cross Hospital & Medical Centers), “C”, 5%, 8/15/2021 | | | 1,000,000 | | | | 1,039,230 | |
| Illinois Finance Authority Rev. (Southern Illinois Healthcare Enterprises, Inc.), “C”, 5%, 3/01/2025 | | | 750,000 | | | | 852,052 | |
| Illinois Finance Authority Rev. (Southern Illinois Healthcare Enterprises, Inc.), “C”, 5%, 3/01/2026 | | | 750,000 | | | | 866,947 | |
| Illinois Finance Authority, Academic Facilities Lease Rev. (Provident Group - UIUC Properties LLC - University of Illinois at Urbana-Champaign Project), “A”, 5%, 10/01/2027 | | | 250,000 | | | | 292,568 | |
| Illinois Finance Authority, Academic Facilities Lease Rev. (Provident Group - UIUC Properties LLC - University of Illinois at Urbana-Champaign Project), “A”, 5%, 10/01/2028 | | | 195,000 | | | | 231,157 | |
| Illinois Finance Authority, Academic Facilities Lease Rev. (Provident Group - UIUC Properties LLC - University of Illinois at Urbana-Champaign Project), “A”, 5%, 10/01/2029 | | | 250,000 | | | | 299,190 | |
| Illinois Finance Authority, Academic Facilities Lease Rev. (Provident Group - UIUC Properties LLC - University of Illinois at Urbana-Champaign Project), “A”, 5%, 10/01/2030 | | | 250,000 | | | | 294,868 | |
| Illinois Finance Authority, Academic Facilities Lease Rev. (Provident Group - UIUC Properties LLC - University of Illinois at Urbana-Champaign Project), “A”, 5%, 10/01/2031 | | | 235,000 | | | | 275,295 | |
| Illinois Finance Authority, Graduate & Professional Student Loan Program Rev. (Midwestern University Foundation), “A”, 5%, 7/01/2024 | | | 1,350,000 | | | | 1,531,845 | |
| Illinois Finance Authority, Graduate & Professional Student Loan Program Rev. (Midwestern University Foundation), “A”, 5%, 7/01/2025 | | | 750,000 | | | | 869,887 | |
| Illinois Finance Authority, Graduate & Professional Student Loan Program Rev. (Midwestern University Foundation), “A”, 5%, 7/01/2026 | | | 1,300,000 | | | | 1,536,717 | |
| Illinois Finance Authority, Graduate & Professional Student Loan Program Rev. (Midwestern University Foundation), “A”, 5%, 7/01/2027 | | | 1,250,000 | | | | 1,504,762 | |
| Illinois Finance Authority, Graduate & Professional Student Loan Program Rev. (Midwestern University Foundation), “A”, 3%, 7/01/2035 | | | 430,000 | | | | 442,122 | |
26
Portfolio of Investments – continued
| | | | | | | | |
| | |
| Issuer | | Shares/Par | | | Value ($) | |
| Municipal Bonds - continued | | | | | | |
| Illinois - continued | | | | | | |
| Illinois Housing Development Authority, Multi-Family Housing Rev. (Century Woods), FHLMC, 1.9%, 10/01/2022 (Put Date 10/01/2021) | | $ | 1,270,000 | | | $ | 1,279,665 | |
| Illinois Railsplitter Tobacco Settlement Authority Rev., 5%, 6/01/2023 | | | 2,500,000 | | | | 2,758,800 | |
| Illinois Railsplitter Tobacco Settlement Authority Rev., 5.5%, 6/01/2023 (Prerefunded 6/01/2021) | | | 1,605,000 | | | | 1,686,646 | |
| Illinois Railsplitter Tobacco Settlement Authority Rev., 6%, 6/01/2028 (Prerefunded 6/01/2021) | | | 1,135,000 | | | | 1,198,288 | |
| Illinois Sales Tax Securitization Corp., Second Lien, “A”, 5%, 1/01/2025 | | | 3,250,000 | | | | 3,551,925 | |
| Illinois Sales Tax Securitization Corp., Second Lien, “A”, 5%, 1/01/2026 | | | 3,300,000 | | | | 3,655,971 | |
| Illinois Sales Tax Securitization Corp., Second Lien, “A”, 5%, 1/01/2027 | | | 2,500,000 | | | | 2,804,250 | |
| Illinois Sports Facilities Authority Refunding Rev., BAM, 5%, 6/15/2028 | | | 500,000 | | | | 555,810 | |
| Illinois Sports Facilities Authority Refunding Rev., BAM, 5%, 6/15/2029 | | | 2,405,000 | | | | 2,684,870 | |
| Illinois Sports Facilities Authority, State Tax Supported Refunding Rev., AGM, 5%, 6/15/2027 | | | 965,000 | | | | 1,027,474 | |
| Kane County, IL, School District No. 131 Rev., “A”, AGM, 5%, 12/01/2025 | | | 340,000 | | | | 403,172 | |
| Kane County, IL, School District No. 131 Rev., “A”, AGM, 5%, 12/01/2026 | | | 665,000 | | | | 803,393 | |
| Kane County, IL, School District No. 131 Rev., “B”, AGM, 5%, 12/01/2025 | | | 700,000 | | | | 830,060 | |
| Kane County, IL, School District No. 131 Rev., “B”, AGM, 5%, 12/01/2026 | | | 410,000 | | | | 496,178 | |
| Kane, Cook & DuPage Counties, IL, School District Rev., Capital Appreciation, “B”, ETM, 0%, 1/01/2021 | | | 3,230,000 | | | | 3,212,235 | |
| Kane, Cook & DuPage Counties, IL, School District Rev., Capital Appreciation, “B”, Unrefunded Balance, 0%, 1/01/2021 | | | 4,215,000 | | | | 4,182,755 | |
| Madison County, IL, Edwardsville Community Unit School District No. 007, BAM, 4%, 12/01/2020 | | | 785,000 | | | | 798,832 | |
| Madison County, IL, Edwardsville Community Unit School District No. 007, BAM, 3.375%, 12/01/2027 | | | 100,000 | | | | 104,104 | |
| Madison County, IL, Edwardsville Community Unit School District No. 007, BAM, 5%, 12/01/2028 | | | 450,000 | | | | 525,740 | |
| Madison County, IL, Edwardsville Community Unit School District No. 007, BAM, 5%, 12/01/2029 | | | 465,000 | | | | 542,725 | |
| Madison, Macoupin, Etc. Counties, IL, Community College District No. 536, BAM, 5%, 11/01/2027 | | | 1,485,000 | | | | 1,701,231 | |
27
Portfolio of Investments – continued
| | | | | | | | |
| | |
| Issuer | | Shares/Par | | | Value ($) | |
| Municipal Bonds - continued | | | | | | |
| Illinois - continued | | | | | | |
| Metropolitan Pier & Exposition Authority Refunding Bonds (McCormick Place Expansion Project), Capital Appreciation, “A”, AGM, 0%, 6/15/2026 | | $ | 2,385,000 | | | $ | 1,974,899 | |
| Metropolitan Pier & Exposition Authority, Dedicated State Tax Rev. (McCormick Place Expansion Project), NATL, 5.5%, 6/15/2029 | | | 3,110,000 | | | | 3,397,582 | |
| Newport Township, IL, Fire Protection District, BAM, 4%, 1/01/2025 | | | 80,000 | | | | 87,137 | |
| Newport Township, IL, Fire Protection District, BAM, 4%, 1/01/2027 | | | 165,000 | | | | 183,284 | |
| Newport Township, IL, Fire Protection District, BAM, 4%, 1/01/2028 | | | 170,000 | | | | 190,004 | |
| Northern Illinois University, Auxiliary Facilities System Refunding Rev., “B”, BAM, 5%, 4/01/2022 | | | 275,000 | | | | 289,308 | |
| Northern Illinois University, Auxiliary Facilities System Refunding Rev., “B”, BAM, 5%, 4/01/2023 | | | 120,000 | | | | 128,860 | |
| Northern Illinois University, Auxiliary Facilities System Refunding Rev., “B”, BAM, 5%, 4/01/2024 | | | 525,000 | | | | 574,172 | |
| Northern Illinois University, Auxiliary Facilities System Refunding Rev., “B”, BAM, 5%, 4/01/2025 | | | 425,000 | | | | 472,124 | |
| Northern Illinois University, Auxiliary Facilities System Refunding Rev., “B”, BAM, 5%, 4/01/2026 | | | 690,000 | | | | 778,389 | |
| Northern Illinois University, Auxiliary Facilities System Refunding Rev., “B”, BAM, 5%, 4/01/2027 | | | 525,000 | | | | 599,077 | |
| Northern Illinois University, Auxiliary Facilities System Refunding Rev., “B”, BAM, 5%, 4/01/2028 | | | 640,000 | | | | 739,347 | |
| Northern Illinois University, Auxiliary Facilities System Refunding Rev., “B”, BAM, 5%, 4/01/2030 | | | 1,000,000 | | | | 1,168,010 | |
| Northern Illinois University, Auxiliary Facilities System Refunding Rev., “B”, BAM, 5%, 4/01/2032 | | | 1,325,000 | | | | 1,519,364 | |
| Peoria, IL, Public Building Commission, School District Facilities Rev., “A”, AGM, 4%, 12/01/2025 | | | 700,000 | | | | 784,805 | |
| Peoria, IL, Public Building Commission, School District Facilities Rev., “A”, AGM, 4%, 12/01/2026 | | | 1,000,000 | | | | 1,130,720 | |
| Peoria, IL, Public Building Commission, School District Facilities Rev., “A”, AGM, 4%, 12/01/2027 | | | 1,270,000 | | | | 1,455,433 | |
| Peoria, IL, Public Building Commission, School District Facilities Rev., “A”, AGM, 5%, 12/01/2028 | | | 1,200,000 | | | | 1,472,604 | |
| Peoria, IL, Public Building Commission, School District Facilities Rev., “A”, AGM, 5%, 12/01/2029 | | | 4,430,000 | | | | 5,407,834 | |
| Quad Cities, IL, Regional Economic Development Authority Rev. (Augustana College), 4%, 10/01/2020 | | | 500,000 | | | | 505,225 | |
| Romeoville, IL, Rev. (Lewis University Project), 5%, 10/01/2020 | | | 520,000 | | | | 527,327 | |
28
Portfolio of Investments – continued
| | | | | | | | |
| | |
| Issuer | | Shares/Par | | | Value ($) | |
| Municipal Bonds - continued | | | | | | |
| Illinois - continued | | | | | | |
| Romeoville, IL, Rev. (Lewis University Project), 5%, 10/01/2022 | | $ | 500,000 | | | $ | 519,110 | |
| Sangamon County, IL, Springfield School District No. 186, “C”, AGM, 4%, 6/01/2022 (w) | | | 705,000 | | | | 737,289 | |
| Sangamon County, IL, Springfield School District No. 186, “C”, AGM, 4%, 6/01/2023 (w) | | | 1,000,000 | | | | 1,064,730 | |
| Sangamon County, IL, Springfield School District No. 186, “C”, AGM, 4%, 6/01/2024 (w) | | | 785,000 | | | | 849,802 | |
| Southwestern, IL, Development Authority Health Facility Rev. (Hospital Sisters Services, Inc.), “A”, 5%, 2/15/2025 | | | 1,000,000 | | | | 1,134,990 | |
| Southwestern, IL, Development Authority Health Facility Rev. (Hospital Sisters Services, Inc.), “A”, 5%, 2/15/2026 | | | 3,000,000 | | | | 3,464,880 | |
| State of Illinois, 5%, 6/01/2020 | | | 2,370,000 | | | | 2,370,853 | |
| State of Illinois, 5%, 1/01/2022 | | | 500,000 | | | | 500,010 | |
| State of Illinois, 5%, 1/01/2024 | | | 3,000,000 | | | | 2,979,840 | |
| State of Illinois, 5%, 2/01/2025 | | | 6,190,000 | | | | 6,107,735 | |
| State of Illinois, AGM, 5%, 2/01/2027 | | | 910,000 | | | | 957,038 | |
| State of Illinois, AGM, 4%, 2/01/2030 | | | 380,000 | | | | 385,502 | |
| State of Illinois, BAM, 5%, 8/01/2021 | | | 8,870,000 | | | | 9,078,800 | |
| State of Illinois, NATL, 6%, 11/01/2026 | | | 2,565,000 | | | | 2,624,046 | |
| State of Illinois, “A”, 5%, 12/01/2020 | | | 1,630,000 | | | | 1,635,167 | |
| State of Illinois, “A”, 4%, 1/01/2025 | | | 1,775,000 | | | | 1,697,841 | |
| State of Illinois, “A”, 5%, 11/01/2027 | | | 5,365,000 | | | | 5,196,754 | |
| State of Illinois, “B”, 5%, 12/01/2020 | | | 900,000 | | | | 902,853 | |
| State of Illinois, “A”, 5%, 12/01/2024 | | | 220,000 | | | | 217,699 | |
| State of Illinois, Sales Tax Rev., BAM, 5%, 6/15/2025 | | | 240,000 | | | | 253,555 | |
| Upper Illinois River Valley Development Authority Rev. (Morris Hospital), 5%, 12/01/2025 | | | 380,000 | | | | 433,774 | |
| Upper Illinois River Valley Development Authority Rev. (Morris Hospital), 5%, 12/01/2026 | | | 915,000 | | | | 1,057,850 | |
| | | | | | | | |
| | | | | | | $ | 270,903,072 | |
| Indiana - 2.3% | | | | | | |
| Ball State University Board of Trustees (Student Fee), “R”, 5%, 7/01/2024 | | $ | 1,000,000 | | | $ | 1,149,910 | |
| Evansville, IN, Redevelopment Authority Lease Rental Rev. (Arena Project), BAM, 5%, 2/01/2025 | | | 1,000,000 | | | | 1,162,580 | |
| Indiana Bond Bank Special Program, Gas Rev., “A”, 5.25%, 10/15/2021 | | | 1,000,000 | | | | 1,048,830 | |
| Indiana Development Finance Authority Solid Water Disposal Rev. (Waste Management, Inc. Project), 2.95%, 10/01/2031 (Put Date 10/01/2021) | | | 595,000 | | | | 597,445 | |
| Indiana Economic Development Finance Authority Rev. (Republic Services, Inc. Project), 1.15%, 12/01/2037 (Put Date 6/01/2020) | | | 2,385,000 | | | | 2,384,189 | |
29
Portfolio of Investments – continued
| | | | | | | | |
| | |
| Issuer | | Shares/Par | | | Value ($) | |
| Municipal Bonds - continued | | | | | | |
| Indiana - continued | | | | | | |
| Indiana Finance Authority Hospital Rev. (Goshen Health), “A”, 5%, 11/01/2027 | | $ | 740,000 | | | $ | 867,051 | |
| Indiana Finance Authority Hospital Rev. (Goshen Health), “A”, 5%, 11/01/2028 | | | 775,000 | | | | 919,545 | |
| Indiana Finance Authority Hospital Rev. (Goshen Health), “A”, 5%, 11/01/2029 | | | 1,140,000 | | | | 1,354,696 | |
| Indiana Finance Authority Hospital Rev. (Goshen Health), “A”, 5%, 11/01/2030 | | | 985,000 | | | | 1,162,940 | |
| Indiana Finance Authority Hospital Rev. (Goshen Health), “A”, 2.1%, 11/01/2049 (Put Date 11/01/2026) | | | 2,700,000 | | | | 2,716,902 | |
| Indiana Finance Authority Hospital Rev. (Indiana University Health Obligated Group), “B”, 1.65%, 12/01/2042 (Put Date 7/01/2022) | | | 3,000,000 | | | | 3,009,690 | |
| Indiana Finance Authority Rev. (Butler University), “A”, 5%, 2/01/2022 | | | 1,000,000 | | | | 1,060,460 | |
| Indiana Finance Authority, Water Utility Rev. (Citizens Energy Group Project), “B”, 2.95%, 10/01/2022 | | | 5,000,000 | | | | 5,175,650 | |
| Indianapolis, IN, Local Public Improvement, Community Justice Campus (Courthouse and Jail Project), “A”, 5%, 2/01/2028 | | | 1,100,000 | | | | 1,387,837 | |
| Indianapolis, IN, Local Public Improvement, Community Justice Campus (Courthouse and Jail Project), “A”, 5%, 2/01/2029 | | | 1,000,000 | | | | 1,282,470 | |
| Indianapolis, IN, Local Public Improvement, Community Justice Campus (Courthouse and Jail Project), “A”, 5%, 2/01/2030 | | | 1,300,000 | | | | 1,652,118 | |
| Indianapolis, IN, Local Public Improvement, Community Justice Campus (Courthouse and Jail Project), “A”, 5%, 2/01/2031 | | | 1,500,000 | | | | 1,890,630 | |
| Lake County, IN, Hammond Multi-School Building Corp., 5%, 7/15/2025 | | | 1,500,000 | | | | 1,734,840 | |
| Lake County, IN, Hammond Multi-School Building Corp., 5%, 1/15/2026 | | | 1,500,000 | | | | 1,740,255 | |
| Lake County, IN, Hammond Multi-School Building Corp., 5%, 7/15/2026 | | | 1,210,000 | | | | 1,406,093 | |
| Lake County, IN, Hammond Multi-School Building Corp., 5%, 1/15/2027 | | | 1,515,000 | | | | 1,761,051 | |
| Lake County, IN, Hammond Multi-School Building Corp., 5%, 7/15/2027 | | | 1,000,000 | | | | 1,172,400 | |
| Lake County, IN, Hammond Multi-School Building Corp., 5%, 1/15/2028 | | | 1,000,000 | | | | 1,181,980 | |
| Lake County, IN, Hammond Multi-School Building Corp., 5%, 7/15/2028 | | | 1,435,000 | | | | 1,693,573 | |
| Valparaiso, IN, Exempt Facilities Rev. (Pratt Paper LLC Project), 5.875%, 1/01/2024 | | | 1,000,000 | | | | 1,018,830 | |
| Whiting, IN, Environmental Facilities Rev. (BP Products North America, Inc. Project), 5%, 11/01/2047 (Put Date 11/01/2024) | | | 7,500,000 | | | | 8,159,100 | |
| Whiting, IN, Environmental Facilities Rev. (BP Products North America, Inc. Project), “A”, 5%, 12/01/2044 (Put Date 6/05/2026) | | | 6,590,000 | | | | 7,324,192 | |
30
Portfolio of Investments – continued
| | | | | | | | |
| | |
| Issuer | | Shares/Par | | | Value ($) | |
| Municipal Bonds - continued | | | | | | |
| Indiana - continued | | | | | | |
| Whiting, IN, Environmental Facilities Rev. (BP Products North America, Inc. Project), “A”, 5%, 3/01/2046 (Put Date 3/01/2023) | | $ | 3,000,000 | | | $ | 3,172,680 | |
| | | | | | | | |
| | | | | | | $ | 59,187,937 | |
| Iowa - 0.2% | | | | | | |
| Iowa Student Loan Liquidity Corp. Rev., “A”, 5%, 12/01/2020 | | $ | 1,050,000 | | | $ | 1,067,777 | |
| Iowa Student Loan Liquidity Corp. Rev., “A”, 5%, 12/01/2022 | | | 1,375,000 | | | | 1,473,766 | |
| Iowa Student Loan Liquidity Corp. Rev., “A”, 5%, 12/01/2024 | | | 1,000,000 | | | | 1,119,820 | |
| Iowa Student Loan Liquidity Corp. Rev., “A”, 5%, 12/01/2025 | | | 1,425,000 | | | | 1,626,652 | |
| | | | | | | | |
| | | | | | | $ | 5,288,015 | |
| Kansas - 0.8% | | | | | | |
| Coffeyville, KS, Electric Utility System Rev. “B”, NATL, 5%, 6/01/2020 (n) | | $ | 1,100,000 | | | $ | 1,103,267 | |
| Coffeyville, KS, Electric Utility System Rev. “B”, NATL, 5%, 6/01/2021 | | | 1,200,000 | | | | 1,248,948 | |
| Coffeyville, KS, Electric Utility System Rev. “B”, NATL, 5%, 6/01/2022 | | | 1,200,000 | | | | 1,242,156 | |
| Coffeyville, KS, Electric Utility System Rev. “B”, NATL, 5%, 6/01/2024 | | | 1,300,000 | | | | 1,364,311 | |
| Lyon County, KS, Unified School District No. 253, 4%, 9/01/2028 | | | 460,000 | | | | 537,050 | |
| Lyon County, KS, Unified School District No. 253, 4%, 9/01/2029 | | | 450,000 | | | | 515,727 | |
| Lyon County, KS, Unified School District No. 253, 4%, 9/01/2030 | | | 325,000 | | | | 369,824 | |
| Lyon County, KS, Unified School District No. 253, 4%, 9/01/2031 | | | 350,000 | | | | 395,811 | |
| Overland Park, KS, Development Corp. Improvement and Refunding Rev. (Convention Center Hotel), 5%, 3/01/2025 | | | 1,130,000 | | | | 1,172,793 | |
| Overland Park, KS, Development Corp. Improvement and Refunding Rev. (Convention Center Hotel), 5%, 3/01/2026 | | | 1,770,000 | | | | 1,837,933 | |
| Overland Park, KS, Development Corp. Improvement and Refunding Rev. (Convention Center Hotel), 5%, 3/01/2027 | | | 1,865,000 | | | | 1,931,413 | |
| Overland Park, KS, Development Corp. Improvement and Refunding Rev. (Convention Center Hotel), 5%, 3/01/2028 | | | 1,960,000 | | | | 2,020,877 | |
| Overland Park, KS, Development Corp. Improvement and Refunding Rev. (Convention Center Hotel), 5%, 3/01/2029 | | | 2,060,000 | | | | 2,105,382 | |
| Overland Park, KS, Development Corp. Improvement and Refunding Rev. (Convention Center Hotel), 5%, 3/01/2030 | | | 2,165,000 | | | | 2,190,049 | |
| Overland Park, KS, Development Corp. Improvement and Refunding Rev. (Convention Center Hotel), 5%, 3/01/2031 | | | 2,270,000 | | | | 2,275,085 | |
| | | | | | | | |
| | | | | | | $ | 20,310,626 | |
| Kentucky - 3.2% | | | | | | |
| Bowling Green, KY, Water and Sewer Rev., AGM, 5%, 6/01/2028 | | $ | 1,845,000 | | | $ | 2,221,029 | |
| Bowling Green, KY, Water and Sewer Rev., AGM, 4%, 6/01/2030 | | | 2,180,000 | | | | 2,465,645 | |
| Carroll County, KY, Environmental Facilities Rev. (Utilities Company Project), “A”, 3.375%, 2/01/2026 | | | 10,000,000 | | | | 10,563,300 | |
31
Portfolio of Investments – continued
| | | | | | | | |
| | |
| Issuer | | Shares/Par | | | Value ($) | |
| Municipal Bonds - continued | | | | | | |
| Kentucky - continued | | | | | | |
| Commonwealth of Kentucky State Property & Buildings Commission Rev. (Project No. 100), “A”, 5%, 8/01/2020 | | $ | 5,000,000 | | | $ | 5,043,750 | |
| Kentucky Bond Development Corp. Industrial Building Rev. (Transylvania University Project), “D”, 3%, 3/01/2021 | | | 375,000 | | | | 380,955 | |
| Kentucky Economic Development Finance Authority Hospital Rev. (Owensboro Health, Inc.), “A”, 5%, 6/01/2025 | | | 1,750,000 | | | | 1,935,272 | |
| Kentucky Economic Development Finance Authority Hospital Rev. (Owensboro Health, Inc.), “A”, 5%, 6/01/2026 | | | 2,000,000 | | | | 2,236,760 | |
| Kentucky Economic Development Finance Authority Hospital Rev. (Owensboro Health, Inc.), “A”, 5%, 6/01/2027 | | | 2,625,000 | | | | 2,973,075 | |
| Kentucky Higher Education Student Loan Corp. Rev., “A”, 3%, 6/01/2029 | | | 1,770,000 | | | | 1,715,732 | |
| Kentucky Higher Education Student Loan Corp. Rev.,“A-1”, 5%, 6/01/2022 | | | 300,000 | | | | 318,042 | |
| Kentucky Higher Education Student Loan Corp. Rev.,“A-1”, 5%, 6/01/2023 | | | 350,000 | | | | 380,177 | |
| Kentucky Higher Education Student Loan Corp. Rev.,“A-1”, 5%, 6/01/2024 | | | 700,000 | | | | 776,251 | |
| Kentucky Higher Education Student Loan Corp. Rev.,“A-1”, 5%, 6/01/2025 | | | 1,350,000 | | | | 1,527,080 | |
| Kentucky Higher Education Student Loan Corp. Rev.,“A-1”, 5%, 6/01/2026 | | | 2,000,000 | | | | 2,302,940 | |
| Kentucky Higher Education Student Loan Corp. Rev.,“A-1”, 5%, 6/01/2027 | | | 3,000,000 | | | | 3,512,760 | |
| Kentucky Higher Education Student Loan Corp. Rev.,“A-1”, 5%, 6/01/2028 | | | 1,150,000 | | | | 1,366,476 | |
| Kentucky Higher Education Student Loan Corp. Rev.,“A-1”, 5%, 6/01/2029 | | | 700,000 | | | | 841,078 | |
| Louisville & Jefferson County, KY, Metro Government College Improvement Rev. (Bellarmine University Project), “A”, 4%, 5/01/2026 | | | 1,190,000 | | | | 1,185,692 | |
| Louisville & Jefferson County, KY, Metro Government College Improvement Rev. (Bellarmine University Project), “A”, 4%, 5/01/2027 | | | 1,105,000 | | | | 1,095,188 | |
| Public Energy Authority of Kentucky, Gas Supply Rev., “B”, 4%, 1/01/2049 (Put Date 1/01/2025) | | | 11,785,000 | | | | 12,244,851 | |
| Public Energy Authority of Kentucky, Gas Supply Rev.,“C-1”, 4%, 12/01/2049 (Put Date 6/01/2025) | | | 15,000,000 | | | | 15,893,100 | |
| Trimble, KY, Pollution Control Rev. (Louisville Gas & Electric Co.), “B”, 2.55%, 11/01/2027 (Put Date 5/03/2021) | | | 8,000,000 | | | | 8,084,400 | |
| University of Kentucky, General Receipts, “A”, 4%, 10/01/2029 | | | 1,000,000 | | | | 1,126,160 | |
| | | | | | | | |
| | | | | | | $ | 80,189,713 | |
32
Portfolio of Investments – continued
| | | | | | | | |
| | |
| Issuer | | Shares/Par | | | Value ($) | |
| Municipal Bonds - continued | | | | | | |
| Louisiana - 1.1% | | | | | | |
| Louisiana Citizens Property Insurance Corp. Rev., AGM, 5%, 6/01/2021 | | $ | 1,460,000 | | | $ | 1,521,962 | |
| Louisiana Citizens Property Insurance Corp. Rev., AGM, 5%, 6/01/2022 | | | 1,165,000 | | | | 1,259,330 | |
| Louisiana Offshore Terminal Authority, Deepwater Port Rev. (Loop LLC Project), “A”, 1.65%, 9/01/2027 (Put Date 12/01/2023) | | | 2,705,000 | | | | 2,665,480 | |
| Louisiana Offshore Terminal Authority, Deepwater Port Rev. (Loop LLC Project), “A”, 1.65%, 9/01/2033 | | | | | | | | |
| (Put Date 12/01/2023) | | | 2,200,000 | | | | 2,165,680 | |
| Louisiana Offshore Terminal Authority, Deepwater Port Rev. (Loop LLC Project), “A”, 1.65%, 9/01/2034 (Put Date 12/01/2023) | | | 1,690,000 | | | | 1,664,278 | |
| Louisiana Tobacco Settlement Authority Rev.,“2013-A”, 5%, 5/15/2023 | | | 2,160,000 | | | | 2,292,602 | |
| New Orleans, LA, Aviation Board General Airport Rev. (North Terminal Project), “B”, 4%, 1/01/2026 | | | 4,105,000 | | | | 4,412,424 | |
| New Orleans, LA, Sewerage Services Rev., 5%, 6/01/2023 | | | 1,480,000 | | | | 1,636,495 | |
| New Orleans, LA, Sewerage Services Rev., 5%, 6/01/2024 | | | 350,000 | | | | 397,789 | |
| New Orleans, LA, Sewerage Services Rev., 5%, 6/01/2026 | | | 735,000 | | | | 859,355 | |
| New Orleans, LA, Sewerage Services Rev., 5%, 6/01/2027 | | | 945,000 | | | | 1,102,910 | |
| New Orleans, LA, Sewerage Services Rev., 5%, 6/01/2029 | | | 1,890,000 | | | | 2,197,673 | |
| Shreveport, LA, Water & Sewer Rev., “B”, AGM, 5%, 12/01/2027 | | | 390,000 | | | | 480,184 | |
| St. Charles Parish, LA, Gulf Zone Opportunity Zone Rev. (Valero Energy Corp.), 4%, 12/01/2040 (Put Date 6/01/2022) | | | 4,335,000 | | | | 4,421,093 | |
| | | | | | | | |
| | | | | | | $ | 27,077,255 | |
| Maine - 0.3% | | | | | | |
| Maine Municipal Bond Bank, “B”, 5%, 11/01/2024 | | $ | 1,000,000 | | | $ | 1,163,050 | |
| Maine Municipal Bond Bank, “B”, 5%, 11/01/2025 | | | 1,000,000 | | | | 1,193,930 | |
| Portland, ME, General Airport Rev., 4%, 7/01/2020 | | | 200,000 | | | | 200,626 | |
| State of Maine, “B”, 5%, 6/01/2020 | | | 5,000,000 | | | | 5,016,000 | |
| | | | | | | | |
| | | | | | | $ | 7,573,606 | |
| Maryland - 1.2% | | | | | | |
| Baltimore, MD, Convention Center Hotel Rev., 5%, 9/01/2024 | | $ | 850,000 | | | $ | 738,089 | |
| Baltimore, MD, Convention Center Hotel Rev., 5%, 9/01/2030 | | | 1,000,000 | | | | 863,320 | |
| Brunswick, MD, Special Obligation (Brunswick Crossing Special Taxing), 3%, 7/01/2020 | | | 385,000 | | | | 384,761 | |
| Brunswick, MD, Special Obligation (Brunswick Crossing Special Taxing), 3%, 7/01/2024 | | | 880,000 | | | | 843,955 | |
| Howard County, MD, Special Obligation (Downtown Columbia Project), “A”, 4%, 2/15/2028 | | | 500,000 | | | | 483,525 | |
| Maryland Community Development Administration, Department of Housing & Community Development Housing Rev., “D”, 4%, 9/01/2036 | | | 1,695,000 | | | | 1,770,834 | |
33
Portfolio of Investments – continued
| | | | | | | | |
| | |
| Issuer | | Shares/Par | | | Value ($) | |
| Municipal Bonds - continued | | | | | | |
| Maryland - continued | | | | | | |
| Maryland Community Development Administration, Department of Housing & Community Development Residential Rev., “C”, 5%, 9/01/2026 | | $ | 160,000 | | | $ | 190,845 | |
| Maryland Community Development Administration, Department of Housing & Community Development Residential Rev., “C”, 5%, 9/01/2027 | | | 245,000 | | | | 298,273 | |
| Maryland Community Development Administration, Department of Housing & Community Development Residential Rev., “C”, 5%, 9/01/2028 | | | 195,000 | | | | 241,675 | |
| Maryland Economic Development Corp. Adjustable Mode Rev. Refunding (Constellation Energy Group, Inc. Project), “B”, 2.55%, 12/01/2025 (Put Date 6/01/2020) | | | 2,710,000 | | | | 2,711,436 | |
| Maryland Economic Development Corp., Student Housing Rev. (University of Maryland College Park), AGM, 4%, 6/01/2024 | | | 1,350,000 | | | | 1,489,631 | |
| Maryland Economic Development Corp., Student Housing Rev. (University of Maryland College Park), AGM, 4%, 6/01/2025 | | | 1,600,000 | | | | 1,799,744 | |
| Maryland Economic Development Corp., Student Housing Rev. (University of Maryland College Park), AGM, 4%, 6/01/2026 | | | 650,000 | | | | 743,087 | |
| Maryland Health & Higher Educational Facilities Authority Rev. (Medstar Health Issue), 5%, 8/15/2025 | | | 3,490,000 | | | | 3,921,992 | |
| Prince George’s County, MD, Public Improvement, “A”, 5%, 9/15/2024 | | | 7,000,000 | | | | 8,160,670 | |
| University System of Maryland, Auxiliary Facility & Tuition Rev., “D”, 5%, 10/01/2022 | | | 1,000,000 | | | | 1,093,340 | |
| Washington Suburban Sanitary District, MD, Consolidated Public Improvement, 5%, 6/01/2021 | | | 5,500,000 | | | | 5,745,520 | |
| | | | | | | | |
| | | | | | | $ | 31,480,697 | |
| Massachusetts - 2.5% | | | | | | |
| Commonwealth of Massachusetts, General Obligation, “B”, 5%, 8/01/2021 | | $ | 6,185,000 | | | $ | 6,502,847 | |
| Massachusetts Development Finance Agency Refunding Rev. (Suffolk University), 5%, 7/01/2026 | | | 475,000 | | | | 513,684 | |
| Massachusetts Development Finance Agency Refunding Rev. (Suffolk University), 5%, 7/01/2027 | | | 600,000 | | | | 653,484 | |
| Massachusetts Development Finance Agency Refunding Rev. (Suffolk University), 5%, 7/01/2028 | | | 520,000 | | | | 569,650 | |
| Massachusetts Development Finance Agency Rev. (Brandeis University),“S-1”, 5%, 10/01/2027 | | | 2,000,000 | | | | 2,423,380 | |
| Massachusetts Development Finance Agency Rev. (Brandeis University),“S-1”, 5%, 10/01/2028 | | | 2,340,000 | | | | 2,873,263 | |
| Massachusetts Development Finance Agency Rev. (Caregroup, Inc.), “I”, 5%, 7/01/2027 | | | 2,435,000 | | | | 2,785,348 | |
34
Portfolio of Investments – continued
| | | | | | | | |
| | |
| Issuer | | Shares/Par | | | Value ($) | |
| Municipal Bonds - continued | | | | | | |
| Massachusetts - continued | | | | | | |
| Massachusetts Development Finance Agency Rev. (Partners Healthcare System), “Q”, 5%, 7/01/2022 | | $ | 2,240,000 | | | $ | 2,403,766 | |
| Massachusetts Development Finance Agency Rev. (Partners Healthcare System), “Q”, 5%, 7/01/2023 | | | 1,375,000 | | | | 1,517,271 | |
| Massachusetts Development Finance Agency Rev. (Sabis International Charter School Issue), 5%, 4/15/2025 | | | 145,000 | | | | 153,278 | |
| Massachusetts Development Finance Agency Rev. (Suffolk University), 5%, 7/01/2025 | | | 1,500,000 | | | | 1,611,465 | |
| Massachusetts Development Finance Agency Rev. (Suffolk University), 5%, 7/01/2026 | | | 1,750,000 | | | | 1,892,520 | |
| Massachusetts Development Finance Agency Rev. (Suffolk University), 5%, 7/01/2027 | | | 2,000,000 | | | | 2,178,280 | |
| Massachusetts Development Finance Agency Rev. (UMass Memorial Health Care Obligated Group), “I”, 5%, 7/01/2024 | | | 1,000,000 | | | | 1,115,060 | |
| Massachusetts Development Finance Agency Rev. (Wellforce), “A”, 5%, 7/01/2025 | | | 1,150,000 | | | | 1,302,846 | |
| Massachusetts Development Finance Agency Rev. (Wellforce), “A”, 5%, 7/01/2026 | | | 1,500,000 | | | | 1,729,710 | |
| Massachusetts Development Finance Agency Rev. (Wellforce), “A”, 5%, 7/01/2027 | | | 1,000,000 | | | | 1,172,430 | |
| Massachusetts Development Finance Agency Rev. (Wellforce), “A”, 5%, 7/01/2028 | | | 780,000 | | | | 921,422 | |
| Massachusetts Development Finance Agency Rev. (Wellforce), “A”, 5%, 7/01/2029 | | | 850,000 | | | | 1,006,391 | |
| Massachusetts Educational Financing Authority, Education Loan Rev., “A”, 5%, 1/01/2021 | | | 5,500,000 | | | | 5,600,320 | |
| Massachusetts Educational Financing Authority, Education Loan Rev., “I”, 5%, 1/01/2025 | | | 3,450,000 | | | | 3,803,763 | |
| Massachusetts Educational Financing Authority, Education Loan Rev., “J”, 5%, 7/01/2020 | | | 4,400,000 | | | | 4,419,404 | |
| Massachusetts Educational Financing Authority, Education Loan Rev., “J”, 3.5%, 7/01/2033 | | | 3,620,000 | | | | 3,676,219 | |
| Massachusetts Educational Financing Authority, Education Loan Rev., “K”, 3.625%, 7/01/2032 | | | 2,370,000 | | | | 2,307,930 | |
| Massachusetts School Building Authority, Sales Tax Rev., “A”, 5%, 8/15/2022 | | | 470,000 | | | | 514,626 | |
| Massachusetts School Building Authority, Sales Tax Rev., “A”, 5%, 8/15/2022 | | | 7,935,000 | | | | 8,629,392 | |
| | | | | | | | |
| | | | | | | $ | 62,277,749 | |
| Michigan - 2.6% | | | | | | |
| Detroit, MI, Downtown Development Authority Subordinate Tax Rev. (General Development Area No. 1 Project), “B”, AGM, 5%, 7/01/2023 | | $ | 1,250,000 | | | $ | 1,385,463 | |
35
Portfolio of Investments – continued
| | | | | | | | |
| | |
| Issuer | | Shares/Par | | | Value ($) | |
| Municipal Bonds - continued | | | | | | |
| Michigan - continued | | | | | | |
| Detroit, MI, Downtown Development Authority Subordinate Tax Rev. (General Development Area No. 1 Project), “B”, AGM, 5%, 7/01/2025 | | $ | 1,000,000 | | | $ | 1,130,390 | |
| Detroit, MI, Downtown Development Authority Tax Rev. (Catalyst Development Project), “A”, AGM, 5%, 7/01/2029 | | | 1,000,000 | | | | 1,120,570 | |
| Flint, MI, Public Library Building & Site Rev., AGM, 3%, 5/01/2022 | | | 1,030,000 | | | | 1,065,144 | |
| Flint, MI, Public Library Building & Site Rev., AGM, 3%, 5/01/2023 | | | 1,045,000 | | | | 1,096,811 | |
| Flint, MI, Public Library Building & Site Rev., AGM, 3%, 5/01/2024 | | | 1,075,000 | | | | 1,141,725 | |
| Flint, MI, Public Library Building & Site Rev., AGM, 3%, 5/01/2025 | | | 675,000 | | | | 723,357 | |
| Flint, MI, Public Library Building & Site Rev., AGM, 3%, 5/01/2026 | | | 1,060,000 | | | | 1,147,704 | |
| Flint, MI, Public Library Building & Site Rev., AGM, 3%, 5/01/2027 | | | 1,095,000 | | | | 1,192,422 | |
| Flint, MI, Public Library Building & Site Rev., AGM, 3%, 5/01/2028 | | | 1,125,000 | | | | 1,233,630 | |
| Michigan Finance Authority (Detroit Financial Recovery Income Tax Rev.), “F”, 3.875%, 10/01/2023 | | | 540,000 | | | | 545,567 | |
| Michigan Finance Authority (Detroit Financial Recovery Income Tax Rev.), “F”, 4%, 10/01/2024 | | | 675,000 | | | | 685,611 | |
| Michigan Finance Authority Local Government Loan Program Rev. (Detroit Water and Sewerage Department Sewage Disposal System Rev. Refunding Second Lien Local Project), “C”, 5%, 7/01/2026 | | | 1,000,000 | | | | 1,166,840 | |
| Michigan Finance Authority Local Government Loan Program Rev. (Detroit Water and Sewerage Department Sewage Disposal System Rev. Second Lien Local Project),“C-7”, NATL, 5%, 7/01/2020 | | | 1,500,000 | | | | 1,509,615 | |
| Michigan Finance Authority Local Government Loan Program Rev. (Detroit Water and Sewerage Department Sewage Disposal System Rev. Second Lien Local Project),“C-7”, NATL, 5%, 7/01/2021 | | | 1,000,000 | | | | 1,044,990 | |
| Michigan Finance Authority Local Government Loan Program Rev. (Detroit Water and Sewerage Department Water Supply System Rev. Refunding Local Project),“D-1”, 5%, 7/01/2021 | | | 400,000 | | | | 418,472 | |
| Michigan Finance Authority Local Government Loan Program Rev. (Detroit Water and Sewerage Department Water Supply System Rev. Second Lien Local Project),“D-1”, AGM, 5%, 7/01/2020 | | | 1,500,000 | | | | 1,510,275 | |
| Michigan Finance Authority Local Government Loan Program Rev. (Detroit Water and Sewerage Department Water Supply System Rev. Senior Lien Local Project),“D-1”, AGM, 5%, 7/01/2021 | | | 3,500,000 | | | | 3,661,630 | |
| Michigan Finance Authority, Hospital Rev. (Trinity Health Credit Group), 5%, 12/01/2044 (Put Date 2/01/2025) | | | 10,000,000 | | | | 11,501,900 | |
| Michigan Housing Development Authority, Single Family Mortgage Rev., “C”, 2.05%, 12/01/2022 | | | 1,000,000 | | | | 1,007,550 | |
| Michigan Strategic Fund Ltd. Obligation Rev. (Detroit Edison Co.), 5.625%, 7/01/2020 | | | 1,000,000 | | | | 1,007,230 | |
36
Portfolio of Investments – continued
| | | | | | | | |
| | |
| Issuer | | Shares/Par | | | Value ($) | |
| Municipal Bonds - continued | | | | | | |
| Michigan - continued | | | | | | |
| Michigan Strategic Fund Ltd. Obligation Rev.(I-75 Improvement Project), 5%, 12/31/2027 | | $ | 2,000,000 | | | $ | 2,220,280 | |
| Michigan Strategic Fund Ltd. Obligation Rev.(I-75 Improvement Project), 5%, 6/30/2028 | | | 3,000,000 | | | | 3,339,360 | |
| Michigan Strategic Fund Ltd. Obligation Rev.(I-75 Improvement Project), 5%, 12/31/2028 | | | 3,000,000 | | | | 3,350,190 | |
| Royal Oak, MI, Hospital Finance Authority Rev. (William Beaumont Hospital), “D”, 5%, 9/01/2021 | | | 2,460,000 | | | | 2,588,486 | |
| Royal Oak, MI, Hospital Finance Authority Rev. (William Beaumont Hospital), “D”, 5%, 9/01/2031 | | | 5,160,000 | | | | 5,569,807 | |
| Saginaw, MI, Hospital Finance Authority Rev. (Covenant Medical Center, Inc.), “J”, 5%, 7/01/2027 | | | 1,000,000 | | | | 1,183,990 | |
| Saginaw, MI, Hospital Finance Authority Rev. (Covenant Medical Center, Inc.), “J”, 5%, 7/01/2028 | | | 1,125,000 | | | | 1,352,858 | |
| Saginaw, MI, Hospital Finance Authority Rev. (Covenant Medical Center, Inc.), “J”, 5%, 7/01/2029 | | | 1,000,000 | | | | 1,217,050 | |
| Saginaw, MI, Hospital Finance Authority Rev. (Covenant Medical Center, Inc.), “J”, 5%, 7/01/2030 | | | 500,000 | | | | 614,250 | |
| Wayne County, MI, Airport Authority Rev. (Detroit Metropolitan Wayne County Airport), “D”, 5%, 12/01/2024 | | | 250,000 | | | | 284,035 | |
| Wayne County, MI, Airport Authority Rev. (Detroit Metropolitan Wayne County Airport), “D”, 5%, 12/01/2025 | | | 350,000 | | | | 405,486 | |
| Wayne County, MI, Airport Authority Rev. (Detroit Metropolitan Wayne County Airport), “D”, 5%, 12/01/2026 | | | 1,745,000 | | | | 2,013,992 | |
| Wayne County, MI, Airport Authority Rev. (Detroit Metropolitan Wayne County Airport), “D”, 5%, 12/01/2027 | | | 2,775,000 | | | | 3,242,754 | |
| Wayne County, MI, Airport Authority Rev. (Detroit Metropolitan Wayne County Airport), “D”, 5%, 12/01/2028 | | | 2,595,000 | | | | 3,059,816 | |
| Wayne County, MI, Airport Authority Rev. (Detroit Metropolitan Wayne County Airport), “G”, 5%, 12/01/2023 | | | 400,000 | | | | 443,968 | |
| | | | | | | | |
| | | | | | | $ | 66,183,218 | |
| Minnesota - 0.8% | | | | | | |
| Duluth, MN, Independent School District No. 709, “A”, COP, 3%, 3/01/2021 | | $ | 390,000 | | | $ | 385,269 | |
| Duluth, MN, Independent School District No. 709, “A”, COP, 3%, 3/01/2022 | | | 610,000 | | | | 593,182 | |
| Duluth, MN, Independent School District No. 709, “A”, COP, 3%, 3/01/2023 | | | 630,000 | | | | 601,467 | |
| Duluth, MN, Independent School District No. 709, “A”, COP, 3.25%, 3/01/2024 | | | 650,000 | | | | 613,405 | |
| Duluth, MN, Independent School District No. 709, “A”, COP, 3.25%, 3/01/2025 | | | 675,000 | | | | 624,503 | |
37
Portfolio of Investments – continued
| | | | | | | | |
| | |
| Issuer | | Shares/Par | | | Value ($) | |
| Municipal Bonds - continued | | | | | | |
| Minnesota - continued | | | | | | |
| Duluth, MN, Independent School District No. 709, “A”, COP, 4%, 3/01/2027 | | $ | 730,000 | | | $ | 690,346 | |
| Duluth, MN, Independent School District No. 709, “A”, COP, 4%, 3/01/2028 | | | 765,000 | | | | 719,353 | |
| Duluth, MN, Independent School District No. 709, “A”, COP, STAPRP, 5%, 2/01/2025 | | | 135,000 | | | | 156,344 | |
| Duluth, MN, Independent School District No. 709, “B”, COP, STAPRP, 5%, 2/01/2026 | | | 430,000 | | | | 509,038 | |
| Duluth, MN, Independent School District No. 709, “B”, COP, STAPRP, 5%, 2/01/2028 | | | 125,000 | | | | 153,693 | |
| Duluth, MN, Independent School District No. 709, “A”, COP, 5%, 2/01/2025 | | | 500,000 | | | | 579,050 | |
| Minneapolis-St. Paul, MN, Metropolitan Airports Commission, Senior Airport Rev., “C”, 5%, 1/01/2025 | | | 250,000 | | | | 283,730 | |
| Minneapolis-St. Paul, MN, Metropolitan Airports Commission, Senior Airport Rev., “C”, 5%, 1/01/2026 | | | 200,000 | | | | 231,394 | |
| Minneapolis-St. Paul, MN, Metropolitan Airports Commission, Subordinate Airport Rev., “B”, 5%, 1/01/2021 | | | 2,000,000 | | | | 2,039,660 | |
| Minnesota Office of Higher Education Supplemental Student Loan Program Rev., 5%, 11/01/2023 | | | 500,000 | | | | 551,315 | |
| Minnesota Office of Higher Education Supplemental Student Loan Program Rev., 5%, 11/01/2024 | | | 615,000 | | | | 693,449 | |
| Minnesota Office of Higher Education Supplemental Student Loan Program Rev., 5%, 11/01/2025 | | | 850,000 | | | | 978,809 | |
| Minnesota Office of Higher Education Supplemental Student Loan Program Rev., 5%, 11/01/2026 | | | 700,000 | | | | 821,058 | |
| Minnesota Office of Higher Education Supplemental Student Loan Program Rev., 5%, 11/01/2027 | | | 700,000 | | | | 836,024 | |
| Minnesota Office of Higher Education Supplemental Student Loan Program Rev., 4%, 11/01/2037 | | | 3,215,000 | | | | 3,381,216 | |
| State of Minnesota, “B”, 5%, 8/01/2021 | | | 5,000,000 | | | | 5,258,900 | |
| | | | | | | | |
| | | | | | | $ | 20,701,205 | |
| Mississippi - 2.6% | | | | | | |
| Gulfport, MS, Hospital Facilities Rev. (Memorial Hospital at Gulfport Project), 5%, 7/01/2024 | | $ | 2,065,000 | | | $ | 2,302,599 | |
| Gulfport, MS, Hospital Facilities Rev. (Memorial Hospital at Gulfport Project), 5%, 7/01/2025 | | | 3,590,000 | | | | 4,067,147 | |
| Gulfport, MS, Hospital Facilities Rev. (Memorial Hospital at Gulfport Project), 5%, 7/01/2026 | | | 2,485,000 | | | | 2,865,553 | |
| Gulfport, MS, Hospital Facilities Rev. (Memorial Hospital at Gulfport Project), 5%, 7/01/2027 | | | 1,395,000 | | | | 1,604,320 | |
| Jackson, MS, Water & Sewer System Rev., BAM, 4%, 9/01/2020 | | | 625,000 | | | | 630,238 | |
38
Portfolio of Investments – continued
| | | | | | | | |
| | |
| Issuer | | Shares/Par | | | Value ($) | |
| Municipal Bonds - continued | | | | | | |
| Mississippi - continued | | | | | | |
| Mississippi Business Finance Corp., Rev. (System Energy Resources, Inc. Project), 2.5%, 4/01/2022 | | $ | 10,000,000 | | | $ | 10,029,300 | |
| Mississippi Development Bank Special Obligation (Gulfport Public Improvement Project), BAM, 5%, 11/01/2030 | | | 1,745,000 | | | | 2,100,614 | |
| Mississippi Development Bank Special Obligation (Magnolia Regional Health Center Project), “A”, 5%, 10/01/2020 | | | 660,000 | | | | 656,720 | |
| Mississippi Development Bank Special Obligation (Magnolia Regional Health Center Project), “A”, 5.5%, 10/01/2021 | | | 1,165,000 | | | | 1,153,606 | |
| Mississippi Development Bank Special Obligation (Magnolia Regional Health Center Project), “A”, 5.5%, 10/01/2022 | | | 585,000 | | | | 575,277 | |
| Mississippi Development Bank Special Obligation (Magnolia Regional Health Center Project), “A”, 6%, 10/01/2023 | | | 700,000 | | | | 694,337 | |
| Mississippi Development Bank Special Obligation (Marshall County Industrial Development Authority Mississippi Highway Construction Project), 5%, 1/01/2021 | | | 1,685,000 | | | | 1,728,978 | |
| Mississippi Development Bank Special Obligation (Municipal Energy Agency Power Supply Project), “A”, AGM, 5%, 3/01/2023 | | | 1,000,000 | | | | 1,090,610 | |
| Mississippi Gaming Tax Rev., “A”, 5%, 10/15/2024 | | | 750,000 | | | | 830,017 | |
| Mississippi Gaming Tax Rev., “A”, 5%, 10/15/2028 | | | 1,400,000 | | | | 1,631,350 | |
| Mississippi Home Corp., Multi-Family Housing Rev. (Gateway Affordable Communities Project), 2.4%, 2/01/2022 (Put Date 8/01/2021) | | | 5,000,000 | | | | 5,101,750 | |
| Mississippi Hospital Equipment & Facilities Authority Rev. (Baptist Memorial Healthcare), “A”, 5%, 9/01/2022 | | | 7,000,000 | | | | 7,480,060 | |
| Mississippi Hospital Equipment & Facilities Authority Rev. (Baptist Memorial Healthcare),“B-2”, 1.07%, 9/01/2022 (Put Date 6/01/2020) | | | 5,000,000 | | | | 4,999,650 | |
| Mississippi Hospital Equipment & Facilities Authority Rev. (North Mississippi Health Services), “I”, 5%, 10/01/2025 | | | 530,000 | | | | 593,452 | |
| Mississippi Hospital Equipment & Facilities Authority Rev. (North Mississippi Health Services), “I”, 5%, 10/01/2026 | | | 625,000 | | | | 711,462 | |
| Mississippi Hospital Equipment & Facilities Authority Rev. (North Mississippi Health Services), “I”, 5%, 10/01/2027 | | | 800,000 | | | | 926,240 | |
| Mississippi Hospital Equipment & Facilities Authority Rev. (North Mississippi Health Services), “I”, 5%, 10/01/2028 | | | 975,000 | | | | 1,147,711 | |
| Mississippi Hospital Equipment & Facilities Authority Rev. (North Mississippi Health Services), “I”, 5%, 10/01/2029 | | | 400,000 | | | | 476,864 | |
| Mississippi Hospital Equipment & Facilities Authority Rev. (North Mississippi Health Services), “I”, 5%, 10/01/2040 (Put Date 3/01/2027) | | | 5,040,000 | | | | 5,947,704 | |
| State of Mississippi, “B”, 5%, 12/01/2025 | | | 415,000 | | | | 495,535 | |
| Warren County, MS, Gulf Opportunity Zone Rev. (International Paper Company Project), 2.9%, 9/01/2032 (Put Date 9/01/2023) | | | 4,000,000 | | | | 3,994,880 | |
39
Portfolio of Investments – continued
| | | | | | | | |
| | |
| Issuer | | Shares/Par | | | Value ($) | |
| Municipal Bonds - continued | | | | | | |
| Mississippi - continued | | | | | | |
| West Rankin, MS, Utility Authority Rev., AGM, 5%, 1/01/2024 | | $ | 400,000 | | | $ | 452,620 | |
| West Rankin, MS, Utility Authority Rev., AGM, 5%, 1/01/2025 | | | 585,000 | | | | 680,642 | |
| West Rankin, MS, Utility Authority Rev., AGM, 5%, 1/01/2026 | | | 525,000 | | | | 607,430 | |
| | | | | | | | |
| | | | | | | $ | 65,576,666 | |
| Missouri - 1.0% | | | | | | |
| Kansas City, MO, Industrial Development Authority, Airport Special Obligation Bonds (International Airport Terminal Modernization Project), “B”, 5%, 3/01/2029 | | $ | 4,000,000 | | | $ | 4,727,840 | |
| Kansas City, MO, Industrial Development Authority, Airport Special Obligation Bonds (International Airport Terminal Modernization Project), “B”, 5%, 3/01/2030 | | | 2,000,000 | | | | 2,339,060 | |
| Kansas City, MO, Industrial Development Authority, Airport Special Obligation Bonds (International Airport Terminal Modernization Project), “B”, 5%, 3/01/2031 | | | 1,250,000 | | | | 1,449,100 | |
| Missouri Health & Educational Facilities Authority Rev. (Lutheran Senior Services Projects), “A”, 5%, 2/01/2021 | | | 565,000 | | | | 567,492 | |
| Missouri Health & Educational Facilities Authority Rev. (Lutheran Senior Services Projects), “A”, 5%, 2/01/2022 | | | 550,000 | | | | 554,884 | |
| Missouri Health & Educational Facilities Authority Rev. (Lutheran Senior Services Projects), “A”, 5%, 2/01/2025 | | | 215,000 | | | | 218,244 | |
| Missouri Health & Educational Facilities Authority Rev. (Mercy Health), “A”, 5%, 6/01/2027 | | | 2,500,000 | | | | 3,010,350 | |
| Missouri Health & Educational Facilities Authority Rev. (Mercy Health), “A”, 5%, 6/01/2028 | | | 7,820,000 | | | | 9,587,711 | |
| Wentzville, MO, School DistrictR-IV, General Obligation Refunding & Improvement Rev. (Missouri Direct Deposit Program), 4%, 3/01/2029 | | | 1,555,000 | | | | 1,809,414 | |
| | | | | | | | |
| | | | | | | $ | 24,264,095 | |
| Nebraska - 0.5% | | | | | | |
| Central Plains Energy Project, NE, Gas Project Rev. (Project No. 3), 5%, 9/01/2020 | | $ | 1,710,000 | | | $ | 1,724,945 | |
| Central Plains Energy Project, NE, Gas Project Rev. (Project No. 3), 5%, 9/01/2021 | | | 2,000,000 | | | | 2,067,200 | |
| Central Plains Energy Project, NE, Gas Project Rev. (Project No. 4), 5%, 3/01/2050 (Put Date 1/01/2024) | | | 8,500,000 | | | | 9,168,525 | |
| | | | | | | | |
| | | | | | | $ | 12,960,670 | |
| Nevada - 0.5% | | | | | | |
| Director of the State of Nevada, Department of Business and Industry, Solid Waste Disposal Rev. (Republic Services, Inc. Project), 1.47%, 12/01/2026 (Put Date 6/01/2020) | | $ | 900,000 | | | $ | 899,910 | |
| Sparks, NV, Tourism Improvement District No. 1 Rev. (Legends at Sparks Marina), “A”, 2.5%, 6/15/2024 (n) | | | 420,000 | | | | 404,027 | |
40
Portfolio of Investments – continued
| | | | | | | | |
| | |
| Issuer | | Shares/Par | | | Value ($) | |
| Municipal Bonds - continued | | | | | | |
| Nevada - continued | | | | | | |
| Washoe County, NV, Water Facilities Rev. (Sierra Pacific Power Projects), “F”, 2.05%, 3/01/2036 (Put Date 4/15/2022) | | $ | 10,250,000 | | | $ | 10,319,905 | |
| | | | | | | | |
| | | | | | | $ | 11,623,842 | |
| New Hampshire - 0.7% | | | | | | |
| National Finance Authority, New Hampshire Resource Recovery Refunding Rev. (Emerald Renewable Diesel LLC Project), 2%, 6/01/2049 (Put Date 8/31/2020) (n) | | $ | 9,470,000 | | | $ | 9,480,985 | |
| New Hampshire Business Finance Authority, Pollution Control Rev. (United Illuminating Company Project), “A”, 2.8%, 10/01/2033 (Put Date 10/02/2023) | | | 5,000,000 | | | | 5,136,400 | |
| New Hampshire Health & Education Facilities Authority Rev. (Memorial Hospital), 5.25%, 6/01/2026 | | | 3,560,000 | | | | 3,898,449 | |
| | | | | | | | |
| | | | | | | $ | 18,515,834 | |
| New Jersey - 5.6% | | | | | | |
| Atlantic City, NJ, Tax Appeal Refunding Rev., “A”, BAM, 5%, 3/01/2024 | | $ | 345,000 | | | $ | 388,132 | |
| Atlantic City, NJ, Tax Appeal Refunding Rev., “A”, BAM, 5%, 3/01/2027 | | | 200,000 | | | | 241,076 | |
| City of Trenton, NJ, General Obligation Refunding, AGM, 4%, 7/15/2022 | | | 1,325,000 | | | | 1,403,241 | |
| City of Trenton, NJ, General Obligation Refunding, AGM, 4%, 7/15/2023 | | | 1,000,000 | | | | 1,082,720 | |
| New Jersey Building Authority, State Building Rev. Unrefunded Balance, “A”, BAM, 5%, 6/15/2025 | | | 1,205,000 | | | | 1,296,942 | |
| New Jersey Building Authority, State Building Rev. Unrefunded Balance, “A”, BAM, 5%, 6/15/2026 | | | 900,000 | | | | 977,571 | |
| New Jersey Building Authority, State Building Rev., “A”, ETM, BAM, 5%, 6/15/2025 | | | 795,000 | | | | 951,822 | |
| New Jersey Building Authority, State Building Rev., “A”, ETM, BAM, 5%, 6/15/2026 | | | 600,000 | | | | 739,584 | |
| New Jersey Casino Reinvestment Development Authority, Luxury Tax Rev., 5%, 11/01/2020 | | | 1,000,000 | | | | 1,006,810 | |
| New Jersey Casino Reinvestment Development Authority, Luxury Tax Rev., 5%, 11/01/2021 | | | 2,465,000 | | | | 2,511,835 | |
| New Jersey Casino Reinvestment Development Authority, Luxury Tax Rev., AGM, 5%, 11/01/2024 | | | 1,000,000 | | | | 1,133,080 | |
| New Jersey Economic Development Authority Refunding Rev. (Provident Group - Montclair Properties LLC - Montclair State University Student Housing Project), ASSD GTY, 5%, 6/01/2025 | | | 1,000,000 | | | | 1,165,080 | |
| New Jersey Economic Development Authority Refunding Rev. (Provident Group - Montclair Properties LLC - Montclair State University Student Housing Project), ASSD GTY, 5%, 6/01/2026 | | | 1,000,000 | | | | 1,189,520 | |
41
Portfolio of Investments – continued
| | | | | | | | |
| | |
| Issuer | | Shares/Par | | | Value ($) | |
| Municipal Bonds - continued | | | | | | |
| New Jersey - continued | | | | | | |
| New Jersey Economic Development Authority Rev. (Goethals Bridge Replacement Project), 5%, 7/01/2020 | | $ | 500,000 | | | $ | 501,030 | |
| New Jersey Economic Development Authority Rev. (Goethals Bridge Replacement Project), 5%, 1/01/2021 | | | 300,000 | | | | 302,538 | |
| New Jersey Economic Development Authority Rev. (Goethals Bridge Replacement Project), 5%, 7/01/2021 | | | 425,000 | | | | 431,167 | |
| New Jersey Economic Development Authority Rev. (Provident Group - Rowan Properties LLC - Rowan University Student Housing Project), “A”, 5%, 1/01/2021 | | | 95,000 | | | | 96,890 | |
| New Jersey Economic Development Authority Rev. (Provident Group - Rowan Properties LLC - Rowan University Student Housing Project), “A”, 5%, 1/01/2022 | | | 560,000 | | | | 587,065 | |
| New Jersey Economic Development Authority Rev. (Provident Group - Rowan Properties LLC - Rowan University Student Housing Project), “A”, 5%, 1/01/2023 | | | 640,000 | | | | 663,053 | |
| New Jersey Economic Development Authority Rev., School Facilities Construction, “DDD”, 5%, 6/15/2025 | | | 1,610,000 | | | | 1,666,189 | |
| New Jersey Economic Development Authority Rev., School Facilities Construction, “DDD”, 5%, 6/15/2026 | | | 2,000,000 | | | | 2,073,960 | |
| New Jersey Economic Development Authority Rev., School Facilities Construction, “DDD”, 5%, 6/15/2027 | | | 1,500,000 | | | | 1,556,760 | |
| New Jersey Economic Development Authority Rev., School Facilities Construction, “DDD”, 5%, 6/15/2028 | | | 3,000,000 | | | | 3,097,140 | |
| New Jersey Economic Development Authority Rev., School Facilities Construction, “XX”, 5%, 6/15/2021 | | | 1,005,000 | | | | 1,020,407 | |
| New Jersey Economic Development Authority Rev., School Facilities Construction, Capital Appreciation, “DDD”, AGM, 0%, 12/15/2026 | | | 9,445,000 | | | | 7,817,910 | |
| New Jersey Economic Development Authority, State Lease Rev. (State House Project), “B”, 5%, 6/15/2026 | | | 1,085,000 | | | | 1,125,123 | |
| New Jersey Economic Development Motor Vehicle Surcharges Subordinate Refunding Rev., “A”, 3.125%, 7/01/2029 | | | 810,000 | | | | 738,461 | |
| New Jersey Economic Development Motor Vehicle Surcharges Subordinate Refunding Rev., “A”, BAM, 5%, 7/01/2027 | | | 8,495,000 | | | | 9,308,396 | |
| New Jersey Economic Development Motor Vehicle Surcharges Subordinate Refunding Rev., “A”, BAM, 5%, 7/01/2028 | | | 6,885,000 | | | | 7,471,740 | |
| New Jersey Health Care Facilities, Financing Authority Rev. (University Hospital), “A”, AGM, 5%, 7/01/2023 | | | 1,615,000 | | | | 1,696,880 | |
| New Jersey Health Care Facilities, Financing Authority Rev. (University Hospital), “A”, AGM, 5%, 7/01/2024 | | | 2,150,000 | | | | 2,286,052 | |
| New Jersey Health Care Facilities, Financing Authority Rev. (University Hospital), “A”, AGM, 5%, 7/01/2026 | | | 1,420,000 | | | | 1,521,274 | |
42
Portfolio of Investments – continued
| | | | | | | | |
| | |
| Issuer | | Shares/Par | | | Value ($) | |
| Municipal Bonds - continued | | | | | | |
| New Jersey - continued | | | | | | |
| New Jersey Health Care Facilities, Financing Authority, State Contract Refunding Bonds (Hospital Asset Transformation Program), 5%, 10/01/2027 | | $ | 2,000,000 | | | $ | 2,040,800 | |
| New Jersey Higher Education Student Assistance Authority, Senior Student Loan Rev., “1B”, 2.95%, 12/01/2028 | | | 3,490,000 | | | | 3,410,428 | |
| New Jersey Higher Education Student Assistance Authority, Senior Student Loan Rev., “A”, 2.375%, 12/01/2029 | | | 10,000,000 | | | | 9,319,200 | |
| New Jersey Housing and Mortgage Finance Agency, Multi-Family Conduit Rev. (Pilgrim Baptist Village I & II), “E”, 1.5%, 9/01/2022 (Put Date 9/01/2021) | | | 5,000,000 | | | | 5,011,350 | |
| New Jersey Housing and Mortgage Finance Agency, Multi-Family Conduit Rev. (Riverside Village Family Apartments (Phase I) Project), “F”, HUD Section 8, 1.35%, 12/01/2022 | | | 5,300,000 | | | | 5,290,831 | |
| New Jersey Tobacco Settlement Financing Corp., “A”, 5%, 6/01/2023 | | | 1,750,000 | | | | 1,900,972 | |
| New Jersey Tobacco Settlement Financing Corp., “B”, 3.2%, 6/01/2027 | | | 8,495,000 | | | | 8,474,952 | |
| New Jersey Transportation Trust Fund Authority, “B”, AAC, 5.5%, 9/01/2026 | | | 1,985,000 | | | | 2,130,897 | |
| New Jersey Transportation Trust Fund Authority, Federal Highway Reimbursement Rev., “A”, 5%, 6/15/2024 | | | 4,000,000 | | | | 4,286,000 | |
| New Jersey Transportation Trust Fund Authority, Federal Highway Reimbursement Rev.,“A-1”, 5%, 6/15/2027 | | | 470,000 | | | | 508,366 | |
| New Jersey Transportation Trust Fund Authority, Federal Highway Reimbursement Rev.,“A-2”, 5%, 6/15/2020 | | | 5,000,000 | | | | 5,013,000 | |
| New Jersey Transportation Trust Fund Authority, Transportation Program (SIFMA Index Multimodal Notes),“BB-2”, FLR, 1.42% (SIFMA + 1.2%), 6/15/2034 (Put Date 12/15/2021) | | | 10,000,000 | | | | 9,995,100 | |
| New Jersey Transportation Trust Fund Authority, Transportation System, “A”, NATL, 5.75%, 6/15/2023 | | | 1,010,000 | | | | 1,062,055 | |
| New Jersey Transportation Trust Fund Authority, Transportation System, “B”, AAC, 5.25%, 12/15/2023 | | | 155,000 | | | | 161,437 | |
| New Jersey Transportation Trust Fund Authority, Transportation System, “B”, NATL, 5.5%, 12/15/2020 | | | 1,910,000 | | | | 1,935,250 | |
| New Jersey Transportation Trust Fund Authority, Transportation System, “B”, NATL, 5.5%, 12/15/2021 | | | 5,000,000 | | | | 5,149,050 | |
| New Jersey Transportation Trust Fund Authority, Transportation System, Capital Appreciation, “C”, AAC, 0%, 12/15/2028 | | | 6,610,000 | | | | 4,855,177 | |
| New Jersey Transportation Trust Fund Authority, Transportation System, Capital Appreciation, “C”, AGM, 0%, 12/15/2032 | | | 1,890,000 | | | | 1,277,602 | |
| New Jersey Transportation Trust Fund Authority, Transportation System, Capital Appreciation, “C”, NATL, 0%, 12/15/2027 | | | 3,780,000 | | | | 2,985,784 | |
| Newark, NJ, Housing Authority Rev. (South Ward Police Facility), AGM, 5%, 12/01/2024 | | | 1,440,000 | | | | 1,646,914 | |
43
Portfolio of Investments – continued
| | | | | | | | |
| | |
| Issuer | | Shares/Par | | | Value ($) | |
| Municipal Bonds - continued | | | | | | |
| New Jersey - continued | | | | | | |
| Newark, NJ, Housing Authority Rev. (South Ward Police Facility), AGM, 5%, 12/01/2025 | | $ | 1,850,000 | | | $ | 2,164,574 | |
| Newark, NJ, Housing Authority Rev. (South Ward Police Facility), AGM, 5%, 12/01/2026 | | | 1,725,000 | | | | 2,061,427 | |
| South Jersey, NJ, Transportation Authority System Rev., “A”, AGM, 5%, 11/01/2029 | | | 1,750,000 | | | | 1,985,550 | |
| | | | | | | | |
| | | | | | | $ | 140,716,164 | |
| New Mexico - 0.0% | | | | | | |
| Clayton, NM, Jail Project Improvement Rev., NATL, 5%, 11/01/2029 | | $ | 1,000,000 | | | $ | 1,140,940 | |
| | |
| New York - 5.5% | | | | | | |
| Guilderland, NY, Central School District Rev., “A”, 2.25%, 7/10/2020 | | $ | 1,825,000 | | | $ | 1,828,559 | |
| Hempstead, NY, Local Development Corp. Rev. (Adelphi University Project), 5%, 6/01/2022 | | | 1,140,000 | | | | 1,176,982 | |
| Metropolitan Transportation Authority Rev., NY, Anticipation Note,“A-1”, 5%, 2/01/2023 | | | 20,000,000 | | | | 19,922,600 | |
| Metropolitan Transportation Authority Rev., NY, Anticipation Note,“B-1”, 5%, 5/15/2022 | | | 12,375,000 | | | | 12,311,393 | |
| Metropolitan Transportation Authority Rev., NY, Anticipation Note,“D-1”, 5%, 9/01/2022 | | | 7,625,000 | | | | 7,580,394 | |
| Nassau County, NY, Local Economic Assistance Corp. Rev. (Catholic Health Services of Long Island Obligated Group Project), 5%, 7/01/2020 | | | 1,000,000 | | | | 1,005,310 | |
| New Rochelle, NY, Corp. for Local Development Rev. (Iona College Project), “A”, 5%, 7/01/2021 | | | 200,000 | | | | 209,116 | |
| New Rochelle, NY, Corp. for Local Development Rev. (Iona College Project), “A”, 5%, 7/01/2022 | | | 250,000 | | | | 262,818 | |
| New York Dormitory Authority Rev. (Orange Regional Medical Center Obligated Group Rev.), 5%, 12/01/2023 | | | 1,300,000 | | | | 1,405,352 | |
| New York Dormitory Authority Rev. (Orange Regional Medical Center Obligated Group Rev.), 5%, 12/01/2025 | | | 2,400,000 | | | | 2,679,648 | |
| New York Energy Research & Development Authority, Pollution Control Rev. (New York Electric & Gas Corp.), “D”, 3.5%, 10/01/2029 | | | 3,370,000 | | | | 3,652,136 | |
| New York Energy Research & Development Authority, Pollution Control Rev. (Rochester Gas & Electric Corp.), “A”, 3%, 8/01/2032 (Put Date 7/01/2025) | | | 11,125,000 | | | | 11,736,875 | |
| New York Environmental Facilities Corp. Rev., “C”, 5%, 5/15/2020 | | | 3,395,000 | | | | 3,399,549 | |
| New York Environmental Facilities Corp. Rev., “C”, ETM, 5%, 11/15/2020 | | | 5,000 | | | | 5,114 | |
44
Portfolio of Investments – continued
| | | | | | | | |
| | |
| Issuer | | Shares/Par | | | Value ($) | |
| Municipal Bonds - continued | | | | | | |
| | |
| New York - continued | | | | | | |
| New York Environmental Facilities Corp. Rev., Unrefunded Balance, “C”, 5%, 11/15/2020 | | $ | 2,820,000 | | | $ | 2,885,480 | |
| New York Transportation Development Corp., Special Facilities Rev. (Delta Airlines, Inc. LaGuardia Airport Terminals C&D Redevelopment Project), 5%, 1/01/2025 | | | 11,030,000 | | | | 11,085,040 | |
| New York Transportation Development Corp., Special Facilities Rev. (Delta Airlines, Inc. LaGuardia Airport Terminals C&D Redevelopment Project), 5%, 1/01/2028 | | | 3,965,000 | | | | 3,974,357 | |
| New York, NY, “I”, 5%, 8/01/2022 | | | 7,500,000 | | | | 8,073,000 | |
| New York, NY, City Housing Development Corp., Multi-Family Housing Rev.,“K-1-A”, 3.05%, 11/01/2027 | | | 5,195,000 | | | | 5,313,758 | |
| New York, NY, Transitional Finance Authority Rev.,“G-5”, VRDN, 0.12%, 5/01/2034 | | | 10,000,000 | | | | 10,000,000 | |
| Oneida County, NY, Local Development Corp. Rev. (Mohawk Valley Health System Project), “A”, AGM, 5%, 12/01/2026 | | | 1,625,000 | | | | 1,807,991 | |
| Oneida County, NY, Local Development Corp. Rev. (Mohawk Valley Health System Project), “A”, AGM, 5%, 12/01/2027 | | | 1,425,000 | | | | 1,582,719 | |
| Oneida County, NY, Local Development Corp. Rev. (Mohawk Valley Health System Project), “A”, AGM, 5%, 12/01/2028 | | | 1,000,000 | | | | 1,108,080 | |
| Oneida County, NY, Local Development Corp. Rev. (Mohawk Valley Health System Project), “A”, AGM, 5%, 12/01/2029 | | | 175,000 | | | | 193,330 | |
| Port Authority of NY & NJ (207th Series), 5%, 9/15/2027 | | | 1,755,000 | | | | 2,070,584 | |
| Poughkeepsie, NY, Anticipation Notes, “A”, 3%, 5/02/2020 | | | 510,000 | | | | 510,000 | |
| Poughkeepsie, NY, Public Improvement, 5%, 6/01/2020 | | | 1,655,000 | | | | 1,659,253 | |
| Poughkeepsie, NY, Public Improvement, 5%, 6/01/2021 | | | 2,040,000 | | | | 2,070,947 | |
| Poughkeepsie, NY, Public Improvement, 5%, 6/01/2022 | | | 1,070,000 | | | | 1,095,894 | |
| Poughkeepsie, NY, Public Improvement, 5%, 6/01/2023 | | | 1,125,000 | | | | 1,158,536 | |
| Poughkeepsie, NY, Public Improvement, 5%, 6/01/2024 | | | 465,000 | | | | 479,299 | |
| Poughkeepsie, NY, Public Improvement, 5%, 6/01/2025 | | | 235,000 | | | | 243,178 | |
| Suffolk County, NY, “B”, AGM, 5%, 10/15/2025 | | | 7,000,000 | | | | 8,251,180 | |
| Suffolk County, NY, “A”, BAM, 5%, 4/01/2027 | | | 2,360,000 | | | | 2,875,282 | |
| Tobacco Settlement Asset Securitization Corp., NY, “1”, 5%, 6/01/2025 | | | 1,000,000 | | | | 1,114,530 | |
| Tobacco Settlement Asset Securitization Corp., NY, “1”, 5%, 6/01/2026 | | | 2,000,000 | | | | 2,262,500 | |
| Tobacco Settlement Asset Securitization Corp., NY, “1”, 5%, 6/01/2027 | | | 1,500,000 | | | | 1,718,820 | |
| | | | | | | | |
| | | | | | | $ | 138,709,604 | |
| North Carolina - 0.9% | | | | | | |
| Charlotte, NC, COP (Convention Facility Project), “A”, 5%, 12/01/2020 | | $ | 4,100,000 | | | $ | 4,200,983 | |
| New Hanover County, NC, General Obligation School, 5%, 9/01/2024 | | | 2,615,000 | | | | 3,046,318 | |
45
Portfolio of Investments – continued
| | | | | | | | |
| | |
| Issuer | | Shares/Par | | | Value ($) | |
| Municipal Bonds - continued | | | | | | |
| North Carolina - continued | | | | | | |
| New Hanover County, NC, General Obligation School, 5%, 9/01/2025 | | $ | 2,140,000 | | | $ | 2,564,811 | |
| North Carolina Capital Facilities Finance Agency Student Housing Rev. (NCA&T University Foundation LLC Project), “A”, ASSD GTY, 5%, 6/01/2022 | | | 665,000 | | | | 704,434 | |
| North Carolina Capital Facilities Finance Agency Student Housing Rev. (NCA&T University Foundation LLC Project), “A”, ASSD GTY, 5%, 6/01/2023 | | | 325,000 | | | | 352,414 | |
| North Carolina Capital Facilities Finance Agency Student Housing Rev. (NCA&T University Foundation LLC Project), “A”, ASSD GTY, 5%, 6/01/2024 | | | 700,000 | | | | 775,677 | |
| North Carolina Turnpike Authority, Triangle Expressway System Turnpike Rev., AGM, 5%, 1/01/2026 | | | 1,500,000 | | | | 1,719,900 | |
| North Carolina Turnpike Authority, Triangle Expressway System Turnpike Rev., AGM, 5%, 1/01/2027 | | | 4,000,000 | | | | 4,668,120 | |
| Orange County, NC, Public Facilities Co., Limited Obligation, 5%, 10/01/2020 | | | 500,000 | | | | 508,725 | |
| Raleigh Durham, NC, Airport Authority Rev., “A”, 5%, 5/01/2025 | | | 645,000 | | | | 732,714 | |
| Raleigh Durham, NC, Airport Authority Rev., “A”, 5%, 5/01/2026 | | | 1,000,000 | | | | 1,154,630 | |
| Wayne County, NC, Limited Obligation, 4%, 6/01/2029 | | | 1,035,000 | | | | 1,197,278 | |
| | | | | | | | |
| | | | | | | $ | 21,626,004 | |
| North Dakota - 0.4% | | | | | | |
McKenzie County, ND, State Aid Certificates of Indebtedness,
4%, 8/01/2025 | | $ | 2,265,000 | | | $ | 2,178,998 | |
McKenzie County, ND, State Aid Certificates of Indebtedness,
4%, 8/01/2026 | | | 1,195,000 | | | | 1,137,939 | |
McKenzie County, ND, State Aid Certificates of Indebtedness,
4%, 8/01/2027 | | | 3,360,000 | | | | 3,167,505 | |
| Williston, ND, Airport Rev., 4%, 11/01/2029 | | | 2,310,000 | | | | 2,482,534 | |
| | | | | | | | |
| | | | | | | $ | 8,966,976 | |
| Ohio - 2.5% | | | | | | |
| Cleveland, OH, Airport System Rev., “A”, 5%, 1/01/2024 | | $ | 2,000,000 | | | $ | 2,186,500 | |
| Cleveland, OH, Airport System Rev., “A”, 5%, 1/01/2025 | | | 1,970,000 | | | | 2,191,172 | |
| Cleveland, OH, Airport System Rev., “A”, 5%, 1/01/2026 | | | 3,000,000 | | | | 3,385,320 | |
| Cleveland, OH, Airport System Rev., “A”, 5%, 1/01/2029 | | | 1,250,000 | | | | 1,335,437 | |
| Cleveland, OH, Airport System Rev., “A”, AGM, 5%, 1/01/2025 | | | 1,250,000 | | | | 1,406,775 | |
| Cleveland-Cuyahoga County, OH, Port Authority Development Rev. (Port of Cleveland Bond Fund), “C”, 5%, 5/15/2021 (Prerefunded 11/15/2020) | | | 375,000 | | | | 383,201 | |
| Cleveland-Cuyahoga County, OH, Port Authority Development Rev. (Port of Cleveland Bond Fund), “C”, 5%, 11/15/2021 (Prerefunded 11/15/2020) | | | 385,000 | | | | 393,420 | |
46
Portfolio of Investments – continued
| | | | | | | | |
| | |
| Issuer | | Shares/Par | | | Value ($) | |
| Municipal Bonds - continued | | | | | | |
| Ohio - continued | | | | | | |
| Cleveland-Cuyahoga County, OH, Port Authority Development Rev. (Port of Cleveland Bond Fund), “C”, 5%, 11/15/2022 (Prerefunded 11/15/2020) | | $ | 405,000 | | | $ | 413,857 | |
| Cleveland-Cuyahoga County, OH, Port Authority Development Rev. (Port of Cleveland Bond Fund), “C”, ETM, 4%, 5/15/2020 | | | 360,000 | | | | 360,342 | |
| Cleveland-Cuyahoga County, OH, Port Authority Development Rev. (Port of Cleveland Bond Fund), “C”, ETM, 4%, 11/15/2020 | | | 365,000 | | | | 371,052 | |
| Columbus, OH, 5%, 7/01/2022 | | | 2,350,000 | | | | 2,552,194 | |
| Cuyahoga County, OH, Hospital Rev. (Metrohealth System), 5%, 2/15/2026 | | | 2,000,000 | | | | 2,228,100 | |
| Cuyahoga County, OH, Hospital Rev. (Metrohealth System), 5%, 2/15/2027 | | | 2,150,000 | | | | 2,426,361 | |
| Ohio Air Quality Development Authority, Air Quality Rev. (American Electric Power Co.), “C”, 2.1%, 4/01/2028 (Put Date 10/01/2024) | | | 2,075,000 | | | | 2,010,281 | |
| Ohio Air Quality Development Authority, Facilities Rev. (Pratt Paper LLC Project), 3.75%, 1/15/2028 | | | 115,000 | | | | 114,791 | |
| Ohio Higher Education, “C”, 5%, 8/01/2021 | | | 8,000,000 | | | | 8,416,240 | |
| Ohio Higher Educational Facility Commission Rev. (Xavier University Project), “C”, 5%, 5/01/2023 | | | 625,000 | | | | 673,613 | |
| Ohio Higher Educational Facility Rev. (Case Western Reserve University Project), “C”, 1.625%, 12/01/2034 (Put Date 12/01/2026) | | | 5,000,000 | | | | 4,816,750 | |
| Ohio Tax Exempt Private Activity (Portsmouth Bypass Project), 5%, 12/31/2021 | | | 1,000,000 | | | | 1,056,590 | |
| Ohio Tax Exempt Private Activity (Portsmouth Bypass Project), 5%, 12/31/2022 | | | 775,000 | | | | 843,595 | |
| Ohio Water Development Authority, Solid Waste Rev. (Waste Management, Inc.), 3.25%, 11/01/2022 (Put Date 11/01/2022) | | | 11,000,000 | | | | 11,184,690 | |
| Ohio Water Development Authority, Water Pollution Control Rev., 5.25%, 6/01/2020 | | | 2,000,000 | | | | 2,006,800 | |
| State of Ohio, Hospital Rev. (University Hospitals Health System, Inc.), 5%, 1/15/2050 (Put Date 1/15/2025) | | | 5,000,000 | | | | 5,749,700 | |
| State of Ohio, Major New State Infrastructure Project Rev., 5%, 12/15/2023 | | | 6,625,000 | | | | 7,524,542 | |
| | | | | | | | |
| | | | | | | $ | 64,031,323 | |
| Oklahoma - 0.2% | | | | | | |
| Tulsa County, OK, Industrial Authority, Senior Living Community Rev. (Montereau, Inc.), 5%, 11/15/2025 | | $ | 800,000 | | | $ | 817,808 | |
| Tulsa County, OK, Industrial Authority, Senior Living Community Rev. (Montereau, Inc.), 5%, 11/15/2026 | | | 500,000 | | | | 511,165 | |
| Tulsa, OK, Airport Improvement Trust Rev., “A”, BAM, 5%, 6/01/2020 | | | 1,500,000 | | | | 1,503,900 | |
47
Portfolio of Investments – continued
| | | | | | | | |
| | |
| Issuer | | Shares/Par | | | Value ($) | |
| Municipal Bonds - continued | | | | | | |
| Oklahoma - continued | | | | | | |
| Tulsa, OK, Airport Improvement Trust Rev., “A”, BAM, 5%, 6/01/2021 | | $ | 700,000 | | | $ | 724,878 | |
| Tulsa, OK, Airport Improvement Trust Rev., “A”, BAM, 5%, 6/01/2022 | | | 600,000 | | | | 638,736 | |
| | | | | | | | |
| | | | | | | $ | 4,196,487 | |
| Oregon - 0.4% | | | | | | |
| Forest Grove, OR, Campus Improvement Rev. (Pacific University Project), “A”, 4%, 5/01/2021 | | $ | 350,000 | | | $ | 358,162 | |
| Forest Grove, OR, Campus Improvement Rev. (Pacific University Project), “A”, 5%, 5/01/2023 | | | 500,000 | | | | 534,400 | |
| Gilliam County, OR, Solid Waste Disposal Rev. (Waste Management, Inc. Project), “A”, 2.4%, 8/01/2025 (Put Date 5/02/2022) | | | 475,000 | | | | 473,623 | |
| Gilliam County, OR, Solid Waste Disposal Rev. (Waste Management, Inc. Project), “A”, 2.4%, 7/01/2038 (Put Date 5/01/2022) | | | 645,000 | | | | 643,129 | |
| Lake Oswego, OR, 4%, 6/01/2020 | | | 1,830,000 | | | | 1,834,502 | |
| Lake Oswego, OR, 4%, 6/01/2021 | | | 2,330,000 | | | | 2,408,358 | |
| Port of Portland, OR, International Airport Rev., “24B”, 5%, 7/01/2024 | | | 1,500,000 | | | | 1,661,850 | |
| Port of Portland, OR, International Airport Rev., “24B”, 5%, 7/01/2025 | | | 1,000,000 | | | | 1,127,200 | |
| | | | | | | | |
| | | | | | | $ | 9,041,224 | |
| Pennsylvania - 8.9% | | | | | | |
| Allegheny County, PA, Hospital Development Authority Rev. (Allegheny Health Network Obligated Group), “A”, 5%, 4/01/2026 | | $ | 2,750,000 | | | $ | 3,159,035 | |
| Allegheny County, PA, Hospital Development Authority Rev. (University of Pittsburgh Medical Center), “A1”, FLR, 1.901% (LIBOR - 3mo. + 0.72%), 2/01/2021 | | | 340,000 | | | | 339,510 | |
| Allentown, PA, City School District, BAM, 5%, 2/01/2026 | | | 4,155,000 | | | | 4,901,238 | |
| Allentown, PA, City School District, BAM, 5%, 2/01/2027 | | | 4,375,000 | | | | 5,273,712 | |
| Altoona, PA, Sewer Rev., AGM, 5%, 12/01/2027 | | | 500,000 | | | | 612,040 | |
| Athens, PA, School District Rev., BAM, 4%, 4/15/2026 | | | 1,465,000 | | | | 1,664,943 | |
| Athens, PA, School District Rev., BAM, 4%, 4/15/2027 | | | 1,070,000 | | | | 1,235,497 | |
| Beaver County, PA, Big Beaver Falls School District Rev., BAM, 5%, 3/15/2025 | | | 1,325,000 | | | | 1,536,496 | |
| Beaver County, PA, Big Beaver Falls School District Rev., BAM, 5%, 3/15/2026 | | | 1,380,000 | | | | 1,635,604 | |
| Beaver County, PA, Big Beaver Falls School District Rev., BAM, 5%, 3/15/2027 | | | 1,460,000 | | | | 1,766,512 | |
48
Portfolio of Investments – continued
| | | | | | | | |
| | |
| Issuer | | Shares/Par | | | Value ($) | |
| Municipal Bonds - continued | | | | | | |
| Pennsylvania - continued | | | | | | |
| Berks County, PA, Industrial Development Authority Health System Rev. (Tower Health Project), 5%, 11/01/2025 | | $ | 1,500,000 | | | $ | 1,597,890 | |
| Berks County, PA, Industrial Development Authority Health System Rev. (Tower Health Project), 5%, 11/01/2027 | | | 315,000 | | | | 339,762 | |
| Berks County, PA, Industrial Development Authority Health System Rev. (Tower Health Project), 5%, 11/01/2028 | | | 730,000 | | | | 778,122 | |
| Berks County, PA, Industrial Development Authority Health System Rev. (Tower Health Project), 5%, 11/01/2029 | | | 1,125,000 | | | | 1,192,421 | |
| Berks County, PA, Municipal Authority Rev. (Tower Health Project),“B-1”, 5%, 2/01/2040 (Put Date 2/01/2025) | | | 4,810,000 | | | | 5,206,921 | |
| Berks County, PA, Reading School District, “A”, BAM, 4%, 4/01/2024 | | | 615,000 | | | | 673,370 | |
| Berks County, PA, Reading School District, “A”, BAM, 4%, 4/01/2025 | | | 1,000,000 | | | | 1,114,350 | |
| Berks County, PA, Reading School District, “B”, BAM, 4%, 4/01/2024 | | | 1,200,000 | | | | 1,313,892 | |
| Berks County, PA, Reading School District, “B”, BAM, 4%, 4/01/2025 | | | 1,680,000 | | | | 1,872,108 | |
| Berks County, PA, Reading School District, “C”, BAM, 5%, 4/01/2023 | | | 720,000 | | | | 794,095 | |
| Berks County, PA, Reading School District, “C”, BAM, 5%, 4/01/2024 | | | 3,635,000 | | | | 4,117,510 | |
| Berks County, PA, Reading School District, “D”, BAM, 5%, 4/01/2025 | | | 8,395,000 | | | | 9,750,037 | |
| Charleroi, PA, Area School District, BAM, 4%, 11/15/2026 | | | 1,110,000 | | | | 1,263,113 | |
| Charleroi, PA, Area School District, BAM, 4%, 11/15/2028 | | | 250,000 | | | | 289,940 | |
| Commonwealth of Pennsylvania, AGM, 5%, 9/15/2025 | | | 9,000,000 | | | | 10,761,660 | |
| Commonwealth of Pennsylvania, AGM, 5%, 9/15/2026 | | | 6,035,000 | | | | 7,354,553 | |
| Commonwealth of Pennsylvania, Tobacco Master Settlement Financing Authority Rev., 5%, 6/01/2027 | | | 3,000,000 | | | | 3,472,530 | |
| Cumberland County, PA, Municipal Authority Rev. (Diakon Lutheran Social Ministries Project), 5%, 1/01/2021 | | | 585,000 | | | | 589,300 | |
| Cumberland County, PA, Municipal Authority Rev. (Diakon Lutheran Social Ministries Project), 5%, 1/01/2022 | | | 1,025,000 | | | | 1,042,466 | |
| Cumberland County, PA, Municipal Authority Rev. (Diakon Lutheran Social Ministries Project), 5%, 1/01/2023 | | | 730,000 | | | | 748,345 | |
| Cumberland County, PA, Municipal Authority Rev. (Presbyterian Homes, Inc.), “C”, 4%, 12/01/2026 | | | 1,400,000 | | | | 1,384,880 | |
| Dallas, PA, Municipal Authority, University Rev. (Misericordia University Project), 5%, 5/01/2020 | | | 500,000 | | | | 500,000 | |
| Dallas, PA, Municipal Authority, University Rev. (Misericordia University Project), 5%, 5/01/2022 | | | 1,095,000 | | | | 1,127,664 | |
| Dallas, PA, Municipal Authority, University Rev. (Misericordia University Project), 3.25%, 5/01/2023 | | | 160,000 | | | | 158,493 | |
49
Portfolio of Investments – continued
| | | | | | | | |
| | |
| Issuer | | Shares/Par | | | Value ($) | |
| Municipal Bonds - continued | | | | | | |
| Pennsylvania - continued | | | | | | |
| Dallas, PA, Municipal Authority, University Rev. (Misericordia University Project), 5%, 5/01/2029 | | $ | 1,000,000 | | | $ | 1,061,540 | |
| Erie, PA, City School District General Obligation, “A”, AGM, 5%, 4/01/2027 | | | 1,075,000 | | | | 1,304,244 | |
| Erie, PA, City School District General Obligation, “A”, AGM, 5%, 4/01/2030 | | | 855,000 | | | | 1,066,134 | |
| Erie, PA, City School District General Obligation, “A”, AGM, 5%, 4/01/2031 | | | 525,000 | | | | 649,357 | |
| Erie, PA, City School District General Obligation, “B”, AGM, 5%, 4/01/2021 | | | 870,000 | | | | 899,041 | |
| Erie, PA, City School District General Obligation, “B”, AGM, 5%, 4/01/2022 | | | 650,000 | | | | 696,202 | |
| Erie, PA, City School District General Obligation, “B”, AGM, 5%, 4/01/2024 | | | 230,000 | | | | 260,530 | |
| Erie, PA, City School District General Obligation, “B”, AGM, 5%, 4/01/2025 | | | 475,000 | | | | 552,159 | |
| Erie, PA, City School District General Obligation, “B”, AGM, 5%, 4/01/2026 | | | 195,000 | | | | 232,071 | |
| Erie, PA, City School District General Obligation, “C”, AGM, 5%, 4/01/2024 | | | 275,000 | | | | 311,504 | |
| Erie, PA, City School District General Obligation, “C”, AGM, 5%, 4/01/2026 | | | 980,000 | | | | 1,166,308 | |
| Erie, PA, City School District General Obligation, “C”, AGM, 5%, 4/01/2027 | | | 2,135,000 | | | | 2,590,289 | |
| Erie, PA, City School District General Obligation, “C”, AGM, 5%, 4/01/2029 | | | 2,605,000 | | | | 3,264,299 | |
| Erie, PA, City School District General Obligation, “C”, AGM, 5%, 4/01/2030 | | | 425,000 | | | | 529,950 | |
| Erie, PA, Water Authority, Water Rev., “D”, BAM, 5%, 12/01/2027 | | | 625,000 | | | | 776,544 | |
| Erie, PA, Water Authority, Water Rev., “D”, BAM, 5%, 12/01/2028 | | | 1,000,000 | | | | 1,260,380 | |
| Lancaster County, PA, Hospital Authority Health Center Rev. (Masonic Villages Project), 5%, 11/01/2021 | | | 300,000 | | | | 313,347 | |
| Lancaster County, PA, Hospital Authority Health Center Rev. (Masonic Villages Project), 5%, 11/01/2022 | | | 320,000 | | | | 342,886 | |
| Lancaster County, PA, Hospital Authority Health Center Rev. (Masonic Villages Project), 5%, 11/01/2024 | | | 700,000 | | | | 775,943 | |
| Lancaster County, PA, Hospital Authority Health Center Rev. (Masonic Villages Project), 5%, 11/01/2025 | | | 265,000 | | | | 295,949 | |
| Lancaster, PA, Parking Rev., “A”, BAM, 4%, 9/01/2023 | | | 770,000 | | | | 833,109 | |
| Lancaster, PA, Parking Rev., “A”, BAM, 4%, 9/01/2024 | | | 1,015,000 | | | | 1,117,931 | |
| Lancaster, PA, Parking Rev., “A”, BAM, 4%, 9/01/2025 | | | 525,000 | | | | 587,181 | |
50
Portfolio of Investments – continued
| | | | | | | | |
| | |
| Issuer | | Shares/Par | | | Value ($) | |
| Municipal Bonds - continued | | | | | | |
| Pennsylvania - continued | | | | | | |
| Lancaster, PA, Parking Rev., “A”, BAM, 4%, 9/01/2026 | | $ | 550,000 | | | $ | 623,607 | |
| Lancaster, PA, Parking Rev., “A”, BAM, 4%, 9/01/2027 | | | 570,000 | | | | 655,859 | |
| Lancaster, PA, Parking Rev., “A”, BAM, 4%, 9/01/2028 | | | 595,000 | | | | 678,740 | |
| Lancaster, PA, Parking Rev., “A”, BAM, 4%, 9/01/2029 | | | 410,000 | | | | 464,776 | |
| Lancaster, PA, Parking Rev., “A”, BAM, 4%, 9/01/2030 | | | 425,000 | | | | 478,367 | |
| Lancaster, PA, Parking Rev., “A”, BAM, 4%, 9/01/2031 | | | 440,000 | | | | 491,564 | |
| Lancaster, PA, Parking Rev., “A”, BAM, 4%, 9/01/2032 | | | 460,000 | | | | 510,352 | |
| Lancaster, PA, School District General Obligation, “B”, AGM, 4%, 6/01/2022 | | | 805,000 | | | | 851,481 | |
| Lancaster, PA, School District General Obligation, “B”, AGM, 4%, 6/01/2023 | | | 450,000 | | | | 486,788 | |
| Lehigh County, PA, General Purpose Authority (Lehigh Valley | | | | | | | | |
| Health Network Hospital), “A”, 5%, 7/01/2021 | | | 1,200,000 | | | | 1,246,476 | |
| Lehigh County, PA, Water and Sewer Authority Rev. (Allentown Concession), Capital Appreciation, “B”, 0%, 12/01/2021 | | | 1,295,000 | | | | 1,261,213 | |
| Lehigh County, PA, Water and Sewer Authority Rev. (Allentown Concession), Capital Appreciation, “B”, 0%, 12/01/2022 | | | 1,345,000 | | | | 1,284,071 | |
| Lehigh County, PA, Water and Sewer Authority Rev. (Allentown Concession), Capital Appreciation, “B”, 0%, 12/01/2023 | | | 1,060,000 | | | | 990,697 | |
| Luzerne County, PA, “A”, AGM, 5%, 11/15/2020 | | | 1,355,000 | | | | 1,383,970 | |
| Luzerne County, PA, “A”, AGM, 5%, 11/15/2021 | | | 3,000,000 | | | | 3,174,720 | |
| Luzerne County, PA, “A”, AGM, 5%, 12/15/2021 | | | 445,000 | | | | 472,310 | |
| Luzerne County, PA, “A”, AGM, 5%, 12/15/2023 | | | 400,000 | | | | 447,968 | |
| Luzerne County, PA, “A”, AGM, 5%, 12/15/2024 | | | 410,000 | | | | 470,524 | |
| Luzerne County, PA, “A”, AGM, 5%, 12/15/2026 | | | 370,000 | | | | 444,041 | |
| Luzerne County, PA, “A”, AGM, 5%, 12/15/2029 | | | 930,000 | | | | 1,120,576 | |
| Luzerne County, PA, “B”, AGM, 5%, 5/15/2020 | | | 2,200,000 | | | | 2,202,706 | |
| Luzerne County, PA, “B”, AGM, 5%, 5/15/2021 | | | 2,055,000 | | | | 2,135,823 | |
| Luzerne County, PA, Industrial Development Authority, Tax Exempt Guaranteed Lease Rev., AGM, 5%, 12/15/2025 | | | 1,000,000 | | | | 1,174,520 | |
| Luzerne County, PA, Wilkes-Barre Area School District, General Obligation, “B”, BAM, 5%, 8/01/2028 | | | 1,540,000 | | | | 1,859,843 | |
| Monroe County, PA, Hospital Authority Rev. (Pocono Medical Center), “A”, 5%, 1/01/2023 (Prerefunded 1/01/2022) | | | 1,225,000 | | | | 1,307,687 | |
| Montgomery County, PA, Higher Education & Health Authority Rev. (AICUP Financing Program - Gwynedd Mercy University Project), 4%, 5/01/2036 (Put Date 5/01/2022) | | | 1,100,000 | | | | 1,115,224 | |
| Montgomery County, PA, Higher Education & Health Authority Rev. (AICUP Financing Program - Gwynedd Mercy University Project), 4%, 5/01/2036 (Put Date 5/01/2023) | | | 1,205,000 | | | | 1,225,521 | |
| Montgomery County, PA, Higher Education & Health Authority Rev. (Thomas Jefferson University), 5%, 9/01/2029 | | | 1,000,000 | | | | 1,168,000 | |
| Montgomery County, PA, Higher Education & Health Authority Rev. (Thomas Jefferson University), 5%, 9/01/2030 | | | 1,350,000 | | | | 1,565,946 | |
51
Portfolio of Investments – continued
| | | | | | | | |
| | |
| Issuer | | Shares/Par | | | Value ($) | |
| Municipal Bonds - continued | | | | | | |
| Pennsylvania - continued | | | | | | |
| Montgomery County, PA, Higher Education & Health Authority Rev. (Thomas Jefferson University), 5%, 9/01/2031 | | $ | 355,000 | | | $ | 407,540 | |
| Montgomery County, PA, Industrial Development Authority Health System Rev. (Albert Einstein Healthcare Network Issue), “A”, 5%, 1/15/2021 | | | 2,000,000 | | | | 2,034,840 | |
| Montgomery County, PA, Industrial Development Authority Health System Rev. (Albert Einstein Healthcare Network Issue), “A”, 5%, 1/15/2022 | | | 3,485,000 | | | | 3,627,885 | |
| Montgomery County, PA, Industrial Development Authority Pollution Control Rev. (Peco Energy Co. Project), “A”, 2.55%, 6/01/2029 (Put Date 6/01/2020) | | | 880,000 | | | | 880,625 | |
| Northampton and Lehigh Counties, PA, Bethlehem Area School District, “A”, 5%, 2/01/2025 | | | 4,575,000 | | | | 5,355,449 | |
| Pennsylvania Economic Development Financing Authority, Solid Waste Disposal Rev. (Waste Management, Inc. Project), “A”, 1.7%, 8/01/2037 (Put Date 8/03/2020) | | | 2,000,000 | | | | 1,998,920 | |
| Pennsylvania Higher Educational Facilities Authority Rev. (Trustees of the University of Pennsylvania), “A”, 5%, 2/15/2022 | | | 1,000,000 | | | | 1,072,250 | |
| Pennsylvania Higher Educational Facilities Authority Rev. (Trustees of the University of Pennsylvania), “A”, 5%, 2/15/2023 | | | 475,000 | | | | 525,626 | |
| Pennsylvania Higher Educational Facilities Authority Rev. (Trustees of the University of Pennsylvania), “A”, 5%, 2/15/2024 | | | 750,000 | | | | 854,625 | |
| Pennsylvania Housing Finance Agency, Single Family Mortgage Rev., “128A”, 2.35%, 10/01/2021 | | | 2,755,000 | | | | 2,789,713 | |
| Pennsylvania Housing Finance Agency, Single Family Mortgage Rev., “128A”, 2.45%, 4/01/2022 | | | 3,100,000 | | | | 3,150,995 | |
| Pennsylvania Housing Finance Agency, Single Family Mortgage Rev., “128A”, 2.55%, 10/01/2022 | | | 3,190,000 | | | | 3,260,244 | |
| Pennsylvania Housing Finance Agency, Single Family Mortgage Rev., “128A”, 2.8%, 4/01/2024 | | | 1,110,000 | | | | 1,157,231 | |
| Pennsylvania Housing Finance Agency, Single Family Mortgage Rev., “128A”, 4.75%, 4/01/2033 | | | 5,110,000 | | | | 5,520,026 | |
| Pennsylvania Housing Finance Agency, Single Family Mortgage Rev., “116A”, 3%, 4/01/2023 | | | 525,000 | | | | 546,294 | |
| Pennsylvania Housing Finance Agency, Single Family Mortgage Rev., “125A”, 3.2%, 10/01/2028 | | | 3,550,000 | | | | 3,850,543 | |
| Pennsylvania Public School Building Authority, College Rev. (Westmoreland County Community College), AGM, 2%, 10/15/2020 | | | 525,000 | | | | 527,431 | |
| Pennsylvania Public School Building Authority, College Rev. (Westmoreland County Community College), AGM, 2%, 10/15/2021 | | | 190,000 | | | | 192,310 | |
52
Portfolio of Investments – continued
| | | | | | | | |
| | |
| Issuer | | Shares/Par | | | Value ($) | |
| Municipal Bonds - continued | | | | | | |
| Pennsylvania - continued | | | | | | |
| Pennsylvania Public School Building Authority, College Rev. (Westmoreland County Community College), AGM, 4%, 10/15/2022 | | $ | 255,000 | | | $ | 271,419 | |
| Pennsylvania Public School Building Authority, College Rev. (Westmoreland County Community College), AGM, 4%, 10/15/2023 | | | 280,000 | | | | 304,091 | |
| Pennsylvania Public School Building Authority, College Rev. (Westmoreland County Community College), AGM, 4%, 10/15/2024 | | | 300,000 | | | | 331,974 | |
| Pennsylvania Public School Building Authority, College Rev. (Westmoreland County Community College), AGM, 4%, 10/15/2026 | | | 250,000 | | | | 285,445 | |
| Pennsylvania Public School Building Authority, College Rev. (Westmoreland County Community College), AGM, 4%, 10/15/2027 | | | 480,000 | | | | 555,000 | |
| Philadelphia, PA, Authority for Industrial Development City Agreement Rev. (Cultural and Commercial Corridors Program), “A”, 5%, 12/01/2024 | | | 5,675,000 | | | | 6,552,639 | |
| Philadelphia, PA, School District, 5%, 9/01/2022 (w) | | | 5,790,000 | | | | 6,283,018 | |
| Philadelphia, PA, School District, 5%, 9/01/2023 (w) | | | 2,500,000 | | | | 2,795,350 | |
| Philadelphia, PA, School District, “A”, 5%, 9/01/2020 | | | 750,000 | | | | 759,998 | |
| Philadelphia, PA, School District, “A”, 5%, 9/01/2021 | | | 475,000 | | | | 499,748 | |
| Philadelphia, PA, School District, “A”, 5%, 9/01/2023 | | | 1,050,000 | | | | 1,177,281 | |
| Philadelphia, PA, School District, “A”, 5%, 9/01/2025 | | | 1,000,000 | | | | 1,180,930 | |
| Philadelphia, PA, School District, “A”, 5%, 9/01/2026 | | | 635,000 | | | | 760,355 | |
| Philadelphia, PA, School District, “A”, 5%, 9/01/2027 | | | 1,850,000 | | | | 2,248,027 | |
| Philadelphia, PA, School District, “F”, 5%, 9/01/2026 | | | 5,000,000 | | | | 5,987,050 | |
| Philadelphia, PA, Water & Wastewater Rev., “A”, 5%, 7/01/2022 | | | 1,510,000 | | | | 1,623,733 | |
| Pittsburgh, PA, Water & Sewer Authority Rev., “B”, AGM, 5%, 9/01/2031 | | | 1,750,000 | | | | 2,284,800 | |
| Scranton, PA, School District Rev., FLR, 1.519% (68% of LIBOR -1mo. + 0.85%), 4/01/2031 (Put Date 4/01/2021) | | | 5,180,000 | | | | 5,181,917 | |
| Wayne County, PA, County Guaranteed Hospital Rev. (Wayne Memorial Hospital Project), “A”, 5%, 7/01/2030 | | | 500,000 | | | | 599,360 | |
| West Mifflin, PA, Area School District, AGM, 5%, 4/01/2024 | | | 1,250,000 | | | | 1,409,325 | |
| West Mifflin, PA, Area School District, AGM, 5%, 4/01/2025 | | | 1,000,000 | | | | 1,155,780 | |
| West Mifflin, PA, Area School District, AGM, 5%, 4/01/2027 | | | 1,000,000 | | | | 1,194,920 | |
| West Shore, PA, Area Authority Rev. (Messiah Village Project), “A”, 5%, 7/01/2020 | | | 855,000 | | | | 855,855 | |
| West Shore, PA, Area Authority Rev. (Messiah Village Project), “A”, 5%, 7/01/2022 | | | 930,000 | | | | 938,100 | |
| West Shore, PA, Area Authority Rev. (Messiah Village Project), “A”, 5%, 7/01/2025 | | | 1,605,000 | | | | 1,627,277 | |
53
Portfolio of Investments – continued
| | | | | | | | |
| | |
| Issuer | | Shares/Par | | | Value ($) | |
| Municipal Bonds - continued | | | | | | |
| Pennsylvania - continued | | | | | | |
| Westmoreland County, PA, Burrell School District, BAM, 4%, 7/15/2022 | | $ | 415,000 | | | $ | 439,601 | |
| Westmoreland County, PA, Burrell School District, BAM, 4%, 7/15/2023 | | | 805,000 | | | | 870,535 | |
| Westmoreland County, PA, Burrell School District, BAM, 4%, 7/15/2024 | | | 745,000 | | | | 821,176 | |
| Westmoreland County, PA, Burrell School District, BAM, 4%, 7/15/2025 | | | 750,000 | | | | 840,683 | |
| Westmoreland County, PA, Burrell School District, BAM, 4%, 7/15/2026 | | | 1,130,000 | | | | 1,280,900 | |
| Westmoreland County, PA, Burrell School District, BAM, 4%, 7/15/2027 | | | 1,170,000 | | | | 1,343,090 | |
| Westmoreland County, PA, Burrell School District, BAM, 4%, 7/15/2028 | | | 1,100,000 | | | | 1,275,494 | |
| York County, PA, Suburban School District General Obligation, “A”, BAM, 4%, 2/15/2021 | | | 275,000 | | | | 281,460 | |
| York County, PA, Suburban School District General Obligation, “A”, BAM, 4%, 2/15/2022 | | | 1,075,000 | | | | 1,131,373 | |
| | | | | | | | |
| | | | | | | $ | 224,648,528 | |
| Puerto Rico - 4.0% | | | | | | |
| Commonwealth of Puerto Rico Aqueduct & Sewer Authority Rev., “A”, ASSD GTY, 5%, 7/01/2028 | | $ | 1,135,000 | | | $ | 1,141,583 | |
| Commonwealth of Puerto Rico Highway & Transportation Authority Rev.,“AA-1”, AGM, 4.95%, 7/01/2026 | | | 1,830,000 | | | | 1,841,218 | |
| Commonwealth of Puerto Rico Highway & Transportation Authority Rev., “BB”, AGM, 5.25%, 7/01/2022 | | | 4,070,000 | | | | 4,226,084 | |
| Commonwealth of Puerto Rico Highway & Transportation Authority Rev., “E”, AGM, 5.5%, 7/01/2020 | | | 3,880,000 | | | | 3,894,938 | |
| Commonwealth of Puerto Rico Highway & Transportation Authority Rev., “E”, AGM, 5.5%, 7/01/2023 | | | 500,000 | | | | 531,475 | |
| Commonwealth of Puerto Rico Highway & Transportation Authority Rev., “L”, NATL, 5.25%, 7/01/2024 | | | 740,000 | | | | 758,937 | |
| Commonwealth of Puerto Rico Highway & Transportation Authority Rev., “N”, AGM, 5.5%, 7/01/2025 | | | 1,740,000 | | | | 1,883,759 | |
| Commonwealth of Puerto Rico Highway & Transportation Authority Rev., “Y”, AGM, 6.25%, 7/01/2021 | | | 2,660,000 | | | | 2,712,695 | |
| Commonwealth of Puerto Rico Highway & Transportation Authority Rev., Capital Appreciation, “N”, AAC, 0%, 7/01/2020 | | | 610,000 | | | | 606,175 | |
| Commonwealth of Puerto Rico, Public Improvement, “A”, FLR, ASSD GTY, 2.784% (CPI), 7/01/2020 | | | 4,000,000 | | | | 3,999,920 | |
| Commonwealth of Puerto Rico, Public Improvement, “A”, ASSD GTY, 5.5%, 7/01/2029 | | | 1,905,000 | | | | 2,087,232 | |
54
Portfolio of Investments – continued
| | | | | | | | |
| | |
| Issuer | | Shares/Par | | | Value ($) | |
| Municipal Bonds - continued | | | | | | |
| Puerto Rico - continued | | | | | | |
| Commonwealth of Puerto Rico, Public Improvement, “A”, NATL, 5.5%, 7/01/2020 | | $ | 8,220,000 | | | $ | 8,241,043 | |
| Commonwealth of Puerto Rico, Public Improvement, “A”, NATL, 5.5%, 7/01/2021 | | | 8,765,000 | | | | 8,911,901 | |
| Commonwealth of Puerto Rico, Public Improvement,“C-7”, NATL, 6%, 7/01/2027 | | | 2,000,000 | | | | 2,014,360 | |
| Puerto Rico Electric Power Authority Rev., “DDD”, AGM, 3.625%, 7/01/2023 | | | 335,000 | | | | 335,047 | |
| Puerto Rico Electric Power Authority Rev., “DDD”, AGM, 5%, 7/01/2023 | | | 1,365,000 | | | | 1,371,648 | |
| Puerto Rico Electric Power Authority Rev., “DDD”, AGM, 3.65%, 7/01/2024 | | | 3,930,000 | | | | 3,930,118 | |
| Puerto Rico Electric Power Authority Rev., “MM”, NATL, 5%, 7/01/2020 | | | 40,000 | | | | 40,072 | |
| Puerto Rico Electric Power Authority Rev., “NN”, NATL, 5.25%, 7/01/2021 | | | 5,115,000 | | | | 5,186,405 | |
| Puerto Rico Electric Power Authority Rev., “NN”, NATL, 5.25%, 7/01/2022 | | | 1,095,000 | | | | 1,118,422 | |
| Puerto Rico Electric Power Authority Rev., “NN”, NATL, 5.25%, 7/01/2023 | | | 435,000 | | | | 445,766 | |
| Puerto Rico Electric Power Authority Rev., “PP”, NATL, 5%, 7/01/2024 | | | 110,000 | | | | 110,265 | |
| Puerto Rico Electric Power Authority Rev., “PP”, NATL, 5%, 7/01/2025 | | | 115,000 | | | | 115,330 | |
| Puerto Rico Electric Power Authority Rev., “RR”, NATL, 5%, 7/01/2022 | | | 300,000 | | | | 300,447 | |
| Puerto Rico Electric Power Authority Rev., “RR”, NATL, 5%, 7/01/2023 | | | 370,000 | | | | 370,722 | |
| Puerto Rico Electric Power Authority Rev., “RR”, NATL, 5%, 7/01/2024 | | | 1,845,000 | | | | 1,849,446 | |
| Puerto Rico Electric Power Authority Rev., “SS”, NATL, 5%, 7/01/2020 | | | 345,000 | | | | 345,290 | |
| Puerto Rico Electric Power Authority Rev., “SS”, NATL, 5%, 7/01/2023 | | | 860,000 | | | | 861,677 | |
| Puerto Rico Electric Power Authority Rev., “TT”, NATL, 5%, 7/01/2024 | | | 530,000 | | | | 531,277 | |
| Puerto Rico Electric Power Authority Rev., “TT”, NATL, 5%, 7/01/2026 | | | 25,000 | | | | 25,072 | |
| Puerto Rico Electric Power Authority Rev., “UU”, AGM, 5%, 7/01/2022 | | | 260,000 | | | | 261,859 | |
| Puerto Rico Electric Power Authority Rev., “UU”, AGM, 5%, 7/01/2023 | | | 1,075,000 | | | | 1,082,450 | |
| Puerto Rico Electric Power Authority Rev., “UU”, AGM, 5%, 7/01/2024 | | | 1,310,000 | | | | 1,318,528 | |
55
Portfolio of Investments – continued
| | | | | | | | |
| | |
| Issuer | | Shares/Par | | | Value ($) | |
| Municipal Bonds - continued | | | | | | |
| Puerto Rico - continued | | | | | | |
| Puerto Rico Electric Power Authority Rev., “VV”, NATL, 5.25%, 7/01/2025 | | $ | 195,000 | | | $ | 200,261 | |
| Puerto Rico Electric Power Authority Rev., “VV”, NATL, 5.25%, 7/01/2026 | | | 460,000 | | | | 472,213 | |
| Puerto Rico Industrial, Tourist, Educational, Medical & Environmental Control Facilities Financing Authority, Higher Education Rev. (Ana G. Mendez University System Project), 5%, 3/01/2021 | | | 5,000 | | | | 4,995 | |
| Puerto Rico Industrial, Tourist, Educational, Medical & Environmental Control Facilities Financing Authority, Higher Education Rev. (Ana G. Mendez University System Project), 5%, 4/01/2021 | | | 380,000 | | | | 383,747 | |
| Puerto Rico Industrial, Tourist, Educational, Medical & Environmental Control Facilities Financing Authority, Higher Education Rev. (Ana G. Mendez University System Project), 5.375%, 12/01/2021 | | | 160,000 | | | | 159,656 | |
| Puerto Rico Industrial, Tourist, Educational, Medical & Environmental Control Facilities Financing Authority, Higher Education Rev. (Ana G. Mendez University System Project), 5%, 4/01/2022 | | | 295,000 | | | | 294,917 | |
| Puerto Rico Industrial, Tourist, Educational, Medical & Environmental Control Facilities Financing Authority, Higher Education Rev. (Ana G. Mendez University System Project), 5%, 3/01/2026 | | | 90,000 | | | | 88,285 | |
| Puerto Rico Industrial, Tourist, Educational, Medical & Environmental Control Facilities Financing Authority, Higher Education Rev. (Ana G. Mendez University System Project), 5%, 4/01/2027 | | | 390,000 | | | | 380,492 | |
| Puerto Rico Infrastructure Financing Authority Special Tax Rev., “C”, AAC, 5.5%, 7/01/2023 | | | 3,980,000 | | | | 4,243,158 | |
| Puerto Rico Infrastructure Financing Authority Special Tax Rev., “C”, AAC, 5.5%, 7/01/2024 | | | 4,900,000 | | | | 5,275,683 | |
| Puerto Rico Infrastructure Financing Authority Special Tax Rev., “C”, AAC, 5.5%, 7/01/2025 | | | 615,000 | | | | 668,591 | |
| Puerto Rico Infrastructure Financing Authority Special Tax Rev., “C”, AAC, 5.5%, 7/01/2026 | | | 3,270,000 | | | | 3,566,687 | |
| Puerto Rico Infrastructure Financing Authority Special Tax Rev., “C”, AAC, 5.5%, 7/01/2027 | | | 5,535,000 | | | | 6,043,113 | |
| Puerto Rico Municipal Finance Agency, “A”, AGM, 5%, 8/01/2027 | | | 135,000 | | | | 135,861 | |
| Puerto Rico Public Buildings Authority Government Facilities Rev.,“M-3”, NATL, 6%, 7/01/2027 | | | 390,000 | | | | 392,800 | |
| Puerto Rico Public Buildings Authority Rev.,“M-2”, AAC, 10%, 7/01/2035 | | | 3,210,000 | | | | 3,434,572 | |
56
Portfolio of Investments – continued
| | | | | | | | |
| | |
| Issuer | | Shares/Par | | | Value ($) | |
| Municipal Bonds - continued | | | | | | |
| Puerto Rico - continued | | | | | | |
| Puerto Rico Sales Tax Financing Corp., Restructured Sales Tax Rev.,“2019A-1”, 4.5%, 7/01/2034 | | $ | 207,000 | | | $ | 201,626 | |
| Puerto Rico Sales Tax Financing Corp., Restructured Sales Tax Rev., Capital Appreciation,“2019A-1”, 0%, 7/01/2027 | | | 718,000 | | | | 540,805 | |
| Puerto Rico Sales Tax Financing Corp., Restructured Sales Tax Rev., Capital Appreciation,“2019A-1”, 0%, 7/01/2029 | | | 15,340,000 | | | | 10,483,049 | |
| University of Puerto Rico Rev., “P”, NATL, 5%, 6/01/2025 | | | 245,000 | | | | 245,703 | |
| | | | | | | | |
| | | | | | | $ | 99,667,375 | |
| Rhode Island - 0.7% | | | | | | |
| Providence, RI, “A”, 5%, 1/15/2021 | | $ | 1,000,000 | | | $ | 1,020,780 | |
| Rhode Island Health & Educational Building Corp. Rev. (Lifespan Obligated Group), 5%, 5/15/2026 | | | 5,000,000 | | | | 5,588,600 | |
| Rhode Island Health & Educational Building Corp. Rev. (Providence Public Building Authority), “A”, 5%, 5/15/2021 | | | 2,240,000 | | | | 2,327,159 | |
| Rhode Island Student Loan Authority, Student Loan Rev., “A”, 5%, 12/01/2020 | | | 2,000,000 | | | | 2,036,880 | |
| Rhode Island Student Loan Authority, Student Loan Rev., “A”, 5%, 12/01/2021 | | | 880,000 | | | | 922,750 | |
| Rhode Island Student Loan Authority, Student Loan Rev., “A”, 5%, 12/01/2022 | | | 550,000 | | | | 591,371 | |
| Rhode Island Student Loan Authority, Student Loan Rev., “A”, 5%, 12/01/2026 | | | 950,000 | | | | 1,103,330 | |
| Rhode Island Student Loan Authority, Student Loan Rev., “A”, 5%, 12/01/2027 | | | 800,000 | | | | 943,904 | |
| Rhode Island Student Loan Authority, Student Loan Rev., “A”, 5%, 12/01/2028 | | | 1,000,000 | | | | 1,195,210 | |
| Rhode Island Student Loan Authority, Student Loan Rev., “A”, 3.8%, 12/01/2031 | | | 1,100,000 | | | | 1,084,380 | |
| Rhode Island Student Loan Authority, Student Loan Rev., “A”, 3.5%, 12/01/2034 | | | 1,540,000 | | | | 1,557,125 | |
| | | | | | | | |
| | | | | | | $ | 18,371,489 | |
| South Carolina - 0.6% | | | | | | |
| Charleston County, SC, Transportation Sales Tax, 5%, 11/01/2022 | | $ | 3,095,000 | | | $ | 3,401,219 | |
| Richland County, SC, Environmental Improvement Rev. (International Paper), “A”, 3.875%, 4/01/2023 | | | 4,545,000 | | | | 4,668,942 | |
| Scago, SC, Educational Facilities Installment Purchase Rev. (School District of Pickens County Project), 5%, 12/01/2023 | | | 1,300,000 | | | | 1,467,466 | |
| Sumter, SC, Two School Facilities, Inc. (Sumter School District), BAM, 5%, 12/01/2024 | | | 1,000,000 | | | | 1,146,540 | |
| Sumter, SC, Two School Facilities, Inc. (Sumter School District), BAM, 5%, 12/01/2025 | | | 1,500,000 | | | | 1,755,930 | |
57
Portfolio of Investments – continued
| | | | | | | | |
| | |
| Issuer | | Shares/Par | | | Value ($) | |
| Municipal Bonds - continued | | | | | | |
| South Carolina - continued | | | | | | |
| Williamsburg County, SC, General Obligation Rev. (Capital Projects Sales & Use Tax), “B”, BAM, 5%, 3/01/2026 | | $ | 1,680,000 | | | $ | 2,012,153 | |
| | | | | | | | |
| | | | | | | $ | 14,452,250 | |
| Tennessee - 1.4% | | | | | | |
| Clarksville, TN, Water, Sewer & Gas Rev., 5%, 2/01/2021 | | $ | 720,000 | | | $ | 741,924 | |
| Knox County, TN, Health, Educational & Housing Facility Board Rev. (University Health Systems, Inc.), 5%, 4/01/2023 | | | 850,000 | | | | 921,239 | |
| Knox County, TN, Health, Educational & Housing Facility Board Rev. (University Health Systems, Inc.), 5%, 4/01/2024 | | | 750,000 | | | | 831,765 | |
| Knox County, TN, Health, Educational & Housing Facility Board Rev. (University Health Systems, Inc.), 5%, 4/01/2025 | | | 1,350,000 | | | | 1,522,260 | |
| Knox County, TN, Health, Educational & Housing Facility Board Rev. (University Health Systems, Inc.), 5%, 4/01/2027 | | | 265,000 | | | | 309,470 | |
| Knox County, TN, Health, Educational & Housing Facility Board Rev. (University Health Systems, Inc.), 5%, 4/01/2028 | | | 500,000 | | | | 578,575 | |
| Knox County, TN, Health, Educational & Housing Facility Board Rev. (University Health Systems, Inc.), 5%, 9/01/2028 | | | 490,000 | | | | 560,001 | |
| Knox County, TN, Health, Educational & Housing Facility Board Rev. (University Health Systems, Inc.), 5%, 4/01/2029 | | | 1,450,000 | | | | 1,669,878 | |
| Memphis, TN, Health, Educational and Housing Board,Multi-Family Housing Rev. (Burkle & Main Apartments Project), 1.4%, 11/01/2022 (Put Date 5/01/2022) | | | 1,500,000 | | | | 1,502,130 | |
| Metropolitan Government of Nashville & Davidson County, TN, Electric System Rev., “B”, 5%, 5/15/2021 | | | 7,500,000 | | | | 7,817,100 | |
| Tennessee Energy Acquisition Corp., Gas Rev., “A”, 4%, 11/01/2049 (Put Date 11/01/2025) | | | 18,380,000 | | | | 19,537,940 | |
| | | | | | | | |
| | | | | | | $ | 35,992,282 | |
| Texas - 6.6% | | | | | | |
| Arlington, TX, Higher Education Finance Corp. Education Rev. (Riverwalk Education Foundation, Inc.), Texas PSF, 5%, 8/15/2021 | | $ | 400,000 | | | $ | 420,356 | |
| Arlington, TX, Higher Education Finance Corp. Education Rev. (Riverwalk Education Foundation, Inc.), Texas PSF, 5%, 8/15/2022 | | | 350,000 | | | | 378,728 | |
| Arlington, TX, Higher Education Finance Corp. Education Rev. (Riverwalk Education Foundation, Inc.), Texas PSF, 5%, 8/15/2023 | | | 325,000 | | | | 361,910 | |
| Arlington, TX, Higher Education Finance Corp. Education Rev. (Riverwalk Education Foundation, Inc.), Texas PSF, 5%, 8/15/2024 | | | 325,000 | | | | 371,504 | |
| Arlington, TX, Higher Education Finance Corp. Education Rev. (Riverwalk Education Foundation, Inc.), Texas PSF, 5%, 8/15/2025 | | | 400,000 | | | | 467,412 | |
| Arlington, TX, Higher Education Finance Corp. Education Rev. (Riverwalk Education Foundation, Inc.), Texas PSF, 5%, 8/15/2026 | | | 400,000 | | | | 477,180 | |
| Arlington, TX, Higher Education Finance Corp. Education Rev. (Riverwalk Education Foundation, Inc.), Texas PSF, 5%, 8/15/2027 | | | 525,000 | | | | 636,610 | |
58
Portfolio of Investments – continued
| | | | | | | | |
| | |
| Issuer | | Shares/Par | | | Value ($) | |
| Municipal Bonds - continued | | | | | | |
| Texas - continued | | | | | | |
| Austin, TX, Convention Center (Convention Enterprises, Inc.), “A”, 5%, 1/01/2025 | | $ | 2,790,000 | | | $ | 2,767,540 | |
| Austin, TX, Convention Center (Convention Enterprises, Inc.), “B”, 5%, 1/01/2024 | | | 1,200,000 | | | | 1,188,264 | |
| Brazos, TX, Higher Education Authority, Inc., Student Loan Program Rev., “1A”, 5%, 4/01/2021 | | | 400,000 | | | | 411,364 | |
| Brazos, TX, Higher Education Authority, Inc., Student Loan Program Rev., “1A”, 5%, 4/01/2022 | | | 1,055,000 | | | | 1,115,968 | |
| Brazos, TX, Higher Education Authority, Inc., Student Loan Program Rev., “1A”, 5%, 4/01/2022 | | | 460,000 | | | | 486,317 | |
| Brazos, TX, Higher Education Authority, Inc., Student Loan Program Rev., “1A”, 5%, 4/01/2023 | | | 1,070,000 | | | | 1,160,950 | |
| Brazos, TX, Higher Education Authority, Inc., Student Loan Program Rev., “1A”, 5%, 4/01/2023 | | | 750,000 | | | | 813,750 | |
| Brazos, TX, Higher Education Authority, Inc., Student Loan Program Rev., “1A”, 5%, 4/01/2024 | | | 1,025,000 | | | | 1,137,965 | |
| Brazos, TX, Higher Education Authority, Inc., Student Loan Program Rev., “1A”, 5%, 4/01/2025 | | | 985,000 | | | | 1,117,059 | |
| Brazos, TX, Higher Education Authority, Inc., Student Loan Program Rev., “1A”, 5%, 4/01/2026 | | | 940,000 | | | | 1,083,181 | |
| Brazos, TX, Higher Education Authority, Inc., Student Loan Program Rev., “1A”, 5%, 4/01/2026 | | | 1,005,000 | | | | 1,158,082 | |
| Brazos, TX, Higher Education Authority, Inc., Student Loan Program Rev., “1A”, 5%, 4/01/2027 | | | 805,000 | | | | 942,325 | |
| Brazos, TX, Higher Education Authority, Inc., Student Loan Program Rev., “1A”, 5%, 4/01/2028 | | | 710,000 | | | | 844,041 | |
| Brazos, TX, Higher Education Authority, Inc., Student Loan Program Rev., “1A”, 5%, 4/01/2028 | | | 1,340,000 | | | | 1,592,979 | |
| Brazos, TX, Higher Education Authority, Inc., Student Loan Program Rev., “1A”, 5%, 4/01/2029 | | | 495,000 | | | | 592,906 | |
| Brazos, TX, Higher Education Authority, Inc., Student Loan Program Rev., “1A”, 5%, 4/01/2029 | | | 1,440,000 | | | | 1,724,818 | |
| Brazos, TX, Higher Education Authority, Inc., Student Loan Program Rev., “1A”, 3%, 4/01/2039 | | | 420,000 | | | | 389,957 | |
| Brownsville, TX, Independent School District, “A”, Texas PSF, 5%, 2/15/2021 | | | 6,595,000 | | | | 6,807,359 | |
| Brownsville, TX, Navigation District Rev., AGM, 5%, 3/01/2025 | | | 950,000 | | | | 1,086,315 | |
| Brownsville, TX, Navigation District Rev., AGM, 5%, 3/01/2026 | | | 1,000,000 | | | | 1,166,660 | |
| Brownsville, TX, Navigation District Rev., AGM, 5%, 3/01/2027 | | | 1,000,000 | | | | 1,154,160 | |
| Brownsville, TX, Navigation District Rev., AGM, 5%, 3/01/2029 | | | 1,100,000 | | | | 1,260,490 | |
| Clifton, TX, Higher Education Finance Corp. Rev. (Idea Public Schools), Texas PSF, 4%, 8/15/2023 | | | 900,000 | | | | 981,342 | |
59
Portfolio of Investments – continued
| | | | | | | | |
| | |
| Issuer | | Shares/Par | | | Value ($) | |
| Municipal Bonds - continued | | | | | | |
| Texas - continued | | | | | | |
| Clifton, TX, Higher Education Finance Corp. Rev. (Idea Public Schools), Texas PSF, 5%, 8/15/2024 | | $ | 600,000 | | | $ | 692,322 | |
| Clifton, TX, Higher Education Finance Corp. Rev. (Idea Public Schools), Texas PSF, 5%, 8/15/2026 | | | 1,475,000 | | | | 1,783,009 | |
| Clifton, TX, Higher Education Finance Corp. Rev. (Uplift Education), “A”, 3.375%, 12/01/2024 | | | 1,765,000 | | | | 1,739,549 | |
| Decatur, TX, Hospital Authority Rev. (Wise Regional Health System), “A”, 4%, 9/01/2020 | | | 650,000 | | | | 653,191 | |
| Decatur, TX, Hospital Authority Rev. (Wise Regional Health System), “A”, 5%, 9/01/2023 | | | 525,000 | | | | 564,086 | |
| El Paso, TX, General Obligation, 4%, 8/15/2029 | | | 1,440,000 | | | | 1,637,136 | |
| Gaines County, TX, Seminole Hospital District, “A”, 3.75%, 2/15/2023 | | | 2,020,000 | | | | 2,097,831 | |
| Gaines County, TX, Seminole Hospital District, “A”, 3.9%, 2/15/2024 | | | 2,125,000 | | | | 2,209,532 | |
| Gaines County, TX, Seminole Hospital District, “A”, 4.05%, 2/15/2025 | | | 2,215,000 | | | | 2,306,546 | |
| Gaines County, TX, Seminole Hospital District, “A”, 4.25%, 2/15/2026 | | | 1,155,000 | | | | 1,204,226 | |
| Gaines County, TX, Seminole Hospital District, “A”, 4.5%, 2/15/2027 | | | 2,405,000 | | | | 2,515,317 | |
| Gaines County, TX, Seminole Hospital District, “A”, 4.65%, 2/15/2028 | | | 2,615,000 | | | | 2,739,265 | |
| Harris County, TX, Cultural Education Facilities Finance Corp., Hospital Rev. (Texas Children’s Hospital), “A”, 5%, 10/01/2027 | | | 6,000,000 | | | | 7,316,460 | |
| Harris County, TX, Cultural Education Facilities Finance Corp., Hospital Rev. (Texas Children’s Hospital), “A”, 5%, 10/01/2028 | | | 9,000,000 | | | | 11,168,820 | |
| Harris County-Houston, TX, Sports Authority Rev., “C”, 5%, 11/15/2020 | | | 575,000 | | | | 577,381 | |
| Harris County-Houston, TX, Sports Authority Rev., “C”, 5%, 11/15/2021 | | | 1,000,000 | | | | 1,009,510 | |
| Houston, TX, Airport System Rev., “B”, 5%, 7/01/2020 | | | 1,000,000 | | | | 1,005,810 | |
| Houston, TX, Airport System Rev., Special Facilities Rev. (United Airlines, Inc. Terminal E Project), 4.5%, 7/01/2020 | | | 475,000 | | | | 473,884 | |
| Houston, TX, Airport System Rev., Special Facilities Rev. (United Airlines, Inc. Terminal E Project), 4.75%, 7/01/2024 | | | 1,010,000 | | | | 1,005,344 | |
| Houston, TX, Airport System Rev., Special Facilities Rev. (United Airlines, Inc. Terminal Improvement Projects),“B-2”, 5%, 7/15/2020 | | | 705,000 | | | | 702,624 | |
| Houston, TX, Airport System Rev., Subordinate Lien, “C”, 5%, 7/01/2024 | | | 4,000,000 | | | | 4,424,880 | |
| Houston, TX, Airport System Rev., Subordinate Lien, “C”, 5%, 7/01/2025 | | | 1,000,000 | | | | 1,125,130 | |
60
Portfolio of Investments – continued
| | | | | | | | |
| | |
| Issuer | | Shares/Par | | | Value ($) | |
| Municipal Bonds - continued | | | | | | |
| Texas - continued | | | | | | |
| Houston, TX, Airport System Rev., Subordinate Lien, “C”, 5%, 7/01/2026 | | $ | 3,000,000 | | | $ | 3,422,430 | |
| Houston, TX, Memorial City Redevelopment Authority Rev., AGM, 5%, 9/01/2022 | | | 500,000 | | | | 542,865 | |
| Houston, TX, Memorial City Redevelopment Authority Rev., AGM, 5%, 9/01/2023 | | | 550,000 | | | | 614,570 | |
| Houston, TX, Memorial City Redevelopment Authority Rev., AGM, 5%, 9/01/2024 | | | 575,000 | | | | 658,818 | |
| Houston, TX, Memorial City Redevelopment Authority Rev., AGM, 5%, 9/01/2026 | | | 1,100,000 | | | | 1,314,973 | |
| Irving, TX, Hospital Authority Rev. (Baylor Scott & White Medical Center-Irving), “A”, 5%, 10/15/2024 | | | 250,000 | | | | 281,843 | |
| Irving, TX, Hospital Authority Rev. (Baylor Scott & White Medical Center-Irving), “A”, 5%, 10/15/2025 | | | 500,000 | | | | 575,540 | |
| Irving, TX, Hospital Authority Rev. (Baylor Scott & White Medical Center-Irving), “A”, 5%, 10/15/2028 | | | 350,000 | | | | 404,152 | |
| Irving, TX, Hotel Occupancy Tax Rev., 5%, 8/15/2025 | | | 130,000 | | | | 132,445 | |
| Irving, TX, Hotel Occupancy Tax Rev., 5%, 8/15/2026 | | | 150,000 | | | | 152,715 | |
| Irving, TX, Hotel Occupancy Tax Rev., 5%, 8/15/2028 | | | 225,000 | | | | 227,162 | |
| Irving, TX, Hotel Occupancy Tax Rev., 5%, 8/15/2029 | | | 275,000 | | | | 275,718 | |
| Irving, TX, Hotel Occupancy Tax Rev., 5%, 8/15/2030 | | | 185,000 | | | | 184,175 | |
| Lone Star College System, TX, 5%, 2/15/2027 | | | 3,750,000 | | | | 4,493,437 | |
| Matagorda County, TX, Pollution Control Rev. (Central Power & Light Co.), “A”, 2.6%, 11/01/2029 | | | 3,000,000 | | | | 2,855,100 | |
| New Hope, TX, Cultural Education Facilities Finance Corp., Retirement Facility Rev. (MRC Senior Living - Langford Project),“B-1”, 3.25%, 11/15/2022 | | | 10,000 | | | | 9,189 | |
| New Hope, TX, Cultural Education Facilities Finance Corp., Student Housing Rev. (Texas A&M University Project), “A”, AGM, 4%, 4/01/2021 | | | 400,000 | | | | 408,984 | |
| North Texas Municipal Water District, Upper East Fork Wastewater Interceptor System Rev., 5%, 6/01/2024 | | | 1,915,000 | | | | 2,208,435 | |
| Prosper, TX, Independent School District, School Building, Texas PSF, 5%, 2/15/2029 | | | 600,000 | | | | 764,322 | |
| Prosper, TX, Independent School District, School Building, Texas PSF, 5%, 2/15/2030 | | | 700,000 | | | | 892,731 | |
| Regents of the University of North Texas Rev. Financing System, “A”, 5%, 4/15/2026 | | | 1,000,000 | | | | 1,204,990 | |
| San Antonio, TX, Airport System Rev., “A”, 5%, 7/01/2024 | | | 1,595,000 | | | | 1,757,100 | |
| San Antonio, TX, Airport System Rev., “A”, 5%, 7/01/2025 | | | 1,015,000 | | | | 1,136,252 | |
| San Antonio, TX, Airport System Rev., “A”, 5%, 7/01/2026 | | | 1,690,000 | | | | 1,916,629 | |
| San Antonio, TX, Airport System Rev., “A”, 5%, 7/01/2027 | | | 1,870,000 | | | | 2,144,684 | |
| San Antonio, TX, Airport System Rev., “A”, 5%, 7/01/2028 | | | 565,000 | | | | 653,903 | |
61
Portfolio of Investments – continued
| | | | | | | | |
| | |
| Issuer | | Shares/Par | | | Value ($) | |
| Municipal Bonds - continued | | | | | | |
| Texas - continued | | | | | | |
| San Antonio, TX, Passenger Facility Charge and Subordinate Lien Airport System Rev., “A”, 5%, 7/01/2020 | | $ | 550,000 | | | $ | 552,794 | |
| San Antonio, TX, Passenger Facility Charge and Subordinate Lien Airport System Rev., “A”, 5%, 7/01/2021 | | | 1,000,000 | | | | 1,035,320 | |
| San Antonio, TX, Passenger Facility Charge and Subordinate Lien Airport System Rev., “A”, 5%, 7/01/2022 | | | 1,405,000 | | | | 1,485,858 | |
| San Antonio, TX, Passenger Facility Charge and Subordinate Lien Airport System Rev., “A”, 5%, 7/01/2023 | | | 1,100,000 | | | | 1,187,681 | |
| San Antonio, TX, Passenger Facility Charge and Subordinate Lien Airport System Rev., “A”, 5%, 7/01/2024 | | | 860,000 | | | | 945,613 | |
| San Antonio, TX, Passenger Facility Charge and Subordinate Lien Airport System Rev., “A”, 5%, 7/01/2025 | | | 1,600,000 | | | | 1,787,024 | |
| San Antonio, TX, Passenger Facility Charge and Subordinate Lien Airport System Rev., “A”, 5%, 7/01/2026 | | | 1,250,000 | | | | 1,413,825 | |
| San Antonio, TX, Passenger Facility Charge and Subordinate Lien Airport System Rev., “A”, 5%, 7/01/2027 | | | 2,750,000 | | | | 3,144,350 | |
| State of Texas, Tax and Revenue Anticipation Notes, 4%, 8/27/2020 | | | 25,000,000 | | | | 25,275,500 | |
| Tarrant County, TX, Cultural Education Facilities Finance Corp. Hospital Rev. (Scott & White Healthcare Project), “A”, 5%, 8/15/2022 | | | 1,160,000 | | | | 1,249,227 | |
| Tarrant County, TX, Cultural Education Facilities Finance Corp. Retirement Facility Rev. (Barton Creek Senior Living Center, Inc., Querencia Project), 5%, 11/15/2020 | | | 785,000 | | | | 785,314 | |
| Tarrant County, TX, Cultural Education Facilities Finance Corp. Retirement Facility Rev. (Barton Creek Senior Living Center, Inc., Querencia Project), 5%, 11/15/2021 | | | 1,390,000 | | | | 1,390,584 | |
| Tarrant County, TX, Cultural Education Facilities Finance Corp. Retirement Facility Rev. (Barton Creek Senior Living Center, Inc., Querencia Project), 5%, 11/15/2022 | | | 1,460,000 | | | | 1,458,263 | |
| Tarrant County, TX, Cultural Education Facilities Finance Corp. Retirement Facility Rev. (Barton Creek Senior Living Center, Inc., Querencia Project), 5%, 11/15/2024 | | | 515,000 | | | | 511,905 | |
| Tarrant County, TX, Cultural Education Facilities Finance Corp. Retirement Facility Rev. (Barton Creek Senior Living Center, Inc., Querencia Project), 5%, 11/15/2025 | | | 1,675,000 | | | | 1,659,841 | |
| Texas Gas Acquisition & Supply Corp. III., Gas Supply Rev., 5%, 12/15/2026 | | | 440,000 | | | | 460,830 | |
| Texas Transportation Commission, State Highway 249 System Rev., Capital Appreciation, “A”, 0%, 8/01/2028 | | | 135,000 | | | | 97,118 | |
| Texas Transportation Commission, State Highway 249 System Rev., Capital Appreciation, “A”, 0%, 8/01/2029 | | | 500,000 | | | | 342,935 | |
62
Portfolio of Investments – continued
| | | | | | | | |
| | |
| Issuer | | Shares/Par | | | Value ($) | |
| Municipal Bonds - continued | | | | | | |
| Texas - continued | | | | | | |
| Travis County, TX, Health Facilities Development Corp. First Mortgage Refunding Rev. (Longhorn Village Project), “A”, 7%, 1/01/2032 (Prerefunded 1/01/2021) | | $ | 1,715,000 | | | $ | 1,784,063 | |
| Travis County, TX, Health Facilities Development Corp. First Mortgage Refunding Rev. (Longhorn Village Project), “A”, 7.125%, 1/01/2046 (Prerefunded 1/01/2021) | | | 2,215,000 | | | | 2,306,014 | |
| Waco, TX, 5%, 2/01/2027 | | | 3,220,000 | | | | 3,968,940 | |
| | | | | | | | |
| | | | | | | $ | 165,125,506 | |
| U.S. Virgin Islands - 0.4% | | | | | | |
| Virgin Islands Public Finance Authority Rev. (Federal Highway Grant Anticipation Loan Note), 5%, 9/01/2023 | | $ | 1,500,000 | | | $ | 1,624,110 | |
| Virgin Islands Public Finance Authority Rev. (Federal Highway Grant Anticipation Loan Note), 5%, 9/01/2024 | | | 1,500,000 | | | | 1,653,705 | |
| Virgin Islands Public Finance Authority Rev., Matching Fund Loan Note, “A”, AGM, 5%, 10/01/2025 | | | 3,595,000 | | | | 3,646,984 | |
| Virgin Islands Public Finance Authority Rev., Matching Fund Loan Note, “B”, AGM, 5%, 10/01/2025 | | | 3,625,000 | | | | 3,752,237 | |
| | | | | | | | |
| | | | | | | $ | 10,677,036 | |
| Utah - 0.4% | | | | | | |
| Salt Lake City, UT, Airport Rev. (Salt Lake City International Airport), “A”, 5%, 7/01/2025 | | $ | 1,990,000 | | | $ | 2,243,128 | |
| Salt Lake City, UT, Airport Rev. (Salt Lake City International Airport), “A”, 5%, 7/01/2026 | | | 1,200,000 | | | | 1,372,656 | |
| Salt Lake City, UT, Airport Rev. (Salt Lake City International Airport), “A”, 5%, 7/01/2028 | | | 5,000,000 | | | | 5,858,300 | |
| | | | | | | | |
| | | | | | | $ | 9,474,084 | |
| Vermont - 0.7% | | | | | | |
| Burlington, VT, Airport Rev., “A”, 5%, 7/01/2022 | | $ | 1,575,000 | | | $ | 1,624,912 | |
| Vermont Student Assistance Corp., Education Loan Rev., “A”, 5%, 6/15/2023 | | | 525,000 | | | | 567,310 | |
| Vermont Student Assistance Corp., Education Loan Rev., “A”, 5%, 6/15/2024 | | | 1,010,000 | | | | 1,111,707 | |
| Vermont Student Assistance Corp., Education Loan Rev., “A”, 5%, 6/15/2024 | | | 775,000 | | | | 853,042 | |
| Vermont Student Assistance Corp., Education Loan Rev., “A”, 5%, 6/15/2026 | | | 1,470,000 | | | | 1,674,007 | |
| Vermont Student Assistance Corp., Education Loan Rev., “A”, 5%, 6/15/2027 | | | 775,000 | | | | 880,222 | |
| Vermont Student Assistance Corp., Education Loan Rev., “A”, 5%, 6/15/2027 | | | 1,000,000 | | | | 1,156,020 | |
63
Portfolio of Investments – continued
| | | | | | | | |
| | |
| Issuer | | Shares/Par | | | Value ($) | |
| Municipal Bonds - continued | | | | | | |
| Vermont - continued | | | | | | |
| Vermont Student Assistance Corp., Education Loan Rev., “A”, 5%, 6/15/2028 | | $ | 1,600,000 | | | $ | 1,873,760 | |
| Vermont Student Assistance Corp., Education Loan Rev., “A”, 5%, 6/15/2029 | | | 1,640,000 | | | | 1,938,906 | |
| Vermont Student Assistance Corp., Education Loan Rev., “A”, 5%, 6/15/2022 | | | 1,420,000 | | | | 1,505,640 | |
| Vermont Student Assistance Corp., Education Loan Rev., “A”, 5%, 6/15/2023 | | | 1,000,000 | | | | 1,080,590 | |
| Vermont Student Assistance Corp., Education Loan Rev., “A”, 5%, 6/15/2024 | | | 850,000 | | | | 935,595 | |
| Vermont Student Assistance Corp., Education Loan Rev., “A”, 5%, 6/15/2025 | | | 875,000 | | | | 980,586 | |
| Vermont Student Assistance Corp., Education Loan Rev., “A”, 5%, 6/15/2026 | | | 2,100,000 | | | | 2,391,438 | |
| | | | | | | | |
| | | | | | | $ | 18,573,735 | |
| Virginia - 0.8% | | | | | | |
| Charles City County, VA, Economic Development Authority Solid Waste Disposal Rev. (Waste Management, Inc. Project), “A”, 2.4%, 8/01/2027 (Put Date 5/02/2022) | | $ | 475,000 | | | $ | 473,622 | |
| Commonwealth of Virginia, Transportation Board Rev., Capital Projects, 5%, 5/15/2020 | | | 2,175,000 | | | | 2,177,849 | |
| Gloucester County, VA, Industrial Development Authority Rev. (Waste Management Disposal Services of Virginia, Inc.), “A”, 2.4%, 9/01/2038 (Put Date 5/02/2022) | | | 410,000 | | | | 408,811 | |
| King George County, VA, Industrial Development Authority Solid Waste Disposal Rev. (King George Landfill, Inc. Project), “A”, 2.5%, 6/01/2023 (Put Date 5/01/2020) | | | 545,000 | | | | 541,321 | |
| Portsmouth, VA, Refunding and Public Improvement, “A”, 5%, 2/01/2021 | | | 1,375,000 | | | | 1,416,869 | |
| Sussex County, VA, Industrial Development Authority Solid Waste Disposal Rev. (Atlantic Waste Disposal, Inc. Project), “A”, 2.4%, 6/01/2028 (Put Date 5/01/2022) | | | 475,000 | | | | 473,623 | |
| Virginia Housing Development Authority Rev., Rental Housing, “A”, 1.9%, 3/01/2023 | | | 6,355,000 | | | | 6,356,462 | |
| Virginia Public Building Authority, Public Facilities Rev., “A”, 5%, 8/01/2023 | | | 4,000,000 | | | | 4,496,760 | |
| Virginia Small Business Financing Authority Rev. (Hampton University), 5%, 10/01/2020 | | | 1,150,000 | | | | 1,169,596 | |
| Virginia Small Business Financing Authority Rev. (Hampton University), 5%, 10/01/2021 | | | 1,000,000 | | | | 1,053,480 | |
| Virginia Small Business Financing Authority Rev. (Hampton University), 5%, 10/01/2022 | | | 750,000 | | | | 814,942 | |
| | | | | | | | |
| | | | | | | $ | 19,383,335 | |
64
Portfolio of Investments – continued
| | | | | | | | |
| | |
| Issuer | | Shares/Par | | | Value ($) | |
| Municipal Bonds - continued | | | | | | |
| Washington - 2.1% | | | | | | |
| Energy Northwest, WA, Wind Project Rev., 5%, 7/01/2020 | | $ | 2,230,000 | | | $ | 2,244,584 | |
| Energy Northwest, WA, Wind Project Rev., 5%, 7/01/2021 | | | 2,455,000 | | | | 2,567,783 | |
| Energy Northwest, WA, Wind Project Rev., 5%, 7/01/2022 | | | 2,000,000 | | | | 2,155,080 | |
| Energy Northwest, WA, Wind Project Rev., 5%, 7/01/2023 | | | 1,500,000 | | | | 1,660,110 | |
| Grays Harbor County, WA, Public Hospital District No. 2, Limited Tax General Obligation, 3.5%, 12/15/2023 | | | 2,080,000 | | | | 2,090,733 | |
| Grays Harbor County, WA, Public Hospital District No. 2, Limited Tax General Obligation, 4%, 12/15/2028 | | | 4,015,000 | | | | 4,111,039 | |
| Pierce County, WA, “A”, 5%, 7/01/2022 | | | 3,290,000 | | | | 3,568,630 | |
| Port of Seattle, WA, Special Facilities Rev. (Seatac Fuel Facilities LLC), 5%, 6/01/2020 | | | 1,175,000 | | | | 1,178,502 | |
| Port of Seattle, WA, Special Facilities Rev. (Seatac Fuel Facilities LLC), 5%, 6/01/2022 | | | 1,740,000 | | | | 1,857,119 | |
| Seattle, WA, Port Rev., 5%, 4/01/2025 | | | 1,750,000 | | | | 1,982,873 | |
| Seattle, WA, Port Rev., 5%, 4/01/2026 | | | 3,000,000 | | | | 3,446,220 | |
| Seattle, WA, Port Rev., 5%, 4/01/2030 | | | 14,685,000 | | | | 17,122,269 | |
| Seattle, WA, Port Rev., 5%, 4/01/2031 | | | 3,500,000 | | | | 4,057,235 | |
| Washington Health Care Facilities Authority Rev. (CommonSpirit Health),“B-3”, 5%, 8/01/2049 (Put Date 8/01/2026) | | | 3,500,000 | | | | 3,955,070 | |
| Washington Health Care Facilities Authority Rev. (Providence Health & Services), “B”, 5%, 10/01/2042 (Put Date 10/01/2021) | | | 1,000,000 | | | | 1,050,020 | |
| Washington Housing Finance Commission Nonprofit Housing Rev. (Emerald Heights Project), 5%, 7/01/2020 | | | 1,175,000 | | | | 1,177,632 | |
| | | | | | | | |
| | | | | | | $ | 54,224,899 | |
| West Virginia - 1.1% | | | | | | |
| Harrison County, WV, Community Solid Waste Disposal Rev. (Monongahela Power Co.), 3%, 10/15/2037 (Put Date 10/15/2021) | | $ | 10,000,000 | | | $ | 10,153,000 | |
| Monongalia County, WV, Building Commission Improvement Rev. (Monongalia Health System Obligated Group), 5%, 7/01/2022 | | | 1,275,000 | | | | 1,333,255 | |
| West Virginia Economic Development Authority, Solid Waste Disposal Facilities Rev. (Appalachian Power Company - Amos Project), “A”, 2.55%, 3/01/2040 (Put Date 4/01/2024) | | | 4,000,000 | | | | 3,999,120 | |
| West Virginia Economic Development Authority, Solid Waste Disposal Facilities Rev. (Wheeling Power Company - Mitchell Project), “A”, 3%, 6/01/2037 (Put Date 4/01/2022) | | | 11,500,000 | | | | 11,636,160 | |
| | | | | | | | |
| | | | | | | $ | 27,121,535 | |
| Wisconsin - 1.0% | | | | | | |
| Wisconsin Health & Educational Facilities Authority Rev. (Ascension Health Alliance Senior Credit Group), “B”, 5%, 11/15/2043 (Put Date 6/01/2021) | | $ | 5,000,000 | | | $ | 5,188,600 | |
| Wisconsin Health & Educational Facilities Authority Rev. (Aurora Health Care, Inc.), “A”, 5%, 7/15/2022 (Prerefunded 7/15/2021) | | | 6,000,000 | | | | 6,300,360 | |
65
Portfolio of Investments – continued
| | | | | | | | |
| | |
| Issuer | | Shares/Par | | | Value ($) | |
| Municipal Bonds - continued | | | | | | |
| Wisconsin - continued | | | | | | |
| Wisconsin Health & Educational Facilities Authority Rev. (Marquette University), 5%, 10/01/2020 | | $ | 780,000 | | | $ | 792,995 | |
| Wisconsin Health & Educational Facilities Authority Rev. (Marquette University), 5%, 10/01/2022 | | | 975,000 | | | | 1,037,166 | |
| Wisconsin Health & Educational Facilities Authority Rev. (Marquette University), 5%, 10/01/2024 | | | 440,000 | | | | 486,015 | |
| Wisconsin Health & Educational Facilities Authority Rev. (ProHealth Care, Inc. Obligated Group), 3%, 8/15/2026 | | | 4,340,000 | | | | 4,487,690 | |
| Wisconsin Health & Educational Facilities Authority Rev. (Unity Point Health Facilities), “A”, 5%, 12/01/2020 | | | 800,000 | | | | 812,944 | |
| Wisconsin Public Finance Authority Airport Facilities Rev. (Transportation Infrastructure Properties LLC), “B”, 5%, 7/01/2022 | | | 1,910,000 | | | | 1,922,854 | |
| Wisconsin Public Finance Authority Limited Obligation Grant Rev. (American Dream at Meadowlands Project), “A”, 6.25%, 8/01/2027 | | | 1,995,000 | | | | 1,852,038 | |
| Wisconsin Public Finance Authority Solid Waste Disposal Refunding Rev. (Waste Management, Inc. Project), 2%, 7/01/2029 (Put Date 6/01/2021) | | | 3,470,000 | | | | 3,446,231 | |
| | | | | | | | |
| | | | | | | $ | 26,326,893 | |
| Total Municipal Bonds (Identified Cost, $2,394,279,251) | | | $ | 2,405,306,118 | |
| | |
| Bonds - 0.2% | | | | | | |
| Consumer Services - 0.2% | | | | | | |
| Toll Road Investors Partnership II LP, NATL, Capital Appreciation, 0%, 2/15/2026 (Identified Cost, $5,446,184) (n) | | $ | 7,427,000 | | | $ | 6,052,971 | |
| | |
| Investment Companies (h) - 2.0% | | | | | | |
| Money Market Funds - 2.0% | | | | | | |
MFS Institutional Money Market Portfolio, 0.41% (v)
(Identified Cost, $49,461,010) | | | 49,454,105 | | | $ | 49,459,051 | |
| | |
| Other Assets, Less Liabilities - 2.3% | | | | | 56,659,732 | |
| Net Assets - 100.0% | | | | | | $ | 2,517,477,872 | |
| (h) | An affiliated issuer, which may be considered one in which the fund owns 5% or more of the outstanding voting securities, or a company which is under common control. At period end, the aggregate values of the fund’s investments in affiliated issuers and in unaffiliated issuers were $49,459,051 and $2,411,359,089, respectively. |
| (n) | Securities exempt from registration under Rule 144A of the Securities Act of 1933. These securities may be sold in the ordinary course of business in transactions exempt from registration, normally to qualified institutional buyers. At period end, the aggregate value of these securities was $17,041,250, representing 0.7% of net assets. |
66
Portfolio of Investments – continued
| (v) | Affiliated issuer that is available only to investment companies managed by MFS. The rate quoted for the MFS Institutional Money Market Portfolio is the annualizedseven-day yield of the fund at period end. |
The following abbreviations are used in this report and are defined:
| AAC | | Ambac Assurance Corp. |
| AGM | | Assured Guaranty Municipal |
| ASSD GTY | | Assured Guaranty Insurance Co. |
| COP | | Certificate of Participation |
| FGIC | | Financial Guaranty Insurance Co. |
| FHA | | Federal Housing Administration |
| FHLMC | | Federal Home Loan Mortgage Corp. |
| FLR | | Floating Rate. Interest rate resets periodically based on the parenthetically disclosed reference rate plus a spread (if any). Theperiod-end rate reported may not be the current rate. All reference rates are USD unless otherwise noted. |
| LIBOR | | London Interbank Offered Rate |
| NATL | | National Public Finance Guarantee Corp. |
| PSF | | Permanent School Fund |
| SIFMA | | Securities Industry & Financial Markets Assn. |
| VRDN | | Variable rate demand note that may be puttable to the issuer at the option of the holder. The stated interest rate, which generally resets either daily or weekly, represents the rate in effect at period end and may not be the current rate. |
See Notes to Financial Statements
67
Financial Statements
STATEMENT OF ASSETS AND LIABILITIES
At 4/30/20
This statement represents your fund’s balance sheet, which details the assets and liabilities comprising the total value of the fund.
| | | | |
| Assets | | | | |
Investments in unaffiliated issuers, at value (identified cost, $2,399,725,435) | | | $2,411,359,089 | |
Investments in affiliated issuers, at value (identified cost, $49,461,010) | | | 49,459,051 | |
Receivables for | | | | |
Investments sold | | | 61,647,867 | |
Fund shares sold | | | 12,663,895 | |
Interest | | | 28,950,308 | |
Other assets | | | 5,488 | |
Total assets | | | $2,564,085,698 | |
| Liabilities | | | | |
Payables for | | | | |
Distributions | | | $660,310 | |
Investments purchased | | | 23,959,123 | |
Investments purchased on an extended settlement basis | | | 13,270,188 | |
Fund shares reacquired | | | 7,541,887 | |
Payable to affiliates | | | | |
Investment adviser | | | 53,456 | |
Administrative services fee | | | 2,041 | |
Shareholder servicing costs | | | 882,599 | |
Distribution and service fees | | | 13,000 | |
Payable for independent Trustees’ compensation | | | 164 | |
Accrued expenses and other liabilities | | | 225,058 | |
Total liabilities | | | $46,607,826 | |
Net assets | | | $2,517,477,872 | |
| Net assets consist of | | | | |
Paid-in capital | | | $2,530,564,533 | |
Total distributable earnings (loss) | | | (13,086,661 | ) |
Net assets | | | $2,517,477,872 | |
Shares of beneficial interest outstanding | | | 312,572,485 | |
| | | | | | | | | | | | |
| | | |
| | | Net assets | | | Shares
outstanding | | | Net asset value
per share (a) | |
Class A | | | $1,060,370,477 | | | | 131,576,899 | | | | $8.06 | |
Class B | | | 470,324 | | | | 58,429 | | | | 8.05 | |
Class C | | | 78,364,844 | | | | 9,718,524 | | | | 8.06 | |
Class I | | | 1,128,576,962 | | | | 140,185,861 | | | | 8.05 | |
Class R6 | | | 249,695,265 | | | | 31,032,772 | | | | 8.05 | |
| (a) | Maximum offering price per share was equal to the net asset value per share for all share classes, except for Class A, for which the maximum offering price per share was $8.27 [100 / 97.50 x $8.06]. On sales of $50,000 or more, the maximum offering price of Class A shares is reduced. A contingent deferred sales charge may be imposed on redemptions of Class A, Class B, and Class C shares. Redemption price per share was equal to the net asset value per share for Classes I and R6. |
See Notes to Financial Statements
68
Financial Statements
STATEMENT OF OPERATIONS
Year ended 4/30/20
This statement describes how much your fund earned in investment income and accrued in expenses. It also describes any gains and/or losses generated by fund operations.
| | | | |
| Net investment income (loss) | | | | |
Income | | | | |
Interest | | | $61,523,447 | |
Dividends from affiliated issuers | | | 1,285,909 | |
Other | | | 283 | |
Total investment income | | | $62,809,639 | |
Expenses | | | | |
Management fee | | | $9,528,088 | |
Distribution and service fees | | | 3,251,809 | |
Shareholder servicing costs | | | 1,701,020 | |
Administrative services fee | | | 324,302 | |
Independent Trustees’ compensation | | | 38,001 | |
Custodian fee | | | 235,525 | |
Shareholder communications | | | 76,072 | |
Audit and tax fees | | | 56,907 | |
Legal fees | | | 21,067 | |
Miscellaneous | | | 326,100 | |
Total expenses | | | $15,558,891 | |
Fees paid indirectly | | | (2,022 | ) |
Reduction of expenses by investment adviser and distributor | | | (1,211,817 | ) |
Net expenses | | | $14,345,052 | |
Net investment income (loss) | | | $48,464,587 | |
| |
| Realized and unrealized gain (loss) | | | | |
Realized gain (loss) (identified cost basis) | | | | |
Unaffiliated issuers | | | $(8,775,418 | ) |
Affiliated issuers | | | 26,390 | |
Net realized gain (loss) | | | $(8,749,028 | ) |
Change in unrealized appreciation or depreciation | | | | |
Unaffiliated issuers | | | $(32,892,315 | ) |
Affiliated issuers | | | (2,841 | ) |
Net unrealized gain (loss) | | | $(32,895,156 | ) |
Net realized and unrealized gain (loss) | | | $(41,644,184 | ) |
Change in net assets from operations | | | $6,820,403 | |
See Notes to Financial Statements
69
Financial Statements
STATEMENTS OF CHANGES IN NET ASSETS
These statements describe the increases and/or decreases in net assets resulting from operations, any distributions, and any shareholder transactions.
| | | | | | | | |
| | | Year ended | |
| | | 4/30/20 | | | 4/30/19 | |
| Change in net assets | | | | | | |
| | |
| From operations | | | | | | | | |
Net investment income (loss) | | | $48,464,587 | | | | $42,896,125 | |
Net realized gain (loss) | | | (8,749,028 | ) | | | (3,049,205 | ) |
Net unrealized gain (loss) | | | (32,895,156 | ) | | | 44,650,347 | |
Change in net assets from operations | | | $6,820,403 | | | | $84,497,267 | |
Total distributions to shareholders | | | $(49,097,132 | ) | | | $(42,728,002 | ) |
Change in net assets from fund share transactions | | | $448,791,595 | | | | $233,465,885 | |
Total change in net assets | | | $406,514,866 | | | | $275,235,150 | |
| | |
| Net assets | | | | | | | | |
At beginning of period | | | 2,110,963,006 | | | | 1,835,727,856 | |
At end of period | | | $2,517,477,872 | | | | $2,110,963,006 | |
See Notes to Financial Statements
70
Financial Statements
FINANCIAL HIGHLIGHTS
The financial highlights table is intended to help you understand the fund’s financial performance for the past 5 years (or life of a particular share class, if shorter). Certain information reflects financial results for a single fund share. The total returns in the table represent the rate that an investor would have earned (or lost) on an investment in the fund share class (assuming reinvestment of all distributions) held for the entire period.
| | | | | | | | | | | | | | | | | | | | |
| Class A | | Year ended | |
| | | | | |
| | | 4/30/20 | | | 4/30/19 | | | 4/30/18 | | | 4/30/17 | | | 4/30/16 | |
Net asset value, beginning of period | | | $8.16 | | | | $7.99 | | | | $8.11 | | | | $8.23 | | | | $8.16 | |
| | | | |
| Income (loss) from investment operations | | | | | | | | | | | | | | | | | |
Net investment income (loss) (d) | | | $0.16 | | | | $0.18 | | | | $0.17 | | | | $0.16 | (c) | | | $0.15 | |
Net realized and unrealized gain (loss) | | | (0.09 | ) | | | 0.16 | | | | (0.12 | ) | | | (0.12 | ) | | | 0.06 | |
Total from investment operations | | | $0.07 | | | | $0.34 | | | | $0.05 | | | | $0.04 | | | | $0.21 | |
| | | | |
| Less distributions declared to shareholders | | | | | | | | | | | | | | | | | |
From net investment income | | | $(0.17 | ) | | | $(0.17 | ) | | | $(0.17 | ) | | | $(0.16 | ) | | | $(0.14 | ) |
Net asset value, end of period (x) | | | $8.06 | | | | $8.16 | | | | $7.99 | | | | $8.11 | | | | $8.23 | |
Total return (%) (r)(s)(t)(x) | | | 0.78 | | | | 4.36 | | | | 0.60 | | | | 0.47 | (c) | | | 2.63 | |
| | | | |
Ratios (%) (to average net assets)
and Supplemental data: | | | | | | | | | | | | | | | | | |
Expenses before expense reductions (f) | | | 0.78 | | | | 0.78 | | | | 0.79 | | | | 0.80 | (c) | | | 0.80 | |
Expenses after expense reductions (f) | | | 0.66 | | | | 0.67 | | | | 0.69 | | | | 0.69 | (c) | | | 0.69 | |
Net investment income (loss) | | | 1.97 | | | | 2.18 | | | | 2.06 | | | | 1.95 | (c) | | | 1.82 | |
Portfolio turnover | | | 24 | | | | 32 | | | | 33 | | | | 27 | | | | 24 | |
Net assets at end of period (000 omitted) | | | $1,060,370 | | | | $817,277 | | | | $692,006 | | | | $647,875 | | | | $703,594 | |
See Notes to Financial Statements
71
Financial Highlights – continued
| | | | | | | | | | | | | | | | | | | | |
| Class B | | Year ended | |
| | | | | |
| | | 4/30/20 | | | 4/30/19 | | | 4/30/18 | | | 4/30/17 | | | 4/30/16 | |
Net asset value, beginning of period | | | $8.15 | | | | $7.98 | | | | $8.10 | | | | $8.22 | | | | $8.15 | |
| | | | |
| Income (loss) from investment operations | | | | | | | | | | | | | | | | | |
Net investment income (loss) (d) | | | $0.10 | | | | $0.12 | | | | $0.11 | | | | $0.10 | (c) | | | $0.09 | |
Net realized and unrealized gain (loss) | | | (0.10 | ) | | | 0.16 | | | | (0.12 | ) | | | (0.12 | ) | | | 0.06 | |
Total from investment operations | | | $0.00 | | | | $0.28 | | | | $(0.01 | ) | | | $(0.02 | ) | | | $0.15 | |
| | | | |
| Less distributions declared to shareholders | | | | | | | | | | | | | | | | | |
From net investment income | | | $(0.10 | ) | | | $(0.11 | ) | | | $(0.11 | ) | | | $(0.10 | ) | | | $(0.08 | ) |
Net asset value, end of period (x) | | | $8.05 | | | | $8.15 | | | | $7.98 | | | | $8.10 | | | | $8.22 | |
Total return (%) (r)(s)(t)(x) | | | 0.03 | | | | 3.59 | | | | (0.15 | ) | | | (0.28 | )(c) | | | 1.87 | |
| | | | |
Ratios (%) (to average net assets)
and Supplemental data: | | | | | | | | | | | | | | | | | |
Expenses before expense reductions (f) | | | 1.53 | | | | 1.53 | | | | 1.55 | | | | 1.55 | (c) | | | 1.55 | |
Expenses after expense reductions (f) | | | 1.42 | | | | 1.42 | | | | 1.44 | | | | 1.44 | (c) | | | 1.45 | |
Net investment income (loss) | | | 1.25 | | | | 1.43 | | | | 1.32 | | | | 1.21 | (c) | | | 1.08 | |
Portfolio turnover | | | 24 | | | | 32 | | | | 33 | | | | 27 | | | | 24 | |
Net assets at end of period (000 omitted) | | | $470 | | | | $902 | | | | $1,008 | | | | $1,367 | | | | $1,945 | |
| |
| Class C | | Year ended | |
| | | | | |
| | | 4/30/20 | | | 4/30/19 | | | 4/30/18 | | | 4/30/17 | | | 4/30/16 | |
Net asset value, beginning of period | | | $8.16 | | | | $7.99 | | | | $8.11 | | | | $8.24 | | | | $8.16 | |
| | | | |
| Income (loss) from investment operations | | | | | | | | | | | | | | | | | |
Net investment income (loss) (d) | | | $0.09 | | | | $0.11 | | | | $0.10 | | | | $0.09 | (c) | | | $0.08 | |
Net realized and unrealized gain (loss) | | | (0.09 | ) | | | 0.17 | | | | (0.12 | ) | | | (0.13 | ) | | | 0.07 | |
Total from investment operations | | | $0.00 | | | | $0.28 | | | | $(0.02 | ) | | | $(0.04 | ) | | | $0.15 | |
| | | | |
| Less distributions declared to shareholders | | | | | | | | | | | | | | | | | |
From net investment income | | | $(0.10 | ) | | | $(0.11 | ) | | | $(0.10 | ) | | | $(0.09 | ) | | | $(0.07 | ) |
Net asset value, end of period (x) | | | $8.06 | | | | $8.16 | | | | $7.99 | | | | $8.11 | | | | $8.24 | |
Total return (%) (r)(s)(t)(x) | | | (0.07 | ) | | | 3.49 | | | | (0.25 | ) | | | (0.50 | )(c) | | | 1.88 | |
| | | | |
Ratios (%) (to average net assets)
and Supplemental data: | | | | | | | | | | | | | | | | | |
Expenses before expense reductions (f) | | | 1.53 | | | | 1.53 | | | | 1.55 | | | | 1.55 | (c) | | | 1.55 | |
Expenses after expense reductions (f) | | | 1.52 | | | | 1.52 | | | | 1.54 | | | | 1.54 | (c) | | | 1.54 | |
Net investment income (loss) | | | 1.14 | | | | 1.33 | | | | 1.22 | | | | 1.11 | (c) | | | 0.97 | |
Portfolio turnover | | | 24 | | | | 32 | | | | 33 | | | | 27 | | | | 24 | |
Net assets at end of period (000 omitted) | | | $78,365 | | | | $89,702 | | | | $105,269 | | | | $128,146 | | | | $139,554 | |
See Notes to Financial Statements
72
Financial Highlights – continued
| | | | | | | | | | | | | | | | | | | | |
| Class I | | Year ended | |
| | | | | |
| | | 4/30/20 | | | 4/30/19 | | | 4/30/18 | | | 4/30/17 | | | 4/30/16 | |
Net asset value, beginning of period | | | $8.15 | | | | $7.98 | | | | $8.10 | | | | $8.22 | | | | $8.15 | |
| | | | |
| Income (loss) from investment operations | | | | | | | | | | | | | | | | | |
Net investment income (loss) (d) | | | $0.18 | | | | $0.19 | | | | $0.18 | | | | $0.17 | (c) | | | $0.16 | |
Net realized and unrealized gain (loss) | | | (0.10 | ) | | | 0.17 | | | | (0.12 | ) | | | (0.12 | ) | | | 0.06 | |
Total from investment operations | | | $0.08 | | | | $0.36 | | | | $0.06 | | | | $0.05 | | | | $0.22 | |
| | | | |
| Less distributions declared to shareholders | | | | | | | | | | | | | | | | | |
From net investment income | | | $(0.18 | ) | | | $(0.19 | ) | | | $(0.18 | ) | | | $(0.17 | ) | | | $(0.15 | ) |
Net asset value, end of period (x) | | | $8.05 | | | | $8.15 | | | | $7.98 | | | | $8.10 | | | | $8.22 | |
Total return (%) (r)(s)(t)(x) | | | 0.92 | | | | 4.52 | | | | 0.75 | | | | 0.61 | (c) | | | 2.79 | |
| | | | |
Ratios (%) (to average net assets)
and Supplemental data: | | | | | | | | | | | | | | | | | |
Expenses before expense reductions (f) | | | 0.53 | | | | 0.53 | | | | 0.54 | | | | 0.55 | (c) | | | 0.55 | |
Expenses after expense reductions (f) | | | 0.52 | | | | 0.52 | | | | 0.54 | | | | 0.54 | (c) | | | 0.54 | |
Net investment income (loss) | | | 2.12 | | | | 2.33 | | | | 2.21 | | | | 2.11 | (c) | | | 1.96 | |
Portfolio turnover | | | 24 | | | | 32 | | | | 33 | | | | 27 | | | | 24 | |
Net assets at end of period (000 omitted) | | | $1,128,577 | | | | $957,507 | | | | $756,720 | | | | $876,126 | | | | $651,872 | |
| | | | | | | | | | | | |
| Class R6 | | Year ended | |
| | | |
| | | 4/30/20 | | | 4/30/19 | | | 4/30/18 (i) | |
Net asset value, beginning of period | | | $8.15 | | | | $7.98 | | | | $8.19 | |
| | |
| Income (loss) from investment operations | | | | | | | | | |
Net investment income (loss) (d) | | | $0.18 | | | | $0.19 | | | | $0.12 | |
Net realized and unrealized gain (loss) | | | (0.10 | ) | | | 0.17 | | | | (0.21 | ) |
Total from investment operations | | | $0.08 | | | | $0.36 | | | | $(0.09 | ) |
| | |
| Less distributions declared to shareholders | | | | | | | | | |
From net investment income | | | $(0.18 | ) | | | $(0.19 | ) | | | $(0.12 | ) |
Net asset value, end of period (x) | | | $8.05 | | | | $8.15 | | | | $7.98 | |
Total return (%) (r)(s)(t)(x) | | | 1.00 | | | | 4.60 | | | | (1.06 | )(n) |
| | |
Ratios (%) (to average net assets)
and Supplemental data: | | | | | | | | | |
Expenses before expense reductions (f) | | | 0.45 | | | | 0.45 | | | | 0.46 | (a) |
Expenses after expense reductions (f) | | | 0.44 | | | | 0.44 | | | | 0.45 | (a) |
Net investment income (loss) | | | 2.21 | | | | 2.40 | | | | 2.30 | (a) |
Portfolio turnover | | | 24 | | | | 32 | | | | 33 | |
Net assets at end of period (000 omitted) | | | $249,695 | | | | $245,575 | | | | $280,725 | |
See Notes to Financial Statements
73
Financial Highlights – continued
| (c) | Amount reflects aone-time reimbursement of expenses by the custodian (or former custodian) without which net investment income and performance would be lower and expenses would be higher. |
| (d) | Per share data is based on average shares outstanding. |
| (f) | Ratios do not reflect reductions from fees paid indirectly, if applicable. |
| (i) | For Class R6, the period is from the class inception, September 1, 2017, through the stated period end. |
| (r) | Certain expenses have been reduced without which performance would have been lower. |
| (s) | From time to time the fund may receive proceeds from litigation settlements, without which performance would be lower. |
| (t) | Total returns do not include any applicable sales charges. |
| (x) | The net asset values and total returns have been calculated on net assets which include adjustments made in accordance with U.S. generally accepted accounting principles required at period end for financial reporting purposes. |
See Notes to Financial Statements
74
NOTES TO FINANCIAL STATEMENTS
(1) Business and Organization
MFS Municipal Limited Maturity Fund (the fund) is a diversified series of MFS Series Trust IX (the trust). The trust is organized as a Massachusetts business trust and is registered under the Investment Company Act of 1940, as amended, as anopen-end management investment company.
The fund is an investment company and accordingly follows the investment company accounting and reporting guidance of the Financial Accounting Standards Board (FASB) Accounting Standards Codification Topic 946 Financial Services – Investment Companies.
(2) Significant Accounting Policies
General– The preparation of financial statements in conformity with U.S. generally accepted accounting principles requires management to make estimates and assumptions that affect the reported amounts of assets and liabilities, and disclosure of contingent assets and liabilities at the date of the financial statements and the reported amounts of increases and decreases in net assets from operations during the reporting period. Actual results could differ from those estimates. In the preparation of these financial statements, management has evaluated subsequent events occurring after the date of the fund’s Statement of Assets and Liabilities through the date that the financial statements were issued. The fund invests primarily in municipal instruments, which generally trade in theover-the-counter market. The value of municipal instruments can be affected by changes in their actual or perceived credit quality. The credit quality of, and the ability to pay principal and interest when due by, an issuer of a municipal instrument depends on the credit quality of the entity supporting the municipal instrument, how essential any services supported by the municipal instrument are, the sufficiency of any revenues or taxes that support the municipal instrument, and/or the willingness or ability of the appropriate government entity to approve any appropriations necessary to support the municipal instrument. Municipal instruments may be supported by insurance which typically guarantees the timely payment of all principal and interest due on the underlying municipal instrument. The value of a municipal instrument can be volatile and significantly affected by adverse tax changes or court rulings, legislative or political changes, changes in specific or general market and economic conditions in the region where the instrument is issued, and the financial condition of municipal issuers and of municipal instrument insurers of which there are a limited number. Also, because many municipal instruments are issued to finance similar projects, conditions in certain industries can significantly affect the fund and the overall municipal market. If the Internal Revenue Service determines an issuer of a municipal instrument has not complied with the applicable tax requirements, interest from the security could become taxable, the security could decline in value, and distributions made by the fund could be taxable to shareholders.
In March 2020, the FASB issued Accounting Standards Update 2020-04, Reference Rate Reform (Topic 848) – Facilitation of the Effects of Reference Rate Reform on Financial Reporting (“ASU 2020-04”), which provides optional, temporary relief with respect to the financial reporting of contracts subject to certain types of modifications due to the planned discontinuation of the London Interbank Offered Rate (LIBOR) and
75
Notes to Financial Statements – continued
other IBOR-based reference rates as of the end of 2021. The temporary relief provided by ASU 2020-04 is effective for certain reference rate-related contract modifications that occur during the period from March 12, 2020 through December 31, 2022. Management is evaluating the impact of ASU 2020-04 on the fund’s investments, derivatives, debt and other contracts that will undergo reference rate-related modifications as a result of the reference rate reform.
In March 2017, the FASB issued Accounting Standards Update2017-08, Receivables –Nonrefundable Fees and Other Costs (Subtopic310-20) – Premium Amortization on Purchased Callable Debt Securities (“ASU2017-08”). For callable debt securities purchased at a premium that have explicit,non-contingent call features and that are callable at fixed prices on preset dates, ASU2017-08 requires the premium to be amortized to the earliest call date. The fund adopted ASU2017-08 as of the beginning of the reporting period on a modified retrospective basis. The adoption resulted in a change in accounting principle, since the fund had historically amortized such premiums to maturity for U.S. GAAP. As a result of the adoption, the fund recognized a cumulative effect adjustment that decreased the beginning of period cost of investments and increased the unrealized appreciation on investments by $2,065,160. Adoption had no impact on the fund’s net assets or any prior period information presented in the financial statements. With respect to the fund’s results of operations, amortization of premium to first call date under ASU2017-08 accelerates amortization with the intent of more closely aligning the recognition of income on such bonds with the economics of the instrument.
Balance Sheet Offsetting– The fund’s accounting policy with respect to balance sheet offsetting is that, absent an event of default by the counterparty or a termination of the agreement, the International Swaps and Derivatives Association (ISDA) Master Agreement, or similar agreement, does not result in an offset of reported amounts of financial assets and financial liabilities in the Statement of Assets and Liabilities across transactions between the fund and the applicable counterparty. The fund’s right to setoff may be restricted or prohibited by the bankruptcy or insolvency laws of the particular jurisdiction to which a specific master netting agreement counterparty is subject. Balance sheet offsetting disclosures, to the extent applicable to the fund, have been included in the fund’s Significant Accounting Policies note under the captions for each of the fund’sin-scope financial instruments and transactions.
Investment Valuations– Debt instruments and floating rate loans, including restricted debt instruments, are generally valued at an evaluated or composite bid as provided by a third-party pricing service. Short-term instruments with a maturity at issuance of 60 days or less may be valued at amortized cost, which approximates market value.Open-end investment companies are generally valued at net asset value per share. Securities and other assets generally valued on the basis of information from a third-party pricing service may also be valued at a broker/dealer bid quotation. In determining values, third-party pricing services can utilize both transaction data and market information such as yield, quality, coupon rate, maturity, type of issue, trading characteristics, and other market data.
The Board of Trustees has delegated primary responsibility for determining or causing to be determined the value of the fund’s investments (including any fair valuation) to the adviser pursuant to valuation policies and procedures approved by the Board. If the
76
Notes to Financial Statements – continued
adviser determines that reliable market quotations are not readily available, investments are valued at fair value as determined in good faith by the adviser in accordance with such procedures under the oversight of the Board of Trustees. Under the fund’s valuation policies and procedures, market quotations are not considered to be readily available for most types of debt instruments and floating rate loans and many types of derivatives. These investments are generally valued at fair value based on information from third-party pricing services. In addition, investments may be valued at fair value if the adviser determines that an investment’s value has been materially affected by events occurring after the close of the exchange or market on which the investment is principally traded (such as foreign exchange or market) and prior to the determination of the fund’s net asset value, or after the halt of trading of a specific security where trading does not resume prior to the close of the exchange or market on which the security is principally traded. The adviser generally relies on third-party pricing services or other information (such as the correlation with price movements of similar securities in the same or other markets; the type, cost and investment characteristics of the security; the business and financial condition of the issuer; and trading and other market data) to assist in determining whether to fair value and at what value to fair value an investment. The value of an investment for purposes of calculating the fund’s net asset value can differ depending on the source and method used to determine value. When fair valuation is used, the value of an investment used to determine the fund’s net asset value may differ from quoted or published prices for the same investment. There can be no assurance that the fund could obtain the fair value assigned to an investment if it were to sell the investment at the same time at which the fund determines its net asset value per share.
Various inputs are used in determining the value of the fund’s assets or liabilities. These inputs are categorized into three broad levels. In certain cases, the inputs used to measure fair value may fall into different levels of the fair value hierarchy. In such cases, an investment’s level within the fair value hierarchy is based on the lowest level of input that is significant to the fair value measurement. The fund’s assessment of the significance of a particular input to the fair value measurement in its entirety requires judgment, and considers factors specific to the investment. Level 1 includes unadjusted quoted prices in active markets for identical assets or liabilities. Level 2 includes other significant observable market-based inputs (including quoted prices for similar securities, interest rates, prepayment speed, and credit risk). Level 3 includes unobservable inputs, which may include the adviser’s own assumptions in determining the fair value of investments. The following is a summary of the levels used as of April 30, 2020 in valuing the fund’s assets or liabilities:
| | | | | | | | | | | | | | | | |
| | | | |
| Financial Instruments | | Level 1 | | | Level 2 | | | Level 3 | | | Total | |
| Municipal Bonds | | | $— | | | | $2,405,306,118 | | | | $— | | | | $2,405,306,118 | |
| U.S. Corporate Bonds | | | — | | | | 6,052,971 | | | | — | | | | 6,052,971 | |
| Mutual Funds | | | 49,459,051 | | | | — | | | | — | | | | 49,459,051 | |
| Total | | | $49,459,051 | | | | $2,411,359,089 | | | | $— | | | | $2,460,818,140 | |
For further information regarding security characteristics, see the Portfolio of Investments.
Indemnifications– Under the fund’s organizational documents, its officers and Trustees may be indemnified against certain liabilities and expenses arising out of the
77
Notes to Financial Statements – continued
performance of their duties to the fund. Additionally, in the normal course of business, the fund enters into agreements with service providers that may contain indemnification clauses. The fund’s maximum exposure under these agreements is unknown as this would involve future claims that may be made against the fund that have not yet occurred.
Investment Transactions and Income– Investment transactions are recorded on the trade date. Interest income is recorded on the accrual basis. All premium and discount is amortized or accreted for financial statement purposes in accordance with U.S. generally accepted accounting principles. Some securities may be purchased or sold on an extended settlement basis which includes “when-issued”, “delayed delivery” or “To Be Announced” (TBA) securities. For extended settlement transactions, the receipt or delivery of the securities by the fund and related payments occur at a future date, usually beyond the customary settlement time. Interest payments received in additional securities are recorded on theex-interest date in an amount equal to the value of the security on such date.
The fund may receive proceeds from litigation settlements. Any proceeds received from litigation involving portfolio holdings are reflected in the Statement of Operations in realized gain/loss if the security has been disposed of by the fund or in unrealized gain/loss if the security is still held by the fund. Any other proceeds from litigation not related to portfolio holdings are reflected as other income in the Statement of Operations.
The fund purchased or sold debt securities on a when-issued or delayed delivery basis, or in a “To Be Announced” (TBA) or “forward commitment” transaction with delivery or payment to occur at a later date beyond the normal settlement period. When the fund sells securities on a when-issued, delayed delivery, TBA, or forward commitment basis, the fund typically owns or has the right to acquire securities equivalent in kind and amount to the delivered securities. At the time a fund enters into a commitment to purchase or sell a security, the transaction is recorded and the value of the security acquired or sold is reflected in the fund’s net asset value. The price of such security and the date that the security will be delivered and paid for are fixed at the time the transaction is negotiated. The value of the security may vary with market fluctuations. No interest accrues to the fund until payment takes place. At the time that a fund enters into this type of transaction, the fund is required to have sufficient cash and/or liquid securities to cover its commitments. Losses may arise due to changes in the value of the underlying securities prior to settlement date or if the counterparty does not perform under the contract’s terms, or if the issuer does not issue the securities due to political, economic or other factors.
Fees Paid Indirectly– The fund’s custody fee may be reduced by a credit earned under an arrangement that measures the value of U.S. dollars deposited with the custodian by the fund. The amount of the credit, for the year ended April 30, 2020, is shown as a reduction of total expenses in the Statement of Operations.
Tax Matters and Distributions– The fund intends to qualify as a regulated investment company, as defined under Subchapter M of the Internal Revenue Code, and to distribute all of its taxable andtax-exempt income, including realized capital gains. As a result, no provision for federal income tax is required. The fund’s federal tax
78
Notes to Financial Statements – continued
returns, when filed, will remain subject to examination by the Internal Revenue Service for a three year period. Management has analyzed the fund’s tax positions taken on federal and state tax returns for all open tax years and does not believe that there are any uncertain tax positions that require recognition of a tax liability.
Distributions to shareholders are recorded on theex-dividend date. Income and capital gain distributions are determined in accordance with income tax regulations, which may differ from U.S. generally accepted accounting principles. Certain capital accounts in the financial statements are periodically adjusted for permanent differences in order to reflect their tax character. These adjustments have no impact on net assets or net asset value per share. Temporary differences which arise from recognizing certain items of income, expense, gain or loss in different periods for financial statement and tax purposes will reverse at some time in the future.
During the year ended April 30, 2020, there were no significant adjustments due to differences between book and tax accounting.
The tax character of distributions declared to shareholders for the last two fiscal years is as follows:
| | | | | | | | |
| | |
| | | Year ended
4/30/20 | | | Year ended
4/30/19 | |
| Ordinary income (including any short-term capital gains) | | | $1,065,976 | | | | $513,056 | |
| Tax-exempt income | | | 48,031,156 | | | | 42,214,946 | |
| | |
| Total distributions | | | $49,097,132 | | | | $42,728,002 | |
The federal tax cost and the tax basis components of distributable earnings were as follows:
| | | | |
| |
| As of 4/30/20 | | | |
| |
| Cost of investments | | | $2,449,004,678 | |
| Gross appreciation | | | 41,902,509 | |
| |
| Gross depreciation | | | (30,089,047 | ) |
| Net unrealized appreciation (depreciation) | | | $11,813,462 | |
| |
| Undistributed ordinary income | | | 427,282 | |
| Undistributedtax-exempt income | | | 2,211,738 | |
| Capital loss carryforwards | | | (23,578,244 | ) |
| Other temporary differences | | | (3,960,899 | ) |
As of April 30, 2020, the fund had capital loss carryforwards available to offset future realized gains. These net capital losses may be carried forward indefinitely and their character is retained as short-term and/or long-term losses. Such losses are characterized as follows:
| | | | |
| Short-Term | | | $(22,747,016 | ) |
| Long-Term | | | (831,228 | ) |
| Total | | | $(23,578,244 | ) |
Multiple Classes of Shares of Beneficial Interest– The fund offers multiple classes of shares, which differ in their respective distribution and service fees. The fund’s income and common expenses are allocated to shareholders based on the value of
79
Notes to Financial Statements – continued
settled shares outstanding of each class. The fund’s realized and unrealized gain (loss) are allocated to shareholders based on the daily net assets of each class. Dividends are declared separately for each class. Differences in per share dividend rates are generally due to differences in separate class expenses. Class B shares will convert to Class A shares approximately eight years after purchase. Class C shares will convert to Class A shares approximately ten years after purchase. The fund’s distributions declared to shareholders as reported in the Statements of Changes in Net Assets are presented by class as follows:
| | | | | | | | |
| | |
| | | Year
ended
4/30/20 | | | Year
ended
4/30/19 | |
| Class A | | | $19,154,214 | | | | $16,287,812 | |
| Class B | | | 9,571 | | | | 13,158 | |
| Class C | | | 978,382 | | | | 1,270,813 | |
| Class I | | | 23,284,713 | | | | 19,539,280 | |
| Class R6 | | | 5,670,252 | | | | 5,616,939 | |
| Total | | | $49,097,132 | | | | $42,728,002 | |
(3) Transactions with Affiliates
Investment Adviser– The fund has an investment advisory agreement with MFS to provide overall investment management and related administrative services and facilities to the fund. The management fee is computed daily and paid monthly at an annual rate of 0.40% of the fund’s average daily net assets.
MFS has agreed in writing to reduce its management fee by a specified amount if certain MFS mutual fund assets exceed thresholds agreed to by MFS and the fund’s Board of Trustees. For the year ended April 30, 2020, this management fee reduction amounted to $239,267, which is included in the reduction of total expenses in the Statement of Operations. The management fee incurred for the year ended April 30, 2020 was equivalent to an annual effective rate of 0.39% of the fund’s average daily net assets.
The investment adviser has agreed in writing to pay a portion of the fund’s total annual operating expenses, excluding interest, taxes, extraordinary expenses, brokerage and transaction costs, and investment-related expenses, such that total fund operating expenses do not exceed the following rates annually of each class’s average daily net assets:
| | | | | | | | | | | | | | | | | | |
| | | | |
| Class A | | | Class B | | | Class C | | | Class I | | | Class R6 | |
| | 0.69% | | | | 1.44 | % | | | 1.54 | % | | | 0.54 | % | | | 0.46 | % |
This written agreement will continue until modified by the fund’s Board of Trustees, but such agreement will continue at least until August 31, 2020. For the year ended April 30, 2020, the fund’s actual operating expenses did not exceed the limit and therefore, the investment adviser did not pay any portion of the fund’s expenses related to this agreement.
Distributor– MFS Fund Distributors, Inc. (MFD), a wholly-owned subsidiary of MFS, as distributor, received $133,940 for the year ended April 30, 2020, as its portion of the initial sales charge on sales of Class A shares of the fund.
80
Notes to Financial Statements – continued
The Board of Trustees has adopted a distribution plan for certain share classes pursuant to Rule12b-1 of the Investment Company Act of 1940.
The fund’s distribution plan provides that the fund will pay MFD for services provided by MFD and financial intermediaries in connection with the distribution and servicing of certain share classes. One component of the plan is a distribution fee paid to MFD and another component of the plan is a service fee paid to MFD. MFD may subsequently pay all, or a portion, of the distribution and/or service fees to financial intermediaries.
Distribution Plan Fee Table:
| | | | | | | | | | | | | | | | | | | | |
| | | | | |
| | | Distribution
Fee Rate (d) | | | Service
Fee Rate (d) | | | Total
Distribution
Plan (d) | | | Annual
Effective
Rate (e) | | | Distribution
and Service
Fee | |
| Class A | | | — | | | | 0.25% | | | | 0.25% | | | | 0.15% | | | | $2,403,009 | |
| Class B | | | 0.75% | | | | 0.25% | | | | 1.00% | | | | 0.90% | | | | 7,480 | |
| Class C | | | 0.75% | | | | 0.25% | | | | 1.00% | | | | 1.00% | | | | 841,320 | |
| Total Distribution and Service Fees | | | | | | | | | | | | $3,251,809 | |
| (d) | In accordance with the distribution plan for certain classes, the fund pays distribution and/or service fees equal to these annual percentage rates of each class’s average daily net assets. The distribution and service fee rates disclosed by class represent the current rates in effect at the end of the reporting period. Any rate changes, if applicable, are detailed below. |
| (e) | The annual effective rates represent actual fees incurred under the distribution plan for the year ended April 30, 2020 based on each class’s average daily net assets. 0.10% of the Class A and Class B service fee is currently being waived under a written waiver arrangement. For the year ended April 30, 2020, this waiver amounted to $961,194 and $749, for Class A and Class B, respectively, and is included in the reduction of total expenses in the Statement of Operations. This written waiver agreement will continue until modified by the fund’s Board of Trustees, but such agreement will continue at least until August 31, 2020. MFD has voluntarily agreed to rebate a portion of each class’s 0.25% service fee attributable to accounts for which there is no financial intermediary specified on the account except for accounts attributable to MFS or its affiliates’ seed money. For the year ended April 30, 2020, this rebate amounted to $10,606 and $1 for Class A and Class C, respectively, and is included in the reduction of total expenses in the Statement of Operations. |
Certain Class A shares are subject to a contingent deferred sales charge (CDSC) in the event of a shareholder redemption within 18 months of purchase. Class B shares are subject to a CDSC in the event of a shareholder redemption within six years of purchase. Class C shares are subject to a CDSC in the event of a shareholder redemption within 12 months of purchase. All contingent deferred sales charges are paid to MFD and during the year ended April 30, 2020, were as follows:
| | | | |
| |
| | | Amount | |
| Class A | | | $148,175 | |
| Class B | | | 712 | |
| Class C | | | 16,039 | |
Shareholder Servicing Agent– MFS Service Center, Inc. (MFSC), a wholly-owned subsidiary of MFS, receives a fee from the fund for its services as shareholder servicing agent calculated as a percentage of the average daily net assets of the fund as determined periodically under the supervision of the fund’s Board of Trustees. For the year ended April 30, 2020, the fee was $31,645, which equated to 0.0013% annually
81
Notes to Financial Statements – continued
of the fund’s average daily net assets. MFSC also receives payment from the fund forout-of-pocket expenses,sub-accounting and other shareholder servicing costs which may be paid to affiliated and unaffiliated service providers. Class R6 shares do not incursub-accounting fees. For the year ended April 30, 2020, theseout-of-pocket expenses,sub-accounting and other shareholder servicing costs amounted to $1,669,375.
Administrator– MFS provides certain financial, legal, shareholder communications, compliance, and other administrative services to the fund. Under an administrative services agreement, the fund reimburses MFS the costs incurred to provide these services. The fund is charged an annual fixed amount of $17,500 plus a fee based on average daily net assets. The administrative services fee incurred for the year ended April 30, 2020 was equivalent to an annual effective rate of 0.0136% of the fund’s average daily net assets.
Trustees’ and Officers’ Compensation– The fund pays compensation to independent Trustees in the form of a retainer, attendance fees, and additional compensation to Board and Committee chairpersons. The fund does not pay compensation directly to Trustees or officers of the fund who are also officers of the investment adviser, all of whom receive remuneration from MFS for their services to the fund. Certain officers and Trustees of the fund are officers or directors of MFS, MFD, and MFSC.
Other– This fund and certain other funds managed by MFS (the funds) had entered into a service agreement (the ISO Agreement) which provided for payment of fees solely by the funds to Tarantino LLC in return for the provision of services of an Independent Senior Officer (ISO) for the funds. Frank L. Tarantino served as the ISO and was an officer of the funds and the sole member of Tarantino LLC. Effective June 30, 2019, Mr. Tarantino retired from his position as ISO for the funds, and the ISO Agreement was terminated. For the year ended April 30, 2020, the fee paid by the fund under this agreement was $1,406 and is included in “Miscellaneous” expense in the Statement of Operations. MFS had agreed to bear all expenses associated with office space, other administrative support, and supplies provided to the ISO.
The fund invests in the MFS Institutional Money Market Portfolio which is managed by MFS and seeks current income consistent with preservation of capital and liquidity. This money market fund does not pay a management fee to MFS but does incur investment and operating costs.
(4) Portfolio Securities
For the year ended April 30, 2020, purchases and sales of investments, other than short-term obligations, aggregated $974,845,404 and $550,291,588, respectively.
82
Notes to Financial Statements – continued
(5) Shares of Beneficial Interest
The fund’s Declaration of Trust permits the Trustees to issue an unlimited number of full and fractional shares of beneficial interest. Transactions in fund shares were as follows:
| | | | | | | | | | | | | | | | |
| | | Year ended
4/30/20 | | | Year ended
4/30/19 | |
| | | | |
| | | Shares | | | Amount | | | Shares | | | Amount | |
| Shares sold | | | | | | | | | | | | | | | | |
Class A | | | 61,696,041 | | | | $509,986,936 | | | | 44,664,831 | | | | $359,113,288 | |
Class B | | | 70 | | | | 575 | | | | 25,723 | | | | 205,282 | |
Class C | | | 2,595,014 | | | | 21,499,482 | | | | 1,474,401 | | | | 11,889,665 | |
Class I | | | 68,302,368 | | | | 563,089,893 | | | | 67,751,082 | | | | 544,597,503 | |
Class R6 | | | 13,681,588 | | | | 112,767,896 | | | | 15,450,857 | | | | 124,042,821 | |
| | | 146,275,081 | | | | $1,207,344,782 | | | | 129,366,894 | | | | $1,039,848,559 | |
| | | |
| Shares issued to shareholders in reinvestment of distributions | | | | | | | | | | | | | |
Class A | | | 2,177,131 | | | | $18,005,764 | | | | 1,885,044 | | | | $15,191,436 | |
Class B | | | 1,075 | | | | 8,886 | | | | 1,440 | | | | 11,593 | |
Class C | | | 100,078 | | | | 828,207 | | | | 136,085 | | | | 1,096,554 | |
Class I | | | 1,910,137 | | | | 15,785,004 | | | | 1,599,399 | | | | 12,875,967 | |
Class R6 | | | 676,158 | | | | 5,584,420 | | | | 684,892 | | | | 5,509,943 | |
| | | 4,864,579 | | | | $40,212,281 | | | | 4,306,860 | | | | $34,685,493 | |
| | | |
| Shares reacquired | | | | | | | | | | | | | |
Class A | | | (32,464,789 | ) | | | $(266,571,720 | ) | | | (32,993,208 | ) | | | $(265,464,696 | ) |
Class B | | | (53,357 | ) | | | (443,856 | ) | | | (42,784 | ) | | | (343,405 | ) |
Class C | | | (3,964,372 | ) | | | (32,704,450 | ) | | | (3,790,639 | ) | | | (30,512,901 | ) |
Class I | | | (47,505,957 | ) | | | (388,387,046 | ) | | | (46,685,485 | ) | | | (374,955,368 | ) |
Class R6 | | | (13,473,477 | ) | | | (110,658,396 | ) | | | (21,183,362 | ) | | | (169,791,797 | ) |
| | | (97,461,952 | ) | | | $(798,765,468 | ) | | | (104,695,478 | ) | | | $(841,068,167 | ) |
| | | |
| Net change | | | | | | | | | | | | | |
Class A | | | 31,408,383 | | | | $261,420,980 | | | | 13,556,667 | | | | $108,840,028 | |
Class B | | | (52,212 | ) | | | (434,395 | ) | | | (15,621 | ) | | | (126,530 | ) |
Class C | | | (1,269,280 | ) | | | (10,376,761 | ) | | | (2,180,153 | ) | | | (17,526,682 | ) |
Class I | | | 22,706,548 | | | | 190,487,851 | | | | 22,664,996 | | | | 182,518,102 | |
Class R6 | | | 884,269 | | | | 7,693,920 | | | | (5,047,613 | ) | | | (40,239,033 | ) |
| | | 53,677,708 | | | | $448,791,595 | | | | 28,978,276 | | | | $233,465,885 | |
Class T shares were not publicly available for sale during the period. Please see the fund’s prospectus for details.
Effective May 1, 2006, purchases of the fund’s Class B shares were closed to new and existing investors subject to certain exceptions. Please see the fund’s prospectus for details.
The sale of the fund’s shares has been suspended except in certain circumstances. Please see the fund’s prospectus for details.
83
Notes to Financial Statements – continued
(6) Line of Credit
The fund and certain other funds managed by MFS participate in a $1.25 billion unsecured committed line of credit, subject to a $1 billion sublimit, provided by a syndicate of banks under a credit agreement. Borrowings may be made for temporary financing needs. Interest is charged to each fund, based on its borrowings, generally at a rate equal to the highest of one month LIBOR, the Federal Funds Effective Rate and the Overnight Bank Funding Rate, plus an agreed upon spread. A commitment fee, based on the average daily, unused portion of the committed line of credit, is allocated among the participating funds. In addition, the fund and other funds managed by MFS have established unsecured uncommitted borrowing arrangements with certain banks for temporary financing needs. Interest is charged to each fund, based on its borrowings, at rates equal to customary reference rates plus an agreed upon spread. For the year ended April 30, 2020, the fund’s commitment fee and interest expense were $12,023 and $0, respectively, and are included in “Miscellaneous” expense in the Statement of Operations.
(7) Investments in Affiliated Issuers
An affiliated issuer may be considered one in which the fund owns 5% or more of the outstanding voting securities, or a company which is under common control. For the purposes of this report, the following were affiliated issuers:
| | | | | | | | | | | | | | | | | | | | | | | | |
| | | | | | |
| Affiliated Issuers | | Beginning
Value | | | Purchases | | | Sales
Proceeds | | | Realized
Gain
(Loss) | | | Change in
Unrealized
Appreciation or
Depreciation | | | Ending
Value | |
| MFS Institutional Money Market Portfolio | | | $8,871,874 | | | | $779,871,375 | | | | $739,307,747 | | | | $26,390 | | | | $(2,841 | ) | | | $49,459,051 | |
| | | | | | |
| Affiliated Issuers | | | | | | | | | | | | | | Dividend
Income | | | Capital Gain
Distributions | |
| MFS Institutional Money Market Portfolio | | | | | | | | | | | | | | | | $1,285,909 | | | | $— | |
(8) Impacts ofCOVID-19
The pandemic related to the global spread of novel coronavirus disease(COVID-19), which was first detected in December 2019, has resulted in significant disruptions to global business activity and the global economy, as well as the economies of individual countries, the financial performance of individual companies and sectors, and the securities and commodities markets in general. This pandemic, the full effects of which are still unknown, has resulted in substantial market volatility and may have adversely impacted the prices and liquidity of the fund’s investments and the fund’s performance.
84
REPORT OF INDEPENDENT REGISTERED PUBLIC ACCOUNTING FIRM
To the Board of Trustees of MFS Series Trust IX and the Shareholders of MFS Municipal Limited Maturity Fund:
Opinion on the Financial Statements and Financial Highlights
We have audited the accompanying statement of assets and liabilities of MFS Municipal Limited Maturity Fund (the “Fund”), including the portfolio of investments, as of April 30, 2020, the related statement of operations for the year then ended, the statements of changes in net assets for each of the two years in the period then ended, the financial highlights for each of the five years in the period then ended, and the related notes. In our opinion, the financial statements and financial highlights present fairly, in all material respects, the financial position of the Fund as of April 30, 2020, and the results of its operations for the year then ended, the changes in its net assets for each of the two years in the period then ended, and the financial highlights for each of the five years in the period then ended, in conformity with accounting principles generally accepted in the United States of America.
Basis for Opinion
These financial statements and financial highlights are the responsibility of the Fund’s management. Our responsibility is to express an opinion on the Fund’s financial statements and financial highlights based on our audits. We are a public accounting firm registered with the Public Company Accounting Oversight Board (United States) (PCAOB) and are required to be independent with respect to the Fund in accordance with the U.S. federal securities laws and the applicable rules and regulations of the Securities and Exchange Commission and the PCAOB.
We conducted our audits in accordance with the standards of the PCAOB. Those standards require that we plan and perform the audit to obtain reasonable assurance about whether the financial statements and financial highlights are free of material misstatement, whether due to error or fraud. The Fund is not required to have, nor were we engaged to perform, an audit of its internal control over financial reporting. As part of our audits we are required to obtain an understanding of internal control over financial reporting but not for the purpose of expressing an opinion on the effectiveness of the Fund’s internal control over financial reporting. Accordingly, we express no such opinion. Our audits included performing procedures to assess the risks of material misstatement of the financial statements and financial highlights, whether due to error or fraud, and performing procedures that respond to those risks. Such procedures included examining, on a test basis, evidence regarding the amounts and disclosures in the financial statements and financial highlights.
Our audits also included evaluating the accounting principles used and significant estimates made by management, as well as evaluating the overall presentation of the financial statements and financial highlights. Our procedures included confirmation of securities owned as of April 30, 2020, by correspondence with the custodian and
85
Report of Independent Registered Public Accounting Firm – continued
brokers; when replies were not received from brokers, we performed other auditing procedures. We believe that our audits provide a reasonable basis for our opinion.
DELOITTE & TOUCHE LLP
Boston, Massachusetts
June 16, 2020
We have served as the auditor of one or more of the MFS investment companies since 1924.
86
TRUSTEES AND OFFICERS — IDENTIFICATION AND BACKGROUND
The Trustees and Officers of the Trust, as of June 1, 2020, are listed below, together with their principal occupations during the past five years. (Their titles may have varied during that period.) The address of each Trustee and Officer is 111 Huntington Avenue, Boston, Massachusetts 02199-7618.
| | | | | | | | | | |
Name, Age | | Position(s)
Held with Fund | | Trustee/Officer Since (h) | | Number of
MFS Funds
overseen
by the
Trustee | | Principal
Occupations During the Past Five Years | | Other Directorships
During the Past
Five Years (j) |
| INTERESTED TRUSTEES |
Robert J. Manning (k)
(age 56) | | Trustee | | February 2004 | | 133 | | Massachusetts Financial Services Company, Executive Chairman (since January 2017); Director; Chairman of the Board; Chief Executive Officer (until 2015);Co-Chief Executive Officer (2015-2016) | | N/A |
| | | | | |
Robin A. Stelmach (k) (age 58) | | Trustee | | January 2014 | | 133 | | Massachusetts Financial Services Company, Vice Chair (since January 2017); Chief Operating Officer and Executive Vice President (until January 2017) | | N/A |
| INDEPENDENT TRUSTEES |
John P. Kavanaugh (age 65) | | Trustee and Chair of Trustees | | January 2009 | | 133 | | Private investor | | N/A |
| | | | | |
Steven E. Buller (age 68) | | Trustee | | February 2014 | | 133 | | Financial Accounting Standards Advisory Council, Chairman (2014-2015); Public Company Accounting Oversight Board, Standing Advisory Group, Member (until 2014); BlackRock, Inc. (investment management), Managing Director (until 2014), BlackRock Finco UK (investment management), Director (until 2014) | | N/A |
87
Trustees and Officers – continued
| | | | | | | | | | |
Name, Age | | Position(s)
Held with Fund | | Trustee/Officer Since (h) | | Number of
MFS Funds
overseen
by the
Trustee | | Principal
Occupations During the Past Five Years | | Other Directorships
During the Past
Five Years (j) |
John A. Caroselli (age 65) | | Trustee | | March 2017 | | 133 | | JC Global Advisors, LLC (management consulting), President (since 2015); First Capital Corporation (commercial finance), Executive Vice President (until 2015) | | N/A |
| | | | | |
Maureen R. Goldfarb (age 65) | | Trustee | | January 2009 | | 133 | | Private investor | | N/A |
| | | | | |
Peter D. Jones
(age 64) | | Trustee | | January 2019 | | 133 | | Franklin Templeton Distributors, Inc. (investment management), President (until 2015); Franklin Templeton Institutional, LLC (investment management), Chairman (until 2015) | | N/A |
| | | | | |
James W. Kilman, Jr.
(age 59) | | Trustee | | January 2019 | | 133 | | Burford Capital Limited (finance and investment management), Chief Financial Officer (since 2019); KielStrand Capital LLC (family office), Chief Executive Officer (since 2016); Morgan Stanley & Co. (financial services), Vice Chairman of Investment Banking,Co-Head of Diversified Financials Coverage – Financial Institutions Investment Banking Group (until 2016) | | Alpha-En Corporation, Director(2016-2019) |
88
Trustees and Officers – continued
| | | | | | | | | | |
Name, Age | | Position(s)
Held with Fund | | Trustee/Officer Since (h) | | Number of
MFS Funds
overseen
by the
Trustee | | Principal
Occupations During the Past Five Years | | Other Directorships
During the Past
Five Years (j) |
Clarence Otis, Jr. (age 64) | | Trustee | | March 2017 | | 133 | | Darden Restaurants, Inc., Chief Executive Officer (until 2014) | | VF Corporation, Director; Verizon Communications, Inc., Director; The Travelers Companies, Director; Federal Reserve Bank of Atlanta, Director (until 2015) |
| | | | | |
Maryanne L. Roepke (age 64) | | Trustee | | May 2014 | | 133 | | American Century Investments (investment management), Senior Vice President and Chief Compliance Officer (until 2014) | | N/A |
| | | | | |
Laurie J. Thomsen
(age 62) | | Trustee | | March 2005 | | 133 | | Private investor | | The Travelers Companies, Director; Dycom Industries, Inc., Director (since 2015) |
| | | | | | | | |
Name, Age | | Position(s) Held with Fund | | Trustee/Officer
Since (h) | | Number of
MFS Funds
for which
the Person
is an Officer | | Principal
Occupations During the Past Five Years |
| OFFICERS | | | | | | | | |
Christopher R. Bohane (k)
(age 46) | | Assistant Secretary and Assistant Clerk | | July 2005 | | 133 | | Massachusetts Financial Services Company, Senior Vice President and Associate General Counsel |
| | | | |
Kino Clark (k) (age 51) | | Assistant Treasurer | | January 2012 | | 133 | | Massachusetts Financial Services Company, Vice President |
| | | | |
John W. Clark, Jr. (k) (age 53) | | Assistant Treasurer | | April 2017 | | 133 | | Massachusetts Financial Services Company, Vice President (since March 2017); Deutsche Bank (financial services), Department Head – Treasurer’s Office (until February 2017) |
89
Trustees and Officers – continued
| | | | | | | | |
Name, Age | | Position(s) Held with Fund | | Trustee/Officer
Since (h) | | Number of
MFS Funds
for which
the Person
is an Officer | | Principal
Occupations During the Past Five Years |
Thomas H. Connors (k) (age 60) | | Assistant Secretary and Assistant Clerk | | September 2012 | | 133 | | Massachusetts Financial Services Company, Vice President and Senior Counsel |
| | | | |
David L. DiLorenzo (k)
(age 51) | | President | | July 2005 | | 133 | | Massachusetts Financial Services Company, Senior Vice President |
| | | | |
Heidi W. Hardin (k) (age 52) | | Secretary and Clerk | | April 2017 | | 133 | | Massachusetts Financial Services Company, Executive Vice President and General Counsel (since March 2017); Harris Associates (investment management), General Counsel (from September 2015 to January 2017); Janus Capital Management LLC (investment management), Senior Vice President and General Counsel (until September 2015) |
| | | | |
Brian E. Langenfeld (k) (age 47) | | Assistant Secretary and Assistant Clerk | | June 2006 | | 133 | | Massachusetts Financial Services Company, Vice President and Senior Counsel |
| | | | |
Amanda S. Mooradian (k) (age 41) | | Assistant Secretary and Assistant Clerk | | September 2018 | | 133 | | Massachusetts Financial Services Company, Assistant Vice President and Senior Counsel |
| | | | |
Susan A. Pereira (k)
(age 49) | | Assistant Secretary and Assistant Clerk | | July 2005 | | 133 | | Massachusetts Financial Services Company, Vice President and Assistant General Counsel |
| | | | |
Kasey L. Phillips (k) (age 49) | | Assistant Treasurer | | September 2012 | | 133 | | Massachusetts Financial Services Company, Vice President |
| | | | |
Matthew A. Stowe (k) (age 45) | | Assistant Secretary and Assistant Clerk | | October 2014 | | 133 | | Massachusetts Financial Services Company, Vice President and Assistant General Counsel |
| | | | |
Martin J. Wolin (k) (age 52) | | Chief Compliance Officer | | July 2015 | | 133 | | Massachusetts Financial Services Company, Senior Vice President and Chief Compliance Officer (since July 2015); Mercer (financial service provider), Chief Risk and Compliance Officer, North America and Latin America (until June 2015) |
90
Trustees and Officers – continued
| | | | | | | | |
Name, Age | | Position(s) Held with Fund | | Trustee/Officer
Since (h) | | Number of
MFS Funds
for which
the Person
is an Officer | | Principal
Occupations During the Past Five Years |
James O. Yost (k)
(age 59) | | Treasurer | | September 1990 | | 133 | | Massachusetts Financial Services Company, Senior Vice President |
| (h) | Date first appointed to serve as Trustee/officer of an MFS Fund. Each Trustee has served continuously since appointment unless indicated otherwise. For the period from December 15, 2004 until February 22, 2005, Mr. Manning served as Advisory Trustee. From January 2012 through December 2016, Messrs. DiLorenzo and Yost served as Treasurer and Deputy Treasurer of the Funds, respectively. |
| (j) | Directorships or trusteeships of companies required to report to the Securities and Exchange Commission (i.e., “public companies”). |
| (k) | “Interested person” of the Trust within the meaning of the Investment Company Act of 1940 (referred to as the 1940 Act), which is the principal federal law governing investment companies like the fund, as a result of a position with MFS. The address of MFS is 111 Huntington Avenue, Boston, Massachusetts 02199-7618. |
Each Trustee (other than Messrs. Jones and Kilman) has been elected by shareholders and each Trustee and Officer holds office until his or her successor is chosen and qualified or until his or her earlier death, resignation, retirement or removal. Messrs. Jones and Kilman became Trustees of the Funds on January 1, 2019. The Trust does not hold annual meetings for the purpose of electing Trustees, and Trustees are not elected for fixed terms. Under the terms of the Board’s retirement policy, an Independent Trustee shall retire at the end of the calendar year in which he or she reaches the earlier of 75 years of age or 15 years of service on the Board (or, in the case of any Independent Trustee who joined the Board prior to 2015, 20 years of service on the Board).
Messrs. Buller, Kilman and Otis and Ms. Roepke are members of the Trust’s Audit Committee.
Each of the Interested Trustees and certain Officers hold comparable officer positions with certain affiliates of MFS.
The Statement of Additional Information for a Fund includes further information about the Trustees and is available without charge upon request by calling1-800-225-2606.
| | |
| Investment Adviser | | Custodian |
Massachusetts Financial Services Company
111 Huntington Avenue Boston, MA 02199-7618 | | JPMorgan Chase Bank, NA 4 Metrotech Center New York, NY 11245 |
| Distributor | | Independent Registered Public Accounting Firm |
MFS Fund Distributors, Inc.
111 Huntington Avenue Boston, MA 02199-7618 | | Deloitte & Touche LLP 200 Berkeley Street Boston, MA 02116 |
| Portfolio Manager(s) | | |
Jason Kosty Geoffrey Schechter | | |
91
STATEMENT REGARDING LIQUIDITY RISK MANAGEMENT PROGRAM
The fund has adopted and implemented a liquidity risk management program (the “Program”) as required by Rule22e-4 under the Investment Company Act of 1940, as amended. The fund’s Board of Trustees (the “Board”) has designated MFS as the administrator of the Program. The Program is reasonably designed to assess and manage the liquidity risk of the fund. Liquidity risk is the risk that the fund could not meet requests to redeem shares issued by the fund without significant dilution of remaining investors’ interests.
MFS provided a written report to the Board for consideration at its April 2020 meeting that addressed the operation of the Program and provided an assessment of the adequacy and effectiveness of the Program during the period from the adoption of the Program on December 1, 2018 to December 31, 2019 (the “Covered Period”). The report concluded that during the Covered Period the Program had operated effectively and had adequately and effectively been implemented to assess and manage the fund’s liquidity risk. MFS also reported that there were no liquidity events that impacted the fund or its ability to timely meet redemptions without dilution to existing shareholders during the Covered Period.
There can be no assurance that the Program will achieve its objectives in the future. Further information on liquidity risk, and other principal risks to which an investment in the fund may be subject, can be found in the prospectus.
92
PROXY VOTING POLICIES AND INFORMATION
MFS votes proxies on behalf of the fund pursuant to proxy voting policies and procedures that are available without charge, upon request, by calling1-800-225-2606, by visitingmfs.com/proxyvoting,or by visiting the SEC’s Web site athttp://www.sec.gov.
Information regarding how the fund voted proxies relating to portfolio securities during the most recent twelve-month period ended June 30 is available by August 31 of each year without charge by visitingmfs.com/proxyvoting,or by visiting the SEC’s Web site athttp://www.sec.gov.
QUARTERLY PORTFOLIO DISCLOSURE
The fund files a complete schedule of portfolio holdings with the SEC for the first and third quarters of each fiscal year as an exhibit to its reports on Form N-PORT. The fund’s Form N-PORT reports are available on the SEC’s website athttp://www.sec.gov. A shareholder can obtain the portfolio holdings report for the first and third quarters of the fund’s fiscal year atmfs.com/openendfunds by choosing the fund’s name and then selecting the “Resources” tab and clicking on “Prospectus and Reports”.
FURTHER INFORMATION
From time to time, MFS may post important information about the fund or the MFS funds on the MFS web site (mfs.com). This information is available athttps://www.mfs.com/en-us/what-we-do/announcements.htmlor atmfs.com/openendfundsby choosing the fund’s name.
INFORMATION ABOUT FUND CONTRACTS AND LEGAL CLAIMS
The fund has entered into contractual arrangements with an investment adviser, administrator, distributor, shareholder servicing agent, 529 program manager (if applicable), and custodian who each provide services to the fund. Unless expressly stated otherwise, shareholders are not parties to, or intended beneficiaries of these contractual arrangements, and these contractual arrangements are not intended to create any shareholder right to enforce them against the service providers or to seek any remedy under them against the service providers, either directly or on behalf of the fund.
Under the Trust’s By-Laws and Declaration of Trust, any claims asserted against or on behalf of the MFS Funds, including claims against Trustees and Officers, must be brought in state and federal courts located within the Commonwealth of Massachusetts.
FEDERAL TAX INFORMATION (unaudited)
The fund will notify shareholders of amounts for use in preparing 2020 income tax forms in January 2021. The following information is provided pursuant to provisions of the Internal Revenue Code.
Of the dividends paid from net investment income during the fiscal year, 97.83% is designated as exempt interest dividends for federal income tax purposes. If the fund has earned income on private activity bonds, a portion of the dividends paid may be considered a tax preference item for purposes of computing a shareholder’s alternative minimum tax.
93
rev. 3/16
| | | | |
| | | |
FACTS | | WHAT DOES MFS DO WITH YOUR PERSONAL INFORMATION? | |  |
| | |
| Why? | | Financial companies choose how they share your personal information. Federal law gives consumers the right to limit some but not all sharing. Federal law also requires us to tell you how we collect, share, and protect your personal information. Please read this notice carefully to understand what we do. |
| | |
| What? | | The types of personal information we collect and share depend on the product or service you have with us. This information can include: • Social Security number and account balances • Account transactions and transaction history • Checking account information and wire transfer instructions When you areno longer our customer, we continue to share your information as described in this notice. |
| | |
| How? | | All financial companies need to share customers’ personal information to run their everyday business. In the section below, we list the reasons financial companies can share their customers’ personal information; the reasons MFS chooses to share; and whether you can limit this sharing. |
| | | | |
Reasons we can share your
personal information | | Does MFS
share? | | Can you limit
this sharing? |
For our everyday business purposes – such as to process your transactions, maintain your account(s), respond to court orders and legal investigations, or report to credit bureaus | | Yes | | No |
For our marketing purposes – to offer our products and services to you | | No | | We don’t share |
For joint marketing with other financial companies | | No | | We don’t share |
For our affiliates’ everyday business purposes – information about your transactions and experiences | | No | | We don’t share |
For our affiliates’ everyday business purposes – information about your creditworthiness | | No | | We don’t share |
| For nonaffiliates to market to you | | No | | We don’t share |
| | |
| | |
| Questions? | | Call800-225-2606 or go tomfs.com. |
94
| | |
| Who we are |
| Who is providing this notice? | | MFS Funds, MFS Investment Management, MFS Institutional Advisors, Inc., and MFS Heritage Trust Company. |
| | |
| What we do |
| How does MFS protect my personal information? | | To protect your personal information from unauthorized access and use, we use security measures that comply with federal law. These measures include procedural, electronic, and physical safeguards for the protection of the personal information we collect about you. |
| How does MFS collect my personal information? | | We collect your personal information, for example, when you • open an account or provide account information • direct us to buy securities or direct us to sell your securities • make a wire transfer We also collect your personal information from others, such as credit bureaus, affiliates, or other companies. |
| Why can’t I limit all sharing? | | Federal law gives you the right to limit only • sharing for affiliates’ everyday business purposes – information about your creditworthiness • affiliates from using your information to market to you • sharing for nonaffiliates to market to you State laws and individual companies may give you additional rights to limit sharing. |
| | |
| Definitions |
| Affiliates | | Companies related by common ownership or control. They can be financial and nonfinancial companies. • MFS does not share personal information with affiliates, except for everyday business purposes as described on page one of this notice. |
| Nonaffiliates | | Companies not related by common ownership or control. They can be financial and nonfinancial companies. • MFS does not share with nonaffiliates so they can market to you. |
| Joint marketing | | A formal agreement between nonaffiliated financial companies that together market financial products or services to you. • MFS doesn’t jointly market. |
| | |
| Other important information |
| If you own an MFS product or receive an MFS service in the name of a third party such as a bank or broker-dealer, their privacy policy may apply to you instead of ours. |
95
Save paper with eDelivery.

| MFS® will send you prospectuses, |
reports, and proxies directly viae-mail so you will get information faster with less mailbox clutter.
To sign up:
1. Go to mfs.com.
2. Log in via MFS® Access.
3. Select eDelivery.
If you own your MFS fund shares through a financial institution or a retirement plan, MFS® TALK, MFS® Access, or eDelivery may not be available to you.
CONTACT
WEB SITE
mfs.com
MFS TALK
1-800-637-8255
24 hours a day
ACCOUNT SERVICE AND LITERATURE
Shareholders
1-800-225-2606
Financial advisors
1-800-343-2829
Retirement plan services
1-800-637-1255
MAILING ADDRESS
MFS Service Center, Inc.
P.O. Box 219341
Kansas City, MO 64121-9341
OVERNIGHT MAIL
MFS Service Center, Inc.
Suite 219341
430 W 7th Street
Kansas City, MO 64105-1407
Annual Report
April 30, 2020

MFS® Total Return Bond Fund

Beginning on January 1, 2021, as permitted by regulations adopted by the U.S. Securities and Exchange Commission, paper copies of the fund’s annual and semiannual shareholder reports will no longer be sent by mail, unless you specifically request paper copies of the reports. Instead, the complete reports will be made available on the fund’s Web site (funds.mfs.com), and you will be notified by mail each time a report is posted and provided with a Web site link to access the report.
If you are already signed up to receive shareholder reports by email, you will not be affected by this change and you need not take any action. You may sign up to receive shareholder reports and other communications from the fund by email by contacting your financial intermediary (such as a broker-dealer or bank) or, if you hold your shares directly with the fund, by calling 1-800-225-2606 or by logging on to MFS Access at mfs.com.
Beginning on January 1, 2019, you may elect to receive all future reports in paper free of charge. Contact your financial intermediary to request that you continue to receive paper copies of your shareholder reports. If you invest directly with the fund, you can call 1-800-225-2606 or send an email request to orderliterature@mfs.com to let the fund know that you wish to continue receiving paper copies of your shareholder reports. Your election to receive reports in paper will apply to all funds held in your account if you invest through your financial intermediary or all funds held with the MFS fund complex if you invest directly.
RBF-ANN
MFS® Total Return Bond Fund
CONTENTS
The report is prepared for the general information of shareholders. It is authorized for distribution to prospective investors only when preceded or accompanied by a current prospectus.
NOT FDIC INSURED• MAY LOSE VALUE• NO BANK GUARANTEE

LETTER FROM THE EXECUTIVE CHAIR
Dear Shareholders:
Markets experienced dramatic swings in early 2020 as the coronavirus pandemic crippled the global economy for a time. Optimism over the development of vaccines
and therapeutics, along with a decline in cases in countries hit early in the outbreak, has brightened the economic and market outlook during the second quarter, though a great deal of uncertainty remains on how long the aftereffects of the lockdowns will linger.
Global central banks have taken aggressive, coordinated steps to cushion the economic and market fallout related to the virus, and governments are undertaking unprecedented levels of fiscal stimulus. As uncertainty recedes, these measures can help build a supportive environment and encourage economic recovery. In the aftermath of the crisis, there are likely to be societal changes as
households, businesses, and governments adjust to a new reality, and these alterations could change the investment landscape. For investors, occurrences such as theCOVID-19 outbreak demonstrate the importance of having a deep understanding of company fundamentals, and our global research platform has been built to do just that.
Here at MFS®, we aim to help our clients navigate the growing complexity of the markets and world economies. Our long-term investment philosophy and commitment to the responsible allocation of capital allow us to tune out the noise and uncover what we believe are the best, most durable investment opportunities in the market. Through our powerful global investment platform, we combine collective expertise, thoughtful risk management, and long-term discipline to create sustainable value for investors.
Respectfully,

Robert J. Manning
Executive Chair
MFS Investment Management
June 16, 2020
The opinions expressed in this letter are subject to change and may not be relied upon for investment advice. No forecasts can be guaranteed.
1
PORTFOLIO COMPOSITION
Portfolio structure (i)
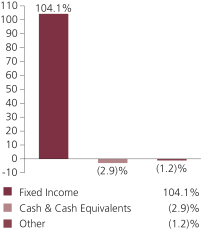
| | | | |
| Fixed income sectors (i) | |
| Investment Grade Corporates | | | 41.4% | |
| Mortgage-Backed Securities | | | 22.0% | |
| Commercial Mortgage-Backed Securities | | | 11.2% | |
| High Yield Corporates | | | 9.6% | |
| U.S. Treasury Securities | | | 6.9% | |
| Collateralized Debt Obligations | | | 6.7% | |
| Municipal Bonds | | | 2.4% | |
| Asset-Backed Securities | | | 2.2% | |
| Emerging Markets Bonds | | | 0.9% | |
| U.S. Government Agencies | | | 0.6% | |
| Non-U.S. Government Bonds | | | 0.1% | |
| Residential Mortgage-Backed Securities | | | 0.1% | |
| | | | |
| Composition including fixed income credit quality (a)(i) | |
| AAA | | | 12.4% | |
| AA | | | 5.5% | |
| A | | | 17.9% | |
| BBB | | | 25.0% | |
| BB | | | 4.7% | |
| B | | | 1.2% | |
| CCC | | | 0.1% | |
| CC (o) | | | 0.0% | |
| D (o) | | | 0.0% | |
| U.S. Government | | | 9.7% | |
| Federal Agencies | | | 22.6% | |
| Not Rated | | | 5.0% | |
| Cash & Cash Equivalents | | | (2.9)% | |
| Other | | | (1.2)% | |
|
| Portfolio facts (i) | |
| Average Duration (d) | | | 5.7 | |
| Average Effective Maturity (m) | | | 8.5 yrs. | |
2
Portfolio Composition – continued
| (a) | For all securities other than those specifically described below, ratings are assigned to underlying securities utilizing ratings from Moody’s, Fitch, and Standard & Poor’s rating agencies and applying the following hierarchy: If all three agencies provide a rating, the middle rating (after dropping the highest and lowest ratings) is assigned; if two of the three agencies rate a security, the lower of the two is assigned. Ratings are shown in the S&P and Fitch scale (e.g., AAA). Securities rated BBB or higher are considered investment grade. All ratings are subject to change. U.S. Government includes securities issued by the U.S. Department of the Treasury. Federal Agencies includes rated and unrated U.S. Agency fixed-income securities, U.S. Agency mortgage-backed securities, and collateralized mortgage obligations of U.S. Agency mortgage-backed securities. Not Rated includes fixed income securities and fixed income derivatives, which have not been rated by any rating agency. The fund may or may not have held all of these instruments on this date. The fund is not rated by these agencies. |
| (d) | Duration is a measure of how much a bond’s price is likely to fluctuate with general changes in interest rates, e.g., if rates rise 1.00%, a bond with a5-year duration is likely to lose about 5.00% of its value due to the interest rate move. |
| (i) | For purposes of this presentation, the components include the value of securities, and reflect the impact of the equivalent exposure of derivative positions, if any. These amounts may be negative from time to time. Equivalent exposure is a calculated amount that translates the derivative position into a reasonable approximation of the amount of the underlying asset that the portfolio would have to hold at a given point in time to have the same price sensitivity that results from the portfolio’s ownership of the derivative contract. When dealing with derivatives, equivalent exposure is a more representative measure of the potential impact of a position on portfolio performance than value. The bond component will include any accrued interest amounts. |
| (m) | In determining each instrument’s effective maturity for purposes of calculating the fund’s dollar-weighted average effective maturity, MFS uses the instrument’s stated maturity or, if applicable, an earlier date on which MFS believes it is probable that a maturity-shortening device (such as a put,pre-refunding or prepayment) will cause the instrument to be repaid. Such an earlier date can be substantially shorter than the instrument’s stated maturity. |
Where the fund holds convertible bonds, they are treated as part of the equity portion of the portfolio.
Cash & Cash Equivalents includes any cash, investments in money market funds, short-term securities, and other assets less liabilities. Please see the Statement of Assets and Liabilities for additional information related to the fund’s cash position and other assets and liabilities.
From time to time Cash & Cash Equivalents may be negative due to timing of cash receipts and disbursements.
Other includes equivalent exposure from currency derivatives and/or any offsets to derivative positions and may be negative.
Percentages are based on net assets as of April 30, 2020.
The portfolio is actively managed and current holdings may be different.
3
MANAGEMENT REVIEW
Summary of Results
For the twelve months ended April 30, 2020, Class A shares of the MFS Total Return Bond Fund (fund) provided a total return of 7.30%, at net asset value. This compares with a return of 10.84% for the fund’s benchmark, the Bloomberg Barclays U.S. Aggregate Bond Index.
Market Environment
Market volatility soared at the end of the period as COVID-19, the illness caused by the novel coronavirus first detected in China, spread around the world in early 2020. Government-imposed social distancing measures taken to slow the spread of the virus forced the shutdown of large portions of the global economy. In an attempt to limit the economic fallout of the crisis, central bankers and policymakers have taken a variety of actions unprecedented in both size and speed, but despite their best efforts, a global recession has begun. Given the unique circumstances surrounding the genesis of the downturn, it is difficult to forecast how long the crisis will linger.
High levels of investor uncertainty saw equity prices plunge, market volatility rise and large segments of global fixed income markets freeze as investors sought liquidity wherever they could find it. As the global economy rapidly slowed, a disagreement between Saudi Arabia and Russia over OPEC+ production cuts resulted in the Saudis shelving the OPEC+ arrangement and increasing oil output at the same time that global oil demand was plummeting, which compounded market turmoil. The resulting drop in prices undercut oil exporters, many of which are in emerging markets, as well as a large segment of the high-yield credit market.
Central banks around the world responded quickly and massively to the crisis with programs to improve liquidity and support markets. They proved largely successful in helping to restore market function, easing volatility and stimulating a market rebound at the end of the period. Monetary easing measures were complimented by large fiscal stimulus plans in developed countries. Even emerging market countries were able to implement counter-cyclical policies, a departure from the usual market-dictated response to risk-off crises, due to relatively manageable external liabilities and balance of payments in many countries and persistently low inflation.
As is often the case in a serious crisis, market vulnerabilities have been revealed. For example, companies that have added significant leverage to their balance sheets in recent years by borrowing to fund dividend payments and stock buybacks may find it difficult to follow that path in the future, and investors may not reward them if they do. Recapitalizations by some of these highly leveraged firms could dilute existing shareholders. Very long supply chains designed to squeeze out every bit of savings may be shifted closer to home markets if companies seek to emphasize resiliency over cost after a series of supply disruptions. The aftereffects of the global pandemic could impact consumer, business and government behavior in ways it will be difficult to forecast.
Factors Affecting Performance
Relative to the Bloomberg Barclays U.S. Aggregate Bond Index, the fund’s lesser exposure to thetreasurysector, andgreater exposure to both theindustrialsand
4
Management Review – continued
commercial mortgage-backed securities (CMBS)sectors, held back relative results. Anout-of-benchmark exposure to thecollateralized mortgage obligations (CMO)sector further weighed on relative performance. Additionally, the fund’s yield curve (y) positioning weakened relative performance as interest rates generally declined over the reporting period. Bond selection within “AAA” rated (r) issues further dampened relative results.
Security selection within “BBB” rated bonds, particularly within theindustrials sector, was a primary contributor to relative returns. Strong bond selection within theutilitiessector also supported relative performance.
Respectfully,
Portfolio Manager(s)
Alexander Mackey, Joshua Marston, and Robert Persons
Note to Shareholders: Effective December 31, 2019, Alexander Mackey was added as a Portfolio Manager of the Fund.
| (r) | Bonds rated “BBB”, “Baa”, or higher are considered investment grade; bonds rated “BB”, “Ba”, or below are considerednon-investment grade. The sources for bond quality ratings are Moody’s Investors Service, Standard & Poor’s and Fitch, Inc. and are applied using the following hierarchy: If all three agencies provide a rating, the middle rating (after dropping the highest and lowest ratings) is assigned; if two of the three agencies rate a security, the lower of the two is assigned. Ratings are shown in the S&P and Fitch scale (e.g., AAA). For securities which are not rated by any of the three agencies, the security is considered Not Rated. |
| (y) | A yield curve graphically depicts the yields of different maturity bonds of the same credit quality and type; a normal yield curve is upward sloping, with short-term rates lower than long-term rates. |
The views expressed in this report are those of the portfolio manager(s) only through the end of the period of the report as stated on the cover and do not necessarily reflect the views of MFS or any other person in the MFS organization. These views are subject to change at any time based on market or other conditions, and MFS disclaims any responsibility to update such views. These views may not be relied upon as investment advice or an indication of trading intent on behalf of any MFS portfolio. References to specific securities are not recommendations of such securities, and may not be representative of any MFS portfolio’s current or future investments.
5
PERFORMANCE SUMMARYTHROUGH 4/30/20
The following chart illustrates a representative class of the fund’s historical performance in comparison to its benchmark(s). Performance results include the deduction of the maximum applicable sales charge and reflect the percentage change in net asset value, including reinvestment of dividends and capital gains distributions. The performance of other share classes will be greater than or less than that of the class depicted below. Benchmarks are unmanaged and may not be invested in directly. Benchmark returns do not reflect sales charges, commissions or expenses. (See Notes to Performance Summary.)
Performance data shown represents past performance and is no guarantee of future results. Investment return and principal value fluctuate so your shares, when sold, may be worth more or less than the original cost; current performance may be lower or higher than quoted. The performance shown does not reflect the deduction of taxes, if any, that a shareholder would pay on fund distributions or the redemption of fund shares.
Growth of a Hypothetical $10,000 Investment
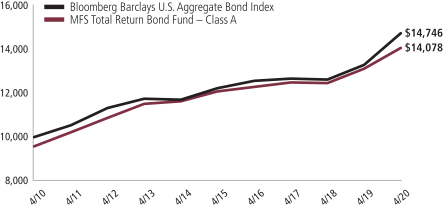
6
Performance Summary – continued
Total Returns through 4/30/20
Average annual without sales charge
| | | | | | | | | | | | |
| | | Share Class | | Class Inception Date | | 1-yr | | 5-yr | | 10-yr | | |
| | | A | | 1/04/99 | | 7.30% | | 3.10% | | 3.93% | | |
| | | B | | 12/29/00 | | 6.50% | | 2.35% | | 3.16% | | |
| | | C | | 12/29/00 | | 6.40% | | 2.25% | | 3.06% | | |
| | | I | | 1/04/99 | | 7.56% | | 3.27% | | 4.09% | | |
| | | R1 | | 4/01/05 | | 6.40% | | 2.25% | | 3.06% | | |
| | | R2 | | 10/31/03 | | 6.93% | | 2.76% | | 3.58% | | |
| | | R3 | | 4/01/05 | | 7.20% | | 3.02% | | 3.84% | | |
| | | R4 | | 4/01/05 | | 7.46% | | 3.27% | | 4.09% | | |
| | | R6 | | 5/01/06 | | 7.67% | | 3.39% | | 4.16% | | |
| | | 529A | | 7/31/02 | | 7.28% | | 3.09% | | 3.90% | | |
| | | 529B | | 7/31/02 | | 6.63% | | 2.25% | | 3.03% | | |
| | | 529C | | 7/31/02 | | 6.34% | | 2.20% | | 3.00% | | |
| | | | |
| Comparative benchmark(s) | | | | | | | | |
| | | Bloomberg Barclays U.S. Aggregate Bond Index (f) | | 10.84% | | 3.80% | | 3.96% | | |
| | | | |
| Average annual with sales charge | | | | | | | | |
| | | A
With Initial Sales Charge (4.25%) | | 2.74% | | 2.21% | | 3.48% | | |
| | | B
With CDSC (Declining over six years from 4% to 0%) (v) | | 2.50% | | 1.99% | | 3.16% | | |
| | | C
With CDSC (1% for 12 months) (v) | | 5.40% | | 2.25% | | 3.06% | | |
| | | 529A
With Initial Sales Charge (4.25%) | | 2.72% | | 2.20% | | 3.45% | | |
| | | 529B
With CDSC (Declining over six years from 4% to 0%) (v) | | 2.63% | | 1.89% | | 3.03% | | |
| | | 529C
With CDSC (1% for 12 months) (v) | | 5.34% | | 2.20% | | 3.00% | | |
CDSC – Contingent Deferred Sales Charge.
Class I, R1, R2, R3, R4, and R6 shares do not have a sales charge.
On May 30, 2012, Class W shares were redesignated Class R5 shares. Total returns for Class R5 shares prior to May 30, 2012 reflect the performance history of Class W shares which had different fees and expenses than Class R5 shares. Effective August 26, 2016, Class R5 shares were renamed Class R6 shares.
| (f) | Source: FactSet Research Systems Inc. |
| (v) | Assuming redemption at the end of the applicable period. |
7
Performance Summary – continued
Benchmark Definition(s)
Bloomberg Barclays U.S. Aggregate Bond Index - a market capitalization-weighted index that measures the performance of the U.S. investment-grade, fixed rate bond market, with index components for government and corporate securities, mortgage pass-through securities, and asset-backed securities with at least one year to final maturity. BLOOMBERG® is a trademark and service mark of Bloomberg Finance L.P. and its affiliates (collectively “Bloomberg”). BARCLAYS® is a trademark and service mark of Barclays Bank Plc (collectively with its affiliates, “Barclays”), used under license. Bloomberg or Bloomberg’s licensors, including Barclays, own all proprietary rights in the Bloomberg Barclays Indices. Neither Bloomberg nor Barclays approves or endorses this material, or guarantees the accuracy or completeness of any information herein, or makes any warranty, express or implied, as to the results to be obtained therefrom, and, to the maximum extent allowed by law, neither shall have any liability or responsibility for injury or damages arising in connection therewith.
It is not possible to invest directly in an index.
Notes to Performance Summary
Class 529 shares are only available in conjunction with qualified tuition programs, such as the MFS 529 Savings Plan. There also is an additional fee, which is detailed in the program description, on qualified tuition programs. If this fee was reflected, the performance for Class 529 shares would have been lower. This annual fee is waived for Oregon residents and for those accounts with assets of $25,000 or more.
Average annual total return represents the average annual change in value for each share class for the periods presented.
Performance results reflect any applicable expense subsidies and waivers in effect during the periods shown. Without such subsidies and waivers the fund’s performance results would be less favorable. Please see the prospectus and financial statements for complete details.
Performance results do not include adjustments made for financial reporting purposes in accordance with U.S. generally accepted accounting principles and may differ from amounts reported in the financial highlights.
From time to time the fund may receive proceeds from litigation settlements, without which performance would be lower.
8
EXPENSE TABLE
Fund expenses borne by the shareholders during the period, November 1, 2019 through April 30, 2020
As a shareholder of the fund, you incur two types of costs: (1) transaction costs, including sales charges (loads) on certain purchase or redemption payments, and (2) ongoing costs, including management fees; distribution and service(12b-1) fees; and other fund expenses. This example is intended to help you understand your ongoing costs (in dollars) of investing in the fund and to compare these costs with the ongoing costs of investing in other mutual funds.
The example is based on an investment of $1,000 invested at the beginning of the period and held for the entire period November 1, 2019 through April 30, 2020.
Actual Expenses
The first line for each share class in the following table provides information about actual account values and actual expenses. You may use the information in this line, together with the amount you invested, to estimate the expenses that you paid over the period. Simply divide your account value by $1,000 (for example, an $8,600 account value divided by $1,000 = 8.6), then multiply the result by the number in the first line under the heading entitled “Expenses Paid During Period” to estimate the expenses you paid on your account during this period.
Hypothetical Example for Comparison Purposes
The second line for each share class in the following table provides information about hypothetical account values and hypothetical expenses based on the fund’s actual expense ratio and an assumed rate of return of 5% per year before expenses, which is not the fund’s actual return. The hypothetical account values and expenses may not be used to estimate the actual ending account balance or expenses you paid for the period. You may use this information to compare the ongoing costs of investing in the fund and other funds. To do so, compare this 5% hypothetical example with the 5% hypothetical examples that appear in the shareholder reports of the other funds.
Please note that the expenses shown in the table are meant to highlight your ongoing costs only and do not reflect any transactional costs, such as sales charges (loads). Therefore, the second line for each share class in the table is useful in comparing ongoing costs only, and will not help you determine the relative total costs of owning different funds. In addition, if these transactional costs were included, your costs would have been higher.
9
Expense Table – continued
| | | | | | | | | | | | | | | | | | |
Share
Class | | | | Annualized
Expense Ratio | | | Beginning
Account Value
11/01/19 | | | Ending Account Value
4/30/20 | | | Expenses Paid During
Period (p) 11/01/19-4/30/20 | |
| A | | Actual | | | 0.67% | | | | $1,000.00 | | | | $1,015.19 | | | | $3.36 | |
| | Hypothetical (h) | | | 0.67% | | | | $1,000.00 | | | | $1,021.53 | | | | $3.37 | |
| B | | Actual | | | 1.42% | | | | $1,000.00 | | | | $1,011.40 | | | | $7.10 | |
| | Hypothetical (h) | | | 1.42% | | | | $1,000.00 | | | | $1,017.80 | | | | $7.12 | |
| C | | Actual | | | 1.52% | | | | $1,000.00 | | | | $1,011.81 | | | | $7.60 | |
| | Hypothetical (h) | | | 1.52% | | | | $1,000.00 | | | | $1,017.30 | | | | $7.62 | |
| I | | Actual | | | 0.52% | | | | $1,000.00 | | | | $1,016.87 | | | | $2.61 | |
| | Hypothetical (h) | | | 0.52% | | | | $1,000.00 | | | | $1,022.28 | | | | $2.61 | |
| R1 | | Actual | | | 1.52% | | | | $1,000.00 | | | | $1,011.81 | | | | $7.60 | |
| | Hypothetical (h) | | | 1.52% | | | | $1,000.00 | | | | $1,017.30 | | | | $7.62 | |
| R2 | | Actual | | | 1.02% | | | | $1,000.00 | | | | $1,013.42 | | | | $5.11 | |
| | Hypothetical (h) | | | 1.02% | | | | $1,000.00 | | | | $1,019.79 | | | | $5.12 | |
| R3 | | Actual | | | 0.77% | | | | $1,000.00 | | | | $1,014.68 | | | | $3.86 | |
| | Hypothetical (h) | | | 0.77% | | | | $1,000.00 | | | | $1,021.03 | | | | $3.87 | |
| R4 | | Actual | | | 0.52% | | | | $1,000.00 | | | | $1,016.87 | | | | $2.61 | |
| | Hypothetical (h) | | | 0.52% | | | | $1,000.00 | | | | $1,022.28 | | | | $2.61 | |
| R6 | | Actual | | | 0.42% | | | | $1,000.00 | | | | $1,017.40 | | | | $2.11 | |
| | Hypothetical (h) | | | 0.42% | | | | $1,000.00 | | | | $1,022.77 | | | | $2.11 | |
| 529A | | Actual | | | 0.70% | | | | $1,000.00 | | | | $1,015.06 | | | | $3.51 | |
| | Hypothetical (h) | | | 0.70% | | | | $1,000.00 | | | | $1,021.38 | | | | $3.52 | |
| 529B | | Actual | | | 1.08% | | | | $1,000.00 | | | | $1,013.37 | | | | $5.41 | |
| | Hypothetical (h) | | | 1.08% | | | | $1,000.00 | | | | $1,019.49 | | | | $5.42 | |
| 529C | | Actual | | | 1.57% | | | | $1,000.00 | | | | $1,010.66 | | | | $7.85 | |
| | Hypothetical (h) | | | 1.57% | | | | $1,000.00 | | | | $1,017.06 | | | | $7.87 | |
| (h) | 5% class return per year before expenses. |
| (p) | “Expenses Paid During Period” are equal to each class’s annualized expense ratio, as shown above, multiplied by the average account value over the period, multiplied by 182/366 (to reflect theone-half year period). Expenses paid do not include any applicable sales charges (loads). If these transaction costs had been included, your costs would have been higher. |
Notes to Expense Table
For the period from January 1, 2020 through April 30, 2020, the distribution fee for Class 529B was not imposed. Had the distribution fee been imposed throughout the entire six month period, the annualized expense ratio, the actual expenses paid during the period,
10
Expense Table – continued
and the hypothetical expenses paid during the period would have been approximately 1.57%, $7.86, and $7.87 for Class 529B. See Note 3 in the Notes to Financial Statements for additional information.
Each class with a Rule12b-1 service fee is subject to a rebate of a portion of such fee. Such rebates are included in the expense ratios above and are outside of the expense limitation arrangement. For Class 529A and Class 529C shares, this rebate reduced the expense ratios above by 0.02% and 0.01%, respectively. See Note 3 in the Notes to Financial Statements for additional information.
11
PORTFOLIO OF INVESTMENTS
4/30/20
The Portfolio of Investments is a complete list of all securities owned by your fund. It is categorized by broad-based asset classes.
| | | | | | | | |
| | |
| Issuer | | Shares/Par | | | Value ($) | |
| Bonds - 102.3% | | | | | | |
| Aerospace - 0.9% | | | | | | |
| Boeing Co., 5.805%, 5/01/2050 | | $ | 17,424,000 | | | $ | 17,424,000 | |
| Raytheon Technologies Corp., 4.125%, 11/16/2028 | | | 8,351,000 | | | | 9,692,513 | |
| Raytheon Technologies Corp., 4.05%, 5/04/2047 | | | 13,687,000 | | | | 16,756,390 | |
| TransDigm, Inc., 6.5%, 7/15/2024 | | | 19,607,000 | | | | 18,111,966 | |
| | | | | | | | |
| | | | | | | $ | 61,984,869 | |
| Apparel Manufacturers - 0.4% | | | | | | |
| NIKE, Inc., 3.375%, 3/27/2050 | | $ | 21,728,000 | | | $ | 24,361,232 | |
| | |
| Asset-Backed & Securitized - 20.2% | | | | | | |
| AIMCO Properties CLO LP,2015-AA, “BR”, FLR, 2.519% (LIBOR | | | | | | | | |
| - 3mo. + 1.3%), 1/15/2028 (n) | | $ | 16,000,000 | | | $ | 14,872,720 | |
| Allegro CLO Ltd.,2014-1RA, “A2”, FLR, 2.709% (LIBOR - 3mo. + 1.6%), 10/21/2028 (n) | | | 14,107,464 | | | | 13,146,859 | |
| ALM Loan Funding, CLO,2015-16A, “AAR2”, FLR, 2.119% | | | | | | | | |
| (LIBOR - 3mo. + 0.90%), 7/15/2027 (n) | | | 5,829,993 | | | | 5,717,964 | |
| Arbor Realty Trust, Inc., CLO,2018-FL1, “A”, FLR, 1.964% (LIBOR - 1mo. + 1.15%), 6/15/2028 (n) | | | 18,855,000 | | | | 17,802,378 | |
| Arbor Realty Trust, Inc., CLO,2019-FL1, “D”, FLR, 3.314% | | | | | | | | |
| (LIBOR - 1mo. + 2.5%), 5/15/2037 (n) | | | 19,810,500 | | | | 16,642,425 | |
| Arbor Realty Trust, Inc., CLO,2020-FL1, “C”, FLR, 2.775% | | | | | | | | |
| (LIBOR - 1mo. + 2.05%), 2/15/2035 (n) | | | 12,681,500 | | | | 10,800,719 | |
| AREIT CRE Trust, 2019-CRE3, “A”, FLR, 1.814% (LIBOR - 1mo. + 1.02%), 9/14/2036 (n) | | | 4,150,000 | | | | 3,808,131 | |
| AREIT CRE Trust, 2019-CRE3, “B”, FLR, 2.344% (LIBOR - 1mo. + 1.55%), 9/14/2036 (n) | | | 7,734,500 | | | | 6,413,958 | |
| AREIT CRE Trust, 2019-CRE3, “C”, FLR, 2.694% (LIBOR - 1mo. + 1.9%), 9/14/2036 (n) | | | 6,751,000 | | | | 5,322,725 | |
| AREIT CRE Trust, 2019-CRE3, “D”, FLR, 3.444% (LIBOR - 1mo. + 2.65%), 9/14/2036 (n) | | | 6,243,500 | | | | 4,326,983 | |
| Atrium XII Corp.,2012-A, “B1R”, FLR, 2.448% (LIBOR - 3mo. + 1.35%), 4/22/2027 (n) | | | 15,670,000 | | | | 14,808,448 | |
| Babson CLO Ltd.,2013-IIA, “BR”, FLR, 2.385% (LIBOR - 3mo. + 1.25%), 1/20/2028 (n) | | | 23,804,982 | | | | 22,628,337 | |
| Bancorp Commercial Mortgage Trust, 2017-CRE2, “B”, FLR, 2.414% (LIBOR - 1mo. + 1.6%), 8/15/2032 (n) | | | 6,227,000 | | | | 6,161,699 | |
| Bancorp Commercial Mortgage Trust, 2018-CRE3, “A”, FLR, 1.664% (LIBOR - 1mo. + 0.85%), 1/15/2033 (n) | | | 1,175,744 | | | | 1,106,232 | |
12
Portfolio of Investments – continued
| | | | | | | | |
| | |
| Issuer | | Shares/Par | | | Value ($) | |
| Bonds - continued | | | | | | |
| Asset-Backed & Securitized - continued | | | | | | |
| Bancorp Commercial Mortgage Trust, 2018-CRE3, “AS”, FLR, 2.064% (LIBOR - 1mo. + 1.25%), 1/15/2033 (n) | | $ | 8,980,149 | | | $ | 8,394,611 | |
| Bancorp Commercial Mortgage Trust, 2018-CRE3, “D”, FLR, 3.514% (LIBOR - 1mo. + 2.7%), 1/15/2033 (n) | | | 3,967,693 | | | | 3,512,887 | |
| Bancorp Commercial Mortgage Trust, 2018-CRE4, “AS”, FLR, 1.914% (LIBOR - 1mo. + 1.1%), 9/15/2035 (n) | | | 5,805,000 | | | | 5,206,297 | |
| Bancorp Commercial Mortgage Trust, 2018-CRE4, “B”, FLR, 2.064% (LIBOR - 1mo. + 1.25%), 9/15/2035 (n) | | | 5,220,000 | | | | 4,475,941 | |
| Bancorp Commercial Mortgage Trust, 2018-CRE4, “D”, FLR, 2.914% (LIBOR - 1mo. + 2.1%), 9/15/2035 (n) | | | 3,770,000 | | | | 3,018,865 | |
| Bancorp Commercial Mortgage Trust, 2019-CRE5, “A”, FLR, 1.814% (LIBOR - 1mo. + 1%), 3/15/2036 (n) | | | 10,352,568 | | | | 9,719,985 | |
| Bancorp Commercial Mortgage Trust, 2019-CRE5, “AS”, FLR, 2.164% (LIBOR - 1mo. + 1.35%), 3/15/2036 (n) | | | 3,787,074 | | | | 3,421,466 | |
| Bancorp Commercial Mortgage Trust, 2019-CRE6, “B”, FLR, 2.364% (LIBOR - 1mo. + 1.55%), 9/15/2036 (n) | | | 25,943,734 | | | | 24,074,042 | |
| Bancorp Commercial Mortgage Trust, 2019-CRE6, “D”, FLR, 3.114% (LIBOR - 1mo. + 2.54%), 9/15/2036 (n) | | | 1,845,000 | | | | 1,574,820 | |
| Barclays Commercial Mortgage Securities LLC,2019-C5, “A4”, 3.063%, 11/15/2052 | | | 9,055,000 | | | | 9,675,215 | |
| Bayview Commercial Asset Trust, 0%, 12/25/2036 (n) | | | 2,830,980 | | | | 283 | |
| Bayview Commercial Asset Trust, FLR, 0.797% (LIBOR - 1mo. + 0.31%), 8/25/2035 (n) | | | 164,524 | | | | 143,618 | |
| Bayview Financial Acquisition Trust, 5.638%, 11/28/2036 | | | 125,270 | | | | 125,195 | |
| Bayview Financial Revolving Mortgage Loan Trust, FLR, 2.04% | | | | | | | | |
| (LIBOR - 1mo. + 1.6%), 12/28/2040 (n) | | | 1,151,235 | | | | 1,124,189 | |
| BDS Ltd.,2018-FL2, “A”, FLR, 1.701% (LIBOR - 1mo. + 0.95%), 8/15/2035 (n) | | | 7,861,192 | | | | 7,440,524 | |
| BDS Ltd.,2019-FL4, “A”, FLR, 1.914% (LIBOR - 1mo. + 1.10%), 8/15/2036 (n) | | | 15,377,000 | | | | 13,435,700 | |
| Benchmark Mortgage Trust,2019-B10, “A4”, 3.717%, 3/15/2062 | | | 25,850,000 | | | | 28,889,128 | |
| BSPRT Ltd.,2019-FL5, “C”, FLR, 2.814% (LIBOR - 1mo. + 2%), 5/15/2029 (n) | | | 9,385,000 | | | | 7,618,480 | |
| Business Jet Securities LLC,2018-1, “A”, 4.335%, 2/15/2033 (n) | | | 10,876,479 | | | | 9,394,319 | |
| BXMT Ltd.,2020-FL2, “B”, FLR, 2.151% (LIBOR - 1mo. + 1.4%), 2/16/2037 (n) | | | 6,104,500 | | | | 5,493,480 | |
| Cantor Commercial Real Estate,2019-CF2, “A5”, 2.874%, 11/15/2052 | | | 20,960,656 | | | | 21,566,629 | |
| Capital Automotive,2020-1A, “A4”, REIT, 3.19%, 2/15/2050 (n) | | | 8,191,260 | | | | 7,874,212 | |
Chesapeake Funding II LLC,2017-4A, “A1”,
2.12%, 11/15/2029 (n) | | | 5,227,607 | | | | 5,176,347 | |
13
Portfolio of Investments – continued
| | | | | | | | |
| | |
| Issuer | | Shares/Par | | | Value ($) | |
| Bonds - continued | | | | | | |
| Asset-Backed & Securitized - continued | | | | | | |
Chesapeake Funding II LLC,2018-1A, “A1”,
3.04%, 4/15/2030 (n) | | $ | 7,406,756 | | | $ | 7,388,494 | |
| Citigroup Commercial Mortgage Trust, 2014-GC25, “A4”, 3.635%, 10/10/2047 | | | 4,461,971 | | | | 4,666,092 | |
| Citigroup Commercial Mortgage Trust, 2015-GC27, “A5”, 3.137%, 2/10/2048 | | | 11,154,926 | | | | 11,626,832 | |
| Citigroup Commercial Mortgage Trust,2016-P6, “A5”, 3.72%, 12/10/2049 | | | 5,948,000 | | | | 6,408,299 | |
| Citigroup Commercial Mortgage Trust,2019-C7, “A4”, 3.102%, 12/15/2072 | | | 2,680,000 | | | | 2,871,647 | |
| CLNC Ltd.,2019-FL1, “B”, FLR, 2.618% (LIBOR - 1mo. + 1.9%), 8/20/2035 (n) | | | 6,270,000 | | | | 5,272,568 | |
| CLNC Ltd.,2019-FL1, “C”, FLR, 3.118% (LIBOR - 1mo. + 2.4%), 8/20/2035 (n) | | | 10,190,000 | | | | 7,960,207 | |
| Commercial Mortgage Pass-Through Certificates, 2014-LC19 | | | | | | | | |
| “A4”, 3.183%, 2/10/2048 | | | 9,743,000 | | | | 10,191,792 | |
| Commercial Mortgage Pass-Through Certificates, 2019-BN17, | | | | | | | | |
| “A4”, 3.714%, 4/15/2052 | | | 16,029,000 | | | | 17,772,202 | |
| Commercial Mortgage Pass-Through Certificates, 2019-BN24, | | | | | | | | |
| “A3”, 2.96%, 11/15/2062 | | | 2,933,332 | | | | 3,112,576 | |
| Commercial Mortgage Trust,2015-DC1, “A5”, 3.35%, 2/10/2048 | | | 9,577,577 | | | | 9,855,822 | |
| Commercial Mortgage Trust, 2015-LC21, “A4”, 3.708%, 7/10/2048 | | | 9,963,398 | | | | 10,697,584 | |
| Commercial Mortgage Trust,2015-PC1, “A5”, 3.902%, 7/10/2050 | | | 4,781,393 | | | | 5,054,817 | |
| Commercial Mortgage Trust, 2017-COR2, “A3”, 3.51%, 9/10/2050 | | | 26,790,000 | | | | 28,688,042 | |
| Countrywide Asset-Backed Certificates, 5.43%, 2/25/2033 | | | 69,431 | | | | 60,706 | |
| CPS Auto Trust,2019-B, “B”, 3.09%, 4/17/2023 (n) | | | 6,326,000 | | | | 6,326,271 | |
| Credit-Based Asset Servicing & Securitization LLC, 3.433%, 1/25/2037 | | | 1,298,521 | | | | 533,063 | |
| Credit-Based Asset Servicing & Securitization LLC, 3.647%, 3/25/2037 | | | 1,402,029 | | | | 662,467 | |
| CSAIL Commercial Mortgage Trust,2015-C2, “A4”, 3.504%, 6/15/2057 | | | 3,687,246 | | | | 3,787,744 | |
| Cutwater Ltd.,2014-1A, “BR”, FLR, 3.619% (LIBOR - 3mo. + 2.4%), 7/15/2026 (n) | | | 5,280,000 | | | | 4,892,258 | |
| Cutwater Ltd.,2015-1A, “BR”, FLR, 3.019% (LIBOR - 3mo. + 1.8%), 1/15/2029 (n) | | | 27,695,000 | | | | 25,702,982 | |
| DT Auto Owner Trust,2019-2A, “C”, 3.18%, 2/18/2025 (n) | | | 9,572,000 | | | | 9,504,356 | |
| Exantas Capital Corp. CLO Ltd., 2018-RS06, “B”, FLR, 1.901% | | | | | | | | |
| (LIBOR - 1mo. + 1.15%), 6/15/2035 (n) | | | 5,150,000 | | | | 4,640,109 | |
14
Portfolio of Investments – continued
| | | | | | | | |
| | |
| Issuer | | Shares/Par | | | Value ($) | |
| Bonds - continued | | | | | | |
| Asset-Backed & Securitized - continued | | | | | | |
| Exantas Capital Corp. CLO Ltd., 2019-RS07, “B”, FLR, 2.45% (LIBOR - 1mo. + 1.7%), 4/15/2036 (n) | | $ | 7,541,500 | | | $ | 6,415,430 | |
| Exeter Automobile Receivables Trust,2020-1A, 2.49%, 1/15/2025 (n) | | | 6,480,000 | | | | 6,238,501 | |
| Falcon Franchise Loan LLC, 11.145%, 1/05/2023 (n) | | | 2,604 | | | | 152 | |
| Flagship CLO,2014-8A, “CRR”, FLR, 2.976% (LIBOR - 3mo. + 1.8%), 1/16/2026 (n) | | | 4,600,000 | | | | 4,195,757 | |
| Flatiron CLO Ltd.,2015-1A, “BR”, FLR, 2.619% (LIBOR - 3mo. + 1.4%), 4/15/2027 (n) | | | 18,297,137 | | | | 17,732,989 | |
| Flatiron CLO Ltd.,2015-1A, “CR”, FLR, 3.119% (LIBOR - 3mo. + 1.9%), 4/15/2027 (n) | | | 4,000,000 | | | | 3,741,037 | |
| Fort CRE LLC,2018-1A, “A1”, FLR, 1.975% (LIBOR - 1mo. + 1.35%), 11/16/2035 (n) | | | 16,088,000 | | | | 15,010,490 | |
| Galaxy CLO Ltd.,2018-29A, “A”, FLR, 2.482% (LIBOR - 3mo. + 0.79%), 11/15/2026 (n) | | | 14,352,967 | | | | 14,016,490 | |
| Galaxy CLO Ltd.,2018-29A, “B”, FLR, 3.092% (LIBOR - 3mo. + 1.4%), 11/15/2026 (n) | | | 8,043,105 | | | | 7,573,846 | |
| Galaxy CLO Ltd.,2018-29A, “C”, FLR, 3.372% (LIBOR - 3mo. + 1.68%), 11/15/2026 (n) | | | 6,670,000 | | | | 6,131,591 | |
| GLS Auto Receivables Trust,2020-1A, “A”, 2.17%, 2/15/2024 (n) | | | 7,572,233 | | | | 7,479,420 | |
| GMAC Mortgage Corp. Loan Trust, 5.805%, 10/25/2036 | | | 277,834 | | | | 279,416 | |
| GMF Floorplan Owner Revolving Trust,2017-2, “C”, 2.63%, 7/15/2022 (n) | | | 8,001,000 | | | | 7,948,747 | |
| Grand Avenue CRE Ltd.,2019-FL1, “A”, FLR, 1.934% (LIBOR -1mo. + 1.12%), 6/15/2037 (n) | | | 15,457,500 | | | | 14,833,651 | |
| Granite Point Mortgage Trust, Inc.,2018-FL1, “A” FLR, 1.573% | | | | | | | | |
| (LIBOR - 1mo. + 0.9%), 11/21/2035 (n) | | | 2,980,825 | | | | 2,944,429 | |
| GS Mortgage Securities Trust, 2015-GC30, “A4”, 3.382%, 5/10/2050 | | | 11,461,699 | | | | 12,084,428 | |
| GS Mortgage Securities Trust, 2019-GSA1, “A4”, 3.047%, 11/10/2052 | | | 33,075,961 | | | | 34,995,445 | |
| HarbourView CLO VII Ltd., 7RA, “B”, FLR, 2.835% (LIBOR - 3mo. | | | | | | | | |
| + 1.7%), 7/18/2031 (n) | | | 15,920,000 | | | | 14,035,693 | |
| Hunt CRE Ltd.,2018-FL2, “AS”, FLR, 2.264% (LIBOR - 1mo. + 1.45%), 8/15/2028 (n) | | | 1,933,000 | | | | 1,706,334 | |
| Hunt CRE Ltd.,2018-FL2, “B”, FLR, 2.464% (LIBOR - 1mo. + 1.65%), 8/15/2028 (n) | | | 3,975,500 | | | | 3,461,199 | |
| Hunt CRE Ltd.,2018-FL2, “C”, FLR, 3.164% (LIBOR - 1mo. + 2.35%), 8/15/2028 (n) | | | 1,312,500 | | | | 1,128,704 | |
| IMPAC CMB Trust, FLR, 1.227% (LIBOR - 1mo. + 0.74%), 11/25/2034 | | | 41,477 | | | | 39,984 | |
15
Portfolio of Investments – continued
| | | | | | | | |
| | |
| Issuer | | Shares/Par | | | Value ($) | |
| Bonds - continued | | | | | | |
| Asset-Backed & Securitized - continued | | | | | | |
| IMPAC CMB Trust, FLR, 1.407% (LIBOR - 1mo. + 0.92%), 11/25/2034 | | $ | 20,739 | | | $ | 19,540 | |
| IMPAC Secured Assets Corp., FLR, 0.837% (LIBOR - 1mo. + 0.35%), 5/25/2036 | | | 139,038 | | | | 118,707 | |
| Invitation Homes Trust, 2018-SFR2, “A”, FLR, 1.601% (LIBOR -1mo. + 0.85%), 12/17/2036 (n) | | | 3,800,320 | | | | 3,674,172 | |
| JPMBB Commercial Mortgage Securities Trust,2014-C26, 3.494%, 1/15/2048 | | | 13,025,174 | | | | 13,756,178 | |
| JPMBB Commercial Mortgage Securities Trust,2015-C28, “A4”, 3.227%, 10/15/2048 | | | 23,872,958 | | | | 25,093,673 | |
| JPMDB Commercial Mortgage Securities Trust,2017-C7, 3.409%, 10/15/2050 | | | 11,500,000 | | | | 12,410,277 | |
| JPMorgan Chase Commercial Mortgage Securities Corp., 5.963%, 7/15/2042 (n) | | | 936,915 | | | | 612,533 | |
| JPMorgan Chase Commercial Mortgage Securities Corp., 3.454%, 9/15/2050 | | | 12,800,212 | | | | 13,838,727 | |
| KKR Real Estate Financial Trust, Inc.,2018-FL1, “C”, FLR, 2.751% (LIBOR - 1mo. + 2%), 6/15/2036 (n) | | | 13,421,000 | | | | 11,545,979 | |
| LoanCore Ltd., 2018-CRE1, “AS”, FLR, 2.314% (LIBOR - 1mo. + 1.5%), 5/15/2028 (n) | | | 21,675,000 | | | | 19,967,487 | |
| LoanCore Ltd., 2018-CRE1, “C”, FLR, 3.364% (LIBOR - 1mo. + 2.55%), 5/15/2028 (n) | | | 5,705,000 | | | | 4,816,775 | |
| LoanCore Ltd., 2018-CRE1, “C”, FLR, 2.764% (LIBOR - 1mo. + 1.95%), 4/15/2034 (n) | | | 6,171,000 | | | | 4,875,844 | |
| LoanCore Ltd., 2018-CRE1/CRE3, “B”, FLR, 2.414% (LIBOR -1mo. + 1.6%), 4/15/2034 (n) | | | 5,946,500 | | | | 5,021,636 | |
| LoanCore Ltd., 2019-CRE2, “D”, FLR, 3.264% (LIBOR - 1mo. + 2.45%), 5/15/2036 (n) | | | 3,164,500 | | | | 2,469,205 | |
| LoanCore Ltd., 2019-CRE3, “AS”, FLR, 2.184% (LIBOR - 1mo. + 1.37%), 4/15/2034 (n) | | | 4,622,000 | | | | 4,144,476 | |
| Loomis, Sayles & Co., CLO,2015-2A, “A1R”, FLR, 2.118% | | | | | | | | |
| (LIBOR - 3mo. + 0.9%), 4/15/2028 (n) | | | 19,525,916 | | | | 18,647,249 | |
| Merrill Lynch Mortgage Investors, Inc., 3.792%, 2/25/2037 (a)(d)(q) | | | 1,940,612 | | | | 356,908 | |
| MF1 CLO Ltd.,2019-FL2, “AS”, FLR, 1.917% (LIBOR - 1mo. + 1.43%), 12/25/2034 (n) | | | 37,395,000 | | | | 33,868,311 | |
| Morgan Stanley Bank of America Merrill Lynch Trust,2015-C21, | | | | | | | | |
| “A4”, 3.338%, 3/15/2048 | | | 8,114,737 | | | | 8,398,949 | |
| Morgan Stanley Capital I Trust,2017-H1, “A5”, 3.53%, 6/15/2050 | | | 26,134,745 | | | | 28,175,529 | |
| Navistar Financial Dealer Note Master Owner Trust,2019-1, | | | | | | | | |
| “A”, FLR, 1.127% (LIBOR - 1mo. + 0.64%), 5/25/2024 (n) | | | 17,916,000 | | | | 17,548,197 | |
| Neuberger Berman CLO Ltd., 2017-16SA, “B”, FLR, 2.469% | | | | | | | | |
| (LIBOR - 3mo. + 1.25%), 1/15/2028 (n) | | | 11,830,000 | | | | 11,096,635 | |
16
Portfolio of Investments – continued
| | | | | | | | |
| | |
| Issuer | | Shares/Par | | | Value ($) | |
| Bonds - continued | | | | | | |
| Asset-Backed & Securitized - continued | | | | | | |
| NextGear Floorplan Master Owner Trust,2018-1A, “A2”, 3.22%, 2/15/2023 (n) | | $ | 7,285,000 | | | $ | 7,281,146 | |
| NextGear Floorplan Master Owner Trust,2019-2A, “A2”, 2.07%, 10/15/2024 (n) | | | 7,876,000 | | | | 7,596,798 | |
| OCP CLO Ltd.,2015-9A, “A2R”, FLR, 2.569% (LIBOR - 3mo. + 1.35%), 7/15/2027 (n) | | | 13,240,000 | | | | 12,595,000 | |
| Ownit Mortgage Loan Asset-Backed Certificates, 3.121%, 10/25/2035 | | | 580,585 | | | | 349,679 | |
| Palmer Square Loan Funding Ltd.,2020-1A, “A2”, FLR, 3.033% | | | | | | | | |
| (LIBOR - 3mo. + 1.35%), 2/20/2028 (n) | | | 13,300,000 | | | | 12,580,297 | |
| Palmer Square Loan Funding Ltd.,2020-1A, “B”, FLR, 3.583% | | | | | | | | |
| (LIBOR - 3mo. + 1.9%), 2/20/2028 (n) | | | 11,690,351 | | | | 10,827,404 | |
| Parallel Ltd.,2015-1A, “C1R”, FLR, 2.885% (LIBOR - 3mo. + 1.75%), 7/20/2027 (n) | | | 3,700,000 | | | | 3,374,426 | |
| Parallel Ltd.,2015-1A, “C2R”, FLR, 2.885% (LIBOR - 3mo. + 1.75%), 7/20/2027 (n) | | | 3,990,000 | | | | 3,638,908 | |
| Preferred Term Securities XIX Ltd., CDO, FLR, 1.091% (LIBOR -3mo. + 0.35%), 12/22/2035 (n) | | | 4,250,642 | | | | 3,575,852 | |
| Race Point CLO Ltd.,2013-8A,“AR-2”, FLR, 2.735% (LIBOR -3mo. + 1.04%), 2/20/2030 (n) | | | 13,350,298 | | | | 12,903,076 | |
| Residential Funding Mortgage Securities, Inc., 5.32%, 12/25/2035 | | | 854,530 | | | | 856,205 | |
| Santander Retail Auto Lease Trust,2019-A, “B”, 3.01%, 5/22/2023 (n) | | | 8,857,000 | | | | 8,915,141 | |
| Santander Retail Auto Lease Trust,2020-A, “C”, 2.08%, 3/20/2024 (n) | | | 8,132,000 | | | | 7,601,121 | |
| Securitized Term Auto Receivable Trust, 2019-CRTA, “B”, 2.453%, 3/25/2026 (n) | | | 6,337,670 | | | | 6,349,075 | |
| Securitized Term Auto Receivable Trust, 2019-CRTA, “C”, 2.849%, 3/25/2026 (n) | | | 7,557,439 | | | | 7,571,001 | |
| Shackleton CLO Ltd.,2015-8A, “CR”, FLR, 2.785% (LIBOR - 3mo. + 1.65%), 10/20/2027 (n) | | | 2,000,000 | | | | 1,768,194 | |
| Shelter Growth CRE,2018-FL1, “B”, FLR, 2.314% (LIBOR - 1mo. | | | | | | | | |
| + 1.5%), 1/15/2035 (n) | | | 5,110,949 | | | | 5,053,752 | |
| Thornburg Mortgage Securities Trust, FLR, 1.167% (LIBOR - 1mo. + 0.68%), 4/25/2043 | | | 3,430 | | | | 3,335 | |
| TICP CLO Ltd.,2018-IA, “A2”, FLR, 2.491% (LIBOR - 3mo. + 1.5%), 4/26/2028 (n) | | | 16,262,022 | | | | 15,469,591 | |
| UBS Commercial Mortgage Trust,2017-C7, “A4”, 3.679%, 12/15/2050 | | | 33,000,000 | | | | 35,234,153 | |
| UBS Commercial Mortgage Trust,2017-C8, “A4”, 3.983%, 2/15/2051 | | | 18,388,578 | | | | 19,969,444 | |
17
Portfolio of Investments – continued
| | | | | | | | |
| | |
| Issuer | | Shares/Par | | | Value ($) | |
| Bonds - continued | | | | | | |
| Asset-Backed & Securitized - continued | | | | | | |
| UBS Commercial Mortgage Trust,2019-C16, “A4”, 3.605%, 4/15/2052 | | $ | 15,000,000 | | | $ | 16,442,589 | |
| UBS Commercial Mortgage Trust,2019-C17, “A4”, 2.921%, 10/15/2052 | | | 39,643,739 | | | | 40,503,933 | |
| Veros Auto Receivables Trust,2020-1, “A”, 1.67%, 9/15/2023 (n) | | | 16,322,698 | | | | 16,179,060 | |
| Voya CLO Ltd.,2012-4A, “A2AR”, FLR, 3.119% (LIBOR - 3mo. + 1.90%), 10/15/2030 (n) | | | 6,560,000 | | | | 6,279,285 | |
| Wells Fargo Commercial Mortgage Trust,2015-C28, “A4”, 3.54%, 5/15/2048 | | | 15,451,790 | | | | 16,264,050 | |
| Wells Fargo Commercial Mortgage Trust,2016-C34, “A4”, 3.096%, 6/15/2049 | | | 7,740,000 | | | | 8,051,992 | |
| Wells Fargo Commercial Mortgage Trust, 2016-LC25, “A4”, 3.64%, 12/15/2059 | | | 25,027,917 | | | | 27,060,709 | |
| Wells Fargo Commercial Mortgage Trust,2017-C42, “A5”, 3.589%, 12/15/2050 | | | 13,470,000 | | | | 14,536,248 | |
| Wells Fargo Commercial Mortgage Trust,2018-C46, “A4”, 4.152%, 8/15/2051 | | | 4,840,000 | | | | 5,386,729 | |
| Wells Fargo Commercial Mortgage Trust,2019-C53, “A4”, 3.04%, 10/15/2052 | | | 32,977,910 | | | | 35,084,770 | |
| Wells Fargo Commercial Mortgage Trust,2019-C54, “A4”, 3.146%, 12/15/2052 | | | 41,394,790 | | | | 44,241,261 | |
| West CLO Ltd.,2014-1A, “A2R”, FLR, 2.485% (LIBOR - 3mo. + 1.35%), 7/18/2026 (n) | | | 16,679,192 | | | | 16,332,448 | |
| West CLO Ltd.,2014-1A, “CR”, FLR, 4.135% (LIBOR - 3mo. + 3%), 7/18/2026 (n) | | | 3,420,000 | | | | 3,093,058 | |
| Wind River CLO Ltd.,2012-1A, “CR2”, FLR, 3.269% (LIBOR -3mo. + 2.05%), 1/15/2026 (n) | | | 14,904,930 | | | | 14,278,416 | |
| Wind River CLO Ltd.,2015-2A, “CR”, FLR, 2.919% (LIBOR - 3mo. + 1.7%), 10/15/2027 (n) | | | 2,650,000 | | | | 2,424,726 | |
| | | | | | | | |
| | | | | | | $ | 1,384,716,333 | |
| Automotive - 0.7% | | | | | | |
| Allison Transmission, Inc., 4.75%, 10/01/2027 (n) | | $ | 20,690,000 | | | $ | 19,241,700 | |
| General Motors Financial Co., Inc., 4.35%, 4/09/2025 | | | 4,495,000 | | | | 4,257,725 | |
| General Motors Financial Co., Inc., 4%, 10/06/2026 | | | 2,482,000 | | | | 2,254,059 | |
| KAR Auction Services, Inc., 5.125%, 6/01/2025 (n) | | | 10,025,000 | | | | 8,538,293 | |
| Volkswagen Group of America, Inc., 3.2%, 9/26/2026 (n) | | | 12,214,000 | | | | 12,204,338 | |
| | | | | | | | |
| | | | | | | $ | 46,496,115 | |
| Broadcasting - 0.8% | | | | | | |
| Fox Corp., 4.709%, 1/25/2029 | | $ | 22,801,000 | | | $ | 26,537,622 | |
| Fox Corp., 3.5%, 4/08/2030 | | | 3,803,000 | | | | 4,103,083 | |
18
Portfolio of Investments – continued
| | | | | | | | |
| | |
| Issuer | | Shares/Par | | | Value ($) | |
| Bonds - continued | | | | | | |
| Broadcasting - continued | | | | | | |
| Netflix, Inc., 4.875%, 4/15/2028 | | $ | 4,480,000 | | | $ | 4,764,166 | |
| Prosus N.V., 3.68%, 1/21/2030 (n) | | | 17,751,000 | | | | 17,766,109 | |
| | | | | | | | |
| | | | | | | $ | 53,170,980 | |
| Brokerage & Asset Managers - 1.7% | | | | | | |
| Charles Schwab Corp., 3.2%, 3/02/2027 | | $ | 17,641,000 | | | $ | 18,800,223 | |
| Charles Schwab Corp., 3.2%, 1/25/2028 | | | 5,045,000 | | | | 5,364,360 | |
| Charles Schwab Corp., 5.375%, 4/30/2070 | | | 10,828,000 | | | | 11,085,165 | |
| E*TRADE Financial Corp., 2.95%, 8/24/2022 | | | 2,848,000 | | | | 2,907,760 | |
| E*TRADE Financial Corp., 3.8%, 8/24/2027 | | | 19,238,000 | | | | 20,698,750 | |
| E*TRADE Financial Corp., 4.5%, 6/20/2028 | | | 8,585,000 | | | | 9,617,302 | |
| Intercontinental Exchange, Inc., 3.1%, 9/15/2027 | | | 15,960,000 | | | | 17,292,660 | |
| Intercontinental Exchange, Inc., 3.75%, 9/21/2028 | | | 6,080,000 | | | | 6,927,333 | |
| Raymond James Financial, Inc., 4.95%, 7/15/2046 | | | 14,019,000 | | | | 16,576,675 | |
| TD Ameritrade Holding Corp., 2.95%, 4/01/2022 | | | 4,376,000 | | | | 4,493,727 | |
| TD Ameritrade Holding Corp., 3.3%, 4/01/2027 | | | 2,450,000 | | | | 2,617,980 | |
| | | | | | | | |
| | | | | | | $ | 116,381,935 | |
| Building - 0.8% | | | | | | |
| ABC Supply Co., Inc., 4%, 1/15/2028 (n) | | $ | 10,860,000 | | | $ | 10,304,185 | |
| Martin Marietta Materials, Inc., 4.25%, 7/02/2024 | | | 12,268,000 | | | | 13,086,060 | |
| Martin Marietta Materials, Inc., 3.45%, 6/01/2027 | | | 2,718,000 | | | | 2,775,422 | |
| Martin Marietta Materials, Inc., 2.5%, 3/15/2030 | | | 6,820,000 | | | | 6,394,365 | |
| Martin Marietta Materials, Inc., 4.25%, 12/15/2047 | | | 8,147,000 | | | | 8,313,831 | |
| Masco Corp., 4.375%, 4/01/2026 | | | 11,111,000 | | | | 11,569,974 | |
| | | | | | | | |
| | | | | | | $ | 52,443,837 | |
| Business Services - 0.9% | | | | | | |
| Equinix, Inc., 5.375%, 5/15/2027 | | $ | 16,204,000 | | | $ | 17,309,113 | |
| Fidelity National Information Services, Inc., 3%, 8/15/2026 | | | 14,166,000 | | | | 15,039,675 | |
| Fiserv, Inc., 3.5%, 7/01/2029 | | | 17,501,000 | | | | 19,188,523 | |
| MSCI, Inc., 5.375%, 5/15/2027 (n) | | | 3,900,000 | | | | 4,202,250 | |
| MSCI, Inc., 3.625%, 9/01/2030 (n) | | | 6,330,000 | | | | 6,409,125 | |
| NXP Semiconductors N.V., 2.7%, 5/01/2025 (n) | | | 1,921,000 | | | | 1,942,311 | |
| | | | | | | | |
| | | | | | | $ | 64,090,997 | |
| Cable TV - 1.9% | | | | | | |
CCO Holdings LLC/CCO Holdings Capital Corp.,
5%, 2/01/2028 (n) | | $ | 18,670,000 | | | $ | 19,168,256 | |
| Charter Communications Operating LLC/Charter Communications Operating Capital Corp., 4.908%, 7/23/2025 | | | 10,635,000 | | | | 12,003,223 | |
| Charter Communications Operating LLC/Charter Communications Operating Capital Corp., 6.384%, 10/23/2035 | | | 7,183,000 | | | | 9,223,555 | |
| Comcast Corp., 3.45%, 2/01/2050 | | | 15,455,000 | | | | 17,339,988 | |
19
Portfolio of Investments – continued
| | | | | | | | |
| | |
| Issuer | | Shares/Par | | | Value ($) | |
| Bonds - continued | | | | | | |
| Cable TV - continued | | | | | | |
| Cox Communications, Inc., 3.15%, 8/15/2024 (n) | | $ | 14,525,000 | | | $ | 15,350,105 | |
| CSC Holdings LLC, 5.5%, 5/15/2026 (n) | | | 17,700,000 | | | | 18,361,980 | |
| Sirius XM Radio, Inc., 5.375%, 7/15/2026 (n) | | | 18,970,000 | | | | 19,681,375 | |
| Time Warner Cable, Inc., 4.5%, 9/15/2042 | | | 10,161,000 | | | | 10,729,884 | |
| Time Warner Entertainment Co. LP, 8.375%, 7/15/2033 | | | 4,688,000 | | | | 6,819,691 | |
| | | | | | | | |
| | | | | | | $ | 128,678,057 | |
| Computer Software - 1.1% | | | | | | |
| Dell Investments LLC/EMC Corp., 5.3%, 10/01/2029 (n) | | $ | 27,410,000 | | | $ | 28,534,509 | |
| Microsoft Corp., 2%, 8/08/2023 | | | 14,694,000 | | | | 15,329,496 | |
| Microsoft Corp., 3.125%, 11/03/2025 | | | 14,939,000 | | | | 16,650,530 | |
| Microsoft Corp., 4.1%, 2/06/2037 | | | 10,394,000 | | | | 12,951,151 | |
| | | | | | | | |
| | | | | | | $ | 73,465,686 | |
| Computer Software - Systems - 0.6% | | | | | | |
| Apple, Inc., 3.35%, 2/09/2027 | | $ | 20,686,000 | | | $ | 23,186,075 | |
| Apple, Inc., 4.375%, 5/13/2045 | | | 6,657,000 | | | | 8,684,726 | |
| Apple, Inc., 3.85%, 8/04/2046 | | | 3,194,000 | | | | 3,903,124 | |
| SS&C Technologies Holdings, Inc., 5.5%, 9/30/2027 (n) | | | 3,600,000 | | | | 3,690,000 | |
| | | | | | | | |
| | | | | | | $ | 39,463,925 | |
| Conglomerates - 0.9% | | | | | | |
| General Electric Co., 4.25%, 5/01/2040 | | $ | 7,872,000 | | | $ | 7,898,785 | |
| General Electric Co., 4.35%, 5/01/2050 | | | 7,840,000 | | | | 7,899,678 | |
| Otis Worldwide Corp., 2.565%, 2/15/2030 (n) | | | 16,730,000 | | | | 16,859,607 | |
| Westinghouse Air Brake Technologies Corp., 4.4%, 3/15/2024 | | | 8,019,000 | | | | 8,051,166 | |
| Westinghouse Air Brake Technologies Corp., 4.95%, 9/15/2028 | | | 20,520,000 | | | | 20,299,455 | |
| | | | | | | | |
| | | | | | | $ | 61,008,691 | |
| Consumer Products - 0.8% | | | | | | |
| Reckitt Benckiser Treasury Services PLC, 3.625%, 9/21/2023 (n) | | $ | 12,239,000 | | | $ | 12,953,951 | |
| Reckitt Benckiser Treasury Services PLC, 2.75%, 6/26/2024 (n) | | | 38,107,000 | | | | 39,318,112 | |
| | | | | | | | |
| | | | | | | $ | 52,272,063 | |
| Consumer Services - 0.8% | | | | | | |
| Booking Holdings, Inc., 2.75%, 3/15/2023 | | $ | 3,459,000 | | | $ | 3,518,041 | |
| Booking Holdings, Inc., 3.65%, 3/15/2025 | | | 22,057,000 | | | | 22,821,327 | |
| Booking Holdings, Inc., 4.5%, 4/13/2027 | | | 7,798,000 | | | | 8,388,775 | |
| Toll Road Investors Partnership II LP, Capital Appreciation, 0%, 2/15/2026 (n) | | | 5,237,000 | | | | 4,268,131 | |
| Toll Road Investors Partnership II LP, Capital Appreciation, 0%, 2/15/2029 (n) | | | 15,190,000 | | | | 10,134,343 | |
| Toll Road Investors Partnership II LP, Capital Appreciation, 0%, 2/15/2031 (n) | | | 5,237,000 | | | | 3,164,660 | |
20
Portfolio of Investments – continued
| | | | | | | | |
| | |
| Issuer | | Shares/Par | | | Value ($) | |
| Bonds - continued | | | | | | |
| Consumer Services - continued | | | | | | |
| Toll Road Investors Partnership II LP, Capital Appreciation, 0%, 2/15/2043 (n) | | $ | 17,800,000 | | | $ | 5,391,345 | |
| | | | | | | | |
| | | | | | | $ | 57,686,622 | |
| Containers - 0.3% | | | | | | |
| Crown Americas LLC/Crown Americas Capital Corp. VI, 4.75%, 2/01/2026 | | $ | 23,115,000 | | | $ | 23,750,662 | |
| | |
| Electronics - 0.8% | | | | | | |
| Broadcom Corp./Broadcom Cayman Finance Ltd., 3.875%, 1/15/2027 | | $ | 27,605,000 | | | $ | 28,777,620 | |
| Broadcom, Inc., 4.75%, 4/15/2029 (n) | | | 11,922,000 | | | | 13,104,288 | |
| Sensata Technologies B.V., 5%, 10/01/2025 (n) | | | 13,485,000 | | | | 13,412,181 | |
| | | | | | | | |
| | | | | | | $ | 55,294,089 | |
| Emerging Market Quasi-Sovereign - 0.4% | | | | | | |
| State Grid Overseas Investment (2016) Ltd. (People’s Republic of China), 2.75%, 5/04/2022 (n) | | $ | 29,692,000 | | | $ | 30,193,795 | |
| | |
| Energy - Integrated - 0.7% | | | | | | |
| Eni S.p.A., 4%, 9/12/2023 (n) | | $ | 14,045,000 | | | $ | 14,313,306 | |
| Eni S.p.A., 4.25%, 5/09/2029 (n) | | | 14,075,000 | | | | 14,361,906 | |
| Exxon Mobil Corp., 4.227%, 3/19/2040 | | | 6,373,000 | | | | 7,638,832 | |
| Exxon Mobil Corp., 3.452%, 4/15/2051 | | | 9,105,000 | | | | 9,958,867 | |
| | | | | | | | |
| | | | | | | $ | 46,272,911 | |
| Entertainment - 0.4% | | | | | | |
| Live Nation Entertainment, Inc., 4.75%, 10/15/2027 (n) | | $ | 12,785,000 | | | $ | 10,803,325 | |
| Six Flags Entertainment Corp., 4.875%, 7/31/2024 (n) | | | 22,065,000 | | | | 19,421,613 | |
| | | | | | | | |
| | | | | | | $ | 30,224,938 | |
| Financial Institutions - 0.6% | | | | | | |
| Avolon Holdings Funding Ltd., 5.25%, 5/15/2024 (n) | | $ | 15,775,000 | | | $ | 13,683,552 | |
| Avolon Holdings Funding Ltd., 3.95%, 7/01/2024 (n) | | | 13,150,000 | | | | 11,314,507 | |
| GE Capital International Funding Co., 4.418%, 11/15/2035 | | | 8,482,000 | | | | 8,839,664 | |
| Global Aircraft Leasing Co. Ltd., 6.5%, (6.5% cash or 7.25% PIK) 9/15/2024 (n)(p) | | | 13,105,000 | | | | 7,928,525 | |
| | | | | | | | |
| | | | | | | $ | 41,766,248 | |
| Food & Beverages - 1.7% | | | | | | |
| Anheuser-Busch Cos. LLC/Anheuser-Busch InBev Worldwide, | | | | | | | | |
| Inc., 4.9%, 2/01/2046 | | $ | 17,605,000 | | | $ | 20,312,485 | |
| Anheuser-Busch InBev Worldwide, Inc., 3.7%, 2/01/2024 | | | 5,084,000 | | | | 5,510,606 | |
| Anheuser-Busch InBev Worldwide, Inc., 5.45%, 1/23/2039 | | | 15,957,000 | | | | 19,225,401 | |
21
Portfolio of Investments – continued
| | | | | | | | |
| | |
| Issuer | | Shares/Par | | | Value ($) | |
| Bonds - continued | | | | | | |
| Food & Beverages - continued | | | | | | |
| Campbell Soup Co., 2.375%, 4/24/2030 | | $ | 3,747,000 | | | $ | 3,802,851 | |
| Campbell Soup Co., 3.125%, 4/24/2050 | | | 5,484,000 | | | | 5,471,426 | |
| Constellation Brands, Inc., 2.875%, 5/01/2030 | | | 3,083,000 | | | | 3,134,026 | |
| Constellation Brands, Inc., 3.75%, 5/01/2050 | | | 4,482,000 | | | | 4,557,718 | |
| Diageo Capital PLC, 2.125%, 4/29/2032 | | | 17,284,000 | | | | 17,321,503 | |
| General Mills, Inc., 2.875%, 4/15/2030 | | | 5,689,000 | | | | 6,086,237 | |
| JBS USA Lux S.A./JBS USA Finance, Inc., 5.5%, 1/15/2030 (n) | | | 4,480,000 | | | | 4,536,000 | |
| Keurig Dr Pepper, Inc., 3.2%, 5/01/2030 | | | 2,506,000 | | | | 2,669,760 | |
| Keurig Dr Pepper, Inc., 3.8%, 5/01/2050 | | | 5,134,000 | | | | 5,469,354 | |
| PepsiCo, Inc., 3.5%, 3/19/2040 | | | 9,485,000 | | | | 11,120,917 | |
| Pilgrim’s Pride Corp., 5.875%, 9/30/2027 (n) | | | 4,480,000 | | | | 4,533,536 | |
| Wm. Wrigley Jr. Co., 3.375%, 10/21/2020 (n) | | | 5,184,000 | | | | 5,232,242 | |
| | | | | | | | |
| | | | | | | $ | 118,984,062 | |
| Gaming & Lodging - 0.5% | | | | | | |
| GLP Capital LP/GLP Financing II, Inc., 5.375%, 11/01/2023 | | $ | 6,977,000 | | | $ | 6,767,690 | |
| GLP Capital LP/GLP Financing II, Inc., 5.25%, 6/01/2025 | | | 5,799,000 | | | | 5,640,107 | |
| GLP Capital LP/GLP Financing II, Inc., 5.375%, 4/15/2026 | | | 6,000,000 | | | | 5,977,500 | |
| Las Vegas Sands Corp., 3.5%, 8/18/2026 | | | 10,262,000 | | | | 9,765,222 | |
| Marriott International, Inc., 5.75%, 5/01/2025 | | | 7,589,000 | | | | 7,931,001 | |
| | | | | | | | |
| | | | | | | $ | 36,081,520 | |
| Insurance - 0.6% | | | | | | |
| American International Group, Inc., 3.75%, 7/10/2025 | | $ | 17,703,000 | | | $ | 18,894,579 | |
| American International Group, Inc., 3.9%, 4/01/2026 | | | 7,925,000 | | | | 8,579,830 | |
| American International Group, Inc., 4.7%, 7/10/2035 | | | 5,448,000 | | | | 6,288,026 | |
| American International Group, Inc., 4.5%, 7/16/2044 | | | 4,835,000 | | | | 5,340,959 | |
| | | | | | | | |
| | | | | | | $ | 39,103,394 | |
| Insurance - Health - 0.5% | | | | | | |
| Centene Corp., 4.625%, 12/15/2029 (n) | | $ | 6,228,000 | | | $ | 6,819,660 | |
| UnitedHealth Group, Inc., 2.375%, 10/15/2022 | | | 18,854,000 | | | | 19,506,483 | |
| UnitedHealth Group, Inc., 3.7%, 8/15/2049 | | | 6,386,000 | | | | 7,500,802 | |
| | | | | | | | |
| | | | | | | $ | 33,826,945 | |
| Insurance - Property & Casualty - 1.9% | | | | | | |
| Allied World Assurance Co. Holdings Ltd., 4.35%, 10/29/2025 | | $ | 13,217,000 | | | $ | 13,507,281 | |
| Ambac Assurance Corp., 5.1%, 6/07/2020 (n) | | | 13,854 | | | | 18,426 | |
| Ambac LSNI, LLC, FLR, 6.45% (LIBOR - 3mo. + 5%), 2/12/2023 (n) | | | 52,096 | | | | 49,491 | |
| Aon Corp., 3.75%, 5/02/2029 | | | 22,369,000 | | | | 24,528,188 | |
| Fairfax Financial Holdings Ltd., 4.85%, 4/17/2028 | | | 16,062,000 | | | | 16,309,965 | |
| Hartford Financial Services Group, Inc., 2.8%, 8/19/2029 | | | 18,324,000 | | | | 18,835,863 | |
| Hartford Financial Services Group, Inc., 3.6%, 8/19/2049 | | | 7,937,000 | | | | 8,415,858 | |
22
Portfolio of Investments – continued
| | | | | | | | |
| | |
| Issuer | | Shares/Par | | | Value ($) | |
| Bonds - continued | | | | | | |
| Insurance - Property & Casualty - continued | | | | | | |
| Liberty Mutual Group, Inc., 3.951%, 10/15/2050 (n) | | $ | 11,271,000 | | | $ | 11,462,116 | |
| Marsh & McLennan Cos., Inc., 4.2%, 3/01/2048 | | | 22,209,000 | | | | 27,069,109 | |
| Progressive Corp., 3.2%, 3/26/2030 | | | 5,087,000 | | | | 5,682,220 | |
| Swiss Re Ltd., 4.25%, 12/06/2042 (n) | | | 2,719,000 | | | | 3,335,942 | |
| | | | | | | | |
| | | | | | | $ | 129,214,459 | |
| International Market Quasi-Sovereign - 0.1% | | | | | | |
| Electricite de France S.A., 4.875%, 9/21/2038 (n) | | $ | 6,911,000 | | | $ | 8,517,981 | |
| | |
| Machinery & Tools - 0.3% | | | | | | |
| CNH Industrial Capital LLC, 4.2%, 1/15/2024 | | $ | 3,109,000 | | | $ | 3,244,472 | |
| CNH Industrial Capital LLC, 3.85%, 11/15/2027 | | | 8,452,000 | | | | 8,422,224 | |
| United Rentals North America, Inc., 5.5%, 5/15/2027 | | | 7,885,000 | | | | 7,963,850 | |
| | | | | | | | |
| | | | | | | $ | 19,630,546 | |
| Major Banks - 9.3% | | | | | | |
| ABN AMRO Bank N.V., 4.8%, 4/18/2026 (n) | | $ | 13,800,000 | | | $ | 14,923,908 | |
| Bank of America Corp., 3.3%, 1/11/2023 | | | 13,781,000 | | | | 14,443,717 | |
| Bank of America Corp., 3.419% to 12/20/2027, FLR (LIBOR -3mo. + 1.04%) to 12/20/2028 | | | 11,952,000 | | | | 12,827,751 | |
| Bank of America Corp., 3.97% to 3/5/2028, FLR (LIBOR - 3mo. + 1.07%) to 3/05/2029 | | | 9,708,000 | | | | 10,802,099 | |
| Bank of America Corp., 2.496% to 2/13/2030, FLR (LIBOR - 3mo. | | | | | | | | |
| + 0.99%) to 2/13/2031 | | | 30,592,000 | | | | 30,973,268 | |
| Bank of America Corp., 4.443%, 1/20/2048 | | | 26,034,000 | | | | 31,647,532 | |
| Bank of America Corp., 6.1% to 3/17/2025, FLR (LIBOR - 3mo. + 3.898%) to 12/29/2049 | | | 16,050,000 | | | | 16,990,530 | |
| Bank of America Corp., 5.875% to 3/15/2028, FLR (LIBOR - 3mo. | | | | | | | | |
| + 2.931%) to 12/31/2059 | | | 14,429,000 | | | | 14,720,033 | |
| Bank of America Corp., FLR, 6.5% (LIBOR - 3mo. + 4.174%), 10/23/2049 | | | 4,793,000 | | | | 5,104,545 | |
| Barclays PLC, 4.375%, 1/12/2026 | | | 5,620,000 | | | | 6,041,575 | |
| Barclays PLC, 4.972% to 5/16/2028, FLR (LIBOR - 3mo. + 1.902%) to 5/16/2029 | | | 8,494,000 | | | | 9,595,448 | |
| Credit Suisse Group AG, 6.5%, 8/08/2023 (n) | | | 2,753,000 | | | | 2,902,587 | |
| Credit Suisse Group Fund (Guernsey) Ltd., 3.75%, 3/26/2025 | | | 11,024,000 | | | | 11,681,869 | |
| Goldman Sachs Group, Inc., 3.625%, 1/22/2023 | | | 8,359,000 | | | | 8,767,589 | |
| Goldman Sachs Group, Inc., 2.6%, 2/07/2030 | | | 15,968,000 | | | | 15,860,029 | |
| JPMorgan Chase & Co., 4.25%, 10/15/2020 | | | 2,264,000 | | | | 2,296,725 | |
| JPMorgan Chase & Co., 4.5%, 1/24/2022 | | | 3,300,000 | | | | 3,483,801 | |
| JPMorgan Chase & Co., 3.125%, 1/23/2025 | | | 15,071,000 | | | | 15,948,923 | |
| JPMorgan Chase & Co., 2.95%, 10/01/2026 | | | 22,838,000 | | | | 23,950,349 | |
| JPMorgan Chase & Co., 3.509%, 1/23/2029 | | | 19,062,000 | | | | 20,652,149 | |
| JPMorgan Chase & Co., 4.005%, 4/23/2029 | | | 28,775,000 | | | | 32,027,238 | |
23
Portfolio of Investments – continued
| | | | | | | | |
| | |
| Issuer | | Shares/Par | | | Value ($) | |
| Bonds - continued | | | | | | |
| Major Banks - continued | | | | | | |
| JPMorgan Chase & Co., 4.203% to 7/23/2028, FLR (LIBOR - 3mo. + 1.26%) to 7/23/2029 | | $ | 14,904,000 | | | $ | 16,860,753 | |
| JPMorgan Chase & Co., 2.739% to 10/15/2029, FLR (SOFR + 1.51%) to 10/15/2030 | | | 19,135,000 | | | | 19,820,613 | |
| JPMorgan Chase & Co., 3.109% to 4/22/2050, FLR (SOFR + 2.44%) to 4/22/2051 | | | 20,208,000 | | | | 20,925,882 | |
| Lloyds Bank PLC, 3.75%, 1/11/2027 | | | 8,348,000 | | | | 8,872,937 | |
| Morgan Stanley, 5.5%, 7/28/2021 | | | 15,554,000 | | | | 16,313,392 | |
| Morgan Stanley, 3.875%, 1/27/2026 | | | 13,472,000 | | | | 14,814,014 | |
| Morgan Stanley, 3.125%, 7/27/2026 | | | 13,910,000 | | | | 14,757,702 | |
| Morgan Stanley, 2.699% to 1/22/2030, FLR (SOFR + 1.143%) to 1/22/2031 | | | 1,913,000 | | | | 1,954,797 | |
| Morgan Stanley, 4.3%, 1/27/2045 | | | 2,634,000 | | | | 3,176,091 | |
| Morgan Stanley, 4.375%, 1/22/2047 | | | 18,187,000 | | | | 22,659,209 | |
| PNC Bank N.A., 3.1%, 10/25/2027 | | | 15,267,000 | | | | 16,338,988 | |
| PNC Financial Services Group, Inc., 2.55%, 1/22/2030 | | | 25,866,000 | | | | 26,469,478 | |
| UBS Group Funding (Jersey) Ltd., 4.125%, 9/24/2025 (n) | | | 7,081,000 | | | | 7,787,843 | |
| UBS Group Funding (Switzerland) AG, 4.253%, 3/23/2028 (n) | | | 10,148,000 | | | | 11,225,589 | |
| UBS Group Funding Ltd., 3%, 4/15/2021 (n) | | | 13,057,000 | | | | 13,196,647 | |
| Wachovia Corp., 6.605%, 10/01/2025 | | | 2,193,000 | | | | 2,549,481 | |
| Wells Fargo & Co., 3.069%, 1/24/2023 | | | 16,413,000 | | | | 16,817,278 | |
| Wells Fargo & Co., 2.572% to 2/11/2030, FLR (LIBOR - 3mo. +1%) to 2/11/2031 | | | 24,268,000 | | | | 24,094,142 | |
| Wells Fargo & Co., 3.068% to 4/30/2040, FLR (SOFR + 2.53%) to 4/30/2041 | | | 28,821,000 | | | | 28,588,699 | |
| Wells Fargo & Co., 5.013% to 4/4/2050, FLR (LIBOR - 3mo. + 4.24%) to 4/04/2051 | | | 19,108,000 | | | | 25,085,697 | |
| Westpac Banking Corp., 2.894% to 2/4/2025, FLR (CMT - 5yr. + 1.35%) to 2/04/2030 | | | 18,790,000 | | | | 18,551,631 | |
| | | | | | | | |
| | | | | | | $ | 636,502,528 | |
| Medical & Health Technology & Services - 3.6% | | | | | | |
| Alcon Finance Corp., 2.75%, 9/23/2026 (n) | | $ | 6,351,000 | | | $ | 6,628,098 | |
| Alcon, Inc., 3%, 9/23/2029 (n) | | | 11,494,000 | | | | 11,967,179 | |
| BayCare Health System, Inc., 3.831%, 11/15/2050 | | | 9,535,000 | | | | 11,146,550 | |
| Becton, Dickinson and Co., 4.669%, 6/06/2047 | | | 8,053,000 | | | | 10,080,598 | |
| Berks County, PA, Industrial Development Authority (Tower Health Project), 4.451%, 2/01/2050 | | | 22,087,000 | | | | 19,184,063 | |
| Cigna Corp., 3.75%, 7/15/2023 | | | 15,402,000 | | | | 16,452,620 | |
| Cigna Corp., 2.4%, 3/15/2030 | | | 12,636,000 | | | | 12,771,937 | |
| CommonSpirit Health, 2.95%, 11/01/2022 | | | 9,078,000 | | | | 9,151,158 | |
| Hackensack Meridian Health, Inc., 4.211%, 7/01/2048 | | | 8,428,000 | | | | 9,800,034 | |
| Hackensack Meridian Health, Inc., 4.5%, 7/01/2057 | | | 10,194,000 | | | | 12,488,278 | |
24
Portfolio of Investments – continued
| | | | | | | | |
| | |
| Issuer | | Shares/Par | | | Value ($) | |
| Bonds - continued | | | | | | |
| Medical & Health Technology & Services - continued | | | | | | |
| HCA, Inc., 5.25%, 6/15/2026 | | $ | 13,993,000 | | | $ | 15,601,681 | |
| HCA, Inc., 5.625%, 9/01/2028 | | | 24,185,000 | | | | 26,798,915 | |
| HCA, Inc., 4.125%, 6/15/2029 | | | 14,904,000 | | | | 16,123,112 | |
| Laboratory Corp. of America Holdings, 3.6%, 2/01/2025 | | | 3,653,000 | | | | 3,957,134 | |
| Laboratory Corp. of America Holdings, 4.7%, 2/01/2045 | | | 11,209,000 | | | | 13,593,960 | |
| Northwell Healthcare, Inc., 3.979%, 11/01/2046 | | | 3,110,000 | | | | 3,073,232 | |
| Northwell Healthcare, Inc., 4.26%, 11/01/2047 | | | 9,132,000 | | | | 9,563,178 | |
| ProMedica Toledo Hospital, “B”, 5.75%, 11/15/2038 | | | 9,026,000 | | | | 10,285,219 | |
| Toledo Hospital, 5.325%, 11/15/2028 | | | 23,983,000 | | | | 24,816,644 | |
| | | | | | | | |
| | | | | | | $ | 243,483,590 | |
| Medical Equipment - 0.5% | | | | | | |
| Abbott Laboratories, 3.4%, 11/30/2023 | | $ | 14,564,000 | | | $ | 15,798,351 | |
| Boston Scientific Corp., 4%, 3/01/2029 | | | 18,117,000 | | | | 20,336,524 | |
| | | | | | | | |
| | | | | | | $ | 36,134,875 | |
| Metals & Mining - 0.6% | | | | | | |
| Freeport-McMoRan Copper & Gold, Inc., 5.4%, 11/14/2034 | | $ | 16,589,000 | | | $ | 15,552,187 | |
| Glencore Funding LLC, 4.125%, 5/30/2023 (n) | | | 5,407,000 | | | | 5,470,086 | |
| Kaiser Aluminum Corp., 4.625%, 3/01/2028 (n) | | | 4,480,000 | | | | 4,170,880 | |
| Novelis Corp., 5.875%, 9/30/2026 (n) | | | 14,155,000 | | | | 13,762,907 | |
| | | | | | | | |
| | | | | | | $ | 38,956,060 | |
| Midstream - 1.9% | | | | | | |
| Cheniere Energy, Inc., 4.5%, 10/01/2029 (n) | | $ | 14,065,000 | | | $ | 12,974,962 | |
| Enbridge, Inc., 4.25%, 12/01/2026 | | | 16,730,000 | | | | 17,646,172 | |
| Kinder Morgan (Delaware), Inc., 7.75%, 1/15/2032 | | | 8,098,000 | | | | 10,397,811 | |
| Kinder Morgan Energy Partners LP, 6.375%, 3/01/2041 | | | 6,862,000 | | | | 7,921,318 | |
| Kinder Morgan Energy Partners LP, 5.4%, 9/01/2044 | | | 8,327,000 | | | | 9,344,618 | |
| ONEOK, Inc., 5.2%, 7/15/2048 | | | 14,326,000 | | | | 12,642,121 | |
| Plains All American Pipeline, 3.55%, 12/15/2029 | | | 33,079,000 | | | | 28,194,560 | |
| Sabine Pass Liquefaction LLC, 5.75%, 5/15/2024 | | | 13,289,000 | | | | 13,886,075 | |
| Sabine Pass Liquefaction LLC, 4.2%, 3/15/2028 | | | 5,452,000 | | | | 5,335,337 | |
| Targa Resources Partners LP/Targa Resources Finance Corp., 5.875%, 4/15/2026 | | | 12,536,000 | | | | 11,238,524 | |
| | | | | | | | |
| | | | | | | $ | 129,581,498 | |
| Mortgage-Backed - 22.0% | | | | | | |
| Fannie Mae, 5%, 6/01/2020 - 3/01/2042 | | $ | 10,578,698 | | | $ | 12,047,862 | |
| Fannie Mae, 5.19%, 9/01/2020 | | | 1,814,428 | | | | 1,812,736 | |
| Fannie Mae, 5.5%, 3/01/2021 - 5/01/2044 | | | 12,703,692 | | | | 14,491,242 | |
| Fannie Mae, 2.41%, 5/01/2023 | | | 2,383,189 | | | | 2,477,929 | |
| Fannie Mae, 2.55%, 5/01/2023 | | | 1,228,605 | | | | 1,282,341 | |
| Fannie Mae, 5.25%, 8/01/2024 | | | 845,804 | | | | 958,047 | |
25
Portfolio of Investments – continued
| | | | | | | | |
| | |
| Issuer | | Shares/Par | | | Value ($) | |
| Bonds - continued | | | | | | |
| Mortgage-Backed - continued | | | | | | |
| Fannie Mae, 4.5%, 5/01/2025 - 6/01/2044 | | $ | 56,380,453 | | | $ | 62,556,868 | |
| Fannie Mae, 3.5%, 5/25/2025 - 1/01/2050 | | | 137,203,032 | | | | 146,413,967 | |
| Fannie Mae, 2.584%, 12/25/2026 | | | 11,638,000 | | | | 12,611,817 | |
| Fannie Mae, 3.95%, 1/01/2027 | | | 630,041 | | | | 716,241 | |
| Fannie Mae, 3%, 11/01/2028 - 3/01/2050 | | | 140,330,977 | | | | 148,902,008 | |
| Fannie Mae, 2.5%, 11/01/2031 - 3/01/2050 | | | 39,923,920 | | | | 41,723,841 | |
| Fannie Mae, 6.5%, 11/01/2031 - 1/01/2033 | | | 93,221 | | | | 108,912 | |
| Fannie Mae, 3%, 2/25/2033 (i) | | | 2,304,539 | | | | 243,304 | |
| Fannie Mae, 6%, 5/01/2034 - 10/01/2038 | | | 3,440,106 | | | | 3,953,052 | |
| Fannie Mae, 3.25%, 5/25/2040 | | | 990,055 | | | | 1,064,428 | |
| Fannie Mae, 4%, 9/01/2040 - 11/01/2049 | | | 125,055,734 | | | | 135,895,939 | |
| Fannie Mae, 2%, 10/25/2040 - 4/25/2046 | | | 2,326,193 | | | | 2,388,709 | |
| Fannie Mae, 4%, 7/25/2046 (i) | | | 2,028,815 | | | | 382,387 | |
| Fannie Mae, TBA, 3%, 6/17/2035 | | | 40,109,693 | | | | 42,258,993 | |
| Fannie Mae, TBA, 2.5%, 6/25/2035 - 6/25/2050 | | | 120,150,000 | | | | 125,436,017 | |
| Fannie Mae, TBA, 3.5%, 6/25/2035 - 6/25/2050 | | | 19,775,000 | | | | 20,878,643 | |
| Fannie Mae, TBA, 2%, 6/25/2050 | | | 2,125,000 | | | | 2,162,981 | |
| Fannie Mae, TBA, 4%, 6/25/2050 | | | 17,525,000 | | | | 18,681,222 | |
| Federal Home Loan Bank, 3.5%, 5/01/2049 | | | 4,622,072 | | | | 4,926,546 | |
| Federal Home Loan Bank, 4%, 1/01/2050 | | | 12,024,498 | | | | 12,805,426 | |
| Freddie Mac, 5%, 5/01/2020 - 7/01/2041 | | | 5,550,813 | | | | 6,327,919 | |
| Freddie Mac, 3.034%, 10/25/2020 | | | 6,326,036 | | | | 6,351,197 | |
| Freddie Mac, 5.5%, 10/01/2021 - 1/01/2038 | | | 2,176,519 | | | | 2,478,263 | |
| Freddie Mac, 2.791%, 1/25/2022 | | | 7,153,871 | | | | 7,363,874 | |
| Freddie Mac, 2.355%, 7/25/2022 | | | 10,625,468 | | | | 10,937,572 | |
| Freddie Mac, 3.32%, 2/25/2023 | | | 5,070,913 | | | | 5,386,596 | |
| Freddie Mac, 3.25%, 4/25/2023 | | | 7,830,787 | | | | 8,316,847 | |
| Freddie Mac, 3.06%, 7/25/2023 | | | 1,328,995 | | | | 1,412,137 | |
| Freddie Mac, 3.531%, 7/25/2023 | | | 2,816,666 | | | | 3,034,275 | |
| Freddie Mac, 3.458%, 8/25/2023 | | | 8,879,782 | | | | 9,549,830 | |
| Freddie Mac, 2.67%, 12/25/2024 | | | 4,982,063 | | | | 5,329,115 | |
| Freddie Mac, 2.811%, 1/25/2025 | | | 7,744,684 | | | | 8,343,015 | |
| Freddie Mac, 3.329%, 5/25/2025 | | | 9,013,328 | | | | 9,966,169 | |
| Freddie Mac, 4%, 7/01/2025 - 4/01/2044 | | | 13,154,233 | | | | 14,322,815 | |
| Freddie Mac, 4.5%, 7/01/2025 - 5/01/2042 | | | 12,820,341 | | | | 14,211,181 | |
| Freddie Mac, 3.3%, 10/25/2026 | | | 4,957,000 | | | | 5,565,164 | |
| Freddie Mac, 3.117%, 6/25/2027 | | | 17,177,017 | | | | 19,163,204 | |
| Freddie Mac, 3%, 6/15/2028 - 2/25/2059 | | | 93,402,783 | | | | 99,339,113 | |
| Freddie Mac, 3.926%, 7/25/2028 | | | 2,186,000 | | | | 2,591,636 | |
| Freddie Mac, 4.06%, 10/25/2028 | | | 12,546,000 | | | | 15,117,078 | |
| Freddie Mac, 1.218%, 7/25/2029 (i) | | | 12,720,342 | | | | 1,056,553 | |
| Freddie Mac, 1.27%, 8/25/2029 (i) | | | 22,497,315 | | | | 1,946,094 | |
| Freddie Mac, 0.757%, 11/25/2029 (i) | | | 52,672,842 | | | | 2,638,535 | |
26
Portfolio of Investments – continued
| | | | | | | | |
| | |
| Issuer | | Shares/Par | | | Value ($) | |
| Bonds - continued | | | | | | |
| Mortgage-Backed - continued | | | | | | |
| Freddie Mac, 6%, 11/01/2033 - 7/01/2038 | | $ | 1,107,921 | | | $ | 1,255,864 | |
| Freddie Mac, 5.5%, 2/15/2036 (i) | | | 476,974 | | | | 94,911 | |
| Freddie Mac, 3.5%, 11/01/2037 - 10/25/2058 | | | 84,080,382 | | | | 89,951,966 | |
| Freddie Mac, 4.5%, 12/15/2040 (i) | | | 548,805 | | | | 52,511 | |
| Freddie Mac, 4%, 8/15/2044 (i) | | | 582,073 | | | | 72,608 | |
| Ginnie Mae, 2.5%, 7/20/2032 | | | 1,375,000 | | | | 1,461,682 | |
| Ginnie Mae, 5.5%, 11/15/2032 - 1/20/2042 | | | 1,524,768 | | | | 1,712,042 | |
| Ginnie Mae, 6%, 2/15/2034 - 1/15/2038 | | | 1,544,498 | | | | 1,778,507 | |
| Ginnie Mae, 4.5%, 4/15/2039 - 7/20/2049 | | | 30,668,993 | | | | 33,422,450 | |
| Ginnie Mae, 4%, 10/20/2040 - 10/20/2049 | | | 28,283,039 | | | | 30,303,006 | |
| Ginnie Mae, 3.5%, 11/15/2040 - 12/20/2049 | | | 118,005,798 | | | | 125,822,777 | |
| Ginnie Mae, 3%, 11/20/2044 - 4/20/2050 | | | 88,779,596 | | | | 94,778,311 | |
| Ginnie Mae, TBA, 3%, 5/15/2050 - 6/22/2050 | | | 21,275,000 | | | | 22,625,748 | |
| Ginnie Mae, TBA, 3.5%, 6/15/2050 | | | 9,325,000 | | | | 9,887,782 | |
| Ginnie Mae, TBA, 4%, 6/15/2050 | | | 15,550,000 | | | | 16,538,871 | |
| | | | | | | | |
| | | | | | | $ | 1,507,688,676 | |
| Municipals - 1.9% | | | | | | |
| Bridgeview, IL, Stadium and Redevelopment Projects, 5.06%, 12/01/2025 | | $ | 2,460,000 | | | $ | 2,406,101 | |
| Bridgeview, IL, Stadium and Redevelopment Projects, 5.14%, 12/01/2036 | | | 24,325,000 | | | | 22,485,787 | |
| Escambia County, FL, Health Facilities Authority Rev. (Baptist | | | | | | | | |
| Health Care Corp.), “B”, 3.607%, 8/15/2040 | | | 4,565,000 | | | | 4,400,158 | |
| New Jersey Economic Development Authority State Pension | | | | | | | | |
| Funding Rev., Capital Appreciation, “B”, 0%, 2/15/2023 | | | 29,043,000 | | | | 27,802,864 | |
| New York Dormitory Authority Rev. (Cornell University), “A”, 5%, 7/01/2030 | | | 12,720,000 | | | | 16,612,956 | |
| Oklahoma Development Finance Authority, Health System Rev. (OU Medicine Project), “C”, 5.45%, 8/15/2028 | | | 8,467,000 | | | | 9,748,226 | |
| Philadelphia, PA, School District, “B”, 6.615%, 6/01/2030 | | | 6,320,000 | | | | 7,967,687 | |
| Philadelphia, PA, School District, “B”, 6.765%, 6/01/2040 | | | 4,260,000 | | | | 5,858,139 | |
| State of California, 4%, 3/01/2029 | | | 11,750,000 | | | | 13,848,902 | |
| State of California (Build America Bonds), 7.625%, 3/01/2040 | | | 1,250,000 | | | | 2,082,163 | |
| State of California (Build America Bonds), 7.6%, 11/01/2040 | | | 9,570,000 | | | | 16,493,704 | |
| University of California Limited Project Rev., “J”, 4.131%, 5/15/2045 | | | 2,920,000 | | | | 3,389,215 | |
| | | | | | | | |
| | | | | | | $ | 133,095,902 | |
| Natural Gas - Distribution - 0.8% | | | | | | |
| Boston Gas Co., 3.15%, 8/01/2027 (n) | | $ | 18,948,000 | | | $ | 20,093,834 | |
| KeySpan Gas East Corp., 2.742%, 8/15/2026 (n) | | | 14,712,000 | | | | 15,502,023 | |
| NiSource, Inc., 3.6%, 5/01/2030 | | | 20,089,000 | | | | 22,413,708 | |
| | | | | | | | |
| | | | | | | $ | 58,009,565 | |
27
Portfolio of Investments – continued
| | | | | | | | |
| | |
| Issuer | | Shares/Par | | | Value ($) | |
| Bonds - continued | | | | | | |
| Network & Telecom - 1.2% | | | | | | |
| AT&T, Inc., 5.25%, 3/01/2037 | | $ | 13,919,000 | | | $ | 16,514,011 | |
| AT&T, Inc., 4.75%, 5/15/2046 | | | 7,387,000 | | | | 8,543,782 | |
| AT&T, Inc., 5.15%, 11/15/2046 | | | 9,069,000 | | | | 10,887,028 | |
| AT&T, Inc., 4.55%, 3/09/2049 | | | 9,069,000 | | | | 10,407,309 | |
| Verizon Communications, Inc., 4.272%, 1/15/2036 | | | 9,580,000 | | | | 11,491,293 | |
| Verizon Communications, Inc., 5.012%, 4/15/2049 | | | 15,373,000 | | | | 21,555,977 | |
| | | | | | | | |
| | | | | | | $ | 79,399,400 | |
| Oil Services - 0.4% | | | | | | |
| Halliburton Co., 2.92%, 3/01/2030 | | $ | 25,095,000 | | | $ | 20,205,623 | |
| Halliburton Co., 5%, 11/15/2045 | | | 7,750,000 | | | | 6,291,271 | |
| | | | | | | | |
| | | | | | | $ | 26,496,894 | |
| Oils - 0.2% | | | | | | |
| Marathon Petroleum Corp., 4.75%, 9/15/2044 | | $ | 9,202,000 | | | $ | 8,363,734 | |
| Marathon Petroleum Corp., 5.85%, 12/15/2045 | | | 5,043,000 | | | | 4,880,536 | |
| | | | | | | | |
| | | | | | | $ | 13,244,270 | |
| Other Banks & Diversified Financials - 1.3% | | | | | | |
| BBVA Bancomer S.A. de C.V., 6.75%, 9/30/2022 (n) | | $ | 3,408,000 | | | $ | 3,535,800 | |
| BBVA USA, 2.875%, 6/29/2022 | | | 22,375,000 | | | | 22,488,380 | |
| Branch Banking & Trust Co., 2.25%, 3/11/2030 | | | 3,292,000 | | | | 3,203,664 | |
| Citigroup, Inc., 2.666% to 1/29/2030, FLR (SOFR + 1.146%) to 1/29/2031 | | | 35,127,000 | | | | 35,340,378 | |
| Groupe BPCE S.A., 4.5%, 3/15/2025 (n) | | | 7,513,000 | | | | 7,911,920 | |
| Macquarie Bank Ltd. of London, 6.125% to 3/08/2027, FLR (Swap Rate - 5yr. + 4.332%) to 12/31/2165 (n) | | | 15,364,000 | | | | 14,826,260 | |
| | | | | | | | |
| | | | | | | $ | 87,306,402 | |
| Pharmaceuticals - 0.6% | | | | | | |
| Allergan Funding SCS, 3.8%, 3/15/2025 | | $ | 22,785,000 | | | $ | 24,322,325 | |
| Elanco Animal Health, Inc., 5.022%, 8/28/2023 | | | 8,568,000 | | | | 9,039,240 | |
| Elanco Animal Health, Inc., 5.65%, 8/28/2028 | | | 7,401,000 | | | | 8,196,607 | |
| | | | | | | | |
| | | | | | | $ | 41,558,172 | |
| Pollution Control - 0.1% | | | | | | |
| Republic Services, Inc., 3.95%, 5/15/2028 | | $ | 7,042,000 | | | $ | 8,032,684 | |
| | |
| Railroad & Shipping - 0.0% | | | | | | |
| CSX Corp., 3.8%, 4/15/2050 | | $ | 3,185,000 | | | $ | 3,660,297 | |
| | |
| Real Estate - Apartment - 0.0% | | | | | | |
| Mid-America Apartment Communities, Inc., REIT, 4.3%, 10/15/2023 | | $ | 2,876,000 | | | $ | 2,991,753 | |
28
Portfolio of Investments – continued
| | | | | | | | |
| | |
| Issuer | | Shares/Par | | | Value ($) | |
| Bonds - continued | | | | | | |
| Real Estate - Healthcare - 0.2% | | | | | | |
| MPT Operating Partnership LP/MPT Financial Co., REIT, 5%, 10/15/2027 | | $ | 12,790,000 | | | $ | 13,045,800 | |
| | |
| Real Estate - Retail - 0.4% | | | | | | |
| Brixmor Operating Partnership LP, REIT, 3.875%, 8/15/2022 | | $ | 8,618,000 | | | $ | 8,745,665 | |
| VEREIT Operating Partnership LP, REIT, 3.1%, 12/15/2029 | | | 24,915,000 | | | | 21,332,946 | |
| | | | | | | | |
| | | | | | | $ | 30,078,611 | |
| Retailers - 0.5% | | | | | | |
| Home Depot, Inc., 3.35%, 4/15/2050 | | $ | 12,738,000 | | | $ | 14,106,687 | |
| Walmart, Inc., 3.05%, 7/08/2026 | | | 20,000,000 | | | | 22,112,375 | |
| | | | | | | | |
| | | | | | | $ | 36,219,062 | |
| Specialty Stores - 0.2% | | | | | | |
| TJX Cos., Inc., 3.875%, 4/15/2030 | | $ | 5,398,000 | | | $ | 6,035,964 | |
| TJX Cos., Inc., 4.5%, 4/15/2050 | | | 3,756,000 | | | | 4,628,363 | |
| | | | | | | | |
| | | | | | | $ | 10,664,327 | |
| State & Local Agencies - 0.4% | | | | | | |
| New Jersey Economic Development Authority State Pension Funding Rev., “A”, 7.425%, 2/15/2029 | | $ | 25,254,000 | | | $ | 29,881,290 | |
| | |
| Telecommunications - Wireless - 1.3% | | | | | | |
| American Tower Corp., REIT, 2.75%, 1/15/2027 | | $ | 6,517,000 | | | $ | 6,753,202 | |
| American Tower Corp., REIT, 3.55%, 7/15/2027 | | | 23,507,000 | | | | 25,681,005 | |
| American Tower Corp., REIT, 3.8%, 8/15/2029 | | | 15,003,000 | | | | 16,771,141 | |
| Crown Castle International Corp., 2.25%, 9/01/2021 | | | 7,361,000 | | | | 7,434,741 | |
| Crown Castle International Corp., 3.2%, 9/01/2024 | | | 4,931,000 | | | | 5,233,950 | |
| Crown Castle International Corp., 3.7%, 6/15/2026 | | | 3,950,000 | | | | 4,289,272 | |
| Crown Castle International Corp., 4%, 3/01/2027 | | | 1,862,000 | | | | 2,060,453 | |
| Crown Castle International Corp., 3.8%, 2/15/2028 | | | 4,853,000 | | | | 5,351,459 | |
| SBA Communications Corp., 3.875%, 2/15/2027 (n) | | | 6,495,000 | | | | 6,633,019 | |
| T-Mobile USA, Inc., 4.375%, 4/15/2040 (n) | | | 5,662,000 | | | | 6,427,049 | |
| | | | | | | | |
| | | | | | | $ | 86,635,291 | |
| Tobacco - 0.6% | | | | | | |
| B.A.T Capital Corp., 3.222%, 8/15/2024 | | $ | 20,260,000 | | | $ | 21,027,254 | |
| B.A.T Capital Corp., 4.906%, 4/02/2030 | | | 3,209,000 | | | | 3,612,417 | |
| Imperial Tobacco Finance PLC, 3.75%, 7/21/2022 (n) | | | 15,574,000 | | | | 15,779,698 | |
| | | | | | | | |
| | | | | | | $ | 40,419,369 | |
| Transportation - Services - 0.3% | | | | | | |
| ERAC USA Finance LLC, 3.85%, 11/15/2024 (n) | | $ | 1,863,000 | | | $ | 1,917,877 | |
| ERAC USA Finance LLC, 7%, 10/15/2037 (n) | | | 11,169,000 | | | | 14,351,649 | |
29
Portfolio of Investments – continued
| | | | | | | | |
| | |
| Issuer | | Shares/Par | | | Value ($) | |
| Bonds - continued | | | | | | |
| Transportation - Services - continued | | | | | | |
| ERAC USA Finance LLC, 4.5%, 2/15/2045 (n) | | $ | 1,327,000 | | | $ | 1,311,735 | |
| | | | | | | | |
| | | | | | | $ | 17,581,261 | |
| U.S. Government Agencies and Equivalents - 0.6% | | | | | | |
| Small Business Administration, 6.35%, 4/01/2021 | | $ | 214 | | | $ | 217 | |
| Small Business Administration, 6.34%, 5/01/2021 | | | 510 | | | | 517 | |
| Small Business Administration, 6.44%, 6/01/2021 | | | 757 | | | | 771 | |
| Small Business Administration, 5.34%, 11/01/2021 | | | 5,850 | | | | 5,964 | |
| Small Business Administration, 6.07%, 3/01/2022 | | | 3,382 | | | | 3,465 | |
| Small Business Administration, 4.35%, 7/01/2023 | | | 48,775 | | | | 50,697 | |
| Small Business Administration, 4.98%, 11/01/2023 | | | 60,857 | | | | 63,871 | |
| Small Business Administration, 4.89%, 12/01/2023 | | | 78,009 | | | | 81,826 | |
| Small Business Administration, 4.93%, 1/01/2024 | | | 77,208 | | | | 80,930 | |
| Small Business Administration, 4.34%, 3/01/2024 | | | 118,778 | | | | 123,642 | |
| Small Business Administration, 5.18%, 5/01/2024 | | | 82,514 | | | | 87,088 | |
| Small Business Administration, 5.52%, 6/01/2024 | | | 91,659 | | | | 97,148 | |
| Small Business Administration, 5.19%, 7/01/2024 | | | 106,287 | | | | 111,787 | |
| Small Business Administration, 4.86%, 10/01/2024 | | | 62,021 | | | | 65,423 | |
| Small Business Administration, 4.57%, 6/01/2025 | | | 213,442 | | | | 225,559 | |
| Small Business Administration, 4.76%, 9/01/2025 | | | 599,725 | | | | 632,984 | |
| Small Business Administration, 5.39%, 12/01/2025 | | | 49,744 | | | | 53,446 | |
| Small Business Administration, 5.35%, 2/01/2026 | | | 330,349 | | | | 356,294 | |
| Small Business Administration, 3.25%, 11/01/2030 | | | 1,307,204 | | | | 1,389,777 | |
| Small Business Administration, 2.85%, 9/01/2031 | | | 2,248,348 | | | | 2,372,782 | |
| Small Business Administration, 2.37%, 8/01/2032 | | | 1,465,061 | | | | 1,513,029 | |
| Small Business Administration, 2.13%, 1/01/2033 | | | 2,522,908 | | | | 2,590,142 | |
| Small Business Administration, 2.21%, 2/01/2033 | | | 724,155 | | | | 743,319 | |
| Small Business Administration, 2.22%, 3/01/2033 | | | 2,491,565 | | | | 2,563,250 | |
| Small Business Administration, 2.08%, 4/01/2033 | | | 4,010,100 | | | | 4,094,409 | |
| Small Business Administration, 2.45%, 6/01/2033 | | | 5,027,307 | | | | 5,164,317 | |
| Small Business Administration, 3.15%, 7/01/2033 | | | 6,427,054 | | | | 6,782,046 | |
| Small Business Administration, 3.16%, 8/01/2033 | | | 6,087,384 | | | | 6,431,927 | |
| Small Business Administration, 3.62%, 9/01/2033 | | | 3,306,326 | | | | 3,545,804 | |
| | | | | | | | |
| | | | | | | $ | 39,232,431 | |
| U.S. Treasury Obligations - 9.7% | | | | | | |
| U.S. Treasury Bonds, 4.5%, 2/15/2036 | | $ | 9,176,000 | | | $ | 14,199,502 | |
| U.S. Treasury Bonds, 5%, 5/15/2037 | | | 2,338,000 | | | | 3,874,961 | |
| U.S. Treasury Bonds, 4.375%, 2/15/2038 | | | 3,136,000 | | | | 4,928,788 | |
| U.S. Treasury Bonds, 3.5%, 2/15/2039 | | | 20,690,000 | | | | 29,730,560 | |
| U.S. Treasury Bonds, 4.5%, 8/15/2039 | | | 55,159,100 | | | | 89,090,565 | |
| U.S. Treasury Bonds, 2.875%, 5/15/2043 | | | 87,127,000 | | | | 115,742,774 | |
| U.S. Treasury Bonds, 2.5%, 2/15/2045 (f) | | | 29,323,000 | | | | 37,011,124 | |
| U.S. Treasury Bonds, 2.875%, 11/15/2046 | | | 27,653,000 | | | | 37,688,014 | |
| U.S. Treasury Bonds, 3%, 2/15/2048 | | | 39,734,200 | | | | 55,779,987 | |
30
Portfolio of Investments – continued
| | | | | | | | |
| | |
| Issuer | | Shares/Par | | | Value ($) | |
| Bonds - continued | | | | | | |
| U.S. Treasury Obligations - continued | | | | | | |
| U.S. Treasury Notes, 1.75%, 9/30/2022 | | $ | 41,109,000 | | | $ | 42,623,289 | |
| U.S. Treasury Notes, 2.75%, 5/31/2023 | | | 66,210,500 | | | | 71,271,982 | |
| U.S. Treasury Notes, 2.375%, 2/29/2024 (f) | | | 149,000,000 | | | | 160,739,570 | |
| | | | | | | | |
| | | | | | | $ | 662,681,116 | |
| Utilities - Electric Power - 2.4% | | | | | | |
| AEP Transmission Co. LLC, 3.1%, 12/01/2026 | | $ | 9,008,000 | | | $ | 9,718,762 | |
| AEP Transmission Co. LLC, 4%, 12/01/2046 | | | 7,883,000 | | | | 9,485,686 | |
| AEP Transmission Co. LLC, 3.65%, 4/01/2050 | | | 6,073,000 | | | | 7,275,092 | |
| Berkshire Hathaway Energy Co., 4.25%, 10/15/2050 (n) | | | 4,693,000 | | | | 5,902,609 | |
| Clearway Energy Operating LLC, 4.75%, 3/15/2028 (n) | | | 4,480,000 | | | | 4,558,400 | |
| Dominion Resources, Inc., 3.9%, 10/01/2025 | | | 2,892,000 | | | | 3,164,760 | |
| Enel Finance International N.V., 3.625%, 5/25/2027 (n) | | | 27,962,000 | | | | 29,259,692 | |
| Enel Finance International N.V., 3.5%, 4/06/2028 (n) | | | 30,206,000 | | | | 31,427,218 | |
| Exelon Corp., 3.497%, 6/01/2022 | | | 2,252,000 | | | | 2,320,384 | |
| Exelon Corp., 4.7%, 4/15/2050 | | | 4,121,000 | | | | 5,301,537 | |
| FirstEnergy Corp., 2.65%, 3/01/2030 | | | 16,728,000 | | | | 17,007,067 | |
| FirstEnergy Corp., 4.85%, 7/15/2047 | | | 17,208,000 | | | | 22,201,257 | |
| NextEra Energy Operating Co., 4.5%, 9/15/2027 (n) | | | 2,145,000 | | | | 2,201,306 | |
| PPL Capital Funding, Inc., 5%, 3/15/2044 | | | 3,924,000 | | | | 4,660,058 | |
| PPL WEM Holdings PLC, 5.375%, 5/01/2021 (n) | | | 10,545,000 | | | | 10,815,706 | |
| | | | | | | | |
| | | | | | | $ | 165,299,534 | |
| Total Bonds (Identified Cost, $6,733,319,306) | | | | | | $ | 7,006,963,550 | |
| | |
| Investment Companies (h) - 1.4% | | | | | | |
| Money Market Funds - 1.4% | | | | | | |
| MFS Institutional Money Market Portfolio, 0.41% (v) (Identified Cost, $95,544,503) | | | 95,527,470 | | | $ | 95,537,022 | |
| | |
| Other Assets, Less Liabilities - (3.7)% | | | | | (254,125,066) | |
| Net Assets - 100.0% | | | | | | $ | 6,848,375,506 | |
| (a) | Non-income producing security. |
| (f) | All or a portion of the security has been segregated as collateral for open futures contracts and cleared swap agreements. |
| (h) | An affiliated issuer, which may be considered one in which the fund owns 5% or more of the outstanding voting securities, or a company which is under common control. At period end, the aggregate values of the fund’s investments in affiliated issuers and in unaffiliated issuers were $95,537,022 and $7,006,963,550, respectively. |
| (i) | Interest only security for which the fund receives interest on notional principal (Par amount). Par amount shown is the notional principal and does not reflect the cost of the security. |
| (n) | Securities exempt from registration under Rule 144A of the Securities Act of 1933. These securities may be sold in the ordinary course of business in transactions exempt from registration, normally to qualified institutional buyers. At period end, the aggregate value of these securities was $1,562,911,181, representing 22.8% of net assets. |
31
Portfolio of Investments – continued
| (p) | Payment-in-kind (PIK) security for which interest income may be received in additional securities and/or cash. |
| (q) | Interest received was less than stated coupon rate. |
| (v) | Affiliated issuer that is available only to investment companies managed by MFS. The rate quoted for the MFS Institutional Money Market Portfolio is the annualizedseven-day yield of the fund at period end. |
The following abbreviations are used in this report and are defined:
| CDO | | Collateralized Debt Obligation |
| CLO | | Collateralized Loan Obligation |
| CMT | | Constant Maturity Treasury |
| FLR | | Floating Rate. Interest rate resets periodically based on the parenthetically disclosed reference rate plus a spread (if any). Theperiod-end rate reported may not be the current rate. All reference rates are USD unless otherwise noted. |
| LIBOR | | London Interbank Offered Rate |
| REIT | | Real Estate Investment Trust |
| SOFR | | Secured Overnight Financing Rate |
Derivative Contracts at 4/30/20
Futures Contracts
| | | | | | | | | | | | | | | | | | | | | | |
| Description | | Long/
Short | | | Currency | | | Contracts | | Notional
Amount | | | Expiration
Date | | | Value/
Unrealized
Appreciation
(Depreciation) | |
| Asset Derivatives | | | | | | | | | | | | | | | | | | | | | | |
| | | | | | |
| Interest Rate Futures | | | | | | | | | | | | | | | | | | | | | | |
| U.S. Treasury Note 2 yr | | | Long | | | | USD | | | 1,496 | | | $329,762,812 | | | | June - 2020 | | | | $4,803,820 | |
| U.S. Treasury Ultra Bond | | | Long | | | | USD | | | 408 | | | 91,710,750 | | | | June - 2020 | | | | 9,797,009 | |
| | | | | | | | | | | | | | | | | | | | | | |
| | | | | | | | | | | | | | | | | | | | | $14,600,829 | |
| | | | | | | | | | | | | | | | | | | | | | |
| Liability Derivatives | | | | | | | | | | | | | | | | | | | | | | |
| | | | | | |
| Interest Rate Futures | | | | | | | | | | | | | | | | | | | | | | |
| U.S. Treasury Ultra Note 10 yr | | | Short | | | | USD | | | 3,924 | | | $616,190,625 | | | | June - 2020 | | | | $(26,512,952 | ) |
| | | | | | | | | | | | | | | | | | | | | | |
Cleared Swap Agreements
| | | | | | | | | | | | | | | | | | | | | | | | | | |
Maturity
Date | | Notional
Amount | | Counter-
party | | Cash Flows to
Receive/
Frequency | | Cash Flows to
Pay/
Frequency | | Unrealized
Appreciation
(Depreciation) | | | Net
Unamortized
Upfront
Payments
(Receipts) | | | Value | |
| Liability Derivatives | | | | | | | | | | | | | | | | | | | | | |
| | | | | |
| Credit Default Swaps | | | | | | | | | | | | | | | | |
| 6/20/25 | | USD | | | 301,100,000 | | | | | centrally cleared | | 5.00%/ Quarterly | | (1) | | | $(13,949,151 | ) | | | $(10,372,713 | ) | | | $(24,321,864 | ) |
| | | | | | | | | | | | | | | | | | | | | | | | | | |
| (1) | Fund, as protection seller, to pay notional amount upon a defined credit event by a reference obligation specified in the Markit CDX North American High-Yield Index, a B+ rated credit default swap index. The fund entered into the contract to gain issuer exposure. |
The credit ratings presented here are an indicator of the current payment/performance risk of the related swap agreement, the reference obligation for which may be either a single security or, in
32
Portfolio of Investments – continued
the case of a credit default index, a basket of securities issued by corporate or sovereign issuers. Ratings are assigned to each reference security, including each individual security within a reference basket of securities, utilizing ratings from Moody’s, Fitch, and Standard & Poor’s rating agencies and applying the following hierarchy: If all three agencies provide a rating, the middle rating (after dropping the highest and lowest ratings) is assigned; if two of the three agencies rate a security, the lower of the two is assigned. Ratings are shown in the S&P and Fitch scale (e.g., AAA). The ratings for a credit default index are calculated by MFS as a weighted average of the external credit ratings of the individual securities that compose the index’s reference basket of securities.
At April 30, 2020, the fund had liquid securities with an aggregate value of $47,617,266 to cover any collateral or margin obligations for certain derivative contracts.
See Notes to Financial Statements
33
Financial Statements
STATEMENT OF ASSETS AND LIABILITIES
At 4/30/20
This statement represents your fund’s balance sheet, which details the assets and liabilities comprising the total value of the fund.
| | | | |
| Assets | | | | |
Investments in unaffiliated issuers, at value (identified cost, $6,733,319,306) | | | $7,006,963,550 | |
Investments in affiliated issuers, at value (identified cost, $95,544,503) | | | 95,537,022 | |
Cash | | | 3,302,419 | |
Restricted cash for TBA sale commitments | | | 100,000 | |
Receivables for | | | | |
Investments sold | | | 188,845 | |
Investments sold on an extended settlement basis | | | 285,985,491 | |
Fund shares sold | | | 15,650,181 | |
Interest | | | 41,502,683 | |
Receivable from investment adviser | | | 172,022 | |
Other assets | | | 14,071 | |
Total assets | | | $7,449,416,284 | |
| |
| Liabilities | | | | |
Payables for | | | | |
Distributions | | | $1,818,532 | |
Due to cleared swap brokers | | | 972,826 | |
Net daily variation margin on open cleared swap agreements | | | 9,400,399 | |
Net daily variation margin on open futures contracts | | | 725,615 | |
Investments purchased | | | 35,676,173 | |
Investments purchased on an extended settlement basis | | | 543,770,970 | |
Fund shares reacquired | | | 6,015,056 | |
Payable to affiliates | | | | |
Administrative services fee | | | 3,408 | |
Shareholder servicing costs | | | 2,143,448 | |
Distribution and service fees | | | 27,617 | |
Program manager fees | | | 47 | |
Payable for independent Trustees’ compensation | | | 509 | |
Accrued expenses and other liabilities | | | 486,178 | |
Total liabilities | | | $601,040,778 | |
Net assets | | | $6,848,375,506 | |
| |
| Net assets consist of | | | | |
Paid-in capital | | | $6,648,019,205 | |
Total distributable earnings (loss) | | | 200,356,301 | |
Net assets | | | $6,848,375,506 | |
Shares of beneficial interest outstanding | | | 617,723,555 | |
34
Statement of Assets and Liabilities – continued
| | | | | | | | | | | | |
| | | |
| | | Net assets | | | Shares
outstanding | | | Net asset value
per share (a) | |
Class A | | | $2,458,182,532 | | | | 221,763,442 | | | | $11.08 | |
Class B | | | 9,962,539 | | | | 897,299 | | | | 11.10 | |
Class C | | | 99,436,918 | | | | 8,959,133 | | | | 11.10 | |
Class I | | | 1,513,495,266 | | | | 136,516,246 | | | | 11.09 | |
Class R1 | | | 1,656,028 | | | | 149,176 | | | | 11.10 | |
Class R2 | | | 27,083,039 | | | | 2,443,810 | | | | 11.08 | |
Class R3 | | | 54,432,757 | | | | 4,910,541 | | | | 11.08 | |
Class R4 | | | 131,628,913 | | | | 11,870,228 | | | | 11.09 | |
Class R6 | | | 2,535,200,180 | | | | 228,652,389 | | | | 11.09 | |
Class 529A | | | 13,258,707 | | | | 1,197,570 | | | | 11.07 | |
Class 529B | | | 201,688 | | | | 18,121 | | | | 11.13 | |
Class 529C | | | 3,836,939 | | | | 345,600 | | | | 11.10 | |
| (a) | Maximum offering price per share was equal to the net asset value per share for all share classes, except for Classes A and 529A, for which the maximum offering prices per share were $11.57 [100 / 95.75 x $11.08] and $11.56 [100 / 95.75 x $11.07], respectively. On sales of $100,000 or more, the maximum offering prices of Class A and Class 529A shares are reduced. A contingent deferred sales charge may be imposed on redemptions of Class A, Class B, Class C, Class 529B, and Class 529C shares. Redemption price per share was equal to the net asset value per share for Classes I, R1, R2, R3, R4, R6, and 529A. |
See Notes to Financial Statements
35
Financial Statements
STATEMENT OF OPERATIONS
Year ended 4/30/20
This statement describes how much your fund earned in investment income and accrued in expenses. It also describes any gains and/or losses generated by fund operations.
| | | | |
| Net investment income (loss) | | | | |
Income | | | | |
Interest | | | $213,729,577 | |
Dividends from affiliated issuers | | | 6,444,597 | |
Other | | | 385,511 | |
Total investment income | | | $220,559,685 | |
Expenses | | | | |
Management fee | | | $26,571,941 | |
Distribution and service fees | | | 7,103,374 | |
Shareholder servicing costs | | | 4,243,370 | |
Program manager fees | | | 7,605 | |
Administrative services fee | | | 570,415 | |
Independent Trustees’ compensation | | | 96,433 | |
Custodian fee | | | 259,076 | |
Shareholder communications | | | 712,108 | |
Audit and tax fees | | | 80,760 | |
Legal fees | | | 55,446 | |
Miscellaneous | | | 638,049 | |
Total expenses | | | $40,338,577 | |
Fees paid indirectly | | | (17,303 | ) |
Reduction of expenses by investment adviser and distributor | | | (3,891,510 | ) |
Net expenses | | | $36,429,764 | |
Net investment income (loss) | | | $184,129,921 | |
| |
| Realized and unrealized gain (loss) | | | | |
| Realized gain (loss) (identified cost basis) | | | | |
Unaffiliated issuers | | | $67,580,371 | |
Affiliated issuers | | | 200,616 | |
Futures contracts | | | 12,496,848 | |
Swap agreements | | | (20,634,018 | ) |
Forward foreign currency exchange contracts | | | 2,098,750 | |
Foreign currency | | | (1,362,639 | ) |
Net realized gain (loss) | | | $60,379,928 | |
| Change in unrealized appreciation or depreciation | | | | |
Unaffiliated issuers | | | $222,775,558 | |
Affiliated issuers | | | (16,840 | ) |
Futures contracts | | | (10,505,077 | ) |
Swap agreements | | | (13,949,151 | ) |
Net unrealized gain (loss) | | | $198,304,490 | |
Net realized and unrealized gain (loss) | | | $258,684,418 | |
Change in net assets from operations | | | $442,814,339 | |
See Notes to Financial Statements
36
Financial Statements
STATEMENTS OF CHANGES IN NET ASSETS
These statements describe the increases and/or decreases in net assets resulting from operations, any distributions, and any shareholder transactions.
| | | | | | | | |
| | | Year ended | |
| | | 4/30/20 | | | 4/30/19 | |
| Change in net assets | | | | | | |
| | |
| From operations | | | | | | | | |
Net investment income (loss) | | | $184,129,921 | | | | $162,749,970 | |
Net realized gain (loss) | | | 60,379,928 | | | | (38,152,624 | ) |
Net unrealized gain (loss) | | | 198,304,490 | | | | 157,391,350 | |
Change in net assets from operations | | | $442,814,339 | | | | $281,988,696 | |
Total distributions to shareholders | | | $(191,936,656 | ) | | | $(163,952,098 | ) |
Change in net assets from fund share transactions | | | $836,084,294 | | | | $258,210,576 | |
Total change in net assets | | | $1,086,961,977 | | | | $376,247,174 | |
| | |
| Net assets | | | | | | | | |
At beginning of period | | | 5,761,413,529 | | | | 5,385,166,355 | |
At end of period | | | $6,848,375,506 | | | | $5,761,413,529 | |
See Notes to Financial Statements
37
Financial Statements
FINANCIAL HIGHLIGHTS
The financial highlights table is intended to help you understand the fund’s financial performance for the past 5 years. Certain information reflects financial results for a single fund share. The total returns in the table represent the rate that an investor would have earned (or lost) on an investment in the fund share class (assuming reinvestment of all distributions) held for the entire period.
| | | | | | | | | | | | | | | | | | | | |
| Class A | | Year ended | |
| | | | | |
| | | 4/30/20 | | | 4/30/19 | | | 4/30/18 | | | 4/30/17 | | | 4/30/16 | |
Net asset value, beginning of period | | | $10.62 | | | | $10.39 | | | | $10.67 | | | | $10.79 | | | | $10.96 | |
| | | | |
| Income (loss) from investment operations | | | | | | | | | | | | | | | | | |
Net investment income (loss) (d) | | | $0.30 | | | | $0.30 | | | | $0.25 | | | | $0.27 | | | | $0.28 | |
Net realized and unrealized gain (loss) | | | 0.47 | | | | 0.23 | | | | (0.27 | ) | | | (0.10 | ) | | | (0.10 | ) |
Total from investment operations | | | $0.77 | | | | $0.53 | | | | $(0.02 | ) | | | $0.17 | | | | $0.18 | |
| | | | |
| Less distributions declared to shareholders | | | | | | | | | | | | | | | | | |
From net investment income | | | $(0.31 | ) | | | $(0.30 | ) | | | $(0.26 | ) | | | $(0.29 | ) | | | $(0.31 | ) |
From net realized gain | | | — | | | | — | | | | — | | | | — | | | | (0.04 | ) |
Total distributions declared to
shareholders | | | $(0.31 | ) | | | $(0.30 | ) | | | $(0.26 | ) | | | $(0.29 | ) | | | $(0.35 | ) |
Net asset value, end of period (x) | | | $11.08 | | | | $10.62 | | | | $10.39 | | | | $10.67 | | | | $10.79 | |
Total return (%) (r)(s)(t)(x) | | | 7.30 | | | | 5.22 | | | | (0.22 | ) | | | 1.63 | | | | 1.76 | |
| | | | |
Ratios (%) (to average net assets)
and Supplemental data: | | | | | | | | | | | | | | | | | |
Expenses before expense reductions (f) | | | 0.79 | | | | 0.82 | | | | 0.88 | | | | 0.90 | | | | 0.89 | |
Expenses after expense reductions (f) | | | 0.67 | | | | 0.69 | | | | 0.74 | | | | 0.74 | | | | 0.74 | |
Net investment income (loss) | | | 2.69 | | | | 2.89 | | | | 2.36 | | | | 2.49 | | | | 2.63 | |
Portfolio turnover | | | 144 | | | | 60 | | | | 27 | | | | 40 | | | | 53 | |
Net assets at end of period (000 omitted) | | | $2,458,183 | | | | $1,967,507 | | | | $1,761,171 | | | | $1,706,798 | | | | $1,829,002 | |
See Notes to Financial Statements
38
Financial Highlights – continued
| | | | | | | | | | | | | | | | | | | | |
| Class B | | Year ended | |
| | | | | |
| | | 4/30/20 | | | 4/30/19 | | | 4/30/18 | | | 4/30/17 | | | 4/30/16 | |
Net asset value, beginning of period | | | $10.64 | | | | $10.41 | | | | $10.68 | | | | $10.80 | | | | $10.97 | |
| | | | |
| Income (loss) from investment operations | | | | | | | | | | | | | | | | | |
Net investment income (loss) (d) | | | $0.22 | | | | $0.22 | | | | $0.17 | | | | $0.19 | | | | $0.20 | |
Net realized and unrealized gain (loss) | | | 0.47 | | | | 0.23 | | | | (0.26 | ) | | | (0.10 | ) | | | (0.10 | ) |
Total from investment operations | | | $0.69 | | | | $0.45 | | | | $(0.09 | ) | | | $0.09 | | | | $0.10 | |
| | | | |
| Less distributions declared to shareholders | | | | | | | | | | | | | | | | | |
From net investment income | | | $(0.23 | ) | | | $(0.22 | ) | | | $(0.18 | ) | | | $(0.21 | ) | | | $(0.23 | ) |
From net realized gain | | | — | | | | — | | | | — | | | | — | | | | (0.04 | ) |
Total distributions declared to
shareholders | | | $(0.23 | ) | | | $(0.22 | ) | | | $(0.18 | ) | | | $(0.21 | ) | | | $(0.27 | ) |
Net asset value, end of period (x) | | | $11.10 | | | | $10.64 | | | | $10.41 | | | | $10.68 | | | | $10.80 | |
Total return (%) (r)(s)(t)(x) | | | 6.50 | | | | 4.43 | | | | (0.87 | ) | | | 0.87 | | | | 1.01 | |
| | | | |
Ratios (%) (to average net assets)
and Supplemental data: | | | | | | | | | | | | | | | | | |
Expenses before expense reductions (f) | | | 1.54 | | | | 1.58 | | | | 1.63 | | | | 1.64 | | | | 1.65 | |
Expenses after expense reductions (f) | | | 1.42 | | | | 1.44 | | | | 1.49 | | | | 1.49 | | | | 1.49 | |
Net investment income (loss) | | | 1.97 | | | | 2.13 | | | | 1.61 | | | | 1.75 | | | | 1.89 | |
Portfolio turnover | | | 144 | | | | 60 | | | | 27 | | | | 40 | | | | 53 | |
Net assets at end of period (000 omitted) | | | $9,963 | | | | $13,727 | | | | $18,207 | | | | $24,514 | | | | $29,351 | |
| |
| Class C | | Year ended | |
| | | | | |
| | | 4/30/20 | | | 4/30/19 | | | 4/30/18 | | | 4/30/17 | | | 4/30/16 | |
Net asset value, beginning of period | | | $10.64 | | | | $10.41 | | | | $10.68 | | | | $10.80 | | | | $10.97 | |
| | | | |
| Income (loss) from investment operations | | | | | | | | | | | | | | | | | |
Net investment income (loss) (d) | | | $0.20 | | | | $0.21 | | | | $0.16 | | | | $0.18 | | | | $0.19 | |
Net realized and unrealized gain (loss) | | | 0.48 | | | | 0.23 | | | | (0.26 | ) | | | (0.10 | ) | | | (0.10 | ) |
Total from investment operations | | | $0.68 | | | | $0.44 | | | | $(0.10 | ) | | | $0.08 | | | | $0.09 | |
| | | | |
| Less distributions declared to shareholders | | | | | | | | | | | | | | | | | |
From net investment income | | | $(0.22 | ) | | | $(0.21 | ) | | | $(0.17 | ) | | | $(0.20 | ) | | | $(0.22 | ) |
From net realized gain | | | — | | | | — | | | | — | | | | — | | | | (0.04 | ) |
Total distributions declared to
shareholders | | | $(0.22 | ) | | | $(0.21 | ) | | | $(0.17 | ) | | | $(0.20 | ) | | | $(0.26 | ) |
Net asset value, end of period (x) | | | $11.10 | | | | $10.64 | | | | $10.41 | | | | $10.68 | | | | $10.80 | |
Total return (%) (r)(s)(t)(x) | | | 6.40 | | | | 4.33 | | | | (0.97 | ) | | | 0.77 | | | | 0.91 | |
| | | | |
Ratios (%) (to average net assets)
and Supplemental data: | | | | | | | | | | | | | | | | | |
Expenses before expense reductions (f) | | | 1.55 | | | | 1.57 | | | | 1.63 | | | | 1.64 | | | | 1.64 | |
Expenses after expense reductions (f) | | | 1.52 | | | | 1.54 | | | | 1.59 | | | | 1.59 | | | | 1.59 | |
Net investment income (loss) | | | 1.85 | | | | 2.03 | | | | 1.51 | | | | 1.65 | | | | 1.78 | |
Portfolio turnover | | | 144 | | | | 60 | | | | 27 | | | | 40 | | | | 53 | |
Net assets at end of period (000 omitted) | | | $99,437 | | | | $89,735 | | | | $100,768 | | | | $134,650 | | | | $150,596 | |
See Notes to Financial Statements
39
Financial Highlights – continued
| | | | | | | | | | | | | | | | | | | | |
| Class I | | Year ended | |
| | | | | |
| | | 4/30/20 | | | 4/30/19 | | | 4/30/18 | | | 4/30/17 | | | 4/30/16 | |
Net asset value, beginning of period | | | $10.62 | | | | $10.40 | | | | $10.67 | | | | $10.79 | | | | $10.96 | |
| | | | |
| Income (loss) from investment operations | | | | | | | | | | | | | | | | | |
Net investment income (loss) (d) | | | $0.31 | | | | $0.31 | | | | $0.27 | | | | $0.28 | | | | $0.30 | |
Net realized and unrealized gain (loss) | | | 0.49 | | | | 0.23 | | | | (0.26 | ) | | | (0.09 | ) | | | (0.10 | ) |
Total from investment operations | | | $0.80 | | | | $0.54 | | | | $0.01 | | | | $0.19 | | | | $0.20 | |
| | | | |
| Less distributions declared to shareholders | | | | | | | | | | | | | | | | | |
From net investment income | | | $(0.33 | ) | | | $(0.32 | ) | | | $(0.28 | ) | | | $(0.31 | ) | | | $(0.33 | ) |
From net realized gain | | | — | | | | — | | | | — | | | | — | | | | (0.04 | ) |
Total distributions declared to
shareholders | | | $(0.33 | ) | | | $(0.32 | ) | | | $(0.28 | ) | | | $(0.31 | ) | | | $(0.37 | ) |
Net asset value, end of period (x) | | | $11.09 | | | | $10.62 | | | | $10.40 | | | | $10.67 | | | | $10.79 | |
Total return (%) (r)(s)(t)(x) | | | 7.56 | | | | 5.27 | | | | 0.03 | | | | 1.78 | | | | 1.92 | |
| | | | |
Ratios (%) (to average net assets)
and Supplemental data: | | | | | | | | | | | | | | | | | |
Expenses before expense reductions (f) | | | 0.54 | | | | 0.57 | | | | 0.63 | | | | 0.65 | | | | 0.64 | |
Expenses after expense reductions (f) | | | 0.52 | | | | 0.54 | | | | 0.59 | | | | 0.59 | | | | 0.59 | |
Net investment income (loss) | | | 2.84 | | | | 3.03 | | | | 2.51 | | | | 2.62 | | | | 2.78 | |
Portfolio turnover | | | 144 | | | | 60 | | | | 27 | | | | 40 | | | | 53 | |
Net assets at end of period (000 omitted) | | | $1,513,495 | | | | $1,242,812 | | | | $1,180,741 | | | | $1,256,542 | | | | $914,984 | |
| |
| Class R1 | | Year ended | |
| | | | | |
| | | 4/30/20 | | | 4/30/19 | | | 4/30/18 | | | 4/30/17 | | | 4/30/16 | |
Net asset value, beginning of period | | | $10.64 | | | | $10.41 | | | | $10.68 | | | | $10.81 | | | | $10.97 | |
| | | | |
| Income (loss) from investment operations | | | | | | | | | | | | | | | | | |
Net investment income (loss) (d) | | | $0.20 | | | | $0.21 | | | | $0.16 | | | | $0.18 | | | | $0.19 | |
Net realized and unrealized gain (loss) | | | 0.48 | | | | 0.23 | | | | (0.26 | ) | | | (0.11 | ) | | | (0.09 | ) |
Total from investment operations | | | $0.68 | | | | $0.44 | | | | $(0.10 | ) | | | $0.07 | | | | $0.10 | |
| | | | |
| Less distributions declared to shareholders | | | | | | | | | | | | | | | | | |
From net investment income | | | $(0.22 | ) | | | $(0.21 | ) | | | $(0.17 | ) | | | $(0.20 | ) | | | $(0.22 | ) |
From net realized gain | | | — | | | | — | | | | — | | | | — | | | | (0.04 | ) |
Total distributions declared to
shareholders | | | $(0.22 | ) | | | $(0.21 | ) | | | $(0.17 | ) | | | $(0.20 | ) | | | $(0.26 | ) |
Net asset value, end of period (x) | | | $11.10 | | | | $10.64 | | | | $10.41 | | | | $10.68 | | | | $10.81 | |
Total return (%) (r)(s)(t)(x) | | | 6.40 | | | | 4.33 | | | | (0.97 | ) | | | 0.67 | | | | 1.00 | |
| | | | |
Ratios (%) (to average net assets)
and Supplemental data: | | | | | | | | | | | | | | | | | |
Expenses before expense reductions (f) | | | 1.54 | | | | 1.57 | | | | 1.63 | | | | 1.64 | | | | 1.64 | |
Expenses after expense reductions (f) | | | 1.52 | | | | 1.54 | | | | 1.59 | | | | 1.59 | | | | 1.59 | |
Net investment income (loss) | | | 1.87 | | | | 2.06 | | | | 1.50 | | | | 1.66 | | | | 1.78 | |
Portfolio turnover | | | 144 | | | | 60 | | | | 27 | | | | 40 | | | | 53 | |
Net assets at end of period (000 omitted) | | | $1,656 | | | | $2,005 | | | | $1,293 | | | | $2,466 | | | | $3,584 | |
See Notes to Financial Statements
40
Financial Highlights – continued
| | | | | | | | | | | | | | | | | | | | |
| Class R2 | | Year ended | |
| | | | | |
| | | 4/30/20 | | | 4/30/19 | | | 4/30/18 | | | 4/30/17 | | | 4/30/16 | |
Net asset value, beginning of period | | | $10.62 | | | | $10.39 | | | | $10.66 | | | | $10.78 | | | | $10.95 | |
| | | | |
| Income (loss) from investment operations | | | | | | | | | | | | | | | | | |
Net investment income (loss) (d) | | | $0.26 | | | | $0.26 | | | | $0.21 | | | | $0.23 | | | | $0.24 | |
Net realized and unrealized gain (loss) | | | 0.47 | | | | 0.24 | | | | (0.26 | ) | | | (0.09 | ) | | | (0.09 | ) |
Total from investment operations | | | $0.73 | | | | $0.50 | | | | $(0.05 | ) | | | $0.14 | | | | $0.15 | |
| | | | |
| Less distributions declared to shareholders | | | | | | | | | | | | | | | | | |
From net investment income | | | $(0.27 | ) | | | $(0.27 | ) | | | $(0.22 | ) | | | $(0.26 | ) | | | $(0.28 | ) |
From net realized gain | | | — | | | | — | | | | — | | | | — | | | | (0.04 | ) |
Total distributions declared to
shareholders | | | $(0.27 | ) | | | $(0.27 | ) | | | $(0.22 | ) | | | $(0.26 | ) | | | $(0.32 | ) |
Net asset value, end of period (x) | | | $11.08 | | | | $10.62 | | | | $10.39 | | | | $10.66 | | | | $10.78 | |
Total return (%) (r)(s)(t)(x) | | | 6.93 | | | | 4.85 | | | | (0.48 | ) | | | 1.27 | | | | 1.41 | |
| | | | |
Ratios (%) (to average net assets)
and Supplemental data: | | | | | | | | | | | | | | | | | |
Expenses before expense reductions (f) | | | 1.04 | | | | 1.08 | | | | 1.13 | | | | 1.15 | | | | 1.14 | |
Expenses after expense reductions (f) | | | 1.02 | | | | 1.04 | | | | 1.09 | | | | 1.09 | | | | 1.09 | |
Net investment income (loss) | | | 2.36 | | | | 2.53 | | | | 2.01 | | | | 2.15 | | | | 2.29 | |
Portfolio turnover | | | 144 | | | | 60 | | | | 27 | | | | 40 | | | | 53 | |
Net assets at end of period (000 omitted) | | | $27,083 | | | | $34,093 | | | | $44,339 | | | | $48,893 | | | | $49,042 | |
| |
| Class R3 | | Year ended | |
| | | | | |
| | | 4/30/20 | | | 4/30/19 | | | 4/30/18 | | | 4/30/17 | | | 4/30/16 | |
Net asset value, beginning of period | | | $10.62 | | | | $10.39 | | | | $10.67 | | | | $10.79 | | | | $10.95 | |
| | | | |
| Income (loss) from investment operations | | | | | | | | | | | | | | | | | |
Net investment income (loss) (d) | | | $0.29 | | | | $0.29 | | | | $0.24 | | | | $0.26 | | | | $0.27 | |
Net realized and unrealized gain (loss) | | | 0.47 | | | | 0.23 | | | | (0.27 | ) | | | (0.10 | ) | | | (0.09 | ) |
Total from investment operations | | | $0.76 | | | | $0.52 | | | | $(0.03 | ) | | | $0.16 | | | | $0.18 | |
| | | | |
| Less distributions declared to shareholders | | | | | | | | | | | | | | | | | |
From net investment income | | | $(0.30 | ) | | | $(0.29 | ) | | | $(0.25 | ) | | | $(0.28 | ) | | | $(0.30 | ) |
From net realized gain | | | — | | | | — | | | | — | | | | — | | | | (0.04 | ) |
Total distributions declared to
shareholders | | | $(0.30 | ) | | | $(0.29 | ) | | | $(0.25 | ) | | | $(0.28 | ) | | | $(0.34 | ) |
Net asset value, end of period (x) | | | $11.08 | | | | $10.62 | | | | $10.39 | | | | $10.67 | | | | $10.79 | |
Total return (%) (r)(s)(t)(x) | | | 7.20 | | | | 5.11 | | | | (0.32 | ) | | | 1.52 | | | | 1.76 | |
| | | | |
Ratios (%) (to average net assets)
and Supplemental data: | | | | | | | | | | | | | | | | | |
Expenses before expense reductions (f) | | | 0.79 | | | | 0.83 | | | | 0.88 | | | | 0.90 | | | | 0.89 | |
Expenses after expense reductions (f) | | | 0.77 | | | | 0.79 | | | | 0.84 | | | | 0.84 | | | | 0.84 | |
Net investment income (loss) | | | 2.60 | | | | 2.78 | | | | 2.25 | | | | 2.40 | | | | 2.53 | |
Portfolio turnover | | | 144 | | | | 60 | | | | 27 | | | | 40 | | | | 53 | |
Net assets at end of period (000 omitted) | | | $54,433 | | | | $49,418 | | | | $75,764 | | | | $90,449 | | | | $88,496 | |
See Notes to Financial Statements
41
Financial Highlights – continued
| | | | | | | | | | | | | | | | | | | | |
| Class R4 | | Year ended | |
| | | | | |
| | | 4/30/20 | | | 4/30/19 | | | 4/30/18 | | | 4/30/17 | | | 4/30/16 | |
Net asset value, beginning of period | | | $10.63 | | | | $10.40 | | | | $10.67 | | | | $10.79 | | | | $10.96 | |
| | | | |
| Income (loss) from investment operations | | | | | | | | | | | | | | | | | |
Net investment income (loss) (d) | | | $0.31 | | | | $0.32 | | | | $0.27 | | | | $0.28 | | | | $0.30 | |
Net realized and unrealized gain (loss) | | | 0.48 | | | | 0.23 | | | | (0.26 | ) | | | (0.09 | ) | | | (0.10 | ) |
Total from investment operations | | | $0.79 | | | | $0.55 | | | | $0.01 | | | | $0.19 | | | | $0.20 | |
| | | | |
| Less distributions declared to shareholders | | | | | | | | | | | | | | | | | |
From net investment income | | | $(0.33 | ) | | | $(0.32 | ) | | | $(0.28 | ) | | | $(0.31 | ) | | | $(0.33 | ) |
From net realized gain | | | — | | | | — | | | | — | | | | — | | | | (0.04 | ) |
Total distributions declared to
shareholders | | | $(0.33 | ) | | | $(0.32 | ) | | | $(0.28 | ) | | | $(0.31 | ) | | | $(0.37 | ) |
Net asset value, end of period (x) | | | $11.09 | | | | $10.63 | | | | $10.40 | | | | $10.67 | | | | $10.79 | |
Total return (%) (r)(s)(t)(x) | | | 7.46 | | | | 5.37 | | | | 0.03 | | | | 1.78 | | | | 1.92 | |
| | | | |
Ratios (%) (to average net assets)
and Supplemental data: | | | | | | | | | | | | | | | | | |
Expenses before expense reductions (f) | | | 0.54 | | | | 0.57 | | | | 0.63 | | | | 0.65 | | | | 0.64 | |
Expenses after expense reductions (f) | | | 0.52 | | | | 0.54 | | | | 0.59 | | | | 0.59 | | | | 0.59 | |
Net investment income (loss) | | | 2.85 | | | | 3.04 | | | | 2.50 | | | | 2.64 | | | | 2.79 | |
Portfolio turnover | | | 144 | | | | 60 | | | | 27 | | | | 40 | | | | 53 | |
Net assets at end of period (000 omitted) | | | $131,629 | | | | $116,533 | | | | $103,144 | | | | $118,494 | | | | $116,248 | |
| |
| Class R6 | | Year ended | |
| | | | | |
| | | 4/30/20 | | | 4/30/19 | | | 4/30/18 | | | 4/30/17 | | | 4/30/16 | |
Net asset value, beginning of period | | | $10.62 | | | | $10.39 | | | | $10.67 | | | | $10.79 | | | | $10.96 | |
| | | | |
| Income (loss) from investment operations | | | | | | | | | | | | | | | | | |
Net investment income (loss) (d) | | | $0.32 | | | | $0.33 | | | | $0.28 | | | | $0.30 | | | | $0.31 | |
Net realized and unrealized gain (loss) | | | 0.49 | | | | 0.23 | | | | (0.27 | ) | | | (0.10 | ) | | | (0.10 | ) |
Total from investment operations | | | $0.81 | | | | $0.56 | | | | $0.01 | | | | $0.20 | | | | $0.21 | |
| | | | |
| Less distributions declared to shareholders | | | | | | | | | | | | | | | | | |
From net investment income | | | $(0.34 | ) | | | $(0.33 | ) | | | $(0.29 | ) | | | $(0.32 | ) | | | $(0.34 | ) |
From net realized gain | | | — | | | | — | | | | — | | | | — | | | | (0.04 | ) |
Total distributions declared to
shareholders | | | $(0.34 | ) | | | $(0.33 | ) | | | $(0.29 | ) | | | $(0.32 | ) | | | $(0.38 | ) |
Net asset value, end of period (x) | | | $11.09 | | | | $10.62 | | | | $10.39 | | | | $10.67 | | | | $10.79 | |
Total return (%) (r)(s)(t)(x) | | | 7.67 | | | | 5.49 | | | | 0.04 | | | | 1.89 | | | | 2.03 | |
| | | | |
Ratios (%) (to average net assets)
and Supplemental data: | | | | | | | | | | | | | | | | | |
Expenses before expense reductions (f) | | | 0.45 | | | | 0.47 | | | | 0.52 | | | | 0.53 | | | | 0.53 | |
Expenses after expense reductions (f) | | | 0.42 | | | | 0.44 | | | | 0.48 | | | | 0.48 | | | | 0.48 | |
Net investment income (loss) | | | 2.95 | | | | 3.14 | | | | 2.61 | | | | 2.76 | | | | 2.90 | |
Portfolio turnover | | | 144 | | | | 60 | | | | 27 | | | | 40 | | | | 53 | |
Net assets at end of period (000 omitted) | | | $2,535,200 | | | | $2,232,386 | | | | $2,087,409 | | | | $1,422,342 | | | | $1,423,635 | |
See Notes to Financial Statements
42
Financial Highlights – continued
| | | | | | | | | | | | | | | | | | | | |
| Class 529A | | Year ended | |
| | | | | |
| | | 4/30/20 | | | 4/30/19 | | | 4/30/18 | | | 4/30/17 | | | 4/30/16 | |
Net asset value, beginning of period | | | $10.61 | | | | $10.38 | | | | $10.65 | | | | $10.77 | | | | $10.94 | |
| | | | |
| Income (loss) from investment operations | | | | | | | | | | | | | | | | | |
Net investment income (loss) (d) | | | $0.29 | | | | $0.30 | | | | $0.25 | | | | $0.27 | | | | $0.28 | |
Net realized and unrealized gain (loss) | | | 0.48 | | | | 0.23 | | | | (0.26 | ) | | | (0.10 | ) | | | (0.10 | ) |
Total from investment operations | | | $0.77 | | | | $0.53 | | | | $(0.01 | ) | | | $0.17 | | | | $0.18 | |
| | | | |
| Less distributions declared to shareholders | | | | | | | | | | | | | | | | | |
From net investment income | | | $(0.31 | ) | | | $(0.30 | ) | | | $(0.26 | ) | | | $(0.29 | ) | | | $(0.31 | ) |
From net realized gain | | | — | | | | — | | | | — | | | | — | | | | (0.04 | ) |
Total distributions declared to
shareholders | | | $(0.31 | ) | | | $(0.30 | ) | | | $(0.26 | ) | | | $(0.29 | ) | | | $(0.35 | ) |
Net asset value, end of period (x) | | | $11.07 | | | | $10.61 | | | | $10.38 | | | | $10.65 | | | | $10.77 | |
Total return (%) (r)(s)(t)(x) | | | 7.28 | | | | 5.20 | | | | (0.15 | ) | | | 1.60 | | | | 1.72 | |
| | | | |
Ratios (%) (to average net assets)
and Supplemental data: | | | | | | | | | | | | | | | | | |
Expenses before expense reductions (f) | | | 0.84 | | | | 0.87 | | | | 0.96 | | | | 1.00 | | | | 0.99 | |
Expenses after expense reductions (f) | | | 0.70 | | | | 0.71 | | | | 0.76 | | | | 0.76 | | | | 0.78 | |
Net investment income (loss) | | | 2.67 | | | | 2.87 | | | | 2.34 | | | | 2.47 | | | | 2.60 | |
Portfolio turnover | | | 144 | | | | 60 | | | | 27 | | | | 40 | | | | 53 | |
Net assets at end of period (000 omitted) | | | $13,259 | | | | $9,657 | | | | $8,816 | | | | $7,879 | | | | $6,132 | |
| |
| Class 529B | | Year ended | |
| | | | | |
| | | 4/30/20 | | | 4/30/19 | | | 4/30/18 | | | 4/30/17 | | | 4/30/16 | |
Net asset value, beginning of period | | | $10.64 | | | | $10.41 | | | | $10.68 | | | | $10.81 | | | | $10.97 | |
| | | | |
| Income (loss) from investment operations | | | | | | | | | | | | | | | | | |
Net investment income (loss) (d) | | | $0.22 | | | | $0.21 | | | | $0.15 | | | | $0.17 | | | | $0.19 | |
Net realized and unrealized gain (loss) | | | 0.48 | | | | 0.23 | | | | (0.26 | ) | | | (0.10 | ) | | | (0.09 | ) |
Total from investment operations | | | $0.70 | | | | $0.44 | | | | $(0.11 | ) | | | $0.07 | | | | $0.10 | |
| | | | |
| Less distributions declared to shareholders | | | | | | | | | | | | | | | | | |
From net investment income | | | $(0.21 | ) | | | $(0.21 | ) | | | $(0.16 | ) | | | $(0.20 | ) | | | $(0.22 | ) |
From net realized gain | | | — | | | | — | | | | — | | | | — | | | | (0.04 | ) |
Total distributions declared to
shareholders | | | $(0.21 | ) | | | $(0.21 | ) | | | $(0.16 | ) | | | $(0.20 | ) | | | $(0.26 | ) |
Net asset value, end of period (x) | | | $11.13 | | | | $10.64 | | | | $10.41 | | | | $10.68 | | | | $10.81 | |
Total return (%) (r)(s)(t)(x) | | | 6.63 | | | | 4.28 | | | | (1.02 | ) | | | 0.62 | | | | 0.95 | |
| | | | |
Ratios (%) (to average net assets)
and Supplemental data: | | | | | | | | | | | | | | | | | |
Expenses before expense reductions (f) | | | 1.36 | | | | 1.62 | | | | 1.71 | | | | 1.74 | | | | 1.74 | |
Expenses after expense reductions (f) | | | 1.34 | | | | 1.59 | | | | 1.64 | | | | 1.64 | | | | 1.64 | |
Net investment income (loss) | | | 2.04 | | | | 1.98 | | | | 1.45 | | | | 1.60 | | | | 1.74 | |
Portfolio turnover | | | 144 | | | | 60 | | | | 27 | | | | 40 | | | | 53 | |
Net assets at end of period (000 omitted) | | | $202 | | | | $243 | | | | $304 | | | | $297 | | | | $339 | |
See Notes to Financial Statements
43
Financial Highlights – continued
| | | | | | | | | | | | | | | | | | | | |
| Class 529C | | Year ended | |
| | | | | |
| | | 4/30/20 | | | 4/30/19 | | | 4/30/18 | | | 4/30/17 | | | 4/30/16 | |
Net asset value, beginning of period | | | $10.64 | | | | $10.41 | | | | $10.68 | | | | $10.80 | | | | $10.97 | |
| | | | |
| Income (loss) from investment operations | | | | | | | | | | | | | | | | | |
Net investment income (loss) (d) | | | $0.20 | | | | $0.21 | | | | $0.16 | | | | $0.17 | | | | $0.19 | |
Net realized and unrealized gain (loss) | | | 0.47 | | | | 0.23 | | | | (0.27 | ) | | | (0.09 | ) | | | (0.10 | ) |
Total from investment operations | | | $0.67 | | | | $0.44 | | | | $(0.11 | ) | | | $0.08 | | | | $0.09 | |
| | | | |
| Less distributions declared to shareholders | | | | | | | | | | | | | | | | | |
From net investment income | | | $(0.21 | ) | | | $(0.21 | ) | | | $(0.16 | ) | | | $(0.20 | ) | | | $(0.22 | ) |
From net realized gain | | | — | | | | — | | | | — | | | | — | | | | (0.04 | ) |
Total distributions declared to
shareholders | | | $(0.21 | ) | | | $(0.21 | ) | | | $(0.16 | ) | | | $(0.20 | ) | | | $(0.26 | ) |
Net asset value, end of period (x) | | | $11.10 | | | | $10.64 | | | | $10.41 | | | | $10.68 | | | | $10.80 | |
Total return (%) (r)(s)(t)(x) | | | 6.34 | | | | 4.28 | | | | (1.02 | ) | | | 0.72 | | | | 0.86 | |
| | | | |
Ratios (%) (to average net assets)
and Supplemental data: | | | | | | | | | | | | | | | | | |
Expenses before expense reductions (f) | | | 1.60 | | | | 1.62 | | | | 1.71 | | | | 1.75 | | | | 1.74 | |
Expenses after expense reductions (f) | | | 1.56 | | | | 1.59 | | | | 1.64 | | | | 1.64 | | | | 1.64 | |
Net investment income (loss) | | | 1.81 | | | | 1.99 | | | | 1.45 | | | | 1.59 | | | | 1.73 | |
Portfolio turnover | | | 144 | | | | 60 | | | | 27 | | | | 40 | | | | 53 | |
Net assets at end of period (000 omitted) | | | $3,837 | | | | $3,298 | | | | $3,210 | | | | $3,843 | | | | $3,283 | |
| (d) | Per share data is based on average shares outstanding. |
| (f) | Ratios do not reflect reductions from fees paid indirectly, if applicable. |
| (r) | Certain expenses have been reduced without which performance would have been lower. |
| (s) | From time to time the fund may receive proceeds from litigation settlements, without which performance would be lower. |
| (t) | Total returns do not include any applicable sales charges. |
| (x) | The net asset values and total returns have been calculated on net assets which include adjustments made in accordance with U.S. generally accepted accounting principles required at period end for financial reporting purposes. |
See Notes to Financial Statements
44
NOTES TO FINANCIAL STATEMENTS
(1) Business and Organization
MFS Total Return Bond Fund (the fund) is a diversified series of MFS Series Trust IX (the trust). The trust is organized as a Massachusetts business trust and is registered under the Investment Company Act of 1940, as amended, as anopen-end management investment company.
The fund is an investment company and accordingly follows the investment company accounting and reporting guidance of the Financial Accounting Standards Board (FASB) Accounting Standards Codification Topic 946 Financial Services – Investment Companies.
(2) Significant Accounting Policies
General– The preparation of financial statements in conformity with U.S. generally accepted accounting principles requires management to make estimates and assumptions that affect the reported amounts of assets and liabilities, and disclosure of contingent assets and liabilities at the date of the financial statements and the reported amounts of increases and decreases in net assets from operations during the reporting period. Actual results could differ from those estimates. In the preparation of these financial statements, management has evaluated subsequent events occurring after the date of the fund’s Statement of Assets and Liabilities through the date that the financial statements were issued.
In March 2020, the FASB issued Accounting Standards Update2020-04, Reference Rate Reform (Topic 848) – Facilitation of the Effects of Reference Rate Reform on Financial Reporting (“ASU2020-04”), which provides optional, temporary relief with respect to the financial reporting of contracts subject to certain types of modifications due to the planned discontinuation of the London Interbank Offered Rate (LIBOR) and other IBOR-based reference rates as of the end of 2021. The temporary relief provided by ASU2020-04 is effective for certain reference rate-related contract modifications that occur during the period from March 12, 2020 through December 31, 2022. Management is evaluating the impact of ASU2020-04 on the fund’s investments, derivatives, debt and other contracts that will undergo reference rate-related modifications as a result of the reference rate reform.
In March 2017, the FASB issued Accounting Standards Update2017-08, Receivables –Nonrefundable Fees and Other Costs (Subtopic310-20) – Premium Amortization on Purchased Callable Debt Securities (“ASU2017-08”). For callable debt securities purchased at a premium that have explicit,non-contingent call features and that are callable at fixed prices on preset dates, ASU2017-08 requires the premium to be amortized to the earliest call date. The fund adopted ASU2017-08 as of the beginning of the reporting period on a modified retrospective basis. The adoption resulted in a change in accounting principle, since the fund had historically amortized such premiums to maturity for U.S. GAAP. As a result of the adoption, the fund recognized a cumulative effect adjustment that decreased the beginning of period cost of investments and increased the unrealized appreciation on investments by $2,986,877. Adoption had no impact on the fund’s net assets or any prior period information presented in the financial statements. With respect to the fund’s results of operations,
45
Notes to Financial Statements – continued
amortization of premium to first call date under ASU2017-08 accelerates amortization with the intent of more closely aligning the recognition of income on such bonds with the economics of the instrument.
Balance Sheet Offsetting– The fund’s accounting policy with respect to balance sheet offsetting is that, absent an event of default by the counterparty or a termination of the agreement, the International Swaps and Derivatives Association (ISDA) Master Agreement, or similar agreement, does not result in an offset of reported amounts of financial assets and financial liabilities in the Statement of Assets and Liabilities across transactions between the fund and the applicable counterparty. The fund’s right to setoff may be restricted or prohibited by the bankruptcy or insolvency laws of the particular jurisdiction to which a specific master netting agreement counterparty is subject. Balance sheet offsetting disclosures, to the extent applicable to the fund, have been included in the fund’s Significant Accounting Policies note under the captions for each of the fund’sin-scope financial instruments and transactions.
Investment Valuations– Debt instruments and floating rate loans, including restricted debt instruments, are generally valued at an evaluated or composite bid as provided by a third-party pricing service. Short-term instruments with a maturity at issuance of 60 days or less may be valued at amortized cost, which approximates market value. Exchange-traded options are generally valued at the last sale or official closing price on their primary exchange as provided by a third-party pricing service. Exchange-traded options for which there were no sales reported that day are generally valued at the last daily bid quotation on their primary exchange as provided by athird-party pricing service. For put options, the position may be valued at the last daily ask quotation if there are no trades reported during the day. Options not traded on an exchange are generally valued at a broker/dealer bid quotation. Foreign currency options are generally valued at valuations provided by a third-party pricing service. Futures contracts are generally valued at last posted settlement price on their primary exchange as provided by a third-party pricing service. Futures contracts for which there were no trades that day for a particular position are generally valued at the closing bid quotation on their primary exchange as provided by a third-party pricing service. Swap agreements are generally valued using valuations provided by athird-party pricing service, which for cleared swaps includes an evaluation of any trading activity at the clearinghouses. Forward foreign currency exchange contracts are generally valued at the mean of bid and asked prices for the time period interpolated from rates provided by a third-party pricing service for proximate time periods.Open-end investment companies are generally valued at net asset value per share. Securities and other assets generally valued on the basis of information from a third-party pricing service may also be valued at a broker/dealer bid quotation. In determining values, third-party pricing services can utilize both transaction data and market information such as yield, quality, coupon rate, maturity, type of issue, trading characteristics, and other market data. The values of foreign securities and other assets and liabilities expressed in foreign currencies are converted to U.S. dollars using the mean of bid and asked prices for rates provided by a third-party pricing service.
The Board of Trustees has delegated primary responsibility for determining or causing to be determined the value of the fund’s investments (including any fair valuation) to the adviser pursuant to valuation policies and procedures approved by the Board. If the
46
Notes to Financial Statements – continued
adviser determines that reliable market quotations are not readily available, investments are valued at fair value as determined in good faith by the adviser in accordance with such procedures under the oversight of the Board of Trustees. Under the fund’s valuation policies and procedures, market quotations are not considered to be readily available for most types of debt instruments and floating rate loans and many types of derivatives. These investments are generally valued at fair value based on information from third-party pricing services. In addition, investments may be valued at fair value if the adviser determines that an investment’s value has been materially affected by events occurring after the close of the exchange or market on which the investment is principally traded (such as foreign exchange or market) and prior to the determination of the fund’s net asset value, or after the halt of trading of a specific security where trading does not resume prior to the close of the exchange or market on which the security is principally traded. The adviser generally relies on third-party pricing services or other information (such as the correlation with price movements of similar securities in the same or other markets; the type, cost and investment characteristics of the security; the business and financial condition of the issuer; and trading and other market data) to assist in determining whether to fair value and at what value to fair value an investment. The value of an investment for purposes of calculating the fund’s net asset value can differ depending on the source and method used to determine value. When fair valuation is used, the value of an investment used to determine the fund’s net asset value may differ from quoted or published prices for the same investment. There can be no assurance that the fund could obtain the fair value assigned to an investment if it were to sell the investment at the same time at which the fund determines its net asset value per share.
Various inputs are used in determining the value of the fund’s assets or liabilities. These inputs are categorized into three broad levels. In certain cases, the inputs used to measure fair value may fall into different levels of the fair value hierarchy. In such cases, an investment’s level within the fair value hierarchy is based on the lowest level of input that is significant to the fair value measurement. The fund’s assessment of the significance of a particular input to the fair value measurement in its entirety requires judgment, and considers factors specific to the investment. Level 1 includes unadjusted quoted prices in active markets for identical assets or liabilities. Level 2 includes other significant observable market-based inputs (including quoted prices for similar securities, interest rates, prepayment speed, and credit risk). Level 3 includes unobservable inputs, which may include the adviser’s own assumptions in determining the fair value of investments. Other financial instruments are derivative instruments,
47
Notes to Financial Statements – continued
such as futures contracts and swap agreements. The following is a summary of the levels used as of April 30, 2020 in valuing the fund’s assets or liabilities:
| | | | | | | | | | | | | | | | |
| | | | |
| Financial Instruments | | Level 1 | | | Level 2 | | | Level 3 | | | Total | |
| U.S. Treasury Bonds & U.S. Government Agencies & Equivalents | | | $— | | | | $701,913,547 | | | | $— | | | | $701,913,547 | |
| Non - U.S. Sovereign Debt | | | — | | | | 38,711,776 | | | | — | | | | 38,711,776 | |
| Municipal Bonds | | | — | | | | 162,977,192 | | | | — | | | | 162,977,192 | |
| U.S. Corporate Bonds | | | — | | | | 2,708,589,535 | | | | — | | | | 2,708,589,535 | |
| Residential Mortgage-Backed Securities | | | — | | | | 1,514,649,346 | | | | — | | | | 1,514,649,346 | |
| Commercial Mortgage-Backed Securities | | | — | | | | 768,506,150 | | | | — | | | | 768,506,150 | |
| Asset-Backed Securities (including CDOs) | | | — | | | | 609,249,513 | | | | — | | | | 609,249,513 | |
| Foreign Bonds | | | — | | | | 502,366,491 | | | | — | | | | 502,366,491 | |
| Mutual Funds | | | 95,537,022 | | | | — | | | | — | | | | 95,537,022 | |
| Total | | | $95,537,022 | | | | $7,006,963,550 | | | | $— | | | | $7,102,500,572 | |
| | | | |
| Other Financial Instruments | | | | | | | | | | | | |
| Futures Contracts – Assets | | | $14,600,829 | | | | $— | | | | $— | | | | $14,600,829 | |
| Futures Contracts – Liabilities | | | (26,512,952 | ) | | | — | | | | — | | | | (26,512,952 | ) |
| Swap Agreements – Liabilities | | | — | | | | (24,321,864 | ) | | | — | | | | (24,321,864 | ) |
For further information regarding security characteristics, see the Portfolio of Investments.
Foreign Currency Translation– Purchases and sales of foreign investments, income, and expenses are converted into U.S. dollars based upon currency exchange rates prevailing on the respective dates of such transactions or on the reporting date for foreign denominated receivables and payables. Gains and losses attributable to foreign currency exchange rates on sales of securities are recorded for financial statement purposes as net realized gains and losses on investments. Gains and losses attributable to foreign exchange rate movements on receivables, payables, income and expenses are recorded for financial statement purposes as foreign currency transaction gains and losses. That portion of both realized and unrealized gains and losses on investments that results from fluctuations in foreign currency exchange rates is not separately disclosed.
Derivatives– The fund uses derivatives primarily to increase or decrease exposure to a particular market or segment of the market, or security, to increase or decrease interest rate or currency exposure, or as alternatives to direct investments. Derivatives are used for hedging ornon-hedging purposes. While hedging can reduce or eliminate losses, it can also reduce or eliminate gains. When the fund uses derivatives as an investment to increase market exposure, or for hedging purposes, gains and losses from derivative instruments may be substantially greater than the derivative’s original cost.
The derivative instruments used by the fund during the period were purchased options, futures contracts, forward foreign currency exchange contracts, and swap agreements. Depending on the type of derivative, the fund may exit a derivative position by entering into an offsetting transaction with a counterparty or exchange, negotiating an agreement with the derivative counterparty, or novating the position to a third party. The fund may be unable to promptly close out a futures position in instances where the
48
Notes to Financial Statements – continued
daily fluctuation in the price for that type of future exceeds the daily limit set by the exchange. The fund’s period end derivatives, as presented in the Portfolio of Investments and the associated Derivative Contract tables, generally are indicative of the volume of its derivative activity during the period.
The following table presents, by major type of derivative contract, the fair value, on a gross basis, of the asset and liability components of derivatives held by the fund at April 30, 2020 as reported in the Statement of Assets and Liabilities:
| | | | | | | | | | |
| | | | | Fair Value (a) | |
| | | |
| Risk | | Derivative Contracts | | Asset Derivatives | | | Liability Derivatives | |
| Interest Rate | | Interest Rate Futures | | | $14,600,829 | | | | $(26,512,952 | ) |
| Credit | | Credit Default Swaps | | | — | | | | (24,321,864 | ) |
| Total | | | | | $14,600,829 | | | | $(50,834,816 | ) |
| (a) | Values presented in this table for futures contracts and cleared swap agreements correspond to the values reported in the fund’s Portfolio of Investments. Only the current day net variation margin for futures contracts and cleared swap agreements is separately reported within the fund’s Statement of Assets and Liabilities. |
The following table presents, by major type of derivative contract, the realized gain (loss) on derivatives held by the fund for the year ended April 30, 2020 as reported in the Statement of Operations:
| | | | | | | | | | | | | | | | |
| | | | |
| Risk | | Futures
Contracts | | | Swap
Agreements | | | Forward
Foreign
Currency
Exchange
Contracts | | | Unaffiliated
Issuers
(Purchased
Options) | |
| Interest Rate | | | $12,496,848 | | | | $— | | | | $— | | | | $(972,720 | ) |
| Foreign Exchange | | | — | | | | — | | | | 2,098,750 | | | | — | |
| Credit | | | — | | | | (20,634,018 | ) | | | — | | | | 3,708,585 | |
| Total | | | $12,496,848 | | | | $(20,634,018 | ) | | | $2,098,750 | | | | $2,735,865 | |
The following table presents, by major type of derivative contract, the change in unrealized appreciation or depreciation on derivatives held by the fund for the year ended April 30, 2020 as reported in the Statement of Operations:
| | | | | | | | |
| | |
| Risk | | Futures
Contracts | | | Swap
Agreements | |
| Interest Rate | | | $(10,505,077 | ) | | | $— | |
| Credit | | | — | | | | (13,949,151 | ) |
| Total | | | $(10,505,077 | ) | | | $(13,949,151 | ) |
Derivative counterparty credit risk is managed through formal evaluation of the creditworthiness of all potential counterparties. On certain, but not all, uncleared derivatives, the fund attempts to reduce its exposure to counterparty credit risk whenever possible by entering into an ISDA Master Agreement on a bilateral basis. The ISDA Master Agreement gives each party to the agreement the right to terminate all transactions traded under such agreement if there is a specified deterioration in the credit quality of the other party. Upon an event of default or a termination of the ISDA Master Agreement, thenon-defaulting party has the right to close out all transactions
49
Notes to Financial Statements – continued
traded under such agreement and to net amounts owed under each agreement to one net amount payable by one party to the other. This right to close out and net payments across all transactions traded under the ISDA Master Agreement could result in a reduction of the fund’s credit risk to such counterparty equal to any amounts payable by the fund under the applicable transactions, if any.
Collateral and margin requirements differ by type of derivative. For cleared derivatives (e.g., futures contracts, cleared swaps, and exchange-traded options), margin requirements are set by the clearing broker and the clearing house and collateral, in the form of cash or securities, is posted by the fund directly with the clearing broker. Collateral terms are counterparty agreement specific for uncleared derivatives (e.g., forward foreign currency exchange contracts, uncleared swap agreements, and uncleared options) and collateral, in the form of cash and securities, is held in segregated accounts with the fund’s custodian in connection with these agreements. For derivatives traded under an ISDA Master Agreement, which contains a collateral support annex, the collateral requirements are netted across all transactions traded under such counterparty-specific agreement and an amount is posted from one party to the other to collateralize such obligations. Cash that has been segregated or delivered to cover the fund’s collateral or margin obligations under derivative contracts, if any, will be reported separately in the Statement of Assets and Liabilities as restricted cash for uncleared derivatives and/or deposits with brokers for cleared derivatives. Securities pledged as collateral or margin for the same purpose, if any, are noted in the Portfolio of Investments. The fund may be required to make payments of interest on uncovered collateral or margin obligations with the broker. Any such payments are included in “Miscellaneous” expense in the Statement of Operations.
Purchased Options– The fund purchased call and put options for a premium. Purchased call and put options entitle the holder to buy and sell a specified number of shares or units of a particular security, currency or index at a specified price at a specified date or within a specified period of time. Purchasing call options may hedge against an anticipated increase in the dollar cost of securities or currency to be acquired or increase the fund’s exposure to an underlying instrument. Purchasing put options may hedge against an anticipated decline in the value of portfolio securities or currency or decrease the fund’s exposure to an underlying instrument.
The premium paid is initially recorded as an investment in the Statement of Assets and Liabilities. That investment is subsequentlymarked-to-market daily with the difference between the premium paid and the market value of the purchased option being recorded as unrealized appreciation or depreciation. Premiums paid for purchased call and put options which have expired are treated as realized losses on investments in the Statement of Operations. Upon the exercise or closing of a purchased call option, the premium paid is added to the cost of the security or financial instrument purchased. Upon the exercise or closing of a purchased put option, the premium paid is offset against the proceeds on the sale of the underlying security or financial instrument in order to determine the realized gain or loss on investments.
Whether or not the option is exercised, the fund’s maximum risk of loss from purchasing an option is the amount of premium paid. All option contracts involve credit risk if the counterparty to the option contract fails to perform. For uncleared options, this risk is mitigated in cases where there is an ISDA Master Agreement
50
Notes to Financial Statements – continued
between the fund and the counterparty providing for netting as described above and, where applicable, by the posting of collateral by the counterparty to the fund to cover the fund’s exposure to the counterparty under such ISDA Master Agreement.
Futures Contracts– The fund entered into futures contracts which may be used to hedge against or obtain broad market exposure, interest rate exposure, currency exposure, or to manage duration. A futures contract represents a commitment for the future purchase or sale of an asset at a specified price on a specified date.
Upon entering into a futures contract, the fund is required to deposit with the broker, either in cash or securities, an initial margin in an amount equal to a specified percentage of the notional amount of the contract. Subsequent payments (variation margin) are made or received by the fund each day, depending on the daily fluctuations in the value of the contract, and are recorded for financial statement purposes as unrealized gain or loss by the fund until the contract is closed or expires at which point the gain or loss on futures contracts is realized.
The fund bears the risk of interest rates, exchange rates or securities prices moving unexpectedly, in which case, the fund may not achieve the anticipated benefits of the futures contracts and may realize a loss. While futures contracts may present less counterparty risk to the fund since the contracts are exchange traded and the exchange’s clearinghouse guarantees payments to the broker, there is still counterparty credit risk due to the insolvency of the broker. The fund’s maximum risk of loss due to counterparty credit risk is equal to the margin posted by the fund to the broker plus any gains or minus any losses on the outstanding futures contracts.
Forward Foreign Currency Exchange Contracts– The fund entered into forward foreign currency exchange contracts for the purchase or sale of a specific foreign currency at a fixed price on a future date. These contracts may be used to hedge the fund’s currency risk or fornon-hedging purposes. For hedging purposes, the fund may enter into contracts to deliver or receive foreign currency that the fund will receive from or use in its normal investment activities. The fund may also use contracts to hedge against declines in the value of foreign currency denominated securities due to unfavorable exchange rate movements. Fornon-hedging purposes, the fund may enter into contracts with the intent of changing the relative exposure of the fund’s portfolio of securities to different currencies to take advantage of anticipated exchange rate changes.
Forward foreign currency exchange contracts are adjusted by the daily exchange rate of the underlying currency and any unrealized gains or losses are recorded as a receivable or payable for forward foreign currency exchange contracts until the contract settlement date. On contract settlement date, any gain or loss on the contract is recorded as realized gains or losses on forward foreign currency exchange contracts.
Risks may arise upon entering into these contracts from unanticipated movements in the value of the contract and from the potential inability of counterparties to meet the terms of their contracts. Generally, the fund’s maximum risk due to counterparty credit risk is the unrealized gain on the contract due to the use of Continuous Linked Settlement, a multicurrency cash settlement system for the centralized settlement of foreign transactions. This risk is mitigated in cases where there is an ISDA Master Agreement between the fund and the counterparty providing for netting as described
51
Notes to Financial Statements – continued
above and, where applicable, by the posting of collateral by the counterparty to the fund to cover the fund’s exposure to the counterparty under such ISDA Master Agreement.
Swap Agreements– During the period the fund entered into swap agreements. Swap agreements generally involve a periodic exchange of cash payments on a net basis, at specified intervals or upon the occurrence of specified events, between the fund and a counterparty. Certain swap agreements may be entered into as a bilateral contract (“uncleared swaps”) while others are required to be centrally cleared (“cleared swaps”). In a cleared swap transaction, the ultimate counterparty to the transaction is a clearinghouse (the “clearinghouse”). The contract is transferred and accepted by the clearinghouse immediately following execution of the swap contract with an executing broker. Thereafter, throughout the term of the cleared swap, the fund interfaces indirectly with the clearinghouse through a clearing broker and has counterparty risk to the clearing broker as well.
Both cleared and uncleared swap agreements are marked to market daily. The value of uncleared swap agreements is reported in the Statement of Assets and Liabilities as “Uncleared swaps, at value” which includes any related interest accruals to be paid or received by the fund. For cleared swaps, payments (variation margin) are made or received by the fund each day, depending on the daily fluctuations in the value of the cleared swap, such that only the current day net receivable or payable for variation margin is reported in the Statement of Assets and Liabilities.
For both cleared and uncleared swaps, the periodic exchange of net cash payments, at specified intervals or upon the occurrence of specified events as stipulated by the agreement, is recorded as realized gain or loss on swap agreements in the Statement of Operations. Premiums paid or received at the inception of the agreements are amortized using the effective interest method over the term of the agreement as realized gain or loss on swap agreements in the Statement of Operations. A liquidation payment received or made upon early termination is recorded as a realized gain or loss on swap agreements in the Statement of Operations. The change in unrealized appreciation or depreciation on swap agreements in the Statement of Operations reflects the aggregate change over the reporting period in the value of swaps net of any unamortized premiums paid or received.
Risks related to swap agreements include the possible lack of a liquid market, unfavorable market and interest rate movements of the underlying instrument and the failure of the counterparty to perform under the terms of the agreements. The fund’s maximum risk of loss from counterparty credit risk is the discounted net value of the cash flows to be received from/paid to the counterparty over the contract’s remaining life, to the extent that the amount is positive. To address counterparty risk, uncleared swap agreements are limited to only highly-rated counterparties. Risk is further reduced by having an ISDA Master Agreement between the fund and the counterparty providing for netting as described above and, where applicable, by the posting of collateral by the counterparty to the fund to cover the fund’s exposure to the counterparty under such ISDA Master Agreement. The fund’s counterparty risk due to cleared swaps is mitigated by the fact that the clearinghouse is the true counterparty to the transaction and the regulatory requirement safeguards in the event of a clearing broker bankruptcy.
52
Notes to Financial Statements – continued
The fund entered into credit default swap agreements in order to manage its exposure to the market or certain sectors of the market, to reduce its credit risk exposure to defaults of corporate and sovereign issuers or to create exposure to corporate or sovereign issuers to which it is not otherwise exposed. In a credit default swap agreement, the protection buyer can make an upfront payment and will make a stream of payments to the protection seller based on a fixed percentage applied to the agreement notional amount in exchange for the right to receive a specified return upon the occurrence of a defined credit event on the reference obligation (which may be either a single security or a basket of securities issued by corporate or sovereign issuers) and, with respect to the cases where physical settlement applies, the delivery by the buyer to the seller of a defined deliverable obligation. Although agreement-specific, credit events generally consist of a combination of the following: bankruptcy, failure to pay, restructuring, obligation acceleration, obligation default, or repudiation/moratorium, each as defined in the 2003 ISDA Credit Derivatives Definitions as amended by the relevant agreement. Restructuring is generally not applicable when the reference obligation is issued by a North American corporation and obligation acceleration, obligation default, or repudiation/moratorium are generally only applicable when the reference obligation is issued by a sovereign entity or an entity in an emerging country. Upon determination of the final price for the deliverable obligation (or upon delivery of the deliverable obligation in the case of physical settlement), the difference between the value of the deliverable obligation and the swap agreement’s notional amount is recorded as realized gain or loss on swap agreements in the Statement of Operations.
Credit default swap agreements are considered to have credit-risk-related contingent features since they trigger payment by the protection seller to the protection buyer upon the occurrence of a defined credit event. The aggregate fair value of credit default swap agreements in a net liability position as of April 30, 2020 is disclosed in the footnotes to the Portfolio of Investments. The maximum amount of future, undiscounted payments that the fund, as protection seller, could be required to make is equal to the swap agreement’s notional amount. The protection seller’s payment obligation would be offset to the extent of the value of the agreement’s deliverable obligation. If a defined credit event had occurred as of April 30, 2020, the swap agreement’s credit-risk-related contingent features would have been triggered and, for those swap agreements in a net liability position for which the fund is the protection seller, the fund in order to settle these swap agreements would have been required to either (1) pay the swap agreement’s notional value of $301,100,000 less the value of the agreements’ related deliverable obligations as decided through an auction or (2) pay the notional value of the swap agreements in return for physical receipt of the deliverable obligations. The fund’s maximum risk of loss from counterparty risk, either as the protection seller or as the protection buyer, is the fair value of the agreement.
TBA Dollar Roll Transactions– The fund enters into TBA dollar roll transactions in which the fund sells TBA mortgage-backed securities to financial institutions and simultaneously agrees to repurchase similar (same issuer, type and coupon) securities at a later date at an agreed-upon price. During the period between the sale and repurchase, the fund will not be entitled to receive interest and principal payments on the securities sold. The fund accounts for dollar roll transactions as purchases and sales
53
Notes to Financial Statements – continued
and realizes gains and losses on these transactions. TBA dollar roll transactions involve the risk that the market value of the securities that the fund is required to purchase may decline below the agreed upon repurchase price of those securities.
Indemnifications– Under the fund’s organizational documents, its officers and Trustees may be indemnified against certain liabilities and expenses arising out of the performance of their duties to the fund. Additionally, in the normal course of business, the fund enters into agreements with service providers that may contain indemnification clauses. The fund’s maximum exposure under these agreements is unknown as this would involve future claims that may be made against the fund that have not yet occurred.
Investment Transactions and Income– Investment transactions are recorded on the trade date. Interest income is recorded on the accrual basis. All premium and discount is amortized or accreted for financial statement purposes in accordance with U.S. generally accepted accounting principles. Some securities may be purchased or sold on an extended settlement basis which includes “when-issued”, “delayed delivery” or “To Be Announced” (TBA) securities. For extended settlement transactions, the receipt or delivery of the securities by the fund and related payments occur at a future date, usually beyond the customary settlement time. Interest payments received in additional securities are recorded on theex-interest date in an amount equal to the value of the security on such date.
The fund may receive proceeds from litigation settlements. Any proceeds received from litigation involving portfolio holdings are reflected in the Statement of Operations in realized gain/loss if the security has been disposed of by the fund or in unrealized gain/loss if the security is still held by the fund. Any other proceeds from litigation not related to portfolio holdings are reflected as other income in the Statement of Operations.
The fund invests a significant portion of its assets in asset-backed and/or mortgage-backed securities. For these securities, the value of the debt instrument also depends on the credit quality and adequacy of the underlying assets or collateral as well as whether there is a security interest in the underlying assets or collateral. Enforcing rights, if any, against the underlying assets or collateral may be difficult. U.S. Government securities not supported as to the payment of principal or interest by the U.S. Treasury, such as those issued by Fannie Mae, Freddie Mac, and the Federal Home Loan Banks, are subject to greater credit risk than are U.S. Government securities supported by the U.S. Treasury, such as those issued by Ginnie Mae.
The fund purchased or sold debt securities on a when-issued or delayed delivery basis, or in a “To Be Announced” (TBA) or “forward commitment” transaction with delivery or payment to occur at a later date beyond the normal settlement period. When the fund sells securities on a when-issued, delayed delivery, TBA, or forward commitment basis, the fund typically owns or has the right to acquire securities equivalent in kind and amount to the delivered securities. At the time a fund enters into a commitment to purchase or sell a security, the transaction is recorded and the value of the security acquired or sold is reflected in the fund’s net asset value. The price of such security and the date that the security will be delivered and paid for are fixed at the time the transaction is negotiated. The value of the security may vary with market fluctuations.
54
Notes to Financial Statements – continued
TBA securities resulting from these transactions are included in the Portfolio of Investments. TBA purchase and sale commitments are held at carrying amount, which approximates fair value and are categorized as level 2 within the fair value hierarchy and included in Investments purchased or sold on an extended settlement basis in the Statement of Assets and Liabilities. No interest accrues to the fund until payment takes place. At the time that a fund enters into this type of transaction, the fund is required to have sufficient cash and/or liquid securities to cover its commitments. Losses may arise due to changes in the value of the underlying securities prior to settlement date or if the counterparty does not perform under the contract’s terms, or if the issuer does not issue the securities due to political, economic or other factors.
To mitigate the counterparty credit risk on TBA securities and other types of forward settling mortgage-backed securities, the fund whenever possible enters into a Master Securities Forward Transaction Agreement (“MSFTA”) on a bilateral basis with each of the counterparties with whom it undertakes a significant volume of transactions. The MSFTA gives each party to the agreement the right to terminate all transactions traded under such agreement if there is a specified deterioration in the credit quality of the other party. Upon an event of default or a termination of the MSFTA, thenon-defaulting party has the right to close out all transactions traded under such agreement and to net amounts owed under each transaction to one net amount payable by one party to the other. This right to close out and net payments across all transactions traded under the MSFTA could result in a reduction of the fund’s credit risk to such counterparty equal to any amounts payable by the fund under the applicable transactions, if any.
For mortgage-backed securities traded under a MSFTA, the collateral and margining requirements are contract specific. Collateral amounts across all transactions traded under such agreement are netted and an amount is posted from one party to the other to collateralize such obligations. Cash that has been pledged to cover the fund’s collateral or margin obligations under a MSFTA, if any, will be reported separately on the Statement of Assets and Liabilities as restricted cash. Securities pledged as collateral or margin for the same purpose, if any, are noted in the Portfolio of Investments.
Fees Paid Indirectly– The fund’s custody fee may be reduced by a credit earned under an arrangement that measures the value of U.S. dollars deposited with the custodian by the fund. The amount of the credit, for the year ended April 30, 2020, is shown as a reduction of total expenses in the Statement of Operations.
Tax Matters and Distributions– The fund intends to qualify as a regulated investment company, as defined under Subchapter M of the Internal Revenue Code, and to distribute all of its taxable income, including realized capital gains. As a result, no provision for federal income tax is required. The fund’s federal tax returns, when filed, will remain subject to examination by the Internal Revenue Service for a three year period. Management has analyzed the fund’s tax positions taken on federal and state tax returns for all open tax years and does not believe that there are any uncertain tax positions that require recognition of a tax liability. Foreign taxes, if any, have been accrued by the fund in the accompanying financial statements in accordance with the applicable foreign tax law. Foreign income taxes may be withheld by certain countries
55
Notes to Financial Statements – continued
in which the fund invests. Additionally, capital gains realized by the fund on securities issued in or by certain foreign countries may be subject to capital gains tax imposed by those countries.
Distributions to shareholders are recorded on theex-dividend date. Income and capital gain distributions are determined in accordance with income tax regulations, which may differ from U.S. generally accepted accounting principles. Certain capital accounts in the financial statements are periodically adjusted for permanent differences in order to reflect their tax character. These adjustments have no impact on net assets or net asset value per share. Temporary differences which arise from recognizing certain items of income, expense, gain or loss in different periods for financial statement and tax purposes will reverse at some time in the future.
Book/tax differences primarily relate to amortization and accretion of debt securities and derivative transactions.
The tax character of distributions declared to shareholders for the last two fiscal years is as follows:
| | | | | | | | |
| | |
| | | Year ended
4/30/20 | | | Year ended
4/30/19 | |
Ordinary income (including any
short-term capital gains) | | | $191,936,656 | | | | $163,952,098 | |
The federal tax cost and the tax basis components of distributable earnings were as follows:
| | | | |
| |
| As of 4/30/20 | | | |
| |
| Cost of investments | | | $6,807,951,960 | |
| Gross appreciation | | | 368,721,139 | |
| |
| Gross depreciation | | | (110,406,514 | ) |
| Net unrealized appreciation (depreciation) | | | $258,314,625 | |
| |
| Undistributed ordinary income | | | 9,990,741 | |
| Capital loss carryforwards | | | (52,429,186 | ) |
| Other temporary differences | | | (15,519,879 | ) |
As of April 30, 2020, the fund had capital loss carryforwards available to offset future realized gains. These net capital losses may be carried forward indefinitely and their character is retained as short-term and/or long-term losses. Such losses are characterized as follows:
| | | | |
| Short-Term | | | $(8,196,763 | ) |
| Long-Term | | | (44,232,423 | ) |
| Total | | | $(52,429,186 | ) |
Multiple Classes of Shares of Beneficial Interest– The fund offers multiple classes of shares, which differ in their respective distribution, service, and program manager fees. The fund’s income and common expenses are allocated to shareholders based on the value of settled shares outstanding of each class. The fund’s realized and unrealized gain (loss) are allocated to shareholders based on the daily net assets of each class. Dividends are declared separately for each class. Differences in per share dividend rates are generally due to differences in separate class expenses. Class B and Class 529B
56
Notes to Financial Statements – continued
shares will convert to Class A and Class 529A shares, respectively, approximately eight years after purchase. Class C and Class 529C shares will convert to Class A and Class 529A shares, respectively, approximately ten years after purchase. The fund’s distributions declared to shareholders as reported in the Statements of Changes in Net Assets are presented by class as follows:
| | | | | | | | |
| | |
| | | Year
ended
4/30/20 | | | Year
ended
4/30/19 | |
| Class A | | | $63,362,687 | | | | $52,631,458 | |
| Class B | | | 260,366 | | | | 334,230 | |
| Class C | | | 1,874,543 | | | | 1,899,977 | |
| Class I | | | 44,942,223 | | | | 35,254,797 | |
| Class R1 | | | 39,322 | | | | 32,894 | |
| Class R2 | | | 793,742 | | | | 1,001,120 | |
| Class R3 | | | 1,443,872 | | | | 1,773,830 | |
| Class R4 | | | 3,830,364 | | | | 3,253,984 | |
| Class R6 | | | 75,000,583 | | | | 67,445,830 | |
| Class 529A | | | 313,476 | | | | 257,546 | |
| Class 529B | | | 4,392 | | | | 5,004 | |
| Class 529C | | | 71,086 | | | | 61,428 | |
| Total | | | $191,936,656 | | | | $163,952,098 | |
(3) Transactions with Affiliates
Investment Adviser– The fund has an investment advisory agreement with MFS to provide overall investment management and related administrative services and facilities to the fund. The management fee is computed daily and paid monthly at the following annual rates based on the fund’s average daily net assets:
| | | | |
| Up to $2.5 billion | | | 0.50 | % |
| In excess of $2.5 billion and up to $5 billion | | | 0.35 | % |
| In excess of $5 billion and up to $10 billion | | | 0.34 | % |
| In excess of $10 billion | | | 0.33 | % |
MFS has agreed in writing to reduce its management fee by a specified amount if certain MFS mutual fund assets exceed thresholds agreed to by MFS and the fund’s Board of Trustees. For the year ended April 30, 2020, this management fee reduction amounted to $659,100, which is included in the reduction of total expenses in the Statement of Operations. The management fee incurred for the year ended April 30, 2020 was equivalent to an annual effective rate of 0.39% of the fund’s average daily net assets.
The investment adviser has agreed in writing to pay a portion of the fund’s total annual operating expenses, excluding interest, taxes, extraordinary expenses, brokerage and transaction costs, and investment-related expenses, such that total fund operating expenses do not exceed the following rates annually of each class’s average daily net assets:
| | | | | | | | | | | | | | | | | | | | | | | | | | | | | | | | | | | | | | | | | | | | |
| Classes | |
| | | | | | | | | | | |
| A | | B | | | C | | | I | | | R1 | | | R2 | | | R3 | | | R4 | | | R6 | | | 529A | | | 529B | | | 529C | |
| 0.68% | | | 1.43% | | | | 1.53% | | | | 0.53% | | | | 1.53% | | | | 1.03% | | | | 0.78% | | | | 0.53% | | | | 0.42% | | | | 0.73% | | | | 1.58% | | | | 1.58% | |
57
Notes to Financial Statements – continued
This written agreement will continue until modified by the fund’s Board of Trustees, but such agreement will continue at least until August 31, 2020. For the year ended April 30, 2020, this reduction amounted to $946,530, which is included in the reduction of total expenses in the Statement of Operations.
Distributor– MFS Fund Distributors, Inc. (MFD), a wholly-owned subsidiary of MFS, as distributor, received $245,522 and $1,893 for the year ended April 30, 2020, as its portion of the initial sales charge on sales of Class A and Class 529A shares of the fund, respectively.
The Board of Trustees has adopted a distribution plan for certain share classes pursuant to Rule12b-1 of the Investment Company Act of 1940.
The fund’s distribution plan provides that the fund will pay MFD for services provided by MFD and financial intermediaries in connection with the distribution and servicing of certain share classes. One component of the plan is a distribution fee paid to MFD and another component of the plan is a service fee paid to MFD. MFD may subsequently pay all, or a portion, of the distribution and/or service fees to financial intermediaries.
Distribution Plan Fee Table:
| | | | | | | | | | | | | | | | | | | | |
| | | | | |
| | | Distribution
Fee Rate (d) | | | Service
Fee Rate (d) | | | Total
Distribution
Plan (d) | | | Annual
Effective
Rate (e) | | | Distribution
and Service
Fee | |
| Class A | | | — | | | | 0.25% | | | | 0.25% | | | | 0.15% | | | | $5,647,318 | |
| Class B | | | 0.75% | | | | 0.25% | | | | 1.00% | | | | 0.90% | | | | 124,484 | |
| Class C | | | 0.75% | | | | 0.25% | | | | 1.00% | | | | 1.00% | | | | 951,902 | |
| Class R1 | | | 0.75% | | | | 0.25% | | | | 1.00% | | | | 1.00% | | | | 19,796 | |
| Class R2 | | | 0.25% | | | | 0.25% | | | | 0.50% | | | | 0.50% | | | | 160,007 | |
| Class R3 | | | — | | | | 0.25% | | | | 0.25% | | | | 0.25% | | | | 132,938 | |
| Class 529A | | | — | | | | 0.25% | | | | 0.25% | | | | 0.13% | | | | 28,201 | |
| Class 529B | | | 0.75% | | | | 0.25% | | | | 1.00% | | | | 0.77% | | | | 1,748 | |
| Class 529C | | | 0.75% | | | | 0.25% | | | | 1.00% | | | | 0.99% | | | | 36,980 | |
| Total Distribution and Service Fees | | | | | | | | | | | | $7,103,374 | |
| (d) | In accordance with the distribution plan for certain classes, the fund pays distribution and/or service fees equal to these annual percentage rates of each class’s average daily net assets. The distribution and service fee rates disclosed by class represent the current rates in effect at the end of the reporting period. Any rate changes, if applicable, are detailed below. |
| (e) | The annual effective rates represent actual fees incurred under the distribution plan for the year ended April 30, 2020 based on each class’s average daily net assets. 0.10% of the Class A, Class B, and Class 529A service fee is currently being waived under a written waiver agreement. For the year ended April 30, 2020, this waiver amounted to $2,258,905, $12,461, and $11,280 for Class A, Class B, and Class 529A, respectively, and is included in the reduction of total expenses in the Statement of Operations. These written waiver agreements will continue until modified by the fund’s Board of Trustees, but such agreements will continue at least until August 31, 2020. MFD has voluntarily agreed to rebate a portion of each class’s 0.25% service fee attributable to accounts for which there is no financial intermediary specified on the account except for accounts attributable to MFS or its affiliates’ seed money. For the year ended April 30, 2020, this rebate amounted to $73, $112, $2,705, $4, and $340 for Class B, Class C, Class 529A, Class 529B, and Class 529C, respectively, and is included in the reduction of total expenses in the Statement of Operations. For the period from January 1, 2020 through April 30, 2020, the 0.75% distribution fee was not imposed for Class 529B shares due to the sales charge limitations contained in Financial Industry Regulatory Authority (“FINRA”) Rule 2341. |
58
Notes to Financial Statements – continued
Certain Class A shares are subject to a contingent deferred sales charge (CDSC) in the event of a shareholder redemption within 18 months of purchase. Class B and Class 529B shares are subject to a CDSC in the event of a shareholder redemption within six years of purchase. Class C and Class 529C shares are subject to a CDSC in the event of a shareholder redemption within 12 months of purchase. All contingent deferred sales charges are paid to MFD and during the year ended April 30, 2020, were as follows:
| | | | |
| |
| | | Amount | |
| Class A | | | $95,268 | |
| Class B | | | 8,110 | |
| Class C | | | 15,685 | |
| Class 529B | | | 468 | |
| Class 529C | | | 112 | |
The fund has entered into and may from time to time enter into contracts with program managers and other parties which administer the tuition programs through which an investment in the fund’s 529 share classes is made. The fund has entered into an agreement with MFD pursuant to which MFD receives an annual fee of up to 0.05% of the average daily net assets attributable to each 529 share class. The services provided by MFD, or a third party with which MFD contracts, include recordkeeping and tax reporting and account services, as well as services designed to maintain the program’s compliance with the Internal Revenue Code and other regulatory requirements. Program manager fees for the year ended April 30, 2020, were as follows:
| | | | |
| |
| | | Fee | |
| Class 529A | | | $5,640 | |
| Class 529B | | | 114 | |
| Class 529C | | | 1,851 | |
| Total Program Manager Fees | | | $7,605 | |
Shareholder Servicing Agent– MFS Service Center, Inc. (MFSC), a wholly-owned subsidiary of MFS, receives a fee from the fund for its services as shareholder servicing agent calculated as a percentage of the average daily net assets of the fund as determined periodically under the supervision of the fund’s Board of Trustees. For the year ended April 30, 2020, the fee was $147,780, which equated to 0.0023% annually of the fund’s average daily net assets. MFSC also receives payment from the fund forout-of-pocket expenses,sub-accounting and other shareholder servicing costs which may be paid to affiliated and unaffiliated service providers. Class R6 shares do not incursub-accounting fees. For the year ended April 30, 2020, theseout-of-pocket expenses,sub-accounting and other shareholder servicing costs amounted to $4,095,590.
Administrator– MFS provides certain financial, legal, shareholder communications, compliance, and other administrative services to the fund. Under an administrative services agreement, the fund reimburses MFS the costs incurred to provide these services. The fund is charged an annual fixed amount of $17,500 plus a fee based on average daily net assets. The administrative services fee incurred for the year ended April 30, 2020 was equivalent to an annual effective rate of 0.0087% of the fund’s average daily net assets.
59
Notes to Financial Statements – continued
Trustees’ and Officers’ Compensation– The fund pays compensation to independent Trustees in the form of a retainer, attendance fees, and additional compensation to Board and Committee chairpersons. The fund does not pay compensation directly to Trustees or officers of the fund who are also officers of the investment adviser, all of whom receive remuneration from MFS for their services to the fund. Certain officers and Trustees of the fund are officers or directors of MFS, MFD, and MFSC.
Other– This fund and certain other funds managed by MFS (the funds) had entered into a service agreement (the ISO Agreement) which provided for payment of fees solely by the funds to Tarantino LLC in return for the provision of services of an Independent Senior Officer (ISO) for the funds. Frank L. Tarantino served as the ISO and was an officer of the funds and the sole member of Tarantino LLC. Effective June 30, 2019, Mr. Tarantino retired from his position as ISO for the funds, and the ISO Agreement was terminated. For the year ended April 30, 2020, the fee paid by the fund under this agreement was $3,535 and is included in “Miscellaneous” expense in the Statement of Operations. MFS had agreed to bear all expenses associated with office space, other administrative support, and supplies provided to the ISO.
The fund invests in the MFS Institutional Money Market Portfolio which is managed by MFS and seeks current income consistent with preservation of capital and liquidity. This money market fund does not pay a management fee to MFS but does incur investment and operating costs.
On August 16, 2018, MFS redeemed 51 shares each of Class I for an aggregate amount of $534.
(4) Portfolio Securities
For the year ended April 30, 2020, purchases and sales of investments, other than purchased option transactions and short-term obligations, were as follows:
| | | | | | | | |
| | |
| | | Purchases | | | Sales | |
| U.S. Government securities | | | $8,416,948,251 | | | | $8,408,651,890 | |
| Non-U.S. Government securities | | | 2,000,250,175 | | | | 1,031,191,180 | |
60
Notes to Financial Statements – continued
(5) Shares of Beneficial Interest
The fund’s Declaration of Trust permits the Trustees to issue an unlimited number of full and fractional shares of beneficial interest. Transactions in fund shares were as follows:
| | | | | | | | | | | | | | | | |
| | | Year ended
4/30/20 | | | Year ended
4/30/19 | |
| | | | |
| | | Shares | | | Amount | | | Shares | | | Amount | |
| Shares sold | | | | | | | | | | | | | | | | |
Class A | | | 88,898,349 | | | | $976,453,472 | | | | 62,547,476 | | | | $649,700,434 | |
Class B | | | 169,124 | | | | 1,855,786 | | | | 142,193 | | | | 1,473,742 | |
Class C | | | 3,105,889 | | | | 34,157,049 | | | | 1,765,617 | | | | 18,342,493 | |
Class I | | | 79,471,285 | | | | 872,510,827 | | | | 57,638,108 | | | | 599,453,720 | |
Class R1 | | | 61,318 | | | | 669,976 | | | | 96,274 | | | | 992,625 | |
Class R2 | | | 571,423 | | | | 6,237,624 | | | | 595,564 | | | | 6,178,876 | |
Class R3 | | | 1,946,555 | | | | 21,389,074 | | | | 1,284,443 | | | | 13,371,184 | |
Class R4 | | | 3,845,711 | | | | 42,213,343 | | | | 3,946,020 | | | | 40,890,242 | |
Class R6 | | | 57,729,552 | | | | 631,122,107 | | | | 37,737,307 | | | | 392,609,825 | |
Class 529A | | | 459,789 | | | | 5,053,881 | | | | 202,732 | | | | 2,100,566 | |
Class 529B | | | 2,155 | | | | 23,493 | | | | 5,447 | | | | 56,758 | |
Class 529C | | | 113,923 | | | | 1,246,301 | | | | 104,843 | | | | 1,093,617 | |
| | | 236,375,073 | | | | $2,592,932,933 | | | | 166,066,024 | | | | $1,726,264,082 | |
| | | |
Shares issued to shareholders in
reinvestment of distributions | | | | | | | | | | | | | |
Class A | | | 5,031,828 | | | | $55,412,685 | | | | 4,386,869 | | | | $45,603,032 | |
Class B | | | 20,963 | | | | 230,872 | | | | 28,294 | | | | 294,535 | |
Class C | | | 146,008 | | | | 1,608,992 | | | | 154,028 | | | | 1,603,622 | |
Class I | | | 2,776,598 | | | | 30,604,133 | | | | 1,956,957 | | | | 20,353,538 | |
Class R1 | | | 3,562 | | | | 39,238 | | | | 3,147 | | | | 32,822 | |
Class R2 | | | 70,377 | | | | 774,077 | | | | 92,520 | | | | 960,951 | |
Class R3 | | | 131,123 | | | | 1,443,435 | | | | 170,187 | | | | 1,767,577 | |
Class R4 | | | 306,086 | | | | 3,371,104 | | | | 271,196 | | | | 2,822,246 | |
Class R6 | | | 6,733,690 | | | | 74,162,357 | | | | 6,440,122 | | | | 66,960,022 | |
Class 529A | | | 28,468 | | | | 313,105 | | | | 24,700 | | | | 256,506 | |
Class 529B | | | 394 | | | | 4,343 | | | | 473 | | | | 4,924 | |
Class 529C | | | 6,423 | | | | 70,803 | | | | 5,858 | | | | 61,004 | |
| | | 15,255,520 | | | | $168,035,144 | | | | 13,534,351 | | | | $140,720,779 | |
61
Notes to Financial Statements – continued
| | | | | | | | | | | | | | | | |
| | | Year ended
4/30/20 | | | Year ended
4/30/19 | |
| | | | |
| | | Shares | | | Amount | | | Shares | | | Amount | |
| Shares reacquired | | | | | | | | | | | | | | | | |
Class A | | | (57,389,604 | ) | | | $(627,129,795 | ) | | | (51,174,231 | ) | | | $(530,432,009 | ) |
Class B | | | (583,113 | ) | | | (6,368,070 | ) | | | (629,557 | ) | | | (6,534,288 | ) |
Class C | | | (2,729,543 | ) | | | (29,815,117 | ) | | | (3,166,606 | ) | | | (32,846,585 | ) |
Class I | | | (62,706,252 | ) | | | (685,799,131 | ) | | | (56,205,246 | ) | | | (581,469,305 | ) |
Class R1 | | | (104,214 | ) | | | (1,144,131 | ) | | | (35,151 | ) | | | (365,569 | ) |
Class R2 | | | (1,408,350 | ) | | | (15,388,450 | ) | | | (1,745,622 | ) | | | (18,050,212 | ) |
Class R3 | | | (1,819,437 | ) | | | (19,952,657 | ) | | | (4,092,992 | ) | | | (42,636,493 | ) |
Class R4 | | | (3,248,573 | ) | | | (35,118,243 | ) | | | (3,171,712 | ) | | | (32,869,528 | ) |
Class R6 | | | (45,919,677 | ) | | | (500,957,636 | ) | | | (34,878,899 | ) | | | (360,589,019 | ) |
Class 529A | | | (200,903 | ) | | | (2,206,945 | ) | | | (166,550 | ) | | | (1,721,625 | ) |
Class 529B | | | (7,250 | ) | | | (79,192 | ) | | | (12,291 | ) | | | (127,734 | ) |
Class 529C | | | (84,780 | ) | | | (924,416 | ) | | | (109,170 | ) | | | (1,131,918 | ) |
| | | (176,201,696 | ) | | | $(1,924,883,783 | ) | | | (155,388,027 | ) | | | $(1,608,774,285 | ) |
| | | | |
| Net change | | | | | | | | | | | | | | | | |
Class A | | | 36,540,573 | | | | $404,736,362 | | | | 15,760,114 | | | | $164,871,457 | |
Class B | | | (393,026 | ) | | | (4,281,412 | ) | | | (459,070 | ) | | | (4,766,011 | ) |
Class C | | | 522,354 | | | | 5,950,924 | | | | (1,246,961 | ) | | | (12,900,470 | ) |
Class I | | | 19,541,631 | | | | 217,315,829 | | | | 3,389,819 | | | | 38,337,953 | |
Class R1 | | | (39,334 | ) | | | (434,917 | ) | | | 64,270 | | | | 659,878 | |
Class R2 | | | (766,550 | ) | | | (8,376,749 | ) | | | (1,057,538 | ) | | | (10,910,385 | ) |
Class R3 | | | 258,241 | | | | 2,879,852 | | | | (2,638,362 | ) | | | (27,497,732 | ) |
Class R4 | | | 903,224 | | | | 10,466,204 | | | | 1,045,504 | | | | 10,842,960 | |
Class R6 | | | 18,543,565 | | | | 204,326,828 | | | | 9,298,530 | | | | 98,980,828 | |
Class 529A | | | 287,354 | | | | 3,160,041 | | | | 60,882 | | | | 635,447 | |
Class 529B | | | (4,701 | ) | | | (51,356 | ) | | | (6,371 | ) | | | (66,052 | ) |
Class 529C | | | 35,566 | | | | 392,688 | | | | 1,531 | | | | 22,703 | |
| | | 75,428,897 | | | | $836,084,294 | | | | 24,212,348 | | | | $258,210,576 | |
Class T shares were not publicly available for sale during the period. Please see the fund’s prospectus for details.
Effective June 1, 2019, purchases of the fund’s Class B and Class 529B shares are closed to new and existing investors subject to certain exceptions. Please see the fund’s prospectus for details.
The fund is one of several mutual funds in which certain MFS funds may invest. The MFS funds do not invest in the underlying funds for the purpose of exercising management or control. At the end of the period, the MFS Conservative Allocation Fund, the MFS Moderate Allocation Fund, the MFS Growth Allocation Fund, the MFS Lifetime Income Fund, the MFS Lifetime 2020 Fund, the MFS Lifetime 2025 Fund, and the MFS Lifetime 2030 Fund were the owners of record of approximately 6%, 6%, 2%, 2%, 1%, 1%, and 1%, respectively, of the value of outstanding voting shares of the fund. In addition, the MFS Lifetime 2035 Fund, the MFS Lifetime 2040 Fund, the
62
Notes to Financial Statements – continued
MFS Lifetime 2045 Fund, the MFS Lifetime 2050 Fund, the MFS Lifetime 2055 Fund, and the MFS Lifetime 2060 Fund were each the owners of record of less than 1% of the value of outstanding voting shares of the fund.
(6) Line of Credit
The fund and certain other funds managed by MFS participate in a $1.25 billion unsecured committed line of credit, subject to a $1 billion sublimit, provided by a syndicate of banks under a credit agreement. Borrowings may be made for temporary financing needs. Interest is charged to each fund, based on its borrowings, generally at a rate equal to the highest of one month LIBOR, the Federal Funds Effective Rate and the Overnight Bank Funding Rate, plus an agreed upon spread. A commitment fee, based on the average daily, unused portion of the committed line of credit, is allocated among the participating funds. In addition, the fund and other funds managed by MFS have established unsecured uncommitted borrowing arrangements with certain banks for temporary financing needs. Interest is charged to each fund, based on its borrowings, at rates equal to customary reference rates plus an agreed upon spread. For the year ended April 30, 2020, the fund’s commitment fee and interest expense were $33,651 and $0, respectively, and are included in “Miscellaneous” expense in the Statement of Operations.
(7) Investments in Affiliated Issuers
An affiliated issuer may be considered one in which the fund owns 5% or more of the outstanding voting securities, or a company which is under common control. For the purposes of this report, the following were affiliated issuers:
| | | | | | | | | | | | | | | | | | | | | | | | |
| | | | | | |
| Affiliated Issuers | | Beginning
Value | | | Purchases | | | Sales
Proceeds | | | Realized
Gain
(Loss) | | | Change in
Unrealized
Appreciation or
Depreciation | | | Ending
Value | |
| MFS Institutional Money Market Portfolio | | | $188,958,313 | | | | $2,622,198,758 | | | | $2,715,803,825 | | | | $200,616 | | | | $(16,840 | ) | | | $95,537,022 | |
| | | | | | |
| Affiliated Issuers | | | | | | | | | | | | | | Dividend
Income | | | Capital Gain
Distributions | |
| MFS Institutional Money Market Portfolio | | | | | | | | | | | | | | | | $6,444,597 | | | | $— | |
(8) Impacts ofCOVID-19
The pandemic related to the global spread of novel coronavirus disease(COVID-19), which was first detected in December 2019, has resulted in significant disruptions to global business activity and the global economy, as well as the economies of individual countries, the financial performance of individual companies and sectors, and the securities and commodities markets in general. This pandemic, the full effects of which are still unknown, has resulted in substantial market volatility and may have adversely impacted the prices and liquidity of the fund’s investments and the fund’s performance.
63
REPORT OF INDEPENDENT REGISTERED PUBLIC ACCOUNTING FIRM
To the Board of Trustees of MFS Series Trust IX and the Shareholders of MFS Total Return Bond Fund:
Opinion on the Financial Statements and Financial Highlights
We have audited the accompanying statement of assets and liabilities of MFS Total Return Bond Fund (the “Fund”), including the portfolio of investments, as of April 30, 2020, the related statement of operations for the year then ended, the statements of changes in net assets for each of the two years in the period then ended, the financial highlights for each of the five years in the period then ended, and the related notes. In our opinion, the financial statements and financial highlights present fairly, in all material respects, the financial position of the Fund as of April 30, 2020, and the results of its operations for the year then ended, the changes in its net assets for each of the two years in the period then ended, and the financial highlights for each of the five years in the period then ended, in conformity with accounting principles generally accepted in the United States of America.
Basis for Opinion
These financial statements and financial highlights are the responsibility of the Fund’s management. Our responsibility is to express an opinion on the Fund’s financial statements and financial highlights based on our audits. We are a public accounting firm registered with the Public Company Accounting Oversight Board (United States) (PCAOB) and are required to be independent with respect to the Fund in accordance with the U.S. federal securities laws and the applicable rules and regulations of the Securities and Exchange Commission and the PCAOB.
We conducted our audits in accordance with the standards of the PCAOB. Those standards require that we plan and perform the audit to obtain reasonable assurance about whether the financial statements and financial highlights are free of material misstatement, whether due to error or fraud. The Fund is not required to have, nor were we engaged to perform, an audit of its internal control over financial reporting. As part of our audits we are required to obtain an understanding of internal control over financial reporting but not for the purpose of expressing an opinion on the effectiveness of the Fund’s internal control over financial reporting. Accordingly, we express no such opinion. Our audits included performing procedures to assess the risks of material misstatement of the financial statements and financial highlights, whether due to error or fraud, and performing procedures that respond to those risks. Such procedures included examining, on a test basis, evidence regarding the amounts and disclosures in the financial statements and financial highlights.
Our audits also included evaluating the accounting principles used and significant estimates made by management, as well as evaluating the overall presentation of the financial statements and financial highlights. Our procedures included confirmation of securities owned as of April 30, 2020, by correspondence with the custodian and
64
Report of Independent Registered Public Accounting Firm – continued
brokers; when replies were not received from brokers, we performed other auditing procedures. We believe that our audits provide a reasonable basis for our opinion.
DELOITTE & TOUCHE LLP
Boston, Massachusetts
June 16, 2020
We have served as the auditor of one or more of the MFS investment companies since 1924.
65
TRUSTEES AND OFFICERS — IDENTIFICATION AND BACKGROUND
The Trustees and Officers of the Trust, as of June 1, 2020, are listed below, together with their principal occupations during the past five years. (Their titles may have varied during that period.) The address of each Trustee and Officer is 111 Huntington Avenue, Boston, Massachusetts 02199-7618.
| | | | | | | | | | |
Name, Age | | Position(s)
Held with Fund | | Trustee/Officer Since (h) | | Number of
MFS Funds
overseen
by the
Trustee | | Principal
Occupations During the Past Five Years | | Other Directorships
During the Past
Five Years (j) |
| INTERESTED TRUSTEES |
Robert J. Manning (k)
(age 56) | | Trustee | | February 2004 | | 133 | | Massachusetts Financial Services Company, Executive Chairman (since January 2017); Director; Chairman of the Board; Chief Executive Officer (until 2015);Co-Chief Executive Officer (2015-2016) | | N/A |
| | | | | |
Robin A. Stelmach (k) (age 58) | | Trustee | | January 2014 | | 133 | | Massachusetts Financial Services Company, Vice Chair (since January 2017); Chief Operating Officer and Executive Vice President (until January 2017) | | N/A |
| INDEPENDENT TRUSTEES |
John P. Kavanaugh (age 65) | | Trustee and Chair of Trustees | | January 2009 | | 133 | | Private investor | | N/A |
| | | | | |
Steven E. Buller (age 68) | | Trustee | | February 2014 | | 133 | | Financial Accounting Standards Advisory Council, Chairman (2014-2015); Public Company Accounting Oversight Board, Standing Advisory Group, Member (until 2014); BlackRock, Inc. (investment management), Managing Director (until 2014), BlackRock Finco UK (investment management), Director (until 2014) | | N/A |
66
Trustees and Officers – continued
| | | | | | | | | | |
Name, Age | | Position(s)
Held with Fund | | Trustee/Officer Since (h) | | Number of
MFS Funds
overseen
by the
Trustee | | Principal
Occupations During the Past Five Years | | Other Directorships
During the Past
Five Years (j) |
John A. Caroselli (age 65) | | Trustee | | March 2017 | | 133 | | JC Global Advisors, LLC (management consulting), President (since 2015); First Capital Corporation (commercial finance), Executive Vice President (until 2015) | | N/A |
| | | | | |
Maureen R. Goldfarb (age 65) | | Trustee | | January 2009 | | 133 | | Private investor | | N/A |
| | | | | |
Peter D. Jones
(age 64) | | Trustee | | January 2019 | | 133 | | Franklin Templeton Distributors, Inc. (investment management), President (until 2015); Franklin Templeton Institutional, LLC (investment management), Chairman (until 2015) | | N/A |
| | | | | |
James W. Kilman, Jr.
(age 59) | | Trustee | | January 2019 | | 133 | | Burford Capital Limited (finance and investment management), Chief Financial Officer (since 2019); KielStrand Capital LLC (family office), Chief Executive Officer (since 2016); Morgan Stanley & Co. (financial services), Vice Chairman of Investment Banking,Co-Head of Diversified Financials Coverage – Financial Institutions Investment Banking Group (until 2016) | | Alpha-En Corporation, Director(2016-2019) |
67
Trustees and Officers – continued
| | | | | | | | | | |
Name, Age | | Position(s)
Held with Fund | | Trustee/Officer Since (h) | | Number of
MFS Funds
overseen
by the
Trustee | | Principal
Occupations During the Past Five Years | | Other Directorships
During the Past
Five Years (j) |
Clarence Otis, Jr. (age 64) | | Trustee | | March 2017 | | 133 | | Darden Restaurants, Inc., Chief Executive Officer (until 2014) | | VF Corporation, Director; Verizon Communications, Inc., Director; The Travelers Companies, Director; Federal Reserve Bank of Atlanta, Director (until 2015) |
| | | | | |
Maryanne L. Roepke (age 64) | | Trustee | | May 2014 | | 133 | | American Century Investments (investment management), Senior Vice President and Chief Compliance Officer (until 2014) | | N/A |
| | | | | |
Laurie J. Thomsen
(age 62) | | Trustee | | March 2005 | | 133 | | Private investor | | The Travelers Companies, Director; Dycom Industries, Inc., Director (since 2015) |
| | | | | | | | |
Name, Age | | Position(s) Held with Fund | | Trustee/Officer
Since (h) | | Number of
MFS Funds
for which
the Person
is an Officer | | Principal
Occupations During the Past Five Years |
| OFFICERS | | | | | | | | |
Christopher R. Bohane (k)
(age 46) | | Assistant Secretary and Assistant Clerk | | July 2005 | | 133 | | Massachusetts Financial Services Company, Senior Vice President and Associate General Counsel |
| | | | |
Kino Clark (k) (age 51) | | Assistant Treasurer | | January 2012 | | 133 | | Massachusetts Financial Services Company, Vice President |
| | | | |
John W. Clark, Jr. (k) (age 53) | | Assistant Treasurer | | April 2017 | | 133 | | Massachusetts Financial Services Company, Vice President (since March 2017); Deutsche Bank (financial services), Department Head – Treasurer’s Office (until February 2017) |
68
Trustees and Officers – continued
| | | | | | | | |
Name, Age | | Position(s) Held with Fund | | Trustee/Officer
Since (h) | | Number of
MFS Funds
for which
the Person
is an Officer | | Principal
Occupations During the Past Five Years |
Thomas H. Connors (k) (age 60) | | Assistant Secretary and Assistant Clerk | | September 2012 | | 133 | | Massachusetts Financial Services Company, Vice President and Senior Counsel |
| | | | |
David L. DiLorenzo (k)
(age 51) | | President | | July 2005 | | 133 | | Massachusetts Financial Services Company, Senior Vice President |
| | | | |
Heidi W. Hardin (k) (age 52) | | Secretary and Clerk | | April 2017 | | 133 | | Massachusetts Financial Services Company, Executive Vice President and General Counsel (since March 2017); Harris Associates (investment management), General Counsel (from September 2015 to January 2017); Janus Capital Management LLC (investment management), Senior Vice President and General Counsel (until September 2015) |
| | | | |
Brian E. Langenfeld (k) (age 47) | | Assistant Secretary and Assistant Clerk | | June 2006 | | 133 | | Massachusetts Financial Services Company, Vice President and Senior Counsel |
| | | | |
Amanda S. Mooradian (k) (age 41) | | Assistant Secretary and Assistant Clerk | | September 2018 | | 133 | | Massachusetts Financial Services Company, Assistant Vice President and Senior Counsel |
| | | | |
Susan A. Pereira (k)
(age 49) | | Assistant Secretary and Assistant Clerk | | July 2005 | | 133 | | Massachusetts Financial Services Company, Vice President and Assistant General Counsel |
| | | | |
Kasey L. Phillips (k) (age 49) | | Assistant Treasurer | | September 2012 | | 133 | | Massachusetts Financial Services Company, Vice President |
| | | | |
Matthew A. Stowe (k) (age 45) | | Assistant Secretary and Assistant Clerk | | October 2014 | | 133 | | Massachusetts Financial Services Company, Vice President and Assistant General Counsel |
| | | | |
Martin J. Wolin (k) (age 52) | | Chief Compliance Officer | | July 2015 | | 133 | | Massachusetts Financial Services Company, Senior Vice President and Chief Compliance Officer (since July 2015); Mercer (financial service provider), Chief Risk and Compliance Officer, North America and Latin America (until June 2015) |
69
Trustees and Officers – continued
| | | | | | | | |
Name, Age | | Position(s) Held with Fund | | Trustee/Officer
Since (h) | | Number of
MFS Funds
for which
the Person
is an Officer | | Principal
Occupations During the Past Five Years |
James O. Yost (k)
(age 59) | | Treasurer | | September 1990 | | 133 | | Massachusetts Financial Services Company, Senior Vice President |
| (h) | Date first appointed to serve as Trustee/officer of an MFS Fund. Each Trustee has served continuously since appointment unless indicated otherwise. For the period from December 15, 2004 until February 22, 2005, Mr. Manning served as Advisory Trustee. From January 2012 through December 2016, Messrs. DiLorenzo and Yost served as Treasurer and Deputy Treasurer of the Funds, respectively. |
| (j) | Directorships or trusteeships of companies required to report to the Securities and Exchange Commission (i.e., “public companies”). |
| (k) | “Interested person” of the Trust within the meaning of the Investment Company Act of 1940 (referred to as the 1940 Act), which is the principal federal law governing investment companies like the fund, as a result of a position with MFS. The address of MFS is 111 Huntington Avenue, Boston, Massachusetts 02199-7618. |
Each Trustee (other than Messrs. Jones and Kilman) has been elected by shareholders and each Trustee and Officer holds office until his or her successor is chosen and qualified or until his or her earlier death, resignation, retirement or removal. Messrs. Jones and Kilman became Trustees of the Funds on January 1, 2019. The Trust does not hold annual meetings for the purpose of electing Trustees, and Trustees are not elected for fixed terms. Under the terms of the Board’s retirement policy, an Independent Trustee shall retire at the end of the calendar year in which he or she reaches the earlier of 75 years of age or 15 years of service on the Board (or, in the case of any Independent Trustee who joined the Board prior to 2015, 20 years of service on the Board).
Messrs. Buller, Kilman and Otis and Ms. Roepke are members of the Trust’s Audit Committee.
Each of the Interested Trustees and certain Officers hold comparable officer positions with certain affiliates of MFS.
The Statement of Additional Information for a Fund includes further information about the Trustees and is available without charge upon request by calling1-800-225-2606.
| | |
| Investment Adviser | | Custodian |
Massachusetts Financial Services Company
111 Huntington Avenue Boston, MA 02199-7618 | | JPMorgan Chase Bank, NA 4 Metrotech Center New York, NY 11245 |
| Distributor | | Independent Registered Public Accounting Firm |
MFS Fund Distributors, Inc.
111 Huntington Avenue Boston, MA 02199-7618 | | Deloitte & Touche LLP 200 Berkeley Street Boston, MA 02116 |
| Portfolio Manager(s) | | |
Alexander Mackey Joshua Marston Robert Persons | | |
70
STATEMENT REGARDING LIQUIDITY RISK MANAGEMENT PROGRAM
The fund has adopted and implemented a liquidity risk management program (the “Program”) as required by Rule22e-4 under the Investment Company Act of 1940, as amended. The fund’s Board of Trustees (the “Board”) has designated MFS as the administrator of the Program. The Program is reasonably designed to assess and manage the liquidity risk of the fund. Liquidity risk is the risk that the fund could not meet requests to redeem shares issued by the fund without significant dilution of remaining investors’ interests.
MFS provided a written report to the Board for consideration at its April 2020 meeting that addressed the operation of the Program and provided an assessment of the adequacy and effectiveness of the Program during the period from the adoption of the Program on December 1, 2018 to December 31, 2019 (the “Covered Period”). The report concluded that during the Covered Period the Program had operated effectively and had adequately and effectively been implemented to assess and manage the fund’s liquidity risk. MFS also reported that there were no liquidity events that impacted the fund or its ability to timely meet redemptions without dilution to existing shareholders during the Covered Period.
There can be no assurance that the Program will achieve its objectives in the future. Further information on liquidity risk, and other principal risks to which an investment in the fund may be subject, can be found in the prospectus.
71
PROXY VOTING POLICIES AND INFORMATION
MFS votes proxies on behalf of the fund pursuant to proxy voting policies and procedures that are available without charge, upon request, by calling1-800-225-2606, by visitingmfs.com/proxyvoting,or by visiting the SEC’s Web site athttp://www.sec.gov.
Information regarding how the fund voted proxies relating to portfolio securities during the most recent twelve-month period ended June 30 is available by August 31 of each year without charge by visitingmfs.com/proxyvoting,or by visiting the SEC’s Web site athttp://www.sec.gov.
QUARTERLY PORTFOLIO DISCLOSURE
The fund files a complete schedule of portfolio holdings with the SEC for the first and third quarters of each fiscal year as an exhibit to its reports on Form N-PORT. The fund’s Form N-PORT reports are available on the SEC’s website athttp://www.sec.gov. A shareholder can obtain the portfolio holdings report for the first and third quarters of the fund’s fiscal year atmfs.com/openendfunds by choosing the fund’s name and then selecting the “Resources” tab and clicking on “Prospectus and Reports”.
FURTHER INFORMATION
From time to time, MFS may post important information about the fund or the MFS funds on the MFS web site (mfs.com). This information is available athttps://www.mfs.com/en-us/what-we-do/announcements.htmlor atmfs.com/openendfundsby choosing the fund’s name.
INFORMATION ABOUT FUND CONTRACTS AND LEGAL CLAIMS
The fund has entered into contractual arrangements with an investment adviser, administrator, distributor, shareholder servicing agent, 529 program manager (if applicable), and custodian who each provide services to the fund. Unless expressly stated otherwise, shareholders are not parties to, or intended beneficiaries of these contractual arrangements, and these contractual arrangements are not intended to create any shareholder right to enforce them against the service providers or to seek any remedy under them against the service providers, either directly or on behalf of the fund.
Under the Trust’s By-Laws and Declaration of Trust, any claims asserted against or on behalf of the MFS Funds, including claims against Trustees and Officers, must be brought in state and federal courts located within the Commonwealth of Massachusetts.
FEDERAL TAX INFORMATION (unaudited)
The fund will notify shareholders of amounts for use in preparing 2020 income tax forms in January 2021.
72
rev. 3/16
| | | | |
| | | |
FACTS | | WHAT DOES MFS DO WITH YOUR PERSONAL INFORMATION? | |  |
| | |
| Why? | | Financial companies choose how they share your personal information. Federal law gives consumers the right to limit some but not all sharing. Federal law also requires us to tell you how we collect, share, and protect your personal information. Please read this notice carefully to understand what we do. |
| | |
| What? | | The types of personal information we collect and share depend on the product or service you have with us. This information can include: • Social Security number and account balances • Account transactions and transaction history • Checking account information and wire transfer instructions When you areno longer our customer, we continue to share your information as described in this notice. |
| | |
| How? | | All financial companies need to share customers’ personal information to run their everyday business. In the section below, we list the reasons financial companies can share their customers’ personal information; the reasons MFS chooses to share; and whether you can limit this sharing. |
| | | | |
Reasons we can share your
personal information | | Does MFS
share? | | Can you limit
this sharing? |
For our everyday business purposes – such as to process your transactions, maintain your account(s), respond to court orders and legal investigations, or report to credit bureaus | | Yes | | No |
For our marketing purposes – to offer our products and services to you | | No | | We don’t share |
For joint marketing with other financial companies | | No | | We don’t share |
For our affiliates’ everyday business purposes – information about your transactions and experiences | | No | | We don’t share |
For our affiliates’ everyday business purposes – information about your creditworthiness | | No | | We don’t share |
| For nonaffiliates to market to you | | No | | We don’t share |
| | |
| | |
| Questions? | | Call800-225-2606 or go tomfs.com. |
73
| | |
| Who we are |
| Who is providing this notice? | | MFS Funds, MFS Investment Management, MFS Institutional Advisors, Inc., and MFS Heritage Trust Company. |
| | |
| What we do |
| How does MFS protect my personal information? | | To protect your personal information from unauthorized access and use, we use security measures that comply with federal law. These measures include procedural, electronic, and physical safeguards for the protection of the personal information we collect about you. |
| How does MFS collect my personal information? | | We collect your personal information, for example, when you • open an account or provide account information • direct us to buy securities or direct us to sell your securities • make a wire transfer We also collect your personal information from others, such as credit bureaus, affiliates, or other companies. |
| Why can’t I limit all sharing? | | Federal law gives you the right to limit only • sharing for affiliates’ everyday business purposes – information about your creditworthiness • affiliates from using your information to market to you • sharing for nonaffiliates to market to you State laws and individual companies may give you additional rights to limit sharing. |
| | |
| Definitions |
| Affiliates | | Companies related by common ownership or control. They can be financial and nonfinancial companies. • MFS does not share personal information with affiliates, except for everyday business purposes as described on page one of this notice. |
| Nonaffiliates | | Companies not related by common ownership or control. They can be financial and nonfinancial companies. • MFS does not share with nonaffiliates so they can market to you. |
| Joint marketing | | A formal agreement between nonaffiliated financial companies that together market financial products or services to you. • MFS doesn’t jointly market. |
| | |
| Other important information |
| If you own an MFS product or receive an MFS service in the name of a third party such as a bank or broker-dealer, their privacy policy may apply to you instead of ours. |
74
Save paper with eDelivery.

| MFS® will send you prospectuses, |
reports, and proxies directly viae-mail so you will get information faster with less mailbox clutter.
To sign up:
1. Go to mfs.com.
2. Log in via MFS® Access.
3. Select eDelivery.
If you own your MFS fund shares through a financial institution or a retirement plan, MFS® TALK, MFS® Access, or eDelivery may not be available to you.
CONTACT
WEB SITE
mfs.com
MFS TALK
1-800-637-8255
24 hours a day
ACCOUNT SERVICE AND LITERATURE
Shareholders
1-800-225-2606
Financial advisors
1-800-343-2829
Retirement plan services
1-800-637-1255
MAILING ADDRESS
MFS Service Center, Inc.
P.O. Box 219341
Kansas City, MO 64121-9341
OVERNIGHT MAIL
MFS Service Center, Inc.
Suite 219341
430 W 7th Street
Kansas City, MO 64105-1407
The Registrant has adopted a Code of Ethics (the “Code”) pursuant to Section 406 of the Sarbanes-Oxley Act and as defined in FormN-CSR that applies to the Registrant’s principal executive officer and principal financial and accounting officer. During the period covered by this report, the Registrant has not amended any provision in the Code that relates to an element of the Code’s definition enumerated in paragraph (b) of Item 2 of this FormN-CSR. During the period covered by this report, the Registrant did not grant a waiver, including an implicit waiver, from any provision of the Code.
A copy of the Code is filed as an exhibit to this FormN-CSR.
| ITEM 3. | AUDIT COMMITTEE FINANCIAL EXPERT. |
Messrs. Steven E. Buller, James Kilman, and Clarence Otis, Jr. and Ms. Maryanne L. Roepke, members of the Audit Committee, have been determined by the Board of Trustees in their reasonable business judgment to meet the definition of “audit committee financial expert” as such term is defined in FormN-CSR. In addition, Messrs. Buller, Kilman, and Otis and Ms. Roepke are “independent” members of the Audit Committee (as such term has been defined by the Securities and Exchange Commission in regulations implementing Section 407 of the Sarbanes-Oxley Act of 2002). The Securities and Exchange Commission has stated that the designation of a person as an audit committee financial expert pursuant to this Item 3 on the FormN-CSR does not impose on such a person any duties, obligations or liability that are greater than the duties, obligations or liability imposed on such person as a member of the Audit Committee and the Board of Trustees in the absence of such designation or identification.
| ITEM 4. | PRINCIPAL ACCOUNTANT FEES AND SERVICES. |
The Board of Trustees has appointed Deloitte & Touche LLP (“Deloitte”) to serve as independent accountants to a series of the Registrant (each a “Fund” and collectively the “Funds”). The tables below set forth the audit fees billed to each Fund as well as fees fornon-audit services provided to each Fund and/or to the Fund’s investment adviser, Massachusetts Financial Services Company (“MFS”), and to various entities either controlling, controlled by, or under common control with MFS that provide ongoing services to the Fund (“MFS Related Entities”).
For the fiscal years ended April 30, 2020 and 2019, audit fees billed to each Fund by Deloitte were as follows:
| | | | | | | | |
| | | Audit Fees | |
| | | 2020 | | | 2019 | |
Fees billed by Deloitte: | | | | | | | | |
MFS Corporate Bond Fund | | | 67,154 | | | | 66,045 | |
MFS Limited Maturity Fund | | | 58,281 | | | | 57,320 | |
MFS Municipal Limited Maturity Fund | | | 48,639 | | | | 47,839 | |
MFS Total Return Bond Fund | | | 70,623 | | | | 69,456 | |
| | | | | | | | |
Total | | | 244,697 | | | | 240,660 | |
For the fiscal years ended April 30, 2020 and 2019, fees billed by Deloitte for audit-related, tax and other services provided to each Fund and for audit-related, tax and other services provided to MFS and MFS Related Entities were as follows:
| | | | | | | | | | | | | | | | | | | | | | | | |
| | | Audit-Related Fees1 | | | Tax Fees2 | | | All Other Fees3 | |
| | | 2020 | | | 2019 | | | 2020 | | | 2019 | | | 2020 | | | 2019 | |
Fees billed by Deloitte: | | | | | | | | | | | | | | | | | | | | | | | | |
To MFS Corporate Bond Fund | | | 0 | | | | 0 | | | | 7,430 | | | | 7,306 | | | | 0 | | | | 0 | |
To MFS Limited Maturity Fund | | | 0 | | | | 0 | | | | 7,327 | | | | 7,205 | | | | 0 | | | | 0 | |
To MFS Municipal Limited Maturity Fund | | | 0 | | | | 0 | | | | 6,713 | | | | 6,601 | | | | 0 | | | | 0 | |
To MFS Total Return Bond Fund | | | 0 | | | | 0 | | | | 7,327 | | | | 7,205 | | | | 0 | | | | 0 | |
Total fees billed by Deloitte To above Funds: | | | 0 | | | | 0 | | | | 28,797 | | | | 28,317 | | | | 0 | | | | 0 | |
| | | | | | | | | | | | | | | | | | | | | | | | |
| | | Audit-Related Fees1 | | | Tax Fees2 | | | All Other Fees3 | |
| | | 2020 | | | 2019 | | | 2020 | | | 2019 | | | 2020 | | | 2019 | |
Fees billed by Deloitte: | | | | | | | | | | | | | | | | | | | | | | | | |
To MFS and MFS Related Entities of MFS Corporate Bond Fund* | | | 0 | | | | 0 | | | | 0 | | | | 0 | | | | 3,790 | | | | 5,390 | |
To MFS and MFS Related Entities of MFS Limited Maturity Fund* | | | 0 | | | | 0 | | | | 0 | | | | 0 | | | | 3,790 | | | | 5,390 | |
To MFS and MFS Related Entities of MFS Municipal Limited Maturity Fund* | | | 0 | | | | 0 | | | | 0 | | | | 0 | | | | 3,790 | | | | 5,390 | |
To MFS and MFS Related Entities of MFS Total Return Bond Fund* | | | 0 | | | | 0 | | | | 0 | | | | 0 | | | | 3,790 | | | | 5,390 | |
| | | | | | | | |
| | | Aggregate Fees for Non-audit
Services | |
| | | 2020 | | | 2019 | |
Fees billed by Deloitte: | | | | | | | | |
To MFS Corporate Bond Fund, MFS and MFS Related Entities# | | | 361,220 | | | | 12,696 | |
To MFS Limited Maturity Fund, MFS and MFS Related Entities# | | | 361,117 | | | | 12,595 | |
To MFS Municipal Limited Maturity Fund, MFS and MFS Related Entities# | | | 360,503 | | | | 11,991 | |
To MFS Total Return Bond Fund, MFS and MFS Related Entities# | | | 361,117 | | | | 12,595 | |
| * | This amount reflects the fees billed to MFS and MFS Related Entities fornon-audit services relating directly to the operations and financial reporting of the Funds (portions of which services also related to the operations and financial reporting of other funds within the MFS Funds complex). |
| # | This amount reflects the aggregate fees billed by Deloitte, as the case may be, fornon-audit services rendered to the Funds and fornon-audit services rendered to MFS and the MFS Related Entities. |
| 1 | The fees included under “Audit-Related Fees” are fees related to assurance and related services that are reasonably related to the performance of the audit or review of financial statements, but not reported under ‘‘Audit Fees,’’ including accounting consultations, agreed-upon procedure reports, attestation reports, comfort letters and internal control reviews. |
| 2 | The fees included under “Tax Fees” are fees associated with tax compliance, tax advice and tax planning, including services relating to the filing or amendment of federal, state or local income tax returns, regulated investment company qualification reviews and tax distribution and analysis. |
| 3 | The fees included under “All Other Fees” are fees for products and services provided by Deloitte other than those reported under “Audit Fees,” “Audit-Related Fees” and “Tax Fees”. |
Item 4(e)(1):
Set forth below are the policies and procedures established by the Audit Committee of the Board of Trustees relating to thepre-approval of audit andnon-audit related services:
To the extent required by applicable law,pre-approval by the Audit Committee of the Board is needed for all audit and permissiblenon-audit services rendered to the Fund and all permissiblenon-audit services rendered to MFS or MFS Related Entities if the services relate directly to the operations and financial reporting of the Registrant.Pre-approval is currently on anengagement-by-engagement basis. In the eventpre-approval of such services is necessary between regular meetings of the Audit Committee and it is not practical to wait to seekpre-approval at the next regular meeting of the Audit Committee,pre-approval of such services may be referred to the Chair of the Audit Committee for approval; provided that the Chair may notpre-approve any individual engagement for such services exceeding $50,000 or multiple engagements for such services in the aggregate exceeding $100,000 in each period between regular meetings of the Audit Committee. Any engagementpre-approved by the Chair between regular meetings of the Audit Committee shall be presented for ratification by the entire Audit Committee at its next regularly scheduled meeting.
Item 4(e)(2):
None, or 0%, of the services relating to the Audit-Related Fees, Tax Fees and All Other Fees paid by the Fund and MFS and MFS Related Entities relating directly to the operations and financial reporting of the Registrant disclosed above were approved by the audit committee pursuant to paragraphs (c)(7)(i)(C) of Rule2-01 of RegulationS-X (which permits audit committee approval after the start of the engagement with respect to services other than audit, review or attest services, if certain conditions are satisfied).
Item 4(f):
Not applicable.
Item 4(h):
The Registrant’s Audit Committee has considered whether the provision by a Registrant’s independent registered public accounting firm ofnon-audit services to MFS and MFS Related Entities that were notpre-approved by the Committee (because such services did not relate directly to the operations and financial reporting of the Registrant) was compatible with maintaining the independence of the independent registered public accounting firm as the Registrant’s principal auditors.
| ITEM 5. | AUDIT COMMITTEE OF LISTED REGISTRANTS. |
Not applicable to the Registrant.
A schedule of investments of each series of the Registrant is included as part of the report to shareholders of such series under Item 1 of this FormN-CSR.
| ITEM 7. | DISCLOSURE OF PROXY VOTING POLICIES AND PROCEDURES FORCLOSED-END MANAGEMENT INVESTMENT COMPANIES. |
Not applicable to the Registrant.
| ITEM 8. | PORTFOLIO MANAGERS OFCLOSED-END MANAGEMENT INVESTMENT COMPANIES. |
Not applicable to the Registrant.
| ITEM 9. | PURCHASES OF EQUITY SECURITIES BYCLOSED-END MANAGEMENT INVESTMENT COMPANY AND AFFILIATED PURCHASERS. |
Not applicable to the Registrant.
| ITEM 10. | SUBMISSION OF MATTERS TO A VOTE OF SECURITY HOLDERS. |
There were no material changes to the procedures by which shareholders may send recommendations to the Board for nominees to the Registrant’s Board since the Registrant last provided disclosure as to such procedures in response to the requirements of Item 407 (c)(2)(iv) of RegulationS-K or this Item.
| ITEM 11. | CONTROLS AND PROCEDURES. |
| (a) | Based upon their evaluation of the effectiveness of the registrant’s disclosure controls and procedures (as defined in Rule30a-3(c) under the Investment Company Act of 1940 (the “Act”)) as conducted within 90 days of the filing date of this report on FormN-CSR, the registrant’s principal financial officer and principal executive officer have concluded that those disclosure controls and procedures provide reasonable assurance that the material information required to be disclosed by the registrant on this report is recorded, processed, summarized and reported within the time periods specified in the Securities and Exchange Commission’s rules and forms. |
| (b) | There were no changes in the registrant’s internal controls over financial reporting (as defined in Rule30a-3(d) under the Act) that occurred during the period covered by the report that have materially affected, or are reasonably likely to materially affect, the registrant’s internal control over financial reporting. |
| ITEM 12. | DISCLOSURE OF SECURITIES LENDING ACTIVITIES FORCLOSED-END MANAGEMENT INVESTMENT COMPANIES. |
Not applicable to the Registrant.
| (a) | File the exhibits listed below as part of this form. Letter or number the exhibits in the sequence indicated. |
| | (1) | Any code of ethics, or amendment thereto, that is the subject of the disclosure required by Item 2, to the extent that the registrant intends to satisfy the Item 2 requirements through filing of an exhibit: Code of Ethics attached hereto asEX-99.COE. |
| | (2) | A separate certification for each principal executive officer and principal financial officer of the registrant as required by Rule30a-2(a) under the Act (17 CFR270.30a-2): Attached hereto asEX-99.302CERT. |
| | (3) | Any written solicitation to purchase securities under Rule23c-1 under the Act (17 CFR270.23c-1) sent or given during the period covered by the report by or on behalf of the registrant to 10 or more persons. Not applicable. |
| | (4) | Change in the registrant’s independent public accountant. Not applicable. |
| (b) | If the report is filed under Section 13(a) or 15(d) of the Exchange Act, provide the certifications required by Rule30a-2(b) under the Act (17 CFR270.30a-2(b)), Rule13a-14(b) or Rule15d-14(b) under the Exchange Act (17 CFR240.13a-14(b) or240.15d-14(b)) and Section 1350 of Chapter 63 of Title 18 of the United States Code (18 U.S.C. 1350) as an exhibit. A certification furnished pursuant to this paragraph will not be deemed “filed” for the purposes of Section 18 of the Exchange Act (15 U.S.C. 78r), or otherwise subject to the liability of that section. Such certification will not be deemed to be incorporated by reference into any filing under the Securities Act of 1933 or the Exchange Act, except to the extent that the registrant specifically incorporates it by reference: Attached hereto asEX-99.906CERT. |
Notice
A copy of the Amended and Restated Declaration of Trust, as amended, of the Registrant is on file with the Secretary of State of The Commonwealth of Massachusetts and notice is hereby given that this instrument is executed on behalf of the Registrant by an officer of the Registrant as an officer and not individually and the obligations of or arising out of this instrument are not binding upon any of the Trustees or shareholders individually, but are binding only upon the assets and property of the respective constituent series of the Registrant.
SIGNATURES
Pursuant to the requirements of the Securities Exchange Act of 1934 and the Investment Company Act of 1940, the registrant has duly caused this report to be signed on its behalf by the undersigned, thereunto duly authorized.
(Registrant) MFS SERIES TRUST IX
| | |
| By (Signature and Title)* | | DAVID L. DILORENZO |
| | David L. DiLorenzo, President |
Date: June 16, 2020
Pursuant to the requirements of the Securities Exchange Act of 1934 and the Investment Company Act of 1940, this report has been signed below by the following persons on behalf of the registrant and in the capacities and on the dates indicated.
| | |
| By (Signature and Title)* | | DAVID L. DILORENZO |
| | David L. DiLorenzo, President (Principal Executive Officer) |
Date: June 16, 2020
| | |
| By (Signature and Title)* | | JAMES O. YOST |
| | James O. Yost, Treasurer (Principal Financial Officer and Accounting Officer) |
Date: June 16, 2020
| * | Print name and title of each signing officer under his or her signature. |