UNITED STATES
SECURITIES AND EXCHANGE COMMISSION
Washington, D.C. 20549
FORM N-CSR
CERTIFIED SHAREHOLDER REPORT OF REGISTERED
MANAGEMENT INVESTMENT COMPANIES
Investment Company Act file number 811-02464
MFS SERIES TRUST IX
(Exact name of registrant as specified in charter)
111 Huntington Avenue, Boston, Massachusetts 02199 (Address of principal executive offices) (Zip code)
Christopher R. Bohane
Massachusetts Financial Services Company
111 Huntington Avenue
Boston, Massachusetts 02199
(Name and address of agents for service)
Registrant's telephone number, including area code: (617) 954-5000
Date of fiscal year end: April 30*
Date of reporting period: October 31, 2022
*This Form N-CSR pertains to the following series of the Registrant: MFS Corporate Bond Fund, MFS Limited Maturity Fund, MFS Municipal Limited Maturity Fund, and MFS Total Return Bond Fund. The remaining series of the Registrant has a fiscal year end of October 31.
ITEM 1. REPORTS TO STOCKHOLDERS.
Item 1(a):


| 1 | |
| 2 | |
| 4 | |
| 6 | |
| 20 | |
| 22 | |
| 24 | |
| 25 | |
| 34 | |
| 48 | |
| 52 | |
| 52 | |
| 52 | |
| 52 | |
| 52 |
| back cover |


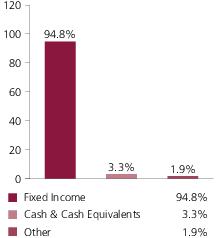
| Investment Grade Corporates | 74.8% |
| High Yield Corporates | 8.6% |
| U.S. Treasury Securities | 2.3% |
| Emerging Markets Bonds | 5.1% |
| Commercial Mortgage-Backed Securities | 1.8% |
| Municipal Bonds | 0.4% |
| Collateralized Debt Obligations | 0.9% |
| Non-U.S. Government Bonds | 0.9% |
| Asset-Backed Securities (o) | 0.0% |
| AAA | 3.0% |
| AA | 5.5% |
| A | 26.9% |
| BBB | 47.3% |
| BB | 7.6% |
| B | 2.0% |
| CCC | 0.2% |
| U.S. Government | 4.2% |
| Not Rated | (1.9)% |
| Cash & Cash Equivalents | 3.3% |
| Other | 1.9% |
| Average Duration (d) | 6.8 |
| Average Effective Maturity (m) | 10.8 yrs. |
| (a) | For all securities other than those specifically described below, ratings are assigned to underlying securities utilizing ratings from Moody’s, Fitch, and Standard & Poor’s rating agencies and applying the following hierarchy: If all three agencies provide a rating, the middle rating (after dropping the highest and lowest ratings) is assigned; if two of the three agencies rate a security, the lower of the two is assigned. If none of the 3 rating agencies above assign a rating, but the security is rated by DBRS Morningstar, then the DBRS Morningstar rating is assigned. If none of the 4 rating agencies listed above rate the security, but the security is rated by the Kroll Bond Rating Agency (KBRA), then the KBRA rating is assigned. Ratings are shown in the S&P and Fitch scale (e.g., AAA). Securities rated BBB or higher are considered investment grade. All ratings are subject to change. U.S. Government includes securities issued by the U.S. Department of the Treasury. Not Rated includes fixed income securities and fixed income derivatives that have not been rated by any rating agency. |
| (d) | Duration is a measure of how much a bond’s price is likely to fluctuate with general changes in interest rates, e.g., if rates rise 1.00%, a bond with a 5-year duration is likely to lose about 5.00% of its value due to the interest rate move. The Average Duration calculation reflects the impact of the equivalent exposure of derivative positions, if any. |
| (i) | For purposes of this presentation, the components include the value of securities, and reflect the impact of the equivalent exposure of derivative positions, if any. These amounts may be negative from time to time. Equivalent exposure is a calculated amount that translates the derivative position into a reasonable approximation of the amount of the underlying asset that the portfolio would have to hold at a given point in time to have the same price sensitivity that results from the portfolio’s ownership of the derivative contract. When dealing with derivatives, equivalent exposure is a more representative measure of the potential impact of a position on portfolio performance than value. The bond component will include any accrued interest amounts. |
| (m) | In determining each instrument’s effective maturity for purposes of calculating the fund’s dollar-weighted average effective maturity, MFS uses the instrument’s stated maturity or, if applicable, an earlier date on which MFS believes it is probable that a maturity-shortening device (such as a put, pre-refunding or prepayment) will cause the instrument to be repaid. Such an earlier date can be substantially shorter than the instrument’s stated maturity. |
| (o) | Less than 0.1%. |
May 1, 2022 through October 31, 2022
| Share Class | Annualized Expense Ratio | Beginning Account Value 5/01/22 | Ending Account Value 10/31/22 | Expenses Paid During Period (p) 5/01/22-10/31/22 | |
| A | Actual | 0.77% | $1,000.00 | $916.96 | $3.72 |
| Hypothetical (h) | 0.77% | $1,000.00 | $1,021.32 | $3.92 | |
| B | Actual | 1.52% | $1,000.00 | $914.03 | $7.33 |
| Hypothetical (h) | 1.52% | $1,000.00 | $1,017.54 | $7.73 | |
| C | Actual | 1.52% | $1,000.00 | $913.95 | $7.33 |
| Hypothetical (h) | 1.52% | $1,000.00 | $1,017.54 | $7.73 | |
| I | Actual | 0.51% | $1,000.00 | $918.77 | $2.47 |
| Hypothetical (h) | 0.51% | $1,000.00 | $1,022.63 | $2.60 | |
| R1 | Actual | 1.52% | $1,000.00 | $914.03 | $7.33 |
| Hypothetical (h) | 1.52% | $1,000.00 | $1,017.54 | $7.73 | |
| R2 | Actual | 1.01% | $1,000.00 | $916.59 | $4.88 |
| Hypothetical (h) | 1.01% | $1,000.00 | $1,020.11 | $5.14 | |
| R3 | Actual | 0.76% | $1,000.00 | $917.76 | $3.67 |
| Hypothetical (h) | 0.76% | $1,000.00 | $1,021.37 | $3.87 | |
| R4 | Actual | 0.52% | $1,000.00 | $918.93 | $2.52 |
| Hypothetical (h) | 0.52% | $1,000.00 | $1,022.58 | $2.65 | |
| R6 | Actual | 0.42% | $1,000.00 | $919.22 | $2.03 |
| Hypothetical (h) | 0.42% | $1,000.00 | $1,023.09 | $2.14 |
| (h) | 5% class return per year before expenses. |
| (p) | “Expenses Paid During Period” are equal to each class’s annualized expense ratio, as shown above, multiplied by the average account value over the period, multiplied by 184/365 (to reflect the one-half year period). Expenses paid do not include any applicable sales charges (loads). If these transaction costs had been included, your costs would have been higher. |
| Issuer | Shares/Par | Value ($) | ||
| Bonds – 95.7% | ||||
| Aerospace & Defense – 2.0% | ||||
| Boeing Co., 5.15%, 5/01/2030 | $ | 31,111,000 | $28,746,074 | |
| Boeing Co., 5.805%, 5/01/2050 | 13,657,000 | 11,745,805 | ||
| General Dynamics Corp., 3.625%, 4/01/2030 | 13,022,000 | 11,834,832 | ||
| Raytheon Technologies Corp., 1.9%, 9/01/2031 | 8,393,000 | 6,361,311 | ||
| Raytheon Technologies Corp., 2.375%, 3/15/2032 | 12,664,000 | 9,880,094 | ||
| Raytheon Technologies Corp., 3.03%, 3/15/2052 | 12,664,000 | 8,072,946 | ||
| $76,641,062 | ||||
| Apparel Manufacturers – 0.5% | ||||
| Tapestry, Inc., 4.125%, 7/15/2027 | $ | 2,710,000 | $2,451,558 | |
| Tapestry, Inc., 3.05%, 3/15/2032 | 25,283,000 | 18,601,652 | ||
| $21,053,210 | ||||
| Asset-Backed & Securitized – 2.7% | ||||
| 3650R Commercial Mortgage Trust, 2021-PF1, “XA”, 1.031%, 11/15/2054 (i) | $ | 113,080,659 | $6,744,131 | |
| ACREC 2021-FL1 Ltd., “A”, FLR, 4.593% (LIBOR - 1mo. + 1.15%), 10/16/2036 (n) | 18,928,000 | 18,011,412 | ||
| Arbor Realty Trust, Inc., CLO, 2021-FL4, “AS”, FLR, 5.112% (LIBOR - 1mo. + 1.7%), 11/15/2036 (n) | 4,841,000 | 4,570,138 | ||
| Bayview Financial Revolving Mortgage Loan Trust, FLR, 5.232% (LIBOR - 1mo. + 1.6%), 12/28/2040 (n) | 338,250 | 406,015 | ||
| BDS 2021-FL7 Ltd., “B”, FLR, 4.943% (LIBOR - 1mo. + 1.5%), 6/16/2036 (n) | 4,505,000 | 4,196,079 | ||
| Benchmark 2021-B27 Mortgage Trust, “XA”, 1.267%, 7/15/2054 (i) | 200,075,619 | 14,246,444 | ||
| JPMorgan Chase Commercial Mortgage Securities Corp., 5.643%, 7/15/2042 (n) | 510,865 | 417,045 | ||
| KREF 2018-FT1 Ltd., “A”, FLR, 4.482% (LIBOR - 1mo. + 1.1%), 2/15/2039 (n) | 8,257,000 | 7,978,747 | ||
| KREF 2018-FT1 Ltd., “AS”, FLR, 4.712% (LIBOR - 1mo. + 1.3%), 2/15/2039 (n) | 9,074,500 | 8,402,406 | ||
| Lehman Brothers Commercial Conduit Mortgage Trust, 0.815%, 2/18/2030 (i) | 28,919 | 0 | ||
| PFP III 2021-8 Ltd., “A”, FLR, 4.412% (LIBOR - 1mo. + 1%), 8/09/2037 (n) | 14,431,663 | 13,826,875 | ||
| PFP III 2021-8 Ltd., “AS”, FLR, 4.662% (LIBOR - 1mo. + 1.25%), 8/09/2037 (n) | 17,557,000 | 16,447,889 | ||
| Issuer | Shares/Par | Value ($) | ||
| Bonds – continued | ||||
| Asset-Backed & Securitized – continued | ||||
| ReadyCap Commercial Mortgage Trust, 2021-FL5, “A”, FLR, 4.586% (LIBOR - 1mo. + 1%), 4/25/2038 (z) | $ | 10,368,060 | $9,813,908 | |
| $105,061,089 | ||||
| Automotive – 0.9% | ||||
| Hyundai Capital America, 1.8%, 1/10/2028 (n) | $ | 8,000,000 | $6,280,854 | |
| Hyundai Capital America, 2%, 6/15/2028 (n) | 31,014,000 | 24,131,345 | ||
| Hyundai Capital America, 6.375%, 4/08/2030 (n) | 2,929,000 | 2,854,230 | ||
| $33,266,429 | ||||
| Broadcasting – 2.1% | ||||
| Discovery Communications LLC, 4%, 9/15/2055 | $ | 8,715,000 | $4,972,591 | |
| Discovery, Inc., 4.125%, 5/15/2029 | 7,075,000 | 5,975,182 | ||
| Discovery, Inc., 5.3%, 5/15/2049 | 9,152,000 | 6,592,593 | ||
| Magallanes, Inc., 4.279%, 3/15/2032 (n) | 12,860,000 | 10,387,643 | ||
| Magallanes, Inc., 5.391%, 3/15/2062 (n) | 12,184,000 | 8,498,889 | ||
| Prosus N.V., 3.832%, 2/08/2051 (n) | 16,220,000 | 8,562,224 | ||
| Walt Disney Co., 3.5%, 5/13/2040 | 34,682,000 | 26,485,767 | ||
| Walt Disney Co., 3.6%, 1/13/2051 | 12,408,000 | 9,034,759 | ||
| $80,509,648 | ||||
| Brokerage & Asset Managers – 1.5% | ||||
| Brookfield Finance, Inc., 2.34%, 1/30/2032 | $ | 25,919,000 | $18,910,083 | |
| Charles Schwab Corp., 1.95%, 12/01/2031 | 9,631,000 | 7,199,717 | ||
| Intercontinental Exchange, Inc., 2.1%, 6/15/2030 | 24,198,000 | 19,373,887 | ||
| Intercontinental Exchange, Inc., 1.85%, 9/15/2032 | 10,946,000 | 7,924,203 | ||
| Intercontinental Exchange, Inc., 3%, 9/15/2060 | 11,809,000 | 6,825,933 | ||
| $60,233,823 | ||||
| Building – 0.3% | ||||
| Vulcan Materials Co., 3.5%, 6/01/2030 | $ | 379,000 | $322,125 | |
| Vulcan Materials Co., 4.5%, 6/15/2047 | 15,485,000 | 12,028,275 | ||
| $12,350,400 | ||||
| Business Services – 3.5% | ||||
| Equifax, Inc., 3.1%, 5/15/2030 | $ | 10,062,000 | $8,218,241 | |
| Equifax, Inc., 2.35%, 9/15/2031 | 35,656,000 | 26,372,209 | ||
| Equinix, Inc., 2.625%, 11/18/2024 | 12,928,000 | 12,176,883 | ||
| Equinix, Inc., 2.5%, 5/15/2031 | 22,738,000 | 17,314,645 | ||
| Equinix, Inc., 3%, 7/15/2050 | 8,061,000 | 4,670,606 | ||
| Fiserv, Inc., 2.25%, 6/01/2027 | 18,340,000 | 15,860,276 | ||
| Fiserv, Inc., 4.4%, 7/01/2049 | 13,643,000 | 10,257,673 | ||
| Iron Mountain, Inc., 4.5%, 2/15/2031 (n) | 28,959,000 | 23,456,645 | ||
| Visa, Inc., 4.15%, 12/14/2035 | 12,578,000 | 11,329,828 | ||
| Issuer | Shares/Par | Value ($) | ||
| Bonds – continued | ||||
| Business Services – continued | ||||
| Visa, Inc., 3.65%, 9/15/2047 | $ | 9,718,000 | $7,393,563 | |
| $137,050,569 | ||||
| Cable TV – 1.6% | ||||
| Charter Communications Operating LLC/Charter Communications Operating Capital Corp., 6.384%, 10/23/2035 | $ | 4,547,000 | $4,153,069 | |
| Charter Communications Operating LLC/Charter Communications Operating Capital Corp., 5.375%, 5/01/2047 | 25,141,000 | 19,338,946 | ||
| Comcast Corp., 1.95%, 1/15/2031 | 3,102,000 | 2,404,651 | ||
| Comcast Corp., 2.887%, 11/01/2051 | 25,068,000 | 15,059,766 | ||
| Sirius XM Radio, Inc., 4.125%, 7/01/2030 (n) | 20,836,000 | 17,049,863 | ||
| Time Warner Cable, Inc., 4.5%, 9/15/2042 | 5,172,000 | 3,531,577 | ||
| $61,537,872 | ||||
| Chemicals – 0.1% | ||||
| RPM International, Inc., 4.55%, 3/01/2029 | $ | 3,753,000 | $3,395,133 | |
| RPM International, Inc., 4.25%, 1/15/2048 | 1,900,000 | 1,350,975 | ||
| $4,746,108 | ||||
| Computer Software – 0.9% | ||||
| Cisco Systems, Inc., 5.5%, 1/15/2040 | $ | 6,838,000 | $6,683,399 | |
| Microsoft Corp., 3.45%, 8/08/2036 | 9,522,000 | 8,159,134 | ||
| Microsoft Corp., 2.525%, 6/01/2050 | 15,025,000 | 9,425,602 | ||
| VeriSign, Inc., 4.75%, 7/15/2027 | 12,007,000 | 11,511,751 | ||
| $35,779,886 | ||||
| Computer Software - Systems – 0.9% | ||||
| Apple, Inc., 2.05%, 9/11/2026 (f) | $ | 16,887,000 | $15,268,028 | |
| Apple, Inc., 1.7%, 8/05/2031 | 4,970,000 | 3,854,364 | ||
| Apple, Inc., 3.85%, 8/04/2046 | 8,346,000 | 6,649,052 | ||
| Apple, Inc., 2.7%, 8/05/2051 | 14,930,000 | 9,381,587 | ||
| $35,153,031 | ||||
| Conglomerates – 1.5% | ||||
| Otis Worldwide Corp., 2.565%, 2/15/2030 | $ | 35,101,000 | $28,611,433 | |
| Westinghouse Air Brake Technologies Corp., 3.2%, 6/15/2025 | 5,611,000 | 5,208,030 | ||
| Westinghouse Air Brake Technologies Corp., 4.95%, 9/15/2028 | 25,995,000 | 24,180,131 | ||
| $57,999,594 | ||||
| Consumer Products – 1.1% | ||||
| Hasbro, Inc., 3.9%, 11/19/2029 | $ | 22,915,000 | $19,767,420 | |
| Mattel, Inc., 3.75%, 4/01/2029 (n) | 27,311,000 | 23,568,096 | ||
| $43,335,516 | ||||
| Issuer | Shares/Par | Value ($) | ||
| Bonds – continued | ||||
| Consumer Services – 0.5% | ||||
| Booking Holdings, Inc., 3.6%, 6/01/2026 | $ | 18,768,000 | $17,720,713 | |
| Booking Holdings, Inc., 3.55%, 3/15/2028 | 2,201,000 | 1,995,904 | ||
| $19,716,617 | ||||
| Electrical Equipment – 1.4% | ||||
| Arrow Electronics, Inc., 3.875%, 1/12/2028 | $ | 11,461,000 | $10,195,604 | |
| Ciena Corp., 4%, 1/31/2030 (n) | 24,699,000 | 20,870,655 | ||
| Commscope, Inc., 4.75%, 9/01/2029 (n) | 28,608,000 | 24,197,625 | ||
| $55,263,884 | ||||
| Electronics – 2.9% | ||||
| Broadcom, Inc., 3.469%, 4/15/2034 (n) | $ | 18,382,000 | $13,759,052 | |
| Lam Research Corp., 1.9%, 6/15/2030 | 3,948,000 | 3,097,818 | ||
| Lam Research Corp., 4.875%, 3/15/2049 | 7,369,000 | 6,496,734 | ||
| NXP B.V./NXP Funding LLC/NXP USA, Inc., 3.15%, 5/01/2027 | 8,214,000 | 7,265,619 | ||
| NXP B.V./NXP Funding LLC/NXP USA, Inc., 2.5%, 5/11/2031 | 15,364,000 | 11,555,064 | ||
| NXP B.V./NXP Funding LLC/NXP USA, Inc., 3.25%, 5/11/2041 | 18,128,000 | 11,773,379 | ||
| NXP B.V./NXP Funding LLC/NXP USA, Inc., 3.125%, 2/15/2042 | 15,080,000 | 9,466,337 | ||
| Qualcomm, Inc., 3.25%, 5/20/2027 | 8,045,000 | 7,474,317 | ||
| Sensata Technologies, Inc., 4.375%, 2/15/2030 (n) | 24,078,000 | 20,712,136 | ||
| Sensata Technologies, Inc., 3.75%, 2/15/2031 (n) | 3,352,000 | 2,669,030 | ||
| TSMC Arizona Corp., 3.875%, 4/22/2027 | 8,004,000 | 7,495,536 | ||
| TSMC Arizona Corp., 3.125%, 10/25/2041 | 15,915,000 | 10,985,454 | ||
| $112,750,476 | ||||
| Emerging Market Quasi-Sovereign – 0.9% | ||||
| Korea Hydro & Nuclear Power Co. Ltd., 4.25%, 7/27/2027 (n) | $ | 21,936,000 | $20,592,189 | |
| Qatar Petroleum, 3.125%, 7/12/2041 (n) | 22,244,000 | 15,766,547 | ||
| $36,358,736 | ||||
| Emerging Market Sovereign – 0.3% | ||||
| United Mexican States, 4.28%, 8/14/2041 | $ | 14,843,000 | $10,740,231 | |
| Energy - Independent – 0.5% | ||||
| EQT Corp., 3.625%, 5/15/2031 (n) | $ | 8,166,000 | $6,793,132 | |
| Hess Corp., 5.8%, 4/01/2047 | 13,418,000 | 12,166,565 | ||
| $18,959,697 | ||||
| Energy - Integrated – 1.4% | ||||
| BP Capital Markets America, Inc., 1.749%, 8/10/2030 | $ | 6,943,000 | $5,376,766 | |
| BP Capital Markets America, Inc., 3.001%, 3/17/2052 | 5,851,000 | 3,623,946 | ||
| Cenovus Energy, Inc., 2.65%, 1/15/2032 | 17,560,000 | 13,544,115 | ||
| Cenovus Energy, Inc., 6.75%, 11/15/2039 | 1,684,000 | 1,656,569 | ||
| Cenovus Energy, Inc., 3.75%, 2/15/2052 | 3,132,000 | 2,086,741 | ||
| Eni S.p.A., 4.75%, 9/12/2028 (n) | 14,052,000 | 13,063,224 | ||
| Issuer | Shares/Par | Value ($) | ||
| Bonds – continued | ||||
| Energy - Integrated – continued | ||||
| Eni S.p.A., 4.25%, 5/09/2029 (n) | $ | 18,279,000 | $16,385,514 | |
| $55,736,875 | ||||
| Entertainment – 0.5% | ||||
| Royal Caribbean Cruises Ltd., 4.25%, 7/01/2026 (n) | $ | 26,029,000 | $20,694,356 | |
| Financial Institutions – 2.3% | ||||
| AerCap Ireland Capital DAC/AerCap Global Aviation Trust, 3.65%, 7/21/2027 | $ | 24,891,000 | $21,644,757 | |
| AerCap Ireland Capital DAC/AerCap Global Aviation Trust, 3.3%, 1/30/2032 | 7,581,000 | 5,689,930 | ||
| AerCap Ireland Capital DAC/AerCap Global Aviation Trust, 3.85%, 10/29/2041 | 6,037,000 | 4,012,528 | ||
| Air Lease Corp., 2.875%, 1/15/2032 | 26,184,000 | 19,557,219 | ||
| Avolon Holdings Funding Ltd., 5.5%, 1/15/2026 (n) | 757,000 | 695,605 | ||
| Avolon Holdings Funding Ltd., 4.375%, 5/01/2026 (n) | 11,590,000 | 10,188,637 | ||
| Avolon Holdings Funding Ltd., 3.25%, 2/15/2027 (n) | 13,674,000 | 11,171,239 | ||
| Avolon Holdings Funding Ltd., 2.75%, 2/21/2028 (n) | 23,742,000 | 18,148,774 | ||
| $91,108,689 | ||||
| Food & Beverages – 2.9% | ||||
| Anheuser-Busch InBev Worldwide, Inc., 4.375%, 4/15/2038 | $ | 8,822,000 | $7,533,135 | |
| Anheuser-Busch InBev Worldwide, Inc., 4.75%, 4/15/2058 | 15,286,000 | 12,418,419 | ||
| Constellation Brands, Inc., 2.25%, 8/01/2031 | 21,758,000 | 16,660,962 | ||
| Constellation Brands, Inc., 3.75%, 5/01/2050 | 5,973,000 | 4,168,570 | ||
| Diageo Capital PLC, 2.375%, 10/24/2029 | 11,730,000 | 9,721,718 | ||
| Diageo Capital PLC, 2%, 4/29/2030 | 11,475,000 | 9,121,300 | ||
| JBS USA Lux S.A./JBS USA Finance, Inc., 5.5%, 1/15/2030 (n) | 8,667,000 | 7,900,477 | ||
| JBS USA Lux S.A./JBS USA Finance, Inc., 3.75%, 12/01/2031 (n) | 8,667,000 | 6,798,018 | ||
| Kraft Heinz Foods Co., 4.875%, 10/01/2049 | 12,944,000 | 10,783,869 | ||
| Kraft Heinz Foods Co., 5.5%, 6/01/2050 | 12,522,000 | 11,468,740 | ||
| SYSCO Corp., 2.4%, 2/15/2030 | 4,205,000 | 3,402,169 | ||
| SYSCO Corp., 2.45%, 12/14/2031 | 8,332,000 | 6,500,765 | ||
| SYSCO Corp., 4.45%, 3/15/2048 | 9,063,000 | 7,046,984 | ||
| $113,525,126 | ||||
| Gaming & Lodging – 2.4% | ||||
| Hilton Domestic Operating Co., Inc., 3.625%, 2/15/2032 (n) | $ | 28,373,000 | $22,592,001 | |
| Marriott International, Inc., 4%, 4/15/2028 | 31,912,000 | 28,776,713 | ||
| Marriott International, Inc., 2.85%, 4/15/2031 | 17,655,000 | 13,736,692 | ||
| VICI Properties LP / VICI Note Co., Inc., 4.25%, 12/01/2026 (n) | 4,173,000 | 3,801,061 | ||
| VICI Properties LP / VICI Note Co., Inc., 4.125%, 8/15/2030 (n) | 7,346,000 | 6,068,122 | ||
| VICI Properties LP, REIT, 4.75%, 2/15/2028 | 19,861,000 | 18,099,036 | ||
| $93,073,625 | ||||
| Issuer | Shares/Par | Value ($) | ||
| Bonds – continued | ||||
| Insurance – 0.4% | ||||
| Corebridge Financial, Inc., 3.9%, 4/05/2032 (n) | $ | 16,695,000 | $13,953,713 | |
| Corebridge Financial, Inc., 4.35%, 4/05/2042 (n) | 2,707,000 | 2,029,221 | ||
| $15,982,934 | ||||
| Insurance - Health – 1.6% | ||||
| Humana, Inc., 2.15%, 2/03/2032 | $ | 8,302,000 | $6,245,115 | |
| Humana, Inc., 4.95%, 10/01/2044 | 13,471,000 | 11,512,740 | ||
| UnitedHealth Group, Inc., 5.3%, 2/15/2030 | 11,253,000 | 11,251,156 | ||
| UnitedHealth Group, Inc., 4.625%, 7/15/2035 | 18,120,000 | 16,639,633 | ||
| UnitedHealth Group, Inc., 3.5%, 8/15/2039 | 6,918,000 | 5,314,779 | ||
| UnitedHealth Group, Inc., 5.875%, 2/15/2053 | 11,845,000 | 12,088,935 | ||
| $63,052,358 | ||||
| Insurance - Property & Casualty – 1.6% | ||||
| Aon Corp., 3.75%, 5/02/2029 | $ | 25,796,000 | $22,969,234 | |
| Aon Corp./Aon Global Holdings PLC, 2.05%, 8/23/2031 | 13,364,000 | 9,965,861 | ||
| Aon Corp./Aon Global Holdings PLC, 2.6%, 12/02/2031 | 3,253,000 | 2,515,479 | ||
| Fairfax Financial Holdings Ltd., 5.625%, 8/16/2032 (n) | 32,074,000 | 29,043,969 | ||
| $64,494,543 | ||||
| International Market Quasi-Sovereign – 0.4% | ||||
| Ontario Teachers' Cadillac Fairview Properties, 2.5%, 10/15/2031 (n) | $ | 19,995,000 | $15,107,407 | |
| International Market Sovereign – 0.5% | ||||
| Government of Bermuda, 5%, 7/15/2032 (n) | $ | 21,773,000 | $20,173,459 | |
| Machinery & Tools – 0.8% | ||||
| CNH Industrial Capital LLC, 5.45%, 10/14/2025 | $ | 17,462,000 | $17,269,450 | |
| CNH Industrial Capital LLC, 3.85%, 11/15/2027 | 14,189,000 | 12,845,246 | ||
| $30,114,696 | ||||
| Major Banks – 18.8% | ||||
| Australia and New Zealand Banking Group Ltd., 2.57% to 11/25/2030, FLR (CMT - 5yr. + 1.7%) to 11/25/2035 (n) | $ | 23,146,000 | $16,119,920 | |
| Bank of America Corp., 2.496% to 2/13/2030, FLR (LIBOR - 3mo. + 0.99%) to 2/13/2031 | 15,143,000 | 11,897,376 | ||
| Bank of America Corp., 2.572% to 10/20/2031, FLR (SOFR + 1.21%) to 10/20/2032 | 8,320,000 | 6,276,951 | ||
| Bank of America Corp., 2.676% to 6/19/2040, FLR (SOFR - 1 day + 1.93%) to 6/19/2041 | 33,510,000 | 21,200,986 | ||
| Bank of America Corp., 3.311% to 4/22/2041, FLR (SOFR - 1 day + 1.58%) to 4/22/2042 | 33,183,000 | 22,961,880 | ||
| Bank of New York Mellon Corp., 5.802% to 10/25/2027, FLR (SOFR - 1 day + 1.802%) to 10/25/2028 | 15,798,000 | 15,900,839 | ||
| Issuer | Shares/Par | Value ($) | ||
| Bonds – continued | ||||
| Major Banks – continued | ||||
| Bank of New York Mellon Corp., 5.834% to 10/25/2032, FLR (SOFR - 1 day + 2.074%) to 10/25/2033 | $ | 11,847,000 | $11,864,019 | |
| Barclays PLC, 2.894% to 11/24/2031, FLR (CMT - 1yr. + 1.3%) to 11/24/2032 | 29,866,000 | 21,146,802 | ||
| Commonwealth Bank of Australia, 3.61% to 9/12/2029, FLR (CMT - 1yr. + 2.05%) to 9/12/2034 (n) | 12,534,000 | 10,071,400 | ||
| Commonwealth Bank of Australia, 3.305%, 3/11/2041 (n) | 24,424,000 | 15,341,852 | ||
| Credit Agricole S.A., 1.247% to 1/26/2026, FLR (SOFR - 1 day + 0.89162%) to 1/26/2027 (n) | 26,499,000 | 22,319,877 | ||
| Goldman Sachs Group, Inc., 2.6%, 2/07/2030 | 18,400,000 | 14,633,052 | ||
| Goldman Sachs Group, Inc., 2.65% to 10/21/2031, FLR (SOFR - 1 day + 1.264%) to 10/21/2032 | 34,721,000 | 26,286,400 | ||
| Goldman Sachs Group, Inc., 3.102% to 2/24/2032, FLR (SOFR - 1 day + 1.41%) to 2/24/2033 | 12,528,000 | 9,811,811 | ||
| HSBC Holdings PLC, 2.357% to 8/18/2030, FLR (SOFR - 1 day + 1.947%) to 8/18/2031 | 30,595,000 | 21,790,923 | ||
| HSBC Holdings PLC, 2.871% to 11/22/2031, FLR (SOFR - 1 day + 1.41%) to 11/22/2032 | 17,186,000 | 12,192,494 | ||
| JPMorgan Chase & Co., 3.782% to 2/01/2027, FLR (LIBOR - 3mo. + 1.337%) to 2/01/2028 | 13,000,000 | 11,876,085 | ||
| JPMorgan Chase & Co., 3.54%, 5/01/2028 | 18,887,000 | 16,985,975 | ||
| JPMorgan Chase & Co., 2.545% to 11/08/2031, FLR (SOFR - 1 day + 1.18%) to 11/08/2032 | 26,194,000 | 19,767,418 | ||
| JPMorgan Chase & Co., 3.897% to 1/23/2048, FLR (LIBOR - 3mo. + 1.22%) to 1/23/2049 | 18,149,000 | 13,222,449 | ||
| Mitsubishi UFJ Financial Group, Inc., 1.64% to 10/13/2026, FLR (CMT - 1yr. + 0.67%) to 10/13/2027 | 8,042,000 | 6,769,920 | ||
| Mitsubishi UFJ Financial Group, Inc., 2.494% to 10/13/2031, FLR (CMT - 1yr. + 0.97%) to 10/13/2032 | 15,409,000 | 11,346,047 | ||
| Morgan Stanley, 0.985% to 12/10/2025, FLR (SOFR - 1 day + 0.72%) to 12/10/2026 | 11,246,000 | 9,623,831 | ||
| Morgan Stanley, 4.431% to 1/23/2029, FLR (LIBOR - 3mo. + 1.63%) to 1/23/2030 | 8,224,000 | 7,504,424 | ||
| Morgan Stanley, 2.699% to 1/22/2030, FLR (SOFR - 1 day + 1.143%) to 1/22/2031 | 38,393,000 | 30,743,134 | ||
| Morgan Stanley, 3.622% to 4/01/2030, FLR (SOFR - 1 day + 3.12%) to 4/01/2031 | 41,896,000 | 35,622,990 | ||
| Morgan Stanley, 3.217% to 4/22/2041, FLR (SOFR - 1 day + 1.485%) to 4/22/2042 | 2,556,000 | 1,737,469 | ||
| National Australia Bank Ltd., 3.347% to 1/12/2032, FLR (CMT - 5yr. + 1.7%) to 1/12/2037 (n) | 30,295,000 | 22,447,066 | ||
| Nordea Bank Abp, 1.5%, 9/30/2026 (n) | 39,033,000 | 32,880,985 | ||
| Royal Bank of Canada, 2.3%, 11/03/2031 | 34,661,000 | 26,376,304 | ||
| Issuer | Shares/Par | Value ($) | ||
| Bonds – continued | ||||
| Major Banks – continued | ||||
| Société Générale S.A., 2.797% to 1/19/2027, FLR (CMT - 1yr. + 1.3%) to 1/19/2028 (n) | $ | 6,283,000 | $5,202,967 | |
| Sumitomo Mitsui Financial Group, Inc., 1.71%, 1/12/2031 | 29,330,000 | 20,887,761 | ||
| Toronto Dominion Bank, 4.108%, 6/08/2027 | 14,123,000 | 13,228,271 | ||
| Toronto Dominion Bank, 2%, 9/10/2031 | 41,319,000 | 30,635,362 | ||
| Toronto Dominion Bank, 4.456%, 6/08/2032 | 4,816,000 | 4,328,082 | ||
| Toronto-Dominion Bank, 4.693%, 9/15/2027 | 15,916,000 | 15,244,886 | ||
| UBS Group AG, 3.126% to 8/13/2029, FLR (LIBOR - 3mo. + 1.468%) to 8/13/2030 (n) | 14,856,000 | 11,854,431 | ||
| UBS Group AG, 3.179% to 2/11/2042, FLR (CMT - 1yr. + 1.1%) to 2/11/2043 (n) | 11,560,000 | 7,084,402 | ||
| UBS Group AG, 4.375% to 2/10/2031, FLR (CMT - 1yr. + 3.313%) to 8/10/2069 (n) | 24,966,000 | 17,342,632 | ||
| UniCredit S.p.A., 2.569% to 9/22/2025, FLR (CMT - 1yr. + 2.3%) to 9/22/2026 (n) | 13,700,000 | 11,747,897 | ||
| UniCredit S.p.A., 1.982% to 6/03/2026, FLR (CMT - 1yr. + 1.2%) to 6/03/2027 (n) | 4,551,000 | 3,722,970 | ||
| Wells Fargo & Co., 3.908% to 4/25/2025, FLR (SOFR - 1 day + 1.32%) to 4/25/2026 | 35,752,000 | 34,063,730 | ||
| Wells Fargo & Co., 3.35% to 3/02/2032, FLR (SOFR - 1 day + 1.5%) to 3/02/2033 | 64,282,000 | 51,820,727 | ||
| $733,884,797 | ||||
| Medical & Health Technology & Services – 2.2% | ||||
| Alcon, Inc., 2.6%, 5/27/2030 (n) | $ | 26,216,000 | $21,084,530 | |
| Alcon, Inc., 3.8%, 9/23/2049 (n) | 9,925,000 | 6,830,600 | ||
| Becton, Dickinson and Co., 2.823%, 5/20/2030 | 5,566,000 | 4,641,250 | ||
| Becton, Dickinson and Co., 4.298%, 8/22/2032 | 3,494,000 | 3,161,040 | ||
| Becton, Dickinson and Co., 4.685%, 12/15/2044 | 6,838,000 | 5,747,629 | ||
| Becton, Dickinson and Co., 4.669%, 6/06/2047 | 17,690,000 | 14,803,139 | ||
| HCA, Inc., 5.875%, 2/01/2029 | 17,391,000 | 16,975,888 | ||
| Thermo Fisher Scientific, Inc., 2%, 10/15/2031 | 8,016,000 | 6,288,724 | ||
| Thermo Fisher Scientific, Inc., 2.8%, 10/15/2041 | 7,023,000 | 4,850,706 | ||
| $84,383,506 | ||||
| Medical Equipment – 0.5% | ||||
| Boston Scientific Corp., 2.65%, 6/01/2030 | $ | 9,471,000 | $7,822,007 | |
| Danaher Corp., 2.6%, 10/01/2050 | 22,327,000 | 13,399,064 | ||
| $21,221,071 | ||||
| Metals & Mining – 2.8% | ||||
| Anglo American Capital PLC, 2.25%, 3/17/2028 (n) | $ | 11,184,000 | $9,067,526 | |
| Anglo American Capital PLC, 2.625%, 9/10/2030 (n) | 22,275,000 | 17,088,771 | ||
| Anglo American Capital PLC, 2.875%, 3/17/2031 (n) | 13,073,000 | 10,048,368 | ||
| Issuer | Shares/Par | Value ($) | ||
| Bonds – continued | ||||
| Metals & Mining – continued | ||||
| Coeur Mining, Inc., 5.125%, 2/15/2029 (n) | $ | 8,988,000 | $6,921,330 | |
| First Quantum Minerals Ltd., 6.875%, 3/01/2026 (n) | 2,794,000 | 2,621,890 | ||
| First Quantum Minerals Ltd., 6.875%, 10/15/2027 (n) | 15,286,000 | 14,213,343 | ||
| FMG Resources Ltd., 4.375%, 4/01/2031 (n) | 15,250,000 | 12,120,700 | ||
| Glencore Funding LLC, 2.5%, 9/01/2030 (n) | 8,339,000 | 6,415,654 | ||
| Glencore Funding LLC, 2.85%, 4/27/2031 (n) | 17,132,000 | 13,261,981 | ||
| Novelis Corp., 4.75%, 1/30/2030 (n) | 20,408,000 | 17,337,515 | ||
| $109,097,078 | ||||
| Midstream – 3.8% | ||||
| Cheniere Corpus Christi Holdings LLC, 3.7%, 11/15/2029 | $ | 10,673,000 | $9,295,584 | |
| DT Midstream, Inc., 4.125%, 6/15/2029 (n) | 1,103,000 | 953,544 | ||
| Energy Transfer LP, 4%, 10/01/2027 | 8,335,000 | 7,539,573 | ||
| Energy Transfer LP, 3.75%, 5/15/2030 | 8,604,000 | 7,313,344 | ||
| Energy Transfer LP, 5%, 5/15/2050 | 11,590,000 | 8,800,866 | ||
| EQM Midstream Partners LP, 4.5%, 1/15/2029 (n) | 16,502,000 | 14,026,700 | ||
| Galaxy Pipeline Assets Bidco Ltd., 1.75%, 9/30/2027 (n) | 30,534,072 | 27,679,030 | ||
| Galaxy Pipeline Assets Bidco Ltd., 2.16%, 3/31/2034 (n) | 12,899,932 | 10,503,116 | ||
| Plains All American Pipeline, 4.9%, 2/15/2045 | 8,649,000 | 6,279,139 | ||
| Plains All American Pipeline LP/PAA Finance Corp., 4.65%, 10/15/2025 | 8,441,000 | 8,158,725 | ||
| Plains All American Pipeline LP/PAA Finance Corp., 3.55%, 12/15/2029 | 12,959,000 | 10,798,544 | ||
| Sabine Pass Liquefaction LLC, 4.2%, 3/15/2028 | 13,455,000 | 12,268,760 | ||
| Sabine Pass Liquefaction LLC, 4.5%, 5/15/2030 | 5,013,000 | 4,572,296 | ||
| Targa Resources Corp., 4.2%, 2/01/2033 | 5,160,000 | 4,307,620 | ||
| Targa Resources Corp., 4.95%, 4/15/2052 | 20,184,000 | 15,144,817 | ||
| $147,641,658 | ||||
| Municipals – 0.4% | ||||
| Golden State, CA, Tobacco Securitization Corp., Tobacco Settlement Rev., Taxable, “B”, 2.746%, 6/01/2034 | $ | 9,830,000 | $7,540,066 | |
| Golden State, CA, Tobacco Securitization Corp., Tobacco Settlement Rev., Taxable, “B”, 3%, 6/01/2046 | 8,380,000 | 7,589,484 | ||
| $15,129,550 | ||||
| Natural Gas - Distribution – 0.1% | ||||
| NiSource, Inc., 5.65%, 2/01/2045 | $ | 3,597,000 | $3,257,479 | |
| Natural Gas - Pipeline – 0.4% | ||||
| APT Pipelines Ltd., 4.25%, 7/15/2027 (n) | $ | 5,122,000 | $4,690,694 | |
| APT Pipelines Ltd., 5%, 3/23/2035 (n) | 12,850,000 | 11,117,148 | ||
| $15,807,842 | ||||
| Issuer | Shares/Par | Value ($) | ||
| Bonds – continued | ||||
| Network & Telecom – 0.4% | ||||
| AT&T, Inc., 2.75%, 6/01/2031 | $ | 16,934,000 | $13,547,997 | |
| Verizon Communications, Inc., 2.1%, 3/22/2028 | 4,562,000 | 3,833,834 | ||
| $17,381,831 | ||||
| Oils – 0.4% | ||||
| Puma International Financing S.A., 5%, 1/24/2026 | $ | 17,131,000 | $15,203,762 | |
| Other Banks & Diversified Financials – 0.9% | ||||
| American Express Co., 4.989% to 5/26/2032, FLR (SOFR - 1 day + 2.255%) to 5/26/2033 | $ | 21,439,000 | $19,450,980 | |
| Groupe BPCE S.A., 4.5%, 3/15/2025 (n) | 5,146,000 | 4,830,427 | ||
| Mizrahi Tefahot Bank Ltd., 3.077% to 4/07/2026, FLR (CMT - 5yr. + 2.25%) to 4/07/2031 (n) | 11,682,000 | 9,812,880 | ||
| $34,094,287 | ||||
| Pharmaceuticals – 0.4% | ||||
| AstraZeneca PLC, 1.375%, 8/06/2030 | $ | 8,756,000 | $6,695,193 | |
| Merck & Co., Inc., 2.75%, 12/10/2051 | 7,976,000 | 5,067,120 | ||
| Pfizer, Inc., 2.55%, 5/28/2040 | 7,976,000 | 5,519,254 | ||
| $17,281,567 | ||||
| Pollution Control – 0.3% | ||||
| Waste Connections, Inc., 4.2%, 1/15/2033 | $ | 14,186,000 | $12,828,806 | |
| Railroad & Shipping – 0.6% | ||||
| Canadian Pacific Railway Co., 3%, 12/02/2041 | $ | 5,600,000 | $3,880,930 | |
| Canadian Pacific Railway Co., 3.1%, 12/02/2051 | 14,624,000 | 9,302,545 | ||
| Wabtec Transportation Netherlands B.V., 1.25%, 12/03/2027 | EUR | 13,732,000 | 11,098,131 | |
| $24,281,606 | ||||
| Real Estate - Apartment – 0.4% | ||||
| American Homes 4 Rent LP, REIT, 2.375%, 7/15/2031 | $ | 17,332,000 | $12,777,905 | |
| American Homes 4 Rent LP, REIT, 3.375%, 7/15/2051 | 6,347,000 | 3,722,925 | ||
| $16,500,830 | ||||
| Real Estate - Office – 0.9% | ||||
| Corporate Office Property LP, REIT, 2%, 1/15/2029 | $ | 18,241,000 | $13,605,735 | |
| Corporate Office Property LP, REIT, 2.75%, 4/15/2031 | 27,392,000 | 19,792,402 | ||
| $33,398,137 | ||||
| Real Estate - Other – 1.0% | ||||
| EPR Properties, REIT, 3.6%, 11/15/2031 | $ | 12,888,000 | $8,700,670 | |
| Lexington Realty Trust Co., 2.375%, 10/01/2031 | 22,937,000 | 16,578,280 | ||
| W.P. Carey, Inc., REIT, 2.45%, 2/01/2032 | 17,047,000 | 12,511,230 | ||
| $37,790,180 | ||||
| Issuer | Shares/Par | Value ($) | ||
| Bonds – continued | ||||
| Real Estate - Retail – 1.1% | ||||
| Brixmor Operating Partnership LP, REIT, 4.125%, 5/15/2029 | $ | 3,022,000 | $2,588,768 | |
| Brixmor Operating Partnership LP, REIT, 2.5%, 8/16/2031 | 14,923,000 | 10,692,826 | ||
| Spirit Realty, LP, REIT, 4.45%, 9/15/2026 | 6,660,000 | 6,207,975 | ||
| Spirit Realty, LP, REIT, 3.2%, 2/15/2031 | 10,444,000 | 7,975,042 | ||
| STORE Capital Corp., REIT, 2.7%, 12/01/2031 | 20,734,000 | 15,676,440 | ||
| $43,141,051 | ||||
| Restaurants – 0.6% | ||||
| Starbucks Corp., 3%, 2/14/2032 | $ | 30,637,000 | $25,354,931 | |
| Retailers – 2.1% | ||||
| Alimentation Couche-Tard, Inc., 3.8%, 1/25/2050 (n) | $ | 18,119,000 | $11,799,321 | |
| Amazon.com, Inc., 3.6%, 4/13/2032 | 20,868,000 | 18,684,099 | ||
| AutoZone, Inc., 4.75%, 8/01/2032 | 10,050,000 | 9,341,266 | ||
| Home Depot, Inc., 3.3%, 4/15/2040 | 19,715,000 | 14,758,508 | ||
| MercadoLibre, Inc., 3.125%, 1/14/2031 | 21,974,000 | 15,885,224 | ||
| Nordstrom, Inc., 4.25%, 8/01/2031 | 15,709,000 | 11,404,734 | ||
| $81,873,152 | ||||
| Specialty Chemicals – 0.4% | ||||
| International Flavors & Fragrances, Inc., 2.3%, 11/01/2030 (n) | $ | 12,028,000 | $9,039,474 | |
| International Flavors & Fragrances, Inc., 3.268%, 11/15/2040 (n) | 12,028,000 | 8,016,717 | ||
| $17,056,191 | ||||
| Specialty Stores – 0.6% | ||||
| DICK'S Sporting Goods, 3.15%, 1/15/2032 | $ | 15,280,000 | $11,598,153 | |
| DICK'S Sporting Goods, 4.1%, 1/15/2052 | 17,941,000 | 10,939,155 | ||
| $22,537,308 | ||||
| Telecommunications - Wireless – 3.6% | ||||
| Cellnex Finance Co. S.A., 3.875%, 7/07/2041 (n) | $ | 24,203,000 | $14,814,656 | |
| Crown Castle International Corp., REIT, 4%, 3/01/2027 | 9,286,000 | 8,590,933 | ||
| Crown Castle, Inc., REIT, 4.45%, 2/15/2026 | 10,709,000 | 10,251,640 | ||
| Crown Castle, Inc., REIT, 3.65%, 9/01/2027 | 8,862,000 | 8,013,984 | ||
| Millicom International Cellular S.A., 4.5%, 4/27/2031 (n) | 15,857,000 | 11,887,502 | ||
| Rogers Communications, Inc., 3.8%, 3/15/2032 (n) | 11,639,000 | 9,909,347 | ||
| Rogers Communications, Inc., 4.5%, 3/15/2042 (n) | 12,354,000 | 9,791,402 | ||
| Rogers Communications, Inc., 4.55%, 3/15/2052 (n) | 13,360,000 | 10,321,349 | ||
| T-Mobile USA, Inc., 2.05%, 2/15/2028 | 18,236,000 | 15,134,997 | ||
| T-Mobile USA, Inc., 3%, 2/15/2041 | 30,674,000 | 20,627,928 | ||
| Vodafone Group PLC, 4.125% to 6/04/2031, FLR (CMT - 1yr. + 2.767%) to 6/04/2051, FLR (CMT - 1yr. + 3.517%) to 6/04/2081 | 28,683,000 | 20,343,705 | ||
| $139,687,443 | ||||
| Issuer | Shares/Par | Value ($) | ||
| Bonds – continued | ||||
| Transportation - Services – 0.1% | ||||
| ERAC USA Finance LLC, 7%, 10/15/2037 (n) | $ | 4,480,000 | $4,575,701 | |
| U.S. Treasury Obligations – 4.2% | ||||
| U.S. Treasury Bonds, 2.375%, 2/15/2042 | $ | 95,964,000 | $70,068,714 | |
| U.S. Treasury Bonds, 2.875%, 5/15/2052 | 34,828,600 | 27,030,259 | ||
| U.S. Treasury Notes, 2.625%, 4/15/2025 | 12,368,000 | 11,842,843 | ||
| U.S. Treasury Notes, 4.125%, 9/30/2027 | 9,702,000 | 9,648,942 | ||
| U.S. Treasury Notes, 3.875%, 9/30/2029 | 46,297,000 | 45,472,335 | ||
| $164,063,093 | ||||
| Utilities - Electric Power – 7.8% | ||||
| American Transmission Systems, Inc., 2.65%, 1/15/2032 (n) | $ | 5,287,000 | $4,104,859 | |
| CenterPoint Energy, Inc., 2.65%, 6/01/2031 | 17,210,000 | 13,631,879 | ||
| Duke Energy Carolinas LLC, 2.45%, 2/01/2030 | 25,541,000 | 21,092,727 | ||
| Duke Energy Corp., 3.3%, 6/15/2041 | 9,512,000 | 6,439,985 | ||
| Duke Energy Corp., 3.75%, 9/01/2046 | 21,247,000 | 14,600,876 | ||
| Enel Finance International N.V., 4.625%, 6/15/2027 (n) | 16,585,000 | 15,025,090 | ||
| Enel Finance International N.V., 5%, 6/15/2032 (n) | 5,776,000 | 4,829,082 | ||
| Evergy, Inc., 2.9%, 9/15/2029 | 28,950,000 | 23,908,001 | ||
| FirstEnergy Corp., 4.4%, 7/15/2027 | 14,231,000 | 13,364,474 | ||
| FirstEnergy Corp., 2.65%, 3/01/2030 | 12,338,000 | 9,974,286 | ||
| FirstEnergy Corp., 3.4%, 3/01/2050 | 29,978,000 | 18,623,832 | ||
| Florida Power & Light Co., 2.85%, 4/01/2025 | 8,281,000 | 7,861,034 | ||
| Florida Power & Light Co., 2.45%, 2/03/2032 | 16,909,000 | 13,610,308 | ||
| Florida Power & Light Co., 3.95%, 3/01/2048 | 8,281,000 | 6,408,201 | ||
| Georgia Power Co., 5.125%, 5/15/2052 | 13,035,000 | 11,662,968 | ||
| Jersey Central Power & Light Co., 2.75%, 3/01/2032 (n) | 26,559,000 | 20,666,088 | ||
| NextEra Energy Capital Holdings, Inc., 2.44%, 1/15/2032 | 2,720,000 | 2,098,635 | ||
| NextEra Energy Capital Holdings, Inc., 3.8% to 3/15/2027, FLR (CMT - 5yr. + 2.547%) to 3/15/2082 | 16,087,000 | 12,256,898 | ||
| Pacific Gas & Electric Co., 5.45%, 6/15/2027 | 9,661,000 | 9,109,563 | ||
| Pacific Gas & Electric Co., 2.5%, 2/01/2031 | 27,538,000 | 20,576,630 | ||
| Southern California Edison Co., 4.5%, 9/01/2040 | 7,827,000 | 6,220,392 | ||
| Southern California Edison Co., 3.65%, 2/01/2050 | 21,387,000 | 14,297,998 | ||
| Southern Co., 3.7%, 4/30/2030 | 23,946,000 | 20,897,523 | ||
| Virginia Electric & Power Co., 2.875%, 7/15/2029 | 11,354,000 | 9,750,331 | ||
| Xcel Energy, Inc., 4.6%, 6/01/2032 | 6,057,000 | 5,578,607 | ||
| $306,590,267 | ||||
| Total Bonds (Identified Cost, $4,655,301,368) | $3,745,635,070 | |||
| Issuer | Shares/Par | Value ($) | ||
| Investment Companies (h) – 3.4% | ||||
| Money Market Funds – 3.4% | ||||
| MFS Institutional Money Market Portfolio, 3.02% (v) (Identified Cost, $132,380,259) | 132,386,731 | $132,386,731 | ||
| Other Assets, Less Liabilities – 0.9% | 35,935,585 | |||
| Net Assets – 100.0% | $3,913,957,386 | |||
| (f) | All or a portion of the security has been segregated as collateral for open futures contracts. |
| (h) | An affiliated issuer, which may be considered one in which the fund owns 5% or more of the outstanding voting securities, or a company which is under common control. At period end, the aggregate values of the fund's investments in affiliated issuers and in unaffiliated issuers were $132,386,731 and $3,745,635,070, respectively. |
| (i) | Interest only security for which the fund receives interest on notional principal (Par amount). Par amount shown is the notional principal and does not reflect the cost of the security. |
| (n) | Securities exempt from registration under Rule 144A of the Securities Act of 1933. These securities may be sold in the ordinary course of business in transactions exempt from registration, normally to qualified institutional buyers. At period end, the aggregate value of these securities was $1,073,764,292, representing 27.4% of net assets. |
| (v) | Affiliated issuer that is available only to investment companies managed by MFS. The rate quoted for the MFS Institutional Money Market Portfolio is the annualized seven-day yield of the fund at period end. |
| (z) | Restricted securities are not registered under the Securities Act of 1933 and are subject to legal restrictions on resale. These securities generally may be resold in transactions exempt from registration or to the public if the securities are subsequently registered. Disposal of these securities may involve time-consuming negotiations and prompt sale at an acceptable price may be difficult. The fund holds the following restricted securities: |
| Restricted Securities | Acquisition Date | Cost | Value |
| ReadyCap Commercial Mortgage Trust, 2021-FL5, “A”, FLR, 4.586% (LIBOR - 1mo. + 1%), 4/25/2038 | 2/14/2022 | $10,280,967 | $9,813,908 |
| % of Net assets | 0.3% |
| The following abbreviations are used in this report and are defined: | |
| CLO | Collateralized Loan Obligation |
| CMT | Constant Maturity Treasury |
| FLR | Floating Rate. Interest rate resets periodically based on the parenthetically disclosed reference rate plus a spread (if any). The period-end rate reported may not be the current rate. All reference rates are USD unless otherwise noted. |
| LIBOR | London Interbank Offered Rate |
| REIT | Real Estate Investment Trust |
| SOFR | Secured Overnight Financing Rate |
| Abbreviations indicate amounts shown in currencies other than the U.S. dollar. All amounts are stated in U.S. dollars unless otherwise indicated. A list of abbreviations is shown below: | |
| EUR | Euro |
| Forward Foreign Currency Exchange Contracts | ||||||
| Currency Purchased | Currency Sold | Counterparty | Settlement Date | Unrealized Appreciation (Depreciation) | ||
| Liability Derivatives | ||||||
| USD | 11,165,856 | EUR | 11,339,003 | HSBC Bank | 1/20/2023 | $(116,393) |
| Futures Contracts | ||||||
| Description | Long/ Short | Currency | Contracts | Notional Amount | Expiration Date | Value/Unrealized Appreciation (Depreciation) |
| Asset Derivatives | ||||||
| Interest Rate Futures | ||||||
| U.S. Treasury Note 5 yr | Short | USD | 1,094 | $116,613,563 | December – 2022 | $5,067,310 |
| U.S. Treasury Ultra Note 10 yr | Short | USD | 5,534 | 641,857,531 | December – 2022 | 52,033,988 |
| $57,101,298 | ||||||
| Liability Derivatives | ||||||
| Interest Rate Futures | ||||||
| U.S. Treasury Note 2 yr | Long | USD | 2,484 | $507,686,905 | December – 2022 | $(10,556,970) |
| U.S. Treasury Ultra Bond | Long | USD | 1,375 | 175,527,344 | December – 2022 | (27,687,057) |
| $(38,244,027) | ||||||
| Assets | |
| Investments in unaffiliated issuers, at value (identified cost, $4,655,301,368) | $3,745,635,070 |
| Investments in affiliated issuers, at value (identified cost, $132,380,259) | 132,386,731 |
| Cash | 34,488 |
| Receivables for | |
| Net daily variation margin on open futures contracts | 795,144 |
| Investments sold | 2,030,636 |
| Fund shares sold | 4,989,655 |
| Interest and dividends | 38,013,919 |
| Other assets | 9,957 |
| Total assets | $3,923,895,600 |
| Liabilities | |
| Payables for | |
| Distributions | $578,769 |
| Forward foreign currency exchange contracts | 116,393 |
| Fund shares reacquired | 7,912,340 |
| Payable to affiliates | |
| Investment adviser | 158,845 |
| Administrative services fee | 6,471 |
| Shareholder servicing costs | 887,985 |
| Distribution and service fees | 52,518 |
| Payable for independent Trustees' compensation | 1,007 |
| Accrued expenses and other liabilities | 223,886 |
| Total liabilities | $9,938,214 |
| Net assets | $3,913,957,386 |
| Net assets consist of | |
| Paid-in capital | $5,014,252,620 |
| Total distributable earnings (loss) | (1,100,295,234) |
| Net assets | $3,913,957,386 |
| Shares of beneficial interest outstanding | 341,376,297 |
| Net assets | Shares outstanding | Net asset value per share (a) | |
| Class A | $1,632,621,333 | 142,299,927 | $11.47 |
| Class B | 4,635,352 | 404,807 | 11.45 |
| Class C | 47,205,519 | 4,127,535 | 11.44 |
| Class I | 780,932,325 | 68,145,569 | 11.46 |
| Class R1 | 3,548,508 | 310,001 | 11.45 |
| Class R2 | 17,351,546 | 1,512,014 | 11.48 |
| Class R3 | 24,663,659 | 2,148,589 | 11.48 |
| Class R4 | 54,563,953 | 4,754,287 | 11.48 |
| Class R6 | 1,348,435,191 | 117,673,568 | 11.46 |
| (a) | Maximum offering price per share was equal to the net asset value per share for all share classes, except for Class A, for which the maximum offering price per share was $11.98 [100 / 95.75 x $11.47]. On sales of $100,000 or more, the maximum offering price of Class A shares is reduced. A contingent deferred sales charge may be imposed on redemptions of Class A, Class B, and Class C shares. Redemption price per share was equal to the net asset value per share for Classes I, R1, R2, R3, R4, and R6. |
| Net investment income (loss) | |
| Income | |
| Interest | $84,303,425 |
| Other | 3,097,414 |
| Dividends from affiliated issuers | 1,297,503 |
| Total investment income | $88,698,342 |
| Expenses | |
| Management fee | $8,529,497 |
| Distribution and service fees | 2,745,427 |
| Shareholder servicing costs | 1,633,698 |
| Administrative services fee | 352,596 |
| Independent Trustees' compensation | 37,810 |
| Custodian fee | 114,631 |
| Shareholder communications | 190,961 |
| Audit and tax fees | 41,145 |
| Legal fees | 12,683 |
| Miscellaneous | 162,562 |
| Total expenses | $13,821,010 |
| Fees paid indirectly | (4,305) |
| Reduction of expenses by investment adviser and distributor | (314,899) |
| Net expenses | $13,501,806 |
| Net investment income (loss) | $75,196,536 |
| Realized and unrealized gain (loss) | |
| Realized gain (loss) (identified cost basis) | |
| Unaffiliated issuers | $(201,636,261) |
| Affiliated issuers | (11,465) |
| Futures contracts | 25,000,634 |
| Forward foreign currency exchange contracts | 862,614 |
| Foreign currency | 2,594 |
| Net realized gain (loss) | $(175,781,884) |
| Change in unrealized appreciation or depreciation | |
| Unaffiliated issuers | $(254,517,682) |
| Affiliated issuers | 4,453 |
| Futures contracts | (11,356,049) |
| Forward foreign currency exchange contracts | (116,393) |
| Translation of assets and liabilities in foreign currencies | (6,386) |
| Net unrealized gain (loss) | $(265,992,057) |
| Net realized and unrealized gain (loss) | $(441,773,941) |
| Change in net assets from operations | $(366,577,405) |
| Six months ended | Year ended | |
| 10/31/22 (unaudited) | 4/30/22 | |
| Change in net assets | ||
| From operations | ||
| Net investment income (loss) | $75,196,536 | $150,649,479 |
| Net realized gain (loss) | (175,781,884) | 109,200,748 |
| Net unrealized gain (loss) | (265,992,057) | (875,412,250) |
| Change in net assets from operations | $(366,577,405) | $(615,562,023) |
| Total distributions to shareholders | $(73,513,858) | $(339,039,916) |
| Change in net assets from fund share transactions | $(543,948,648) | $(278,898,348) |
| Total change in net assets | $(984,039,911) | $(1,233,500,287) |
| Net assets | ||
| At beginning of period | 4,897,997,297 | 6,131,497,584 |
| At end of period | $3,913,957,386 | $4,897,997,297 |
| Class A | Six months ended | Year ended | ||||
| 10/31/22 (unaudited) | 4/30/22 | 4/30/21 | 4/30/20 | 4/30/19 | 4/30/18 | |
| Net asset value, beginning of period | $12.71 | $15.09 | $14.88 | $13.93 | $13.52 | $13.92 |
| Income (loss) from investment operations | ||||||
| Net investment income (loss) (d) | $0.20 | $0.35 | $0.37 | $0.42 | $0.43 | $0.41 |
| Net realized and unrealized gain (loss) | (1.25) | (1.92) | 0.37 | 0.96 | 0.41 | (0.39) |
| Total from investment operations | $(1.05) | $(1.57) | $0.74 | $1.38 | $0.84 | $0.02 |
| Less distributions declared to shareholders | ||||||
| From net investment income | $(0.19) | $(0.36) | $(0.39) | $(0.43) | $(0.43) | $(0.42) |
| From net realized gain | — | (0.45) | (0.14) | — | — | — |
| Total distributions declared to shareholders | $(0.19) | $(0.81) | $(0.53) | $(0.43) | $(0.43) | $(0.42) |
| Net asset value, end of period (x) | $11.47 | $12.71 | $15.09 | $14.88 | $13.93 | $13.52 |
| Total return (%) (r)(s)(t)(x) | (8.30)(n) | (11.00) | 4.94 | 10.00 | 6.39 | 0.08 |
| Ratios (%) (to average net assets) and Supplemental data: | ||||||
| Expenses before expense reductions (f) | 0.78(a) | 0.76 | 0.77 | 0.79 | 0.79 | 0.80 |
| Expenses after expense reductions (f) | 0.77(a) | 0.75 | 0.75 | 0.77 | 0.78 | 0.79 |
| Net investment income (loss) | 3.22(a) | 2.38 | 2.42 | 2.91 | 3.16 | 2.95 |
| Portfolio turnover | 18(n) | 54 | 37 | 36 | 38 | 38 |
| Net assets at end of period (000 omitted) | $1,632,621 | $1,932,006 | $2,328,936 | $1,996,170 | $1,654,534 | $1,648,508 |
| Class B | Six months ended | Year ended | ||||
| 10/31/22 (unaudited) | 4/30/22 | 4/30/21 | 4/30/20 | 4/30/19 | 4/30/18 | |
| Net asset value, beginning of period | $12.68 | $15.06 | $14.85 | $13.90 | $13.50 | $13.89 |
| Income (loss) from investment operations | ||||||
| Net investment income (loss) (d) | $0.15 | $0.24 | $0.26 | $0.32 | $0.32 | $0.31 |
| Net realized and unrealized gain (loss) | (1.23) | (1.92) | 0.36 | 0.95 | 0.41 | (0.39) |
| Total from investment operations | $(1.08) | $(1.68) | $0.62 | $1.27 | $0.73 | $(0.08) |
| Less distributions declared to shareholders | ||||||
| From net investment income | $(0.15) | $(0.25) | $(0.27) | $(0.32) | $(0.33) | $(0.31) |
| From net realized gain | — | (0.45) | (0.14) | — | — | — |
| Total distributions declared to shareholders | $(0.15) | $(0.70) | $(0.41) | $(0.32) | $(0.33) | $(0.31) |
| Net asset value, end of period (x) | $11.45 | $12.68 | $15.06 | $14.85 | $13.90 | $13.50 |
| Total return (%) (r)(s)(t)(x) | (8.60)(n) | (11.70) | 4.17 | 9.20 | 5.53 | (0.60) |
| Ratios (%) (to average net assets) and Supplemental data: | ||||||
| Expenses before expense reductions (f) | 1.53(a) | 1.51 | 1.52 | 1.54 | 1.54 | 1.55 |
| Expenses after expense reductions (f) | 1.52(a) | 1.50 | 1.50 | 1.53 | 1.53 | 1.54 |
| Net investment income (loss) | 2.47(a) | 1.62 | 1.70 | 2.18 | 2.41 | 2.20 |
| Portfolio turnover | 18(n) | 54 | 37 | 36 | 38 | 38 |
| Net assets at end of period (000 omitted) | $4,635 | $6,283 | $10,838 | $21,384 | $33,983 | $47,698 |
| Class C | Six months ended | Year ended | ||||
| 10/31/22 (unaudited) | 4/30/22 | 4/30/21 | 4/30/20 | 4/30/19 | 4/30/18 | |
| Net asset value, beginning of period | $12.67 | $15.04 | $14.84 | $13.89 | $13.48 | $13.88 |
| Income (loss) from investment operations | ||||||
| Net investment income (loss) (d) | $0.15 | $0.24 | $0.26 | $0.31 | $0.32 | $0.31 |
| Net realized and unrealized gain (loss) | (1.23) | (1.91) | 0.35 | 0.96 | 0.42 | (0.40) |
| Total from investment operations | $(1.08) | $(1.67) | $0.61 | $1.27 | $0.74 | $(0.09) |
| Less distributions declared to shareholders | ||||||
| From net investment income | $(0.15) | $(0.25) | $(0.27) | $(0.32) | $(0.33) | $(0.31) |
| From net realized gain | — | (0.45) | (0.14) | — | — | — |
| Total distributions declared to shareholders | $(0.15) | $(0.70) | $(0.41) | $(0.32) | $(0.33) | $(0.31) |
| Net asset value, end of period (x) | $11.44 | $12.67 | $15.04 | $14.84 | $13.89 | $13.48 |
| Total return (%) (r)(s)(t)(x) | (8.61)(n) | (11.65) | 4.10 | 9.21 | 5.61 | (0.67) |
| Ratios (%) (to average net assets) and Supplemental data: | ||||||
| Expenses before expense reductions (f) | 1.53(a) | 1.51 | 1.51 | 1.54 | 1.54 | 1.55 |
| Expenses after expense reductions (f) | 1.52(a) | 1.50 | 1.50 | 1.53 | 1.53 | 1.54 |
| Net investment income (loss) | 2.47(a) | 1.62 | 1.68 | 2.16 | 2.41 | 2.20 |
| Portfolio turnover | 18(n) | 54 | 37 | 36 | 38 | 38 |
| Net assets at end of period (000 omitted) | $47,206 | $61,283 | $98,956 | $143,988 | $143,872 | $182,315 |
| Class I | Six months ended | Year ended | ||||
| 10/31/22 (unaudited) | 4/30/22 | 4/30/21 | 4/30/20 | 4/30/19 | 4/30/18 | |
| Net asset value, beginning of period | $12.69 | $15.07 | $14.87 | $13.92 | $13.51 | $13.91 |
| Income (loss) from investment operations | ||||||
| Net investment income (loss) (d) | $0.21 | $0.39 | $0.41 | $0.46 | $0.46 | $0.45 |
| Net realized and unrealized gain (loss) | (1.23) | (1.92) | 0.36 | 0.96 | 0.42 | (0.40) |
| Total from investment operations | $(1.02) | $(1.53) | $0.77 | $1.42 | $0.88 | $0.05 |
| Less distributions declared to shareholders | ||||||
| From net investment income | $(0.21) | $(0.40) | $(0.43) | $(0.47) | $(0.47) | $(0.45) |
| From net realized gain | — | (0.45) | (0.14) | — | — | — |
| Total distributions declared to shareholders | $(0.21) | $(0.85) | $(0.57) | $(0.47) | $(0.47) | $(0.45) |
| Net asset value, end of period (x) | $11.46 | $12.69 | $15.07 | $14.87 | $13.92 | $13.51 |
| Total return (%) (r)(s)(t)(x) | (8.12)(n) | (10.79) | 5.14 | 10.28 | 6.66 | 0.33 |
| Ratios (%) (to average net assets) and Supplemental data: | ||||||
| Expenses before expense reductions (f) | 0.53(a) | 0.51 | 0.52 | 0.53 | 0.54 | 0.55 |
| Expenses after expense reductions (f) | 0.51(a) | 0.50 | 0.50 | 0.52 | 0.53 | 0.54 |
| Net investment income (loss) | 3.46(a) | 2.62 | 2.66 | 3.15 | 3.40 | 3.19 |
| Portfolio turnover | 18(n) | 54 | 37 | 36 | 38 | 38 |
| Net assets at end of period (000 omitted) | $780,932 | $1,062,759 | $1,573,250 | $1,306,407 | $1,021,313 | $1,781,450 |
| Class R1 | Six months ended | Year ended | ||||
| 10/31/22 (unaudited) | 4/30/22 | 4/30/21 | 4/30/20 | 4/30/19 | 4/30/18 | |
| Net asset value, beginning of period | $12.68 | $15.05 | $14.85 | $13.90 | $13.49 | $13.89 |
| Income (loss) from investment operations | ||||||
| Net investment income (loss) (d) | $0.15 | $0.24 | $0.26 | $0.31 | $0.32 | $0.31 |
| Net realized and unrealized gain (loss) | (1.23) | (1.91) | 0.35 | 0.96 | 0.42 | (0.40) |
| Total from investment operations | $(1.08) | $(1.67) | $0.61 | $1.27 | $0.74 | $(0.09) |
| Less distributions declared to shareholders | ||||||
| From net investment income | $(0.15) | $(0.25) | $(0.27) | $(0.32) | $(0.33) | $(0.31) |
| From net realized gain | — | (0.45) | (0.14) | — | — | — |
| Total distributions declared to shareholders | $(0.15) | $(0.70) | $(0.41) | $(0.32) | $(0.33) | $(0.31) |
| Net asset value, end of period (x) | $11.45 | $12.68 | $15.05 | $14.85 | $13.90 | $13.49 |
| Total return (%) (r)(s)(t)(x) | (8.60)(n) | (11.64) | 4.10 | 9.20 | 5.60 | (0.67) |
| Ratios (%) (to average net assets) and Supplemental data: | ||||||
| Expenses before expense reductions (f) | 1.53(a) | 1.51 | 1.51 | 1.54 | 1.54 | 1.55 |
| Expenses after expense reductions (f) | 1.52(a) | 1.50 | 1.50 | 1.53 | 1.53 | 1.54 |
| Net investment income (loss) | 2.47(a) | 1.62 | 1.68 | 2.16 | 2.41 | 2.20 |
| Portfolio turnover | 18(n) | 54 | 37 | 36 | 38 | 38 |
| Net assets at end of period (000 omitted) | $3,549 | $3,922 | $5,391 | $5,970 | $6,187 | $6,101 |
| Class R2 | Six months ended | Year ended | ||||
| 10/31/22 (unaudited) | 4/30/22 | 4/30/21 | 4/30/20 | 4/30/19 | 4/30/18 | |
| Net asset value, beginning of period | $12.71 | $15.09 | $14.88 | $13.93 | $13.53 | $13.92 |
| Income (loss) from investment operations | ||||||
| Net investment income (loss) (d) | $0.18 | $0.31 | $0.34 | $0.39 | $0.39 | $0.38 |
| Net realized and unrealized gain (loss) | (1.23) | (1.91) | 0.36 | 0.95 | 0.41 | (0.39) |
| Total from investment operations | $(1.05) | $(1.60) | $0.70 | $1.34 | $0.80 | $(0.01) |
| Less distributions declared to shareholders | ||||||
| From net investment income | $(0.18) | $(0.33) | $(0.35) | $(0.39) | $(0.40) | $(0.38) |
| From net realized gain | — | (0.45) | (0.14) | — | — | — |
| Total distributions declared to shareholders | $(0.18) | $(0.78) | $(0.49) | $(0.39) | $(0.40) | $(0.38) |
| Net asset value, end of period (x) | $11.48 | $12.71 | $15.09 | $14.88 | $13.93 | $13.53 |
| Total return (%) (r)(s)(t)(x) | (8.34)(n) | (11.23) | 4.68 | 9.73 | 6.05 | (0.09) |
| Ratios (%) (to average net assets) and Supplemental data: | ||||||
| Expenses before expense reductions (f) | 1.03(a) | 1.01 | 1.02 | 1.04 | 1.04 | 1.05 |
| Expenses after expense reductions (f) | 1.01(a) | 1.00 | 1.00 | 1.03 | 1.03 | 1.04 |
| Net investment income (loss) | 2.97(a) | 2.12 | 2.18 | 2.67 | 2.91 | 2.70 |
| Portfolio turnover | 18(n) | 54 | 37 | 36 | 38 | 38 |
| Net assets at end of period (000 omitted) | $17,352 | $19,328 | $28,348 | $31,346 | $38,593 | $43,827 |
| Class R3 | Six months ended | Year ended | ||||
| 10/31/22 (unaudited) | 4/30/22 | 4/30/21 | 4/30/20 | 4/30/19 | 4/30/18 | |
| Net asset value, beginning of period | $12.71 | $15.09 | $14.88 | $13.93 | $13.52 | $13.92 |
| Income (loss) from investment operations | ||||||
| Net investment income (loss) (d) | $0.19 | $0.35 | $0.37 | $0.42 | $0.43 | $0.41 |
| Net realized and unrealized gain (loss) | (1.23) | (1.92) | 0.37 | 0.96 | 0.41 | (0.39) |
| Total from investment operations | $(1.04) | $(1.57) | $0.74 | $1.38 | $0.84 | $0.02 |
| Less distributions declared to shareholders | ||||||
| From net investment income | $(0.19) | $(0.36) | $(0.39) | $(0.43) | $(0.43) | $(0.42) |
| From net realized gain | — | (0.45) | (0.14) | — | — | — |
| Total distributions declared to shareholders | $(0.19) | $(0.81) | $(0.53) | $(0.43) | $(0.43) | $(0.42) |
| Net asset value, end of period (x) | $11.48 | $12.71 | $15.09 | $14.88 | $13.93 | $13.52 |
| Total return (%) (r)(s)(t)(x) | (8.22)(n) | (11.00) | 4.94 | 10.00 | 6.39 | 0.08 |
| Ratios (%) (to average net assets) and Supplemental data: | ||||||
| Expenses before expense reductions (f) | 0.78(a) | 0.76 | 0.77 | 0.79 | 0.79 | 0.81 |
| Expenses after expense reductions (f) | 0.76(a) | 0.75 | 0.75 | 0.78 | 0.78 | 0.80 |
| Net investment income (loss) | 3.06(a) | 2.38 | 2.43 | 2.91 | 3.16 | 2.95 |
| Portfolio turnover | 18(n) | 54 | 37 | 36 | 38 | 38 |
| Net assets at end of period (000 omitted) | $24,664 | $136,630 | $162,465 | $165,319 | $163,142 | $167,404 |
| Class R4 | Six months ended | Year ended | ||||
| 10/31/22 (unaudited) | 4/30/22 | 4/30/21 | 4/30/20 | 4/30/19 | 4/30/18 | |
| Net asset value, beginning of period | $12.71 | $15.09 | $14.89 | $13.93 | $13.53 | $13.93 |
| Income (loss) from investment operations | ||||||
| Net investment income (loss) (d) | $0.21 | $0.39 | $0.41 | $0.46 | $0.46 | $0.45 |
| Net realized and unrealized gain (loss) | (1.23) | (1.92) | 0.36 | 0.97 | 0.41 | (0.40) |
| Total from investment operations | $(1.02) | $(1.53) | $0.77 | $1.43 | $0.87 | $0.05 |
| Less distributions declared to shareholders | ||||||
| From net investment income | $(0.21) | $(0.40) | $(0.43) | $(0.47) | $(0.47) | $(0.45) |
| From net realized gain | — | (0.45) | (0.14) | — | — | — |
| Total distributions declared to shareholders | $(0.21) | $(0.85) | $(0.57) | $(0.47) | $(0.47) | $(0.45) |
| Net asset value, end of period (x) | $11.48 | $12.71 | $15.09 | $14.89 | $13.93 | $13.53 |
| Total return (%) (r)(s)(t)(x) | (8.11)(n) | (10.78) | 5.13 | 10.35 | 6.57 | 0.33 |
| Ratios (%) (to average net assets) and Supplemental data: | ||||||
| Expenses before expense reductions (f) | 0.53(a) | 0.51 | 0.52 | 0.53 | 0.54 | 0.55 |
| Expenses after expense reductions (f) | 0.52(a) | 0.50 | 0.50 | 0.52 | 0.53 | 0.54 |
| Net investment income (loss) | 3.48(a) | 2.63 | 2.67 | 3.17 | 3.41 | 3.19 |
| Portfolio turnover | 18(n) | 54 | 37 | 36 | 38 | 38 |
| Net assets at end of period (000 omitted) | $54,564 | $61,624 | $73,890 | $63,775 | $75,519 | $74,027 |
| Class R6 | Six months ended | Year ended | ||||
| 10/31/22 (unaudited) | 4/30/22 | 4/30/21 | 4/30/20 | 4/30/19 | 4/30/18 | |
| Net asset value, beginning of period | $12.69 | $15.07 | $14.87 | $13.92 | $13.51 | $13.91 |
| Income (loss) from investment operations | ||||||
| Net investment income (loss) (d) | $0.22 | $0.40 | $0.42 | $0.47 | $0.47 | $0.46 |
| Net realized and unrealized gain (loss) | (1.23) | (1.92) | 0.36 | 0.96 | 0.42 | (0.39) |
| Total from investment operations | $(1.01) | $(1.52) | $0.78 | $1.43 | $0.89 | $0.07 |
| Less distributions declared to shareholders | ||||||
| From net investment income | $(0.22) | $(0.41) | $(0.44) | $(0.48) | $(0.48) | $(0.47) |
| From net realized gain | — | (0.45) | (0.14) | — | — | — |
| Total distributions declared to shareholders | $(0.22) | $(0.86) | $(0.58) | $(0.48) | $(0.48) | $(0.47) |
| Net asset value, end of period (x) | $11.46 | $12.69 | $15.07 | $14.87 | $13.92 | $13.51 |
| Total return (%) (r)(s)(t)(x) | (8.08)(n) | (10.70) | 5.23 | 10.38 | 6.76 | 0.43 |
| Ratios (%) (to average net assets) and Supplemental data: | ||||||
| Expenses before expense reductions (f) | 0.43(a) | 0.41 | 0.42 | 0.44 | 0.44 | 0.45 |
| Expenses after expense reductions (f) | 0.42(a) | 0.40 | 0.41 | 0.43 | 0.43 | 0.44 |
| Net investment income (loss) | 3.57(a) | 2.73 | 2.76 | 3.25 | 3.51 | 3.27 |
| Portfolio turnover | 18(n) | 54 | 37 | 36 | 38 | 38 |
| Net assets at end of period (000 omitted) | $1,348,435 | $1,614,162 | $1,849,423 | $1,268,071 | $1,034,161 | $1,043,950 |
| (a) | Annualized. |
| (d) | Per share data is based on average shares outstanding. |
| (f) | Ratios do not reflect reductions from fees paid indirectly, if applicable. See Note 2 in the Notes to Financial Statements for additional information. |
| (n) | Not annualized. |
| (r) | Certain expenses have been reduced without which performance would have been lower. |
| (s) | From time to time the fund may receive proceeds from litigation settlements, without which performance would be lower. |
| (t) | Total returns do not include any applicable sales charges. |
| (x) | The net asset values and total returns have been calculated on net assets which include adjustments made in accordance with U.S. generally accepted accounting principles required at period end for financial reporting purposes. |
| Financial Instruments | Level 1 | Level 2 | Level 3 | Total |
| U.S. Treasury Bonds & U.S. Government Agencies & Equivalents | $— | $164,063,093 | $— | $164,063,093 |
| Non - U.S. Sovereign Debt | — | 82,379,833 | — | 82,379,833 |
| Municipal Bonds | — | 15,129,550 | — | 15,129,550 |
| U.S. Corporate Bonds | — | 2,392,857,372 | — | 2,392,857,372 |
| Commercial Mortgage-Backed Securities | — | 69,693,796 | — | 69,693,796 |
| Asset-Backed Securities (including CDOs) | — | 35,367,293 | — | 35,367,293 |
| Foreign Bonds | — | 986,144,133 | — | 986,144,133 |
| Mutual Funds | 132,386,731 | — | — | 132,386,731 |
| Total | $132,386,731 | $3,745,635,070 | $— | $3,878,021,801 |
| Other Financial Instruments | ||||
| Futures Contracts – Assets | $57,101,298 | $— | $— | $57,101,298 |
| Futures Contracts – Liabilities | (38,244,027) | — | — | (38,244,027) |
| Forward Foreign Currency Exchange Contracts – Liabilities | — | (116,393) | — | (116,393) |
| Fair Value (a) | |||
| Risk | Derivative Contracts | Asset Derivatives | Liability Derivatives |
| Interest Rate | Futures Contracts | $57,101,298 | $(38,244,027) |
| Foreign Exchange | Forward Foreign Currency Exchange Contracts | — | (116,393) |
| Total | $57,101,298 | $(38,360,420) | |
| (a) | Values presented in this table for futures contracts correspond to the values reported in the Portfolio of Investments. Only the current day net variation margin for futures contracts is reported separately within the Statement of Assets and Liabilities. |
| Risk | Futures Contracts | Forward Foreign Currency Exchange Contracts |
| Interest Rate | $25,000,634 | $— |
| Foreign Exchange | — | 862,614 |
| Total | $25,000,634 | $862,614 |
| Risk | Futures Contracts | Forward Foreign Currency Exchange Contracts |
| Interest Rate | $(11,356,049) | $— |
| Foreign Exchange | — | (116,393) |
| Total | $(11,356,049) | $(116,393) |
| Year ended 4/30/22 | |
| Ordinary income (including any short-term capital gains) | $166,620,827 |
| Long-term capital gains | 172,419,089 |
| Total distributions | $339,039,916 |
| As of 10/31/22 | |
| Cost of investments | $4,793,636,407 |
| Gross appreciation | 645,974 |
| Gross depreciation | (916,260,580) |
| Net unrealized appreciation (depreciation) | $(915,614,606) |
| As of 4/30/22 | |
| Undistributed ordinary income | 12,994,613 |
| Undistributed long-term capital gain | 3,697,711 |
| Other temporary differences | (12,393,813) |
| Net unrealized appreciation (depreciation) | (664,502,482) |
| Six months ended 10/31/22 | Year ended 4/30/22 | ||
| Class A | $28,347,185 | $126,385,238 | |
| Class B | 65,808 | 416,740 | |
| Class C | 655,136 | 3,950,172 | |
| Class I | 15,494,657 | 82,541,639 | |
| Class R1 | 44,911 | 235,645 | |
| Class R2 | 266,829 | 1,278,079 | |
| Class R3 | 1,480,145 | 8,681,121 | |
| Class R4 | 1,007,997 | 4,117,594 | |
| Class R6 | 26,151,190 | 111,433,688 | |
| Total | $73,513,858 | $339,039,916 |
| Up to $1.1 billion | 0.39% |
| In excess of $1.1 billion and up to $5 billion | 0.38% |
| In excess of $5 billion and up to $10 billion | 0.35% |
| In excess of $10 billion | 0.34% |
| Distribution Fee Rate (d) | Service Fee Rate (d) | Total Distribution Plan (d) | Annual Effective Rate (e) | Distribution and Service Fee | |
| Class A | — | 0.25% | 0.25% | 0.25% | $ 2,257,139 |
| Class B | 0.75% | 0.25% | 1.00% | 1.00% | 27,639 |
| Class C | 0.75% | 0.25% | 1.00% | 1.00% | 274,919 |
| Class R1 | 0.75% | 0.25% | 1.00% | 1.00% | 18,810 |
| Class R2 | 0.25% | 0.25% | 0.50% | 0.50% | 46,175 |
| Class R3 | — | 0.25% | 0.25% | 0.25% | 120,745 |
| Total Distribution and Service Fees | $2,745,427 |
| (d) | In accordance with the distribution plan for certain classes, the fund pays distribution and/or service fees equal to these annual percentage rates of each class’s average daily net assets. The distribution and service fee rates disclosed by class represent the current rates in effect at the end of the reporting period. Any rate changes, if applicable, are detailed below. |
| (e) | The annual effective rates represent actual fees incurred under the distribution plan for the six months ended October 31, 2022 based on each class's average daily net assets. MFD has voluntarily agreed to rebate a portion of each class's 0.25% service fee attributable to accounts for which there is no financial intermediary specified on the account except for accounts attributable to MFS or its affiliates' seed money. For the six months ended October 31, 2022, this rebate amounted to $1,018, $2, $34, and $8 for Class A, Class B, Class R2, and Class R3 shares, respectively, and is included in the reduction of total expenses in the Statement of Operations. |
| Amount | |
| Class A | $30,874 |
| Class B | 1,387 |
| Class C | 1,036 |
| Purchases | Sales | |
| U.S. Government securities | $184,163,693 | $94,804,865 |
| Non-U.S. Government securities | 597,830,733 | 1,226,778,956 |
| Six months ended 10/31/22 | Year ended 4/30/22 | ||||
| Shares | Amount | Shares | Amount | ||
| Shares sold | |||||
| Class A | 6,673,904 | $81,710,554 | 19,450,238 | $288,203,776 | |
| Class B | 5,404 | 67,842 | 30,153 | 444,887 | |
| Class C | 115,272 | 1,408,894 | 399,801 | 5,972,613 | |
| Class I | 16,300,430 | 199,686,069 | 27,868,802 | 407,922,300 | |
| Class R1 | 27,801 | 338,914 | 51,535 | 748,990 | |
| Class R2 | 118,132 | 1,434,278 | 546,591 | 7,810,031 | |
| Class R3 | 573,125 | 7,086,420 | 2,543,818 | 36,620,537 | |
| Class R4 | 297,095 | 3,648,170 | 544,576 | 7,943,614 | |
| Class R6 | 8,239,532 | 100,864,714 | 29,742,834 | 440,475,771 | |
| 32,350,695 | $396,245,855 | 81,178,348 | $1,196,142,519 | ||
| Shares issued to shareholders in reinvestment of distributions | |||||
| Class A | 2,266,464 | $27,521,264 | 8,350,574 | $122,755,623 | |
| Class B | 4,882 | 59,225 | 25,872 | 380,512 | |
| Class C | 51,974 | 629,477 | 258,413 | 3,794,079 | |
| Class I | 1,098,555 | 13,345,327 | 4,880,255 | 71,737,553 | |
| Class R1 | 3,707 | 44,871 | 16,021 | 235,240 | |
| Class R2 | 21,837 | 265,133 | 86,207 | 1,268,572 | |
| Class R3 | 98,783 | 1,226,068 | 590,411 | 8,678,164 | |
| Class R4 | 82,891 | 1,006,772 | 279,811 | 4,112,813 | |
| Class R6 | 2,104,886 | 25,536,824 | 7,419,484 | 108,869,031 | |
| 5,733,979 | $69,634,961 | 21,907,048 | $321,831,587 | ||
| Shares reacquired | |||||
| Class A | (18,698,454) | $(229,189,014) | (30,104,898) | $(436,989,298) | |
| Class B | (100,932) | (1,227,280) | (280,348) | (4,116,795) | |
| Class C | (878,471) | (10,683,311) | (2,399,131) | (35,158,167) | |
| Class I | (32,990,945) | (402,303,600) | (53,391,234) | (773,095,409) | |
| Class R1 | (30,919) | (381,401) | (116,305) | (1,675,800) | |
| Class R2 | (148,827) | (1,836,030) | (990,560) | (14,330,213) | |
| Class R3 | (9,276,495) | (115,383,733) | (3,149,056) | (45,605,154) | |
| Class R4 | (474,263) | (5,807,731) | (871,609) | (12,688,090) | |
| Class R6 | (19,865,900) | (243,017,364) | (32,679,983) | (473,213,528) | |
| (82,465,206) | $(1,009,829,464) | (123,983,124) | $(1,796,872,454) | ||
| Six months ended 10/31/22 | Year ended 4/30/22 | ||||
| Shares | Amount | Shares | Amount | ||
| Net change | |||||
| Class A | (9,758,086) | $(119,957,196) | (2,304,086) | $(26,029,899) | |
| Class B | (90,646) | (1,100,213) | (224,323) | (3,291,396) | |
| Class C | (711,225) | (8,644,940) | (1,740,917) | (25,391,475) | |
| Class I | (15,591,960) | (189,272,204) | (20,642,177) | (293,435,556) | |
| Class R1 | 589 | 2,384 | (48,749) | (691,570) | |
| Class R2 | (8,858) | (136,619) | (357,762) | (5,251,610) | |
| Class R3 | (8,604,587) | (107,071,245) | (14,827) | (306,453) | |
| Class R4 | (94,277) | (1,152,789) | (47,222) | (631,663) | |
| Class R6 | (9,521,482) | (116,615,826) | 4,482,335 | 76,131,274 | |
| (44,380,532) | $(543,948,648) | (20,897,728) | $(278,898,348) | ||
| Affiliated Issuers | Beginning Value | Purchases | Sales Proceeds | Realized Gain (Loss) | Change in Unrealized Appreciation or Depreciation | Ending Value |
| MFS Institutional Money Market Portfolio | $107,526,013 | $788,788,575 | $763,920,845 | $(11,465) | $4,453 | $132,386,731 |
| Affiliated Issuers | Dividend Income | Capital Gain Distributions |
| MFS Institutional Money Market Portfolio | $1,297,503 | $— |


| 1 | |
| 2 | |
| 4 | |
| 6 | |
| 26 | |
| 28 | |
| 29 | |
| 30 | |
| 36 | |
| 52 | |
| 56 | |
| 56 | |
| 56 | |
| 56 | |
| 56 |
| back cover |


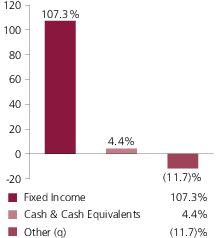
| Investment Grade Corporates | 49.5% |
| U.S. Treasury Securities | 21.9% |
| Collateralized Debt Obligations | 10.9% |
| Non-U.S. Government Bonds | 10.3% |
| Commercial Mortgage-Backed Securities | 6.1% |
| Asset-Backed Securities | 3.5% |
| Emerging Markets Bonds | 2.2% |
| Municipal Bonds | 1.2% |
| High Yield Corporates | 1.1% |
| Mortgage-Backed Securities | 0.4% |
| Residential Mortgage-Backed Securities | 0.2% |
| AAA | 8.3% |
| AA | 10.8% |
| A | 23.3% |
| BBB | 30.8% |
| BB | 1.3% |
| B (o) | 0.0% |
| CC | 0.1% |
| C (o) | 0.0% |
| U.S. Government | 20.5% |
| Federal Agencies | 0.5% |
| Not Rated | 11.7% |
| Cash & Cash Equivalents | 4.4% |
| Other (q) | (11.7)% |
| Average Duration (d) | 1.9 |
| Average Effective Maturity (m) | 2.3 yrs. |
| (a) | For all securities other than those specifically described below, ratings are assigned to underlying securities utilizing ratings from Moody’s, Fitch, and Standard & Poor’s rating agencies and applying the following hierarchy: If all three agencies provide a rating, the middle rating (after dropping the highest and lowest ratings) is assigned; if two of the three agencies rate a security, the lower of the two is assigned. If none of the 3 rating agencies above assign a rating, but the security is rated by DBRS Morningstar, then the DBRS Morningstar rating is assigned. If none of the 4 rating agencies listed above rate the security, but the security is rated by the Kroll Bond Rating Agency (KBRA), then the KBRA rating is assigned. Ratings are shown in the S&P and Fitch scale (e.g., AAA). Securities rated BBB or higher are considered investment grade. All ratings are subject to change. U.S. Government includes securities issued by the U.S. Department of the Treasury. Federal Agencies includes rated and unrated U.S. Agency fixed-income securities, U.S. Agency mortgage-backed securities, and collateralized mortgage obligations of U.S. Agency mortgage-backed securities. |
| (d) | Duration is a measure of how much a bond’s price is likely to fluctuate with general changes in interest rates, e.g., if rates rise 1.00%, a bond with a 5-year duration is likely to lose about 5.00% of its value due to the interest rate move. The Average Duration calculation reflects the impact of the equivalent exposure of derivative positions, if any. |
| (i) | For purposes of this presentation, the components include the value of securities, and reflect the impact of the equivalent exposure of derivative positions, if any. These amounts may be negative from time to time. Equivalent exposure is a calculated amount that translates the derivative position into a reasonable approximation of the amount of the underlying asset that the portfolio would have to hold at a given point in time to have the same price sensitivity that results from the portfolio’s ownership of the derivative contract. When dealing with derivatives, equivalent exposure is a more representative measure of the potential impact of a position on portfolio performance than value. The bond component will include any accrued interest amounts. |
| (m) | In determining each instrument’s effective maturity for purposes of calculating the fund’s dollar-weighted average effective maturity, MFS uses the instrument’s stated maturity or, if applicable, an earlier date on which MFS believes it is probable that a maturity-shortening device (such as a put, pre-refunding or prepayment) will cause the instrument to be repaid. Such an earlier date can be substantially shorter than the instrument’s stated maturity. |
| (o) | Less than 0.1%. |
| (q) | For purposes of this presentation, Other includes equivalent exposure from currency derivatives and/or any offsets to derivative positions and may be negative. |
| (v) | For purposes of this presentation, market value of fixed income and/or equity derivatives, if any, is included in Cash & Cash Equivalents. |
May 1, 2022 through October 31, 2022
| Share Class | Annualized Expense Ratio | Beginning Account Value 5/01/22 | Ending Account Value 10/31/22 | Expenses Paid During Period (p) 5/01/22-10/31/22 | |
| A | Actual | 0.57% | $1,000.00 | $974.74 | $2.84 |
| Hypothetical (h) | 0.57% | $1,000.00 | $1,022.33 | $2.91 | |
| B | Actual | 1.32% | $1,000.00 | $971.02 | $6.56 |
| Hypothetical (h) | 1.32% | $1,000.00 | $1,018.55 | $6.72 | |
| C | Actual | 1.42% | $1,000.00 | $970.60 | $7.05 |
| Hypothetical (h) | 1.42% | $1,000.00 | $1,018.05 | $7.22 | |
| I | Actual | 0.42% | $1,000.00 | $977.06 | $2.09 |
| Hypothetical (h) | 0.42% | $1,000.00 | $1,023.09 | $2.14 | |
| R1 | Actual | 1.42% | $1,000.00 | $970.47 | $7.05 |
| Hypothetical (h) | 1.42% | $1,000.00 | $1,018.05 | $7.22 | |
| R2 | Actual | 0.82% | $1,000.00 | $975.26 | $4.08 |
| Hypothetical (h) | 0.82% | $1,000.00 | $1,021.07 | $4.18 | |
| R3 | Actual | 0.67% | $1,000.00 | $976.00 | $3.34 |
| Hypothetical (h) | 0.67% | $1,000.00 | $1,021.83 | $3.41 | |
| R4 | Actual | 0.42% | $1,000.00 | $975.60 | $2.09 |
| Hypothetical (h) | 0.42% | $1,000.00 | $1,023.09 | $2.14 | |
| R6 | Actual | 0.35% | $1,000.00 | $975.78 | $1.74 |
| Hypothetical (h) | 0.35% | $1,000.00 | $1,023.44 | $1.79 |
| (h) | 5% class return per year before expenses. |
| (p) | “Expenses Paid During Period” are equal to each class’s annualized expense ratio, as shown above, multiplied by the average account value over the period, multiplied by 184/365 (to reflect the one-half year period). Expenses paid do not include any applicable sales charges (loads). If these transaction costs had been included, your costs would have been higher. |
| Issuer | Shares/Par | Value ($) | ||
| Bonds – 95.0% | ||||
| Aerospace & Defense – 0.9% | ||||
| Boeing Co., 1.167%, 2/04/2023 | $ | 6,459,000 | $6,395,345 | |
| Boeing Co., 1.433%, 2/04/2024 | 13,868,000 | 13,162,192 | ||
| Huntington Ingalls Industries, Inc., 3.844%, 5/01/2025 | 6,464,000 | 6,154,177 | ||
| Raytheon Technologies Corp., 3.65%, 8/16/2023 | 362,000 | 358,203 | ||
| $26,069,917 | ||||
| Asset-Backed & Securitized – 20.5% | ||||
| 3650R Commercial Mortgage Trust, 2021-PF1, “XA”, 1.031%, 11/15/2054 (i) | $ | 91,153,227 | $5,436,378 | |
| ACREC 2021-FL1 Ltd., “AS”, FLR, 4.943% (LIBOR - 1mo. + 1.5%), 10/16/2036 (n) | 5,944,500 | 5,612,012 | ||
| ACREC 2021-FL1 Ltd., “B”, FLR, 5.243% (LIBOR - 1mo. + 1.8%), 10/16/2036 (n) | 11,776,000 | 11,123,392 | ||
| ACREC 2021-FL1 Ltd., “C”, FLR, 5.593% (LIBOR - 1mo. + 2.15%), 10/16/2036 (n) | 5,972,500 | 5,589,485 | ||
| ACRES 2021-FL2 Issuer Ltd., “B”, FLR, 5.662% (LIBOR - 1mo. + 2.25%), 1/15/2037 (n) | 6,994,000 | 6,609,915 | ||
| Allegro CLO Ltd., 2014-1RA, “A2”, FLR, 5.877% (LIBOR - 3mo. + 1.6%), 10/21/2028 (n) | 776,747 | 752,020 | ||
| AmeriCredit Automobile Receivables Trust, 2020-1, “C”, 1.59%, 10/20/2025 | 2,663,000 | 2,545,611 | ||
| AmeriCredit Automobile Receivables Trust, 2022-2, “A2A”, 4.2%, 12/18/2025 | 9,300,000 | 9,224,060 | ||
| Arbor Realty Trust, Inc., CLO, 2021-FL1, “B”, FLR, 4.912% (LIBOR - 1mo. + 1.5%), 12/15/2035 (n) | 1,833,000 | 1,690,537 | ||
| Arbor Realty Trust, Inc., CLO, 2021-FL1, “C”, FLR, 5.412% (LIBOR - 1mo. + 2%), 12/15/2035 (n) | 752,000 | 705,049 | ||
| Arbor Realty Trust, Inc., CLO, 2021-FL3, “B”, FLR, 5.012% (LIBOR - 1mo. + 1.6%), 8/15/2034 (n) | 3,008,500 | 2,749,697 | ||
| Arbor Realty Trust, Inc., CLO, 2021-FL3, “C”, FLR, 5.262% (LIBOR - 1mo. + 1.85%), 8/15/2034 (n) | 1,746,500 | 1,619,968 | ||
| Arbor Realty Trust, Inc., CLO, 2021-FL4, “AS”, FLR, 5.112% (LIBOR - 1mo. + 1.7%), 11/15/2036 (n) | 11,713,500 | 11,058,110 | ||
| Arbor Realty Trust, Inc., CLO, 2021-FL4, “B”, FLR, 5.412% (LIBOR - 1mo. + 2%), 11/15/2036 (n) | 7,713,500 | 7,239,553 | ||
| Arbor Realty Trust, Inc., CLO, 2021-FL4, “C”, FLR, 5.712% (LIBOR - 1mo. + 2.3%), 11/15/2036 (n) | 4,645,000 | 4,338,034 | ||
| Arbor Realty Trust, Inc., CLO, 2022-FL1, “C”, FLR, 5.091% (SOFR - 30 day + 2.3%), 1/15/2037 (n) | 12,447,500 | 11,951,429 | ||
| Issuer | Shares/Par | Value ($) | ||
| Bonds – continued | ||||
| Asset-Backed & Securitized – continued | ||||
| AREIT 2019-CRE3 Trust, “A”, FLR, 4.76% (LIBOR - 1mo. + 1.02%), 9/14/2036 (n) | $ | 1,277,093 | $1,261,034 | |
| AREIT 2019-CRE3 Trust, “AS”, FLR, 4.79% (LIBOR - 1mo. + 1.3%), 9/14/2036 (n) | 2,301,000 | 2,269,159 | ||
| AREIT 2019-CRE3 Trust, “B”, FLR, 5.04% (LIBOR - 1mo. + 1.55%), 9/14/2036 (n) | 1,136,500 | 1,113,789 | ||
| AREIT 2019-CRE3 Trust, “C”, FLR, 5.39% (SOFR - 1mo. + 2.014%), 9/14/2036 (n) | 940,000 | 923,135 | ||
| AREIT 2022-CRE6 Trust, “C”, FLR, 5.043% (SOFR - 30 day + 2.15%), 1/16/2037 (n) | 4,174,000 | 3,862,674 | ||
| AREIT 2022-CRE6 Trust, “D”, FLR, 5.743% (SOFR - 30 day + 2.85%), 12/17/2024 (n) | 2,549,000 | 2,343,785 | ||
| AREIT 2022-CRE7 LLC, “B”, FLR, 6.659% (SOFR - 1mo. + 3.244%), 6/17/2039 (n) | 12,436,500 | 11,816,429 | ||
| ARI Fleet Lease Trust, 2020-A, “A3”, 1.8%, 8/15/2028 (n) | 1,498,888 | 1,493,079 | ||
| Avery Point CLO Ltd., 2014-1A, “CR”, FLR, 6.708% (LIBOR - 3mo. + 2.35%), 4/25/2026 (n) | 19,155 | 19,064 | ||
| Balboa Bay Loan Funding Ltd., 2020-1A, “BR”, FLR, 5.893% (LIBOR - 3mo. + 1.65%), 1/20/2032 (n) | 7,353,970 | 6,867,931 | ||
| Balboa Bay Loan Funding Ltd., 2020-1A, “CR”, FLR, 6.342% (LIBOR - 3mo. + 2.1%), 1/20/2032 (n) | 3,983,401 | 3,585,690 | ||
| Ballyrock CLO 2018-1A Ltd., “A2”, FLR, 5.843% (LIBOR - 3mo. + 1.6%), 4/20/2031 (n) | 4,282,847 | 4,074,709 | ||
| Ballyrock CLO 2018-1A Ltd., “B”, FLR, 6.142% (LIBOR - 3mo. + 1.9%), 4/20/2031 (n) | 1,814,958 | 1,675,024 | ||
| Bayview Commercial Asset Trust, FLR, 4.051% (LIBOR - 1mo. + 0.31%), 8/25/2035 (n) | 212,500 | 193,201 | ||
| Bayview Financial Revolving Mortgage Loan Trust, FLR, 5.232% (LIBOR - 1mo. + 1.6%), 12/28/2040 (n) | 161,967 | 194,415 | ||
| BBCMS Mortgage Trust, 2018-C2, “XA”, 0.759%, 12/15/2051 (i)(n) | 63,214,043 | 2,201,985 | ||
| BBCMS Mortgage Trust, 2021-C10, “XA”, 1.299%, 7/15/2054 (i) | 36,371,424 | 2,659,148 | ||
| BBCMS Mortgage Trust, 2021-C11, “XA”, 1.385%, 9/15/2054 (i) | 39,340,872 | 3,040,979 | ||
| BBCMS Mortgage Trust, 2021-C9, “XA”, 1.628%, 2/15/2054 (i) | 55,163,684 | 5,042,562 | ||
| BDS 2021-FL10 Ltd., “B”, FLR, 5.393% (LIBOR - 1mo. + 1.95%), 12/16/2036 (n) | 3,637,500 | 3,406,180 | ||
| BDS 2021-FL10 Ltd., “C”, FLR, 5.743% (LIBOR - 1mo. + 2.3%), 12/16/2036 (n) | 2,645,500 | 2,453,714 | ||
| Benchmark 2021-B23 Mortgage Trust, “XA”, 1.272%, 2/15/2054 (i) | 60,416,235 | 4,122,580 | ||
| Benchmark 2021-B24 Mortgage Trust, “XA”, 1.152%, 3/15/2054 (i) | 38,487,063 | 2,390,216 | ||
| Issuer | Shares/Par | Value ($) | ||
| Bonds – continued | ||||
| Asset-Backed & Securitized – continued | ||||
| Benchmark 2021-B27 Mortgage Trust, “XA”, 1.267%, 7/15/2054 (i) | $ | 71,471,206 | $5,089,129 | |
| Benchmark 2021-B28 Mortgage Trust, “XA”, 1.284%, 8/15/2054 (i) | 53,562,365 | 3,819,912 | ||
| Benchmark 2021-B29 Mortgage Trust, “XA”, 1.043%, 9/15/2054 (i) | 78,446,356 | 4,415,008 | ||
| BSPDF 2021-FL1 Issuer Ltd., “AS”, FLR, 4.892% (LIBOR - 1mo. + 1.48%), 10/15/2036 (n) | 4,140,000 | 3,997,596 | ||
| BSPDF 2021-FL1 Issuer Ltd., “B”, FLR, 5.212% (LIBOR - 1mo. + 1.8%), 10/15/2036 (n) | 3,130,500 | 2,929,387 | ||
| BSPDF 2021-FL1 Issuer Ltd., “C”, FLR, 5.662% (LIBOR - 1mo. + 2.25%), 10/15/2036 (n) | 8,000,000 | 7,502,256 | ||
| BSPRT 2019-FL5 Issuer Ltd., “C”, FLR, 5.412% (LIBOR - 1mo. + 2%), 5/15/2029 (n) | 3,000,000 | 2,921,676 | ||
| BSPRT 2021-FL6 Issuer Ltd., “C”, FLR, 5.462% (LIBOR - 1mo. + 2.05%), 3/15/2036 (n) | 2,447,500 | 2,254,965 | ||
| BSPRT 2021-FL7 Issuer Ltd., “B”, FLR, 5.462% (LIBOR - 1mo. + 2.05%), 12/15/2038 (n) | 1,552,000 | 1,435,760 | ||
| BSPRT 2021-FL7 Issuer Ltd., “C”, FLR, 5.712% (LIBOR - 1mo. + 2.3%), 12/15/2038 (n) | 1,869,500 | 1,714,049 | ||
| BSPRT 2022-FL8 Issuer Ltd., “A”, FLR, 4.291% (SOFR - 30 day + 1.5%), 2/15/2037 (n) | 14,846,500 | 14,219,599 | ||
| BSPRT 2022-FL8 Issuer Ltd., “B”, FLR, 4.841% (SOFR - 30 day + 2.05%), 2/15/2037 (n) | 2,054,500 | 1,966,992 | ||
| BSPRT 2022-FL8 Issuer Ltd., “C”, FLR, 5.091% (SOFR - 30 day + 2.3%), 2/15/2037 (n) | 3,317,000 | 3,167,075 | ||
| Business Jet Securities LLC, 2020-1A, “A”, 2.981%, 11/15/2035 (n) | 1,174,214 | 1,071,079 | ||
| Business Jet Securities LLC, 2021-1A, “A”, 2.162%, 4/15/2036 (n) | 1,754,959 | 1,519,942 | ||
| Business Jet Securities LLC, 2021-1A, “B”, 2.918%, 4/15/2036 (n) | 327,930 | 265,269 | ||
| BXMT 2020-FL2 Ltd., “B”, FLR, 4.89% (LIBOR - 1mo. + 1.4%), 2/15/2038 (n) | 5,795,500 | 5,427,544 | ||
| BXMT 2020-FL2 Ltd., “A”, FLR, 4.39% (LIBOR - 1mo. + 0.9%), 2/15/2038 (n) | 7,198,439 | 7,105,946 | ||
| BXMT 2021-FL4 Ltd., “AS”, FLR, 4.712% (LIBOR - 1mo. + 1.3%), 5/15/2038 (n) | 12,062,500 | 11,470,630 | ||
| Capital Automotive, 2020-1A, “A4”, REIT, 3.19%, 2/15/2050 (n) | 2,195,286 | 2,039,105 | ||
| C-BASS Mortgage Loan Trust, 2007-CB1, “AF3”, 3.105%, 1/25/2037 (d)(q) | 1,691,956 | 569,004 | ||
| C-BASS Mortgage Loan Trust, 2007-CB3, “A3”, 3.25%, 3/25/2037 (d)(q) | 2,269,564 | 865,743 | ||
| Issuer | Shares/Par | Value ($) | ||
| Bonds – continued | ||||
| Asset-Backed & Securitized – continued | ||||
| CD 2017-CD4 Mortgage Trust, “XA”, 1.226%, 5/10/2050 (i) | $ | 35,505,969 | $1,448,885 | |
| CF Hippolyta Issuer LLC, 2020-1, “A1”, 1.69%, 7/15/2060 (n) | 1,594,624 | 1,401,866 | ||
| CF Hippolyta Issuer LLC, 2020-1, “B1”, 2.28%, 7/15/2060 (n) | 508,177 | 436,031 | ||
| Commercial Equipment Finance 2021-A, LLC, “A”, 2.05%, 2/16/2027 (n) | 3,481,042 | 3,344,634 | ||
| Commercial Mortgage Pass-Through Certificates, 2019-BN24, “XA”, 0.64%, 11/15/2062 (i) | 34,694,934 | 1,228,211 | ||
| Commercial Mortgage Pass-Through Certificates, 2021-BN31, “XA”, 1.327%, 2/15/2054 (i) | 52,963,306 | 4,017,452 | ||
| Commercial Mortgage Pass-Through Certificates, 2021-BN32, “XA”, 0.78%, 4/15/2054 (i) | 48,888,020 | 2,145,304 | ||
| Commercial Mortgage Pass-Through Certificates, 2021-BN34, “XA”, 0.977%, 6/15/2063 (i) | 55,887,542 | 3,157,870 | ||
| Commercial Mortgage Pass-Through Certificates, 2021-BN35, “XA��, 1.048%, 6/15/2064 (i) | 31,969,788 | 1,902,225 | ||
| Credit Acceptance Auto Loan Trust, 2021-4, “B”, 1.74%, 12/16/2030 (n) | 3,258,000 | 2,945,630 | ||
| Credit Acceptance Auto Loan Trust, 2021-2A, “A”, 0.96%, 2/15/2030 (n) | 2,192,000 | 2,082,612 | ||
| Credit Acceptance Auto Loan Trust, 2021-2A, “B”, 1.26%, 4/15/2030 (n) | 1,037,000 | 935,295 | ||
| Credit Acceptance Auto Loan Trust, 2021-3A, “B”, 1.38%, 7/15/2030 (n) | 1,499,000 | 1,348,806 | ||
| Credit Acceptance Auto Loan Trust, 2021-3A, “C”, 1.63%, 9/16/2030 (n) | 916,000 | 808,555 | ||
| Credit Acceptance Auto Loan Trust, 2021-4, “A”, 1.26%, 10/15/2030 (n) | 1,778,000 | 1,655,498 | ||
| Cutwater 2015-1A Ltd., “AR”, FLR, 5.299% (LIBOR - 3mo. + 1.22%), 1/15/2029 (n) | 2,496,742 | 2,470,998 | ||
| Dryden Senior Loan Fund, 2017-49A, “BR”, CLO, FLR, 5.793% (LIBOR - 3mo. + 1.6%), 7/18/2030 (n) | 9,054,010 | 8,593,324 | ||
| DT Auto Owner Trust 2022-3A, “A”, 6.05%, 10/15/2026 (n)(w) | 9,500,000 | 9,497,194 | ||
| DT Auto Owner Trust 2022-3A, “B”, 6.74%, 7/17/2028 (n)(w) | 5,250,000 | 5,244,742 | ||
| DT Auto Owner Trust 2022-3A, “C”, 7.69%, 7/17/2028 (n)(w) | 2,000,000 | 1,997,687 | ||
| Exeter Automobile Receivables Trust, 2020-1A, 2.49%, 1/15/2025 (n) | 273,350 | 273,059 | ||
| Fortress CBO Investments Ltd., 2022-FL3, “A”, FLR, 4.821% (SOFR - 30 day + 1.85%), 2/23/2039 (n) | 8,935,000 | 8,718,773 | ||
| Fortress CBO Investments Ltd., 2022-FL3, “AS”, FLR, 5.221% (SOFR - 30 day + 2.25%), 2/23/2039 (n) | 8,299,000 | 7,909,760 | ||
| GLS Auto Receivables Trust, 2021-3A, “B”, 0.78%, 11/17/2025 (n) | 4,655,544 | 4,485,809 | ||
| Issuer | Shares/Par | Value ($) | ||
| Bonds – continued | ||||
| Asset-Backed & Securitized – continued | ||||
| GS Mortgage Securities Trust, 2017-GS6, “XA”, 1.163%, 5/10/2050 (i) | $ | 39,042,531 | $1,436,281 | |
| GS Mortgage Securities Trust, 2017-GS7, “XA”, 1.083%, 8/10/2050 (i) | 36,887,106 | 1,352,558 | ||
| GS Mortgage Securities Trust, 2020-GC47, “A5”, 1.13%, 5/12/2053 (i) | 39,169,842 | 2,473,478 | ||
| IMPAC CMB Trust, FLR, 4.326% (LIBOR - 1mo. + 0.74%), 11/25/2034 | 36,350 | 35,388 | ||
| IMPAC CMB Trust, FLR, 4.506% (LIBOR - 1mo. + 0.92%), 11/25/2034 | 38,263 | 37,510 | ||
| IMPAC Secured Assets Corp., FLR, 4.286% (LIBOR - 1mo. + 0.35%), 5/25/2036 | 55,033 | 46,768 | ||
| Interstar Millennium Trust, FLR, 3.67% (LIBOR - 3mo. + 0.4%), 3/14/2036 | 24,942 | 23,826 | ||
| Invitation Homes 2018-SFR1 Trust, “B”, FLR, 4.362% (LIBOR - 1mo. + 0.95%), 3/17/2037 (n) | 3,497,498 | 3,422,402 | ||
| Jamestown CLO Ltd., 2020-15A, “C”, FLR, 6.529% (LIBOR - 3mo. + 2.45%), 4/15/2033 (n) | 14,432,415 | 13,099,610 | ||
| JPMorgan Chase Commercial Mortgage Securities Corp., 0.989%, 9/15/2050 (i) | 40,157,600 | 1,327,434 | ||
| LAD Auto Receivables Trust, 2022-1A, “A”, 5.21%, 6/15/2027 (n) | 5,481,427 | 5,380,793 | ||
| LoanCore 2018-CRE1 Ltd., “AS”, FLR, 4.912% (LIBOR - 1mo. + 1.5%), 5/15/2028 (n) | 5,087,267 | 5,038,175 | ||
| LoanCore 2018-CRE1 Ltd., “C”, FLR, 5.962% (LIBOR - 1mo. + 2.55%), 5/15/2028 (n) | 1,859,500 | 1,847,168 | ||
| LoanCore 2019-CRE3 Ltd., “AS”, FLR, 4.782% (LIBOR - 1mo. + 1.37%), 4/15/2034 (n) | 6,052,584 | 6,009,374 | ||
| LoanCore 2021-CRE5 Ltd., “AS”, FLR, 5.162% (LIBOR - 1mo. + 1.75%), 7/15/2036 (n) | 8,481,500 | 7,854,370 | ||
| LoanCore 2021-CRE5 Ltd., “B”, FLR, 5.412% (LIBOR - 1mo. + 2%), 7/15/2036 (n) | 3,588,000 | 3,310,767 | ||
| Madison Park Funding Ltd., 2014-13A, “BR2”, FLR, 5.726% (LIBOR - 3mo. + 1.5%), 4/19/2030 (n) | 6,806,093 | 6,566,178 | ||
| Magnetite CLO Ltd., 2015-16A, “BR”, FLR, 5.393% (LIBOR - 3mo. + 1.2%), 1/18/2028 (n) | 9,726,000 | 9,445,852 | ||
| Merrill Lynch Mortgage Investors, Inc., 4.166%, 2/25/2037 (a)(d) | 1,669,728 | 227,419 | ||
| MF1 2020-FL4 Ltd., “B”, FLR, 6.24% (LIBOR - 1mo. + 2.75%), 11/15/2035 (n) | 10,472,500 | 10,045,647 | ||
| MF1 2021-FL5 Ltd., “B”, FLR, 4.94% (LIBOR - 1mo. + 1.45%), 7/15/2036 (n) | 13,063,500 | 12,332,064 | ||
| MF1 2021-FL5 Ltd., “C”, FLR, 5.19% (LIBOR - 1mo. + 1.7%), 7/15/2036 (n) | 3,716,500 | 3,447,689 | ||
| Issuer | Shares/Par | Value ($) | ||
| Bonds – continued | ||||
| Asset-Backed & Securitized – continued | ||||
| MF1 2021-FL6 Ltd., “B”, FLR, 5.093% (LIBOR - 1mo. + 1.65%), 7/16/2036 (n) | $ | 10,716,294 | $10,076,488 | |
| MF1 2022-FL8 Ltd., “C”, FLR, 5.094% (SOFR - 30 day + 2.2%), 2/19/2037 (n) | 2,198,259 | 2,063,734 | ||
| MF1 2022-FL9 Ltd., “B”, FLR, 6.617% (SOFR - 1mo. + 3.15%), 6/19/2037 (n) | 15,126,500 | 14,874,417 | ||
| Morgan Stanley Bank of America Merrill Lynch Trust, 2017-C33, “XA”, 1.251%, 5/15/2050 (i) | 33,947,132 | 1,372,045 | ||
| Morgan Stanley Capital I Trust, 2017-H1, “XA”, 1.325%, 6/15/2050 (i) | 16,536,874 | 642,109 | ||
| Morgan Stanley Capital I Trust, 2018-H4, “XA”, 0.831%, 12/15/2051 (i) | 52,495,375 | 1,947,006 | ||
| Morgan Stanley Capital I Trust, 2021-L5, “XA”, 1.296%, 5/15/2054 (i) | 45,347,005 | 3,214,595 | ||
| Morgan Stanley Capital I Trust, 2021-L6, “XA”, 1.23%, 6/15/2054 (i) | 43,443,284 | 2,786,105 | ||
| Navistar Financial Dealer Note Master Owner Trust, 2022-1, “A”, FLR, 4.195% (SOFR - 30 day + 1.25%), 5/25/2027 (n) | 10,812,000 | 10,826,983 | ||
| NextGear Floorplan Master Owner Trust, 2022-1A, “A1”, FLR, 3.841% (SOFR - 30 day + 1.05%), 3/15/2027 (n) | 6,113,000 | 6,071,728 | ||
| Oaktree CLO 2019-1A Ltd., “BR”, FLR, 6.075% (LIBOR - 3mo. + 1.75%), 4/22/2030 (n) | 8,692,908 | 8,134,484 | ||
| Oaktree CLO 2019-1A Ltd., “CR”, FLR, 6.675% (LIBOR - 3mo. + 2.35%), 4/22/2030 (n) | 7,442,908 | 6,763,557 | ||
| OneMain Financial Issuance Trust, 2020-1A, “A”, 3.84%, 5/14/2032 (n) | 4,624,572 | 4,567,159 | ||
| OneMain Financial Issuance Trust, 2020-2A, “A”, 1.75%, 9/14/2035 (n) | 8,570,000 | 7,409,414 | ||
| OneMain Financial Issuance Trust, 2022-S1, “A”, 4.13%, 5/14/2035 (n) | 5,509,000 | 5,136,240 | ||
| Ownit Mortgage Loan Asset-Backed Certificates, 3.107%, 10/25/2035 | 1,051,874 | 595,569 | ||
| Palmer Square Loan Funding 2020-1A Ltd., “A2”, FLR, 4.334% (LIBOR - 3mo. + 1.35%), 2/20/2028 (n) | 13,000,000 | 12,635,272 | ||
| PFP III 2021-7 Ltd., “B”, FLR, 4.812% (LIBOR - 1mo. + 1.4%), 4/14/2038 (n) | 3,004,350 | 2,757,471 | ||
| PFP III 2021-7 Ltd., “C”, FLR, 5.062% (LIBOR - 1mo. + 1.65%), 4/14/2038 (n) | 955,952 | 882,995 | ||
| PFP III 2021-8 Ltd., “B”, FLR, 4.912% (LIBOR - 1mo. + 1.5%), 8/09/2037 (n) | 3,244,500 | 2,906,942 | ||
| Progress Residential 2021-SFR1 Trust, “B”, 1.303%, 4/17/2038 (n) | 1,210,000 | 1,016,710 | ||
| Issuer | Shares/Par | Value ($) | ||
| Bonds – continued | ||||
| Asset-Backed & Securitized – continued | ||||
| Progress Residential 2021-SFR1 Trust, “C”, 1.555%, 4/17/2038 (n) | $ | 908,000 | $760,038 | |
| Securitized Term Auto Receivable Trust, 2019-CRTA, “B”, 2.453%, 3/25/2026 (n) | 261,271 | 259,228 | ||
| Securitized Term Auto Receivable Trust, 2019-CRTA, “C”, 2.849%, 3/25/2026 (n) | 334,725 | 332,326 | ||
| Shackleton 2013-4RA CLO Ltd., “B”, FLR, 5.84% (LIBOR - 3mo. + 1.9%), 4/13/2031 (n) | 2,268,542 | 2,069,856 | ||
| Shackleton 2015-8A CLO Ltd., “CR”, FLR, 5.893% (LIBOR - 3mo. + 1.65%), 10/20/2027 (n) | 2,414,922 | 2,305,497 | ||
| Shelter Growth CRE 2021-FL3 Ltd., “C”, FLR, 5.562% (LIBOR - 1mo. + 2.15%), 9/15/2036 (n) | 6,411,000 | 6,003,307 | ||
| Southwick Park CLO, Ltd., 2019-4A, “B1R”, FLR, 5.742% (LIBOR - 3mo. + 1.5%), 7/20/2032 (n) | 2,957,000 | 2,782,655 | ||
| Southwick Park CLO, Ltd., 2019-4A, “B2R”, 2.46%, 7/20/2032 (n) | 5,142,000 | 4,084,861 | ||
| Southwick Park CLO, Ltd., 2019-4A, “CR”, FLR, 6.192% (LIBOR - 3mo. + 1.95%), 7/20/2032 (n) | 7,004,000 | 6,410,495 | ||
| Starwood Commercial Mortgage, 2021-FL2, “B”, FLR, 5.243% (LIBOR - 1mo. + 1.8%), 4/18/2038 (n) | 8,644,500 | 8,258,625 | ||
| Stratus CLO 2022-3A, Ltd., “C”, FLR, 0% (SOFR - 3mo. + 4%), 10/20/2031 (n)(w) | 8,000,000 | 8,000,000 | ||
| Thornburg Mortgage Securities Trust, FLR, 4.266% (LIBOR - 1mo. + 0.68%), 4/25/2043 | 31,532 | 31,334 | ||
| TICP CLO 2018-3R Ltd., “B”, FLR, 5.592% (LIBOR - 3mo. + 1.35%), 4/20/2028 (n) | 2,132,575 | 2,081,417 | ||
| TICP CLO 2018-3R Ltd., “C”, FLR, 6.042% (LIBOR - 3mo. + 1.8%), 4/20/2028 (n) | 3,742,444 | 3,603,480 | ||
| TPG Real Estate Finance, 2021-FL4, “AS”, FLR, 4.812% (LIBOR - 1mo. + 1.4%), 3/15/2038 (n) | 6,062,000 | 5,754,578 | ||
| TPG Real Estate Finance, 2021-FL4, “B”, FLR, 5.262% (LIBOR - 1mo. + 1.85%), 3/15/2038 (n) | 13,226,000 | 12,412,813 | ||
| UBS Commercial Mortgage Trust, 2017-C1, “XA”, 1.023%, 11/15/2050 (i) | 23,750,524 | 866,949 | ||
| UBS Commercial Mortgage Trust, 2018-C14, “XA”, 0.95%, 12/15/2051 (i) | 24,939,704 | 1,095,776 | ||
| Wells Fargo Commercial Mortgage Trust, 2021-C61, “XA”, 1.37%, 11/15/2054 (i) | 47,297,139 | 3,581,306 | ||
| World Omni Auto Receivables Trust, 3.67%, 6/15/2027 | 3,072,000 | 2,970,452 | ||
| $594,180,385 | ||||
| Issuer | Shares/Par | Value ($) | ||
| Bonds – continued | ||||
| Automotive – 2.5% | ||||
| Daimler Trucks Finance North America LLC, 1.625%, 12/13/2024 (n) | $ | 10,519,000 | $9,671,078 | |
| General Motors Financial Co., 1.7%, 8/18/2023 | 7,349,000 | 7,115,907 | ||
| Hyundai Capital America, 2.85%, 11/01/2022 (n) | 4,203,000 | 4,203,000 | ||
| Hyundai Capital America, 2.375%, 2/10/2023 (n) | 2,145,000 | 2,126,482 | ||
| Hyundai Capital America, 5.75%, 4/06/2023 (n) | 12,206,000 | 12,213,324 | ||
| Hyundai Capital America, 0.8%, 1/08/2024 (n) | 863,000 | 814,523 | ||
| Hyundai Capital America, 5.875%, 4/07/2025 (n) | 8,600,000 | 8,510,641 | ||
| Mercedes-Benz Finance North America LLC, 0.75%, 3/01/2024 (n) | 5,167,000 | 4,866,487 | ||
| Stellantis Finance US, Inc., 1.711%, 1/29/2027 (n) | 8,000,000 | 6,613,391 | ||
| Volkswagen Group of America Finance LLC, 3.125%, 5/12/2023 (n) | 1,111,000 | 1,098,025 | ||
| Volkswagen Group of America Finance LLC, 2.85%, 9/26/2024 (n) | 4,128,000 | 3,917,967 | ||
| Volkswagen Group of America Finance LLC, 3.35%, 5/13/2025 (n) | 7,295,000 | 6,868,133 | ||
| Volkswagen Group of America Finance LLC, 1.25%, 11/24/2025 (n) | 5,071,000 | 4,428,186 | ||
| $72,447,144 | ||||
| Broadcasting – 0.8% | ||||
| Warnermedia Holdings, Inc., 3.788%, 3/15/2025 (n) | $ | 17,801,000 | $16,784,127 | |
| Warnermedia Holdings, Inc., 3.755%, 3/15/2027 (n) | 6,864,000 | 6,106,090 | ||
| $22,890,217 | ||||
| Brokerage & Asset Managers – 1.8% | ||||
| Brookfield Finance, Inc., 3.9%, 1/25/2028 | $ | 13,949,000 | $12,489,276 | |
| Charles Schwab Corp., 0.75%, 3/18/2024 | 6,272,000 | 5,915,658 | ||
| NASDAQ, Inc., 0.445%, 12/21/2022 | 6,300,000 | 6,263,318 | ||
| National Securities Clearing Corp., 1.2%, 4/23/2023 (n) | 9,500,000 | 9,332,380 | ||
| National Securities Clearing Corp., 0.4%, 12/07/2023 (n) | 5,086,000 | 4,841,016 | ||
| National Securities Clearing Corp., 1.5%, 4/23/2025 (n) | 3,257,000 | 2,981,012 | ||
| National Securities Clearing Corp., 0.75%, 12/07/2025 (n) | 10,182,000 | 8,915,004 | ||
| $50,737,664 | ||||
| Business Services – 1.0% | ||||
| Equinix, Inc., 1.25%, 7/15/2025 | $ | 6,132,000 | $5,461,405 | |
| Global Payments, Inc., 1.2%, 3/01/2026 | 8,692,000 | 7,415,750 | ||
| Tencent Holdings Ltd., 1.81%, 1/26/2026 (n) | 7,043,000 | 6,186,762 | ||
| Western Union Co., 1.35%, 3/15/2026 | 11,707,000 | 10,022,347 | ||
| $29,086,264 | ||||
| Issuer | Shares/Par | Value ($) | ||
| Bonds – continued | ||||
| Cable TV – 0.3% | ||||
| SES S.A., 3.6%, 4/04/2023 (n) | $ | 10,292,000 | $10,148,315 | |
| Chemicals – 0.1% | ||||
| Westlake Chemical Corp., 0.875%, 8/15/2024 | $ | 3,244,000 | $3,009,534 | |
| Computer Software – 0.3% | ||||
| Dell International LLC/EMC Corp., 4%, 7/15/2024 | $ | 4,900,000 | $4,782,344 | |
| Dell International LLC/EMC Corp., 5.85%, 7/15/2025 | 1,522,000 | 1,522,996 | ||
| Infor, Inc., 1.45%, 7/15/2023 (n) | 1,594,000 | 1,536,525 | ||
| $7,841,865 | ||||
| Computer Software - Systems – 0.3% | ||||
| VMware, Inc., 1%, 8/15/2024 | $ | 5,405,000 | $4,983,567 | |
| VMware, Inc., 1.4%, 8/15/2026 | 4,186,000 | 3,571,113 | ||
| $8,554,680 | ||||
| Conglomerates – 0.4% | ||||
| Carrier Global Corp., 2.242%, 2/15/2025 | $ | 956,000 | $889,666 | |
| Westinghouse Air Brake Technologies Corp., 4.4%, 3/15/2024 | 9,885,000 | 9,662,680 | ||
| $10,552,346 | ||||
| Consumer Products – 0.5% | ||||
| GSK Consumer Healthcare Capital UK PLC, 3.125%, 3/24/2025 | $ | 10,091,000 | $9,503,350 | |
| GSK Consumer Healthcare Capital UK PLC, 3.375%, 3/24/2027 | 4,466,000 | 4,039,082 | ||
| $13,542,432 | ||||
| Containers – 0.5% | ||||
| Berry Global, Inc., 1.57%, 1/15/2026 | $ | 7,474,000 | $6,478,009 | |
| Berry Global, Inc., 1.65%, 1/15/2027 | 9,789,000 | 8,066,513 | ||
| $14,544,522 | ||||
| Electronics – 1.1% | ||||
| Broadcom, Inc., 3.15%, 11/15/2025 | $ | 5,544,000 | $5,168,412 | |
| Microchip Technology, Inc., 0.983%, 9/01/2024 | 18,197,000 | 16,699,882 | ||
| Qorvo, Inc., 1.75%, 12/15/2024 (n) | 3,654,000 | 3,332,083 | ||
| Skyworks Solutions, Inc., 0.9%, 6/01/2023 | 3,692,000 | 3,586,260 | ||
| TSMC Arizona Corp., 1.75%, 10/25/2026 | 2,930,000 | 2,528,413 | ||
| $31,315,050 | ||||
| Emerging Market Quasi-Sovereign – 0.4% | ||||
| DAE Funding LLC (United Arab Emirates), 1.55%, 8/01/2024 (n) | $ | 3,903,000 | $3,540,474 | |
| DAE Funding LLC (United Arab Emirates), 2.625%, 1/20/2025 (n) | 6,500,000 | 5,897,450 | ||
| Indian Oil Corp. Ltd., 5.75%, 8/01/2023 | 2,973,000 | 2,978,051 | ||
| $12,415,975 | ||||
| Issuer | Shares/Par | Value ($) | ||
| Bonds – continued | ||||
| Emerging Market Sovereign – 0.3% | ||||
| Emirate of Abu Dhabi, 0.75%, 9/02/2023 (n) | $ | 7,805,000 | $7,533,823 | |
| Energy - Independent – 0.4% | ||||
| EQT Corp., 5.678%, 10/01/2025 | $ | 3,011,000 | $2,976,426 | |
| EQT Corp., 5.7%, 4/01/2028 | 3,013,000 | 2,931,950 | ||
| Pioneer Natural Resources Co., 0.55%, 5/15/2023 | 5,857,000 | 5,714,860 | ||
| $11,623,236 | ||||
| Energy - Integrated – 0.6% | ||||
| Eni S.p.A., 4%, 9/12/2023 (n) | $ | 9,261,000 | $9,091,976 | |
| Exxon Mobil Corp., 1.571%, 4/15/2023 | 9,200,000 | 9,071,755 | ||
| $18,163,731 | ||||
| Financial Institutions – 2.1% | ||||
| AerCap Ireland Capital DAC/AerCap Global Aviation Trust, 4.875%, 1/16/2024 | $ | 6,254,000 | $6,138,322 | |
| AerCap Ireland Capital DAC/AerCap Global Aviation Trust, 3.15%, 2/15/2024 | 11,511,000 | 11,017,816 | ||
| AerCap Ireland Capital DAC/AerCap Global Aviation Trust, 1.75%, 10/29/2024 | 5,472,000 | 4,958,800 | ||
| AerCap Ireland Capital DAC/AerCap Global Aviation Trust, 6.5%, 7/15/2025 | 5,664,000 | 5,575,561 | ||
| Air Lease Corp., 2.2%, 1/15/2027 | 7,822,000 | 6,542,481 | ||
| Avolon Holdings Funding Ltd., 3.95%, 7/01/2024 (n) | 5,703,000 | 5,339,239 | ||
| Avolon Holdings Funding Ltd., 5.5%, 1/15/2026 (n) | 3,134,000 | 2,879,825 | ||
| Avolon Holdings Funding Ltd., 2.125%, 2/21/2026 (n) | 8,784,000 | 7,201,843 | ||
| Avolon Holdings Funding Ltd., 4.25%, 4/15/2026 (n) | 2,797,000 | 2,444,950 | ||
| Avolon Holdings Funding Ltd., 2.528%, 11/18/2027 (n) | 6,154,000 | 4,697,705 | ||
| Avolon Holdings Funding Ltd., 2.75%, 2/21/2028 (n) | 4,709,000 | 3,599,637 | ||
| $60,396,179 | ||||
| Food & Beverages – 0.9% | ||||
| JBS USA Lux S.A./JBS USA Food Co./JBS USA Finance, Inc., 5.125%, 2/01/2028 (n) | $ | 4,517,000 | $4,199,355 | |
| JBS USA Lux S.A./JBS USA Food Co./JBS USA Finance, Inc., 3%, 2/02/2029 (n) | 11,955,000 | 9,685,502 | ||
| JDE Peet's N.V., 0.8%, 9/24/2024 (n) | 4,753,000 | 4,311,879 | ||
| JDE Peet's N.V., 1.375%, 1/15/2027 (n) | 8,356,000 | 6,852,983 | ||
| $25,049,719 | ||||
| Food & Drug Stores – 0.6% | ||||
| 7-Eleven, Inc., 0.625%, 2/10/2023 (n) | $ | 10,326,000 | $10,199,543 | |
| 7-Eleven, Inc., 0.8%, 2/10/2024 (n) | 7,744,000 | 7,302,894 | ||
| $17,502,437 | ||||
| Issuer | Shares/Par | Value ($) | ||
| Bonds – continued | ||||
| Forest & Paper Products – 0.2% | ||||
| Fibria Overseas Finance Ltd., 5.5%, 1/17/2027 | $ | 5,928,000 | $5,705,700 | |
| Gaming & Lodging – 1.5% | ||||
| GLP Capital LP/GLP Financing II, Inc., 5.375%, 11/01/2023 | $ | 4,936,000 | $4,880,421 | |
| GLP Capital LP/GLP Financing II, Inc., 5.25%, 6/01/2025 | 8,847,000 | 8,531,498 | ||
| GLP Capital LP/GLP Financing II, Inc., 5.375%, 4/15/2026 | 1,551,000 | 1,480,523 | ||
| Hyatt Hotels Corp., 1.3%, 10/01/2023 | 8,139,000 | 7,809,887 | ||
| Hyatt Hotels Corp., 1.8%, 10/01/2024 | 7,537,000 | 7,029,946 | ||
| Las Vegas Sands Corp., 3.2%, 8/08/2024 | 5,950,000 | 5,665,479 | ||
| Marriott International, Inc., 5.75%, 5/01/2025 | 1,617,000 | 1,631,583 | ||
| Marriott International, Inc., 3.75%, 10/01/2025 | 1,655,000 | 1,575,975 | ||
| Sands China Ltd., 4.3%, 1/08/2026 | 6,819,000 | 5,578,078 | ||
| $44,183,390 | ||||
| Industrial – 0.0% | ||||
| Howard University, Washington D.C., 2.801%, 10/01/2023 | $ | 424,000 | $412,905 | |
| Howard University, Washington D.C., AGM, 2.416%, 10/01/2024 | 467,000 | 438,941 | ||
| Howard University, Washington D.C., AGM, 2.516%, 10/01/2025 | 578,000 | 530,635 | ||
| $1,382,481 | ||||
| Insurance – 0.9% | ||||
| AIG Global Funding, 0.8%, 7/07/2023 (n) | $ | 4,511,000 | $4,381,341 | |
| Corebridge Financial, Inc., 3.5%, 4/04/2025 (n) | 3,720,000 | 3,505,827 | ||
| Corebridge Financial, Inc., 3.65%, 4/05/2027 (n) | 7,440,000 | 6,738,227 | ||
| Equitable Financial Life Insurance Co., 1.4%, 7/07/2025 (n) | 4,044,000 | 3,616,712 | ||
| Metropolitan Life Global Funding I, 0.4%, 1/07/2024 (n) | 7,624,000 | 7,205,368 | ||
| $25,447,475 | ||||
| Insurance - Property & Casualty – 0.1% | ||||
| Ambac Assurance Corp., 5.1%, 6/07/2060 (z) | $ | 23,513 | $32,801 | |
| Aon PLC, 2.2%, 11/15/2022 | 3,374,000 | 3,370,675 | ||
| �� | $3,403,476 | |||
| Internet – 0.1% | ||||
| Baidu, Inc., 3.875%, 9/29/2023 | $ | 3,736,000 | $3,687,431 | |
| Machinery & Tools – 0.4% | ||||
| CNH Industrial Capital LLC, 4.2%, 1/15/2024 | $ | 6,502,000 | $6,390,670 | |
| CNH Industrial Capital LLC, 1.875%, 1/15/2026 | 2,401,000 | 2,113,824 | ||
| CNH Industrial N.V., 4.5%, 8/15/2023 | 4,043,000 | 4,010,118 | ||
| $12,514,612 | ||||
| Issuer | Shares/Par | Value ($) | ||
| Bonds – continued | ||||
| Major Banks – 16.6% | ||||
| Bank of America Corp., 4.2%, 8/26/2024 | $ | 3,106,000 | $3,037,318 | |
| Bank of America Corp., 4.45%, 3/03/2026 | 6,999,000 | 6,713,921 | ||
| Bank of America Corp., 4.25%, 10/22/2026 | 4,033,000 | 3,809,510 | ||
| Bank of America Corp., 1.734% to 7/22/2026, FLR (SOFR - 1 day + 0.96%) to 7/22/2027 | 22,751,000 | 19,455,221 | ||
| Bank of America Corp., 4.183%, 11/25/2027 | 6,721,000 | 6,156,399 | ||
| Bank of Montreal, 2.05%, 11/01/2022 | 4,809,000 | 4,809,000 | ||
| Barclays PLC, 1.007% to 12/10/2023, FLR (CMT - 1yr. + 0.8%) to 12/10/2024 | 2,837,000 | 2,656,111 | ||
| Barclays PLC, 2.852% to 5/07/2025, FLR (LIBOR - 3mo. + 2.452%) to 5/07/2026 | 2,564,000 | 2,309,437 | ||
| Barclays PLC, 2.279% to 11/24/2026, FLR (CMT - 1yr. + 1.05%) to 11/24/2027 | 10,326,000 | 8,543,655 | ||
| BNP Paribas S.A., 2.591% to 1/20/2027, FLR (SOFR - 1 day + 1.228%) to 1/20/2028 (n) | 12,560,000 | 10,572,914 | ||
| Capital One Financial Corp., 4.166%, 5/09/2025 | 6,912,000 | 6,642,537 | ||
| Capital One Financial Corp., 2.636% to 3/03/2025, FLR (SOFR - 1 day + 1.29%) to 3/03/2026 | 12,928,000 | 11,851,879 | ||
| Credit Agricole S.A., 1.907% to 6/16/2025, FLR (SOFR - 1 day + 1.676%) to 6/16/2026 (n) | 2,080,000 | 1,842,152 | ||
| Deutsche Bank AG, 0.898%, 5/28/2024 | 2,663,000 | 2,444,022 | ||
| Deutsche Bank AG, 1.447% to 4/1/2024, FLR (SOFR - 1 day + 1.131%) to 4/01/2025 | 12,981,000 | 11,833,687 | ||
| Deutsche Bank AG, 2.311% to 11/16/2026, FLR (SOFR - 1 day + 1.219%) to 11/16/2027 | 3,240,000 | 2,586,178 | ||
| Goldman Sachs Group, Inc., 1.757% to 1/24/2024, FLR (SOFR - 1 day + 0.73%) to 1/24/2025 | 10,205,000 | 9,644,031 | ||
| Goldman Sachs Group, Inc., 3.5%, 4/01/2025 | 5,300,000 | 5,021,600 | ||
| Goldman Sachs Group, Inc., 1.093% to 12/09/2025, FLR (SOFR - 1 day + 0.789%) to 12/09/2026 | 4,637,000 | 3,977,558 | ||
| Goldman Sachs Group, Inc., 5.95%, 1/15/2027 | 14,381,000 | 14,508,042 | ||
| Goldman Sachs Group, Inc., 1.948% to 10/21/2026, FLR (SOFR - 1 day + 0.913%) to 10/21/2027 | 8,452,000 | 7,181,077 | ||
| HSBC Holdings PLC, 3.033% to 11/22/2022, FLR (LIBOR - 3mo. + 0.923%) to 11/22/2023 | 3,245,000 | 3,238,502 | ||
| HSBC Holdings PLC, 2.099% to 6/04/2025, FLR (SOFR - 1 day + 1.929%) to 6/04/2026 | 4,303,000 | 3,784,775 | ||
| HSBC Holdings PLC, 7.336% to 11/03/2025, FLR (SOFR - 1 day + 3.03%) to 11/03/2026 | 4,354,000 | 4,366,052 | ||
| HSBC Holdings PLC, 1.589% to 5/24/2026, FLR (SOFR - 1 day + 1.29%) to 5/24/2027 | 3,448,000 | 2,833,502 | ||
| HSBC Holdings PLC, 2.251% to 11/22/2026, FLR (SOFR - 1 day + 1.1%) to 11/22/2027 | 12,000,000 | 9,866,385 | ||
| Issuer | Shares/Par | Value ($) | ||
| Bonds – continued | ||||
| Major Banks – continued | ||||
| Huntington Bancshares, Inc., 4.008% to 5/16/2024, FLR (SOFR - 1 day + 1.205%) to 5/16/2025 | $ | 5,554,000 | $5,412,849 | |
| JPMorgan Chase & Co., 3.375%, 5/01/2023 | 4,455,000 | 4,422,431 | ||
| JPMorgan Chase & Co., 3.797% to 7/23/2023, FLR (LIBOR - 3mo. + 0.89%) to 7/23/2024 | 7,253,000 | 7,149,448 | ||
| JPMorgan Chase & Co., 2.005% to 3/13/2025, FLR (SOFR - 1 day + 1.585%) to 3/13/2026 | 7,223,000 | 6,586,133 | ||
| JPMorgan Chase & Co., 1.04% to 2/04/2026, FLR (SOFR - 1 day + 0.695%) to 2/04/2027 | 6,220,000 | 5,289,425 | ||
| JPMorgan Chase & Co., 1.578% to 4/22/2026, FLR (SOFR - 1 day + 0.885%) to 4/22/2027 | 5,268,000 | 4,530,758 | ||
| JPMorgan Chase & Co., 1.47%, 9/22/2027 | 10,000,000 | 8,401,174 | ||
| JPMorgan Chase & Co., 4.25%, 10/01/2027 | 6,722,000 | 6,313,969 | ||
| Lloyds Banking Group PLC, 3.511% to 3/18/2025, FLR (CMT - 1yr. + 1.6%) to 3/18/2026 | 15,414,000 | 14,263,508 | ||
| Mitsubishi UFJ Financial Group, Inc., 0.848% to 9/15/2023, FLR (CMT - 1yr. + 0.68%) to 9/15/2024 | 10,500,000 | 10,025,670 | ||
| Mitsubishi UFJ Financial Group, Inc., 0.953% to 7/19/2024, FLR (CMT - 1yr. + 0.55%) to 7/19/2025 | 7,128,000 | 6,542,271 | ||
| Mitsubishi UFJ Financial Group, Inc., 0.962% to 10/11/2024, FLR (CMT - 1yr. + 0.45%) to 10/11/2025 | 7,021,000 | 6,382,656 | ||
| Mizuho Financial Group, 0.849% to 9/08/2023, FLR (LIBOR - 3mo. + 0.61%) to 9/08/2024 | 7,800,000 | 7,451,482 | ||
| Morgan Stanley, 0.56% to 11/10/2022, FLR (SOFR - 1 day + 0.466%) to 11/10/2023 | 9,002,000 | 8,990,381 | ||
| Morgan Stanley, 0.529% to 1/25/2023, FLR (SOFR - 1 day + 0.455%) to 1/25/2024 | 12,221,000 | 12,038,014 | ||
| Morgan Stanley, 0.864% to 10/21/2024, FLR (SOFR - 1 day + 0.745%) to 10/21/2025 | 8,651,000 | 7,802,957 | ||
| Morgan Stanley, 4.35%, 9/08/2026 | 9,466,000 | 9,013,378 | ||
| Morgan Stanley, 3.95%, 4/23/2027 | 8,302,000 | 7,660,298 | ||
| Morgan Stanley, 1.512% to 7/20/2026, FLR (SOFR - 1 day + 0.858%) to 7/20/2027 | 7,636,000 | 6,474,602 | ||
| Nationwide Building Society, 2.972% to 2/16/2027, FLR (SOFR - 1 day + 1.29%) to 2/16/2028 (n) | 9,261,000 | 7,842,533 | ||
| NatWest Group PLC, 2.359% to 5/22/2023, FLR (CMT - 1yr. + 2.15%) to 5/22/2024 | 8,063,000 | 7,844,419 | ||
| NatWest Group PLC, 4.269% to 3/22/2024, FLR (LIBOR - 3mo. + 1.762%) to 3/22/2025 | 15,826,000 | 15,259,258 | ||
| NatWest Markets PLC, 3.479%, 3/22/2025 (n) | 8,888,000 | 8,387,620 | ||
| PNC Bank N.A., 2.5%, 8/27/2024 | 4,237,000 | 4,038,643 | ||
| Royal Bank of Canada, 1.6%, 4/17/2023 | 10,000,000 | 9,843,877 | ||
| Royal Bank of Canada, 0.5%, 10/26/2023 | 16,550,000 | 15,800,887 | ||
| Issuer | Shares/Par | Value ($) | ||
| Bonds – continued | ||||
| Major Banks – continued | ||||
| Standard Chartered PLC, 0.991% to 1/12/2024, FLR (CMT - 1yr. + 0.78%) to 1/12/2025 (n) | $ | 5,088,000 | $4,729,931 | |
| Standard Chartered PLC, 1.214% to 3/23/2024, FLR (CMT - 1yr. + 0.88%) to 3/23/2025 (n) | 2,614,000 | 2,418,812 | ||
| Standard Chartered PLC, 1.822% to 11/23/2024, FLR (CMT - 1yr. + 0.95%) to 11/23/2025 (n) | 2,554,000 | 2,283,262 | ||
| Standard Chartered PLC, 3.971% to 3/30/2025, FLR (CMT - 1yr. + 1.65%) to 3/30/2026 (n) | 3,723,000 | 3,430,699 | ||
| Sumitomo Mitsui Financial Group, Inc., 0.508%, 1/12/2024 | 2,541,000 | 2,394,295 | ||
| Sumitomo Mitsui Financial Group, Inc., 1.474%, 7/08/2025 | 7,574,000 | 6,760,697 | ||
| Sumitomo Mitsui Financial Group, Inc., 2.174%, 1/14/2027 | 8,414,000 | 7,272,022 | ||
| Sumitomo Mitsui Trust Bank Ltd., 0.8%, 9/12/2023 (n) | 9,000,000 | 8,648,625 | ||
| Sumitomo Mitsui Trust Bank Ltd., 0.85%, 3/25/2024 (n) | 5,661,000 | 5,299,001 | ||
| Toronto-Dominion Bank, 0.25%, 1/06/2023 | 5,082,000 | 5,043,836 | ||
| UBS Group AG, 1.008% to 7/30/2023, FLR (CMT - 1yr. + 0.83%) to 7/30/2024 (n) | 2,226,000 | 2,142,276 | ||
| UBS Group AG, 4.703% to 8/05/2026, FLR (CMT - 1yr. + 2.05%) to 8/05/2027 (n) | 6,561,000 | 6,097,436 | ||
| UniCredit S.p.A., 2.569% to 9/22/2025, FLR (CMT - 1yr. + 2.3%) to 9/22/2026 (n) | 8,699,000 | 7,459,486 | ||
| Wells Fargo & Co., 1.654% to 6/02/2023, FLR (SOFR - 1 day + 1.6%) to 6/02/2024 | 13,775,000 | 13,456,678 | ||
| Wells Fargo & Co., 2.164% to 2/11/2025, FLR (LIBOR - 3mo. + 0.75%) to 2/11/2026 | 9,707,000 | 8,915,608 | ||
| Wells Fargo & Co., 3.526% to 3/24/2027, FLR (SOFR - 1 day + 1.51%) to 3/24/2028 | 13,228,000 | 11,911,208 | ||
| $481,717,978 | ||||
| Medical & Health Technology & Services – 1.6% | ||||
| HCA Healthcare, Inc., 3.125%, 3/15/2027 (n) | $ | 7,303,000 | $6,455,853 | |
| HCA, Inc., 5%, 3/15/2024 | 7,222,000 | 7,159,414 | ||
| PerkinElmer, Inc., 0.85%, 9/15/2024 | 10,000,000 | 9,227,783 | ||
| Thermo Fisher Scientific, Inc., 1.215%, 10/18/2024 | 25,217,000 | 23,446,219 | ||
| $46,289,269 | ||||
| Metals & Mining – 1.1% | ||||
| Anglo American Capital PLC, 4.75%, 4/10/2027 (n) | $ | 10,084,000 | $9,449,514 | |
| Glencore Funding LLC, 4.125%, 3/12/2024 (n) | 4,410,000 | 4,320,445 | ||
| Glencore Funding LLC, 4.625%, 4/29/2024 (n) | 3,375,000 | 3,317,460 | ||
| Glencore Funding LLC, 1.625%, 9/01/2025 (n) | 7,900,000 | 7,028,670 | ||
| Glencore Funding LLC, 1.625%, 4/27/2026 (n) | 8,268,000 | 7,101,538 | ||
| $31,217,627 | ||||
| Issuer | Shares/Par | Value ($) | ||
| Bonds – continued | ||||
| Midstream – 1.3% | ||||
| Enbridge, Inc., 2.5%, 2/14/2025 | $ | 6,525,000 | $6,096,876 | |
| Energy Transfer LP, 2.9%, 5/15/2025 | 3,676,000 | 3,412,357 | ||
| Gray Oak Pipeline LLC, 2%, 9/15/2023 (n) | 7,337,000 | 7,100,493 | ||
| Plains All American Pipeline LP, 3.85%, 10/15/2023 | 3,750,000 | 3,682,996 | ||
| Plains All American Pipeline LP/PAA Finance Corp., 4.65%, 10/15/2025 | 10,480,000 | 10,129,539 | ||
| Western Midstream Operating LP, 3.35%, 2/01/2025 | 3,357,000 | 3,190,728 | ||
| Western Midstream Operating LP, FLR, 5.04% (LIBOR - 3mo. + 0.85%), 1/13/2023 | 4,795,000 | 4,771,025 | ||
| $38,384,014 | ||||
| Mortgage-Backed – 0.5% | ||||
| Fannie Mae, 4.5%, 3/01/2023 | $ | 7,857 | $7,774 | |
| Fannie Mae, 5%, 7/01/2023 | 11,366 | 11,317 | ||
| Fannie Mae, 3%, 12/01/2031 | 1,090,827 | 1,025,901 | ||
| Fannie Mae, 2.105%, 3/01/2033 | 33,153 | 32,522 | ||
| Fannie Mae, 3.375%, 5/01/2033 | 73,327 | 71,690 | ||
| Fannie Mae, 2%, 5/25/2044 | 622,021 | 596,887 | ||
| Freddie Mac, 0.901%, 4/25/2024 (i) | 215,470 | 2,285 | ||
| Freddie Mac, 1.582%, 4/25/2030 (i) | 29,037,507 | 2,538,110 | ||
| Freddie Mac, 3%, 4/15/2033 - 6/15/2045 | 8,326,210 | 7,641,830 | ||
| Freddie Mac, 2%, 7/15/2042 | 1,300,460 | 1,167,283 | ||
| Ginnie Mae, 2.625%, 7/20/2032 | 29,540 | 28,657 | ||
| $13,124,256 | ||||
| Municipals – 1.2% | ||||
| California Earthquake Authority Rev., Taxable, “B”, 1.477%, 7/01/2023 | $ | 2,425,000 | $2,362,451 | |
| California Municipal Finance Authority Rev., Taxable (Century Housing Corp.), 1.486%, 11/01/2022 | 1,090,000 | 1,090,000 | ||
| California Municipal Finance Authority Rev., Taxable (Century Housing Corp.), 1.605%, 11/01/2023 | 1,295,000 | 1,249,188 | ||
| Illinois Sales Tax Securitization Corp., Second Lien, Taxable, “B”, BAM, 2.128%, 1/01/2023 | 1,205,000 | 1,199,576 | ||
| Illinois Sales Tax Securitization Corp., Second Lien, Taxable, “B”, BAM, 2.225%, 1/01/2024 | 2,890,000 | 2,779,132 | ||
| Long Island, NY, Power Authority, Electric System General Rev., Taxable, “C”, 0.764%, 3/01/2023 | 3,570,000 | 3,522,781 | ||
| Massachusetts Educational Financing Authority, Education Loan Rev., Taxable, “A”, 1.904%, 7/01/2023 | 360,000 | 352,248 | ||
| Massachusetts Educational Financing Authority, Education Loan Rev., Taxable, “A”, 2.156%, 7/01/2024 | 1,000,000 | 946,459 | ||
| Massachusetts Educational Financing Authority, Education Loan Rev., Taxable, “A”, 2.306%, 7/01/2025 | 790,000 | 726,136 | ||
| Issuer | Shares/Par | Value ($) | ||
| Bonds – continued | ||||
| Municipals – continued | ||||
| Massachusetts Educational Financing Authority, Education Loan Rev., Taxable, “A”, 2.562%, 7/01/2026 | $ | 1,005,000 | $902,783 | |
| Michigan Finance Authority Tobacco Settlement Asset-Backed Rev., Taxable (2006 Sold Tobacco Receipts), “A-1”, 2.326%, 6/01/2030 | 2,073,278 | 1,854,683 | ||
| New Jersey Economic Development Authority State Pension Funding Rev., Capital Appreciation, Taxable, “B”, AGM, 0%, 2/15/2023 | 10,353,000 | 10,211,123 | ||
| New Jersey Transportation Trust Fund Authority, Transportation System, Taxable, “B”, 2.551%, 6/15/2023 | 1,835,000 | 1,808,473 | ||
| New Jersey Transportation Trust Fund Authority, Transportation System, Taxable, “B”, 2.631%, 6/15/2024 | 1,720,000 | 1,659,368 | ||
| Port Authority of NY & NJ, Taxable, “AAA”, 1.086%, 7/01/2023 | 4,925,000 | 4,803,596 | ||
| $35,467,997 | ||||
| Natural Gas - Distribution – 0.7% | ||||
| Atmos Energy Corp., 0.625%, 3/09/2023 | $ | 14,123,000 | $13,919,144 | |
| CenterPoint Energy Resources Corp., 0.7%, 3/02/2023 | 7,769,000 | 7,661,177 | ||
| $21,580,321 | ||||
| Natural Gas - Pipeline – 0.5% | ||||
| APA Infrastructure Ltd., 4.2%, 3/23/2025 (n) | $ | 14,780,000 | $14,093,364 | |
| Network & Telecom – 0.5% | ||||
| AT&T, Inc., 0.9%, 3/25/2024 | $ | 15,796,000 | $14,914,859 | |
| Oils – 0.2% | ||||
| Valero Energy Corp., 1.2%, 3/15/2024 | $ | 7,070,000 | $6,666,811 | |
| Other Banks & Diversified Financials – 1.5% | ||||
| American Express Co., 2.25%, 3/04/2025 | $ | 6,463,000 | $6,000,902 | |
| Banque Federative du Credit Mutuel S.A., 0.65%, 2/27/2024 (n) | 10,142,000 | 9,510,303 | ||
| Groupe BPCE S.A., 4%, 9/12/2023 (n) | 3,667,000 | 3,593,594 | ||
| Groupe BPCE S.A., FLR, 4.476% (LIBOR - 3mo. + 1.24%), 9/12/2023 (n) | 3,667,000 | 3,665,797 | ||
| Macquarie Group Ltd., 1.201% to 10/14/2024, FLR (SOFR - 1 day + 0.694%) to 10/14/2025 (n) | 10,208,000 | 9,245,089 | ||
| Macquarie Group Ltd., 1.34% to 1/12/2026, FLR (SOFR - 1 day + 1.069%) to 1/12/2027 (n) | 6,707,000 | 5,688,816 | ||
| National Bank of Canada, 0.55% to 11/15/2023, FLR (CMT - 1yr. + 0.4%) to 11/15/2024 | 5,738,000 | 5,438,207 | ||
| $43,142,708 | ||||
| Pharmaceuticals – 0.2% | ||||
| Royalty Pharma PLC, 0.75%, 9/02/2023 | $ | 7,338,000 | $7,039,388 | |
| Issuer | Shares/Par | Value ($) | ||
| Bonds – continued | ||||
| Railroad & Shipping – 0.4% | ||||
| Canadian Pacific Railway Co., 1.35%, 12/02/2024 | $ | 11,123,000 | $10,265,176 | |
| Real Estate - Office – 0.1% | ||||
| Corporate Office Property LP, REIT, 2.25%, 3/15/2026 | $ | 3,542,000 | $3,069,383 | |
| Retailers – 0.7% | ||||
| Alibaba Group Holding Ltd., 2.8%, 6/06/2023 | $ | 5,754,000 | $5,654,746 | |
| Kohl's Corp., 9.5%, 5/15/2025 | 9,595,000 | 9,901,933 | ||
| Nordstrom, Inc., 2.3%, 4/08/2024 | 3,956,000 | 3,712,647 | ||
| $19,269,326 | ||||
| Specialty Stores – 0.4% | ||||
| Genuine Parts Co., 1.75%, 2/01/2025 | $ | 5,643,000 | $5,204,301 | |
| Ross Stores, Inc., 0.875%, 4/15/2026 | 7,614,000 | 6,548,625 | ||
| $11,752,926 | ||||
| Telecommunications - Wireless – 1.1% | ||||
| Crown Castle, Inc., REIT, 3.15%, 7/15/2023 | $ | 5,334,000 | $5,251,191 | |
| Crown Castle, Inc., REIT, 1.35%, 7/15/2025 | 1,776,000 | 1,586,423 | ||
| Crown Castle, Inc., REIT, 2.9%, 3/15/2027 | 3,817,000 | 3,365,831 | ||
| Rogers Communications, Inc., 3.2%, 3/15/2027 (n) | 12,002,000 | 10,885,209 | ||
| T-Mobile USA, Inc., 3.5%, 4/15/2025 | 10,518,000 | 10,034,296 | ||
| $31,122,950 | ||||
| Tobacco – 0.4% | ||||
| B.A.T. Capital Corp., 3.222%, 8/15/2024 | $ | 4,881,000 | $4,665,056 | |
| Imperial Brands Finance PLC, 6.125%, 7/27/2027 (n) | 4,706,000 | 4,541,754 | ||
| Philip Morris International, Inc., 1.125%, 5/01/2023 | 3,763,000 | 3,690,084 | ||
| $12,896,894 | ||||
| Transportation - Services – 1.2% | ||||
| Element Fleet Management Corp., 1.6%, 4/06/2024 (n) | $ | 24,483,000 | $23,033,652 | |
| ERAC USA Finance LLC, 2.7%, 11/01/2023 (n) | 5,924,000 | 5,749,061 | ||
| ERAC USA Finance LLC, 3.85%, 11/15/2024 (n) | 2,559,000 | 2,466,921 | ||
| ERAC USA Finance LLC, 3.8%, 11/01/2025 (n) | 2,559,000 | 2,408,219 | ||
| $33,657,853 | ||||
| U.S. Treasury Obligations – 20.3% | ||||
| U.S. Treasury Notes, 0.125%, 1/31/2023 | $ | 121,490,000 | $120,301,230 | |
| U.S. Treasury Notes, 0.25%, 5/15/2024 (f) | 91,929,700 | 85,975,816 | ||
| U.S. Treasury Notes, 3%, 7/31/2024 | 75,066,000 | 73,063,262 | ||
| U.S. Treasury Notes, 0.375%, 9/15/2024 | 109,702,000 | 101,572,911 | ||
| U.S. Treasury Notes, 2.75%, 5/15/2025 (f) | 217,085,000 | 208,181,124 | ||
| $589,094,343 | ||||
| Issuer | Shares/Par | Value ($) | ||
| Bonds – continued | ||||
| Utilities - Electric Power – 5.0% | ||||
| Edison International, 4.7%, 8/15/2025 | $ | 10,842,000 | $10,468,573 | |
| Emera US Finance LP, 0.833%, 6/15/2024 | 3,730,000 | 3,438,480 | ||
| Enel Finance International N.V., 4.25%, 6/15/2025 (n) | 15,000,000 | 14,148,381 | ||
| Enel Finance International N.V., 6.8%, 10/14/2025 (n) | 3,086,000 | 3,098,833 | ||
| ENGIE Energía Chile S.A., 4.5%, 1/29/2025 (n) | 14,822,000 | 13,888,214 | ||
| Entergy Louisiana LLC, 0.95%, 10/01/2024 | 16,697,000 | 15,396,894 | ||
| Exelon Corp., 2.75%, 3/15/2027 (n) | 7,104,000 | 6,351,104 | ||
| FirstEnergy Corp., 2.05%, 3/01/2025 | 5,731,000 | 5,268,230 | ||
| FirstEnergy Corp., 1.6%, 1/15/2026 | 2,459,000 | 2,138,521 | ||
| NextEra Energy Capital Holdings, Inc., 0.65%, 3/01/2023 | 6,270,000 | 6,182,444 | ||
| Pacific Gas & Electric Co., 1.7%, 11/15/2023 | 3,088,000 | 2,959,528 | ||
| Pacific Gas & Electric Co., 3.25%, 2/16/2024 | 10,584,000 | 10,229,230 | ||
| Pacific Gas & Electric Co., 4.95%, 6/08/2025 | 7,450,000 | 7,220,791 | ||
| Southern California Edison Co., 0.7%, 8/01/2023 | 7,725,000 | 7,455,166 | ||
| Southern California Edison Co., 0.975%, 8/01/2024 | 7,618,000 | 7,057,261 | ||
| Vistra Operations Co. LLC, 4.875%, 5/13/2024 (n) | 16,784,000 | 16,335,196 | ||
| WEC Energy Group, Inc., 0.8%, 3/15/2024 | 3,658,000 | 3,438,297 | ||
| Xcel Energy, Inc., 0.5%, 10/15/2023 | 8,847,000 | 8,443,238 | ||
| $143,518,381 | ||||
| Total Bonds (Identified Cost, $2,948,694,272) | $2,752,215,824 | |||
| Investment Companies (h) – 5.2% | ||||
| Money Market Funds – 5.2% | ||||
| MFS Institutional Money Market Portfolio, 3.02% (v) (Identified Cost, $149,104,688) | 149,103,317 | $149,103,317 | ||
| Other Assets, Less Liabilities – (0.2)% | (4,430,547) | |||
| Net Assets – 100.0% | $2,896,888,594 | |||
| (a) | Non-income producing security. |
| (d) | In default. |
| (f) | All or a portion of the security has been segregated as collateral for open futures contracts and cleared swap agreements. |
| (h) | An affiliated issuer, which may be considered one in which the fund owns 5% or more of the outstanding voting securities, or a company which is under common control. At period end, the aggregate values of the fund's investments in affiliated issuers and in unaffiliated issuers were $149,103,317 and $2,752,215,824, respectively. |
| (i) | Interest only security for which the fund receives interest on notional principal (Par amount). Par amount shown is the notional principal and does not reflect the cost of the security. |
| (n) | Securities exempt from registration under Rule 144A of the Securities Act of 1933. These securities may be sold in the ordinary course of business in transactions exempt from registration, normally to qualified institutional buyers. At period end, the aggregate value of these securities was $1,025,349,531, representing 35.4% of net assets. |
| (q) | Interest received was less than stated coupon rate. |
| (v) | Affiliated issuer that is available only to investment companies managed by MFS. The rate quoted for the MFS Institutional Money Market Portfolio is the annualized seven-day yield of the fund at period end. |
| (w) | When-issued security. |
| (z) | Restricted securities are not registered under the Securities Act of 1933 and are subject to legal restrictions on resale. These securities generally may be resold in transactions exempt from registration or to the public if the securities are subsequently registered. Disposal of these securities may involve time-consuming negotiations and prompt sale at an acceptable price may be difficult. The fund holds the following restricted securities: |
| Restricted Securities | Acquisition Date | Cost | Value |
| Ambac Assurance Corp., 5.1%, 6/07/2060 | 2/14/18 | $9,214 | $32,801 |
| % of Net assets | 0.0% |
| The following abbreviations are used in this report and are defined: | |
| AGM | Assured Guaranty Municipal |
| BAM | Build America Mutual |
| CLO | Collateralized Loan Obligation |
| CMT | Constant Maturity Treasury |
| FLR | Floating Rate. Interest rate resets periodically based on the parenthetically disclosed reference rate plus a spread (if any). The period-end rate reported may not be the current rate. All reference rates are USD unless otherwise noted. |
| LIBOR | London Interbank Offered Rate |
| REIT | Real Estate Investment Trust |
| SOFR | Secured Overnight Financing Rate |
| Futures Contracts | ||||||
| Description | Long/ Short | Currency | Contracts | Notional Amount | Expiration Date | Value/Unrealized Appreciation (Depreciation) |
| Liability Derivatives | ||||||
| Interest Rate Futures | ||||||
| U.S. Treasury Note 2 yr | Long | USD | 201 | $41,080,945 | December – 2022 | $(854,248) |
| Cleared Swap Agreements | ||||||||||
| Maturity Date | Notional Amount | Counterparty | Cash Flows to Receive/ Frequency | Cash Flows to Pay/ Frequency | Unrealized Appreciation (Depreciation) | Net Unamortized Upfront Payments (Receipts) | Value | |||
| Liability Derivatives | ||||||||||
| Interest Rate Swaps | ||||||||||
| 8/19/24 | USD | 76,000,000 | centrally cleared | 3.31%/Annually | Daily SOFR/Annually | $(1,622,889) | $— | $(1,622,889) | ||
| 5/13/25 | USD | 155,100,000 | centrally cleared | 2.76%/Annually | Daily SOFR/Annually | (5,515,374) | — | (5,515,374) | ||
| 10/17/25 | USD | 73,100,000 | centrally cleared | 4.20%/Annually | Daily SOFR/Annually | (339,137) | — | (339,137) | ||
| $(7,477,400) | $— | $(7,477,400) | ||||||||
| Assets | |
| Investments in unaffiliated issuers, at value (identified cost, $2,948,694,272) | $2,752,215,824 |
| Investments in affiliated issuers, at value (identified cost, $149,104,688) | 149,103,317 |
| Cash | 134,756 |
| Receivables for | |
| Fund shares sold | 17,009,252 |
| Interest and dividends | 15,256,989 |
| Receivable from investment adviser | 25,573 |
| Other assets | 22,095 |
| Total assets | $2,933,767,806 |
| Liabilities | |
| Payables for | |
| Distributions | $210,783 |
| Net daily variation margin on open cleared swap agreements | 639,452 |
| Net daily variation margin on open futures contracts | 59,672 |
| Investments purchased | 4,354,000 |
| Fund shares reacquired | 6,264,471 |
| When-issued investments purchased | 24,749,531 |
| Payable to affiliates | |
| Administrative services fee | 4,798 |
| Shareholder servicing costs | 463,113 |
| Distribution and service fees | 20,778 |
| Accrued expenses and other liabilities | 112,614 |
| Total liabilities | $36,879,212 |
| Net assets | $2,896,888,594 |
| Net assets consist of | |
| Paid-in capital | $3,145,646,575 |
| Total distributable earnings (loss) | (248,757,981) |
| Net assets | $2,896,888,594 |
| Shares of beneficial interest outstanding | 517,862,979 |
| Net assets | Shares outstanding | Net asset value per share (a) | |
| Class A | $1,045,875,455 | 186,641,000 | $5.60 |
| Class B | 1,875,141 | 335,310 | 5.59 |
| Class C | 29,254,585 | 5,222,209 | 5.60 |
| Class I | 541,915,501 | 97,139,858 | 5.58 |
| Class R1 | 430,251 | 77,060 | 5.58 |
| Class R2 | 1,388,974 | 247,779 | 5.61 |
| Class R3 | 898,272 | 160,190 | 5.61 |
| Class R4 | 921,443 | 163,856 | 5.62 |
| Class R6 | 1,274,328,972 | 227,875,717 | 5.59 |
| (a) | Maximum offering price per share was equal to the net asset value per share for all share classes, except for Class A, for which the maximum offering price per share was $5.74 [100 / 97.50 x $5.60]. On sales of $50,000 or more, the maximum offering price of Class A shares is reduced. A contingent deferred sales charge may be imposed on redemptions of Class A, Class B, and Class C shares. Redemption price per share was equal to the net asset value per share for Classes I, R1, R2, R3, R4, and R6. |
| Net investment income (loss) | |
| Income | |
| Interest | $33,062,779 |
| Dividends from affiliated issuers | 735,302 |
| Other | 583,114 |
| Total investment income | $34,381,195 |
| Expenses | |
| Management fee | $5,391,244 |
| Distribution and service fees | 1,555,196 |
| Shareholder servicing costs | 893,568 |
| Program manager fees | 8,084 |
| Administrative services fee | 252,340 |
| Independent Trustees' compensation | 23,093 |
| Custodian fee | 100,641 |
| Shareholder communications | 49,008 |
| Audit and tax fees | 36,327 |
| Legal fees | 6,592 |
| Miscellaneous | 175,530 |
| Total expenses | $8,491,623 |
| Fees paid indirectly | (5,604) |
| Reduction of expenses by investment adviser and distributor | (1,671,145) |
| Net expenses | $6,814,874 |
| Net investment income (loss) | $27,566,321 |
| Realized and unrealized gain (loss) | |
| Realized gain (loss) (identified cost basis) | |
| Unaffiliated issuers | $(2,912,573) |
| Affiliated issuers | (6,722) |
| Futures contracts | (1,171,311) |
| Net realized gain (loss) | $(4,090,606) |
| Change in unrealized appreciation or depreciation | |
| Unaffiliated issuers | $(87,348,865) |
| Affiliated issuers | (1,371) |
| Futures contracts | 102,074 |
| Swap agreements | (7,477,400) |
| Net unrealized gain (loss) | $(94,725,562) |
| Net realized and unrealized gain (loss) | $(98,816,168) |
| Change in net assets from operations | $(71,249,847) |
| Six months ended | Year ended | |
| 10/31/22 (unaudited) | 4/30/22 | |
| Change in net assets | ||
| From operations | ||
| Net investment income (loss) | $27,566,321 | $32,804,638 |
| Net realized gain (loss) | (4,090,606) | 1,820,102 |
| Net unrealized gain (loss) | (94,725,562) | (145,475,431) |
| Change in net assets from operations | $(71,249,847) | $(110,850,691) |
| Total distributions to shareholders | $(29,946,820) | $(37,624,202) |
| Change in net assets from fund share transactions | $(42,228,892) | $452,962,150 |
| Total change in net assets | $(143,425,559) | $304,487,257 |
| Net assets | ||
| At beginning of period | 3,040,314,153 | 2,735,826,896 |
| At end of period | $2,896,888,594 | $3,040,314,153 |
| Class A | Six months ended | Year ended | ||||
| 10/31/22 (unaudited) | 4/30/22 | 4/30/21 | 4/30/20 | 4/30/19 | 4/30/18 | |
| Net asset value, beginning of period | $5.80 | $6.09 | $5.94 | $5.96 | $5.90 | $5.99 |
| Income (loss) from investment operations | ||||||
| Net investment income (loss) (d) | $0.05 | $0.06 | $0.09 | $0.14 | $0.14 | $0.10 |
| Net realized and unrealized gain (loss) | (0.20) | (0.28) | 0.18 | (0.01) | 0.06 | (0.08) |
| Total from investment operations | $(0.15) | $(0.22) | $0.27 | $0.13 | $0.20 | $0.02 |
| Less distributions declared to shareholders | ||||||
| From net investment income | $(0.05) | $(0.07) | $(0.12) | $(0.15) | $(0.14) | $(0.11) |
| Net asset value, end of period (x) | $5.60 | $5.80 | $6.09 | $5.94 | $5.96 | $5.90 |
| Total return (%) (r)(s)(t)(x) | (2.53)(n) | (3.59) | 4.59 | 2.21 | 3.43 | 0.36 |
| Ratios (%) (to average net assets) and Supplemental data: | ||||||
| Expenses before expense reductions (f) | 0.74(a) | 0.75 | 0.78 | 0.80 | 0.82 | 0.83 |
| Expenses after expense reductions (f) | 0.57(a) | 0.57 | 0.58 | 0.64 | 0.71 | 0.72 |
| Net investment income (loss) | 1.72(a) | 1.04 | 1.56 | 2.41 | 2.30 | 1.68 |
| Portfolio turnover | 17(n) | 39 | 35 | 41 | 55 | 57 |
| Net assets at end of period (000 omitted) | $1,045,875 | $1,046,034 | $1,042,239 | $730,945 | $606,885 | $486,144 |
| Class B | Six months ended | Year ended | ||||
| 10/31/22 (unaudited) | 4/30/22 | 4/30/21 | 4/30/20 | 4/30/19 | 4/30/18 | |
| Net asset value, beginning of period | $5.79 | $6.08 | $5.93 | $5.95 | $5.88 | $5.97 |
| Income (loss) from investment operations | ||||||
| Net investment income (loss) (d) | $0.03 | $0.02 | $0.05 | $0.10 | $0.09 | $0.06 |
| Net realized and unrealized gain (loss) | (0.20) | (0.28) | 0.18 | (0.01) | 0.07 | (0.08) |
| Total from investment operations | $(0.17) | $(0.26) | $0.23 | $0.09 | $0.16 | $(0.02) |
| Less distributions declared to shareholders | ||||||
| From net investment income | $(0.03) | $(0.03) | $(0.08) | $(0.11) | $(0.09) | $(0.07) |
| Net asset value, end of period (x) | $5.59 | $5.79 | $6.08 | $5.93 | $5.95 | $5.88 |
| Total return (%) (r)(s)(t)(x) | (2.90)(n) | (4.32) | 3.82 | 1.45 | 2.83 | (0.39) |
| Ratios (%) (to average net assets) and Supplemental data: | ||||||
| Expenses before expense reductions (f) | 1.49(a) | 1.50 | 1.53 | 1.55 | 1.57 | 1.58 |
| Expenses after expense reductions (f) | 1.32(a) | 1.32 | 1.34 | 1.39 | 1.46 | 1.48 |
| Net investment income (loss) | 0.96(a) | 0.29 | 0.84 | 1.67 | 1.56 | 0.93 |
| Portfolio turnover | 17(n) | 39 | 35 | 41 | 55 | 57 |
| Net assets at end of period (000 omitted) | $1,875 | $2,361 | $2,931 | $2,714 | $3,703 | $3,779 |
| Class C | Six months ended | Year ended | ||||
| 10/31/22 (unaudited) | 4/30/22 | 4/30/21 | 4/30/20 | 4/30/19 | 4/30/18 | |
| Net asset value, beginning of period | $5.80 | $6.09 | $5.94 | $5.96 | $5.89 | $5.98 |
| Income (loss) from investment operations | ||||||
| Net investment income (loss) (d) | $0.03 | $0.01 | $0.05 | $0.09 | $0.09 | $0.05 |
| Net realized and unrealized gain (loss) | (0.20) | (0.28) | 0.17 | (0.01) | 0.07 | (0.08) |
| Total from investment operations | $(0.17) | $(0.27) | $0.22 | $0.08 | $0.16 | $(0.03) |
| Less distributions declared to shareholders | ||||||
| From net investment income | $(0.03) | $(0.02) | $(0.07) | $(0.10) | $(0.09) | $(0.06) |
| Net asset value, end of period (x) | $5.60 | $5.80 | $6.09 | $5.94 | $5.96 | $5.89 |
| Total return (%) (r)(s)(t)(x) | (2.94)(n) | (4.41) | 3.71 | 1.35 | 2.73 | (0.49) |
| Ratios (%) (to average net assets) and Supplemental data: | ||||||
| Expenses before expense reductions (f) | 1.49(a) | 1.50 | 1.53 | 1.55 | 1.57 | 1.58 |
| Expenses after expense reductions (f) | 1.42(a) | 1.42 | 1.43 | 1.49 | 1.56 | 1.58 |
| Net investment income (loss) | 0.87(a) | 0.19 | 0.75 | 1.57 | 1.45 | 0.83 |
| Portfolio turnover | 17(n) | 39 | 35 | 41 | 55 | 57 |
| Net assets at end of period (000 omitted) | $29,255 | $31,747 | $39,241 | $42,281 | $47,447 | $56,372 |
| Class I | Six months ended | Year ended | ||||
| 10/31/22 (unaudited) | 4/30/22 | 4/30/21 | 4/30/20 | 4/30/19 | 4/30/18 | |
| Net asset value, beginning of period | $5.77 | $6.07 | $5.92 | $5.93 | $5.87 | $5.96 |
| Income (loss) from investment operations | ||||||
| Net investment income (loss) (d) | $0.05 | $0.07 | $0.10 | $0.15 | $0.14 | $0.11 |
| Net realized and unrealized gain (loss) | (0.18) | (0.29) | 0.18 | (0.00)(w) | 0.07 | (0.08) |
| Total from investment operations | $(0.13) | $(0.22) | $0.28 | $0.15 | $0.21 | $0.03 |
| Less distributions declared to shareholders | ||||||
| From net investment income | $(0.06) | $(0.08) | $(0.13) | $(0.16) | $(0.15) | $(0.12) |
| Net asset value, end of period (x) | $5.58 | $5.77 | $6.07 | $5.92 | $5.93 | $5.87 |
| Total return (%) (r)(s)(t)(x) | (2.29)(n) | (3.63) | 4.75 | 2.54 | 3.59 | 0.51 |
| Ratios (%) (to average net assets) and Supplemental data: | ||||||
| Expenses before expense reductions (f) | 0.49(a) | 0.50 | 0.53 | 0.55 | 0.57 | 0.58 |
| Expenses after expense reductions (f) | 0.42(a) | 0.42 | 0.43 | 0.49 | 0.56 | 0.58 |
| Net investment income (loss) | 1.86(a) | 1.19 | 1.69 | 2.56 | 2.46 | 1.81 |
| Portfolio turnover | 17(n) | 39 | 35 | 41 | 55 | 57 |
| Net assets at end of period (000 omitted) | $541,916 | $570,543 | $453,159 | $258,164 | $187,021 | $141,291 |
| Class R1 | Six months ended | Year ended | ||||
| 10/31/22 (unaudited) | 4/30/22 | 4/30/21 | 4/30/20 | 4/30/19 | 4/30/18 | |
| Net asset value, beginning of period | $5.78 | $6.08 | $5.93 | $5.94 | $5.88 | $5.97 |
| Income (loss) from investment operations | ||||||
| Net investment income (loss) (d) | $0.02 | $0.01 | $0.05 | $0.09 | $0.09 | $0.05 |
| Net realized and unrealized gain (loss) | (0.19) | (0.29) | 0.17 | (0.00)(w) | 0.06 | (0.08) |
| Total from investment operations | $(0.17) | $(0.28) | $0.22 | $0.09 | $0.15 | $(0.03) |
| Less distributions declared to shareholders | ||||||
| From net investment income | $(0.03) | $(0.02) | $(0.07) | $(0.10) | $(0.09) | $(0.06) |
| Net asset value, end of period (x) | $5.58 | $5.78 | $6.08 | $5.93 | $5.94 | $5.88 |
| Total return (%) (r)(s)(t)(x) | (2.95)(n) | (4.58) | 3.71 | 1.52 | 2.55 | (0.49) |
| Ratios (%) (to average net assets) and Supplemental data: | ||||||
| Expenses before expense reductions (f) | 1.50(a) | 1.50 | 1.53 | 1.55 | 1.57 | 1.58 |
| Expenses after expense reductions (f) | 1.42(a) | 1.42 | 1.44 | 1.48 | 1.56 | 1.58 |
| Net investment income (loss) | 0.76(a) | 0.18 | 0.74 | 1.57 | 1.47 | 0.83 |
| Portfolio turnover | 17(n) | 39 | 35 | 41 | 55 | 57 |
| Net assets at end of period (000 omitted) | $430 | $1,252 | $1,597 | $1,593 | $451 | $294 |
| Class R2 | Six months ended | Year ended | ||||
| 10/31/22 (unaudited) | 4/30/22 | 4/30/21 | 4/30/20 | 4/30/19 | 4/30/18 | |
| Net asset value, beginning of period | $5.80 | $6.10 | $5.94 | $5.96 | $5.89 | $5.98 |
| Income (loss) from investment operations | ||||||
| Net investment income (loss) (d) | $0.04 | $0.05 | $0.08 | $0.13 | $0.12 | $0.08 |
| Net realized and unrealized gain (loss) | (0.18) | (0.29) | 0.19 | (0.01) | 0.07 | (0.07) |
| Total from investment operations | $(0.14) | $(0.24) | $0.27 | $0.12 | $0.19 | $0.01 |
| Less distributions declared to shareholders | ||||||
| From net investment income | $(0.05) | $(0.06) | $(0.11) | $(0.14) | $(0.12) | $(0.10) |
| Net asset value, end of period (x) | $5.61 | $5.80 | $6.10 | $5.94 | $5.96 | $5.89 |
| Total return (%) (r)(s)(t)(x) | (2.47)(n) | (3.99) | 4.50 | 1.96 | 3.34 | 0.11 |
| Ratios (%) (to average net assets) and Supplemental data: | ||||||
| Expenses before expense reductions (f) | 0.99(a) | 1.00 | 1.03 | 1.05 | 1.07 | 1.08 |
| Expenses after expense reductions (f) | 0.82(a) | 0.82 | 0.84 | 0.90 | 0.96 | 0.98 |
| Net investment income (loss) | 1.45(a) | 0.79 | 1.32 | 2.17 | 2.04 | 1.42 |
| Portfolio turnover | 17(n) | 39 | 35 | 41 | 55 | 57 |
| Net assets at end of period (000 omitted) | $1,389 | $1,646 | $1,997 | $1,579 | $2,524 | $2,908 |
| Class R3 | Six months ended | Year ended | ||||
| 10/31/22 (unaudited) | 4/30/22 | 4/30/21 | 4/30/20 | 4/30/19 | 4/30/18 | |
| Net asset value, beginning of period | $5.80 | $6.10 | $5.95 | $5.96 | $5.90 | $5.99 |
| Income (loss) from investment operations | ||||||
| Net investment income (loss) (d) | $0.05 | $0.06 | $0.09 | $0.14 | $0.13 | $0.09 |
| Net realized and unrealized gain (loss) | (0.19) | (0.29) | 0.18 | (0.00)(w) | 0.06 | (0.07) |
| Total from investment operations | $(0.14) | $(0.23) | $0.27 | $0.14 | $0.19 | $0.02 |
| Less distributions declared to shareholders | ||||||
| From net investment income | $(0.05) | $(0.07) | $(0.12) | $(0.15) | $(0.13) | $(0.11) |
| Net asset value, end of period (x) | $5.61 | $5.80 | $6.10 | $5.95 | $5.96 | $5.90 |
| Total return (%) (r)(s)(t)(x) | (2.40)(n) | (3.85) | 4.48 | 2.28 | 3.32 | 0.26 |
| Ratios (%) (to average net assets) and Supplemental data: | ||||||
| Expenses before expense reductions (f) | 0.74(a) | 0.75 | 0.78 | 0.80 | 0.82 | 0.83 |
| Expenses after expense reductions (f) | 0.67(a) | 0.67 | 0.69 | 0.75 | 0.81 | 0.83 |
| Net investment income (loss) | 1.61(a) | 0.96 | 1.50 | 2.32 | 2.19 | 1.57 |
| Portfolio turnover | 17(n) | 39 | 35 | 41 | 55 | 57 |
| Net assets at end of period (000 omitted) | $898 | $1,001 | $1,318 | $1,512 | $2,249 | $2,140 |
| Class R4 | Six months ended | Year ended | ||||
| 10/31/22 (unaudited) | 4/30/22 | 4/30/21 | 4/30/20 | 4/30/19 | 4/30/18 | |
| Net asset value, beginning of period | $5.82 | $6.11 | $5.96 | $5.99 | $5.89 | $5.98 |
| Income (loss) from investment operations | ||||||
| Net investment income (loss) (d) | $0.05 | $0.07 | $0.11 | $0.15 | $0.15 | $0.11 |
| Net realized and unrealized gain (loss) | (0.19) | (0.28) | 0.17 | (0.02) | 0.10(g) | (0.08) |
| Total from investment operations | $(0.14) | $(0.21) | $0.28 | $0.13 | $0.25 | $0.03 |
| Less distributions declared to shareholders | ||||||
| From net investment income | $(0.06) | $(0.08) | $(0.13) | $(0.16) | $(0.15) | $(0.12) |
| Net asset value, end of period (x) | $5.62 | $5.82 | $6.11 | $5.96 | $5.99 | $5.89 |
| Total return (%) (r)(s)(t)(x) | (2.44)(n) | (3.43) | 4.74 | 2.20 | 4.28 | 0.51 |
| Ratios (%) (to average net assets) and Supplemental data: | ||||||
| Expenses before expense reductions (f) | 0.49(a) | 0.50 | 0.53 | 0.55 | 0.63 | 0.58 |
| Expenses after expense reductions (f) | 0.42(a) | 0.42 | 0.44 | 0.49 | 0.62 | 0.58 |
| Net investment income (loss) | 1.87(a) | 1.16 | 1.73 | 2.58 | 2.60 | 1.84 |
| Portfolio turnover | 17(n) | 39 | 35 | 41 | 55 | 57 |
| Net assets at end of period (000 omitted) | $921 | $906 | $275 | $242 | $304 | $6,537 |
| Class R6 | Six months ended | Year ended | ||||
| 10/31/22 (unaudited) | 4/30/22 | 4/30/21 | 4/30/20 | 4/30/19 | 4/30/18 | |
| Net asset value, beginning of period | $5.79 | $6.08 | $5.93 | $5.95 | $5.88 | $5.97 |
| Income (loss) from investment operations | ||||||
| Net investment income (loss) (d) | $0.06 | $0.08 | $0.11 | $0.16 | $0.15 | $0.11 |
| Net realized and unrealized gain (loss) | (0.20) | (0.28) | 0.17 | (0.02) | 0.07 | (0.08) |
| Total from investment operations | $(0.14) | $(0.20) | $0.28 | $0.14 | $0.22 | $0.03 |
| Less distributions declared to shareholders | ||||||
| From net investment income | $(0.06) | $(0.09) | $(0.13) | $(0.16) | $(0.15) | $(0.12) |
| Net asset value, end of period (x) | $5.59 | $5.79 | $6.08 | $5.93 | $5.95 | $5.88 |
| Total return (%) (r)(s)(t)(x) | (2.42)(n) | (3.39) | 4.82 | 2.43 | 3.82 | 0.58 |
| Ratios (%) (to average net assets) and Supplemental data: | ||||||
| Expenses before expense reductions (f) | 0.42(a) | 0.43 | 0.46 | 0.48 | 0.50 | 0.51 |
| Expenses after expense reductions (f) | 0.35(a) | 0.35 | 0.37 | 0.42 | 0.49 | 0.50 |
| Net investment income (loss) | 1.95(a) | 1.26 | 1.77 | 2.64 | 2.51 | 1.91 |
| Portfolio turnover | 17(n) | 39 | 35 | 41 | 55 | 57 |
| Net assets at end of period (000 omitted) | $1,274,329 | $1,116,143 | $942,709 | $599,945 | $561,643 | $524,653 |
| (a) | Annualized. |
| (d) | Per share data is based on average shares outstanding. |
| (f) | Ratios do not reflect reductions from fees paid indirectly, if applicable. See Note 2 in the Notes to Financial Statements for additional information. |
| (g) | The per share amount varies from the net realized and unrealized gain/loss for the period because of the timing of sales of fund shares and the per share amount of realized and unrealized gains and losses at such time. |
| (n) | Not annualized. |
| (r) | Certain expenses have been reduced without which performance would have been lower. |
| (s) | From time to time the fund may receive proceeds from litigation settlements, without which performance would be lower. |
| (t) | Total returns do not include any applicable sales charges. |
| (w) | Per share amount was less than $0.01. |
| (x) | The net asset values and total returns have been calculated on net assets which include adjustments made in accordance with U.S. generally accepted accounting principles required at period end for financial reporting purposes. |
| Financial Instruments | Level 1 | Level 2 | Level 3 | Total |
| U.S. Treasury Bonds & U.S. Government Agencies & Equivalents | $— | $589,094,343 | $— | $589,094,343 |
| Non - U.S. Sovereign Debt | — | 19,949,798 | — | 19,949,798 |
| Municipal Bonds | — | 35,467,997 | — | 35,467,997 |
| U.S. Corporate Bonds | — | 917,624,435 | — | 917,624,435 |
| Residential Mortgage-Backed Securities | — | 20,755,967 | — | 20,755,967 |
| Commercial Mortgage-Backed Securities | — | 174,050,927 | — | 174,050,927 |
| Asset-Backed Securities (including CDOs) | — | 412,497,747 | — | 412,497,747 |
| Foreign Bonds | — | 582,774,610 | — | 582,774,610 |
| Mutual Funds | 149,103,317 | — | — | 149,103,317 |
| Total | $149,103,317 | $2,752,215,824 | $— | $2,901,319,141 |
| Other Financial Instruments | ||||
| Futures Contracts – Liabilities | $(854,248) | $— | $— | $(854,248) |
| Swap Agreements – Liabilities | — | (7,477,400) | — | (7,477,400) |
| Fair Value (a) | |||
| Risk | Derivative Contracts | Liability Derivatives | |
| Interest Rate | Futures Contracts | $(854,248) | |
| Interest Rate | Cleared Swap Agreements | (7,477,400) | |
| Total | $(8,331,648) | ||
| Risk | Futures Contracts |
| Interest Rate | $(1,171,311) |
| Risk | Futures Contracts | Swap Agreements |
| Interest Rate | $102,074 | $(7,477,400) |
| Year ended 4/30/22 | |
| Ordinary income (including any short-term capital gains) | $37,624,202 |
| As of 10/31/22 | |
| Cost of investments | $3,107,582,182 |
| Gross appreciation | 122,048 |
| Gross depreciation | (206,385,089) |
| Net unrealized appreciation (depreciation) | $(206,263,041) |
| As of 4/30/22 | |
| Undistributed ordinary income | 3,562,293 |
| Capital loss carryforwards | (30,349,982) |
| Other temporary differences | (3,306,464) |
| Net unrealized appreciation (depreciation) | (117,467,161) |
| Long-Term | $(30,349,982) |
| Six months ended 10/31/22 | Year ended 4/30/22 | |
| Class A | $10,068,798 | $12,810,583 |
| Class B | 12,627 | 12,776 |
| Class C | 161,958 | 136,687 |
| Class I | 5,793,244 | 7,092,573 |
| Class R1 | 3,613 | 5,810 |
| Class R2 | 12,036 | 18,028 |
| Class R3 | 8,381 | 12,167 |
| Class R4 | 9,426 | 14,059 |
| Class R6 | 13,676,841 | 15,016,740 |
| Class 529A | 199,896 | 2,388,231 |
| Class 529B | — | 10,512 |
| Class 529C | — | 106,036 |
| Total | $29,946,820 | $37,624,202 |
| Up to $1 billion | 0.40% |
| In excess of $1 billion and up to $2.5 billion | 0.35% |
| In excess of $2.5 billion | 0.30% |
| Distribution Fee Rate (d) | Service Fee Rate (d) | Total Distribution Plan (d) | Annual Effective Rate (e) | Distribution and Service Fee | |
| Class A | — | 0.25% | 0.25% | 0.15% | $ 1,337,485 |
| Class B | 0.75% | 0.25% | 1.00% | 0.90% | 11,277 |
| Class C | 0.75% | 0.25% | 1.00% | 1.00% | 157,124 |
| Class R1 | 0.75% | 0.25% | 1.00% | 1.00% | 3,975 |
| Class R2 | 0.25% | 0.25% | 0.50% | 0.40% | 3,732 |
| Class R3 | — | 0.25% | 0.25% | 0.25% | 1,182 |
| Class 529A | — | 0.25% | 0.25% | 0.02% | 40,421 |
| Total Distribution and Service Fees | $1,555,196 |
| (d) | In accordance with the distribution plan for certain classes, the fund pays distribution and/or service fees equal to these annual percentage rates of each class’s average daily net assets. The distribution and service fee rates disclosed by class represent the current rates in effect at the end of the reporting period. Any rate changes, if applicable, are detailed below. |
| (e) | The annual effective rates represent actual fees incurred under the distribution plan for the six months ended October 31, 2022 based on each class's average daily net assets. The annual effective rates represent actual fees incurred under the distribution plan for the six months ended October 31, 2022, based on each class’s average daily net assets. 0.10% of the Class A, Class B and Class 529A service fee is currently being waived under a written waiver agreement. For the six months October 31, 2022, this waiver amounted to $534,990, $1,128, and $16,168 for Class A, Class B, and Class 529A, respectively, and is included in the reduction of total expenses in the Statement of Operations. This written waiver agreement will continue until modified by the fund’s Board of Trustees, but such agreement will continue at least until August 31, 2023. 0.10% of the Class R2 distribution fee is currently being waived under a written waiver agreement. For the six months ended October 31, 2022, this waiver amounted to $746 and is included in the reduction of total expenses in the Statement of Operations. This written waiver agreement will continue until modified by the fund’s Board of Trustees, but such agreement will continue at least until August 31, 2023. MFD has voluntarily agreed to rebate a portion of each class’s 0.25% service fee attributable to accounts for which there is no financial intermediary specified on the account except for accounts attributable to MFS or its affiliates’ seed money. For the six months ended October 31, 2022, this rebate amounted to $100 and $2,088, for Class A and Class 529A shares respectively, and is included in the reduction of total expenses in the Statement of Operations. |
| Amount | |
| Class A | $84,353 |
| Class B | 1,814 |
| Class C | 4,763 |
| Fee | |
| Class 529A | $8,084 |
| Purchases | Sales | |
| U.S. Government securities | $290,473,119 | $290,557,375 |
| Non-U.S. Government securities | 198,108,867 | 229,173,614 |
| Six months ended 10/31/22 | Year ended 4/30/22 | ||||
| Shares | Amount | Shares | Amount | ||
| Shares sold | |||||
| Class A | 43,550,634 | $249,465,844 | 86,778,837 | $521,056,716 | |
| Class B | 31,086 | 176,302 | 183,031 | 1,099,205 | |
| Class C | 1,313,750 | 7,518,034 | 1,918,779 | 11,513,621 | |
| Class I | 31,229,751 | 177,924,908 | 76,084,181 | 455,165,312 | |
| Class R1 | 1,766 | 10,075 | 64,702 | 391,258 | |
| Class R2 | 9,884 | 56,529 | 77,506 | 463,314 | |
| Class R3 | 26,131 | 149,430 | 54,107 | 326,851 | |
| Class R4 | 12,424 | 71,152 | 206,483 | 1,259,581 | |
| Class R6 | 81,567,760 | 468,806,371 | 63,439,661 | 380,041,306 | |
| Class 529A | 266,200 | 1,543,975 | 23,913,148 | 142,710,255 | |
| Class 529B | — | — | 213,931 | 1,294,442 | |
| Class 529C | — | — | 2,486,150 | 15,048,298 | |
| 158,009,386 | $905,722,620 | 255,420,516 | $1,530,370,159 | ||
| Six months ended 10/31/22 | Year ended 4/30/22 | ||||
| Shares | Amount | Shares | Amount | ||
| Shares issued to shareholders in reinvestment of distributions | |||||
| Class A | 1,732,300 | $9,874,583 | 1,977,358 | $11,887,315 | |
| Class B | 2,222 | 12,624 | 2,075 | 12,489 | |
| Class C | 25,526 | 145,147 | 20,445 | 123,531 | |
| Class I | 899,402 | 5,102,628 | 1,072,997 | 6,414,857 | |
| Class R1 | 616 | 3,506 | 964 | 5,810 | |
| Class R2 | 2,053 | 11,708 | 2,964 | 17,859 | |
| Class R3 | 1,469 | 8,381 | 1,999 | 12,033 | |
| Class R4 | 1,648 | 9,426 | 2,330 | 14,059 | |
| Class R6 | 2,380,836 | 13,535,412 | 2,461,632 | 14,760,610 | |
| Class 529A | — | — | 384,355 | 2,312,326 | |
| Class 529B | — | — | 1,653 | 10,025 | |
| Class 529C | — | — | 16,501 | 100,299 | |
| 5,046,072 | $28,703,415 | 5,945,273 | $35,671,213 | ||
| Shares reacquired | |||||
| Class A | (39,064,627) | $(223,549,213) | (79,336,015) | $(477,914,545) | |
| Class B | (106,012) | (599,390) | (259,027) | (1,545,993) | |
| Class C | (1,594,200) | (9,096,049) | (2,902,597) | (17,434,007) | |
| Class I | (33,831,086) | (192,520,728) | (52,990,618) | (316,050,111) | |
| Class R1 | (141,843) | (811,201) | (111,918) | (669,084) | |
| Class R2 | (47,931) | (274,691) | (124,185) | (746,996) | |
| Class R3 | (40,005) | (229,808) | (99,637) | (603,145) | |
| Class R4 | (5,971) | (34,108) | (98,084) | (591,315) | |
| Class R6 | (48,989,746) | (279,955,953) | (27,977,440) | (167,143,276) | |
| Class 529A | (46,544,984) | (269,583,786) | (12,281,049) | (73,998,631) | |
| Class 529B | — | — | (812,524) | (4,805,493) | |
| Class 529C | — | — | (8,709,189) | (51,576,626) | |
| (170,366,405) | $(976,654,927) | (185,702,283) | $(1,113,079,222) | ||
| Six months ended 10/31/22 | Year ended 4/30/22 | ||||
| Shares | Amount | Shares | Amount | ||
| Net change | |||||
| Class A | 6,218,307 | $35,791,214 | 9,420,180 | $55,029,486 | |
| Class B | (72,704) | (410,464) | (73,921) | (434,299) | |
| Class C | (254,924) | (1,432,868) | (963,373) | (5,796,855) | |
| Class I | (1,701,933) | (9,493,192) | 24,166,560 | 145,530,058 | |
| Class R1 | (139,461) | (797,620) | (46,252) | (272,016) | |
| Class R2 | (35,994) | (206,454) | (43,715) | (265,823) | |
| Class R3 | (12,405) | (71,997) | (43,531) | (264,261) | |
| Class R4 | 8,101 | 46,470 | 110,729 | 682,325 | |
| Class R6 | 34,958,850 | 202,385,830 | 37,923,853 | 227,658,640 | |
| Class 529A | (46,278,784) | (268,039,811) | 12,016,454 | 71,023,950 | |
| Class 529B | — | — | (596,940) | (3,501,026) | |
| Class 529C | — | — | (6,206,538) | (36,428,029) | |
| (7,310,947) | $(42,228,892) | 75,663,506 | $452,962,150 | ||
| Affiliated Issuers | Beginning Value | Purchases | Sales Proceeds | Realized Gain (Loss) | Change in Unrealized Appreciation or Depreciation | Ending Value |
| MFS Institutional Money Market Portfolio | $155,032,857 | $389,011,733 | $394,933,180 | $(6,722) | $(1,371) | $149,103,317 |
| Affiliated Issuers | Dividend Income | Capital Gain Distributions |
| MFS Institutional Money Market Portfolio | $735,302 | $— |


Maturity Fund

Maturity Fund
| 1 | |
| 2 | |
| 4 | |
| 6 | |
| 108 | |
| 110 | |
| 111 | |
| 112 | |
| 116 | |
| 126 | |
| 130 | |
| 130 | |
| 130 | |
| 130 | |
| 130 |
| back cover |


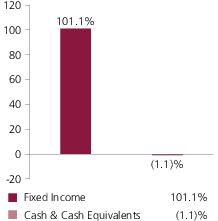
| Healthcare Revenue - Hospitals | 13.1% |
| General Obligations - General Purpose | 10.3% |
| General Obligations - Schools | 8.4% |
| Airport Revenue | 7.6% |
| Multi-Family Housing Revenue | 6.7% |
| Utilities - Other | 5.7% |
| Student Loan Revenue | 5.4% |
| Utilities - Investor Owned | 5.2% |
| Universities - Colleges | 4.2% |
| Single Family Housing - State | 3.2% |
| AAA | 7.7% |
| AA | 26.5% |
| A | 39.6% |
| BBB | 17.1% |
| BB | 4.4% |
| B | 0.1% |
| CCC | 0.5% |
| CC (o) | 0.0% |
| D | 0.2% |
| Not Rated | 5.0% |
| Cash & Cash Equivalents | (1.1)% |
| Average Duration (d) | 3.1 |
| Average Effective Maturity (m) | 3.9 yrs. |
| (a) | For all securities other than those specifically described below, ratings are assigned to underlying securities utilizing ratings from Moody’s, Fitch, and Standard & Poor’s rating agencies and applying the following hierarchy: If all three agencies provide a rating, the middle rating (after dropping the highest and lowest ratings) is assigned; if two of the three agencies rate a security, the lower of the two is assigned. If none of the 3 rating agencies above assign a rating, but the security is rated by DBRS Morningstar, then the DBRS Morningstar rating is assigned. If none of the 4 rating agencies listed above rate the security, but the security is rated by the Kroll Bond Rating Agency (KBRA), then the KBRA rating is assigned. Ratings are shown in the S&P and Fitch scale (e.g., AAA). Securities rated BBB or higher are considered investment grade. All ratings are subject to change. Not Rated includes fixed income securities and fixed income derivatives that have not been rated by any rating agency. The fund may or may not have held all of these instruments on this date. The fund is not rated by these agencies. |
| (d) | Duration is a measure of how much a bond’s price is likely to fluctuate with general changes in interest rates, e.g., if rates rise 1.00%, a bond with a 5-year duration is likely to lose about 5.00% of its value due to the interest rate move. The Average Duration calculation reflects the impact of the equivalent exposure of derivative positions, if any. |
| (i) | For purposes of this presentation, the components include the value of securities, and reflect the impact of the equivalent exposure of derivative positions, if any. These amounts may be negative from time to time. Equivalent exposure is a calculated amount that translates the derivative position into a reasonable approximation of the amount of the underlying asset that the portfolio would have to hold at a given point in time to have the same price sensitivity that results from the portfolio’s ownership of the derivative contract. When dealing with derivatives, equivalent exposure is a more representative measure of the potential impact of a position on portfolio performance than value. The bond component will include any accrued interest amounts. |
| (m) | In determining each instrument’s effective maturity for purposes of calculating the fund’s dollar-weighted average effective maturity, MFS uses the instrument’s stated maturity or, if applicable, an earlier date on which MFS believes it is probable that a maturity-shortening device (such as a put, pre-refunding or prepayment) will cause the instrument to be repaid. Such an earlier date can be substantially shorter than the instrument’s stated maturity. |
| (o) | Less than 0.1%. |
May 1, 2022 through October 31, 2022
| Share Class | Annualized Expense Ratio | Beginning Account Value 5/01/22 | Ending Account Value 10/31/22 | Expenses Paid During Period (p) 5/01/22-10/31/22 | |
| A | Actual | 0.61% | $1,000.00 | $979.54 | $3.04 |
| Hypothetical(h) | 0.61% | $1,000.00 | $1,022.13 | $3.11 | |
| B | Actual | 1.36% | $1,000.00 | $974.53 | $6.77 |
| Hypothetical(h) | 1.36% | $1,000.00 | $1,018.35 | $6.92 | |
| C | Actual | 1.46% | $1,000.00 | $975.35 | $7.27 |
| Hypothetical(h) | 1.46% | $1,000.00 | $1,017.85 | $7.43 | |
| I | Actual | 0.46% | $1,000.00 | $980.23 | $2.30 |
| Hypothetical(h) | 0.46% | $1,000.00 | $1,022.89 | $2.35 | |
| R6 | Actual | 0.37% | $1,000.00 | $980.60 | $1.85 |
| Hypothetical(h) | 0.37% | $1,000.00 | $1,023.34 | $1.89 |
| (h) | 5% class return per year before expenses. |
| (p) | “Expenses Paid During Period” are equal to each class’s annualized expense ratio, as shown above, multiplied by the average account value over the period, multiplied by 184/365 (to reflect the one-half year period). Expenses paid do not include any applicable sales charges (loads). If these transaction costs had been included, your costs would have been higher. |
| Issuer | Shares/Par | Value ($) | ||
| Municipal Bonds - 99.5% | ||||
| Alabama - 2.8% | ||||
| Alabama Community College System, Board of Trustees Rev. (Wallace State Community College - Hanceville Rev.), BAM, 3.5%, 11/01/2026 | $ | 1,245,000 | $1,233,117 | |
| Alabama Community College System, Board of Trustees Rev. (Wallace State Community College - Hanceville Rev.), BAM, 3.5%, 11/01/2027 | 1,290,000 | 1,270,392 | ||
| Alabama Community College System, Board of Trustees Rev. (Wallace State Community College - Hanceville Rev.), BAM, 4%, 11/01/2028 | 1,330,000 | 1,349,192 | ||
| Alabama Community College System, Board of Trustees Rev. (Wallace State Community College - Hanceville Rev.), BAM, 4%, 11/01/2029 | 1,385,000 | 1,405,460 | ||
| Alabama Housing Finance Authority, Multi-Family Housing Rev. (Maryvale Place Project), “F”, HUD Section 8, 4%, 10/01/2025 (Put Date 4/01/2025) | 4,645,000 | 4,621,321 | ||
| Alabama Southeast Energy Authority Commodity Supply Rev. (Project No. 2), “A”, 4%, 12/01/2051 (Put Date 12/01/2031) | 7,130,000 | 6,418,440 | ||
| Alabama Southeast Energy Authority Commodity Supply Rev. (Project No. 3), “A-1”, 5.5%, 1/01/2053 (Put Date 12/01/2029) (w) | 3,865,000 | 3,906,754 | ||
| Alabama Southeast Energy Authority Commodity Supply Rev. (Project No. 4), “B-1”, 5%, 5/01/2053 (Put Date 8/01/2028) | 6,380,000 | 6,281,343 | ||
| Birmingham, AL, Airport Authority Rev., BAM, 5%, 7/01/2023 | 225,000 | 227,361 | ||
| Birmingham, AL, Airport Authority Rev., BAM, 5%, 7/01/2024 | 325,000 | 332,845 | ||
| Birmingham, AL, Airport Authority Rev., BAM, 5%, 7/01/2025 | 500,000 | 517,257 | ||
| Birmingham, AL, Airport Authority Rev., BAM, 5%, 7/01/2026 | 450,000 | 469,786 | ||
| Birmingham, AL, Airport Authority Rev., BAM, 5%, 7/01/2027 | 500,000 | 524,064 | ||
| Birmingham, AL, Airport Authority Rev., BAM, 5%, 7/01/2028 | 700,000 | 736,212 | ||
| Birmingham, AL, Airport Authority Rev., BAM, 5%, 7/01/2029 | 1,500,000 | 1,580,750 | ||
| Black Belt Energy Gas District, AL, Gas Prepay Rev., “A”, 4%, 12/01/2048 (Put Date 12/01/2023) | 3,750,000 | 3,727,659 | ||
| Black Belt Energy Gas District, AL, Gas Prepay Rev., “B-1”, FLR, 2.996% (67% of LIBOR - 1mo. + 0.9%), 12/01/2048 (Put Date 12/01/2023) | 11,480,000 | 11,351,353 | ||
| Black Belt Energy Gas District, AL, Gas Project Rev., “F”, 5.5%, 11/01/2053 (Put Date 12/01/2028) | 3,795,000 | 3,833,028 | ||
| Black Belt Energy Gas District, AL, Gas Supply Rev., “D-1”, 4%, 7/01/2052 (Put Date 6/01/2027) | 4,270,000 | 4,135,301 | ||
| Chatom, AL, Industrial Development Board Gulf Opportunity Zone (PowerSouth Energy), AGM, 5%, 8/01/2023 | 450,000 | 454,610 | ||
| Issuer | Shares/Par | Value ($) | ||
| Municipal Bonds - continued | ||||
| Alabama - continued | ||||
| Chatom, AL, Industrial Development Board Gulf Opportunity Zone (PowerSouth Energy), AGM, 5%, 8/01/2025 | $ | 850,000 | $881,301 | |
| Chatom, AL, Industrial Development Board Gulf Opportunity Zone (PowerSouth Energy), AGM, 5%, 8/01/2027 | 1,100,000 | 1,161,054 | ||
| Chatom, AL, Industrial Development Board Gulf Opportunity Zone (PowerSouth Energy), AGM, 5%, 8/01/2028 | 610,000 | 649,654 | ||
| Chatom, AL, Industrial Development Board Gulf Opportunity Zone (PowerSouth Energy), AGM, 5%, 8/01/2029 | 400,000 | 429,538 | ||
| Houston County, AL, Health Care Authority (Southeast Alabama Medical Center), “A”, 5%, 10/01/2025 | 1,165,000 | 1,188,628 | ||
| Mobile County, AL, Board of School Commissioners Special Tax School Warrants, 5%, 3/01/2031 | 1,100,000 | 1,184,232 | ||
| Mobile County, AL, Board of School Commissioners Special Tax School Warrants , 4%, 3/01/2024 | 540,000 | 543,488 | ||
| Mobile County, AL, Board of School Commissioners Special Tax School Warrants , 5%, 3/01/2026 | 1,325,000 | 1,383,161 | ||
| Mobile County, AL, Board of School Commissioners Special Tax School Warrants , 5%, 3/01/2028 | 1,475,000 | 1,565,202 | ||
| Mobile County, AL, Board of School Commissioners, Special Tax School Warrants, 5%, 3/01/2030 | 1,415,000 | 1,520,856 | ||
| Mobile, AL, Industrial Development Board, Pollution Control Rev. (Alabama Power Co.), 1%, 6/01/2034 (Put Date 6/26/2025) | 3,000,000 | 2,788,167 | ||
| Montgomery, AL, General Obligation, “B”, 3%, 12/01/2022 | 1,450,000 | 1,449,831 | ||
| Montgomery, AL, General Obligation, “B”, 3%, 12/01/2023 | 425,000 | 424,211 | ||
| Montgomery, AL, General Obligation, “B”, 3%, 12/01/2024 | 400,000 | 396,032 | ||
| Pell City, AL, Special Care Facilities Financing Authority Rev. (Noland Health Services, Inc.), “A”, 5%, 12/01/2022 | 720,000 | 720,477 | ||
| Pell City, AL, Special Care Facilities Financing Authority Rev. (Noland Health Services, Inc.), “A”, 5%, 12/01/2023 | 710,000 | 715,731 | ||
| Pell City, AL, Special Care Facilities Financing Authority Rev. (Noland Health Services, Inc.), “A”, 5%, 12/01/2024 | 750,000 | 760,501 | ||
| Pell City, AL, Special Care Facilities Financing Authority Rev. (Noland Health Services, Inc.), “A”, 5%, 12/01/2025 | 785,000 | 799,897 | ||
| Pell City, AL, Special Care Facilities Financing Authority Rev. (Noland Health Services, Inc.), “A”, 5%, 12/01/2026 | 1,030,000 | 1,054,698 | ||
| Phenix City, AL, Water & Sewer Rev., “A”, BAM, 5%, 8/15/2025 | 2,225,000 | 2,286,651 | ||
| Southeast Alabama Gas Supply District Rev. (Project No. 2), “A”, 4%, 6/01/2049 (Put Date 6/01/2024) | 10,000,000 | 9,863,300 | ||
| University of West Alabama, General Fee Rev., AGM, 4%, 1/01/2023 | 125,000 | 125,118 | ||
| University of West Alabama, General Fee Rev., AGM, 4%, 1/01/2024 | 100,000 | 100,586 | ||
| Issuer | Shares/Par | Value ($) | ||
| Municipal Bonds - continued | ||||
| Alabama - continued | ||||
| University of West Alabama, General Fee Rev., AGM, 4%, 1/01/2025 | $ | 150,000 | $150,336 | |
| University of West Alabama, General Fee Rev., AGM, 5%, 1/01/2026 | 180,000 | 185,476 | ||
| University of West Alabama, General Fee Rev., AGM, 5%, 1/01/2027 | 100,000 | 103,668 | ||
| University of West Alabama, General Fee Rev., AGM, 5%, 1/01/2028 | 200,000 | 208,572 | ||
| University of West Alabama, General Fee Rev., AGM, 5%, 1/01/2029 | 200,000 | 209,821 | ||
| University of West Alabama, General Fee Rev., AGM, 5%, 1/01/2030 | 425,000 | 447,918 | ||
| $87,674,350 | ||||
| Alaska - 0.4% | ||||
| Alaska Housing Finance Corp., Capital Project Bonds II, “A”, 3%, 12/01/2023 | $ | 450,000 | $448,193 | |
| Alaska Housing Finance Corp., Capital Project Bonds II, “A”, 3%, 6/01/2024 | 400,000 | 397,484 | ||
| Alaska Housing Finance Corp., Capital Project Bonds II, “A”, 4%, 12/01/2024 | 650,000 | 657,526 | ||
| Alaska Housing Finance Corp., Capital Project Bonds II, “A”, 4%, 6/01/2025 | 670,000 | 677,756 | ||
| Alaska Housing Finance Corp., Capital Project Bonds II, “A”, 4%, 6/01/2026 | 600,000 | 608,128 | ||
| Alaska Housing Finance Corp., Capital Project Bonds II, “A”, 5%, 12/01/2026 | 900,000 | 947,349 | ||
| Alaska Housing Finance Corp., Capital Project Bonds II, “A”, 5%, 6/01/2027 | 130,000 | 137,563 | ||
| Alaska Municipal Bond Bank, General Obligation, Series 3, 5%, 10/01/2023 | 2,305,000 | 2,339,624 | ||
| Alaska Municipal Bond Bank, General Obligation, Series 3, 5%, 10/01/2025 | 2,570,000 | 2,673,576 | ||
| North Slope Borough, AK, General Obligation Refunding, “B”, 5%, 6/30/2026 | 600,000 | 631,826 | ||
| North Slope Borough, AK, General Obligation Refunding, “B”, 5%, 6/30/2027 | 415,000 | 441,884 | ||
| North Slope Borough, AK, General Obligation Refunding, “B”, 5%, 6/30/2028 | 360,000 | 386,350 | ||
| Northern Alaska Tobacco Securitization Corp., Tobacco Settlement Asset-Backed, “B1”, 0.5%, 6/01/2031 | 80,000 | 78,745 | ||
| Issuer | Shares/Par | Value ($) | ||
| Municipal Bonds - continued | ||||
| Alaska - continued | ||||
| State of Alaska, International Airport System Rev., “C”, 5%, 10/01/2026 | $ | 1,455,000 | $1,495,052 | |
| $11,921,056 | ||||
| Arizona - 3.7% | ||||
| Arizona Industrial Development Authority Education Rev. (GreatHearts Arizona Projects), “A”, 4%, 7/01/2023 | $ | 130,000 | $130,307 | |
| Arizona Industrial Development Authority Education Rev. (GreatHearts Arizona Projects), “A”, 5%, 7/01/2024 | 125,000 | 127,206 | ||
| Arizona Industrial Development Authority Education Rev. (GreatHearts Arizona Projects), “A”, 5%, 7/01/2025 | 145,000 | 148,117 | ||
| Arizona Industrial Development Authority Education Rev. (GreatHearts Arizona Projects), “A”, 5%, 7/01/2027 | 160,000 | 165,079 | ||
| Arizona Industrial Development Authority Education Rev. (GreatHearts Arizona Projects), “A”, 5%, 7/01/2028 | 125,000 | 129,477 | ||
| Arizona Industrial Development Authority Education Rev. (GreatHearts Arizona Projects), “A”, 5%, 7/01/2029 | 125,000 | 129,806 | ||
| Arizona Industrial Development Authority Education Rev. (GreatHearts Arizona Projects), “A”, 5%, 7/01/2030 | 135,000 | 140,175 | ||
| Arizona Industrial Development Authority Education Rev. (GreatHearts Arizona Projects), “A”, 5%, 7/01/2031 | 125,000 | 129,188 | ||
| Arizona Industrial Development Authority Education Rev., Taxable (Kipp NYC Public Charter Schools - Gerard Facility Project), “C”, 1.5%, 7/01/2023 | 200,000 | 193,830 | ||
| Arizona Industrial Development Authority Education Rev., Taxable (Kipp NYC Public Charter Schools - Gerard Facility Project), “C”, 1.8%, 7/01/2024 | 225,000 | 209,001 | ||
| Arizona Industrial Development Authority Hospital Rev. (Phoenix Children's Hospital), “A”, 5%, 2/01/2024 | 500,000 | 509,465 | ||
| Arizona Industrial Development Authority Hospital Rev. (Phoenix Children's Hospital), “A”, 5%, 2/01/2025 | 400,000 | 411,612 | ||
| Arizona Industrial Development Authority Hospital Rev. (Phoenix Children's Hospital), “A”, 5%, 2/01/2028 | 1,000,000 | 1,063,793 | ||
| Arizona Industrial Development Authority Hospital Rev. (Phoenix Children's Hospital), “A”, 5%, 2/01/2030 | 300,000 | 324,661 | ||
| Chandler, AZ, Industrial Development Authority Rev. (Intel Corp. Project), 2.7%, 12/01/2037 (Put Date 8/14/2023) | 5,150,000 | 5,085,608 | ||
| Chandler, AZ, Industrial Development Authority Rev. (Intel Corp. Project), 5%, 9/01/2042 (Put Date 9/01/2027) | 9,250,000 | 9,475,073 | ||
| Chandler, AZ, Industrial Development Authority Rev. (Intel Corp. Project), 5%, 6/01/2049 (Put Date 6/03/2024) | 7,500,000 | 7,503,322 | ||
| Coconino County, AZ, Pollution Control Corp., “A”, 1.875%, 9/01/2032 (Put Date 3/31/2023) | 1,395,000 | 1,383,624 | ||
| Issuer | Shares/Par | Value ($) | ||
| Municipal Bonds - continued | ||||
| Arizona - continued | ||||
| Glendale, AZ, Industrial Development Authority, Graduate & Professional Student Loan Program Rev. (Midwestern University Foundation), “A”, 5%, 7/01/2024 | $ | 1,300,000 | $1,329,264 | |
| Glendale, AZ, Industrial Development Authority, Graduate & Professional Student Loan Program Rev. (Midwestern University Foundation), “A”, 5%, 7/01/2025 | 1,400,000 | 1,448,679 | ||
| Glendale, AZ, Industrial Development Authority, Graduate & Professional Student Loan Program Rev. (Midwestern University Foundation), “A”, 5%, 7/01/2025 | 790,000 | 817,469 | ||
| Glendale, AZ, Industrial Development Authority, Graduate & Professional Student Loan Program Rev. (Midwestern University Foundation), “A”, 5%, 7/01/2026 | 1,200,000 | 1,252,762 | ||
| Glendale, AZ, Industrial Development Authority, Graduate & Professional Student Loan Program Rev. (Midwestern University Foundation), “A”, 5%, 7/01/2026 | 540,000 | 563,743 | ||
| Glendale, AZ, Industrial Development Authority, Graduate & Professional Student Loan Program Rev. (Midwestern University Foundation), “A”, 5%, 7/01/2027 | 1,120,000 | 1,178,788 | ||
| Glendale, AZ, Industrial Development Authority, Graduate & Professional Student Loan Program Rev. (Midwestern University Foundation), “A”, 5%, 7/01/2027 | 720,000 | 757,792 | ||
| Glendale, AZ, Industrial Development Authority, Graduate & Professional Student Loan Program Rev. (Midwestern University Foundation), “A”, 5%, 7/01/2028 | 850,000 | 901,495 | ||
| Glendale, AZ, Industrial Development Authority, Graduate & Professional Student Loan Program Rev. (Midwestern University Foundation), “A”, 3%, 7/01/2035 | 1,100,000 | 934,808 | ||
| La Paz County, AZ, Industrial Development Authority Education Facility Lease Rev. (Charter School Solutions-Harmony Public Schools Project), “A”, 5%, 2/15/2028 | 945,000 | 953,588 | ||
| Maricopa County, AZ, Industrial Development Authority Education Rev. (Legacy Traditional Schools Projects), “A”, 4%, 7/01/2023 | 125,000 | 125,132 | ||
| Maricopa County, AZ, Industrial Development Authority Education Rev. (Legacy Traditional Schools Projects), “A”, 4%, 7/01/2024 | 135,000 | 134,626 | ||
| Maricopa County, AZ, Industrial Development Authority Education Rev. (Legacy Traditional Schools Projects), “A”, 4%, 7/01/2025 | 175,000 | 173,306 | ||
| Maricopa County, AZ, Industrial Development Authority Education Rev. (Legacy Traditional Schools Projects), “A”, 4%, 7/01/2026 | 200,000 | 196,951 | ||
| Maricopa County, AZ, Industrial Development Authority Education Rev. (Legacy Traditional Schools Projects), “A”, 4%, 7/01/2027 | 200,000 | 195,815 | ||
| Maricopa County, AZ, Industrial Development Authority Education Rev. (Legacy Traditional Schools Projects), “A”, 4%, 7/01/2028 | 325,000 | 316,146 | ||
| Issuer | Shares/Par | Value ($) | ||
| Municipal Bonds - continued | ||||
| Arizona - continued | ||||
| Maricopa County, AZ, Industrial Development Authority Education Rev. (Legacy Traditional Schools Projects), “A”, 4%, 7/01/2029 | $ | 250,000 | $241,481 | |
| Maricopa County, AZ, Pollution Control Corp. Rev. (Public Service Company of New Mexico Palo Verde Project), “A”, 3%, 1/01/2038 (Put Date 6/01/2024) | 10,560,000 | 10,407,954 | ||
| Maricopa County, AZ, Pollution Control Corp. Rev. (Public Service Company of New Mexico Palo Verde Project), “B”, 0.875%, 6/01/2043 (Put Date 10/01/2026) | 455,000 | 390,950 | ||
| Peoria, AZ, Vistancia Community Facilities District, BAM, 4%, 7/15/2023 | 800,000 | 802,910 | ||
| Peoria, AZ, Vistancia Community Facilities District, BAM, 4%, 7/15/2024 | 575,000 | 579,376 | ||
| Peoria, AZ, Vistancia Community Facilities District, BAM, 4%, 7/15/2026 | 900,000 | 913,124 | ||
| Phoenix, AZ, Industrial Development Authority, Education Facility Rev. (Basis Schools Projects), “A”, 4%, 7/01/2025 (n) | 765,000 | 748,518 | ||
| Phoenix, AZ, Industrial Development Authority, Education Facility Rev. (Great Hearts Academies Project), “A”, 2.95%, 7/01/2026 | 1,660,000 | 1,543,380 | ||
| Phoenix, AZ, Industrial Development Authority, Solid Waste Disposal Rev. (Republic Services, Inc. Project), 4.1%, 12/01/2035 (Put Date 2/01/2023) | 49,720,000 | 49,720,000 | ||
| Phoenix, AZ, Industrial Development Authority, Student Housing Refunding Rev. (Downtown Phoenix Student Housing LLC-Arizona State University Project), “A”, 5%, 7/01/2023 | 150,000 | 150,544 | ||
| Phoenix, AZ, Industrial Development Authority, Student Housing Refunding Rev. (Downtown Phoenix Student Housing LLC-Arizona State University Project), “A”, 5%, 7/01/2024 | 400,000 | 402,383 | ||
| Phoenix, AZ, Industrial Development Authority, Student Housing Refunding Rev. (Downtown Phoenix Student Housing LLC-Arizona State University Project), “A”, 5%, 7/01/2026 | 250,000 | 251,562 | ||
| Phoenix, AZ, Industrial Development Authority, Student Housing Refunding Rev. (Downtown Phoenix Student Housing LLC-Arizona State University Project), “A”, 5%, 7/01/2027 | 600,000 | 602,435 | ||
| Phoenix, AZ, Industrial Development Authority, Student Housing Refunding Rev. (Downtown Phoenix Student Housing LLC-Arizona State University Project), “A”, 5%, 7/01/2028 | 150,000 | 149,770 | ||
| Pima County, AZ, Industrial Development Authority Rev. (Tucson Electric Power Co.), “A”, 4%, 9/01/2029 | 1,950,000 | 1,953,539 | ||
| Pima County, AZ, Industrial Development Authority Senior Living Rev. (LA Posada At Pusch Ridge Project), “B-3”, 5.125%, 11/15/2029 (n) | 2,690,000 | 2,644,025 | ||
| Tempe, AZ, Industrial Development Authority Rev. (Friendship Village of Tempe Project), “A”, 4%, 12/01/2022 | 210,000 | 209,824 | ||
| Issuer | Shares/Par | Value ($) | ||
| Municipal Bonds - continued | ||||
| Arizona - continued | ||||
| Tempe, AZ, Industrial Development Authority Rev. (Friendship Village of Tempe Project), “A”, 4%, 12/01/2023 | $ | 215,000 | $212,404 | |
| Tempe, AZ, Industrial Development Authority Rev. (Friendship Village of Tempe Project), “A”, 4%, 12/01/2024 | 225,000 | 219,689 | ||
| Tempe, AZ, Industrial Development Authority Rev. (Friendship Village of Tempe Project), “A”, 4%, 12/01/2025 | 275,000 | 265,254 | ||
| Tempe, AZ, Industrial Development Authority Rev. (Friendship Village of Tempe Project), “C-2”, 1.125%, 12/01/2026 | 3,350,000 | 2,841,635 | ||
| Yavapai County, AZ, Industrial Development Authority Rev. (Waste Management, Inc.), “A-2”, 2.2%, 3/01/2028 (Put Date 6/03/2024) | 1,200,000 | 1,156,229 | ||
| $114,946,694 | ||||
| Arkansas - 0.4% | ||||
| Arkansas Development Finance Authority, Health Care Rev. (Baptist Memorial Health Care Corp.), “B-2”, 5%, 9/01/2044 (Put Date 9/01/2027) | $ | 6,545,000 | $6,721,852 | |
| Arkansas Development Finance Authority, Healthcare Facilities Rev. (Carti Surgery Center Project), “B”, 4%, 7/01/2024 | 200,000 | 197,425 | ||
| Arkansas Development Finance Authority, Healthcare Facilities Rev. (Carti Surgery Center Project), “B”, 4%, 7/01/2025 | 150,000 | 146,669 | ||
| Arkansas Development Finance Authority, Healthcare Facilities Rev. (Carti Surgery Center Project), “B”, 4%, 7/01/2026 | 185,000 | 179,322 | ||
| Arkansas Development Finance Authority, Healthcare Facilities Rev. (Carti Surgery Center Project), “B”, 4%, 7/01/2027 | 95,000 | 91,272 | ||
| Arkansas Development Finance Authority, Healthcare Facilities Rev. (Carti Surgery Center Project), “B”, 4%, 7/01/2028 | 230,000 | 217,568 | ||
| Conway, AR, Health Facilities Board, Hospital Improvement Rev. (Conway Regional Medical Center), 5%, 8/01/2024 | 400,000 | 407,509 | ||
| Conway, AR, Health Facilities Board, Hospital Improvement Rev. (Conway Regional Medical Center), 5%, 8/01/2026 | 665,000 | 686,122 | ||
| Conway, AR, Health Facilities Board, Hospital Improvement Rev. (Conway Regional Medical Center), “A”, 5%, 8/01/2024 | 530,000 | 539,949 | ||
| Pulaski County, AR, Public Facilities Board, Healthcare Rev. (Baptist Health), 5%, 12/01/2022 | 300,000 | 300,329 | ||
| Pulaski County, AR, Public Facilities Board, Healthcare Rev. (Baptist Health), 5%, 12/01/2023 | 1,665,000 | 1,688,120 | ||
| $11,176,137 | ||||
| Issuer | Shares/Par | Value ($) | ||
| Municipal Bonds - continued | ||||
| California - 4.1% | ||||
| California Community Choice Financing Authority, Clean Energy Project Rev., “A-1”, 4%, 5/01/2053 (Put Date 8/01/2028) | $ | 1,875,000 | $1,800,861 | |
| California County Tobacco Securitization Agency Settlement (Los Angeles County Securitization Corp.), “A”, 4%, 6/01/2023 | 300,000 | 300,779 | ||
| California County Tobacco Securitization Agency Settlement (Los Angeles County Securitization Corp.), “A”, 5%, 6/01/2024 | 350,000 | 356,804 | ||
| California County Tobacco Securitization Agency Settlement (Los Angeles County Securitization Corp.), “A”, 5%, 6/01/2025 | 350,000 | 359,068 | ||
| California County Tobacco Securitization Agency Settlement (Los Angeles County Securitization Corp.), “A”, 5%, 6/01/2026 | 370,000 | 379,965 | ||
| California County Tobacco Securitization Agency Settlement (Los Angeles County Securitization Corp.), “A”, 5%, 6/01/2027 | 800,000 | 824,109 | ||
| California County Tobacco Securitization Agency Settlement (Los Angeles County Securitization Corp.), “A”, 5%, 6/01/2028 | 850,000 | 876,010 | ||
| California County Tobacco Securitization Agency Settlement (Los Angeles County Securitization Corp.), “A”, 5%, 6/01/2029 | 400,000 | 414,114 | ||
| California County Tobacco Securitization Agency Settlement (Los Angeles County Securitization Corp.), “A”, 5%, 6/01/2031 | 800,000 | 820,963 | ||
| California Infrastructure & Economic Development Bank Refunding Rev. (Los Angeles County Museum of Art Project), “A”, 1.2%, 12/01/2050 (Put Date 6/01/2028) | 4,560,000 | 3,816,852 | ||
| California Infrastructure & Economic Development Bank Rev. (Colburn School), 1.75%, 8/01/2055 (Put Date 8/01/2026) | 11,375,000 | 10,290,341 | ||
| California Municipal Finance Authority Rev. (NorthBay Healthcare Group), “A”, 5%, 11/01/2025 | 1,130,000 | 1,153,213 | ||
| California Municipal Finance Authority Rev. (NorthBay Healthcare Group), “A”, 5%, 11/01/2026 | 1,000,000 | 1,026,199 | ||
| California Municipal Finance Authority, COP (Palomar Health), “A”, AGM, 5%, 11/01/2027 (w) | 200,000 | 206,309 | ||
| California Municipal Finance Authority, COP (Palomar Health), “A”, AGM, 5%, 11/01/2028 (w) | 125,000 | 128,981 | ||
| California Municipal Finance Authority, COP (Palomar Health), “A”, AGM, 5%, 11/01/2029 (w) | 125,000 | 129,039 | ||
| California Municipal Finance Authority, COP (Palomar Health), “A”, AGM, 5%, 11/01/2030 (w) | 400,000 | 413,275 | ||
| California Municipal Finance Authority, COP (Palomar Health), “A”, AGM, 5%, 11/01/2031 (w) | 200,000 | 206,243 | ||
| California Municipal Finance Authority, COP (Palomar Health), “A”, AGM, 5%, 11/01/2032 (w) | 225,000 | 231,631 | ||
| California Municipal Finance Authority, COP (Palomar Health), “A”, AGM, 5%, 11/01/2033 (w) | 1,150,000 | 1,177,469 | ||
| Issuer | Shares/Par | Value ($) | ||
| Municipal Bonds - continued | ||||
| California - continued | ||||
| California Municipal Finance Authority, Solid Waste Disposal Rev. (Republic Services, Inc. Project), “A”, 3.875%, 7/01/2041 (Put Date 4/03/2023) | $ | 10,000,000 | $9,989,745 | |
| California Municipal Finance Authority, Solid Waste Disposal Rev. (Waste Management, Inc. Project), “A”, 4.125%, 10/01/2041 (Put Date 10/01/2025) | 450,000 | 445,065 | ||
| California Pollution Control Financing Authority, Solid Waste Disposal Rev. (Republic Services, Inc. Project), “A”, 4.1%, 8/01/2023 (n) | 2,720,000 | 2,719,887 | ||
| California Pollution Control Financing Authority, Solid Waste Disposal Rev. (Waste Management, Inc.), “A”, 2.5%, 11/01/2038 (Put Date 5/01/2024) | 1,455,000 | 1,413,112 | ||
| California Pollution Control Financing Authority, Solid Waste Disposal Rev. (Waste Management, Inc.), “A-1”, 3.375%, 7/01/2025 | 5,000,000 | 4,856,394 | ||
| California Public Finance Authority Rev. (Henry Mayo Newhall Hospital), “A”, 4%, 10/15/2023 | 290,000 | 290,594 | ||
| California Public Finance Authority Rev. (Henry Mayo Newhall Hospital), “A”, 4%, 10/15/2024 | 380,000 | 378,520 | ||
| California Public Finance Authority Rev. (Henry Mayo Newhall Hospital), “A”, 4%, 10/15/2025 | 400,000 | 396,191 | ||
| California Public Finance Authority, Senior Living Rev. (Enso Village Project), “B-3”, 2.125%, 11/15/2027 (n) | 2,565,000 | 2,337,672 | ||
| California School Finance Authority, Charter School Refunding Rev. (Aspire Public Schools), 5%, 8/01/2024 (n) | 325,000 | 329,781 | ||
| California School Finance Authority, Charter School Refunding Rev. (Aspire Public Schools), 5%, 8/01/2025 (n) | 335,000 | 342,139 | ||
| California School Finance Authority, Charter School Refunding Rev. (Aspire Public Schools), 5%, 8/01/2026 (Prerefunded 8/01/2025) (n) | 25,000 | 26,121 | ||
| California School Finance Authority, Charter School Refunding Rev. (Aspire Public Schools), ETM, 5%, 8/01/2024 (n) | 25,000 | 25,734 | ||
| California School Finance Authority, Charter School Refunding Rev. (Aspire Public Schools), ETM, 5%, 8/01/2025 (n) | 30,000 | 31,345 | ||
| California School Finance Authority, School Facility Rev. (Alliance for College-Ready Public Schools Projects), “A”, 4%, 7/01/2023 (n) | 1,245,000 | 1,245,667 | ||
| California Statewide Communities Development Authority Rev. (California Baptist University), “A”, 3.5%, 11/01/2027 (n) | 3,965,000 | 3,736,691 | ||
| California Statewide Communities Development Authority Rev. (University of California, Irvine East Campus Apartments), 5%, 5/15/2026 | 1,300,000 | 1,329,963 | ||
| Issuer | Shares/Par | Value ($) | ||
| Municipal Bonds - continued | ||||
| California - continued | ||||
| California Statewide Communities Development Authority Rev., Taxable (Front Porch Communities and Services), “B”, 0.638%, 4/01/2023 | $ | 1,260,000 | $1,237,468 | |
| California Statewide Communities Development Authority Rev., Taxable (Front Porch Communities and Services), “B”, 1.028%, 4/01/2024 | 1,125,000 | 1,060,797 | ||
| California Statewide Communities Development Authority Rev., Taxable (Front Porch Communities and Services), “B”, 1.31%, 4/01/2025 | 1,195,000 | 1,088,615 | ||
| Golden State, CA, Tobacco Securitization Corp., Tobacco Settlement Rev., Taxable, “B-1”, 1.85%, 6/01/2031 | 2,765,000 | 2,707,629 | ||
| Hastings College of the Law, CA, AGM, 5%, 4/01/2026 | 305,000 | 318,495 | ||
| Los Angeles County, CA, Redevelopment Authority Tax Allocation Refunding Rev., “D”, AGM, 5%, 9/01/2023 | 1,630,000 | 1,654,426 | ||
| Los Angeles County, CA, Redevelopment Authority Tax Allocation Refunding Rev., “D”, ETM, AGM, 5%, 9/01/2023 | 235,000 | 238,444 | ||
| Los Angeles, CA, Department of Airports Refunding Rev. (Los Angeles International), “A”, 5%, 5/15/2028 | 1,250,000 | 1,297,197 | ||
| Los Angeles, CA, Department of Airports Refunding Rev. (Los Angeles International), “A”, 5%, 5/15/2029 | 1,410,000 | 1,465,996 | ||
| Los Angeles, CA, Department of Airports Rev. (Los Angeles International), “B”, 5%, 5/15/2026 | 1,350,000 | 1,390,853 | ||
| Los Angeles, CA, Department of Airports Rev. (Los Angeles International), “G”, 5%, 5/15/2029 | 10,000,000 | 10,437,668 | ||
| Port of Oakland, CA, Intermediate Lien Refunding Rev., “H”, 5%, 5/01/2024 | 1,205,000 | 1,227,550 | ||
| Port of Oakland, CA, Intermediate Lien Refunding Rev., “H”, ETM, 5%, 5/01/2024 | 95,000 | 97,419 | ||
| Riverside County, CA, Teeter Plan Obligation Notes, “A”, 3.7%, 10/19/2023 | 3,750,000 | 3,758,358 | ||
| San Bernardino, CA, City Unified School District, “A”, AGM, 5%, 8/01/2023 | 1,100,000 | 1,114,037 | ||
| San Diego County, CA, Regional Airport Authority Rev., “B”, 5%, 7/01/2026 | 2,225,000 | 2,277,595 | ||
| San Diego County, CA, Regional Airport Authority Rev., “B”, 5%, 7/01/2027 | 2,905,000 | 2,976,219 | ||
| San Diego County, CA, Regional Airport Authority Rev., “B”, 5%, 7/01/2028 | 3,250,000 | 3,331,882 | ||
| San Diego County, CA, Regional Airport Authority Rev., “B”, 5%, 7/01/2029 | 5,500,000 | 5,653,744 | ||
| San Francisco, CA, City & County Airports Commission, International Airport Rev. (SFO Fuel Company LLC), “A”, 5%, 1/01/2027 | 2,205,000 | 2,262,915 | ||
| Issuer | Shares/Par | Value ($) | ||
| Municipal Bonds - continued | ||||
| California - continued | ||||
| San Joaquin Hills, CA, Transportation Corridor Agency, Toll Road Rev., “A”, 5%, 1/15/2030 | $ | 750,000 | $771,229 | |
| San Ramon CA, Public Financing Authority, Capital Appreciation, “A”, AAC, 0%, 2/01/2026 | 1,690,000 | 1,473,953 | ||
| State of California, Various Purpose General Obligation, 5%, 8/01/2026 | 3,490,000 | 3,702,965 | ||
| State of California, Various Purpose General Obligation, 5%, 8/01/2027 | 5,750,000 | 5,960,690 | ||
| Sweetwater, CA, Union High School District, 5%, 8/01/2031 | 1,665,000 | 1,741,293 | ||
| Transbay Joint Powers Authority, CA, Senior Tax Allocation, “A”, 5%, 10/01/2026 | 1,150,000 | 1,198,927 | ||
| Transbay Joint Powers Authority, CA, Senior Tax Allocation, “A”, 5%, 10/01/2028 | 1,000,000 | 1,058,378 | ||
| Transbay Joint Powers Authority, CA, Senior Tax Allocation, “A”, 5%, 10/01/2029 | 1,100,000 | 1,171,090 | ||
| Vernon, CA, Electric System Rev., “A”, 5%, 4/01/2026 | 1,000,000 | 1,019,749 | ||
| Vernon, CA, Electric System Rev., “A”, 5%, 10/01/2026 | 1,670,000 | 1,706,902 | ||
| Vernon, CA, Electric System Rev., “A”, 5%, 4/01/2027 | 1,630,000 | 1,669,641 | ||
| Vernon, CA, Electric System Rev., “A”, 5%, 10/01/2027 | 2,500,000 | 2,566,046 | ||
| Vernon, CA, Electric System Rev., “A”, 5%, 4/01/2028 | 2,000,000 | 2,056,680 | ||
| Victorville, CA, Electric Rev., “A”, 5%, 5/01/2031 | 1,000,000 | 1,039,621 | ||
| $127,541,317 | ||||
| Colorado - 2.5% | ||||
| Arvada, CO, Vauxmont Metropolitan District Rev., AGM, 5%, 12/01/2022 | $ | 165,000 | $165,197 | |
| Arvada, CO, Vauxmont Metropolitan District Rev., AGM, 5%, 12/15/2022 | 100,000 | 100,168 | ||
| Arvada, CO, Vauxmont Metropolitan District Rev., AGM, 5%, 12/01/2023 | 195,000 | 198,019 | ||
| Arvada, CO, Vauxmont Metropolitan District Rev., AGM, 5%, 12/15/2023 | 120,000 | 121,897 | ||
| Arvada, CO, Vauxmont Metropolitan District Rev., AGM, 5%, 12/01/2024 | 400,000 | 411,380 | ||
| Arvada, CO, Vauxmont Metropolitan District Rev., AGM, 5%, 12/15/2024 | 135,000 | 138,867 | ||
| Arvada, CO, Vauxmont Metropolitan District Rev., AGM, 5%, 12/01/2025 | 175,000 | 182,161 | ||
| Arvada, CO, Vauxmont Metropolitan District Rev., AGM, 5%, 12/15/2025 | 125,000 | 130,310 | ||
| Arvada, CO, Vauxmont Metropolitan District Rev., AGM, 5%, 12/01/2026 | 195,000 | 205,259 | ||
| Issuer | Shares/Par | Value ($) | ||
| Municipal Bonds - continued | ||||
| Colorado - continued | ||||
| Arvada, CO, Vauxmont Metropolitan District Rev., AGM, 5%, 12/15/2026 | $ | 135,000 | $142,886 | |
| Arvada, CO, Vauxmont Metropolitan District Rev., AGM, 5%, 12/01/2027 | 200,000 | 212,712 | ||
| Colorado Educational & Cultural Facilities Authority Rev. (Classical Academy Project), “A”, 5%, 12/01/2029 | 1,040,000 | 1,061,606 | ||
| Colorado Educational & Cultural Facilities Authority Rev. (Colorado Springs Charter Academy Project), 5.25%, 7/01/2028 | 1,330,000 | 1,331,629 | ||
| Colorado Educational & Cultural Facilities Authority Rev. (Pinnacle Charter School Building Corp.), 5%, 6/01/2029 | 630,000 | 632,526 | ||
| Colorado Educational & Cultural Facilities Authority Rev. (Union Colony School Project), 4%, 4/01/2023 | 35,000 | 35,070 | ||
| Colorado Health Facilities Authority Hospital Rev. (Boulder Community Health Project), 5%, 10/01/2025 | 205,000 | 211,369 | ||
| Colorado Health Facilities Authority Hospital Rev. (Boulder Community Health Project), 5%, 10/01/2026 | 255,000 | 263,226 | ||
| Colorado Health Facilities Authority Hospital Rev. (Boulder Community Health Project), 5%, 10/01/2027 | 215,000 | 223,375 | ||
| Colorado Health Facilities Authority Hospital Rev. (Boulder Community Health Project), 5%, 10/01/2028 | 400,000 | 415,847 | ||
| Colorado Health Facilities Authority Hospital Rev. (Boulder Community Health Project), 5%, 10/01/2029 | 625,000 | 651,925 | ||
| Colorado Health Facilities Authority Hospital Rev. (Boulder Community Health Project), 5%, 10/01/2030 | 720,000 | 751,744 | ||
| Colorado Health Facilities Authority Hospital Rev. (Boulder Community Health Project), 5%, 10/01/2031 | 850,000 | 882,283 | ||
| Colorado Health Facilities Authority Rev. (Christian Living Neighborhoods), 4%, 1/01/2023 | 55,000 | 54,846 | ||
| Colorado Health Facilities Authority Rev. (Christian Living Neighborhoods), 4%, 1/01/2024 | 330,000 | 323,386 | ||
| Colorado Health Facilities Authority Rev. (Christian Living Neighborhoods), 4%, 1/01/2025 | 390,000 | 375,508 | ||
| Colorado Health Facilities Authority Rev. (Christian Living Neighborhoods), 4%, 1/01/2026 | 320,000 | 302,663 | ||
| Colorado Health Facilities Authority Rev. (Christian Living Neighborhoods), 4%, 1/01/2027 | 495,000 | 458,964 | ||
| Colorado Health Facilities Authority Rev. (Christian Living Neighborhoods), 4%, 1/01/2028 | 460,000 | 417,724 | ||
| Colorado Health Facilities Authority Rev. (Christian Living Neighborhoods), 4%, 1/01/2029 | 430,000 | 382,521 | ||
| Colorado Health Facilities Authority Rev. (Christian Living Neighborhoods), 4%, 1/01/2030 | 500,000 | 435,790 | ||
| Issuer | Shares/Par | Value ($) | ||
| Municipal Bonds - continued | ||||
| Colorado - continued | ||||
| Colorado Health Facilities Authority Rev. (Christian Living Neighborhoods), 4%, 1/01/2031 | $ | 960,000 | $820,678 | |
| Colorado Health Facilities Authority Rev. (CommonSpirit Health), “A”, 5.25%, 11/01/2034 | 1,000,000 | 1,037,550 | ||
| Colorado Health Facilities Authority Rev. (CommonSpirit Health), “A”, 5.25%, 11/01/2035 | 1,200,000 | 1,238,390 | ||
| Colorado Health Facilities Authority Rev. (CommonSpirit Health), “A-1”, 5%, 8/01/2026 | 1,500,000 | 1,549,225 | ||
| Colorado Health Facilities Authority Rev. (CommonSpirit Health), “A-1”, 5%, 8/01/2027 | 2,000,000 | 2,076,579 | ||
| Colorado Health Facilities Authority Rev. (CommonSpirit Health), “A-2”, 5%, 8/01/2026 | 2,160,000 | 2,230,883 | ||
| Colorado Health Facilities Authority Rev. (Covenant Retirement Communities, Inc.), “A”, 5%, 12/01/2022 | 1,750,000 | 1,749,968 | ||
| Colorado Health Facilities Authority Rev. (Intermountain Healthcare, Inc.), “C”, 5%, 5/15/2062 (Put Date 8/15/2028) | 16,365,000 | 17,390,842 | ||
| Colorado Health Facilities Authority Rev., Improvement Bonds (Valley View Hospital Association Project), 2.8%, 5/15/2042 (Put Date 5/15/2023) | 4,410,000 | 4,409,186 | ||
| Colorado Regional Transportation District (Denver Transit Partners Eagle P3 Project), “A”, 3%, 7/15/2023 | 100,000 | 99,594 | ||
| Colorado Regional Transportation District (Denver Transit Partners Eagle P3 Project), “A”, 5%, 1/15/2024 | 400,000 | 405,662 | ||
| Colorado Regional Transportation District (Denver Transit Partners Eagle P3 Project), “A”, 5%, 7/15/2024 | 300,000 | 301,714 | ||
| Colorado Regional Transportation District (Denver Transit Partners Eagle P3 Project), “A”, 5%, 1/15/2025 | 325,000 | 328,761 | ||
| Colorado Regional Transportation District (Denver Transit Partners Eagle P3 Project), “A”, 5%, 7/15/2025 | 400,000 | 405,540 | ||
| Colorado Regional Transportation District (Denver Transit Partners Eagle P3 Project), “A”, 3%, 1/15/2026 | 600,000 | 573,475 | ||
| Colorado Regional Transportation District (Denver Transit Partners Eagle P3 Project), “A”, 5%, 7/15/2026 | 300,000 | 305,199 | ||
| Colorado Regional Transportation District (Denver Transit Partners Eagle P3 Project), “A”, 5%, 1/15/2027 | 500,000 | 509,186 | ||
| Colorado Regional Transportation District (Denver Transit Partners Eagle P3 Project), “A”, 5%, 7/15/2027 | 600,000 | 611,990 | ||
| Colorado Regional Transportation District (Denver Transit Partners Eagle P3 Project), “A”, 5%, 1/15/2028 | 1,075,000 | 1,096,069 | ||
| Colorado Regional Transportation District (Denver Transit Partners Eagle P3 Project), “A”, 5%, 7/15/2028 | 850,000 | 867,219 | ||
| Denver, CO, City & County Airport System Rev., “A”, 5%, 11/15/2027 | 5,000,000 | 5,175,722 | ||
| Issuer | Shares/Par | Value ($) | ||
| Municipal Bonds - continued | ||||
| Colorado - continued | ||||
| Denver, CO, City & County Airport System Rev., “A”, 5%, 11/15/2028 | $ | 14,000,000 | $14,495,327 | |
| Denver, CO, Convention Center Hotel Authority Rev., 5%, 12/01/2024 | 1,500,000 | 1,521,300 | ||
| Denver, CO, Convention Center Hotel Authority Rev., 5%, 12/01/2025 | 2,000,000 | 2,039,688 | ||
| Park Creek Metropolitan District, CO, Senior Limited Property Tax Supported Rev., “A”, 5%, 12/01/2023 | 1,000,000 | 1,015,480 | ||
| Park Creek Metropolitan District, CO, Senior Limited Property Tax Supported Rev., “A”, NPFG, 5%, 12/01/2025 | 500,000 | 521,203 | ||
| Park Creek Metropolitan District, CO, Senior Limited Property Tax Supported Rev., “A”, NPFG, 5%, 12/01/2026 | 1,300,000 | 1,370,918 | ||
| Park Creek Metropolitan District, CO, Senior Limited Property Tax Supported Rev., “A”, NPFG, 5%, 12/01/2027 | 1,270,000 | 1,335,337 | ||
| $76,703,543 | ||||
| Connecticut - 1.6% | ||||
| Connecticut Health & Educational Facilities Authority Rev. (Connecticut State University), “N”, 5%, 11/01/2024 | $ | 1,930,000 | $1,958,958 | |
| Connecticut Health & Educational Facilities Authority Rev. (Masonicare), “F”, 5%, 7/01/2023 | 2,800,000 | 2,806,520 | ||
| Connecticut Health & Educational Facilities Authority Rev. (Masonicare), “F”, 5%, 7/01/2024 | 1,840,000 | 1,847,742 | ||
| Connecticut Health & Educational Facilities Authority Rev. (Sacred Heart University), “K”, 5%, 7/01/2023 | 250,000 | 252,492 | ||
| Connecticut Health & Educational Facilities Authority Rev. (Sacred Heart University), “K”, 5%, 7/01/2024 | 250,000 | 255,790 | ||
| Connecticut Health & Educational Facilities Authority Rev. (Sacred Heart University), “K”, 5%, 7/01/2025 | 250,000 | 258,050 | ||
| Connecticut Health & Educational Facilities Authority Rev. (Sacred Heart University), “K”, 5%, 7/01/2026 | 250,000 | 259,775 | ||
| Connecticut Health & Educational Facilities Authority Rev. (Sacred Heart University), “K”, 5%, 7/01/2027 | 830,000 | 869,946 | ||
| Connecticut Health & Educational Facilities Authority Rev. (Sacred Heart University), “K”, 5%, 7/01/2028 | 1,030,000 | 1,085,420 | ||
| Connecticut Health & Educational Facilities Authority Rev. (Sacred Heart University), “K”, 5%, 7/01/2029 | 745,000 | 790,463 | ||
| Connecticut Health & Educational Facilities Authority Rev. (Sacred Heart University), “K”, 5%, 7/01/2030 | 400,000 | 425,228 | ||
| Connecticut Health & Educational Facilities Authority Rev. (Sacred Heart University), “K”, 5%, 7/01/2031 | 825,000 | 870,739 | ||
| Connecticut Health & Educational Facilities Authority Rev. (Stamford Hospital), “L-1”, 4%, 7/01/2023 | 495,000 | 494,831 | ||
| Issuer | Shares/Par | Value ($) | ||
| Municipal Bonds - continued | ||||
| Connecticut - continued | ||||
| Connecticut Housing Finance Authority Rev. (Housing Mortgage Finance Program), “E-1”, GNMA, 5.5%, 11/15/2052 (w) | $ | 5,890,000 | $6,109,374 | |
| Hamden, CT, General Obligation, BAM, 4%, 8/15/2023 | 300,000 | 301,265 | ||
| Hamden, CT, General Obligation, BAM, 4%, 8/15/2025 | 400,000 | 405,365 | ||
| Hamden, CT, General Obligation, BAM, 4%, 8/15/2026 | 155,000 | 157,434 | ||
| Hartford County, CT, Metropolitan District, “C”, AGM, 5%, 11/01/2023 | 3,000,000 | 3,053,450 | ||
| Hartford County, CT, Metropolitan District, “C”, AGM, 5%, 11/01/2024 | 5,600,000 | 5,780,767 | ||
| New Haven, CT, General Obligation, “B”, BAM, 5%, 8/01/2027 | 3,520,000 | 3,704,410 | ||
| New Haven, CT, General Obligation, “A”, AGM, 5%, 8/15/2024 | 1,280,000 | 1,312,075 | ||
| State of Connecticut, “D”, BAM, 4%, 8/15/2030 | 11,250,000 | 11,376,204 | ||
| State of Connecticut, Special Tax Obligation Rev., “A”, 5%, 9/01/2023 | 2,005,000 | 2,033,062 | ||
| University of Connecticut, General Obligation, “A”, BAM, 5%, 1/15/2028 | 1,720,000 | 1,815,734 | ||
| West Haven, CT, General Obligation, BAM, 4%, 3/15/2023 | 250,000 | 250,626 | ||
| West Haven, CT, General Obligation, BAM, 4%, 3/15/2025 | 420,000 | 425,608 | ||
| West Haven, CT, General Obligation, BAM, 4%, 3/15/2026 | 200,000 | 203,358 | ||
| West Haven, CT, General Obligation, BAM, 4%, 3/15/2027 | 200,000 | 203,589 | ||
| West Haven, CT, General Obligation, BAM, 4%, 3/15/2028 | 215,000 | 219,088 | ||
| West Haven, CT, General Obligation, BAM, 4%, 3/15/2029 | 200,000 | 204,770 | ||
| West Haven, CT, General Obligation, BAM, 4%, 3/15/2030 | 125,000 | 127,067 | ||
| $49,859,200 | ||||
| Delaware - 0.2% | ||||
| Delaware Economic Development Authority Rev. (Delaware Military Academy, Inc. Project), 4%, 9/01/2024 | $ | 150,000 | $150,974 | |
| Delaware Economic Development Authority Rev. (Newark Charter School, Inc.), “A”, 2.8%, 9/01/2026 | 220,000 | 205,076 | ||
| Delaware Economic Development Authority, Gas Facilities Rev. (Delmarva Power and Light Co. Project), “A”, 1.05%, 1/01/2031 (Put Date 7/01/2025) | 5,985,000 | 5,551,972 | ||
| $5,908,022 | ||||
| District of Columbia - 1.1% | ||||
| District of Columbia University Rev. (Georgetown University), 5%, 4/01/2026 | $ | 1,045,000 | $1,086,806 | |
| District of Columbia, Housing Finance Agency, Collateralized Multi-Family Rev. (Parcel 42 Project) , 1.7%, 9/01/2041 (Put Date 3/01/2025) | 9,000,000 | 8,529,786 | ||
| District of Columbia, Housing Finance Agency, Multi-Family Development Program, “B-2”, 0.5%, 3/01/2027 (Put Date 10/01/2024) | 2,415,000 | 2,251,777 | ||
| Issuer | Shares/Par | Value ($) | ||
| Municipal Bonds - continued | ||||
| District of Columbia - continued | ||||
| District of Columbia, Housing Finance Agency, Multi-Family Development Program, “B-2”, 3%, 9/01/2028 (Put Date 9/01/2026) | $ | 5,350,000 | $5,079,885 | |
| District of Columbia, Housing Finance Agency, Multi-Family Development Program, Taxable, “B-3”, 0.9%, 10/01/2024 | 1,400,000 | 1,299,046 | ||
| District of Columbia, Housing Finance Agency, Multi-Family Housing Rev. (Cascade Park Apartments II Project), 0.7%, 8/01/2042 (Put Date 8/01/2024) | 3,970,000 | 3,718,862 | ||
| District of Columbia, Housing Finance Agency, Multi-Family Housing Rev. (Paxton Project), 4%, 9/01/2040 (Put Date 9/01/2025) | 3,750,000 | 3,741,901 | ||
| Metropolitan Washington, D.C., Airport Authority System Rev., “A”, 5%, 10/01/2027 | 7,000,000 | 7,256,920 | ||
| $32,964,983 | ||||
| Florida - 3.4% | ||||
| Alachua County, FL, Health Facilities Authority, Health Facilities Rev. (Shands Teaching Hospital and Clinics, Inc. at the University of Florida), “B-1”, 5%, 12/01/2022 | $ | 600,000 | $600,658 | |
| Bellalago, FL, Educational Facilities Benefit District Capital Improvement Refunding Rev., 3.75%, 5/01/2023 | 1,080,000 | 1,082,051 | ||
| Broward County, FL, Multi-Family Housing Rev. (Solaris Apartments), “B”, FNMA, 0.7%, 1/01/2025 (Put Date 7/01/2024) | 4,375,000 | 4,131,267 | ||
| Broward County, FL, School Board, COP, “A”, AGM, 5%, 7/01/2028 | 4,505,000 | 4,666,280 | ||
| Daytona Beach, FL, Halifax Hospital Medical Center Rev., 5%, 6/01/2024 | 535,000 | 544,352 | ||
| Daytona Beach, FL, Halifax Hospital Medical Center Rev., 5%, 6/01/2025 | 615,000 | 628,315 | ||
| Florida Development Finance Corp. Educational Facilities Rev. (Mater Academy Projects), “A”, 5%, 6/15/2025 | 430,000 | 434,003 | ||
| Florida Development Finance Corp. Educational Facilities Rev. (Mater Academy Projects), “A”, 5%, 6/15/2027 | 565,000 | 571,222 | ||
| Florida Development Finance Corp. Educational Facilities Rev. (Mater Academy Projects), “A”, 5%, 6/15/2029 | 940,000 | 944,646 | ||
| Florida Development Finance Corp. Educational Facilities Rev. (Mater Academy Projects), “A”, 5%, 6/15/2031 | 1,040,000 | 1,036,755 | ||
| Florida Development Finance Corp. Educational Facilities Rev. (Nova Southeastern University Project), “A”, 5%, 4/01/2023 | 700,000 | 704,701 | ||
| Florida Development Finance Corp. Educational Facilities Rev. (Nova Southeastern University Project), “A”, 5%, 4/01/2024 | 1,000,000 | 1,019,519 | ||
| Florida Development Finance Corp. Educational Facilities Rev. (Nova Southeastern University Project), “A”, 5%, 4/01/2025 | 400,000 | 409,075 | ||
| Issuer | Shares/Par | Value ($) | ||
| Municipal Bonds - continued | ||||
| Florida - continued | ||||
| Florida Development Finance Corp. Educational Facilities Rev. (Nova Southeastern University Project), “A”, 5%, 4/01/2026 | $ | 285,000 | $293,727 | |
| Florida Development Finance Corp. Educational Facilities Rev. (Nova Southeastern University Project), “A”, 5%, 4/01/2027 | 880,000 | 913,559 | ||
| Florida Development Finance Corp. Educational Facilities Rev. (Nova Southeastern University Project), “A”, 5%, 4/01/2028 | 625,000 | 651,267 | ||
| Florida Development Finance Corp. Educational Facilities Rev. (Nova Southeastern University Project), “A”, 5%, 4/01/2029 | 500,000 | 523,870 | ||
| Florida Development Finance Corp. Senior Living Rev. (Mayflower Retirement Community Project), “A”, 4%, 6/01/2027 (n) | 1,270,000 | 1,178,173 | ||
| Florida Development Finance Corp. Senior Living Rev. (Mayflower Retirement Community Project), “A”, 4%, 6/01/2028 (n) | 825,000 | 749,515 | ||
| Florida Development Finance Corp. Senior Living Rev. (Mayflower Retirement Community Project), “B-2”, 1.75%, 6/01/2026 (n) | 215,000 | 189,948 | ||
| Florida Higher Educational Facilities Financing Authority Rev. (Florida Institute of Technology), 5%, 10/01/2027 | 480,000 | 488,013 | ||
| Florida Higher Educational Facilities Financing Authority Rev. (Florida Institute of Technology), 5%, 10/01/2028 | 1,500,000 | 1,525,653 | ||
| Florida Higher Educational Facilities Financing Authority Rev. (Florida Institute of Technology), 5%, 10/01/2029 | 1,295,000 | 1,316,653 | ||
| Florida Higher Educational Facilities Financing Authority Rev. (Florida Institute of Technology), 5%, 10/01/2030 | 1,990,000 | 2,014,811 | ||
| Florida Housing Finance Corp., Homeowner Mortgage Rev., “1”, GNMA, 5%, 1/01/2025 | 920,000 | 947,139 | ||
| Florida Housing Finance Corp., Homeowner Mortgage Rev., “1”, GNMA, 5%, 1/01/2026 | 500,000 | 519,435 | ||
| Florida Housing Finance Corp., Homeowner Mortgage Rev., “1”, GNMA, 5%, 1/01/2027 | 385,000 | 403,333 | ||
| Florida Housing Finance Corp., Homeowner Mortgage Rev., “1”, GNMA, 5%, 1/01/2028 | 135,000 | 142,394 | ||
| Florida Housing Finance Corp., Homeowner Mortgage Rev., “1”, GNMA, 5%, 1/01/2029 | 485,000 | 514,239 | ||
| Florida Housing Finance Corp., Homeowner Mortgage Rev., “1”, GNMA, 5%, 1/01/2030 | 765,000 | 814,062 | ||
| Florida Housing Finance Corp., Homeowner Mortgage Rev., “1”, GNMA, 5%, 1/01/2031 | 745,000 | 795,817 | ||
| Florida Housing Finance Corp., Multi-Family Mortgage Rev. (Valencia Park Apartments) “A”, 0.25%, 12/01/2023 (Put Date 12/01/2022) | 9,000,000 | 8,969,195 | ||
| Greater Orlando Aviation Authority Airport Facilities Rev., “A”, 5%, 10/01/2027 | 1,375,000 | 1,422,378 | ||
| Greater Orlando Aviation Authority Airport Facilities Rev., “A”, 5%, 10/01/2028 | 1,795,000 | 1,861,360 | ||
| Issuer | Shares/Par | Value ($) | ||
| Municipal Bonds - continued | ||||
| Florida - continued | ||||
| Greater Orlando Aviation Authority Airport Facilities Rev., “A”, 5%, 10/01/2029 | $ | 1,350,000 | $1,397,533 | |
| Greater Orlando Aviation Authority Airport Facilities Rev., “A”, 5%, 10/01/2030 | 1,375,000 | 1,416,111 | ||
| Hillsborough County, FL, Wastewater Impact Fee Assessment Rev., 5%, 5/01/2024 | 2,500,000 | 2,555,575 | ||
| Lee County, FL, Airport Refunding Rev., “A”, 5%, 10/01/2024 | 4,250,000 | 4,330,355 | ||
| Lee County, FL, Airport Rev., “B”, 5%, 10/01/2026 | 1,660,000 | 1,701,481 | ||
| Lee County, FL, Airport Rev., “B”, 5%, 10/01/2028 | 4,060,000 | 4,165,292 | ||
| Lee Memorial Health System, FL, Hospital Rev., “A-2”, 5%, 4/01/2033 (Put Date 4/01/2026) | 5,135,000 | 5,163,620 | ||
| Miami Beach, FL, Health Facilities Authority Hospital Rev. (Mount Sinai Medical Center of Florida), 5%, 11/15/2024 | 400,000 | 406,278 | ||
| Miami-Dade County, FL, Industrial Development Authority Rev. (Pinecrest Academy Project), 5%, 9/15/2024 | 125,000 | 125,655 | ||
| Miami-Dade County, FL, School District, 4%, 2/23/2023 | 10,000,000 | 10,027,973 | ||
| Miami-Dade County, FL, Seaport Rev., “B”, 5%, 10/01/2023 | 1,500,000 | 1,516,178 | ||
| Okeechobee County, FL, Solid Waste Disposal Rev. (Waste Management, Inc./Okeechobee Landfill Project), “A”, 0.55%, 7/01/2039 (Put Date 7/01/2024) | 775,000 | 725,149 | ||
| Orange County, FL, Health Facilities Authority Hospital Rev. (AdventHealth Obligated Group), “C”, 5%, 11/15/2052 (Put Date 11/15/2026) | 19,000,000 | 19,873,949 | ||
| Orange County, FL, Housing Finance Authority, Multi-Family Housing Rev. (Dunwoodie Place Apartments), “A”, 0.2%, 9/01/2024 | 4,700,000 | 4,514,912 | ||
| Palm Beach County, FL, Health Facilities Authority Hospital Rev. (Jupiter Medical Center Project), “A”, 5%, 11/01/2028 | 150,000 | 154,487 | ||
| Palm Beach County, FL, Health Facilities Authority Hospital Rev. (Jupiter Medical Center Project), “A”, 5%, 11/01/2029 | 200,000 | 205,165 | ||
| Palm Beach County, FL, Health Facilities Authority Hospital Rev. (Jupiter Medical Center Project), “A”, 5%, 11/01/2030 | 200,000 | 203,839 | ||
| Palm Beach County, FL, Health Facilities Authority Hospital Rev. (Jupiter Medical Center Project), “A”, 5%, 11/01/2031 | 200,000 | 203,168 | ||
| Palm Beach County, FL, Health Facilities Authority Hospital Rev. (Jupiter Medical Center Project), “A”, 5%, 11/01/2032 | 250,000 | 251,817 | ||
| Pasco County, FL, School Board Refunding Certificates of Participation, “A”, 5%, 8/01/2025 | 100,000 | 103,948 | ||
| Pompano Beach, FL, Refunding Rev. (John Knox Village Project), “B-2”, 1.45%, 1/01/2027 | 430,000 | 367,549 | ||
| St. John's County, FL, Industrial Development Authority, Senior Living Rev. (Vicars Landing Project), “A”, 4%, 12/15/2022 | 110,000 | 109,854 | ||
| Issuer | Shares/Par | Value ($) | ||
| Municipal Bonds - continued | ||||
| Florida - continued | ||||
| St. John's County, FL, Industrial Development Authority, Senior Living Rev. (Vicars Landing Project), “A”, 4%, 12/15/2023 | $ | 115,000 | $113,525 | |
| St. John's County, FL, Industrial Development Authority, Senior Living Rev. (Vicars Landing Project), “A”, 4%, 12/15/2024 | 140,000 | 136,144 | ||
| St. John's County, FL, Industrial Development Authority, Senior Living Rev. (Vicars Landing Project), “A”, 4%, 12/15/2025 | 180,000 | 172,397 | ||
| Tampa, FL, Hospital Rev. (H. Lee Moffitt Cancer Center Project), “B”, 5%, 7/01/2023 | 100,000 | 100,885 | ||
| Tampa, FL, Hospital Rev. (H. Lee Moffitt Cancer Center Project), “B”, 5%, 7/01/2024 | 100,000 | 101,878 | ||
| Tampa, FL, Hospital Rev. (H. Lee Moffitt Cancer Center Project), “B”, 5%, 7/01/2025 | 100,000 | 102,939 | ||
| Tampa, FL, Hospital Rev. (H. Lee Moffitt Cancer Center Project), “B”, 5%, 7/01/2026 | 100,000 | 103,564 | ||
| Tampa, FL, Hospital Rev. (H. Lee Moffitt Cancer Center Project), “B”, 5%, 7/01/2027 | 180,000 | 187,104 | ||
| Tampa, FL, Hospital Rev. (H. Lee Moffitt Cancer Center Project), “B”, 5%, 7/01/2028 | 230,000 | 240,001 | ||
| Tampa, FL, Hospital Rev. (H. Lee Moffitt Cancer Center Project), “B”, 5%, 7/01/2029 | 225,000 | 234,975 | ||
| Tampa, FL, Hospital Rev. (H. Lee Moffitt Cancer Center Project), “B”, 5%, 7/01/2030 | 250,000 | 260,244 | ||
| Tampa, FL, Hospital Rev. (H. Lee Moffitt Cancer Center Project), “B”, 5%, 7/01/2031 | 300,000 | 311,046 | ||
| Wildwood, FL, Utility Dependent District Utility Rev. (South Sumter Utility Project), BAM, 5%, 10/01/2026 | 200,000 | 210,366 | ||
| Wildwood, FL, Utility Dependent District Utility Rev. (South Sumter Utility Project), BAM, 5%, 10/01/2027 | 200,000 | 212,266 | ||
| $105,014,607 | ||||
| Georgia - 3.4% | ||||
| Appling County, GA, Development Authority Pollution Control Rev. (Oglethorpe Power Corp. Hatch Project), “A”, 1.5%, 1/01/2038 (Put Date 2/03/2025) | $ | 2,500,000 | $2,308,146 | |
| Atlanta, GA, Geo. L. Smith II World Congress Center Authority Convention Center Hotel Rev., “A”, 2.375%, 1/01/2031 | 1,000,000 | 834,676 | ||
| Atlanta, GA, Water & Wastewater Rev., “B”, 5%, 11/01/2025 | 1,000,000 | 1,048,352 | ||
| Bainbridge, GA, Combined Utilities Rev., BAM, 4%, 12/01/2026 | 115,000 | 116,287 | ||
| Bainbridge, GA, Combined Utilities Rev., BAM, 4%, 12/01/2027 | 100,000 | 100,828 | ||
| Bainbridge, GA, Combined Utilities Rev., BAM, 4%, 12/01/2028 | 100,000 | 100,329 | ||
| Bainbridge, GA, Combined Utilities Rev., BAM, 4%, 12/01/2029 | 130,000 | 130,328 | ||
| Issuer | Shares/Par | Value ($) | ||
| Municipal Bonds - continued | ||||
| Georgia - continued | ||||
| Bartow County, GA, Development Authority Pollution Control Rev. (Georgia Power Co. Plant Bowen Project), 2.875%, 8/01/2043 (Put Date 8/19/2025) | $ | 2,000,000 | $1,908,848 | |
| Brookhaven, GA, Development Authority Rev. (Children's Healthcare of Atlanta, Inc.), “A”, 5%, 7/01/2026 | 1,250,000 | 1,310,641 | ||
| Brookhaven, GA, Development Authority Rev. (Children's Healthcare of Atlanta, Inc.), “A”, 5%, 7/01/2027 | 1,550,000 | 1,642,928 | ||
| Brookhaven, GA, Development Authority Rev. (Children's Healthcare of Atlanta, Inc.), “A”, 5%, 7/01/2028 | 1,665,000 | 1,782,511 | ||
| Brookhaven, GA, Development Authority Rev. (Children's Healthcare of Atlanta, Inc.), “A”, 5%, 7/01/2029 | 1,680,000 | 1,815,215 | ||
| Brookhaven, GA, Development Authority Rev. (Children's Healthcare of Atlanta, Inc.), “A”, 5%, 7/01/2030 | 1,250,000 | 1,331,131 | ||
| Burke County, GA, Development Authority Pollution Control Rev. (Georgia Power Co. Plant Vogtle Project), 2.25%, 10/01/2032 (Put Date 5/25/2023) | 2,885,000 | 2,850,501 | ||
| Burke County, GA, Development Authority Pollution Control Rev. (Georgia Power Co. Plant Vogtle Project), 1.5%, 1/01/2040 (Put Date 2/03/2025) | 2,030,000 | 1,874,215 | ||
| Burke County, GA, Development Authority Pollution Control Rev. (Georgia Power Co. Plant Vogtle Project), 2.925%, 11/01/2053 (Put Date 3/12/2024) | 5,000,000 | 4,894,575 | ||
| Cobb County, GA, Kennestone Hospital Authority Rev. (WellStar Health System, Inc. Project), “B”, 5%, 4/01/2023 | 520,000 | 522,935 | ||
| Cobb County, GA, Kennestone Hospital Authority Rev. (WellStar Health System, Inc. Project), “B”, 5%, 4/01/2024 | 535,000 | 544,554 | ||
| Cobb County, GA, Kennestone Hospital Authority Rev. (WellStar Health System, Inc. Project), “B”, 5%, 4/01/2025 | 800,000 | 821,488 | ||
| Cobb County, GA, Kennestone Hospital Authority Rev. (WellStar Health System, Inc. Project), “B”, 5%, 4/01/2026 | 1,715,000 | 1,776,374 | ||
| Cobb County, GA, Kennestone Hospital Authority Rev. (WellStar Health System, Inc. Project), “B”, 5%, 4/01/2027 | 500,000 | 520,298 | ||
| Cobb County, GA, Kennestone Hospital Authority Rev. (WellStar Health System, Inc. Project), “B”, 5%, 4/01/2028 | 500,000 | 521,507 | ||
| Cobb County, GA, Kennestone Hospital Authority Rev. (WellStar Health System, Inc. Project), “B”, 5%, 4/01/2029 | 580,000 | 605,033 | ||
| Cobb County, GA, Kennestone Hospital Authority Rev. (WellStar Health System, Inc. Project), “B”, 5%, 4/01/2030 | 440,000 | 457,853 | ||
| Dalton, GA, Combined Utilities Rev., 5%, 3/01/2024 | 590,000 | 602,029 | ||
| Dalton, GA, Combined Utilities Rev., 5%, 3/01/2025 | 610,000 | 627,223 | ||
| Dalton, GA, Combined Utilities Rev., 5%, 3/01/2028 | 1,530,000 | 1,615,988 | ||
| Issuer | Shares/Par | Value ($) | ||
| Municipal Bonds - continued | ||||
| Georgia - continued | ||||
| DeKalb, GA, Housing Authority, Multi-Family Housing Rev. (Tranquility at Decatur Project), “B”, 2.77%, 9/01/2025 (Put Date 3/01/2025) | $ | 1,325,000 | $1,281,261 | |
| Georgia Main Street Natural Gas, Inc., Gas Project Rev., “B”, 4%, 8/01/2048 (Put Date 12/01/2023) | 8,815,000 | 8,790,939 | ||
| Georgia Main Street Natural Gas, Inc., Gas Project Rev., “B”, FLR, 2.846% (67% of LIBOR - 1mo. + 0.75%), 4/01/2048 (Put Date 9/01/2023) | 10,000,000 | 9,931,730 | ||
| Georgia Main Street Natural Gas, Inc., Gas Supply Rev., “B”, 4%, 8/01/2049 (Put Date 12/02/2024) | 3,610,000 | 3,587,308 | ||
| Georgia Main Street Natural Gas, Inc., Gas Supply Rev., “B”, 5%, 12/01/2052 (Put Date 6/01/2029) | 8,845,000 | 8,677,605 | ||
| Georgia Main Street Natural Gas, Inc., Gas Supply Rev., “C”, 4%, 3/01/2050 (Put Date 9/01/2026) | 1,765,000 | 1,694,200 | ||
| Georgia Main Street Natural Gas, Inc., Gas Supply Rev., “C”, 4%, 5/01/2052 (Put Date 12/01/2028) | 15,095,000 | 14,134,923 | ||
| Georgia Main Street Natural Gas, Inc., Gas Supply Rev., “D”, FLR, 2.926% (67% of LIBOR - 1mo. + 0.83%), 8/01/2048 (Put Date 12/01/2023) | 8,420,000 | 8,347,603 | ||
| Georgia Municipal Electric Authority (Project One), “A”, 5%, 1/01/2027 | 850,000 | 881,840 | ||
| Georgia Municipal Electric Authority (Project One), “A”, 5%, 1/01/2028 | 1,285,000 | 1,337,036 | ||
| Georgia Municipal Electric Authority (Project One), “A”, 5%, 1/01/2029 | 1,110,000 | 1,157,135 | ||
| Georgia Municipal Electric Authority (Project One), “A”, 5%, 1/01/2030 | 1,170,000 | 1,222,753 | ||
| Glynn-Brunswick, GA, Memorial Hospital Authority Rev., Anticipation Certificates (Southeast Georgia Health System Project), 5%, 8/01/2023 | 1,750,000 | 1,762,127 | ||
| Monroe County, GA, Development Authority Pollution Control Rev. (Georgia Power Co. Plant Scherer Project), 2.25%, 7/01/2025 | 5,500,000 | 5,150,774 | ||
| Northwest, GA, Housing Authority Multi-Family Housing Rev. (Dallas Manor Apartment Project), HUD Section 8, 0.25%, 10/01/2024 (Put Date 10/01/2023) | 2,000,000 | 1,930,501 | ||
| Northwest, GA, Housing Authority Multi-Family Housing Rev. (Spring Grove Apartment Project), HUD Section 8, 0.25%, 10/01/2024 (Put Date 10/01/2023) | 2,250,000 | 2,171,813 | ||
| $104,724,341 | ||||
| Issuer | Shares/Par | Value ($) | ||
| Municipal Bonds - continued | ||||
| Guam - 0.2% | ||||
| Guam Government Business Privilege Tax Refunding, “F”, 5%, 1/01/2028 | $ | 400,000 | $399,970 | |
| Guam International Airport Authority Rev. (A.B. Won Pat Airport), “A”, 5%, 10/01/2023 | 905,000 | 915,167 | ||
| Guam International Airport Authority Rev., Taxable (A.B. Won Pat Airport), “A”, 2.499%, 10/01/2025 | 620,000 | 566,371 | ||
| Guam International Airport Authority Rev., Taxable (A.B. Won Pat Airport), “A”, 2.899%, 10/01/2027 | 840,000 | 731,846 | ||
| Guam International Airport Authority Rev., Taxable (A.B. Won Pat Airport), “A”, 3.099%, 10/01/2028 | 1,880,000 | 1,610,170 | ||
| Guam International Airport Authority Rev., Taxable (A.B. Won Pat Airport), “A”, 3.339%, 10/01/2030 | 615,000 | 506,798 | ||
| Guam International Airport Authority Rev., Taxable (A.B. Won Pat Airport), “A”, 3.489%, 10/01/2031 | 450,000 | 366,155 | ||
| Guam Port Authority Rev., “B”, 5%, 7/01/2023 | 500,000 | 502,952 | ||
| $5,599,429 | ||||
| Hawaii - 0.1% | ||||
| City & County of Honolulu, HI, General Obligation, “A”, 5%, 9/01/2027 | $ | 2,015,000 | $2,160,750 | |
| Hawaii Harbor System Rev., “A”, 5%, 7/01/2024 | 250,000 | 255,994 | ||
| Hawaii Harbor System Rev., “A”, 5%, 7/01/2025 | 350,000 | 358,501 | ||
| Hawaii Harbor System Rev., “A”, 5%, 7/01/2027 | 250,000 | 258,793 | ||
| Hawaii Harbor System Rev., “A”, 5%, 7/01/2028 | 1,000,000 | 1,040,918 | ||
| Hawaii Harbor System Rev., “A”, 5%, 7/01/2029 | 500,000 | 523,054 | ||
| $4,598,010 | ||||
| Idaho - 0.2% | ||||
| Idaho Health Facilities Authority Rev. (St. Luke's Health System Project), “A”, 5%, 3/01/2026 | $ | 2,000,000 | $2,065,563 | |
| Idaho Health Facilities Authority Rev. (St. Luke's Health System Project), “A”, 5%, 3/01/2027 | 2,100,000 | 2,177,930 | ||
| Idaho Housing and Finance Association Multi-Family Housing Rev. (Sunset Landing Apartments Project ), “A”, 0.7%, 7/01/2024 | 1,840,000 | 1,753,094 | ||
| $5,996,587 | ||||
| Illinois - 9.7% | ||||
| Bolingbrook, IL, Special Service Areas Taxes, AGM, 4%, 3/01/2025 | $ | 1,500,000 | $1,513,036 | |
| Bolingbrook, IL, Special Service Areas Taxes, AGM, 4%, 3/01/2027 | 1,500,000 | 1,495,691 | ||
| Chicago, IL, “A”, 5%, 1/01/2028 | 5,000,000 | 4,981,333 | ||
| Chicago, IL, “A”, 5%, 1/01/2029 | 3,000,000 | 2,977,118 | ||
| Chicago, IL, “A”, 5%, 1/01/2031 | 2,000,000 | 1,955,905 | ||
| Chicago, IL, Board of Education (School Reform), “A”, NPFG, 5.25%, 12/01/2023 | 3,875,000 | 3,903,600 | ||
| Issuer | Shares/Par | Value ($) | ||
| Municipal Bonds - continued | ||||
| Illinois - continued | ||||
| Chicago, IL, Board of Education (School Reform), “A”, NPFG, 5.25%, 12/01/2023 | $ | 5,735,000 | $5,777,328 | |
| Chicago, IL, Board of Education (School Reform), Capital Appreciation, “A”, NPFG, 0%, 12/01/2022 | 785,000 | 782,686 | ||
| Chicago, IL, Board of Education (School Reform), Capital Appreciation, “A”, NPFG, 0%, 12/01/2028 | 4,435,000 | 3,296,663 | ||
| Chicago, IL, Board of Education (School Reform), Capital Appreciation, “B-1”, NPFG, 0%, 12/01/2022 | 1,855,000 | 1,849,533 | ||
| Chicago, IL, Board of Education (School Reform), Capital Appreciation, “B-1”, NPFG, 0%, 12/01/2023 | 8,170,000 | 7,799,240 | ||
| Chicago, IL, Board of Education (School Reform), Capital Appreciation, “B-1”, NPFG, 0%, 12/01/2026 | 1,925,000 | 1,589,965 | ||
| Chicago, IL, Board of Education, “A”, AAC, 5.5%, 12/01/2024 | 5,430,000 | 5,561,673 | ||
| Chicago, IL, Board of Education, Unlimited Tax General Obligation Refunding Dedicated Rev., “A”, 5%, 12/01/2029 | 1,260,000 | 1,235,742 | ||
| Chicago, IL, Board of Education, Unlimited Tax General Obligation Refunding Dedicated Rev., “A”, AGM, 5%, 12/01/2025 | 2,500,000 | 2,558,302 | ||
| Chicago, IL, Board of Education, Unlimited Tax General Obligation Refunding Dedicated Rev., “A”, AGM, 5%, 12/01/2026 | 3,000,000 | 3,082,097 | ||
| Chicago, IL, Board of Education, Unlimited Tax General Obligation Refunding Dedicated Rev., “A”, AGM, 5%, 12/01/2027 | 2,750,000 | 2,830,783 | ||
| Chicago, IL, Board of Education, Unlimited Tax General Obligation Refunding Dedicated Rev., “A”, AGM, 5%, 12/01/2028 | 2,250,000 | 2,322,701 | ||
| Chicago, IL, Board of Education, Unlimited Tax General Obligation Refunding Dedicated Rev., “C”, 5%, 12/01/2027 | 3,000,000 | 2,964,351 | ||
| Chicago, IL, Board of Education, Unlimited Tax General Obligation Refunding Dedicated Rev., “C”, AGM, 5%, 12/01/2027 | 10,000,000 | 10,321,358 | ||
| Chicago, IL, City Colleges Capital Improvement Project, Capital Appreciation, NPFG, 0%, 1/01/2026 | 6,640,000 | 5,800,984 | ||
| Chicago, IL, General Obligation, “A”, 5%, 1/01/2025 | 4,550,000 | 4,565,165 | ||
| Chicago, IL, Greater Chicago Metropolitan Water Reclamation District, “A”, 5%, 12/01/2027 | 460,000 | 491,439 | ||
| Chicago, IL, Greater Chicago Metropolitan Water Reclamation District, “C”, 5%, 12/01/2022 | 1,300,000 | 1,301,736 | ||
| Chicago, IL, Greater Chicago Metropolitan Water Reclamation District, “C”, 5%, 12/01/2025 | 2,750,000 | 2,870,700 | ||
| Chicago, IL, Greater Chicago Metropolitan Water Reclamation District, “C”, 5%, 12/01/2027 | 500,000 | 534,173 | ||
| Chicago, IL, Midway Airport Rev., Second Lien, “A”, 5.5%, 1/01/2030 | 3,060,000 | 3,063,285 | ||
| Chicago, IL, Multi-Family Housing Rev. (Covent Apartments Project), 4%, 9/01/2025 (Put Date 9/01/2024) | 1,637,250 | 1,635,783 | ||
| Issuer | Shares/Par | Value ($) | ||
| Municipal Bonds - continued | ||||
| Illinois - continued | ||||
| Chicago, IL, O’Hare International Airport Rev., Senior Lien, “C”, 5%, 1/01/2025 | $ | 2,000,000 | $2,036,843 | |
| Chicago, IL, O’Hare International Airport Rev., Senior Lien, “C”, 5%, 1/01/2026 | 3,500,000 | 3,580,340 | ||
| Chicago, IL, O'Hare International Airport Rev., Senior Lien, “A”, 5%, 1/01/2023 | 820,000 | 821,621 | ||
| Chicago, IL, O'Hare International Airport Rev., Senior Lien, “A”, 5%, 1/01/2025 | 5,000,000 | 5,092,107 | ||
| Chicago, IL, O'Hare International Airport, Passenger Facility Charge Rev., “B”, 5%, 1/01/2030 | 580,000 | 580,150 | ||
| Chicago, IL, Park District General Obligation, “E”, 4%, 1/01/2023 | 555,000 | 555,434 | ||
| Chicago, IL, Transit Authority Capital Grant Receipts Refunding Rev. (Federal Transit Administration Section 5307 Urbanized Area Formula Funds), 5%, 6/01/2023 | 700,000 | 706,044 | ||
| Chicago, IL, Transit Authority Capital Grant Receipts Refunding Rev. (Federal Transit Administration Section 5307 Urbanized Area Formula Funds), 5%, 6/01/2024 | 1,200,000 | 1,226,344 | ||
| Chicago, IL, Transit Authority Capital Grant Receipts Refunding Rev. (Federal Transit Administration Section 5337 State of Good Repair Formula Funds), 5%, 6/01/2026 | 115,000 | 117,861 | ||
| Chicago, IL, Transit Authority Capital Grant Receipts Refunding Rev. (Federal Transit Administration Section 5337 State Of Good Repair Formula Funds), 5%, 6/01/2023 | 270,000 | 272,331 | ||
| Chicago, IL, Transit Authority Capital Grant Receipts Refunding Rev. (Federal Transit Administration Section 5337 State Of Good Repair Formula Funds), 5%, 6/01/2024 | 285,000 | 291,257 | ||
| Chicago, IL, Transit Authority Capital Grant Receipts Refunding Rev. (Federal Transit Administration Section 5337 State Of Good Repair Formula Funds), 5%, 6/01/2025 | 150,000 | 152,916 | ||
| Chicago, IL, Transit Authority Refunding Rev., 5%, 6/01/2026 | 2,600,000 | 2,664,682 | ||
| Chicago, IL, Wastewater Transmission Rev., Second Lien, “B”, AGM, 5%, 1/01/2027 | 2,000,000 | 2,111,818 | ||
| Chicago, IL, Water Rev., AGM, 5%, 11/01/2027 | 4,160,000 | 4,377,098 | ||
| Chicago, IL, Water Rev., Second Lien, AGM, 5%, 11/01/2028 | 1,400,000 | 1,465,640 | ||
| Cook County, IL, General Obligation Refunding, “A”, 5%, 11/15/2025 | 1,000,000 | 1,038,647 | ||
| Cook County, IL, General Obligation Refunding, “A”, 5%, 11/15/2027 | 2,000,000 | 2,114,886 | ||
| Cook County, IL, General Obligation Refunding, “C”, AGM, 5%, 11/15/2025 | 10,000,000 | 10,006,338 | ||
| Cook County, IL, Sales Tax Rev., “A”, 5%, 11/15/2029 | 675,000 | 723,017 | ||
| Cook County, IL, School District No. 111, General Obligation, AGM, 4%, 12/01/2029 | 550,000 | 556,325 | ||
| Issuer | Shares/Par | Value ($) | ||
| Municipal Bonds - continued | ||||
| Illinois - continued | ||||
| Cook County, IL, School District No. 111, General Obligation, BAM, 5%, 12/01/2029 | $ | 935,000 | $1,008,385 | |
| Cook County, IL, School District No. 111, General Obligation, BAM, 5%, 12/01/2030 | 1,040,000 | 1,119,269 | ||
| Country Club Hills, Cook County, IL, Refunding, BAM, 4%, 12/01/2024 | 1,180,000 | 1,192,919 | ||
| Country Club Hills, Cook County, IL, Refunding, BAM, 4%, 12/01/2025 | 1,230,000 | 1,247,706 | ||
| DuPage County, IL, Carol Stream Park District, “C”, BAM, 4%, 11/01/2024 | 215,000 | 217,029 | ||
| DuPage County, IL, Carol Stream Park District, “C”, BAM, 4%, 11/01/2025 | 450,000 | 456,156 | ||
| DuPage County, IL, Carol Stream Park District, “C”, BAM, 4%, 11/01/2026 | 550,000 | 558,956 | ||
| DuPage County, IL, Carol Stream Park District, “C”, BAM, 4%, 11/01/2031 | 925,000 | 938,461 | ||
| East Moline, IL, General Obligation, Taxable, BAM, 0.926%, 1/15/2023 | 250,000 | 247,806 | ||
| East Moline, IL, General Obligation, Taxable, BAM, 1.21%, 1/15/2024 | 325,000 | 309,567 | ||
| Franklin Park, IL, General Obligation Refunding Debt Certificates, “A”, BAM, 3%, 10/01/2023 | 260,000 | 258,551 | ||
| Franklin Park, IL, General Obligation Refunding Debt Certificates, “A”, BAM, 3%, 10/01/2024 | 270,000 | 264,739 | ||
| Franklin Park, IL, General Obligation Refunding Debt Certificates, “A”, BAM, 3%, 10/01/2025 | 275,000 | 268,853 | ||
| Illinois Community College District No. 518 (Carl Sandburg Community College), BAM, 4%, 12/30/2025 | 750,000 | 761,799 | ||
| Illinois Community College District No. 518 (Carl Sandburg Community College), BAM, 4%, 12/30/2026 | 600,000 | 611,254 | ||
| Illinois Community College District No. 518 (Carl Sandburg Community College), BAM, 4%, 12/30/2027 | 325,000 | 331,460 | ||
| Illinois Community College District No. 518 (Carl Sandburg Community College), BAM, 4%, 12/30/2028 | 250,000 | 254,657 | ||
| Illinois Finance Authority Rev. (Advocate Health Care Network), “A-1”, 4%, 11/01/2030 | 2,325,000 | 2,334,347 | ||
| Illinois Finance Authority Rev. (Advocate Health Care Network), “A-2”, 4%, 11/01/2030 | 2,330,000 | 2,339,356 | ||
| Illinois Finance Authority Rev. (Dominican University), 5%, 3/01/2023 | 730,000 | 730,776 | ||
| Illinois Finance Authority Rev. (Dominican University), 5%, 3/01/2024 | 345,000 | 345,698 | ||
| Issuer | Shares/Par | Value ($) | ||
| Municipal Bonds - continued | ||||
| Illinois - continued | ||||
| Illinois Finance Authority Rev. (Dominican University), 5%, 3/01/2025 | $ | 460,000 | $461,154 | |
| Illinois Finance Authority Rev. (Dominican University), 5%, 3/01/2026 | 485,000 | 485,580 | ||
| Illinois Finance Authority Rev. (Dominican University), 5%, 3/01/2028 | 530,000 | 527,920 | ||
| Illinois Finance Authority Rev. (Dominican University), 5%, 3/01/2030 | 590,000 | 582,507 | ||
| Illinois Finance Authority Rev. (Edward-Elmhurst Healthcare), “A”, 5%, 1/01/2023 | 400,000 | 401,010 | ||
| Illinois Finance Authority Rev. (Edward-Elmhurst Healthcare), “A”, 5%, 1/01/2024 | 350,000 | 355,887 | ||
| Illinois Finance Authority Rev. (Edward-Elmhurst Healthcare), “A”, 5%, 1/01/2025 | 825,000 | 849,684 | ||
| Illinois Finance Authority Rev. (Franciscan Communities, Inc.), “A”, 4%, 5/15/2023 | 190,000 | 189,192 | ||
| Illinois Finance Authority Rev. (Franciscan Communities, Inc.), “A”, ETM, 4%, 5/15/2023 | 25,000 | 25,088 | ||
| Illinois Finance Authority Rev. (Northshore University Health System), “A”, 5%, 8/15/2023 | 1,000,000 | 1,013,064 | ||
| Illinois Finance Authority Rev. (OSF Healthcare System), “B-1”, 5%, 5/15/2050 (Put Date 11/15/2024) | 4,000,000 | 4,069,987 | ||
| Illinois Finance Authority Rev. (OSF Healthcare System), “B-2”, 5%, 5/15/2050 (Put Date 11/15/2026) | 4,500,000 | 4,655,658 | ||
| Illinois Finance Authority Rev. (Plymouth Place, Inc.), “A”, 5.5%, 5/15/2029 (w) | 805,000 | 803,684 | ||
| Illinois Finance Authority Rev. (Plymouth Place, Inc.), “A”, 5.75%, 5/15/2031 (w) | 905,000 | 911,040 | ||
| Illinois Finance Authority Rev. (Plymouth Place, Inc.), “A”, 5.75%, 5/15/2032 (w) | 955,000 | 956,374 | ||
| Illinois Finance Authority Rev. (Plymouth Place, Inc.), “A”, 6%, 5/15/2033 (w) | 1,015,000 | 1,025,638 | ||
| Illinois Finance Authority Rev. (Plymouth Place, Inc.), “A”, 6%, 5/15/2034 (w) | 1,075,000 | 1,074,985 | ||
| Illinois Finance Authority Rev. (Plymouth Place, Inc.), “B-2”, 5.25%, 11/15/2027 (w) | 1,940,000 | 1,936,598 | ||
| Illinois Finance Authority Rev. (Plymouth Place, Inc.), “B-3”, 4.75%, 11/15/2027 (w) | 3,880,000 | 3,873,116 | ||
| Illinois Finance Authority Rev. (Presence Health Network), “C”, 5%, 2/15/2023 | 3,900,000 | 3,916,263 | ||
| Illinois Finance Authority Rev. (Southern Illinois Healthcare Enterprises, Inc.), “C”, 5%, 3/01/2025 | 750,000 | 769,488 | ||
| Issuer | Shares/Par | Value ($) | ||
| Municipal Bonds - continued | ||||
| Illinois - continued | ||||
| Illinois Finance Authority Rev. (Southern Illinois Healthcare Enterprises, Inc.), “C”, 5%, 3/01/2026 | $ | 750,000 | $774,586 | |
| Illinois Finance Authority Rev. (University of Chicago), “A”, 5%, 10/01/2025 | 2,995,000 | 3,133,462 | ||
| Illinois Finance Authority Rev., Taxable (Christian Horizons Obligated Group), “B”, 3.25%, 5/15/2027 | 1,280,000 | 1,092,063 | ||
| Illinois Finance Authority, Academic Facilities Lease Rev. (Provident Group - UIUC Properties LLC - University of Illinois at Urbana-Champaign Project), “A”, 5%, 10/01/2027 | 250,000 | 262,575 | ||
| Illinois Finance Authority, Academic Facilities Lease Rev. (Provident Group - UIUC Properties LLC - University of Illinois at Urbana-Champaign Project), “A”, 5%, 10/01/2028 | 195,000 | 206,384 | ||
| Illinois Finance Authority, Academic Facilities Lease Rev. (Provident Group - UIUC Properties LLC - University of Illinois at Urbana-Champaign Project), “A”, 5%, 10/01/2029 | 250,000 | 265,535 | ||
| Illinois Finance Authority, Academic Facilities Lease Rev. (Provident Group - UIUC Properties LLC - University of Illinois at Urbana-Champaign Project), “A”, 5%, 10/01/2030 | 250,000 | 263,490 | ||
| Illinois Finance Authority, Academic Facilities Lease Rev. (Provident Group - UIUC Properties LLC - University of Illinois at Urbana-Champaign Project), “A”, 5%, 10/01/2031 | 235,000 | 246,670 | ||
| Illinois Finance Authority, Graduate & Professional Student Loan Program Rev. (Midwestern University Foundation), “A”, 5%, 7/01/2024 | 1,350,000 | 1,378,853 | ||
| Illinois Finance Authority, Graduate & Professional Student Loan Program Rev. (Midwestern University Foundation), “A”, 5%, 7/01/2025 | 750,000 | 774,729 | ||
| Illinois Finance Authority, Graduate & Professional Student Loan Program Rev. (Midwestern University Foundation), “A”, 5%, 7/01/2025 | 225,000 | 231,899 | ||
| Illinois Finance Authority, Graduate & Professional Student Loan Program Rev. (Midwestern University Foundation), “A”, 5%, 7/01/2026 | 1,300,000 | 1,353,087 | ||
| Illinois Finance Authority, Graduate & Professional Student Loan Program Rev. (Midwestern University Foundation), “A”, 5%, 7/01/2026 | 240,000 | 249,135 | ||
| Illinois Finance Authority, Graduate & Professional Student Loan Program Rev. (Midwestern University Foundation), “A”, 5%, 7/01/2027 | 1,250,000 | 1,306,901 | ||
| Illinois Finance Authority, Graduate & Professional Student Loan Program Rev. (Midwestern University Foundation), “A”, 5%, 7/01/2027 | 850,000 | 888,693 | ||
| Issuer | Shares/Par | Value ($) | ||
| Municipal Bonds - continued | ||||
| Illinois - continued | ||||
| Illinois Finance Authority, Graduate & Professional Student Loan Program Rev. (Midwestern University Foundation), “A”, 5%, 7/01/2028 | $ | 750,000 | $789,965 | |
| Illinois Finance Authority, Graduate & Professional Student Loan Program Rev. (Midwestern University Foundation), “A”, 5%, 7/01/2029 | 600,000 | 635,173 | ||
| Illinois Finance Authority, Graduate & Professional Student Loan Program Rev. (Midwestern University Foundation), “A”, 3%, 7/01/2035 | 430,000 | 356,259 | ||
| Illinois Finance Authority, Health Services Facility Lease Rev. (Provident Group - UIC Surgery Center LLC - University of Illinois Health Services Facility Project), 5%, 10/01/2024 | 500,000 | 508,992 | ||
| Illinois Finance Authority, Health Services Facility Lease Rev. (Provident Group - UIC Surgery Center LLC - University of Illinois Health Services Facility Project), 5%, 10/01/2026 | 500,000 | 514,127 | ||
| Illinois Finance Authority, Health Services Facility Lease Rev. (Provident Group - UIC Surgery Center LLC - University of Illinois Health Services Facility Project), 5%, 10/01/2027 | 500,000 | 512,543 | ||
| Illinois Finance Authority, Health Services Facility Lease Rev. (Provident Group - UIC Surgery Center LLC - University of Illinois Health Services Facility Project), 5%, 10/01/2028 | 500,000 | 512,967 | ||
| Illinois Finance Authority, Health Services Facility Lease Rev. (Provident Group - UIC Surgery Center LLC - University of Illinois Health Services Facility Project), 5%, 10/01/2030 | 500,000 | 512,943 | ||
| Illinois Finance Authority, Health Services Facility Lease Rev. (Provident Group - UIC Surgery Center LLC - University of Illinois Health Services Facility Project), 5%, 10/01/2031 | 500,000 | 504,031 | ||
| Illinois Finance Authority, Health Services Facility Lease Rev. (Provident Group - UIC Surgery Center LLC - University of Illinois Health Services Facility Project), 5%, 10/01/2032 | 425,000 | 426,844 | ||
| Illinois Finance Authority, Health Services Facility Lease Rev. (Provident Group - UIC Surgery Center LLC - University of Illinois Health Services Facility Project), 5%, 10/01/2033 | 500,000 | 499,943 | ||
| Illinois Finance Authority, Water Facilities Refunding Rev. (American Water Capital Corp. Project), 0.7%, 5/01/2040 (Put Date 9/01/2023) | 950,000 | 924,763 | ||
| Illinois Housing Development Authority Multi-Family Housing Rev. (Berry Manor), 4%, 9/01/2025 (Put Date 9/01/2024) | 500,000 | 499,028 | ||
| Illinois Metropolitan Pier & Exposition Authority, Dedicated State Tax Rev. (McCormick Place Expansion Project), NPFG, 5.5%, 6/15/2029 | 3,110,000 | 3,256,436 | ||
| Issuer | Shares/Par | Value ($) | ||
| Municipal Bonds - continued | ||||
| Illinois - continued | ||||
| Illinois Metropolitan Pier & Exposition Authority, Dedicated State Tax Rev. Refunding Bonds (McCormick Place Expansion Project), Capital Appreciation, “B-1”, AGM, 0%, 6/15/2026 | $ | 2,385,000 | $2,046,549 | |
| Illinois Metropolitan Pier & Exposition Authority, Dedicated State Tax Rev., Capital Appreciation, “A”, NPFG, 0%, 6/15/2024 | 7,075,000 | 6,588,360 | ||
| Illinois Metropolitan Pier & Exposition Authority, Dedicated State Tax Rev., Capital Appreciation, “A”, NPFG, 0%, 12/15/2026 | 1,275,000 | 1,054,113 | ||
| Illinois Railsplitter Tobacco Settlement Authority Rev., 5%, 6/01/2023 | 2,500,000 | 2,519,288 | ||
| Illinois Regional Transportation Authority, General Obligation Refunding Rev., “A”, NPFG, 6%, 7/01/2029 | 340,000 | 374,317 | ||
| Illinois Sales Tax Securitization Corp., Second Lien, “A”, 5%, 1/01/2025 | 3,250,000 | 3,328,828 | ||
| Illinois Sales Tax Securitization Corp., Second Lien, “A”, 5%, 1/01/2027 | 2,500,000 | 2,594,619 | ||
| Illinois Sales Tax Securitization Corp., Second Lien, “A”, 5%, 1/01/2028 | 7,500,000 | 7,786,039 | ||
| Illinois Sales Tax Securitization Corp., Second Lien, “A”, 5%, 1/01/2029 | 7,500,000 | 7,764,929 | ||
| Illinois Sports Facilities Authority Refunding Rev., BAM, 5%, 6/15/2029 | 2,405,000 | 2,445,805 | ||
| Illinois Sports Facilities Authority, State Tax Supported Refunding Rev., AGM, 5%, 6/15/2027 | 965,000 | 979,501 | ||
| Kane County, IL, School District No. 131 Rev., “A”, AGM, 5%, 12/01/2025 | 340,000 | 354,216 | ||
| Kane County, IL, School District No. 131 Rev., “A”, AGM, 5%, 12/01/2026 | 665,000 | 699,728 | ||
| Kane County, IL, School District No. 131 Rev., “B”, AGM, 5%, 12/01/2025 | 700,000 | 729,268 | ||
| Kane County, IL, School District No. 131 Rev., “B”, AGM, 5%, 12/01/2026 | 410,000 | 431,411 | ||
| Macon County, IL, Decatur School District No. 61 General Obligation School Rev., “C”, AGM, 4%, 1/01/2023 | 200,000 | 200,223 | ||
| Macon County, IL, Decatur School District No. 61 General Obligation School Rev., “C”, AGM, 4%, 1/01/2025 | 545,000 | 549,237 | ||
| Macon County, IL, Decatur School District No. 61 General Obligation School Rev., “C”, AGM, 4%, 1/01/2027 | 300,000 | 303,887 | ||
| Macon County, IL, Decatur School District No. 61 General Obligation School Rev., “C”, AGM, 4%, 1/01/2028 | 300,000 | 303,596 | ||
| Madison County, IL, Edwardsville Community Unit School District No. 007, BAM, 3.375%, 12/01/2027 | 100,000 | 94,102 | ||
| Madison County, IL, Edwardsville Community Unit School District No. 007, BAM, 5%, 12/01/2028 | 450,000 | 469,751 | ||
| Issuer | Shares/Par | Value ($) | ||
| Municipal Bonds - continued | ||||
| Illinois - continued | ||||
| Madison County, IL, Edwardsville Community Unit School District No. 007, BAM, 5%, 12/01/2029 | $ | 465,000 | $485,409 | |
| Madison, Macoupin, Etc. Counties, IL, Community College District No. 536, BAM, 5%, 11/01/2027 | 1,485,000 | 1,526,561 | ||
| Newport Township, IL, Fire Protection District, BAM, 4%, 1/01/2025 | 80,000 | 80,179 | ||
| Newport Township, IL, Fire Protection District, BAM, 4%, 1/01/2027 | 165,000 | 164,850 | ||
| Newport Township, IL, Fire Protection District, BAM, 4%, 1/01/2028 | 170,000 | 169,207 | ||
| Northern Illinois Municipal Power Agency Project, Refunding Rev. (Prairie State Project), “A”, 4%, 12/01/2033 | 105,000 | 99,433 | ||
| Northern Illinois University, Auxiliary Facilities System Refunding Rev., “B”, BAM, 5%, 4/01/2023 | 120,000 | 120,776 | ||
| Northern Illinois University, Auxiliary Facilities System Refunding Rev., “B”, BAM, 5%, 4/01/2024 | 525,000 | 535,830 | ||
| Northern Illinois University, Auxiliary Facilities System Refunding Rev., “B”, BAM, 5%, 4/01/2025 | 425,000 | 435,430 | ||
| Northern Illinois University, Auxiliary Facilities System Refunding Rev., “B”, BAM, 5%, 4/01/2026 | 690,000 | 711,573 | ||
| Northern Illinois University, Auxiliary Facilities System Refunding Rev., “B”, BAM, 5%, 4/01/2027 | 525,000 | 545,451 | ||
| Northern Illinois University, Auxiliary Facilities System Refunding Rev., “B”, BAM, 5%, 4/01/2028 | 640,000 | 668,476 | ||
| Northern Illinois University, Auxiliary Facilities System Refunding Rev., “B”, BAM, 5%, 4/01/2030 | 1,000,000 | 1,055,487 | ||
| Northern Illinois University, Auxiliary Facilities System Refunding Rev., “B”, BAM, 5%, 4/01/2032 | 1,325,000 | 1,382,911 | ||
| Northern Illinois University, Auxiliary Facilities System Rev., BAM, 5%, 10/01/2025 | 325,000 | 335,006 | ||
| Northern Illinois University, Auxiliary Facilities System Rev., BAM, 5%, 10/01/2026 | 250,000 | 258,797 | ||
| Peoria, IL, Public Building Commission, School District Facilities Rev., “A”, AGM, 4%, 12/01/2025 | 700,000 | 710,077 | ||
| Peoria, IL, Public Building Commission, School District Facilities Rev., “A”, AGM, 4%, 12/01/2026 | 1,000,000 | 1,016,552 | ||
| Peoria, IL, Public Building Commission, School District Facilities Rev., “A”, AGM, 4%, 12/01/2027 | 1,270,000 | 1,297,762 | ||
| Peoria, IL, Public Building Commission, School District Facilities Rev., “A”, AGM, 5%, 12/01/2028 | 1,200,000 | 1,281,464 | ||
| Peoria, IL, Public Building Commission, School District Facilities Rev., “A”, AGM, 5%, 12/01/2029 | 4,430,000 | 4,724,310 | ||
| Issuer | Shares/Par | Value ($) | ||
| Municipal Bonds - continued | ||||
| Illinois - continued | ||||
| Sangamon County, IL, Springfield School District No. 186, “C”, AGM, 4%, 6/01/2023 | $ | 1,000,000 | $1,002,999 | |
| Sangamon County, IL, Springfield School District No. 186, “C”, AGM, 4%, 6/01/2024 | 785,000 | 789,796 | ||
| Southern Illinois University Housing and Auxiliary Facilities System Rev., “A”, 4%, 4/01/2023 | 650,000 | 650,706 | ||
| Southern Illinois University Housing and Auxiliary Facilities System Rev., “A”, 4%, 4/01/2025 | 1,200,000 | 1,201,653 | ||
| Southern Illinois University Housing and Auxiliary Facilities System Rev., “A”, 4%, 4/01/2027 | 1,700,000 | 1,695,696 | ||
| Southwestern, IL, Development Authority Health Facility Rev. (Hospital Sisters Services, Inc.), “A”, 5%, 2/15/2025 | 1,000,000 | 1,025,518 | ||
| Southwestern, IL, Development Authority Health Facility Rev. (Hospital Sisters Services, Inc.), “A”, 5%, 2/15/2026 | 3,000,000 | 3,097,160 | ||
| State of Illinois, “A”, 5%, 10/01/2028 | 2,200,000 | 2,203,809 | ||
| State of Illinois, General Obligation, 5%, 2/01/2025 | 6,190,000 | 6,239,223 | ||
| State of Illinois, General Obligation, AGM, 5%, 2/01/2027 | 910,000 | 917,902 | ||
| State of Illinois, General Obligation, AGM, 4%, 2/01/2030 | 380,000 | 366,483 | ||
| State of Illinois, General Obligation, “A”, 5%, 3/01/2023 | 2,750,000 | 2,759,298 | ||
| State of Illinois, General Obligation, “A”, 5%, 11/01/2027 | 5,365,000 | 5,383,803 | ||
| State of Illinois, General Obligation, “B”, 5%, 3/01/2023 | 3,500,000 | 3,511,834 | ||
| State of Illinois, General Obligation, “C”, 4%, 3/01/2023 | 7,000,000 | 7,000,979 | ||
| State of Illinois, General Obligation, “C”, 4%, 3/01/2024 | 365,000 | 363,451 | ||
| State of Illinois, General Obligation, “A”, 5%, 12/01/2024 | 220,000 | 221,849 | ||
| State of Illinois, General Obligation,“C”, 5%, 6/15/2023 | 2,000,000 | 2,012,020 | ||
| State of Illinois, Sales Tax Rev., BAM, 5%, 6/15/2025 | 240,000 | 242,139 | ||
| Upper Illinois River Valley Development Authority Rev. (Morris Hospital), 5%, 12/01/2025 | 380,000 | 387,761 | ||
| Upper Illinois River Valley Development Authority Rev. (Morris Hospital), 5%, 12/01/2026 | 915,000 | 938,661 | ||
| $298,353,854 | ||||
| Indiana - 2.5% | ||||
| Ball State University Board of Trustees (Student Fee), “R”, 5%, 7/01/2024 | $ | 1,000,000 | $1,026,260 | |
| Dekalb & Steuben Counties, GA, Central School Buildings Corp. Property Tax, 4%, 7/15/2023 | 200,000 | 200,935 | ||
| Dekalb & Steuben Counties, GA, Central School Buildings Corp. Property Tax, 4%, 1/15/2024 | 360,000 | 362,679 | ||
| Dekalb & Steuben Counties, GA, Central School Buildings Corp. Property Tax, 4%, 7/15/2024 | 640,000 | 646,138 | ||
| Dekalb & Steuben Counties, GA, Central School Buildings Corp. Property Tax, 4%, 1/15/2025 | 655,000 | 662,418 | ||
| Issuer | Shares/Par | Value ($) | ||
| Municipal Bonds - continued | ||||
| Indiana - continued | ||||
| Dekalb & Steuben Counties, GA, Central School Buildings Corp. Property Tax, 4%, 7/15/2025 | $ | 570,000 | $577,739 | |
| Dekalb & Steuben Counties, GA, Central School Buildings Corp. Property Tax, 4%, 1/15/2026 | 890,000 | 902,629 | ||
| Dekalb & Steuben Counties, GA, Central School Buildings Corp. Property Tax, 4%, 7/15/2026 | 855,000 | 868,358 | ||
| Evansville, IN, Redevelopment Authority Lease Rental Rev. (Arena Project), BAM, 5%, 2/01/2025 | 1,000,000 | 1,036,253 | ||
| Indiana Finance Authority Refunding Rev., Taxable (BHI Senior Living), “B”, 3.21%, 11/15/2028 | 115,000 | 98,245 | ||
| Indiana Finance Authority Rev., Taxable (BHI Senior Living), “B”, 1.67%, 11/15/2022 | 300,000 | 299,567 | ||
| Indiana Finance Authority Rev., Taxable (BHI Senior Living), “B”, 1.72%, 11/15/2023 | 300,000 | 287,186 | ||
| Indiana Finance Authority Rev., Taxable (BHI Senior Living), “B”, 1.99%, 11/15/2024 | 350,000 | 323,948 | ||
| Indiana Finance Authority Rev., Taxable (BHI Senior Living), “B”, 2.52%, 11/15/2026 | 515,000 | 453,074 | ||
| Indiana Finance Authority, Educational Facilities Rev. (Butler University Project), 4%, 2/01/2026 | 425,000 | 425,275 | ||
| Indiana Finance Authority, Educational Facilities Rev. (Valparaiso University Project), 5%, 10/01/2023 | 200,000 | 201,924 | ||
| Indiana Finance Authority, Educational Facilities Rev. (Valparaiso University Project), 5%, 10/01/2026 | 270,000 | 277,530 | ||
| Indiana Finance Authority, Environmental Facilities Refunding Rev. (Indianapolis Power & Light Co.), “B”, 0.95%, 12/01/2038 (Put Date 4/01/2026) | 1,655,000 | 1,396,253 | ||
| Indiana Finance Authority, Environmental Improvement Rev. (Fulcrum Centerpoint LLC Project), 4.5%, 12/15/2046 (Put Date 11/15/2023) (w) | 10,000,000 | 10,000,717 | ||
| Indiana Finance Authority, Hospital Rev. (Goshen Health), “A”, 5%, 11/01/2027 | 740,000 | 764,183 | ||
| Indiana Finance Authority, Hospital Rev. (Goshen Health), “A”, 5%, 11/01/2028 | 775,000 | 800,655 | ||
| Indiana Finance Authority, Hospital Rev. (Goshen Health), “A”, 5%, 11/01/2029 | 1,140,000 | 1,179,286 | ||
| Indiana Finance Authority, Hospital Rev. (Goshen Health), “A”, 5%, 11/01/2030 | 985,000 | 1,013,646 | ||
| Indiana Finance Authority, Hospital Rev. (Goshen Health), “A”, 2.1%, 11/01/2049 (Put Date 11/01/2026) | 2,700,000 | 2,530,315 | ||
| Indianapolis, IN, Local Public Improvement (Indianapolis Airport Authority Project), “I”, 5%, 1/01/2023 | 1,000,000 | 1,001,811 | ||
| Issuer | Shares/Par | Value ($) | ||
| Municipal Bonds - continued | ||||
| Indiana - continued | ||||
| Indianapolis, IN, Local Public Improvement (Indianapolis Airport Authority Project), “I”, 5%, 1/01/2028 | $ | 1,000,000 | $1,012,399 | |
| Indianapolis, IN, Local Public Improvement, “A”, 5%, 6/01/2023 | 1,400,000 | 1,414,024 | ||
| Indianapolis, IN, Local Public Improvement, “A”, 5%, 6/01/2024 | 1,800,000 | 1,838,403 | ||
| Indianapolis, IN, Local Public Improvement, “A”, 5%, 6/01/2025 | 3,415,000 | 3,524,416 | ||
| Indianapolis, IN, Local Public Improvement, Community Justice Campus (Courthouse and Jail Project), “A”, 5%, 2/01/2028 | 1,100,000 | 1,181,039 | ||
| Indianapolis, IN, Local Public Improvement, Community Justice Campus (Courthouse and Jail Project), “A”, 5%, 2/01/2029 | 1,000,000 | 1,085,154 | ||
| Indianapolis, IN, Local Public Improvement, Community Justice Campus (Courthouse and Jail Project), “A”, 5%, 2/01/2030 | 1,300,000 | 1,408,067 | ||
| Indianapolis, IN, Local Public Improvement, Community Justice Campus (Courthouse and Jail Project), “A”, 5%, 2/01/2031 | 1,500,000 | 1,617,586 | ||
| Jefferson County, IN, Jail Building Corp., Lease Rental Rev., BAM, 4%, 1/15/2023 | 225,000 | 225,327 | ||
| Jefferson County, IN, Jail Building Corp., Lease Rental Rev., BAM, 4%, 7/15/2023 | 335,000 | 336,566 | ||
| Jefferson County, IN, Jail Building Corp., Lease Rental Rev., BAM, 4%, 1/15/2024 | 680,000 | 684,660 | ||
| Jefferson County, IN, Jail Building Corp., Lease Rental Rev., BAM, 4%, 7/15/2024 | 690,000 | 696,390 | ||
| Jefferson County, IN, Jail Building Corp., Lease Rental Rev., BAM, 4%, 1/15/2025 | 355,000 | 358,999 | ||
| Jefferson County, IN, Jail Building Corp., Lease Rental Rev., BAM, 4%, 7/15/2025 | 360,000 | 364,713 | ||
| Jefferson County, IN, Jail Building Corp., Lease Rental Rev., BAM, 4%, 1/15/2026 | 365,000 | 370,330 | ||
| Jefferson County, IN, Jail Building Corp., Lease Rental Rev., BAM, 4%, 7/15/2026 | 375,000 | 380,859 | ||
| Jefferson County, IN, Jail Building Corp., Lease Rental Rev., BAM, 4%, 7/15/2027 | 390,000 | 398,291 | ||
| Jefferson County, IN, Jail Building Corp., Lease Rental Rev., BAM, 4%, 1/15/2028 | 395,000 | 402,073 | ||
| Jefferson County, IN, Jail Building Corp., Lease Rental Rev., BAM, 4%, 7/15/2028 | 405,000 | 412,860 | ||
| Jefferson County, IN, Jail Building Corp., Lease Rental Rev., BAM, 4%, 1/15/2029 | 350,000 | 357,093 | ||
| Jefferson County, IN, Jail Building Corp., Lease Rental Rev., BAM, 4%, 7/15/2029 | 425,000 | 433,740 | ||
| Jefferson County, IN, Jail Building Corp., Lease Rental Rev., BAM, 4%, 1/15/2030 | 430,000 | 436,668 | ||
| Jefferson County, IN, Jail Building Corp., Lease Rental Rev., BAM, 4%, 7/15/2030 | 435,000 | 442,526 | ||
| Issuer | Shares/Par | Value ($) | ||
| Municipal Bonds - continued | ||||
| Indiana - continued | ||||
| Lake County, IN, Hammond Multi-School Building Corp., 5%, 7/15/2025 | $ | 1,500,000 | $1,555,984 | |
| Lake County, IN, Hammond Multi-School Building Corp., 5%, 1/15/2026 | 1,500,000 | 1,565,398 | ||
| Lake County, IN, Hammond Multi-School Building Corp., 5%, 7/15/2026 | 1,210,000 | 1,270,106 | ||
| Lake County, IN, Hammond Multi-School Building Corp., 5%, 1/15/2027 | 1,515,000 | 1,599,176 | ||
| Lake County, IN, Hammond Multi-School Building Corp., 5%, 7/15/2027 | 1,000,000 | 1,061,267 | ||
| Lake County, IN, Hammond Multi-School Building Corp., 5%, 1/15/2028 | 1,000,000 | 1,066,763 | ||
| Lake County, IN, Hammond Multi-School Building Corp., 5%, 7/15/2028 | 1,435,000 | 1,530,113 | ||
| Mount Vernon, IN, Environmental Improvement Rev. (Southern Indiana Gas and Electric Co. Project), 0.875%, 9/01/2055 (Put Date 9/01/2023) | 2,045,000 | 1,996,162 | ||
| Valparaiso, IN, Exempt Facilities Rev. (Pratt Paper LLC Project), 5.875%, 1/01/2024 | 400,000 | 404,359 | ||
| Warrick County, IN, Environmental Improvement Rev. (Southern Indiana Gas and Electric Co. Projects), 0.875%, 9/01/2055 (Put Date 9/01/2023) | 1,290,000 | 1,259,193 | ||
| Whiting, IN, Environmental Facilities Rev. (BP Products North America, Inc. Project), 5%, 11/01/2047 (Put Date 11/01/2024) | 7,500,000 | 7,570,859 | ||
| Whiting, IN, Environmental Facilities Rev. (BP Products North America, Inc. Project), “A”, 5%, 12/01/2044 (Put Date 6/05/2026) | 6,590,000 | 6,686,971 | ||
| Whiting, IN, Environmental Facilities Rev. (BP Products North America, Inc. Project), “A”, 5%, 3/01/2046 (Put Date 3/01/2023) | 3,000,000 | 3,005,500 | ||
| $77,291,058 | ||||
| Iowa - 0.1% | ||||
| Iowa Student Loan Liquidity Corp. Rev., “A”, 5%, 12/01/2022 | $ | 1,375,000 | $1,376,621 | |
| Iowa Student Loan Liquidity Corp. Rev., “A”, 5%, 12/01/2024 | 1,000,000 | 1,017,389 | ||
| Iowa Student Loan Liquidity Corp. Rev., “A”, 5%, 12/01/2025 | 1,425,000 | 1,460,303 | ||
| $3,854,313 | ||||
| Kansas - 1.3% | ||||
| Burlington, KS, Environmental Improvement Rev. (Kansas City Power & Light Co. Project), “B”, 2.95%, 12/01/2023 | $ | 10,000,000 | $9,876,902 | |
| Coffeyville, KS, Electric Utility System Rev., “B”, NPFG, 5%, 6/01/2024 (n) | 1,300,000 | 1,292,991 | ||
| Kansas Development Finance Authority Hospital Rev. (Advent Health Obligated Group), “B-1”, 5%, 11/15/2054 (Put Date 11/15/2028) | 12,880,000 | 13,651,369 | ||
| Issuer | Shares/Par | Value ($) | ||
| Municipal Bonds - continued | ||||
| Kansas - continued | ||||
| Lyon County, KS, Unified School District No. 253, 4%, 9/01/2028 | $ | 460,000 | $466,591 | |
| Lyon County, KS, Unified School District No. 253, 4%, 9/01/2029 | 450,000 | 454,467 | ||
| Lyon County, KS, Unified School District No. 253, 4%, 9/01/2030 | 325,000 | 327,631 | ||
| Lyon County, KS, Unified School District No. 253, 4%, 9/01/2031 | 350,000 | 351,533 | ||
| Manhattan, KS, Health Care Facilities Rev. (Meadowlark Hills), “A”, 4%, 6/01/2025 | 85,000 | 81,046 | ||
| Manhattan, KS, Health Care Facilities Rev. (Meadowlark Hills), “A”, 4%, 6/01/2026 | 320,000 | 304,878 | ||
| Manhattan, KS, Health Care Facilities Rev. (Meadowlark Hills), “A”, 4%, 6/01/2027 | 330,000 | 310,183 | ||
| Manhattan, KS, Health Care Facilities Rev. (Meadowlark Hills), “A”, 4%, 6/01/2028 | 300,000 | 276,576 | ||
| Manhattan, KS, Health Care Facilities Rev. (Meadowlark Hills), “B-2”, 2.375%, 6/01/2027 | 430,000 | 379,911 | ||
| Overland Park, KS, Development Corp. Improvement and Refunding Rev. (Convention Center Hotel), 5%, 3/01/2026 | 1,770,000 | 1,728,135 | ||
| Overland Park, KS, Development Corp. Improvement and Refunding Rev. (Convention Center Hotel), 5%, 3/01/2027 | 1,865,000 | 1,804,587 | ||
| Overland Park, KS, Development Corp. Improvement and Refunding Rev. (Convention Center Hotel), 5%, 3/01/2028 | 1,960,000 | 1,878,993 | ||
| Overland Park, KS, Development Corp. Improvement and Refunding Rev. (Convention Center Hotel), 5%, 3/01/2029 | 2,060,000 | 1,959,658 | ||
| Overland Park, KS, Development Corp. Improvement and Refunding Rev. (Convention Center Hotel), 5%, 3/01/2030 | 2,165,000 | 2,052,745 | ||
| Overland Park, KS, Development Corp. Improvement and Refunding Rev. (Convention Center Hotel), 5%, 3/01/2031 | 2,270,000 | 2,139,268 | ||
| $39,337,464 | ||||
| Kentucky - 2.3% | ||||
| Boone County, KY, Pollution Control Rev. (Duke Energy Kentucky, Inc. Project), “A”, 3.7%, 8/01/2027 | $ | 4,500,000 | $4,324,594 | |
| Bowling Green, KY, Water and Sewer Rev., AGM, 4%, 6/01/2030 | 2,180,000 | 2,193,301 | ||
| Carroll County, KY, Environmental Facilities Rev. (Utilities Company Project), “A”, 3.375%, 2/01/2026 | 10,000,000 | 9,845,257 | ||
| Hazard, KY, Healthcare Rev. (Appalachian Regional Healthcare Project), 5%, 7/01/2023 | 350,000 | 353,098 | ||
| Hazard, KY, Healthcare Rev. (Appalachian Regional Healthcare Project), 5%, 7/01/2024 | 225,000 | 229,225 | ||
| Hazard, KY, Healthcare Rev. (Appalachian Regional Healthcare Project), 5%, 7/01/2025 | 270,000 | 277,934 | ||
| Hazard, KY, Healthcare Rev. (Appalachian Regional Healthcare Project), 5%, 7/01/2026 | 225,000 | 233,019 | ||
| Issuer | Shares/Par | Value ($) | ||
| Municipal Bonds - continued | ||||
| Kentucky - continued | ||||
| Henderson, KY, Exempt Facilities Rev. (Pratt Paper LLC Project), “B”, 3.7%, 1/01/2032 (n) | $ | 2,895,000 | $2,622,858 | |
| Kentucky Economic Development Finance Authority Hospital Rev. (Owensboro Health, Inc.), “A”, 5%, 6/01/2025 | 1,750,000 | 1,790,042 | ||
| Kentucky Economic Development Finance Authority Hospital Rev. (Owensboro Health, Inc.), “A”, 5%, 6/01/2026 | 2,000,000 | 2,061,146 | ||
| Kentucky Economic Development Finance Authority Hospital Rev. (Owensboro Health, Inc.), “A”, 5%, 6/01/2027 | 2,625,000 | 2,701,690 | ||
| Kentucky Higher Education Student Loan Corp. Rev., “A-1”, 5%, 6/01/2023 | 350,000 | 353,244 | ||
| Kentucky Higher Education Student Loan Corp. Rev., “A-1”, 5%, 6/01/2024 | 700,000 | 711,161 | ||
| Kentucky Higher Education Student Loan Corp. Rev., “A-1”, 5%, 6/01/2024 | 500,000 | 507,972 | ||
| Kentucky Higher Education Student Loan Corp. Rev., “A-1”, 5%, 6/01/2025 | 1,350,000 | 1,381,887 | ||
| Kentucky Higher Education Student Loan Corp. Rev., “A-1”, 5%, 6/01/2025 | 750,000 | 767,715 | ||
| Kentucky Higher Education Student Loan Corp. Rev., “A-1”, 5%, 6/01/2026 | 2,000,000 | 2,056,447 | ||
| Kentucky Higher Education Student Loan Corp. Rev., “A-1”, 5%, 6/01/2026 | 950,000 | 975,221 | ||
| Kentucky Higher Education Student Loan Corp. Rev., “A-1”, 5%, 6/01/2027 | 3,000,000 | 3,091,420 | ||
| Kentucky Higher Education Student Loan Corp. Rev., “A-1”, 5%, 6/01/2027 | 1,000,000 | 1,028,378 | ||
| Kentucky Higher Education Student Loan Corp. Rev., “A-1”, 5%, 6/01/2028 | 1,150,000 | 1,179,288 | ||
| Kentucky Higher Education Student Loan Corp. Rev., “A-1”, 5%, 6/01/2029 | 700,000 | 719,835 | ||
| Kentucky Higher Education Student Loan Corp. Rev., “A-1”, 5%, 6/01/2029 | 1,250,000 | 1,278,272 | ||
| Kentucky State University Certificates of Participation, BAM, 5%, 11/01/2024 | 95,000 | 97,585 | ||
| Kentucky State University Certificates of Participation, BAM, 5%, 11/01/2025 | 160,000 | 166,345 | ||
| Kentucky State University Certificates of Participation, BAM, 5%, 11/01/2027 | 285,000 | 302,739 | ||
| Kentucky State University, Certificates of Participation, BAM, 5%, 11/01/2028 | 180,000 | 193,017 | ||
| Louisville & Jefferson County, KY, Metro Government College Improvement Rev. (Bellarmine University Project), “A”, 4%, 5/01/2026 | 1,190,000 | 1,133,702 | ||
| Issuer | Shares/Par | Value ($) | ||
| Municipal Bonds - continued | ||||
| Kentucky - continued | ||||
| Louisville & Jefferson County, KY, Metro Government College Improvement Rev. (Bellarmine University Project), “A”, 4%, 5/01/2027 | $ | 1,105,000 | $1,037,581 | |
| Owen County, KY, Water Facilities Refunding Rev. (Kentucky-American Water Co. Project), 0.7%, 6/01/2040 (Put Date 9/01/2023) | 850,000 | 827,419 | ||
| Public Energy Authority of Kentucky, Gas Supply Rev., “B”, 4%, 1/01/2049 (Put Date 11/01/2024) | 11,785,000 | 11,598,183 | ||
| Public Energy Authority of Kentucky, Gas Supply Rev., “C-1”, 4%, 12/01/2049 (Put Date 6/01/2025) | 15,000,000 | 14,613,241 | ||
| University of Kentucky, General Receipts, “A”, 4%, 10/01/2029 | 1,000,000 | 1,011,334 | ||
| $71,664,150 | ||||
| Louisiana - 1.3% | ||||
| East Baton Rouge, LA, Sewerage Commission Multi-Modal Rev., “A”, 5%, 2/01/2023 | $ | 300,000 | $301,380 | |
| East Baton Rouge, LA, Sewerage Commission Multi-Modal Rev., “A”, 5%, 2/01/2024 | 325,000 | 332,153 | ||
| Louisiana Local Government, Environmental Facilities & Community Development Authority Rev., Taxable (LCTCS Act 360 Project), AGM, 0.576%, 10/01/2023 | 250,000 | 240,137 | ||
| Louisiana Local Government, Environmental Facilities & Community Development Authority Rev., Taxable (LCTCS Act 360 Project), AGM, 0.682%, 10/01/2024 | 500,000 | 460,409 | ||
| Louisiana Local Government, Environmental Facilities & Community Development Authority Rev., Taxable (LCTCS Act 360 Project), AGM, 0.965%, 10/01/2025 | 750,000 | 666,194 | ||
| Louisiana Local Government, Environmental Facilities & Community Development Authority Rev., Taxable (LCTCS Act 360 Project), AGM, 1.165%, 10/01/2026 | 330,000 | 282,776 | ||
| Louisiana Local Government, Environmental Facilities & Community Development Authority Rev., Taxable (LCTCS Act 360 Project), AGM, 1.406%, 10/01/2027 | 460,000 | 383,249 | ||
| Louisiana Local Government, Environmental Facilities & Community Development Authority Rev., Taxable (LCTCS Act 360 Project), AGM, 1.656%, 10/01/2028 | 1,285,000 | 1,045,989 | ||
| Louisiana Offshore Terminal Authority, Deepwater Port Rev. (Loop LLC Project), “A”, 1.65%, 9/01/2027 (Put Date 12/01/2023) | 2,705,000 | 2,642,725 | ||
| Louisiana Offshore Terminal Authority, Deepwater Port Rev. (Loop LLC Project), “A”, 1.65%, 9/01/2033 (Put Date 12/01/2023) | 2,200,000 | 2,149,351 | ||
| Louisiana Offshore Terminal Authority, Deepwater Port Rev. (Loop LLC Project), “A”, 1.65%, 9/01/2034 (Put Date 12/01/2023) | 1,690,000 | 1,651,092 | ||
| Issuer | Shares/Par | Value ($) | ||
| Municipal Bonds - continued | ||||
| Louisiana - continued | ||||
| Louisiana Public Facilities Authority Refunding Rev. (Loyola University Project), 5%, 10/01/2025 | $ | 300,000 | $304,032 | |
| Louisiana Public Facilities Authority Rev. (Ochsner Clinic Foundation Project), “B”, 5%, 5/15/2050 (Put Date 5/15/2025) | 4,600,000 | 4,720,424 | ||
| Louisiana Public Facilities Authority Rev. (Tulane University Project), “A”, 5%, 4/01/2025 | 915,000 | 949,638 | ||
| Louisiana Public Facilities Authority Rev. (Tulane University Project), “A”, 5%, 4/01/2028 | 1,000,000 | 1,046,967 | ||
| Louisiana Public Facilities Authority Rev. (Tulane University Project), “A”, 5%, 4/01/2029 | 750,000 | 790,122 | ||
| Louisiana Stadium & Exposition District Rev., 4%, 7/03/2023 | 3,225,000 | 3,223,128 | ||
| Louisiana Stadium & Exposition District Rev., 5%, 7/03/2023 | 3,650,000 | 3,654,746 | ||
| Louisiana Tobacco Settlement Authority Rev., “2013-A”, 5%, 5/15/2023 | 2,160,000 | 2,178,968 | ||
| New Orleans, LA, Aviation Board General Airport Rev. (North Terminal Project), “B”, 4%, 1/01/2026 | 4,105,000 | 4,064,498 | ||
| New Orleans, LA, Regional Transit Authority Sale Tax Refunding Rev., “A”, AGM, 5%, 1/01/2030 | 1,935,000 | 2,092,942 | ||
| New Orleans, LA, Sewerage Services Rev., 5%, 6/01/2023 | 1,480,000 | 1,494,143 | ||
| New Orleans, LA, Sewerage Services Rev., 5%, 6/01/2024 | 350,000 | 358,552 | ||
| New Orleans, LA, Sewerage Services Rev., 5%, 6/01/2026 | 735,000 | 763,693 | ||
| New Orleans, LA, Sewerage Services Rev., 5%, 6/01/2027 | 945,000 | 980,943 | ||
| New Orleans, LA, Sewerage Services Rev., 5%, 6/01/2029 (Prerefunded 6/01/2025) | 1,890,000 | 1,968,533 | ||
| Shreveport, LA, Water & Sewer Rev., “B”, AGM, 5%, 12/01/2027 | 670,000 | 702,436 | ||
| $39,449,220 | ||||
| Maine - 0.2% | ||||
| Maine Finance Authority, Student Loan Rev., “A”, AGM, 5%, 12/01/2022 | $ | 135,000 | $135,176 | |
| Maine Finance Authority, Student Loan Rev., “A”, AGM, 5%, 12/01/2023 | 175,000 | 177,653 | ||
| Maine Finance Authority, Student Loan Rev., “A”, AGM, 5%, 12/01/2024 | 310,000 | 317,817 | ||
| Maine Finance Authority, Student Loan Rev., “A”, AGM, 5%, 12/01/2025 | 330,000 | 341,264 | ||
| Maine Finance Authority, Student Loan Rev., “A”, AGM, 5%, 12/01/2026 | 360,000 | 374,914 | ||
| Maine Health and Higher Educational Facilities Authority Rev. (MaineHealth), “A”, 5%, 7/01/2026 | 400,000 | 415,640 | ||
| Maine Health and Higher Educational Facilities Authority Rev. (MaineHealth), “A”, 5%, 7/01/2027 | 600,000 | 627,052 | ||
| Issuer | Shares/Par | Value ($) | ||
| Municipal Bonds - continued | ||||
| Maine - continued | ||||
| Maine Health and Higher Educational Facilities Authority Rev. (MaineHealth), “A”, 5%, 7/01/2028 | $ | 1,000,000 | $1,049,145 | |
| Maine Health and Higher Educational Facilities Authority Rev. (MaineHealth), “A”, 5%, 7/01/2029 | 750,000 | 790,823 | ||
| Maine Health and Higher Educational Facilities Authority Rev. (MaineHealth), “A”, 5%, 7/01/2030 | 800,000 | 846,130 | ||
| Maine Municipal Bond Bank, “B”, 5%, 11/01/2024 | 1,000,000 | 1,033,651 | ||
| Maine Municipal Bond Bank, “B”, 5%, 11/01/2025 | 1,000,000 | 1,047,187 | ||
| $7,156,452 | ||||
| Maryland - 0.8% | ||||
| Baltimore, MD, Convention Center Hotel Rev., 5%, 9/01/2024 | $ | 850,000 | $837,001 | |
| Baltimore, MD, Convention Center Hotel Rev., 5%, 9/01/2030 | 1,000,000 | 948,231 | ||
| Brunswick, MD, Special Obligation Refunding (Brunswick Crossing Special Taxing District), 3%, 7/01/2024 | 475,000 | 459,628 | ||
| Howard County, MD, Special Obligation (Downtown Columbia Project), “A”, 4%, 2/15/2028 (n) | 350,000 | 331,105 | ||
| Maryland Community Development Administration, Department of Housing & Community Development Housing Rev., “D”, 4%, 9/01/2036 | 685,000 | 678,696 | ||
| Maryland Community Development Administration, Department of Housing & Community Development Residential Rev., “C”, 5%, 9/01/2026 | 160,000 | 168,838 | ||
| Maryland Community Development Administration, Department of Housing & Community Development Residential Rev., “C”, 5%, 9/01/2027 | 245,000 | 260,473 | ||
| Maryland Community Development Administration, Department of Housing & Community Development Residential Rev., “C”, 5%, 9/01/2028 | 195,000 | 208,880 | ||
| Maryland Economic Development Corp., Student Housing Rev. (University of Maryland College Park), AGM, 4%, 6/01/2024 | 1,350,000 | 1,357,422 | ||
| Maryland Economic Development Corp., Student Housing Rev. (University of Maryland College Park), AGM, 4%, 6/01/2025 | 1,600,000 | 1,616,553 | ||
| Maryland Economic Development Corp., Student Housing Rev. (University of Maryland College Park), AGM, 4%, 6/01/2026 | 650,000 | 658,806 | ||
| Maryland Health & Higher Educational Facilities Authority Rev. (Adventist Healthcare), 5%, 1/01/2023 | 800,000 | 801,025 | ||
| Maryland Health & Higher Educational Facilities Authority Rev. (Adventist Healthcare), 5%, 1/01/2024 | 540,000 | 544,531 | ||
| Maryland Health & Higher Educational Facilities Authority Rev. (Adventist Healthcare), 5%, 1/01/2025 | 475,000 | 481,489 | ||
| Maryland Health & Higher Educational Facilities Authority Rev. (Adventist Healthcare), 5%, 1/01/2026 | 495,000 | 504,452 | ||
| Issuer | Shares/Par | Value ($) | ||
| Municipal Bonds - continued | ||||
| Maryland - continued | ||||
| Maryland Health & Higher Educational Facilities Authority Rev. (Adventist Healthcare), 5%, 1/01/2027 | $ | 430,000 | $440,306 | |
| Maryland Health & Higher Educational Facilities Authority Rev. (Adventist Healthcare), 5%, 1/01/2028 | 300,000 | 307,796 | ||
| Maryland Health & Higher Educational Facilities Authority Rev. (Adventist Healthcare), 5%, 1/01/2029 | 290,000 | 297,718 | ||
| Maryland Health & Higher Educational Facilities Authority Rev. (Adventist Healthcare), 5%, 1/01/2030 | 285,000 | 292,362 | ||
| Maryland Health & Higher Educational Facilities Authority Rev. (Medstar Health Issue), 5%, 8/15/2025 | 3,490,000 | 3,578,432 | ||
| Maryland Health & Higher Educational Facilities Authority Rev. (University of Maryland Medical System), “B-2”, 5%, 7/01/2045 (Put Date 7/01/2027) | 2,445,000 | 2,548,015 | ||
| Prince George's County, MD, Public Improvement, “A”, 5%, 9/15/2024 | 7,000,000 | 7,225,252 | ||
| $24,547,011 | ||||
| Massachusetts - 2.1% | ||||
| Lowell, MA, Regional Transit Authority General Obligation Rev., 3.75%, 8/18/2023 | $ | 6,200,000 | $6,187,473 | |
| Lynn, MA, General Obligation, 4%, 9/01/2023 | 7,400,000 | 7,408,632 | ||
| Massachusetts Development Finance Agency Multi-Family Housing Rev. (Salem Heights II Preservation Associates LP), “B”, 0.25%, 7/01/2024 (Put Date 7/01/2023) | 4,500,000 | 4,386,770 | ||
| Massachusetts Development Finance Agency Refunding Rev. (Suffolk University), 5%, 7/01/2026 | 475,000 | 485,905 | ||
| Massachusetts Development Finance Agency Refunding Rev. (Suffolk University), 5%, 7/01/2027 | 600,000 | 616,747 | ||
| Massachusetts Development Finance Agency Refunding Rev. (Suffolk University), 5%, 7/01/2028 | 520,000 | 536,775 | ||
| Massachusetts Development Finance Agency Rev. (Brandeis University), “S-1”, 5%, 10/01/2027 | 2,000,000 | 2,118,964 | ||
| Massachusetts Development Finance Agency Rev. (Brandeis University), “S-1”, 5%, 10/01/2028 | 2,340,000 | 2,495,704 | ||
| Massachusetts Development Finance Agency Rev. (Caregroup, Inc.), “I”, 5%, 7/01/2027 | 2,435,000 | 2,522,029 | ||
| Massachusetts Development Finance Agency Rev. (Lasell University), 4%, 7/01/2023 | 215,000 | 213,629 | ||
| Massachusetts Development Finance Agency Rev. (Lasell University), 4%, 7/01/2024 | 225,000 | 221,087 | ||
| Massachusetts Development Finance Agency Rev. (Lasell University), 4%, 7/01/2025 | 230,000 | 223,314 | ||
| Issuer | Shares/Par | Value ($) | ||
| Municipal Bonds - continued | ||||
| Massachusetts - continued | ||||
| Massachusetts Development Finance Agency Rev. (Lasell University), 4%, 7/01/2026 | $ | 145,000 | $138,975 | |
| Massachusetts Development Finance Agency Rev. (Lasell University), 4%, 7/01/2027 | 255,000 | 241,041 | ||
| Massachusetts Development Finance Agency Rev. (Lasell University), 4%, 7/01/2028 | 330,000 | 307,845 | ||
| Massachusetts Development Finance Agency Rev. (Partners Healthcare System), “Q”, 5%, 7/01/2023 | 1,375,000 | 1,389,974 | ||
| Massachusetts Development Finance Agency Rev. (Sabis International Charter School Issue), 5%, 4/15/2025 | 160,000 | 160,649 | ||
| Massachusetts Development Finance Agency Rev. (Suffolk University), 5%, 7/01/2025 | 1,500,000 | 1,527,318 | ||
| Massachusetts Development Finance Agency Rev. (Suffolk University), 5%, 7/01/2026 | 1,750,000 | 1,790,175 | ||
| Massachusetts Development Finance Agency Rev. (Suffolk University), 5%, 7/01/2027 | 2,000,000 | 2,055,822 | ||
| Massachusetts Development Finance Agency Rev. (UMass Memorial Health Care Obligated Group), “I”, 5%, 7/01/2024 | 1,000,000 | 1,017,970 | ||
| Massachusetts Development Finance Agency Rev. (Wellforce, Inc.), “A”, 5%, 7/01/2025 | 1,150,000 | 1,179,101 | ||
| Massachusetts Development Finance Agency Rev. (Wellforce, Inc.), “A”, 5%, 7/01/2026 | 1,500,000 | 1,545,200 | ||
| Massachusetts Development Finance Agency Rev. (Wellforce, Inc.), “A”, 5%, 7/01/2027 | 1,000,000 | 1,030,466 | ||
| Massachusetts Development Finance Agency Rev. (Wellforce, Inc.), “A”, 5%, 7/01/2028 | 780,000 | 801,615 | ||
| Massachusetts Development Finance Agency Rev. (Wellforce, Inc.), “A”, 5%, 7/01/2029 | 850,000 | 869,912 | ||
| Massachusetts Development Finance Agency Rev. (Wellforce, Inc.), “C”, AGM, 5%, 10/01/2023 | 325,000 | 328,856 | ||
| Massachusetts Development Finance Agency Rev. (Wellforce, Inc.), “C”, AGM, 5%, 10/01/2024 | 365,000 | 372,983 | ||
| Massachusetts Development Finance Agency Rev. (Wellforce, Inc.), “C”, AGM, 5%, 10/01/2025 | 350,000 | 361,263 | ||
| Massachusetts Development Finance Agency Rev. (Wellforce, Inc.), “C”, AGM, 5%, 10/01/2026 | 350,000 | 364,374 | ||
| Massachusetts Development Finance Agency Rev. (Wellforce, Inc.), “C”, AGM, 5%, 10/01/2027 | 500,000 | 524,465 | ||
| Massachusetts Development Finance Agency Rev. (Wellforce, Inc.), “C”, AGM, 5%, 10/01/2029 | 1,275,000 | 1,355,019 | ||
| Massachusetts Development Finance Agency Rev. (Wellforce, Inc.), “C”, AGM, 5%, 10/01/2031 | 1,150,000 | 1,206,201 | ||
| Issuer | Shares/Par | Value ($) | ||
| Municipal Bonds - continued | ||||
| Massachusetts - continued | ||||
| Massachusetts Development Finance Agency Rev. (Williams College), “N”, 0.45%, 7/01/2041 (Put Date 7/01/2025) | $ | 3,455,000 | $3,022,042 | |
| Massachusetts Educational Financing Authority, Education Loan Rev., “B”, 5%, 7/01/2023 | 250,000 | 252,295 | ||
| Massachusetts Educational Financing Authority, Education Loan Rev., “B”, 5%, 7/01/2024 | 600,000 | 610,976 | ||
| Massachusetts Educational Financing Authority, Education Loan Rev., “B”, 5%, 7/01/2025 | 850,000 | 868,273 | ||
| Massachusetts Educational Financing Authority, Education Loan Rev., “B”, 5%, 7/01/2026 | 1,000,000 | 1,028,762 | ||
| Massachusetts Educational Financing Authority, Education Loan Rev., “B”, 5%, 7/01/2027 | 1,500,000 | 1,552,755 | ||
| Massachusetts Educational Financing Authority, Education Loan Rev., “C”, 2.625%, 7/01/2036 | 150,000 | 139,938 | ||
| Massachusetts Educational Financing Authority, Education Loan Rev., “I”, 5%, 1/01/2025 | 3,450,000 | 3,518,572 | ||
| Massachusetts Educational Financing Authority, Education Loan Rev., “J”, 3.5%, 7/01/2033 | 2,670,000 | 2,431,941 | ||
| Massachusetts Educational Financing Authority, Education Loan Rev., “K”, 3.625%, 7/01/2032 | 625,000 | 597,416 | ||
| Massachusetts Educational Financing Authority, Education Loan Rev., Issue M, “B”, 3.625%, 7/01/2038 | 4,270,000 | 3,641,862 | ||
| $63,651,085 | ||||
| Michigan - 2.9% | ||||
| Detroit, MI, Downtown Development Authority Subordinate Tax Rev. (General Development Area No. 1 Project), “B”, AGM, 5%, 7/01/2023 | $ | 1,250,000 | $1,262,296 | |
| Detroit, MI, Downtown Development Authority Subordinate Tax Rev. (General Development Area No. 1 Project), “B”, AGM, 5%, 7/01/2025 | 1,000,000 | 1,024,302 | ||
| Detroit, MI, Downtown Development Authority Tax Increment Rev. (Catalyst Development), “A”, AGM, 5%, 7/01/2029 | 1,000,000 | 1,020,237 | ||
| Detroit, MI, General Obligation, Taxable, “B”, 2.017%, 4/01/2023 | 350,000 | 344,671 | ||
| Flint, MI, Public Library Building & Site Rev., AGM, 3%, 5/01/2023 | 1,045,000 | 1,041,748 | ||
| Flint, MI, Public Library Building & Site Rev., AGM, 3%, 5/01/2024 | 1,075,000 | 1,065,904 | ||
| Flint, MI, Public Library Building & Site Rev., AGM, 3%, 5/01/2025 | 675,000 | 666,892 | ||
| Flint, MI, Public Library Building & Site Rev., AGM, 3%, 5/01/2027 | 1,095,000 | 1,060,858 | ||
| Flint, MI, Public Library Building & Site Rev., AGM, 3%, 5/01/2028 | 1,125,000 | 1,082,299 | ||
| Grand Traverse, MI, Hospital Finance Authority Rev. (Munson Healthcare Obligated Group), 5%, 7/01/2023 | 425,000 | 429,321 | ||
| Grand Traverse, MI, Hospital Finance Authority Rev. (Munson Healthcare Obligated Group), 5%, 7/01/2024 | 650,000 | 664,738 | ||
| Issuer | Shares/Par | Value ($) | ||
| Municipal Bonds - continued | ||||
| Michigan - continued | ||||
| Grand Traverse, MI, Hospital Finance Authority Rev. (Munson Healthcare Obligated Group), 5%, 7/01/2025 | $ | 950,000 | $983,765 | |
| Kent County, MI, Gerald R. Ford International Airport Authority Rev., 5%, 1/01/2026 | 225,000 | 234,703 | ||
| Kent County, MI, Gerald R. Ford International Airport Authority Rev., 5%, 1/01/2027 | 350,000 | 368,736 | ||
| Kent County, MI, Gerald R. Ford International Airport Authority Rev., 5%, 1/01/2028 | 250,000 | 265,497 | ||
| Kent County, MI, Gerald R. Ford International Airport Authority Rev., 5%, 1/01/2029 | 555,000 | 589,397 | ||
| Kent County, MI, Gerald R. Ford International Airport Authority Rev., 5%, 1/01/2030 | 440,000 | 469,066 | ||
| Lake Superior State University Board of Trustees General Refunding Rev., AGM, 4%, 11/15/2022 | 610,000 | 610,154 | ||
| Lake Superior State University Board of Trustees General Refunding Rev., AGM, 4%, 11/15/2024 | 550,000 | 553,556 | ||
| Lake Superior State University Board of Trustees General Refunding Rev., AGM, 4%, 11/15/2026 | 790,000 | 793,189 | ||
| Lake Superior State University Board of Trustees General Refunding Rev., AGM, 4%, 11/15/2029 | 815,000 | 810,222 | ||
| Lake Superior State University Board of Trustees General Refunding Rev., AGM, 4%, 11/15/2031 | 810,000 | 794,113 | ||
| Lincoln, MI, Consolidated School District, Counties of Washtenaw & Wayne Refunding (General Obligation - Unlimited Tax), Taxable, 0.33%, 5/01/2023 | 835,000 | 816,649 | ||
| Lincoln, MI, Consolidated School District, Counties of Washtenaw & Wayne Refunding (General Obligation - Unlimited Tax), Taxable, 0.55%, 5/01/2024 | 2,340,000 | 2,195,645 | ||
| Lincoln, MI, Consolidated School District, Counties of Washtenaw & Wayne Refunding (General Obligation - Unlimited Tax), Taxable, 0.83%, 5/01/2025 | 1,000,000 | 904,907 | ||
| Michigan Finance Authority (Detroit Financial Recovery Income Tax Rev.), “F”, 3.875%, 10/01/2023 | 540,000 | 536,592 | ||
| Michigan Finance Authority (Detroit Financial Recovery Income Tax Rev.), “F”, 4%, 10/01/2024 | 675,000 | 667,244 | ||
| Michigan Finance Authority Hospital Rev. (Bronson Healthcare Group Inc.), “B”, 5%, 11/15/2044 (Put Date 11/16/2026) (w) | 8,405,000 | 8,722,283 | ||
| Michigan Finance Authority Hospital Rev. (McLaren Health Care), “D-1”, 1.2%, 10/15/2030 (Put Date 4/13/2028) | 1,470,000 | 1,237,565 | ||
| Michigan Finance Authority Hospital Rev. (McLaren Health Care), “D-2”, 1.2%, 10/15/2038 (Put Date 4/13/2028) | 1,850,000 | 1,577,697 | ||
| Michigan Finance Authority Hospital Rev. (Trinity Health Credit Group), 5%, 12/01/2044 (Put Date 2/01/2025) | 10,000,000 | 10,268,524 | ||
| Issuer | Shares/Par | Value ($) | ||
| Municipal Bonds - continued | ||||
| Michigan - continued | ||||
| Michigan Finance Authority Local Government Loan Program Rev. (Detroit Water and Sewerage Department Sewage Disposal System Rev. Refunding Second Lien Local Project), “C”, 5%, 7/01/2026 | $ | 1,000,000 | $1,024,796 | |
| Michigan Finance Authority Tobacco Settlement (2007 Sold Tobacco Receipts), “A”, 5%, 6/01/2027 | 2,700,000 | 2,748,951 | ||
| Michigan Finance Authority Tobacco Settlement (2007 Sold Tobacco Receipts), “A”, 5%, 6/01/2030 | 2,000,000 | 2,042,288 | ||
| Michigan Finance Authority Tobacco Settlement Asset-Backed Rev., Taxable (2006 Sold Tobacco Receipts), “A-1”, 2.326%, 6/01/2030 | 1,660,115 | 1,485,083 | ||
| Michigan Housing Development Authority, Rental Housing Rev., “A”, 0.55%, 4/01/2025 | 2,640,000 | 2,436,795 | ||
| Michigan Housing Development Authority, Single Family Mortgage Rev., “C”, 2.05%, 12/01/2022 | 1,000,000 | 998,480 | ||
| Michigan Housing Development Authority, Single Family Mortgage Rev., “D”, 5.5%, 6/01/2053 (w) | 3,625,000 | 3,751,626 | ||
| Michigan Strategic Fund Ltd. Obligation Rev. (Consumers Energy Company Project), 0.875%, 4/01/2035 (Put Date 10/08/2026) | 6,680,000 | 5,896,767 | ||
| Michigan Strategic Fund Ltd. Obligation Rev. (I-75 Improvement Project), 5%, 12/31/2027 | 2,000,000 | 2,006,164 | ||
| Michigan Strategic Fund Ltd. Obligation Rev. (I-75 Improvement Project), 5%, 6/30/2028 | 3,000,000 | 3,004,188 | ||
| Michigan Strategic Fund Ltd. Obligation Rev. (I-75 Improvement Project), 5%, 12/31/2028 | 3,000,000 | 3,003,011 | ||
| Royal Oak, MI, Hospital Finance Authority Rev. (William Beaumont Hospital), “D”, 5%, 9/01/2031 (Prerefunded 3/01/2024) | 5,160,000 | 5,275,350 | ||
| Saginaw, MI, Hospital Finance Authority Rev. (Covenant Medical Center, Inc.), “J”, 5%, 7/01/2027 | 1,000,000 | 1,042,489 | ||
| Saginaw, MI, Hospital Finance Authority Rev. (Covenant Medical Center, Inc.), “J”, 5%, 7/01/2028 | 1,125,000 | 1,175,072 | ||
| Saginaw, MI, Hospital Finance Authority Rev. (Covenant Medical Center, Inc.), “J”, 5%, 7/01/2029 | 1,000,000 | 1,044,335 | ||
| Saginaw, MI, Hospital Finance Authority Rev. (Covenant Medical Center, Inc.), “J”, 5%, 7/01/2030 | 500,000 | 520,488 | ||
| Wayne and Monroe Counties, MI, South Huron Valley Utility Authority, Sewage Disposal System Improvement Rev. , BAM, 5%, 5/01/2029 | 1,235,000 | 1,327,294 | ||
| Wayne and Monroe Counties, MI, South Huron Valley Utility Authority, Sewage Disposal System Improvement Rev. , BAM, 5%, 5/01/2030 | 735,000 | 795,717 | ||
| Wayne County, MI, Airport Authority Rev. (Detroit Metropolitan Wayne County Airport), “D”, 5%, 12/01/2024 | 250,000 | 257,213 | ||
| Issuer | Shares/Par | Value ($) | ||
| Municipal Bonds - continued | ||||
| Michigan - continued | ||||
| Wayne County, MI, Airport Authority Rev. (Detroit Metropolitan Wayne County Airport), “D”, 5%, 12/01/2025 | $ | 350,000 | $363,597 | |
| Wayne County, MI, Airport Authority Rev. (Detroit Metropolitan Wayne County Airport), “D”, 5%, 12/01/2026 | 1,745,000 | 1,795,387 | ||
| Wayne County, MI, Airport Authority Rev. (Detroit Metropolitan Wayne County Airport), “D”, 5%, 12/01/2027 | 2,775,000 | 2,860,344 | ||
| Wayne County, MI, Airport Authority Rev. (Detroit Metropolitan Wayne County Airport), “D”, 5%, 12/01/2028 | 2,595,000 | 2,676,054 | ||
| Wayne County, MI, Airport Authority Rev. (Detroit Metropolitan Wayne County Airport), “G”, 5%, 12/01/2023 | 400,000 | 407,087 | ||
| $91,001,346 | ||||
| Minnesota - 0.6% | ||||
| Duluth, MN, Economic Development Authority Rev. (Benedictine Health System), “A”, 3%, 7/01/2023 | $ | 415,000 | $410,931 | |
| Duluth, MN, Economic Development Authority Rev. (Benedictine Health System), “A”, 3%, 7/01/2025 | 400,000 | 383,047 | ||
| Duluth, MN, Economic Development Authority Rev. (Benedictine Health System), “A”, 3%, 7/01/2026 | 235,000 | 221,234 | ||
| Duluth, MN, Independent School District No. 709, “A”, COP, 3%, 3/01/2023 | 630,000 | 626,649 | ||
| Duluth, MN, Independent School District No. 709, “A”, COP, 3.25%, 3/01/2024 | 650,000 | 638,280 | ||
| Duluth, MN, Independent School District No. 709, “A”, COP, 3.25%, 3/01/2025 | 675,000 | 652,448 | ||
| Duluth, MN, Independent School District No. 709, “A”, COP, 4%, 3/01/2027 | 730,000 | 703,499 | ||
| Duluth, MN, Independent School District No. 709, “A”, COP, 4%, 3/01/2028 | 765,000 | 727,482 | ||
| Duluth, MN, Independent School District No. 709, “B”, COP, STAPRP, 5%, 2/01/2025 | 135,000 | 138,772 | ||
| Duluth, MN, Independent School District No. 709, “B”, COP, STAPRP, 5%, 2/01/2026 | 430,000 | 446,706 | ||
| Duluth, MN, Independent School District No. 709, “B”, COP, STAPRP, 5%, 2/01/2028 | 125,000 | 131,874 | ||
| Duluth, MN, Independent School District No. 709, “A”, COP, 5%, 2/01/2025 | 500,000 | 513,970 | ||
| Minneapolis-St. Paul, MN, Metropolitan Airports Commission, Senior Airport Rev., “C”, 5%, 1/01/2025 | 250,000 | 258,007 | ||
| Minneapolis-St. Paul, MN, Metropolitan Airports Commission, Senior Airport Rev., “C”, 5%, 1/01/2026 | 200,000 | 208,686 | ||
| Minnesota Housing Finance Agency, Rental Housing, “A”, GNMA, 2.3%, 8/01/2024 | 1,000,000 | 959,456 | ||
| Issuer | Shares/Par | Value ($) | ||
| Municipal Bonds - continued | ||||
| Minnesota - continued | ||||
| Minnesota Housing Finance Agency, Rental Housing, “B”, HUD Section 8, 0.3%, 2/01/2023 | $ | 3,500,000 | $3,474,516 | |
| Minnesota Housing Finance Agency, Rental Housing, “C”, GNMA, 3.8%, 2/01/2025 | 1,885,000 | 1,876,873 | ||
| Minnesota Housing Finance Agency, Rental Housing, “C”, HUD Section 8, 0.3%, 2/01/2024 | 3,170,000 | 3,042,316 | ||
| Minnesota Housing Finance Agency, Residential Housing, “C”, GNMA, 0.45%, 7/01/2023 | 230,000 | 224,949 | ||
| Minnesota Housing Finance Agency, Residential Housing, “C”, GNMA, 0.6%, 1/01/2024 | 395,000 | 380,182 | ||
| Minnesota Housing Finance Agency, Residential Housing, “C”, GNMA, 0.7%, 7/01/2024 | 380,000 | 359,997 | ||
| Minnesota Office of Higher Education Supplemental Student Loan Program Rev., 5%, 11/01/2023 | 500,000 | 505,471 | ||
| Minnesota Office of Higher Education Supplemental Student Loan Program Rev., 5%, 11/01/2024 | 615,000 | 625,319 | ||
| Minnesota Office of Higher Education Supplemental Student Loan Program Rev., 5%, 11/01/2025 | 850,000 | 865,785 | ||
| Minnesota Office of Higher Education Supplemental Student Loan Program Rev., 5%, 11/01/2026 | 700,000 | 717,048 | ||
| Minnesota Office of Higher Education Supplemental Student Loan Program Rev., 5%, 11/01/2027 | 700,000 | 720,020 | ||
| $19,813,517 | ||||
| Mississippi - 1.5% | ||||
| Gulfport, MS, Hospital Facilities Rev. (Memorial Hospital at Gulfport Project), 5%, 7/01/2023 | $ | 185,000 | $186,213 | |
| Gulfport, MS, Hospital Facilities Rev. (Memorial Hospital at Gulfport Project), 5%, 7/01/2024 | 2,780,000 | 2,821,881 | ||
| Gulfport, MS, Hospital Facilities Rev. (Memorial Hospital at Gulfport Project), 5%, 7/01/2025 | 3,680,000 | 3,735,904 | ||
| Gulfport, MS, Hospital Facilities Rev. (Memorial Hospital at Gulfport Project), 5%, 7/01/2027 | 1,960,000 | 1,984,637 | ||
| Gulfport, MS, Hospital Facilities Rev. (Memorial Hospital at Gulfport Project), 5%, 7/01/2028 | 380,000 | 384,154 | ||
| Gulfport, MS, Hospital Facilities Rev. (Memorial Hospital at Gulfport Project), 5%, 7/01/2029 | 355,000 | 358,302 | ||
| Gulfport, MS, Hospital Facilities Rev. (Memorial Hospital at Gulfport Project), 5%, 7/01/2031 | 380,000 | 382,662 | ||
| Jackson, MS, General Obligation Refunding, 5%, 3/01/2023 | 320,000 | 321,703 | ||
| Jackson, MS, General Obligation Refunding, 5%, 3/01/2024 | 500,000 | 510,063 | ||
| Jackson, MS, General Obligation Refunding, 5%, 3/01/2026 | 825,000 | 863,855 | ||
| Issuer | Shares/Par | Value ($) | ||
| Municipal Bonds - continued | ||||
| Mississippi - continued | ||||
| Mississippi Development Bank Special Obligation (Gulfport Public Improvement Project), 5%, 9/01/2026 | $ | 225,000 | $235,371 | |
| Mississippi Development Bank Special Obligation (Gulfport Public Improvement Project), BAM, 5%, 11/01/2030 | 1,745,000 | 1,843,630 | ||
| Mississippi Development Bank Special Obligation (Jackson, MS, Sales Tax Rev. Infrastructure Project), 5%, 9/01/2024 | 740,000 | 759,366 | ||
| Mississippi Development Bank Special Obligation (Jackson, MS, Sales Tax Rev. Infrastructure Project), 5%, 9/01/2028 | 1,200,000 | 1,272,468 | ||
| Mississippi Development Bank Special Obligation (Municipal Energy Agency Power Supply Project), “A”, AGM, 5%, 3/01/2023 | 1,000,000 | 1,005,486 | ||
| Mississippi Gaming Tax Rev., “A”, 5%, 10/15/2024 | 750,000 | 769,127 | ||
| Mississippi Gaming Tax Rev., “A”, 5%, 10/15/2028 | 1,400,000 | 1,485,986 | ||
| Mississippi Hospital Equipment & Facilities Authority Rev. (Baptist Memorial Healthcare), “A”, 5%, 9/01/2044 (Put Date 9/01/2025) | 7,000,000 | 7,137,845 | ||
| Mississippi Hospital Equipment & Facilities Authority Rev. (North Mississippi Health Services), “I”, 5%, 10/01/2025 | 530,000 | 546,613 | ||
| Mississippi Hospital Equipment & Facilities Authority Rev. (North Mississippi Health Services), “I”, 5%, 10/01/2027 | 800,000 | 832,247 | ||
| Mississippi Hospital Equipment & Facilities Authority Rev. (North Mississippi Health Services), “I”, 5%, 10/01/2028 | 975,000 | 1,015,180 | ||
| Mississippi Hospital Equipment & Facilities Authority Rev. (North Mississippi Health Services), “I”, 5%, 10/01/2029 | 400,000 | 417,232 | ||
| Mississippi Hospital Equipment & Facilities Authority Rev. (North Mississippi Health Services), “I”, 5%, 10/01/2040 (Put Date 3/01/2027) | 5,040,000 | 5,149,513 | ||
| State of Mississippi, “B”, 5%, 12/01/2025 | 415,000 | 435,692 | ||
| Warren County, MS, Gulf Opportunity Zone Rev. (International Paper Co. Project), 2.9%, 9/01/2032 (Put Date 9/01/2023) | 4,000,000 | 3,964,517 | ||
| Warren County, MS, Gulf Opportunity Zone Rev. (International Paper Co. Project), “A”, 1.375%, 5/01/2034 (Put Date 6/16/2025) | 3,500,000 | 3,231,431 | ||
| Warren County, MS, Gulf Opportunity Zone Rev. (International Paper Co. Project), “C”, 1.375%, 8/01/2027 (Put Date 6/16/2025) | 3,000,000 | 2,769,798 | ||
| West Rankin, MS, Utility Authority Rev., AGM, 5%, 1/01/2026 (Prerefunded 1/01/2025) | 525,000 | 544,037 | ||
| West Rankin, MS, Utility Authority Rev., ETM, AGM, 5%, 1/01/2024 | 400,000 | 406,865 | ||
| West Rankin, MS, Utility Authority Rev., ETM, AGM, 5%, 1/01/2025 | 585,000 | 604,725 | ||
| West Rankin, MS, Utility Authority Rev., Taxable, AGM, 0.569%, 1/01/2024 | 450,000 | 428,390 | ||
| West Rankin, MS, Utility Authority Rev., Taxable, AGM, 1.001%, 1/01/2026 | 465,000 | 411,461 | ||
| Issuer | Shares/Par | Value ($) | ||
| Municipal Bonds - continued | ||||
| Mississippi - continued | ||||
| West Rankin, MS, Utility Authority Rev., Taxable, AGM, 1.399%, 1/01/2028 | $ | 500,000 | $416,259 | |
| $47,232,613 | ||||
| Missouri - 1.0% | ||||
| Brentwood & Maplewood, MO, Hanley Road Corridor Transportation Development District, Transportation Sales Tax Refunding Rev., 1.625%, 10/01/2033 | $ | 35,000 | $34,518 | |
| Kansas City, MO, General Obligation Refunding & Improvement, “A”, 5%, 2/01/2024 | 5,500,000 | 5,614,941 | ||
| Kansas City, MO, Industrial Development Authority, Airport Special Obligation Bonds (International Airport Terminal Modernization Project), “B”, 5%, 3/01/2029 | 4,000,000 | 4,088,392 | ||
| Kansas City, MO, Industrial Development Authority, Airport Special Obligation Bonds (International Airport Terminal Modernization Project), “B”, 5%, 3/01/2030 | 2,000,000 | 2,043,439 | ||
| Kansas City, MO, Industrial Development Authority, Airport Special Obligation Bonds (International Airport Terminal Modernization Project), “B”, 5%, 3/01/2031 | 1,250,000 | 1,273,456 | ||
| Missouri Development Finance Board, Infrastructure Facilities Rev. (Crackerneck Creek Project), 5%, 3/01/2023 | 200,000 | 200,879 | ||
| Missouri Development Finance Board, Infrastructure Facilities Rev. (Crackerneck Creek Project), 5%, 3/01/2024 | 300,000 | 304,316 | ||
| Missouri Development Finance Board, Infrastructure Facilities Rev. (Crackerneck Creek Project), 5%, 3/01/2025 | 425,000 | 428,954 | ||
| Missouri Development Finance Board, Infrastructure Facilities Rev. (Crackerneck Creek Project), 5%, 3/01/2026 | 150,000 | 151,416 | ||
| Missouri Development Finance Board, Infrastructure Facilities Rev. (Independence, MO, Annual Appropriation Sewer System Rev.), “A”, 4%, 11/01/2022 | 320,000 | 320,000 | ||
| Missouri Development Finance Board, Infrastructure Facilities Rev. (Independence, MO, Annual Appropriation Sewer System Rev.), “A”, 4%, 11/01/2023 | 315,000 | 317,051 | ||
| Missouri Development Finance Board, Infrastructure Facilities Rev. (Independence, MO, Annual Appropriation Sewer System Rev.), “A”, 5%, 11/01/2026 | 300,000 | 313,915 | ||
| Missouri Development Finance, Solid Waste Disposal Rev. (Procter & Gamble Paper Products Co. Project), 5.2%, 3/15/2029 | 300,000 | 322,086 | ||
| Missouri Health & Educational Facilities Authority Rev. (Bethesda Health Group, Inc.), 4%, 8/01/2024 | 155,000 | 152,733 | ||
| Missouri Health & Educational Facilities Authority Rev. (Bethesda Health Group, Inc.), 4%, 8/01/2026 | 205,000 | 197,857 | ||
| Issuer | Shares/Par | Value ($) | ||
| Municipal Bonds - continued | ||||
| Missouri - continued | ||||
| Missouri Health & Educational Facilities Authority Rev. (Bethesda Health Group, Inc.), 4%, 8/01/2028 | $ | 420,000 | $394,613 | |
| Missouri Health & Educational Facilities Authority Rev. (Bethesda Health Group, Inc.), 4%, 8/01/2030 | 300,000 | 274,031 | ||
| Missouri Health & Educational Facilities Authority Rev. (Lutheran Senior Services Projects), “A”, 5%, 2/01/2025 | 215,000 | 216,664 | ||
| Missouri Health & Educational Facilities Authority Rev. (Mercy Health), “A”, 5%, 6/01/2027 | 2,500,000 | 2,631,424 | ||
| Missouri Health & Educational Facilities Authority Rev. (Mercy Health), “A”, 5%, 6/01/2028 | 7,820,000 | 8,292,337 | ||
| Plaza at Noah's Ark Community District, MO, Tax Increment and Improvement Rev., 3%, 5/01/2024 | 400,000 | 388,037 | ||
| Plaza at Noah's Ark Community District, MO, Tax Increment and Improvement Rev., 3%, 5/01/2026 | 150,000 | 139,480 | ||
| St. Louis, MO, Land Clearance for Redevelopment Authority, Special Obligation Refunding (600 Washington Project), “A”, 4%, 4/01/2023 | 50,000 | 50,110 | ||
| St. Louis, MO, Land Clearance for Redevelopment Authority, Special Obligation Refunding (600 Washington Project), “A”, 4%, 4/01/2024 | 150,000 | 150,714 | ||
| St. Louis, MO, Land Clearance for Redevelopment Authority, Special Obligation Refunding (600 Washington Project), “A”, 4%, 4/01/2025 | 280,000 | 282,101 | ||
| St. Louis, MO, Land Clearance for Redevelopment Authority, Special Obligation Refunding (600 Washington Project), “A”, 4%, 4/01/2026 | 300,000 | 302,250 | ||
| St. Louis, MO, Land Clearance for Redevelopment Authority, Special Obligation Refunding (600 Washington Project), “A”, 4%, 4/01/2027 | 350,000 | 352,476 | ||
| St. Louis, MO, Land Clearance for Redevelopment Authority, Special Obligation Refunding (600 Washington Project), “A”, 4%, 4/01/2028 | 200,000 | 200,926 | ||
| Wentzville, MO, School District R-IV, General Obligation Refunding & Improvement Rev. (Missouri Direct Deposit Program), 4%, 3/01/2029 | 1,555,000 | 1,573,905 | ||
| $31,013,021 | ||||
| Nebraska - 0.4% | ||||
| Central Plains Energy Project, NE, Gas Project Rev. (Project No. 4), 5%, 3/01/2050 (Put Date 1/01/2024) | $ | 8,500,000 | $8,504,560 | |
| Nebraska Public Power District Rev., “A”, 5%, 1/01/2023 | 1,400,000 | 1,404,094 | ||
| Nebraska Public Power District Rev., “A”, 5%, 1/01/2025 | 525,000 | 542,258 | ||
| Issuer | Shares/Par | Value ($) | ||
| Municipal Bonds - continued | ||||
| Nebraska - continued | ||||
| Nebraska Public Power District Rev., “B”, 5%, 1/01/2023 | $ | 450,000 | $451,316 | |
| $10,902,228 | ||||
| Nevada - 0.0% | ||||
| Clark County, NV, School District General Obligation, “A”, AGM, 5%, 6/15/2032 | $ | 900,000 | $967,369 | |
| Sparks, NV, Tourism Improvement District No. 1 Rev. (Legends at Sparks Marina), “A”, 2.5%, 6/15/2024 (n) | 205,000 | 196,518 | ||
| $1,163,887 | ||||
| New Hampshire - 0.5% | ||||
| National Finance Authority Pollution Control Refunding Rev. (New York State Electric & Gas Corp. Project), “A”, 4%, 12/01/2028 | $ | 4,300,000 | $4,209,405 | |
| National Finance Authority, New Hampshire Senior Living Rev. (Springpoint Senior Living Project), 4%, 1/01/2024 | 265,000 | 262,732 | ||
| National Finance Authority, New Hampshire Senior Living Rev. (Springpoint Senior Living Project), 4%, 1/01/2025 | 290,000 | 285,212 | ||
| National Finance Authority, New Hampshire Senior Living Rev. (Springpoint Senior Living Project), 4%, 1/01/2026 | 265,000 | 258,377 | ||
| National Finance Authority, New Hampshire Senior Living Rev. (Springpoint Senior Living Project), 4%, 1/01/2028 | 580,000 | 552,334 | ||
| National Finance Authority, New Hampshire Senior Living Rev. (Springpoint Senior Living Project), 4%, 1/01/2029 | 300,000 | 282,564 | ||
| National Finance Authority, New Hampshire Senior Living Rev. (Springpoint Senior Living Project), 4%, 1/01/2030 | 280,000 | 259,625 | ||
| National Finance Authority, New Hampshire Senior Living Rev. (Springpoint Senior Living Project), 4%, 1/01/2031 | 295,000 | 269,283 | ||
| New Hampshire Business Finance Authority, Pollution Control Rev. (United Illuminating Company Project), “A”, 2.8%, 10/01/2033 (Put Date 10/02/2023) | 5,000,000 | 4,956,395 | ||
| New Hampshire Health & Education Facilities Authority Rev. (Memorial Hospital), 5.25%, 6/01/2026 | 2,490,000 | 2,563,847 | ||
| $13,899,774 | ||||
| New Jersey - 5.9% | ||||
| Atlantic City, NJ, Board of Education, AGM, 4%, 4/01/2023 | $ | 150,000 | $150,452 | |
| Atlantic City, NJ, Board of Education, AGM, 4%, 4/01/2024 | 160,000 | 161,333 | ||
| Atlantic City, NJ, Board of Education, AGM, 4%, 4/01/2025 | 175,000 | 177,173 | ||
| Atlantic City, NJ, Board of Education, AGM, 4%, 4/01/2026 | 100,000 | 101,528 | ||
| Atlantic City, NJ, Improvement Authority Lease Rev. (Stockton University Campus Phase II Project), “A”, AGM, 5%, 7/01/2024 | 150,000 | 153,303 | ||
| Atlantic City, NJ, Improvement Authority Lease Rev. (Stockton University Campus Phase II Project), “A”, AGM, 5%, 7/01/2027 | 175,000 | 183,651 | ||
| Issuer | Shares/Par | Value ($) | ||
| Municipal Bonds - continued | ||||
| New Jersey - continued | ||||
| Atlantic City, NJ, Improvement Authority Lease Rev. (Stockton University Campus Phase II Project), “A”, AGM, 5%, 7/01/2028 | $ | 145,000 | $153,254 | |
| Atlantic City, NJ, Improvement Authority Lease Rev. (Stockton University Campus Phase II Project), “A”, AGM, 5%, 7/01/2029 | 100,000 | 106,464 | ||
| Atlantic City, NJ, Improvement Authority Lease Rev. (Stockton University Campus Phase II Project), “A”, AGM, 5%, 7/01/2030 | 125,000 | 133,819 | ||
| Atlantic City, NJ, Improvement Authority Lease Rev. (Stockton University Campus Phase II Project), “A”, AGM, 5%, 7/01/2031 | 160,000 | 171,764 | ||
| Atlantic City, NJ, Tax Appeal Refunding Rev., “A”, BAM, 5%, 3/01/2024 | 345,000 | 351,402 | ||
| Atlantic City, NJ, Tax Appeal Refunding Rev., “A”, BAM, 5%, 3/01/2027 | 200,000 | 210,916 | ||
| Burlington County, NJ, Moorestown Board of Education, 4%, 1/15/2023 | 200,000 | 200,295 | ||
| Burlington County, NJ, Moorestown Board of Education, 4%, 1/15/2024 | 300,000 | 302,232 | ||
| Burlington County, NJ, Moorestown Board of Education, 4%, 1/15/2025 | 305,000 | 308,713 | ||
| Gloucester County, NJ, Improvement Authority Rev. (Rowan University Student Center Project), 0.6%, 3/01/2024 | 2,155,000 | 2,033,658 | ||
| New Jersey Building Authority, State Building Rev. Unrefunded Balance, “A”, BAM, 5%, 6/15/2025 | 1,205,000 | 1,244,434 | ||
| New Jersey Building Authority, State Building Rev. Unrefunded Balance, “A”, BAM, 5%, 6/15/2026 | 900,000 | 937,913 | ||
| New Jersey Building Authority, State Building Rev., “A”, ETM, BAM, 5%, 6/15/2025 | 795,000 | 827,488 | ||
| New Jersey Building Authority, State Building Rev., “A”, ETM, BAM, 5%, 6/15/2026 | 600,000 | 632,984 | ||
| New Jersey Casino Reinvestment Development Authority, Luxury Tax Rev., AGM, 5%, 11/01/2024 | 1,000,000 | 1,020,626 | ||
| New Jersey Economic Development Authority Refunding Rev. (Provident Group - Montclair Properties LLC - Montclair State University Student Housing Project), AGM, 5%, 6/01/2025 | 1,000,000 | 1,034,782 | ||
| New Jersey Economic Development Authority Refunding Rev. (Provident Group - Montclair Properties LLC - Montclair State University Student Housing Project), AGM, 5%, 6/01/2026 | 1,000,000 | 1,046,860 | ||
| New Jersey Economic Development Authority Rev. (Provident Group - Rowan Properties LLC - Rowan University Student Housing Project), “A”, 5%, 1/01/2023 | 640,000 | 639,027 | ||
| New Jersey Economic Development Authority Rev. (School Facilities Construction), “DDD”, 5%, 6/15/2025 | 1,610,000 | 1,652,153 | ||
| New Jersey Economic Development Authority Rev. (School Facilities Construction), “DDD”, 5%, 6/15/2026 | 2,000,000 | 2,067,815 | ||
| Issuer | Shares/Par | Value ($) | ||
| Municipal Bonds - continued | ||||
| New Jersey - continued | ||||
| New Jersey Economic Development Authority Rev. (School Facilities Construction), “DDD”, 5%, 6/15/2027 | $ | 1,500,000 | $1,556,188 | |
| New Jersey Economic Development Authority Rev. (School Facilities Construction), “DDD”, 5%, 6/15/2028 | 3,000,000 | 3,097,243 | ||
| New Jersey Economic Development Authority Rev. (School Facilities Construction), “QQQ”, 5%, 6/15/2023 | 220,000 | 221,773 | ||
| New Jersey Economic Development Authority Rev. (School Facilities Construction), “QQQ”, 5%, 6/15/2024 | 300,000 | 305,878 | ||
| New Jersey Economic Development Authority Rev. (School Facilities Construction), “QQQ”, 5%, 6/15/2025 | 500,000 | 513,091 | ||
| New Jersey Economic Development Authority Rev. (School Facilities Construction), “QQQ”, 5%, 6/15/2026 | 565,000 | 584,158 | ||
| New Jersey Economic Development Authority Rev. (School Facilities Construction), “QQQ”, 5%, 6/15/2027 | 410,000 | 425,358 | ||
| New Jersey Economic Development Authority Rev. (School Facilities Construction), “QQQ”, 5%, 6/15/2028 | 400,000 | 415,462 | ||
| New Jersey Economic Development Authority Rev., School Facilities Construction, Capital Appreciation, “DDD”, AGM, 0%, 12/15/2026 | 9,445,000 | 7,967,657 | ||
| New Jersey Economic Development Authority, (Portal North Bridge Project), “A”, 5%, 11/01/2033 | 1,500,000 | 1,535,960 | ||
| New Jersey Economic Development Authority, (Portal North Bridge Project), “A”, 5%, 11/01/2034 | 1,040,000 | 1,051,973 | ||
| New Jersey Economic Development Authority, Motor Vehicle Surcharges Subordinate Refunding Rev., “A”, 3.125%, 7/01/2029 | 495,000 | 454,847 | ||
| New Jersey Economic Development Authority, Motor Vehicle Surcharges Subordinate Refunding Rev., “A”, BAM, 5%, 7/01/2027 | 8,495,000 | 8,837,606 | ||
| New Jersey Economic Development Authority, Motor Vehicle Surcharges Subordinate Refunding Rev., “A”, BAM, 5%, 7/01/2028 | 6,885,000 | 7,136,360 | ||
| New Jersey Economic Development Authority, State Lease Rev. (State House Project), “B”, 5%, 6/15/2026 | 1,085,000 | 1,121,790 | ||
| New Jersey Economic Development Authority, Water Facilities Rev. (American Water Co., Inc. Project), “B”, 1.2%, 11/01/2034 (Put Date 6/01/2023) | 9,000,000 | 8,862,292 | ||
| New Jersey Economic Development Authority, Water Facilities Rev. (American Water Co., Inc. Project), “E”, 0.85%, 12/01/2025 | 1,135,000 | 1,006,681 | ||
| New Jersey Economic Development Motor Vehicle Surcharges Subordinate Refunding Rev., “A”, NPFG, 5.25%, 7/01/2025 | 5,000,000 | 5,178,285 | ||
| New Jersey Educational Facilities Authority Refunding Rev. (Ramapo College of New Jersey Project), “A”, 5%, 7/01/2025 | 510,000 | 526,292 | ||
| New Jersey Educational Facilities Authority Refunding Rev. (Ramapo College of New Jersey Project), “A”, 5%, 7/01/2026 | 1,000,000 | 1,042,575 | ||
| Issuer | Shares/Par | Value ($) | ||
| Municipal Bonds - continued | ||||
| New Jersey - continued | ||||
| New Jersey Educational Facilities Authority Refunding Rev. (Ramapo College of New Jersey Project), “A”, 5%, 7/01/2027 | $ | 1,000,000 | $1,050,306 | |
| New Jersey Educational Facilities Authority Refunding Rev. (Ramapo College of New Jersey Project), “A”, 5%, 7/01/2028 | 1,000,000 | 1,059,014 | ||
| New Jersey Educational Facilities Authority Refunding Rev. (Ramapo College of New Jersey Project), “A”, 5%, 7/01/2029 | 650,000 | 693,590 | ||
| New Jersey Health Care Facilities, Financing Authority Rev. (University Hospital), “A”, AGM, 5%, 7/01/2023 | 1,615,000 | 1,634,079 | ||
| New Jersey Health Care Facilities, Financing Authority Rev. (University Hospital), “A”, AGM, 5%, 7/01/2024 | 2,150,000 | 2,187,593 | ||
| New Jersey Health Care Facilities, Financing Authority Rev. (University Hospital), “A”, AGM, 5%, 7/01/2026 | 1,420,000 | 1,464,744 | ||
| New Jersey Health Care Facilities, Financing Authority, State Contract Refunding Bonds (Hospital Asset Transformation Program), 5%, 10/01/2027 | 2,000,000 | 2,078,811 | ||
| New Jersey Higher Education Student Assistance Authority, Senior Student Loan Refunding Rev., ”A“, 5%, 12/01/2023 | 215,000 | 217,644 | ||
| New Jersey Higher Education Student Assistance Authority, Senior Student Loan Refunding Rev., ”A“, 5%, 12/01/2024 | 330,000 | 336,332 | ||
| New Jersey Higher Education Student Assistance Authority, Senior Student Loan Refunding Rev., ”A“, 5%, 12/01/2025 | 415,000 | 424,317 | ||
| New Jersey Higher Education Student Assistance Authority, Senior Student Loan Refunding Rev., ”A“, 5%, 12/01/2026 | 335,000 | 344,673 | ||
| New Jersey Higher Education Student Assistance Authority, Senior Student Loan Rev., “B”, 4%, 12/01/2041 | 6,400,000 | 5,810,502 | ||
| New Jersey Higher Education Student Assistance Authority, Senior Student Loan Rev., ”B“, 5%, 12/01/2023 | 300,000 | 303,371 | ||
| New Jersey Higher Education Student Assistance Authority, Senior Student Loan Rev., ”B“, 5%, 12/01/2024 | 2,350,000 | 2,395,093 | ||
| New Jersey Higher Education Student Assistance Authority, Senior Student Loan Rev., ”B“, 5%, 12/01/2024 | 575,000 | 586,033 | ||
| New Jersey Higher Education Student Assistance Authority, Senior Student Loan Rev., ”B“, 5%, 12/01/2025 | 2,600,000 | 2,658,371 | ||
| New Jersey Higher Education Student Assistance Authority, Senior Student Loan Rev., ”B“, 5%, 12/01/2025 | 850,000 | 869,083 | ||
| New Jersey Higher Education Student Assistance Authority, Senior Student Loan Rev., ”B“, 5%, 12/01/2026 | 2,300,000 | 2,370,760 | ||
| New Jersey Higher Education Student Assistance Authority, Senior Student Loan Rev., ”B“, 5%, 12/01/2026 | 1,430,000 | 1,471,291 | ||
| New Jersey Higher Education Student Assistance Authority, Senior Student Loan Rev., ”B“, 5%, 12/01/2027 | 1,550,000 | 1,612,007 | ||
| New Jersey Higher Education Student Assistance Authority, Senior Student Loan Rev., ”B“, 5%, 12/01/2028 | 1,000,000 | 1,044,244 | ||
| Issuer | Shares/Par | Value ($) | ||
| Municipal Bonds - continued | ||||
| New Jersey - continued | ||||
| New Jersey Tobacco Settlement Financing Corp., “A”, 5%, 6/01/2023 | $ | 1,750,000 | $1,762,232 | |
| New Jersey Tobacco Settlement Financing Corp., “B”, 3.2%, 6/01/2027 | 30,000 | 29,821 | ||
| New Jersey Transportation Trust Fund Authority, “B”, AAC, 5.5%, 9/01/2026 | 1,985,000 | 2,102,169 | ||
| New Jersey Transportation Trust Fund Authority, ”AA“, 5%, 6/15/2025 | 5,500,000 | 5,644,003 | ||
| New Jersey Transportation Trust Fund Authority, ”AA“, 5%, 6/15/2026 | 9,000,000 | 9,305,167 | ||
| New Jersey Transportation Trust Fund Authority, ”AA“, 5%, 6/15/2027 | 8,000,000 | 8,299,670 | ||
| New Jersey Transportation Trust Fund Authority, ”AA“, 5%, 6/15/2028 | 10,000,000 | 10,386,543 | ||
| New Jersey Transportation Trust Fund Authority, Federal Highway Reimbursement Rev., “A”, 5%, 6/15/2024 | 4,000,000 | 4,080,895 | ||
| New Jersey Transportation Trust Fund Authority, Federal Highway Reimbursement Rev., “A-1”, 5%, 6/15/2027 | 470,000 | 485,823 | ||
| New Jersey Transportation Trust Fund Authority, Transportation System, “A”, NPFG, 5.75%, 6/15/2023 | 1,010,000 | 1,022,733 | ||
| New Jersey Transportation Trust Fund Authority, Transportation System, “B”, AAC, 5.25%, 12/15/2023 | 155,000 | 157,576 | ||
| New Jersey Transportation Trust Fund Authority, Transportation System, Capital Appreciation, “C”, AAC, 0%, 12/15/2025 | 550,000 | 484,970 | ||
| New Jersey Transportation Trust Fund Authority, Transportation System, Capital Appreciation, “C”, AAC, 0%, 12/15/2026 | 2,500,000 | 2,104,711 | ||
| New Jersey Transportation Trust Fund Authority, Transportation System, Capital Appreciation, “C”, AAC, 0%, 12/15/2028 | 6,635,000 | 5,077,886 | ||
| New Jersey Transportation Trust Fund Authority, Transportation System, Capital Appreciation, “C”, AGM, 0%, 12/15/2032 | 1,890,000 | 1,168,844 | ||
| New Jersey Transportation Trust Fund Authority, Transportation System, Capital Appreciation, “C”, NPFG, 0%, 12/15/2027 | 3,780,000 | 3,037,249 | ||
| New Jersey Turnpike Authority, Turnpike Rev., Taxable, “B”, 0.897%, 1/01/2025 | 1,905,000 | 1,743,000 | ||
| New Jersey Turnpike Authority, Turnpike Rev., Taxable, “B”, 1.047%, 1/01/2026 | 2,380,000 | 2,098,262 | ||
| Newark, NJ, Board of Education, Energy Savings Obligation Refunding, BAM, 5%, 7/15/2023 | 250,000 | 252,976 | ||
| Newark, NJ, Board of Education, Energy Savings Obligation Refunding, BAM, 5%, 7/15/2024 | 420,000 | 429,794 | ||
| Newark, NJ, Board of Education, Energy Savings Obligation Refunding, BAM, 5%, 7/15/2025 | 250,000 | 259,592 | ||
| Issuer | Shares/Par | Value ($) | ||
| Municipal Bonds - continued | ||||
| New Jersey - continued | ||||
| Newark, NJ, Board of Education, Energy Savings Obligation Refunding, BAM, 5%, 7/15/2030 | $ | 600,000 | $650,742 | |
| Newark, NJ, Board of Education, Energy Savings Obligation Refunding, BAM, 5%, 7/15/2031 | 375,000 | 407,475 | ||
| Newark, NJ, General Obligation Refunding, “A”, AGM, 5%, 10/01/2023 | 750,000 | 758,898 | ||
| Newark, NJ, General Obligation Refunding, “A”, AGM, 5%, 10/01/2025 | 700,000 | 725,460 | ||
| Newark, NJ, General Obligation Refunding, “A”, AGM, 5%, 10/01/2026 | 475,000 | 497,320 | ||
| Newark, NJ, Housing Authority Rev. (South Ward Police Facility), AGM, 5%, 12/01/2024 | 1,440,000 | 1,482,133 | ||
| Newark, NJ, Housing Authority Rev. (South Ward Police Facility), AGM, 5%, 12/01/2025 | 1,850,000 | 1,923,514 | ||
| Newark, NJ, Housing Authority Rev. (South Ward Police Facility), AGM, 5%, 12/01/2026 | 1,725,000 | 1,809,073 | ||
| South Jersey, NJ, Transportation Authority System Rev., “A”, AGM, 5%, 11/01/2029 | 1,750,000 | 1,831,453 | ||
| State of New Jersey, COVID-19 General Obligation, “A”, 4%, 6/01/2023 | 13,000,000 | 13,046,433 | ||
| Trenton, NJ, General Obligation Refunding, AGM, 4%, 7/15/2023 | 1,000,000 | 1,003,845 | ||
| $182,527,628 | ||||
| New Mexico - 0.7% | ||||
| Clayton, NM, Jail Project Improvement Rev., NPFG, 5%, 11/01/2029 | $ | 1,000,000 | $1,015,422 | |
| Farmington, NM, Pollution Control Rev. (Public Service Company of New Mexico San Juan Project), “D”, 1.1%, 6/01/2040 (Put Date 6/01/2023) | 7,000,000 | 6,874,433 | ||
| Lea County, NM, Hobbs Municipal School District No. 16, 5%, 9/15/2023 | 310,000 | 314,846 | ||
| Lea County, NM, Hobbs Municipal School District No. 16, 5%, 9/15/2024 | 120,000 | 123,487 | ||
| Lea County, NM, Hobbs Municipal School District No. 16, 5%, 9/15/2025 | 325,000 | 339,175 | ||
| Los Ranchos de Albuquerque, NM, Education Facilities Rev. (Albuquerque Academy Project), 4%, 9/01/2024 | 175,000 | 175,579 | ||
| Los Ranchos de Albuquerque, NM, Education Facilities Rev. (Albuquerque Academy Project), 4%, 9/01/2025 | 150,000 | 150,656 | ||
| Los Ranchos de Albuquerque, NM, Education Facilities Rev. (Albuquerque Academy Project), 5%, 9/01/2026 | 300,000 | 312,195 | ||
| Los Ranchos de Albuquerque, NM, Education Facilities Rev. (Albuquerque Academy Project), 5%, 9/01/2028 | 225,000 | 237,985 | ||
| Issuer | Shares/Par | Value ($) | ||
| Municipal Bonds - continued | ||||
| New Mexico - continued | ||||
| Los Ranchos de Albuquerque, NM, Education Facilities Rev. (Albuquerque Academy Project), 5%, 9/01/2030 | $ | 450,000 | $481,796 | |
| Los Ranchos de Albuquerque, NM, Education Facilities Rev. (Albuquerque Academy Project), 5%, 9/01/2031 | 300,000 | 319,789 | ||
| Los Ranchos de Albuquerque, NM, Education Facilities Rev. (Albuquerque Academy Project), 5%, 9/01/2032 | 350,000 | 371,673 | ||
| New Mexico Educational Assistance Foundation, “A-1”, 5%, 9/01/2027 | 2,000,000 | 2,081,242 | ||
| New Mexico Educational Assistance Foundation, “A-1”, 5%, 9/01/2028 | 4,000,000 | 4,188,321 | ||
| New Mexico Educational Assistance Foundation, “A-1”, 5%, 9/01/2029 | 1,750,000 | 1,842,736 | ||
| New Mexico Hospital Equipment Loan Council, Hospital System and Improvement Rev. (San Juan Regional Medical Center), 5%, 6/01/2023 | 600,000 | 604,767 | ||
| New Mexico Hospital Equipment Loan Council, Hospital System and Improvement Rev. (San Juan Regional Medical Center), 5%, 6/01/2024 | 960,000 | 976,044 | ||
| New Mexico Hospital Equipment Loan Council, Hospital System and Improvement Rev. (San Juan Regional Medical Center), 5%, 6/01/2025 | 1,055,000 | 1,079,140 | ||
| New Mexico Hospital Equipment Loan Council, Hospital System and Improvement Rev. (San Juan Regional Medical Center), 5%, 6/01/2026 | 1,000,000 | 1,030,573 | ||
| $22,519,859 | ||||
| New York - 7.2% | ||||
| Brookhaven, NY, Local Development Corp. Rev. (Active Retirement Community, Inc. d.b.a. Jefferson's Ferry Project), “B”, 1.625%, 11/01/2025 | $ | 2,850,000 | $2,603,898 | |
| Broome County, NY, Local Development Corp. Rev. (United Health Services Hospitals, Inc.), AGM, 5%, 4/01/2024 | 500,000 | 510,315 | ||
| Broome County, NY, Local Development Corp. Rev. (United Health Services Hospitals, Inc.), AGM, 5%, 4/01/2025 | 500,000 | 515,761 | ||
| Broome County, NY, Local Development Corp. Rev. (United Health Services Hospitals, Inc.), AGM, 5%, 4/01/2026 | 500,000 | 520,328 | ||
| Broome County, NY, Local Development Corp. Rev. (United Health Services Hospitals, Inc.), AGM, 5%, 4/01/2027 | 950,000 | 996,406 | ||
| Broome County, NY, Local Development Corp. Rev. (United Health Services Hospitals, Inc.), AGM, 5%, 4/01/2028 | 1,225,000 | 1,289,842 | ||
| Broome County, NY, Local Development Corp. Rev. (United Health Services Hospitals, Inc.), AGM, 5%, 4/01/2029 | 2,100,000 | 2,220,850 | ||
| Issuer | Shares/Par | Value ($) | ||
| Municipal Bonds - continued | ||||
| New York - continued | ||||
| Broome County, NY, Local Development Corp. Rev. (United Health Services Hospitals, Inc.), AGM, 5%, 4/01/2030 | $ | 900,000 | $954,068 | |
| Build NYC Resource Corp. Rev. (Academic Leadership Charter School Project), 4%, 6/15/2023 | 100,000 | 99,608 | ||
| Build NYC Resource Corp. Rev. (Academic Leadership Charter School Project), 4%, 6/15/2024 | 120,000 | 118,959 | ||
| Build NYC Resource Corp. Rev. (Grand Concourse Academy Charter School Project), “A”, 3.4%, 7/01/2027 | 300,000 | 285,985 | ||
| Monroe County, NY, Industrial Development Corp. Rev. (Rochester Regional Health Project), “A”, 5%, 12/01/2022 | 400,000 | 400,455 | ||
| Monroe County, NY, Industrial Development Corp. Rev. (Rochester Regional Health Project), “A”, 5%, 12/01/2023 | 500,000 | 507,102 | ||
| Monroe County, NY, Industrial Development Corp. Rev. (Rochester Regional Health Project), “A”, 5%, 12/01/2024 | 600,000 | 610,194 | ||
| Monroe County, NY, Industrial Development Corp. Rev. (Rochester Regional Health Project), “A”, 5%, 12/01/2027 | 700,000 | 722,495 | ||
| Nassau County, NY, Interim Finance Authority Sales Tax, Taxable, “B”, 1.278%, 11/15/2028 | 6,000,000 | 4,858,523 | ||
| Nassau County, NY, Local Economic Assistance Corp., Multi-Family Housing Rev. (Park Lake Hempstead LP Project), 0.3%, 11/01/2024 (Put Date 11/01/2023) | 10,000,000 | 9,560,291 | ||
| New York Dormitory Authority Rev. (Maimonides Medical Center), FHA, 5%, 2/01/2024 | 250,000 | 255,194 | ||
| New York Dormitory Authority Rev. (Maimonides Medical Center), FHA, 5%, 8/01/2024 | 275,000 | 282,365 | ||
| New York Dormitory Authority Rev. (Maimonides Medical Center), FHA, 5%, 2/01/2025 | 225,000 | 232,219 | ||
| New York Dormitory Authority Rev. (Maimonides Medical Center), FHA, 5%, 8/01/2025 | 200,000 | 207,737 | ||
| New York Dormitory Authority Rev. (Maimonides Medical Center), FHA, 5%, 2/01/2026 | 250,000 | 260,880 | ||
| New York Dormitory Authority Rev. (Maimonides Medical Center), FHA, 5%, 8/01/2026 | 300,000 | 314,846 | ||
| New York Dormitory Authority Rev. (Maimonides Medical Center), FHA, 5%, 8/01/2027 | 500,000 | 530,434 | ||
| New York Dormitory Authority Rev. (Maimonides Medical Center), FHA, 5%, 2/01/2028 | 425,000 | 450,694 | ||
| New York Dormitory Authority Rev. (Maimonides Medical Center), FHA, 4%, 2/01/2029 | 635,000 | 645,380 | ||
| New York Dormitory Authority Rev. (Maimonides Medical Center), FHA, 4%, 8/01/2029 | 550,000 | 558,774 | ||
| New York Dormitory Authority Rev. (Maimonides Medical Center), FHA, 4%, 8/01/2030 | 550,000 | 553,096 | ||
| Issuer | Shares/Par | Value ($) | ||
| Municipal Bonds - continued | ||||
| New York - continued | ||||
| New York Dormitory Authority Rev. (Maimonides Medical Center), FHA, 4%, 2/01/2031 | $ | 625,000 | $614,313 | |
| New York Dormitory Authority Rev. (Maimonides Medical Center), FHA, 4%, 8/01/2031 | 550,000 | 538,703 | ||
| New York Dormitory Authority Rev. (Orange Regional Medical Center Obligated Group Rev.), 5%, 12/01/2023 (n) | 1,300,000 | 1,308,170 | ||
| New York Dormitory Authority Rev. (Orange Regional Medical Center Obligated Group Rev.), 5%, 12/01/2025 (n) | 2,400,000 | 2,409,135 | ||
| New York Dormitory Authority Rev., Non-State Supported Debt (St. John's University), “A”, 5%, 7/01/2023 | 600,000 | 607,207 | ||
| New York Dormitory Authority Rev., Non-State Supported Debt (St. John's University), “A”, 5%, 7/01/2024 | 750,000 | 764,934 | ||
| New York Dormitory Authority Rev., Non-State Supported Debt (St. John's University), “A”, 5%, 7/01/2025 | 750,000 | 772,039 | ||
| New York Dormitory Authority Rev., Non-State Supported Debt (St. John's University), “A”, 5%, 7/01/2026 | 500,000 | 518,339 | ||
| New York Energy Research & Development Authority, Pollution Control Rev. (Rochester Gas & Electric Corp.), “A”, 3%, 8/01/2032 (Put Date 7/01/2025) | 11,125,000 | 10,921,318 | ||
| New York Environmental Facilities Corp. Rev., Solid Waste Disposal (Casella Waste Management, Inc. Project), 2.75%, 9/01/2050 (Put Date 9/02/2025) (n) | 300,000 | 278,911 | ||
| New York Housing Finance Agency Affordable Housing Rev., “L-2”, 0.75%, 11/01/2025 | 1,200,000 | 1,085,090 | ||
| New York Mortgage Agency Homeowner Mortgage Rev., “242”, 5%, 10/01/2023 | 1,880,000 | 1,901,459 | ||
| New York Mortgage Agency Homeowner Mortgage Rev., “242”, 3.5%, 10/01/2052 | 6,445,000 | 6,129,816 | ||
| New York Mortgage Agency Homeowner Mortgage Rev., “243”, 5%, 4/01/2024 | 1,920,000 | 1,951,634 | ||
| New York Mortgage Agency Homeowner Mortgage Rev., “243”, 5%, 10/01/2024 | 1,955,000 | 1,995,582 | ||
| New York Mortgage Agency Homeowner Mortgage Rev., “243”, 5%, 4/01/2025 | 1,990,000 | 2,038,835 | ||
| New York Mortgage Agency Homeowner Mortgage Rev., “243”, 5%, 10/01/2025 | 2,030,000 | 2,089,116 | ||
| New York Mortgage Agency Homeowner Mortgage Rev., “243”, 5%, 4/01/2026 | 2,065,000 | 2,130,894 | ||
| New York Mortgage Agency Rev., “243”, 5%, 10/01/2026 | 1,810,000 | 1,873,026 | ||
| New York Mortgage Agency Rev., “4th-9th”, 3.25%, 10/01/2028 | 3,750,000 | 3,567,903 | ||
| New York State Housing Finance Agency Affordable Rev., “A-2”, 2.5%, 11/01/2060 (Put Date 5/01/2027) | 19,050,000 | 17,655,119 | ||
| Issuer | Shares/Par | Value ($) | ||
| Municipal Bonds - continued | ||||
| New York - continued | ||||
| New York Transportation Development Corp., Special Facilities Rev. (Delta Airlines, Inc. LaGuardia Airport Terminals C&D Redevelopment Project), 5%, 1/01/2025 | $ | 11,030,000 | $11,013,582 | |
| New York Transportation Development Corp., Special Facilities Rev. (Delta Airlines, Inc. LaGuardia Airport Terminals C&D Redevelopment Project), 5%, 1/01/2028 | 3,965,000 | 3,950,476 | ||
| New York Transportation Development Corp., Special Facilities Rev. (John F. Kennedy International Airport Project), 2.25%, 8/01/2026 | 805,000 | 738,283 | ||
| New York Transportation Development Corp., Special Facilities Rev. (Terminal 4 John F. Kennedy International Airport Project), 5%, 12/01/2026 | 8,635,000 | 8,735,811 | ||
| New York Transportation Development Corp., Special Facilities Rev. (Terminal 4 John F. Kennedy International Airport Project), “A”, 5%, 12/01/2022 | 250,000 | 250,135 | ||
| New York Transportation Development Corp., Special Facilities Rev. (Terminal 4 John F. Kennedy International Airport Project), “A”, 5%, 12/01/2023 | 1,350,000 | 1,358,910 | ||
| New York Transportation Development Corp., Special Facilities Rev. (Terminal 4 John F. Kennedy International Airport Project), “A”, 5%, 12/01/2024 | 1,250,000 | 1,264,275 | ||
| New York Transportation Development Corp., Special Facilities Rev. (Terminal 4 John F. Kennedy International Airport Project), “A”, 5%, 12/01/2025 | 1,100,000 | 1,115,805 | ||
| New York Transportation Development Corp., Special Facilities Rev. (Terminal 4 John F. Kennedy International Airport Project), “C”, 5%, 12/01/2022 | 1,805,000 | 1,807,024 | ||
| New York Transportation Development Corp., Special Facilities Rev. (Terminal 4 John F. Kennedy International Airport Project), “C”, 5%, 12/01/2023 | 1,900,000 | 1,925,980 | ||
| New York Transportation Development Corp., Special Facilities Rev. (Terminal 4 John F. Kennedy International Airport Project), “C”, 5%, 12/01/2024 | 1,000,000 | 1,025,216 | ||
| New York Transportation Development Corp., Special Facilities Rev. (Terminal 4 John F. Kennedy International Airport Project), “C”, 5%, 12/01/2025 | 1,600,000 | 1,642,899 | ||
| New York, NY, City Housing Development Corp., Multi-Family Housing Rev. (Sustainable Neighborhood Bonds), “A-3”, 1.125%, 5/01/2060 (Put Date 11/01/2024) | 6,000,000 | 5,659,240 | ||
| New York, NY, City Housing Development Corp., Multi-Family Housing Rev., “A-2”, FHA, 0.9%, 5/01/2025 | 500,000 | 467,755 | ||
| New York, NY, City Housing Development Corp., Multi-Family Housing Rev., “A-2”, FHA, 1%, 11/01/2025 | 1,450,000 | 1,342,518 | ||
| Issuer | Shares/Par | Value ($) | ||
| Municipal Bonds - continued | ||||
| New York - continued | ||||
| New York, NY, City Housing Development Corp., Multi-Family Housing Rev., “A-2”, FHA, 1.1%, 5/01/2026 | $ | 3,305,000 | $3,015,211 | |
| New York, NY, City Housing Development Corp., Multi-Family Housing Rev., “A-2”, FHA, 1.15%, 11/01/2026 | 1,290,000 | 1,163,886 | ||
| New York, NY, Industrial Development Agency Pilot Refunding Rev. (Queens Baseball Stadium Project), “A”, AGM, 5%, 1/01/2024 | 750,000 | 761,413 | ||
| New York, NY, Industrial Development Agency Pilot Refunding Rev. (Yankee Stadium Project), “A”, AGM, 5%, 3/01/2028 | 1,000,000 | 1,053,243 | ||
| New York, NY, Industrial Development Agency Pilot Refunding Rev. (Yankee Stadium Project), “A”, AGM, 5%, 3/01/2029 | 1,250,000 | 1,322,628 | ||
| New York, NY, Industrial Development Agency Pilot Refunding Rev. (Yankee Stadium Project), “A”, AGM, 4%, 3/01/2031 | 2,000,000 | 2,004,084 | ||
| New York, NY, Industrial Development Agency Pilot Refunding Rev. (Yankee Stadium Project), “A”, AGM, 4%, 3/01/2032 | 680,000 | 677,052 | ||
| Oneida County, NY, Local Development Corp. Rev. (Mohawk Valley Health System Project), “A”, AGM, 5%, 12/01/2026 | 1,625,000 | 1,647,448 | ||
| Oneida County, NY, Local Development Corp. Rev. (Mohawk Valley Health System Project), “A”, AGM, 5%, 12/01/2027 | 1,425,000 | 1,444,424 | ||
| Oneida County, NY, Local Development Corp. Rev. (Mohawk Valley Health System Project), “A”, AGM, 5%, 12/01/2028 | 1,000,000 | 1,013,424 | ||
| Oneida County, NY, Local Development Corp. Rev. (Mohawk Valley Health System Project), “A”, AGM, 5%, 12/01/2029 | 175,000 | 177,312 | ||
| Oyster Bay, NY, Public Improvement, 4%, 8/25/2023 | 12,000,000 | 12,065,392 | ||
| Oyster Bay, NY, Public Improvement Refunding Rev., 5%, 8/01/2023 | 600,000 | 607,968 | ||
| Oyster Bay, NY, Public Improvement Refunding Rev., 5%, 8/01/2024 | 1,250,000 | 1,286,052 | ||
| Oyster Bay, NY, Public Improvement Rev., BAM, 4%, 11/01/2025 | 750,000 | 762,824 | ||
| Oyster Bay, NY, Public Improvement Rev., BAM, 4%, 11/01/2026 | 800,000 | 815,419 | ||
| Phelps-Clifton Springs, NY, Central School District General Obligation Anticipation Notes, 3%, 7/27/2023 | 6,075,000 | 6,027,252 | ||
| Port Authority of NY & NJ (207th Series), 5%, 9/15/2027 | 1,755,000 | 1,820,486 | ||
| Port Authority of NY & NJ (226th Series), 5%, 10/15/2025 | 1,475,000 | 1,512,283 | ||
| Port Authority of NY & NJ (226th Series), 5%, 10/15/2026 | 2,000,000 | 2,065,091 | ||
| Port Authority of NY & NJ (226th Series), 5%, 10/15/2027 | 3,650,000 | 3,788,170 | ||
| Port Authority of NY & NJ (226th Series), 5%, 10/15/2028 | 3,500,000 | 3,650,592 | ||
| Poughkeepsie, NY, Public Improvement, 5%, 6/01/2023 | 1,125,000 | 1,131,422 | ||
| Poughkeepsie, NY, Public Improvement, 5%, 6/01/2024 | 465,000 | 471,559 | ||
| Poughkeepsie, NY, Public Improvement, 5%, 6/01/2025 | 235,000 | 240,146 | ||
| St. Lawrence County, NY, Industrial Development Agency, Civic Development Corp. Rev., Taxable (Clarkson University Project), “C”, 1.25%, 9/01/2023 | 145,000 | 139,645 | ||
| Issuer | Shares/Par | Value ($) | ||
| Municipal Bonds - continued | ||||
| New York - continued | ||||
| St. Lawrence County, NY, Industrial Development Agency, Civic Development Corp. Rev., Taxable (Clarkson University Project), “C”, 1.45%, 9/01/2024 | $ | 100,000 | $92,579 | |
| St. Lawrence County, NY, Industrial Development Agency, Civic Development Corp. Rev., Taxable (Clarkson University Project), “C”, 1.7%, 9/01/2025 | 110,000 | 98,353 | ||
| St. Lawrence County, NY, Industrial Development Agency, Civic Development Corp. Rev., Taxable (Clarkson University Project), “C”, 1.95%, 9/01/2026 | 140,000 | 121,782 | ||
| St. Lawrence County, NY, Industrial Development Agency, Civic Development Corp. Rev., Taxable (Clarkson University Project), “C”, 2.2%, 9/01/2027 | 135,000 | 114,994 | ||
| Suffolk County, NY, “B”, AGM, 5%, 10/15/2025 | 7,000,000 | 7,295,629 | ||
| Suffolk County, NY, “A”, 5%, 6/15/2028 | 1,800,000 | 1,922,455 | ||
| Suffolk County, NY, “A”, 5%, 6/15/2030 | 850,000 | 920,263 | ||
| Suffolk County, NY, “A”, BAM, 5%, 4/01/2027 | 2,360,000 | 2,497,907 | ||
| Suffolk, NY, Tobacco Asset Securitization Corp., Tobacco Settlement, Taxable, “A-1”, 0.67%, 6/01/2023 | 1,500,000 | 1,464,077 | ||
| Suffolk, NY, Tobacco Asset Securitization Corp., Tobacco Settlement, Taxable, “A-1”, 1.015%, 6/01/2024 | 500,000 | 470,929 | ||
| Syracuse, NY, Regional Airport Authority Senior Airport Rev., 5%, 7/01/2023 | 700,000 | 704,819 | ||
| Syracuse, NY, Regional Airport Authority Senior Airport Rev., 5%, 7/01/2024 | 700,000 | 711,110 | ||
| Syracuse, NY, Regional Airport Authority Senior Airport Rev., 5%, 7/01/2025 | 750,000 | 764,416 | ||
| Syracuse, NY, Regional Airport Authority Senior Airport Rev., 5%, 7/01/2026 | 250,000 | 255,060 | ||
| Tobacco Settlement Asset Securitization Corp., NY, “1”, 5%, 6/01/2025 | 1,000,000 | 1,024,572 | ||
| Tobacco Settlement Asset Securitization Corp., NY, “1”, 5%, 6/01/2026 | 2,000,000 | 2,062,328 | ||
| Tobacco Settlement Asset Securitization Corp., NY, “1”, 5%, 6/01/2027 | 1,500,000 | 1,552,640 | ||
| Triborough Bridge & Tunnel Authority Rev., NY, Payroll Mobility Tax (MTA Bridges and Tunnels), “A-2”, 2%, 5/15/2045 (Put Date 5/15/2026) | 10,000,000 | 9,233,646 | ||
| Yonkers, NY, General Obligation, “C”, AGM, 5%, 3/15/2024 | 300,000 | 306,852 | ||
| Yonkers, NY, General Obligation, “C”, AGM, 5%, 3/15/2025 | 500,000 | 517,787 | ||
| Yonkers, NY, General Obligation, “C”, AGM, 5%, 3/15/2026 | 600,000 | 628,560 | ||
| Yonkers, NY, General Obligation, “C”, AGM, 5%, 3/15/2027 | 650,000 | 687,911 | ||
| Yonkers, NY, General Obligation, “C”, AGM, 5%, 3/15/2028 | 500,000 | 533,521 | ||
| Yonkers, NY, General Obligation, “C”, AGM, 5%, 3/15/2029 | 735,000 | 790,764 | ||
| Issuer | Shares/Par | Value ($) | ||
| Municipal Bonds - continued | ||||
| New York - continued | ||||
| Yonkers, NY, School District, “D”, AGM, 5%, 3/15/2025 | $ | 750,000 | $776,680 | |
| Yonkers, NY, School District, “D”, AGM, 5%, 3/15/2026 | 785,000 | 822,366 | ||
| Yonkers, NY, School District, “D”, AGM, 5%, 3/15/2027 | 525,000 | 555,621 | ||
| Yonkers, NY, School District, “D”, AGM, 5%, 3/15/2028 | 865,000 | 922,991 | ||
| Yonkers, NY, School District, “D”, AGM, 5%, 3/15/2029 | 910,000 | 979,041 | ||
| $224,010,230 | ||||
| North Carolina - 1.4% | ||||
| Columbus County, NC, Industrial Facilities & Pollution Control, Financing Authority Rev. (International Paper Co.), “A”, 1.375%, 5/01/2034 (Put Date 6/16/2025) | $ | 1,000,000 | $923,266 | |
| Durham, SC, Multi-Family Housing Authority Rev. (JJ Henderson Senior Apartment Project), 0.3%, 6/01/2024 (Put Date 6/01/2023) | 1,095,000 | 1,073,076 | ||
| Greater Ashville, NC, Regional Airport Authority System Rev., “A”, AGM, 5%, 7/01/2027 | 750,000 | 769,023 | ||
| Greater Ashville, NC, Regional Airport Authority System Rev., “A”, AGM, 5%, 7/01/2028 | 725,000 | 746,188 | ||
| Greater Ashville, NC, Regional Airport Authority System Rev., “A”, AGM, 5%, 7/01/2029 | 900,000 | 927,771 | ||
| Greater Ashville, NC, Regional Airport Authority System Rev., “A”, AGM, 5%, 7/01/2030 | 100,000 | 102,785 | ||
| Greater Ashville, NC, Regional Airport Authority System Rev., “A”, AGM, 5%, 7/01/2031 | 1,370,000 | 1,407,008 | ||
| New Hanover County, NC, General Obligation School, 5%, 9/01/2024 | 2,615,000 | 2,697,990 | ||
| New Hanover County, NC, General Obligation School, 5%, 9/01/2025 | 2,140,000 | 2,242,182 | ||
| North Carolina Capital Facilities Finance Agency Student Housing Rev. (NCA&T University Foundation LLC Project), “A”, AGM, 5%, 6/01/2023 | 325,000 | 327,545 | ||
| North Carolina Capital Facilities Finance Agency Student Housing Rev. (NCA&T University Foundation LLC Project), “A”, AGM, 5%, 6/01/2024 | 700,000 | 711,376 | ||
| North Carolina Education Assistance Authority, Student Loan Rev., “A”, 5%, 6/01/2025 | 250,000 | 256,460 | ||
| North Carolina Education Assistance Authority, Tax-Exempt Student Loan Rev., “A”, 5%, 6/01/2027 | 1,250,000 | 1,298,104 | ||
| North Carolina Housing Finance Agency, Home Ownership Rev., “48”, 5%, 1/01/2028 | 2,175,000 | 2,304,577 | ||
| North Carolina Housing Finance Agency, Home Ownership Rev., “48”, 5%, 7/01/2028 | 1,845,000 | 1,963,544 | ||
| North Carolina Housing Finance Agency, Home Ownership Rev., “48”, 5%, 1/01/2030 | 500,000 | 533,673 | ||
| Issuer | Shares/Par | Value ($) | ||
| Municipal Bonds - continued | ||||
| North Carolina - continued | ||||
| North Carolina Housing Finance Agency, Home Ownership Rev., “48”, 5%, 7/01/2030 | $ | 1,500,000 | $1,604,809 | |
| North Carolina Medical Care Commission, Health Care Facilities First Mortgage Refunding Rev. (Lutheran Services for the Aging), “C”, 5%, 3/01/2023 | 375,000 | 375,281 | ||
| North Carolina Medical Care Commission, Health Care Facilities First Mortgage Refunding Rev. (Lutheran Services for the Aging), “C”, 5%, 3/01/2024 | 395,000 | 396,081 | ||
| North Carolina Medical Care Commission, Health Care Facilities First Mortgage Refunding Rev. (Lutheran Services for the Aging), “C”, 5%, 3/01/2025 | 420,000 | 421,528 | ||
| North Carolina Medical Care Commission, Health Care Facilities First Mortgage Refunding Rev. (Lutheran Services for the Aging), “C”, 5%, 3/01/2026 | 440,000 | 437,972 | ||
| North Carolina Medical Care Commission, Health Care Facilities First Mortgage Refunding Rev. (Lutheran Services for the Aging), “C”, 5%, 3/01/2027 | 460,000 | 453,815 | ||
| North Carolina Medical Care Commission, Health Care Facilities First Mortgage Refunding Rev. (Lutheran Services for the Aging), “C”, 5%, 3/01/2028 | 365,000 | 356,639 | ||
| North Carolina Medical Care Commission, Health Care Facilities First Mortgage Refunding Rev. (Lutheran Services for the Aging), “C”, 4%, 3/01/2029 | 760,000 | 695,883 | ||
| North Carolina Medical Care Commission, Health Care Facilities First Mortgage Refunding Rev. (Lutheran Services for the Aging), “C”, 4%, 3/01/2030 | 790,000 | 709,511 | ||
| North Carolina Medical Care Commission, Health Care Facilities First Mortgage Refunding Rev. (Lutheran Services for the Aging), “C”, 4%, 3/01/2031 | 820,000 | 722,524 | ||
| North Carolina Medical Care Commission, Health Care Facilities First Mortgage Rev. (Lutheran Services for the Aging), “A”, 3%, 3/01/2023 | 150,000 | 149,144 | ||
| North Carolina Medical Care Commission, Health Care Facilities First Mortgage Rev. (Lutheran Services for the Aging), “A”, 4%, 3/01/2024 | 220,000 | 217,801 | ||
| North Carolina Medical Care Commission, Health Care Facilities First Mortgage Rev. (Lutheran Services for the Aging), “A”, 4%, 3/01/2025 | 265,000 | 260,192 | ||
| North Carolina Medical Care Commission, Health Care Facilities First Mortgage Rev. (Lutheran Services for the Aging), “A”, 5%, 3/01/2026 | 245,000 | 243,871 | ||
| Issuer | Shares/Par | Value ($) | ||
| Municipal Bonds - continued | ||||
| North Carolina - continued | ||||
| North Carolina Medical Care Commission, Health Care Facilities First Mortgage Rev. (Lutheran Services for the Aging), “A”, 5%, 3/01/2027 | $ | 290,000 | $286,101 | |
| North Carolina Medical Care Commission, Health Care Facilities First Mortgage Rev. (Lutheran Services for the Aging), “A”, 5%, 3/01/2028 | 185,000 | 180,762 | ||
| North Carolina Medical Care Commission, Health Care Facilities First Mortgage Rev. (Presbyterian Homes Obligated Group), “A”, 4%, 10/01/2027 | 600,000 | 582,510 | ||
| North Carolina Turnpike Authority, Triangle Expressway System Turnpike Rev., AGM, 5%, 1/01/2026 | 1,500,000 | 1,560,580 | ||
| North Carolina Turnpike Authority, Triangle Expressway System Turnpike Rev., AGM, 5%, 1/01/2027 | 4,000,000 | 4,206,225 | ||
| Raleigh Durham, NC, Airport Authority Rev., “A”, 5%, 5/01/2025 | 645,000 | 660,578 | ||
| Raleigh Durham, NC, Airport Authority Rev., “A”, 5%, 5/01/2026 | 1,000,000 | 1,029,990 | ||
| Sanford, NC, Housing Authority Multi-Family Housing Rev. (Matthews Garden Gilmore), HUD Section 8, 3.35%, 10/01/2023 | 7,500,000 | 7,488,847 | ||
| Wayne County, NC, Limited Obligation, 4%, 6/01/2029 | 1,035,000 | 1,050,255 | ||
| $42,375,467 | ||||
| North Dakota - 0.4% | ||||
| McKenzie County, ND, State Aid Certificates of Indebtedness, 4%, 8/01/2025 | $ | 2,265,000 | $2,239,156 | |
| McKenzie County, ND, State Aid Certificates of Indebtedness, 4%, 8/01/2026 | 1,195,000 | 1,172,458 | ||
| McKenzie County, ND, State Aid Certificates of Indebtedness, 4%, 8/01/2027 | 3,360,000 | 3,270,762 | ||
| North Dakota Housing Finance Agency Multifamily Rev. (Grand Forks Portfolio), HUD Section 8, 2.45%, 9/01/2025 (Put Date 9/01/2023) | 2,000,000 | 1,974,026 | ||
| Williston, ND, Airport Rev., 4%, 11/01/2029 | 2,310,000 | 2,314,154 | ||
| $10,970,556 | ||||
| Ohio - 3.1% | ||||
| Akron, Bath, & Copley, OH, Joint Township Hospital District Facilities Rev. (Summa Health Obligated Group), 5%, 11/15/2026 | $ | 530,000 | $545,967 | |
| Akron, Bath, & Copley, OH, Joint Township Hospital District Facilities Rev. (Summa Health Obligated Group), 5%, 11/15/2028 | 240,000 | 247,591 | ||
| Cleveland, OH, Airport System Rev., “A”, 5%, 1/01/2024 | 2,000,000 | 2,030,891 | ||
| Cleveland, OH, Airport System Rev., “A”, 5%, 1/01/2025 | 1,970,000 | 2,005,881 | ||
| Cleveland, OH, Airport System Rev., “A”, 5%, 1/01/2026 | 3,000,000 | 3,062,623 | ||
| Cleveland, OH, Airport System Rev., “A”, AGM, 5%, 1/01/2025 | 1,250,000 | 1,285,559 | ||
| Cuyahoga County, OH, Hospital Rev. (Metrohealth System), 5%, 2/15/2026 | 2,000,000 | 2,059,797 | ||
| Issuer | Shares/Par | Value ($) | ||
| Municipal Bonds - continued | ||||
| Ohio - continued | ||||
| Cuyahoga County, OH, Hospital Rev. (Metrohealth System), 5%, 2/15/2027 | $ | 2,150,000 | $2,212,875 | |
| Lorain, OH, General Obligation, BAM, 3%, 12/01/2023 | 550,000 | 546,747 | ||
| Lorain, OH, General Obligation, BAM, 4%, 12/01/2025 | 815,000 | 826,494 | ||
| Mayfield Hights, OH, MACC Improvement General Obligation Bond Anticipation Notes, 3%, 7/20/2023 | 13,500,000 | 13,398,470 | ||
| Middleburg Heights, OH, Hospital Facilities Rev. (Southwest General Health Center), “A”, 5%, 8/01/2026 | 500,000 | 518,168 | ||
| Middleburg Heights, OH, Hospital Facilities Rev. (Southwest General Health Center), “A”, 5%, 8/01/2027 | 580,000 | 603,223 | ||
| Middleburg Heights, OH, Hospital Facilities Rev. (Southwest General Health Center), “A”, 5%, 8/01/2028 | 1,455,000 | 1,518,957 | ||
| Middleburg Heights, OH, Hospital Facilities Rev. (Southwest General Health Center), “A”, 5%, 8/01/2029 | 1,560,000 | 1,629,760 | ||
| Middleburg Heights, OH, Hospital Facilities Rev. (Southwest General Health Center), “A”, 5%, 8/01/2030 | 1,000,000 | 1,041,098 | ||
| Middleburg Heights, OH, Hospital Facilities Rev. (Southwest General Health Center), “A”, 5%, 8/01/2031 | 1,000,000 | 1,040,654 | ||
| Middleburg Heights, OH, Hospital Facilities Rev. (Southwest General Health Center), “A”, 5%, 8/01/2032 | 900,000 | 931,317 | ||
| Middleburg Heights, OH, Hospital Facilities Rev. (Southwest General Health Center), “A”, 5%, 8/01/2033 | 800,000 | 823,981 | ||
| Middleburg Heights, OH, Hospital Facilities Rev. (Southwest General Health Center), “A”, 5%, 8/01/2034 | 1,000,000 | 1,024,357 | ||
| Montgomery County, OH, Hospital Facilities Improvement and Refunding Rev. (Kettering Health Network Obligated Group Project), 5%, 8/01/2023 | 225,000 | 227,222 | ||
| Montgomery County, OH, Hospital Facilities Improvement and Refunding Rev. (Kettering Health Network Obligated Group Project), 5%, 8/01/2024 | 205,000 | 209,266 | ||
| Montgomery County, OH, Hospital Facilities Improvement and Refunding Rev. (Kettering Health Network Obligated Group Project), 5%, 8/01/2025 | 500,000 | 515,635 | ||
| Montgomery County, OH, Hospital Facilities Improvement and Refunding Rev. (Kettering Health Network Obligated Group Project), 5%, 8/01/2026 | 500,000 | 519,405 | ||
| Montgomery County, OH, Hospital Facilities Improvement and Refunding Rev. (Kettering Health Network Obligated Group Project), 5%, 8/01/2027 | 525,000 | 547,633 | ||
| Montgomery County, OH, Hospital Facilities Improvement and Refunding Rev. (Kettering Health Network Obligated Group Project), 5%, 8/01/2028 | 400,000 | 417,999 | ||
| Issuer | Shares/Par | Value ($) | ||
| Municipal Bonds - continued | ||||
| Ohio - continued | ||||
| Montgomery County, OH, Hospital Facilities Improvement and Refunding Rev. (Kettering Health Network Obligated Group Project), 5%, 8/01/2029 | $ | 450,000 | $470,123 | |
| Northeast Ohio Medical University, General Receipts, “A”, 3%, 12/01/2022 | 100,000 | 99,960 | ||
| Northeast Ohio Medical University, General Receipts, “A”, 3%, 12/01/2023 | 100,000 | 99,227 | ||
| Northeast Ohio Medical University, General Receipts, “A”, 5%, 12/01/2024 | 100,000 | 101,759 | ||
| Northeast Ohio Medical University, General Receipts, “A”, 5%, 12/01/2026 | 200,000 | 206,077 | ||
| Northeast Ohio Medical University, General Receipts, “A”, 5%, 12/01/2028 | 120,000 | 124,331 | ||
| Northeast Ohio Medical University, General Receipts, “A”, 5%, 12/01/2030 | 135,000 | 139,663 | ||
| Ohio Air Quality Development Authority Refunding Rev. (Duke Energy Corp. Project), “A”, 4.25%, 11/01/2039 (Put Date 6/01/2027) | 2,895,000 | 2,824,338 | ||
| Ohio Air Quality Development Authority Refunding Rev. (Duke Energy Corp. Project), “B”, 4%, 9/01/2030 (Put Date 6/01/2027) | 3,420,000 | 3,334,656 | ||
| Ohio Air Quality Development Authority Rev. (American Electric Power Co.), “C”, 2.1%, 4/01/2028 (Put Date 10/01/2024) | 2,075,000 | 1,969,950 | ||
| Ohio Air Quality Development Authority, Facilities Rev. (Pratt Paper LLC Project), 3.75%, 1/15/2028 (n) | 105,000 | 99,646 | ||
| Ohio Higher Educational Facility Commission Rev. (Cleveland Institute of Music 2022 Project), 5%, 12/01/2027 | 875,000 | 886,777 | ||
| Ohio Higher Educational Facility Commission Rev. (Xavier University Project), “C”, 5%, 5/01/2023 | 625,000 | 629,761 | ||
| Ohio Higher Educational Facility Rev. (Case Western Reserve University Project), “C”, 1.625%, 12/01/2034 (Put Date 12/01/2026) | 5,000,000 | 4,626,256 | ||
| Ohio Housing Finance Agency Residential Mortgage Rev. (Mortgage-Backed Securities Program), “C”, FNMA, 5.75%, 3/01/2054 (w) | 5,960,000 | 6,244,680 | ||
| Ohio Housing Finance Agency Residential Mortgage Rev. (Seton Square North), “A”, HUD Section 8, 0.4%, 4/01/2024 (Put Date 4/01/2023) | 4,725,000 | 4,653,811 | ||
| Ohio State Hospital Rev. (Premier Health Partners Obligated Group), 5%, 11/15/2026 | 140,000 | 144,270 | ||
| Ohio State Hospital Rev. (Premier Health Partners Obligated Group), 5%, 11/15/2027 | 420,000 | 433,222 | ||
| Ohio State Hospital Rev. (Premier Health Partners Obligated Group), 5%, 11/15/2028 | 370,000 | 382,297 | ||
| Issuer | Shares/Par | Value ($) | ||
| Municipal Bonds - continued | ||||
| Ohio - continued | ||||
| Ohio State Hospital Rev. (Premier Health Partners Obligated Group), 5%, 11/15/2029 | $ | 825,000 | $852,818 | |
| Ohio State Hospital Rev. (Premier Health Partners Obligated Group), 5%, 11/15/2031 | 475,000 | 485,917 | ||
| Ohio State Hospital Rev. (Premier Health Partners Obligated Group), 5%, 11/15/2032 | 290,000 | 293,631 | ||
| Ohio State Hospital Rev. (University Hospitals Health System, Inc.), 5%, 1/15/2050 (Put Date 1/15/2025) | 5,000,000 | 5,116,897 | ||
| Ohio Tax Exempt Private Activity (Portsmouth Bypass Project), 5%, 12/31/2022 | 775,000 | 777,112 | ||
| Ohio Water Development Authority, Solid Waste Rev. (Waste Management, Inc.), 3.25%, 11/01/2022 | 8,500,000 | 8,500,000 | ||
| State of Ohio, Common Schools General Obligation, “A”, 5%, 6/15/2023 | 225,000 | 227,629 | ||
| State of Ohio, Common Schools General Obligation, “A”, 5%, 6/15/2024 | 200,000 | 205,793 | ||
| State of Ohio, Major New State Infrastructure Project Rev., 5%, 12/15/2023 | 6,625,000 | 6,749,270 | ||
| Triway, OH, Local School District Board of Education, BAM, 3%, 12/01/2022 | 800,000 | 799,777 | ||
| Triway, OH, Local School District Board of Education, BAM, 3%, 12/01/2023 | 700,000 | 696,302 | ||
| Triway, OH, Local School District Board of Education, BAM, 3%, 12/01/2024 | 400,000 | 395,398 | ||
| Triway, OH, Local School District Board of Education, BAM, 3%, 12/01/2025 | 310,000 | 303,956 | ||
| Triway, OH, Local School District Board of Education, BAM, 4%, 12/01/2026 | 630,000 | 640,188 | ||
| Triway, OH, Local School District Board of Education, BAM, 4%, 12/01/2027 | 350,000 | 356,019 | ||
| Youngstown State University, OH, General Receipts, AGM, 4%, 12/15/2024 | 650,000 | 657,889 | ||
| Youngstown State University, OH, General Receipts, AGM, 4%, 12/15/2025 | 580,000 | 589,416 | ||
| $94,910,386 | ||||
| Issuer | Shares/Par | Value ($) | ||
| Municipal Bonds - continued | ||||
| Oklahoma - 0.4% | ||||
| Cushing, OK, Educational Facilities Lease Authority Rev. (Cushing Public Schools Project), 5%, 9/01/2024 | $ | 5,000,000 | $5,129,955 | |
| Oklahoma City, OK, Economic Development Trust Tax Apportionment Refunding Rev., Taxable (Increment District No. 8), “A”, 0.384%, 3/01/2023 | 1,800,000 | 1,776,124 | ||
| Oklahoma City, OK, Economic Development Trust Tax Apportionment Refunding Rev., Taxable (Increment District No. 8), “A”, 0.648%, 3/01/2024 | 1,070,000 | 1,011,640 | ||
| Rogers County, OK, Educational Facilities Authority Lease Rev. (Catoosa Public Schools Project), 5%, 9/01/2024 | 950,000 | 974,521 | ||
| Tulsa County, OK, Industrial Authority, Senior Living Community Rev. (Montereau, Inc.), 5%, 11/15/2025 | 800,000 | 803,558 | ||
| Tulsa County, OK, Industrial Authority, Senior Living Community Rev. (Montereau, Inc.), 5%, 11/15/2026 | 500,000 | 501,983 | ||
| Tulsa, OK, Trustees of the Tulsa Airports Improvement Trust, General Airport Rev., “A”, BAM, 4%, 6/01/2023 | 200,000 | 200,143 | ||
| Tulsa, OK, Trustees of the Tulsa Airports Improvement Trust, General Airport Rev., “A”, BAM, 4%, 6/01/2024 | 425,000 | 425,329 | ||
| Tulsa, OK, Trustees of the Tulsa Airports Improvement Trust, General Airport Rev., “A”, BAM, 4%, 6/01/2025 | 440,000 | 438,646 | ||
| Tulsa, OK, Trustees of the Tulsa Airports Improvement Trust, General Airport Rev., “A”, BAM, 4%, 6/01/2026 | 300,000 | 298,088 | ||
| $11,559,987 | ||||
| Oregon - 0.9% | ||||
| Forest Grove, OR, Campus Improvement Rev. (Pacific University Project), “A”, 5%, 5/01/2023 | $ | 500,000 | $502,899 | |
| Medford, OR, Hospital Facilities Authority Rev. (Asante Health System Obligated Group), “A”, 5%, 8/15/2025 | 400,000 | 412,991 | ||
| Medford, OR, Hospital Facilities Authority Rev. (Asante Health System Obligated Group), “A”, 5%, 8/15/2027 | 720,000 | 751,250 | ||
| Medford, OR, Hospital Facilities Authority Rev. (Asante Health System Obligated Group), “A”, 5%, 8/15/2029 | 1,000,000 | 1,049,109 | ||
| Medford, OR, Hospital Facilities Authority Rev. (Asante Health System Obligated Group), “A”, 5%, 8/15/2030 | 600,000 | 629,538 | ||
| Multnomah County, OR, Hospital Facilities Authority Refunding Rev. (Terwilliger Plaza - Parkview Project), “B-1”, 1.2%, 6/01/2028 | 455,000 | 378,414 | ||
| Multnomah County, OR, Hospital Facilities Authority Refunding Rev. (Terwilliger Plaza - Parkview Project), “B-2”, 0.95%, 6/01/2027 | 1,170,000 | 1,001,539 | ||
| Multnomah County, OR, Hospital Facilities Authority Refunding Rev., Taxable (Terwilliger Plaza - Parkview Project), “C”, 1.25%, 6/01/2026 | 560,000 | 497,689 | ||
| Issuer | Shares/Par | Value ($) | ||
| Municipal Bonds - continued | ||||
| Oregon - continued | ||||
| Oregon Facilities Authority Rev. (Samaritan Health Services Project), “A”, 5%, 10/01/2024 | $ | 200,000 | $204,078 | |
| Oregon Facilities Authority Rev. (Samaritan Health Services Project), “A”, 5%, 10/01/2025 | 225,000 | 230,742 | ||
| Oregon Facilities Authority Rev. (Samaritan Health Services Project), “A”, 5%, 10/01/2026 | 150,000 | 154,949 | ||
| Oregon Facilities Authority Rev. (Samaritan Health Services Project), “A”, 5%, 10/01/2027 | 125,000 | 128,859 | ||
| Oregon Facilities Authority Rev. (Samaritan Health Services Project), “A”, 5%, 10/01/2028 | 150,000 | 154,912 | ||
| Oregon Facilities Authority Rev. (Samaritan Health Services Project), “A”, 5%, 10/01/2029 | 300,000 | 310,021 | ||
| Oregon Facilities Authority Rev. (Samaritan Health Services Project), “A”, 5%, 10/01/2030 | 300,000 | 310,381 | ||
| Oregon Housing & Community Services Department, Housing Development Rev. (Westwind Apartments Project), “H”, HUD Section 8, 0.25%, 3/01/2024 (Put Date 3/01/2023) | 3,500,000 | 3,456,099 | ||
| Oregon Housing & Community Services Department, Multi-Family Housing Rev. (Plaza Los Amigos Apartments Project, “T-2”, 3%, 2/01/2026 (Put Date 2/01/2025) | 2,375,000 | 2,270,597 | ||
| Port of Portland, OR, International Airport Rev., “24B”, 5%, 7/01/2024 | 1,500,000 | 1,523,081 | ||
| Port of Portland, OR, International Airport Rev., “24B”, 5%, 7/01/2025 | 1,000,000 | 1,023,526 | ||
| Port of Portland, OR, International Airport Rev., “28”, 5%, 7/01/2030 | 10,945,000 | 11,271,254 | ||
| Union County, OR, Hospital Facility Authority Rev. (Grande Ronde Hospital Project), 5%, 7/01/2024 | 125,000 | 126,742 | ||
| Union County, OR, Hospital Facility Authority Rev. (Grande Ronde Hospital Project), 5%, 7/01/2027 | 425,000 | 433,444 | ||
| Union County, OR, Hospital Facility Authority Rev. (Grande Ronde Hospital Project), 5%, 7/01/2029 | 400,000 | 407,262 | ||
| Union County, OR, Hospital Facility Authority Rev. (Grande Ronde Hospital Project), 5%, 7/01/2030 | 300,000 | 305,055 | ||
| Union County, OR, Hospital Facility Authority Rev. (Grande Ronde Hospital Project) , 5%, 7/01/2025 | 125,000 | 127,119 | ||
| Yamhill County, OR, Hospital Authority Rev. (Friendsview), “B-2”, 2.125%, 11/15/2027 | 200,000 | 174,432 | ||
| Yamhill County, OR, Hospital Authority Rev. (Friendsview), “B-3”, 1.75%, 11/15/2026 | 265,000 | 240,203 | ||
| $28,076,185 | ||||
| Issuer | Shares/Par | Value ($) | ||
| Municipal Bonds - continued | ||||
| Pennsylvania - 8.8% | ||||
| Allegheny County, PA, Hospital Development Authority Rev. (Allegheny Health Network Obligated Group), “A”, 5%, 4/01/2026 | $ | 2,750,000 | $2,857,334 | |
| Allegheny County, PA, Sanitary Authority Sewer Rev., “A”, 4%, 6/01/2024 | 300,000 | 303,260 | ||
| Allegheny County, PA, Sanitary Authority Sewer Rev., “A”, 4%, 6/01/2025 | 150,000 | 152,376 | ||
| Allegheny County, PA, Sanitary Authority Sewer Rev., “B”, 5%, 6/01/2027 | 500,000 | 534,097 | ||
| Allegheny County, PA, Sanitary Authority Sewer Rev., “B”, 5%, 6/01/2029 | 225,000 | 244,305 | ||
| Allentown, PA, City School District, BAM, 5%, 2/01/2026 | 4,155,000 | 4,341,021 | ||
| Allentown, PA, City School District, BAM, 5%, 2/01/2027 | 4,375,000 | 4,606,221 | ||
| Allentown, PA, Neighborhood Improvement Zone Development Authority Tax Refunding Rev., 5%, 5/01/2024 | 150,000 | 151,890 | ||
| Allentown, PA, Neighborhood Improvement Zone Development Authority Tax Refunding Rev., 5%, 5/01/2025 | 500,000 | 504,263 | ||
| Allentown, PA, Neighborhood Improvement Zone Development Authority Tax Refunding Rev., 5%, 5/01/2026 | 490,000 | 494,670 | ||
| Altoona, PA, Area School District, Taxable, AGM, 0.38%, 12/01/2022 | 605,000 | 602,997 | ||
| Altoona, PA, Area School District, Taxable, AGM, 0.49%, 12/01/2023 | 1,000,000 | 954,133 | ||
| Altoona, PA, Area School District, Taxable, AGM, 0.733%, 12/01/2024 | 1,105,000 | 1,014,059 | ||
| Altoona, PA, Area School District, Taxable, AGM, 1.005%, 12/01/2025 | 900,000 | 798,061 | ||
| Altoona, PA, Sewer Rev., AGM, 5%, 12/01/2027 | 500,000 | 533,933 | ||
| Athens, PA, School District Rev., BAM, 4%, 4/15/2026 | 1,465,000 | 1,487,949 | ||
| Athens, PA, School District Rev., BAM, 4%, 4/15/2027 | 1,070,000 | 1,090,856 | ||
| Beaver County, PA, Big Beaver Falls School District Rev., BAM, 5%, 3/15/2025 | 1,325,000 | 1,367,557 | ||
| Beaver County, PA, Big Beaver Falls School District Rev., BAM, 5%, 3/15/2026 | 1,380,000 | 1,441,220 | ||
| Beaver County, PA, Big Beaver Falls School District Rev., BAM, 5%, 3/15/2027 | 1,460,000 | 1,532,484 | ||
| Beaver County, PA, General Obligation, BAM, 4%, 11/15/2023 | 655,000 | 659,142 | ||
| Beaver County, PA, General Obligation, BAM, 4%, 11/15/2027 | 500,000 | 508,635 | ||
| Beaver County, PA, General Obligation, BAM, 4%, 11/15/2028 | 535,000 | 543,267 | ||
| Beaver County, PA, Rochester Area School District, BAM, 2%, 5/01/2023 | 500,000 | 494,944 | ||
| Beaver County, PA, Rochester Area School District, BAM, 1%, 5/01/2024 | 200,000 | 189,225 | ||
| Issuer | Shares/Par | Value ($) | ||
| Municipal Bonds - continued | ||||
| Pennsylvania - continued | ||||
| Beaver County, PA, Rochester Area School District, BAM, 3%, 5/01/2025 | $ | 500,000 | $486,133 | |
| Berks County, PA, Industrial Development Authority Health System Rev. (Tower Health Project), 5%, 11/01/2023 | 500,000 | 487,707 | ||
| Berks County, PA, Industrial Development Authority Health System Rev. (Tower Health Project), 5%, 11/01/2024 | 400,000 | 382,142 | ||
| Berks County, PA, Industrial Development Authority Health System Rev. (Tower Health Project), 5%, 11/01/2025 | 1,950,000 | 1,818,133 | ||
| Berks County, PA, Industrial Development Authority Health System Rev. (Tower Health Project), 5%, 11/01/2026 | 200,000 | 182,488 | ||
| Berks County, PA, Industrial Development Authority Health System Rev. (Tower Health Project), 5%, 11/01/2027 | 465,000 | 412,310 | ||
| Berks County, PA, Industrial Development Authority Health System Rev. (Tower Health Project), 5%, 11/01/2028 | 855,000 | 740,934 | ||
| Berks County, PA, Industrial Development Authority Health System Rev. (Tower Health Project), 5%, 11/01/2029 | 1,620,000 | 1,372,674 | ||
| Berks County, PA, Municipal Authority Rev. (Tower Health Project), “A”, 5%, 2/01/2024 | 435,000 | 422,640 | ||
| Berks County, PA, Municipal Authority Rev. (Tower Health Project), “A”, 5%, 2/01/2025 | 565,000 | 535,646 | ||
| Berks County, PA, Municipal Authority Rev. (Tower Health Project), “A”, 5%, 2/01/2026 | 1,000,000 | 927,169 | ||
| Berks County, PA, Municipal Authority Rev. (Tower Health Project), “A”, 5%, 2/01/2027 | 1,100,000 | 992,884 | ||
| Berks County, PA, Municipal Authority Rev. (Tower Health Project), “B-2”, 5%, 2/01/2040 (Put Date 2/01/2027) | 5,545,000 | 4,955,144 | ||
| Berks County, PA, Reading School District, “A”, BAM, 4%, 4/01/2024 | 615,000 | 618,602 | ||
| Berks County, PA, Reading School District, “A”, BAM, 4%, 4/01/2025 | 1,000,000 | 1,009,411 | ||
| Berks County, PA, Reading School District, “B”, BAM, 4%, 4/01/2024 | 1,200,000 | 1,207,028 | ||
| Berks County, PA, Reading School District, “B”, BAM, 4%, 4/01/2025 | 1,680,000 | 1,695,810 | ||
| Berks County, PA, Reading School District, “C”, BAM, 5%, 4/01/2023 | 720,000 | 724,420 | ||
| Berks County, PA, Reading School District, “D”, BAM, 5%, 4/01/2025 | 8,395,000 | 8,663,548 | ||
| Charleroi, PA, Area School District, BAM, 4%, 11/15/2026 | 1,110,000 | 1,128,631 | ||
| Charleroi, PA, Area School District, BAM, 4%, 11/15/2028 | 250,000 | 254,541 | ||
| Chester County, PA, Health & Education Facilities Authority Rev. (Simpson Senior Services Project), 4%, 12/01/2025 | 360,000 | 338,850 | ||
| Issuer | Shares/Par | Value ($) | ||
| Municipal Bonds - continued | ||||
| Pennsylvania - continued | ||||
| Chester County, PA, Health & Education Facilities Authority Rev. (Simpson Senior Services Project), 4%, 12/01/2026 | $ | 755,000 | $697,680 | |
| Chester County, PA, Health & Education Facilities Authority Rev. (Simpson Senior Services Project), 4%, 12/01/2027 | 795,000 | 720,052 | ||
| Chester County, PA, Health & Education Facilities Authority Rev. (Simpson Senior Services Project), 4%, 12/01/2028 | 830,000 | 733,219 | ||
| Chester County, PA, Health & Education Facilities Authority Rev. (Simpson Senior Services Project), 4%, 12/01/2029 | 865,000 | 748,683 | ||
| Chester County, PA, Health & Education Facilities Authority Rev. (Simpson Senior Services Project), 4%, 12/01/2030 | 450,000 | 381,643 | ||
| Commonwealth of Pennsylvania, AGM, 5%, 9/15/2025 | 9,000,000 | 9,432,746 | ||
| Commonwealth of Pennsylvania, AGM, 5%, 9/15/2026 | 6,035,000 | 6,416,391 | ||
| Commonwealth of Pennsylvania Financing Authority Rev., “B”, 5%, 6/01/2025 | 675,000 | 698,478 | ||
| Commonwealth of Pennsylvania Financing Authority Rev., “B”, 5%, 6/01/2026 | 185,000 | 193,669 | ||
| Commonwealth of Pennsylvania, Tobacco Master Settlement Financing Authority Rev., 5%, 6/01/2027 | 3,000,000 | 3,117,990 | ||
| Connellsville, PA, Area School District General Obligation, AGM, 4%, 11/15/2024 | 530,000 | 535,181 | ||
| Connellsville, PA, Area School District General Obligation, AGM, 4%, 11/15/2028 | 1,010,000 | 1,018,529 | ||
| Connellsville, PA, Area School District General Obligation, AGM, 4%, 11/15/2029 | 1,040,000 | 1,048,850 | ||
| Connellsville, PA, Area School District General Obligation, AGM, 4%, 11/15/2030 | 500,000 | 502,514 | ||
| Cumberland County, PA, Municipal Authority Rev. (Diakon Lutheran Social Ministries), 5%, 1/01/2023 | 375,000 | 375,514 | ||
| Cumberland County, PA, Municipal Authority Rev. (Diakon Lutheran Social Ministries), ETM, 5%, 1/01/2023 | 100,000 | 100,294 | ||
| Cumberland County, PA, Municipal Authority Rev. (Diakon Lutheran Social Ministries), ETM, 5%, 1/01/2023 | 255,000 | 255,750 | ||
| Dallas, PA, Municipal Authority, University Rev. (Misericordia University Project), 3.25%, 5/01/2023 | 50,000 | 49,498 | ||
| Dallas, PA, Municipal Authority, University Rev. (Misericordia University Project), 5%, 5/01/2029 | 1,000,000 | 966,342 | ||
| Delaware County, PA, Chichester School District General Obligation, AGM, 4%, 9/15/2029 | 900,000 | 917,641 | ||
| Delaware Valley, PA, Regional Finance Authority, “A”, 2%, 10/01/2029 | 4,550,000 | 3,840,370 | ||
| East Allegheny, PA, School District General Obligation, BAM, 4%, 6/01/2024 | 1,125,000 | 1,133,596 | ||
| Issuer | Shares/Par | Value ($) | ||
| Municipal Bonds - continued | ||||
| Pennsylvania - continued | ||||
| East Allegheny, PA, School District General Obligation, BAM, 4%, 6/01/2025 | $ | 880,000 | $891,112 | |
| East Allegheny, PA, School District General Obligation, BAM, 4%, 6/01/2026 | 935,000 | 949,500 | ||
| East Allegheny, PA, School District General Obligation, BAM, 4%, 6/01/2027 | 950,000 | 966,142 | ||
| East Allegheny, PA, School District General Obligation, BAM, 4%, 6/01/2028 | 650,000 | 661,482 | ||
| East Allegheny, PA, School District General Obligation, BAM, 3%, 6/01/2029 | 800,000 | 750,578 | ||
| Erie, PA, City School District General Obligation, “A”, AGM, 5%, 4/01/2027 | 1,075,000 | 1,131,084 | ||
| Erie, PA, City School District General Obligation, “A”, AGM, 5%, 4/01/2030 | 855,000 | 924,860 | ||
| Erie, PA, City School District General Obligation, “A”, AGM, 5%, 4/01/2031 | 525,000 | 566,770 | ||
| Erie, PA, City School District General Obligation, “B”, AGM, 5%, 4/01/2024 | 230,000 | 234,426 | ||
| Erie, PA, City School District General Obligation, “B”, AGM, 5%, 4/01/2025 | 475,000 | 490,528 | ||
| Erie, PA, City School District General Obligation, “B”, AGM, 5%, 4/01/2026 | 195,000 | 203,756 | ||
| Erie, PA, City School District General Obligation, “C”, AGM, 5%, 4/01/2024 | 275,000 | 280,292 | ||
| Erie, PA, City School District General Obligation, “C”, AGM, 5%, 4/01/2026 | 980,000 | 1,024,002 | ||
| Erie, PA, City School District General Obligation, “C”, AGM, 5%, 4/01/2027 | 2,135,000 | 2,246,386 | ||
| Erie, PA, City School District General Obligation, “C”, AGM, 5%, 4/01/2029 | 2,605,000 | 2,789,930 | ||
| Erie, PA, City School District General Obligation, “C”, AGM, 5%, 4/01/2030 | 425,000 | 459,726 | ||
| Erie, PA, Water Authority, Water Rev., “D”, BAM, 5%, 12/01/2027 | 625,000 | 667,416 | ||
| Fayette County, PA, Laurel Highlands School District, General Obligation , BAM, 4%, 2/01/2023 | 325,000 | 325,381 | ||
| Fayette County, PA, Laurel Highlands School District, General Obligation , BAM, 4%, 2/01/2024 | 320,000 | 321,603 | ||
| Fayette County, PA, Laurel Highlands School District, General Obligation , BAM, 4%, 2/01/2025 | 350,000 | 353,783 | ||
| Fayette County, PA, Laurel Highlands School District, General Obligation , BAM, 4%, 2/01/2026 | 945,000 | 958,873 | ||
| Fayette County, PA, Laurel Highlands School District, General Obligation , BAM, 4%, 2/01/2028 | 1,100,000 | 1,121,728 | ||
| Issuer | Shares/Par | Value ($) | ||
| Municipal Bonds - continued | ||||
| Pennsylvania - continued | ||||
| Fayette County, PA, Laurel Highlands School District, General Obligation , BAM, 3%, 2/01/2030 | $ | 675,000 | $628,934 | |
| Fayette County, PA, Laurel Highlands School District, Unlimited Tax General Obligation, “A”, BAM, 4%, 2/01/2026 | 350,000 | 354,379 | ||
| Lancaster County, PA, Hospital Authority Health Center Rev. (Masonic Villages Project), 5%, 11/01/2022 | 320,000 | 320,000 | ||
| Lancaster County, PA, Hospital Authority Health Center Rev. (Masonic Villages Project), 5%, 11/01/2023 | 375,000 | 378,847 | ||
| Lancaster County, PA, Hospital Authority Health Center Rev. (Masonic Villages Project), 5%, 11/01/2024 | 700,000 | 712,551 | ||
| Lancaster County, PA, Hospital Authority Health Center Rev. (Masonic Villages Project), 5%, 11/01/2025 | 265,000 | 270,338 | ||
| Lancaster County, PA, Pequea Valley School District, 2%, 5/15/2023 | 175,000 | 173,295 | ||
| Lancaster County, PA, Pequea Valley School District, 3%, 5/15/2024 | 225,000 | 222,541 | ||
| Lancaster County, PA, Pequea Valley School District, 1.5%, 5/15/2025 | 125,000 | 115,229 | ||
| Lancaster County, PA, Pequea Valley School District, 4%, 5/15/2025 | 100,000 | 101,295 | ||
| Lancaster County, PA, Pequea Valley School District, 1.5%, 5/15/2026 | 150,000 | 134,100 | ||
| Lancaster County, PA, Pequea Valley School District, 4%, 5/15/2026 | 75,000 | 76,234 | ||
| Lancaster, PA, Higher Education Authority College Rev. (Harrisburg Area Community College Project), BAM, 5%, 10/01/2024 | 465,000 | 478,116 | ||
| Lancaster, PA, Higher Education Authority College Rev. (Harrisburg Area Community College Project), BAM, 5%, 10/01/2025 | 630,000 | 655,390 | ||
| Lancaster, PA, Higher Education Authority College Rev. (Harrisburg Area Community College Project), BAM, 5%, 10/01/2026 | 820,000 | 861,584 | ||
| Lancaster, PA, Higher Education Authority College Rev. (Harrisburg Area Community College Project), BAM, 5%, 10/01/2027 | 1,000,000 | 1,059,482 | ||
| Lancaster, PA, Higher Education Authority College Rev. (Harrisburg Area Community College Project), BAM, 5%, 10/01/2028 | 705,000 | 751,911 | ||
| Lancaster, PA, Higher Education Authority College Rev. (Harrisburg Area Community College Project), BAM, 4%, 10/01/2030 | 450,000 | 450,534 | ||
| Lancaster, PA, Higher Education Authority College Rev. (Harrisburg Area Community College Project), BAM, 4%, 10/01/2031 | 500,000 | 497,951 | ||
| Lancaster, PA, Parking Rev., “A”, BAM, 4%, 9/01/2023 | 770,000 | 772,765 | ||
| Lancaster, PA, Parking Rev., “A”, BAM, 4%, 9/01/2024 | 1,015,000 | 1,023,912 | ||
| Lancaster, PA, Parking Rev., “A”, BAM, 4%, 9/01/2025 | 525,000 | 532,134 | ||
| Lancaster, PA, Parking Rev., “A”, BAM, 3%, 12/01/2025 | 500,000 | 481,817 | ||
| Lancaster, PA, Parking Rev., “A”, BAM, 4%, 9/01/2026 | 550,000 | 558,662 | ||
| Issuer | Shares/Par | Value ($) | ||
| Municipal Bonds - continued | ||||
| Pennsylvania - continued | ||||
| Lancaster, PA, Parking Rev., “A”, BAM, 4%, 9/01/2027 | $ | 570,000 | $580,620 | |
| Lancaster, PA, Parking Rev., “A”, BAM, 4%, 9/01/2028 | 595,000 | 605,693 | ||
| Lancaster, PA, Parking Rev., “A”, BAM, 3%, 12/01/2028 | 1,315,000 | 1,212,240 | ||
| Lancaster, PA, Parking Rev., “A”, BAM, 4%, 9/01/2029 | 410,000 | 415,748 | ||
| Lancaster, PA, Parking Rev., “A”, BAM, 3%, 12/01/2029 | 525,000 | 475,991 | ||
| Lancaster, PA, Parking Rev., “A”, BAM, 4%, 9/01/2030 | 425,000 | 431,302 | ||
| Lancaster, PA, Parking Rev., “A”, BAM, 4%, 9/01/2031 | 440,000 | 444,641 | ||
| Lancaster, PA, Parking Rev., “A”, BAM, 4%, 9/01/2032 | 460,000 | 462,625 | ||
| Lancaster, PA, School District General Obligation, “B”, AGM, 4%, 6/01/2023 | 450,000 | 451,710 | ||
| Lawrence County, PA, New Castle Area School District, General Obligation, BAM, 3%, 3/01/2023 | 1,000,000 | 998,214 | ||
| Lawrence County, PA, New Castle Area School District, General Obligation, BAM, 4%, 3/01/2024 | 500,000 | 503,294 | ||
| Lawrence County, PA, New Castle Area School District, General Obligation, BAM, 4%, 3/01/2025 | 805,000 | 813,973 | ||
| Lawrence County, PA, New Castle Area School District, General Obligation, BAM, 4%, 3/01/2027 | 500,000 | 508,901 | ||
| Lawrence County, PA, New Castle Area School District, General Obligation, BAM, 4%, 3/01/2028 | 500,000 | 509,814 | ||
| Lawrence County, PA, New Castle Area School District, General Obligation, BAM, 3%, 3/01/2029 | 500,000 | 468,827 | ||
| Lawrence County, PA, New Castle Area School District, General Obligation, BAM, 3%, 3/01/2030 | 500,000 | 463,651 | ||
| Lehigh County, PA, Industrial Development Authority, Pollution Control Rev. (PPL Electric Utilities Corporation Project), “A”, 3%, 9/01/2029 | 8,000,000 | 7,370,542 | ||
| Lehigh County, PA, Water & Sewer Authority Rev. (Allentown Concession), Capital Appreciation, “B”, 0%, 12/01/2022 | 1,345,000 | 1,340,853 | ||
| Lehigh County, PA, Water & Sewer Authority Rev. (Allentown Concession), Capital Appreciation, “B”, 0%, 12/01/2023 | 1,060,000 | 1,015,222 | ||
| Luzerne County, PA, “A”, AGM, 5%, 12/15/2023 | 400,000 | 406,840 | ||
| Luzerne County, PA, “A”, AGM, 5%, 12/15/2024 | 410,000 | 421,864 | ||
| Luzerne County, PA, “A”, AGM, 5%, 12/15/2026 | 370,000 | 389,624 | ||
| Luzerne County, PA, “A”, AGM, 5%, 12/15/2029 | 930,000 | 995,273 | ||
| Luzerne County, PA, Industrial Development Authority, Tax Exempt Guaranteed Lease Rev., AGM, 5%, 12/15/2025 | 1,000,000 | 1,041,380 | ||
| Luzerne County, PA, Wilkes-Barre Area School District, General Obligation, “B”, BAM, 5%, 8/01/2028 | 1,540,000 | 1,630,247 | ||
| Luzerne, Carbon and Schuylkill Counties, PA, Hazleton Area School District, General Obligation, “A”, AGM, 2%, 3/01/2029 | 1,135,000 | 990,342 | ||
| Issuer | Shares/Par | Value ($) | ||
| Municipal Bonds - continued | ||||
| Pennsylvania - continued | ||||
| Luzerne, Carbon and Schuylkill Counties, PA, Hazleton Area School District, General Obligation, Taxable, “B”, AGM, 1.039%, 3/01/2025 | $ | 515,000 | $470,514 | |
| Luzerne, Carbon and Schuylkill Counties, PA, Hazleton Area School District, General Obligation, Taxable, “B”, AGM, 1.229%, 3/01/2026 | 1,250,000 | 1,103,522 | ||
| Luzerne, Carbon and Schuylkill Counties, PA, Hazleton Area School District, General Obligation, Taxable, “B”, AGM, 1.47%, 3/01/2027 | 1,000,000 | 857,271 | ||
| Lycoming County, PA, College Rev. (Pennsylvania College of Technology), “A”, BAM, 5%, 7/01/2024 | 1,000,000 | 1,022,185 | ||
| Lycoming County, PA, College Rev. (Pennsylvania College of Technology), “A”, BAM, 5%, 7/01/2025 | 500,000 | 516,357 | ||
| Lycoming County, PA, College Rev. (Pennsylvania College of Technology), “A”, BAM, 5%, 7/01/2026 | 600,000 | 626,172 | ||
| Monroeville, PA, Finance Authority University of Pittsburgh Medical Centry Rev., “B”, 5%, 2/15/2024 | 1,115,000 | 1,136,020 | ||
| Monroeville, PA, Finance Authority University of Pittsburgh Medical Centry Rev., “B”, 5%, 2/15/2028 | 1,600,000 | 1,687,731 | ||
| Montgomery County, PA, Higher Education & Health Authority Rev. (AICUP Financing Program - Gwynedd Mercy University Project), 4%, 5/01/2036 (Put Date 5/01/2023) | 1,145,000 | 1,147,115 | ||
| Montgomery County, PA, Higher Education & Health Authority Rev. (Thomas Jefferson University), 5%, 9/01/2029 | 1,000,000 | 1,056,042 | ||
| Montgomery County, PA, Higher Education & Health Authority Rev. (Thomas Jefferson University), 5%, 9/01/2030 | 1,350,000 | 1,422,358 | ||
| Montgomery County, PA, Higher Education & Health Authority Rev. (Thomas Jefferson University), 5%, 9/01/2031 | 2,355,000 | 2,471,539 | ||
| Northampton and Lehigh Counties, PA, Bethlehem Area School District, “A”, 5%, 2/01/2025 | 4,575,000 | 4,742,870 | ||
| Pennsylvania Economic Development Financing Authority, Sewage Sludge Disposal Refunding Rev. (Philadelphia Biosolids Facility Project), 3%, 1/01/2024 | 865,000 | 857,765 | ||
| Pennsylvania Economic Development Financing Authority, Sewage Sludge Disposal Refunding Rev. (Philadelphia Biosolids Facility Project), 4%, 1/01/2026 | 110,000 | 108,883 | ||
| Pennsylvania Economic Development Financing Authority, Solid Waste Disposal Rev. (Republic Services, Inc. Project), “B-2”, 2.35%, 4/01/2049 (Put Date 1/17/2023) | 5,780,000 | 5,759,299 | ||
| Pennsylvania Economic Development Financing Authority, Solid Waste Disposal Rev. (Waste Management, Inc. Project), “A”, 0.58%, 8/01/2037 (Put Date 8/01/2024) | 1,145,000 | 1,068,374 | ||
| Issuer | Shares/Par | Value ($) | ||
| Municipal Bonds - continued | ||||
| Pennsylvania - continued | ||||
| Pennsylvania Higher Educational Assistance Agency, Education Loan Rev., “A”, 5%, 6/01/2026 | $ | 2,050,000 | $2,097,580 | |
| Pennsylvania Higher Educational Assistance Agency, Education Loan Rev., “A”, 5%, 6/01/2026 | 475,000 | 486,025 | ||
| Pennsylvania Higher Educational Assistance Agency, Education Loan Rev., “A”, 5%, 6/01/2027 | 2,700,000 | 2,748,532 | ||
| Pennsylvania Higher Educational Assistance Agency, Education Loan Rev., “A”, 5%, 6/01/2027 | 350,000 | 356,291 | ||
| Pennsylvania Higher Educational Assistance Agency, Education Loan Rev., “A”, 5%, 6/01/2028 | 550,000 | 559,119 | ||
| Pennsylvania Higher Educational Assistance Agency, Education Loan Rev., “A”, 5%, 6/01/2029 | 230,000 | 233,635 | ||
| Pennsylvania Higher Educational Assistance Agency, Education Loan Rev., “A”, 5%, 6/01/2029 | 3,590,000 | 3,646,742 | ||
| Pennsylvania Higher Educational Facilities Authority Rev. (Drexel University), “A”, AGM, 5%, 5/01/2023 | 540,000 | 544,726 | ||
| Pennsylvania Higher Educational Facilities Authority Rev. (Drexel University), “A”, AGM, 5%, 5/01/2024 | 340,000 | 347,309 | ||
| Pennsylvania Higher Educational Facilities Authority Rev. (Drexel University), “A”, AGM, 5%, 5/01/2025 | 350,000 | 361,143 | ||
| Pennsylvania Higher Educational Facilities Authority Rev. (Drexel University), “A”, AGM, 5%, 5/01/2026 | 550,000 | 573,414 | ||
| Pennsylvania Higher Educational Facilities Authority Rev. (Drexel University), “A”, AGM, 5%, 5/01/2028 | 825,000 | 873,415 | ||
| Pennsylvania Higher Educational Facilities Authority Rev. (Drexel University), “A”, AGM, 5%, 5/01/2029 | 1,500,000 | 1,598,717 | ||
| Pennsylvania Higher Educational Facilities Authority Rev. (Trustees of the University of Pennsylvania), “A”, 5%, 2/15/2023 | 475,000 | 477,528 | ||
| Pennsylvania Higher Educational Facilities Authority Rev. (Trustees of the University of Pennsylvania), “A”, 5%, 2/15/2024 | 750,000 | 766,993 | ||
| Pennsylvania Housing Finance Agency, Single Family Mortgage Rev., “128A”, 2.8%, 4/01/2024 | 1,110,000 | 1,095,743 | ||
| Pennsylvania Housing Finance Agency, Single Family Mortgage Rev., “128A”, 4.75%, 4/01/2033 | 5,800,000 | 5,776,422 | ||
| Pennsylvania Housing Finance Agency, Single Family Mortgage Rev., “133”, 5%, 10/01/2025 | 750,000 | 779,172 | ||
| Pennsylvania Housing Finance Agency, Single Family Mortgage Rev., “133”, 5%, 10/01/2026 | 740,000 | 777,527 | ||
| Pennsylvania Housing Finance Agency, Single Family Mortgage Rev., “133”, 5%, 4/01/2028 | 950,000 | 1,008,857 | ||
| Pennsylvania Housing Finance Agency, Single Family Mortgage Rev., “133”, 5%, 4/01/2029 | 100,000 | 105,929 | ||
| Issuer | Shares/Par | Value ($) | ||
| Municipal Bonds - continued | ||||
| Pennsylvania - continued | ||||
| Pennsylvania Housing Finance Agency, Single Family Mortgage Rev., “133”, 5%, 10/01/2029 | $ | 450,000 | $478,242 | |
| Pennsylvania Housing Finance Agency, Single Family Mortgage Rev., “135B”, 5%, 4/01/2023 | 515,000 | 518,225 | ||
| Pennsylvania Housing Finance Agency, Single Family Mortgage Rev., “135B”, 5%, 10/01/2023 | 1,025,000 | 1,037,622 | ||
| Pennsylvania Housing Finance Agency, Single Family Mortgage Rev., “135B”, 5%, 4/01/2024 | 485,000 | 491,988 | ||
| Pennsylvania Housing Finance Agency, Single Family Mortgage Rev., “135B”, 5%, 10/01/2024 | 805,000 | 820,220 | ||
| Pennsylvania Housing Finance Agency, Single Family Mortgage Rev., “135B”, 5%, 4/01/2025 | 575,000 | 587,780 | ||
| Pennsylvania Housing Finance Agency, Single Family Mortgage Rev., “135B”, 5%, 10/01/2025 | 1,090,000 | 1,117,213 | ||
| Pennsylvania Housing Finance Agency, Single Family Mortgage Rev., “135B”, 5%, 4/01/2026 | 1,105,000 | 1,136,706 | ||
| Pennsylvania Housing Finance Agency, Single Family Mortgage Rev., “135B”, 5%, 10/01/2026 | 2,250,000 | 2,322,587 | ||
| Pennsylvania Housing Finance Agency, Single Family Mortgage Rev., “135B”, 5%, 4/01/2027 | 2,285,000 | 2,366,532 | ||
| Pennsylvania Housing Finance Agency, Single Family Mortgage Rev., “135B”, 5%, 10/01/2027 | 2,120,000 | 2,202,584 | ||
| Pennsylvania Housing Finance Agency, Single Family Mortgage Rev., “116A”, 3%, 4/01/2023 | 525,000 | 523,373 | ||
| Pennsylvania Housing Finance Agency, Single Family Mortgage Rev., “125A”, 3.2%, 10/01/2028 | 3,550,000 | 3,297,739 | ||
| Pennsylvania Public School Building Authority, College Rev. (Northampton County Area Community College Project), BAM, 5%, 6/15/2023 | 175,000 | 176,808 | ||
| Pennsylvania Public School Building Authority, College Rev. (Northampton County Area Community College Project), BAM, 5%, 6/15/2024 | 320,000 | 327,485 | ||
| Pennsylvania Public School Building Authority, College Rev. (Northampton County Area Community College Project), BAM, 5%, 6/15/2025 | 375,000 | 387,651 | ||
| Pennsylvania Public School Building Authority, College Rev. (Northampton County Area Community College Project), BAM, 5%, 6/15/2026 | 460,000 | 480,170 | ||
| Pennsylvania Public School Building Authority, College Rev. (Northampton County Area Community College Project), BAM, 5%, 6/15/2027 | 325,000 | 341,923 | ||
| Issuer | Shares/Par | Value ($) | ||
| Municipal Bonds - continued | ||||
| Pennsylvania - continued | ||||
| Pennsylvania Public School Building Authority, College Rev. (Northampton County Area Community College Project), BAM, 5%, 6/15/2028 | $ | 545,000 | $578,379 | |
| Pennsylvania Public School Building Authority, College Rev. (Northampton County Community College), BAM, 5%, 3/01/2023 | 500,000 | 502,710 | ||
| Pennsylvania Public School Building Authority, College Rev. (Northampton County Community College), BAM, 5%, 3/01/2024 | 560,000 | 571,857 | ||
| Pennsylvania Public School Building Authority, College Rev. (Northampton County Community College), BAM, 5%, 3/01/2025 | 675,000 | 695,428 | ||
| Pennsylvania Public School Building Authority, College Rev. (Northampton County Community College), BAM, 5%, 3/01/2026 | 800,000 | 832,564 | ||
| Pennsylvania Public School Building Authority, College Rev. (Northampton County Community College), BAM, 5%, 3/01/2027 | 715,000 | 750,221 | ||
| Pennsylvania Public School Building Authority, College Rev. (Northampton County Community College), BAM, 5%, 3/01/2028 | 750,000 | 794,006 | ||
| Pennsylvania Public School Building Authority, College Rev. (Northampton County Community College), BAM, 4%, 3/01/2029 | 850,000 | 857,655 | ||
| Pennsylvania Public School Building Authority, College Rev. (Northampton County Community College), BAM, 4%, 3/01/2030 | 640,000 | 643,307 | ||
| Pennsylvania Public School Building Authority, College Rev. (Westmoreland County Community College), AGM, 4%, 10/15/2023 | 280,000 | 281,905 | ||
| Pennsylvania Public School Building Authority, College Rev. (Westmoreland County Community College), AGM, 4%, 10/15/2024 | 300,000 | 303,117 | ||
| Pennsylvania Public School Building Authority, College Rev. (Westmoreland County Community College), AGM, 4%, 10/15/2026 | 250,000 | 253,965 | ||
| Pennsylvania Public School Building Authority, College Rev. (Westmoreland County Community College), AGM, 4%, 10/15/2027 | 480,000 | 488,920 | ||
| Philadelphia, PA, Authority for Industrial Development Charter School Rev. (Green Woods Charter School Project), “A”, 5%, 6/15/2032 | 240,000 | 225,980 | ||
| Philadelphia, PA, Authority for Industrial Development City Agreement Rev. (Cultural and Commercial Corridors Program), “A”, 5%, 12/01/2024 | 5,675,000 | 5,836,447 | ||
| Philadelphia, PA, School District, 5%, 9/01/2023 | 2,500,000 | 2,530,673 | ||
| Philadelphia, PA, School District, “A”, 5%, 9/01/2023 | 1,050,000 | 1,062,883 | ||
| Philadelphia, PA, School District, “A”, 5%, 9/01/2025 | 1,000,000 | 1,032,683 | ||
| Philadelphia, PA, School District, “A”, 5%, 9/01/2026 | 635,000 | 659,666 | ||
| Philadelphia, PA, School District, “A”, 5%, 9/01/2026 | 1,370,000 | 1,423,217 | ||
| Philadelphia, PA, School District, “A”, 5%, 9/01/2027 | 1,850,000 | 1,925,149 | ||
| Issuer | Shares/Par | Value ($) | ||
| Municipal Bonds - continued | ||||
| Pennsylvania - continued | ||||
| Philadelphia, PA, School District, “F”, 5%, 9/01/2026 | $ | 5,000,000 | $5,194,221 | |
| Pittsburgh and Allegheny County, PA, Sports & Exhibition Authority Regional Asset District Sales Tax Rev., AGM, 4%, 2/01/2025 | 1,870,000 | 1,881,356 | ||
| Pittsburgh and Allegheny County, PA, Sports & Exhibition Authority Regional Asset District Sales Tax Rev., AGM, 5%, 2/01/2026 | 2,000,000 | 2,090,791 | ||
| Pittsburgh and Allegheny County, PA, Sports & Exhibition Authority Regional Asset District Sales Tax Rev., AGM, 5%, 2/01/2027 | 2,250,000 | 2,377,079 | ||
| Pittsburgh and Allegheny County, PA, Sports & Exhibition Authority Regional Asset District Sales Tax Rev., AGM, 5%, 2/01/2028 | 2,590,000 | 2,759,044 | ||
| Pittsburgh and Allegheny County, PA, Sports & Exhibition Authority Regional Asset District Sales Tax Rev., AGM, 5%, 2/01/2029 | 2,750,000 | 2,949,038 | ||
| Pittsburgh and Allegheny County, PA, Sports & Exhibition Authority Regional Asset District Sales Tax Rev., AGM, 5%, 2/01/2030 | 2,925,000 | 3,118,423 | ||
| Pittsburgh and Allegheny, PA, Sports and Exhibition Authority Hotel Room Rev., “B”, AGM, 5%, 2/01/2028 | 2,050,000 | 2,169,731 | ||
| South Wayne County, PA, Water & Sewer Authority Rev., BAM, 2%, 2/15/2023 | 200,000 | 198,838 | ||
| Wayne County, PA, County Guaranteed Hospital Rev. (Wayne Memorial Hospital Project), “A”, 5%, 7/01/2030 | 500,000 | 513,254 | ||
| West Mifflin, PA, Area School District, AGM, 5%, 4/01/2024 | 1,250,000 | 1,274,919 | ||
| West Mifflin, PA, Area School District, AGM, 5%, 4/01/2025 | 1,000,000 | 1,032,691 | ||
| West Mifflin, PA, Area School District, AGM, 5%, 4/01/2027 | 1,000,000 | 1,055,573 | ||
| West Shore, PA, Area Authority Rev. (Messiah Village Project), “A”, 5%, 7/01/2025 | 1,605,000 | 1,606,174 | ||
| Westmoreland County, PA, Burrell School District, BAM, 4%, 7/15/2023 | 805,000 | 809,211 | ||
| Westmoreland County, PA, Burrell School District, BAM, 4%, 7/15/2024 | 745,000 | 749,934 | ||
| Westmoreland County, PA, Burrell School District, BAM, 4%, 7/15/2025 | 750,000 | 760,398 | ||
| Westmoreland County, PA, Burrell School District, BAM, 4%, 7/15/2026 | 1,130,000 | 1,147,655 | ||
| Westmoreland County, PA, Burrell School District, BAM, 4%, 7/15/2027 | 1,170,000 | 1,190,805 | ||
| Westmoreland County, PA, Burrell School District, BAM, 4%, 7/15/2028 | 1,100,000 | 1,119,077 | ||
| Issuer | Shares/Par | Value ($) | ||
| Municipal Bonds - continued | ||||
| Pennsylvania - continued | ||||
| Westmoreland County, PA, Industrial Development Authority Rev. (Redstone Presbyterian Seniorcare Obligated Group), 4%, 5/15/2023 | $ | 280,000 | $278,751 | |
| Westmoreland County, PA, Industrial Development Authority Rev. (Redstone Presbyterian Seniorcare Obligated Group), 4%, 5/15/2024 | 440,000 | 434,520 | ||
| Westmoreland County, PA, Industrial Development Authority Rev. (Redstone Presbyterian Seniorcare Obligated Group), 4%, 5/15/2025 | 625,000 | 611,291 | ||
| Westmoreland County, PA, Industrial Development Authority Rev. (Redstone Presbyterian Seniorcare Obligated Group), 4%, 5/15/2026 | 150,000 | 144,955 | ||
| $273,132,309 | ||||
| Puerto Rico - 1.9% | ||||
| Commonwealth of Puerto Rico Highway & Transportation Authority Rev., “AA-1”, AGM, 4.95%, 7/01/2026 | $ | 1,650,000 | $1,650,540 | |
| Commonwealth of Puerto Rico Highway & Transportation Authority Rev., “L”, NPFG, 5.25%, 7/01/2024 | 740,000 | 739,984 | ||
| Commonwealth of Puerto Rico, General Obligation Restructured Bonds, Series 2022A, 5.625%, 7/01/2029 | 14,750,000 | 14,835,279 | ||
| Commonwealth of Puerto Rico, General Obligation Restructured Bonds, Series 2022A, 5.75%, 7/01/2031 | 1,521,000 | 1,530,138 | ||
| Puerto Rico Aqueduct and Sewer Authority Rev., “A”, 5%, 7/01/2024 | 3,430,000 | 3,419,334 | ||
| Puerto Rico Aqueduct and Sewer Authority Rev., “A”, 5%, 7/01/2025 | 315,000 | 312,966 | ||
| Puerto Rico Aqueduct and Sewer Authority Rev., “A”, 5%, 7/01/2025 (n) | 4,100,000 | 4,073,528 | ||
| Puerto Rico Aqueduct and Sewer Authority Rev., “B”, 5%, 7/01/2025 | 265,000 | 263,289 | ||
| Puerto Rico Electric Power Authority Rev., “DDD”, AGM, 3.625%, 7/01/2023 | 335,000 | 333,240 | ||
| Puerto Rico Electric Power Authority Rev., “DDD”, AGM, 5%, 7/01/2023 | 1,365,000 | 1,390,484 | ||
| Puerto Rico Electric Power Authority Rev., “DDD”, AGM, 3.65%, 7/01/2024 | 3,930,000 | 3,874,528 | ||
| Puerto Rico Electric Power Authority Rev., “NN”, NPFG, 5.25%, 7/01/2023 | 435,000 | 435,361 | ||
| Puerto Rico Electric Power Authority Rev., “PP”, NPFG, 5%, 7/01/2024 | 110,000 | 109,732 | ||
| Puerto Rico Electric Power Authority Rev., “PP”, NPFG, 5%, 7/01/2025 | 115,000 | 114,390 | ||
| Issuer | Shares/Par | Value ($) | ||
| Municipal Bonds - continued | ||||
| Puerto Rico - continued | ||||
| Puerto Rico Electric Power Authority Rev., “RR”, NPFG, 5%, 7/01/2023 | $ | 370,000 | $369,616 | |
| Puerto Rico Electric Power Authority Rev., “RR”, NPFG, 5%, 7/01/2024 | 1,845,000 | 1,840,511 | ||
| Puerto Rico Electric Power Authority Rev., “SS”, NPFG, 5%, 7/01/2023 | 860,000 | 859,108 | ||
| Puerto Rico Electric Power Authority Rev., “TT”, NPFG, 5%, 7/01/2024 | 530,000 | 528,711 | ||
| Puerto Rico Electric Power Authority Rev., “TT”, NPFG, 5%, 7/01/2026 | 25,000 | 24,823 | ||
| Puerto Rico Electric Power Authority Rev., “UU”, AGM, 5%, 7/01/2023 | 1,075,000 | 1,090,708 | ||
| Puerto Rico Electric Power Authority Rev., “UU”, AGM, 5%, 7/01/2024 | 1,310,000 | 1,329,142 | ||
| Puerto Rico Electric Power Authority Rev., “VV”, NPFG, 5.25%, 7/01/2025 | 195,000 | 194,667 | ||
| Puerto Rico Electric Power Authority Rev., “VV”, NPFG, 5.25%, 7/01/2026 | 460,000 | 458,015 | ||
| Puerto Rico Municipal Finance Agency, “A”, AGM, 5%, 8/01/2027 | 135,000 | 136,920 | ||
| Puerto Rico Sales Tax Financing Corp., Restructured Sales Tax Rev., “2019A-1”, 4.5%, 7/01/2034 | 207,000 | 187,675 | ||
| Puerto Rico Sales Tax Financing Corp., Restructured Sales Tax Rev., Capital Appreciation, “2019A-1”, 0%, 7/01/2027 | 718,000 | 559,119 | ||
| Puerto Rico Sales Tax Financing Corp., Restructured Sales Tax Rev., Capital Appreciation, “2019A-1”, 0%, 7/01/2029 | 15,340,000 | 10,640,132 | ||
| Puerto Rico Sales Tax Financing Corp., Restructured Sales Tax Rev., Capital Appreciation, “2019A-1”, 0%, 7/01/2033 | 16,249,000 | 8,715,613 | ||
| University of Puerto Rico Rev., “P”, NPFG, 5%, 6/01/2025 | 245,000 | 244,112 | ||
| $60,261,665 | ||||
| Rhode Island - 1.2% | ||||
| Rhode Island Health and Educational Building Corp. Rev. (Lifespan Obligated Group), 5%, 5/15/2026 | $ | 5,000,000 | $5,072,322 | |
| Rhode Island Health and Educational Building Corp., Higher Education Facility Refunding Rev. (Providence College), “B”, 5%, 11/01/2022 | 385,000 | 385,000 | ||
| Rhode Island Health and Educational Building Corp., Higher Education Facility Refunding Rev. (Providence College), “B”, 5%, 11/01/2023 | 400,000 | 406,614 | ||
| Rhode Island Health and Educational Building Corp., Higher Education Facility Refunding Rev. (Providence College), “B”, 5%, 11/01/2024 | 430,000 | 442,621 | ||
| Issuer | Shares/Par | Value ($) | ||
| Municipal Bonds - continued | ||||
| Rhode Island - continued | ||||
| Rhode Island Health and Educational Building Corp., Higher Education Facility Refunding Rev. (Providence College), “B”, 5%, 11/01/2025 | $ | 450,000 | $467,844 | |
| Rhode Island Health and Educational Building Corp., Higher Education Facility Refunding Rev. (Providence College), “B”, 5%, 11/01/2026 | 470,000 | 493,403 | ||
| Rhode Island Health and Educational Building Corp., Higher Education Facility Refunding Rev., (Providence College), “B”, 5%, 11/01/2027 | 245,000 | 259,560 | ||
| Rhode Island Housing and Mortgage Finance Corp., Home Ownership Opportunity, “76-A”, 5%, 10/01/2026 | 300,000 | 316,897 | ||
| Rhode Island Housing and Mortgage Finance Corp., Home Ownership Opportunity, “76-A”, 5%, 10/01/2027 | 435,000 | 463,897 | ||
| Rhode Island Housing and Mortgage Finance Corp., Home Ownership Opportunity, “76-A”, 5%, 4/01/2028 | 475,000 | 508,033 | ||
| Rhode Island Housing and Mortgage Finance Corp., Home Ownership Opportunity, “78-A”, 5.5%, 10/01/2052 (w) | 7,250,000 | 7,532,789 | ||
| Rhode Island Housing and Mortgage Finance Corp., Home Ownership Opportunity, Taxable, “76-T”, 0.96%, 4/01/2023 | 200,000 | 196,787 | ||
| Rhode Island Student Loan Authority, Education Loan Rev., “A”, 5%, 12/01/2025 | 600,000 | 617,489 | ||
| Rhode Island Student Loan Authority, Education Loan Rev., “A”, 5%, 12/01/2026 | 875,000 | 907,571 | ||
| Rhode Island Student Loan Authority, Education Loan Rev., Federally Taxable, “1”, 4.125%, 12/01/2041 | 5,455,000 | 4,821,468 | ||
| Rhode Island Student Loan Authority, Student Loan Rev., “A”, 5%, 12/01/2022 | 550,000 | 550,626 | ||
| Rhode Island Student Loan Authority, Student Loan Rev., “A”, 4%, 12/01/2025 | 2,005,000 | 2,009,808 | ||
| Rhode Island Student Loan Authority, Student Loan Rev., “A”, 5%, 12/01/2026 | 950,000 | 983,553 | ||
| Rhode Island Student Loan Authority, Student Loan Rev., “A”, 5%, 12/01/2027 | 800,000 | 830,146 | ||
| Rhode Island Student Loan Authority, Student Loan Rev., “A”, 5%, 12/01/2028 | 1,000,000 | 1,040,430 | ||
| Rhode Island Student Loan Authority, Student Loan Rev., “A”, 3.5%, 12/01/2034 | 700,000 | 677,898 | ||
| Rhode Island Student Loan Authority, Student Loan Rev., ”A“, 5%, 12/01/2024 | 765,000 | 781,366 | ||
| Rhode Island Student Loan Authority, Student Loan Rev., ”A“, 5%, 12/01/2025 | 1,000,000 | 1,027,979 | ||
| Rhode Island Student Loan Authority, Student Loan Rev., ”A“, 5%, 12/01/2026 | 1,125,000 | 1,177,226 | ||
| Issuer | Shares/Par | Value ($) | ||
| Municipal Bonds - continued | ||||
| Rhode Island - continued | ||||
| Rhode Island Student Loan Authority, Student Loan Rev., ”A“, 5%, 12/01/2027 | $ | 2,130,000 | $2,231,120 | |
| Rhode Island Student Loan Authority, Student Loan Rev., ”A“, 5%, 12/01/2028 | 1,185,000 | 1,245,223 | ||
| Rhode Island Student Loan Authority, Student Loan Rev., ”A“, 5%, 12/01/2029 | 1,250,000 | 1,317,832 | ||
| $36,765,502 | ||||
| South Carolina - 1.2% | ||||
| Charleston County, SC, Transportation Sales Tax, 5%, 11/01/2022 | $ | 3,095,000 | $3,095,000 | |
| Richland County, SC, Environmental Improvement Rev. (International Paper), “A”, 3.875%, 4/01/2023 | 4,545,000 | 4,532,985 | ||
| Scago, SC, Educational Facilities Installment Purchase Rev. (School District of Pickens County Project), 5%, 12/01/2023 | 1,300,000 | 1,320,124 | ||
| South Carolina Housing Finance & Development Authority Mortgage Rev., “A”, 5%, 1/01/2025 | 900,000 | 928,256 | ||
| South Carolina Housing Finance & Development Authority Mortgage Rev., “A”, 5%, 7/01/2025 | 1,005,000 | 1,042,793 | ||
| South Carolina Housing Finance & Development Authority Mortgage Rev., “A”, 5%, 1/01/2026 | 715,000 | 745,180 | ||
| South Carolina Housing Finance & Development Authority Mortgage Rev., “A”, 5%, 7/01/2026 | 420,000 | 439,934 | ||
| South Carolina Housing Finance & Development Authority Mortgage Rev., “A”, 5%, 1/01/2027 | 730,000 | 766,772 | ||
| South Carolina Housing Finance & Development Authority Mortgage Rev., “A”, 5%, 7/01/2027 | 315,000 | 332,224 | ||
| South Carolina Housing Finance & Development Authority Mortgage Rev., “A”, 5%, 1/01/2028 | 550,000 | 581,443 | ||
| South Carolina Housing Finance & Development Authority Mortgage Rev., “A”, 5%, 7/01/2028 | 610,000 | 647,594 | ||
| South Carolina Housing Finance & Development Authority Mortgage Rev., “A”, 5%, 1/01/2029 | 300,000 | 318,762 | ||
| South Carolina Housing Finance & Development Authority Mortgage Rev., “A”, 5%, 7/01/2029 | 535,000 | 570,554 | ||
| South Carolina Housing Finance & Development Authority Mortgage Rev., “A”, 5%, 1/01/2030 | 305,000 | 324,756 | ||
| South Carolina Student Loan Corp., Student Loan Rev., Taxable, “A”, 2.067%, 12/01/2022 | 2,515,000 | 2,509,213 | ||
| South Carolina Student Loan Corp., Student Loan Rev., Taxable, “A”, 2.208%, 12/01/2023 | 3,205,000 | 3,092,807 | ||
| South Carolina Student Loan Corp., Student Loan Rev., Taxable, “A”, 2.368%, 12/01/2024 | 5,000,000 | 4,684,410 | ||
| Issuer | Shares/Par | Value ($) | ||
| Municipal Bonds - continued | ||||
| South Carolina - continued | ||||
| South Carolina Student Loan Corp., Student Loan Rev., Taxable, “A”, 2.468%, 12/01/2025 | $ | 6,850,000 | $6,232,561 | |
| Sumter, SC, Two School Facilities, Inc. (Sumter School District), BAM, 5%, 12/01/2024 | 1,000,000 | 1,028,449 | ||
| Sumter, SC, Two School Facilities, Inc. (Sumter School District), BAM, 5%, 12/01/2025 | 1,500,000 | 1,561,383 | ||
| Williamsburg County, SC, General Obligation Rev. (Capital Projects Sales & Use Tax), “B”, BAM, 5%, 3/01/2026 | 1,680,000 | 1,764,521 | ||
| $36,519,721 | ||||
| South Dakota - 0.2% | ||||
| South Dakota Educational Enhancement Funding Corp., Tobacco Settlement Rev., Taxable, 0.706%, 6/01/2023 | $ | 4,250,000 | $4,145,090 | |
| South Dakota Educational Enhancement Funding Corp., Tobacco Settlement Rev., Taxable, 0.961%, 6/01/2024 | 3,425,000 | 3,204,362 | ||
| $7,349,452 | ||||
| Tennessee - 1.9% | ||||
| Knox County, TN, Health, Educational & Housing Facility Board Hospital Rev. (Covenant Health), “A”, 5%, 1/01/2025 | $ | 545,000 | $545,879 | |
| Knox County, TN, Health, Educational & Housing Facility Board Rev. (East Tennessee Children's Hospital), 5%, 11/15/2029 | 1,175,000 | 1,223,980 | ||
| Knox County, TN, Health, Educational & Housing Facility Board Rev. (University Health Systems, Inc.), 5%, 4/01/2023 | 850,000 | 854,797 | ||
| Knox County, TN, Health, Educational & Housing Facility Board Rev. (University Health Systems, Inc.), 5%, 4/01/2024 | 750,000 | 761,943 | ||
| Knox County, TN, Health, Educational & Housing Facility Board Rev. (University Health Systems, Inc.), 5%, 4/01/2025 | 2,350,000 | 2,389,241 | ||
| Knox County, TN, Health, Educational & Housing Facility Board Rev. (University Health Systems, Inc.), 5%, 4/01/2027 | 265,000 | 271,338 | ||
| Knox County, TN, Health, Educational & Housing Facility Board Rev. (University Health Systems, Inc.), 5%, 4/01/2028 | 500,000 | 509,785 | ||
| Knox County, TN, Health, Educational & Housing Facility Board Rev. (University Health Systems, Inc.), 5%, 9/01/2028 | 490,000 | 499,136 | ||
| Knox County, TN, Health, Educational & Housing Facility Board Rev. (University Health Systems, Inc.), 5%, 4/01/2029 | 1,450,000 | 1,475,533 | ||
| Knox County, TN, Health, Educational & Housing Facility Board Rev. (University Health Systems, Inc.), “A”, 5%, 9/01/2030 | 7,750,000 | 7,797,741 | ||
| Memphis-Shelby County, TN, Airport Authority Refunding Rev., “C”, 5%, 7/01/2023 | 750,000 | 755,655 | ||
| Memphis-Shelby County, TN, Airport Authority Refunding Rev., “C”, 5%, 7/01/2024 | 850,000 | 864,862 | ||
| Memphis-Shelby County, TN, Airport Authority Rev., “A”, 5%, 7/01/2025 | 2,750,000 | 2,810,512 | ||
| Issuer | Shares/Par | Value ($) | ||
| Municipal Bonds - continued | ||||
| Tennessee - continued | ||||
| Memphis-Shelby County, TN, Airport Authority Rev., “A”, 5%, 7/01/2026 | $ | 175,000 | $179,137 | |
| Memphis-Shelby County, TN, Airport Authority Rev., “B”, 5%, 7/01/2023 | 1,750,000 | 1,763,194 | ||
| Memphis-Shelby County, TN, Airport Authority Rev., “B”, 5%, 7/01/2024 | 4,000,000 | 4,069,940 | ||
| Memphis-Shelby County, TN, Airport Authority Rev., “B”, 5%, 7/01/2025 | 2,500,000 | 2,555,011 | ||
| Tennessee Energy Acquisition Corp., Gas Rev., “A”, 4%, 11/01/2049 (Put Date 11/01/2025) | 18,380,000 | 17,865,645 | ||
| Tennessee Housing Development Agency, Residential Finance Program Rev., “1”, 5%, 7/01/2025 | 1,350,000 | 1,398,330 | ||
| Tennessee Housing Development Agency, Residential Finance Program Rev., “1”, 5%, 1/01/2026 | 1,290,000 | 1,344,059 | ||
| Tennessee Housing Development Agency, Residential Finance Program Rev., “1”, 5%, 7/01/2026 | 1,795,000 | 1,880,823 | ||
| Tennessee Housing Development Agency, Residential Finance Program Rev., “1”, 5%, 1/01/2027 | 1,885,000 | 1,978,467 | ||
| Tennessee Housing Development Agency, Residential Finance Program Rev., “1”, 5%, 7/01/2027 | 1,405,000 | 1,481,823 | ||
| Tennessee Housing Development Agency, Residential Finance Program Rev., “1”, 5%, 1/01/2028 | 1,930,000 | 2,040,335 | ||
| $57,317,166 | ||||
| Texas - 7.1% | ||||
| Arlington, TX, Higher Education Finance Corp. Education Rev. (Riverwalk Education Foundation, Inc.), Texas PSF, 5%, 8/15/2023 | $ | 325,000 | $329,271 | |
| Arlington, TX, Higher Education Finance Corp. Education Rev. (Riverwalk Education Foundation, Inc.), Texas PSF, 5%, 8/15/2024 | 325,000 | 333,769 | ||
| Arlington, TX, Higher Education Finance Corp. Education Rev. (Riverwalk Education Foundation, Inc.), Texas PSF, 5%, 8/15/2025 | 400,000 | 416,000 | ||
| Arlington, TX, Higher Education Finance Corp. Education Rev. (Riverwalk Education Foundation, Inc.), Texas PSF, 5%, 8/15/2026 | 400,000 | 420,122 | ||
| Arlington, TX, Higher Education Finance Corp. Education Rev. (Riverwalk Education Foundation, Inc.), Texas PSF, 5%, 8/15/2027 | 525,000 | 557,892 | ||
| Arlington, TX, Higher Education Finance Corp. Rev. (Basis Charter Schools, Inc.), 4.5%, 6/15/2056 (Put Date 6/15/2026) (n) | 575,000 | 542,459 | ||
| Austin, TX, Convention Center (Convention Enterprises, Inc.), “A”, 5%, 1/01/2025 | 2,790,000 | 2,797,238 | ||
| Austin, TX, Convention Center (Convention Enterprises, Inc.), “B”, 5%, 1/01/2024 | 1,200,000 | 1,192,591 | ||
| Bexar County, TX, Venue Project Rev., Taxable, AGM, 0.461%, 8/15/2023 | 500,000 | 483,223 | ||
| Issuer | Shares/Par | Value ($) | ||
| Municipal Bonds - continued | ||||
| Texas - continued | ||||
| Bexar County, TX, Venue Project Rev., Taxable, AGM, 0.76%, 8/15/2024 | $ | 455,000 | $423,295 | |
| Bexar County, TX, Venue Project Rev., Taxable, AGM, 1.082%, 8/15/2025 | 720,000 | 648,658 | ||
| Bexar County, TX, Venue Project Rev., Taxable, AGM, 1.272%, 8/15/2026 | 315,000 | 274,785 | ||
| Boerne, TX, Independent School District, Unlimited Tax, 2.8%, 12/01/2051 (Put Date 12/01/2023) | 17,465,000 | 17,304,329 | ||
| Brazos, TX, Higher Education Authority, Inc., Student Loan Program Rev., “1A”, 5%, 4/01/2023 | 1,070,000 | 1,075,070 | ||
| Brazos, TX, Higher Education Authority, Inc., Student Loan Program Rev., “1A”, 5%, 4/01/2023 | 750,000 | 753,770 | ||
| Brazos, TX, Higher Education Authority, Inc., Student Loan Program Rev., “1A”, 5%, 4/01/2024 | 1,025,000 | 1,038,077 | ||
| Brazos, TX, Higher Education Authority, Inc., Student Loan Program Rev., “1A”, 5%, 4/01/2025 | 985,000 | 1,001,900 | ||
| Brazos, TX, Higher Education Authority, Inc., Student Loan Program Rev., “1A”, 5%, 4/01/2026 | 940,000 | 958,862 | ||
| Brazos, TX, Higher Education Authority, Inc., Student Loan Program Rev., “1A”, 5%, 4/01/2026 | 1,005,000 | 1,028,688 | ||
| Brazos, TX, Higher Education Authority, Inc., Student Loan Program Rev., “1A”, 5%, 4/01/2027 | 805,000 | 821,663 | ||
| Brazos, TX, Higher Education Authority, Inc., Student Loan Program Rev., “1A”, 5%, 4/01/2028 | 710,000 | 724,294 | ||
| Brazos, TX, Higher Education Authority, Inc., Student Loan Program Rev., “1A”, 5%, 4/01/2028 | 1,340,000 | 1,366,978 | ||
| Brazos, TX, Higher Education Authority, Inc., Student Loan Program Rev., “1A”, 5%, 4/01/2029 | 495,000 | 504,381 | ||
| Brazos, TX, Higher Education Authority, Inc., Student Loan Program Rev., “1A”, 5%, 4/01/2029 | 1,440,000 | 1,468,089 | ||
| Brazos, TX, Higher Education Authority, Inc., Student Loan Program Rev., “1A”, 3%, 4/01/2039 | 15,000 | 14,884 | ||
| Brazos, TX, Higher Education Authority, Inc., Student Loan Program Rev., Taxable, “1A”, 1.075%, 4/01/2023 | 350,000 | 344,406 | ||
| Brazos, TX, Higher Education Authority, Inc., Student Loan Program Rev., Taxable, “1A”, 1.305%, 4/01/2024 | 375,000 | 354,301 | ||
| Brazos, TX, Higher Education Authority, Inc., Student Loan Program Rev., Taxable, “1A”, 1.674%, 4/01/2025 | 250,000 | 228,914 | ||
| Brazos, TX, Higher Education Authority, Inc., Student Loan Program Rev., Taxable, “1A”, 1.974%, 4/01/2026 | 375,000 | 334,111 | ||
| Brownsville, TX, General Obligation, Refunding, 5%, 2/15/2023 | 230,000 | 231,052 | ||
| Brownsville, TX, General Obligation, Refunding, 5%, 2/15/2025 | 475,000 | 491,122 | ||
| Brownsville, TX, General Obligation, Refunding, 5%, 2/15/2027 | 525,000 | 554,460 | ||
| Issuer | Shares/Par | Value ($) | ||
| Municipal Bonds - continued | ||||
| Texas - continued | ||||
| Brownsville, TX, Navigation District Rev., AGM, 5%, 3/01/2025 | $ | 950,000 | $974,898 | |
| Brownsville, TX, Navigation District Rev., AGM, 5%, 3/01/2026 | 1,000,000 | 1,036,259 | ||
| Brownsville, TX, Navigation District Rev., AGM, 5%, 3/01/2027 | 1,000,000 | 1,042,707 | ||
| Brownsville, TX, Navigation District Rev., AGM, 5%, 3/01/2029 | 1,100,000 | 1,143,927 | ||
| Bryan, TX, Electric System Rev., “A”, AGM, 5%, 7/01/2023 | 200,000 | 202,257 | ||
| Bryan, TX, Electric System Rev., “A”, AGM, 5%, 7/01/2024 | 265,000 | 271,570 | ||
| Bryan, TX, Electric System Rev., “A”, AGM, 5%, 7/01/2025 | 310,000 | 321,258 | ||
| Bryan, TX, Electric System Rev., “A”, AGM, 5%, 7/01/2026 | 330,000 | 345,778 | ||
| Capital Area, TX, Housing Finance Corp., Multi-Family Housing Rev. (Grand Ave. Flats), 0.29%, 8/01/2039 (Put Date 8/01/2024) | 2,370,000 | 2,196,810 | ||
| Central Texas Regional Mobility Authority, “F”, 5%, 1/01/2025 | 4,000,000 | 4,061,044 | ||
| Cinco Southwest, TX, Municipal Utility District No. 1 Contract Refunding Rev., BAM, 3%, 12/01/2022 | 595,000 | 594,686 | ||
| Cinco Southwest, TX, Municipal Utility District No. 1 Contract Refunding Rev., BAM, 3%, 12/01/2023 | 250,000 | 248,008 | ||
| Cinco Southwest, TX, Municipal Utility District No. 1 Contract Refunding Rev., BAM, 3%, 12/01/2024 | 190,000 | 187,424 | ||
| Cinco Southwest, TX, Municipal Utility District No. 1 Contract Refunding Rev., BAM, 3%, 12/01/2025 | 170,000 | 166,261 | ||
| Cinco Southwest, TX, Municipal Utility District No. 1 Contract Refunding Rev., BAM, 4%, 12/01/2026 | 175,000 | 177,897 | ||
| Cinco Southwest, TX, Municipal Utility District No. 1 Contract Refunding Rev., “A”, BAM, 3%, 12/01/2022 | 460,000 | 459,757 | ||
| Clear Brook City, TX, Municipal Utility District, AGM, 4%, 2/01/2028 | 275,000 | 276,278 | ||
| Clear Brook City, TX, Municipal Utility District (Tax Fire Protection), “A”, BAM, 4%, 2/01/2025 | 800,000 | 804,343 | ||
| Clifton, TX, Higher Education Finance Corp. Rev. (Idea Public Schools), Texas PSF, 4%, 8/15/2023 | 900,000 | 904,212 | ||
| Clifton, TX, Higher Education Finance Corp. Rev. (Idea Public Schools), Texas PSF, 5%, 8/15/2024 | 600,000 | 615,874 | ||
| Clifton, TX, Higher Education Finance Corp. Rev. (Idea Public Schools), Texas PSF, 5%, 8/15/2026 | 1,475,000 | 1,542,282 | ||
| Clifton, TX, Higher Education Finance Corp. Rev. (International Leadership of Texas, Inc.), Texas PSF, 5%, 8/15/2027 | 1,350,000 | 1,429,095 | ||
| Clifton, TX, Higher Education Finance Corp. Rev. (International Leadership of Texas, Inc.), Texas PSF, 5%, 8/15/2028 | 1,055,000 | 1,122,261 | ||
| Clifton, TX, Higher Education Finance Corp. Rev. (International Leadership of Texas, Inc.), Texas PSF, 5%, 8/15/2029 | 1,500,000 | 1,609,404 | ||
| Clifton, TX, Higher Education Finance Corp. Rev. (Uplift Education), “A”, 3.375%, 12/01/2024 | 745,000 | 719,946 | ||
| Collin and Hunt Counties, TX, Magnolia Pointe Municipal Utility District No. 1, AGM, 4.5%, 9/01/2023 | 455,000 | 458,924 | ||
| Issuer | Shares/Par | Value ($) | ||
| Municipal Bonds - continued | ||||
| Texas - continued | ||||
| Collin and Hunt Counties, TX, Magnolia Pointe Municipal Utility District No. 1, AGM, 4.5%, 9/01/2025 | $ | 490,000 | $503,072 | |
| Collin and Hunt Counties, TX, Magnolia Pointe Municipal Utility District No. 1, AGM, 4.5%, 9/01/2026 | 505,000 | 522,102 | ||
| Collin and Hunt Counties, TX, Magnolia Pointe Municipal Utility District No. 1, AGM, 4.5%, 9/01/2027 | 525,000 | 541,824 | ||
| Collin and Hunt Counties, TX, Magnolia Pointe Municipal Utility District No. 1, AGM, 4%, 9/01/2028 | 415,000 | 420,569 | ||
| Dallas, TX, Housing Finance Corp., Multi-Family Housing Rev. (Highpoint at Wynnewood), 3.5%, 2/01/2044 (Put Date 2/01/2026) | 2,755,000 | 2,650,064 | ||
| Decatur, TX, Hospital Authority Rev. (Wise Regional Health System), “A”, 5%, 9/01/2023 | 525,000 | 530,151 | ||
| Eagle Pass, TX, Tax and Limited Pledge Rev., AGM, 5%, 3/01/2023 | 220,000 | 221,171 | ||
| Eagle Pass, TX, Tax and Limited Pledge Rev., AGM, 5%, 3/01/2024 | 205,000 | 209,126 | ||
| Eagle Pass, TX, Tax and Limited Pledge Rev., AGM, 5%, 3/01/2025 | 410,000 | 424,824 | ||
| El Paso, TX, General Obligation, 4%, 8/15/2029 | 1,440,000 | 1,461,810 | ||
| Elgin, TX, Tax and Rev., AGM, 4%, 7/15/2023 | 125,000 | 125,610 | ||
| Elgin, TX, Tax and Rev., AGM, 4%, 7/15/2024 | 110,000 | 111,164 | ||
| Elgin, TX, Tax and Rev., AGM, 4%, 7/15/2024 | 155,000 | 156,640 | ||
| Elgin, TX, Tax and Rev., AGM, 4%, 7/15/2025 | 120,000 | 121,664 | ||
| Elgin, TX, Tax and Rev., AGM, 4%, 7/15/2025 | 150,000 | 152,080 | ||
| Elgin, TX, Tax and Rev., AGM, 4%, 7/15/2026 | 180,000 | 182,687 | ||
| Elgin, TX, Tax and Rev., AGM, 4%, 7/15/2026 | 215,000 | 218,210 | ||
| Elgin, TX, Tax and Rev., AGM, 4%, 7/15/2027 | 140,000 | 142,915 | ||
| Elgin, TX, Tax and Rev., AGM, 4%, 7/15/2027 | 240,000 | 244,998 | ||
| Elgin, TX, Tax and Rev., AGM, 4%, 7/15/2028 | 145,000 | 147,780 | ||
| Elgin, TX, Tax and Rev., AGM, 4%, 7/15/2028 | 210,000 | 214,027 | ||
| Elgin, TX, Tax and Rev., AGM, 4%, 7/15/2029 | 175,000 | 178,882 | ||
| Elgin, TX, Tax and Rev., AGM, 4%, 7/15/2030 | 185,000 | 187,953 | ||
| Fort Bend County, TX, Independent School District, Unlimited Tax School Building, “B”, 3%, 8/01/2052 (Put Date 8/01/2023) | 4,500,000 | 4,467,007 | ||
| Fort Bend County, TX, Municipal Utility District No. 134B, AGM, 3%, 3/01/2024 | 585,000 | 580,300 | ||
| Fort Bend County, TX, Toll Road Rev. Senior Lien, BAM, 5%, 3/01/2023 | 400,000 | 402,447 | ||
| Galveston, TX, Public Facility Corp., Multi-Family Housing Rev. (Oleanders At Broadway), HUD Section 8, 0.47%, 8/01/2025 (Put Date 8/01/2024) | 4,935,000 | 4,604,749 | ||
| Garland, TX, Electric Utility System Rev., Taxable (Dallas, Collin and Rockwall Counties), “B”, 0.459%, 3/01/2023 | 295,000 | 290,818 | ||
| Garland, TX, Electric Utility System Rev., Taxable (Dallas, Collin and Rockwall Counties), “B”, 0.723%, 3/01/2024 | 600,000 | 566,693 | ||
| Issuer | Shares/Par | Value ($) | ||
| Municipal Bonds - continued | ||||
| Texas - continued | ||||
| Garland, TX, Electric Utility System Rev., Taxable (Dallas, Collin and Rockwall Counties), “B”, 1.068%, 3/01/2025 | $ | 800,000 | $729,540 | |
| Greater Texas Cultural Education Facilities Finance Corp. Rev. (Epicenter Multipurpose Facilities Project), “A”, 5%, 3/01/2026 | 440,000 | 460,581 | ||
| Greater Texas Cultural Education Facilities Finance Corp. Rev. (Epicenter Multipurpose Facilities Project), “A”, 5%, 3/01/2027 | 470,000 | 497,390 | ||
| Greater Texas Cultural Education Facilities Finance Corp. Rev. (Epicenter Multipurpose Facilities Project), “A”, 5%, 3/01/2029 | 450,000 | 481,870 | ||
| Greater Texas Cultural Education Facilities Finance Corp. Rev. (Epicenter Multipurpose Facilities Project), “A”, 5%, 3/01/2030 | 475,000 | 509,279 | ||
| Harris County, TX, Cultural Education Facilities Finance Corp., Hospital Rev. (Memorial Hermann Health System), “B”, 5%, 6/01/2050 (Put Date 12/01/2028) | 4,000,000 | 4,205,486 | ||
| Harris County, TX, Morton Road Municipal Utility District, BAM, 3%, 9/01/2023 | 200,000 | 199,010 | ||
| Harris County, TX, Morton Road Municipal Utility District, BAM, 3%, 9/01/2025 | 265,000 | 259,535 | ||
| Harris County, TX, Morton Road Municipal Utility District, BAM, 3%, 9/01/2026 | 300,000 | 291,641 | ||
| Harris County, TX, Municipal Utility District No. 287, “A”, AGM, 2%, 3/01/2023 | 530,000 | 526,186 | ||
| Harris County, TX, Municipal Utility District No. 287, “A”, AGM, 2%, 3/01/2024 | 530,000 | 513,788 | ||
| Harris County, TX, Municipal Utility District No. 287, “A”, AGM, 2%, 3/01/2025 | 530,000 | 500,327 | ||
| Harris County, TX, Municipal Utility District No. 287, “A”, AGM, 2%, 3/01/2026 | 530,000 | 486,435 | ||
| Harris County, TX, Spring Branch Independent School District, Texas PSF, 5%, 2/01/2024 | 4,000,000 | 4,087,044 | ||
| Horizon, TX, Regional Municipal Utility District, BAM, 3%, 2/01/2023 | 565,000 | 564,348 | ||
| Horizon, TX, Regional Municipal Utility District, BAM, 3%, 2/01/2024 | 590,000 | 585,367 | ||
| Horizon, TX, Regional Municipal Utility District, BAM, 3%, 2/01/2025 | 410,000 | 401,853 | ||
| Houston, TX, Airport System Rev., Special Facilities Rev. (United Airlines, Inc. Terminal E Project), 4.75%, 7/01/2024 | 510,000 | 507,560 | ||
| Houston, TX, Airport System Rev., Special Facilities Rev. (United Airlines, Inc. Terminal E Project), “A”, 5%, 7/01/2027 | 355,000 | 352,647 | ||
| Houston, TX, Airport System Rev., Special Facilities Rev. (United Airlines, Inc. Terminal Improvement Projects), “B-2”, 5%, 7/15/2027 | 490,000 | 486,725 | ||
| Issuer | Shares/Par | Value ($) | ||
| Municipal Bonds - continued | ||||
| Texas - continued | ||||
| Houston, TX, Airport System Rev., Subordinate Lien, “C”, 5%, 7/01/2024 | $ | 4,475,000 | $4,540,254 | |
| Houston, TX, Airport System Rev., Subordinate Lien, “C”, 5%, 7/01/2025 | 1,000,000 | 1,022,258 | ||
| Houston, TX, Airport System Rev., Subordinate Lien, “C”, 5%, 7/01/2026 | 3,000,000 | 3,078,076 | ||
| Houston, TX, Convention & Entertainment Facilities Department, Hotel Occupancy Rev., 4%, 9/01/2023 | 180,000 | 180,793 | ||
| Houston, TX, Convention & Entertainment Facilities Department, Hotel Occupancy Rev., 4%, 9/01/2024 | 255,000 | 256,683 | ||
| Houston, TX, Convention & Entertainment Facilities Department, Hotel Occupancy Rev., 4%, 9/01/2025 | 230,000 | 231,435 | ||
| Houston, TX, Convention & Entertainment Facilities Department, Hotel Occupancy Rev., 4%, 9/01/2026 | 280,000 | 283,075 | ||
| Houston, TX, Convention & Entertainment Facilities Department, Hotel Occupancy Rev., 4%, 9/01/2029 | 440,000 | 441,140 | ||
| Houston, TX, Convention & Entertainment Facilities Department, Hotel Occupancy Rev., 4%, 9/01/2030 | 445,000 | 444,663 | ||
| Houston, TX, Convention & Entertainment Facilities Department, Hotel Occupancy Rev., 4%, 9/01/2031 | 400,000 | 397,376 | ||
| Houston, TX, Housing Finance Corp., Multi-Family Housing Rev. (Sweet Gardens Apartments Project), 4%, 10/01/2025 (Put Date 10/01/2024) | 6,175,000 | 6,182,440 | ||
| Houston, TX, Memorial City Redevelopment Authority Rev., AGM, 5%, 9/01/2023 | 550,000 | 556,703 | ||
| Houston, TX, Memorial City Redevelopment Authority Rev., AGM, 5%, 9/01/2024 | 575,000 | 588,917 | ||
| Houston, TX, Memorial City Redevelopment Authority Rev., AGM, 5%, 9/01/2026 | 1,100,000 | 1,149,901 | ||
| Irving, TX, Hospital Authority Rev. (Baylor Scott & White Medical Center-Irving), “A”, 5%, 10/15/2024 | 250,000 | 256,281 | ||
| Irving, TX, Hospital Authority Rev. (Baylor Scott & White Medical Center-Irving), “A”, 5%, 10/15/2025 | 500,000 | 516,150 | ||
| Irving, TX, Hospital Authority Rev. (Baylor Scott & White Medical Center-Irving), “A”, 5%, 10/15/2028 | 350,000 | 360,400 | ||
| Irving, TX, Hotel Occupancy Tax Rev., 5%, 8/15/2025 | 130,000 | 132,805 | ||
| Irving, TX, Hotel Occupancy Tax Rev., 5%, 8/15/2026 | 150,000 | 154,118 | ||
| Irving, TX, Hotel Occupancy Tax Rev., 5%, 8/15/2028 | 225,000 | 233,416 | ||
| Irving, TX, Hotel Occupancy Tax Rev., 5%, 8/15/2029 | 275,000 | 286,195 | ||
| Irving, TX, Hotel Occupancy Tax Rev., 5%, 8/15/2030 | 185,000 | 191,992 | ||
| Lone Star College System, TX, 5%, 2/15/2027 | 3,750,000 | 3,935,151 | ||
| Lower Colorado River Authority Transmission Contract Refunding Rev. (LCRA Transmission Services Corp. Project), 5%, 5/15/2023 | 1,195,000 | 1,205,658 | ||
| Issuer | Shares/Par | Value ($) | ||
| Municipal Bonds - continued | ||||
| Texas - continued | ||||
| Lower Colorado River Authority Transmission Contract Refunding Rev. (LCRA Transmission Services Corp. Project), 5%, 5/15/2024 | $ | 1,120,000 | $1,146,326 | |
| Lower Colorado River Authority Transmission Contract Refunding Rev. (LCRA Transmission Services Corp. Project), 5%, 5/15/2025 | 1,550,000 | 1,604,597 | ||
| Matagorda County, TX, Navigation District 1, Pollution Control Refunding Rev. (Central Power & Light Co. Project), 0.9%, 5/01/2030 (Put Date 9/01/2023) | 1,360,000 | 1,325,314 | ||
| Matagorda County, TX, Pollution Control Rev. (Central Power & Light Co.), “A”, 2.6%, 11/01/2029 | 3,000,000 | 2,568,891 | ||
| North Central, TX, Housing Finance Corp., Multifamily Housing Rev. (Bluebonnet Ridge Apartments), 0.375%, 8/01/2040 (Put Date 8/01/2024) | 3,150,000 | 2,948,784 | ||
| North Texas Municipal Water District, Upper East Fork Wastewater Interceptor System Rev., 5%, 6/01/2024 | 1,915,000 | 1,965,956 | ||
| North Texas Tollway Authority System Refunding Rev., “B”, 5%, 1/01/2028 | 3,580,000 | 3,822,758 | ||
| Port Arthur, TX, Combination Tax & Certificates of Obligation Rev., BAM, 5%, 2/15/2023 | 565,000 | 567,697 | ||
| Port Arthur, TX, Combination Tax & Certificates of Obligation Rev., BAM, 5%, 2/15/2024 | 250,000 | 254,840 | ||
| Port Arthur, TX, Combination Tax & Certificates of Obligation Rev., BAM, 5%, 2/15/2025 | 500,000 | 516,080 | ||
| Port Arthur, TX, Combination Tax & Certificates of Obligation Rev., BAM, 5%, 2/15/2026 | 375,000 | 391,852 | ||
| Port Arthur, TX, Combination Tax & Certificates of Obligation Rev., BAM, 5%, 2/15/2027 | 350,000 | 369,213 | ||
| Port Beaumont, TX, Navigation District, Dock & Wharf Facility Rev. (Jefferson Gulf Coast Energy Project), “A”, 1.875%, 1/01/2026 (n) | 850,000 | 755,016 | ||
| Prosper, TX, Independent School District, School Building, Texas PSF, 5%, 2/15/2029 | 600,000 | 652,409 | ||
| Prosper, TX, Independent School District, School Building, Texas PSF, 5%, 2/15/2030 | 700,000 | 758,844 | ||
| Public Facility Corp., Texas Multi-Family Housing Rev. (Lakeside Manor Apartments), 3.25%, 3/01/2040 (Put Date 9/01/2025) | 5,000,000 | 4,818,270 | ||
| Regents of the University of North Texas Rev. Financing System, “A”, 5%, 4/15/2026 | 1,000,000 | 1,046,694 | ||
| San Antonio, TX, Airport System Rev., “A”, 5%, 7/01/2024 | 1,595,000 | 1,618,258 | ||
| San Antonio, TX, Airport System Rev., “A”, 5%, 7/01/2025 | 1,015,000 | 1,037,592 | ||
| San Antonio, TX, Airport System Rev., “A”, 5%, 7/01/2026 | 1,690,000 | 1,733,983 | ||
| San Antonio, TX, Airport System Rev., “A”, 5%, 7/01/2027 | 1,870,000 | 1,923,785 | ||
| San Antonio, TX, Airport System Rev., “A”, 5%, 7/01/2028 | 565,000 | 581,512 | ||
| Issuer | Shares/Par | Value ($) | ||
| Municipal Bonds - continued | ||||
| Texas - continued | ||||
| San Antonio, TX, Housing Trust Public Facility Corp., Multi-Family Housing Rev. (Country Club Village), 4%, 8/01/2026 (Put Date 8/01/2025) | $ | 4,375,000 | $4,368,190 | |
| San Antonio, TX, Passenger Facility Charge and Subordinate Lien Airport System Rev., “A”, 5%, 7/01/2023 | 1,100,000 | 1,106,998 | ||
| San Antonio, TX, Passenger Facility Charge and Subordinate Lien Airport System Rev., “A”, 5%, 7/01/2024 | 860,000 | 872,541 | ||
| San Antonio, TX, Passenger Facility Charge and Subordinate Lien Airport System Rev., “A”, 5%, 7/01/2025 | 1,600,000 | 1,635,207 | ||
| San Antonio, TX, Passenger Facility Charge and Subordinate Lien Airport System Rev., “A”, 5%, 7/01/2026 | 1,250,000 | 1,279,548 | ||
| San Antonio, TX, Passenger Facility Charge and Subordinate Lien Airport System Rev., “A”, 5%, 7/01/2027 | 2,750,000 | 2,817,419 | ||
| Tarrant County, TX, Cultural Education Facilities Finance Corp. Retirement Facility Rev. (Barton Creek Senior Living Center, Inc., Querencia Project), 5%, 11/15/2022 | 1,460,000 | 1,460,343 | ||
| Tarrant County, TX, Cultural Education Facilities Finance Corp. Retirement Facility Rev. (Barton Creek Senior Living Center, Inc., Querencia Project), 5%, 11/15/2024 | 515,000 | 520,946 | ||
| Tarrant County, TX, Cultural Education Facilities Finance Corp. Retirement Facility Rev. (Barton Creek Senior Living Center, Inc., Querencia Project), 5%, 11/15/2025 | 1,675,000 | 1,696,119 | ||
| Tarrant County, TX, Cultural Education Facilities Finance Corp. Rev. (CHRISTUS Health), “A”, 5%, 7/01/2053 (Put Date 7/01/2032) | 3,895,000 | 4,047,379 | ||
| Temple, TX, Reinvestment Zone 1 Rev., “A”, BAM, 5%, 8/01/2023 | 145,000 | 146,883 | ||
| Temple, TX, Reinvestment Zone 1 Rev., “A”, BAM, 5%, 8/01/2024 | 135,000 | 138,894 | ||
| Temple, TX, Reinvestment Zone 1 Rev., “A”, BAM, 5%, 8/01/2025 | 140,000 | 145,081 | ||
| Temple, TX, Reinvestment Zone 1 Rev., “A”, BAM, 5%, 8/01/2026 | 250,000 | 261,389 | ||
| Temple, TX, Reinvestment Zone 1 Rev., “A”, BAM, 5%, 8/01/2029 | 200,000 | 212,928 | ||
| Temple, TX, Reinvestment Zone 1 Rev., “A”, BAM, 5%, 8/01/2030 | 250,000 | 266,705 | ||
| Texas Department of Housing & Community Affairs, Multi-Family Housing Rev. (Scott Street Lofts), 0.7%, 8/01/2040 (Put Date 8/01/2023) | 5,000,000 | 4,858,198 | ||
| Texas Department of Housing & Community Affairs, Residential Mortgage Rev., “A”, GNMA, 5%, 1/01/2027 | 275,000 | 286,479 | ||
| Texas Department of Housing & Community Affairs, Residential Mortgage Rev., “A”, GNMA, 5%, 7/01/2027 | 300,000 | 313,786 | ||
| Texas Department of Housing & Community Affairs, Residential Mortgage Rev., “A”, GNMA, 5%, 1/01/2028 | 300,000 | 314,995 | ||
| Texas Department of Housing & Community Affairs, Residential Mortgage Rev., “A”, GNMA, 5%, 7/01/2028 | 300,000 | 316,142 | ||
| Texas Department of Housing & Community Affairs, Residential Mortgage Rev., “A”, GNMA, 5%, 1/01/2029 | 215,000 | 227,358 | ||
| Issuer | Shares/Par | Value ($) | ||
| Municipal Bonds - continued | ||||
| Texas - continued | ||||
| Texas Department of Housing & Community Affairs, Residential Mortgage Rev., “A”, GNMA, 5%, 7/01/2029 | $ | 150,000 | $159,154 | |
| Texas Department of Housing & Community Affairs, Residential Mortgage Rev., “A”, GNMA, 5%, 1/01/2030 | 220,000 | 234,109 | ||
| Texas Department of Housing & Community Affairs, Residential Mortgage Rev., “A”, GNMA, 5%, 7/01/2030 | 225,000 | 239,954 | ||
| Texas Gas Acquisition & Supply Corp. III., Gas Supply Rev., 5%, 12/15/2022 | 2,500,000 | 2,502,211 | ||
| Texas Municipal Gas Acquisition and Supply Corp. III, Gas Supply Rev., 5%, 12/15/2030 | 2,550,000 | 2,575,614 | ||
| Texas Municipal Gas Acquisition and Supply Corp. III, Gas Supply Rev., 5%, 12/15/2031 | 7,335,000 | 7,372,907 | ||
| Texas Municipal Gas Acquisition and Supply Corp. III, Gas Supply Rev., 5%, 12/15/2032 | 2,115,000 | 2,115,594 | ||
| Texas Public Finance Authority, Financing System Refunding Rev. (Texas Southern University), BAM, 5%, 5/01/2023 | 270,000 | 272,097 | ||
| Texas Public Finance Authority, Financing System Refunding Rev. (Texas Southern University), BAM, 5%, 5/01/2024 | 370,000 | 376,600 | ||
| Texas Public Finance Authority, Financing System Refunding Rev. (Texas Southern University), BAM, 5%, 5/01/2025 | 500,000 | 507,915 | ||
| Texas Public Finance Authority, Financing System Refunding Rev. (Texas Southern University), “A”, BAM, 5%, 5/01/2026 | 395,000 | 403,230 | ||
| Texas Transportation Commission, State Highway 249 System Rev., Capital Appreciation, “A”, 0%, 8/01/2028 | 135,000 | 99,491 | ||
| Texas Transportation Commission, State Highway 249 System Rev., Capital Appreciation, “A”, 0%, 8/01/2029 | 500,000 | 348,775 | ||
| Texas Water Development Board, Water Implementation Rev., 4%, 10/15/2023 | 435,000 | 438,408 | ||
| Trinity River, TX, Public Facility Corp., Multi-Family Housing Rev. (Cowan Place Apartments), 0.28%, 10/01/2024 | 10,000,000 | 9,587,286 | ||
| Viridian, TX, Municipal Management District, Road Improvement Rev., AGM, 3%, 12/01/2024 | 400,000 | 393,642 | ||
| Viridian, TX, Municipal Management District, Road Improvement Rev., AGM, 3%, 12/01/2025 | 590,000 | 576,046 | ||
| Viridian, TX, Municipal Management District, Road Improvement Rev., AGM, 3%, 12/01/2026 | 615,000 | 590,620 | ||
| Viridian, TX, Municipal Management District, Road Improvement Rev., AGM, 3%, 12/01/2027 | 500,000 | 476,110 | ||
| Waco, TX, 5%, 2/01/2027 | 3,220,000 | 3,416,212 | ||
| $218,173,817 | ||||
| Issuer | Shares/Par | Value ($) | ||
| Municipal Bonds - continued | ||||
| U.S. Virgin Islands - 0.1% | ||||
| Virgin Islands Matching Fund Special Purpose Securitization Corp., “A”, 5%, 10/01/2025 | $ | 1,245,000 | $1,270,429 | |
| Virgin Islands Public Finance Authority Rev. (Federal Highway Grant Anticipation Loan Note), 5%, 9/01/2023 (n) | 1,500,000 | 1,512,021 | ||
| Virgin Islands Public Finance Authority Rev. (Federal Highway Grant Anticipation Loan Note), 5%, 9/01/2024 (n) | 1,500,000 | 1,523,260 | ||
| $4,305,710 | ||||
| Utah - 0.4% | ||||
| Salt Lake City, UT, Airport Rev. (Salt Lake City International Airport), “A”, 5%, 7/01/2025 | $ | 1,990,000 | $2,033,789 | |
| Salt Lake City, UT, Airport Rev. (Salt Lake City International Airport), “A”, 5%, 7/01/2026 | 1,200,000 | 1,228,366 | ||
| Salt Lake City, UT, Airport Rev. (Salt Lake City International Airport), “A”, 5%, 7/01/2028 | 5,000,000 | 5,141,079 | ||
| Utah Housing Corp., Multifamily Housing Rev. (Moda Shoreline Apartments), 4%, 9/01/2025 (Put Date 9/01/2024) | 5,000,000 | 5,006,018 | ||
| $13,409,252 | ||||
| Vermont - 0.7% | ||||
| Vermont Student Assistance Corp., Education Loan Rev., “A”, 5%, 6/15/2023 | $ | 525,000 | $529,521 | |
| Vermont Student Assistance Corp., Education Loan Rev., “A”, 5%, 6/15/2024 | 1,010,000 | 1,028,036 | ||
| Vermont Student Assistance Corp., Education Loan Rev., “A”, 5%, 6/15/2024 | 775,000 | 788,839 | ||
| Vermont Student Assistance Corp., Education Loan Rev., “A”, 5%, 6/15/2025 | 360,000 | 367,716 | ||
| Vermont Student Assistance Corp., Education Loan Rev., “A”, 5%, 6/15/2026 | 1,470,000 | 1,509,367 | ||
| Vermont Student Assistance Corp., Education Loan Rev., “A”, 5%, 6/15/2026 | 775,000 | 795,755 | ||
| Vermont Student Assistance Corp., Education Loan Rev., “A”, 5%, 6/15/2026 | 140,000 | 143,986 | ||
| Vermont Student Assistance Corp., Education Loan Rev., “A”, 5%, 6/15/2027 | 775,000 | 792,358 | ||
| Vermont Student Assistance Corp., Education Loan Rev., “A”, 5%, 6/15/2027 | 1,000,000 | 1,029,820 | ||
| Vermont Student Assistance Corp., Education Loan Rev., “A”, 5%, 6/15/2027 | 1,000,000 | 1,029,820 | ||
| Vermont Student Assistance Corp., Education Loan Rev., “A”, 5%, 6/15/2027 | 425,000 | 438,033 | ||
| Vermont Student Assistance Corp., Education Loan Rev., “A”, 5%, 6/15/2028 | 1,600,000 | 1,618,716 | ||
| Issuer | Shares/Par | Value ($) | ||
| Municipal Bonds - continued | ||||
| Vermont - continued | ||||
| Vermont Student Assistance Corp., Education Loan Rev., “A”, 5%, 6/15/2028 | $ | 1,735,000 | $1,755,295 | |
| Vermont Student Assistance Corp., Education Loan Rev., “A”, 5%, 6/15/2028 | 525,000 | 537,115 | ||
| Vermont Student Assistance Corp., Education Loan Rev., “A”, 5%, 6/15/2029 | 1,640,000 | 1,654,821 | ||
| Vermont Student Assistance Corp., Education Loan Rev., “A”, 5%, 6/15/2029 | 1,450,000 | 1,463,104 | ||
| Vermont Student Assistance Corp., Education Loan Rev., “A”, 5%, 6/15/2030 | 1,000,000 | 1,005,456 | ||
| Vermont Student Assistance Corp., Education Loan Rev., “A”, 5%, 6/15/2023 | 1,000,000 | 1,007,999 | ||
| Vermont Student Assistance Corp., Education Loan Rev., “A”, 5%, 6/15/2024 | 850,000 | 863,841 | ||
| Vermont Student Assistance Corp., Education Loan Rev., “A”, 5%, 6/15/2025 | 875,000 | 892,665 | ||
| Vermont Student Assistance Corp., Education Loan Rev., “A”, 5%, 6/15/2026 | 2,100,000 | 2,156,238 | ||
| $21,408,501 | ||||
| Virginia - 0.8% | ||||
| Amelia County, VA, Industrial Development Authority, Solid Waste Disposal Rev. (Waste Management, Inc. Project), 1.45%, 4/01/2027 | $ | 505,000 | $437,318 | |
| Arlington County, VA, Industrial Development Authority, Hospital Rev. (Virginia Hospital Center), 5%, 7/01/2024 | 775,000 | 791,061 | ||
| Arlington County, VA, Industrial Development Authority, Hospital Rev. (Virginia Hospital Center), 5%, 7/01/2025 | 475,000 | 488,958 | ||
| Arlington County, VA, Industrial Development Authority, Hospital Rev. (Virginia Hospital Center), 5%, 7/01/2027 | 1,025,000 | 1,068,552 | ||
| Charles City County, VA, Industrial Development Authority, Solid Waste Disposal Rev. (Waste Management, Inc. Project), 1.45%, 4/01/2027 | 235,000 | 203,505 | ||
| Gloucester County, VA, Industrial Development Authority Rev. (Waste Management Disposal Services of Virginia, Inc.), “A”, 3%, 9/01/2038 (Put Date 5/01/2023) | 4,350,000 | 4,318,048 | ||
| King George County, VA, Industrial Development Authority Solid Waste Disposal Rev. (King George Landfill, Inc. Project), “A”, 2.5%, 6/01/2023 | 545,000 | 540,962 | ||
| Louisa, VA, Industrial Development Authority, Pollution Control Refunding Rev. (Virginia Electric and Power Co. Project), “B”, 0.75%, 11/01/2035 (Put Date 9/02/2025) | 2,340,000 | 2,132,881 | ||
| Issuer | Shares/Par | Value ($) | ||
| Municipal Bonds - continued | ||||
| Virginia - continued | ||||
| Virginia Beach, VA, Development Authority Residential Care Facility Refunding Rev. (Westminster-Canterbury on Chesapeake Bay), 5%, 9/01/2029 | $ | 95,000 | $92,318 | |
| Virginia College Building Authority, Educational Facilities Rev. (Regent University Project), 5%, 6/01/2023 | 225,000 | 225,604 | ||
| Virginia College Building Authority, Educational Facilities Rev. (Regent University Project), 5%, 6/01/2024 | 300,000 | 301,583 | ||
| Virginia College Building Authority, Educational Facilities Rev. (Regent University Project), 5%, 6/01/2025 | 350,000 | 352,292 | ||
| Virginia College Building Authority, Educational Facilities Rev. (Regent University Project), 5%, 6/01/2026 | 400,000 | 402,552 | ||
| Virginia Housing Development Authority Rev., Rental Housing, “A”, 1.9%, 3/01/2023 | 505,000 | 502,433 | ||
| Virginia Public Building Authority, Public Facilities Rev., “A”, 5%, 8/01/2023 | 4,000,000 | 4,052,232 | ||
| Virginia Small Business Financing Authority Rev. (Obligated Group of National Senior Campuses, Inc.), “A”, 5%, 1/01/2023 | 425,000 | 425,495 | ||
| Virginia Small Business Financing Authority Rev. (Obligated Group of National Senior Campuses, Inc.), “A”, 5%, 1/01/2024 | 500,000 | 504,932 | ||
| Wise County, VA, Industrial Development Authority, Solid Waste & Sewage Disposal Rev. (Virginia Electric and Power Co. Project), “A”, 0.75%, 10/01/2040 (Put Date 9/02/2025) | 2,700,000 | 2,461,017 | ||
| Wise County, VA, Industrial Development Authority, Solid Waste and Sewage Disposal Rev. (Virginia Electric and Power Co. Project), “A”, 1.2%, 11/01/2040 (Put Date 5/31/2024) | 4,555,000 | 4,360,995 | ||
| $23,662,738 | ||||
| Washington - 2.2% | ||||
| Energy Northwest, WA, Wind Project Rev., 5%, 7/01/2023 | $ | 1,500,000 | $1,516,237 | |
| Everett, WA, Housing Authority Multi-Family Rev. (Baker Heights Legacy), 0.3%, 9/01/2024 (Put Date 9/01/2023) | 4,000,000 | 3,875,446 | ||
| Grays Harbor County, WA, Public Hospital District No. 2, Limited Tax General Obligation, 3.5%, 12/15/2023 | 715,000 | 707,358 | ||
| Grays Harbor County, WA, Public Hospital District No. 2, Limited Tax General Obligation, 4%, 12/15/2028 | 4,015,000 | 3,887,854 | ||
| Port of Seattle, WA, Intermediate Lien Refunding Rev. (Private Activity), “B”, 5%, 8/01/2023 | 12,490,000 | 12,617,033 | ||
| Port of Seattle, WA, Intermediate Lien Refunding Rev. (Private Activity), “B”, 5%, 8/01/2024 | 4,000,000 | 4,089,363 | ||
| Port of Seattle, WA, Intermediate Lien Refunding Rev. (Private Activity), “B”, 5%, 8/01/2025 | 3,800,000 | 3,909,821 | ||
| Port of Seattle, WA, Intermediate Lien Refunding Rev. (Private Activity), “B”, 5%, 8/01/2026 | 2,230,000 | 2,311,818 | ||
| Issuer | Shares/Par | Value ($) | ||
| Municipal Bonds - continued | ||||
| Washington - continued | ||||
| Port of Seattle, WA, Intermediate Lien Refunding Rev. (Private Activity), “C”, 5%, 8/01/2023 | $ | 4,025,000 | $4,065,937 | |
| Port Tacoma, WA, Refunding Rev., “A”, 5%, 12/01/2028 | 125,000 | 131,559 | ||
| Seattle, WA, Housing Authority Rev. (Lam Bow Apartments Project), 1.25%, 6/01/2024 | 1,500,000 | 1,445,243 | ||
| Seattle, WA, Housing Authority Rev. (Northgate Plaza Project), 1%, 6/01/2026 | 3,070,000 | 2,801,870 | ||
| Seattle, WA, Port Intermediate Lien Rev., “C”, 5%, 8/01/2024 | 3,600,000 | 3,680,426 | ||
| Seattle, WA, Port Intermediate Lien Rev., “C”, 5%, 8/01/2025 | 1,825,000 | 1,877,743 | ||
| Seattle, WA, Port Intermediate Lien Rev., “C”, 5%, 8/01/2026 | 2,315,000 | 2,399,937 | ||
| Seattle, WA, Port Rev., 5%, 4/01/2025 | 1,750,000 | 1,794,974 | ||
| Seattle, WA, Port Rev., 5%, 4/01/2026 | 3,000,000 | 3,100,570 | ||
| Seattle, WA, Port Rev., 5%, 4/01/2030 | 9,685,000 | 9,982,748 | ||
| Seattle, WA, Port Rev., 5%, 4/01/2031 | 3,500,000 | 3,584,825 | ||
| $67,780,762 | ||||
| West Virginia - 0.6% | ||||
| Parkersburg, WV, Waterworks & Sewerage System Refunding Rev., “A”, BAM, 3%, 8/01/2023 | $ | 400,000 | $398,174 | |
| Parkersburg, WV, Waterworks & Sewerage System Refunding Rev., “A”, BAM, 3%, 8/01/2025 | 200,000 | 195,995 | ||
| West Virginia Economic Development Authority, Lease Rev. (Department of Environmental Protection Office Building), “B”, 3.375%, 11/01/2025 | 830,000 | 817,312 | ||
| West Virginia Economic Development Authority, Solid Waste Disposal Facilities Refunding Rev. (Wheel Power Co. - Mitchell Project), “A”, 3%, 6/01/2037 (Put Date 6/18/2027) | 7,535,000 | 6,838,504 | ||
| West Virginia Economic Development Authority, Solid Waste Disposal Facilities Rev. (Appalachian Power Company - Amos Project), “A”, 2.55%, 3/01/2040 (Put Date 4/01/2024) | 4,000,000 | 3,872,487 | ||
| West Virginia Economic Development Authority, Solid Waste Disposal Rev. (Appalachian Power Company-Amos Project), “A”, 0.625%, 12/01/2038 (Put Date 12/15/2025) | 1,915,000 | 1,670,969 | ||
| West Virginia Economic Development Authority, Solid Waste Disposal Rev. (Appalachian Power Company-Amos Project), “A”, 1%, 1/01/2041 (Put Date 9/01/2025) | 4,520,000 | 4,038,296 | ||
| West Virginia Economic Development Authority, Solid Waste Disposal Rev. (Appalachian Power Company-Amos Project), “A”, 3.75%, 12/01/2042 (Put Date 6/01/2025) | 985,000 | 955,371 | ||
| $18,787,108 | ||||
| Issuer | Shares/Par | Value ($) | ||
| Municipal Bonds - continued | ||||
| Wisconsin - 0.9% | ||||
| Wisconsin Center District Junior Dedicated Tax Rev., Capital Appreciation, “D”, AGM, 0%, 12/15/2028 | $ | 265,000 | $206,364 | |
| Wisconsin Center District Junior Dedicated Tax Rev., Capital Appreciation, “D”, AGM, 0%, 12/15/2029 | 365,000 | 271,501 | ||
| Wisconsin Center District Junior Dedicated Tax Rev., Capital Appreciation, “D”, AGM, 0%, 12/15/2030 | 550,000 | 389,412 | ||
| Wisconsin Center District Senior Dedicated Tax Rev., Capital Appreciation, “C”, AGM, 0%, 12/15/2028 | 1,055,000 | 818,122 | ||
| Wisconsin Center District Senior Dedicated Tax Rev., Capital Appreciation, “C”, AGM, 0%, 12/15/2029 | 1,050,000 | 775,604 | ||
| Wisconsin Center District Senior Dedicated Tax Rev., Capital Appreciation, “C”, AGM, 0%, 12/15/2030 | 1,095,000 | 769,147 | ||
| Wisconsin Health & Educational Facilities Authority Rev. (Marquette University), 5%, 10/01/2024 | 440,000 | 451,917 | ||
| Wisconsin Health & Educational Facilities Authority Rev. (Marshfield Clinic Health System, Inc.), “B-2”, 5%, 2/15/2051 (Put Date 2/15/2027) | 4,000,000 | 4,098,546 | ||
| Wisconsin Health & Educational Facilities Authority Rev. (Oakwood Lutheran Senior Ministries), 4%, 1/01/2023 | 125,000 | 124,795 | ||
| Wisconsin Health & Educational Facilities Authority Rev. (Oakwood Lutheran Senior Ministries), 4%, 1/01/2024 | 480,000 | 474,399 | ||
| Wisconsin Health & Educational Facilities Authority Rev. (Oakwood Lutheran Senior Ministries), 4%, 1/01/2025 | 210,000 | 205,354 | ||
| Wisconsin Health & Educational Facilities Authority Rev. (Oakwood Lutheran Senior Ministries), 4%, 1/01/2026 | 345,000 | 333,630 | ||
| Wisconsin Health & Educational Facilities Authority Rev. (Oakwood Lutheran Senior Ministries), 4%, 1/01/2027 | 360,000 | 343,473 | ||
| Wisconsin Health & Educational Facilities Authority Rev. (Oakwood Lutheran Senior Ministries), 4%, 1/01/2028 | 375,000 | 350,949 | ||
| Wisconsin Health & Educational Facilities Authority Rev. (Oakwood Lutheran Senior Ministries), 4%, 1/01/2029 | 390,000 | 359,358 | ||
| Wisconsin Health & Educational Facilities Authority Rev. (ProHealth Care, Inc. Obligated Group), 3%, 8/15/2026 | 4,340,000 | 4,144,183 | ||
| Wisconsin Health & Educational Facilities Authority Rev. (Saint John's Communities, Inc. Project), 4%, 9/15/2027 (Prerefunded 9/15/2023) | 865,000 | 869,732 | ||
| Wisconsin Health & Educational Facilities Authority Rev. (Saint John's Communities, Inc. Project), “A”, 4%, 9/15/2025 (Prerefunded 9/15/2023) | 500,000 | 502,735 | ||
| Wisconsin Health & Educational Facilities Authority Rev. (Saint John's Communities, Inc. Project), “A”, 4%, 9/15/2026 (Prerefunded 9/15/2023) | 685,000 | 688,748 | ||
| Issuer | Shares/Par | Value ($) | ||
| Municipal Bonds - continued | ||||
| Wisconsin - continued | ||||
| Wisconsin Public Finance Authority Entrance Fee Principal Redemption Accredited Rev. (Searstone CCRC Project), “B-2”, 2.25%, 6/01/2027 (n) | $ | 855,000 | $748,876 | |
| Wisconsin Public Finance Authority Hospital Rev. (Renown Regional Medical Center Project), “A”, 5%, 6/01/2023 | 400,000 | 403,132 | ||
| Wisconsin Public Finance Authority Hospital Rev. (Renown Regional Medical Center Project), “A”, 5%, 6/01/2024 | 400,000 | 407,423 | ||
| Wisconsin Public Finance Authority Hospital Rev. (Renown Regional Medical Center Project), “A”, 5%, 6/01/2025 | 425,000 | 435,038 | ||
| Wisconsin Public Finance Authority Hospital Rev. (Renown Regional Medical Center Project), “A”, 5%, 6/01/2026 | 325,000 | 335,264 | ||
| Wisconsin Public Finance Authority Hospital Rev. (Renown Regional Medical Center Project), “A”, 5%, 6/01/2027 | 450,000 | 466,936 | ||
| Wisconsin Public Finance Authority Hospital Rev. (Renown Regional Medical Center Project), “A”, 5%, 6/01/2028 | 725,000 | 756,921 | ||
| Wisconsin Public Finance Authority Hospital Rev. (Renown Regional Medical Center Project), “A”, 5%, 6/01/2029 | 900,000 | 939,566 | ||
| Wisconsin Public Finance Authority Hospital Rev., Taxable (UNC Health Southeastern), “B”, 0.813%, 2/01/2023 | 920,000 | 909,262 | ||
| Wisconsin Public Finance Authority Hospital Rev., Taxable (UNC Health Southeastern), “B”, 1.143%, 2/01/2024 | 1,315,000 | 1,238,600 | ||
| Wisconsin Public Finance Authority Hospital Rev., Taxable (UNC Health Southeastern), “B”, 1.755%, 2/01/2026 | 1,710,000 | 1,496,228 | ||
| Wisconsin Public Finance Authority Limited Obligation Grant Rev. (American Dream at Meadowlands Project), “A”, 6.25%, 8/01/2027 (a)(d)(n) | 3,735,000 | 3,040,060 | ||
| Wisconsin Public Finance Authority Retirement Facilities First Mortgage Rev. (United Methodist Retirement Homes), “A”, 4%, 10/01/2027 | 200,000 | 192,893 | ||
| Wisconsin Public Finance Authority Retirement Facilities First Mortgage Rev. (United Methodist Retirement Homes), “A”, 4%, 10/01/2028 | 255,000 | 243,079 | ||
| Wisconsin Public Finance Authority Retirement Facilities First Mortgage Rev. (United Methodist Retirement Homes), “A”, 4%, 10/01/2029 | 325,000 | 307,096 | ||
| $28,098,343 | ||||
| Issuer | Shares/Par | Value ($) | ||
| Municipal Bonds - continued | ||||
| Wyoming - 0.2% | ||||
| Lancaster County, WY, Hospital Refunding Rev. (Cheyenne Regional Medical Center Project), 4%, 5/01/2023 | $ | 250,000 | $250,719 | |
| Lancaster County, WY, Hospital Refunding Rev. (Cheyenne Regional Medical Center Project), 4%, 5/01/2024 | 250,000 | 251,650 | ||
| Lancaster County, WY, Hospital Refunding Rev. (Cheyenne Regional Medical Center Project), 4%, 5/01/2025 | 280,000 | 282,822 | ||
| Lancaster County, WY, Hospital Refunding Rev. (Cheyenne Regional Medical Center Project), 4%, 5/01/2026 | 400,000 | 403,625 | ||
| Lancaster County, WY, Hospital Refunding Rev. (Cheyenne Regional Medical Center Project), 4%, 5/01/2027 | 185,000 | 186,986 | ||
| Wyoming Community Development Authority, Housing Rev., “3”, 5%, 12/01/2022 | 815,000 | 816,088 | ||
| Wyoming Community Development Authority, Housing Rev., “3”, 5%, 6/01/2023 | 1,200,000 | 1,210,776 | ||
| Wyoming Community Development Authority, Housing Rev., “3”, 5%, 12/01/2023 | 635,000 | 645,168 | ||
| Wyoming Community Development Authority, Housing Rev., “3”, 5%, 6/01/2024 | 680,000 | 693,983 | ||
| Wyoming Community Development Authority, Housing Rev., “3”, 5%, 12/01/2024 | 690,000 | 707,538 | ||
| Wyoming Community Development Authority, Housing Rev., “3”, 5%, 6/01/2025 | 695,000 | 715,368 | ||
| Wyoming Community Development Authority, Housing Rev., “3”, 5%, 12/01/2025 | 380,000 | 392,635 | ||
| $6,557,358 | ||||
| Total Municipal Bonds (Identified Cost, $3,252,309,867) | $3,075,438,971 | |||
| Bonds – 0.3% | ||||
| Consumer Services – 0.3% | ||||
| Toll Road Investors Partnership II LP, Capital Appreciation, NPFG, 0%, 2/15/2025 (n) | $ | 4,589,000 | $3,909,326 | |
| Toll Road Investors Partnership II LP, Capital Appreciation, NPFG, 0%, 2/15/2026 (n) | 7,427,000 | 5,894,647 | ||
| Toll Road Investors Partnership II LP, Capital Appreciation, NPFG, 0%, 2/15/2028 (n) | 1,054,000 | 717,004 | ||
| Total Bonds (Identified Cost, $11,367,346) | $10,520,977 | |||
| Issuer | Shares/Par | Value ($) | ||
| Investment Companies (h) - 1.1% | ||||
| Money Market Funds – 1.1% | ||||
| MFS Institutional Money Market Portfolio, 3.02% (v) (Identified Cost, $32,612,883) | 32,612,825 | $32,612,824 | ||
| Other Assets, Less Liabilities - (0.9)% | (27,073,404) | |||
| Net Assets - 100.0% | $3,091,499,368 | |||
| (a) | Non-income producing security. |
| (d) | In default. |
| (h) | An affiliated issuer, which may be considered one in which the fund owns 5% or more of the outstanding voting securities, or a company which is under common control. At period end, the aggregate values of the fund's investments in affiliated issuers and in unaffiliated issuers were $32,612,824 and $3,085,959,948, respectively. |
| (n) | Securities exempt from registration under Rule 144A of the Securities Act of 1933. These securities may be sold in the ordinary course of business in transactions exempt from registration, normally to qualified institutional buyers. At period end, the aggregate value of these securities was $47,560,747, representing 1.5% of net assets. |
| (v) | Affiliated issuer that is available only to investment companies managed by MFS. The rate quoted for the MFS Institutional Money Market Portfolio is the annualized seven-day yield of the fund at period end. |
| (w) | When-issued security. |
| The following abbreviations are used in this report and are defined: | |
| AAC | Ambac Assurance Corp. |
| AGM | Assured Guaranty Municipal |
| BAM | Build America Mutual |
| COP | Certificate of Participation |
| ETM | Escrowed to Maturity |
| FHA | Federal Housing Administration |
| FLR | Floating Rate. Interest rate resets periodically based on the parenthetically disclosed reference rate plus a spread (if any). The period-end rate reported may not be the current rate. All reference rates are USD unless otherwise noted. |
| FNMA | Federal National Mortgage Assn. |
| GNMA | Government National Mortgage Assn. |
| LIBOR | London Interbank Offered Rate |
| NPFG | National Public Finance Guarantee Corp. |
| PSF | Permanent School Fund |
| Assets | |
| Investments in unaffiliated issuers, at value (identified cost, $3,263,677,213) | $3,085,959,948 |
| Investments in affiliated issuers, at value (identified cost, $32,612,883) | 32,612,824 |
| Receivables for | |
| Investments sold | 26,586,072 |
| Fund shares sold | 17,013,113 |
| Interest and dividends | 35,975,684 |
| Other assets | 52,477 |
| Total assets | $3,198,200,118 |
| Liabilities | |
| Payables for | |
| Distributions | $598,869 |
| Investments purchased | 26,470,967 |
| Fund shares reacquired | 18,886,419 |
| When-issued investments purchased | 59,649,528 |
| Payable to affiliates | |
| Investment adviser | 111,031 |
| Administrative services fee | 5,133 |
| Shareholder servicing costs | 746,992 |
| Distribution and service fees | 24,519 |
| Accrued expenses and other liabilities | 207,292 |
| Total liabilities | $106,700,750 |
| Net assets | $3,091,499,368 |
| Net assets consist of | |
| Paid-in capital | $3,331,093,892 |
| Total distributable earnings (loss) | (239,594,524) |
| Net assets | $3,091,499,368 |
| Shares of beneficial interest outstanding | 405,208,043 |
| Net assets | Shares outstanding | Net asset value per share (a) | |
| Class A | $1,275,653,931 | 167,081,778 | $7.63 |
| Class B | 153,516 | 20,134 | 7.62 |
| Class C | 32,583,648 | 4,266,130 | 7.64 |
| Class I | 1,181,032,227 | 154,861,498 | 7.63 |
| Class R6 | 602,076,046 | 78,978,503 | 7.62 |
| (a) | Maximum offering price per share was equal to the net asset value per share for all share classes, except for Class A, for which the maximum offering price per share was $7.83 [100 / 97.50 x $7.63]. On sales of $50,000 or more, the maximum offering price of Class A shares is reduced. A contingent deferred sales charge may be imposed on redemptions of Class A, Class B, and Class C shares. Redemption price per share was equal to the net asset value per share for Classes I and R6. |
| Net investment income (loss) | |
| Income | |
| Interest | $34,966,806 |
| Dividends from affiliated issuers | 396,716 |
| Other | 46,220 |
| Total investment income | $35,409,742 |
| Expenses | |
| Management fee | $5,607,908 |
| Distribution and service fees | 1,856,234 |
| Shareholder servicing costs | 1,141,027 |
| Administrative services fee | 278,330 |
| Independent Trustees' compensation | 26,396 |
| Custodian fee | 226,038 |
| Shareholder communications | 48,135 |
| Audit and tax fees | 30,282 |
| Legal fees | 7,917 |
| Miscellaneous | 174,885 |
| Total expenses | $9,397,152 |
| Fees paid indirectly | (3,890) |
| Reduction of expenses by investment adviser and distributor | (903,554) |
| Net expenses | $8,489,708 |
| Net investment income (loss) | $26,920,034 |
| Realized and unrealized gain (loss) | |
| Realized gain (loss) (identified cost basis) | |
| Unaffiliated issuers | $(30,169,908) |
| Affiliated issuers | (13,400) |
| Net realized gain (loss) | $(30,183,308) |
| Change in unrealized appreciation or depreciation | |
| Unaffiliated issuers | $(61,430,640) |
| Affiliated issuers | (517) |
| Net unrealized gain (loss) | $(61,431,157) |
| Net realized and unrealized gain (loss) | $(91,614,465) |
| Change in net assets from operations | $(64,694,431) |
| Six months ended | Year ended | |
| 10/31/22 (unaudited) | 4/30/22 | |
| Change in net assets | ||
| From operations | ||
| Net investment income (loss) | $26,920,034 | $47,868,145 |
| Net realized gain (loss) | (30,183,308) | (9,270,794) |
| Net unrealized gain (loss) | (61,431,157) | (237,233,698) |
| Change in net assets from operations | $(64,694,431) | $(198,636,347) |
| Total distributions to shareholders | $(26,831,466) | $(48,060,657) |
| Change in net assets from fund share transactions | $(262,340,501) | $343,430,745 |
| Total change in net assets | $(353,866,398) | $96,733,741 |
| Net assets | ||
| At beginning of period | 3,445,365,766 | 3,348,632,025 |
| At end of period | $3,091,499,368 | $3,445,365,766 |
| Class A | Six months ended | Year ended | ||||
| 10/31/22 (unaudited) | 4/30/22 | 4/30/21 | 4/30/20 | 4/30/19 | 4/30/18 | |
| Net asset value, beginning of period | $7.86 | $8.40 | $8.06 | $8.16 | $7.99 | $8.11 |
| Income (loss) from investment operations | ||||||
| Net investment income (loss) (d) | $0.06 | $0.10 | $0.14 | $0.16 | $0.18 | $0.17 |
| Net realized and unrealized gain (loss) | (0.23) | (0.54) | 0.34 | (0.09) | 0.16 | (0.12) |
| Total from investment operations | $(0.17) | $(0.44) | $0.48 | $0.07 | $0.34 | $0.05 |
| Less distributions declared to shareholders | ||||||
| From net investment income | $(0.06) | $(0.10) | $(0.14) | $(0.17) | $(0.17) | $(0.17) |
| Net asset value, end of period (x) | $7.63 | $7.86 | $8.40 | $8.06 | $8.16 | $7.99 |
| Total return (%) (r)(s)(t)(x) | (2.17)(n) | (5.24) | 5.92 | 0.78 | 4.36 | 0.60 |
| Ratios (%) (to average net assets) and Supplemental data: | ||||||
| Expenses before expense reductions (f) | 0.72(a) | 0.72 | 0.76 | 0.78 | 0.78 | 0.79 |
| Expenses after expense reductions (f) | 0.61(a) | 0.61 | 0.65 | 0.66 | 0.67 | 0.69 |
| Net investment income (loss) | 1.53(a) | 1.25 | 1.65 | 1.97 | 2.18 | 2.06 |
| Portfolio turnover | 20(n) | 23 | 18 | 24 | 32 | 33 |
| Net assets at end of period (000 omitted) | $1,275,654 | $1,351,962 | $1,382,963 | $1,060,370 | $817,277 | $692,006 |
| Class B | Six months ended | Year ended | ||||
| 10/31/22 (unaudited) | 4/30/22 | 4/30/21 | 4/30/20 | 4/30/19 | 4/30/18 | |
| Net asset value, beginning of period | $7.85 | $8.39 | $8.05 | $8.15 | $7.98 | $8.10 |
| Income (loss) from investment operations | ||||||
| Net investment income (loss) (d) | $0.03 | $0.04 | $0.08 | $0.10 | $0.12 | $0.11 |
| Net realized and unrealized gain (loss) | (0.23) | (0.54) | 0.33 | (0.10) | 0.16 | (0.12) |
| Total from investment operations | $(0.20) | $(0.50) | $0.41 | $0.00 | $0.28 | $(0.01) |
| Less distributions declared to shareholders | ||||||
| From net investment income | $(0.03) | $(0.04) | $(0.07) | $(0.10) | $(0.11) | $(0.11) |
| Net asset value, end of period (x) | $7.62 | $7.85 | $8.39 | $8.05 | $8.15 | $7.98 |
| Total return (%) (r)(s)(t)(x) | (2.55)(n) | (5.96) | 5.15 | 0.03 | 3.59 | (0.15) |
| Ratios (%) (to average net assets) and Supplemental data: | ||||||
| Expenses before expense reductions (f) | 1.47(a) | 1.47 | 1.52 | 1.53 | 1.53 | 1.55 |
| Expenses after expense reductions (f) | 1.36(a) | 1.36 | 1.40 | 1.42 | 1.42 | 1.44 |
| Net investment income (loss) | 0.78(a) | 0.50 | 0.96 | 1.25 | 1.43 | 1.32 |
| Portfolio turnover | 20(n) | 23 | 18 | 24 | 32 | 33 |
| Net assets at end of period (000 omitted) | $154 | $167 | $188 | $470 | $902 | $1,008 |
| Class C | Six months ended | Year ended | ||||
| 10/31/22 (unaudited) | 4/30/22 | 4/30/21 | 4/30/20 | 4/30/19 | 4/30/18 | |
| Net asset value, beginning of period | $7.86 | $8.41 | $8.06 | $8.16 | $7.99 | $8.11 |
| Income (loss) from investment operations | ||||||
| Net investment income (loss) (d) | $0.03 | $0.03 | $0.07 | $0.09 | $0.11 | $0.10 |
| Net realized and unrealized gain (loss) | (0.22) | (0.55) | 0.35 | (0.09) | 0.17 | (0.12) |
| Total from investment operations | $(0.19) | $(0.52) | $0.42 | $0.00 | $0.28 | $(0.02) |
| Less distributions declared to shareholders | ||||||
| From net investment income | $(0.03) | $(0.03) | $(0.07) | $(0.10) | $(0.11) | $(0.10) |
| Net asset value, end of period (x) | $7.64 | $7.86 | $8.41 | $8.06 | $8.16 | $7.99 |
| Total return (%) (r)(s)(t)(x) | (2.46)(n) | (6.16) | 5.16 | (0.07) | 3.49 | (0.25) |
| Ratios (%) (to average net assets) and Supplemental data: | ||||||
| Expenses before expense reductions (f) | 1.47(a) | 1.47 | 1.51 | 1.53 | 1.53 | 1.55 |
| Expenses after expense reductions (f) | 1.46(a) | 1.46 | 1.50 | 1.52 | 1.52 | 1.54 |
| Net investment income (loss) | 0.68(a) | 0.40 | 0.84 | 1.14 | 1.33 | 1.22 |
| Portfolio turnover | 20(n) | 23 | 18 | 24 | 32 | 33 |
| Net assets at end of period (000 omitted) | $32,584 | $39,268 | $51,865 | $78,365 | $89,702 | $105,269 |
| Class I | Six months ended | Year ended | ||||
| 10/31/22 (unaudited) | 4/30/22 | 4/30/21 | 4/30/20 | 4/30/19 | 4/30/18 | |
| Net asset value, beginning of period | $7.85 | $8.40 | $8.05 | $8.15 | $7.98 | $8.10 |
| Income (loss) from investment operations | ||||||
| Net investment income (loss) (d) | $0.07 | $0.12 | $0.15 | $0.18 | $0.19 | $0.18 |
| Net realized and unrealized gain (loss) | (0.22) | (0.55) | 0.35 | (0.10) | 0.17 | (0.12) |
| Total from investment operations | $(0.15) | $(0.43) | $0.50 | $0.08 | $0.36 | $0.06 |
| Less distributions declared to shareholders | ||||||
| From net investment income | $(0.07) | $(0.12) | $(0.15) | $(0.18) | $(0.19) | $(0.18) |
| Net asset value, end of period (x) | $7.63 | $7.85 | $8.40 | $8.05 | $8.15 | $7.98 |
| Total return (%) (r)(s)(t)(x) | (1.98)(n) | (5.22) | 6.21 | 0.92 | 4.52 | 0.75 |
| Ratios (%) (to average net assets) and Supplemental data: | ||||||
| Expenses before expense reductions (f) | 0.47(a) | 0.47 | 0.51 | 0.53 | 0.53 | 0.54 |
| Expenses after expense reductions (f) | 0.46(a) | 0.46 | 0.50 | 0.52 | 0.52 | 0.54 |
| Net investment income (loss) | 1.68(a) | 1.39 | 1.80 | 2.12 | 2.33 | 2.21 |
| Portfolio turnover | 20(n) | 23 | 18 | 24 | 32 | 33 |
| Net assets at end of period (000 omitted) | $1,181,032 | $1,435,075 | $1,413,405 | $1,128,577 | $957,507 | $756,720 |
| Class R6 | Six months ended | Year ended | ||||
| 10/31/22 (unaudited) | 4/30/22 | 4/30/21 | 4/30/20 | 4/30/19 | 4/30/18(i) | |
| Net asset value, beginning of period | $7.84 | $8.39 | $8.05 | $8.15 | $7.98 | $8.19 |
| Income (loss) from investment operations | ||||||
| Net investment income (loss) (d) | $0.07 | $0.12 | $0.15 | $0.18 | $0.19 | $0.12 |
| Net realized and unrealized gain (loss) | (0.22) | (0.55) | 0.34 | (0.10) | 0.17 | (0.21) |
| Total from investment operations | $(0.15) | $(0.43) | $0.49 | $0.08 | $0.36 | $(0.09) |
| Less distributions declared to shareholders | ||||||
| From net investment income | $(0.07) | $(0.12) | $(0.15) | $(0.18) | $(0.19) | $(0.12) |
| Net asset value, end of period (x) | $7.62 | $7.84 | $8.39 | $8.05 | $8.15 | $7.98 |
| Total return (%) (r)(s)(t)(x) | (1.94)(n) | (5.16) | 6.16 | 1.00 | 4.60 | (1.06)(n) |
| Ratios (%) (to average net assets) and Supplemental data: | ||||||
| Expenses before expense reductions (f) | 0.39(a) | 0.39 | 0.44 | 0.45 | 0.45 | 0.46(a) |
| Expenses after expense reductions (f) | 0.37(a) | 0.38 | 0.43 | 0.44 | 0.44 | 0.45(a) |
| Net investment income (loss) | 1.76(a) | 1.47 | 1.84 | 2.21 | 2.40 | 2.30(a) |
| Portfolio turnover | 20(n) | 23 | 18 | 24 | 32 | 33 |
| Net assets at end of period (000 omitted) | $602,076 | $618,894 | $500,212 | $249,695 | $245,575 | $280,725 |
| (a) | Annualized. |
| (d) | Per share data is based on average shares outstanding. |
| (f) | Ratios do not reflect reductions from fees paid indirectly, if applicable. See Note 2 in the Notes to Financial Statements for additional information. |
| (i) | For Class R6, the period is from the class inception, September 1, 2017, through the stated period end. |
| (n) | Not annualized. |
| (r) | Certain expenses have been reduced without which performance would have been lower. |
| (s) | From time to time the fund may receive proceeds from litigation settlements, without which performance would be lower. |
| (t) | Total returns do not include any applicable sales charges. |
| (x) | The net asset values and total returns have been calculated on net assets which include adjustments made in accordance with U.S. generally accepted accounting principles required at period end for financial reporting purposes. |
| Financial Instruments | Level 1 | Level 2 | Level 3 | Total |
| Municipal Bonds | $— | $3,075,438,971 | $— | $3,075,438,971 |
| U.S. Corporate Bonds | — | 10,520,977 | — | 10,520,977 |
| Mutual Funds | 32,612,824 | — | — | 32,612,824 |
| Total | $32,612,824 | $3,085,959,948 | $— | $3,118,572,772 |
| Year ended 4/30/22 | |
| Ordinary income (including any short-term capital gains) | $504,606 |
| Tax-exempt income | 47,556,051 |
| Total distributions | $48,060,657 |
| As of 10/31/22 | |
| Cost of investments | $3,295,415,129 |
| Gross appreciation | 1,470,016 |
| Gross depreciation | (178,312,373) |
| Net unrealized appreciation (depreciation) | $(176,842,357) |
| As of 4/30/22 | |
| Undistributed ordinary income | 1,078,774 |
| Undistributed tax-exempt income | 1,422,329 |
| Capital loss carryforwards | (30,930,084) |
| Other temporary differences | (4,318,377) |
| Net unrealized appreciation (depreciation) | (115,321,269) |
| Short-Term | $(26,617,263) |
| Long-Term | (4,312,821) |
| Total | $(30,930,084) |
| Six months ended 10/31/22 | Year ended 4/30/22 | |
| Class A | $10,221,287 | $18,056,613 |
| Class B | 640 | 974 |
| Class C | 121,338 | 193,411 |
| Class I | 10,942,835 | 21,290,779 |
| Class R6 | 5,545,366 | 8,518,880 |
| Total | $26,831,466 | $48,060,657 |
| Up to $2.5 billion | 0.35% |
| In excess of $2.5 billion and up to $5 billion | 0.30% |
| In excess of $5 billion | 0.28% |
| Classes | ||||
| A | B | C | I | R6 |
| 0.69% | 1.44% | 1.54% | 0.54% | 0.46% |
| Distribution Fee Rate (d) | Service Fee Rate (d) | Total Distribution Plan (d) | Annual Effective Rate (e) | Distribution and Service Fee | |
| Class A | — | 0.25% | 0.25% | 0.15% | $ 1,675,361 |
| Class B | 0.75% | 0.25% | 1.00% | 0.90% | 828 |
| Class C | 0.75% | 0.25% | 1.00% | 1.00% | 180,045 |
| Total Distribution and Service Fees | $1,856,234 |
| (d) | In accordance with the distribution plan for certain classes, the fund pays distribution and/or service fees equal to these annual percentage rates of each class’s average daily net assets. The distribution and service fee rates disclosed by class represent the current rates in effect at the end of the reporting period. Any rate changes, if applicable, are detailed below. |
| (e) | The annual effective rates represent actual fees incurred under the distribution plan for the six months ended October 31, 2022 based on each class's average daily net assets. 0.10% of the Class A and Class B service fee is currently being waived under a written waiver agreement. For the six months October 31, 2022, this waiver amounted to $670,139 and $83, for Class A and Class B, respectively, and is included in the reduction of total expenses in the Statement of Operations. This written waiver agreement will continue until modified by the fund’s Board of Trustees, but such agreement will continue at least until August 31, 2023. MFD has voluntarily agreed to rebate a portion of each class's 0.25% service fee attributable to accounts for which there is no financial intermediary specified on the account except for accounts attributable to MFS or its affiliates' seed money. For the six months ended October 31, 2022, this rebate amounted to $9 for Class A shares and is included in the reduction of total expenses in the Statement of Operations. |
| Amount | |
| Class A | $158,790 |
| Class B | 204 |
| Class C | 2,060 |
| Six months ended 10/31/22 | Year ended 4/30/22 | ||||
| Shares | Amount | Shares | Amount | ||
| Shares sold | |||||
| Class A | 36,698,518 | $287,395,263 | 53,787,239 | $445,866,921 | |
| Class B | 216 | 1,688 | 9,097 | 76,501 | |
| Class C | 417,645 | 3,252,854 | 807,436 | 6,745,174 | |
| Class I | 54,610,322 | 427,065,404 | 103,404,480 | 851,438,832 | |
| Class R6 | 28,581,053 | 223,422,075 | 36,782,197 | 302,888,261 | |
| 120,307,754 | $941,137,284 | 194,790,449 | $1,607,015,689 | ||
| Six months ended 10/31/22 | Year ended 4/30/22 | ||||
| Shares | Amount | Shares | Amount | ||
| Shares issued to shareholders in reinvestment of distributions | |||||
| Class A | 1,214,909 | $9,493,104 | 2,036,197 | $16,844,940 | |
| Class B | 82 | 640 | 116 | 961 | |
| Class C | 13,152 | 102,671 | 20,198 | 167,238 | |
| Class I | 1,090,714 | 8,515,212 | 1,964,514 | 16,220,701 | |
| Class R6 | 694,126 | 5,411,099 | 1,025,280 | 8,456,789 | |
| 3,012,983 | $23,522,726 | 5,046,305 | $41,690,629 | ||
| Shares reacquired | |||||
| Class A | (42,934,768) | $(336,253,377) | (48,261,943) | $(396,693,359) | |
| Class B | (1,456) | (11,393) | (10,316) | (86,545) | |
| Class C | (1,161,452) | (9,077,124) | (1,999,108) | (16,547,668) | |
| Class I | (83,717,944) | (653,802,776) | (90,829,385) | (740,962,904) | |
| Class R6 | (29,198,952) | (227,855,841) | (18,508,512) | (150,985,097) | |
| (157,014,572) | $(1,227,000,511) | (159,609,264) | $(1,305,275,573) | ||
| Net change | |||||
| Class A | (5,021,341) | $(39,365,010) | 7,561,493 | $66,018,502 | |
| Class B | (1,158) | (9,065) | (1,103) | (9,083) | |
| Class C | (730,655) | (5,721,599) | (1,171,474) | (9,635,256) | |
| Class I | (28,016,908) | (218,222,160) | 14,539,609 | 126,696,629 | |
| Class R6 | 76,227 | 977,333 | 19,298,965 | 160,359,953 | |
| (33,693,835) | $(262,340,501) | 40,227,490 | $343,430,745 | ||
| Affiliated Issuers | Beginning Value | Purchases | Sales Proceeds | Realized Gain (Loss) | Change in Unrealized Appreciation or Depreciation | Ending Value |
| MFS Institutional Money Market Portfolio | $50,123,210 | $542,098,817 | $559,595,286 | $(13,400) | $(517) | $32,612,824 |
| Affiliated Issuers | Dividend Income | Capital Gain Distributions |
| MFS Institutional Money Market Portfolio | $396,716 | $— |


Bond Fund

Bond Fund
| 1 | |
| 2 | |
| 4 | |
| 6 | |
| 26 | |
| 28 | |
| 29 | |
| 30 | |
| 39 | |
| 55 | |
| 59 | |
| 59 | |
| 59 | |
| 59 | |
| 59 |
| back cover |


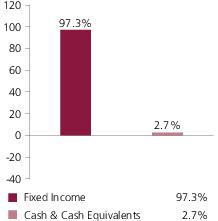
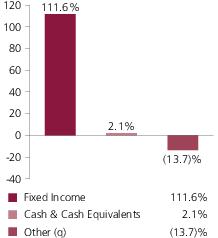
| U.S. Treasury Securities | 32.9% |
| Investment Grade Corporates | 28.9% |
| Mortgage-Backed Securities | 21.9% |
| Collateralized Loan Obligations | 10.0% |
| Commercial Mortgage-Backed Securities | 7.3% |
| High Yield Corporates | 6.7% |
| Municipal Bonds | 1.9% |
| Emerging Markets Bonds | 1.2% |
| Asset-Backed Securities | 0.4% |
| U.S. Government Agencies | 0.3% |
| Non-U.S. Government Bonds | 0.1% |
| Residential Mortgage-Backed Securities (o) | 0.0% |
| AAA | 6.7% |
| AA | 5.5% |
| A | 13.3% |
| BBB | 23.1% |
| BB | 6.5% |
| B | 1.2% |
| CCC | 0.2% |
| CC (o) | 0.0% |
| C (o) | 0.0% |
| U.S. Government | 19.2% |
| Federal Agencies | 22.2% |
| Not Rated | 13.7% |
| Cash & Cash Equivalents | 2.1% |
| Other (q) | (13.7)% |
| Average Duration (d) | 5.8 |
| Average Effective Maturity (m) | 7.7 yrs. |
| (a) | For all securities other than those specifically described below, ratings are assigned to underlying securities utilizing ratings from Moody’s, Fitch, and Standard & Poor’s rating agencies and applying the following hierarchy: If all three agencies provide a rating, the middle rating (after dropping the highest and lowest ratings) is assigned; if two of the three agencies rate a security, the lower of the two is assigned. If none of the 3 rating agencies above assign a rating, but the security is rated by DBRS Morningstar, then the DBRS Morningstar rating is assigned. If none of the 4 rating agencies listed above rate the security, but the security is rated by the Kroll Bond Rating Agency (KBRA), then the KBRA rating is assigned. Ratings are shown in the S&P and Fitch scale (e.g., AAA). Securities rated BBB or higher are considered investment grade. All ratings are subject to change. U.S. Government includes securities issued by the U.S. Department of the Treasury. Federal Agencies includes rated and unrated U.S. Agency fixed-income securities, U.S. Agency mortgage-backed securities, and collateralized mortgage obligations of U.S. Agency mortgage-backed securities. |
| (d) | Duration is a measure of how much a bond’s price is likely to fluctuate with general changes in interest rates, e.g., if rates rise 1.00%, a bond with a 5-year duration is likely to lose about 5.00% of its value due to the interest rate move. The Average Duration calculation reflects the impact of the equivalent exposure of derivative positions, if any. |
| (i) | For purposes of this presentation, the components include the value of securities, and reflect the impact of the equivalent exposure of derivative positions, if any. These amounts may be negative from time to time. Equivalent exposure is a calculated amount that translates the derivative position into a reasonable approximation of the amount of the underlying asset that the portfolio would have to hold at a given point in time to have the same price sensitivity that results from the portfolio’s ownership of the derivative contract. When dealing with derivatives, equivalent exposure is a more representative measure of the potential impact of a position on portfolio performance than value. The bond component will include any accrued interest amounts. |
| (m) | In determining each instrument’s effective maturity for purposes of calculating the fund’s dollar-weighted average effective maturity, MFS uses the instrument’s stated maturity or, if applicable, an earlier date on which MFS believes it is probable that a maturity-shortening device (such as a put, pre-refunding or prepayment) will cause the instrument to be repaid. Such an earlier date can be substantially shorter than the instrument’s stated maturity. |
| (o) | Less than 0.1%. |
| (q) | For purposes of this presentation, Other includes equivalent exposure from currency derivatives and/or any offsets to derivative positions and may be negative. |
| (v) | For purposes of this presentation, market value of fixed income and/or equity derivatives, if any, is included in Cash & Cash Equivalents. |
May 1, 2022 through October 31, 2022
| Share Class | Annualized Expense Ratio | Beginning Account Value 5/01/22 | Ending Account Value 10/31/22 | Expenses Paid During Period (p) 5/01/22-10/31/22 | |
| A | Actual | 0.60% | $1,000.00 | $922.42 | $2.91 |
| Hypothetical (h) | 0.60% | $1,000.00 | $1,022.18 | $3.06 | |
| B | Actual | 1.35% | $1,000.00 | $919.10 | $6.53 |
| Hypothetical (h) | 1.35% | $1,000.00 | $1,018.40 | $6.87 | |
| C | Actual | 1.45% | $1,000.00 | $917.62 | $7.01 |
| Hypothetical (h) | 1.45% | $1,000.00 | $1,017.90 | $7.38 | |
| I | Actual | 0.45% | $1,000.00 | $923.12 | $2.18 |
| Hypothetical (h) | 0.45% | $1,000.00 | $1,022.94 | $2.29 | |
| R1 | Actual | 1.45% | $1,000.00 | $917.62 | $7.01 |
| Hypothetical (h) | 1.45% | $1,000.00 | $1,017.90 | $7.38 | |
| R2 | Actual | 0.95% | $1,000.00 | $920.79 | $4.60 |
| Hypothetical (h) | 0.95% | $1,000.00 | $1,020.42 | $4.84 | |
| R3 | Actual | 0.70% | $1,000.00 | $921.96 | $3.39 |
| Hypothetical (h) | 0.70% | $1,000.00 | $1,021.68 | $3.57 | |
| R4 | Actual | 0.45% | $1,000.00 | $923.13 | $2.18 |
| Hypothetical (h) | 0.45% | $1,000.00 | $1,022.94 | $2.29 | |
| R6 | Actual | 0.35% | $1,000.00 | $923.61 | $1.70 |
| Hypothetical (h) | 0.35% | $1,000.00 | $1,023.44 | $1.79 |
| (h) | 5% class return per year before expenses. |
| (p) | “Expenses Paid During Period” are equal to each class’s annualized expense ratio, as shown above, multiplied by the average account value over the period, multiplied by 184/365 (to reflect the one-half year period). Expenses paid do not include any applicable sales charges (loads). If these transaction costs had been included, your costs would have been higher. |
| Issuer | Shares/Par | Value ($) | ||
| Bonds – 97.3% | ||||
| Aerospace & Defense – 0.9% | ||||
| Boeing Co., 2.196%, 2/04/2026 | $ | 26,637,000 | $23,538,980 | |
| Boeing Co., 5.15%, 5/01/2030 | 7,084,000 | 6,545,504 | ||
| Boeing Co., 5.705%, 5/01/2040 | 6,632,000 | 5,753,456 | ||
| Boeing Co., 5.805%, 5/01/2050 | 6,457,000 | 5,553,391 | ||
| TransDigm, Inc., 4.625%, 1/15/2029 | 20,143,000 | 17,152,369 | ||
| $58,543,700 | ||||
| Asset-Backed & Securitized – 17.7% | ||||
| ACREC 2021-FL1 Ltd., “C”, FLR, 5.593% (LIBOR - 1mo. + 2.15%), 10/16/2036 (n) | $ | 10,841,500 | $10,146,237 | |
| ACREC 2021-FL1 Ltd., “D”, FLR, 6.093% (LIBOR - 1mo. + 2.65%), 10/16/2036 (n) | 13,074,500 | 12,005,909 | ||
| ACRES 2021-FL2 Issuer Ltd., “C”, FLR, 6.062% (LIBOR - 1mo. + 2.65%), 1/15/2037 (n) | 13,618,500 | 12,789,426 | ||
| Allegro CLO Ltd., 2014-1RA, “A2”, FLR, 5.877% (LIBOR - 3mo. + 1.6%), 10/21/2028 (n) | 14,107,464 | 13,658,367 | ||
| Arbor Realty Trust, Inc., CLO, 2019-FL2, “AS”, FLR, 4.94% (LIBOR - 1mo. + 1.45%), 9/15/2034 (n) | 4,019,500 | 3,936,047 | ||
| Arbor Realty Trust, Inc., CLO, 2019-FL2, “B”, FLR, 5.24% (LIBOR - 1mo. + 1.75%), 9/15/2034 (n) | 3,215,500 | 3,064,233 | ||
| Arbor Realty Trust, Inc., CLO, 2020-FL1, “B”, FLR, 5.29% (LIBOR - 1mo. + 1.8%), 2/15/2035 (n) | 4,500,000 | 4,400,316 | ||
| Arbor Realty Trust, Inc., CLO, 2020-FL1, “C”, FLR, 5.54% (LIBOR - 1mo. + 2.05%), 2/15/2035 (n) | 15,774,500 | 15,166,235 | ||
| Arbor Realty Trust, Inc., CLO, 2021-FL1, “C”, FLR, 5.412% (LIBOR - 1mo. + 2%), 12/15/2035 (n) | 4,863,500 | 4,559,847 | ||
| Arbor Realty Trust, Inc., CLO, 2021-FL1, “D”, FLR, 6.362% (LIBOR - 1mo. + 2.95%), 12/15/2035 (n) | 3,420,500 | 3,155,050 | ||
| Arbor Realty Trust, Inc., CLO, 2021-FL2, “B”, FLR, 5.012% (LIBOR - 1mo. + 1.6%), 5/15/2036 (n) | 4,735,000 | 4,415,766 | ||
| Arbor Realty Trust, Inc., CLO, 2021-FL3, “C”, FLR, 5.262% (LIBOR - 1mo. + 1.85%), 8/15/2034 (n) | 9,870,000 | 9,154,928 | ||
| Arbor Realty Trust, Inc., CLO, 2021-FL3, “D”, FLR, 5.612% (LIBOR - 1mo. + 2.2%), 8/15/2034 (n) | 4,110,000 | 3,807,385 | ||
| Arbor Realty Trust, Inc., CLO, 2021-FL4, “C”, FLR, 5.712% (LIBOR - 1mo. + 2.3%), 11/15/2036 (n) | 14,892,500 | 13,908,325 | ||
| Arbor Realty Trust, Inc., CLO, 2022-FL1, “D”, FLR, 5.791% (SOFR - 30 day + 3%), 1/15/2037 (n) | 40,620,500 | 38,275,792 | ||
| AREIT 2019-CRE3 Trust, “A”, FLR, 4.76% (LIBOR - 1mo. + 1.02%), 9/14/2036 (n) | 561,434 | 554,374 | ||
| Issuer | Shares/Par | Value ($) | ||
| Bonds – continued | ||||
| Asset-Backed & Securitized – continued | ||||
| AREIT 2019-CRE3 Trust, “B”, FLR, 5.04% (LIBOR - 1mo. + 1.55%), 9/14/2036 (n) | $ | 7,734,500 | $7,579,941 | |
| AREIT 2019-CRE3 Trust, “C”, FLR, 5.39% (SOFR - 1mo. + 2.014%), 9/14/2036 (n) | 6,751,000 | 6,629,874 | ||
| AREIT 2019-CRE3 Trust, “D”, FLR, 6.14% (LIBOR - 1mo. + 2.65%), 9/14/2036 (n) | 6,243,500 | 5,787,831 | ||
| AREIT 2022-CRE6 Trust, “B”, FLR, 4.744% (SOFR - 30 day + 1.85%), 1/16/2037 (n) | 4,924,000 | 4,499,177 | ||
| AREIT 2022-CRE6 Trust, “C”, FLR, 5.043% (SOFR - 30 day + 2.15%), 1/16/2037 (n) | 10,134,500 | 9,378,598 | ||
| AREIT 2022-CRE6 Trust, “D”, FLR, 5.743% (SOFR - 30 day + 2.85%), 12/17/2024 (n) | 4,313,500 | 3,966,229 | ||
| Atrium XII Corp., 2012-A, “B1R”, FLR, 5.675% (LIBOR - 3mo. + 1.35%), 4/22/2027 (n) | 15,670,000 | 15,167,103 | ||
| Babson CLO Ltd., 2013-IIA, “BR”, FLR, 5.493% (LIBOR - 3mo. + 1.25%), 1/20/2028 (n) | 23,804,982 | 23,068,441 | ||
| Bayview Commercial Asset Trust, 0%, 12/25/2036 (i)(z) | 1,809,617 | 181 | ||
| Bayview Commercial Asset Trust, FLR, 4.051% (LIBOR - 1mo. + 0.31%), 8/25/2035 (n) | 108,712 | 98,839 | ||
| Bayview Financial Revolving Mortgage Loan Trust, FLR, 5.232% (LIBOR - 1mo. + 1.6%), 12/28/2040 (n) | 575,454 | 690,740 | ||
| BBCMS Mortgage Trust, 2019-C5, “A4”, 3.063%, 11/15/2052 | 9,055,000 | 7,683,990 | ||
| BDS 2019-FL4 Ltd., “A”, FLR, 4.512% (LIBOR - 1mo. + 1.10%), 8/15/2036 (n) | 1,123,307 | 1,118,646 | ||
| BDS 2019-FL4 Ltd., “C”, FLR, 5.412% (LIBOR - 1mo. + 2%), 8/15/2036 (n) | 10,946,500 | 10,647,870 | ||
| BDS 2021-FL7 Ltd., “B”, FLR, 4.943% (LIBOR - 1mo. + 1.5%), 6/16/2036 (n) | 5,159,500 | 4,805,698 | ||
| BSPRT 2019-FL5 Issuer Ltd., “C”, FLR, 5.412% (LIBOR - 1mo. + 2%), 5/15/2029 (n) | 9,385,000 | 9,139,976 | ||
| BSPRT 2021-FL6 Issuer Ltd., “B”, FLR, 5.012% (LIBOR - 1mo. + 1.6%), 3/15/2036 (n) | 15,128,000 | 13,836,871 | ||
| BSPRT 2021-FL6 Issuer Ltd., “C”, FLR, 5.462% (LIBOR - 1mo. + 2.05%), 3/15/2036 (n) | 5,310,500 | 4,892,744 | ||
| BSPRT 2021-FL7 Issuer Ltd., “C”, FLR, 5.712% (LIBOR - 1mo. + 2.3%), 12/15/2038 (n) | 3,651,000 | 3,347,416 | ||
| BSPRT 2021-FL7 Issuer Ltd., “D”, FLR, 6.162% (LIBOR - 1mo. + 2.75%), 12/15/2038 (n) | 4,152,500 | 3,819,054 | ||
| Business Jet Securities LLC, 2020-1A, “A”, 2.981%, 11/15/2035 (n) | 4,650,709 | 4,242,222 | ||
| Business Jet Securities LLC, 2021-1A, “B”, 2.918%, 4/15/2036 (n) | 1,975,948 | 1,598,386 | ||
| Issuer | Shares/Par | Value ($) | ||
| Bonds – continued | ||||
| Asset-Backed & Securitized – continued | ||||
| BXMT 2020-FL2 Ltd., “B”, FLR, 4.89% (LIBOR - 1mo. + 1.4%), 2/15/2038 (n) | $ | 6,104,500 | $5,716,925 | |
| BXMT 2021-FL4 Ltd., “AS”, FLR, 4.712% (LIBOR - 1mo. + 1.3%), 5/15/2038 (n) | 17,470,500 | 16,613,277 | ||
| BXMT 2021-FL4 Ltd., “B”, FLR, 4.962% (LIBOR - 1mo. + 1.55%), 5/15/2038 (n) | 38,262,000 | 35,779,083 | ||
| Cantor Commercial Real Estate, 2019-CF2, “A5”, 2.874%, 11/15/2052 | 20,960,656 | 17,076,280 | ||
| Capital Automotive, 2020-1A, “A4”, REIT, 3.19%, 2/15/2050 (n) | 8,134,945 | 7,556,193 | ||
| C-BASS Mortgage Loan Trust, 2007-CB1, “AF3”, 3.105%, 1/25/2037 (d)(q) | 1,147,900 | 386,038 | ||
| C-BASS Mortgage Loan Trust, 2007-CB3, “A3”, 3.25%, 3/25/2037 (d)(q) | 1,205,706 | 459,926 | ||
| CHCP 2021-FL1 Ltd., “B”, FLR, 5.18% (LIBOR - 1mo. + 1.65%), 2/15/2038 (n) | 6,412,000 | 6,133,187 | ||
| CHCP 2021-FL1 Ltd., “C”, FLR, 5.63% (LIBOR - 1mo. + 2.1%), 2/15/2038 (n) | 5,168,000 | 4,907,355 | ||
| Citigroup Commercial Mortgage Trust, 2014-GC25, “A4”, 3.635%, 10/10/2047 | 4,461,971 | 4,278,228 | ||
| Citigroup Commercial Mortgage Trust, 2015-GC27, “A5”, 3.137%, 2/10/2048 | 11,154,926 | 10,552,287 | ||
| Citigroup Commercial Mortgage Trust, 2016-P6, “A5”, 3.72%, 12/10/2049 | 5,948,000 | 5,482,581 | ||
| CLNC 2019-FL1 Ltd., “B”, FLR, 5.482% (LIBOR - 1mo. + 1.9%), 8/20/2035 (n) | 6,270,000 | 6,017,250 | ||
| CLNC 2019-FL1 Ltd., “C”, FLR, 5.982% (LIBOR - 1mo. + 2.4%), 8/20/2035 (n) | 10,190,000 | 9,672,835 | ||
| Columbia Cent CLO 28 Ltd., “A-2-R”, 6.232%, 11/07/2030 (n) | 28,014,809 | 26,504,783 | ||
| Columbia Cent CLO 28 Ltd., “B-R”, 6.682%, 11/07/2030 (n) | 17,835,205 | 16,364,425 | ||
| Commercial Mortgage Pass-Through Certificates, 2014-LC19 “A4”, 3.183%, 2/10/2048 | 9,743,000 | 9,200,965 | ||
| Commercial Mortgage Trust, 2015-DC1, “A5”, 3.35%, 2/10/2048 | 9,577,577 | 9,081,841 | ||
| Commercial Mortgage Trust, 2015-LC21, “A4”, 3.708%, 7/10/2048 | 9,963,398 | 9,425,784 | ||
| Commercial Mortgage Trust, 2015-PC1, “A5”, 3.902%, 7/10/2050 | 4,781,393 | 4,555,042 | ||
| Commercial Mortgage Trust, 2017-COR2, “A3”, 3.51%, 9/10/2050 | 26,790,000 | 24,355,266 | ||
| Credit Acceptance Auto Loan Trust, 2021-3A, “C”, 1.63%, 9/16/2030 (n) | 2,159,000 | 1,905,753 | ||
| CSAIL Commercial Mortgage Trust, 2015-C2, “A4”, 3.504%, 6/15/2057 | 3,687,246 | 3,493,270 | ||
| Issuer | Shares/Par | Value ($) | ||
| Bonds – continued | ||||
| Asset-Backed & Securitized – continued | ||||
| Cutwater 2014-1A Ltd., “BR”, FLR, 6.479% (LIBOR - 3mo. + 2.4%), 7/15/2026 (n) | $ | 1,983,154 | $1,960,642 | |
| Cutwater 2015-1A Ltd., “BR”, FLR, 5.879% (LIBOR - 3mo. + 1.8%), 1/15/2029 (n) | 27,695,000 | 26,875,173 | ||
| Dryden Senior Loan Fund, 2014-36A, “BR3”, CLO, FLR, 5.529% (LIBOR - 3mo. + 1.45%), 4/15/2029 (n) | 14,975,000 | 14,349,958 | ||
| Dryden Senior Loan Fund, 2017-49A, “CR”, CLO, FLR, 6.244% (LIBOR - 3mo. + 2.05%), 7/18/2030 (n) | 16,500,000 | 15,358,976 | ||
| Exeter Automobile Receivables Trust, 2020-1A, 2.49%, 1/15/2025 (n) | 890,104 | 889,157 | ||
| GMAC Mortgage Corp. Loan Trust, FGIC, 5.805%, 10/25/2036 | 102,011 | 100,583 | ||
| GS Mortgage Securities Trust, 2015-GC30, “A4”, 3.382%, 5/10/2050 | 11,461,699 | 10,787,543 | ||
| HarbourView CLO VII Ltd., 7RA, “B”, FLR, 5.894% (LIBOR - 3mo. + 1.7%), 7/18/2031 (n) | 15,920,000 | 14,787,372 | ||
| IMPAC CMB Trust, FLR, 4.326% (LIBOR - 1mo. + 0.74%), 11/25/2034 | 17,524 | 17,061 | ||
| IMPAC CMB Trust, FLR, 4.506% (LIBOR - 1mo. + 0.92%), 11/25/2034 | 8,762 | 8,590 | ||
| IMPAC Secured Assets Corp., FLR, 4.286% (LIBOR - 1mo. + 0.35%), 5/25/2036 | 34,470 | 29,293 | ||
| JPMBB Commercial Mortgage Securities Trust, 2014-C26, “A4”, 3.494%, 1/15/2048 | 13,025,174 | 12,373,317 | ||
| JPMBB Commercial Mortgage Securities Trust, 2015-C28, “A4”, 3.227%, 10/15/2048 | 23,872,958 | 22,413,974 | ||
| JPMDB Commercial Mortgage Securities Trust, 2017-C7, 3.409%, 10/15/2050 | 11,500,000 | 10,339,199 | ||
| JPMorgan Chase Commercial Mortgage Securities Corp., 5.643%, 7/15/2042 (n) | 413,104 | 337,238 | ||
| LCCM 2021-FL2 Trust, “C”, FLR, 5.562% (LIBOR - 1mo. + 2.15%), 12/13/2038 (n) | 8,225,000 | 7,853,822 | ||
| LoanCore 2018-CRE1 Ltd., “AS”, FLR, 4.912% (LIBOR - 1mo. + 1.5%), 5/15/2028 (n) | 19,768,108 | 19,577,346 | ||
| LoanCore 2018-CRE1 Ltd., “C”, FLR, 5.962% (LIBOR - 1mo. + 2.55%), 5/15/2028 (n) | 5,705,000 | 5,667,164 | ||
| LoanCore 2018-CRE1 Ltd., “C”, FLR, 5.362% (LIBOR - 1mo. + 1.95%), 4/15/2034 (n) | 5,553,900 | 5,422,856 | ||
| LoanCore 2018-CRE3 Ltd., “B”, FLR, 5.012% (LIBOR - 1mo. + 1.6%), 4/15/2034 (n) | 5,351,850 | 5,277,855 | ||
| LoanCore 2019-CRE2 Ltd., “D”, FLR, 5.862% (LIBOR - 1mo. + 2.45%), 5/15/2036 (n) | 3,164,500 | 3,111,916 | ||
| LoanCore 2019-CRE3 Ltd., “AS”, FLR, 4.782% (LIBOR - 1mo. + 1.37%), 4/15/2034 (n) | 3,796,830 | 3,769,724 | ||
| Issuer | Shares/Par | Value ($) | ||
| Bonds – continued | ||||
| Asset-Backed & Securitized – continued | ||||
| LoanCore 2021-CRE5 Ltd., “AS”, FLR, 5.162% (LIBOR - 1mo. + 1.75%), 7/15/2036 (n) | $ | 23,249,000 | $21,529,948 | |
| LoanCore 2021-CRE5 Ltd., “B”, FLR, 5.412% (LIBOR - 1mo. + 2%), 7/15/2036 (n) | 8,432,000 | 7,780,487 | ||
| LoanCore 2021-CRE6 Ltd., “B”, FLR, 5.312% (LIBOR - 1mo. + 1.9%), 11/15/2038 (n) | 42,852,000 | 39,845,847 | ||
| Madison Park Funding Ltd., 2017- 23A, “CR”, FLR, 6.358% (LIBOR - 3mo. + 2%), 7/27/2031 (n) | 24,271,403 | 22,664,757 | ||
| Merrill Lynch Mortgage Investors, Inc., 4.166%, 2/25/2037 (a)(d) | 1,810,362 | 246,574 | ||
| MF1 2020-FL4 Ltd., “AS”, FLR, 5.59% (LIBOR - 1mo. + 2.1%), 11/15/2035 (n) | 10,615,000 | 10,170,843 | ||
| MF1 2021-FL5 Ltd., “C”, FLR, 5.19% (LIBOR - 1mo. + 1.7%), 7/15/2036 (n) | 10,670,500 | 9,898,713 | ||
| MF1 2022-FL8 Ltd., “C”, FLR, 5.094% (SOFR - 30 day + 2.2%), 2/19/2037 (n) | 10,626,099 | 9,975,824 | ||
| MF1 2022-FL8 Ltd., “D”, FLR, 5.544% (SOFR - 30 day + 2.65%), 2/19/2037 (n) | 6,141,972 | 5,633,253 | ||
| MidOcean Credit CLO, 2013-2A, “BR”, FLR, 6.065% (LIBOR - 3mo. + 1.65%), 1/29/2030 (n) | 31,520,702 | 30,043,736 | ||
| Morgan Stanley Bank of America Merrill Lynch Trust, 2015-C21, “A4”, 3.338%, 3/15/2048 | 8,114,737 | 7,607,615 | ||
| Neuberger Berman CLO Ltd., 2013-15A, “CR2”, FLR, 5.929% (LIBOR - 3mo. + 1.85%), 10/15/2029 (n) | 5,663,303 | 5,240,135 | ||
| Neuberger Berman CLO Ltd., 2016-21A, “CR2”, 6.293%, 4/20/2034 (n) | 9,973,559 | 9,129,776 | ||
| Neuberger Berman CLO Ltd., 2017-16SA, “BR”, FLR, 5.479% (LIBOR - 3mo. + 1.4%), 4/15/2034 (n) | 20,000,000 | 18,753,120 | ||
| Oaktree CLO 2019-1A Ltd., “BR”, FLR, 6.075% (LIBOR - 3mo. + 1.75%), 4/22/2030 (n) | 16,780,750 | 15,702,771 | ||
| Oaktree CLO 2019-1A Ltd., “CR”, FLR, 6.675% (LIBOR - 3mo. + 2.35%), 4/22/2030 (n) | 22,979,914 | 20,882,422 | ||
| Ownit Mortgage Loan Asset-Backed Certificates, 3.107%, 10/25/2035 | 489,363 | 277,076 | ||
| Palmer Square Loan Funding 2020-1A Ltd., “A2”, FLR, 4.334% (LIBOR - 3mo. + 1.35%), 2/20/2028 (n) | 13,300,000 | 12,926,855 | ||
| Palmer Square Loan Funding 2020-1A Ltd., “B”, FLR, 4.884% (LIBOR - 3mo. + 1.9%), 2/20/2028 (n) | 11,690,351 | 11,287,046 | ||
| Parallel 2015-1A Ltd., “C1R”, FLR, 5.993% (LIBOR - 3mo. + 1.75%), 7/20/2027 (n) | 3,700,000 | 3,611,263 | ||
| Parallel 2015-1A Ltd., “C2R”, FLR, 5.993% (LIBOR - 3mo. + 1.75%), 7/20/2027 (n) | 3,990,000 | 3,858,533 | ||
| PFP III 2021-7 Ltd., “B”, FLR, 4.812% (LIBOR - 1mo. + 1.4%), 4/14/2038 (n) | 3,866,807 | 3,549,056 | ||
| Issuer | Shares/Par | Value ($) | ||
| Bonds – continued | ||||
| Asset-Backed & Securitized – continued | ||||
| PFP III 2021-7 Ltd., “C”, FLR, 5.062% (LIBOR - 1mo. + 1.65%), 4/14/2038 (n) | $ | 6,776,662 | $6,259,474 | |
| Preferred Term Securities XIX Ltd., CDO, FLR, 3.643% (LIBOR - 3mo. + 0.35%), 12/22/2035 (n) | 2,264,360 | 2,026,829 | ||
| Race Point CLO Ltd., 2013-8A, “AR-2”, FLR, 4.024% (LIBOR - 3mo. + 1.04%), 2/20/2030 (n) | 12,674,904 | 12,411,468 | ||
| ReadyCap Commercial Mortgage Trust, 2021-FL7, “C”, FLR, 5.786% (LIBOR - 1mo. + 2.2%), 11/25/2036 (z) | 5,795,000 | 5,369,827 | ||
| ReadyCap Commercial Mortgage Trust, 2021-FL7, “D”, FLR, 6.536% (LIBOR - 1mo. + 2.95%), 11/25/2036 (z) | 6,825,000 | 6,403,352 | ||
| Regatta II Funding L.P., 2013-2A, “BR3”, FLR, 4.512% (LIBOR - 3mo. + 2%), 1/15/2029 (n) | 17,000,000 | 15,884,817 | ||
| Residential Funding Mortgage Securities, Inc., FGIC, 4.345%, 12/25/2035 | 137,728 | 137,169 | ||
| Santander Retail Auto Lease Trust, 2020-A, “C”, 2.08%, 3/20/2024 (n) | 8,132,000 | 8,050,731 | ||
| Securitized Term Auto Receivable Trust, 2019-CRTA, “B”, 2.453%, 3/25/2026 (n) | 1,202,639 | 1,193,234 | ||
| Securitized Term Auto Receivable Trust, 2019-CRTA, “C”, 2.849%, 3/25/2026 (n) | 1,434,103 | 1,423,823 | ||
| Shackleton 2015-8A CLO Ltd., “CR”, FLR, 5.893% (LIBOR - 3mo. + 1.65%), 10/20/2027 (n) | 2,000,000 | 1,909,376 | ||
| Starwood Commercial Mortgage, 2021-FL2, “C”, FLR, 5.543% (LIBOR - 1mo. + 2.1%), 4/18/2038 (n) | 11,255,500 | 10,559,029 | ||
| Starwood Commercial Mortgage, 2022-FL3, “B”, FLR, 4.741% (SOFR - 30 day + 1.95%), 11/15/2038 (n) | 6,082,500 | 5,758,890 | ||
| Starwood Commercial Mortgage, 2022-FL3, “C”, FLR, 4.991% (SOFR - 30 day + 2.2%), 11/15/2038 (n) | 11,508,500 | 10,837,757 | ||
| Thornburg Mortgage Securities Trust, FLR, 4.266% (LIBOR - 1mo. + 0.68%), 4/25/2043 | 605 | 601 | ||
| TICP CLO 2018-IA Ltd., “A2”, FLR, 5.827% (LIBOR - 3mo. + 1.5%), 4/26/2028 (n) | 16,262,022 | 15,861,471 | ||
| UBS Commercial Mortgage Trust, 2017-C7, “A4”, 3.679%, 12/15/2050 | 33,000,000 | 30,005,078 | ||
| UBS Commercial Mortgage Trust, 2017-C8, “A4”, 3.983%, 2/15/2051 | 18,388,578 | 16,780,493 | ||
| Voya CLO 2012-4A Ltd., “A2R3”, FLR, 5.529% (LIBOR - 3mo. + 1.45%), 10/15/2030 (n) | 8,202,288 | 7,680,639 | ||
| Voya CLO 2012-4A Ltd., “BR3”, FLR, 6.029% (LIBOR - 3mo. + 1.95%), 10/15/2030 (n) | 3,474,736 | 3,158,056 | ||
| Voya CLO 2012-4A Ltd., “C1R3”, FLR, 7.379% (LIBOR - 3mo. + 3.3%), 10/15/2030 (n) | 4,942,894 | 4,318,834 | ||
| Issuer | Shares/Par | Value ($) | ||
| Bonds – continued | ||||
| Asset-Backed & Securitized – continued | ||||
| Wells Fargo Commercial Mortgage Trust, 2015-C28, “A4”, 3.54%, 5/15/2048 | $ | 15,451,790 | $14,631,978 | |
| Wells Fargo Commercial Mortgage Trust, 2016-C34, “A4”, 3.096%, 6/15/2049 | 7,740,000 | 7,088,335 | ||
| Wells Fargo Commercial Mortgage Trust, 2016-LC25, “A4”, 3.64%, 12/15/2059 | 25,027,917 | 23,049,603 | ||
| Wells Fargo Commercial Mortgage Trust, 2017-C42, “A5”, 3.589%, 12/15/2050 | 13,470,000 | 12,105,279 | ||
| $1,205,347,190 | ||||
| Automotive – 0.2% | ||||
| Stellantis N.V., 2.691%, 9/15/2031 (n) | $ | 14,723,000 | $10,487,329 | |
| Volkswagen Group of America Finance LLC, 3.2%, 9/26/2026 (n) | 1,522,000 | 1,378,195 | ||
| Volkswagen Group of America Finance LLC, 3.75%, 5/13/2030 (n) | 5,056,000 | 4,276,390 | ||
| $16,141,914 | ||||
| Broadcasting – 1.1% | ||||
| Discovery, Inc., 4.65%, 5/15/2050 | $ | 11,068,000 | $7,258,787 | |
| Magallanes, Inc., 5.05%, 3/15/2042 (n) | 24,492,000 | 17,918,227 | ||
| Magallanes, Inc., 5.141%, 3/15/2052 (n) | 21,194,000 | 14,798,041 | ||
| Magallanes, Inc., 5.391%, 3/15/2062 (n) | 8,483,000 | 5,917,274 | ||
| Prosus N.V., 3.68%, 1/21/2030 (n) | 17,751,000 | 13,063,431 | ||
| WMG Acquisition Corp., 3%, 2/15/2031 (n) | 20,043,000 | 15,641,357 | ||
| $74,597,117 | ||||
| Brokerage & Asset Managers – 1.2% | ||||
| Charles Schwab Corp., 5% to 6/01/2027, FLR (CMT - 5yr. + 3.256%) to 6/01/2170 | $ | 26,796,000 | $23,781,450 | |
| Intercontinental Exchange, Inc., 2.1%, 6/15/2030 | 2,539,000 | 2,032,825 | ||
| LPL Holdings, Inc., 4%, 3/15/2029 (n) | 21,696,000 | 18,936,052 | ||
| Morgan Stanley Domestic Holdings, Inc., 3.8%, 8/24/2027 | 18,580,000 | 17,016,362 | ||
| Morgan Stanley Domestic Holdings, Inc., 4.5%, 6/20/2028 | 8,585,000 | 8,014,540 | ||
| Raymond James Financial, Inc., 4.95%, 7/15/2046 | 14,019,000 | 11,869,224 | ||
| $81,650,453 | ||||
| Building – 0.6% | ||||
| ABC Supply Co., Inc., 4%, 1/15/2028 (n) | $ | 5,230,000 | $4,614,900 | |
| Standard Industries, Inc., 4.375%, 7/15/2030 (n) | 17,370,000 | 14,044,513 | ||
| Standard Industries, Inc., 3.375%, 1/15/2031 (n) | 15,475,000 | 11,578,395 | ||
| Vulcan Materials Co., 3.5%, 6/01/2030 | 9,570,000 | 8,133,876 | ||
| $38,371,684 | ||||
| Issuer | Shares/Par | Value ($) | ||
| Bonds – continued | ||||
| Business Services – 0.9% | ||||
| Equinix, Inc., 1.8%, 7/15/2027 | $ | 9,219,000 | $7,671,449 | |
| Equinix, Inc., 2.15%, 7/15/2030 | 21,402,000 | 16,292,259 | ||
| Fiserv, Inc., 3.5%, 7/01/2029 | 17,324,000 | 15,030,638 | ||
| Iron Mountain, Inc., 4.5%, 2/15/2031 (n) | 27,150,000 | 21,991,364 | ||
| $60,985,710 | ||||
| Cable TV – 1.7% | ||||
| CCO Holdings LLC/CCO Holdings Capital Corp., 4.5%, 8/15/2030 (n) | $ | 17,665,000 | $14,336,207 | |
| Charter Communications Operating LLC/Charter Communications Operating Capital Corp., 4.908%, 7/23/2025 | 10,635,000 | 10,324,700 | ||
| Charter Communications Operating LLC/Charter Communications Operating Capital Corp., 6.384%, 10/23/2035 | 6,428,000 | 5,871,107 | ||
| Charter Communications Operating LLC/Charter Communications Operating Capital Corp., 5.25%, 4/01/2053 | 35,959,000 | 27,037,517 | ||
| CSC Holdings LLC, 4.125%, 12/01/2030 (n) | 17,470,000 | 13,744,872 | ||
| CSC Holdings LLC, 4.5%, 11/15/2031 (n) | 16,620,000 | 12,926,621 | ||
| Sirius XM Radio, Inc., 5.5%, 7/01/2029 (n) | 8,250,000 | 7,608,975 | ||
| Sirius XM Radio, Inc., 4.125%, 7/01/2030 (n) | 15,640,000 | 12,798,035 | ||
| Time Warner Cable, Inc., 4.5%, 9/15/2042 | 9,503,000 | 6,488,897 | ||
| Time Warner Entertainment Co. LP, 8.375%, 7/15/2033 | 4,688,000 | 4,955,848 | ||
| $116,092,779 | ||||
| Chemicals – 0.2% | ||||
| Axalta Coating Systems Ltd., 3.375%, 2/15/2029 (n) | $ | 19,805,000 | $16,277,234 | |
| Computer Software – 0.4% | ||||
| Dell International LLC/EMC Corp., 5.3%, 10/01/2029 | $ | 26,757,000 | $25,049,495 | |
| Computer Software - Systems – 0.2% | ||||
| SS&C Technologies Holdings, Inc., 5.5%, 9/30/2027 (n) | $ | 11,982,000 | $11,140,758 | |
| Conglomerates – 0.7% | ||||
| BWX Technologies, Inc., 4.125%, 6/30/2028 (n) | $ | 9,016,000 | $7,889,000 | |
| Carrier Global Corp., 3.577%, 4/05/2050 | 27,527,000 | 18,465,439 | ||
| Westinghouse Air Brake Technologies Corp., 4.95%, 9/15/2028 | 21,336,000 | 19,846,404 | ||
| $46,200,843 | ||||
| Consumer Products – 0.3% | ||||
| GSK Consumer Healthcare Capital US LLC, 3.375%, 3/24/2029 | $ | 6,859,000 | $5,981,803 | |
| GSK Consumer Healthcare Capital US LLC, 3.625%, 3/24/2032 | 15,416,000 | 12,987,656 | ||
| $18,969,459 | ||||
| Issuer | Shares/Par | Value ($) | ||
| Bonds – continued | ||||
| Consumer Services – 0.4% | ||||
| Match Group Holdings II LLC, 3.625%, 10/01/2031 (n) | $ | 12,640,000 | $9,634,966 | |
| Toll Road Investors Partnership II LP, Capital Appreciation, NPFG, 0%, 2/15/2026 (n) | 5,237,000 | 4,156,492 | ||
| Toll Road Investors Partnership II LP, Capital Appreciation, NPFG, 0%, 2/15/2029 (n) | 15,190,000 | 9,874,847 | ||
| Toll Road Investors Partnership II LP, Capital Appreciation, NPFG, 0%, 2/15/2031 (n) | 5,237,000 | 2,956,994 | ||
| Toll Road Investors Partnership II LP, Capital Appreciation, NPFG, 0%, 2/15/2043 (n) | 17,518,127 | 4,078,103 | ||
| $30,701,402 | ||||
| Containers – 0.1% | ||||
| Crown Americas LLC/Crown Americas Capital Corp. VI, 4.75%, 2/01/2026 | $ | 8,718,000 | $8,344,085 | |
| Electrical Equipment – 0.2% | ||||
| Arrow Electronics, Inc., 2.95%, 2/15/2032 | $ | 21,913,000 | $16,654,925 | |
| Electronics – 0.7% | ||||
| Broadcom, Inc., 4.15%, 11/15/2030 | $ | 8,877,000 | $7,634,859 | |
| Broadcom, Inc., 3.469%, 4/15/2034 (n) | 14,353,000 | 10,743,318 | ||
| Broadcom, Inc., 3.137%, 11/15/2035 (n) | 12,875,000 | 8,931,052 | ||
| Broadcom, Inc., 3.187%, 11/15/2036 (n) | 12,521,000 | 8,540,119 | ||
| Broadcom, Inc., 4.926%, 5/15/2037 (n) | 12,031,000 | 9,919,688 | ||
| $45,769,036 | ||||
| Emerging Market Quasi-Sovereign – 0.1% | ||||
| Indian Railway Finance Corp., 2.8%, 2/10/2031 (n) | $ | 5,243,000 | $3,916,487 | |
| Energy - Independent – 0.7% | ||||
| Energean Israel Finance Ltd., 4.875%, 3/30/2026 | $ | 16,253,000 | $14,587,067 | |
| EQT Corp., 5%, 1/15/2029 | 5,901,000 | 5,481,797 | ||
| Leviathan Bond Ltd., 6.5%, 6/30/2027 (n) | 9,070,000 | 8,457,775 | ||
| Leviathan Bond Ltd., 6.75%, 6/30/2030 (n) | 11,033,000 | 9,830,624 | ||
| Tengizchevroil Finance Co. International Ltd., 3.25%, 8/15/2030 | 13,596,000 | 9,265,674 | ||
| $47,622,937 | ||||
| Energy - Integrated – 0.4% | ||||
| Eni S.p.A., 4%, 9/12/2023 (n) | $ | 13,354,000 | $13,110,273 | |
| Eni S.p.A., 4.25%, 5/09/2029 (n) | 13,598,000 | 12,189,410 | ||
| $25,299,683 | ||||
| Issuer | Shares/Par | Value ($) | ||
| Bonds – continued | ||||
| Financial Institutions – 1.8% | ||||
| AerCap Ireland Capital DAC/AerCap Global Aviation Trust, 4.5%, 9/15/2023 | $ | 18,880,000 | $18,541,083 | |
| AerCap Ireland Capital DAC/AerCap Global Aviation Trust, 6.5%, 7/15/2025 | 12,700,000 | 12,501,701 | ||
| AerCap Ireland Capital DAC/AerCap Global Aviation Trust, 3%, 10/29/2028 | 10,175,000 | 8,220,084 | ||
| AerCap Ireland Capital DAC/AerCap Global Aviation Trust, 3.3%, 1/30/2032 | 12,067,000 | 9,056,903 | ||
| Avolon Holdings Funding Ltd., 5.25%, 5/15/2024 (n) | 15,117,000 | 14,631,200 | ||
| Avolon Holdings Funding Ltd., 3.95%, 7/01/2024 (n) | 12,497,000 | 11,699,889 | ||
| Avolon Holdings Funding Ltd., 2.125%, 2/21/2026 (n) | 12,112,000 | 9,930,411 | ||
| Avolon Holdings Funding Ltd., 4.25%, 4/15/2026 (n) | 7,451,000 | 6,513,166 | ||
| Avolon Holdings Funding Ltd., 3.25%, 2/15/2027 (n) | 7,098,000 | 5,798,848 | ||
| Avolon Holdings Funding Ltd., 2.528%, 11/18/2027 (n) | 5,071,000 | 3,870,988 | ||
| Avolon Holdings Funding Ltd., 2.75%, 2/21/2028 (n) | 10,959,000 | 8,377,239 | ||
| Global Aircraft Leasing Co. Ltd., 6.5% (6.5% cash or 7.25% PIK), 9/15/2024 (n)(p) | 14,582,455 | 11,570,486 | ||
| $120,711,998 | ||||
| Food & Beverages – 0.6% | ||||
| Anheuser-Busch InBev Worldwide, Inc., 5.45%, 1/23/2039 | $ | 7,779,000 | $7,308,112 | |
| JBS USA Lux S.A./JBS USA Finance, Inc., 5.5%, 1/15/2030 (n) | 20,690,000 | 18,860,144 | ||
| PT Indofood CBP Sukses Makmur Tbk, 3.541%, 4/27/2032 | 22,400,000 | 16,273,948 | ||
| $42,442,204 | ||||
| Gaming & Lodging – 0.3% | ||||
| Marriott International, Inc., 3.5%, 10/15/2032 | $ | 12,991,000 | $10,375,763 | |
| Marriott International, Inc., 2.75%, 10/15/2033 | 18,167,000 | 13,189,744 | ||
| $23,565,507 | ||||
| Insurance – 0.3% | ||||
| Corebridge Financial, Inc., 3.9%, 4/05/2032 (n) | $ | 15,987,000 | $13,361,965 | |
| Corebridge Financial, Inc., 4.35%, 4/05/2042 (n) | 1,846,000 | 1,383,798 | ||
| Corebridge Financial, Inc., 4.4%, 4/05/2052 (n) | 5,568,000 | 4,065,857 | ||
| $18,811,620 | ||||
| Insurance - Property & Casualty – 1.4% | ||||
| Allied World Assurance Co. Holdings Ltd., 4.35%, 10/29/2025 | $ | 13,217,000 | $12,526,417 | |
| Ambac Assurance Corp., 5.1%, 6/07/2060 (z) | 13,854 | 19,326 | ||
| American International Group, Inc., 3.9%, 4/01/2026 | 3,649,000 | 3,476,579 | ||
| Aon Corp., 3.75%, 5/02/2029 | 23,260,000 | 20,711,133 | ||
| Aon Corp./Aon Global Holdings PLC, 2.6%, 12/02/2031 | 2,778,000 | 2,148,171 | ||
| Brown & Brown, Inc., 4.2%, 3/17/2032 | 15,616,000 | 13,103,138 | ||
| Brown & Brown, Inc., 4.95%, 3/17/2052 | 18,116,000 | 13,766,363 | ||
| Issuer | Shares/Par | Value ($) | ||
| Bonds – continued | ||||
| Insurance - Property & Casualty – continued | ||||
| Fairfax Financial Holdings Ltd., 4.85%, 4/17/2028 | $ | 15,409,000 | $14,171,208 | |
| Fairfax Financial Holdings Ltd., 3.375%, 3/03/2031 | 7,257,000 | 5,687,071 | ||
| Liberty Mutual Group, Inc., 3.951%, 10/15/2050 (n) | 11,271,000 | 7,248,266 | ||
| $92,857,672 | ||||
| International Market Quasi-Sovereign – 0.1% | ||||
| Electricite de France S.A., 4.875%, 9/21/2038 (n) | $ | 6,911,000 | $5,278,730 | |
| Machinery & Tools – 0.0% | ||||
| CNH Industrial Capital LLC, 4.2%, 1/15/2024 | $ | 3,387,000 | $3,329,006 | |
| Major Banks – 7.1% | ||||
| Bank of America Corp., 3.419% to 12/20/2027, FLR (LIBOR - 3mo. + 1.04%) to 12/20/2028 | $ | 7,070,000 | $6,241,107 | |
| Bank of America Corp., 3.97% to 3/05/2028, FLR (LIBOR - 3mo. + 1.07%) to 3/05/2029 | 8,931,000 | 8,031,955 | ||
| Bank of America Corp., 2.496% to 2/13/2030, FLR (LIBOR - 3mo. + 0.99%) to 2/13/2031 | 39,891,000 | 31,341,097 | ||
| Bank of America Corp., 2.572% to 10/20/2031, FLR (SOFR + 1.21%) to 10/20/2032 | 45,881,000 | 34,614,516 | ||
| Bank of America Corp., 6.5% to 10/23/2024, FLR (LIBOR - 3mo. + 4.174%) to 10/23/2049 | 4,140,000 | 4,108,950 | ||
| Bank of America Corp., 6.1% to 3/17/2025, FLR (LIBOR - 3mo. + 3.898%) to 12/29/2049 | 15,392,000 | 14,853,280 | ||
| Bank of America Corp., 5.875% to 3/15/2028, FLR (LIBOR - 3mo. + 2.931%) to 12/31/2059 | 13,771,000 | 11,853,388 | ||
| Barclays PLC, 4.375%, 1/12/2026 | 4,820,000 | 4,474,687 | ||
| Barclays PLC, 4.972% to 5/16/2028, FLR (LIBOR - 3mo. + 1.902%) to 5/16/2029 | 7,802,000 | 6,910,260 | ||
| Barclays PLC, 2.894% to 11/24/2031, FLR (CMT - 1yr. + 1.3%) to 11/24/2032 | 16,966,000 | 12,012,879 | ||
| Deutsche Bank AG, 2.311% to 11/16/2026, FLR (SOFR - 1 day + 1.219%) to 11/16/2027 | 23,182,000 | 18,503,943 | ||
| Goldman Sachs Group, Inc., 2.6%, 2/07/2030 | 15,968,000 | 12,698,944 | ||
| Goldman Sachs Group, Inc., 2.65% to 10/21/2031, FLR (SOFR - 1 day + 1.264%) to 10/21/2032 | 26,935,000 | 20,391,815 | ||
| HSBC Holdings PLC, 4.7% to 9/09/2031, FLR (CMT - 1yr. + 3.25%) to 9/09/2169 | 25,500,000 | 17,740,101 | ||
| HSBC Holdings PLC, 4% to 9/09/2026, FLR (CMT - 1yr. + 3.222%) to 9/09/2170 | 10,111,000 | 7,890,321 | ||
| JPMorgan Chase & Co., 3.509%, 1/23/2029 | 18,395,000 | 16,237,070 | ||
| JPMorgan Chase & Co., 4.005%, 4/23/2029 | 28,117,000 | 25,343,411 | ||
| JPMorgan Chase & Co., 4.203% to 7/23/2028, FLR (LIBOR - 3mo. + 1.26%) to 7/23/2029 | 9,246,000 | 8,366,285 | ||
| Issuer | Shares/Par | Value ($) | ||
| Bonds – continued | ||||
| Major Banks – continued | ||||
| JPMorgan Chase & Co., 2.739% to 10/15/2029, FLR (SOFR - 1 day + 1.51%) to 10/15/2030 | $ | 16,953,000 | $13,677,321 | |
| JPMorgan Chase & Co., 2.956% to 5/13/2030, FLR (SOFR - 1 day + 2.515%) to 5/13/2031 | 7,484,000 | 5,887,913 | ||
| JPMorgan Chase & Co., 2.545% to 11/08/2031, FLR (SOFR - 1 day + 1.18%) to 11/08/2032 | 29,061,000 | 21,931,013 | ||
| Lloyds Bank PLC, 3.75%, 1/11/2027 | 3,975,000 | 3,567,355 | ||
| Mitsubishi UFJ Financial Group, Inc., 2.048%, 7/17/2030 | 31,223,000 | 23,286,471 | ||
| Morgan Stanley, 3.125%, 7/27/2026 | 12,844,000 | 11,721,223 | ||
| Morgan Stanley, 2.699% to 1/22/2030, FLR (SOFR - 1 day + 1.143%) to 1/22/2031 | 7,037,000 | 5,634,867 | ||
| Morgan Stanley, 2.511% to 10/20/2031, FLR (SOFR - 1 day + 1.2%) to 10/20/2032 | 19,284,000 | 14,518,711 | ||
| Sumitomo Mitsui Financial Group, Inc., 2.13%, 7/08/2030 | 38,002,000 | 28,509,259 | ||
| Sumitomo Mitsui Trust Bank Ltd., 0.85%, 3/25/2024 (n) | 6,036,000 | 5,650,022 | ||
| UBS Group AG, 4.375% to 2/10/2031, FLR (CMT - 1yr. + 3.313%) to 8/10/2069 (n) | 30,010,000 | 20,846,446 | ||
| UBS Group Funding (Jersey) Ltd., 4.125%, 9/24/2025 (n) | 6,610,000 | 6,258,165 | ||
| UBS Group Funding (Switzerland) AG, 4.253%, 3/23/2028 (n) | 10,491,000 | 9,330,322 | ||
| Wells Fargo & Co., 2.572% to 2/11/2030, FLR (LIBOR - 3mo. +1%) to 2/11/2031 | 45,462,000 | 36,228,858 | ||
| Westpac Banking Corp., 2.894% to 2/4/2025, FLR (CMT - 5yr. + 1.35%) to 2/04/2030 | 18,137,000 | 16,558,257 | ||
| $485,220,212 | ||||
| Medical & Health Technology & Services – 1.7% | ||||
| Alcon, Inc., 2.75%, 9/23/2026 (n) | $ | 4,432,000 | $3,941,361 | |
| Alcon, Inc., 3%, 9/23/2029 (n) | 11,067,000 | 9,220,334 | ||
| Alcon, Inc., 2.6%, 5/27/2030 (n) | 4,431,000 | 3,563,684 | ||
| CommonSpirit Health, 2.95%, 11/01/2022 | 9,078,000 | 9,078,000 | ||
| DaVita, Inc., 4.625%, 6/01/2030 (n) | 15,220,000 | 11,865,893 | ||
| HCA Healthcare, Inc., 4.375%, 3/15/2042 (n) | 14,385,000 | 10,808,081 | ||
| HCA Healthcare, Inc., 4.625%, 3/15/2052 (n) | 9,681,000 | 7,130,363 | ||
| HCA, Inc., 5.25%, 6/15/2026 | 6,743,000 | 6,534,841 | ||
| HCA, Inc., 4.125%, 6/15/2029 | 14,251,000 | 12,575,204 | ||
| Northwell Healthcare, Inc., 3.979%, 11/01/2046 | 3,110,000 | 2,212,380 | ||
| Northwell Healthcare, Inc., 4.26%, 11/01/2047 | 9,132,000 | 6,737,959 | ||
| ProMedica Toledo Hospital, “B”, 5.325%, 11/15/2028 | 23,983,000 | 15,847,487 | ||
| ProMedica Toledo Hospital, “B”, AGM, 5.75%, 11/15/2038 | 9,026,000 | 8,048,317 | ||
| Tower Health, 4.451%, 2/01/2050 | 22,087,000 | 11,374,805 | ||
| $118,938,709 | ||||
| Issuer | Shares/Par | Value ($) | ||
| Bonds – continued | ||||
| Metals & Mining – 1.1% | ||||
| Anglo American Capital PLC, 2.25%, 3/17/2028 (n) | $ | 10,712,000 | $8,684,848 | |
| Anglo American Capital PLC, 3.875%, 3/16/2029 (n) | 16,098,000 | 13,808,098 | ||
| Anglo American Capital PLC, 2.875%, 3/17/2031 (n) | 12,521,000 | 9,624,081 | ||
| Anglo American Capital PLC, 4.75%, 3/16/2052 (n) | 20,205,000 | 15,034,726 | ||
| Glencore Funding LLC, 4.125%, 5/30/2023 (n) | 5,720,000 | 5,659,018 | ||
| Glencore Funding LLC, 2.85%, 4/27/2031 (n) | 17,296,000 | 13,388,935 | ||
| Novelis Corp., 3.25%, 11/15/2026 (n) | 3,169,000 | 2,773,625 | ||
| Novelis Corp., 3.875%, 8/15/2031 (n) | 11,091,000 | 8,592,309 | ||
| $77,565,640 | ||||
| Midstream – 2.0% | ||||
| Cheniere Corpus Christi Holdings LLC, 2.742%, 12/31/2039 | $ | 16,500,000 | $12,243,522 | |
| Cheniere Energy Partners LP, 4.5%, 10/01/2029 | 13,412,000 | 11,842,125 | ||
| Enbridge, Inc., 4.25%, 12/01/2026 | 9,961,000 | 9,427,278 | ||
| Kinder Morgan (Delaware), Inc., 7.75%, 1/15/2032 | 7,347,000 | 7,985,675 | ||
| Kinder Morgan Energy Partners LP, 6.375%, 3/01/2041 | 6,112,000 | 5,648,293 | ||
| Kinder Morgan Energy Partners LP, 5.4%, 9/01/2044 | 7,661,000 | 6,407,960 | ||
| MPLX LP, 4.95%, 3/14/2052 | 32,980,000 | 25,495,497 | ||
| ONEOK, Inc., 5.2%, 7/15/2048 | 13,639,000 | 10,600,460 | ||
| Plains All American Pipeline LP/PAA Finance Corp., 3.55%, 12/15/2029 | 33,187,000 | 27,654,239 | ||
| Sabine Pass Liquefaction LLC, 4.2%, 3/15/2028 | 5,255,000 | 4,791,701 | ||
| Sabine Pass Liquefaction LLC, 4.5%, 5/15/2030 | 5,465,000 | 4,984,560 | ||
| Targa Resources Corp., 4.2%, 2/01/2033 | 4,099,000 | 3,421,886 | ||
| Targa Resources Corp., 4.95%, 4/15/2052 | 6,758,000 | 5,070,782 | ||
| $135,573,978 | ||||
| Mortgage-Backed – 21.9% | ||||
| Fannie Mae, 2.41%, 5/01/2023 | $ | 2,225,701 | $2,191,253 | |
| Fannie Mae, 5%, 3/01/2024 - 3/01/2042 | 4,979,322 | 4,977,670 | ||
| Fannie Mae, 5.25%, 8/01/2024 | 791,333 | 788,827 | ||
| Fannie Mae, 4.5%, 5/01/2025 - 6/01/2044 | 23,049,378 | 22,250,455 | ||
| Fannie Mae, 2.64%, 12/25/2026 | 8,415,229 | 7,703,638 | ||
| Fannie Mae, 3.95%, 1/01/2027 | 591,433 | 573,091 | ||
| Fannie Mae, 3.5%, 1/01/2028 - 12/01/2047 | 31,932,879 | 28,948,533 | ||
| Fannie Mae, 3%, 11/01/2028 - 11/01/2048 | 29,606,809 | 26,009,327 | ||
| Fannie Mae, 2.5%, 11/01/2031 - 11/01/2046 | 2,776,336 | 2,343,255 | ||
| Fannie Mae, 6.5%, 11/01/2031 - 1/01/2033 | 50,242 | 51,801 | ||
| Fannie Mae, 3%, 2/25/2033 (i) | 1,343,108 | 124,502 | ||
| Fannie Mae, 5.5%, 3/01/2033 - 12/01/2038 | 4,718,343 | 4,819,411 | ||
| Fannie Mae, 6%, 5/01/2034 - 10/01/2038 | 2,034,858 | 2,090,333 | ||
| Fannie Mae, 3.25%, 5/25/2040 | 415,770 | 381,603 | ||
| Fannie Mae, 4%, 9/01/2040 - 12/01/2048 | 39,369,326 | 36,888,778 | ||
| Fannie Mae, 2%, 10/25/2040 - 4/25/2046 | 850,392 | 769,366 | ||
| Issuer | Shares/Par | Value ($) | ||
| Bonds – continued | ||||
| Mortgage-Backed – continued | ||||
| Fannie Mae, 4%, 7/25/2046 (i) | $ | 1,381,224 | $265,746 | |
| Fannie Mae, UMBS, 2%, 10/01/2036 - 9/01/2052 | 152,031,520 | 125,057,690 | ||
| Fannie Mae, UMBS, 2.5%, 5/01/2037 - 11/01/2052 | 232,558,799 | 192,457,809 | ||
| Fannie Mae, UMBS, 1.5%, 9/01/2041 - 2/01/2042 | 1,069,824 | 846,819 | ||
| Fannie Mae, UMBS, 5.5%, 5/01/2044 | 1,964,938 | 2,014,841 | ||
| Fannie Mae, UMBS, 3.5%, 5/01/2049 - 7/01/2052 | 6,662,947 | 5,922,733 | ||
| Fannie Mae, UMBS, 3%, 6/01/2051 - 10/01/2052 | 56,492,518 | 48,237,862 | ||
| Fannie Mae, UMBS, 5%, 9/01/2052 | 21,756,638 | 20,998,337 | ||
| Freddie Mac, 3.32%, 2/25/2023 | 4,403,025 | 4,381,556 | ||
| Freddie Mac, 3.25%, 4/25/2023 - 11/25/2061 | 10,615,835 | 10,093,809 | ||
| Freddie Mac, 3.06%, 7/25/2023 | 1,328,995 | 1,311,286 | ||
| Freddie Mac, 3.531%, 7/25/2023 | 2,815,567 | 2,783,109 | ||
| Freddie Mac, 3.458%, 8/25/2023 | 8,785,395 | 8,677,090 | ||
| Freddie Mac, 2.67%, 12/25/2024 | 4,982,063 | 4,759,230 | ||
| Freddie Mac, 2.811%, 1/25/2025 | 6,443,164 | 6,162,094 | ||
| Freddie Mac, 3.329%, 5/25/2025 | 8,738,328 | 8,417,269 | ||
| Freddie Mac, 4%, 7/01/2025 - 4/01/2044 | 4,653,919 | 4,378,609 | ||
| Freddie Mac, 4.5%, 7/01/2025 - 5/01/2042 | 5,661,169 | 5,483,300 | ||
| Freddie Mac, 3.3%, 10/25/2026 | 4,957,000 | 4,679,449 | ||
| Freddie Mac, 3.117%, 6/25/2027 | 17,177,017 | 16,000,087 | ||
| Freddie Mac, 3%, 6/15/2028 - 2/25/2059 | 28,152,788 | 24,815,801 | ||
| Freddie Mac, 4.06%, 10/25/2028 | 5,001,000 | 4,777,790 | ||
| Freddie Mac, 1.091%, 7/25/2029 (i) | 12,679,604 | 732,430 | ||
| Freddie Mac, 1.144%, 8/25/2029 (i) | 22,332,761 | 1,348,964 | ||
| Freddie Mac, 1.868%, 4/25/2030 (i) | 6,415,004 | 705,704 | ||
| Freddie Mac, 5.5%, 8/01/2033 - 1/01/2038 | 1,095,348 | 1,117,263 | ||
| Freddie Mac, 6%, 11/01/2033 - 7/01/2038 | 620,783 | 629,827 | ||
| Freddie Mac, 5%, 11/01/2035 - 7/01/2041 | 2,326,169 | 2,327,774 | ||
| Freddie Mac, 5.5%, 2/15/2036 (i) | 259,883 | 43,791 | ||
| Freddie Mac, 3.5%, 11/01/2037 - 10/25/2058 | 20,607,407 | 18,739,648 | ||
| Freddie Mac, 4.5%, 12/15/2040 (i) | 205,343 | 18,674 | ||
| Freddie Mac, 4%, 8/15/2044 (i) | 282,848 | 36,233 | ||
| Freddie Mac, UMBS, 3%, 11/01/2034 - 4/01/2052 | 35,089,468 | 30,116,661 | ||
| Freddie Mac, UMBS, 2%, 4/01/2037 - 8/01/2052 | 283,040,650 | 227,177,345 | ||
| Freddie Mac, UMBS, 2.5%, 4/01/2037 - 11/01/2052 | 85,776,495 | 71,741,676 | ||
| Freddie Mac, UMBS, 3.5%, 12/01/2046 - 9/01/2052 | 53,296,866 | 46,995,442 | ||
| Freddie Mac, UMBS, 5%, 8/01/2052 | 510,905 | 493,415 | ||
| Freddie Mac, UMBS, 4.5%, 9/01/2052 | 4,969,964 | 4,666,198 | ||
| Ginnie Mae, 5.5%, 11/15/2032 - 1/20/2042 | 774,571 | 801,656 | ||
| Ginnie Mae, 6%, 2/15/2034 - 1/15/2038 | 608,575 | 631,310 | ||
| Ginnie Mae, 4.5%, 4/15/2039 - 9/20/2052 | 47,731,689 | 45,488,009 | ||
| Ginnie Mae, 4%, 10/20/2040 - 10/20/2052 | 43,841,308 | 40,508,732 | ||
| Ginnie Mae, 3.5%, 11/15/2040 - 9/20/2052 | 36,419,152 | 32,867,434 | ||
| Issuer | Shares/Par | Value ($) | ||
| Bonds – continued | ||||
| Mortgage-Backed – continued | ||||
| Ginnie Mae, 3%, 11/20/2044 - 7/20/2052 | $ | 51,861,028 | $45,550,378 | |
| Ginnie Mae, 2.5%, 7/20/2051 - 6/20/2052 | 59,839,163 | 50,844,497 | ||
| Ginnie Mae, 2%, 1/20/2052 | 14,973,729 | 12,332,974 | ||
| Ginnie Mae, 5%, 8/20/2052 | 8,154,687 | 7,949,460 | ||
| Ginnie Mae, TBA, 6%, 12/15/2051 | 4,625,000 | 4,643,749 | ||
| Ginnie Mae, TBA, 3%, 11/15/2052 | 21,600,000 | 18,800,438 | ||
| Ginnie Mae, TBA, 3.5%, 11/15/2052 | 21,611,608 | 19,340,476 | ||
| Ginnie Mae, TBA, 5%, 11/15/2052 | 56,300,000 | 54,762,746 | ||
| UMBS, TBA, 3%, 11/25/2037 - 11/25/2052 | 23,009,693 | 20,587,930 | ||
| UMBS, TBA, 2%, 11/25/2052 | 22,450,000 | 17,686,391 | ||
| UMBS, TBA, 4.5%, 11/25/2052 | 10,975,000 | 10,294,207 | ||
| UMBS, TBA, 5.5%, 11/25/2052 - 12/25/2052 | 39,400,000 | 38,819,562 | ||
| UMBS, TBA, 6%, 11/25/2052 - 12/25/2052 | 14,875,000 | 14,917,338 | ||
| $1,487,152,491 | ||||
| Municipals – 1.8% | ||||
| Bridgeview, IL, Stadium and Redevelopment Projects, Taxable, AAC, 5.06%, 12/01/2025 | $ | 2,065,000 | $1,993,439 | |
| Bridgeview, IL, Stadium and Redevelopment Projects, Taxable, AAC, 5.14%, 12/01/2036 | 24,325,000 | 20,960,845 | ||
| Escambia County, FL, Health Facilities Authority Rev., Taxable (Baptist Health Care Corp.), “B”, AGM, 3.607%, 8/15/2040 | 4,565,000 | 3,314,307 | ||
| New Jersey Economic Development Authority State Pension Funding Rev., Capital Appreciation, Taxable, “B”, AGM, 0%, 2/15/2023 | 29,043,000 | 28,644,995 | ||
| New Jersey Economic Development Authority State Pension Funding Rev., Taxable, “A”, NPFG, 7.425%, 2/15/2029 | 25,254,000 | 26,851,444 | ||
| Oklahoma Development Finance Authority, Health System Rev., Taxable (OU Medicine Project), “C”, 5.45%, 8/15/2028 | 9,717,000 | 8,356,049 | ||
| Philadelphia, PA, School District, Taxable, “B”, AGM, 6.615%, 6/01/2030 | 6,320,000 | 6,783,634 | ||
| Philadelphia, PA, School District, Taxable, “B”, AGM, 6.765%, 6/01/2040 | 4,260,000 | 4,678,890 | ||
| State of Florida, Taxable, “A”, 2.154%, 7/01/2030 | 29,316,000 | 22,943,698 | ||
| $124,527,301 | ||||
| Natural Gas - Distribution – 0.6% | ||||
| Boston Gas Co., 3.15%, 8/01/2027 (n) | $ | 18,261,000 | $16,069,897 | |
| KeySpan Gas East Corp., 2.742%, 8/15/2026 (n) | 13,855,000 | 12,208,410 | ||
| NiSource, Inc., 3.6%, 5/01/2030 | 16,331,000 | 14,054,557 | ||
| $42,332,864 | ||||
| Issuer | Shares/Par | Value ($) | ||
| Bonds – continued | ||||
| Network & Telecom – 0.7% | ||||
| AT&T, Inc., 3.5%, 9/15/2053 | $ | 7,351,000 | $4,718,091 | |
| AT&T, Inc., 3.55%, 9/15/2055 | 19,066,000 | 12,132,879 | ||
| Verizon Communications, Inc., 2.55%, 3/21/2031 | 26,553,000 | 20,982,797 | ||
| Verizon Communications, Inc., 4.272%, 1/15/2036 | 9,727,000 | 8,175,742 | ||
| $46,009,509 | ||||
| Oils – 0.2% | ||||
| Marathon Petroleum Corp., 4.75%, 9/15/2044 | $ | 9,202,000 | $7,253,321 | |
| Marathon Petroleum Corp., 5.85%, 12/15/2045 | 4,349,000 | 3,677,649 | ||
| $10,930,970 | ||||
| Other Banks & Diversified Financials – 1.4% | ||||
| Bangkok Bank (Hong Kong), 3.733% to 9/25/2029, FLR (CMT - 5yr. + 1.9%) to 9/25/2034 (n) | $ | 17,102,000 | $12,696,210 | |
| Citigroup, Inc., 2.666% to 1/29/2030, FLR (SOFR - 1 day + 1.146%) to 1/29/2031 | 21,877,000 | 17,398,543 | ||
| Groupe BPCE S.A., 4.5%, 3/15/2025 (n) | 7,743,000 | 7,268,168 | ||
| Macquarie Bank Ltd. of London, 6.125% to 3/08/2027, FLR (Swap Rate - 5yr. + 4.332%) to 12/31/2165 (n) | 14,673,000 | 12,481,161 | ||
| Macquarie Group Ltd., 4.442% to 6/21/2032, FLR (SOFR - 1 day + 2.405%) to 6/21/2033 (n) | 57,968,000 | 48,174,326 | ||
| $98,018,408 | ||||
| Pharmaceuticals – 0.5% | ||||
| Jazz Securities DAC, 4.375%, 1/15/2029 (n) | $ | 23,655,000 | $20,993,812 | |
| Organon Finance 1 LLC, 4.125%, 4/30/2028 (n) | 16,685,000 | 14,696,482 | ||
| $35,690,294 | ||||
| Real Estate - Office – 0.6% | ||||
| Boston Properties Ltd. LP, REIT, 2.55%, 4/01/2032 | $ | 29,885,000 | $21,489,804 | |
| Boston Properties Ltd. LP, REIT, 2.45%, 10/01/2033 | 27,176,000 | 18,737,025 | ||
| $40,226,829 | ||||
| Retailers – 0.2% | ||||
| MercadoLibre, Inc., 3.125%, 1/14/2031 | $ | 20,686,000 | $14,954,116 | |
| Specialty Stores – 0.3% | ||||
| Penske Automotive Group Co., 3.75%, 6/15/2029 | $ | 21,146,000 | $17,359,809 | |
| Telecommunications - Wireless – 1.4% | ||||
| American Tower Corp., REIT, 3.55%, 7/15/2027 | $ | 3,247,000 | $2,901,612 | |
| Crown Castle International Corp., REIT, 4%, 3/01/2027 | 1,300,000 | 1,202,694 | ||
| Crown Castle, Inc., REIT, 3.7%, 6/15/2026 | 3,555,000 | 3,300,008 | ||
| Crown Castle, Inc., REIT, 3.8%, 2/15/2028 | 4,492,000 | 4,049,272 | ||
| Crown Castle, Inc., REIT, 3.25%, 1/15/2051 | 1,841,000 | 1,125,742 | ||
| Issuer | Shares/Par | Value ($) | ||
| Bonds – continued | ||||
| Telecommunications - Wireless – continued | ||||
| Rogers Communications, Inc., 4.5%, 3/15/2042 (n) | $ | 27,147,000 | $21,515,881 | |
| Rogers Communications, Inc., 4.55%, 3/15/2052 (n) | 27,147,000 | 20,972,580 | ||
| SBA Communications Corp., 3.125%, 2/01/2029 | 17,490,000 | 14,135,943 | ||
| T-Mobile USA, Inc., 2.55%, 2/15/2031 | 28,722,000 | 22,717,283 | ||
| T-Mobile USA, Inc., 4.375%, 4/15/2040 | 2,343,000 | 1,907,975 | ||
| $93,828,990 | ||||
| Tobacco – 0.8% | ||||
| B.A.T. Capital Corp., 3.222%, 8/15/2024 | $ | 12,881,000 | $12,311,122 | |
| B.A.T. Capital Corp., 4.906%, 4/02/2030 | 2,485,000 | 2,169,395 | ||
| B.A.T. Capital Corp., 4.742%, 3/16/2032 | 26,499,000 | 22,219,242 | ||
| B.A.T. International Finance PLC, 4.448%, 3/16/2028 | 23,935,000 | 21,198,946 | ||
| $57,898,705 | ||||
| Transportation - Services – 0.4% | ||||
| Element Fleet Management Corp., 1.6%, 4/06/2024 (n) | $ | 13,697,000 | $12,886,163 | |
| ERAC USA Finance LLC, 7%, 10/15/2037 (n) | 11,601,000 | 11,848,819 | ||
| $24,734,982 | ||||
| U.S. Government Agencies and Equivalents – 0.3% | ||||
| Small Business Administration, 4.35%, 7/01/2023 | $ | 10,613 | $10,559 | |
| Small Business Administration, 4.98%, 11/01/2023 | 17,449 | 17,336 | ||
| Small Business Administration, 4.89%, 12/01/2023 | 20,964 | 20,728 | ||
| Small Business Administration, 4.93%, 1/01/2024 | 19,858 | 19,649 | ||
| Small Business Administration, 4.34%, 3/01/2024 | 21,913 | 21,681 | ||
| Small Business Administration, 5.18%, 5/01/2024 | 27,928 | 27,690 | ||
| Small Business Administration, 5.52%, 6/01/2024 | 25,600 | 25,630 | ||
| Small Business Administration, 5.19%, 7/01/2024 | 31,874 | 31,422 | ||
| Small Business Administration, 4.86%, 10/01/2024 | 21,189 | 20,952 | ||
| Small Business Administration, 4.57%, 6/01/2025 | 85,913 | 85,353 | ||
| Small Business Administration, 4.76%, 9/01/2025 | 270,460 | 262,161 | ||
| Small Business Administration, 5.39%, 12/01/2025 | 18,063 | 17,953 | ||
| Small Business Administration, 5.35%, 2/01/2026 | 109,022 | 107,409 | ||
| Small Business Administration, 3.25%, 11/01/2030 | 726,385 | 678,662 | ||
| Small Business Administration, 2.85%, 9/01/2031 | 1,094,809 | 1,008,797 | ||
| Small Business Administration, 2.37%, 8/01/2032 | 747,491 | 670,941 | ||
| Small Business Administration, 2.13%, 1/01/2033 | 1,448,886 | 1,298,113 | ||
| Small Business Administration, 2.21%, 2/01/2033 | 383,676 | 343,432 | ||
| Small Business Administration, 2.22%, 3/01/2033 | 1,201,325 | 1,073,367 | ||
| Small Business Administration, 2.08%, 4/01/2033 | 2,206,944 | 1,967,674 | ||
| Small Business Administration, 2.45%, 6/01/2033 | 2,746,829 | 2,480,815 | ||
| Small Business Administration, 3.15%, 7/01/2033 | 3,337,749 | 3,118,039 | ||
| Small Business Administration, 3.16%, 8/01/2033 | 3,513,952 | 3,293,807 | ||
| Issuer | Shares/Par | Value ($) | ||
| Bonds – continued | ||||
| U.S. Government Agencies and Equivalents – continued | ||||
| Small Business Administration, 3.62%, 9/01/2033 | $ | 1,678,591 | $1,594,771 | |
| $18,196,941 | ||||
| U.S. Treasury Obligations – 19.1% | ||||
| U.S. Treasury Bonds, 1.125%, 8/15/2040 | $ | 27,300,000 | $16,157,121 | |
| U.S. Treasury Bonds, 1.375%, 11/15/2040 | 74,100,000 | 45,777,012 | ||
| U.S. Treasury Bonds, 1.75%, 8/15/2041 | 67,500,000 | 44,054,297 | ||
| U.S. Treasury Bonds, 2.375%, 2/15/2042 | 61,700,000 | 45,050,641 | ||
| U.S. Treasury Bonds, 2.875%, 5/15/2043 | 58,777,000 | 46,073,362 | ||
| U.S. Treasury Bonds, 2.5%, 2/15/2045 (f) | 29,323,000 | 21,102,251 | ||
| U.S. Treasury Bonds, 2.875%, 11/15/2046 | 27,653,000 | 21,270,126 | ||
| U.S. Treasury Bonds, 3%, 2/15/2048 | 19,900,000 | 15,714,004 | ||
| U.S. Treasury Bonds, 2.375%, 11/15/2049 | 34,500,000 | 24,110,918 | ||
| U.S. Treasury Bonds, 1.625%, 11/15/2050 | 67,800,000 | 38,773,125 | ||
| U.S. Treasury Notes, 0.75%, 12/31/2023 (f) | 469,300,000 | 448,603,138 | ||
| U.S. Treasury Notes, 4.25%, 9/30/2024 | 396,000,000 | 393,989,064 | ||
| U.S. Treasury Notes, 0.875%, 6/30/2026 | 120,000,000 | 105,829,687 | ||
| U.S. Treasury Notes, 2.5%, 3/31/2027 | 33,400,000 | 30,988,938 | ||
| $1,297,493,684 | ||||
| Utilities - Electric Power – 2.0% | ||||
| AEP Transmission Co. LLC, 4%, 12/01/2046 | $ | 7,457,000 | $5,526,890 | |
| American Electric Power Co., Inc., 5.95%, 11/01/2032 (w) | 13,723,000 | 13,629,272 | ||
| Calpine Corp., 3.75%, 3/01/2031 (n) | 16,125,000 | 13,210,801 | ||
| Enel Finance International N.V., 3.5%, 4/06/2028 (n) | 30,284,000 | 25,180,246 | ||
| Evergy, Inc., 2.9%, 9/15/2029 | 3,000,000 | 2,477,513 | ||
| FirstEnergy Corp., 2.65%, 3/01/2030 | 15,914,000 | 12,865,196 | ||
| FirstEnergy Corp., 5.35%, 7/15/2047 | 6,821,000 | 5,627,871 | ||
| FirstEnergy Corp., 3.4%, 3/01/2050 | 9,936,000 | 6,172,740 | ||
| Jersey Central Power & Light Co., 2.75%, 3/01/2032 (n) | 21,954,000 | 17,082,846 | ||
| Pacific Gas & Electric Co., 3%, 6/15/2028 | 11,170,000 | 9,190,842 | ||
| Pacific Gas & Electric Co., 3.3%, 8/01/2040 | 34,169,000 | 22,188,582 | ||
| $133,152,799 | ||||
| Total Bonds (Identified Cost, $7,638,695,336) | $6,614,480,859 | |||
| Investment Companies (h) – 4.7% | ||||
| Money Market Funds – 4.7% | ||||
| MFS Institutional Money Market Portfolio, 3.02% (v) (Identified Cost, $321,096,202) | 321,108,661 | $321,108,661 | ||
| Other Assets, Less Liabilities – (2.0)% | (136,499,403) | |||
| Net Assets – 100.0% | $6,799,090,117 | |||
| (a) | Non-income producing security. |
| (d) | In default. |
| (f) | All or a portion of the security has been segregated as collateral for open futures contracts. |
| (h) | An affiliated issuer, which may be considered one in which the fund owns 5% or more of the outstanding voting securities, or a company which is under common control. At period end, the aggregate values of the fund's investments in affiliated issuers and in unaffiliated issuers were $321,108,661 and $6,614,480,859, respectively. |
| (i) | Interest only security for which the fund receives interest on notional principal (Par amount). Par amount shown is the notional principal and does not reflect the cost of the security. |
| (n) | Securities exempt from registration under Rule 144A of the Securities Act of 1933. These securities may be sold in the ordinary course of business in transactions exempt from registration, normally to qualified institutional buyers. At period end, the aggregate value of these securities was $1,843,307,389, representing 27.1% of net assets. |
| (p) | Payment-in-kind (PIK) security for which interest income may be received in additional securities and/or cash. |
| (q) | Interest received was less than stated coupon rate. |
| (v) | Affiliated issuer that is available only to investment companies managed by MFS. The rate quoted for the MFS Institutional Money Market Portfolio is the annualized seven-day yield of the fund at period end. |
| (w) | When-issued security. |
| (z) | Restricted securities are not registered under the Securities Act of 1933 and are subject to legal restrictions on resale. These securities generally may be resold in transactions exempt from registration or to the public if the securities are subsequently registered. Disposal of these securities may involve time-consuming negotiations and prompt sale at an acceptable price may be difficult. The fund holds the following restricted securities: |
| Restricted Securities | Acquisition Date | Cost | Value |
| Ambac Assurance Corp., 5.1%, 6/07/2060 | 2/14/18 | $5,429 | $19,326 |
| Bayview Commercial Asset Trust, 0%, 12/25/2036 | 10/25/06 | 504 | 181 |
| ReadyCap Commercial Mortgage Trust, 2021-FL7, “C”, FLR, 5.786% (LIBOR - 1mo. + 2.2%), 11/25/2036 | 11/12/21 | 5,795,000 | 5,369,827 |
| ReadyCap Commercial Mortgage Trust, 2021-FL7, “D”, FLR, 6.536% (LIBOR - 1mo. + 2.95%), 11/25/2036 | 11/12/21 | 6,825,000 | 6,403,352 |
| Total Restricted Securities | $11,792,686 | ||
| % of Net assets | 0.2% |
| The following abbreviations are used in this report and are defined: | |
| AAC | Ambac Assurance Corp. |
| AGM | Assured Guaranty Municipal |
| CDO | Collateralized Debt Obligation |
| CLO | Collateralized Loan Obligation |
| CMT | Constant Maturity Treasury |
| FGIC | Financial Guaranty Insurance Co. |
| FLR | Floating Rate. Interest rate resets periodically based on the parenthetically disclosed reference rate plus a spread (if any). The period-end rate reported may not be the current rate. All reference rates are USD unless otherwise noted. |
| LIBOR | London Interbank Offered Rate |
| NPFG | National Public Finance Guarantee Corp. |
| REIT | Real Estate Investment Trust |
| SOFR | Secured Overnight Financing Rate |
| TBA | To Be Announced |
| UMBS | Uniform Mortgage-Backed Security |
| Futures Contracts | ||||||
| Description | Long/ Short | Currency | Contracts | Notional Amount | Expiration Date | Value/Unrealized Appreciation (Depreciation) |
| Asset Derivatives | ||||||
| Interest Rate Futures | ||||||
| U.S. Treasury Ultra Note 10 yr | Short | USD | 2,218 | $257,253,344 | December – 2022 | $7,613,467 |
| Liability Derivatives | ||||||
| Interest Rate Futures | ||||||
| U.S. Treasury Note 2 yr | Long | USD | 2,393 | $489,088,069 | December – 2022 | $(10,170,221) |
| U.S. Treasury Note 5 yr | Long | USD | 3,692 | 393,544,125 | December – 2022 | (17,175,594) |
| U.S. Treasury Ultra Bond | Long | USD | 2,386 | 304,587,813 | December – 2022 | (47,963,412) |
| $(75,309,227) | ||||||
| Assets | |
| Investments in unaffiliated issuers, at value (identified cost, $7,638,695,336) | $6,614,480,859 |
| Investments in affiliated issuers, at value (identified cost, $321,096,202) | 321,108,661 |
| Cash | 734,284 |
| Restricted cash for MBS/TBA | 55,391 |
| Receivables for | |
| Investments sold | 27,612,521 |
| TBA sale commitments | 58,702,142 |
| Fund shares sold | 33,293,671 |
| Interest and dividends | 41,503,114 |
| Other assets | 39,338 |
| Total assets | $7,097,529,981 |
| Liabilities | |
| Payables for | |
| Distributions | $1,230,845 |
| Net daily variation margin on open futures contracts | 4,354,253 |
| Investments purchased | 7,417,151 |
| TBA purchase commitments | 261,260,272 |
| Fund shares reacquired | 8,872,604 |
| When-issued investments purchased | 13,629,272 |
| Payable to affiliates | |
| Investment adviser | 22,718 |
| Administrative services fee | 7,004 |
| Shareholder servicing costs | 1,351,125 |
| Distribution and service fees | 42,871 |
| Accrued expenses and other liabilities | 251,749 |
| Total liabilities | $298,439,864 |
| Net assets | $6,799,090,117 |
| Net assets consist of | |
| Paid-in capital | $8,179,720,006 |
| Total distributable earnings (loss) | (1,380,629,889) |
| Net assets | $6,799,090,117 |
| Shares of beneficial interest outstanding | 747,914,843 |
| Net assets | Shares outstanding | Net asset value per share (a) | |
| Class A | $2,115,338,727 | 232,715,846 | $9.09 |
| Class B | 3,707,232 | 407,126 | 9.11 |
| Class C | 43,687,484 | 4,799,310 | 9.10 |
| Class I | 1,306,030,554 | 143,675,456 | 9.09 |
| Class R1 | 1,518,733 | 166,816 | 9.10 |
| Class R2 | 13,884,405 | 1,527,681 | 9.09 |
| Class R3 | 69,609,245 | 7,658,593 | 9.09 |
| Class R4 | 42,694,367 | 4,695,362 | 9.09 |
| Class R6 | 3,202,619,370 | 352,268,653 | 9.09 |
| (a) | Maximum offering price per share was equal to the net asset value per share for all share classes, except for Class A, for which the maximum offering price per share was $9.49 [100 / 95.75 x $9.09]. On sales of $100,000 or more, the maximum offering price of Class A shares is reduced. A contingent deferred sales charge may be imposed on redemptions of Class A, Class B, and Class C shares. Redemption price per share was equal to the net asset value per share for Classes I, R1, R2, R3, R4, and R6. |
| Net investment income (loss) | |
| Income | |
| Interest | $119,346,174 |
| Dividends from affiliated issuers | 4,404,438 |
| Other | 4,035,798 |
| Foreign taxes withheld | (112) |
| Total investment income | $127,786,298 |
| Expenses | |
| Management fee | $14,686,479 |
| Distribution and service fees | 3,308,028 |
| Shareholder servicing costs | 2,188,830 |
| Program manager fees | 513 |
| Administrative services fee | 357,484 |
| Independent Trustees' compensation | 55,541 |
| Custodian fee | 161,749 |
| Shareholder communications | 187,949 |
| Audit and tax fees | 43,521 |
| Legal fees | 18,396 |
| Miscellaneous | 191,566 |
| Total expenses | $21,200,056 |
| Fees paid indirectly | (18,009) |
| Reduction of expenses by investment adviser and distributor | (4,200,403) |
| Net expenses | $16,981,644 |
| Net investment income (loss) | $110,804,654 |
| Realized and unrealized gain (loss) | |
| Realized gain (loss) (identified cost basis) | |
| Unaffiliated issuers | $(95,096,124) |
| Affiliated issuers | (16,737) |
| Futures contracts | (70,583,196) |
| Net realized gain (loss) | $(165,696,057) |
| Change in unrealized appreciation or depreciation | |
| Unaffiliated issuers | $(493,009,642) |
| Affiliated issuers | 12,459 |
| Futures contracts | (30,285,501) |
| Net unrealized gain (loss) | $(523,282,684) |
| Net realized and unrealized gain (loss) | $(688,978,741) |
| Change in net assets from operations | $(578,174,087) |
| Six months ended | Year ended | |
| 10/31/22 (unaudited) | 4/30/22 | |
| Change in net assets | ||
| From operations | ||
| Net investment income (loss) | $110,804,654 | $165,119,175 |
| Net realized gain (loss) | (165,696,057) | (62,366,751) |
| Net unrealized gain (loss) | (523,282,684) | (806,212,654) |
| Change in net assets from operations | $(578,174,087) | $(703,460,230) |
| Total distributions to shareholders | $(104,286,072) | $(282,080,395) |
| Change in net assets from fund share transactions | $(148,506,100) | $358,268,568 |
| Total change in net assets | $(830,966,259) | $(627,272,057) |
| Net assets | ||
| At beginning of period | 7,630,056,376 | 8,257,328,433 |
| At end of period | $6,799,090,117 | $7,630,056,376 |
| Class A | Six months ended | Year ended | ||||
| 10/31/22 (unaudited) | 4/30/22 | 4/30/21 | 4/30/20 | 4/30/19 | 4/30/18 | |
| Net asset value, beginning of period | $9.99 | $11.27 | $11.08 | $10.62 | $10.39 | $10.67 |
| Income (loss) from investment operations | ||||||
| Net investment income (loss) (d) | $0.14 | $0.20 | $0.24 | $0.30 | $0.30 | $0.25 |
| Net realized and unrealized gain (loss) | (0.91) | (1.13) | 0.27 | 0.47 | 0.23 | (0.27) |
| Total from investment operations | $(0.77) | $(0.93) | $0.51 | $0.77 | $0.53 | $(0.02) |
| Less distributions declared to shareholders | ||||||
| From net investment income | $(0.13) | $(0.21) | $(0.28) | $(0.31) | $(0.30) | $(0.26) |
| From net realized gain | — | (0.14) | (0.04) | — | — | — |
| Total distributions declared to shareholders | $(0.13) | $(0.35) | $(0.32) | $(0.31) | $(0.30) | $(0.26) |
| Net asset value, end of period (x) | $9.09 | $9.99 | $11.27 | $11.08 | $10.62 | $10.39 |
| Total return (%) (r)(s)(t)(x) | (7.76)(n) | (8.46) | 4.55 | 7.30 | 5.22 | (0.22) |
| Ratios (%) (to average net assets) and Supplemental data: | ||||||
| Expenses before expense reductions (f) | 0.78(a) | 0.76 | 0.77 | 0.79 | 0.82 | 0.88 |
| Expenses after expense reductions (f) | 0.60(a) | 0.60 | 0.62 | 0.67 | 0.69 | 0.74 |
| Net investment income (loss) | 2.87(a) | 1.84 | 2.07 | 2.69 | 2.89 | 2.36 |
| Portfolio turnover | 69(n) | 185 | 188 | 144 | 60 | 27 |
| Net assets at end of period (000 omitted) | $2,115,339 | $2,426,564 | $2,969,273 | $2,458,183 | $1,967,507 | $1,761,171 |
| Class B | Six months ended | Year ended | ||||
| 10/31/22 (unaudited) | 4/30/22 | 4/30/21 | 4/30/20 | 4/30/19 | 4/30/18 | |
| Net asset value, beginning of period | $10.01 | $11.29 | $11.10 | $10.64 | $10.41 | $10.68 |
| Income (loss) from investment operations | ||||||
| Net investment income (loss) (d) | $0.10 | $0.12 | $0.15 | $0.22 | $0.22 | $0.17 |
| Net realized and unrealized gain (loss) | (0.91) | (1.13) | 0.27 | 0.47 | 0.23 | (0.26) |
| Total from investment operations | $(0.81) | $(1.01) | $0.42 | $0.69 | $0.45 | $(0.09) |
| Less distributions declared to shareholders | ||||||
| From net investment income | $(0.09) | $(0.13) | $(0.19) | $(0.23) | $(0.22) | $(0.18) |
| From net realized gain | — | (0.14) | (0.04) | — | — | — |
| Total distributions declared to shareholders | $(0.09) | $(0.27) | $(0.23) | $(0.23) | $(0.22) | $(0.18) |
| Net asset value, end of period (x) | $9.11 | $10.01 | $11.29 | $11.10 | $10.64 | $10.41 |
| Total return (%) (r)(s)(t)(x) | (8.09)(n) | (9.13) | 3.77 | 6.50 | 4.43 | (0.87) |
| Ratios (%) (to average net assets) and Supplemental data: | ||||||
| Expenses before expense reductions (f) | 1.53(a) | 1.51 | 1.52 | 1.54 | 1.58 | 1.63 |
| Expenses after expense reductions (f) | 1.35(a) | 1.35 | 1.37 | 1.42 | 1.44 | 1.49 |
| Net investment income (loss) | 2.11(a) | 1.09 | 1.35 | 1.97 | 2.13 | 1.61 |
| Portfolio turnover | 69(n) | 185 | 188 | 144 | 60 | 27 |
| Net assets at end of period (000 omitted) | $3,707 | $4,618 | $6,865 | $9,963 | $13,727 | $18,207 |
| Class C | Six months ended | Year ended | ||||
| 10/31/22 (unaudited) | 4/30/22 | 4/30/21 | 4/30/20 | 4/30/19 | 4/30/18 | |
| Net asset value, beginning of period | $10.01 | $11.28 | $11.10 | $10.64 | $10.41 | $10.68 |
| Income (loss) from investment operations | ||||||
| Net investment income (loss) (d) | $0.10 | $0.11 | $0.14 | $0.20 | $0.21 | $0.16 |
| Net realized and unrealized gain (loss) | (0.92) | (1.12) | 0.26 | 0.48 | 0.23 | (0.26) |
| Total from investment operations | $(0.82) | $(1.01) | $0.40 | $0.68 | $0.44 | $(0.10) |
| Less distributions declared to shareholders | ||||||
| From net investment income | $(0.09) | $(0.12) | $(0.18) | $(0.22) | $(0.21) | $(0.17) |
| From net realized gain | — | (0.14) | (0.04) | — | — | — |
| Total distributions declared to shareholders | $(0.09) | $(0.26) | $(0.22) | $(0.22) | $(0.21) | $(0.17) |
| Net asset value, end of period (x) | $9.10 | $10.01 | $11.28 | $11.10 | $10.64 | $10.41 |
| Total return (%) (r)(s)(t)(x) | (8.24)(n) | (9.14) | 3.57 | 6.40 | 4.33 | (0.97) |
| Ratios (%) (to average net assets) and Supplemental data: | ||||||
| Expenses before expense reductions (f) | 1.53(a) | 1.51 | 1.52 | 1.55 | 1.57 | 1.63 |
| Expenses after expense reductions (f) | 1.45(a) | 1.45 | 1.47 | 1.52 | 1.54 | 1.59 |
| Net investment income (loss) | 2.01(a) | 0.99 | 1.25 | 1.85 | 2.03 | 1.51 |
| Portfolio turnover | 69(n) | 185 | 188 | 144 | 60 | 27 |
| Net assets at end of period (000 omitted) | $43,687 | $56,980 | $77,610 | $99,437 | $89,735 | $100,768 |
| Class I | Six months ended | Year ended | ||||
| 10/31/22 (unaudited) | 4/30/22 | 4/30/21 | 4/30/20 | 4/30/19 | 4/30/18 | |
| Net asset value, beginning of period | $9.99 | $11.27 | $11.09 | $10.62 | $10.40 | $10.67 |
| Income (loss) from investment operations | ||||||
| Net investment income (loss) (d) | $0.15 | $0.22 | $0.25 | $0.31 | $0.31 | $0.27 |
| Net realized and unrealized gain (loss) | (0.91) | (1.13) | 0.26 | 0.49 | 0.23 | (0.26) |
| Total from investment operations | $(0.76) | $(0.91) | $0.51 | $0.80 | $0.54 | $0.01 |
| Less distributions declared to shareholders | ||||||
| From net investment income | $(0.14) | $(0.23) | $(0.29) | $(0.33) | $(0.32) | $(0.28) |
| From net realized gain | — | (0.14) | (0.04) | — | — | — |
| Total distributions declared to shareholders | $(0.14) | $(0.37) | $(0.33) | $(0.33) | $(0.32) | $(0.28) |
| Net asset value, end of period (x) | $9.09 | $9.99 | $11.27 | $11.09 | $10.62 | $10.40 |
| Total return (%) (r)(s)(t)(x) | (7.69)(n) | (8.32) | 4.61 | 7.56 | 5.27 | 0.03 |
| Ratios (%) (to average net assets) and Supplemental data: | ||||||
| Expenses before expense reductions (f) | 0.53(a) | 0.51 | 0.52 | 0.54 | 0.57 | 0.63 |
| Expenses after expense reductions (f) | 0.45(a) | 0.45 | 0.47 | 0.52 | 0.54 | 0.59 |
| Net investment income (loss) | 3.01(a) | 1.99 | 2.22 | 2.84 | 3.03 | 2.51 |
| Portfolio turnover | 69(n) | 185 | 188 | 144 | 60 | 27 |
| Net assets at end of period (000 omitted) | $1,306,031 | $1,617,089 | $1,651,206 | $1,513,495 | $1,242,812 | $1,180,741 |
| Class R1 | Six months ended | Year ended | ||||
| 10/31/22 (unaudited) | 4/30/22 | 4/30/21 | 4/30/20 | 4/30/19 | 4/30/18 | |
| Net asset value, beginning of period | $10.01 | $11.28 | $11.10 | $10.64 | $10.41 | $10.68 |
| Income (loss) from investment operations | ||||||
| Net investment income (loss) (d) | $0.10 | $0.11 | $0.14 | $0.20 | $0.21 | $0.16 |
| Net realized and unrealized gain (loss) | (0.92) | (1.12) | 0.26 | 0.48 | 0.23 | (0.26) |
| Total from investment operations | $(0.82) | $(1.01) | $0.40 | $0.68 | $0.44 | $(0.10) |
| Less distributions declared to shareholders | ||||||
| From net investment income | $(0.09) | $(0.12) | $(0.18) | $(0.22) | $(0.21) | $(0.17) |
| From net realized gain | — | (0.14) | (0.04) | — | — | — |
| Total distributions declared to shareholders | $(0.09) | $(0.26) | $(0.22) | $(0.22) | $(0.21) | $(0.17) |
| Net asset value, end of period (x) | $9.10 | $10.01 | $11.28 | $11.10 | $10.64 | $10.41 |
| Total return (%) (r)(s)(t)(x) | (8.24)(n) | (9.14) | 3.57 | 6.40 | 4.33 | (0.97) |
| Ratios (%) (to average net assets) and Supplemental data: | ||||||
| Expenses before expense reductions (f) | 1.53(a) | 1.51 | 1.52 | 1.54 | 1.57 | 1.63 |
| Expenses after expense reductions (f) | 1.45(a) | 1.45 | 1.47 | 1.52 | 1.54 | 1.59 |
| Net investment income (loss) | 2.02(a) | 0.99 | 1.22 | 1.87 | 2.06 | 1.50 |
| Portfolio turnover | 69(n) | 185 | 188 | 144 | 60 | 27 |
| Net assets at end of period (000 omitted) | $1,519 | $1,641 | $1,812 | $1,656 | $2,005 | $1,293 |
| Class R2 | Six months ended | Year ended | ||||
| 10/31/22 (unaudited) | 4/30/22 | 4/30/21 | 4/30/20 | 4/30/19 | 4/30/18 | |
| Net asset value, beginning of period | $9.99 | $11.27 | $11.08 | $10.62 | $10.39 | $10.66 |
| Income (loss) from investment operations | ||||||
| Net investment income (loss) (d) | $0.12 | $0.16 | $0.20 | $0.26 | $0.26 | $0.21 |
| Net realized and unrealized gain (loss) | (0.91) | (1.13) | 0.27 | 0.47 | 0.24 | (0.26) |
| Total from investment operations | $(0.79) | $(0.97) | $0.47 | $0.73 | $0.50 | $(0.05) |
| Less distributions declared to shareholders | ||||||
| From net investment income | $(0.11) | $(0.17) | $(0.24) | $(0.27) | $(0.27) | $(0.22) |
| From net realized gain | — | (0.14) | (0.04) | — | — | — |
| Total distributions declared to shareholders | $(0.11) | $(0.31) | $(0.28) | $(0.27) | $(0.27) | $(0.22) |
| Net asset value, end of period (x) | $9.09 | $9.99 | $11.27 | $11.08 | $10.62 | $10.39 |
| Total return (%) (r)(s)(t)(x) | (7.92)(n) | (8.79) | 4.19 | 6.93 | 4.85 | (0.48) |
| Ratios (%) (to average net assets) and Supplemental data: | ||||||
| Expenses before expense reductions (f) | 1.03(a) | 1.01 | 1.02 | 1.04 | 1.08 | 1.13 |
| Expenses after expense reductions (f) | 0.95(a) | 0.95 | 0.97 | 1.02 | 1.04 | 1.09 |
| Net investment income (loss) | 2.51(a) | 1.49 | 1.74 | 2.36 | 2.53 | 2.01 |
| Portfolio turnover | 69(n) | 185 | 188 | 144 | 60 | 27 |
| Net assets at end of period (000 omitted) | $13,884 | $16,565 | $25,398 | $27,083 | $34,093 | $44,339 |
| Class R3 | Six months ended | Year ended | ||||
| 10/31/22 (unaudited) | 4/30/22 | 4/30/21 | 4/30/20 | 4/30/19 | 4/30/18 | |
| Net asset value, beginning of period | $9.99 | $11.27 | $11.08 | $10.62 | $10.39 | $10.67 |
| Income (loss) from investment operations | ||||||
| Net investment income (loss) (d) | $0.13 | $0.19 | $0.23 | $0.29 | $0.29 | $0.24 |
| Net realized and unrealized gain (loss) | (0.90) | (1.13) | 0.26 | 0.47 | 0.23 | (0.27) |
| Total from investment operations | $(0.77) | $(0.94) | $0.49 | $0.76 | $0.52 | $(0.03) |
| Less distributions declared to shareholders | ||||||
| From net investment income | $(0.13) | $(0.20) | $(0.26) | $(0.30) | $(0.29) | $(0.25) |
| From net realized gain | — | (0.14) | (0.04) | — | — | — |
| Total distributions declared to shareholders | $(0.13) | $(0.34) | $(0.30) | $(0.30) | $(0.29) | $(0.25) |
| Net asset value, end of period (x) | $9.09 | $9.99 | $11.27 | $11.08 | $10.62 | $10.39 |
| Total return (%) (r)(s)(t)(x) | (7.80)(n) | (8.55) | 4.44 | 7.20 | 5.11 | (0.32) |
| Ratios (%) (to average net assets) and Supplemental data: | ||||||
| Expenses before expense reductions (f) | 0.78(a) | 0.76 | 0.77 | 0.79 | 0.83 | 0.88 |
| Expenses after expense reductions (f) | 0.70(a) | 0.70 | 0.72 | 0.77 | 0.79 | 0.84 |
| Net investment income (loss) | 2.77(a) | 1.75 | 1.98 | 2.60 | 2.78 | 2.25 |
| Portfolio turnover | 69(n) | 185 | 188 | 144 | 60 | 27 |
| Net assets at end of period (000 omitted) | $69,609 | $79,389 | $57,652 | $54,433 | $49,418 | $75,764 |
| Class R4 | Six months ended | Year ended | ||||
| 10/31/22 (unaudited) | 4/30/22 | 4/30/21 | 4/30/20 | 4/30/19 | 4/30/18 | |
| Net asset value, beginning of period | $9.99 | $11.27 | $11.09 | $10.63 | $10.40 | $10.67 |
| Income (loss) from investment operations | ||||||
| Net investment income (loss) (d) | $0.15 | $0.22 | $0.26 | $0.31 | $0.32 | $0.27 |
| Net realized and unrealized gain (loss) | (0.91) | (1.13) | 0.25 | 0.48 | 0.23 | (0.26) |
| Total from investment operations | $(0.76) | $(0.91) | $0.51 | $0.79 | $0.55 | $0.01 |
| Less distributions declared to shareholders | ||||||
| From net investment income | $(0.14) | $(0.23) | $(0.29) | $(0.33) | $(0.32) | $(0.28) |
| From net realized gain | — | (0.14) | (0.04) | — | — | — |
| Total distributions declared to shareholders | $(0.14) | $(0.37) | $(0.33) | $(0.33) | $(0.32) | $(0.28) |
| Net asset value, end of period (x) | $9.09 | $9.99 | $11.27 | $11.09 | $10.63 | $10.40 |
| Total return (%) (r)(s)(t)(x) | (7.69)(n) | (8.32) | 4.61 | 7.46 | 5.37 | 0.03 |
| Ratios (%) (to average net assets) and Supplemental data: | ||||||
| Expenses before expense reductions (f) | 0.53(a) | 0.51 | 0.52 | 0.54 | 0.57 | 0.63 |
| Expenses after expense reductions (f) | 0.45(a) | 0.45 | 0.47 | 0.52 | 0.54 | 0.59 |
| Net investment income (loss) | 3.01(a) | 1.98 | 2.23 | 2.85 | 3.04 | 2.50 |
| Portfolio turnover | 69(n) | 185 | 188 | 144 | 60 | 27 |
| Net assets at end of period (000 omitted) | $42,694 | $50,056 | $127,449 | $131,629 | $116,533 | $103,144 |
| Class R6 | Six months ended | Year ended | ||||
| 10/31/22 (unaudited) | 4/30/22 | 4/30/21 | 4/30/20 | 4/30/19 | 4/30/18 | |
| Net asset value, beginning of period | $9.99 | $11.27 | $11.09 | $10.62 | $10.39 | $10.67 |
| Income (loss) from investment operations | ||||||
| Net investment income (loss) (d) | $0.15 | $0.23 | $0.26 | $0.32 | $0.33 | $0.28 |
| Net realized and unrealized gain (loss) | (0.91) | (1.13) | 0.26 | 0.49 | 0.23 | (0.27) |
| Total from investment operations | $(0.76) | $(0.90) | $0.52 | $0.81 | $0.56 | $0.01 |
| Less distributions declared to shareholders | ||||||
| From net investment income | $(0.14) | $(0.24) | $(0.30) | $(0.34) | $(0.33) | $(0.29) |
| From net realized gain | — | (0.14) | (0.04) | — | — | — |
| Total distributions declared to shareholders | $(0.14) | $(0.38) | $(0.34) | $(0.34) | $(0.33) | $(0.29) |
| Net asset value, end of period (x) | $9.09 | $9.99 | $11.27 | $11.09 | $10.62 | $10.39 |
| Total return (%) (r)(s)(t)(x) | (7.64)(n) | (8.23) | 4.71 | 7.67 | 5.49 | 0.04 |
| Ratios (%) (to average net assets) and Supplemental data: | ||||||
| Expenses before expense reductions (f) | 0.43(a) | 0.42 | 0.43 | 0.45 | 0.47 | 0.52 |
| Expenses after expense reductions (f) | 0.35(a) | 0.35 | 0.37 | 0.42 | 0.44 | 0.48 |
| Net investment income (loss) | 3.12(a) | 2.09 | 2.31 | 2.95 | 3.14 | 2.61 |
| Portfolio turnover | 69(n) | 185 | 188 | 144 | 60 | 27 |
| Net assets at end of period (000 omitted) | $3,202,619 | $3,359,986 | $3,320,149 | $2,535,200 | $2,232,386 | $2,087,409 |
| (a) | Annualized. |
| (d) | Per share data is based on average shares outstanding. |
| (f) | Ratios do not reflect reductions from fees paid indirectly, if applicable. See Note 2 in the Notes to Financial Statements for additional information. |
| (n) | Not annualized. |
| (r) | Certain expenses have been reduced without which performance would have been lower. |
| (s) | From time to time the fund may receive proceeds from litigation settlements, without which performance would be lower. |
| (t) | Total returns do not include any applicable sales charges. |
| (x) | The net asset values and total returns have been calculated on net assets which include adjustments made in accordance with U.S. generally accepted accounting principles required at period end for financial reporting purposes. |
| Financial Instruments | Level 1 | Level 2 | Level 3 | Total |
| U.S. Treasury Bonds & U.S. Government Agencies & Equivalents | $— | $1,315,690,625 | $— | $1,315,690,625 |
| Non - U.S. Sovereign Debt | — | 9,195,217 | — | 9,195,217 |
| Municipal Bonds | — | 124,527,301 | — | 124,527,301 |
| U.S. Corporate Bonds | — | 1,714,338,452 | — | 1,714,338,452 |
| Residential Mortgage-Backed Securities | — | 1,488,815,402 | — | 1,488,815,402 |
| Commercial Mortgage-Backed Securities | — | 495,544,778 | — | 495,544,778 |
| Asset-Backed Securities (including CDOs) | — | 708,139,501 | — | 708,139,501 |
| Foreign Bonds | — | 758,229,583 | — | 758,229,583 |
| Mutual Funds | 321,108,661 | — | — | 321,108,661 |
| Total | $321,108,661 | $6,614,480,859 | $— | $6,935,589,520 |
| Other Financial Instruments | ||||
| Futures Contracts – Assets | $7,613,467 | $— | $— | $7,613,467 |
| Futures Contracts – Liabilities | (75,309,227) | — | — | (75,309,227) |
| Fair Value (a) | |||
| Risk | Derivative Contracts | Asset Derivatives | Liability Derivatives |
| Interest Rate | Futures Contracts | $7,613,467 | $(75,309,227) |
| (a) | Values presented in this table for futures contracts correspond to the values reported in the Portfolio of Investments. Only the current day net variation margin for futures contracts is reported separately within the Statement of Assets and Liabilities. |
| Risk | Futures Contracts |
| Interest Rate | $(70,583,196) |
| Risk | Futures Contracts |
| Interest Rate | $(30,285,501) |
| Year ended 4/30/22 | |
| Ordinary income (including any short-term capital gains) | $198,577,919 |
| Long-term capital gains | 83,502,476 |
| Total distributions | $282,080,395 |
| As of 10/31/22 | |
| Cost of investments | $7,963,851,764 |
| Gross appreciation | 1,319,457 |
| Gross depreciation | (1,029,581,701) |
| Net unrealized appreciation (depreciation) | $(1,028,262,244) |
| As of 4/30/22 | |
| Undistributed ordinary income | 5,937,227 |
| Post-October capital loss deferral | (132,665,794) |
| Other temporary differences | (15,483,451) |
| Net unrealized appreciation (depreciation) | (555,957,712) |
| Six months ended 10/31/22 | Year ended 4/30/22 | ||
| Class A | $30,981,870 | $89,650,278 | |
| Class B | 40,497 | 149,368 | |
| Class C | 473,788 | 1,685,233 | |
| Class I | 20,709,287 | 59,932,983 | |
| Class R1 | 14,682 | 41,979 | |
| Class R2 | 178,693 | 583,861 | |
| Class R3 | 984,966 | 2,534,325 | |
| Class R4 | 668,028 | 2,691,862 | |
| Class R6 | 50,211,304 | 124,228,123 | |
| Class 529A | 22,957 | 520,544 | |
| Class 529B | — | 2,307 | |
| Class 529C | — | 59,532 | |
| Total | $104,286,072 | $282,080,395 |
| Up to $2.5 billion | 0.50% |
| In excess of $2.5 billion and up to $5 billion | 0.35% |
| In excess of $5 billion and up to $10 billion | 0.34% |
| In excess of $10 billion | 0.33% |
| Classes | |||||||||
| A | B | C | I | R1 | R2 | R3 | R4 | R6 | 529A |
| 0.60% | 1.35% | 1.45% | 0.45% | 1.45% | 0.95% | 0.70% | 0.45% | 0.36% | 0.65% |
| Distribution Fee Rate (d) | Service Fee Rate (d) | Total Distribution Plan (d) | Annual Effective Rate (e) | Distribution and Service Fee | |
| Class A | — | 0.25% | 0.25% | 0.15% | $ 2,883,771 |
| Class B | 0.75% | 0.25% | 1.00% | 0.90% | 20,992 |
| Class C | 0.75% | 0.25% | 1.00% | 1.00% | 259,176 |
| Class R1 | 0.75% | 0.25% | 1.00% | 1.00% | 7,997 |
| Class R2 | 0.25% | 0.25% | 0.50% | 0.50% | 38,280 |
| Class R3 | — | 0.25% | 0.25% | 0.25% | 95,249 |
| Class 529A | — | 0.25% | 0.25% | 0.13% | 2,563 |
| Total Distribution and Service Fees | $3,308,028 |
| (d) | In accordance with the distribution plan for certain classes, the fund pays distribution and/or service fees equal to these annual percentage rates of each class’s average daily net assets. The distribution and service fee rates disclosed by class represent the current rates in effect at the end of the reporting period. Any rate changes, if applicable, are detailed below. |
| (e) | The annual effective rates represent actual fees incurred under the distribution plan for the six months ended October 31, 2022 based on each class's average daily net assets. 0.10% of the Class A, Class B, and Class 529A service fee is currently being waived under a written waiver agreement. For the six months ended October 31, 2022, this waiver amounted to $1,153,500, $2,099, and $1,025 for Class A, Class B, and Class 529A shares, respectively, and is included in the reduction of total expenses in the Statement of Operations. This written waiver agreement will continue until modified by the fund’s Board of Trustees, but such agreement will continue at least until August 31, 2023. MFD has voluntarily agreed to rebate a portion of each class's 0.25% service fee attributable to accounts for which there is no financial intermediary specified on the account except for accounts attributable to MFS or its affiliates' seed money. For the six months ended October 31, 2022, this rebate amounted to $170 for Class 529A shares and is included in the reduction of total expenses in the Statement of Operations. |
| Amount | |
| Class A | $40,274 |
| Class B | 1,997 |
| Class C | 886 |
| Fee | |
| Class 529A | $513 |
| Purchases | Sales | |
| U.S. Government securities | $4,943,496,096 | $4,745,594,496 |
| Non-U.S. Government securities | 19,121,170 | 524,627,688 |
| Six months ended 10/31/22 | Year ended 4/30/22 | ||||
| Shares | Amount | Shares | Amount | ||
| Shares sold | |||||
| Class A | 15,531,225 | $150,053,592 | 42,121,771 | $468,763,745 | |
| Class B | 8,732 | 86,088 | 26,727 | 299,911 | |
| Class C | 185,393 | 1,789,172 | 664,076 | 7,431,968 | |
| Class I | 22,149,709 | 213,462,566 | 65,731,010 | 731,418,479 | |
| Class R1 | 29,539 | 285,247 | 22,453 | 250,152 | |
| Class R2 | 114,172 | 1,087,882 | 582,902 | 6,310,304 | |
| Class R3 | 479,302 | 4,591,462 | 4,965,372 | 55,889,840 | |
| Class R4 | 478,374 | 4,644,173 | 1,452,461 | 16,260,647 | |
| Class R6 | 52,020,143 | 510,075,177 | 68,359,186 | 761,560,252 | |
| Class 529A | 7,712 | 77,520 | 522,768 | 5,662,217 | |
| Class 529C | — | — | 33,509 | 377,269 | |
| 91,004,301 | $886,152,879 | 184,482,235 | $2,054,224,784 | ||
| Shares issued to shareholders in reinvestment of distributions | |||||
| Class A | 3,134,107 | $30,035,634 | 7,700,492 | $85,304,428 | |
| Class B | 3,963 | 38,030 | 11,721 | 130,321 | |
| Class C | 45,785 | 439,350 | 140,003 | 1,556,900 | |
| Class I | 1,647,837 | 15,803,798 | 4,047,736 | 44,799,674 | |
| Class R1 | 1,530 | 14,646 | 3,778 | 41,953 | |
| Class R2 | 18,478 | 176,978 | 52,323 | 580,889 | |
| Class R3 | 102,722 | 984,178 | 229,380 | 2,534,173 | |
| Class R4 | 45,878 | 440,127 | 185,712 | 2,074,661 | |
| Class R6 | 5,145,950 | 49,319,043 | 10,982,807 | 121,553,780 | |
| Class 529A | — | — | 46,145 | 510,672 | |
| Class 529B | — | — | 199 | 2,228 | |
| Class 529C | — | — | 5,161 | 57,837 | |
| 10,146,250 | $97,251,784 | 23,405,457 | $259,147,516 | ||
| Six months ended 10/31/22 | Year ended 4/30/22 | ||||
| Shares | Amount | Shares | Amount | ||
| Shares reacquired | |||||
| Class A | (28,819,680) | $(278,433,301) | (70,462,747) | $(785,055,818) | |
| Class B | (67,013) | (648,921) | (185,265) | (2,036,031) | |
| Class C | (1,126,946) | (10,747,759) | (1,987,554) | (21,944,142) | |
| Class I | (41,965,645) | (406,496,494) | (54,451,566) | (595,979,761) | |
| Class R1 | (28,287) | (273,004) | (22,731) | (249,837) | |
| Class R2 | (263,180) | (2,532,800) | (1,231,438) | (13,612,746) | |
| Class R3 | (869,866) | (8,343,380) | (2,364,537) | (26,013,097) | |
| Class R4 | (837,260) | (8,101,578) | (7,935,459) | (89,290,421) | |
| Class R6 | (41,128,617) | (399,196,865) | (37,685,221) | (413,764,938) | |
| Class 529A | (1,725,772) | (17,136,661) | (336,469) | (3,728,699) | |
| Class 529B | — | — | (8,458) | (90,040) | |
| Class 529C | — | — | (312,958) | (3,338,202) | |
| (116,832,266) | $(1,131,910,763) | (176,984,403) | $(1,955,103,732) | ||
| Net change | |||||
| Class A | (10,154,348) | $(98,344,075) | (20,640,484) | $(230,987,645) | |
| Class B | (54,318) | (524,803) | (146,817) | (1,605,799) | |
| Class C | (895,768) | (8,519,237) | (1,183,475) | (12,955,274) | |
| Class I | (18,168,099) | (177,230,130) | 15,327,180 | 180,238,392 | |
| Class R1 | 2,782 | 26,889 | 3,500 | 42,268 | |
| Class R2 | (130,530) | (1,267,940) | (596,213) | (6,721,553) | |
| Class R3 | (287,842) | (2,767,740) | 2,830,215 | 32,410,916 | |
| Class R4 | (313,008) | (3,017,278) | (6,297,286) | (70,955,113) | |
| Class R6 | 16,037,476 | 160,197,355 | 41,656,772 | 469,349,094 | |
| Class 529A | (1,718,060) | (17,059,141) | 232,444 | 2,444,190 | |
| Class 529B | — | — | (8,259) | (87,812) | |
| Class 529C | — | — | (274,288) | (2,903,096) | |
| (15,681,715) | $(148,506,100) | 30,903,289 | $358,268,568 | ||
| Affiliated Issuers | Beginning Value | Purchases | Sales Proceeds | Realized Gain (Loss) | Change in Unrealized Appreciation or Depreciation | Ending Value |
| MFS Institutional Money Market Portfolio | $663,218,414 | $763,961,133 | $1,106,066,608 | $(16,737) | $12,459 | $321,108,661 |
| Affiliated Issuers | Dividend Income | Capital Gain Distributions |
| MFS Institutional Money Market Portfolio | $4,404,438 | $— |


Item 1(b):
Not applicable
ITEM 2. CODE OF ETHICS.
During the period covered by this report, the Registrant has not amended any provision in its Code of Ethics (the "Code") that relates to an element of the Code's definition enumerated in paragraph (b) of Item 2 of this Form N-CSR. During the period covered by this report, the Registrant did not grant a waiver, including an implicit waiver, from any provision of the Code.
ITEM 3. AUDIT COMMITTEE FINANCIAL EXPERT.
Not applicable for semi-annual reports.
ITEM 4. PRINCIPAL ACCOUNTANT FEES AND SERVICES.
Not applicable for semi-annual reports.
ITEM 5. AUDIT COMMITTEE OF LISTED REGISTRANTS.
Not applicable to the Registrant.
ITEM 6. INVESTMENTS
A schedule of investments for each series covered by this Form N-CSR is included as part of the report to shareholders of such series under Item 1(a) of this Form N-CSR.
ITEM 7. DISCLOSURE OF PROXY VOTING POLICIES AND PROCEDURES FOR CLOSED-END MANAGEMENT INVESTMENT COMPANIES.
Not applicable to the Registrant.
ITEM 8. PORTFOLIO MANAGERS OF CLOSED-END MANAGEMENT INVESTMENT COMPANIES.
Not applicable to the Registrant.
ITEM 9. PURCHASES OF EQUITY SECURITIES BY CLOSED-END MANAGEMENT INVESTMENT COMPANY AND AFFILIATED PURCHASERS.
Not applicable to the Registrant.
ITEM 10. SUBMISSION OF MATTERS TO A VOTE OF SECURITY HOLDERS.
There were no material changes to the procedures by which shareholders may send recommendations to the Board for nominees to the Registrant's Board since the Registrant last provided disclosure as to such procedures in response to the requirements of Item 407 (c)(2)(iv) of Regulation S-K or this Item.
ITEM 11. CONTROLS AND PROCEDURES.
(a)Based upon their evaluation of the effectiveness of the registrant's disclosure controls and procedures (as defined in Rule 30a-3(c) under the Investment Company Act of 1940 (the "Act")) as conducted within 90 days of the filing date of this report on Form N-CSR, the registrant's principal financial officer and principal executive officer have concluded that those disclosure controls and procedures provide reasonable assurance that the material information required to be disclosed by the registrant on this report is recorded, processed, summarized and reported within the time periods specified in the Securities and Exchange Commission's rules and forms.
(b)There were no changes in the registrant's internal controls over financial reporting (as defined in Rule 30a-3(d) under the Act) that occurred during the period covered by the report that have materially affected, or are reasonably likely to materially affect, the registrant's internal control over financial reporting.
ITEM 12. DISCLOSURE OF SECURITIES LENDING ACTIVITIES FOR CLOSED-END MANAGEMENT INVESTMENT COMPANIES.
Not applicable to the Registrant.
ITEM 13. EXHIBITS.
(a)(1) Any code of ethics, or amendment thereto, that is the subject of the disclosure required by Item 2, to the extent that the registrant intends to satisfy the Item 2 requirements through filing of an exhibit: Not applicable.
(2)A separate certification for each principal executive officer and principal financial officer of the registrant as required by Rule 30a-2(a) under the Act (17 CFR 270.30a-2): Attached hereto as EX-99.302CERT.
(3)Any written solicitation to purchase securities under Rule 23c-1 under the Act (17 CFR 270.23c-1) sent or given during the period covered by the report by or on behalf of the registrant to 10 or more persons. Not applicable.
(4)Change in the registrant's independent public accountant. Not applicable.
(b)If the report is filed under Section 13(a) or 15(d) of the Exchange Act, provide the certifications required by Rule 30a-2(b) under the Act (17 CFR 270.30a-2(b)), Rule 13a-14(b) or Rule 15d-14(b) under the Exchange Act (17 CFR 240.13a-14(b) or
240.15d-14(b)) and Section 1350 of Chapter 63 of Title 18 of the United States Code (18 U.S.C. 1350) as an exhibit. A certification furnished pursuant to this paragraph will not be deemed "filed" for the purposes of Section 18 of the Exchange Act (15 U.S.C. 78r), or otherwise subject to the liability of that section. Such certification will not be deemed to be incorporated by reference into any filing under the Securities Act of 1933 or the Exchange Act, except to the extent that the registrant specifically incorporates it by reference. Attached hereto as EX-99.906CERT.
Notice
A copy of the Amended and Restated Declaration of Trust, as amended, of the Registrant is on file with the Secretary of State of The Commonwealth of Massachusetts and notice is hereby given that this instrument is executed on behalf of the Registrant by an officer of the Registrant as an officer and not individually and the obligations of or arising out of this instrument are not binding upon any of the Trustees or shareholders individually, but are binding only upon the assets and property of the respective constituent series of the Registrant.
SIGNATURES
Pursuant to the requirements of the Securities Exchange Act of 1934 and the Investment Company Act of 1940, the registrant has duly caused this report to be signed on its behalf by the undersigned, thereunto duly authorized.
(Registrant) MFS SERIES TRUST IX
By (Signature and Title)*
/S/ DAVID L. DILORENZO
David L. DiLorenzo, President
Date: December 15, 2022
Pursuant to the requirements of the Securities Exchange Act of 1934 and the Investment Company Act of 1940, this report has been signed below by the following persons on behalf of the registrant and in the capacities and on the dates indicated.
By (Signature and Title)*
/S/ DAVID L. DILORENZO
David L. DiLorenzo, President (Principal Executive Officer)
Date: December 15, 2022
By (Signature and Title)*
/S/ JAMES O. YOST
James O. Yost, Treasurer (Principal Financial Officer and Accounting Officer)
Date: December 15, 2022
* Print name and title of each signing officer under his or her signature.