UNITED STATES
SECURITIES AND EXCHANGE COMMISSION
Washington, D.C. 20549
FORM N-CSR
CERTIFIED SHAREHOLDER REPORT OF REGISTERED
MANAGEMENT INVESTMENT COMPANIES
Investment Company Act file number 811-02464
MFS SERIES TRUST IX
(Exact name of registrant as specified in charter)
111 Huntington Avenue, Boston, Massachusetts 02199 (Address of principal executive offices) (Zip code)
Christopher R. Bohane
Massachusetts Financial Services Company
111Huntington Avenue Boston, Massachusetts 02199
(Name and address of agents for service)
Registrant’s telephone number, including area code: (617) 954-5000
Date of fiscal year end: April 30*
Date of reporting period: April 30, 2024
*This Form N-CSR pertains to the following series of the Registrant: MFS Corporate Bond Fund, MFS Limited Maturity Fund, MFS Municipal Limited Maturity Fund, and MFS Total Return Bond Fund. The remaining series of the Registrant has a fiscal year end of October 31.
ITEM 1. REPORTS TO STOCKHOLDERS.
Item 1(a):
Annual Report
April 30, 2024
| 1 |
| 3 |
| 5 |
| 8 |
| 10 |
| 26 |
| 28 |
| 29 |
| 30 |
| 36 |
| 51 |
| 53 |
| 57 |
| 58 |
| 58 |
| 58 |
| 58 |
| 58 |
| 59 |
The report is prepared for the general information of shareholders. It is authorized for distribution to prospective investors only when preceded or accompanied by a current prospectus.
NOT FDIC INSURED • MAY LOSE VALUE • NO BANK GUARANTEE
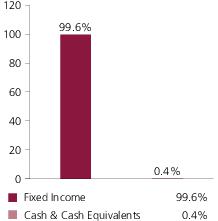
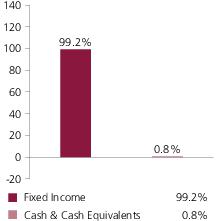
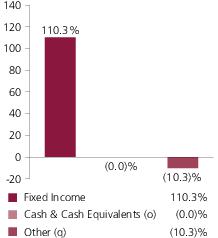
Portfolio structure (i)
Fixed income sectors (i)
| Investment Grade Corporates | 78.5% |
| U.S. Treasury Securities | 10.2% |
| High Yield Corporates | 5.6% |
| Emerging Markets Bonds | 4.6% |
| Non-U.S. Government Bonds | 1.3% |
| Collateralized Loan Obligations | 1.2% |
| Commercial Mortgage-Backed Securities | 0.9% |
| Asset-Backed Securities | 0.7% |
| Municipal Bonds | 0.5% |
| Residential Mortgage-Backed Securities | 0.4% |
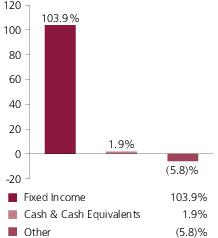
Composition including fixed income credit quality (a)(i)
| AAA | 3.3% |
| AA | 3.2% |
| A | 27.8% |
| BBB | 51.5% |
| BB | 5.6% |
| B | 2.3% |
| C (o) | 0.0% |
| U.S. Government | 4.4% |
| Not Rated | 5.8% |
| Cash & Cash Equivalents | 1.9% |
| Other | (5.8)% |
Portfolio facts
| Average Duration (d) | 6.6 |
| Average Effective Maturity (m) | 10.1 yrs. |
| (a) | For all securities other than those specifically described below, ratings are assigned to underlying securities utilizing ratings from Moody’s, Fitch, and Standard & Poor’s rating agencies and applying the following hierarchy: If all three agencies provide a rating, the middle rating (after dropping the highest and lowest ratings) is assigned; if two of the three agencies rate a security, the lower of the two is assigned. If none of the 3 rating agencies above assign a rating, but the security is rated by DBRS Morningstar, then the DBRS Morningstar rating is assigned. If none of the 4 rating agencies listed above rate the security, but the security is rated by the Kroll Bond Rating Agency (KBRA), then the KBRA rating is assigned. Ratings are shown in the S&P and Fitch scale (e.g., AAA). Securities rated BBB or higher are considered investment grade. All ratings are subject to change. U.S. Government includes securities issued by the U.S. Department of the Treasury. Not Rated includes fixed income securities and fixed income derivatives that have not been rated by any rating agency. |
The fund may or may not have held all of these instruments on this date. The fund is not rated by these agencies.
Portfolio Composition - continued
| (d) | Duration is a measure of how much a bond’s price is likely to fluctuate with general changes in interest rates, e.g., if rates rise 1.00%, a bond with a 5-year duration is likely to lose about 5.00% of its value due to the interest rate move. The Average Duration calculation reflects the impact of the equivalent exposure of derivative positions, if any. |
| (i) | For purposes of this presentation, the components include the value of securities, and reflect the impact of the equivalent exposure of derivative positions, if any. These amounts may be negative from time to time. Equivalent exposure is a calculated amount that translates the derivative position into a reasonable approximation of the amount of the underlying asset that the portfolio would have to hold at a given point in time to have the same price sensitivity that results from the portfolio’s ownership of the derivative contract. When dealing with derivatives, equivalent exposure is a more representative measure of the potential impact of a position on portfolio performance than value. The bond component will include any accrued interest amounts. |
| (m) | In determining each instrument’s effective maturity for purposes of calculating the fund’s dollar-weighted average effective maturity, MFS uses the instrument’s stated maturity or, if applicable, an earlier date on which MFS believes it is probable that a maturity-shortening feature (such as a put, pre-refunding or prepayment) will cause the instrument to be repaid. Such an earlier date can be substantially shorter than the instrument’s stated maturity. |
Where the fund holds convertible bonds, they are treated as part of the equity portion of the portfolio.
Cash & Cash Equivalents includes any cash, investments in money market funds, short-term securities, and other assets less liabilities. Please see the Statement of Assets and Liabilities for additional information related to the fund’s cash position and other assets and liabilities.
Other includes equivalent exposure from currency derivatives and/or any offsets to derivative positions and may be negative.
Percentages are based on net assets as of April 30, 2024.
The portfolio is actively managed and current holdings may be different.
Management Review
Summary of Results
For the twelve months ended April 30, 2024, Class A shares of the MFS Corporate Bond Fund (fund) provided a total return of 1.50%, at net asset value. This compares with a return of 0.76% for the fund’s benchmark, the Bloomberg U.S. Credit Index.
Market Environment
In response to the strongest inflationary period in four decades, global central banks tightened monetary policy significantly during the reporting period, helping reduce price pressures, although more work is needed before inflation returns to target. Geopolitical strains remained high amid ongoing conflicts in Ukraine and in the Middle East, while relations between China and the US remained tense. The US sought to restrict the flow of advanced technologies to China and China looked to use its industrial overcapacity to increase exports to developed markets to bolster its slow-growing domestic economy. The conflict in the Middle East caused trade flow disruptions between Asia and Europe as shipping traffic was routed away from the Red Sea.
Although inflation has yet to reach central banks’ targets, policymakers have indicated their desire to begin cutting rates in the months ahead, although stickier-than-expected inflation could delay cuts in the US. The prospects for easier monetary policy along with resilient global economic growth have been supportive factors for risky assets, such as equities and high-yield bonds. Long-term interest rates moderated during the latter half of the reporting period, although rising government debt levels remained a concern over the medium term. Advancements in artificial intelligence and the adoption of novel weight-loss drugs were two areas of focus for investors during the period.
Factors Affecting Performance
Relative to the Bloomberg U.S. Credit Index, the fund’s exposure to “BB” and “B” rated(r) securities, which are not held by the benchmark, and its underweight exposure to “AAA” rated bonds contributed to relative performance. From a sector perspective, favorable bond selection within “BBB” rated bonds, primarily across the banking, communications, and REITS sectors, also strengthened relative returns.
Conversely, the fund’s exposure to “AA” rated securities, most notably within the treasury sector, detracted from relative performance. An overweight exposure to the electric utility sector also hindered relative results.
The fund’s cash and/or cash equivalents position during the period was another detractor from relative performance.
Respectfully,
Portfolio Manager(s)
Alexander Mackey and John Mitchell
| (r) | Securities rated “BBB”, “Baa”, or higher are considered investment grade; securities rated “BB”, “Ba”, or below are considered non-investment grade. Ratings are assigned to underlying securities utilizing ratings from Moody's, Fitch, and Standard & Poor's and applying the following hierarchy: If all three agencies provide a rating, the middle rating (after dropping the highest and lowest ratings) is assigned; if two of the three agencies rate a security, the |
Management Review - continued
lower of the two is assigned. If none of the 3 rating agencies above assign a rating, but the security is rated by DBRS Morningstar, then the DBRS Morningstar rating is assigned. If none of the 4 rating agencies listed above rate the security, but the security is rated by the Kroll Bond Rating Agency (KBRA), then the KBRA rating is assigned. Ratings are shown in the S&P and Fitch scale (e.g., AAA). For securities that are not rated by any of the rating agencies, the security is considered Not Rated.
The views expressed in this report are those of the portfolio manager(s) only through the end of the period of the report as stated on the cover and do not necessarily reflect the views of MFS or any other person in the MFS organization. These views are subject to change at any time based on market or other conditions, and MFS disclaims any responsibility to update such views. These views may not be relied upon as investment advice or an indication of trading intent on behalf of any MFS portfolio. References to specific securities are not recommendations of such securities, and may not be representative of any MFS portfolio’s current or future investments.
Performance Summary THROUGH 4/30/24
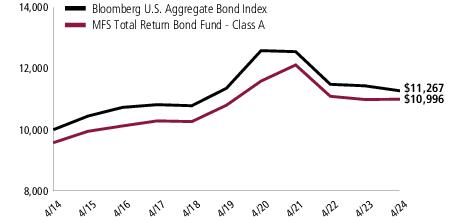
The following chart illustrates a representative class of the fund’s historical performance in comparison to its benchmark(s). Performance results include the deduction of the maximum applicable sales charge and reflect the percentage change in net asset value, including reinvestment of dividends and capital gains distributions. The performance of other share classes will be greater than or less than that of the class depicted below. Benchmarks are unmanaged and may not be invested in directly. Benchmark returns do not reflect sales charges, commissions or expenses. (See Notes to Performance Summary.)
Performance data shown represents past performance and is no guarantee of future results. Investment return and principal value fluctuate so your shares, when sold, may be worth more or less than the original cost; current performance may be lower or higher than quoted. The performance shown does not reflect the deduction of taxes, if any, that a shareholder would pay on fund distributions or the redemption of fund shares.
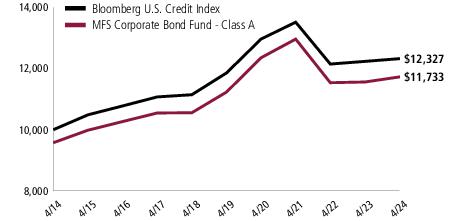
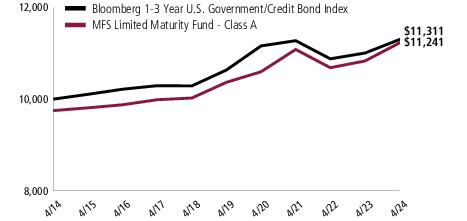
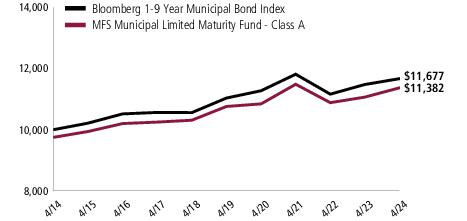
Growth of a Hypothetical $10,000 Investment
Performance Summary - continued
Total Returns through 4/30/24
Average annual without sales charge
| Share Class | Class Inception Date | 1-yr | 5-yr | 10-yr |
| A | 5/08/1974 | 1.50% | 0.88% | 2.05% |
| B | 9/07/1993 | 0.74% | 0.14% | 1.30% |
| C | 1/03/1994 | 0.73% | 0.12% | 1.30% |
| I | 1/02/1997 | 1.67% | 1.11% | 2.30% |
| R1 | 4/01/2005 | 0.65% | 0.12% | 1.30% |
| R2 | 10/31/2003 | 1.16% | 0.63% | 1.80% |
| R3 | 4/01/2005 | 1.42% | 0.88% | 2.05% |
| R4 | 4/01/2005 | 1.67% | 1.13% | 2.31% |
| R6 | 6/01/2012 | 1.76% | 1.21% | 2.40% |
Comparative benchmark(s)
| Bloomberg U.S. Credit Index (f) | 0.76% | 0.78% | 2.11% |
Average annual with sales charge
| | | | |
A
With Initial Sales Charge (4.25%) | (2.81)% | 0.01% | 1.61% |
B
With CDSC (Declining over six years from 4% to 0%) (v) | (3.15)% | (0.20)% | 1.30% |
C
With CDSC (1% for 12 months) (v) | (0.24)% | 0.12% | 1.30% |
CDSC – Contingent Deferred Sales Charge.
Class I, R1, R2, R3, R4, and R6 shares do not have a sales charge.
| (f) | Source: FactSet Research Systems Inc. |
| (v) | Assuming redemption at the end of the applicable period. |
Benchmark Definition(s)
Bloomberg U.S. Credit Index(a) – a market capitalization-weighted index that measures the performance of publicly issued, SEC-registered, U.S. corporate and specified foreign debentures and secured notes that meet specified maturity, liquidity, and quality requirements.
It is not possible to invest directly in an index.
| (a) | Source: Bloomberg Index Services Limited. BLOOMBERG® is a trademark and service mark of Bloomberg Finance L.P. and its affiliates (collectively “Bloomberg”). Bloomberg or Bloomberg's licensors own all proprietary rights in the Bloomberg Indices. Bloomberg neither approves or endorses this material, or guarantees the accuracy or completeness of any information herein, or makes any warranty, express or implied, as to the results to be obtained therefrom and, to the maximum extent allowed by law, neither shall have any liability or responsibility for injury or damages arising in connection therewith. |
Notes to Performance Summary
Average annual total return represents the average annual change in value for each share class for the periods presented.
Performance Summary - continued
Performance results reflect any applicable expense subsidies and waivers in effect during the periods shown. Without such subsidies and waivers the fund's performance results would be less favorable. Please see the prospectus and financial statements for complete details.
Performance results do not include adjustments made for financial reporting purposes in accordance with U.S. generally accepted accounting principles and may differ from amounts reported in the financial highlights.
From time to time the fund may receive proceeds from litigation settlements, without which performance would be lower.
Expense Table
Fund expenses borne by the shareholders during the period,
November 1, 2023 through April 30, 2024
As a shareholder of the fund, you incur two types of costs: (1) transaction costs, including sales charges (loads) on certain purchase or redemption payments, and (2) ongoing costs, including management fees; distribution and service (12b-1) fees; and other fund expenses. This example is intended to help you understand your ongoing costs (in dollars) of investing in the fund and to compare these costs with the ongoing costs of investing in other mutual funds.
The example is based on an investment of $1,000 invested at the beginning of the period and held for the entire period November 1, 2023 through April 30, 2024.
Actual Expenses
The first line for each share class in the following table provides information about actual account values and actual expenses. You may use the information in this line, together with the amount you invested, to estimate the expenses that you paid over the period. Simply divide your account value by $1,000 (for example, an $8,600 account value divided by $1,000 = 8.6), then multiply the result by the number in the first line under the heading entitled “Expenses Paid During Period” to estimate the expenses you paid on your account during this period.
Hypothetical Example for Comparison Purposes
The second line for each share class in the following table provides information about hypothetical account values and hypothetical expenses based on the fund’s actual expense ratio and an assumed rate of return of 5% per year before expenses, which is not the fund’s actual return. The hypothetical account values and expenses may not be used to estimate the actual ending account balance or expenses you paid for the period. You may use this information to compare the ongoing costs of investing in the fund and other funds. To do so, compare this 5% hypothetical example with the 5% hypothetical examples that appear in the shareholder reports of the other funds.
Please note that the expenses shown in the table are meant to highlight your ongoing costs only and do not reflect any transactional costs, such as sales charges (loads). Therefore, the second line for each share class in the table is useful in comparing ongoing costs only, and will not help you determine the relative total costs of owning different funds. In addition, if these transactional costs were included, your costs would have been higher.
Expense Table - continued
Share
Class | | Annualized
Expense
Ratio | Beginning
Account Value
11/01/23 | Ending
Account Value
4/30/24 | Expenses
Paid During
Period (p)
11/01/23-4/30/24 |
| A | Actual | 0.76% | $1,000.00 | $1,078.76 | $3.93 |
| Hypothetical (h) | 0.76% | $1,000.00 | $1,021.08 | $3.82 |
| B | Actual | 1.52% | $1,000.00 | $1,074.89 | $7.84 |
| Hypothetical (h) | 1.52% | $1,000.00 | $1,017.30 | $7.62 |
| C | Actual | 1.52% | $1,000.00 | $1,074.04 | $7.84 |
| Hypothetical (h) | 1.52% | $1,000.00 | $1,017.30 | $7.62 |
| I | Actual | 0.51% | $1,000.00 | $1,079.23 | $2.64 |
| Hypothetical (h) | 0.51% | $1,000.00 | $1,022.33 | $2.56 |
| R1 | Actual | 1.51% | $1,000.00 | $1,073.99 | $7.79 |
| Hypothetical (h) | 1.51% | $1,000.00 | $1,017.35 | $7.57 |
| R2 | Actual | 1.01% | $1,000.00 | $1,076.48 | $5.21 |
| Hypothetical (h) | 1.01% | $1,000.00 | $1,019.84 | $5.07 |
| R3 | Actual | 0.77% | $1,000.00 | $1,077.81 | $3.98 |
| Hypothetical (h) | 0.77% | $1,000.00 | $1,021.03 | $3.87 |
| R4 | Actual | 0.51% | $1,000.00 | $1,079.13 | $2.64 |
| Hypothetical (h) | 0.51% | $1,000.00 | $1,022.33 | $2.56 |
| R6 | Actual | 0.42% | $1,000.00 | $1,079.73 | $2.17 |
| Hypothetical (h) | 0.42% | $1,000.00 | $1,022.77 | $2.11 |
| (h) | 5% class return per year before expenses. |
| (p) | “Expenses Paid During Period” are equal to each class’s annualized expense ratio, as shown above, multiplied by the average account value over the period, multiplied by 182/366 (to reflect the one-half year period). Expenses paid do not include any applicable sales charges (loads). If these transaction costs had been included, your costs would have been higher. |
Portfolio of Investments
4/30/24
The Portfolio of Investments is a complete list of all securities owned by your fund. It is categorized by broad-based asset classes.
| Issuer | | | Shares/Par | Value ($) |
| Bonds – 97.0% |
| Aerospace & Defense – 2.6% |
| Boeing Co., 2.196%, 2/04/2026 | | $ | 8,727,000 | $8,140,332 |
| Boeing Co., 5.15%, 5/01/2030 | | | 15,298,000 | 14,468,699 |
| Boeing Co., 6.388%, 5/01/2031 (n)(w) | | | 6,580,000 | 6,609,558 |
| Boeing Co., 5.805%, 5/01/2050 | | | 36,763,000 | 32,532,438 |
| General Dynamics Corp., 3.625%, 4/01/2030 | | | 13,022,000 | 11,953,975 |
| L3 Harris Technologies, Inc., 5.4%, 1/15/2027 | | | 11,915,000 | 11,893,857 |
| L3 Harris Technologies, Inc., 5.4%, 7/31/2033 | | | 9,532,000 | 9,284,907 |
| TransDigm, Inc., 6.875%, 12/15/2030 (n) | | | 19,115,000 | 19,244,971 |
| | | | | $114,128,737 |
| Apparel Manufacturers – 0.3% |
| Tapestry, Inc., 7%, 11/27/2026 | | $ | 4,027,000 | $4,104,021 |
| Tapestry, Inc., 4.125%, 7/15/2027 | | | 2,710,000 | 2,554,040 |
| Tapestry, Inc., 3.05%, 3/15/2032 | | | 5,674,000 | 4,506,681 |
| | | | | $11,164,742 |
| Asset-Backed & Securitized – 3.1% |
| 3650R Commercial Mortgage Trust, 2021-PF1, “XA”, 1.126%, 11/15/2054 (i) | | $ | 111,783,707 | $5,143,392 |
| ACREC 2021-FL1 Ltd., “A”, FLR, 6.583% ((SOFR - 1mo. + 0.11448%) + 1.15%), 10/16/2036 (n) | | | 15,741,247 | 15,651,774 |
| Arbor Realty Trust, Inc., CLO, 2021-FL4, “AS”, FLR, 7.135% ((SOFR - 1mo. + 0.11448%) + 1.7%), 11/15/2036 (n) | | | 4,841,000 | 4,776,187 |
| ARI Fleet Lease Trust, 2023-A, “A2”, 5.41%, 2/17/2032 (n) | | | 3,767,459 | 3,755,117 |
| Bayview Financial Revolving Mortgage Loan Trust, FLR, 7.033% ((SOFR - 1mo. + 0.11448%) + 1.6%), 12/28/2040 (n) | | | 218,515 | 331,771 |
| BDS 2021-FL7 Ltd., “B”, FLR, 6.933% ((SOFR - 1mo. + 0.11448%) + 1.5%), 6/16/2036 (n) | | | 4,505,000 | 4,422,450 |
| Benchmark 2021-B27 Mortgage Trust, “XA”, 1.374%, 7/15/2054 (i) | | | 198,741,051 | 11,463,583 |
| JPMorgan Chase Commercial Mortgage Securities Corp., 5.754%, 7/15/2042 (n) | | | 23,552 | 20,572 |
| KREF 2018-FT1 Ltd., “A”, FLR, 6.501% ((SOFR - 1mo. + 0.11448%) + 1.07%), 2/15/2039 (n) | | | 8,240,294 | 8,096,147 |
| KREF 2018-FT1 Ltd., “AS”, FLR, 6.731% ((SOFR - 1mo. + 0.11448%) + 1.3%), 2/15/2039 (n) | | | 9,074,500 | 8,752,609 |
| LAD Auto Receivables Trust, 2023-2A, “A2”, 5.93%, 6/15/2027 (n) | | | 8,577,838 | 8,582,947 |
| MF1 2022-FL8 Ltd., “A”, FLR, 6.669% (SOFR - 1mo. + 1.35%), 2/19/2037 (n) | | | 12,662,588 | 12,568,834 |
Portfolio of Investments – continued
| Issuer | | | Shares/Par | Value ($) |
| Bonds – continued |
| Asset-Backed & Securitized – continued |
| OBX Trust, 2023-NQM5, “A1”, 5.988%, 12/01/2064 (n) | | $ | 5,605,563 | $5,556,395 |
| OBX Trust, 2024-NQM1, “A1”, 5.928%, 11/25/2063 (n) | | | 4,479,180 | 4,437,273 |
| OBX Trust, 2024-NQM3, “A1”, 6.129%, 12/25/2063 (n) | | | 5,999,032 | 5,971,838 |
| PFP III 2021-8 Ltd., “A”, FLR, 6.433% ((SOFR - 1mo. + 0.11448%) + 1%), 8/09/2037 (n) | | | 3,205,414 | 3,183,924 |
| PFP III 2021-8 Ltd., “AS”, FLR, 6.683% ((SOFR - 1mo. + 0.11448%) + 1.25%), 8/09/2037 (n) | | | 17,557,000 | 17,087,965 |
| SBNA Auto Lease Trust, 2023-A, “A2”, 6.27%, 4/20/2026 (n) | | | 8,318,977 | 8,347,740 |
| Toyota Lease Owner Trust, 2023-A, “A2”, 5.3%, 8/20/2025 (n) | | | 2,234,203 | 2,231,599 |
| Virginia Power Fuel Securitization LLC, 5.088%, 5/01/2027 | | | 5,527,000 | 5,483,013 |
| | | | | $135,865,130 |
| Automotive – 1.4% |
| Cummins, Inc., 5.15%, 2/20/2034 | | $ | 7,822,000 | $7,679,139 |
| Cummins, Inc., 5.45%, 2/20/2054 | | | 7,545,000 | 7,263,020 |
| Ford Motor Credit Co. LLC, 5.8%, 3/05/2027 | | | 8,394,000 | 8,338,378 |
| Ford Motor Credit Co. LLC, 4.95%, 5/28/2027 | | | 10,040,000 | 9,699,174 |
| Ford Motor Credit Co. LLC, 5.8%, 3/08/2029 | | | 9,607,000 | 9,440,902 |
| Ford Motor Credit Co. LLC, 5.113%, 5/03/2029 | | | 11,273,000 | 10,741,256 |
| Volkswagen Group of America Finance LLC, 6.2%, 11/16/2028 (n) | | | 8,166,000 | 8,340,587 |
| | | | | $61,502,456 |
| Broadcasting – 1.2% |
| Discovery Communications LLC, 4.125%, 5/15/2029 | | $ | 7,049,000 | $6,444,906 |
| Discovery Communications LLC, 5.3%, 5/15/2049 | | | 7,539,000 | 5,931,027 |
| Walt Disney Co., 3.5%, 5/13/2040 | | | 25,879,000 | 20,155,138 |
| Walt Disney Co., 4.75%, 9/15/2044 | | | 2,217,000 | 1,969,843 |
| Walt Disney Co., 3.6%, 1/13/2051 | | | 9,908,000 | 7,196,064 |
| WarnerMedia Holdings, Inc., 4.279%, 3/15/2032 | | | 9,967,000 | 8,585,440 |
| | | | | $50,282,418 |
| Brokerage & Asset Managers – 1.5% |
| Brookfield Finance, Inc., 2.34%, 1/30/2032 | | $ | 13,327,000 | $10,539,640 |
| Charles Schwab Corp., 5.643% to 5/19/2028, FLR (SOFR - 1 day + 2.210%) to 5/19/2029 | | | 6,874,000 | 6,884,822 |
| Charles Schwab Corp., 6.136% to 8/24/2033, FLR (SOFR - 1 day + 2.01%) to 8/24/2034 | | | 10,112,000 | 10,253,348 |
| LPL Holdings, Inc., 4.625%, 11/15/2027 (n) | | | 12,968,000 | 12,357,170 |
| LPL Holdings, Inc., 6.75%, 11/17/2028 | | | 3,337,000 | 3,429,617 |
| LPL Holdings, Inc., 4.375%, 5/15/2031 (n) | | | 16,854,000 | 14,995,077 |
| LSEG US Financial Corp., 5.297%, 3/28/2034 (n) | | | 6,298,000 | 6,118,148 |
| | | | | $64,577,822 |
Portfolio of Investments – continued
| Issuer | | | Shares/Par | Value ($) |
| Bonds – continued |
| Building – 0.4% |
| Summit Materials LLC/Summit Materials Finance Corp., 7.25%, 1/15/2031 (n) | | $ | 5,889,000 | $6,049,970 |
| Vulcan Materials Co., 3.5%, 6/01/2030 | | | 6,389,000 | 5,739,163 |
| Vulcan Materials Co., 4.5%, 6/15/2047 | | | 7,860,000 | 6,439,033 |
| | | | | $18,228,166 |
| Business Services – 0.7% |
| Fiserv, Inc., 2.25%, 6/01/2027 | | $ | 11,840,000 | $10,758,145 |
| Fiserv, Inc., 4.4%, 7/01/2049 | | | 13,643,000 | 10,900,119 |
| Visa, Inc., 3.65%, 9/15/2047 | | | 9,718,000 | 7,377,059 |
| | | | | $29,035,323 |
| Cable TV – 1.3% |
| Charter Communications Operating LLC/Charter Communications Operating Capital Corp., 5.375%, 5/01/2047 | | $ | 11,438,000 | $8,744,201 |
| Comcast Corp., 2.887%, 11/01/2051 | | | 22,816,000 | 13,798,429 |
| Cox Communications, Inc., 5.7%, 6/15/2033 (n) | | | 16,866,000 | 16,506,362 |
| Cox Communications, Inc., 4.5%, 6/30/2043 (n) | | | 4,237,000 | 3,326,010 |
| Sirius XM Radio, Inc., 4.125%, 7/01/2030 (n) | | | 17,335,000 | 14,701,132 |
| | | | | $57,076,134 |
| Chemicals – 0.4% |
| SCIH Salt Holdings, Inc., 4.875%, 5/01/2028 (n) | | $ | 18,888,000 | $17,561,845 |
| Computer Software – 0.7% |
| Cisco Systems, Inc., 5.5%, 1/15/2040 | | $ | 7,722,000 | $7,690,649 |
| Microsoft Corp., 2.525%, 6/01/2050 | | | 5,450,000 | 3,335,270 |
| Microsoft Corp., 2.5%, 9/15/2050 (n) | | | 14,610,000 | 8,772,181 |
| Oracle Corp., 5.55%, 2/06/2053 | | | 10,951,000 | 10,064,500 |
| | | | | $29,862,600 |
| Computer Software - Systems – 0.4% |
| Apple, Inc., 2.05%, 9/11/2026 (f) | | $ | 12,687,000 | $11,815,332 |
| Apple, Inc., 2.7%, 8/05/2051 | | | 6,683,000 | 4,118,167 |
| | | | | $15,933,499 |
| Conglomerates – 1.8% |
| nVent Finance S.à r.l., 5.65%, 5/15/2033 | | $ | 12,831,000 | $12,664,280 |
| Regal Rexnord Corp., 6.05%, 4/15/2028 (n) | | | 10,547,000 | 10,526,619 |
| Regal Rexnord Corp., 6.3%, 2/15/2030 (n) | | | 14,860,000 | 14,923,540 |
| Regal Rexnord Corp., 6.4%, 4/15/2033 (n) | | | 10,590,000 | 10,675,886 |
| Westinghouse Air Brake Technologies Corp., 3.2%, 6/15/2025 | | | 5,611,000 | 5,445,827 |
| Westinghouse Air Brake Technologies Corp., 4.7%, 9/15/2028 | | | 15,305,000 | 14,731,125 |
Portfolio of Investments – continued
| Issuer | | | Shares/Par | Value ($) |
| Bonds – continued |
| Conglomerates – continued |
| Westinghouse Air Brake Technologies Corp., 5.611%, 3/11/2034 | | $ | 8,326,000 | $8,184,896 |
| | | | | $77,152,173 |
| Consumer Products – 1.0% |
| Kenvue, Inc., 5%, 3/22/2030 | | $ | 11,408,000 | $11,270,197 |
| Kenvue, Inc., 5.1%, 3/22/2043 | | | 10,021,000 | 9,454,810 |
| Kenvue, Inc., 5.05%, 3/22/2053 | | | 9,133,000 | 8,433,423 |
| Mattel, Inc., 3.75%, 4/01/2029 (n) | | | 15,859,000 | 14,394,377 |
| | | | | $43,552,807 |
| Consumer Services – 0.6% |
| CBRE Group, Inc., 5.95%, 8/15/2034 | | $ | 27,311,000 | $27,155,116 |
| Electrical Equipment – 0.5% |
| Arrow Electronics, Inc., 5.875%, 4/10/2034 | | $ | 20,675,000 | $19,928,416 |
| Electronics – 1.2% |
| Intel Corp., 5.7%, 2/10/2053 | | $ | 17,168,000 | $16,393,546 |
| Lam Research Corp., 1.9%, 6/15/2030 | | | 3,948,000 | 3,257,086 |
| Lam Research Corp., 4.875%, 3/15/2049 | | | 7,791,000 | 6,999,635 |
| NXP B.V./NXP Funding LLC/NXP USA, Inc., 5%, 1/15/2033 | | | 3,324,000 | 3,152,545 |
| NXP B.V./NXP Funding LLC/NXP USA, Inc., 3.125%, 2/15/2042 | | | 12,491,000 | 8,540,394 |
| Sensata Technologies, Inc., 4.375%, 2/15/2030 (n) | | | 14,219,000 | 12,730,086 |
| | | | | $51,073,292 |
| Emerging Market Quasi-Sovereign – 0.2% |
| Qatar Petroleum, 3.125%, 7/12/2041 (n) | | $ | 14,719,000 | $10,510,720 |
| Emerging Market Sovereign – 0.3% |
| United Mexican States, 6.338%, 5/04/2053 | | $ | 15,650,000 | $14,558,118 |
| Energy - Independent – 2.5% |
| Diamondback Energy, Inc., 5.4%, 4/18/2034 | | $ | 6,440,000 | $6,258,144 |
| Diamondback Energy, Inc., 5.75%, 4/18/2054 | | | 12,093,000 | 11,544,688 |
| EQT Corp., 5.7%, 4/01/2028 | | | 3,455,000 | 3,442,344 |
| EQT Corp., 3.625%, 5/15/2031 (n) | | | 11,873,000 | 10,270,088 |
| Occidental Petroleum Corp., 6.125%, 1/01/2031 | | | 7,894,000 | 7,993,070 |
| Occidental Petroleum Corp., 4.4%, 4/15/2046 | | | 16,739,000 | 12,931,675 |
| Permian Resources Operating LLC, 7%, 1/15/2032 (n) | | | 12,809,000 | 13,057,682 |
| Pioneer Natural Resources Co., 5.1%, 3/29/2026 | | | 8,177,000 | 8,116,977 |
| Pioneer Natural Resources Co., 1.9%, 8/15/2030 | | | 2,906,000 | 2,384,279 |
| Pioneer Natural Resources Co., 2.15%, 1/15/2031 | | | 21,285,000 | 17,525,130 |
| Santos Finance Ltd., 6.875%, 9/19/2033 (n) | | | 17,013,000 | 17,485,128 |
| | | | | $111,009,205 |
Portfolio of Investments – continued
| Issuer | | | Shares/Par | Value ($) |
| Bonds – continued |
| Energy - Integrated – 0.4% |
| BP Capital Markets America, Inc., 1.749%, 8/10/2030 | | $ | 6,943,000 | $5,660,351 |
| BP Capital Markets America, Inc., 4.812%, 2/13/2033 | | | 4,600,000 | 4,397,100 |
| BP Capital Markets America, Inc., 3.001%, 3/17/2052 | | | 10,654,000 | 6,732,071 |
| | | | | $16,789,522 |
| Entertainment – 0.6% |
| Royal Caribbean Cruises Ltd., 4.25%, 7/01/2026 (n) | | $ | 18,053,000 | $17,334,301 |
| Six Flags Entertainment Corp., 6.625%, 5/01/2032 (n) | | | 8,554,000 | 8,519,880 |
| | | | | $25,854,181 |
| Financial Institutions – 1.5% |
| Avolon Holdings Funding Ltd., 4.375%, 5/01/2026 (n) | | $ | 4,843,000 | $4,665,593 |
| Avolon Holdings Funding Ltd., 3.25%, 2/15/2027 (n) | | | 9,024,000 | 8,320,444 |
| Avolon Holdings Funding Ltd., 2.75%, 2/21/2028 (n) | | | 3,243,000 | 2,869,248 |
| Fortress Transportation and Infrastructure Investors LLC, 7%, 5/01/2031 (n) | | | 13,702,000 | 13,776,022 |
| Global Aircraft Leasing Co. Ltd., 6.5% (6.5% Cash or 7.25% PIK), 9/15/2024 (n)(p) | | | 14,963,450 | 14,155,005 |
| Macquarie AirFinance Holdings Ltd., 8.125%, 3/30/2029 (n) | | | 5,642,000 | 5,899,862 |
| Macquarie AirFinance Holdings Ltd., 6.5%, 3/26/2031 (n) | | | 7,609,000 | 7,614,684 |
| SMBC Aviation Capital Finance DAC, 5.3%, 4/03/2029 (n) | | | 9,997,000 | 9,751,124 |
| | | | | $67,051,982 |
| Food & Beverages – 4.3% |
| Anheuser-Busch InBev Worldwide, Inc., 4.375%, 4/15/2038 | | $ | 4,622,000 | $4,095,582 |
| Anheuser-Busch InBev Worldwide, Inc., 4.75%, 4/15/2058 | | | 15,286,000 | 13,191,818 |
| Bacardi-Martini B.V., 5.4%, 6/15/2033 (n) | | | 21,513,000 | 20,669,374 |
| Campbell Soup Co., 5.2%, 3/21/2029 | | | 9,382,000 | 9,249,237 |
| Campbell Soup Co., 2.375%, 4/24/2030 | | | 3,409,000 | 2,867,487 |
| Constellation Brands, Inc., 2.25%, 8/01/2031 | | | 12,758,000 | 10,216,211 |
| Constellation Brands, Inc., 4.75%, 5/09/2032 | | | 13,091,000 | 12,369,212 |
| Constellation Brands, Inc., 3.75%, 5/01/2050 | | | 5,973,000 | 4,280,560 |
| Diageo Capital PLC, 2.375%, 10/24/2029 | | | 8,958,000 | 7,752,603 |
| Diageo Capital PLC, 5.625%, 10/05/2033 | | | 6,595,000 | 6,713,623 |
| JBS USA Food Co., 6.5%, 12/01/2052 | | | 11,976,000 | 11,337,063 |
| JBS USA Lux S.A./JBS USA Food Co./JBS USA Finance, Inc., 5.5%, 1/15/2030 | | | 4,282,000 | 4,133,408 |
| JBS USA Lux S.A./JBS USA Food Co./JBS USA Finance, Inc., 3.75%, 12/01/2031 | | | 12,802,000 | 10,814,427 |
| JDE Peet's N.V., 0.8%, 9/24/2024 (n) | | | 10,304,000 | 10,073,211 |
| Kraft Heinz Foods Co., 4.875%, 10/01/2049 | | | 12,944,000 | 11,114,531 |
| Kraft Heinz Foods Co., 5.5%, 6/01/2050 | | | 12,522,000 | 11,726,298 |
| Mars, Inc., 4.55%, 4/20/2028 (n) | | | 21,743,000 | 21,162,361 |
| SYSCO Corp., 4.45%, 3/15/2048 | | | 9,063,000 | 7,333,069 |
Portfolio of Investments – continued
| Issuer | | | Shares/Par | Value ($) |
| Bonds – continued |
| Food & Beverages – continued |
| Viterra Finance B.V., 3.2%, 4/21/2031 (n) | | $ | 5,281,000 | $4,451,120 |
| Viterra Finance B.V., 5.25%, 4/21/2032 (n) | | | 3,134,000 | 2,995,301 |
| | | | | $186,546,496 |
| Gaming & Lodging – 1.5% |
| Flutter Treasury DAC, 6.375%, 4/29/2029 (n) | | $ | 7,016,000 | $7,035,013 |
| Marriott International, Inc., 4%, 4/15/2028 | | | 7,013,000 | 6,644,618 |
| Marriott International, Inc., 2.85%, 4/15/2031 | | | 12,565,000 | 10,539,306 |
| Melco Resorts Finance Ltd., 7.625%, 4/17/2032 (n) | | | 8,328,000 | 8,146,450 |
| Sands China Ltd., 2.85%, 3/08/2029 | | | 10,138,000 | 8,711,301 |
| Sands China Ltd., 3.25%, 8/08/2031 | | | 5,716,000 | 4,668,735 |
| VICI Properties LP/VICI Note Co., Inc., 4.25%, 12/01/2026 (n) | | | 7,044,000 | 6,721,189 |
| Wynn Macau Ltd., 5.5%, 10/01/2027 (n) | | | 14,957,000 | 14,092,829 |
| | | | | $66,559,441 |
| Insurance – 1.4% |
| Corebridge Financial, Inc., 3.9%, 4/05/2032 | | $ | 22,135,000 | $19,310,405 |
| Corebridge Financial, Inc., 4.35%, 4/05/2042 | | | 2,707,000 | 2,170,308 |
| Lincoln National Corp., 5.852%, 3/15/2034 | | | 22,341,000 | 21,464,083 |
| Sammons Financial Group, Inc., 6.875%, 4/15/2034 (n) | | | 17,496,000 | 17,258,520 |
| Unum Group, 4.125%, 6/15/2051 | | | 781,000 | 557,209 |
| | | | | $60,760,525 |
| Insurance - Health – 1.0% |
| Humana, Inc., 4.95%, 10/01/2044 | | $ | 9,162,000 | $7,852,005 |
| Humana, Inc., 5.5%, 3/15/2053 | | | 3,660,000 | 3,336,724 |
| UnitedHealth Group, Inc., 5.3%, 2/15/2030 | | | 8,423,000 | 8,425,631 |
| UnitedHealth Group, Inc., 4.625%, 7/15/2035 | | | 12,467,000 | 11,692,532 |
| UnitedHealth Group, Inc., 5.875%, 2/15/2053 | | | 12,207,000 | 12,428,885 |
| | | | | $43,735,777 |
| Insurance - Property & Casualty – 2.5% |
| Alliant Holdings Intermediate LLC/Alliant Holdings Co-Issuer, 6.75%, 4/15/2028 (n) | | $ | 5,404,000 | $5,398,298 |
| American International Group, Inc., 5.125%, 3/27/2033 | | | 12,789,000 | 12,266,813 |
| Arthur J. Gallagher & Co., 6.5%, 2/15/2034 | | | 14,386,000 | 14,982,159 |
| Arthur J. Gallagher & Co., 6.75%, 2/15/2054 | | | 11,784,000 | 12,689,053 |
| Fairfax Financial Holdings Ltd., 3.375%, 3/03/2031 | | | 11,222,000 | 9,590,540 |
| Fairfax Financial Holdings Ltd., 5.625%, 8/16/2032 | | | 4,771,000 | 4,631,033 |
| Fairfax Financial Holdings Ltd., 6%, 12/07/2033 (n) | | | 10,406,000 | 10,326,878 |
| Fairfax Financial Holdings Ltd., 6.35%, 3/22/2054 (n) | | | 11,191,000 | 11,063,456 |
| Panther Escrow Issuer, 7.125%, 6/01/2031 (n) | | | 10,393,000 | 10,446,900 |
| RenaissanceRe Holdings Ltd., 5.75%, 6/05/2033 | | | 17,426,000 | 16,986,250 |
| | | | | $108,381,380 |
Portfolio of Investments – continued
| Issuer | | | Shares/Par | Value ($) |
| Bonds – continued |
| International Market Quasi-Sovereign – 0.7% |
| NBN Co. Ltd. (Commonwealth of Australia), 5.75%, 10/06/2028 (n) | | $ | 16,054,000 | $16,269,966 |
| Ontario Teachers' Cadillac Fairview Properties, 2.5%, 10/15/2031 (n) | | | 20,295,000 | 16,047,768 |
| | | | | $32,317,734 |
| International Market Sovereign – 0.5% |
| Government of Bermuda, 5%, 7/15/2032 (n) | | $ | 25,609,000 | $24,149,287 |
| Machinery & Tools – 1.7% |
| AGCO Corp., 5.8%, 3/21/2034 | | $ | 22,046,000 | $21,570,830 |
| Ashtead Capital, Inc., 4.375%, 8/15/2027 (n) | | | 3,228,000 | 3,071,415 |
| Ashtead Capital, Inc., 5.55%, 5/30/2033 (n) | | | 9,885,000 | 9,465,087 |
| Ashtead Capital, Inc., 5.95%, 10/15/2033 (n) | | | 3,902,000 | 3,842,048 |
| CNH Industrial Capital LLC, 5.45%, 10/14/2025 | | | 17,462,000 | 17,421,489 |
| CNH Industrial Capital LLC, 5.5%, 1/12/2029 | | | 15,194,000 | 15,141,923 |
| CNH Industrial N.V., 3.85%, 11/15/2027 | | | 5,323,000 | 5,069,278 |
| | | | | $75,582,070 |
| Major Banks – 16.7% |
| Bank of America Corp., 4.376% to 4/27/2027, FLR (SOFR - 1 day + 1.58%) to 4/27/2028 | | $ | 25,565,000 | $24,709,673 |
| Bank of America Corp., 5.819% to 9/15/2028, FLR (SOFR - 1 day + 1.57%) to 9/15/2029 | | | 19,822,000 | 19,938,626 |
| Bank of America Corp., 2.687% to 4/22/2031, FLR (SOFR - 1 day + 1.32%) to 4/22/2032 | | | 8,035,000 | 6,620,320 |
| Bank of America Corp., 5.872% to 9/15/2033, FLR (SOFR - 1 day + 1.84%) to 9/15/2034 | | | 18,943,000 | 18,977,453 |
| Barclays PLC, 2.894% to 11/24/2031, FLR (CMT - 1yr. + 1.3%) to 11/24/2032 | | | 19,828,000 | 16,073,509 |
| Capital One Financial Corp., 6.312% to 6/08/2028, FLR (SOFR - 1 day + 2.640%) to 6/08/2029 | | | 8,133,000 | 8,204,894 |
| Comerica, Inc., 5.982% to 1/30/2029, FLR (SOFR - 1 day + 2.155%) to 1/30/2030 | | | 14,075,000 | 13,668,090 |
| Commonwealth Bank of Australia, 3.61% to 9/12/2029, FLR (CMT - 1yr. + 2.05%) to 9/12/2034 (n) | | | 12,534,000 | 11,056,556 |
| Commonwealth Bank of Australia, 3.305%, 3/11/2041 (n) | | | 18,459,000 | 13,026,226 |
| Credit Agricole S.A., 1.247% to 1/26/2026, FLR (SOFR - 1 day + 0.89162%) to 1/26/2027 (n) | | | 28,208,000 | 26,085,480 |
| Danske Bank A.S., 5.705% to 3/01/2029, FLR (CMT - 1yr. + 1.4%) to 3/01/2030 (n) | | | 16,262,000 | 16,059,180 |
| Deutsche Bank AG, 5.706% to 2/08/2027, FLR (SOFR - 1 day + 1.594%) to 2/08/2028 | | | 11,567,000 | 11,458,841 |
Portfolio of Investments – continued
| Issuer | | | Shares/Par | Value ($) |
| Bonds – continued |
| Major Banks – continued |
| Deutsche Bank AG, 7.079% to 2/10/2033, FLR (SOFR - 1 day + 3.65%) to 2/10/2034 | | $ | 15,155,000 | $15,112,473 |
| HSBC Holdings PLC, 2.357% to 8/18/2030, FLR (SOFR - 1 day + 1.947%) to 8/18/2031 | | | 21,465,000 | 17,459,567 |
| HSBC Holdings PLC, 2.871% to 11/22/2031, FLR (SOFR - 1 day + 1.41%) to 11/22/2032 | | | 8,263,000 | 6,701,848 |
| Huntington Bancshares, Inc., 6.208% to 8/21/2028, FLR (SOFR - 1 day + 2.02%) to 8/21/2029 | | | 12,477,000 | 12,529,863 |
| JPMorgan Chase & Co., 6.07% to 10/22/2026, FLR (SOFR - 1 day + 1.33%) to 10/22/2027 | | | 25,493,000 | 25,792,738 |
| JPMorgan Chase & Co., 4.323% to 4/26/2027, FLR (SOFR - 1 day + 1.56%) to 4/26/2028 | | | 4,363,000 | 4,217,789 |
| JPMorgan Chase & Co., 3.54%, 5/01/2028 | | | 18,887,000 | 17,822,169 |
| JPMorgan Chase & Co., 5.581% to 4/22/2029, FLR (SOFR - 1 day + 1.16%) to 4/22/2030 | | | 9,529,000 | 9,520,553 |
| JPMorgan Chase & Co., 2.545% to 11/08/2031, FLR (SOFR - 1 day + 1.18%) to 11/08/2032 | | | 37,249,000 | 30,220,577 |
| JPMorgan Chase & Co., 5.336% to 1/23/2034, FLR (SOFR - 1 day + 1.62%) to 1/23/2035 | | | 7,807,000 | 7,567,503 |
| Mitsubishi UFJ Financial Group, Inc., 5.719% to 2/20/2025, FLR (CMT - 1yr. + 1.08%) to 2/20/2026 | | | 24,317,000 | 24,266,776 |
| Mitsubishi UFJ Financial Group, Inc., 1.64% to 10/13/2026, FLR (CMT - 1yr. + 0.67%) to 10/13/2027 | | | 14,185,000 | 12,904,742 |
| Mizuho Financial Group, 5.754%, 5/27/2034 | | | 14,342,000 | 14,304,145 |
| Morgan Stanley, 0.985% to 12/10/2025, FLR (SOFR - 1 day + 0.72%) to 12/10/2026 | | | 17,246,000 | 15,969,863 |
| Morgan Stanley, 5.449% to 7/20/2028, FLR (SOFR - 1 day + 1.63%) to 7/20/2029 | | | 8,281,000 | 8,230,355 |
| Morgan Stanley, 4.431% to 1/23/2029, FLR ((SOFR - 3mo. + 0.26161%) + 1.628%) to 1/23/2030 | | | 3,224,000 | 3,066,770 |
| Morgan Stanley, 3.622% to 4/01/2030, FLR (SOFR - 1 day + 3.12%) to 4/01/2031 | | | 23,279,000 | 20,923,291 |
| Morgan Stanley, 5.424% to 7/21/2033, FLR (SOFR - 1 day + 1.88%) to 7/21/2034 | | | 8,881,000 | 8,617,573 |
| National Australia Bank Ltd., 3.347% to 1/12/2032, FLR (CMT - 5yr. + 1.7%) to 1/12/2037 (n) | | | 21,704,000 | 17,859,314 |
| NatWest Group PLC, 5.847% to 3/02/2026, FLR (CMT - 1yr. + 1.35%) to 3/02/2027 | | | 10,295,000 | 10,287,522 |
| NatWest Group PLC, 5.583%, 3/01/2028 | | | 9,594,000 | 9,533,652 |
| Nordea Bank Abp, 1.5%, 9/30/2026 (n) | | | 24,233,000 | 21,981,528 |
| PNC Financial Services Group, Inc., 5.3% to 1/21/2027, FLR (SOFR - 1 day + 1.342%) to 1/21/2028 | | | 9,221,000 | 9,140,819 |
Portfolio of Investments – continued
| Issuer | | | Shares/Par | Value ($) |
| Bonds – continued |
| Major Banks – continued |
| PNC Financial Services Group, Inc., 5.676% to 1/22/2034, FLR (SOFR - 1 day + 1.902%) to 1/22/2035 | | $ | 14,337,000 | $14,046,316 |
| Royal Bank of Canada, 2.3%, 11/03/2031 | | | 19,141,000 | 15,467,954 |
| Sumitomo Mitsui Financial Group, Inc., 1.71%, 1/12/2031 | | | 28,730,000 | 22,496,087 |
| Sumitomo Mitsui Trust Bank Ltd., 5.65%, 3/09/2026 (n) | | | 19,569,000 | 19,583,378 |
| Toronto-Dominion Bank, 4.108%, 6/08/2027 | | | 12,741,000 | 12,248,188 |
| Toronto-Dominion Bank, 4.693%, 9/15/2027 | | | 16,991,000 | 16,600,328 |
| UBS Group AG, 3.126% to 8/13/2029, FLR (LIBOR - 3mo. + 1.468%) to 8/13/2030 (n) | | | 34,761,000 | 30,471,470 |
| UBS Group AG, 4.375% to 2/10/2031, FLR (CMT - 1yr. + 3.313%) to 8/10/2171 (n) | | | 22,649,000 | 18,088,622 |
| UBS Group AG, 9.25% to 11/13/2033, FLR (CMT - 5yr. + 4.758%) to 5/13/2172 (n) | | | 5,754,000 | 6,314,940 |
| UniCredit S.p.A., 2.569% to 9/22/2025, FLR (CMT - 1yr. + 2.3%) to 9/22/2026 (n) | | | 18,700,000 | 17,832,499 |
| UniCredit S.p.A., 1.982% to 6/03/2026, FLR (CMT - 1yr. + 1.2%) to 6/03/2027 (n) | | | 10,140,000 | 9,335,118 |
| Wells Fargo & Co., 3.908% to 4/25/2025, FLR (SOFR - 1 day + 1.32%) to 4/25/2026 | | | 15,012,000 | 14,723,728 |
| Wells Fargo & Co., 5.574% to 7/25/2028, FLR (SOFR - 1 day + 1.74%) to 7/25/2029 | | | 13,754,000 | 13,710,074 |
| Wells Fargo & Co., 3.35% to 3/02/2032, FLR (SOFR - 1 day + 1.5%) to 3/02/2033 | | | 7,908,000 | 6,675,621 |
| | | | | $727,504,601 |
| Medical & Health Technology & Services – 2.6% |
| Alcon Finance Corp., 2.6%, 5/27/2030 (n) | | $ | 20,216,000 | $17,132,273 |
| Alcon Finance Corp., 3.8%, 9/23/2049 (n) | | | 6,904,000 | 5,042,582 |
| Becton, Dickinson and Co., 2.823%, 5/20/2030 | | | 5,566,000 | 4,796,772 |
| Becton, Dickinson and Co., 4.298%, 8/22/2032 | | | 3,494,000 | 3,209,815 |
| Becton, Dickinson and Co., 4.685%, 12/15/2044 | | | 6,838,000 | 5,872,780 |
| CVS Health Corp., 5%, 2/20/2026 | | | 8,421,000 | 8,336,947 |
| CVS Health Corp., 5.625%, 2/21/2053 | | | 10,784,000 | 9,947,681 |
| ICON Investments Six DAC, 5.809%, 5/08/2027 (w) | | | 17,938,000 | 17,938,000 |
| ICON Investments Six DAC, 5.849%, 5/08/2029 (w) | | | 5,758,000 | 5,758,000 |
| IQVIA Holdings, Inc., 6.25%, 2/01/2029 | | | 12,166,000 | 12,364,026 |
| Marin General Hospital, 7.242%, 8/01/2045 | | | 8,685,000 | 8,982,293 |
| Thermo Fisher Scientific, Inc., 4.977%, 8/10/2030 | | | 2,497,000 | 2,454,186 |
| Thermo Fisher Scientific, Inc., 2%, 10/15/2031 | | | 6,659,000 | 5,315,424 |
| Thermo Fisher Scientific, Inc., 2.8%, 10/15/2041 | | | 7,023,000 | 4,848,602 |
| | | | | $111,999,381 |
| Medical Equipment – 0.2% |
| Danaher Corp., 2.6%, 10/01/2050 | | $ | 16,527,000 | $9,798,664 |
Portfolio of Investments – continued
| Issuer | | | Shares/Par | Value ($) |
| Bonds – continued |
| Metals & Mining – 1.2% |
| Anglo American Capital PLC, 2.25%, 3/17/2028 (n) | | $ | 11,184,000 | $9,862,680 |
| Anglo American Capital PLC, 2.625%, 9/10/2030 (n) | | | 4,570,000 | 3,833,715 |
| FMG Resources Ltd., 4.375%, 4/01/2031 (n) | | | 17,960,000 | 15,812,760 |
| Glencore Funding LLC, 3.875%, 10/27/2027 (n) | | | 8,624,000 | 8,126,012 |
| Novelis Corp., 4.75%, 1/30/2030 (n) | | | 18,174,000 | 16,629,588 |
| | | | | $54,264,755 |
| Midstream – 4.3% |
| Columbia Pipelines Holdings Co. LLC, 6.055%, 8/15/2026 (n) | | $ | 3,370,000 | $3,381,481 |
| Columbia Pipelines Operating Co. LLC, 6.497%, 8/15/2043 (n) | | | 4,836,000 | 4,915,338 |
| Columbia Pipelines Operating Co. LLC, 6.544%, 11/15/2053 (n) | | | 19,527,000 | 20,140,478 |
| Enbridge, Inc., 5.95%, 4/05/2054 | | | 9,370,000 | 9,073,287 |
| Enbridge, Inc., 8.5% to 1/15/2034, FLR (CMT - 5yr. + 4.431%) to 1/15/2054, FLR (CMT - 5yr. + 5.181%) to 1/15/2084 | | | 14,863,000 | 15,681,178 |
| Energy Transfer LP, 4%, 10/01/2027 | | | 8,335,000 | 7,924,164 |
| Energy Transfer LP, 5.95%, 5/15/2054 | | | 8,347,000 | 7,866,794 |
| Energy Transfer LP, 7.125% to 5/15/2030, FLR (CMT - 5yr. + 5.306%) to 5/15/2171 | | | 14,243,000 | 13,674,912 |
| EQM Midstream Partners LP, 4.5%, 1/15/2029 (n) | | | 8,946,000 | 8,277,095 |
| Galaxy Pipeline Assets Bidco Ltd., 1.75%, 9/30/2027 (n) | | | 21,103,364 | 19,554,328 |
| Galaxy Pipeline Assets Bidco Ltd., 2.16%, 3/31/2034 (n) | | | 3,466,081 | 2,891,455 |
| Plains All American Pipeline LP, 4.65%, 10/15/2025 | | | 15,024,000 | 14,766,485 |
| Plains All American Pipeline LP, 3.55%, 12/15/2029 | | | 11,859,000 | 10,667,454 |
| Plains All American Pipeline LP, 4.9%, 2/15/2045 | | | 8,649,000 | 7,181,175 |
| Targa Resources Corp., 4.2%, 2/01/2033 | | | 9,631,000 | 8,501,157 |
| Targa Resources Corp., 4.95%, 4/15/2052 | | | 20,184,000 | 16,805,409 |
| Venture Global Calcasieu Pass LLC, 6.25%, 1/15/2030 (n) | | | 4,378,000 | 4,328,606 |
| Venture Global Calcasieu Pass LLC, 4.125%, 8/15/2031 (n) | | | 5,012,000 | 4,374,335 |
| Venture Global LNG, Inc., 9.5%, 2/01/2029 (n) | | | 6,218,000 | 6,683,492 |
| | | | | $186,688,623 |
| Municipals – 0.5% |
| Golden State, CA, Tobacco Securitization Corp., Tobacco Settlement Rev., Taxable, “B”, 2.746%, 6/01/2034 | | $ | 9,830,000 | $8,022,789 |
| National Finance Authority, NH, Utility Refunding Rev., Taxable (Wheeling Power Co. Project), “A”, 6.89%, 4/01/2034 | | | 13,505,000 | 13,498,258 |
| | | | | $21,521,047 |
| Natural Gas - Pipeline – 0.3% |
| APA Infrastructure Ltd., 5%, 3/23/2035 (n) | | $ | 12,850,000 | $11,632,828 |
| Oils – 0.4% |
| MC Brazil Downstream Trading S.à r.l., 7.25%, 6/30/2031 | | $ | 18,759,277 | $16,252,803 |
Portfolio of Investments – continued
| Issuer | | | Shares/Par | Value ($) |
| Bonds – continued |
| Other Banks & Diversified Financials – 4.2% |
| AIB Group PLC, 6.608% to 9/13/2028, FLR (SOFR - 1 day + 2.33%) to 9/13/2029 (n) | | $ | 24,810,000 | $25,288,192 |
| AIB Group PLC, 5.871% to 3/28/2034, FLR (SOFR - 1 day + 1.91%) to 3/28/2035 (n) | | | 6,142,000 | 5,943,176 |
| BBVA Bancomer S.A. (Texas), 8.125%, 1/08/2039 (n) | | | 17,196,000 | 17,421,491 |
| BPCE S.A., 5.716% to 1/18/2029, FLR (CMT - 1yr. + 1.959%) to 1/18/2030 (n) | | | 12,906,000 | 12,760,133 |
| CaixaBank S.A., 5.673% to 3/15/2029, FLR (SOFR - 1 day + 1.78%) to 3/15/2030 (n) | | | 8,800,000 | 8,647,268 |
| CaixaBank S.A., 6.84% to 9/13/2033, FLR (SOFR - 1 day + 2.77%) to 9/13/2034 (n) | | | 16,173,000 | 16,714,501 |
| Intesa Sanpaolo S.p.A., 7.2%, 11/28/2033 (n) | | | 10,166,000 | 10,623,750 |
| Intesa Sanpaolo S.p.A., 7.8%, 11/28/2053 (n) | | | 8,606,000 | 9,242,850 |
| M&T Bank Corp., 7.413% to 10/30/2028, FLR (SOFR - 1 day + 2.80%) to 10/30/2029 | | | 2,051,000 | 2,126,704 |
| M&T Bank Corp., 6.082% to 3/13/2031, FLR (SOFR - 1 day + 2.26%) to 3/13/2032 | | | 6,688,000 | 6,534,294 |
| M&T Bank Corp., 5.053% to 1/27/2033, FLR (SOFR - 1 day + 1.850%) to 1/27/2034 | | | 4,573,000 | 4,116,220 |
| Macquarie Bank Ltd. of London, 6.125% to 3/08/2027, FLR (Swap Rate - 5yr. + 4.332%) to 12/31/2165 (n) | | | 14,680,000 | 14,220,788 |
| Macquarie Group Ltd., 6.255% to 12/07/2033, FLR (SOFR - 1 day + 2.303%) to 12/07/2034 (n) | | | 9,925,000 | 10,056,025 |
| Manufacturers and Traders Trust Co., 4.7%, 1/27/2028 | | | 11,201,000 | 10,604,301 |
| Truist Financial Corp., 7.161% to 10/30/2028, FLR (SOFR - 1 day + 2.446%) to 10/30/2029 | | | 20,259,000 | 21,212,711 |
| Truist Financial Corp., 5.711% to 1/24/2034, FLR (SOFR - 1 day + 1.922%) to 1/24/2035 | | | 7,975,000 | 7,739,633 |
| | | | | $183,252,037 |
| Pharmaceuticals – 2.4% |
| AbbVie, Inc., 5.35%, 3/15/2044 | | $ | 14,936,000 | $14,444,292 |
| AbbVie, Inc., 5.4%, 3/15/2054 | | | 8,759,000 | 8,480,211 |
| Bayer US Finance LLC, 6.125%, 11/21/2026 (n) | | | 10,771,000 | 10,787,939 |
| Bayer US Finance LLC, 6.25%, 1/21/2029 (n) | | | 4,093,000 | 4,112,684 |
| Bristol-Myers Squibb Co., 5.5%, 2/22/2044 | | | 7,453,000 | 7,230,329 |
| Bristol-Myers Squibb Co., 5.55%, 2/22/2054 | | | 9,363,000 | 9,036,384 |
| Merck & Co., Inc., 2.75%, 12/10/2051 | | | 7,976,000 | 4,865,616 |
| Pfizer Investment Enterprises Pte. Ltd., 5.3%, 5/19/2053 | | | 8,900,000 | 8,299,584 |
| Pfizer, Inc., 2.55%, 5/28/2040 | | | 7,976,000 | 5,423,195 |
| Roche Holdings, Inc., 5.338%, 11/13/2028 (n) | | | 20,567,000 | 20,671,713 |
| Roche Holdings, Inc., 5.489%, 11/13/2030 (n) | | | 10,734,000 | 10,849,009 |
| | | | | $104,200,956 |
Portfolio of Investments – continued
| Issuer | | | Shares/Par | Value ($) |
| Bonds – continued |
| Pollution Control – 0.8% |
| GFL Environmental, Inc., 3.5%, 9/01/2028 (n) | | $ | 13,918,000 | $12,511,062 |
| GFL Environmental, Inc., 6.75%, 1/15/2031 (n) | | | 6,787,000 | 6,841,865 |
| Waste Management, Inc., 4.625%, 2/15/2033 | | | 16,964,000 | 16,148,050 |
| | | | | $35,500,977 |
| Precious Metals & Minerals – 0.7% |
| IAMGOLD Corp., 5.75%, 10/15/2028 (n) | | $ | 13,761,000 | $12,721,380 |
| Northern Star Resources Ltd. Co., 6.125%, 4/11/2033 (n) | | | 17,232,000 | 17,004,715 |
| | | | | $29,726,095 |
| Railroad & Shipping – 0.6% |
| Burlington Northern Santa Fe LLC, 5.2%, 4/15/2054 | | $ | 14,985,000 | $14,023,210 |
| Canadian Pacific Railway Co., 3.1%, 12/02/2051 | | | 17,537,000 | 11,258,469 |
| | | | | $25,281,679 |
| Real Estate - Office – 1.2% |
| Boston Properties LP, REIT, 3.65%, 2/01/2026 | | $ | 11,718,000 | $11,240,162 |
| Boston Properties LP, REIT, 4.5%, 12/01/2028 | | | 901,000 | 839,969 |
| Boston Properties LP, REIT, 2.45%, 10/01/2033 | | | 4,219,000 | 3,056,311 |
| COPT Defense Property LP, REIT, 2%, 1/15/2029 | | | 18,241,000 | 15,191,920 |
| COPT Defense Property LP, REIT, 2.75%, 4/15/2031 | | | 27,392,000 | 22,005,426 |
| | | | | $52,333,788 |
| Real Estate - Other – 1.8% |
| EPR Properties, REIT, 3.6%, 11/15/2031 | | $ | 21,022,000 | $17,065,430 |
| Extra Space Storage LP, 5.5%, 7/01/2030 | | | 16,979,000 | 16,734,377 |
| Lexington Realty Trust Co., 2.375%, 10/01/2031 | | | 16,899,000 | 13,152,013 |
| Prologis LP, REIT, 5.125%, 1/15/2034 | | | 20,823,000 | 20,088,334 |
| W.P. Carey, Inc., REIT, 2.45%, 2/01/2032 | | | 15,391,000 | 12,059,903 |
| | | | | $79,100,057 |
| Real Estate - Retail – 0.8% |
| NNN REIT, Inc., 5.6%, 10/15/2033 | | $ | 13,247,000 | $12,996,474 |
| STORE Capital Corp., REIT, 2.7%, 12/01/2031 | | | 26,269,000 | 20,311,103 |
| | | | | $33,307,577 |
| Retailers – 1.1% |
| Alimentation Couche-Tard, Inc., 3.439%, 5/13/2041 (n) | | $ | 1,953,000 | $1,428,327 |
| Alimentation Couche-Tard, Inc., 3.8%, 1/25/2050 (n) | | | 18,119,000 | 13,158,837 |
| Amazon.com, Inc., 3.6%, 4/13/2032 | | | 12,124,000 | 10,932,521 |
| AutoZone, Inc., 4.75%, 8/01/2032 | | | 9,131,000 | 8,615,510 |
| Home Depot, Inc., 3.3%, 4/15/2040 | | | 15,616,000 | 11,852,684 |
| Home Depot, Inc., 3.9%, 6/15/2047 | | | 2,382,000 | 1,839,538 |
| | | | | $47,827,417 |
Portfolio of Investments – continued
| Issuer | | | Shares/Par | Value ($) |
| Bonds – continued |
| Specialty Chemicals – 0.6% |
| International Flavors & Fragrances, Inc., 1.23%, 10/01/2025 (n) | | $ | 8,252,000 | $7,724,392 |
| International Flavors & Fragrances, Inc., 1.832%, 10/15/2027 (n) | | | 3,953,000 | 3,466,382 |
| International Flavors & Fragrances, Inc., 2.3%, 11/01/2030 (n) | | | 4,867,000 | 3,947,567 |
| International Flavors & Fragrances, Inc., 5%, 9/26/2048 | | | 5,803,000 | 4,786,179 |
| International Flavors & Fragrances, Inc., 3.468%, 12/01/2050 (n) | | | 6,902,000 | 4,364,478 |
| | | | | $24,288,998 |
| Specialty Stores – 0.4% |
| DICK'S Sporting Goods, 4.1%, 1/15/2052 | | $ | 27,612,000 | $18,735,945 |
| Telecommunications - Wireless – 3.4% |
| American Tower Corp., 5.2%, 2/15/2029 | | $ | 11,727,000 | $11,511,984 |
| American Tower Corp., 5.45%, 2/15/2034 | | | 12,330,000 | 11,979,116 |
| Cellnex Finance Co. S.A., 3.875%, 7/07/2041 (n) | | | 32,683,000 | 24,779,630 |
| Crown Castle, Inc., REIT, 4.45%, 2/15/2026 | | | 10,709,000 | 10,472,138 |
| Crown Castle, Inc., REIT, 3.65%, 9/01/2027 | | | 8,862,000 | 8,305,347 |
| Millicom International Cellular S.A., 4.5%, 4/27/2031 (n) | | | 13,604,000 | 11,352,580 |
| Rogers Communications, Inc., 4.5%, 3/15/2042 | | | 8,577,000 | 7,062,204 |
| Rogers Communications, Inc., 4.55%, 3/15/2052 | | | 7,360,000 | 5,821,239 |
| T-Mobile USA, Inc., 2.05%, 2/15/2028 | | | 9,921,000 | 8,770,639 |
| T-Mobile USA, Inc., 5.05%, 7/15/2033 | | | 8,601,000 | 8,239,451 |
| T-Mobile USA, Inc., 3%, 2/15/2041 | | | 30,674,000 | 21,446,186 |
| Vodafone Group PLC, 5.625%, 2/10/2053 | | | 19,986,000 | 18,708,153 |
| | | | | $148,448,667 |
| Tobacco – 0.9% |
| B.A.T. Capital Corp., 6.343%, 8/02/2030 | | $ | 15,471,000 | $15,862,075 |
| B.A.T. Capital Corp., 5.834%, 2/20/2031 | | | 8,594,000 | 8,590,658 |
| Philip Morris International, Inc., 5.625%, 11/17/2029 | | | 5,491,000 | 5,537,389 |
| Philip Morris International, Inc., 5.125%, 2/15/2030 | | | 7,490,000 | 7,362,766 |
| | | | | $37,352,888 |
| Transportation - Services – 1.0% |
| Element Fleet Management Corp., 6.271%, 6/26/2026 (n) | | $ | 12,315,000 | $12,379,542 |
| Element Fleet Management Corp., 6.319%, 12/04/2028 (n) | | | 19,070,000 | 19,353,382 |
| GXO Logistics, Inc., 6.25%, 5/06/2029 (w) | | | 12,658,000 | 12,672,404 |
| | | | | $44,405,328 |
| U.S. Treasury Obligations – 4.4% |
| U.S. Treasury Bonds, 2.375%, 2/15/2042 | | $ | 92,207,000 | $64,649,353 |
| U.S. Treasury Bonds, 3.875%, 5/15/2043 | | | 66,652,000 | 58,125,230 |
| U.S. Treasury Bonds, 4.375%, 8/15/2043 | | | 13,516,000 | 12,622,677 |
| U.S. Treasury Bonds, 4.75%, 11/15/2043 | | | 8,368,000 | 8,208,485 |
| U.S. Treasury Bonds, 4.5%, 2/15/2044 | | | 9,070,000 | 8,610,831 |
Portfolio of Investments – continued
| Issuer | | | Shares/Par | Value ($) |
| Bonds – continued |
| U.S. Treasury Obligations – continued |
| U.S. Treasury Bonds, 2.875%, 5/15/2052 | | $ | 29,221,600 | $20,563,560 |
| U.S. Treasury Notes, 5%, 10/31/2025 | | | 8,687,000 | 8,666,640 |
| U.S. Treasury Notes, 4.875%, 11/30/2025 | | | 8,736,000 | 8,699,145 |
| | | | | $190,145,921 |
| Utilities - Electric Power – 8.3% |
| Adani Transmission Ltd., 4.25%, 5/21/2036 | | $ | 5,386,670 | $4,365,796 |
| Adani Transmission Step-One Ltd., 4%, 8/03/2026 | | | 14,632,000 | 13,621,061 |
| AEP Transmission Co. LLC, 5.4%, 3/15/2053 | | | 5,252,000 | 4,904,433 |
| Algonquin Power & Utilities Corp., 5.365%, 6/15/2026 | | | 5,767,000 | 5,706,766 |
| American Transmission Systems, Inc., 2.65%, 1/15/2032 (n) | | | 4,691,000 | 3,792,796 |
| Berkshire Hathaway Energy Co., 5.15%, 11/15/2043 | | | 3,795,000 | 3,515,418 |
| Berkshire Hathaway Energy Co., 4.6%, 5/01/2053 | | | 3,159,000 | 2,554,482 |
| Duke Energy Carolinas LLC, 2.45%, 2/01/2030 | | | 21,816,000 | 18,674,790 |
| Duke Energy Florida LLC, 6.2%, 11/15/2053 | | | 8,443,000 | 8,793,291 |
| Enel Finance International N.V., 4.625%, 6/15/2027 (n) | | | 16,585,000 | 16,104,596 |
| Enel Finance International N.V., 2.25%, 7/12/2031 (n) | | | 7,340,000 | 5,898,170 |
| Enel Finance International N.V., 5.5%, 6/15/2052 (n) | | | 4,500,000 | 4,005,221 |
| Enel Finance International N.V., 7.75%, 10/14/2052 (n) | | | 9,393,000 | 10,951,404 |
| ENGIE Energia Chile S.A., 6.375%, 4/17/2034 (n) | | | 15,527,000 | 15,349,992 |
| Eversource Energy, 5.5%, 1/01/2034 | | | 11,861,000 | 11,416,980 |
| FirstEnergy Corp., 4.15%, 7/15/2027 | | | 16,631,000 | 15,669,229 |
| FirstEnergy Corp., 3.4%, 3/01/2050 | | | 16,280,000 | 10,446,848 |
| Florida Power & Light Co., 2.45%, 2/03/2032 | | | 6,909,000 | 5,646,028 |
| Florida Power & Light Co., 3.95%, 3/01/2048 | | | 8,281,000 | 6,404,503 |
| Georgia Power Co., 4.7%, 5/15/2032 | | | 9,903,000 | 9,374,608 |
| Georgia Power Co., 4.95%, 5/17/2033 | | | 12,724,000 | 12,113,313 |
| Georgia Power Co., 5.125%, 5/15/2052 | | | 13,035,000 | 11,824,769 |
| Jersey Central Power & Light Co., 2.75%, 3/01/2032 (n) | | | 22,679,000 | 18,419,902 |
| MidAmerican Energy Co., 5.85%, 9/15/2054 | | | 15,452,000 | 15,542,596 |
| NextEra Energy Capital Holdings, Inc., 5.749%, 9/01/2025 | | | 8,412,000 | 8,417,383 |
| NextEra Energy Capital Holdings, Inc., 2.44%, 1/15/2032 | | | 2,720,000 | 2,184,035 |
| NextEra Energy Capital Holdings, Inc., 3.8% to 3/15/2027, FLR (CMT - 5yr. + 2.547%) to 3/15/2082 | | | 9,140,000 | 8,268,344 |
| Pacific Gas & Electric Co., 5.45%, 6/15/2027 | | | 10,156,000 | 10,091,317 |
| Pacific Gas & Electric Co., 2.5%, 2/01/2031 | | | 27,538,000 | 22,327,358 |
| Pacific Gas & Electric Co., 6.4%, 6/15/2033 | | | 4,889,000 | 4,974,670 |
| PPL Electric Utilities Corp., 4.85%, 2/15/2034 | | | 11,696,000 | 11,139,563 |
| Southern California Edison Co., 4.5%, 9/01/2040 | | | 7,827,000 | 6,582,053 |
| Southern California Edison Co., 3.65%, 2/01/2050 | | | 4,289,000 | 2,987,723 |
| WEC Energy Group, Inc., 4.75%, 1/09/2026 | | | 23,734,000 | 23,403,128 |
Portfolio of Investments – continued
| Issuer | | | Shares/Par | Value ($) |
| Bonds – continued |
| Utilities - Electric Power – continued |
| Xcel Energy, Inc., 5.5%, 3/15/2034 | | $ | 25,243,000 | $24,343,097 |
| | | | | $359,815,663 |
| Total Bonds (Identified Cost, $4,525,958,060) | | $4,221,273,809 |
| Investment Companies (h) – 2.9% |
| Money Market Funds – 2.9% | |
| MFS Institutional Money Market Portfolio, 5.38% (v) (Identified Cost, $125,256,601) | | | 125,256,423 | $125,256,423 |
|
|
| Other Assets, Less Liabilities – 0.1% | | 6,138,892 |
| Net Assets – 100.0% | $4,352,669,124 |
| (f) | All or a portion of the security has been segregated as collateral for open futures contracts. | | | |
| (h) | An affiliated issuer, which may be considered one in which the fund owns 5% or more of the outstanding voting securities, or a company which is under common control. At period end, the aggregate values of the fund's investments in affiliated issuers and in unaffiliated issuers were $125,256,423 and $4,221,273,809, respectively. | | | |
| (i) | Interest only security for which the fund receives interest on notional principal (Par amount). Par amount shown is the notional principal and does not reflect the cost of the security. | | | |
| (n) | Securities exempt from registration under Rule 144A of the Securities Act of 1933. These securities may be sold in the ordinary course of business in transactions exempt from registration, normally to qualified institutional buyers. At period end, the aggregate value of these securities was $1,451,734,009, representing 33.4% of net assets. | | | |
| (p) | Payment-in-kind (PIK) security for which interest income may be received in additional securities and/or cash. | | | |
| (v) | Affiliated issuer that is available only to investment companies managed by MFS. The rate quoted for the MFS Institutional Money Market Portfolio is the annualized seven-day yield of the fund at period end. | | | |
| (w) | When-issued security. | | | |
| The following abbreviations are used in this report and are defined: |
| CLO | Collateralized Loan Obligation |
| CMT | Constant Maturity Treasury |
| FLR | Floating Rate. Interest rate resets periodically based on the parenthetically disclosed reference rate plus a spread (if any). The period-end rate reported may not be the current rate. All reference rates are USD unless otherwise noted. |
| LIBOR | London Interbank Offered Rate |
| REIT | Real Estate Investment Trust |
| SOFR | Secured Overnight Financing Rate |
Portfolio of Investments – continued
Derivative Contracts at 4/30/24
| Futures Contracts |
| Description | Long/
Short | Currency | Contracts | Notional
Amount | Expiration
Date | Value/Unrealized
Appreciation
(Depreciation) |
| Asset Derivatives |
| Interest Rate Futures | | |
| U.S. Treasury Note 5 yr | Short | USD | 1,053 | $110,293,524 | June – 2024 | $2,193,146 |
| U.S. Treasury Ultra Note 10 yr | Short | USD | 2,256 | 248,653,500 | June – 2024 | 7,589,682 |
| | | | | | | $9,782,828 |
| Liability Derivatives |
| Interest Rate Futures | | |
| U.S. Treasury Bond 30 yr | Long | USD | 1,025 | $116,657,813 | June – 2024 | $(5,067,366) |
| U.S. Treasury Note 2 yr | Long | USD | 2,153 | 436,318,906 | June – 2024 | (3,737,067) |
| U.S. Treasury Ultra Bond 30 yr | Long | USD | 470 | 56,194,375 | June – 2024 | (2,802,992) |
| | | | | | | $(11,607,425) |
At April 30, 2024, the fund had liquid securities with an aggregate value of $5,522,550 to cover any collateral or margin obligations for certain derivative contracts.
See Notes to Financial Statements
Financial Statements
Statement of Assets and Liabilities
At 4/30/24
This statement represents your fund’s balance sheet, which details the assets and liabilities comprising the total value of the fund.
| Assets | |
| Investments in unaffiliated issuers, at value (identified cost, $4,525,958,060) | $4,221,273,809 |
| Investments in affiliated issuers, at value (identified cost, $125,256,601) | 125,256,423 |
| Cash | 710,585 |
| Receivables for | |
| Investments sold | 18,469,054 |
| Fund shares sold | 7,217,029 |
| Interest | 49,372,238 |
| Other assets | 8,804 |
| Total assets | $4,422,307,942 |
| Liabilities | |
| Payables for | |
| Distributions | $616,757 |
| Net daily variation margin on open futures contracts | 57,022 |
| Investments purchased | 17,183,346 |
| When-issued investments purchased | 42,870,098 |
| Fund shares reacquired | 7,650,421 |
| Payable to affiliates | |
| Investment adviser | 87,767 |
| Administrative services fee | 3,368 |
| Shareholder servicing costs | 881,560 |
| Distribution and service fees | 25,545 |
| Payable for independent Trustees' compensation | 555 |
| Accrued expenses and other liabilities | 262,379 |
| Total liabilities | $69,638,818 |
| Net assets | $4,352,669,124 |
| Net assets consist of | |
| Paid-in capital | $5,296,131,576 |
| Total distributable earnings (loss) | (943,462,452) |
| Net assets | $4,352,669,124 |
| Shares of beneficial interest outstanding | 363,971,622 |
Statement of Assets and Liabilities – continued
| | Net assets | Shares
outstanding | Net asset value
per share (a) |
| Class A | $1,663,875,550 | 139,027,360 | $11.97 |
| Class B | 1,733,520 | 145,115 | 11.95 |
| Class C | 34,107,613 | 2,859,009 | 11.93 |
| Class I | 942,477,394 | 78,849,954 | 11.95 |
| Class R1 | 4,070,726 | 340,903 | 11.94 |
| Class R2 | 13,962,712 | 1,166,266 | 11.97 |
| Class R3 | 19,949,104 | 1,665,977 | 11.97 |
| Class R4 | 54,316,264 | 4,536,791 | 11.97 |
| Class R6 | 1,618,176,241 | 135,380,247 | 11.95 |
| (a) | Maximum offering price per share was equal to the net asset value per share for all share classes, except for Class A, for which the maximum offering price per share was $12.50 [100 / 95.75 x $11.97]. On sales of $100,000 or more, the maximum offering price of Class A shares is reduced. A contingent deferred sales charge may be imposed on redemptions of Class A, Class B, and Class C shares. Redemption price per share was equal to the net asset value per share for Classes I, R1, R2, R3, R4, and R6. |
See Notes to Financial Statements
Financial Statements
Statement of Operations
Year ended 4/30/24
This statement describes how much your fund earned in investment income and accrued in expenses. It also describes any gains and/or losses generated by fund operations.
| Net investment income (loss) | |
| Income | |
| Interest | $205,527,883 |
| Dividends from affiliated issuers | 5,472,516 |
| Other | 771,540 |
| Total investment income | $211,771,939 |
| Expenses | |
| Management fee | $16,365,396 |
| Distribution and service fees | 4,781,789 |
| Shareholder servicing costs | 3,068,137 |
| Administrative services fee | 611,413 |
| Independent Trustees' compensation | 73,579 |
| Custodian fee | 182,621 |
| Shareholder communications | 355,275 |
| Audit and tax fees | 79,880 |
| Legal fees | 23,762 |
| Miscellaneous | 350,077 |
| Total expenses | $25,891,929 |
| Fees paid indirectly | (8,784) |
| Reduction of expenses by investment adviser and distributor | (549,411) |
| Net expenses | $25,333,734 |
| Net investment income (loss) | $186,438,205 |
| Realized and unrealized gain (loss) |
| Realized gain (loss) (identified cost basis) | |
| Unaffiliated issuers | $(264,904,878) |
| Affiliated issuers | 13,056 |
| Futures contracts | (3,701,486) |
| Foreign currency | 1 |
| Net realized gain (loss) | $(268,593,307) |
| Change in unrealized appreciation or depreciation | |
| Unaffiliated issuers | $143,942,602 |
| Affiliated issuers | (38,167) |
| Futures contracts | 867,043 |
| Net unrealized gain (loss) | $144,771,478 |
| Net realized and unrealized gain (loss) | $(123,821,829) |
| Change in net assets from operations | $62,616,376 |
See Notes to Financial Statements
Financial Statements
Statements of Changes in Net Assets
These statements describe the increases and/or decreases in net assets resulting from operations, any distributions, and any shareholder transactions.
| | Year ended |
| | 4/30/24 | 4/30/23 |
| Change in net assets | | |
| From operations | | |
| Net investment income (loss) | $186,438,205 | $150,733,982 |
| Net realized gain (loss) | (268,593,307) | (327,077,618) |
| Net unrealized gain (loss) | 144,771,478 | 173,652,773 |
| Change in net assets from operations | $62,616,376 | $(2,690,863) |
| Total distributions to shareholders | $(187,927,023) | $(155,256,971) |
| Change in net assets from fund share transactions | $193,995,534 | $(456,065,226) |
| Total change in net assets | $68,684,887 | $(614,013,060) |
| Net assets | | |
| At beginning of period | 4,283,984,237 | 4,897,997,297 |
| At end of period | $4,352,669,124 | $4,283,984,237 |
See Notes to Financial Statements
Financial Statements
Financial Highlights
The financial highlights table is intended to help you understand the fund's financial performance for the past 5 years. Certain information reflects financial results for a single fund share. The total returns in the table represent the rate that an investor would have earned (or lost) on an investment in the fund share class (assuming reinvestment of all distributions) held for the entire period.
| Class A | Year ended |
| | 4/30/24 | 4/30/23 | 4/30/22 | 4/30/21 | 4/30/20 |
| Net asset value, beginning of period | $12.30 | $12.71 | $15.09 | $14.88 | $13.93 |
| Income (loss) from investment operations |
| Net investment income (loss) (d) | $0.50 | $0.41 | $0.35 | $0.37 | $0.42 |
| Net realized and unrealized gain (loss) | (0.32) | (0.40) | (1.92) | 0.37 | 0.96 |
| Total from investment operations | $0.18 | $0.01 | $(1.57) | $0.74 | $1.38 |
| Less distributions declared to shareholders |
| From net investment income | $(0.51) | $(0.41) | $(0.36) | $(0.39) | $(0.43) |
| From net realized gain | — | (0.01) | (0.45) | (0.14) | — |
| Total distributions declared to shareholders | $(0.51) | $(0.42) | $(0.81) | $(0.53) | $(0.43) |
| Net asset value, end of period (x) | $11.97 | $12.30 | $12.71 | $15.09 | $14.88 |
| Total return (%) (r)(s)(t)(x) | 1.50 | 0.20 | (11.00) | 4.94 | 10.00 |
Ratios (%) (to average net assets)
and Supplemental data: |
| Expenses before expense reductions (f) | 0.78 | 0.78 | 0.76 | 0.77 | 0.79 |
| Expenses after expense reductions (f) | 0.77 | 0.77 | 0.75 | 0.75 | 0.77 |
| Net investment income (loss) | 4.19 | 3.36 | 2.38 | 2.42 | 2.91 |
| Portfolio turnover | 59 | 46 | 54 | 37 | 36 |
| Net assets at end of period (000 omitted) | $1,663,876 | $1,726,630 | $1,932,006 | $2,328,936 | $1,996,170 |
See Notes to Financial Statements
Financial Highlights – continued
| Class B | Year ended |
| | 4/30/24 | 4/30/23 | 4/30/22 | 4/30/21 | 4/30/20 |
| Net asset value, beginning of period | $12.28 | $12.68 | $15.06 | $14.85 | $13.90 |
| Income (loss) from investment operations |
| Net investment income (loss) (d) | $0.41 | $0.32 | $0.24 | $0.26 | $0.32 |
| Net realized and unrealized gain (loss) | (0.32) | (0.39) | (1.92) | 0.36 | 0.95 |
| Total from investment operations | $0.09 | $(0.07) | $(1.68) | $0.62 | $1.27 |
| Less distributions declared to shareholders |
| From net investment income | $(0.42) | $(0.32) | $(0.25) | $(0.27) | $(0.32) |
| From net realized gain | — | (0.01) | (0.45) | (0.14) | — |
| Total distributions declared to shareholders | $(0.42) | $(0.33) | $(0.70) | $(0.41) | $(0.32) |
| Net asset value, end of period (x) | $11.95 | $12.28 | $12.68 | $15.06 | $14.85 |
| Total return (%) (r)(s)(t)(x) | 0.74 | (0.48) | (11.70) | 4.17 | 9.20 |
Ratios (%) (to average net assets)
and Supplemental data: |
| Expenses before expense reductions (f) | 1.53 | 1.53 | 1.51 | 1.52 | 1.54 |
| Expenses after expense reductions (f) | 1.52 | 1.52 | 1.50 | 1.50 | 1.53 |
| Net investment income (loss) | 3.40 | 2.60 | 1.62 | 1.70 | 2.18 |
| Portfolio turnover | 59 | 46 | 54 | 37 | 36 |
| Net assets at end of period (000 omitted) | $1,734 | $3,585 | $6,283 | $10,838 | $21,384 |
| Class C | Year ended |
| | 4/30/24 | 4/30/23 | 4/30/22 | 4/30/21 | 4/30/20 |
| Net asset value, beginning of period | $12.26 | $12.67 | $15.04 | $14.84 | $13.89 |
| Income (loss) from investment operations |
| Net investment income (loss) (d) | $0.41 | $0.32 | $0.24 | $0.26 | $0.31 |
| Net realized and unrealized gain (loss) | (0.32) | (0.40) | (1.91) | 0.35 | 0.96 |
| Total from investment operations | $0.09 | $(0.08) | $(1.67) | $0.61 | $1.27 |
| Less distributions declared to shareholders |
| From net investment income | $(0.42) | $(0.32) | $(0.25) | $(0.27) | $(0.32) |
| From net realized gain | — | (0.01) | (0.45) | (0.14) | — |
| Total distributions declared to shareholders | $(0.42) | $(0.33) | $(0.70) | $(0.41) | $(0.32) |
| Net asset value, end of period (x) | $11.93 | $12.26 | $12.67 | $15.04 | $14.84 |
| Total return (%) (r)(s)(t)(x) | 0.73 | (0.56) | (11.65) | 4.10 | 9.21 |
Ratios (%) (to average net assets)
and Supplemental data: |
| Expenses before expense reductions (f) | 1.53 | 1.53 | 1.51 | 1.51 | 1.54 |
| Expenses after expense reductions (f) | 1.52 | 1.52 | 1.50 | 1.50 | 1.53 |
| Net investment income (loss) | 3.43 | 2.60 | 1.62 | 1.68 | 2.16 |
| Portfolio turnover | 59 | 46 | 54 | 37 | 36 |
| Net assets at end of period (000 omitted) | $34,108 | $42,440 | $61,283 | $98,956 | $143,988 |
See Notes to Financial Statements
Financial Highlights – continued
| Class I | Year ended |
| | 4/30/24 | 4/30/23 | 4/30/22 | 4/30/21 | 4/30/20 |
| Net asset value, beginning of period | $12.29 | $12.69 | $15.07 | $14.87 | $13.92 |
| Income (loss) from investment operations |
| Net investment income (loss) (d) | $0.53 | $0.44 | $0.39 | $0.41 | $0.46 |
| Net realized and unrealized gain (loss) | (0.33) | (0.39) | (1.92) | 0.36 | 0.96 |
| Total from investment operations | $0.20 | $0.05 | $(1.53) | $0.77 | $1.42 |
| Less distributions declared to shareholders |
| From net investment income | $(0.54) | $(0.44) | $(0.40) | $(0.43) | $(0.47) |
| From net realized gain | — | (0.01) | (0.45) | (0.14) | — |
| Total distributions declared to shareholders | $(0.54) | $(0.45) | $(0.85) | $(0.57) | $(0.47) |
| Net asset value, end of period (x) | $11.95 | $12.29 | $12.69 | $15.07 | $14.87 |
| Total return (%) (r)(s)(t)(x) | 1.67 | 0.53 | (10.79) | 5.14 | 10.28 |
Ratios (%) (to average net assets)
and Supplemental data: |
| Expenses before expense reductions (f) | 0.53 | 0.53 | 0.51 | 0.52 | 0.53 |
| Expenses after expense reductions (f) | 0.52 | 0.52 | 0.50 | 0.50 | 0.52 |
| Net investment income (loss) | 4.43 | 3.60 | 2.62 | 2.66 | 3.15 |
| Portfolio turnover | 59 | 46 | 54 | 37 | 36 |
| Net assets at end of period (000 omitted) | $942,477 | $934,582 | $1,062,759 | $1,573,250 | $1,306,407 |
See Notes to Financial Statements
Financial Highlights – continued
| Class R1 | Year ended |
| | 4/30/24 | 4/30/23 | 4/30/22 | 4/30/21 | 4/30/20 |
| Net asset value, beginning of period | $12.28 | $12.68 | $15.05 | $14.85 | $13.90 |
| Income (loss) from investment operations |
| Net investment income (loss) (d) | $0.41 | $0.32 | $0.24 | $0.26 | $0.31 |
| Net realized and unrealized gain (loss) | (0.33) | (0.39) | (1.91) | 0.35 | 0.96 |
| Total from investment operations | $0.08 | $(0.07) | $(1.67) | $0.61 | $1.27 |
| Less distributions declared to shareholders |
| From net investment income | $(0.42) | $(0.32) | $(0.25) | $(0.27) | $(0.32) |
| From net realized gain | — | (0.01) | (0.45) | (0.14) | — |
| Total distributions declared to shareholders | $(0.42) | $(0.33) | $(0.70) | $(0.41) | $(0.32) |
| Net asset value, end of period (x) | $11.94 | $12.28 | $12.68 | $15.05 | $14.85 |
| Total return (%) (r)(s)(t)(x) | 0.65 | (0.48) | (11.64) | 4.10 | 9.20 |
Ratios (%) (to average net assets)
and Supplemental data: |
| Expenses before expense reductions (f) | 1.53 | 1.53 | 1.51 | 1.51 | 1.54 |
| Expenses after expense reductions (f) | 1.52 | 1.52 | 1.50 | 1.50 | 1.53 |
| Net investment income (loss) | 3.45 | 2.61 | 1.62 | 1.68 | 2.16 |
| Portfolio turnover | 59 | 46 | 54 | 37 | 36 |
| Net assets at end of period (000 omitted) | $4,071 | $3,629 | $3,922 | $5,391 | $5,970 |
| Class R2 | Year ended |
| | 4/30/24 | 4/30/23 | 4/30/22 | 4/30/21 | 4/30/20 |
| Net asset value, beginning of period | $12.31 | $12.71 | $15.09 | $14.88 | $13.93 |
| Income (loss) from investment operations |
| Net investment income (loss) (d) | $0.47 | $0.38 | $0.31 | $0.34 | $0.39 |
| Net realized and unrealized gain (loss) | (0.33) | (0.39) | (1.91) | 0.36 | 0.95 |
| Total from investment operations | $0.14 | $(0.01) | $(1.60) | $0.70 | $1.34 |
| Less distributions declared to shareholders |
| From net investment income | $(0.48) | $(0.38) | $(0.33) | $(0.35) | $(0.39) |
| From net realized gain | — | (0.01) | (0.45) | (0.14) | — |
| Total distributions declared to shareholders | $(0.48) | $(0.39) | $(0.78) | $(0.49) | $(0.39) |
| Net asset value, end of period (x) | $11.97 | $12.31 | $12.71 | $15.09 | $14.88 |
| Total return (%) (r)(s)(t)(x) | 1.16 | 0.03 | (11.23) | 4.68 | 9.73 |
Ratios (%) (to average net assets)
and Supplemental data: |
| Expenses before expense reductions (f) | 1.03 | 1.03 | 1.01 | 1.02 | 1.04 |
| Expenses after expense reductions (f) | 1.02 | 1.02 | 1.00 | 1.00 | 1.03 |
| Net investment income (loss) | 3.93 | 3.11 | 2.12 | 2.18 | 2.67 |
| Portfolio turnover | 59 | 46 | 54 | 37 | 36 |
| Net assets at end of period (000 omitted) | $13,963 | $17,271 | $19,328 | $28,348 | $31,346 |
See Notes to Financial Statements
Financial Highlights – continued
| Class R3 | Year ended |
| | 4/30/24 | 4/30/23 | 4/30/22 | 4/30/21 | 4/30/20 |
| Net asset value, beginning of period | $12.31 | $12.71 | $15.09 | $14.88 | $13.93 |
| Income (loss) from investment operations |
| Net investment income (loss) (d) | $0.50 | $0.39 | $0.35 | $0.37 | $0.42 |
| Net realized and unrealized gain (loss) | (0.33) | (0.37) | (1.92) | 0.37 | 0.96 |
| Total from investment operations | $0.17 | $0.02 | $(1.57) | $0.74 | $1.38 |
| Less distributions declared to shareholders |
| From net investment income | $(0.51) | $(0.41) | $(0.36) | $(0.39) | $(0.43) |
| From net realized gain | — | (0.01) | (0.45) | (0.14) | — |
| Total distributions declared to shareholders | $(0.51) | $(0.42) | $(0.81) | $(0.53) | $(0.43) |
| Net asset value, end of period (x) | $11.97 | $12.31 | $12.71 | $15.09 | $14.88 |
| Total return (%) (r)(s)(t)(x) | 1.42 | 0.28 | (11.00) | 4.94 | 10.00 |
Ratios (%) (to average net assets)
and Supplemental data: |
| Expenses before expense reductions (f) | 0.78 | 0.78 | 0.76 | 0.77 | 0.79 |
| Expenses after expense reductions (f) | 0.77 | 0.76 | 0.75 | 0.75 | 0.78 |
| Net investment income (loss) | 4.18 | 3.17 | 2.38 | 2.43 | 2.91 |
| Portfolio turnover | 59 | 46 | 54 | 37 | 36 |
| Net assets at end of period (000 omitted) | $19,949 | $24,627 | $136,630 | $162,465 | $165,319 |
| Class R4 | Year ended |
| | 4/30/24 | 4/30/23 | 4/30/22 | 4/30/21 | 4/30/20 |
| Net asset value, beginning of period | $12.31 | $12.71 | $15.09 | $14.89 | $13.93 |
| Income (loss) from investment operations |
| Net investment income (loss) (d) | $0.53 | $0.44 | $0.39 | $0.41 | $0.46 |
| Net realized and unrealized gain (loss) | (0.33) | (0.39) | (1.92) | 0.36 | 0.97 |
| Total from investment operations | $0.20 | $0.05 | $(1.53) | $0.77 | $1.43 |
| Less distributions declared to shareholders |
| From net investment income | $(0.54) | $(0.44) | $(0.40) | $(0.43) | $(0.47) |
| From net realized gain | — | (0.01) | (0.45) | (0.14) | — |
| Total distributions declared to shareholders | $(0.54) | $(0.45) | $(0.85) | $(0.57) | $(0.47) |
| Net asset value, end of period (x) | $11.97 | $12.31 | $12.71 | $15.09 | $14.89 |
| Total return (%) (r)(s)(t)(x) | 1.67 | 0.53 | (10.78) | 5.13 | 10.35 |
Ratios (%) (to average net assets)
and Supplemental data: |
| Expenses before expense reductions (f) | 0.53 | 0.53 | 0.51 | 0.52 | 0.53 |
| Expenses after expense reductions (f) | 0.52 | 0.52 | 0.50 | 0.50 | 0.52 |
| Net investment income (loss) | 4.44 | 3.61 | 2.63 | 2.67 | 3.17 |
| Portfolio turnover | 59 | 46 | 54 | 37 | 36 |
| Net assets at end of period (000 omitted) | $54,316 | $53,301 | $61,624 | $73,890 | $63,775 |
See Notes to Financial Statements
Financial Highlights – continued
| Class R6 | Year ended |
| | 4/30/24 | 4/30/23 | 4/30/22 | 4/30/21 | 4/30/20 |
| Net asset value, beginning of period | $12.29 | $12.69 | $15.07 | $14.87 | $13.92 |
| Income (loss) from investment operations |
| Net investment income (loss) (d) | $0.54 | $0.45 | $0.40 | $0.42 | $0.47 |
| Net realized and unrealized gain (loss) | (0.33) | (0.39) | (1.92) | 0.36 | 0.96 |
| Total from investment operations | $0.21 | $0.06 | $(1.52) | $0.78 | $1.43 |
| Less distributions declared to shareholders |
| From net investment income | $(0.55) | $(0.45) | $(0.41) | $(0.44) | $(0.48) |
| From net realized gain | — | (0.01) | (0.45) | (0.14) | — |
| Total distributions declared to shareholders | $(0.55) | $(0.46) | $(0.86) | $(0.58) | $(0.48) |
| Net asset value, end of period (x) | $11.95 | $12.29 | $12.69 | $15.07 | $14.87 |
| Total return (%) (r)(s)(t)(x) | 1.76 | 0.63 | (10.70) | 5.23 | 10.38 |
Ratios (%) (to average net assets)
and Supplemental data: |
| Expenses before expense reductions (f) | 0.43 | 0.43 | 0.41 | 0.42 | 0.44 |
| Expenses after expense reductions (f) | 0.42 | 0.42 | 0.40 | 0.41 | 0.43 |
| Net investment income (loss) | 4.54 | 3.71 | 2.73 | 2.76 | 3.25 |
| Portfolio turnover | 59 | 46 | 54 | 37 | 36 |
| Net assets at end of period (000 omitted) | $1,618,176 | $1,477,919 | $1,614,162 | $1,849,423 | $1,268,071 |
| (d) | Per share data is based on average shares outstanding. |
| (f) | Ratios do not reflect reductions from fees paid indirectly, if applicable. See Note 2 in the Notes to Financial Statements for additional information. |
| (r) | Certain expenses have been reduced without which performance would have been lower. |
| (s) | From time to time the fund may receive proceeds from litigation settlements, without which performance would be lower. |
| (t) | Total returns do not include any applicable sales charges. |
| (x) | The net asset values and total returns have been calculated on net assets which include adjustments made in accordance with U.S. generally accepted accounting principles required at period end for financial reporting purposes. |
See Notes to Financial Statements
Notes to Financial Statements
(1) Business and Organization
MFS Corporate Bond Fund (the fund) is a diversified series of MFS Series Trust IX (the trust). The trust is organized as a Massachusetts business trust and is registered under the Investment Company Act of 1940, as amended, as an open-end management investment company.
The fund is an investment company and accordingly follows the investment company accounting and reporting guidance of the Financial Accounting Standards Board (FASB) Accounting Standards Codification Topic 946 Financial Services - Investment Companies.
(2) Significant Accounting Policies
General — The preparation of financial statements in conformity with U.S. generally accepted accounting principles requires management to make estimates and assumptions that affect the reported amounts of assets and liabilities, and disclosure of contingent assets and liabilities at the date of the financial statements and the reported amounts of increases and decreases in net assets from operations during the reporting period. Actual results could differ from those estimates. In the preparation of these financial statements, management has evaluated subsequent events occurring after the date of the fund’s Statement of Assets and Liabilities through the date that the financial statements were issued. The fund invests in foreign securities. Investments in foreign securities are vulnerable to the effects of changes in the relative values of the local currency and the U.S. dollar and to the effects of changes in each country’s market, economic, industrial, political, regulatory, geopolitical, environmental, public health, and other conditions.
Balance Sheet Offsetting — The fund's accounting policy with respect to balance sheet offsetting is that, absent an event of default by the counterparty or a termination of the agreement, the International Swaps and Derivatives Association (ISDA) Master Agreement, or similar agreement, does not result in an offset of reported amounts of financial assets and financial liabilities in the Statement of Assets and Liabilities across transactions between the fund and the applicable counterparty. The fund's right to setoff may be restricted or prohibited by the bankruptcy or insolvency laws of the particular jurisdiction to which a specific master netting agreement counterparty is subject. Balance sheet offsetting disclosures, to the extent applicable to the fund, have been included in the fund’s Significant Accounting Policies note under the captions for each of the fund’s in-scope financial instruments and transactions.
Investment Valuations — Subject to its oversight, the fund's Board of Trustees has delegated primary responsibility for determining or causing to be determined the value of the fund’s investments to MFS as the fund's adviser, pursuant to the fund’s valuation policy and procedures which have been adopted by the adviser and approved by the Board. In accordance with Rule 2a-5 under the Investment Company Act of 1940, the Board of Trustees designated the adviser as the “valuation designee” of the fund. If the adviser, as valuation designee, determines that reliable market quotations are not readily available for an investment, the investment is valued at fair value as determined in good faith by the adviser in accordance with the adviser’s fair valuation policy and procedures.
Notes to Financial Statements - continued
Under the fund's valuation policy and procedures, debt instruments and floating rate loans, including restricted debt instruments, are generally valued at an evaluated or composite bid as provided by a third-party pricing service. Short-term instruments with a maturity at issuance of 60 days or less may be valued at amortized cost, which approximates market value. Futures contracts are generally valued at last posted settlement price on their primary exchange as provided by a third-party pricing service. Futures contracts for which there were no trades that day for a particular position are generally valued at the closing bid quotation on their primary exchange as provided by a third-party pricing service. Open-end investment companies are generally valued at net asset value per share. The values of foreign securities and other assets and liabilities expressed in foreign currencies are converted to U.S. dollars using the mean of bid and asked prices for rates provided by a third-party pricing service.
Under the fund’s valuation policy and procedures, market quotations are not considered to be readily available for debt instruments, floating rate loans, and many types of derivatives. These investments are generally valued at fair value based on information from third-party pricing services or otherwise determined by the adviser in accordance with the adviser’s fair valuation policy and procedures. Securities and other assets generally valued on the basis of information from a third-party pricing service may also be valued at a broker/dealer bid quotation. In determining values, third-party pricing services can utilize both transaction data and market information such as yield, quality, coupon rate, maturity, type of issue, trading characteristics, spreads and other market data. An investment may also be valued at fair value if the adviser determines that the investment’s value has been materially affected by events occurring after the close of the exchange or market on which the investment is principally traded (such as foreign exchange or market) and prior to the determination of the fund’s net asset value, or after the halt of trading of a specific security where trading does not resume prior to the close of the exchange or market on which the security is principally traded. The adviser generally relies on third-party pricing services or other information (such as the correlation with price movements of similar securities in the same or other markets; the type, cost and investment characteristics of the security; the business and financial condition of the issuer; and trading and other market data) to assist in determining whether to fair value and at what value to fair value an investment. The value of an investment for purposes of calculating the fund’s net asset value can differ depending on the source and method used to determine value. When fair valuation is used, the value of an investment used to determine the fund’s net asset value may differ from quoted or published prices for the same investment. There can be no assurance that the fund could obtain the fair value assigned to an investment if it were to sell the investment at the same time at which the fund determines its net asset value per share.
Various inputs are used in determining the value of the fund's assets or liabilities. These inputs are categorized into three broad levels. In certain cases, the inputs used to measure fair value may fall into different levels of the fair value hierarchy. In such cases, an investment's level within the fair value hierarchy is based on the lowest level of input that is significant to the fair value measurement. The fund's assessment of the significance of a particular input to the fair value measurement in its entirety requires judgment, and considers factors specific to the investment. Level 1 includes unadjusted quoted prices in active markets for identical assets or liabilities. Level 2 includes other significant observable market-based inputs (including quoted prices for similar securities, interest rates, prepayment speed, and credit risk). Level 3 includes significant unobservable inputs, which may include the adviser's own assumptions in determining
Notes to Financial Statements - continued
the fair value of investments. Other financial instruments are derivative instruments, such as futures contracts. The following is a summary of the levels used as of April 30, 2024 in valuing the fund's assets and liabilities:
| Financial Instruments | Level 1 | Level 2 | Level 3 | Total |
| U.S. Treasury Bonds & U.S. Government Agencies & Equivalents | $— | $190,145,921 | $— | $190,145,921 |
| Non - U.S. Sovereign Debt | — | 81,535,859 | — | 81,535,859 |
| Municipal Bonds | — | 21,521,047 | — | 21,521,047 |
| U.S. Corporate Bonds | — | 2,541,706,665 | — | 2,541,706,665 |
| Residential Mortgage-Backed Securities | — | 15,965,506 | — | 15,965,506 |
| Commercial Mortgage-Backed Securities | — | 36,899,436 | — | 36,899,436 |
| Asset-Backed Securities (including CDOs) | — | 83,000,188 | — | 83,000,188 |
| Foreign Bonds | — | 1,250,499,187 | — | 1,250,499,187 |
| Mutual Funds | 125,256,423 | — | — | 125,256,423 |
| Total | $125,256,423 | $4,221,273,809 | $— | $4,346,530,232 |
| Other Financial Instruments | | | | |
| Futures Contracts – Assets | $9,782,828 | $— | $— | $9,782,828 |
| Futures Contracts – Liabilities | (11,607,425) | — | — | (11,607,425) |
For further information regarding security characteristics, see the Portfolio of Investments.
Foreign Currency Translation — Purchases and sales of foreign investments, income, and expenses are converted into U.S. dollars based upon currency exchange rates prevailing on the respective dates of such transactions or on the reporting date for foreign denominated receivables and payables. Gains and losses attributable to foreign currency exchange rates on sales of securities are recorded for financial statement purposes as net realized gains and losses on investments. Gains and losses attributable to foreign exchange rate movements on receivables, payables, income and expenses are recorded for financial statement purposes as foreign currency transaction gains and losses. That portion of both realized and unrealized gains and losses on investments that results from fluctuations in foreign currency exchange rates is not separately disclosed.
Derivatives — The fund uses derivatives primarily to increase or decrease exposure to a particular market or segment of the market, or security, to increase or decrease interest rate or currency exposure, or as alternatives to direct investments. Derivatives are used for hedging or non-hedging purposes. While hedging can reduce or eliminate losses, it can also reduce or eliminate gains. When the fund uses derivatives as an investment to increase market exposure, or for hedging purposes, gains and losses from derivative instruments may be substantially greater than the derivative’s original cost.
The derivative instruments used by the fund during the period were futures contracts. Depending on the type of derivative, a fund may exit a derivative position by entering into an offsetting transaction with a counterparty or exchange, negotiating an
Notes to Financial Statements - continued
agreement with the derivative counterparty, or novating the position to a third party. The fund may be unable to promptly close out a futures position in instances where the daily fluctuation in the price for that type of future exceeds the daily limit set by the exchange. The fund's period end derivatives, as presented in the Portfolio of Investments and the associated Derivative Contract tables, generally are indicative of the volume of its derivative activity during the period.
The following table presents, by major type of derivative contract, the fair value, on a gross basis, of the asset and liability components of derivatives held by the fund at April 30, 2024 as reported in the Statement of Assets and Liabilities:
| | | Fair Value (a) |
| Risk | Derivative Contracts | Asset Derivatives | Liability Derivatives |
| Interest Rate | Futures Contracts | $9,782,828 | $(11,607,425) |
| (a) | Values presented in this table for futures contracts correspond to the values reported in the Portfolio of Investments. Only the current day net variation margin for futures contracts is reported separately within the Statement of Assets and Liabilities. |
The following table presents, by major type of derivative contract, the realized gain (loss) on derivatives held by the fund for the year ended April 30, 2024 as reported in the Statement of Operations:
| Risk | Futures
Contracts |
| Interest Rate | $(3,701,486) |
The following table presents, by major type of derivative contract, the change in unrealized appreciation or depreciation on derivatives held by the fund for the year ended April 30, 2024 as reported in the Statement of Operations:
| Risk | Futures
Contracts |
| Interest Rate | $867,043 |
Derivative counterparty credit risk is managed through formal evaluation of the creditworthiness of all potential counterparties. On certain, but not all, uncleared derivatives, the fund attempts to reduce its exposure to counterparty credit risk whenever possible by entering into an ISDA Master Agreement on a bilateral basis. The ISDA Master Agreement gives each party to the agreement the right to terminate all transactions traded under such agreement if there is a specified deterioration in the credit quality of the other party. Upon an event of default or a termination of the ISDA Master Agreement, the non-defaulting party has the right to close out all transactions traded under such agreement and to net amounts owed under each agreement to one net amount payable by one party to the other. This right to close out and net payments across all transactions traded under the ISDA Master Agreement could result in a reduction of the fund's credit risk to such counterparty equal to any amounts payable by the fund under the applicable transactions, if any.
Collateral and margin requirements differ by type of derivative. For cleared derivatives (e.g., futures contracts, cleared swaps, and exchange-traded options), margin requirements are set by the clearing broker and the clearing house and collateral, in the form of cash or securities, is posted by the fund directly with the clearing broker. Collateral terms are counterparty agreement specific for uncleared derivatives (e.g.,
Notes to Financial Statements - continued
forward foreign currency exchange contracts, uncleared swap agreements, and uncleared options) and collateral, in the form of cash and securities, is held in segregated accounts with the fund's custodian in connection with these agreements. For derivatives traded under an ISDA Master Agreement, which contains a credit support annex, the collateral requirements are netted across all transactions traded under such counterparty-specific agreement and an amount is posted from one party to the other to collateralize such obligations. Cash that has been segregated or delivered to cover the fund's collateral or margin obligations under derivative contracts, if any, will be reported separately in the Statement of Assets and Liabilities as restricted cash for uncleared derivatives and/or deposits with brokers for cleared derivatives. Securities pledged as collateral or margin for the same purpose, if any, are noted in the Portfolio of Investments. The fund may be required to make payments of interest on uncovered collateral or margin obligations with the broker. Any such payments are included in “Miscellaneous” expense in the Statement of Operations.
Futures Contracts — The fund entered into futures contracts which may be used to hedge against or obtain broad market exposure, interest rate exposure, currency exposure, or to manage duration. A futures contract represents a commitment for the future purchase or sale of an asset at a specified price on a specified date.
Upon entering into a futures contract, the fund is required to deposit with the broker, either in cash or securities, an initial margin in an amount equal to a specified percentage of the notional amount of the contract. Subsequent payments (variation margin) are made or received by the fund each day, depending on the daily fluctuations in the value of the contract, and are recorded for financial statement purposes as unrealized gain or loss by the fund until the contract is closed or expires at which point the gain or loss on futures contracts is realized.
The fund bears the risk of interest rates, exchange rates or securities prices moving unexpectedly, in which case, the fund may not achieve the anticipated benefits of the futures contracts and may realize a loss. While futures contracts may present less counterparty risk to the fund since the contracts are exchange traded and the exchange’s clearinghouse guarantees payments to the broker, there is still counterparty credit risk due to the insolvency of the broker. The fund’s maximum risk of loss due to counterparty credit risk is equal to the margin posted by the fund to the broker plus any gains or minus any losses on the outstanding futures contracts.
Indemnifications — Under the fund's organizational documents, its officers and Trustees may be indemnified against certain liabilities and expenses arising out of the performance of their duties to the fund. Additionally, in the normal course of business, the fund enters into agreements with service providers that may contain indemnification clauses. The fund's maximum exposure under these agreements is unknown as this would involve future claims that may be made against the fund that have not yet occurred.
Investment Transactions and Income — Interest income is recorded on the accrual basis. All premium and discount is amortized or accreted for financial statement purposes in accordance with U.S. generally accepted accounting principles. Interest payments received in additional securities are recorded on the ex-interest date in an amount equal to the value of the security on such date.
Notes to Financial Statements - continued
The fund may receive proceeds from litigation settlements. Any proceeds received from litigation involving portfolio holdings are reflected in the Statement of Operations in realized gain/loss if the security has been disposed of by the fund or in unrealized gain/loss if the security is still held by the fund. Any other proceeds from litigation not related to portfolio holdings are reflected as other income in the Statement of Operations.
Investment transactions are recorded on the trade date. In determining the net gain or loss on securities sold, the cost of securities is determined on the identified cost basis.
The fund may purchase or sell securities on a when-issued or delayed delivery basis. In these extended settlement transactions, the receipt or delivery of the securities by the fund and related payments occur at a future date, usually beyond the customary settlement period. The price of such security and the date that the security will be settled are generally fixed at the time the transaction is negotiated. The value of the security varies with market fluctuations and for debt securities no interest accrues to the fund until settlement takes place. When the fund sells securities on a when-issued or delayed delivery basis, the fund typically owns or has the right to acquire securities equivalent in kind and amount to the securities sold. Purchase and sale commitments for when-issued or delayed delivery securities are held at carrying amount, which approximates fair value and are categorized as level 2 within the fair value hierarchy, and included in When-issued investments purchased and When-issued investments sold in the Statement of Assets and Liabilities, as applicable. Losses may arise due to changes in the value of the underlying securities prior to settlement date or if the counterparty does not perform under the contract’s terms, or if the issuer does not issue the securities due to political, economic or other factors.
To mitigate the counterparty credit risk on TBA transactions, mortgage dollar rolls, and other types of forward settling mortgage-backed and asset-backed security transactions, the fund whenever possible enters into a Master Securities Forward Transaction Agreement (“MSFTA”) on a bilateral basis with each of the counterparties with whom it undertakes a significant volume of transactions. The MSFTA gives each party to the agreement the right to terminate all transactions traded under such agreement if there is a specified deterioration in the credit quality of the other party. Upon an event of default or a termination of the MSFTA, the non-defaulting party has the right to close out all transactions traded under such agreement and to net amounts owed under each transaction to one net amount payable by one party to the other. This right to close out and net payments across all transactions traded under the MSFTA could result in a reduction of the fund's credit risk to such counterparty equal to any amounts payable by the fund under the applicable transactions, if any.
For mortgage-backed and asset-backed securities traded under a MSFTA, the collateral and margining requirements are contract specific. Collateral amounts across all transactions traded under such agreement are netted and an amount is posted from one party to the other to collateralize such obligations. Cash that has been pledged to cover the fund's collateral or margin obligations under a MSFTA, if any, will be reported separately on the Statement of Assets and Liabilities as restricted cash. Securities pledged as collateral or margin for the same purpose, if any, are noted in the Portfolio of Investments.
Notes to Financial Statements - continued
Fees Paid Indirectly — The fund's custody fee may be reduced by a credit earned under an arrangement that measures the value of U.S. dollars deposited with the custodian by the fund. The amount of the credit, for the year ended April 30, 2024, is shown as a reduction of total expenses in the Statement of Operations.
Tax Matters and Distributions — The fund intends to qualify as a regulated investment company, as defined under Subchapter M of the Internal Revenue Code, and to distribute all of its taxable income, including realized capital gains. As a result, no provision for federal income tax is required. The fund’s federal tax returns, when filed, will remain subject to examination by the Internal Revenue Service for a three year period. Management has analyzed the fund’s tax positions taken on federal and state tax returns for all open tax years and does not believe that there are any uncertain tax positions that require recognition of a tax liability. Foreign taxes, if any, have been accrued by the fund in the accompanying financial statements in accordance with the applicable foreign tax law. Foreign income taxes may be withheld by certain countries in which the fund invests. Additionally, capital gains realized by the fund on securities issued in or by certain foreign countries may be subject to capital gains tax imposed by those countries.
Distributions to shareholders are recorded on the ex-dividend date. Income and capital gain distributions are determined in accordance with income tax regulations, which may differ from U.S. generally accepted accounting principles. Certain capital accounts in the financial statements are periodically adjusted for permanent differences in order to reflect their tax character. These adjustments have no impact on net assets or net asset value per share. Temporary differences which arise from recognizing certain items of income, expense, gain or loss in different periods for financial statement and tax purposes will reverse at some time in the future.
Book/tax differences primarily relate to amortization of premium and accretion of discount of debt securities, wash sale loss deferrals, and derivative transactions.
The tax character of distributions declared to shareholders for the last two fiscal years is as follows:
| | Year ended
4/30/24 | Year ended
4/30/23 |
| Ordinary income (including any short-term capital gains) | $187,927,023 | $151,559,260 |
| Long-term capital gains | — | 3,697,711 |
| Total distributions | $187,927,023 | $155,256,971 |
Notes to Financial Statements - continued
The federal tax cost and the tax basis components of distributable earnings were as follows:
| As of 4/30/24 | |
| Cost of investments | $4,655,952,240 |
| Gross appreciation | 34,658,853 |
| Gross depreciation | (345,905,458) |
| Net unrealized appreciation (depreciation) | $(311,246,605) |
| Undistributed ordinary income | 21,384,366 |
| Capital loss carryforwards | (636,262,064) |
| Other temporary differences | (17,338,149) |
| Total distributable earnings (loss) | $(943,462,452) |
As of April 30, 2024, the fund had capital loss carryforwards available to offset future realized gains. These net capital losses may be carried forward indefinitely and their character is retained as short-term and/or long-term losses. Such losses are characterized as follows:
| Short-Term | $(102,818,704) |
| Long-Term | (533,443,360) |
| Total | $(636,262,064) |
Multiple Classes of Shares of Beneficial Interest — The fund offers multiple classes of shares, which differ in their respective distribution and service fees. The fund's income and common expenses are allocated to shareholders based on the value of settled shares outstanding of each class. The fund's realized and unrealized gain (loss) are allocated to shareholders based on the daily net assets of each class. Dividends are declared separately for each class. Differences in per share dividend rates are generally due to differences in separate class expenses. Class B and Class C shares will convert to Class A shares approximately eight years after purchase. The fund’s distributions declared to shareholders as reported in the Statements of Changes in Net Assets are presented by class as follows:
| | Year
ended
4/30/24 | | Year
ended
4/30/23 |
| Class A | $70,907,408 | | $60,380,248 |
| Class B | 92,301 | | 131,185 |
| Class C | 1,312,809 | | 1,342,438 |
| Class I | 41,264,416 | | 32,831,247 |
| Class R1 | 130,064 | | 99,900 |
| Class R2 | 575,106 | | 579,141 |
| Class R3 | 947,764 | | 1,954,549 |
| Class R4 | 2,350,203 | | 2,113,438 |
| Class R6 | 70,346,952 | | 55,824,825 |
| Total | $187,927,023 | | $155,256,971 |
Notes to Financial Statements - continued
(3) Transactions with Affiliates
Investment Adviser — The fund has an investment advisory agreement with MFS to provide overall investment management and related administrative services and facilities to the fund. The management fee is computed daily and paid monthly at the following annual rates based on the fund's average daily net assets:
| Up to $1.1 billion | 0.39% |
| In excess of $1.1 billion and up to $5 billion | 0.38% |
| In excess of $5 billion and up to $10 billion | 0.35% |
| In excess of $10 billion | 0.34% |
MFS has agreed in writing to reduce its management fee by a specified amount if certain MFS mutual fund assets exceed thresholds agreed to by MFS and the fund's Board of Trustees. MFS has also agreed in writing to waive at least 0.01% of its management fee as part of this agreement. The agreement to waive at least 0.01% of the management fee will continue until modified by the fund's Board of Trustees, but such agreement will continue at least until August 31, 2025. For the year ended April 30, 2024, this management fee reduction amounted to $547,867, which is included in the reduction of total expenses in the Statement of Operations. The management fee incurred for the year ended April 30, 2024 was equivalent to an annual effective rate of 0.37% of the fund's average daily net assets.
Distributor — MFS Fund Distributors, Inc. (MFD), a wholly-owned subsidiary of MFS, as distributor, received $54,461 for the year ended April 30, 2024, as its portion of the initial sales charge on sales of Class A shares of the fund.
The Board of Trustees has adopted a distribution plan for certain share classes pursuant to Rule 12b-1 of the Investment Company Act of 1940.
The fund's distribution plan provides that the fund will pay MFD for services provided by MFD and financial intermediaries in connection with the distribution and servicing of certain share classes. One component of the plan is a distribution fee paid to MFD and another component of the plan is a service fee paid to MFD. MFD may subsequently pay all, or a portion, of the distribution and/or service fees to financial intermediaries. The distribution and service fees are computed daily and paid monthly.
Notes to Financial Statements - continued
Distribution Plan Fee Table:
| | Distribution
Fee Rate (d) | Service
Fee Rate (d) | Total
Distribution
Plan (d) | Annual
Effective
Rate (e) | Distribution
and Service
Fee |
| Class A | — | 0.25% | 0.25% | 0.25% | $ 4,208,287 |
| Class B | 0.75% | 0.25% | 1.00% | 1.00% | 26,950 |
| Class C | 0.75% | 0.25% | 1.00% | 1.00% | 379,975 |
| Class R1 | 0.75% | 0.25% | 1.00% | 1.00% | 37,416 |
| Class R2 | 0.25% | 0.25% | 0.50% | 0.50% | 72,761 |
| Class R3 | — | 0.25% | 0.25% | 0.25% | 56,400 |
| Total Distribution and Service Fees | | | | | $4,781,789 |
| (d) | In accordance with the distribution plan for certain classes, the fund pays distribution and/or service fees equal to these annual percentage rates of each class’s average daily net assets. The distribution and service fee rates disclosed by class represent the current rates in effect at the end of the reporting period. Any rate changes, if applicable, are detailed below. |
| (e) | The annual effective rates represent actual fees incurred under the distribution plan for the year ended April 30, 2024 based on each class's average daily net assets. MFD has voluntarily agreed to rebate a portion of each class's 0.25% service fee attributable to accounts for which there is no financial intermediary specified on the account except for accounts attributable to MFS or its affiliates' seed money. For the year ended April 30, 2024, this rebate amounted to $1,457, $73, and $14 for Class A, Class R2, and Class R3 shares, respectively, and is included in the reduction of total expenses in the Statement of Operations. |
Certain Class A shares are subject to a contingent deferred sales charge (CDSC) in the event of a shareholder redemption within 18 months of purchase. Class B shares are subject to a CDSC in the event of a shareholder redemption within six years of purchase. Class C shares are subject to a CDSC in the event of a shareholder redemption within 12 months of purchase. All contingent deferred sales charges are paid to MFD and during the year ended April 30, 2024, were as follows:
| | Amount |
| Class A | $38,153 |
| Class B | 1,058 |
| Class C | 1,658 |
Shareholder Servicing Agent — MFS Service Center, Inc. (MFSC), a wholly-owned subsidiary of MFS, receives a fee from the fund for its services as shareholder servicing agent calculated as a percentage of the average daily net assets of the fund as determined periodically under the supervision of the fund's Board of Trustees. For the year ended April 30, 2024, the fee was $308,106, which equated to 0.0072% annually of the fund's average daily net assets. MFSC also receives reimbursement from the fund for out-of-pocket expenses, sub-accounting and other shareholder servicing costs which may be paid to affiliated and unaffiliated service providers. Class R6 shares do not incur sub-accounting fees. For the year ended April 30, 2024, these out-of-pocket expenses, sub-accounting and other shareholder servicing costs amounted to $2,760,031.
Administrator — MFS provides certain financial, legal, shareholder communications, compliance, and other administrative services to the fund. Under an administrative services agreement, the fund reimburses MFS the costs incurred to provide these
Notes to Financial Statements - continued
services. The fund is charged an annual fixed amount of $17,500 plus a fee based on average daily net assets. The administrative services fee is computed daily and paid monthly. The administrative services fee incurred for the year ended April 30, 2024 was equivalent to an annual effective rate of 0.0143% of the fund's average daily net assets.
Trustees’ and Officers’ Compensation — The fund pays compensation to independent Trustees in the form of a retainer, attendance fees, and additional compensation to Board and Committee chairpersons. Independent Trustees’ compensation is accrued daily and paid subsequent to each Trustee Board meeting. The fund does not pay compensation directly to Trustees or officers of the fund who are also officers of the investment adviser, all of whom receive remuneration from MFS for their services to the fund. Certain officers and Trustees of the fund are officers or directors of MFS, MFD, and MFSC.
Prior to December 31, 2001, the fund had an unfunded defined benefit plan (“DB plan”) for independent Trustees. As of December 31, 2001, the Board took action to terminate the DB plan with respect to then-current and any future independent Trustees, such that the DB plan covers only certain of those former independent Trustees who retired on or before December 31, 2001. The DB plan resulted in a pension expense of $1,315 and is included in “Independent Trustees’ compensation” in the Statement of Operations for the year ended April 30, 2024. The liability for deferred retirement benefits payable to those former independent Trustees under the DB plan amounted to $545 at April 30, 2024, and is included in “Payable for independent Trustees’ compensation” in the Statement of Assets and Liabilities. The deferred retirement benefits compensation fee is accrued daily and paid monthly.
Other — The fund invests in the MFS Institutional Money Market Portfolio which is managed by MFS and seeks current income consistent with preservation of capital and liquidity. This money market fund does not pay a management fee to MFS but does incur investment and operating costs.
On August 3, 2022, MFS redeemed 16 shares of Class R6 for an aggregate amount of $203.
(4) Portfolio Securities
For the year ended April 30, 2024, purchases and sales of investments, other than short-term obligations, were as follows:
| | Purchases | Sales |
| U.S. Government securities | $247,598,383 | $275,563,444 |
| Non-U.S. Government securities | 2,467,026,256 | 2,183,733,895 |
Notes to Financial Statements - continued
(5) Shares of Beneficial Interest
The fund's Declaration of Trust permits the Trustees to issue an unlimited number of full and fractional shares of beneficial interest. Transactions in fund shares were as follows:
| | Year ended
4/30/24 | | Year ended
4/30/23 |
| | Shares | Amount | | Shares | Amount |
| Shares sold | | | | | |
| Class A | 20,355,489 | $245,183,532 | | 16,208,708 | $197,407,131 |
| Class B | 621 | 7,434 | | 7,907 | 97,981 |
| Class C | 522,435 | 6,293,541 | | 462,373 | 5,584,472 |
| Class I | 34,548,462 | 416,872,789 | | 38,660,748 | 470,877,618 |
| Class R1 | 116,118 | 1,400,732 | | 49,503 | 599,021 |
| Class R2 | 225,961 | 2,732,698 | | 217,585 | 2,636,973 |
| Class R3 | 535,015 | 6,477,883 | | 770,202 | 9,482,748 |
| Class R4 | 861,022 | 10,419,848 | | 789,531 | 9,584,971 |
| Class R6 | 41,078,844 | 494,696,785 | | 24,567,367 | 298,290,806 |
| | 98,243,967 | $1,184,085,242 | | 81,733,924 | $994,561,721 |
Shares issued to shareholders
in reinvestment of distributions | | | | | |
| Class A | 5,744,442 | $69,160,809 | | 4,831,276 | $58,652,516 |
| Class B | 6,890 | 82,703 | | 9,726 | 117,873 |
| Class C | 104,046 | 1,248,318 | | 106,102 | 1,284,249 |
| Class I | 3,098,413 | 37,260,428 | | 2,333,776 | 28,326,538 |
| Class R1 | 10,805 | 129,977 | | 8,215 | 99,475 |
| Class R2 | 47,419 | 571,077 | | 47,497 | 576,645 |
| Class R3 | 78,733 | 947,193 | | 137,838 | 1,700,358 |
| Class R4 | 194,852 | 2,347,176 | | 172,524 | 2,095,472 |
| Class R6 | 5,664,354 | 68,122,044 | | 4,469,434 | 54,209,484 |
| | 14,949,954 | $179,869,725 | | 12,116,388 | $147,062,610 |
| Shares reacquired | | | | | |
| Class A | (27,408,823) | $(329,480,958) | | (32,761,745) | $(399,068,069) |
| Class B | (154,346) | (1,840,334) | | (221,136) | (2,682,672) |
| Class C | (1,227,831) | (14,717,551) | | (1,946,876) | (23,484,043) |
| Class I | (34,849,044) | (415,586,780) | | (48,679,930) | (591,328,170) |
| Class R1 | (81,673) | (985,258) | | (71,477) | (877,364) |
| Class R2 | (510,435) | (6,162,013) | | (382,633) | (4,658,481) |
| Class R3 | (948,375) | (11,467,386) | | (9,660,612) | (120,039,341) |
| Class R4 | (849,760) | (10,224,655) | | (1,479,942) | (17,914,001) |
| Class R6 | (31,632,145) | (379,494,498) | | (35,962,657) | (437,637,416) |
| | (97,662,432) | $(1,169,959,433) | | (131,167,008) | $(1,597,689,557) |
Notes to Financial Statements - continued
| | Year ended
4/30/24 | | Year ended
4/30/23 |
| | Shares | Amount | | Shares | Amount |
| Net change | | | | | |
| Class A | (1,308,892) | $(15,136,617) | | (11,721,761) | $(143,008,422) |
| Class B | (146,835) | (1,750,197) | | (203,503) | (2,466,818) |
| Class C | (601,350) | (7,175,692) | | (1,378,401) | (16,615,322) |
| Class I | 2,797,831 | 38,546,437 | | (7,685,406) | (92,124,014) |
| Class R1 | 45,250 | 545,451 | | (13,759) | (178,868) |
| Class R2 | (237,055) | (2,858,238) | | (117,551) | (1,444,863) |
| Class R3 | (334,627) | (4,042,310) | | (8,752,572) | (108,856,235) |
| Class R4 | 206,114 | 2,542,369 | | (517,887) | (6,233,558) |
| Class R6 | 15,111,053 | 183,324,331 | | (6,925,856) | (85,137,126) |
| | 15,531,489 | $193,995,534 | | (37,316,696) | $(456,065,226) |
Effective June 1, 2019, purchases of the fund’s Class B shares were closed to new and existing investors subject to certain exceptions. Effective September 29, 2023, purchases of the fund's Class R1 and Class R2 shares were closed to new eligible investors.
(6) Line of Credit
The fund and certain other funds managed by MFS participate in a $1.45 billion unsecured committed line of credit of which $1.2 billion is reserved for use by the fund and certain other MFS U.S. funds. The line of credit is provided by a syndicate of banks under a credit agreement. Borrowings may be made for temporary financing needs. Interest is charged to each fund, based on its borrowings, generally at a rate equal to the highest of 1) Daily Simple SOFR (Secured Overnight Financing Rate) plus 0.10%, 2) the Federal Funds Effective Rate, or 3) the Overnight Bank Funding Rate, each plus an agreed upon spread. A commitment fee, based on the average daily unused portion of the committed line of credit, is allocated among the participating funds. The line of credit expires on March 13, 2025 unless extended or renewed. In addition, the fund and other funds managed by MFS have established unsecured uncommitted borrowing arrangements with certain banks for temporary financing needs. Interest is charged to each fund, based on its borrowings, at rates equal to customary reference rates plus an agreed upon spread. For the year ended April 30, 2024, the fund’s commitment fee and interest expense were $24,503 and $0, respectively, and are included in “Miscellaneous” expense in the Statement of Operations.
Notes to Financial Statements - continued
(7) Investments in Affiliated Issuers
An affiliated issuer may be considered one in which the fund owns 5% or more of the outstanding voting securities, or a company which is under common control. For the purposes of this report, the following were affiliated issuers:
| Affiliated Issuers | Beginning
Value | Purchases | Sales
Proceeds | Realized
Gain
(Loss) | Change in
Unrealized
Appreciation or
Depreciation | Ending
Value |
| MFS Institutional Money Market Portfolio | $181,071,513 | $1,288,963,281 | $1,344,753,260 | $13,056 | $(38,167) | $125,256,423 |
| Affiliated Issuers | Dividend
Income | Capital Gain
Distributions |
| MFS Institutional Money Market Portfolio | $5,472,516 | $— |
(8) LIBOR Transition
The London Interbank Offered Rate (LIBOR) was intended to represent the rate at which contributing banks may obtain short-term borrowings from each other in the London interbank market. Certain of the fund's investments, payment obligations, and financing terms were historically based on LIBOR. In 2017, the United Kingdom Financial Conduct Authority (FCA) announced plans to transition away from LIBOR by the end of 2021. LIBOR's administrator, ICE Benchmark Administration (IBA), ceased publication (on a representative basis) of many of its LIBOR settings as of December 31, 2021 and ceased publication (on a representative basis) of the remaining U.S. dollar LIBOR settings as of June 30, 2023. In addition, global regulators announced that, with limited exceptions, no new LIBOR-based contracts should be entered into after 2021. Although the FCA has announced that it will require the IBA to continue to publish certain select LIBOR rates on a synthetic basis after the relevant cessation dates, such synthetic rates are not considered to be representative of the underlying market and economic reality they are intended to measure, are expected to be published for a limited time period, and are intended solely for use on a limited basis for legacy transactions.
Regulators and industry groups have implemented measures to facilitate the transition away from LIBOR and other interbank offered rates to alternative reference rates, such as the Secured Overnight Financing Rate (SOFR). SOFR is a broad measure of the cost of borrowing cash overnight collateralized by U.S. Treasury securities in the repurchase agreement (repo) market. SOFR is published in various forms including as a daily, compounded, and forward-looking term rate. The transition to alternative reference rates may affect the liquidity and valuation of investments that were tied to LIBOR or other interbank offered rates and may lead to other consequences affecting securities and credit markets more broadly. For example, while some investments that were tied to LIBOR provided for an alternative or “fallback” rate-setting methodology in the event LIBOR is not available, there is uncertainty regarding the effectiveness of any such alternative methodologies to replace LIBOR and certain investments tied to LIBOR may not have fallback provisions. While legislation passed in the United States facilitates by operation of law the replacement of U.S. dollar LIBOR settings in certain legacy
Notes to Financial Statements - continued
instruments with a specified replacement rate, such as SOFR, there is uncertainty regarding the effectiveness of such legislation. There also remains uncertainty regarding the willingness and ability of parties to add or amend fallback provisions in certain other legacy instruments maturing after the cessation of the applicable LIBOR rates, which could create market and litigation risk.
It is difficult to quantify or predict the impact on the fund resulting from the transition from LIBOR to alternative reference rates and the potential effects of the transition from LIBOR on the fund, or on certain instruments in which the fund invests, are not known. The transition process may involve, among other things, increased volatility or illiquidity in markets for instruments that relied on LIBOR to determine interest rates. The transition may also result in a reduction in value of certain LIBOR-related investments held by the fund or reduce the effectiveness of related transactions such as hedges. Any such effects of the transition away from LIBOR and the adoption of alternative reference rates, as well as other unforeseen effects, could have an adverse impact on the fund's performance.
With respect to the fund’s accounting for investments, including investments in certain debt instruments and derivatives, as well as borrowings by the fund and any other contractual arrangements of the fund that undergo reference rate-related modifications as a result of the transition, management has and will continue to rely upon the relief provided by FASB Codification Topic 848 – Reference Rate Reform (Topic 848). The guidance in Topic 848 permits the fund to account for such contract modifications made on or before December 31, 2024 as a continuation of the existing contracts. The situation remains fluid, and management believes, based on best available information, that the impact of the transition will not be material to the fund.
Report of Independent Registered Public Accounting Firm
To the Board of Trustees of MFS Series Trust IX and the Shareholders of MFS Corporate Bond Fund:
Opinion on the Financial Statements and Financial Highlights
We have audited the accompanying statement of assets and liabilities of MFS Corporate Bond Fund (the “Fund”), including the portfolio of investments, as of April 30, 2024, the related statement of operations for the year then ended, the statements of changes in net assets for each of the two years in the period then ended, the financial highlights for each of the five years in the period then ended, and the related notes. In our opinion, the financial statements and financial highlights present fairly, in all material respects, the financial position of the Fund as of April 30, 2024, and the results of its operations for the year then ended, the changes in its net assets for each of the two years in the period then ended, and the financial highlights for each of the five years in the period then ended, in conformity with accounting principles generally accepted in the United States of America.
Basis for Opinion
These financial statements and financial highlights are the responsibility of the Fund’s management. Our responsibility is to express an opinion on the Fund's financial statements and financial highlights based on our audits. We are a public accounting firm registered with the Public Company Accounting Oversight Board (United States) (PCAOB) and are required to be independent with respect to the Fund in accordance with the U.S. federal securities laws and the applicable rules and regulations of the Securities and Exchange Commission and the PCAOB.
We conducted our audits in accordance with the standards of the PCAOB. Those standards require that we plan and perform the audit to obtain reasonable assurance about whether the financial statements and financial highlights are free of material misstatement, whether due to error or fraud. The Fund is not required to have, nor were we engaged to perform, an audit of its internal control over financial reporting. As part of our audits we are required to obtain an understanding of internal control over financial reporting but not for the purpose of expressing an opinion on the effectiveness of the Fund's internal control over financial reporting. Accordingly, we express no such opinion.
Our audits included performing procedures to assess the risks of material misstatement of the financial statements and financial highlights, whether due to error or fraud, and performing procedures that respond to those risks. Such procedures included examining, on a test basis, evidence regarding the amounts and disclosures in the financial statements and financial highlights. Our audits also included evaluating the accounting principles used and significant estimates made by management, as well as evaluating the overall presentation of the financial statements and financial highlights.
Report of Independent Registered Public Accounting Firm – continued
Our procedures included confirmation of securities owned as of April 30, 2024, by correspondence with the custodian and brokers; when replies were not received from brokers, we performed other auditing procedures. We believe that our audits provide a reasonable basis for our opinion.
DELOITTE & TOUCHE LLP
Boston, Massachusetts
June 20, 2024
We have served as the auditor of one or more of the MFS investment companies since 1924.
Trustees and Officers — Identification and Background
The Trustees and Officers of the Trust, as of June 1, 2024, are listed below, together with their principal occupations during the past five years. (Their titles may have varied during that period.) The address of each Trustee and Officer is 111 Huntington Avenue, Boston, Massachusetts 02199-7618.
| Name, Age | | Position(s) Held with Fund | | Trustee/Officer Since(h) | | Number of MFS Funds overseen by the Trustee | | Principal Occupations During
the Past Five Years | | Other Directorships During
the Past Five Years (j) |
| INTERESTED TRUSTEE | | | | | | | | | | |
Michael W. Roberge (k)
(age 57) | | Trustee | | January 2021 | | 135 | | Massachusetts Financial Services Company, Chairman (since January 2021); Chief Executive Officer (since January 2017); Director; Chairman of the Board (since January 2022) | | N/A |
| INDEPENDENT TRUSTEES | | | | | | | | | | |
John P. Kavanaugh
(age 69) | | Trustee and Chair of Trustees | | January 2009 | | 135 | | Private investor | | N/A |
Steven E. Buller
(age 72) | | Trustee | | February 2014 | | 135 | | Private investor | | N/A |
John A. Caroselli
(age 69) | | Trustee | | March 2017 | | 135 | | Private investor; JC Global Advisors, LLC (management consulting), President (since 2015) | | N/A |
Maureen R. Goldfarb
(age 69) | | Trustee | | January 2009 | | 135 | | Private investor | | N/A |
Peter D. Jones
(age 68) | | Trustee | | January 2019 | | 135 | | Private investor | | N/A |
James W. Kilman, Jr.
(age 63) | | Trustee | | January 2019 | | 135 | | Burford Capital Limited (finance and investment management), Senior Advisor (since May 3, 2021), Chief Financial Officer (2019 - May 2, 2021); KielStrand Capital LLC (family office), Chief Executive Officer (since 2016) | | Alpha-En Corporation, Director (2016-2019) |
Trustees and Officers - continued
| Name, Age | | Position(s) Held with Fund | | Trustee/Officer Since(h) | | Number of MFS Funds overseen by the Trustee | | Principal Occupations During
the Past Five Years | | Other Directorships During
the Past Five Years (j) |
Clarence Otis, Jr.
(age 68) | | Trustee | | March 2017 | | 135 | | Private investor | | VF Corporation, Director; Verizon Communications, Inc., Director; The Travelers Companies, Director |
Maryanne L. Roepke
(age 68) | | Trustee | | May 2014 | | 135 | | Private investor | | N/A |
Laurie J. Thomsen
(age 66) | | Trustee | | March 2005 | | 135 | | Private investor | | The Travelers Companies, Director; Dycom Industries, Inc., Director |
| Name, Age | | Position(s) Held with
Fund | | Trustee/Officer Since(h) | | Number of MFS Funds for which the Person is an Officer | | Principal Occupations During
the Past Five Years |
| OFFICERS | | | | | | | | |
William T. Allen (k)
(age 57) | | Deputy Assistant Treasurer | | April 2024 | | 135 | | Massachusetts Financial Services Company, Vice President |
Brian Balasco (k)
(age 46) | | Assistant Treasurer | | April 2024 | | 135 | | Massachusetts Financial Services Company, Vice President |
Christopher R. Bohane (k)
(age 50) | | Assistant Secretary and Assistant Clerk | | July 2005 | | 135 | | Massachusetts Financial Services Company, Senior Vice President and Deputy General Counsel |
James L. Byrne (k)
(age 48) | | Assistant Treasurer | | April 2024 | | 135 | | Massachusetts Financial Services Company, Vice President |
John W. Clark, Jr. (k)
(age 57) | | Deputy Treasurer | | April 2017 | | 135 | | Massachusetts Financial Services Company, Vice President |
David L. DiLorenzo (k)
(age 55) | | President | | July 2005 | | 135 | | Massachusetts Financial Services Company, Senior Vice President |
Heidi W. Hardin (k)
(age 56) | | Secretary and Clerk | | April 2017 | | 135 | | Massachusetts Financial Services Company, Executive Vice President and General Counsel |
Brian E. Langenfeld (k)
(age 51) | | Assistant Secretary and Assistant Clerk | | June 2006 | | 135 | | Massachusetts Financial Services Company, Vice President and Managing Counsel |
Trustees and Officers - continued
| Name, Age | | Position(s) Held with
Fund | | Trustee/Officer Since(h) | | Number of MFS Funds for which the Person is an Officer | | Principal Occupations During
the Past Five Years |
Rosa E. Licea-Mailloux (k)
(age 47) | | Chief Compliance Officer | | March 2022 | | 135 | | Massachusetts Financial Services Company, Vice President (since 2018); Director of Corporate Compliance (2018-2021), Senior Director Compliance (2021-2022), Senior Managing Director of North American Compliance & Chief Compliance Officer (since March 2022) |
Amanda S. Mooradian (k)
(age 45) | | Assistant Secretary and Assistant Clerk | | September 2018 | | 135 | | Massachusetts Financial Services Company, Vice President and Senior Counsel |
Susan A. Pereira (k)
(age 53) | | Assistant Secretary and Assistant Clerk | | July 2005 | | 135 | | Massachusetts Financial Services Company, Vice President and Managing Counsel |
Kasey L. Phillips (k)
(age 53) | | Treasurer | | September 2012 | | 135 | | Massachusetts Financial Services Company, Vice President |
Matthew A. Stowe (k)
(age 49) | | Assistant Secretary and Assistant Clerk | | October 2014 | | 135 | | Massachusetts Financial Services Company, Vice President and Senior Managing Counsel |
William B. Wilson (k)
(age 41) | | Assistant Secretary and Assistant Clerk | | October 2022 | | 135 | | Massachusetts Financial Services Company, Assistant Vice President and Senior Counsel |
| (h) | Date first appointed to serve as Trustee/Officer of an MFS Fund. Each Trustee has served continuously since appointment unless indicated otherwise. From January 2012 through December 2016, Mr. DiLorenzo served as Treasurer and of the Funds. From September 2012 through March 2024, Ms. Phillips served as Assistant Treasurer of the Funds. From April 2017 through March 2024, Mr. Clark served as Assistant Treasurer of the Funds. |
| (j) | Directorships or trusteeships of companies required to report to the Securities and Exchange Commission (i.e., “public companies”). |
| (k) | “Interested person” of the Trust within the meaning of the Investment Company Act of 1940 (referred to as the 1940 Act), which is the principal federal law governing investment companies like the fund, as a result of a position with MFS. The address of MFS is 111 Huntington Avenue, Boston, Massachusetts 02199-7618. |
Each Trustee (other than Messrs. Jones, Kilman and Roberge) has been elected by shareholders and each Trustee and Officer holds office until his or her successor is chosen and qualified or until his or her earlier death, resignation, retirement or removal. Mr. Roberge became a Trustee of the Funds on January 1, 2021 and Messrs. Jones and Kilman became Trustees of the Funds on January 1, 2019. The Trust does not hold annual meetings for the purpose of electing Trustees, and Trustees are not elected for fixed terms. Under the terms of the Board's retirement policy, an Independent Trustee
Trustees and Officers - continued
shall retire at the end of the calendar year in which he or she reaches the earlier of 75 years of age or 15 years of service on the Board (or, in the case of any Independent Trustee who joined the Board prior to 2015, 20 years of service on the Board).
Messrs. Buller, Caroselli, Jones and Otis are members of the Trust’s Audit Committee.
Each of the Interested Trustees and certain Officers hold comparable officer positions with certain affiliates of MFS.
The Statement of Additional Information for a Fund includes further information about the Trustees and is available without charge upon request by calling 1-800-225-2606.
| Investment Adviser | Custodian |
Massachusetts Financial Services Company
111 Huntington Avenue
Boston, MA 02199-7618 | JPMorgan Chase Bank, NA
4 Metrotech Center
New York, NY 11245 |
| Distributor | Independent Registered Public Accounting Firm |
MFS Fund Distributors, Inc.
111 Huntington Avenue
Boston, MA 02199-7618 | Deloitte & Touche LLP
200 Berkeley Street
Boston, MA 02116 |
| Portfolio Manager(s) | |
Alexander Mackey
John Mitchell | |
Statement Regarding Liquidity Risk Management Program
The fund has adopted and implemented a liquidity risk management program (the “Program”) as required by Rule 22e-4 under the Investment Company Act of 1940, as amended. The fund’s Board of Trustees (the “Board”) has designated MFS as the administrator of the Program. The Program is reasonably designed to assess and manage the liquidity risk of the fund. Liquidity risk is the risk that the fund could not meet requests to redeem shares issued by the fund without significant dilution of remaining investors' interests.
MFS provided a written report to the Board for consideration at its March 2024 meeting that addressed the operation of the Program and provided an assessment of the adequacy and effectiveness of the Program during the period from January 1, 2023 to December 31, 2023 (the “Covered Period”). The report concluded that during the Covered Period the Program had operated effectively in all material respects and had adequately and effectively been implemented to assess and manage the fund’s liquidity risk. MFS also reported that there were no liquidity events that impacted the fund or its ability to timely meet redemptions without dilution to existing shareholders during the Covered Period.
There can be no assurance that the Program will achieve its objectives in the future. Further information on liquidity risk, and other principal risks to which an investment in the fund may be subject, can be found in the prospectus.
Proxy Voting Policies and Information
MFS votes proxies on behalf of the fund pursuant to proxy voting policies and procedures that are available without charge, upon request, by calling 1-800-225-2606, by visiting mfs.com/proxyvoting, or by visiting the SEC’s Web site at http://www.sec.gov.
Information regarding how the fund voted proxies relating to portfolio securities during the most recent twelve-month period ended June 30 is available by August 31 of each year without charge by visiting mfs.com/proxyvoting, or by visiting the SEC’s Web site at http://www.sec.gov.
Quarterly Portfolio Disclosure
The fund files a complete schedule of portfolio holdings with the SEC for the first and third quarters of each fiscal year as an exhibit to its reports on Form N-PORT. The fund's Form N-PORT reports are available on the SEC's Web site at http://www.sec.gov. A shareholder can obtain the portfolio holdings report for the first and third quarters of the fund's fiscal year at mfs.com/openendfunds by choosing the fund's name and then scrolling to the “Resources” section and clicking on the “Shareholder Reports” tab.
Further Information
From time to time, MFS may post important information about the fund or the MFS Funds on the MFS Web site (mfs.com). This information is available at https://www.mfs.com/announcements or at mfs.com/openendfunds by choosing the fund’s name and then scrolling to the “Resources” section and clicking on the “Announcements” tab, if any.
Information About Fund Contracts and Legal Claims
The fund has entered into contractual arrangements with an investment adviser, administrator, distributor, shareholder servicing agent, and custodian who each provide services to the fund. Unless expressly stated otherwise, shareholders are not parties to, or intended beneficiaries of these contractual arrangements, and these contractual arrangements are not intended to create any shareholder right to enforce them against the service providers or to seek any remedy under them against the service providers, either directly or on behalf of the fund.
Under the Trust’s By-Laws and Declaration of Trust, any claims asserted against or on behalf of the MFS Funds, including claims against Trustees and Officers, must be brought in state and federal courts located within the Commonwealth of Massachusetts.
Federal Tax Information (unaudited)
The fund will notify shareholders of amounts for use in preparing 2024 income tax forms in January 2025. The following information is provided pursuant to provisions of the Internal Revenue Code.
The fund intends to pass through the maximum amount allowable as Section 163(j) Interest Dividends as defined in Treasury Regulation §1.163(j)-1(b).
| FACTS | WHAT DOES MFS DO WITH YOUR PERSONAL INFORMATION? |
| Why? | Financial companies choose how they share your personal information. Federal law gives consumers the right to limit some but not all sharing. Federal law also requires us to tell you how we collect, share, and protect your personal information. Please read this notice carefully to understand what we do. |
| What? | The types of personal information we collect and share depend on the product or service you have with us. This information can include: |
| • Social Security number and account balances |
| • Account transactions and transaction history |
| • Checking account information and wire transfer instructions |
| When you are no longer our customer, we continue to share your information as described in this notice. |
| How? | All financial companies need to share customers' personal information to run their everyday business. In the section below, we list the reasons financial companies can share their customers' personal information; the reasons MFS chooses to share; and whether you can limit this sharing. |
Reasons we can share your
personal information | Does MFS share? | Can you limit
this sharing? |
For our everyday business purposes –
such as to process your transactions, maintain your
account(s), respond to court orders and legal
investigations, or report to credit bureaus | Yes | No |
For our marketing purposes –
to offer our products and services to you | No | We don't share |
For joint marketing with other
financial companies | No | We don't share |
For our affiliates' everyday business purposes –
information about your transactions and experiences | No | We don't share |
For our affiliates' everyday business purposes –
information about your creditworthiness | No | We don't share |
| For nonaffiliates to market to you | No | We don't share |
| Questions? | Call 800-225-2606 or go to mfs.com. |
| Who we are |
| Who is providing this notice? | MFS Funds, MFS Investment Management, MFS Institutional Advisors, Inc., and MFS Heritage Trust Company. |
| What we do |
How does MFS
protect my personal
information? | To protect your personal information from unauthorized access and use, we use security measures that comply with federal law. These measures include procedural, electronic, and physical safeguards for the protection of the personal information we collect about you. |
How does MFS
collect my personal
information? | We collect your personal information, for example, when you |
| • open an account or provide account information |
| • direct us to buy securities or direct us to sell your securities |
| • make a wire transfer |
| We also collect your personal information from others, such as credit bureaus, affiliates, or other companies. |
| Why can't I limit all sharing? | Federal law gives you the right to limit only |
| • sharing for affiliates' everyday business purposes – information about your creditworthiness |
| • affiliates from using your information to market to you |
| • sharing for nonaffiliates to market to you |
| State laws and individual companies may give you additional rights to limit sharing. |
| Definitions |
| Affiliates | Companies related by common ownership or control. They can be financial and nonfinancial companies. |
| • MFS does not share personal information with affiliates, except for everyday business purposes as described on page one of this notice. |
| Nonaffiliates | Companies not related by common ownership or control. They can be financial and nonfinancial companies. |
| • MFS does not share with nonaffiliates so they can market to you. |
| Joint marketing | A formal agreement between nonaffiliated financial companies that together market financial products or services to you. |
| • MFS doesn't jointly market. |
| Other important information |
| If you own an MFS product or receive an MFS service in the name of a third party such as a bank or broker-dealer, their privacy policy may apply to you instead of ours. |
Save paper with eDelivery.
MFS® will send you prospectuses, reports, and proxies directly via e-mail so you will get information faster with less mailbox clutter.
To sign up:
1. Go to mfs.com.
2. Log in via MFS® Access.
3. Select eDelivery.
If you own your MFS fund shares through a financial institution or a retirement plan, MFS® TALK, MFS® Access, or eDelivery may not be available to you.
CONTACT
WEB SITE
mfs.com
MFS TALK
1-800-637-8255
24 hours a day
ACCOUNT SERVICE AND LITERATURE
Shareholders
1-800-225-2606
Financial advisors
1-800-343-2829
Retirement plan services
1-800-637-1255
MAILING ADDRESS
MFS Service Center, Inc.
P.O. Box 219341
Kansas City, MO 64121-9341
OVERNIGHT MAIL
MFS Service Center, Inc.
Suite 219341
430 W 7th Street
Kansas City, MO 64105-1407
Annual Report
April 30, 2024
MFS® Limited Maturity Fund
MFS® Limited Maturity Fund
| 1 |
| 3 |
| 5 |
| 8 |
| 10 |
| 28 |
| 30 |
| 31 |
| 32 |
| 38 |
| 52 |
| 54 |
| 58 |
| 59 |
| 59 |
| 59 |
| 59 |
| 59 |
| 60 |
The report is prepared for the general information of shareholders. It is authorized for distribution to prospective investors only when preceded or accompanied by a current prospectus.
NOT FDIC INSURED • MAY LOSE VALUE • NO BANK GUARANTEE
Portfolio structure at value (v)
Portfolio structure reflecting equivalent exposure of derivative positions (i)
Fixed income sectors (i)
| Investment Grade Corporates | 45.9% |
| U.S. Treasury Securities | 42.4% |
| Collateralized Debt Obligations | 11.6% |
| Asset-Backed Securities | 5.1% |
| Commercial Mortgage-Backed Securities | 4.8% |
| Residential Mortgage-Backed Securities | 1.3% |
| Emerging Markets Bonds | 1.3% |
| Municipal Bonds | 0.6% |
| Mortgage-Backed Securities | 0.5% |
| Non-U.S. Government Bonds | 0.4% |
| High Yield Corporates | 0.3% |
Composition including fixed income credit quality (a)(i)
| AAA | 10.8% |
| AA | 8.7% |
| A | 22.5% |
| BBB | 28.9% |
| BB | 0.3% |
| CC | 0.1% |
| C (o) | 0.0% |
| U.S. Government | 26.5% |
| Federal Agencies | 0.5% |
| Not Rated | 15.9% |
| Cash & Cash Equivalents | 1.7% |
| Other (q) | (15.9)% |
Portfolio facts
| Average Duration (d) | 2.1 |
| Average Effective Maturity (m) | 2.3 yrs. |
Portfolio Composition - continued
| (a) | For all securities other than those specifically described below, ratings are assigned to underlying securities utilizing ratings from Moody’s, Fitch, and Standard & Poor’s rating agencies and applying the following hierarchy: If all three agencies provide a rating, the middle rating (after dropping the highest and lowest ratings) is assigned; if two of the three agencies rate a security, the lower of the two is assigned. If none of the 3 rating agencies above assign a rating, but the security is rated by DBRS Morningstar, then the DBRS Morningstar rating is assigned. If none of the 4 rating agencies listed above rate the security, but the security is rated by the Kroll Bond Rating Agency (KBRA), then the KBRA rating is assigned. Ratings are shown in the S&P and Fitch scale (e.g., AAA). Securities rated BBB or higher are considered investment grade. All ratings are subject to change. U.S. Government includes securities issued by the U.S. Department of the Treasury. Federal Agencies includes rated and unrated U.S. Agency fixed-income securities, U.S. Agency mortgage-backed securities, and collateralized mortgage obligations of U.S. Agency mortgage-backed securities. |
Not Rated includes fixed income securities and fixed income derivatives that have not been rated by any rating agency. The fund may or may not have held all of these instruments on this date. The fund is not rated by these agencies.
| (d) | Duration is a measure of how much a bond’s price is likely to fluctuate with general changes in interest rates, e.g., if rates rise 1.00%, a bond with a 5-year duration is likely to lose about 5.00% of its value due to the interest rate move. The Average Duration calculation reflects the impact of the equivalent exposure of derivative positions, if any. |
| (i) | For purposes of this presentation, the components include the value of securities, and reflect the impact of the equivalent exposure of derivative positions, if any. These amounts may be negative from time to time. Equivalent exposure is a calculated amount that translates the derivative position into a reasonable approximation of the amount of the underlying asset that the portfolio would have to hold at a given point in time to have the same price sensitivity that results from the portfolio’s ownership of the derivative contract. When dealing with derivatives, equivalent exposure is a more representative measure of the potential impact of a position on portfolio performance than value. The bond component will include any accrued interest amounts. |
| (m) | In determining each instrument’s effective maturity for purposes of calculating the fund’s dollar-weighted average effective maturity, MFS uses the instrument’s stated maturity or, if applicable, an earlier date on which MFS believes it is probable that a maturity-shortening feature (such as a put, pre-refunding or prepayment) will cause the instrument to be repaid. Such an earlier date can be substantially shorter than the instrument’s stated maturity. |
| (q) | For purposes of this presentation, Other includes equivalent exposure from currency derivatives and/or any offsets to derivative positions and may be negative. |
| (v) | For purposes of this presentation, market value of fixed income and/or equity derivatives, if any, is included in Cash & Cash Equivalents. |
Where the fund holds convertible bonds, they are treated as part of the equity portion of the portfolio.
Cash & Cash Equivalents includes any cash, investments in money market funds, short-term securities, and other assets less liabilities. Please see the Statement of Assets and Liabilities for additional information related to the fund’s cash position and other assets and liabilities.
Percentages are based on net assets as of April 30, 2024.
The portfolio is actively managed and current holdings may be different.
Management Review
Summary of Results
For the twelve months ended April 30, 2024, Class A shares of the MFS Limited Maturity Fund (fund) provided a total return of 3.78%, at net asset value. This compares with a return of 2.79% for the fund’s benchmark, the Bloomberg 1-3 Year U.S. Government/Credit Bond Index.
Market Environment
In response to the strongest inflationary period in four decades, global central banks tightened monetary policy significantly during the reporting period, helping reduce price pressures, although more work is needed before inflation returns to target. Geopolitical strains remained high amid ongoing conflicts in Ukraine and in the Middle East, while relations between China and the US remained tense. The US sought to restrict the flow of advanced technologies to China and China looked to use its industrial overcapacity to increase exports to developed markets to bolster its slow-growing domestic economy. The conflict in the Middle East caused trade flow disruptions between Asia and Europe as shipping traffic was routed away from the Red Sea.
Although inflation has yet to reach central banks’ targets, policymakers have indicated their desire to begin cutting rates in the months ahead, although stickier-than-expected inflation could delay cuts in the US. The prospects for easier monetary policy along with resilient global economic growth have been supportive factors for risky assets, such as equities and high-yield bonds. Long-term interest rates moderated during the latter half of the reporting period, although rising government debt levels remained a concern over the medium term. Advancements in artificial intelligence and the adoption of novel weight-loss drugs were two areas of focus for investors during the period.
Factors Affecting Performance
Relative to the Bloomberg 1-3 Year U.S. Government/Credit Bond Index, the fund’s exposure to the collateralized mortgage obligation (CMO) sector, for which the benchmark has no exposure, and an underweight exposure to the treasury sector contributed to returns. In addition, the fund’s overweight exposure and bond selection in both the financial institutions and industrials sectors also supported relative results. From a quality perspective, bond selection and an overweight exposure to both “BBB” and “A” rated(r) bonds benefited relative results.
Conversely, the fund's yield curve(y) positioning detracted from relative performance.
Respectfully,
Portfolio Manager(s)
Philipp Burgener and Alexander Mackey
| (r) | Securities rated “BBB”, “Baa”, or higher are considered investment grade; securities rated “BB”, “Ba”, or below are considered non-investment grade. Ratings are assigned to underlying securities utilizing ratings from Moody's, Fitch, and Standard & Poor's and applying the following hierarchy: If all three agencies provide a rating, the middle rating (after dropping the highest and lowest ratings) is assigned; if two of the three agencies rate a security, the lower of the two is assigned. If none of the 3 rating agencies above assign a rating, but the security is rated by DBRS Morningstar, then the DBRS Morningstar rating is assigned. If none |
Management Review - continued
of the 4 rating agencies listed above rate the security, but the security is rated by the Kroll Bond Rating Agency (KBRA), then the KBRA rating is assigned. Ratings are shown in the S&P and Fitch scale (e.g., AAA). For securities that are not rated by any of the rating agencies, the security is considered Not Rated.
| (y) | A yield curve graphically depicts the yields of different maturity bonds of the same credit quality and type; a normal yield curve is upward sloping, with short-term rates lower than long-term rates. |
The views expressed in this report are those of the portfolio manager(s) only through the end of the period of the report as stated on the cover and do not necessarily reflect the views of MFS or any other person in the MFS organization. These views are subject to change at any time based on market or other conditions, and MFS disclaims any responsibility to update such views. These views may not be relied upon as investment advice or an indication of trading intent on behalf of any MFS portfolio. References to specific securities are not recommendations of such securities, and may not be representative of any MFS portfolio’s current or future investments.
Performance Summary THROUGH 4/30/24
The following chart illustrates a representative class of the fund’s historical performance in comparison to its benchmark(s). Performance results include the deduction of the maximum applicable sales charge and reflect the percentage change in net asset value, including reinvestment of dividends and capital gains distributions. The performance of other share classes will be greater than or less than that of the class depicted below. Benchmarks are unmanaged and may not be invested in directly. Benchmark returns do not reflect sales charges, commissions or expenses. (See Notes to Performance Summary.)
Performance data shown represents past performance and is no guarantee of future results. Investment return and principal value fluctuate so your shares, when sold, may be worth more or less than the original cost; current performance may be lower or higher than quoted. The performance shown does not reflect the deduction of taxes, if any, that a shareholder would pay on fund distributions or the redemption of fund shares.
Growth of a Hypothetical $10,000 Investment
Performance Summary - continued
Total Returns through 4/30/24
Average annual without sales charge
| Share Class | Class Inception Date | 1-yr | 5-yr | 10-yr |
| A | 2/26/1992 | 3.78% | 1.63% | 1.43% |
| B | 9/07/1993 | 3.00% | 0.87% | 0.69% |
| C | 7/01/1994 | 2.90% | 0.77% | 0.59% |
| I | 1/02/1997 | 4.11% | 1.81% | 1.60% |
| R1 | 4/01/2005 | 2.90% | 0.77% | 0.57% |
| R2 | 10/31/2003 | 3.70% | 1.41% | 1.20% |
| R3 | 4/01/2005 | 3.86% | 1.57% | 1.37% |
| R4 | 4/01/2005 | 4.12% | 1.76% | 1.62% |
| R6 | 9/04/2012 | 4.19% | 1.85% | 1.67% |
Comparative benchmark(s)
| Bloomberg 1-3 Year U.S. Government/Credit Bond Index (f) | 2.79% | 1.24% | 1.24% |
Average annual with sales charge
| | | | |
A
With Initial Sales Charge (2.50%) | 1.18% | 1.12% | 1.18% |
B
With CDSC (Declining over six years from 4% to 0%) (v) | (0.99)% | 0.50% | 0.69% |
C
With CDSC (1% for 12 months) (v) | 1.91% | 0.77% | 0.59% |
CDSC – Contingent Deferred Sales Charge.
Class I, R1, R2, R3, R4, and R6 shares do not have a sales charge.
| (f) | Source: FactSet Research Systems Inc. |
| (v) | Assuming redemption at the end of the applicable period. |
Benchmark Definition(s)
Bloomberg 1-3 Year U.S. Government/Credit Bond Index(a) – a market capitalization-weighted index that measures the performance of the short-term (1 to 3 years) investment-grade corporate and U.S. government bond markets.
It is not possible to invest directly in an index.
| (a) | Source: Bloomberg Index Services Limited. BLOOMBERG® is a trademark and service mark of Bloomberg Finance L.P. and its affiliates (collectively “Bloomberg”). Bloomberg or Bloomberg's licensors own all proprietary rights in the Bloomberg Indices. Bloomberg neither approves or endorses this material, or guarantees the accuracy or completeness of any information herein, or makes any warranty, express or implied, as to the results to be obtained therefrom and, to the maximum extent allowed by law, neither shall have any liability or responsibility for injury or damages arising in connection therewith. |
Notes to Performance Summary
Average annual total return represents the average annual change in value for each share class for the periods presented.
Performance Summary - continued
Performance results reflect any applicable expense subsidies and waivers in effect during the periods shown. Without such subsidies and waivers the fund's performance results would be less favorable. Please see the prospectus and financial statements for complete details.
Performance results do not include adjustments made for financial reporting purposes in accordance with U.S. generally accepted accounting principles and may differ from amounts reported in the financial highlights.
From time to time the fund may receive proceeds from litigation settlements, without which performance would be lower.
Expense Table
Fund expenses borne by the shareholders during the period,
November 1, 2023 through April 30, 2024
As a shareholder of the fund, you incur two types of costs: (1) transaction costs, including sales charges (loads) on certain purchase or redemption payments, and (2) ongoing costs, including management fees; distribution and service (12b-1) fees; and other fund expenses. This example is intended to help you understand your ongoing costs (in dollars) of investing in the fund and to compare these costs with the ongoing costs of investing in other mutual funds.
The example is based on an investment of $1,000 invested at the beginning of the period and held for the entire period November 1, 2023 through April 30, 2024.
Actual Expenses
The first line for each share class in the following table provides information about actual account values and actual expenses. You may use the information in this line, together with the amount you invested, to estimate the expenses that you paid over the period. Simply divide your account value by $1,000 (for example, an $8,600 account value divided by $1,000 = 8.6), then multiply the result by the number in the first line under the heading entitled “Expenses Paid During Period” to estimate the expenses you paid on your account during this period.
Hypothetical Example for Comparison Purposes
The second line for each share class in the following table provides information about hypothetical account values and hypothetical expenses based on the fund’s actual expense ratio and an assumed rate of return of 5% per year before expenses, which is not the fund’s actual return. The hypothetical account values and expenses may not be used to estimate the actual ending account balance or expenses you paid for the period. You may use this information to compare the ongoing costs of investing in the fund and other funds. To do so, compare this 5% hypothetical example with the 5% hypothetical examples that appear in the shareholder reports of the other funds.
Please note that the expenses shown in the table are meant to highlight your ongoing costs only and do not reflect any transactional costs, such as sales charges (loads). Therefore, the second line for each share class in the table is useful in comparing ongoing costs only, and will not help you determine the relative total costs of owning different funds. In addition, if these transactional costs were included, your costs would have been higher.
Expense Table - continued
Share
Class | | Annualized
Expense
Ratio | Beginning
Account Value
11/01/23 | Ending
Account Value
4/30/24 | Expenses
Paid During
Period (p)
11/01/23-4/30/24 |
| A | Actual | 0.57% | $1,000.00 | $1,031.41 | $2.88 |
| Hypothetical (h) | 0.57% | $1,000.00 | $1,022.03 | $2.87 |
| B | Actual | 1.32% | $1,000.00 | $1,027.59 | $6.65 |
| Hypothetical (h) | 1.32% | $1,000.00 | $1,018.30 | $6.62 |
| C | Actual | 1.42% | $1,000.00 | $1,028.88 | $7.16 |
| Hypothetical (h) | 1.42% | $1,000.00 | $1,017.80 | $7.12 |
| I | Actual | 0.42% | $1,000.00 | $1,034.04 | $2.12 |
| Hypothetical (h) | 0.42% | $1,000.00 | $1,022.77 | $2.11 |
| R1 | Actual | 1.42% | $1,000.00 | $1,028.93 | $7.16 |
| Hypothetical (h) | 1.42% | $1,000.00 | $1,017.80 | $7.12 |
| R2 | Actual | 0.82% | $1,000.00 | $1,031.92 | $4.14 |
| Hypothetical (h) | 0.82% | $1,000.00 | $1,020.79 | $4.12 |
| R3 | Actual | 0.67% | $1,000.00 | $1,032.69 | $3.39 |
| Hypothetical (h) | 0.67% | $1,000.00 | $1,021.53 | $3.37 |
| R4 | Actual | 0.42% | $1,000.00 | $1,033.96 | $2.12 |
| Hypothetical (h) | 0.42% | $1,000.00 | $1,022.77 | $2.11 |
| R6 | Actual | 0.35% | $1,000.00 | $1,034.40 | $1.77 |
| Hypothetical (h) | 0.35% | $1,000.00 | $1,023.12 | $1.76 |
| (h) | 5% class return per year before expenses. |
| (p) | “Expenses Paid During Period” are equal to each class’s annualized expense ratio, as shown above, multiplied by the average account value over the period, multiplied by 182/366 (to reflect the one-half year period). Expenses paid do not include any applicable sales charges (loads). If these transaction costs had been included, your costs would have been higher. |
Portfolio of Investments
4/30/24
The Portfolio of Investments is a complete list of all securities owned by your fund. It is categorized by broad-based asset classes.
| Issuer | | | Shares/Par | Value ($) |
| Bonds – 97.4% |
| Aerospace & Defense – 0.4% |
| Boeing Co., 2.196%, 2/04/2026 | | $ | 11,032,000 | $10,290,379 |
| Apparel Manufacturers – 0.2% |
| Tapestry, Inc., 7.05%, 11/27/2025 | | $ | 2,945,000 | $2,989,945 |
| Tapestry, Inc., 7%, 11/27/2026 | | | 1,785,000 | 1,819,140 |
| | | | | $4,809,085 |
| Asset-Backed & Securitized – 22.6% |
| 3650R Commercial Mortgage Trust, 2021-PF1, “XA”, 1.126%, 11/15/2054 (i) | | $ | 90,107,767 | $4,146,039 |
| ACREC 2021-FL1 Ltd., “AS”, FLR, 6.933% ((SOFR - 1mo. + 0.11448%) + 1.5%), 10/16/2036 (n) | | | 5,944,500 | 5,836,913 |
| ACREC 2021-FL1 Ltd., “B”, FLR, 7.233% ((SOFR - 1mo. + 0.11448%) + 1.8%), 10/16/2036 (n) | | | 11,776,000 | 11,498,105 |
| ACREC 2021-FL1 Ltd., “C”, FLR, 7.583% ((SOFR - 1mo. + 0.11448%) + 2.15%), 10/16/2036 (n) | | | 5,972,500 | 5,786,868 |
| ACREC 2023-FL2 LLC, “A”, FLR, 7.551% (SOFR - 1mo. + 2.23%), 2/19/2038 (n) | | | 5,550,486 | 5,568,592 |
| ACRES 2021-FL2 Issuer Ltd., “B”, FLR, 7.68% ((SOFR - 1mo. + 0.11448%) + 2.25%), 1/15/2037 (n) | | | 6,994,000 | 6,866,564 |
| Allegro CLO Ltd., 2014-1RA, “A2”, FLR, 7.186% ((SOFR - 3mo. + 0.26161%) + 1.6%), 10/21/2028 (n) | | | 776,747 | 778,038 |
| AmeriCredit Automobile Receivables Trust, 2020-1, “C”, 1.59%, 10/20/2025 | | | 76,671 | 76,510 |
| AmeriCredit Automobile Receivables Trust, 2022-2, “A2A”, 4.2%, 12/18/2025 | | | 311,360 | 311,117 |
| AmeriCredit Automobile Receivables Trust, 2024-1, “A”, 5.61%, 1/12/2027 (n) | | | 3,571,522 | 3,565,269 |
| Arbor Realty Trust, Inc., CLO, 2021-FL1, “B”, FLR, 6.935% ((SOFR - 1mo. + 0.11448%) + 1.5%), 12/15/2035 (n) | | | 1,833,000 | 1,790,491 |
| Arbor Realty Trust, Inc., CLO, 2021-FL1, “C”, FLR, 7.435% ((SOFR - 1mo. + 0.11448%) + 2%), 12/15/2035 (n) | | | 752,000 | 733,137 |
| Arbor Realty Trust, Inc., CLO, 2021-FL3, “B”, FLR, 7.035% ((SOFR - 1mo. + 0.11448%) + 1.6%), 8/15/2034 (n) | | | 3,008,500 | 2,914,310 |
| Arbor Realty Trust, Inc., CLO, 2021-FL3, “C”, FLR, 7.285% ((SOFR - 1mo. + 0.11448%) + 1.85%), 8/15/2034 (n) | | | 1,746,500 | 1,679,808 |
| Arbor Realty Trust, Inc., CLO, 2021-FL4, “AS”, FLR, 7.135% ((SOFR - 1mo. + 0.11448%) + 1.7%), 11/15/2036 (n) | | | 11,713,500 | 11,556,676 |
| Arbor Realty Trust, Inc., CLO, 2021-FL4, “B”, FLR, 7.435% ((SOFR - 1mo. + 0.11448%) + 2%), 11/15/2036 (n) | | | 7,713,500 | 7,596,886 |
Portfolio of Investments – continued
| Issuer | | | Shares/Par | Value ($) |
| Bonds – continued |
| Asset-Backed & Securitized – continued |
| Arbor Realty Trust, Inc., CLO, 2021-FL4, “C”, FLR, 7.735% ((SOFR - 1mo. + 0.11448%) + 2.3%), 11/15/2036 (n) | | $ | 4,645,000 | $4,521,404 |
| Arbor Realty Trust, Inc., CLO, 2022-FL1, “C”, FLR, 7.63% (SOFR - 30 day + 2.3%), 1/15/2037 (n) | | | 12,447,500 | 12,232,976 |
| AREIT 2019-CRE3 Trust, “B”, FLR, 6.984% ((SOFR - 1mo. + 0.11448%) + 1.55%), 9/14/2036 (n) | | | 981,216 | 948,572 |
| AREIT 2019-CRE3 Trust, “C”, FLR, 7.333% (SOFR - 1mo. + 2.014%), 9/14/2036 (n) | | | 940,000 | 892,440 |
| AREIT 2022-CRE6 Trust, “C”, FLR, 7.48% (SOFR - 30 day + 2.15%), 1/20/2037 (n) | | | 4,174,000 | 3,999,030 |
| AREIT 2022-CRE6 Trust, “D”, FLR, 8.18% (SOFR - 30 day + 2.85%), 1/20/2037 (n) | | | 2,549,000 | 2,414,217 |
| AREIT 2022-CRE7 LLC, “B”, FLR, 8.56% (SOFR - 1mo. + 3.244%), 6/17/2039 (n) | | | 12,436,500 | 12,333,115 |
| ARI Fleet Lease Trust, 2023-B, “A2”, 6.05%, 7/15/2032 (n) | | | 2,526,586 | 2,533,915 |
| Balboa Bay Loan Funding Ltd., 2020-1A, “BR”, FLR, 7.236% ((SOFR - 3mo. + 0.26161%) + 1.65%), 1/20/2032 (n) | | | 7,353,970 | 7,356,139 |
| Balboa Bay Loan Funding Ltd., 2020-1A, “CR”, FLR, 7.686% ((SOFR - 3mo. + 0.26161%) + 2.1%), 1/20/2032 (n) | | | 3,983,401 | 3,985,198 |
| Ballyrock CLO 2018-1A Ltd., “A2”, FLR, 7.186% ((SOFR - 3mo. + 0.26161%) + 1.6%), 4/20/2031 (n) | | | 4,282,847 | 4,290,573 |
| Ballyrock CLO 2018-1A Ltd., “B”, FLR, 7.486% ((SOFR - 3mo. + 0.26161%) + 1.9%), 4/20/2031 (n) | | | 1,814,958 | 1,816,888 |
| Bayview Commercial Asset Trust, FLR, 5.896% ((SOFR - 1mo. + 0.11448%) + 0.4658%), 8/25/2035 (n) | | | 160,545 | 153,222 |
| Bayview Financial Revolving Mortgage Loan Trust, FLR, 7.033% ((SOFR - 1mo. + 0.11448%) + 1.6%), 12/28/2040 (n) | | | 104,633 | 158,864 |
| BBCMS Mortgage Trust, 2018-C2, “XA”, 0.918%, 12/15/2051 (i)(n) | | | 62,444,797 | 1,677,673 |
| BBCMS Mortgage Trust, 2021-C10, “XA”, 1.404%, 7/15/2054 (i) | | | 35,970,554 | 2,258,757 |
| BBCMS Mortgage Trust, 2021-C11, “XA”, 1.487%, 9/15/2054 (i) | | | 38,990,589 | 2,567,121 |
| BBCMS Mortgage Trust, 2021-C9, “XA”, 1.727%, 2/15/2054 (i) | | | 54,399,267 | 4,266,023 |
| BDS 2021-FL10 Ltd., “B”, FLR, 7.383% ((SOFR - 1mo. + 0.11448%) + 1.95%), 12/16/2036 (n) | | | 3,637,500 | 3,574,168 |
| BDS 2021-FL10 Ltd., “C”, FLR, 7.733% ((SOFR - 1mo. + 0.11448%) + 2.3%), 12/16/2036 (n) | | | 2,645,500 | 2,583,801 |
| Benchmark 2021-B23 Mortgage Trust, “XA”, 1.372%, 2/15/2054 (i) | | | 60,044,273 | 3,446,469 |
| Benchmark 2021-B24 Mortgage Trust, “XA”, 1.263%, 3/15/2054 (i) | | | 38,370,779 | 1,949,550 |
| Benchmark 2021-B27 Mortgage Trust, “XA”, 1.374%, 7/15/2054 (i) | | | 70,994,470 | 4,095,032 |
Portfolio of Investments – continued
| Issuer | | | Shares/Par | Value ($) |
| Bonds – continued |
| Asset-Backed & Securitized – continued |
| Benchmark 2021-B28 Mortgage Trust, “XA”, 1.382%, 8/15/2054 (i) | | $ | 53,073,359 | $3,314,023 |
| Benchmark 2021-B29 Mortgage Trust, “XA”, 1.14%, 9/15/2054 (i) | | | 77,851,776 | 3,694,479 |
| BSPDF 2021-FL1 Issuer Ltd., “AS”, FLR, 6.915% ((SOFR - 1mo. + 0.11448%) + 1.48%), 10/15/2036 (n) | | | 4,140,000 | 4,005,032 |
| BSPDF 2021-FL1 Issuer Ltd., “B”, FLR, 7.235% ((SOFR - 1mo. + 0.11448%) + 1.8%), 10/15/2036 (n) | | | 3,130,500 | 3,005,903 |
| BSPDF 2021-FL1 Issuer Ltd., “C”, FLR, 7.685% ((SOFR - 1mo. + 0.11448%) + 2.25%), 10/15/2036 (n) | | | 8,000,000 | 7,569,496 |
| BSPRT 2021-FL6 Issuer Ltd., “C”, FLR, 7.485% ((SOFR - 1mo. + 0.11448%) + 2.05%), 3/15/2036 (n) | | | 2,447,500 | 2,355,029 |
| BSPRT 2021-FL7 Issuer Ltd., “B”, FLR, 7.485% ((SOFR - 1mo. + 0.11448%) + 2.05%), 12/15/2038 (n) | | | 1,552,000 | 1,523,527 |
| BSPRT 2021-FL7 Issuer Ltd., “C”, FLR, 7.735% ((SOFR - 1mo. + 0.11448%) + 2.3%), 12/15/2038 (n) | | | 1,869,500 | 1,828,135 |
| BSPRT 2022-FL8 Issuer Ltd., “A”, FLR, 6.83% (SOFR - 30 day + 1.5%), 2/15/2037 (n) | | | 14,730,850 | 14,646,717 |
| BSPRT 2022-FL8 Issuer Ltd., “B”, FLR, 7.38% (SOFR - 30 day + 2.05%), 2/15/2037 (n) | | | 2,054,500 | 2,007,099 |
| BSPRT 2022-FL8 Issuer Ltd., “C”, FLR, 7.63% (SOFR - 30 day + 2.3%), 2/15/2037 (n) | | | 3,317,000 | 3,204,945 |
| Business Jet Securities LLC, 2021-1A, “A”, 2.162%, 4/15/2036 (n) | | | 903,485 | 844,794 |
| Business Jet Securities LLC, 2021-1A, “B”, 2.918%, 4/15/2036 (n) | | | 198,927 | 185,960 |
| Business Jet Securities LLC, 2024-1A, “A”, 6.197%, 5/15/2039 (n) | | | 4,274,000 | 4,268,944 |
| Business Jet Securities LLC, 2024-1A, “B”, 6.924%, 5/15/2039 (n) | | | 497,000 | 496,238 |
| BXMT 2020-FL2 Ltd., “B”, FLR, 6.831% ((SOFR - 1mo. + 0.11448%) + 1.4%), 2/15/2038 (n) | | | 5,795,500 | 5,121,872 |
| BXMT 2020-FL2 Ltd., “A”, FLR, 6.331% ((SOFR - 1mo. + 0.11448%) + 0.9%), 2/15/2038 (n) | | | 4,587,072 | 4,420,483 |
| BXMT 2021-FL4 Ltd., “AS”, FLR, 6.73% ((SOFR - 1mo. + 0.11448%) + 1.3%), 5/15/2038 (n) | | | 12,062,500 | 11,222,414 |
| Capital Automotive, 2020-1A, “A4”, REIT, 3.19%, 2/15/2050 (n) | | | 2,178,707 | 2,114,144 |
| C-BASS Mortgage Loan Trust, 2007-CB1, “AF3”, 6.237%, 1/25/2037 (d)(q) | | | 1,605,197 | 467,049 |
| C-BASS Mortgage Loan Trust, 2007-CB3, “A3”, 5.731%, 3/25/2037 (d)(q) | | | 2,129,051 | 735,262 |
| CD 2017-CD4 Mortgage Trust, “XA”, 1.376%, 5/10/2050 (i) | | | 34,463,204 | 937,327 |
| CF Hippolyta Issuer LLC, 2020-1, “A1”, 1.69%, 7/15/2060 (n) | | | 1,568,623 | 1,470,299 |
Portfolio of Investments – continued
| Issuer | | | Shares/Par | Value ($) |
| Bonds – continued |
| Asset-Backed & Securitized – continued |
| CF Hippolyta Issuer LLC, 2020-1, “B1”, 2.28%, 7/15/2060 (n) | | $ | 499,890 | $459,581 |
| Chesapeake Funding II LLC, 2023-1A, “A1”, 5.65%, 5/15/2035 (n) | | | 5,068,984 | 5,057,028 |
| Chesapeake Funding II LLC, 2023-2A, “A1”, 6.16%, 10/15/2035 (n) | | | 4,925,151 | 4,945,706 |
| CNH Equipment Trust 2023-A, “A2”, 5.34%, 9/15/2026 | | | 2,404,054 | 2,399,629 |
| Colt Funding LLC, 2024-2, “A1”, 6.125%, 4/25/2069 (n) | | | 5,977,488 | 5,945,304 |
| Commercial Equipment Finance 2021-A, LLC, “A”, 2.05%, 2/16/2027 (n) | | | 842,988 | 831,517 |
| Commercial Mortgage Pass-Through Certificates, 2019-BN24, “XA”, 0.751%, 11/15/2062 (i) | | | 34,451,301 | 1,042,045 |
| Commercial Mortgage Pass-Through Certificates, 2021-BN31, “XA”, 1.402%, 2/15/2054 (i) | | | 51,962,950 | 3,346,154 |
| Commercial Mortgage Pass-Through Certificates, 2021-BN32, “XA”, 0.88%, 4/15/2054 (i) | | | 48,682,998 | 1,786,564 |
| Commercial Mortgage Pass-Through Certificates, 2021-BN34, “XA”, 1.083%, 6/15/2063 (i) | | | 55,778,621 | 2,677,881 |
| Commercial Mortgage Pass-Through Certificates, 2021-BN35, “XA”, 1.144%, 6/15/2064 (i) | | | 31,740,821 | 1,634,275 |
| Credit Acceptance Auto Loan Trust, 2021-3A, “B”, 1.38%, 7/15/2030 (n) | | | 1,499,000 | 1,478,911 |
| Credit Acceptance Auto Loan Trust, 2021-3A, “C”, 1.63%, 9/16/2030 (n) | | | 916,000 | 896,552 |
| Credit Acceptance Auto Loan Trust, 2021-4, “A”, 1.26%, 10/15/2030 (n) | | | 897,568 | 886,670 |
| Credit Acceptance Auto Loan Trust, 2021-4, “B”, 1.74%, 12/16/2030 (n) | | | 3,258,000 | 3,154,320 |
| Dell Equipment Finance Trust, 2023-1, “A2”, 5.65%, 9/22/2028 (n) | | | 7,315,834 | 7,315,778 |
| DLLST LLC, 2024-1A, “A3”, 5.05%, 8/20/2027 (n) | | | 1,899,400 | 1,876,621 |
| Dryden Senior Loan Fund, 2017-49A, “BR”, CLO, FLR, 7.189% ((SOFR - 3mo. + 0.26161%) + 1.6%), 7/18/2030 (n) | | | 9,054,010 | 9,060,764 |
| DT Auto Owner Trust 2022-3A, “A”, 6.05%, 10/15/2026 (n) | | | 1,652,384 | 1,653,054 |
| DT Auto Owner Trust 2022-3A, “B”, 6.74%, 7/17/2028 (n) | | | 5,250,000 | 5,267,312 |
| DT Auto Owner Trust 2022-3A, “C”, 7.69%, 7/17/2028 (n) | | | 2,000,000 | 2,031,455 |
| DT Auto Owner Trust, 2023-2A, “A”, 5.88%, 4/15/2027 (n) | | | 4,165,096 | 4,165,768 |
| Empire District Bondco LLC, 4.943%, 1/01/2033 | | | 3,253,000 | 3,188,122 |
| Enterprise Fleet Financing 2022-4 LLC, “A2”, 5.76%, 10/22/2029 (n) | | | 4,603,824 | 4,602,202 |
| Enterprise Fleet Financing 2023-1 LLC, “A2”, 5.51%, 1/22/2029 (n) | | | 5,487,585 | 5,474,368 |
| Enterprise Fleet Financing 2023-2 LLC, “A2”, 5.56%, 4/22/2030 (n) | | | 5,393,385 | 5,382,785 |
Portfolio of Investments – continued
| Issuer | | | Shares/Par | Value ($) |
| Bonds – continued |
| Asset-Backed & Securitized – continued |
| Enterprise Fleet Financing 2023-2 LLC, “A3”, 5.5%, 4/22/2030 (n) | | $ | 3,561,000 | $3,545,793 |
| Fortress CBO Investments Ltd., 2022-FL3, “A”, FLR, 7.18% (SOFR - 30 day + 1.85%), 2/23/2039 (n) | | | 7,379,837 | 7,292,445 |
| Fortress CBO Investments Ltd., 2022-FL3, “AS”, FLR, 7.58% (SOFR - 30 day + 2.25%), 2/23/2039 (n) | | | 8,299,000 | 8,071,831 |
| GreatAmerica Leasing Receivables Funding LLC, 2023-1, “A2”, 5.35%, 2/16/2026 (n) | | | 3,597,279 | 3,596,808 |
| GS Mortgage Securities Trust, 2017-GS6, “XA”, 1.154%, 5/10/2050 (i) | | | 38,149,401 | 922,754 |
| GS Mortgage Securities Trust, 2017-GS7, “XA”, 1.224%, 8/10/2050 (i) | | | 36,453,111 | 946,757 |
| GS Mortgage Securities Trust, 2020-GC47, “A5”, 1.241%, 5/12/2053 (i) | | | 39,074,950 | 2,055,385 |
| IMPAC CMB Trust, FLR, 6.171% ((SOFR - 1mo. + 0.11448%) + 0.74%), 11/25/2034 | | | 24,298 | 23,670 |
| IMPAC CMB Trust, FLR, 6.351% ((SOFR - 1mo. + 0.11448%) + 0.92%), 11/25/2034 | | | 25,576 | 25,050 |
| IMPAC Secured Assets Corp., FLR, 6.131% ((SOFR - 1mo. + 0.11448%) + 0.7%), 5/25/2036 | | | 47,557 | 41,767 |
| Jamestown CLO Ltd., 2020-15A, “C”, FLR, 8.04% ((SOFR - 3mo. + 0.26161%) + 2.45%), 4/15/2033 (n) | | | 14,432,415 | 14,419,743 |
| JPMorgan Chase Commercial Mortgage Securities Corp., 1.129%, 9/15/2050 (i) | | | 37,714,954 | 810,921 |
| LAD Auto Receivables Trust, 2022-1A, “A”, 5.21%, 6/15/2027 (n) | | | 2,123,449 | 2,117,186 |
| LAD Auto Receivables Trust, 2023-4A, “A2”, 6.21%, 10/15/2026 (n) | | | 3,376,999 | 3,380,733 |
| LoanCore 2021-CRE5 Ltd., “AS”, FLR, 7.185% ((SOFR - 1mo. + 0.11448%) + 1.75%), 7/15/2036 (n) | | | 8,481,500 | 8,390,477 |
| LoanCore 2021-CRE5 Ltd., “B”, FLR, 7.435% ((SOFR - 1mo. + 0.11448%) + 2.0%), 7/15/2036 (n) | | | 3,588,000 | 3,503,428 |
| Madison Park Funding Ltd., 2014-13A, “BR2”, FLR, 7.088% ((SOFR - 3mo. + 0.26161%) + 1.5%), 4/19/2030 (n) | | | 6,806,093 | 6,806,195 |
| Merrill Lynch Mortgage Investors, Inc., 4.191%, 2/25/2037 (a)(d) | | | 1,626,949 | 195,847 |
| MF1 2020-FL4 Ltd., “B”, FLR, 8.18% ((SOFR - 1mo. + 0.11448%) + 2.75%), 11/15/2035 (n) | | | 10,472,500 | 10,445,637 |
| MF1 2021-FL5 Ltd., “B”, FLR, 6.881% ((SOFR - 1mo. + 0.11448%) + 1.45%), 7/15/2036 (n) | | | 13,063,500 | 12,959,543 |
| MF1 2021-FL5 Ltd., “C”, FLR, 7.13% ((SOFR - 1mo. + 0.11448%) + 1.7%), 7/15/2036 (n) | | | 3,716,500 | 3,655,118 |
| MF1 2021-FL6 Ltd., “B”, FLR, 7.083% ((SOFR - 1mo. + 0.11448%) + 1.65%), 7/16/2036 (n) | | | 10,716,294 | 10,428,600 |
Portfolio of Investments – continued
| Issuer | | | Shares/Par | Value ($) |
| Bonds – continued |
| Asset-Backed & Securitized – continued |
| MF1 2022-FL8 Ltd., “C”, FLR, 7.518% (SOFR - 30 day + 2.2%), 2/19/2037 (n) | | $ | 2,198,259 | $2,118,963 |
| MF1 2022-FL9 Ltd., “B”, FLR, 8.468% (SOFR - 1mo. + 3.15%), 6/19/2037 (n) | | | 15,126,500 | 15,011,372 |
| MF1 2024-FL14 LLC, “C”, FLR, 8.607% (SOFR - 1mo. + 3.289%), 3/19/2039 (n) | | | 3,863,210 | 3,856,774 |
| Morgan Stanley Bank of America Merrill Lynch Trust, 2017-C33, “XA”, 1.403%, 5/15/2050 (i) | | | 31,870,679 | 856,059 |
| Morgan Stanley Capital I Trust, 2017-H1, “XA”, 1.46%, 6/15/2050 (i) | | | 15,389,727 | 377,288 |
| Morgan Stanley Capital I Trust, 2018-H4, “XA”, 0.974%, 12/15/2051 (i) | | | 48,432,671 | 1,495,480 |
| Morgan Stanley Capital I Trust, 2021-L5, “XA”, 1.411%, 5/15/2054 (i) | | | 45,136,409 | 2,639,040 |
| Morgan Stanley Capital I Trust, 2021-L6, “XA”, 1.319%, 6/15/2054 (i) | | | 42,724,580 | 2,251,068 |
| Morgan Stanley Residential Mortgage Loan Trust, 2024-NQM1, “A-1”, 6.152%, 12/25/2068 (n) | | | 7,992,320 | 7,955,957 |
| Navistar Financial Dealer Note Master Owner Trust, 2022-1, “A”, FLR, 6.58% (SOFR - 30 day + 1.25%), 5/25/2027 (n) | | | 10,812,000 | 10,814,798 |
| New Residential Mortgage Loan Trust, 2024-NQMI, “A-1”, 6.129%, 3/25/2064 (n) | | | 9,356,622 | 9,286,019 |
| NextGear Floorplan Master Owner Trust, 2022-1A, “A1”, FLR, 6.38% (SOFR - 30 day + 1.05%), 3/15/2027 (n) | | | 6,113,000 | 6,136,992 |
| NextGear Floorplan Master Owner Trust, 2023-1A, “A1”, FLR, 6.43% (SOFR - 1mo. + 1.1%), 3/15/2028 (n) | | | 4,992,000 | 5,031,373 |
| Oaktree CLO 2019-1A Ltd., “BR”, FLR, 7.336% ((SOFR - 3mo. + 0.26161%) + 1.75%), 4/22/2030 (n) | | | 8,692,908 | 8,672,323 |
| Oaktree CLO 2019-1A Ltd., “CR”, FLR, 7.936% ((SOFR - 3mo. + 0.26161%) + 2.35%), 4/22/2030 (n) | | | 7,442,908 | 7,368,881 |
| OBX Trust, 2023-NQM5, “A1”, 5.988%, 12/01/2064 (n) | | | 3,074,929 | 3,047,958 |
| OBX Trust, 2024-NQM1, “A1”, 5.928%, 11/25/2063 (n) | | | 3,405,173 | 3,373,314 |
| OBX Trust, 2024-NQM1, “A2”, 6.253%, 11/25/2063 (n) | | | 1,032,076 | 1,022,684 |
| OneMain Financial Issuance Trust, 2020-2A, “A”, 1.75%, 9/14/2035 (n) | | | 8,570,000 | 7,939,369 |
| OneMain Financial Issuance Trust, 2022-S1, “A”, 4.13%, 5/14/2035 (n) | | | 5,509,000 | 5,365,241 |
| OSD CLO, 2023-27, Ltd., “B”, FLR, 7.728% (SOFR - 3mo. + 2.4%), 4/16/2035 (n) | | | 8,390,839 | 8,404,793 |
| Ownit Mortgage Loan Asset-Backed Certificates, 5.79%, 10/25/2035 | | | 975,175 | 530,597 |
| Palmer Square Loan Funding 2023-1A Ltd., “A2”, FLR, 7.824% (SOFR - 3mo. + 2.5%), 7/20/2031 (n) | | | 15,111,215 | 15,128,245 |
Portfolio of Investments – continued
| Issuer | | | Shares/Par | Value ($) |
| Bonds – continued |
| Asset-Backed & Securitized – continued |
| PFP III 2021-8 Ltd., “B”, FLR, 6.933% ((SOFR - 1mo. + 0.11448%) + 1.5%), 8/09/2037 (n) | | $ | 3,244,500 | $3,139,437 |
| Progress Residential 2021-SFR1 Trust, “B”, 1.303%, 4/17/2038 (n) | | | 1,210,000 | 1,106,585 |
| Progress Residential 2021-SFR1 Trust, “C”, 1.555%, 4/17/2038 (n) | | | 908,000 | 830,012 |
| Shackleton 2013-4RA CLO Ltd., “B”, FLR, 7.49% ((SOFR - 3mo. + 2.1616%) + 1.9%) 4/13/2031 (n) | | | 2,268,542 | 2,259,829 |
| Shelter Growth CRE 2021-FL3 Ltd., “C”, FLR, 7.585% ((SOFR - 1mo. + 0.11448%) + 2.15%), 9/15/2036 (n) | | | 6,411,000 | 6,163,357 |
| Southwick Park CLO, Ltd., 2019-4A, “B1R”, FLR, 7.086% ((SOFR - 3mo. + 0.26161%) + 1.5%), 7/20/2032 (n) | | | 2,957,000 | 2,956,279 |
| Southwick Park CLO, Ltd., 2019-4A, “B2R”, 2.46%, 7/20/2032 (n) | | | 5,142,000 | 4,478,291 |
| Southwick Park CLO, Ltd., 2019-4A, “CR”, FLR, 7.536% ((SOFR - 3mo. + 0.26161%) + 1.95%), 7/20/2032 (n) | | | 7,004,000 | 7,016,411 |
| Starwood Commercial Mortgage, 2021-FL2, “B”, FLR, 7.233% ((SOFR - 1mo. + 0.11448%) + 1.8%), 4/18/2038 (n) | | | 8,644,500 | 8,186,081 |
| Stratus Static CLO Ltd., 2022-3A, “BR”, FLR, 7.225% (SOFR - 3mo. + 1.9%), 10/20/2031 (n) | | | 2,308,226 | 2,308,708 |
| Thornburg Mortgage Securities Trust, FLR, 6.111% ((SOFR - 1mo. + 0.11448%) + 0.68%), 4/25/2043 | | | 2,808 | 2,805 |
| TPG Real Estate Finance, 2021-FL4, “AS”, FLR, 6.83% ((SOFR - 1mo. + 0.11448%) + 1.4%), 3/15/2038 (n) | | | 6,062,000 | 5,917,330 |
| TPG Real Estate Finance, 2021-FL4, “B”, FLR, 7.281% ((SOFR - 1mo. + 0.11448%) + 1.85%), 3/15/2038 (n) | | | 13,226,000 | 12,583,984 |
| UBS Commercial Mortgage Trust, 2017-C1, “XA”, 1.159%, 11/15/2050 (i) | | | 23,409,736 | 613,152 |
| UBS Commercial Mortgage Trust, 2018-C14, “XA”, 1.039%, 12/15/2051 (i) | | | 20,335,033 | 637,190 |
| Verus Securitization Trust, 2024-3,“A2”, 6.642%, 4/25/2069 (n) | | | 5,227,092 | 5,225,301 |
| Virginia Power Fuel Securitization LLC, 5.088%, 5/01/2027 | | | 2,317,000 | 2,298,560 |
| Wells Fargo Commercial Mortgage Trust, 2021-C61, “XA”, 1.486%, 11/15/2054 (i) | | | 46,790,491 | 3,029,333 |
| Westlake Automobile Receivables Trust, 2023-1A, “A2B”, FLR, 6.18% (SOFR - 30 day + 0.85%), 6/15/2026 (n) | | | 1,228,880 | 1,229,837 |
| World Omni Auto Receivables Trust, 3.67%, 6/15/2027 | | | 3,072,000 | 3,049,748 |
| World Omni Select Auto Trust 2023-A, “A2B”, FLR, 6.18% (SOFR - 30 day + 0.85%), 3/15/2027 | | | 5,017,267 | 5,027,340 |
| | | | | $631,139,853 |
Portfolio of Investments – continued
| Issuer | | | Shares/Par | Value ($) |
| Bonds – continued |
| Automotive – 1.7% |
| Ford Motor Credit Co. LLC, 5.8%, 3/05/2027 | | $ | 11,168,000 | $11,093,996 |
| Hyundai Capital America, 5.875%, 4/07/2025 (n) | | | 8,600,000 | 8,598,671 |
| LKQ Corp., 5.75%, 6/15/2028 | | | 9,655,000 | 9,645,422 |
| Stellantis Finance US, Inc., 1.711%, 1/29/2027 (n) | | | 6,594,000 | 5,940,579 |
| Volkswagen Group of America Finance LLC, 2.85%, 9/26/2024 (n) | | | 4,128,000 | 4,078,138 |
| Volkswagen Group of America Finance LLC, 3.35%, 5/13/2025 (n) | | | 7,295,000 | 7,122,054 |
| | | | | $46,478,860 |
| Broadcasting – 0.2% |
| WarnerMedia Holdings, Inc., 3.755%, 3/15/2027 | | $ | 6,864,000 | $6,467,925 |
| Brokerage & Asset Managers – 1.7% |
| Brookfield Finance, Inc., 3.9%, 1/25/2028 | | $ | 13,949,000 | $13,225,587 |
| Charles Schwab Corp., 5.875%, 8/24/2026 | | | 7,766,000 | 7,838,983 |
| Charles Schwab Corp., 5.643% to 5/19/2028, FLR (SOFR - 1 day + 2.210%) to 5/19/2029 | | | 11,590,000 | 11,608,247 |
| LPL Holdings, Inc., 4.625%, 11/15/2027 (n) | | | 4,392,000 | 4,185,124 |
| LPL Holdings, Inc., 6.75%, 11/17/2028 | | | 3,449,000 | 3,544,726 |
| LPL Holdings, Inc., 4%, 3/15/2029 (n) | | | 7,092,000 | 6,430,738 |
| | | | | $46,833,405 |
| Business Services – 0.5% |
| Global Payments, Inc., 1.2%, 3/01/2026 | | $ | 8,692,000 | $8,024,936 |
| Tencent Holdings Ltd., 1.81%, 1/26/2026 (n) | | | 7,043,000 | 6,615,401 |
| | | | | $14,640,337 |
| Cable TV – 0.7% |
| Charter Communications Operating LLC/Charter Communications Operating Capital Corp., 6.15%, 11/10/2026 | | $ | 6,865,000 | $6,881,890 |
| Cox Communications, Inc., 5.45%, 9/15/2028 (n) | | | 13,143,000 | 13,073,572 |
| | | | | $19,955,462 |
| Computer Software – 0.2% |
| Dell International LLC/EMC Corp., 4%, 7/15/2024 | | $ | 4,900,000 | $4,880,958 |
| Computer Software - Systems – 0.3% |
| VMware, Inc., 1%, 8/15/2024 | | $ | 5,405,000 | $5,328,297 |
| VMware, Inc., 1.4%, 8/15/2026 | | | 4,186,000 | 3,806,661 |
| | | | | $9,134,958 |
Portfolio of Investments – continued
| Issuer | | | Shares/Par | Value ($) |
| Bonds – continued |
| Conglomerates – 0.5% |
| Regal Rexnord Corp., 6.05%, 2/15/2026 (n) | | $ | 9,148,000 | $9,149,297 |
| Regal Rexnord Corp., 6.05%, 4/15/2028 (n) | | | 5,533,000 | 5,522,308 |
| | | | | $14,671,605 |
| Consumer Products – 0.4% |
| Haleon UK Capital LLC, 3.125%, 3/24/2025 | | $ | 10,091,000 | $9,851,494 |
| Containers – 0.6% |
| Berry Global, Inc., 1.57%, 1/15/2026 | | $ | 7,474,000 | $6,962,336 |
| Berry Global, Inc., 1.65%, 1/15/2027 | | | 9,789,000 | 8,827,347 |
| Berry Global, Inc., 5.5%, 4/15/2028 | | | 1,938,000 | 1,915,910 |
| | | | | $17,705,593 |
| Electronics – 1.2% |
| Microchip Technology, Inc., 0.983%, 9/01/2024 | | $ | 18,197,000 | $17,908,351 |
| Qorvo, Inc., 1.75%, 12/15/2024 | | | 3,654,000 | 3,556,515 |
| SK hynix, Inc., 6.25%, 1/17/2026 (n) | | | 12,203,000 | 12,260,232 |
| | | | | $33,725,098 |
| Emerging Market Quasi-Sovereign – 0.4% |
| DAE Funding LLC (United Arab Emirates), 1.55%, 8/01/2024 (n) | | $ | 3,903,000 | $3,853,413 |
| DAE Funding LLC (United Arab Emirates), 2.625%, 3/20/2025 (n) | | | 6,500,000 | 6,287,320 |
| | | | | $10,140,733 |
| Energy - Independent – 0.8% |
| Diamondback Energy, Inc., 5.2%, 4/18/2027 | | $ | 4,048,000 | $4,018,610 |
| Diamondback Energy, Inc., 5.15%, 1/30/2030 | | | 4,048,000 | 3,970,378 |
| EQT Corp., 5.7%, 4/01/2028 | | | 3,013,000 | 3,001,963 |
| Pioneer Natural Resources Co., 1.9%, 8/15/2030 | | | 13,968,000 | 11,460,294 |
| | | | | $22,451,245 |
| Financial Institutions – 1.2% |
| AerCap Ireland Capital DAC/AerCap Global Aviation Trust, 6.45%, 4/15/2027 | | $ | 5,009,000 | $5,106,372 |
| Avolon Holdings Funding Ltd., 5.5%, 1/15/2026 (n) | | | 3,134,000 | 3,087,899 |
| Avolon Holdings Funding Ltd., 4.25%, 4/15/2026 (n) | | | 2,797,000 | 2,689,808 |
| Avolon Holdings Funding Ltd., 2.528%, 11/18/2027 (n) | | | 6,154,000 | 5,423,100 |
| Avolon Holdings Funding Ltd., 2.75%, 2/21/2028 (n) | | | 4,709,000 | 4,166,293 |
| Avolon Holdings Funding Ltd., 6.375%, 5/04/2028 (n) | | | 4,885,000 | 4,921,357 |
| SMBC Aviation Capital Finance DAC, 5.3%, 4/03/2029 (n) | | | 6,768,000 | 6,601,541 |
| | | | | $31,996,370 |
Portfolio of Investments – continued
| Issuer | | | Shares/Par | Value ($) |
| Bonds – continued |
| Food & Beverages – 1.5% |
| Bacardi-Martini B.V., 5.25%, 1/15/2029 (n) | | $ | 11,526,000 | $11,219,482 |
| JBS USA Lux S.A./JBS USA Food Co./JBS USA Finance, Inc., 3%, 2/02/2029 | | | 11,955,000 | 10,397,558 |
| JDE Peet's N.V., 0.8%, 9/24/2024 (n) | | | 11,971,000 | 11,702,873 |
| JDE Peet's N.V., 1.375%, 1/15/2027 (n) | | | 8,356,000 | 7,457,893 |
| | | | | $40,777,806 |
| Gaming & Lodging – 1.5% |
| GLP Capital LP/GLP Financing II, Inc., 5.25%, 6/01/2025 | | $ | 8,847,000 | $8,764,884 |
| GLP Capital LP/GLP Financing II, Inc., 5.375%, 4/15/2026 | | | 1,551,000 | 1,531,206 |
| Hyatt Hotels Corp., 1.8%, 10/01/2024 | | | 7,537,000 | 7,403,823 |
| Hyatt Hotels Corp., 5.75%, 1/30/2027 | | | 5,367,000 | 5,392,827 |
| Las Vegas Sands Corp., 3.2%, 8/08/2024 | | | 5,950,000 | 5,892,667 |
| Marriott International, Inc., 4.9%, 4/15/2029 | | | 5,173,000 | 5,034,976 |
| Sands China Ltd., 4.05%, 1/08/2026 | | | 6,819,000 | 6,563,595 |
| | | | | $40,583,978 |
| Industrial – 0.0% |
| Howard University, Washington D.C., AGM, 2.516%, 10/01/2025 | | $ | 578,000 | $550,428 |
| Insurance – 1.2% |
| Corebridge Financial, Inc., 3.5%, 4/04/2025 | | $ | 3,720,000 | $3,641,821 |
| Corebridge Financial, Inc., 3.65%, 4/05/2027 | | | 7,440,000 | 7,045,418 |
| Corebridge Global Funding, 5.2%, 1/12/2029 (n) | | | 4,695,000 | 4,608,632 |
| Equitable Financial Life Insurance Co., 1.4%, 7/07/2025 (n) | | | 4,044,000 | 3,839,736 |
| Equitable Financial Life Insurance Co., 5.5%, 12/02/2025 (n) | | | 15,338,000 | 15,248,560 |
| | | | | $34,384,167 |
| Insurance - Property & Casualty – 0.0% |
| Ambac Assurance Corp., 5.1%, 6/07/2172 (n) | | $ | 23,513 | $33,859 |
| International Market Quasi-Sovereign – 0.4% |
| NBN Co. Ltd. (Commonwealth of Australia), 5.75%, 10/06/2028 (n) | | $ | 10,003,000 | $10,137,565 |
| Machinery & Tools – 0.3% |
| Agco Co., 5.45%, 3/21/2027 | | $ | 5,782,000 | $5,762,097 |
| CNH Industrial Capital LLC, 1.875%, 1/15/2026 | | | 2,401,000 | 2,252,561 |
| | | | | $8,014,658 |
| Major Banks – 14.3% |
| Bank of America Corp., 4.2%, 8/26/2024 | | $ | 3,106,000 | $3,090,177 |
| Bank of America Corp., 4.45%, 3/03/2026 | | | 6,999,000 | 6,855,862 |
| Bank of America Corp., 4.25%, 10/22/2026 | | | 4,033,000 | 3,904,935 |
Portfolio of Investments – continued
| Issuer | | | Shares/Par | Value ($) |
| Bonds – continued |
| Major Banks – continued |
| Bank of America Corp., 1.734% to 7/22/2026, FLR (SOFR - 1 day + 0.96%) to 7/22/2027 | | $ | 22,751,000 | $20,872,625 |
| Bank of America Corp., 4.183%, 11/25/2027 | | | 6,721,000 | 6,431,085 |
| Barclays PLC, 2.852% to 5/07/2025, FLR (SOFR - 3mo. + 2.71361%) to 5/07/2026 | | | 2,564,000 | 2,484,139 |
| Barclays PLC, 2.279% to 11/24/2026, FLR (CMT - 1yr. + 1.05%) to 11/24/2027 | | | 10,326,000 | 9,427,833 |
| BNP Paribas S.A., 2.591% to 1/20/2027, FLR (SOFR - 1 day + 1.228%) to 1/20/2028 (n) | | | 12,560,000 | 11,535,083 |
| Capital One Financial Corp., 4.166% to 5/09/2024, FLR (SOFR - 1 day + 1.37%) to 5/09/2025 | | | 6,912,000 | 6,909,051 |
| Capital One Financial Corp., 2.636% to 3/03/2025, FLR (SOFR - 1 day + 1.29%) to 3/03/2026 | | | 12,928,000 | 12,562,923 |
| Capital One Financial Corp., 7.149% to 10/29/2026, FLR (SOFR - 1 day + 2.44%) to 10/29/2027 | | | 1,650,000 | 1,697,988 |
| Capital One Financial Corp., 5.7% to 2/01/2029, FLR (SOFR - 1 day + 1.905%) to 2/01/2030 | | | 2,193,000 | 2,162,682 |
| Credit Agricole S.A., 1.907% to 6/16/2025, FLR (SOFR - 1 day + 1.676%) to 6/16/2026 (n) | | | 2,080,000 | 1,987,594 |
| Credit Agricole S.A., 5.335% to 1/10/2029, FLR (SOFR - 1 day + 1.69%) to 1/10/2030 (n) | | | 11,751,000 | 11,535,636 |
| Danske Bank A.S., 5.705% to 3/01/2029, FLR (CMT - 1yr. + 1.4%) to 3/01/2030 (n) | | | 3,375,000 | 3,332,907 |
| Deutsche Bank AG, 0.898%, 5/28/2024 | | | 2,663,000 | 2,654,073 |
| Deutsche Bank AG, 7.146% to 7/13/2026, FLR (SOFR - 1 day + 2.52%) to 7/13/2027 | | | 3,585,000 | 3,659,869 |
| Deutsche Bank AG, 2.311% to 11/16/2026, FLR (SOFR - 1 day + 1.219%) to 11/16/2027 | | | 3,240,000 | 2,947,435 |
| Deutsche Bank AG, 6.72% to 1/18/2028, FLR (SOFR - 1 day + 3.18%) to 1/18/2029 | | | 680,000 | 693,519 |
| Goldman Sachs Group, Inc., 3.5%, 4/01/2025 | | | 5,300,000 | 5,194,358 |
| Goldman Sachs Group, Inc., 1.093% to 12/09/2025, FLR (SOFR - 1 day + 0.789%) to 12/09/2026 | | | 4,637,000 | 4,298,545 |
| Goldman Sachs Group, Inc., 1.948% to 10/21/2026, FLR (SOFR - 1 day + 0.913%) to 10/21/2027 | | | 8,452,000 | 7,717,316 |
| HSBC Holdings PLC, 2.099% to 6/04/2025, FLR (SOFR - 1 day + 1.929%) to 6/04/2026 | | | 4,303,000 | 4,124,285 |
| HSBC Holdings PLC, 7.336% to 11/03/2025, FLR (SOFR - 1 day + 3.03%) to 11/03/2026 | | | 4,354,000 | 4,451,746 |
| HSBC Holdings PLC, 1.589% to 5/24/2026, FLR (SOFR - 1 day + 1.29%) to 5/24/2027 | | | 3,448,000 | 3,159,149 |
| HSBC Holdings PLC, 2.251% to 11/22/2026, FLR (SOFR - 1 day + 1.1%) to 11/22/2027 | | | 12,000,000 | 10,976,830 |
Portfolio of Investments – continued
| Issuer | | | Shares/Par | Value ($) |
| Bonds – continued |
| Major Banks – continued |
| Huntington Bancshares, Inc., 4.008% to 5/16/2024, FLR (SOFR - 1 day + 1.205%) to 5/16/2025 | | $ | 10,655,000 | $10,638,342 |
| Huntington Bancshares, Inc., 5.699% to 11/18/2024, FLR (SOFR - 1 day + 1.215%) to 11/18/2025 | | | 9,500,000 | 9,443,867 |
| Huntington Bancshares, Inc., 4.443% to 8/04/2027, FLR (SOFR - 1 day + 1.970%) to 8/04/2028 | | | 1,309,000 | 1,254,019 |
| JPMorgan Chase & Co., 5.546% to 12/15/2024, FLR (SOFR - 1 day + 1.07%) to 12/15/2025 | | | 8,000,000 | 7,979,310 |
| JPMorgan Chase & Co., 2.005% to 3/13/2025, FLR (SOFR - 1 day + 1.585%) to 3/13/2026 | | | 7,223,000 | 6,987,291 |
| JPMorgan Chase & Co., 1.04% to 2/04/2026, FLR (SOFR - 1 day + 0.695%) to 2/04/2027 | | | 6,220,000 | 5,733,208 |
| JPMorgan Chase & Co., 1.578% to 4/22/2026, FLR (SOFR - 1 day + 0.885%) to 4/22/2027 | | | 5,268,000 | 4,861,268 |
| JPMorgan Chase & Co., 1.47% to 9/22/2026, FLR (SOFR - 1 day + 0.765%) to 9/22/2027 | | | 10,000,000 | 9,069,236 |
| JPMorgan Chase & Co., 5.04% to 1/23/2027, FLR (SOFR - 1 day + 1.19%) to 1/23/2028 | | | 6,919,000 | 6,820,845 |
| JPMorgan Chase & Co., 5.571% to 4/22/2027, FLR (SOFR - 1 day + 0.93%) to 4/22/2028 | | | 9,197,000 | 9,189,750 |
| Lloyds Banking Group PLC, 3.511% to 3/18/2025, FLR (CMT - 1yr. + 1.6%) to 3/18/2026 | | | 15,414,000 | 15,075,043 |
| Mitsubishi UFJ Financial Group, Inc., 0.953% to 7/19/2024, FLR (CMT - 1yr. + 0.55%) to 7/19/2025 | | | 7,128,000 | 7,048,692 |
| Mitsubishi UFJ Financial Group, Inc., 0.962% to 10/11/2024, FLR (CMT - 1yr. + 0.45%) to 10/11/2025 | | | 7,021,000 | 6,862,258 |
| Morgan Stanley, 0.864% to 10/21/2024, FLR (SOFR - 1 day + 0.745%) to 10/21/2025 | | | 8,651,000 | 8,442,165 |
| Morgan Stanley, 4.35%, 9/08/2026 | | | 9,466,000 | 9,208,163 |
| Morgan Stanley, 3.625%, 1/20/2027 | | | 6,092,000 | 5,823,798 |
| Morgan Stanley, 3.95%, 4/23/2027 | | | 2,189,000 | 2,096,232 |
| Morgan Stanley, 1.512% to 7/20/2026, FLR (SOFR - 1 day + 0.858%) to 7/20/2027 | | | 7,636,000 | 6,973,195 |
| Nationwide Building Society, 2.972% to 2/16/2027, FLR (SOFR - 1 day + 1.29%) to 2/16/2028 (n) | | | 9,261,000 | 8,563,481 |
| NatWest Markets PLC, 3.479%, 3/22/2025 (n) | | | 8,888,000 | 8,714,696 |
| PNC Bank N.A., 2.5%, 8/27/2024 | | | 4,237,000 | 4,194,429 |
| PNC Financial Services Group, Inc., 5.354% to 12/02/2027, FLR (SOFR - 1 day + 1.62%) to 12/02/2028 | | | 15,162,000 | 15,028,548 |
| Standard Chartered PLC, 1.822% to 11/23/2024, FLR (CMT - 1yr. + 0.95%) to 11/23/2025 (n) | | | 2,554,000 | 2,489,967 |
| Standard Chartered PLC, 3.971% to 3/30/2025, FLR (CMT - 1yr. + 1.65%) to 3/30/2026 (n) | | | 3,723,000 | 3,652,239 |
Portfolio of Investments – continued
| Issuer | | | Shares/Par | Value ($) |
| Bonds – continued |
| Major Banks – continued |
| Standard Chartered PLC, 6.17% to 1/09/2026, FLR (CMT - 1yr. + 2.05%) to 1/09/2027 (n) | | $ | 4,409,000 | $4,419,219 |
| Sumitomo Mitsui Financial Group, Inc., 1.474%, 7/08/2025 | | | 7,574,000 | 7,206,830 |
| Sumitomo Mitsui Financial Group, Inc., 2.174%, 1/14/2027 | | | 8,414,000 | 7,716,703 |
| UBS Group AG, 5.711% to 1/12/2026, FLR (CMT - 1yr. + 1.55%) to 1/12/2027 (n) | | | 10,083,000 | 10,056,648 |
| UBS Group AG, 4.703% to 8/05/2026, FLR (CMT - 1yr. + 2.05%) to 8/05/2027 (n) | | | 6,561,000 | 6,409,736 |
| UBS Group AG, 9.25% to 11/13/2028, FLR (CMT - 5yr. + 4.745%) to 5/13/2172 (n) | | | 2,169,000 | 2,314,820 |
| UniCredit S.p.A., 2.569% to 9/22/2025, FLR (CMT - 1yr. + 2.3%) to 9/22/2026 (n) | | | 8,699,000 | 8,295,450 |
| Wells Fargo & Co., 2.164% to 2/11/2025, FLR ((SOFR - 3mo. + 0.26161%) + 0.75%) to 2/11/2026 | | | 9,707,000 | 9,431,406 |
| Wells Fargo & Co., 3.526% to 3/24/2027, FLR (SOFR - 1 day + 1.51%) to 3/24/2028 | | | 13,228,000 | 12,482,751 |
| | | | | $399,151,250 |
| Medical & Health Technology & Services – 1.5% |
| IQVIA Holdings, Inc., 6.25%, 2/01/2029 | | $ | 3,009,000 | $3,057,978 |
| Iqvia, Inc., 5.7%, 5/15/2028 | | | 4,073,000 | 4,072,185 |
| Revvity, Inc., 0.85%, 9/15/2024 | | | 10,000,000 | 9,815,857 |
| Thermo Fisher Scientific, Inc., 1.215%, 10/18/2024 | | | 25,217,000 | 24,720,648 |
| | | | | $41,666,668 |
| Metals & Mining – 1.0% |
| Anglo American Capital PLC, 4.75%, 4/10/2027 (n) | | $ | 14,029,000 | $13,657,844 |
| Glencore Funding LLC, 1.625%, 9/01/2025 (n) | | | 7,900,000 | 7,468,047 |
| Glencore Funding LLC, 1.625%, 4/27/2026 (n) | | | 8,268,000 | 7,633,792 |
| | | | | $28,759,683 |
| Midstream – 1.7% |
| DCP Midstream Operating, LP, 5.625%, 7/15/2027 | | $ | 12,562,000 | $12,581,848 |
| Enbridge, Inc., 2.5%, 2/14/2025 | | | 6,525,000 | 6,359,185 |
| Enbridge, Inc., 5.25%, 4/05/2027 | | | 8,730,000 | 8,662,613 |
| Energy Transfer LP, 2.9%, 5/15/2025 | | | 3,676,000 | 3,573,786 |
| Energy Transfer LP, 5.55%, 2/15/2028 | | | 3,921,000 | 3,916,941 |
| Plains All American Pipeline LP, 4.65%, 10/15/2025 | | | 10,480,000 | 10,300,370 |
| Western Midstream Operating LP, 3.1%, 2/01/2025 | | | 3,357,000 | 3,281,254 |
| | | | | $48,675,997 |
Portfolio of Investments – continued
| Issuer | | | Shares/Par | Value ($) |
| Bonds – continued |
| Mortgage-Backed – 0.5% | |
| Fannie Mae, 3%, 12/01/2031 | | $ | 812,010 | $761,560 |
| Fannie Mae, 6.105%, 3/01/2033 | | | 29,031 | 29,002 |
| Fannie Mae, 5.375%, 5/01/2033 | | | 63,088 | 62,489 |
| Fannie Mae, 2%, 5/25/2044 | | | 163,927 | 161,378 |
| Freddie Mac, 5.956%, 7/25/2029 | | | 3,747,169 | 3,756,052 |
| Freddie Mac, 1.693%, 4/25/2030 (i) | | | 28,811,015 | 2,096,298 |
| Freddie Mac, 3%, 4/15/2033 - 6/15/2045 | | | 7,921,294 | 7,351,898 |
| Freddie Mac, 2%, 7/15/2042 | | | 1,016,565 | 912,813 |
| Ginnie Mae, 3.625%, 7/20/2032 | | | 23,552 | 23,137 |
| | | | | $15,154,627 |
| Municipals – 0.6% |
| Kentucky Higher Education Student Loan Corp. Rev., Taxable, “A-2”, 5.949%, 6/01/2037 | | $ | 12,155,000 | $11,629,128 |
| Massachusetts Educational Financing Authority, Education Loan Rev., Taxable, “A”, 2.156%, 7/01/2024 | | | 1,000,000 | 994,386 |
| Massachusetts Educational Financing Authority, Education Loan Rev., Taxable, “A”, 2.306%, 7/01/2025 | | | 790,000 | 762,198 |
| Massachusetts Educational Financing Authority, Education Loan Rev., Taxable, “A”, 2.562%, 7/01/2026 | | | 1,005,000 | 949,152 |
| Michigan Finance Authority Tobacco Settlement Asset-Backed Rev., Taxable (2006 Sold Tobacco Receipts), “A-1”, 2.326%, 6/01/2030 | | | 1,046,308 | 1,020,072 |
| New Jersey Transportation Trust Fund Authority, Transportation System, Taxable, “B”, 2.631%, 6/15/2024 | | | 1,720,000 | 1,713,821 |
| | | | | $17,068,757 |
| Natural Gas - Pipeline – 0.5% |
| APA Infrastructure Ltd., 4.2%, 3/23/2025 (n) | | $ | 14,780,000 | $14,543,320 |
| Other Banks & Diversified Financials – 2.5% |
| AIB Group PLC, 7.583% to 10/14/2025, FLR (SOFR - 1 day + 3.456%) to 10/14/2026 (n) | | $ | 12,719,000 | $12,976,777 |
| AIB Group PLC, 6.608% to 9/13/2028, FLR (SOFR - 1 day + 2.33%) to 9/13/2029 (n) | | | 1,836,000 | 1,871,387 |
| American Express Co., 2.25%, 3/04/2025 | | | 6,463,000 | 6,285,270 |
| Banque Federative du Credit Mutuel S.A., 5.896%, 7/13/2026 (n) | | | 7,978,000 | 8,018,892 |
| CaixaBank S.A., 5.673% to 3/15/2029, FLR (SOFR - 1 day + 1.78%) to 3/15/2030 (n) | | | 5,420,000 | 5,325,931 |
| Citizens Financial Group, Inc., 5.841% to 1/23/2029, FLR (SOFR - 1 day + 2.01%) to 1/23/2030 | | | 9,750,000 | 9,548,853 |
| Macquarie Group Ltd., 1.201% to 10/14/2024, FLR (SOFR - 1 day + 0.694%) to 10/14/2025 (n) | | | 10,208,000 | 9,975,266 |
Portfolio of Investments – continued
| Issuer | | | Shares/Par | Value ($) |
| Bonds – continued |
| Other Banks & Diversified Financials – continued |
| Macquarie Group Ltd., 1.34% to 1/12/2026, FLR (SOFR - 1 day + 1.069%) to 1/12/2027 (n) | | $ | 6,707,000 | $6,212,283 |
| Truist Financial Corp., 5.435% to 1/24/2029, FLR (SOFR - 1 day + 1.62%) to 1/24/2030 | | | 8,266,000 | 8,097,165 |
| | | | | $68,311,824 |
| Pharmaceuticals – 0.3% |
| Amgen, Inc., 5.507%, 3/02/2026 | | $ | 2,748,000 | $2,740,208 |
| Bayer US Finance LLC, 6.125%, 11/21/2026 (n) | | | 2,950,000 | 2,954,639 |
| Bayer US Finance LLC, 6.25%, 1/21/2029 (n) | | | 2,837,000 | 2,850,644 |
| | | | | $8,545,491 |
| Railroad & Shipping – 0.4% |
| Canadian Pacific Railway Co., 1.35%, 12/02/2024 | | $ | 11,123,000 | $10,847,733 |
| Real Estate - Office – 0.5% |
| COPT Defense Property LP, REIT, 2.25%, 3/15/2026 | | $ | 13,184,000 | $12,357,095 |
| COPT Defense Property LP, REIT, 2%, 1/15/2029 | | | 2,060,000 | 1,715,660 |
| | | | | $14,072,755 |
| Real Estate - Other – 0.3% |
| Sun Communities Operating LP, 5.5%, 1/15/2029 | | $ | 7,053,000 | $6,931,126 |
| Specialty Chemicals – 0.6% |
| International Flavors & Fragrances, Inc., 1.23%, 10/01/2025 (n) | | $ | 14,678,000 | $13,739,534 |
| International Flavors & Fragrances, Inc., 1.832%, 10/15/2027 (n) | | | 4,697,000 | 4,118,795 |
| | | | | $17,858,329 |
| Specialty Stores – 0.4% |
| Genuine Parts Co., 1.75%, 2/01/2025 | | $ | 5,643,000 | $5,472,440 |
| Ross Stores, Inc., 0.875%, 4/15/2026 | | | 7,614,000 | 6,969,348 |
| | | | | $12,441,788 |
| Telecommunications - Wireless – 1.0% |
| Crown Castle, Inc., REIT, 1.35%, 7/15/2025 | | $ | 1,776,000 | $1,684,417 |
| Crown Castle, Inc., REIT, 2.9%, 3/15/2027 | | | 3,817,000 | 3,537,108 |
| Rogers Communications, Inc., 3.2%, 3/15/2027 | | | 12,002,000 | 11,258,804 |
| T-Mobile USA, Inc., 3.5%, 4/15/2025 | | | 10,518,000 | 10,298,254 |
| | | | | $26,778,583 |
| Tobacco – 0.6% |
| B.A.T. International Finance PLC, 5.931%, 2/02/2029 | | $ | 4,159,000 | $4,196,521 |
| Philip Morris International, Inc., 5%, 11/17/2025 | | | 3,250,000 | 3,224,655 |
| Philip Morris International, Inc., 5.125%, 11/17/2027 | | | 2,895,000 | 2,868,039 |
Portfolio of Investments – continued
| Issuer | | | Shares/Par | Value ($) |
| Bonds – continued |
| Tobacco – continued |
| Philip Morris International, Inc., 4.875%, 2/15/2028 | | $ | 6,100,000 | $5,995,813 |
| | | | | $16,285,028 |
| Transportation - Services – 1.8% |
| Element Fleet Management Corp., 6.271%, 6/26/2026 (n) | | $ | 14,322,000 | $14,397,061 |
| Element Fleet Management Corp., 5.643%, 3/13/2027 (n) | | | 12,644,000 | 12,555,749 |
| ERAC USA Finance LLC, 3.85%, 11/15/2024 (n) | | | 2,559,000 | 2,532,480 |
| ERAC USA Finance LLC, 3.8%, 11/01/2025 (n) | | | 2,559,000 | 2,490,145 |
| GXO Logistics, Inc., 6.25%, 5/06/2029 (w) | | | 5,459,000 | 5,465,212 |
| Penske Truck Leasing Co. LP, 5.35%, 1/12/2027 (n) | | | 5,489,000 | 5,434,859 |
| Penske Truck Leasing Co. LP, 5.35%, 3/30/2029 (n) | | | 7,800,000 | 7,664,264 |
| | | | | $50,539,770 |
| U.S. Treasury Obligations – 26.1% |
| U.S. Treasury Notes, 4.125%, 6/15/2026 (f) | | $ | 279,372,000 | $274,384,774 |
| U.S. Treasury Notes, 4.625%, 11/15/2026 | | | 273,785,000 | 271,710,224 |
| U.S. Treasury Notes, 2.75%, 7/31/2027 | | | 194,704,000 | 182,504,578 |
| | | | | $728,599,576 |
| Utilities - Electric Power – 4.3% |
| Algonquin Power & Utilities Corp., 5.365%, 6/15/2026 | | $ | 3,124,000 | $3,091,371 |
| Edison International, 4.7%, 8/15/2025 | | | 10,842,000 | 10,678,185 |
| Emera US Finance LP, 0.833%, 6/15/2024 | | | 3,730,000 | 3,703,624 |
| Enel Finance International N.V., 4.25%, 6/15/2025 (n) | | | 15,000,000 | 14,751,030 |
| Enel Finance International N.V., 6.8%, 10/14/2025 (n) | | | 3,086,000 | 3,137,738 |
| Entergy Louisiana LLC, 0.95%, 10/01/2024 | | | 17,870,000 | 17,519,131 |
| FirstEnergy Corp., 2.05%, 3/01/2025 | | | 5,731,000 | 5,535,262 |
| FirstEnergy Corp., 1.6%, 1/15/2026 | | | 2,459,000 | 2,284,204 |
| NextEra Energy Capital Holdings, Inc., 6.051%, 3/01/2025 | | | 7,426,000 | 7,440,703 |
| NextEra Energy Capital Holdings, Inc., 5.749%, 9/01/2025 | | | 7,988,000 | 7,993,112 |
| Pacific Gas & Electric Co., 4.95%, 6/08/2025 | | | 7,450,000 | 7,360,908 |
| Pacific Gas & Electric Co., 6.1%, 1/15/2029 | | | 7,485,000 | 7,545,964 |
| Pacific Gas & Electric Co., 5.55%, 5/15/2029 | | | 5,557,000 | 5,495,848 |
| Southern California Edison Co., 0.975%, 8/01/2024 | | | 7,618,000 | 7,522,811 |
| Vistra Operations Co. LLC, 4.875%, 5/13/2024 (n) | | | 16,784,000 | 16,775,985 |
| | | | | $120,835,876 |
| Total Bonds (Identified Cost, $2,784,448,867) | | $2,716,724,002 |
Portfolio of Investments – continued
| Issuer | | | Shares/Par | Value ($) |
| Investment Companies (h) – 2.1% |
| Money Market Funds – 2.1% | |
| MFS Institutional Money Market Portfolio, 5.38% (v) (Identified Cost, $58,747,939) | | | 58,747,939 | $58,747,939 |
|
|
| Other Assets, Less Liabilities – 0.5% | | 14,780,058 |
| Net Assets – 100.0% | $2,790,251,999 |
| (a) | Non-income producing security. | | | |
| (d) | In default. | | | |
| (f) | All or a portion of the security has been segregated as collateral for open futures contracts and cleared swap agreements. | | | |
| (h) | An affiliated issuer, which may be considered one in which the fund owns 5% or more of the outstanding voting securities, or a company which is under common control. At period end, the aggregate values of the fund's investments in affiliated issuers and in unaffiliated issuers were $58,747,939 and $2,716,724,002, respectively. | | | |
| (i) | Interest only security for which the fund receives interest on notional principal (Par amount). Par amount shown is the notional principal and does not reflect the cost of the security. | | | |
| (n) | Securities exempt from registration under Rule 144A of the Securities Act of 1933. These securities may be sold in the ordinary course of business in transactions exempt from registration, normally to qualified institutional buyers. At period end, the aggregate value of these securities was $1,013,619,997, representing 36.3% of net assets. | | | |
| (q) | Interest received was less than stated coupon rate. | | | |
| (v) | Affiliated issuer that is available only to investment companies managed by MFS. The rate quoted for the MFS Institutional Money Market Portfolio is the annualized seven-day yield of the fund at period end. | | | |
| (w) | When-issued security. | | | |
| The following abbreviations are used in this report and are defined: |
| AGM | Assured Guaranty Municipal |
| CLO | Collateralized Loan Obligation |
| CMT | Constant Maturity Treasury |
| FLR | Floating Rate. Interest rate resets periodically based on the parenthetically disclosed reference rate plus a spread (if any). The period-end rate reported may not be the current rate. All reference rates are USD unless otherwise noted. |
| REIT | Real Estate Investment Trust |
| SOFR | Secured Overnight Financing Rate |
Derivative Contracts at 4/30/24
| Futures Contracts |
| Description | Long/
Short | Currency | Contracts | Notional
Amount | Expiration
Date | Value/Unrealized
Appreciation
(Depreciation) |
| Liability Derivatives |
| Interest Rate Futures | | |
| U.S. Treasury Note 2 yr | Long | USD | 685 | $138,819,531 | June – 2024 | $(1,321,409) |
Portfolio of Investments – continued
| Cleared Swap Agreements |
Maturity
Date | Notional
Amount | Counterparty | Cash Flows
to Receive/
Frequency | Cash Flows
to Pay/
Frequency | Unrealized
Appreciation
(Depreciation) | | Net Unamortized
Upfront Payments
(Receipts) | | Value |
| Liability Derivatives | | | | | |
| Interest Rate Swaps | | | | | |
| 10/02/26 | USD | 228,000,000 | centrally cleared | 4.697%/Annually | Daily SOFR/Annually | $(1,930,517) | | $(16,813) | | $(1,947,330) |
| 10/02/26 | USD | 70,900,000 | centrally cleared | 4.664%/Annually | Daily SOFR/Annually | (517,256) | | — | | (517,256) |
| | | | | | | $(2,447,773) | | $(16,813) | | $(2,464,586) |
At April 30, 2024, the fund had liquid securities with an aggregate value of $5,847,711 to cover any collateral or margin obligations for certain derivative contracts.
See Notes to Financial Statements
Financial Statements
Statement of Assets and Liabilities
At 4/30/24
This statement represents your fund’s balance sheet, which details the assets and liabilities comprising the total value of the fund.
| Assets | |
| Investments in unaffiliated issuers, at value (identified cost, $2,784,448,867) | $2,716,724,002 |
| Investments in affiliated issuers, at value (identified cost, $58,747,939) | 58,747,939 |
| Receivables for | |
| Investments sold | 180,068,836 |
| Fund shares sold | 3,993,110 |
| Interest and dividends | 26,759,138 |
| Receivable from investment adviser | 100,458 |
| Other assets | 6,111 |
| Total assets | $2,986,399,594 |
| Liabilities | |
| Payable to custodian | $57,704 |
| Payables for | |
| Distributions | 215,859 |
| Net daily variation margin on open cleared swap agreements | 805,436 |
| Net daily variation margin on open futures contracts | 192,660 |
| Investments purchased | 183,950,298 |
| When-issued investments purchased | 5,429,467 |
| Fund shares reacquired | 4,910,442 |
| Payable to affiliates | |
| Administrative services fee | 2,227 |
| Shareholder servicing costs | 400,377 |
| Distribution and service fees | 8,976 |
| Payable for independent Trustees' compensation | 13 |
| Accrued expenses and other liabilities | 174,136 |
| Total liabilities | $196,147,595 |
| Net assets | $2,790,251,999 |
| Net assets consist of | |
| Paid-in capital | $2,972,247,693 |
| Total distributable earnings (loss) | (181,995,694) |
| Net assets | $2,790,251,999 |
| Shares of beneficial interest outstanding | 487,476,168 |
Statement of Assets and Liabilities – continued
| | Net assets | Shares
outstanding | Net asset value
per share (a) |
| Class A | $934,236,711 | 162,917,343 | $5.73 |
| Class B | 939,115 | 164,064 | 5.72 |
| Class C | 21,946,649 | 3,828,285 | 5.73 |
| Class I | 528,157,597 | 92,526,016 | 5.71 |
| Class R1 | 489,071 | 85,612 | 5.71 |
| Class R2 | 1,003,553 | 174,898 | 5.74 |
| Class R3 | 629,154 | 109,633 | 5.74 |
| Class R4 | 1,445,079 | 251,175 | 5.75 |
| Class R6 | 1,301,405,070 | 227,419,142 | 5.72 |
| (a) | Maximum offering price per share was equal to the net asset value per share for all share classes, except for Class A, for which the maximum offering price per share was $5.88 [100 / 97.50 x $5.73]. On sales of $50,000 or more, the maximum offering price of Class A shares is reduced. A contingent deferred sales charge may be imposed on redemptions of Class A, Class B, and Class C shares. Redemption price per share was equal to the net asset value per share for Classes I, R1, R2, R3, R4, and R6. |
See Notes to Financial Statements
Financial Statements
Statement of Operations
Year ended 4/30/24
This statement describes how much your fund earned in investment income and accrued in expenses. It also describes any gains and/or losses generated by fund operations.
| Net investment income (loss) | |
| Income | |
| Interest | $121,299,380 |
| Dividends from affiliated issuers | 2,511,231 |
| Other | 18,442 |
| Total investment income | $123,829,053 |
| Expenses | |
| Management fee | $10,178,745 |
| Distribution and service fees | 2,680,885 |
| Shareholder servicing costs | 1,375,565 |
| Administrative services fee | 411,196 |
| Independent Trustees' compensation | 48,537 |
| Custodian fee | 178,310 |
| Shareholder communications | 122,897 |
| Audit and tax fees | 75,477 |
| Legal fees | 15,181 |
| Miscellaneous | 334,669 |
| Total expenses | $15,421,462 |
| Fees paid indirectly | (6,442) |
| Reduction of expenses by investment adviser and distributor | (2,703,153) |
| Net expenses | $12,711,867 |
| Net investment income (loss) | $111,117,186 |
| Realized and unrealized gain (loss) |
| Realized gain (loss) (identified cost basis) | |
| Unaffiliated issuers | $(20,910,246) |
| Affiliated issuers | 10,018 |
| Futures contracts | (4,008,443) |
| Swap agreements | (9,793,022) |
| Net realized gain (loss) | $(34,701,693) |
| Change in unrealized appreciation or depreciation | |
| Unaffiliated issuers | $38,252,807 |
| Affiliated issuers | (8,978) |
| Futures contracts | (1,605,291) |
| Swap agreements | (2,496,645) |
| Net unrealized gain (loss) | $34,141,893 |
| Net realized and unrealized gain (loss) | $(559,800) |
| Change in net assets from operations | $110,557,386 |
See Notes to Financial Statements
Financial Statements
Statements of Changes in Net Assets
These statements describe the increases and/or decreases in net assets resulting from operations, any distributions, and any shareholder transactions.
| | Year ended |
| | 4/30/24 | 4/30/23 |
| Change in net assets | | |
| From operations | | |
| Net investment income (loss) | $111,117,186 | $71,828,487 |
| Net realized gain (loss) | (34,701,693) | (33,833,545) |
| Net unrealized gain (loss) | 34,141,893 | 4,449,965 |
| Change in net assets from operations | $110,557,386 | $42,444,907 |
| Total distributions to shareholders | $(112,675,801) | $(74,760,872) |
| Change in net assets from fund share transactions | $(181,633,601) | $(33,994,173) |
| Total change in net assets | $(183,752,016) | $(66,310,138) |
| Net assets | | |
| At beginning of period | 2,974,004,015 | 3,040,314,153 |
| At end of period | $2,790,251,999 | $2,974,004,015 |
See Notes to Financial Statements
Financial Statements
Financial Highlights
The financial highlights table is intended to help you understand the fund's financial performance for the past 5 years. Certain information reflects financial results for a single fund share. The total returns in the table represent the rate that an investor would have earned (or lost) on an investment in the fund share class (assuming reinvestment of all distributions) held for the entire period.
| Class A | Year ended |
| | 4/30/24 | 4/30/23 | 4/30/22 | 4/30/21 | 4/30/20 |
| Net asset value, beginning of period | $5.74 | $5.80 | $6.09 | $5.94 | $5.96 |
| Income (loss) from investment operations |
| Net investment income (loss) (d) | $0.22 | $0.13 | $0.06 | $0.09 | $0.14 |
| Net realized and unrealized gain (loss) | (0.01) | (0.05) | (0.28) | 0.18 | (0.01) |
| Total from investment operations | $0.21 | $0.08 | $(0.22) | $0.27 | $0.13 |
| Less distributions declared to shareholders |
| From net investment income | $(0.22) | $(0.14) | $(0.07) | $(0.12) | $(0.15) |
| Net asset value, end of period (x) | $5.73 | $5.74 | $5.80 | $6.09 | $5.94 |
| Total return (%) (r)(s)(t)(x) | 3.78 | 1.37 | (3.59) | 4.59 | 2.21 |
Ratios (%) (to average net assets)
and Supplemental data: |
| Expenses before expense reductions (f) | 0.74 | 0.74 | 0.75 | 0.78 | 0.80 |
| Expenses after expense reductions (f) | 0.58 | 0.57 | 0.57 | 0.58 | 0.64 |
| Net investment income (loss) | 3.83 | 2.30 | 1.04 | 1.56 | 2.41 |
| Portfolio turnover | 66 | 48 | 39 | 35 | 41 |
| Net assets at end of period (000 omitted) | $934,237 | $1,019,905 | $1,046,034 | $1,042,239 | $730,945 |
See Notes to Financial Statements
Financial Highlights – continued
| Class B | Year ended |
| | 4/30/24 | 4/30/23 | 4/30/22 | 4/30/21 | 4/30/20 |
| Net asset value, beginning of period | $5.73 | $5.79 | $6.08 | $5.93 | $5.95 |
| Income (loss) from investment operations |
| Net investment income (loss) (d) | $0.17 | $0.08 | $0.02 | $0.05 | $0.10 |
| Net realized and unrealized gain (loss) | (0.00)(w) | (0.05) | (0.28) | 0.18 | (0.01) |
| Total from investment operations | $0.17 | $0.03 | $(0.26) | $0.23 | $0.09 |
| Less distributions declared to shareholders |
| From net investment income | $(0.18) | $(0.09) | $(0.03) | $(0.08) | $(0.11) |
| Net asset value, end of period (x) | $5.72 | $5.73 | $5.79 | $6.08 | $5.93 |
| Total return (%) (r)(s)(t)(x) | 3.00 | 0.61 | (4.32) | 3.82 | 1.45 |
Ratios (%) (to average net assets)
and Supplemental data: |
| Expenses before expense reductions (f) | 1.49 | 1.49 | 1.50 | 1.53 | 1.55 |
| Expenses after expense reductions (f) | 1.33 | 1.32 | 1.32 | 1.34 | 1.39 |
| Net investment income (loss) | 3.06 | 1.49 | 0.29 | 0.84 | 1.67 |
| Portfolio turnover | 66 | 48 | 39 | 35 | 41 |
| Net assets at end of period (000 omitted) | $939 | $1,663 | $2,361 | $2,931 | $2,714 |
| Class C | Year ended |
| | 4/30/24 | 4/30/23 | 4/30/22 | 4/30/21 | 4/30/20 |
| Net asset value, beginning of period | $5.74 | $5.80 | $6.09 | $5.94 | $5.96 |
| Income (loss) from investment operations |
| Net investment income (loss) (d) | $0.17 | $0.08 | $0.01 | $0.05 | $0.09 |
| Net realized and unrealized gain (loss) | (0.01) | (0.05) | (0.28) | 0.17 | (0.01) |
| Total from investment operations | $0.16 | $0.03 | $(0.27) | $0.22 | $0.08 |
| Less distributions declared to shareholders |
| From net investment income | $(0.17) | $(0.09) | $(0.02) | $(0.07) | $(0.10) |
| Net asset value, end of period (x) | $5.73 | $5.74 | $5.80 | $6.09 | $5.94 |
| Total return (%) (r)(s)(t)(x) | 2.90 | 0.51 | (4.41) | 3.71 | 1.35 |
Ratios (%) (to average net assets)
and Supplemental data: |
| Expenses before expense reductions (f) | 1.49 | 1.49 | 1.50 | 1.53 | 1.55 |
| Expenses after expense reductions (f) | 1.43 | 1.42 | 1.42 | 1.43 | 1.49 |
| Net investment income (loss) | 2.98 | 1.42 | 0.19 | 0.75 | 1.57 |
| Portfolio turnover | 66 | 48 | 39 | 35 | 41 |
| Net assets at end of period (000 omitted) | $21,947 | $26,732 | $31,747 | $39,241 | $42,281 |
See Notes to Financial Statements
Financial Highlights – continued
| Class I | Year ended |
| | 4/30/24 | 4/30/23 | 4/30/22 | 4/30/21 | 4/30/20 |
| Net asset value, beginning of period | $5.71 | $5.77 | $6.07 | $5.92 | $5.93 |
| Income (loss) from investment operations |
| Net investment income (loss) (d) | $0.23 | $0.14 | $0.07 | $0.10 | $0.15 |
| Net realized and unrealized gain (loss) | (0.00)(w) | (0.06) | (0.29) | 0.18 | (0.00)(w) |
| Total from investment operations | $0.23 | $0.08 | $(0.22) | $0.28 | $0.15 |
| Less distributions declared to shareholders |
| From net investment income | $(0.23) | $(0.14) | $(0.08) | $(0.13) | $(0.16) |
| Net asset value, end of period (x) | $5.71 | $5.71 | $5.77 | $6.07 | $5.92 |
| Total return (%) (r)(s)(t)(x) | 4.11 | 1.52 | (3.63) | 4.75 | 2.54 |
Ratios (%) (to average net assets)
and Supplemental data: |
| Expenses before expense reductions (f) | 0.49 | 0.49 | 0.50 | 0.53 | 0.55 |
| Expenses after expense reductions (f) | 0.43 | 0.42 | 0.42 | 0.43 | 0.49 |
| Net investment income (loss) | 3.97 | 2.47 | 1.19 | 1.69 | 2.56 |
| Portfolio turnover | 66 | 48 | 39 | 35 | 41 |
| Net assets at end of period (000 omitted) | $528,158 | $625,604 | $570,543 | $453,159 | $258,164 |
| Class R1 | Year ended |
| | 4/30/24 | 4/30/23 | 4/30/22 | 4/30/21 | 4/30/20 |
| Net asset value, beginning of period | $5.72 | $5.78 | $6.08 | $5.93 | $5.94 |
| Income (loss) from investment operations |
| Net investment income (loss) (d) | $0.17 | $0.07 | $0.01 | $0.05 | $0.09 |
| Net realized and unrealized gain (loss) | (0.01) | (0.04) | (0.29) | 0.17 | (0.00)(w) |
| Total from investment operations | $0.16 | $0.03 | $(0.28) | $0.22 | $0.09 |
| Less distributions declared to shareholders |
| From net investment income | $(0.17) | $(0.09) | $(0.02) | $(0.07) | $(0.10) |
| Net asset value, end of period (x) | $5.71 | $5.72 | $5.78 | $6.08 | $5.93 |
| Total return (%) (r)(s)(t)(x) | 2.90 | 0.51 | (4.58) | 3.71 | 1.52 |
Ratios (%) (to average net assets)
and Supplemental data: |
| Expenses before expense reductions (f) | 1.49 | 1.49 | 1.50 | 1.53 | 1.55 |
| Expenses after expense reductions (f) | 1.43 | 1.42 | 1.42 | 1.44 | 1.48 |
| Net investment income (loss) | 2.98 | 1.22 | 0.18 | 0.74 | 1.57 |
| Portfolio turnover | 66 | 48 | 39 | 35 | 41 |
| Net assets at end of period (000 omitted) | $489 | $456 | $1,252 | $1,597 | $1,593 |
See Notes to Financial Statements
Financial Highlights – continued
| Class R2 | Year ended |
| | 4/30/24 | 4/30/23 | 4/30/22 | 4/30/21 | 4/30/20 |
| Net asset value, beginning of period | $5.74 | $5.80 | $6.10 | $5.94 | $5.96 |
| Income (loss) from investment operations |
| Net investment income (loss) (d) | $0.21 | $0.11 | $0.05 | $0.08 | $0.13 |
| Net realized and unrealized gain (loss) | (0.00)(w) | (0.05) | (0.29) | 0.19 | (0.01) |
| Total from investment operations | $0.21 | $0.06 | $(0.24) | $0.27 | $0.12 |
| Less distributions declared to shareholders |
| From net investment income | $(0.21) | $(0.12) | $(0.06) | $(0.11) | $(0.14) |
| Net asset value, end of period (x) | $5.74 | $5.74 | $5.80 | $6.10 | $5.94 |
| Total return (%) (r)(s)(t)(x) | 3.70 | 1.12 | (3.99) | 4.50 | 1.96 |
Ratios (%) (to average net assets)
and Supplemental data: |
| Expenses before expense reductions (f) | 0.99 | 0.99 | 1.00 | 1.03 | 1.05 |
| Expenses after expense reductions (f) | 0.83 | 0.82 | 0.82 | 0.84 | 0.90 |
| Net investment income (loss) | 3.59 | 1.99 | 0.79 | 1.32 | 2.17 |
| Portfolio turnover | 66 | 48 | 39 | 35 | 41 |
| Net assets at end of period (000 omitted) | $1,004 | $1,151 | $1,646 | $1,997 | $1,579 |
| Class R3 | Year ended |
| | 4/30/24 | 4/30/23 | 4/30/22 | 4/30/21 | 4/30/20 |
| Net asset value, beginning of period | $5.74 | $5.80 | $6.10 | $5.95 | $5.96 |
| Income (loss) from investment operations |
| Net investment income (loss) (d) | $0.21 | $0.12 | $0.06 | $0.09 | $0.14 |
| Net realized and unrealized gain (loss) | 0.01 | (0.05) | (0.29) | 0.18 | (0.00)(w) |
| Total from investment operations | $0.22 | $0.07 | $(0.23) | $0.27 | $0.14 |
| Less distributions declared to shareholders |
| From net investment income | $(0.22) | $(0.13) | $(0.07) | $(0.12) | $(0.15) |
| Net asset value, end of period (x) | $5.74 | $5.74 | $5.80 | $6.10 | $5.95 |
| Total return (%) (r)(s)(t)(x) | 3.86 | 1.27 | (3.85) | 4.48 | 2.28 |
Ratios (%) (to average net assets)
and Supplemental data: |
| Expenses before expense reductions (f) | 0.74 | 0.74 | 0.75 | 0.78 | 0.80 |
| Expenses after expense reductions (f) | 0.68 | 0.67 | 0.67 | 0.69 | 0.75 |
| Net investment income (loss) | 3.73 | 2.08 | 0.96 | 1.50 | 2.32 |
| Portfolio turnover | 66 | 48 | 39 | 35 | 41 |
| Net assets at end of period (000 omitted) | $629 | $595 | $1,001 | $1,318 | $1,512 |
See Notes to Financial Statements
Financial Highlights – continued
| Class R4 | Year ended |
| | 4/30/24 | 4/30/23 | 4/30/22 | 4/30/21 | 4/30/20 |
| Net asset value, beginning of period | $5.76 | $5.82 | $6.11 | $5.96 | $5.99 |
| Income (loss) from investment operations |
| Net investment income (loss) (d) | $0.23 | $0.14 | $0.07 | $0.11 | $0.15 |
| Net realized and unrealized gain (loss) | (0.01) | (0.05) | (0.28) | 0.17 | (0.02) |
| Total from investment operations | $0.22 | $0.09 | $(0.21) | $0.28 | $0.13 |
| Less distributions declared to shareholders |
| From net investment income | $(0.23) | $(0.15) | $(0.08) | $(0.13) | $(0.16) |
| Net asset value, end of period (x) | $5.75 | $5.76 | $5.82 | $6.11 | $5.96 |
| Total return (%) (r)(s)(t)(x) | 3.93 | 1.56 | (3.43) | 4.74 | 2.20 |
Ratios (%) (to average net assets)
and Supplemental data: |
| Expenses before expense reductions (f) | 0.49 | 0.49 | 0.50 | 0.53 | 0.55 |
| Expenses after expense reductions (f) | 0.43 | 0.42 | 0.42 | 0.44 | 0.49 |
| Net investment income (loss) | 4.00 | 2.48 | 1.16 | 1.73 | 2.58 |
| Portfolio turnover | 66 | 48 | 39 | 35 | 41 |
| Net assets at end of period (000 omitted) | $1,445 | $1,039 | $906 | $275 | $242 |
| Class R6 | Year ended |
| | 4/30/24 | 4/30/23 | 4/30/22 | 4/30/21 | 4/30/20 |
| Net asset value, beginning of period | $5.72 | $5.79 | $6.08 | $5.93 | $5.95 |
| Income (loss) from investment operations |
| Net investment income (loss) (d) | $0.23 | $0.14 | $0.08 | $0.11 | $0.16 |
| Net realized and unrealized gain (loss) | 0.01 | (0.06) | (0.28) | 0.17 | (0.02) |
| Total from investment operations | $0.24 | $0.08 | $(0.20) | $0.28 | $0.14 |
| Less distributions declared to shareholders |
| From net investment income | $(0.24) | $(0.15) | $(0.09) | $(0.13) | $(0.16) |
| Net asset value, end of period (x) | $5.72 | $5.72 | $5.79 | $6.08 | $5.93 |
| Total return (%) (r)(s)(t)(x) | 4.19 | 1.42 | (3.39) | 4.82 | 2.43 |
Ratios (%) (to average net assets)
and Supplemental data: |
| Expenses before expense reductions (f) | 0.41 | 0.41 | 0.43 | 0.46 | 0.48 |
| Expenses after expense reductions (f) | 0.35 | 0.35 | 0.35 | 0.37 | 0.42 |
| Net investment income (loss) | 4.06 | 2.53 | 1.26 | 1.77 | 2.64 |
| Portfolio turnover | 66 | 48 | 39 | 35 | 41 |
| Net assets at end of period (000 omitted) | $1,301,405 | $1,296,859 | $1,116,143 | $942,709 | $599,945 |
See Notes to Financial Statements
Financial Highlights – continued
| (d) | Per share data is based on average shares outstanding. |
| (f) | Ratios do not reflect reductions from fees paid indirectly, if applicable. See Note 2 in the Notes to Financial Statements for additional information. |
| (r) | Certain expenses have been reduced without which performance would have been lower. |
| (s) | From time to time the fund may receive proceeds from litigation settlements, without which performance would be lower. |
| (t) | Total returns do not include any applicable sales charges. |
| (w) | Per share amount was less than $0.01. |
| (x) | The net asset values and total returns have been calculated on net assets which include adjustments made in accordance with U.S. generally accepted accounting principles required at period end for financial reporting purposes. |
See Notes to Financial Statements
Notes to Financial Statements
(1) Business and Organization
MFS Limited Maturity Fund (the fund) is a diversified series of MFS Series Trust IX (the trust). The trust is organized as a Massachusetts business trust and is registered under the Investment Company Act of 1940, as amended, as an open-end management investment company.
The fund is an investment company and accordingly follows the investment company accounting and reporting guidance of the Financial Accounting Standards Board (FASB) Accounting Standards Codification Topic 946 Financial Services - Investment Companies.
(2) Significant Accounting Policies
General — The preparation of financial statements in conformity with U.S. generally accepted accounting principles requires management to make estimates and assumptions that affect the reported amounts of assets and liabilities, and disclosure of contingent assets and liabilities at the date of the financial statements and the reported amounts of increases and decreases in net assets from operations during the reporting period. Actual results could differ from those estimates. In the preparation of these financial statements, management has evaluated subsequent events occurring after the date of the fund’s Statement of Assets and Liabilities through the date that the financial statements were issued. The fund invests in foreign securities. Investments in foreign securities are vulnerable to the effects of changes in the relative values of the local currency and the U.S. dollar and to the effects of changes in each country’s market, economic, industrial, political, regulatory, geopolitical, environmental, public health, and other conditions.
Balance Sheet Offsetting — The fund's accounting policy with respect to balance sheet offsetting is that, absent an event of default by the counterparty or a termination of the agreement, the International Swaps and Derivatives Association (ISDA) Master Agreement, or similar agreement, does not result in an offset of reported amounts of financial assets and financial liabilities in the Statement of Assets and Liabilities across transactions between the fund and the applicable counterparty. The fund's right to setoff may be restricted or prohibited by the bankruptcy or insolvency laws of the particular jurisdiction to which a specific master netting agreement counterparty is subject. Balance sheet offsetting disclosures, to the extent applicable to the fund, have been included in the fund’s Significant Accounting Policies note under the captions for each of the fund’s in-scope financial instruments and transactions.
Investment Valuations — Subject to its oversight, the fund's Board of Trustees has delegated primary responsibility for determining or causing to be determined the value of the fund’s investments to MFS as the fund's adviser, pursuant to the fund’s valuation policy and procedures which have been adopted by the adviser and approved by the Board. In accordance with Rule 2a-5 under the Investment Company Act of 1940, the Board of Trustees designated the adviser as the “valuation designee” of the fund. If the adviser, as valuation designee, determines that reliable market quotations are not readily available for an investment, the investment is valued at fair value as determined in good faith by the adviser in accordance with the adviser’s fair valuation policy and procedures.
Notes to Financial Statements - continued
Under the fund's valuation policy and procedures, debt instruments and floating rate loans, including restricted debt instruments, are generally valued at an evaluated or composite bid as provided by a third-party pricing service. Short-term instruments with a maturity at issuance of 60 days or less may be valued at amortized cost, which approximates market value. Futures contracts are generally valued at last posted settlement price on their primary exchange as provided by a third-party pricing service. Futures contracts for which there were no trades that day for a particular position are generally valued at the closing bid quotation on their primary exchange as provided by a third-party pricing service. Swap agreements are generally valued using valuations provided by a third-party pricing service, which for cleared swaps includes an evaluation of any trading activity at the clearinghouses. Open-end investment companies are generally valued at net asset value per share. The values of foreign securities and other assets and liabilities expressed in foreign currencies are converted to U.S. dollars using the mean of bid and asked prices for rates provided by a third-party pricing service.
Under the fund’s valuation policy and procedures, market quotations are not considered to be readily available for debt instruments, floating rate loans, and many types of derivatives. These investments are generally valued at fair value based on information from third-party pricing services or otherwise determined by the adviser in accordance with the adviser’s fair valuation policy and procedures. Securities and other assets generally valued on the basis of information from a third-party pricing service may also be valued at a broker/dealer bid quotation. In determining values, third-party pricing services can utilize both transaction data and market information such as yield, quality, coupon rate, maturity, type of issue, trading characteristics, spreads and other market data. An investment may also be valued at fair value if the adviser determines that the investment’s value has been materially affected by events occurring after the close of the exchange or market on which the investment is principally traded (such as foreign exchange or market) and prior to the determination of the fund’s net asset value, or after the halt of trading of a specific security where trading does not resume prior to the close of the exchange or market on which the security is principally traded. The adviser generally relies on third-party pricing services or other information (such as the correlation with price movements of similar securities in the same or other markets; the type, cost and investment characteristics of the security; the business and financial condition of the issuer; and trading and other market data) to assist in determining whether to fair value and at what value to fair value an investment. The value of an investment for purposes of calculating the fund’s net asset value can differ depending on the source and method used to determine value. When fair valuation is used, the value of an investment used to determine the fund’s net asset value may differ from quoted or published prices for the same investment. There can be no assurance that the fund could obtain the fair value assigned to an investment if it were to sell the investment at the same time at which the fund determines its net asset value per share.
Various inputs are used in determining the value of the fund's assets or liabilities. These inputs are categorized into three broad levels. In certain cases, the inputs used to measure fair value may fall into different levels of the fair value hierarchy. In such cases, an investment's level within the fair value hierarchy is based on the lowest level of input that is significant to the fair value measurement. The fund's assessment of the significance of a particular input to the fair value measurement in its entirety requires judgment, and considers factors specific to the investment. Level 1 includes unadjusted quoted prices in active markets for identical assets or liabilities. Level 2 includes other significant observable market-based inputs (including quoted prices for similar
Notes to Financial Statements - continued
securities, interest rates, prepayment speed, and credit risk). Level 3 includes significant unobservable inputs, which may include the adviser's own assumptions in determining the fair value of investments. Other financial instruments are derivative instruments, such as futures contracts and swap agreements. The following is a summary of the levels used as of April 30, 2024 in valuing the fund's assets and liabilities:
| Financial Instruments | Level 1 | Level 2 | Level 3 | Total |
| U.S. Treasury Bonds & U.S. Government Agencies & Equivalents | $— | $728,599,576 | $— | $728,599,576 |
| Non - U.S. Sovereign Debt | — | 20,278,298 | — | 20,278,298 |
| Municipal Bonds | — | 17,068,757 | — | 17,068,757 |
| U.S. Corporate Bonds | — | 833,995,135 | — | 833,995,135 |
| Residential Mortgage-Backed Securities | — | 52,939,919 | — | 52,939,919 |
| Commercial Mortgage-Backed Securities | — | 132,465,251 | — | 132,465,251 |
| Asset-Backed Securities (including CDOs) | — | 460,889,310 | — | 460,889,310 |
| Foreign Bonds | — | 470,487,756 | — | 470,487,756 |
| Mutual Funds | 58,747,939 | — | — | 58,747,939 |
| Total | $58,747,939 | $2,716,724,002 | $— | $2,775,471,941 |
| Other Financial Instruments | | | | |
| Futures Contracts – Liabilities | $(1,321,409) | $— | $— | $(1,321,409) |
| Swap Agreements – Liabilities | — | (2,464,586) | — | (2,464,586) |
For further information regarding security characteristics, see the Portfolio of Investments.
Derivatives — The fund uses derivatives primarily to increase or decrease exposure to a particular market or segment of the market, or security, to increase or decrease interest rate or currency exposure, or as alternatives to direct investments. Derivatives are used for hedging or non-hedging purposes. While hedging can reduce or eliminate losses, it can also reduce or eliminate gains. When the fund uses derivatives as an investment to increase market exposure, or for hedging purposes, gains and losses from derivative instruments may be substantially greater than the derivative’s original cost.
The derivative instruments used by the fund during the period were futures contracts and swap agreements. Depending on the type of derivative, a fund may exit a derivative position by entering into an offsetting transaction with a counterparty or exchange, negotiating an agreement with the derivative counterparty, or novating the position to a third party. The fund may be unable to promptly close out a futures position in instances where the daily fluctuation in the price for that type of future
Notes to Financial Statements - continued
exceeds the daily limit set by the exchange. The fund's period end derivatives, as presented in the Portfolio of Investments and the associated Derivative Contract tables, generally are indicative of the volume of its derivative activity during the period.
| | | Fair Value (a) |
| Risk | Derivative Contracts | Liability Derivatives |
| Interest Rate | Futures Contracts | $(1,321,409) |
| Interest Rate | Cleared Swap Agreements | (2,464,586) |
| Total | | $(3,785,995) |
| (a) | Values presented in this table for futures contracts and cleared swap agreements correspond to the values reported in the Portfolio of Investments. Only the current day net variation margin for futures contracts and cleared swap agreements is reported separately within the Statement of Assets and Liabilities. |
The following table presents, by major type of derivative contract, the realized gain (loss) on derivatives held by the fund for the year ended April 30, 2024 as reported in the Statement of Operations:
| Risk | Futures
Contracts | Swap
Agreements |
| Interest Rate | $(4,008,443) | $(9,793,022) |
The following table presents, by major type of derivative contract, the change in unrealized appreciation or depreciation on derivatives held by the fund for the year ended April 30, 2024 as reported in the Statement of Operations:
| Risk | Futures
Contracts | Swap
Agreements |
| Interest Rate | $(1,605,291) | $(2,496,645) |
Derivative counterparty credit risk is managed through formal evaluation of the creditworthiness of all potential counterparties. On certain, but not all, uncleared derivatives, the fund attempts to reduce its exposure to counterparty credit risk whenever possible by entering into an ISDA Master Agreement on a bilateral basis. The ISDA Master Agreement gives each party to the agreement the right to terminate all transactions traded under such agreement if there is a specified deterioration in the credit quality of the other party. Upon an event of default or a termination of the ISDA Master Agreement, the non-defaulting party has the right to close out all transactions traded under such agreement and to net amounts owed under each agreement to one net amount payable by one party to the other. This right to close out and net payments across all transactions traded under the ISDA Master Agreement could result in a reduction of the fund's credit risk to such counterparty equal to any amounts payable by the fund under the applicable transactions, if any.
Collateral and margin requirements differ by type of derivative. For cleared derivatives (e.g., futures contracts, cleared swaps, and exchange-traded options), margin requirements are set by the clearing broker and the clearing house and collateral, in the form of cash or securities, is posted by the fund directly with the clearing broker. Collateral terms are counterparty agreement specific for uncleared derivatives (e.g., forward foreign currency exchange contracts, uncleared swap agreements, and uncleared options) and collateral, in the form of cash and securities, is held in segregated accounts with the fund's custodian in connection with these agreements.
Notes to Financial Statements - continued
For derivatives traded under an ISDA Master Agreement, which contains a credit support annex, the collateral requirements are netted across all transactions traded under such counterparty-specific agreement and an amount is posted from one party to the other to collateralize such obligations. Cash that has been segregated or delivered to cover the fund's collateral or margin obligations under derivative contracts, if any, will be reported separately in the Statement of Assets and Liabilities as restricted cash for uncleared derivatives and/or deposits with brokers for cleared derivatives. Securities pledged as collateral or margin for the same purpose, if any, are noted in the Portfolio of Investments. The fund may be required to make payments of interest on uncovered collateral or margin obligations with the broker. Any such payments are included in “Miscellaneous” expense in the Statement of Operations.
Futures Contracts — The fund entered into futures contracts which may be used to hedge against or obtain broad market exposure, interest rate exposure, currency exposure, or to manage duration. A futures contract represents a commitment for the future purchase or sale of an asset at a specified price on a specified date.
Upon entering into a futures contract, the fund is required to deposit with the broker, either in cash or securities, an initial margin in an amount equal to a specified percentage of the notional amount of the contract. Subsequent payments (variation margin) are made or received by the fund each day, depending on the daily fluctuations in the value of the contract, and are recorded for financial statement purposes as unrealized gain or loss by the fund until the contract is closed or expires at which point the gain or loss on futures contracts is realized.
The fund bears the risk of interest rates, exchange rates or securities prices moving unexpectedly, in which case, the fund may not achieve the anticipated benefits of the futures contracts and may realize a loss. While futures contracts may present less counterparty risk to the fund since the contracts are exchange traded and the exchange’s clearinghouse guarantees payments to the broker, there is still counterparty credit risk due to the insolvency of the broker. The fund’s maximum risk of loss due to counterparty credit risk is equal to the margin posted by the fund to the broker plus any gains or minus any losses on the outstanding futures contracts.
Swap Agreements — The fund entered into swap agreements which generally involve a periodic exchange of cash payments on a net basis, at specified intervals or upon the occurrence of specified events, between the fund and a counterparty. Certain swap agreements may be entered into as a bilateral contract (“uncleared swaps”) while others are required to be centrally cleared (“cleared swaps”).
Both cleared and uncleared swap agreements are marked to market daily. The value of uncleared swap agreements is reported in the Statement of Assets and Liabilities as “Uncleared swaps, at value” which includes any related interest accruals to be paid or received by the fund. For cleared swaps, payments (variation margin) are made or received by the fund each day, depending on the daily fluctuations in the value of the cleared swap, such that only the current day net receivable or payable for variation margin is reported in the Statement of Assets and Liabilities.
For both cleared and uncleared swaps, premiums paid or received at the inception of the agreements are amortized over the term of the agreement as realized gain or loss on swap agreements in the Statement of Operations. The periodic exchange of net cash payments, as well as any liquidation payment received or made upon early termination, are recorded as a realized gain or loss on swap agreements in the
Notes to Financial Statements - continued
Statement of Operations. The change in unrealized appreciation or depreciation on swap agreements in the Statement of Operations reflects the aggregate change over the reporting period in the value of swaps net of any unamortized premiums paid or received.
Risks related to swap agreements include the possible lack of a liquid market, unfavorable market and interest rate movements of the underlying instrument and the failure of the counterparty to perform under the terms of the agreements. The fund's maximum risk of loss from counterparty credit risk is the discounted net value of the cash flows to be received from/paid to the counterparty over the contract's remaining life, to the extent that the amount is positive. To address counterparty risk, uncleared swap agreements are limited to only highly-rated counterparties. Risk is further reduced by having an ISDA Master Agreement (“ISDA”) between the fund and the counterparty and, where applicable, by the posting of collateral by the counterparty to the fund to cover the fund’s exposure to the counterparty under such ISDA. The fund's counterparty risk due to cleared swaps is mitigated by the fact that the clearinghouse is the true counterparty to the transaction and the regulatory requirement safeguards in the event of a clearing broker bankruptcy.
The fund entered into interest rate swap agreements in order to manage its exposure to interest rate fluctuations. Interest rate swap agreements involve the periodic exchange of cash flows, between the fund and a counterparty, based on the difference between two interest rates applied to a notional principal amount. The two interest rates exchanged may either be a fixed rate and a floating rate or two floating rates based on different indices.
Mortgage-Backed/Asset-Backed Securities — The fund invests a significant portion of its assets in asset-backed and/or mortgage-backed securities. For these securities, the value of the debt instrument also depends on the credit quality and adequacy of the underlying assets or collateral as well as whether there is a security interest in the underlying assets or collateral. Enforcing rights, if any, against the underlying assets or collateral may be difficult. U.S. Government securities not supported as to the payment of principal or interest by the U.S. Treasury, such as those issued by Fannie Mae, Freddie Mac, and the Federal Home Loan Banks, are subject to greater credit risk than are U.S. Government securities supported by the U.S. Treasury, such as those issued by Ginnie Mae.
Indemnifications — Under the fund's organizational documents, its officers and Trustees may be indemnified against certain liabilities and expenses arising out of the performance of their duties to the fund. Additionally, in the normal course of business, the fund enters into agreements with service providers that may contain indemnification clauses. The fund's maximum exposure under these agreements is unknown as this would involve future claims that may be made against the fund that have not yet occurred.
Investment Transactions and Income — Interest income is recorded on the accrual basis. All premium and discount is amortized or accreted for financial statement purposes in accordance with U.S. generally accepted accounting principles. Debt obligations may be placed on non-accrual status or set to accrue at a rate of interest less than the contractual coupon when the collection of all or a portion of interest has become doubtful. Interest income for those debt obligations may be further reduced by the write-off of the related interest receivables when deemed uncollectible.
Notes to Financial Statements - continued
The fund may receive proceeds from litigation settlements. Any proceeds received from litigation involving portfolio holdings are reflected in the Statement of Operations in realized gain/loss if the security has been disposed of by the fund or in unrealized gain/loss if the security is still held by the fund. Any other proceeds from litigation not related to portfolio holdings are reflected as other income in the Statement of Operations.
Investment transactions are recorded on the trade date. In determining the net gain or loss on securities sold, the cost of securities is determined on the identified cost basis.
The fund may purchase or sell securities on a when-issued or delayed delivery basis. In these extended settlement transactions, the receipt or delivery of the securities by the fund and related payments occur at a future date, usually beyond the customary settlement period. The price of such security and the date that the security will be settled are generally fixed at the time the transaction is negotiated. The value of the security varies with market fluctuations and for debt securities no interest accrues to the fund until settlement takes place. When the fund sells securities on a when-issued or delayed delivery basis, the fund typically owns or has the right to acquire securities equivalent in kind and amount to the securities sold. Purchase and sale commitments for when-issued or delayed delivery securities are held at carrying amount, which approximates fair value and are categorized as level 2 within the fair value hierarchy, and included in When-issued investments purchased and When-issued investments sold in the Statement of Assets and Liabilities, as applicable. Losses may arise due to changes in the value of the underlying securities prior to settlement date or if the counterparty does not perform under the contract’s terms, or if the issuer does not issue the securities due to political, economic or other factors.
To mitigate the counterparty credit risk on TBA transactions, mortgage dollar rolls, and other types of forward settling mortgage-backed and asset-backed security transactions, the fund whenever possible enters into a Master Securities Forward Transaction Agreement (“MSFTA”) on a bilateral basis with each of the counterparties with whom it undertakes a significant volume of transactions. The MSFTA gives each party to the agreement the right to terminate all transactions traded under such agreement if there is a specified deterioration in the credit quality of the other party. Upon an event of default or a termination of the MSFTA, the non-defaulting party has the right to close out all transactions traded under such agreement and to net amounts owed under each transaction to one net amount payable by one party to the other. This right to close out and net payments across all transactions traded under the MSFTA could result in a reduction of the fund's credit risk to such counterparty equal to any amounts payable by the fund under the applicable transactions, if any.
For mortgage-backed and asset-backed securities traded under a MSFTA, the collateral and margining requirements are contract specific. Collateral amounts across all transactions traded under such agreement are netted and an amount is posted from one party to the other to collateralize such obligations. Cash that has been pledged to cover the fund's collateral or margin obligations under a MSFTA, if any, will be reported separately on the Statement of Assets and Liabilities as restricted cash. Securities pledged as collateral or margin for the same purpose, if any, are noted in the Portfolio of Investments.
Notes to Financial Statements - continued
Fees Paid Indirectly — The fund's custody fee may be reduced by a credit earned under an arrangement that measures the value of U.S. dollars deposited with the custodian by the fund. The amount of the credit, for the year ended April 30, 2024, is shown as a reduction of total expenses in the Statement of Operations.
Tax Matters and Distributions — The fund intends to qualify as a regulated investment company, as defined under Subchapter M of the Internal Revenue Code, and to distribute all of its taxable income, including realized capital gains. As a result, no provision for federal income tax is required. The fund’s federal tax returns, when filed, will remain subject to examination by the Internal Revenue Service for a three year period. Management has analyzed the fund’s tax positions taken on federal and state tax returns for all open tax years and does not believe that there are any uncertain tax positions that require recognition of a tax liability. Foreign taxes, if any, have been accrued by the fund in the accompanying financial statements in accordance with the applicable foreign tax law. Foreign income taxes may be withheld by certain countries in which the fund invests. Additionally, capital gains realized by the fund on securities issued in or by certain foreign countries may be subject to capital gains tax imposed by those countries.
Distributions to shareholders are recorded on the ex-dividend date. Income and capital gain distributions are determined in accordance with income tax regulations, which may differ from U.S. generally accepted accounting principles. Certain capital accounts in the financial statements are periodically adjusted for permanent differences in order to reflect their tax character. These adjustments have no impact on net assets or net asset value per share. Temporary differences which arise from recognizing certain items of income, expense, gain or loss in different periods for financial statement and tax purposes will reverse at some time in the future.
Book/tax differences primarily relate to amortization of premium and accretion of discount of debt securities.
The tax character of distributions declared to shareholders for the last two fiscal years is as follows:
| | Year ended
4/30/24 | Year ended
4/30/23 |
| Ordinary income (including any short-term capital gains) | $112,675,801 | $74,760,872 |
The federal tax cost and the tax basis components of distributable earnings were as follows:
| As of 4/30/24 | |
| Cost of investments | $2,847,982,041 |
| Gross appreciation | 3,196,288 |
| Gross depreciation | (79,492,383) |
| Net unrealized appreciation (depreciation) | $(76,296,095) |
| Undistributed ordinary income | 11,455,556 |
| Undistributed long-term capital gain | (107,167,206) |
| Other temporary differences | (9,987,949) |
| Total distributable earnings (loss) | $(181,995,694) |
Notes to Financial Statements - continued
As of April 30, 2024, the fund had capital loss carryforwards available to offset future realized gains. These net capital losses may be carried forward indefinitely and their character is retained as short-term and/or long-term losses. Such losses are characterized as follows:
| Short-Term | $(29,147,118) |
| Long-Term | (78,020,088) |
| Total | $(107,167,206) |
Multiple Classes of Shares of Beneficial Interest — The fund offers multiple classes of shares, which differ in their respective distribution and service fees. The fund's income and common expenses are allocated to shareholders based on the value of settled shares outstanding of each class. The fund's realized and unrealized gain (loss) are allocated to shareholders based on the daily net assets of each class. Dividends are declared separately for each class. Differences in per share dividend rates are generally due to differences in separate class expenses. Class B and Class C shares will convert to Class A shares approximately eight years after purchase. Effective May 20, 2022, all Class 529A shares were redeemed. The fund’s distributions declared to shareholders as reported in the Statements of Changes in Net Assets are presented by class as follows:
| | Year ended
4/30/24 | Year ended
4/30/23 |
| Class A | $37,629,674 | $25,285,679 |
| Class B | 40,402 | 32,502 |
| Class C | 699,371 | 453,519 |
| Class I | 21,263,061 | 14,920,816 |
| Class R1 | 14,440 | 8,187 |
| Class R2 | 40,863 | 28,472 |
| Class R3 | 30,412 | 17,486 |
| Class R4 | 48,214 | 24,694 |
| Class R6 | 52,909,364 | 33,789,621 |
| Class 529A | — | 199,896 |
| Total | $112,675,801 | $74,760,872 |
(3) Transactions with Affiliates
Investment Adviser — The fund has an investment advisory agreement with MFS to provide overall investment management and related administrative services and facilities to the fund. The management fee is computed daily and paid monthly at the following annual rates based on the fund's average daily net assets:
| Up to $1 billion | 0.40% |
| In excess of $1 billion and up to $2.5 billion | 0.35% |
| In excess of $2.5 billion | 0.30% |
MFS has agreed in writing to reduce its management fee by a specified amount if certain MFS mutual fund assets exceed thresholds agreed to by MFS and the fund's Board of Trustees. MFS has also agreed in writing to waive at least 0.01% of its management fee as part of this agreement. The agreement to waive at least 0.01% of the management fee will continue until modified by the fund's Board of Trustees, but such agreement will continue at least until August 31, 2025. For the year ended April 30, 2024, this management fee reduction amounted to $359,646, which is
Notes to Financial Statements - continued
included in the reduction of total expenses in the Statement of Operations. The management fee incurred for the year ended April 30, 2024 was equivalent to an annual effective rate of 0.35% of the fund's average daily net assets.
The investment adviser has agreed in writing to bear the fund’s expenses, excluding management fees, distribution and service fees, payments made to service providers (other than MFS Service Center, Inc. (“MFSC”)) that provide certain sub-accounting services, interest, taxes, extraordinary expenses, brokerage and transaction costs, certain tax reclaim recovery expenses (including contingency fees and closing agreement expenses), and investment-related expenses (such as interest and borrowing expenses incurred in connection with the fund's investment activity), such that “Other Expenses” do not exceed 0.00% of the class' average daily net assets annually for each class of shares. This written agreement will continue until modified by the fund’s Board of Trustees, but such agreement will continue until at least August 31, 2024. For the year ended April 30, 2024, this reduction amounted to $1,371,038, which is included in the reduction of total expenses in the Statement of Operations.
Distributor — MFS Fund Distributors, Inc. (MFD), a wholly-owned subsidiary of MFS, as distributor, received $93,869 for the year ended April 30, 2024, as its portion of the initial sales charge on sales of Class A shares of the fund.
The Board of Trustees has adopted a distribution plan for certain share classes pursuant to Rule 12b-1 of the Investment Company Act of 1940.
The fund's distribution plan provides that the fund will pay MFD for services provided by MFD and financial intermediaries in connection with the distribution and servicing of certain share classes. One component of the plan is a distribution fee paid to MFD and another component of the plan is a service fee paid to MFD. MFD may subsequently pay all, or a portion, of the distribution and/or service fees to financial intermediaries. The distribution and service fees are computed daily and paid monthly.
Distribution Plan Fee Table:
| | Distribution
Fee Rate (d) | Service
Fee Rate (d) | Total
Distribution
Plan (d) | Annual
Effective
Rate (e) | Distribution
and Service
Fee |
| Class A | — | 0.25% | 0.25% | 0.15% | $ 2,424,645 |
| Class B | 0.75% | 0.25% | 1.00% | 0.90% | 13,012 |
| Class C | 0.75% | 0.25% | 1.00% | 1.00% | 230,857 |
| Class R1 | 0.75% | 0.25% | 1.00% | 1.00% | 4,747 |
| Class R2 | 0.25% | 0.25% | 0.50% | 0.40% | 5,617 |
| Class R3 | — | 0.25% | 0.25% | 0.25% | 2,007 |
| Total Distribution and Service Fees | | | | | $2,680,885 |
| (d) | In accordance with the distribution plan for certain classes, the fund pays distribution and/or service fees equal to these annual percentage rates of each class’s average daily net assets. The distribution and service fee rates disclosed by class represent the current rates in effect at the end of the reporting period. Any rate changes, if applicable, are detailed below. |
| (e) | The annual effective rates represent actual fees incurred under the distribution plan for the year ended April 30, 2024, based on each class’s average daily net assets. 0.10% of the Class A and Class B service fee is currently being waived under a written waiver agreement. For the year ended April 30, 2024, this waiver amounted to $969,849 and $1,303 for Class A and Class B shares, respectively, and is included in the reduction of total expenses |
Notes to Financial Statements - continued
in the Statement of Operations. This written waiver agreement will continue until modified by the fund’s Board of Trustees, but such agreement will continue at least until August 31, 2024. 0.10% of the Class R2 distribution fee is currently being waived under a written waiver agreement. For the year ended April 30, 2024, this waiver amounted to $1,123 and is included in the reduction of total expenses in the Statement of Operations. This written waiver agreement will continue until modified by the fund’s Board of Trustees, but such agreement will continue at least until August 31, 2024. MFD has voluntarily agreed to rebate a portion of each class’s 0.25% service fee attributable to accounts for which there is no financial intermediary specified on the account except for accounts attributable to MFS or its affiliates’ seed money. For the year ended April 30, 2024, this rebate amounted to $194 for Class A shares and is included in the reduction of total expenses in the Statement of Operations.
Certain Class A shares are subject to a contingent deferred sales charge (CDSC) in the event of a shareholder redemption within 18 months of purchase. Class B shares are subject to a CDSC in the event of a shareholder redemption within six years of purchase. Class C shares are subject to a CDSC in the event of a shareholder redemption within 12 months of purchase. All contingent deferred sales charges are paid to MFD and during the year ended April 30, 2024, were as follows:
| | Amount |
| Class A | $41,696 |
| Class B | 475 |
| Class C | 3,633 |
Shareholder Servicing Agent — MFS Service Center, Inc. (MFSC), a wholly-owned subsidiary of MFS, receives a fee from the fund for its services as shareholder servicing agent calculated as a percentage of the average daily net assets of the fund as determined periodically under the supervision of the fund's Board of Trustees. For the year ended April 30, 2024, the fee was $167,089, which equated to 0.0060% annually of the fund's average daily net assets. MFSC also receives reimbursement from the fund for out-of-pocket expenses, sub-accounting and other shareholder servicing costs which may be paid to affiliated and unaffiliated service providers. Class R6 shares do not incur sub-accounting fees. For the year ended April 30, 2024, these out-of-pocket expenses, sub-accounting and other shareholder servicing costs amounted to $1,208,476.
Administrator — MFS provides certain financial, legal, shareholder communications, compliance, and other administrative services to the fund. Under an administrative services agreement, the fund reimburses MFS the costs incurred to provide these services. The fund is charged an annual fixed amount of $17,500 plus a fee based on average daily net assets. The administrative services fee is computed daily and paid monthly. The administrative services fee incurred for the year ended April 30, 2024 was equivalent to an annual effective rate of 0.0146% of the fund's average daily net assets.
Trustees’ and Officers’ Compensation — The fund pays compensation to independent Trustees in the form of a retainer, attendance fees, and additional compensation to Board and Committee chairpersons. Independent Trustees’ compensation is accrued daily and paid subsequent to each Trustee Board meeting. The fund does not pay compensation directly to Trustees or officers of the fund who are also officers of the investment adviser, all of whom receive remuneration from MFS for their services to the fund. Certain officers and Trustees of the fund are officers or directors of MFS, MFD, and MFSC.
Notes to Financial Statements - continued
Other — The fund invests in the MFS Institutional Money Market Portfolio which is managed by MFS and seeks current income consistent with preservation of capital and liquidity. This money market fund does not pay a management fee to MFS but does incur investment and operating costs.
On August 3, 2022, MFS redeemed 11 shares of Class R6 for an aggregate amount of $63.
(4) Portfolio Securities
For the year ended April 30, 2024, purchases and sales of investments, other than short-term obligations, were as follows:
| | Purchases | Sales |
| U.S. Government securities | $1,274,236,194 | $1,127,149,154 |
| Non-U.S. Government securities | 535,740,656 | 888,137,395 |
(5) Shares of Beneficial Interest
The fund's Declaration of Trust permits the Trustees to issue an unlimited number of full and fractional shares of beneficial interest. Transactions in fund shares were as follows:
| | Year ended
4/30/24 | | Year ended
4/30/23 |
| | Shares | Amount | | Shares | Amount |
| Shares sold | | | | | |
| Class A | 44,319,398 | $253,725,089 | | 72,153,223 | $411,965,008 |
| Class B | 26,405 | 150,240 | | 55,836 | 316,341 |
| Class C | 1,231,274 | 7,062,677 | | 1,971,499 | 11,255,420 |
| Class I | 45,970,918 | 262,028,830 | | 73,321,138 | 415,905,432 |
| Class R1 | 16,671 | 94,651 | | 3,851 | 21,916 |
| Class R2 | 35,850 | 204,960 | | 14,560 | 83,153 |
| Class R3 | 72,553 | 413,496 | | 33,920 | 193,944 |
| Class R4 | 174,935 | 1,008,246 | | 30,792 | 175,900 |
| Class R6 | 52,251,549 | 298,799,080 | | 113,492,676 | 650,016,899 |
| Class 529A | — | — | | 272,247 | 1,579,104 |
| | 144,099,553 | $823,487,269 | | 261,349,742 | $1,491,513,117 |
Notes to Financial Statements - continued
| | Year ended
4/30/24 | | Year ended
4/30/23 |
| | Shares | Amount | | Shares | Amount |
Shares issued to shareholders
in reinvestment of distributions | | | | | |
| Class A | 6,432,166 | $36,848,095 | | 4,349,462 | $24,789,017 |
| Class B | 7,031 | 40,183 | | 5,686 | 32,316 |
| Class C | 107,470 | 615,446 | | 71,228 | 405,448 |
| Class I | 3,402,752 | 19,412,827 | | 2,251,266 | 12,771,677 |
| Class R1 | 2,530 | 14,440 | | 1,422 | 8,080 |
| Class R2 | 7,021 | 40,255 | | 4,902 | 27,947 |
| Class R3 | 5,207 | 29,841 | | 3,049 | 17,382 |
| Class R4 | 8,369 | 48,117 | | 4,319 | 24,694 |
| Class R6 | 9,186,711 | 52,518,082 | | 5,886,069 | 33,458,996 |
| Class 529A | — | — | | 39,556 | 229,822 |
| | 19,159,257 | $109,567,286 | | 12,616,959 | $71,765,379 |
| Shares reacquired | | | | | |
| Class A | (65,622,383) | $(375,813,663) | | (79,137,216) | $(451,526,635) |
| Class B | (159,910) | (911,977) | | (178,998) | (1,014,815) |
| Class C | (2,171,628) | (12,422,015) | | (2,858,691) | (16,287,951) |
| Class I | (66,390,813) | (378,241,601) | | (64,871,036) | (368,040,935) |
| Class R1 | (13,391) | (76,091) | | (141,992) | (812,046) |
| Class R2 | (68,475) | (392,510) | | (102,733) | (586,423) |
| Class R3 | (71,800) | (416,369) | | (105,891) | (603,851) |
| Class R4 | (112,703) | (649,409) | | (10,292) | (58,807) |
| Class R6 | (60,556,870) | (345,764,521) | | (85,757,860) | (488,492,469) |
| Class 529A | — | — | | (46,590,587) | (269,848,737) |
| | (195,167,973) | $(1,114,688,156) | | (279,755,296) | $(1,597,272,669) |
| Net change | | | | | |
| Class A | (14,870,819) | $(85,240,479) | | (2,634,531) | $(14,772,610) |
| Class B | (126,474) | (721,554) | | (117,476) | (666,158) |
| Class C | (832,884) | (4,743,892) | | (815,964) | (4,627,083) |
| Class I | (17,017,143) | (96,799,944) | | 10,701,368 | 60,636,174 |
| Class R1 | 5,810 | 33,000 | | (136,719) | (782,050) |
| Class R2 | (25,604) | (147,295) | | (83,271) | (475,323) |
| Class R3 | 5,960 | 26,968 | | (68,922) | (392,525) |
| Class R4 | 70,601 | 406,954 | | 24,819 | 141,787 |
| Class R6 | 881,390 | 5,552,641 | | 33,620,885 | 194,983,426 |
| Class 529A | — | — | | (46,278,784) | (268,039,811) |
| | (31,909,163) | $(181,633,601) | | (5,788,595) | $(33,994,173) |
Notes to Financial Statements - continued
The fund is one of several mutual funds in which certain MFS funds may invest. The MFS funds do not invest in the underlying funds for the purpose of exercising management or control. At the end of the period, the MFS Conservative Allocation Fund, the MFS Lifetime Income Fund, the MFS Lifetime 2025 Fund, and the MFS Lifetime 2030 Fund were the owners of record of approximately 13%, 5%, 2%, and 2%, respectively, of the value of outstanding voting shares of the fund.
Effective May 1, 2006, purchases of the fund's Class B shares were closed to new and existing investors subject to certain exceptions. Effective after the close of business on May 13, 2022, all sales and redemptions of Class 529A shares were suspended, and all Class 529A shares were redeemed on May 20, 2022. Effective September 29, 2023, purchases of the fund's Class R1 and Class R2 shares were closed to new eligible investors.
(6) Line of Credit
The fund and certain other funds managed by MFS participate in a $1.45 billion unsecured committed line of credit of which $1.2 billion is reserved for use by the fund and certain other MFS U.S. funds. The line of credit is provided by a syndicate of banks under a credit agreement. Borrowings may be made for temporary financing needs. Interest is charged to each fund, based on its borrowings, generally at a rate equal to the highest of 1) Daily Simple SOFR (Secured Overnight Financing Rate) plus 0.10%, 2) the Federal Funds Effective Rate, or 3) the Overnight Bank Funding Rate, each plus an agreed upon spread. A commitment fee, based on the average daily unused portion of the committed line of credit, is allocated among the participating funds. The line of credit expires on March 13, 2025 unless extended or renewed. In addition, the fund and other funds managed by MFS have established unsecured uncommitted borrowing arrangements with certain banks for temporary financing needs. Interest is charged to each fund, based on its borrowings, at rates equal to customary reference rates plus an agreed upon spread. For the year ended April 30, 2024, the fund’s commitment fee and interest expense were $15,296 and $0, respectively, and are included in “Miscellaneous” expense in the Statement of Operations.
(7) Investments in Affiliated Issuers
An affiliated issuer may be considered one in which the fund owns 5% or more of the outstanding voting securities, or a company which is under common control. For the purposes of this report, the following were affiliated issuers:
| Affiliated Issuers | Beginning
Value | Purchases | Sales
Proceeds | Realized
Gain
(Loss) | Change in
Unrealized
Appreciation or
Depreciation | Ending
Value |
| MFS Institutional Money Market Portfolio | $45,501,380 | $827,060,854 | $813,815,335 | $10,018 | $(8,978) | $58,747,939 |
| Affiliated Issuers | Dividend
Income | Capital Gain
Distributions |
| MFS Institutional Money Market Portfolio | $2,511,231 | $— |
Report of Independent Registered Public Accounting Firm
To the Board of Trustees of MFS Series Trust IX and the Shareholders of
MFS Limited Maturity Fund:
Opinion on the Financial Statements and Financial Highlights
We have audited the accompanying statement of assets and liabilities of MFS Limited Maturity Fund (the “Fund”), including the portfolio of investments, as of April 30, 2024, the related statement of operations for the year then ended, the statements of changes in net assets for each of the two years in the period then ended, the financial highlights for each of the five years in the period then ended, and the related notes. In our opinion, the financial statements and financial highlights present fairly, in all material respects, the financial position of the Fund as of April 30, 2024, and the results of its operations for the year then ended, the changes in its net assets for each of the two years in the period then ended, and the financial highlights for each of the five years in the period then ended, in conformity with accounting principles generally accepted in the United States of America.
Basis for Opinion
These financial statements and financial highlights are the responsibility of the Fund’s management. Our responsibility is to express an opinion on the Fund's financial statements and financial highlights based on our audits. We are a public accounting firm registered with the Public Company Accounting Oversight Board (United States) (PCAOB) and are required to be independent with respect to the Fund in accordance with the U.S. federal securities laws and the applicable rules and regulations of the Securities and Exchange Commission and the PCAOB.
We conducted our audits in accordance with the standards of the PCAOB. Those standards require that we plan and perform the audit to obtain reasonable assurance about whether the financial statements and financial highlights are free of material misstatement, whether due to error or fraud. The Fund is not required to have, nor were we engaged to perform, an audit of its internal control over financial reporting. As part of our audits we are required to obtain an understanding of internal control over financial reporting but not for the purpose of expressing an opinion on the effectiveness of the Fund's internal control over financial reporting. Accordingly, we express no such opinion.
Our audits included performing procedures to assess the risks of material misstatement of the financial statements and financial highlights, whether due to error or fraud, and performing procedures that respond to those risks. Such procedures included examining, on a test basis, evidence regarding the amounts and disclosures in the financial statements and financial highlights. Our audits also included evaluating the accounting principles used and significant estimates made by management, as well as evaluating the overall presentation of the financial statements and financial highlights.
Report of Independent Registered Public Accounting Firm – continued
Our procedures included confirmation of securities owned as of April 30, 2024, by correspondence with the custodian and brokers; when replies were not received from brokers, we performed other auditing procedures. We believe that our audits provide a reasonable basis for our opinion.
DELOITTE & TOUCHE LLP
Boston, Massachusetts
June 20, 2024
We have served as the auditor of one or more of the MFS investment companies since 1924.
Trustees and Officers — Identification and Background
The Trustees and Officers of the Trust, as of June 1, 2024, are listed below, together with their principal occupations during the past five years. (Their titles may have varied during that period.) The address of each Trustee and Officer is 111 Huntington Avenue, Boston, Massachusetts 02199-7618.
| Name, Age | | Position(s) Held with Fund | | Trustee/Officer Since(h) | | Number of MFS Funds overseen by the Trustee | | Principal Occupations During
the Past Five Years | | Other Directorships During
the Past Five Years (j) |
| INTERESTED TRUSTEE | | | | | | | | | | |
Michael W. Roberge (k)
(age 57) | | Trustee | | January 2021 | | 135 | | Massachusetts Financial Services Company, Chairman (since January 2021); Chief Executive Officer (since January 2017); Director; Chairman of the Board (since January 2022) | | N/A |
| INDEPENDENT TRUSTEES | | | | | | | | | | |
John P. Kavanaugh
(age 69) | | Trustee and Chair of Trustees | | January 2009 | | 135 | | Private investor | | N/A |
Steven E. Buller
(age 72) | | Trustee | | February 2014 | | 135 | | Private investor | | N/A |
John A. Caroselli
(age 69) | | Trustee | | March 2017 | | 135 | | Private investor; JC Global Advisors, LLC (management consulting), President (since 2015) | | N/A |
Maureen R. Goldfarb
(age 69) | | Trustee | | January 2009 | | 135 | | Private investor | | N/A |
Peter D. Jones
(age 68) | | Trustee | | January 2019 | | 135 | | Private investor | | N/A |
James W. Kilman, Jr.
(age 63) | | Trustee | | January 2019 | | 135 | | Burford Capital Limited (finance and investment management), Senior Advisor (since May 3, 2021), Chief Financial Officer (2019 - May 2, 2021); KielStrand Capital LLC (family office), Chief Executive Officer (since 2016) | | Alpha-En Corporation, Director (2016-2019) |
Trustees and Officers - continued
| Name, Age | | Position(s) Held with Fund | | Trustee/Officer Since(h) | | Number of MFS Funds overseen by the Trustee | | Principal Occupations During
the Past Five Years | | Other Directorships During
the Past Five Years (j) |
Clarence Otis, Jr.
(age 68) | | Trustee | | March 2017 | | 135 | | Private investor | | VF Corporation, Director; Verizon Communications, Inc., Director; The Travelers Companies, Director |
Maryanne L. Roepke
(age 68) | | Trustee | | May 2014 | | 135 | | Private investor | | N/A |
Laurie J. Thomsen
(age 66) | | Trustee | | March 2005 | | 135 | | Private investor | | The Travelers Companies, Director; Dycom Industries, Inc., Director |
| Name, Age | | Position(s) Held with
Fund | | Trustee/Officer Since(h) | | Number of MFS Funds for which the Person is an Officer | | Principal Occupations During
the Past Five Years |
| OFFICERS | | | | | | | | |
William T. Allen (k)
(age 57) | | Deputy Assistant Treasurer | | April 2024 | | 135 | | Massachusetts Financial Services Company, Vice President |
Brian Balasco (k)
(age 46) | | Assistant Treasurer | | April 2024 | | 135 | | Massachusetts Financial Services Company, Vice President |
Christopher R. Bohane (k)
(age 50) | | Assistant Secretary and Assistant Clerk | | July 2005 | | 135 | | Massachusetts Financial Services Company, Senior Vice President and Deputy General Counsel |
James L. Byrne (k)
(age 48) | | Assistant Treasurer | | April 2024 | | 135 | | Massachusetts Financial Services Company, Vice President |
John W. Clark, Jr. (k)
(age 57) | | Deputy Treasurer | | April 2017 | | 135 | | Massachusetts Financial Services Company, Vice President |
David L. DiLorenzo (k)
(age 55) | | President | | July 2005 | | 135 | | Massachusetts Financial Services Company, Senior Vice President |
Heidi W. Hardin (k)
(age 56) | | Secretary and Clerk | | April 2017 | | 135 | | Massachusetts Financial Services Company, Executive Vice President and General Counsel |
Brian E. Langenfeld (k)
(age 51) | | Assistant Secretary and Assistant Clerk | | June 2006 | | 135 | | Massachusetts Financial Services Company, Vice President and Managing Counsel |
Trustees and Officers - continued
| Name, Age | | Position(s) Held with
Fund | | Trustee/Officer Since(h) | | Number of MFS Funds for which the Person is an Officer | | Principal Occupations During
the Past Five Years |
Rosa E. Licea-Mailloux (k)
(age 47) | | Chief Compliance Officer | | March 2022 | | 135 | | Massachusetts Financial Services Company, Vice President (since 2018); Director of Corporate Compliance (2018-2021), Senior Director Compliance (2021-2022), Senior Managing Director of North American Compliance & Chief Compliance Officer (since March 2022) |
Amanda S. Mooradian (k)
(age 45) | | Assistant Secretary and Assistant Clerk | | September 2018 | | 135 | | Massachusetts Financial Services Company, Vice President and Senior Counsel |
Susan A. Pereira (k)
(age 53) | | Assistant Secretary and Assistant Clerk | | July 2005 | | 135 | | Massachusetts Financial Services Company, Vice President and Managing Counsel |
Kasey L. Phillips (k)
(age 53) | | Treasurer | | September 2012 | | 135 | | Massachusetts Financial Services Company, Vice President |
Matthew A. Stowe (k)
(age 49) | | Assistant Secretary and Assistant Clerk | | October 2014 | | 135 | | Massachusetts Financial Services Company, Vice President and Senior Managing Counsel |
William B. Wilson (k)
(age 41) | | Assistant Secretary and Assistant Clerk | | October 2022 | | 135 | | Massachusetts Financial Services Company, Assistant Vice President and Senior Counsel |
| (h) | Date first appointed to serve as Trustee/Officer of an MFS Fund. Each Trustee has served continuously since appointment unless indicated otherwise. From January 2012 through December 2016, Mr. DiLorenzo served as Treasurer and of the Funds. From September 2012 through March 2024, Ms. Phillips served as Assistant Treasurer of the Funds. From April 2017 through March 2024, Mr. Clark served as Assistant Treasurer of the Funds. |
| (j) | Directorships or trusteeships of companies required to report to the Securities and Exchange Commission (i.e., “public companies”). |
| (k) | “Interested person” of the Trust within the meaning of the Investment Company Act of 1940 (referred to as the 1940 Act), which is the principal federal law governing investment companies like the fund, as a result of a position with MFS. The address of MFS is 111 Huntington Avenue, Boston, Massachusetts 02199-7618. |
Each Trustee (other than Messrs. Jones, Kilman and Roberge) has been elected by shareholders and each Trustee and Officer holds office until his or her successor is chosen and qualified or until his or her earlier death, resignation, retirement or removal. Mr. Roberge became a Trustee of the Funds on January 1, 2021 and Messrs. Jones and Kilman became Trustees of the Funds on January 1, 2019. The Trust does not hold annual meetings for the purpose of electing Trustees, and Trustees are not elected for fixed terms. Under the terms of the Board's retirement policy, an Independent Trustee
Trustees and Officers - continued
shall retire at the end of the calendar year in which he or she reaches the earlier of 75 years of age or 15 years of service on the Board (or, in the case of any Independent Trustee who joined the Board prior to 2015, 20 years of service on the Board).
Messrs. Buller, Caroselli, Jones and Otis are members of the Trust’s Audit Committee.
Each of the Interested Trustees and certain Officers hold comparable officer positions with certain affiliates of MFS.
| Investment Adviser | Custodian |
Massachusetts Financial Services Company
111 Huntington Avenue
Boston, MA 02199-7618 | JPMorgan Chase Bank, NA
4 Metrotech Center
New York, NY 11245 |
| Distributor | Independent Registered Public Accounting Firm |
MFS Fund Distributors, Inc.
111 Huntington Avenue
Boston, MA 02199-7618 | Deloitte & Touche LLP
200 Berkeley Street
Boston, MA 02116 |
| Portfolio Manager(s) | |
Philipp Burgener
Alexander Mackey | |
Statement Regarding Liquidity Risk Management Program
The fund has adopted and implemented a liquidity risk management program (the “Program”) as required by Rule 22e-4 under the Investment Company Act of 1940, as amended. The fund’s Board of Trustees (the “Board”) has designated MFS as the administrator of the Program. The Program is reasonably designed to assess and manage the liquidity risk of the fund. Liquidity risk is the risk that the fund could not meet requests to redeem shares issued by the fund without significant dilution of remaining investors' interests.
MFS provided a written report to the Board for consideration at its March 2024 meeting that addressed the operation of the Program and provided an assessment of the adequacy and effectiveness of the Program during the period from January 1, 2023 to December 31, 2023 (the “Covered Period”). The report concluded that during the Covered Period the Program had operated effectively in all material respects and had adequately and effectively been implemented to assess and manage the fund’s liquidity risk. MFS also reported that there were no liquidity events that impacted the fund or its ability to timely meet redemptions without dilution to existing shareholders during the Covered Period.
There can be no assurance that the Program will achieve its objectives in the future. Further information on liquidity risk, and other principal risks to which an investment in the fund may be subject, can be found in the prospectus.
Proxy Voting Policies and Information
MFS votes proxies on behalf of the fund pursuant to proxy voting policies and procedures that are available without charge, upon request, by calling 1-800-225-2606, by visiting mfs.com/proxyvoting, or by visiting the SEC’s Web site at http://www.sec.gov.
Information regarding how the fund voted proxies relating to portfolio securities during the most recent twelve-month period ended June 30 is available by August 31 of each year without charge by visiting mfs.com/proxyvoting, or by visiting the SEC’s Web site at http://www.sec.gov.
Quarterly Portfolio Disclosure
The fund files a complete schedule of portfolio holdings with the SEC for the first and third quarters of each fiscal year as an exhibit to its reports on Form N-PORT. The fund's Form N-PORT reports are available on the SEC's Web site at http://www.sec.gov. A shareholder can obtain the portfolio holdings report for the first and third quarters of the fund's fiscal year at mfs.com/openendfunds by choosing the fund's name and then scrolling to the “Resources” section and clicking on the “Shareholder Reports” tab.
Further Information
From time to time, MFS may post important information about the fund or the MFS Funds on the MFS Web site (mfs.com). This information is available at https://www.mfs.com/announcements or at mfs.com/openendfunds by choosing the fund’s name and then scrolling to the “Resources” section and clicking on the “Announcements” tab, if any.
Information About Fund Contracts and Legal Claims
The fund has entered into contractual arrangements with an investment adviser, administrator, distributor, shareholder servicing agent, and custodian who each provide services to the fund. Unless expressly stated otherwise, shareholders are not parties to, or intended beneficiaries of these contractual arrangements, and these contractual arrangements are not intended to create any shareholder right to enforce them against the service providers or to seek any remedy under them against the service providers, either directly or on behalf of the fund.
Under the Trust’s By-Laws and Declaration of Trust, any claims asserted against or on behalf of the MFS Funds, including claims against Trustees and Officers, must be brought in state and federal courts located within the Commonwealth of Massachusetts.
Federal Tax Information (unaudited)
The fund will notify shareholders of amounts for use in preparing 2024 income tax forms in January 2025. The following information is provided pursuant to provisions of the Internal Revenue Code.
The fund intends to pass through the maximum amount allowable as Section 163(j) Interest Dividends as defined in Treasury Regulation §1.163(j)-1(b).
| FACTS | WHAT DOES MFS DO WITH YOUR PERSONAL INFORMATION? |
| Why? | Financial companies choose how they share your personal information. Federal law gives consumers the right to limit some but not all sharing. Federal law also requires us to tell you how we collect, share, and protect your personal information. Please read this notice carefully to understand what we do. |
| What? | The types of personal information we collect and share depend on the product or service you have with us. This information can include: |
| • Social Security number and account balances |
| • Account transactions and transaction history |
| • Checking account information and wire transfer instructions |
| When you are no longer our customer, we continue to share your information as described in this notice. |
| How? | All financial companies need to share customers' personal information to run their everyday business. In the section below, we list the reasons financial companies can share their customers' personal information; the reasons MFS chooses to share; and whether you can limit this sharing. |
Reasons we can share your
personal information | Does MFS share? | Can you limit
this sharing? |
For our everyday business purposes –
such as to process your transactions, maintain your
account(s), respond to court orders and legal
investigations, or report to credit bureaus | Yes | No |
For our marketing purposes –
to offer our products and services to you | No | We don't share |
For joint marketing with other
financial companies | No | We don't share |
For our affiliates' everyday business purposes –
information about your transactions and experiences | No | We don't share |
For our affiliates' everyday business purposes –
information about your creditworthiness | No | We don't share |
| For nonaffiliates to market to you | No | We don't share |
| Questions? | Call 800-225-2606 or go to mfs.com. |
| Who we are |
| Who is providing this notice? | MFS Funds, MFS Investment Management, MFS Institutional Advisors, Inc., and MFS Heritage Trust Company. |
| What we do |
How does MFS
protect my personal
information? | To protect your personal information from unauthorized access and use, we use security measures that comply with federal law. These measures include procedural, electronic, and physical safeguards for the protection of the personal information we collect about you. |
How does MFS
collect my personal
information? | We collect your personal information, for example, when you |
| • open an account or provide account information |
| • direct us to buy securities or direct us to sell your securities |
| • make a wire transfer |
| We also collect your personal information from others, such as credit bureaus, affiliates, or other companies. |
| Why can't I limit all sharing? | Federal law gives you the right to limit only |
| • sharing for affiliates' everyday business purposes – information about your creditworthiness |
| • affiliates from using your information to market to you |
| • sharing for nonaffiliates to market to you |
| State laws and individual companies may give you additional rights to limit sharing. |
| Definitions |
| Affiliates | Companies related by common ownership or control. They can be financial and nonfinancial companies. |
| • MFS does not share personal information with affiliates, except for everyday business purposes as described on page one of this notice. |
| Nonaffiliates | Companies not related by common ownership or control. They can be financial and nonfinancial companies. |
| • MFS does not share with nonaffiliates so they can market to you. |
| Joint marketing | A formal agreement between nonaffiliated financial companies that together market financial products or services to you. |
| • MFS doesn't jointly market. |
| Other important information |
| If you own an MFS product or receive an MFS service in the name of a third party such as a bank or broker-dealer, their privacy policy may apply to you instead of ours. |
Save paper with eDelivery.
MFS® will send you prospectuses, reports, and proxies directly via e-mail so you will get information faster with less mailbox clutter.
To sign up:
1. Go to mfs.com.
2. Log in via MFS® Access.
3. Select eDelivery.
If you own your MFS fund shares through a financial institution or a retirement plan, MFS® TALK, MFS® Access, or eDelivery may not be available to you.
CONTACT
WEB SITE
mfs.com
MFS TALK
1-800-637-8255
24 hours a day
ACCOUNT SERVICE AND LITERATURE
Shareholders
1-800-225-2606
Financial advisors
1-800-343-2829
Retirement plan services
1-800-637-1255
MAILING ADDRESS
MFS Service Center, Inc.
P.O. Box 219341
Kansas City, MO 64121-9341
OVERNIGHT MAIL
MFS Service Center, Inc.
Suite 219341
430 W 7th Street
Kansas City, MO 64105-1407
Annual Report
April 30, 2024
MFS® Municipal Limited
Maturity Fund
MFS® Municipal Limited
Maturity Fund
| 1 |
| 3 |
| 5 |
| 8 |
| 10 |
| 80 |
| 82 |
| 83 |
| 84 |
| 88 |
| 99 |
| 101 |
| 105 |
| 106 |
| 106 |
| 106 |
| 106 |
| 106 |
| 107 |
The report is prepared for the general information of shareholders. It is authorized for distribution to prospective investors only when preceded or accompanied by a current prospectus.
NOT FDIC INSURED • MAY LOSE VALUE • NO BANK GUARANTEE
Portfolio structure (i)
Top ten industries (i)
| Healthcare Revenue - Hospitals | 11.3% |
| Utilities - Other | 10.7% |
| Multi-family Housing | 10.7% |
| Municipal Student Loans | 9.0% |
| Airport Revenue | 8.1% |
| Investor Owned Utilities | 7.7% |
| General Obligations - Schools | 4.9% |
| Single Family Housing - State | 4.6% |
| General Obligations - General Purpose | 3.8% |
| Miscellaneous Revenue - Other | 3.1% |
Composition including fixed income credit quality (a)(i)
| AAA | 9.9% |
| AA | 22.8% |
| A | 37.2% |
| BBB | 18.9% |
| BB | 5.5% |
| B | 0.1% |
| CCC | 0.4% |
| CC (o) | 0.0% |
| C (o) | 0.0% |
| Not Rated | 4.8% |
| Cash & Cash Equivalents | 0.4% |
Portfolio facts
| Average Duration (d) | 3.2 |
| Average Effective Maturity (m) | 4.4 yrs. |
| (a) | For all securities other than those specifically described below, ratings are assigned to underlying securities utilizing ratings from Moody’s, Fitch, and Standard & Poor’s rating agencies and applying the following hierarchy: If all three agencies provide a rating, the middle rating (after dropping the highest and lowest ratings) is assigned; if two of the three agencies rate a security, the lower of the two is assigned. If none of the 3 rating agencies above assign a rating, but the security is rated by DBRS Morningstar, then the DBRS Morningstar rating is assigned. If none of the 4 rating agencies listed above rate the security, but the security is rated by the Kroll Bond Rating Agency (KBRA), then the KBRA rating is assigned. Ratings are shown in the S&P and Fitch scale (e.g., AAA). Securities rated BBB or higher are considered investment grade. All ratings are subject to change. Not Rated includes fixed income securities and fixed income derivatives that have not been rated by any rating agency. The fund may or may not have held all of these instruments on this date. The fund is not rated by these agencies. |
Portfolio Composition - continued
| (d) | Duration is a measure of how much a bond’s price is likely to fluctuate with general changes in interest rates, e.g., if rates rise 1.00%, a bond with a 5-year duration is likely to lose about 5.00% of its value due to the interest rate move. The Average Duration calculation reflects the impact of the equivalent exposure of derivative positions, if any. |
| (i) | For purposes of this presentation, the components include the value of securities, and reflect the impact of the equivalent exposure of derivative positions, if any. These amounts may be negative from time to time. Equivalent exposure is a calculated amount that translates the derivative position into a reasonable approximation of the amount of the underlying asset that the portfolio would have to hold at a given point in time to have the same price sensitivity that results from the portfolio’s ownership of the derivative contract. When dealing with derivatives, equivalent exposure is a more representative measure of the potential impact of a position on portfolio performance than value. The bond component will include any accrued interest amounts. |
| (m) | In determining each instrument’s effective maturity for purposes of calculating the fund’s dollar-weighted average effective maturity, MFS uses the instrument’s stated maturity or, if applicable, an earlier date on which MFS believes it is probable that a maturity-shortening feature (such as a put, pre-refunding or prepayment) will cause the instrument to be repaid. Such an earlier date can be substantially shorter than the instrument’s stated maturity. |
Cash & Cash Equivalents includes any cash, investments in money market funds, short-term securities, and other assets less liabilities. Please see the Statement of Assets and Liabilities for additional information related to the fund’s cash position and other assets and liabilities.
Percentages are based on net assets as of April 30, 2024.
The portfolio is actively managed and current holdings may be different.
Management Review
Summary of Results
For the twelve months ended April 30, 2024, Class A shares of the MFS Municipal Limited Maturity Fund (fund) provided a total return of 2.86% at net asset value. This compares with a return of 1.72% for the fund’s benchmark, the Bloomberg 1-9 Year Municipal Bond Index.
Market Environment
In response to the strongest inflationary period in four decades, global central banks tightened monetary policy significantly during the reporting period, helping reduce price pressures, although more work is needed before inflation returns to target. Geopolitical strains remained high amid ongoing conflicts in Ukraine and in the Middle East, while relations between China and the US remained tense. The US sought to restrict the flow of advanced technologies to China and China looked to use its industrial overcapacity to increase exports to developed markets to bolster its slow-growing domestic economy. The conflict in the Middle East caused trade flow disruptions between Asia and Europe as shipping traffic was routed away from the Red Sea.
Although inflation has yet to reach central banks’ targets, policymakers have indicated their desire to begin cutting rates in the months ahead, although stickier-than-expected inflation could delay cuts in the US. The prospects for easier monetary policy along with resilient global economic growth have been supportive factors for risky assets, such as equities and high-yield bonds. Long-term interest rates moderated during the latter half of the reporting period, although rising government debt levels remained a concern over the medium term. Advancements in artificial intelligence and the adoption of novel weight-loss drugs were two areas of focus for investors during the period.
Amid this eventful backdrop, the investment grade municipal market generated positive returns over the period. Securities in the lower-rated investment grade credit quality tiers and bonds with very short (<2 years) and very long maturities (> 15 years) outperformed. Yields rose across the tax-exempt municipal curve, most notably in the short (within one year) segment. A positive for income-oriented investors, the yield (yield-to-worst) on the index for this fund ended the period at 3.42%, well above its five-year average.
Factors Affecting Performance
Relative to the Bloomberg 1-9 Year Municipal Bond Index, the fund’s asset allocation decisions contributed to performance. From a quality perspective, exposure to both non-rated(r) and “BB” rated bonds, for which the benchmark has no exposure, and the fund’s overweight allocation to “BBB” rated bonds strengthened relative returns. From a sector perspective, an overweight allocation to the industrial revenue sector also helped relative returns. Security selection within the housing sector coupled with the fund’s short duration(d) positioning over the reporting period also strengthened relative performance.
Conversely, security selection within the industrial revenue sector detracted from the fund’s relative performance. Unfavorable security selection within “BBB” rated bonds also weakened relative results.
Management Review - continued
Respectfully,
Portfolio Manager(s)
Michael Dawson, Jason Kosty, Megan Poplowski, and Geoffrey Schechter
Note to Shareholders: Effective September 30, 2025, Geoffrey Schechter will no longer be a Portfolio Manager of the fund.
| (d) | Duration is a measure of how much a bond’s price is likely to fluctuate with general changes in interest rates, e.g., if rates rise 1.00%, a bond with a 5-year duration is likely to lose about 5.00% of its value. |
| (r) | Securities rated “BBB”, “Baa”, or higher are considered investment grade; securities rated “BB”, “Ba”, or below are considered non-investment grade. Ratings are assigned to underlying securities utilizing ratings from Moody's, Fitch, and Standard & Poor's and applying the following hierarchy: If all three agencies provide a rating, the middle rating (after dropping the highest and lowest ratings) is assigned; if two of the three agencies rate a security, the lower of the two is assigned. If none of the 3 rating agencies above assign a rating, but the security is rated by DBRS Morningstar, then the DBRS Morningstar rating is assigned. If none of the 4 rating agencies listed above rate the security, but the security is rated by the Kroll Bond Rating Agency (KBRA), then the KBRA rating is assigned. Ratings are shown in the S&P and Fitch scale (e.g., AAA). For securities that are not rated by any of the rating agencies, the security is considered Not Rated. |
The views expressed in this report are those of the portfolio manager(s) only through the end of the period of the report as stated on the cover and do not necessarily reflect the views of MFS or any other person in the MFS organization. These views are subject to change at any time based on market or other conditions, and MFS disclaims any responsibility to update such views. These views may not be relied upon as investment advice or an indication of trading intent on behalf of any MFS portfolio. References to specific securities are not recommendations of such securities, and may not be representative of any MFS portfolio’s current or future investments.
Performance Summary THROUGH 4/30/24
The following chart illustrates a representative class of the fund’s historical performance in comparison to its benchmark(s). Performance results include the deduction of the maximum applicable sales charge and reflect the percentage change in net asset value, including reinvestment of dividends and capital gains distributions. The performance of other share classes will be greater than or less than that of the class depicted below. Benchmarks are unmanaged and may not be invested in directly. Benchmark returns do not reflect sales charges, commissions or expenses. (See Notes to Performance Summary.)
Performance data shown represents past performance and is no guarantee of future results. Investment return and principal value fluctuate so your shares, when sold, may be worth more or less than the original cost; current performance may be lower or higher than quoted. The performance shown does not reflect the deduction of taxes, if any, that a shareholder would pay on fund distributions or the redemption of fund shares.
Growth of a Hypothetical $10,000 Investment
Performance Summary - continued
Total Returns through 4/30/24
Average annual without sales charge
| Share Class | Class Inception Date | 1-yr | 5-yr | 10-yr | Life (t) |
| A | 3/17/1992 | 2.86% | 1.13% | 1.56% | N/A |
| B | 9/07/1993 | 2.11% | 0.38% | 0.81% | N/A |
| C | 7/01/1994 | 1.99% | 0.28% | 0.70% | N/A |
| I | 8/30/2010 | 3.01% | 1.28% | 1.71% | N/A |
| R6 | 9/01/2017 | 3.22% | 1.36% | N/A | 1.54% |
Comparative benchmark(s)
| | | | | |
| Bloomberg 1-9 Year Municipal Bond Index (f) | 1.72% | 1.14% | 1.56% | N/A |
Average annual with sales charge
| | | | | |
A
With Initial Sales Charge (2.50%) | 0.29% | 0.62% | 1.30% | N/A |
B
With CDSC (Declining over six years from 4% to 0%) (v) | (1.89)% | (0.00)% | 0.81% | N/A |
C
With CDSC (1% for 12 months) (v) | 0.99% | 0.28% | 0.70% | N/A |
CDSC – Contingent Deferred Sales Charge.
Class I and R6 shares do not have a sales charge.
| (f) | Source: FactSet Research Systems Inc. |
| (t) | For the period from the class inception date through the stated period end (for those share classes with less than 10 years of performance history). No comparative benchmark performance information is provided for “life” periods. (See Notes to Performance Summary.) |
| (v) | Assuming redemption at the end of the applicable period. |
Benchmark Definition(s)
Bloomberg 1-9 Year Municipal Bond Index(a) – a market capitalization-weighted index that measures the performance of the medium-term (1 to 9 years) tax-exempt bond market.
It is not possible to invest directly in an index.
| (a) | Source: Bloomberg Index Services Limited. BLOOMBERG® is a trademark and service mark of Bloomberg Finance L.P. and its affiliates (collectively “Bloomberg”). Bloomberg or Bloomberg's licensors own all proprietary rights in the Bloomberg Indices. Bloomberg neither approves or endorses this material, or guarantees the accuracy or completeness of any information herein, or makes any warranty, express or implied, as to the results to be obtained therefrom and, to the maximum extent allowed by law, neither shall have any liability or responsibility for injury or damages arising in connection therewith. |
Notes to Performance Summary
Average annual total return represents the average annual change in value for each share class for the periods presented. Life returns are presented where the share class has less than 10 years of performance history and represent the average annual total return from the class inception date to the stated period end date. As the fund's share
Performance Summary - continued
classes may have different inception dates, the life returns may represent different time periods and may not be comparable. As a result, no comparative benchmark performance information is provided for life periods.
Performance results reflect any applicable expense subsidies and waivers in effect during the periods shown. Without such subsidies and waivers the fund's performance results would be less favorable. Please see the prospectus and financial statements for complete details.
Performance results do not include adjustments made for financial reporting purposes in accordance with U.S. generally accepted accounting principles and may differ from amounts reported in the financial highlights.
A portion of the fund’s monthly distributions may be subject to state, federal, and/or alternative minimum tax. Capital gains, if any, are subject to a capital gains tax.
From time to time the fund may receive proceeds from litigation settlements, without which performance would be lower.
Expense Table
Fund expenses borne by the shareholders during the period,
November 1, 2023 through April 30, 2024
As a shareholder of the fund, you incur two types of costs: (1) transaction costs, including sales charges (loads) on certain purchase or redemption payments, and (2) ongoing costs, including management fees; distribution and service (12b-1) fees; and other fund expenses. This example is intended to help you understand your ongoing costs (in dollars) of investing in the fund and to compare these costs with the ongoing costs of investing in other mutual funds.
The example is based on an investment of $1,000 invested at the beginning of the period and held for the entire period November 1, 2023 through April 30, 2024.
Actual Expenses
The first line for each share class in the following table provides information about actual account values and actual expenses. You may use the information in this line, together with the amount you invested, to estimate the expenses that you paid over the period. Simply divide your account value by $1,000 (for example, an $8,600 account value divided by $1,000 = 8.6), then multiply the result by the number in the first line under the heading entitled “Expenses Paid During Period” to estimate the expenses you paid on your account during this period.
Hypothetical Example for Comparison Purposes
The second line for each share class in the following table provides information about hypothetical account values and hypothetical expenses based on the fund’s actual expense ratio and an assumed rate of return of 5% per year before expenses, which is not the fund’s actual return. The hypothetical account values and expenses may not be used to estimate the actual ending account balance or expenses you paid for the period. You may use this information to compare the ongoing costs of investing in the fund and other funds. To do so, compare this 5% hypothetical example with the 5% hypothetical examples that appear in the shareholder reports of the other funds.
Please note that the expenses shown in the table are meant to highlight your ongoing costs only and do not reflect any transactional costs, such as sales charges (loads). Therefore, the second line for each share class in the table is useful in comparing ongoing costs only, and will not help you determine the relative total costs of owning different funds. In addition, if these transactional costs were included, your costs would have been higher.
Expense Table - continued
Share
Class | | Annualized
Expense
Ratio | Beginning
Account Value
11/01/23 | Ending
Account Value
4/30/24 | Expenses
Paid During
Period (p)
11/01/23-4/30/24 |
| A | Actual | 0.58% | $1,000.00 | $1,041.44 | $2.94 |
| Hypothetical (h) | 0.58% | $1,000.00 | $1,021.98 | $2.92 |
| B | Actual | 1.33% | $1,000.00 | $1,037.76 | $6.74 |
| Hypothetical (h) | 1.33% | $1,000.00 | $1,018.25 | $6.67 |
| C | Actual | 1.43% | $1,000.00 | $1,037.08 | $7.24 |
| Hypothetical (h) | 1.43% | $1,000.00 | $1,017.75 | $7.17 |
| I | Actual | 0.43% | $1,000.00 | $1,042.24 | $2.18 |
| Hypothetical (h) | 0.43% | $1,000.00 | $1,022.73 | $2.16 |
| R6 | Actual | 0.36% | $1,000.00 | $1,043.95 | $1.83 |
| Hypothetical (h) | 0.36% | $1,000.00 | $1,023.07 | $1.81 |
| (h) | 5% class return per year before expenses. |
| (p) | “Expenses Paid During Period” are equal to each class’s annualized expense ratio, as shown above, multiplied by the average account value over the period, multiplied by 182/366 (to reflect the one-half year period). Expenses paid do not include any applicable sales charges (loads). If these transaction costs had been included, your costs would have been higher. |
Portfolio of Investments
4/30/24
The Portfolio of Investments is a complete list of all securities owned by your fund. It is categorized by jurisdiction.MFS Municipal Limited Maturity Fund
| Issuer | | | Shares/Par | Value ($) |
| Municipal Bonds - 97.6% |
| Alabama - 4.7% |
| Alabama Community College System, Board of Trustees Rev. (Wallace State Community College - Hanceville Rev.), BAM, 3.5%, 11/01/2026 | | $ | 1,245,000 | $1,234,992 |
| Alabama Housing Finance Authority, Multi-Family Housing Rev. (Maryvale Place Project), “F”, HUD Section 8, 4%, 10/01/2025 (Put Date 4/01/2025) | | | 4,645,000 | 4,622,009 |
| Alabama Port Authority Docks Facilities Refunding Rev., “A”, AGM, 5%, 10/01/2025 | | | 1,000,000 | 1,009,782 |
| Birmingham, AL, Airport Authority Rev., BAM, 5%, 7/01/2024 | | | 325,000 | 325,518 |
| Black Belt Energy Gas District, AL, Gas Prepay Rev., “A-1”, 4%, 12/01/2049 (Put Date 12/01/2025) | | | 10,000,000 | 10,007,022 |
| Black Belt Energy Gas District, AL, Gas Project Rev., “A”, 4%, 6/01/2051 (Put Date 12/01/2031) | | | 6,130,000 | 6,038,234 |
| Black Belt Energy Gas District, AL, Gas Project Rev., “C-1”, 5.25%, 2/01/2053 (Put Date 6/01/2029) | | | 7,000,000 | 7,303,850 |
| Black Belt Energy Gas District, AL, Gas Project Rev., “F”, 5.5%, 11/01/2053 (Put Date 12/01/2028) | | | 3,795,000 | 3,996,848 |
| Black Belt Energy Gas District, AL, Gas Supply Rev., “D-1”, 4%, 7/01/2052 (Put Date 6/01/2027) | | | 4,270,000 | 4,281,861 |
| Chatom, AL, Industrial Development Board Gulf Opportunity Zone (PowerSouth Energy), AGM, 5%, 8/01/2025 | | | 850,000 | 859,908 |
| Chatom, AL, Industrial Development Board Gulf Opportunity Zone (PowerSouth Energy), AGM, 5%, 8/01/2028 | | | 610,000 | 644,998 |
| Houston County, AL, Health Care Authority (Southeast Alabama Medical Center), “A”, 5%, 10/01/2025 | | | 1,165,000 | 1,175,140 |
| Jefferson County, AL, Sewer Rev. Warrants, 5%, 10/01/2025 | | | 1,500,000 | 1,524,426 |
| Jefferson County, AL, Sewer Rev. Warrants, 5%, 10/01/2026 | | | 1,500,000 | 1,546,934 |
| Jefferson County, AL, Sewer Rev. Warrants, 5%, 10/01/2027 | | | 1,250,000 | 1,309,331 |
| Mobile, AL, Industrial Development Board Pollution Control Rev. (Alabama Power Co. Barry Plant Project), “A”, 1%, 6/01/2034 (Put Date 6/26/2025) | | | 3,000,000 | 2,890,266 |
| Mobile, AL, Industrial Development Board Pollution Control Rev. (Alabama Power Co. Barry Plant Project), “C”, 3.78%, 6/01/2034 (Put Date 6/16/2026) | | | 11,000,000 | 10,943,756 |
| Pell City, AL, Special Care Facilities Financing Authority Rev. (Noland Health Services, Inc.), “A”, 5%, 12/01/2024 | | | 750,000 | 752,165 |
| Pell City, AL, Special Care Facilities Financing Authority Rev. (Noland Health Services, Inc.), “A”, 5%, 12/01/2025 | | | 785,000 | 794,573 |
| Pell City, AL, Special Care Facilities Financing Authority Rev. (Noland Health Services, Inc.), “A”, 5%, 12/01/2026 | | | 1,030,000 | 1,054,610 |
Portfolio of Investments – continued
| Issuer | | | Shares/Par | Value ($) |
| Municipal Bonds - continued |
| Alabama - continued |
| Phenix City, AL, Water & Sewer Rev., “A”, BAM, 5%, 8/15/2025 | | $ | 2,225,000 | $2,244,257 |
| Southeast Alabama Energy Authority Commodity Supply Rev. (Project No. 2), “A”, 4%, 12/01/2051 (Put Date 12/01/2031) | | | 7,130,000 | 6,978,005 |
| Southeast Alabama Energy Authority Commodity Supply Rev. (Project No. 3), “A-1”, 5.5%, 1/01/2053 (Put Date 12/01/2029) | | | 3,865,000 | 4,091,920 |
| Southeast Alabama Energy Authority Commodity Supply Rev. (Project No. 4), “B-1”, 5%, 5/01/2053 (Put Date 8/01/2028) | | | 6,380,000 | 6,583,156 |
| Southeast Alabama Energy Authority Commodity Supply Rev. (Project No. 5), “A”, 5.25%, 1/01/2054 (Put Date 7/01/2029) | | | 12,000,000 | 12,597,409 |
| Southeast Alabama Energy Authority Commodity Supply Rev. (Project No.6), 5%, 1/01/2054 (Put Date 6/01/2030) | | | 6,875,000 | 7,228,571 |
| Southeast Alabama Energy, Cooperative District Energy Supply Rev., “A-1”, 5.5%, 11/01/2053 (Put Date 1/01/2031) | | | 10,000,000 | 10,682,211 |
| Southeast Alabama Gas Supply District Rev. (Project No. 2), “A”, 4%, 6/01/2049 (Put Date 6/01/2024) | | | 10,000,000 | 9,997,197 |
| University of West Alabama, General Fee Rev., AGM, 4%, 1/01/2025 | | | 150,000 | 149,652 |
| University of West Alabama, General Fee Rev., AGM, 5%, 1/01/2027 | | | 100,000 | 102,726 |
| | | | | $122,971,327 |
| Alaska - 0.2% |
| Alaska Housing Finance Corp., Capital Project Bonds II, “A”, 3%, 6/01/2024 | | $ | 400,000 | $399,444 |
| Alaska Housing Finance Corp., Capital Project Bonds II, “A”, 4%, 12/01/2024 | | | 650,000 | 650,585 |
| Alaska Housing Finance Corp., General Mortgage Rev. II, “C”, 5.75%, 12/01/2052 | | | 4,755,000 | 4,983,785 |
| | | | | $6,033,814 |
| Arizona - 3.8% |
| Arizona Industrial Development Authority Education Rev. (Great Hearts Arizona Projects), “A”, 5%, 7/01/2024 | | $ | 125,000 | $125,126 |
| Arizona Industrial Development Authority Education Rev. (Great Hearts Arizona Projects), “A”, 5%, 7/01/2025 | | | 145,000 | 146,769 |
| Arizona Industrial Development Authority Education Rev. (Great Hearts Arizona Projects), “A”, 5%, 7/01/2027 | | | 160,000 | 164,880 |
| Arizona Industrial Development Authority Education Rev. (Great Hearts Arizona Projects), “A”, 5%, 7/01/2028 | | | 125,000 | 130,343 |
| Arizona Industrial Development Authority Education Rev. (Great Hearts Arizona Projects), “A”, 5%, 7/01/2029 | | | 125,000 | 131,702 |
| Arizona Industrial Development Authority Education Rev. (Great Hearts Arizona Projects), “A”, 5%, 7/01/2030 | | | 135,000 | 143,530 |
Portfolio of Investments – continued
| Issuer | | | Shares/Par | Value ($) |
| Municipal Bonds - continued |
| Arizona - continued |
| Arizona Industrial Development Authority Education Rev. (Great Hearts Arizona Projects), “A”, 5%, 7/01/2031 | | $ | 125,000 | $133,792 |
| Arizona Industrial Development Authority Education Rev., Taxable (KIPP NYC Public Charter Schools - Gerard Facility Project), “C”, 1.8%, 7/01/2024 | | | 225,000 | 223,160 |
| Arizona Industrial Development Authority Multi-Family Housing Rev. (Unity at West Glendale Project), 5%, 3/01/2045 (Put Date 9/01/2026) | | | 1,033,000 | 1,051,492 |
| Chandler, AZ, Industrial Development Authority Rev. (Intel Corp. Project), 4.1%, 12/01/2037 (Put Date 6/15/2028) | | | 2,000,000 | 1,995,801 |
| Chandler, AZ, Industrial Development Authority Rev. (Intel Corp. Project), 5%, 6/01/2049 (Put Date 6/03/2024) | | | 7,500,000 | 7,502,851 |
| Chandler, AZ, Industrial Development Authority Rev. (Intel Corp. Project), 5%, 9/01/2052 (Put Date 9/01/2027) | | | 18,845,000 | 19,245,712 |
| Coconino County, AZ, Pollution Control Refunding Rev. (Nevada Power Co. Projects), “A”, 4.125%, 9/01/2032 (Put Date 3/31/2026) | | | 2,085,000 | 2,065,126 |
| Glendale, AZ, Industrial Development Authority, Graduate & Professional Student Loan Program Rev. (Midwestern University Foundation), “A”, 5%, 7/01/2024 | | | 1,300,000 | 1,301,104 |
| Glendale, AZ, Industrial Development Authority, Graduate & Professional Student Loan Program Rev. (Midwestern University Foundation), “A”, 5%, 7/01/2025 | | | 1,400,000 | 1,413,951 |
| Glendale, AZ, Industrial Development Authority, Graduate & Professional Student Loan Program Rev. (Midwestern University Foundation), “A”, 5%, 7/01/2026 | | | 1,200,000 | 1,223,644 |
| Glendale, AZ, Industrial Development Authority, Graduate & Professional Student Loan Program Rev. (Midwestern University Foundation), “A”, 5%, 7/01/2026 | | | 540,000 | 550,640 |
| Glendale, AZ, Industrial Development Authority, Graduate & Professional Student Loan Program Rev. (Midwestern University Foundation), “A”, 5%, 7/01/2027 | | | 1,120,000 | 1,155,450 |
| Glendale, AZ, Industrial Development Authority, Graduate & Professional Student Loan Program Rev. (Midwestern University Foundation), “A”, 5%, 7/01/2027 | | | 720,000 | 742,789 |
| Glendale, AZ, Industrial Development Authority, Graduate & Professional Student Loan Program Rev. (Midwestern University Foundation), “A”, 3%, 7/01/2035 | | | 555,000 | 502,268 |
| La Paz County, AZ, Industrial Development Authority Education Facility Lease Rev. (Charter School Solutions-Harmony Public Schools Project), “A”, 5%, 2/15/2028 | | | 675,000 | 683,087 |
| Maricopa County, AZ, Industrial Development Authority Education Rev. (Legacy Traditional Schools Projects), “A”, 4%, 7/01/2024 | | | 135,000 | 134,855 |
Portfolio of Investments – continued
| Issuer | | | Shares/Par | Value ($) |
| Municipal Bonds - continued |
| Arizona - continued |
| Maricopa County, AZ, Industrial Development Authority Education Rev. (Legacy Traditional Schools Projects), “A”, 4%, 7/01/2025 | | $ | 175,000 | $173,887 |
| Maricopa County, AZ, Industrial Development Authority Education Rev. (Legacy Traditional Schools Projects), “A”, 4%, 7/01/2026 | | | 200,000 | 199,477 |
| Maricopa County, AZ, Industrial Development Authority Education Rev. (Legacy Traditional Schools Projects), “A”, 4%, 7/01/2027 | | | 200,000 | 199,973 |
| Maricopa County, AZ, Industrial Development Authority Education Rev. (Legacy Traditional Schools Projects), “A”, 4%, 7/01/2028 | | | 325,000 | 326,012 |
| Maricopa County, AZ, Industrial Development Authority Education Rev. (Legacy Traditional Schools Projects), “A”, 4%, 7/01/2029 | | | 250,000 | 251,215 |
| Maricopa County, AZ, Pollution Control Corp. Rev. (Public Service Company of New Mexico Palo Verde Project), “A”, 3%, 1/01/2038 (Put Date 6/01/2024) | | | 10,560,000 | 10,546,389 |
| Maricopa County, AZ, Pollution Control Corp. Rev. (Public Service Company of New Mexico Palo Verde Project), “B”, 0.875%, 6/01/2043 (Put Date 10/01/2026) | | | 455,000 | 416,660 |
| Peoria, AZ, Vistancia Community Facilities District, BAM, 4%, 7/15/2024 | | | 575,000 | 574,786 |
| Phoenix, AZ, Industrial Development Authority, Education Facility Rev. (Basis Schools Projects), “A”, 4%, 7/01/2025 (n) | | | 515,000 | 510,847 |
| Phoenix, AZ, Industrial Development Authority, Education Facility Rev. (Great Hearts Academies Project), “A”, 2.95%, 7/01/2026 | | | 1,265,000 | 1,209,752 |
| Phoenix, AZ, Industrial Development Authority, Single Family Mortgage Rev., “A”, GNMA, 6.5%, 3/01/2055 | | | 5,315,000 | 5,913,867 |
| Phoenix, AZ, Industrial Development Authority, Solid Waste Disposal Rev. (Republic Services, Inc. Project), 4.1%, 12/01/2035 (Put Date 8/01/2024) | | | 25,000,000 | 25,000,000 |
| Phoenix, AZ, Industrial Development Authority, Student Housing Refunding Rev. (Downtown Phoenix Student Housing LLC - Arizona State University Project), “A”, 5%, 7/01/2024 | | | 400,000 | 399,814 |
| Phoenix, AZ, Industrial Development Authority, Student Housing Refunding Rev. (Downtown Phoenix Student Housing LLC - Arizona State University Project), “A”, 5%, 7/01/2026 | | | 1,115,000 | 1,123,569 |
| Phoenix, AZ, Industrial Development Authority, Student Housing Refunding Rev. (Downtown Phoenix Student Housing LLC - Arizona State University Project), “A”, 5%, 7/01/2027 | | | 600,000 | 608,773 |
| Phoenix, AZ, Industrial Development Authority, Student Housing Refunding Rev. (Downtown Phoenix Student Housing LLC - Arizona State University Project), “A”, 5%, 7/01/2028 | | | 150,000 | 153,262 |
| Pima County, AZ, Industrial Development Authority Senior Living Rev. (La Posada at Pusch Ridge Project), “B3”, 5.125%, 11/15/2029 (n) | | | 2,690,000 | 2,707,867 |
Portfolio of Investments – continued
| Issuer | | | Shares/Par | Value ($) |
| Municipal Bonds - continued |
| Arizona - continued |
| Pima County, AZ, Industrial Development Authority, Single Family Mortgage Rev., “B”, GNMA, 6.5%, 1/01/2055 | | $ | 6,310,000 | $6,990,311 |
| Tempe, AZ, Industrial Development Authority Rev. (Friendship Village of Tempe Project), “A”, 4%, 12/01/2024 | | | 225,000 | 224,445 |
| Tempe, AZ, Industrial Development Authority Rev. (Friendship Village of Tempe Project), “A”, 4%, 12/01/2025 | | | 275,000 | 272,999 |
| Yavapai County, AZ, Industrial Development Authority Rev. (Waste Management, Inc.), “A-2”, 2.2%, 3/01/2028 (Put Date 6/03/2024) | | | 1,200,000 | 1,197,642 |
| | | | | $99,769,619 |
| Arkansas - 0.4% |
| Arkansas Development Finance Authority, Health Care Rev. (Baptist Memorial Health Care Corp.), “B-2”, 5%, 9/01/2044 (Put Date 9/01/2027) | | $ | 6,545,000 | $6,809,741 |
| Arkansas Development Finance Authority, Healthcare Facilities Rev. (Carti Surgery Center Project), “B”, 4%, 7/01/2024 | | | 200,000 | 199,519 |
| Arkansas Development Finance Authority, Healthcare Facilities Rev. (Carti Surgery Center Project), “B”, 4%, 7/01/2025 | | | 150,000 | 148,228 |
| Arkansas Development Finance Authority, Healthcare Facilities Rev. (Carti Surgery Center Project), “B”, 4%, 7/01/2026 | | | 185,000 | 181,686 |
| Arkansas Development Finance Authority, Healthcare Facilities Rev. (Carti Surgery Center Project), “B”, 4%, 7/01/2027 | | | 95,000 | 92,988 |
| Arkansas Development Finance Authority, Healthcare Facilities Rev. (Carti Surgery Center Project), “B”, 4%, 7/01/2028 | | | 230,000 | 223,533 |
| Conway, AR, Health Facilities Board, Hospital Improvement Rev. (Conway Regional Medical Center), 5%, 8/01/2024 | | | 400,000 | 400,505 |
| Conway, AR, Health Facilities Board, Hospital Improvement Rev. (Conway Regional Medical Center), 5%, 8/01/2026 | | | 665,000 | 678,894 |
| Conway, AR, Health Facilities Board, Hospital Improvement Rev. (Conway Regional Medical Center), “A”, 5%, 8/01/2024 | | | 530,000 | 530,670 |
| | | | | $9,265,764 |
| California - 4.6% |
| California Community Choice Financing Authority, Clean Energy Project Rev., “A-1”, 4%, 5/01/2053 (Put Date 8/01/2028) | | $ | 1,875,000 | $1,868,211 |
| California Community Choice Financing Authority, Clean Energy Project Rev., “C”, 5.25%, 1/01/2054 (Put Date 10/01/2031) | | | 17,250,000 | 17,995,600 |
| California Community Choice Financing Authority, Clean Energy Project Rev., “F”, 5.5%, 10/01/2054 (Put Date 11/01/2030) | | | 7,480,000 | 8,109,602 |
| California County Tobacco Securitization Agency Settlement (Los Angeles County Securitization Corp.), “A”, 5%, 6/01/2024 | | | 350,000 | 350,210 |
| California County Tobacco Securitization Agency Settlement (Los Angeles County Securitization Corp.), “A”, 5%, 6/01/2025 | | | 350,000 | 354,697 |
Portfolio of Investments – continued
| Issuer | | | Shares/Par | Value ($) |
| Municipal Bonds - continued |
| California - continued |
| California Infrastructure & Economic Development Bank Refunding Rev. (Los Angeles County Museum of Art Project), “A”, 1.2%, 12/01/2050 (Put Date 6/01/2028) | | $ | 4,560,000 | $4,006,308 |
| California Infrastructure & Economic Development Bank Rev. (Colburn School), 1.75%, 8/01/2055 (Put Date 8/01/2026) | | | 11,375,000 | 10,743,633 |
| California Municipal Finance Authority Refunding Rev. (William Jessup University), 5%, 8/01/2024 | | | 835,000 | 832,023 |
| California Municipal Finance Authority Rev. (NorthBay Healthcare Group), “A”, 5%, 11/01/2025 | | | 1,130,000 | 1,133,549 |
| California Municipal Finance Authority Rev. (NorthBay Healthcare Group), “A”, 5%, 11/01/2026 | | | 1,000,000 | 1,000,858 |
| California Municipal Finance Authority, COP (Palomar Health), “A”, AGM, 5%, 11/01/2027 | | | 200,000 | 210,367 |
| California Municipal Finance Authority, COP (Palomar Health), “A”, AGM, 5%, 11/01/2028 | | | 125,000 | 133,714 |
| California Municipal Finance Authority, COP (Palomar Health), “A”, AGM, 5%, 11/01/2029 | | | 125,000 | 135,843 |
| California Municipal Finance Authority, COP (Palomar Health), “A”, AGM, 5%, 11/01/2030 | | | 400,000 | 440,952 |
| California Municipal Finance Authority, COP (Palomar Health), “A”, AGM, 5%, 11/01/2031 | | | 200,000 | 223,256 |
| California Municipal Finance Authority, COP (Palomar Health), “A”, AGM, 5%, 11/01/2032 | | | 225,000 | 254,073 |
| California Municipal Finance Authority, COP (Palomar Health), “A”, AGM, 5%, 11/01/2033 | | | 1,150,000 | 1,288,890 |
| California Municipal Finance Authority, Solid Waste Disposal Rev. (Republic Services, Inc.), “A”, 4.375%, 9/01/2053 (Put Date 9/01/2033) | | | 10,000,000 | 10,267,249 |
| California Municipal Finance Authority, Solid Waste Disposal Rev. (Waste Management, Inc. Project), “A”, 4.125%, 10/01/2041 (Put Date 10/01/2025) | | | 450,000 | 450,157 |
| California Municipal Finance Authority, Solid Waste Disposal Rev. (Waste Management, Inc. Project), “A”, 4.25%, 12/01/2044 (Put Date 12/02/2024) | | | 3,795,000 | 3,792,102 |
| California Municipal Finance Authority, Solid Waste Disposal Rev. (Waste Management, Inc. Project), “B”, 4.8%, 11/01/2041 (Put Date 6/02/2025) | | | 1,000,000 | 1,000,705 |
| California Pollution Control Financing Authority, Solid Waste Disposal Rev. (Waste Management, Inc.), “A-1”, 3.375%, 7/01/2025 | | | 5,000,000 | 4,979,230 |
| California Public Finance Authority Rev. (Henry Mayo Newhall Hospital), “A”, 4%, 10/15/2024 | | | 380,000 | 378,324 |
Portfolio of Investments – continued
| Issuer | | | Shares/Par | Value ($) |
| Municipal Bonds - continued |
| California - continued |
| California Public Finance Authority Rev. (Henry Mayo Newhall Hospital), “A”, 4%, 10/15/2025 | | $ | 400,000 | $396,310 |
| California School Finance Authority, Charter School Refunding Rev. (Aspire Public Schools), 5%, 8/01/2024 (n) | | | 325,000 | 324,984 |
| California School Finance Authority, Charter School Refunding Rev. (Aspire Public Schools), 5%, 8/01/2025 (n) | | | 335,000 | 336,231 |
| California School Finance Authority, Charter School Refunding Rev. (Aspire Public Schools), 5%, 8/01/2026 (Prerefunded 8/01/2025) (n) | | | 25,000 | 25,470 |
| California School Finance Authority, Charter School Refunding Rev. (Aspire Public Schools), ETM, 5%, 8/01/2024 (n) | | | 25,000 | 25,070 |
| California School Finance Authority, Charter School Refunding Rev. (Aspire Public Schools), ETM, 5%, 8/01/2025 (n) | | | 30,000 | 30,564 |
| California Statewide Communities Development Authority Rev. (California Baptist University), “A”, 3.5%, 11/01/2027 (n) | | | 3,160,000 | 3,064,247 |
| California Statewide Communities Development Authority Rev. (University of California, Irvine East Campus Apartments), 5%, 5/15/2026 | | | 1,300,000 | 1,321,699 |
| California Statewide Communities Development Authority Rev., Taxable (Front Porch Communities and Services), “B”, 1.31%, 4/01/2025 | | | 1,195,000 | 1,147,087 |
| Los Angeles County, CA, Development Authority, Multi-Family Housing Mortgage Rev. (2111 Firestone), “E”, 5%, 7/01/2043 (Put Date 7/01/2026) | | | 2,209,000 | 2,250,551 |
| Los Angeles, CA, Department of Airports Rev. (Los Angeles International), “B”, 5%, 5/15/2026 | | | 1,350,000 | 1,384,480 |
| Los Angeles, CA, Housing Authority, Multi-Family Housing Rev. (M-TEBS + Homekey Portfolio), “B”, 3.75%, 4/01/2034 | | | 852,703 | 846,555 |
| Los Angeles, CA, Housing Authority, Multi-Family Housing Rev. (M-TEBS + Homekey Portfolio), “C”, 3.75%, 4/01/2034 | | | 2,144,266 | 2,128,807 |
| Port of Oakland, CA, Intermediate Lien Refunding Rev., “H”, 5%, 5/01/2024 | | | 1,205,000 | 1,205,000 |
| Port of Oakland, CA, Intermediate Lien Refunding Rev., “H”, ETM, 5%, 5/01/2024 | | | 95,000 | 95,000 |
| San Diego County, CA, Regional Airport Authority Rev., “B”, 5%, 7/01/2026 | | | 2,225,000 | 2,276,707 |
| San Diego County, CA, Regional Airport Authority Rev., “B”, 5%, 7/01/2027 | | | 2,905,000 | 3,016,187 |
| San Francisco, CA, City & County Airports Commission, International Airport Rev. (SFO Fuel Company LLC), “A”, 5%, 1/01/2027 | | | 2,205,000 | 2,273,999 |
| San Francisco, CA, City & County Airports Commission, Second Series Rev., “C”, 5.25%, 5/01/2035 | | | 7,500,000 | 8,503,453 |
Portfolio of Investments – continued
| Issuer | | | Shares/Par | Value ($) |
| Municipal Bonds - continued |
| California - continued |
| San Francisco, CA, City & County Airports Commission, Second Series Rev., “C”, 5.25%, 5/01/2036 | | $ | 4,500,000 | $5,067,397 |
| San Ramon CA, Public Financing Authority, Capital Appreciation, “A”, AAC, 0%, 2/01/2026 | | | 1,690,000 | 1,575,520 |
| Transbay Joint Powers Authority, CA, Senior Tax Allocation, “A”, 5%, 10/01/2026 | | | 1,150,000 | 1,175,216 |
| Transbay Joint Powers Authority, CA, Senior Tax Allocation, “A”, 5%, 10/01/2028 | | | 1,000,000 | 1,047,361 |
| Transbay Joint Powers Authority, CA, Senior Tax Allocation, “A”, 5%, 10/01/2029 | | | 1,100,000 | 1,161,477 |
| Vernon, CA, Electric System Rev., “A”, 5%, 4/01/2026 | | | 1,000,000 | 1,019,704 |
| Vernon, CA, Electric System Rev., “A”, 5%, 4/01/2027 | | | 3,380,000 | 3,487,190 |
| Vernon, CA, Electric System Rev., “A”, 5%, 10/01/2027 | | | 4,500,000 | 4,675,383 |
| | | | | $119,811,202 |
| Colorado - 2.7% |
| Arvada, CO, Vauxmont Metropolitan District Rev., AGM, 5%, 12/01/2024 | | $ | 400,000 | $402,273 |
| Arvada, CO, Vauxmont Metropolitan District Rev., AGM, 5%, 12/15/2024 | | | 135,000 | 135,816 |
| Arvada, CO, Vauxmont Metropolitan District Rev., AGM, 5%, 12/01/2025 | | | 175,000 | 178,396 |
| Arvada, CO, Vauxmont Metropolitan District Rev., AGM, 5%, 12/15/2025 | | | 125,000 | 127,681 |
| Arvada, CO, Vauxmont Metropolitan District Rev., AGM, 5%, 12/15/2026 | | | 135,000 | 139,422 |
| Colorado Education Loan Program, Tax & Rev. Anticipation Notes, “B”, 4.5%, 6/28/2024 | | | 5,000,000 | 5,004,347 |
| Colorado Educational & Cultural Facilities Authority Rev. (Classical Academy Project), “A”, 5%, 12/01/2029 | | | 1,040,000 | 1,046,908 |
| Colorado Educational & Cultural Facilities Authority Rev. (Colorado Springs Charter Academy Project), 5.25%, 7/01/2028 | | | 1,135,000 | 1,136,748 |
| Colorado Educational & Cultural Facilities Authority Rev. (Pinnacle Charter School Building Corp.), 5%, 6/01/2029 | | | 630,000 | 630,558 |
| Colorado Health Facilities Authority Rev. (AdventHealth), “B”, 5%, 11/15/2049 (Put Date 11/19/2026) | | | 17,720,000 | 18,257,492 |
| Colorado Health Facilities Authority Rev. (Christian Living Neighborhoods), 4%, 1/01/2025 | | | 390,000 | 388,845 |
| Colorado Health Facilities Authority Rev. (Christian Living Neighborhoods), 4%, 1/01/2026 | | | 320,000 | 317,194 |
| Colorado Health Facilities Authority Rev. (Christian Living Neighborhoods), 4%, 1/01/2027 | | | 495,000 | 488,096 |
Portfolio of Investments – continued
| Issuer | | | Shares/Par | Value ($) |
| Municipal Bonds - continued |
| Colorado - continued |
| Colorado Health Facilities Authority Rev. (Christian Living Neighborhoods), 4%, 1/01/2028 | | $ | 460,000 | $451,223 |
| Colorado Health Facilities Authority Rev. (Christian Living Neighborhoods), 4%, 1/01/2029 | | | 430,000 | 418,907 |
| Colorado Health Facilities Authority Rev. (Christian Living Neighborhoods), 4%, 1/01/2030 | | | 500,000 | 483,470 |
| Colorado Health Facilities Authority Rev. (Christian Living Neighborhoods), 4%, 1/01/2031 | | | 960,000 | 920,822 |
| Colorado Health Facilities Authority Rev. (CommonSpirit Health), “A”, 5.25%, 11/01/2034 | | | 1,000,000 | 1,125,059 |
| Colorado Health Facilities Authority Rev. (CommonSpirit Health), “A”, 5.25%, 11/01/2035 | | | 1,200,000 | 1,343,922 |
| Colorado Health Facilities Authority Rev. (CommonSpirit Health), “A-1”, 5%, 8/01/2026 | | | 1,500,000 | 1,539,269 |
| Colorado Health Facilities Authority Rev. (CommonSpirit Health), “A-1”, 5%, 8/01/2027 | | | 2,000,000 | 2,084,197 |
| Colorado Health Facilities Authority Rev. (CommonSpirit Health), “A-2”, 5%, 8/01/2026 | | | 2,160,000 | 2,216,547 |
| Colorado Regional Transportation District (Denver Transit Partners Eagle P3 Project), “A”, 5%, 7/15/2024 | | | 300,000 | 300,305 |
| Colorado Regional Transportation District (Denver Transit Partners Eagle P3 Project), “A”, 5%, 1/15/2025 | | | 325,000 | 326,779 |
| Colorado Regional Transportation District (Denver Transit Partners Eagle P3 Project), “A”, 5%, 7/15/2025 | | | 400,000 | 404,416 |
| Colorado Regional Transportation District (Denver Transit Partners Eagle P3 Project), “A”, 3%, 1/15/2026 | | | 1,500,000 | 1,470,634 |
| Colorado Regional Transportation District (Denver Transit Partners Eagle P3 Project), “A”, 5%, 7/15/2026 | | | 300,000 | 307,275 |
| Colorado Regional Transportation District (Denver Transit Partners Eagle P3 Project), “A”, 5%, 1/15/2027 | | | 500,000 | 515,588 |
| Colorado Regional Transportation District (Denver Transit Partners Eagle P3 Project), “A”, 5%, 7/15/2027 | | | 600,000 | 623,360 |
| Colorado Regional Transportation District (Denver Transit Partners Eagle P3 Project), “A”, 5%, 7/15/2028 | | | 850,000 | 896,175 |
| Denver, CO, City & County Airport System Rev., “A”, 5%, 11/15/2027 | | | 5,000,000 | 5,230,761 |
| Denver, CO, City & County Airport System Rev., “A”, 5%, 11/15/2028 | | | 14,000,000 | 14,811,226 |
| Denver, CO, Convention Center Hotel Authority Rev., 5%, 12/01/2024 | | | 1,500,000 | 1,502,284 |
| Denver, CO, Convention Center Hotel Authority Rev., 5%, 12/01/2025 | | | 2,000,000 | 2,015,557 |
Portfolio of Investments – continued
| Issuer | | | Shares/Par | Value ($) |
| Municipal Bonds - continued |
| Colorado - continued |
| Park Creek Metropolitan District, CO, Senior Limited Property Tax Supported Rev., “A”, NPFG, 5%, 12/01/2025 | | $ | 500,000 | $508,933 |
| Park Creek Metropolitan District, CO, Senior Limited Property Tax Supported Rev., “A”, NPFG, 5%, 12/01/2027 | | | 1,270,000 | 1,310,141 |
| | | | | $69,060,626 |
| Connecticut - 1.3% |
| Connecticut Health & Educational Facilities Authority Rev. (Connecticut State University), “N”, 5%, 11/01/2024 | | $ | 1,930,000 | $1,931,612 |
| Connecticut Health & Educational Facilities Authority Rev. (Masonicare), “F”, 5%, 7/01/2024 | | | 1,840,000 | 1,839,323 |
| Connecticut Health & Educational Facilities Authority Rev. (Masonicare), “F”, 4%, 7/01/2030 | | | 3,000,000 | 2,883,930 |
| Connecticut Higher Education Supplemental Loan Authority Rev. (Chesla Loan Program), “B”, 5%, 11/15/2026 | | | 1,000,000 | 1,018,231 |
| Connecticut Higher Education Supplemental Loan Authority Rev. (Chesla Loan Program), “B”, 5%, 11/15/2027 | | | 1,440,000 | 1,477,590 |
| Connecticut Higher Education Supplemental Loan Authority Rev. (Chesla Loan Program), “B”, 5%, 11/15/2028 | | | 890,000 | 922,709 |
| Connecticut Higher Education Supplemental Loan Authority Rev. (Chesla Loan Program), “B”, 5%, 11/15/2029 | | | 2,000,000 | 2,091,388 |
| Connecticut Higher Education Supplemental Loan Authority Rev. (Chesla Loan Program), “B”, 5%, 11/15/2030 | | | 2,030,000 | 2,141,231 |
| Connecticut Housing Finance Authority Rev. (Housing Mortgage Finance Program), “C-2”, 4.4%, 5/15/2066 (Put Date 11/15/2026) | | | 5,500,000 | 5,520,595 |
| Connecticut Housing Finance Authority Rev. (Housing Mortgage Finance Program), “E-1”, GNMA, 5.5%, 11/15/2052 | | | 5,630,000 | 5,830,153 |
| Danbury, CT, General Obligation Anticipation Notes, 5%, 9/24/2024 (n) | | | 2,500,000 | 2,508,629 |
| East Hartford, CT, Housing Authority Multi-Family Rev. (Summerfield Townhouses Project), “A”, 4.25%, 2/01/2027 (Put Date 2/01/2025) | | | 3,000,000 | 3,001,131 |
| Hamden, CT, General Obligation, BAM, 4%, 8/15/2025 | | | 400,000 | 400,425 |
| New Haven, CT, General Obligation, “A”, AGM, 5%, 8/15/2024 | | | 1,280,000 | 1,282,586 |
| West Haven, CT, General Obligation, BAM, 4%, 3/15/2025 | | | 420,000 | 419,991 |
| | | | | $33,269,524 |
Portfolio of Investments – continued
| Issuer | | | Shares/Par | Value ($) |
| Municipal Bonds - continued |
| Delaware - 0.2% |
| Delaware Economic Development Authority Rev. (Delaware Military Academy, Inc. Project), 4%, 9/01/2024 | | $ | 75,000 | $74,975 |
| Delaware Economic Development Authority Rev. (Newark Charter School, Inc.), “A”, 2.8%, 9/01/2026 | | | 165,000 | 158,617 |
| Delaware Economic Development Authority, Gas Facilities Rev. (Delmarva Power and Light Co. Project), “A”, 1.05%, 1/01/2031 (Put Date 7/01/2025) | | | 5,985,000 | 5,751,306 |
| | | | | $5,984,898 |
| District of Columbia - 1.7% |
| District of Columbia University Rev. (Georgetown University), 5%, 4/01/2026 | | $ | 1,045,000 | $1,068,522 |
| District of Columbia, Housing Finance Agency, Collateralized Multi-Family Rev. (Parcel 42 Project), 1.7%, 9/01/2041 (Put Date 3/01/2025) | | | 9,000,000 | 8,786,713 |
| District of Columbia, Housing Finance Agency, Multi-Family Development Program, “B-2”, 0.5%, 3/01/2027 (Put Date 10/01/2024) | | | 2,415,000 | 2,374,932 |
| District of Columbia, Housing Finance Agency, Multi-Family Development Program, “B-2”, 3%, 9/01/2028 (Put Date 9/01/2026) | | | 5,350,000 | 5,187,015 |
| District of Columbia, Housing Finance Agency, Multi-Family Development Program, Taxable, “B-3”, 0.9%, 10/01/2024 | | | 1,400,000 | 1,371,921 |
| District of Columbia, Housing Finance Agency, Multi-Family Housing Rev. (Cascade Park Apartments II Project), 0.7%, 8/01/2042 (Put Date 8/01/2024) | | | 3,970,000 | 3,932,512 |
| District of Columbia, Housing Finance Agency, Multi-Family Housing Rev. (Clara Apartments Project), 3.75%, 4/01/2025 (Put Date 10/01/2024) | | | 1,500,000 | 1,498,753 |
| District of Columbia, Housing Finance Agency, Multi-Family Housing Rev. (Paxton Project), 4%, 9/01/2040 (Put Date 9/01/2025) | | | 3,750,000 | 3,731,134 |
| Metropolitan Washington, D.C., Airport Authority System Refunding Rev., “A”, 5%, 10/01/2034 | | | 10,000,000 | 10,027,012 |
| Metropolitan Washington, D.C., Airport Authority System Rev., “A”, 5%, 10/01/2027 | | | 7,000,000 | 7,308,843 |
| | | | | $45,287,357 |
Portfolio of Investments – continued
| Issuer | | | Shares/Par | Value ($) |
| Municipal Bonds - continued |
| Florida - 2.2% |
| Broward County, FL, Multi-Family Housing Rev. (Pinnacle 441 Phase 2 LLC), 4.05%, 9/01/2056 (Put Date 3/01/2026) | | $ | 3,000,000 | $2,997,465 |
| Broward County, FL, Multi-Family Housing Rev. (Solaris Apartments), “B”, FNMA, 0.7%, 1/01/2025 (Put Date 7/01/2024) | | | 4,375,000 | 4,347,200 |
| Florida Development Finance Corp. Educational Facilities Rev. (Mater Academy Projects), “A”, 5%, 6/15/2025 | | | 430,000 | 430,343 |
| Florida Development Finance Corp. Educational Facilities Rev. (Mater Academy Projects), “A”, 5%, 6/15/2027 | | | 565,000 | 576,433 |
| Florida Development Finance Corp. Educational Facilities Rev. (Mater Academy Projects), “A”, 5%, 6/15/2029 | | | 940,000 | 962,114 |
| Florida Development Finance Corp. Educational Facilities Rev. (Mater Academy Projects), “A”, 5%, 6/15/2031 | | | 1,040,000 | 1,064,484 |
| Florida Development Finance Corp. Educational Facilities Rev. (Nova Southeastern University Project), “A”, 5%, 4/01/2025 | | | 400,000 | 402,757 |
| Florida Development Finance Corp. Educational Facilities Rev. (Nova Southeastern University Project), “A”, 5%, 4/01/2026 | | | 285,000 | 290,359 |
| Florida Development Finance Corp. Educational Facilities Rev. (Nova Southeastern University Project), “A”, 5%, 4/01/2029 | | | 450,000 | 477,361 |
| Florida Development Finance Corp. Senior Living Rev. (Mayflower Retirement Community Project), “A”, 4%, 6/01/2027 (n) | | | 1,270,000 | 1,207,673 |
| Florida Development Finance Corp. Senior Living Rev. (Mayflower Retirement Community Project), “A”, 4%, 6/01/2028 (n) | | | 825,000 | 771,406 |
| Florida Higher Educational Facilities Financing Authority Rev. (Florida Institute of Technology), 5%, 10/01/2027 | | | 480,000 | 490,675 |
| Florida Higher Educational Facilities Financing Authority Rev. (Florida Institute of Technology), 5%, 10/01/2028 | | | 1,500,000 | 1,545,985 |
| Florida Higher Educational Facilities Financing Authority Rev. (Florida Institute of Technology), 5%, 10/01/2029 | | | 1,295,000 | 1,343,793 |
| Florida Higher Educational Facilities Financing Authority Rev. (Florida Institute of Technology), 5%, 10/01/2030 | | | 1,990,000 | 2,062,685 |
| Florida Housing Finance Corp., Homeowner Mortgage Rev., “1”, GNMA, 5%, 1/01/2025 | | | 920,000 | 925,873 |
| Florida Housing Finance Corp., Homeowner Mortgage Rev., “1”, GNMA, 5%, 1/01/2026 | | | 500,000 | 509,502 |
| Florida Housing Finance Corp., Homeowner Mortgage Rev., “1”, GNMA, 5%, 1/01/2028 | | | 135,000 | 141,709 |
| Florida Housing Finance Corp., Multi-Family Mortgage Rev. (Culmer Apartments), “C”, 5%, 12/01/2026 (Put Date 12/01/2025) | | | 2,000,000 | 2,022,533 |
| Florida Housing Finance Corp., Multi-Family Mortgage Rev. (Hampton Point Apartments), “E”, 5%, 5/01/2026 (Put Date 5/01/2025) | | | 5,600,000 | 5,642,051 |
Portfolio of Investments – continued
| Issuer | | | Shares/Par | Value ($) |
| Municipal Bonds - continued |
| Florida - continued |
| Florida Housing Finance Corp., Multi-Family Mortgage Rev. (Northside Transit Village III), “B”, GNMA, 5%, 2/01/2027 (Put Date 2/01/2026) | | $ | 4,050,000 | $4,114,606 |
| Greater Orlando Aviation Authority Airport Facilities Rev., “A”, 5%, 10/01/2027 | | | 1,375,000 | 1,435,666 |
| Greater Orlando Aviation Authority Airport Facilities Rev., “A”, 5%, 10/01/2030 | | | 1,375,000 | 1,489,354 |
| Lakewood Ranch Stewardship District, FL, Special Assessment Rev. (Taylor Ranch Project), 5.4%, 5/01/2028 | | | 700,000 | 710,400 |
| Lee County, FL, Airport Rev., “B”, 5%, 10/01/2026 | | | 1,660,000 | 1,703,739 |
| Miami Beach, FL, Health Facilities Authority Hospital Rev. (Mount Sinai Medical Center of Florida), 5%, 11/15/2024 | | | 400,000 | 400,864 |
| Miami-Dade County, FL, Aviation Rev., “A”, 5%, 10/01/2038 | | | 1,145,000 | 1,150,933 |
| Miami-Dade County, FL, Housing Finance Authority Multi-Family Rev. (Cutler Vista Housing LP), 5%, 3/01/2027 (Put Date 9/01/2025) | | | 3,000,000 | 3,030,177 |
| Miami-Dade County, FL, Housing Finance Authority Multi-Family Rev. (Emerald Dunes), “B”, 4.05%, 9/01/2026 (Put Date 9/01/2025) | | | 1,750,000 | 1,742,298 |
| Miami-Dade County, FL, Housing Finance Authority Multi-Family Rev. (Quail Roost Transit Village I), HUD Section 8, 5%, 9/01/2026 (Put Date 9/01/2025) | | | 4,250,000 | 4,285,077 |
| Miami-Dade County, FL, Housing Finance Authority Multi-Family Rev. (St. Mary Towers Apartments), 3.4%, 4/01/2041 (Put Date 10/01/2026) | | | 1,750,000 | 1,718,292 |
| Miami-Dade County, FL, Industrial Development Authority Rev. (Doral Academy Project), 5%, 1/15/2032 | | | 1,000,000 | 1,019,590 |
| Miami-Dade County, FL, Seaport Refunding Rev., “A”, 5%, 10/01/2035 | | | 1,650,000 | 1,775,172 |
| Orange County, FL, Health Facilities Authority Rev. (AdventHealth Obligated Group), “C”, ETM, 5%, 11/15/2052 (Prerefunded 11/15/2026) | | | 1,140,000 | 1,183,454 |
| Palm Beach County, FL, Health Facilities Authority Hospital Rev. (Jupiter Medical Center Project), “A”, 5%, 11/01/2028 | | | 150,000 | 154,571 |
| Palm Beach County, FL, Health Facilities Authority Hospital Rev. (Jupiter Medical Center Project), “A”, 5%, 11/01/2029 | | | 200,000 | 207,349 |
| Palm Beach County, FL, Health Facilities Authority Hospital Rev. (Jupiter Medical Center Project), “A”, 5%, 11/01/2030 | | | 200,000 | 208,439 |
| Palm Beach County, FL, Health Facilities Authority Hospital Rev. (Jupiter Medical Center Project), “A”, 5%, 11/01/2031 | | | 200,000 | 209,537 |
| Palm Beach County, FL, Health Facilities Authority Hospital Rev. (Jupiter Medical Center Project), “A”, 5%, 11/01/2032 | | | 250,000 | 263,116 |
Portfolio of Investments – continued
| Issuer | | | Shares/Par | Value ($) |
| Municipal Bonds - continued |
| Florida - continued |
| Pasco County, FL, School Board Refunding Certificates of Participation, “A”, 5%, 8/01/2025 | | $ | 100,000 | $101,457 |
| Pompano Beach, FL, Refunding Rev. (John Knox Village Project), “B-2”, 1.45%, 1/01/2027 | | | 280,000 | 265,517 |
| Pompano Beach, FL, Rev. (John Knox Village Project), “B-1”, 2%, 1/01/2029 | | | 1,080,000 | 962,045 |
| St. John's County, FL, Industrial Development Authority, Senior Living Rev. (Vicars Landing Project), “A”, 4%, 12/15/2024 | | | 140,000 | 139,251 |
| St. John's County, FL, Industrial Development Authority, Senior Living Rev. (Vicars Landing Project), “A”, 4%, 12/15/2025 | | | 180,000 | 177,417 |
| Tampa, FL, Hospital Rev. (H. Lee Moffitt Cancer Center Project), “B”, 5%, 7/01/2024 | | | 100,000 | 100,085 |
| Tampa, FL, Hospital Rev. (H. Lee Moffitt Cancer Center Project), “B”, 5%, 7/01/2025 | | | 100,000 | 101,110 |
| Tampa, FL, Hospital Rev. (H. Lee Moffitt Cancer Center Project), “B”, 5%, 7/01/2026 | | | 100,000 | 102,328 |
| Tampa, FL, Hospital Rev. (H. Lee Moffitt Cancer Center Project), “B”, 5%, 7/01/2027 | | | 180,000 | 186,792 |
| Tampa, FL, Hospital Rev. (H. Lee Moffitt Cancer Center Project), “B”, 5%, 7/01/2028 | | | 230,000 | 242,273 |
| Tampa, FL, Hospital Rev. (H. Lee Moffitt Cancer Center Project), “B”, 5%, 7/01/2029 | | | 225,000 | 240,322 |
| Tampa, FL, Hospital Rev. (H. Lee Moffitt Cancer Center Project), “B”, 5%, 7/01/2030 | | | 250,000 | 270,500 |
| Tampa, FL, Hospital Rev. (H. Lee Moffitt Cancer Center Project), “B”, 5%, 7/01/2031 | | | 300,000 | 325,421 |
| | | | | $58,229,553 |
| Georgia - 3.7% |
| Appling County, GA, Development Authority Pollution Control Rev. (Oglethorpe Power Corp. Hatch Project), “A”, 1.5%, 1/01/2038 (Put Date 2/03/2025) | | $ | 2,500,000 | $2,417,461 |
| Atlanta, GA, Geo. L. Smith II World Congress Center Authority Convention Center Hotel Rev., “A”, 2.375%, 1/01/2031 | | | 1,000,000 | 893,436 |
| Bartow County, GA, Development Authority Pollution Control Rev. (Georgia Power Co. Plant Bowen Project), 3.95%, 12/01/2032 (Put Date 3/08/2028) | | | 6,245,000 | 6,256,616 |
| Bartow County, GA, Development Authority Pollution Control Rev. (Georgia Power Co. Plant Bowen Project), 2.875%, 8/01/2043 (Put Date 8/19/2025) | | | 2,000,000 | 1,952,898 |
| Burke County, GA, Development Authority Pollution Control Rev. (Georgia Power Co. Plant Vogtle Project), 3.8%, 10/01/2032 (Put Date 5/21/2026) | | | 750,000 | 750,073 |
Portfolio of Investments – continued
| Issuer | | | Shares/Par | Value ($) |
| Municipal Bonds - continued |
| Georgia - continued |
| Burke County, GA, Development Authority Pollution Control Rev. (Oglethorpe Power Corp. Vogtle Project), “A”, 1.5%, 1/01/2040 (Put Date 2/03/2025) | | $ | 2,030,000 | $1,962,978 |
| Cobb County, GA, Kennestone Hospital Authority Rev. (WellStar Health System, Inc. Project), “B”, 5%, 4/01/2025 | | | 800,000 | 808,164 |
| Cobb County, GA, Kennestone Hospital Authority Rev. (WellStar Health System, Inc. Project), “B”, 5%, 4/01/2027 | | | 500,000 | 519,353 |
| DeKalb County, GA, Development Authority Rev. (Global Academy, Inc. Project), “A”, 4%, 6/01/2035 | | | 500,000 | 488,163 |
| DeKalb County, GA, Housing Authority, Affordable Multi-Family Rev. (Park at 500 Project), 4%, 3/01/2034 | | | 12,880,000 | 12,464,789 |
| DeKalb, GA, Housing Authority, Multi-Family Housing Rev. (Tranquility at Decatur Project), “B”, 2.77%, 9/01/2025 (Put Date 3/01/2025) | | | 1,325,000 | 1,303,948 |
| Georgia Main Street Natural Gas, Inc., Gas Supply Rev., “A”, 5%, 6/01/2053 (Put Date 6/01/2030) | | | 9,500,000 | 9,866,366 |
| Georgia Main Street Natural Gas, Inc., Gas Supply Rev., “B”, 4%, 8/01/2049 (Put Date 12/02/2024) | | | 14,540,000 | 14,541,928 |
| Georgia Main Street Natural Gas, Inc., Gas Supply Rev., “B”, 5%, 12/01/2052 (Put Date 6/01/2029) | | | 8,845,000 | 9,184,879 |
| Georgia Main Street Natural Gas, Inc., Gas Supply Rev., “C”, 4%, 3/01/2050 (Put Date 9/01/2026) | | | 1,765,000 | 1,766,037 |
| Georgia Main Street Natural Gas, Inc., Gas Supply Rev., “C”, 4%, 5/01/2052 (Put Date 12/01/2028) | | | 15,095,000 | 15,080,504 |
| Georgia Main Street Natural Gas, Inc., Gas Supply Rev., “C”, 5%, 9/01/2053 (Put Date 9/01/2030) | | | 8,325,000 | 8,765,321 |
| Georgia Municipal Electric Authority (Project One), “A”, 5%, 1/01/2027 | | | 850,000 | 879,253 |
| Monroe County, GA, Development Authority Pollution Control Rev. (Georgia Power Co. Plant Scherer Project), 2.25%, 7/01/2025 | | | 5,500,000 | 5,319,411 |
| | | | | $95,221,578 |
| Guam - 0.2% |
| Guam Government Business Privilege Tax Refunding, “F”, 5%, 1/01/2028 | | $ | 400,000 | $413,760 |
| Guam International Airport Authority Rev., Taxable (A.B. Won Pat Airport), “A”, 2.499%, 10/01/2025 | | | 620,000 | 590,976 |
| Guam International Airport Authority Rev., Taxable (A.B. Won Pat Airport), “A”, 2.899%, 10/01/2027 | | | 840,000 | 762,244 |
| Guam International Airport Authority Rev., Taxable (A.B. Won Pat Airport), “A”, 3.099%, 10/01/2028 | | | 1,880,000 | 1,674,671 |
| Guam International Airport Authority Rev., Taxable (A.B. Won Pat Airport), “A”, 3.339%, 10/01/2030 | | | 615,000 | 525,834 |
Portfolio of Investments – continued
| Issuer | | | Shares/Par | Value ($) |
| Municipal Bonds - continued |
| Guam - continued |
| Guam International Airport Authority Rev., Taxable (A.B. Won Pat Airport), “A”, 3.489%, 10/01/2031 | | $ | 450,000 | $378,774 |
| | | | | $4,346,259 |
| Hawaii - 0.1% |
| Hawaii Harbor System Rev., “A”, 5%, 7/01/2024 | | $ | 250,000 | $250,285 |
| Hawaii Harbor System Rev., “A”, 5%, 7/01/2025 | | | 350,000 | 354,305 |
| Hawaii Harbor System Rev., “A”, 5%, 7/01/2027 | | | 250,000 | 259,199 |
| Hawaii Harbor System Rev., “A”, 5%, 7/01/2029 | | | 500,000 | 529,677 |
| | | | | $1,393,466 |
| Idaho - 0.2% |
| Idaho Health Facilities Authority Rev. (St. Luke's Health System Project), “A”, 5%, 3/01/2026 | | $ | 2,000,000 | $2,038,973 |
| Idaho Health Facilities Authority Rev. (St. Luke's Health System Project), “A”, 5%, 3/01/2027 | | | 2,100,000 | 2,163,945 |
| Idaho Housing and Finance Association, Multi-Family Housing Rev. (Sunset Landing Apartments Project), “A”, 0.7%, 7/01/2024 | | | 1,840,000 | 1,822,815 |
| | | | | $6,025,733 |
| Illinois - 9.2% |
| Bolingbrook, IL, Special Service Areas Taxes, AGM, 4%, 3/01/2025 | | $ | 1,500,000 | $1,501,999 |
| Bolingbrook, IL, Special Service Areas Taxes, AGM, 4%, 3/01/2027 | | | 1,500,000 | 1,519,005 |
| Chicago, IL, “A”, 5%, 1/01/2029 | | | 3,000,000 | 3,174,737 |
| Chicago, IL, “A”, 5%, 1/01/2031 | | | 2,000,000 | 2,108,067 |
| Chicago, IL, Board of Education (School Reform), Capital Appreciation, “A”, NPFG, 0%, 12/01/2028 | | | 4,435,000 | 3,640,049 |
| Chicago, IL, Board of Education (School Reform), Capital Appreciation, “B-1”, NPFG, 0%, 12/01/2026 | | | 1,925,000 | 1,724,208 |
| Chicago, IL, Board of Education, “A”, AAC, 5.5%, 12/01/2024 | | | 5,430,000 | 5,462,014 |
| Chicago, IL, Board of Education, Dedicated Capital Improvement Tax Bond, 5.25%, 4/01/2033 | | | 1,500,000 | 1,689,683 |
| Chicago, IL, Board of Education, Dedicated Capital Improvement Tax Bond, 5.25%, 4/01/2034 | | | 1,345,000 | 1,507,622 |
| Chicago, IL, Board of Education, Dedicated Capital Improvement Tax Bond, 5.75%, 4/01/2034 | | | 5,000,000 | 5,285,747 |
| Chicago, IL, Board of Education, Dedicated Capital Improvement Tax Bond, 5.75%, 4/01/2035 | | | 825,000 | 871,282 |
| Chicago, IL, Board of Education, Dedicated Capital Improvement Tax Bond, 6.1%, 4/01/2036 | | | 7,740,000 | 8,226,368 |
| Chicago, IL, Board of Education, Unlimited Tax General Obligation Dedicated Rev., “A”, 5%, 12/01/2034 | | | 5,000,000 | 5,306,926 |
| Chicago, IL, Board of Education, Unlimited Tax General Obligation Dedicated Rev., “A”, 5.25%, 12/01/2035 | | | 7,145,000 | 7,683,097 |
Portfolio of Investments – continued
| Issuer | | | Shares/Par | Value ($) |
| Municipal Bonds - continued |
| Illinois - continued |
| Chicago, IL, Board of Education, Unlimited Tax General Obligation Dedicated Rev., “A”, 7%, 12/01/2044 | | $ | 6,070,000 | $6,281,832 |
| Chicago, IL, Board of Education, Unlimited Tax General Obligation Dedicated Rev., “A”, AAC, 5.5%, 12/01/2028 | | | 1,685,000 | 1,739,080 |
| Chicago, IL, Board of Education, Unlimited Tax General Obligation Dedicated Rev., “A”, AAC, 5.5%, 12/01/2029 | | | 1,120,000 | 1,165,783 |
| Chicago, IL, Board of Education, Unlimited Tax General Obligation Dedicated Rev., “A”, AAC, 5.5%, 12/01/2030 | | | 845,000 | 886,335 |
| Chicago, IL, Board of Education, Unlimited Tax General Obligation Dedicated Rev., “A”, AAC, 5.5%, 12/01/2031 | | | 2,315,000 | 2,440,934 |
| Chicago, IL, Board of Education, Unlimited Tax General Obligation Refunding Dedicated Rev., “A”, 5%, 12/01/2029 | | | 1,260,000 | 1,319,105 |
| Chicago, IL, Board of Education, Unlimited Tax General Obligation Refunding Dedicated Rev., “A”, AGM, 5%, 12/01/2025 | | | 2,500,000 | 2,523,295 |
| Chicago, IL, Board of Education, Unlimited Tax General Obligation Refunding Dedicated Rev., “A”, AGM, 5%, 12/01/2026 | | | 3,000,000 | 3,072,199 |
| Chicago, IL, Board of Education, Unlimited Tax General Obligation Refunding Dedicated Rev., “A”, AGM, 5%, 12/01/2027 | | | 2,750,000 | 2,835,867 |
| Chicago, IL, Board of Education, Unlimited Tax General Obligation Refunding Dedicated Rev., “A”, AGM, 5%, 12/01/2028 | | | 2,250,000 | 2,344,039 |
| Chicago, IL, Board of Education, Unlimited Tax General Obligation Refunding Dedicated Rev., “C”, 5%, 12/01/2024 | | | 1,000,000 | 1,004,247 |
| Chicago, IL, Board of Education, Unlimited Tax General Obligation Refunding Dedicated Rev., “C”, AGM, 5%, 12/01/2027 | | | 10,000,000 | 10,312,243 |
| Chicago, IL, City Colleges Capital Improvement Project, Capital Appreciation, NPFG, 0%, 1/01/2026 | | | 6,640,000 | 6,222,978 |
| Chicago, IL, General Obligation, “A”, 5%, 1/01/2025 | | | 4,550,000 | 4,577,997 |
| Chicago, IL, General Obligation, “A”, 5%, 1/01/2028 | | | 4,265,000 | 4,453,139 |
| Chicago, IL, General Obligation, “A”, 5%, 1/01/2029 | | | 1,000,000 | 1,058,246 |
| Chicago, IL, General Obligation, “A”, 5%, 1/01/2033 | | | 1,000,000 | 1,086,983 |
| Chicago, IL, General Obligation, “A”, 5%, 1/01/2034 | | | 7,000,000 | 7,574,683 |
| Chicago, IL, Metropolitan Pier & Exposition Authority, Dedicated State Tax Rev. (McCormick Place Expansion Project), NPFG, 5.5%, 6/15/2029 | | | 3,110,000 | 3,200,359 |
| Chicago, IL, Metropolitan Pier & Exposition Authority, Dedicated State Tax Rev. Refunding Bonds (McCormick Place Expansion Project), Capital Appreciation, “B-1”, AGM, 0%, 6/15/2026 | | | 2,385,000 | 2,201,077 |
| Chicago, IL, Metropolitan Pier & Exposition Authority, Dedicated State Tax Rev., Capital Appreciation, “A”, NPFG, 0%, 6/15/2024 | | | 7,075,000 | 7,038,537 |
| Chicago, IL, Metropolitan Pier & Exposition Authority, Dedicated State Tax Rev., Capital Appreciation, “A”, NPFG, 0%, 12/15/2026 | | | 1,275,000 | 1,153,563 |
| Chicago, IL, Midway Airport Rev., Second Lien, “A”, BAM, 5%, 1/01/2031 | | | 10,000,000 | 10,830,049 |
Portfolio of Investments – continued
| Issuer | | | Shares/Par | Value ($) |
| Municipal Bonds - continued |
| Illinois - continued |
| Chicago, IL, Midway Airport Rev., Second Lien, “A”, BAM, 5%, 1/01/2032 | | $ | 1,000,000 | $1,093,688 |
| Chicago, IL, Midway Airport Rev., Second Lien, “A”, BAM, 5%, 1/01/2033 | | | 1,000,000 | 1,103,566 |
| Chicago, IL, Multi-Family Housing Rev. (Covent Apartments Project), 4%, 9/01/2025 (Put Date 9/01/2024) | | | 1,637,250 | 1,632,505 |
| Chicago, IL, O’Hare International Airport Rev., Senior Lien, “C”, 5%, 1/01/2025 | | | 2,000,000 | 2,010,053 |
| Chicago, IL, O’Hare International Airport Rev., Senior Lien, “C”, 5%, 1/01/2026 | | | 3,500,000 | 3,557,574 |
| Chicago, IL, O’Hare International Airport Rev., Special Facilities, 5%, 7/01/2033 | | | 2,000,000 | 2,053,978 |
| Chicago, IL, O'Hare International Airport Rev., Senior Lien, “A”, 5%, 1/01/2025 | | | 5,000,000 | 5,024,479 |
| Chicago, IL, O'Hare International Airport, Passenger Facility Charge Rev., “B”, 5%, 1/01/2030 | | | 580,000 | 580,282 |
| Chicago, IL, Transit Authority Capital Grant Receipts Refunding Rev. (Federal Transit Administration Section 5337 State Of Good Repair Formula Funds), 5%, 6/01/2025 | | | 150,000 | 151,408 |
| Chicago, IL,Wastewater Transmission Rev., Second Lien, “B”, AGM, 5%, 1/01/2027 | | | 1,500,000 | 1,559,297 |
| Cook County, IL, School District No. 111, General Obligation, AGM, 4%, 12/01/2029 | | | 550,000 | 557,159 |
| Country Club Hills, Cook County, IL, Refunding, BAM, 4%, 12/01/2024 | | | 1,180,000 | 1,180,733 |
| DuPage County, IL, Carol Stream Park District, “C”, BAM, 4%, 11/01/2024 | | | 215,000 | 215,019 |
| DuPage County, IL, Carol Stream Park District, “C”, BAM, 4%, 11/01/2025 | | | 450,000 | 452,535 |
| Franklin Park, IL, General Obligation Refunding Debt Certificates, “A”, BAM, 3%, 10/01/2024 | | | 270,000 | 268,288 |
| Illinois Finance Authority Rev. (Advocate Health Care Network), “A-1”, 4%, 11/01/2030 | | | 1,935,000 | 1,946,722 |
| Illinois Finance Authority Rev. (Dominican University), 5%, 3/01/2025 | | | 460,000 | 459,265 |
| Illinois Finance Authority Rev. (Dominican University), 5%, 3/01/2026 | | | 485,000 | 484,319 |
| Illinois Finance Authority Rev. (Dominican University), 5%, 3/01/2028 | | | 530,000 | 532,179 |
| Illinois Finance Authority Rev. (Dominican University), 5%, 3/01/2030 | | | 590,000 | 594,830 |
| Illinois Finance Authority Rev. (Edward-Elmhurst Healthcare), “A”, 5%, 1/01/2025 | | | 825,000 | 831,574 |
Portfolio of Investments – continued
| Issuer | | | Shares/Par | Value ($) |
| Municipal Bonds - continued |
| Illinois - continued |
| Illinois Finance Authority Rev. (OSF Healthcare System), “B-1”, 5%, 5/15/2050 (Put Date 11/15/2024) | | $ | 4,000,000 | $4,000,606 |
| Illinois Finance Authority Rev. (Plymouth Place, Inc.), “A”, 5.5%, 5/15/2029 | | | 805,000 | 803,232 |
| Illinois Finance Authority Rev. (Plymouth Place, Inc.), “A”, 5.75%, 5/15/2031 | | | 905,000 | 910,170 |
| Illinois Finance Authority Rev. (Plymouth Place, Inc.), “A”, 5.75%, 5/15/2032 | | | 955,000 | 958,019 |
| Illinois Finance Authority Rev. (Plymouth Place, Inc.), “A”, 6%, 5/15/2033 | | | 1,015,000 | 1,031,901 |
| Illinois Finance Authority Rev. (Plymouth Place, Inc.), “A”, 6%, 5/15/2034 | | | 1,075,000 | 1,085,683 |
| Illinois Finance Authority Rev. (Southern Illinois Healthcare Enterprises, Inc.), “C”, 5%, 3/01/2025 | | | 750,000 | 755,434 |
| Illinois Finance Authority Rev. (Southern Illinois Healthcare Enterprises, Inc.), “C”, 5%, 3/01/2026 | | | 750,000 | 760,108 |
| Illinois Finance Authority Rev., Taxable (Christian Horizons Obligated Group), “B”, 3.25%, 5/15/2027 | | | 1,035,000 | 439,875 |
| Illinois Finance Authority, Academic Facilities Lease Rev. (Provident Group - UIUC Properties LLC - University of Illinois at Urbana-Champaign Project), “A”, 5%, 10/01/2028 | | | 195,000 | 206,519 |
| Illinois Finance Authority, Academic Facilities Lease Rev. (Provident Group - UIUC Properties LLC - University of Illinois at Urbana-Champaign Project), “A”, 5%, 10/01/2030 | | | 250,000 | 267,168 |
| Illinois Finance Authority, Academic Facilities Lease Rev. (Provident Group - UIUC Properties LLC - University of Illinois at Urbana-Champaign Project), “A”, 5%, 10/01/2031 | | | 235,000 | 251,448 |
| Illinois Finance Authority, Graduate & Professional Student Loan Program Rev. (Midwestern University Foundation), “A”, 5%, 7/01/2024 | | | 1,350,000 | 1,351,146 |
| Illinois Finance Authority, Graduate & Professional Student Loan Program Rev. (Midwestern University Foundation), “A”, 5%, 7/01/2025 | | | 750,000 | 757,474 |
| Illinois Finance Authority, Graduate & Professional Student Loan Program Rev. (Midwestern University Foundation), “A”, 5%, 7/01/2025 | | | 225,000 | 227,242 |
| Illinois Finance Authority, Graduate & Professional Student Loan Program Rev. (Midwestern University Foundation), “A”, 5%, 7/01/2026 | | | 1,300,000 | 1,325,614 |
| Illinois Finance Authority, Graduate & Professional Student Loan Program Rev. (Midwestern University Foundation), “A”, 5%, 7/01/2026 | | | 240,000 | 244,629 |
Portfolio of Investments – continued
| Issuer | | | Shares/Par | Value ($) |
| Municipal Bonds - continued |
| Illinois - continued |
| Illinois Finance Authority, Graduate & Professional Student Loan Program Rev. (Midwestern University Foundation), “A”, 5%, 7/01/2027 | | $ | 1,250,000 | $1,289,565 |
| Illinois Finance Authority, Graduate & Professional Student Loan Program Rev. (Midwestern University Foundation), “A”, 5%, 7/01/2027 | | | 850,000 | 876,904 |
| Illinois Finance Authority, Graduate & Professional Student Loan Program Rev. (Midwestern University Foundation), “A”, 5%, 7/01/2029 | | | 600,000 | 632,996 |
| Illinois Finance Authority, Graduate & Professional Student Loan Program Rev. (Midwestern University Foundation), “A”, 3%, 7/01/2035 | | | 245,000 | 221,722 |
| Illinois Finance Authority, Health Services Facility Lease Rev. (Provident Group - UIC Surgery Center LLC - University of Illinois Health Services Facility Project), 5%, 10/01/2024 | | | 500,000 | 501,044 |
| Illinois Finance Authority, Health Services Facility Lease Rev. (Provident Group - UIC Surgery Center LLC - University of Illinois Health Services Facility Project), 5%, 10/01/2026 | | | 500,000 | 508,302 |
| Illinois Finance Authority, Health Services Facility Lease Rev. (Provident Group - UIC Surgery Center LLC - University of Illinois Health Services Facility Project), 5%, 10/01/2027 | | | 500,000 | 512,493 |
| Illinois Finance Authority, Health Services Facility Lease Rev. (Provident Group - UIC Surgery Center LLC - University of Illinois Health Services Facility Project), 5%, 10/01/2028 | | | 500,000 | 517,492 |
| Illinois Finance Authority, Health Services Facility Lease Rev. (Provident Group - UIC Surgery Center LLC - University of Illinois Health Services Facility Project), 5%, 10/01/2030 | | | 500,000 | 526,283 |
| Illinois Finance Authority, Health Services Facility Lease Rev. (Provident Group - UIC Surgery Center LLC - University of Illinois Health Services Facility Project), 5%, 10/01/2031 | | | 500,000 | 526,284 |
| Illinois Finance Authority, Health Services Facility Lease Rev. (Provident Group - UIC Surgery Center LLC - University of Illinois Health Services Facility Project), 5%, 10/01/2032 | | | 425,000 | 447,171 |
| Illinois Finance Authority, Health Services Facility Lease Rev. (Provident Group - UIC Surgery Center LLC - University of Illinois Health Services Facility Project), 5%, 10/01/2033 | | | 500,000 | 525,872 |
| Illinois Finance Authority, Water Facilities Refunding Rev. (American Water Capital Corp. Project), 3.875%, 5/01/2040 (Put Date 9/01/2028) | | | 2,190,000 | 2,170,561 |
| Illinois Housing Development Authority Multi-Family Housing Rev. (South Shore), GNMA, 4%, 6/01/2026 (Put Date 6/01/2025) | | | 6,175,000 | 6,143,410 |
| Illinois Housing Development Authority, Multi-Family Housing Rev. (Berry Manor), 4%, 9/01/2025 (Put Date 9/01/2024) | | | 500,000 | 498,945 |
Portfolio of Investments – continued
| Issuer | | | Shares/Par | Value ($) |
| Municipal Bonds - continued |
| Illinois - continued |
| Illinois Sports Facilities Authority Refunding Rev., BAM, 5%, 6/15/2029 | | $ | 2,405,000 | $2,557,856 |
| Illinois Sports Facilities Authority, State Tax Supported Refunding Rev., AGM, 5%, 6/15/2027 | | | 965,000 | 964,173 |
| Illinois Toll Highway Authority Senior Rev., “B”, 5%, 1/01/2040 | | | 9,000,000 | 9,159,520 |
| Kane County, IL, School District No. 131 Rev., “A”, AGM, 5%, 12/01/2025 | | | 340,000 | 346,797 |
| Kane County, IL, School District No. 131 Rev., “B”, AGM, 5%, 12/01/2025 | | | 700,000 | 713,994 |
| Macon County, IL, Decatur School District No. 61 General Obligation School Rev., “C”, AGM, 4%, 1/01/2025 | | | 545,000 | 544,884 |
| Madison County, IL, Edwardsville Community Unit School District No. 007, BAM, 3.375%, 12/01/2027 | | | 100,000 | 97,431 |
| Madison County, IL, Edwardsville Community Unit School District No. 007, BAM, 5%, 12/01/2028 | | | 450,000 | 456,225 |
| Madison County, IL, Edwardsville Community Unit School District No. 007, BAM, 5%, 12/01/2029 | | | 465,000 | 471,077 |
| Newport Township, IL, Fire Protection District, BAM, 4%, 1/01/2025 | | | 80,000 | 79,818 |
| Newport Township, IL, Fire Protection District, BAM, 4%, 1/01/2027 | | | 165,000 | 165,405 |
| Newport Township, IL, Fire Protection District, BAM, 4%, 1/01/2028 | | | 170,000 | 171,030 |
| Northern Illinois University, Auxiliary Facilities System Refunding Rev., “B”, BAM, 5%, 4/01/2025 | | | 425,000 | 428,309 |
| Northern Illinois University, Auxiliary Facilities System Refunding Rev., “B”, BAM, 5%, 4/01/2026 | | | 690,000 | 701,446 |
| Northern Illinois University, Auxiliary Facilities System Refunding Rev., “B”, BAM, 5%, 4/01/2027 | | | 525,000 | 539,461 |
| Northern Illinois University, Auxiliary Facilities System Refunding Rev., “B”, BAM, 5%, 4/01/2028 | | | 640,000 | 665,102 |
| Northern Illinois University, Auxiliary Facilities System Refunding Rev., “B”, BAM, 5%, 4/01/2030 | | | 1,000,000 | 1,052,582 |
| Northern Illinois University, Auxiliary Facilities System Refunding Rev., “B”, BAM, 5%, 4/01/2032 | | | 1,325,000 | 1,385,013 |
| Northern Illinois University, Auxiliary Facilities System Rev., BAM, 5%, 10/01/2025 | | | 325,000 | 329,358 |
| Northern Illinois University, Auxiliary Facilities System Rev., BAM, 5%, 10/01/2026 | | | 250,000 | 255,730 |
| Peoria, IL, Public Building Commission, School District Facilities Rev., “A”, AGM, 4%, 12/01/2025 | | | 700,000 | 701,318 |
| Sangamon County, IL, Springfield School District No. 186, “C”, AGM, 4%, 6/01/2024 | | | 785,000 | 784,634 |
Portfolio of Investments – continued
| Issuer | | | Shares/Par | Value ($) |
| Municipal Bonds - continued |
| Illinois - continued |
| Southern Illinois University Housing and Auxiliary Facilities System Rev., “A”, 4%, 4/01/2025 | | $ | 1,200,000 | $1,197,336 |
| Southern Illinois University Housing and Auxiliary Facilities System Rev., “A”, 4%, 4/01/2027 | | | 1,700,000 | 1,703,216 |
| Southwestern, IL, Development Authority Health Facility Rev. (Hospital Sisters Services, Inc.), “A”, 5%, 2/15/2025 | | | 1,000,000 | 1,004,807 |
| Southwestern, IL, Development Authority Health Facility Rev. (Hospital Sisters Services, Inc.), “A”, 5%, 2/15/2026 | | | 3,000,000 | 3,044,770 |
| St. Clair County, IL, Cahokia Community Unit School District No. 187, General Obligation, “A”, AGM, 5%, 1/01/2025 | | | 175,000 | 175,864 |
| St. Clair County, IL, Cahokia Community Unit School District No. 187, General Obligation, “A”, AGM, 5%, 1/01/2026 | | | 125,000 | 126,908 |
| St. Clair County, IL, Cahokia Community Unit School District No. 187, General Obligation, “A”, AGM, 5%, 1/01/2027 | | | 120,000 | 123,569 |
| St. Clair County, IL, Cahokia Community Unit School District No. 187, General Obligation, “A”, AGM, 5%, 1/01/2035 | | | 250,000 | 279,325 |
| St. Clair County, IL, Cahokia Community Unit School District No. 187, General Obligation, “A”, AGM, 5%, 1/01/2036 | | | 225,000 | 250,001 |
| St. Clair County, IL, Cahokia Community Unit School District No. 187, General Obligation, “A”, AGM, 5%, 1/01/2037 | | | 210,000 | 231,077 |
| St. Clair County, IL, Cahokia Community Unit School District No. 187, General Obligation, “B”, AGM, 5%, 1/01/2035 | | | 525,000 | 575,329 |
| St. Clair County, IL, Cahokia Community Unit School District No. 187, General Obligation, “B”, AGM, 5%, 1/01/2036 | | | 265,000 | 288,356 |
| St. Clair County, IL, Cahokia Community Unit School District No. 187, General Obligation, “B”, AGM, 5%, 1/01/2037 | | | 225,000 | 242,660 |
| State of Illinois, General Obligation, 5%, 2/01/2025 | | | 6,190,000 | 6,236,384 |
| State of Illinois, General Obligation, AGM, 5%, 2/01/2027 | | | 910,000 | 910,947 |
| State of Illinois, General Obligation, “A”, 5%, 11/01/2027 | | | 5,365,000 | 5,605,413 |
| State of Illinois, Sales Tax Rev., BAM, 5%, 6/15/2025 | | | 240,000 | 240,262 |
| Upper Illinois River Valley Development Authority Rev. (Morris Hospital), 5%, 12/01/2025 | | | 380,000 | 382,425 |
| Upper Illinois River Valley Development Authority Rev. (Morris Hospital), 5%, 12/01/2026 | | | 915,000 | 927,579 |
| | | | | $238,705,530 |
| Indiana - 2.3% |
| Ball State University Board of Trustees (Student Fee), “R”, 5%, 7/01/2024 | | $ | 1,000,000 | $1,001,578 |
| Brownsburg, IN, 1999 School Building Corp., Anticipation Notes, “A”, 4.5%, 3/15/2025 | | | 7,500,000 | 7,516,617 |
| Dekalb & Steuben Counties, GA, Central School Buildings Corp. Property Tax, 4%, 7/15/2024 | | | 640,000 | 639,401 |
Portfolio of Investments – continued
| Issuer | | | Shares/Par | Value ($) |
| Municipal Bonds - continued |
| Indiana - continued |
| Dekalb & Steuben Counties, GA, Central School Buildings Corp. Property Tax, 4%, 7/15/2025 | | $ | 570,000 | $570,801 |
| Indiana Finance Authority Refunding Rev., Taxable (BHI Senior Living), “B”, 1.99%, 11/15/2024 | | | 350,000 | 342,078 |
| Indiana Finance Authority Refunding Rev., Taxable (BHI Senior Living), “B”, 3.21%, 11/15/2028 | | | 115,000 | 101,141 |
| Indiana Finance Authority Rev., Taxable (BHI Senior Living), “B”, 2.52%, 11/15/2026 | | | 515,000 | 469,800 |
| Indiana Finance Authority, Educational Facilities Rev. (Rose-Hulman Institute of Technology Project), 4.5%, 6/01/2033 | | | 3,425,000 | 3,471,197 |
| Indiana Finance Authority, Educational Facilities Rev. (Valparaiso University Project), 5%, 10/01/2026 | | | 270,000 | 271,906 |
| Indiana Finance Authority, Environmental Facilities Refunding Rev. (Indianapolis Power & Light Co.), “B”, 0.95%, 12/01/2038 (Put Date 4/01/2026) | | | 1,655,000 | 1,527,769 |
| Indiana Finance Authority, Hospital Rev. (Goshen Health), “A”, 5%, 11/01/2027 | | | 740,000 | 762,440 |
| Indiana Finance Authority, Hospital Rev. (Goshen Health), “A”, 5%, 11/01/2028 | | | 775,000 | 804,516 |
| Indiana Finance Authority, Hospital Rev. (Goshen Health), “A”, 5%, 11/01/2029 | | | 1,140,000 | 1,174,240 |
| Indiana Finance Authority, Hospital Rev. (Goshen Health), “A”, 5%, 11/01/2030 | | | 985,000 | 1,011,838 |
| Indiana Finance Authority, Hospital Rev. (Goshen Health), “A”, 2.1%, 11/01/2049 (Put Date 11/01/2026) | | | 2,700,000 | 2,549,846 |
| Indiana Secondary Market for Education Loans, Inc., Student Loan Program Rev., “1A”, 5%, 6/01/2024 | | | 1,000,000 | 1,000,334 |
| Indiana Secondary Market for Education Loans, Inc., Student Loan Program Rev., “1A”, 5%, 6/01/2025 | | | 1,250,000 | 1,255,970 |
| Indiana Secondary Market for Education Loans, Inc., Student Loan Program Rev., “1A”, 5%, 6/01/2026 | | | 2,000,000 | 2,022,688 |
| Indiana Secondary Market for Education Loans, Inc., Student Loan Program Rev., “1A”, 5%, 6/01/2027 | | | 2,000,000 | 2,042,519 |
| Indiana Secondary Market for Education Loans, Inc., Student Loan Program Rev., “1A”, 5%, 6/01/2028 | | | 1,750,000 | 1,798,366 |
| Indiana Secondary Market for Education Loans, Inc., Student Loan Program Rev., “1A”, 5%, 6/01/2029 | | | 1,500,000 | 1,552,325 |
| Indiana Secondary Market for Education Loans, Inc., Student Loan Program Rev., “1A”, 5%, 6/01/2030 | | | 1,450,000 | 1,507,731 |
| Indiana Secondary Market for Education Loans, Inc., Student Loan Program Rev., “1A”, 5%, 6/01/2031 | | | 520,000 | 542,772 |
| Indianapolis, IN, Local Public Improvement Bond Bank (Indianapolis Airport Authority Project), “I”, 5%, 1/01/2028 | | | 1,000,000 | 1,005,769 |
Portfolio of Investments – continued
| Issuer | | | Shares/Par | Value ($) |
| Municipal Bonds - continued |
| Indiana - continued |
| Indianapolis, IN, Local Public Improvement Bond Bank, Convention Center Hotel Rev, “E”, 5%, 3/01/2033 | | $ | 1,000,000 | $1,083,402 |
| Jefferson County, IN, Jail Building Corp., Lease Rental Rev., BAM, 4%, 7/15/2024 | | | 690,000 | 689,890 |
| Jefferson County, IN, Jail Building Corp., Lease Rental Rev., BAM, 4%, 1/15/2025 | | | 355,000 | 355,393 |
| Jefferson County, IN, Jail Building Corp., Lease Rental Rev., BAM, 4%, 7/15/2025 | | | 360,000 | 361,011 |
| Lake County, IN, Hammond Multi-School Building Corp., 5%, 7/15/2025 | | | 1,500,000 | 1,522,559 |
| Lake County, IN, Hammond Multi-School Building Corp., 5%, 7/15/2026 | | | 1,210,000 | 1,242,694 |
| Lake County, IN, Hammond Multi-School Building Corp., 5%, 1/15/2027 | | | 1,515,000 | 1,564,200 |
| Lake County, IN, Hammond Multi-School Building Corp., 5%, 7/15/2027 | | | 1,000,000 | 1,038,934 |
| Lake County, IN, Hammond Multi-School Building Corp., 5%, 1/15/2028 | | | 1,000,000 | 1,045,427 |
| Valparaiso, IN, Exempt Facilities Rev. (Pratt Paper LLC Project), 4.5%, 1/01/2034 (w) | | | 2,650,000 | 2,677,819 |
| Whiting, IN, Environmental Facilities Rev. (BP Products North America, Inc. Project), 4.4%, 11/01/2045 (Put Date 6/10/2031) | | | 5,000,000 | 5,028,834 |
| Whiting, IN, Environmental Facilities Rev. (BP Products North America, Inc. Project), 5%, 11/01/2047 (Put Date 11/01/2024) | | | 7,500,000 | 7,509,448 |
| | | | | $59,063,253 |
| Iowa - 0.4% |
| Iowa Student Loan Liquidity Corp. Rev., “A”, 5%, 12/01/2024 | | $ | 1,000,000 | $1,003,336 |
| Iowa Student Loan Liquidity Corp. Rev., “A”, 5%, 12/01/2025 | | | 1,425,000 | 1,438,424 |
| Iowa Student Loan Liquidity Corp. Rev., “B”, 5%, 12/01/2030 | | | 2,000,000 | 2,098,437 |
| Iowa Student Loan Liquidity Corp. Rev., “B”, 5%, 12/01/2031 | | | 2,100,000 | 2,216,571 |
| Iowa Student Loan Liquidity Corp. Rev., “B”, 5%, 12/01/2032 | | | 3,750,000 | 3,951,365 |
| | | | | $10,708,133 |
| Kansas - 0.7% |
| Coffeyville, KS, Electric Utility System Rev., “B”, NPFG, 5%, 6/01/2024 (n) | | $ | 1,300,000 | $1,298,775 |
| Manhattan, KS, Health Care Facilities Rev. (Meadowlark Hills), “A”, 4%, 6/01/2025 | | | 85,000 | 84,607 |
| Manhattan, KS, Health Care Facilities Rev. (Meadowlark Hills), “A”, 4%, 6/01/2026 | | | 320,000 | 316,909 |
| Manhattan, KS, Health Care Facilities Rev. (Meadowlark Hills), “A”, 4%, 6/01/2027 | | | 330,000 | 324,921 |
Portfolio of Investments – continued
| Issuer | | | Shares/Par | Value ($) |
| Municipal Bonds - continued |
| Kansas - continued |
| Manhattan, KS, Health Care Facilities Rev. (Meadowlark Hills), “A”, 4%, 6/01/2028 | | $ | 300,000 | $293,472 |
| Overland Park, KS, Development Corp. Improvement and Refunding Rev. (Overland Park Convention Center Hotel), 5%, 3/01/2026 | | | 1,770,000 | 1,763,915 |
| Overland Park, KS, Development Corp. Improvement and Refunding Rev. (Overland Park Convention Center Hotel), 5%, 3/01/2027 | | | 1,865,000 | 1,858,934 |
| Overland Park, KS, Development Corp. Improvement and Refunding Rev. (Overland Park Convention Center Hotel), 5%, 3/01/2028 | | | 1,960,000 | 1,955,202 |
| Overland Park, KS, Development Corp. Improvement and Refunding Rev. (Overland Park Convention Center Hotel), 5%, 3/01/2029 | | | 2,060,000 | 2,057,895 |
| Overland Park, KS, Development Corp. Improvement and Refunding Rev. (Overland Park Convention Center Hotel), 5%, 3/01/2030 | | | 2,165,000 | 2,167,992 |
| Overland Park, KS, Development Corp. Improvement and Refunding Rev. (Overland Park Convention Center Hotel), 5%, 3/01/2031 | | | 2,270,000 | 2,272,213 |
| Topeka, KS, Health Care Facilities Rev. (Brewster Place), “A”, 5.75%, 12/01/2033 | | | 2,010,000 | 2,020,004 |
| Topeka, KS, Health Care Facilities Rev. (Brewster Place), “B”, 5.125%, 12/01/2026 | | | 1,000,000 | 995,785 |
| | | | | $17,410,624 |
| Kentucky - 2.6% |
| Boone County, KY, Pollution Control Rev. (Duke Energy Kentucky, Inc. Project), “A”, 3.7%, 8/01/2027 | | $ | 4,500,000 | $4,439,862 |
| Carroll County, KY, Environmental Facilities Rev. (Utilities Company Project), “A”, 3.375%, 2/01/2026 | | | 10,000,000 | 9,677,762 |
| Hazard, KY, Healthcare Rev. (Appalachian Regional Healthcare Project), 5%, 7/01/2024 | | | 225,000 | 225,191 |
| Hazard, KY, Healthcare Rev. (Appalachian Regional Healthcare Project), 5%, 7/01/2025 | | | 270,000 | 272,997 |
| Hazard, KY, Healthcare Rev. (Appalachian Regional Healthcare Project), 5%, 7/01/2026 | | | 225,000 | 230,004 |
| Henderson, KY, Exempt Facilities Rev. (Pratt Paper LLC Project), “B”, 3.7%, 1/01/2032 (n) | | | 2,595,000 | 2,505,660 |
| Kentucky Economic Development Finance Authority Hospital Rev. (Owensboro Health, Inc.), “A”, 5%, 6/01/2025 | | | 1,750,000 | 1,748,134 |
| Kentucky Economic Development Finance Authority Hospital Rev. (Owensboro Health, Inc.), “A”, 5%, 6/01/2026 | | | 2,000,000 | 2,016,264 |
Portfolio of Investments – continued
| Issuer | | | Shares/Par | Value ($) |
| Municipal Bonds - continued |
| Kentucky - continued |
| Kentucky Economic Development Finance Authority Hospital Rev. (Owensboro Health, Inc.), “A”, 5%, 6/01/2027 | | $ | 2,625,000 | $2,668,500 |
| Kentucky Higher Education Student Loan Corp. Rev., “A-1”, 5%, 6/01/2024 | | | 700,000 | 700,234 |
| Kentucky Higher Education Student Loan Corp. Rev., “A-1”, 5%, 6/01/2024 | | | 500,000 | 500,167 |
| Kentucky Higher Education Student Loan Corp. Rev., “A-1”, 5%, 6/01/2025 | | | 1,350,000 | 1,360,273 |
| Kentucky Higher Education Student Loan Corp. Rev., “A-1”, 5%, 6/01/2025 | | | 750,000 | 755,707 |
| Kentucky Higher Education Student Loan Corp. Rev., “A-1”, 5%, 6/01/2026 | | | 2,000,000 | 2,032,230 |
| Kentucky Higher Education Student Loan Corp. Rev., “A-1”, 5%, 6/01/2026 | | | 950,000 | 965,309 |
| Kentucky Higher Education Student Loan Corp. Rev., “A-1”, 5%, 6/01/2027 | | | 3,000,000 | 3,067,257 |
| Kentucky Higher Education Student Loan Corp. Rev., “A-1”, 5%, 6/01/2027 | | | 1,000,000 | 1,022,419 |
| Kentucky Higher Education Student Loan Corp. Rev., “A-1”, 5%, 6/01/2028 | | | 1,150,000 | 1,186,566 |
| Kentucky Higher Education Student Loan Corp. Rev., “A-1”, 5%, 6/01/2029 | | | 700,000 | 727,988 |
| Kentucky Higher Education Student Loan Corp. Rev., “A-1”, 5%, 6/01/2029 | | | 1,250,000 | 1,299,978 |
| Kentucky Housing Corp., Single Family Mortgage Rev., “A”, GNMA, 6.25%, 7/01/2054 | | | 10,000,000 | 11,034,168 |
| Kentucky State University Certificates of Participation, BAM, 5%, 11/01/2025 | | | 160,000 | 163,000 |
| Kentucky State University, Certificates of Participation, BAM, 5%, 11/01/2024 | | | 95,000 | 95,464 |
| Louisville & Jefferson County, KY, Metro Government College Improvement Rev. (Bellarmine University Project), “A”, 4%, 5/01/2026 | | | 1,190,000 | 1,147,002 |
| Louisville & Jefferson County, KY, Metro Government College Improvement Rev. (Bellarmine University Project), “A”, 4%, 5/01/2027 | | | 1,105,000 | 1,049,680 |
| Owen County, KY, Water Facilities Refunding Rev. (Kentucky-American Water Co. Project), 3.875%, 6/01/2040 (Put Date 9/01/2028) | | | 2,385,000 | 2,373,224 |
| Public Energy Authority of Kentucky, Gas Supply Rev., “B”, 4%, 1/01/2049 (Put Date 1/01/2025) | | | 1,785,000 | 1,784,319 |
| Public Energy Authority of Kentucky, Gas Supply Rev., “C-1”, 4%, 12/01/2049 (Put Date 6/01/2025) | | | 5,000,000 | 4,998,714 |
Portfolio of Investments – continued
| Issuer | | | Shares/Par | Value ($) |
| Municipal Bonds - continued |
| Kentucky - continued |
| Trimble County, KY, Environmental Facilities Rev. (Kentucky Utilities Co. Project), “A”, 4.7%, 6/01/2054 (Put Date 6/01/2027) | | $ | 945,000 | $945,876 |
| Trimble County, KY, Environmental Facilities Rev. (Louisville Gas & Electric Co. Project), “A”, 4.7%, 6/01/2054 (Put Date 6/01/2027) | | | 6,075,000 | 6,080,634 |
| | | | | $67,074,583 |
| Louisiana - 0.5% |
| Capital Area Finance Authority, LA, Single Family Mortgage Rev., GNMA, 6.5%, 4/01/2054 | | $ | 4,430,000 | $4,936,448 |
| Louisiana Local Government, Environmental Facilities & Community Development Authority Rev., Taxable (LCTCS Act 360 Project), AGM, 0.682%, 10/01/2024 | | | 500,000 | 490,222 |
| Louisiana Local Government, Environmental Facilities & Community Development Authority Rev., Taxable (LCTCS Act 360 Project), AGM, 0.965%, 10/01/2025 | | | 750,000 | 704,813 |
| Louisiana Local Government, Environmental Facilities & Community Development Authority Rev., Taxable (LCTCS Act 360 Project), AGM, 1.165%, 10/01/2026 | | | 330,000 | 299,305 |
| Louisiana Local Government, Environmental Facilities & Community Development Authority Rev., Taxable (LCTCS Act 360 Project), AGM, 1.406%, 10/01/2027 | | | 460,000 | 405,650 |
| Louisiana Local Government, Environmental Facilities & Community Development Authority Rev., Taxable (LCTCS Act 360 Project), AGM, 1.656%, 10/01/2028 | | | 1,285,000 | 1,108,291 |
| Louisiana Public Facilities Authority Refunding Rev. (Loyola University Project), 5%, 10/01/2025 | | | 300,000 | 303,391 |
| New Orleans, LA, Aviation Board General Airport Rev. (North Terminal Project), “B”, 4%, 1/01/2026 | | | 4,105,000 | 4,094,017 |
| New Orleans, LA, Sewerage Services Rev., 5%, 6/01/2024 | | | 350,000 | 350,217 |
| Shreveport, LA, Water & Sewer Rev., “B”, AGM, 5%, 12/01/2027 | | | 670,000 | 700,299 |
| | | | | $13,392,653 |
| Maine - 0.0% |
| Maine Finance Authority, Student Loan Rev., “A”, AGM, 5%, 12/01/2024 | | $ | 310,000 | $311,317 |
| Maine Finance Authority, Student Loan Rev., “A”, AGM, 5%, 12/01/2025 | | | 330,000 | 333,611 |
| Maine Finance Authority, Student Loan Rev., “A”, AGM, 5%, 12/01/2026 | | | 360,000 | 365,233 |
| | | | | $1,010,161 |
Portfolio of Investments – continued
| Issuer | | | Shares/Par | Value ($) |
| Municipal Bonds - continued |
| Maryland - 0.5% |
| Baltimore, MD, Convention Center Hotel Rev., 5%, 9/01/2024 | | $ | 850,000 | $848,751 |
| Baltimore, MD, Convention Center Hotel Rev., 5%, 9/01/2030 | | | 1,000,000 | 1,006,405 |
| Brunswick, MD, Special Obligation Refunding (Brunswick Crossing Special Taxing District), 3%, 7/01/2024 | | | 245,000 | 244,353 |
| Howard County, MD, Special Obligation (Downtown Columbia Project), “A”, 4%, 2/15/2028 (n) | | | 350,000 | 342,110 |
| Maryland Community Development Administration, Department of Housing & Community Development Housing Rev., “D”, 4%, 9/01/2036 | | | 295,000 | 293,103 |
| Maryland Economic Development Corp., Student Housing Rev. (University of Maryland College Park), AGM, 4%, 6/01/2024 | | | 1,350,000 | 1,349,347 |
| Maryland Economic Development Corp., Student Housing Rev. (University of Maryland College Park), AGM, 4%, 6/01/2025 | | | 1,600,000 | 1,603,734 |
| Maryland Economic Development Corp., Student Housing Rev. (University of Maryland College Park), AGM, 4%, 6/01/2026 | | | 650,000 | 654,110 |
| Maryland Health & Higher Educational Facilities Authority Rev. (Adventist Healthcare), 5%, 1/01/2025 | | | 475,000 | 475,863 |
| Maryland Health & Higher Educational Facilities Authority Rev. (Adventist Healthcare), 5%, 1/01/2026 | | | 495,000 | 499,776 |
| Maryland Health & Higher Educational Facilities Authority Rev. (Adventist Healthcare), 5%, 1/01/2027 | | | 430,000 | 436,670 |
| Maryland Health & Higher Educational Facilities Authority Rev. (Adventist Healthcare), 5%, 1/01/2028 | | | 300,000 | 307,402 |
| Maryland Health & Higher Educational Facilities Authority Rev. (Adventist Healthcare), 5%, 1/01/2029 | | | 290,000 | 299,630 |
| Maryland Health & Higher Educational Facilities Authority Rev. (Adventist Healthcare), 5%, 1/01/2030 | | | 285,000 | 296,574 |
| Maryland Health & Higher Educational Facilities Authority Rev. (Medstar Health Issue), 5%, 8/15/2025 | | | 3,490,000 | 3,516,908 |
| | | | | $12,174,736 |
| Massachusetts - 1.7% |
| Massachusetts Development Finance Agency Refunding Rev. (Suffolk University), 5%, 7/01/2026 | | $ | 475,000 | $482,210 |
| Massachusetts Development Finance Agency Refunding Rev. (Suffolk University), 5%, 7/01/2027 | | | 600,000 | 615,605 |
| Massachusetts Development Finance Agency Refunding Rev. (Suffolk University), 5%, 7/01/2028 | | | 520,000 | 540,604 |
| Massachusetts Development Finance Agency Rev. (Caregroup, Inc.), “I”, 5%, 7/01/2027 | | | 2,435,000 | 2,499,203 |
| Massachusetts Development Finance Agency Rev. (Lasell University), 4%, 7/01/2024 | | | 225,000 | 224,604 |
Portfolio of Investments – continued
| Issuer | | | Shares/Par | Value ($) |
| Municipal Bonds - continued |
| Massachusetts - continued |
| Massachusetts Development Finance Agency Rev. (Lasell University), 4%, 7/01/2025 | | $ | 230,000 | $227,787 |
| Massachusetts Development Finance Agency Rev. (Lasell University), 4%, 7/01/2026 | | | 145,000 | 142,941 |
| Massachusetts Development Finance Agency Rev. (Lasell University), 4%, 7/01/2027 | | | 255,000 | 250,492 |
| Massachusetts Development Finance Agency Rev. (Lasell University), 4%, 7/01/2028 | | | 330,000 | 322,988 |
| Massachusetts Development Finance Agency Rev. (Sabis International Charter School Issue), 5%, 4/15/2025 | | | 55,000 | 54,833 |
| Massachusetts Development Finance Agency Rev. (Suffolk University), 5%, 7/01/2025 | | | 1,500,000 | 1,509,965 |
| Massachusetts Development Finance Agency Rev. (Suffolk University), 5%, 7/01/2026 | | | 1,750,000 | 1,776,564 |
| Massachusetts Development Finance Agency Rev. (Suffolk University), 5%, 7/01/2027 | | | 2,000,000 | 2,052,016 |
| Massachusetts Development Finance Agency Rev. (UMass Memorial Health Care Obligated Group), “I”, 5%, 7/01/2024 | | | 1,000,000 | 1,000,744 |
| Massachusetts Development Finance Agency Rev. (Wellforce, Inc.), “A”, 5%, 7/01/2025 | | | 1,150,000 | 1,155,435 |
| Massachusetts Development Finance Agency Rev. (Wellforce, Inc.), “A”, 5%, 7/01/2026 | | | 1,500,000 | 1,503,566 |
| Massachusetts Development Finance Agency Rev. (Wellforce, Inc.), “A”, 5%, 7/01/2027 | | | 1,000,000 | 1,004,083 |
| Massachusetts Development Finance Agency Rev. (Wellforce, Inc.), “A”, 5%, 7/01/2028 | | | 780,000 | 787,509 |
| Massachusetts Development Finance Agency Rev. (Wellforce, Inc.), “A”, 5%, 7/01/2029 | | | 850,000 | 861,307 |
| Massachusetts Development Finance Agency Rev. (Wellforce, Inc.), “C”, AGM, 5%, 10/01/2024 | | | 365,000 | 366,066 |
| Massachusetts Development Finance Agency Rev. (Wellforce, Inc.), “C”, AGM, 5%, 10/01/2025 | | | 350,000 | 354,645 |
| Massachusetts Development Finance Agency Rev. (Wellforce, Inc.), “C”, AGM, 5%, 10/01/2026 | | | 350,000 | 359,320 |
| Massachusetts Development Finance Agency Rev. (Williams College), “N”, 0.45%, 7/01/2041 (Put Date 7/01/2025) | | | 3,455,000 | 3,278,214 |
| Massachusetts Educational Financing Authority, Education Loan Rev., “B”, 5%, 7/01/2024 | | | 600,000 | 600,805 |
| Massachusetts Educational Financing Authority, Education Loan Rev., “B”, 5%, 7/01/2025 | | | 850,000 | 860,467 |
| Massachusetts Educational Financing Authority, Education Loan Rev., “B”, 5%, 7/01/2026 | | | 1,000,000 | 1,016,383 |
Portfolio of Investments – continued
| Issuer | | | Shares/Par | Value ($) |
| Municipal Bonds - continued |
| Massachusetts - continued |
| Massachusetts Educational Financing Authority, Education Loan Rev., “B”, 5%, 7/01/2027 | | $ | 1,500,000 | $1,541,181 |
| Massachusetts Educational Financing Authority, Education Loan Rev., “C”, 2.625%, 7/01/2036 | | | 45,000 | 44,640 |
| Massachusetts Educational Financing Authority, Education Loan Rev., “I”, 5%, 1/01/2025 | | | 3,450,000 | 3,471,997 |
| Massachusetts Educational Financing Authority, Education Loan Rev., “J”, 3.5%, 7/01/2033 | | | 5,005,000 | 4,781,948 |
| Massachusetts Educational Financing Authority, Education Loan Rev., Issue L, “B”, 4.25%, 7/01/2044 | | | 4,000,000 | 3,864,900 |
| Massachusetts Educational Financing Authority, Education Loan Rev., Issue M, “B”, 3.625%, 7/01/2038 | | | 3,725,000 | 3,352,148 |
| Massachusetts Housing Finance Agency Rev., “D-3”, FHA, 3.3%, 12/01/2026 | | | 1,000,000 | 986,198 |
| Massachusetts Housing Finance Agency, “A-3”, 3.05%, 12/01/2027 | | | 2,000,000 | 1,952,288 |
| | | | | $43,843,656 |
| Michigan - 3.3% |
| Detroit, MI, Downtown Development Authority Subordinate Tax Rev. (General Development Area No. 1 Project), “B”, AGM, 5%, 7/01/2025 | | $ | 1,000,000 | $1,001,398 |
| Detroit, MI, Downtown Development Authority Tax Increment Refunding Rev. (Catalyst Development Project), “A”, AGM, 5%, 7/01/2033 | | | 1,900,000 | 1,901,043 |
| Detroit, MI, Downtown Development Authority Tax Increment Rev. (Catalyst Development), “A”, AGM, 5%, 7/01/2029 | | | 1,000,000 | 1,000,913 |
| Flint, MI, Public Library Building & Site Rev., AGM, 3%, 5/01/2024 | | | 1,075,000 | 1,075,000 |
| Flint, MI, Public Library Building & Site Rev., AGM, 3%, 5/01/2025 | | | 675,000 | 665,835 |
| Lake Superior State University Board of Trustees General Refunding Rev., AGM, 4%, 11/15/2024 | | | 550,000 | 549,704 |
| Lincoln, MI, Consolidated School District, Counties of Washtenaw & Wayne Refunding (General Obligation - Unlimited Tax), Taxable, 0.55%, 5/01/2024 | | | 2,340,000 | 2,340,000 |
| Lincoln, MI, Consolidated School District, Counties of Washtenaw & Wayne Refunding (General Obligation - Unlimited Tax), Taxable, 0.83%, 5/01/2025 | | | 1,000,000 | 955,535 |
| Michigan Finance Authority Hospital Rev. (Bronson Healthcare Group Inc.), “B”, 5%, 11/15/2044 (Put Date 11/16/2026) | | | 8,405,000 | 8,595,451 |
| Michigan Finance Authority Hospital Rev. (McLaren Health Care), “D-1”, 1.2%, 10/15/2030 (Put Date 4/13/2028) | | | 1,470,000 | 1,297,653 |
| Michigan Finance Authority Hospital Rev. (McLaren Health Care), “D-2”, 1.2%, 10/15/2038 (Put Date 4/13/2028) | | | 1,850,000 | 1,633,101 |
Portfolio of Investments – continued
| Issuer | | | Shares/Par | Value ($) |
| Municipal Bonds - continued |
| Michigan - continued |
| Michigan Finance Authority Hospital Rev. (Trinity Health Credit Group), 5%, 12/01/2044 (Put Date 2/01/2025) | | $ | 10,000,000 | $10,076,529 |
| Michigan Finance Authority Local Government Loan Program Rev. (Detroit Water and Sewerage Department Sewage Disposal System Rev. Refunding Second Lien Local Project), “C”, 5%, 7/01/2026 | | | 1,000,000 | 1,010,150 |
| Michigan Finance Authority Tobacco Settlement Asset-Backed Rev. (2007 Sold Tobacco Receipts), “A”, 5%, 6/01/2030 | | | 2,000,000 | 2,162,977 |
| Michigan Finance Authority Tobacco Settlement Asset-Backed Rev., Taxable (2006 Sold Tobacco Receipts), “A-1”, 2.326%, 6/01/2030 | | | 837,799 | 816,793 |
| Michigan Housing Development Authority, Multi-Family Housing Rev. (Clark Road Senior Apartments Project), 4.5%, 12/01/2042 (Put Date 4/01/2026) | | | 7,735,000 | 7,775,571 |
| Michigan Housing Development Authority, Rental Housing Rev., “A”, 0.55%, 4/01/2025 | | | 1,715,000 | 1,642,440 |
| Michigan Housing Development Authority, Single Family Mortgage Rev., “D”, 5.5%, 6/01/2053 | | | 3,335,000 | 3,473,704 |
| Michigan Strategic Fund Limited Obligation Rev. (DTE Electric Co. Exempt Facilities Project), “DT”, 3.875%, 6/01/2053 (Put Date 6/03/2030) | | | 10,750,000 | 10,686,840 |
| Michigan Strategic Fund Limited Obligation Rev. (I-75 Improvement Project), AGM, 4.125%, 6/30/2035 | | | 2,515,000 | 2,500,898 |
| Michigan Strategic Fund Ltd. Obligation Rev. (Consumers Energy Company Project), 0.875%, 4/01/2035 (Put Date 10/08/2026) | | | 6,680,000 | 5,985,072 |
| Michigan Strategic Fund Ltd. Obligation Rev. (I-75 Improvement Project), 5%, 12/31/2027 | | | 2,000,000 | 2,046,191 |
| Michigan Strategic Fund Ltd. Obligation Rev. (I-75 Improvement Project), 5%, 6/30/2028 | | | 3,000,000 | 3,081,697 |
| Michigan Strategic Fund Ltd. Obligation Rev. (I-75 Improvement Project), 5%, 12/31/2028 | | | 3,000,000 | 3,093,652 |
| Saginaw, MI, Hospital Finance Authority Rev. (Covenant Medical Center, Inc.), “J”, 5%, 7/01/2027 | | | 1,000,000 | 1,033,806 |
| Saginaw, MI, Hospital Finance Authority Rev. (Covenant Medical Center, Inc.), “J”, 5%, 7/01/2030 | | | 500,000 | 534,991 |
| Wayne County, MI, Airport Authority Rev. (Detroit Metropolitan Wayne County Airport), “D”, 5%, 12/01/2024 | | | 250,000 | 251,695 |
| Wayne County, MI, Airport Authority Rev. (Detroit Metropolitan Wayne County Airport), “D”, 5%, 12/01/2025 | | | 350,000 | 357,827 |
| Wayne County, MI, Airport Authority Rev. (Detroit Metropolitan Wayne County Airport), “D”, 5%, 12/01/2026 | | | 1,745,000 | 1,795,231 |
| Wayne County, MI, Airport Authority Rev. (Detroit Metropolitan Wayne County Airport), “D”, 5%, 12/01/2027 | | | 2,775,000 | 2,891,769 |
Portfolio of Investments – continued
| Issuer | | | Shares/Par | Value ($) |
| Municipal Bonds - continued |
| Michigan - continued |
| Wayne County, MI, Airport Authority Rev. (Detroit Metropolitan Wayne County Airport), “D”, 5%, 12/01/2028 | | $ | 2,595,000 | $2,732,430 |
| | | | | $84,965,896 |
| Minnesota - 0.5% |
| Duluth, MN, Economic Development Authority Rev. (Benedictine Health System), “A”, 3%, 7/01/2025 | | $ | 400,000 | $388,637 |
| Duluth, MN, Economic Development Authority Rev. (Benedictine Health System), “A”, 3%, 7/01/2026 | | | 235,000 | 223,662 |
| Duluth, MN, Independent School District No. 709, “A”, COP, 3.25%, 3/01/2025 | | | 675,000 | 671,987 |
| Duluth, MN, Independent School District No. 709, “B”, COP, STAPRP, 5%, 2/01/2025 | | | 135,000 | 136,290 |
| Duluth, MN, Independent School District No. 709, “A”, COP, 5%, 2/01/2025 | | | 500,000 | 504,776 |
| Minnesota Housing Finance Agency, Rental Housing, “A”, GNMA, 2.3%, 8/01/2024 | | | 1,000,000 | 993,444 |
| Minnesota Housing Finance Agency, Rental Housing, “C”, GNMA, 3.8%, 2/01/2025 | | | 1,885,000 | 1,876,379 |
| Minnesota Housing Finance Agency, Residential Housing, “C”, GNMA, 0.7%, 7/01/2024 | | | 375,000 | 371,683 |
| Minnesota Housing Finance Agency, Residential Housing, “O”, GNMA, 6%, 7/01/2053 | | | 5,000,000 | 5,325,635 |
| Minnesota Office of Higher Education Supplemental Student Loan Program Rev., 5%, 11/01/2024 | | | 615,000 | 616,402 |
| Minnesota Office of Higher Education Supplemental Student Loan Program Rev., 5%, 11/01/2025 | | | 850,000 | 856,209 |
| Minnesota Office of Higher Education Supplemental Student Loan Program Rev., 5%, 11/01/2026 | | | 700,000 | 712,470 |
| Minnesota Office of Higher Education Supplemental Student Loan Program Rev., 5%, 11/01/2027 | | | 700,000 | 717,977 |
| | | | | $13,395,551 |
| Mississippi - 1.2% |
| Gulfport, MS, Hospital Facilities Rev. (Memorial Hospital at Gulfport Project), 5%, 7/01/2024 | | $ | 2,780,000 | $2,781,240 |
| Gulfport, MS, Hospital Facilities Rev. (Memorial Hospital at Gulfport Project), 5%, 7/01/2025 | | | 3,680,000 | 3,698,635 |
| Gulfport, MS, Hospital Facilities Rev. (Memorial Hospital at Gulfport Project), 5%, 7/01/2027 | | | 1,960,000 | 1,956,640 |
| Gulfport, MS, Hospital Facilities Rev. (Memorial Hospital at Gulfport Project), 5%, 7/01/2028 | | | 380,000 | 380,427 |
| Gulfport, MS, Hospital Facilities Rev. (Memorial Hospital at Gulfport Project), 5%, 7/01/2029 | | | 355,000 | 353,736 |
Portfolio of Investments – continued
| Issuer | | | Shares/Par | Value ($) |
| Municipal Bonds - continued |
| Mississippi - continued |
| Gulfport, MS, Hospital Facilities Rev. (Memorial Hospital at Gulfport Project), 5%, 7/01/2031 | | $ | 380,000 | $372,394 |
| Jackson, MS, General Obligation Refunding, 5%, 3/01/2026 | | | 825,000 | 828,705 |
| Mississippi Development Bank Special Obligation (Jackson Sales Tax Rev. Infrastructure Project), 5%, 9/01/2024 | | | 740,000 | 740,093 |
| Mississippi Development Bank Special Obligation (Jackson Sales Tax Rev. Infrastructure Project), 5%, 9/01/2028 | | | 280,000 | 287,136 |
| Mississippi Gaming Tax Rev., “A”, 5%, 10/15/2024 | | | 750,000 | 752,596 |
| Mississippi Gaming Tax Rev., “A”, 5%, 10/15/2028 | | | 1,400,000 | 1,484,791 |
| Mississippi Hospital Equipment & Facilities Authority Rev. (Baptist Memorial Healthcare), “A”, 5%, 9/01/2044 (Put Date 9/01/2025) | | | 7,000,000 | 7,040,743 |
| Mississippi Hospital Equipment & Facilities Authority Rev. (North Mississippi Health Services), “I”, 5%, 10/01/2025 | | | 530,000 | 537,326 |
| Mississippi Hospital Equipment & Facilities Authority Rev. (North Mississippi Health Services), “I”, 5%, 10/01/2027 | | | 800,000 | 830,919 |
| Mississippi Hospital Equipment & Facilities Authority Rev. (North Mississippi Health Services), “I”, 5%, 10/01/2028 | | | 975,000 | 1,024,919 |
| Mississippi Hospital Equipment & Facilities Authority Rev. (North Mississippi Health Services), “I”, 5%, 10/01/2029 | | | 400,000 | 425,417 |
| Warren County, MS, Gulf Opportunity Zone Rev. (International Paper Co. Project), “A”, 1.375%, 5/01/2034 (Put Date 6/16/2025) | | | 3,500,000 | 3,393,408 |
| Warren County, MS, Gulf Opportunity Zone Rev. (International Paper Co. Project), “C”, 1.375%, 8/01/2027 (Put Date 6/16/2025) | | | 3,000,000 | 2,908,635 |
| West Rankin, MS, Utility Authority Rev., Taxable, AGM, 1.001%, 1/01/2026 | | | 465,000 | 433,743 |
| West Rankin, MS, Utility Authority Rev., Taxable, AGM, 1.399%, 1/01/2028 | | | 500,000 | 439,325 |
| | | | | $30,670,828 |
| Missouri - 0.8% |
| Missouri Development Finance Board, Infrastructure Facilities Rev. (Crackerneck Creek Project), 5%, 3/01/2025 | | $ | 425,000 | $425,518 |
| Missouri Development Finance Board, Infrastructure Facilities Rev. (Crackerneck Creek Project), 5%, 3/01/2026 | | | 150,000 | 150,752 |
| Missouri Health & Educational Facilities Authority Rev. (Bethesda Health Group, Inc.), 4%, 8/01/2024 | | | 155,000 | 154,313 |
| Missouri Health & Educational Facilities Authority Rev. (Bethesda Health Group, Inc.), 4%, 8/01/2026 | | | 205,000 | 198,484 |
| Missouri Health & Educational Facilities Authority Rev. (Bethesda Health Group, Inc.), 4%, 8/01/2028 | | | 420,000 | 399,756 |
| Missouri Health & Educational Facilities Authority Rev. (Bethesda Health Group, Inc.), 4%, 8/01/2030 | | | 300,000 | 280,226 |
Portfolio of Investments – continued
| Issuer | | | Shares/Par | Value ($) |
| Municipal Bonds - continued |
| Missouri - continued |
| Missouri Health & Educational Facilities Authority Rev. (Lutheran Senior Services Projects), “A”, 5%, 2/01/2025 | | $ | 215,000 | $215,062 |
| Missouri Health & Educational Facilities Authority Rev. (Mercy Health), “A”, 5%, 6/01/2027 | | | 2,500,000 | 2,610,510 |
| Missouri Health & Educational Facilities Authority Rev. (Mercy Health), “A”, 5%, 6/01/2028 | | | 7,820,000 | 8,301,131 |
| Missouri Housing Development Commission, Single Family Mortgage Rev. (First Place Loan Program), “E”, GNMA, 6.5%, 5/01/2054 | | | 3,440,000 | 3,840,495 |
| Plaza at Noah's Ark Community District, MO, Tax Increment and Improvement Rev., 3%, 5/01/2024 | | | 400,000 | 400,000 |
| Plaza at Noah's Ark Community District, MO, Tax Increment and Improvement Rev., 3%, 5/01/2026 | | | 150,000 | 145,056 |
| Poplar Bluff, MO, Transportation Development District Convertible Transportation Sales Tax Refunding & Improvement Rev., “B”, 3.375%, 12/01/2031 | | | 1,900,000 | 1,804,550 |
| Poplar Bluff, MO, Transportation Development District Convertible Transportation Sales Tax Refunding & Improvement Rev., Taxable, “A”, 3%, 12/01/2027 | | | 940,000 | 928,866 |
| St. Louis, MO, Land Clearance for Redevelopment Authority, Special Obligation Refunding (600 Washington Project), “A”, 4%, 4/01/2025 | | | 280,000 | 280,210 |
| St. Louis, MO, Land Clearance for Redevelopment Authority, Special Obligation Refunding (600 Washington Project), “A”, 4%, 4/01/2026 | | | 300,000 | 300,806 |
| St. Louis, MO, Land Clearance for Redevelopment Authority, Special Obligation Refunding (600 Washington Project), “A”, 4%, 4/01/2027 | | | 350,000 | 352,596 |
| | | | | $20,788,331 |
| Montana - 0.2% |
| Forsyth, MT, Pollution Control Rev. (Avista Corp. Colstrip Project), “A”, 3.875%, 10/01/2032 | | $ | 6,220,000 | $6,149,154 |
| Nevada - 0.5% |
| Clark County, NV, Jet Aviation Fuel Tax Refunding Rev., “A”, 5%, 7/01/2024 | | $ | 1,500,000 | $1,501,373 |
| Clark County, NV, Jet Aviation Fuel Tax Refunding Rev., “A”, 5%, 7/01/2025 | | | 2,545,000 | 2,574,408 |
| Clark County, NV, Jet Aviation Fuel Tax Refunding Rev., “A”, 5%, 7/01/2026 | | | 1,545,000 | 1,587,050 |
| Director of the State of Nevada, Department of Business & Industry Rev. (Brightline West Passenger Rail Project), “A”, 4%, 1/01/2050 (Put Date 1/30/2025) | | | 1,820,000 | 1,819,993 |
Portfolio of Investments – continued
| Issuer | | | Shares/Par | Value ($) |
| Municipal Bonds - continued |
| Nevada - continued |
| Nevada Housing Division, Multi-Unit Housing Rev. (Woodcreek Apartments), 5%, 12/01/2025 (Put Date 12/01/2024) | | $ | 2,635,000 | $2,642,007 |
| Washoe County, NV, Gas and Water Facilities Rev. (Sierra Pacific Power Company Projects), “C”, 3.625%, 3/01/2036 (Put Date 10/01/2029) | | | 1,000,000 | 993,351 |
| Washoe County, NV, Water Facilities Rev. (Sierra Pacific Power Company Projects), “C”, 4.125%, 3/01/2036 (Put Date 10/01/2029) | | | 860,000 | 860,537 |
| Washoe County, NV, Water Facilities Rev., “F”, 4.125%, 3/01/2036 (Put Date 10/01/2029) | | | 1,275,000 | 1,275,796 |
| | | | | $13,254,515 |
| New Hampshire - 1.3% |
| National Finance Authority Pollution Control Refunding Rev. (New York State Electric & Gas Corp. Project), “A”, 4%, 12/01/2028 | | $ | 4,300,000 | $4,269,826 |
| National Finance Authority, New Hampshire Senior Living Rev. (Springpoint Senior Living Project), 4%, 1/01/2025 | | | 290,000 | 287,611 |
| National Finance Authority, New Hampshire Senior Living Rev. (Springpoint Senior Living Project), 4%, 1/01/2026 | | | 265,000 | 260,515 |
| National Finance Authority, New Hampshire Senior Living Rev. (Springpoint Senior Living Project), 4%, 1/01/2028 | | | 580,000 | 563,412 |
| National Finance Authority, New Hampshire Senior Living Rev. (Springpoint Senior Living Project), 4%, 1/01/2029 | | | 300,000 | 289,454 |
| National Finance Authority, New Hampshire Senior Living Rev. (Springpoint Senior Living Project), 4%, 1/01/2030 | | | 280,000 | 268,454 |
| National Finance Authority, New Hampshire Senior Living Rev. (Springpoint Senior Living Project), 4%, 1/01/2031 | | | 295,000 | 281,174 |
| National Finance Authority, NH, Lease Rent Rev. (Centurion Biosquare, Inc.), “A”, 5.88%, 12/15/2038 | | | 15,025,000 | 15,198,999 |
| National Finance Authority, NH, Lease Rent Rev., Taxable (Centurion Biosquare, Inc.), “B”, 9.58%, 12/15/2038 | | | 905,000 | 866,719 |
| National Finance Authority, NH, Rev., Taxable (Centurion Foundation), “C”, 11%, 12/15/2038 | | | 495,000 | 475,621 |
| New Hampshire Health & Education Facilities Authority Rev. (Memorial Hospital), 5.25%, 6/01/2026 | | | 1,910,000 | 1,940,198 |
| New Hampshire Housing Finance Authority, Single Family Mortgage Acquisition Rev., “C”, GNMA, 6.25%, 1/01/2055 | | | 7,995,000 | 8,604,372 |
| | | | | $33,306,355 |
Portfolio of Investments – continued
| Issuer | | | Shares/Par | Value ($) |
| Municipal Bonds - continued |
| New Jersey - 3.8% |
| Atlantic City, NJ, Board of Education, 4%, 4/01/2025 | | $ | 175,000 | $175,426 |
| Atlantic City, NJ, Improvement Authority Lease Rev. (Stockton University Campus Phase II Project), “A”, AGM, 5%, 7/01/2024 | | | 150,000 | 150,239 |
| Atlantic City, NJ, Tax Appeal Refunding Rev., “A”, BAM, 5%, 3/01/2027 | | | 200,000 | 207,996 |
| Burlington County, NJ, Moorestown Board of Education, 4%, 1/15/2025 | | | 305,000 | 305,525 |
| Camden County, NJ, Improvement Authority, Multi-Family Housing Rev. (Northgate I Apartments Project), 5%, 3/01/2027 (Put Date 3/01/2026) | | | 3,625,000 | 3,684,603 |
| Gloucester County, NJ, Improvement Authority Rev. (Rowan University Student Center Project), 4%, 2/27/2025 | | | 2,500,000 | 2,502,060 |
| New Jersey Building Authority, State Building Rev. Unrefunded Balance, “A”, BAM, 5%, 6/15/2025 | | | 1,205,000 | 1,223,629 |
| New Jersey Building Authority, State Building Rev. Unrefunded Balance, “A”, BAM, 5%, 6/15/2026 | | | 900,000 | 929,391 |
| New Jersey Building Authority, State Building Rev., “A”, ETM, BAM, 5%, 6/15/2025 | | | 795,000 | 808,167 |
| New Jersey Casino Reinvestment Development Authority, Luxury Tax Rev., AGM, 5%, 11/01/2024 | | | 1,000,000 | 1,003,245 |
| New Jersey Economic Development Authority Refunding Rev. (Provident Group - Montclair Properties LLC - Montclair State University Student Housing Project), AGM, 5%, 6/01/2025 | | | 1,000,000 | 1,011,759 |
| New Jersey Economic Development Authority Refunding Rev. (Provident Group - Montclair Properties LLC - Montclair State University Student Housing Project), AGM, 5%, 6/01/2026 | | | 1,000,000 | 1,027,181 |
| New Jersey Economic Development Authority Rev. (Portal North Bridge Project), “A”, 5%, 11/01/2033 | | | 1,500,000 | 1,688,140 |
| New Jersey Economic Development Authority Rev. (Portal North Bridge Project), “A”, 5%, 11/01/2034 | | | 1,040,000 | 1,166,061 |
| New Jersey Economic Development Authority Rev. (School Facilities Construction), “DDD”, 5%, 6/15/2025 | | | 1,610,000 | 1,631,482 |
| New Jersey Economic Development Authority Rev. (School Facilities Construction), “DDD”, 5%, 6/15/2026 | | | 2,000,000 | 2,056,314 |
| New Jersey Economic Development Authority Rev. (School Facilities Construction), “DDD”, 5%, 6/15/2027 | | | 1,500,000 | 1,567,407 |
| New Jersey Economic Development Authority Rev. (School Facilities Construction), “DDD”, 5%, 6/15/2028 | | | 3,000,000 | 3,128,001 |
| New Jersey Economic Development Authority Rev. (School Facilities Construction), “QQQ”, 5%, 6/15/2024 | | | 300,000 | 300,273 |
| New Jersey Economic Development Authority Rev. (School Facilities Construction), Capital Appreciation, “DDD”, AGM, 0%, 12/15/2026 | | | 9,445,000 | 8,585,049 |
Portfolio of Investments – continued
| Issuer | | | Shares/Par | Value ($) |
| Municipal Bonds - continued |
| New Jersey - continued |
| New Jersey Economic Development Authority, Water Facilities Rev. (American Water Co., Inc. Project), “B”, 3.75%, 11/01/2034 (Put Date 6/01/2028) | | $ | 2,350,000 | $2,320,338 |
| New Jersey Economic Development Authority, Water Facilities Rev. (American Water Co., Inc. Project), “E”, 0.85%, 12/01/2025 | | | 1,135,000 | 1,050,647 |
| New Jersey Health Care Facilities, Financing Authority Rev. (University Hospital), “A”, AGM, 5%, 7/01/2024 | | | 2,150,000 | 2,151,489 |
| New Jersey Health Care Facilities, Financing Authority Rev. (University Hospital), “A”, AGM, 5%, 7/01/2026 | | | 1,420,000 | 1,433,014 |
| New Jersey Health Care Facilities, Financing Authority, State Contract Refunding Bonds (Hospital Asset Transformation Program), 5%, 10/01/2027 | | | 2,000,000 | 2,081,882 |
| New Jersey Higher Education Student Assistance Authority, Senior Student Loan Refunding Rev., ”A“, 5%, 12/01/2024 | | | 330,000 | 331,949 |
| New Jersey Higher Education Student Assistance Authority, Senior Student Loan Refunding Rev., ”A“, 5%, 12/01/2025 | | | 415,000 | 421,191 |
| New Jersey Higher Education Student Assistance Authority, Senior Student Loan Refunding Rev., ”A“, 5%, 12/01/2026 | | | 335,000 | 342,412 |
| New Jersey Higher Education Student Assistance Authority, Senior Student Loan Rev., “B”, 4%, 12/01/2041 | | | 6,915,000 | 6,637,661 |
| New Jersey Higher Education Student Assistance Authority, Senior Student Loan Rev., ”B“, 5%, 12/01/2024 | | | 2,350,000 | 2,363,880 |
| New Jersey Higher Education Student Assistance Authority, Senior Student Loan Rev., ”B“, 5%, 12/01/2024 | | | 575,000 | 578,396 |
| New Jersey Higher Education Student Assistance Authority, Senior Student Loan Rev., ”B“, 5%, 12/01/2025 | | | 2,600,000 | 2,638,787 |
| New Jersey Higher Education Student Assistance Authority, Senior Student Loan Rev., ”B“, 5%, 12/01/2025 | | | 850,000 | 862,680 |
| New Jersey Higher Education Student Assistance Authority, Senior Student Loan Rev., ”B“, 5%, 12/01/2026 | | | 2,300,000 | 2,350,889 |
| New Jersey Higher Education Student Assistance Authority, Senior Student Loan Rev., ”B“, 5%, 12/01/2026 | | | 1,430,000 | 1,461,640 |
| New Jersey Higher Education Student Assistance Authority, Senior Student Loan Rev., ”B“, 5%, 12/01/2027 | | | 1,550,000 | 1,593,254 |
| New Jersey Higher Education Student Assistance Authority, Senior Student Loan Rev., ”B“, 5%, 12/01/2028 | | | 1,000,000 | 1,038,026 |
| New Jersey Housing & Mortgage Finance Agency, Multi-Family Conduit Rev. (New Irvine Taylor Apartments Project), “C”, HUD Section 8, 3.67%, 2/01/2026 | | | 3,165,000 | 3,127,353 |
| New Jersey Transportation Trust Fund Authority, “B”, AAC, 5.5%, 9/01/2026 | | | 1,985,000 | 2,070,951 |
| New Jersey Transportation Trust Fund Authority, Federal Highway Reimbursement Rev., “A”, 5%, 6/15/2024 | | | 4,000,000 | 4,004,052 |
Portfolio of Investments – continued
| Issuer | | | Shares/Par | Value ($) |
| Municipal Bonds - continued |
| New Jersey - continued |
| New Jersey Transportation Trust Fund Authority, Transportation System, Capital Appreciation, “C”, AAC, 0%, 12/15/2025 | | $ | 550,000 | $517,846 |
| New Jersey Transportation Trust Fund Authority, Transportation System, Capital Appreciation, “C”, AAC, 0%, 12/15/2026 | | | 2,500,000 | 2,267,126 |
| New Jersey Transportation Trust Fund Authority, Transportation System, Capital Appreciation, “C”, AAC, 0%, 12/15/2028 | | | 6,635,000 | 5,592,050 |
| New Jersey Transportation Trust Fund Authority, Transportation System, Capital Appreciation, “C”, AGM, 0%, 12/15/2032 | | | 1,890,000 | 1,379,561 |
| New Jersey Transportation Trust Fund Authority, Transportation System, Capital Appreciation, “C”, NPFG, 0%, 12/15/2027 | | | 3,780,000 | 3,307,269 |
| New Jersey Turnpike Authority, Turnpike Rev., Taxable, “B”, 0.897%, 1/01/2025 | | | 1,905,000 | 1,848,473 |
| New Jersey Turnpike Authority, Turnpike Rev., Taxable, “B”, 1.047%, 1/01/2026 | | | 2,380,000 | 2,222,220 |
| Newark, NJ, Board of Education, Energy Savings Obligation Refunding, BAM, 5%, 7/15/2024 | | | 420,000 | 420,666 |
| Newark, NJ, General Obligation Refunding, “A”, AGM, 5%, 10/01/2025 | | | 700,000 | 711,368 |
| Newark, NJ, Housing Authority Rev. (South Ward Police Facility), AGM, 5%, 12/01/2024 | | | 1,440,000 | 1,447,745 |
| Newark, NJ, Housing Authority Rev. (South Ward Police Facility), AGM, 5%, 12/01/2025 | | | 1,850,000 | 1,884,386 |
| Newark, NJ, Housing Authority Rev. (South Ward Police Facility), AGM, 5%, 12/01/2026 | | | 1,725,000 | 1,784,185 |
| Salem County, NJ, Pollution Control Financing Authority Rev. (Philadelphia Electric Co. Project), “A”, 4.45%, 3/01/2025 (Put Date 3/01/2025) | | | 2,500,000 | 2,503,591 |
| | | | | $97,898,925 |
| New Mexico - 1.2% |
| Clayton, NM, Jail Project Improvement Rev., NPFG, 5%, 11/01/2029 | | $ | 1,000,000 | $1,009,721 |
| Farmington, NM, Pollution Control Rev. (Public Service Company of New Mexico San Juan Project), “D”, 3.9%, 6/01/2040 (Put Date 6/01/2028) | | | 7,000,000 | 6,915,948 |
| Lea County, NM, Hobbs Municipal School District No. 16, 5%, 9/15/2024 | | | 120,000 | 120,452 |
| Los Ranchos de Albuquerque, NM, Education Facilities Rev. (Albuquerque Academy Project), 4%, 9/01/2024 | | | 175,000 | 174,702 |
| Los Ranchos de Albuquerque, NM, Education Facilities Rev. (Albuquerque Academy Project), 4%, 9/01/2025 | | | 150,000 | 150,091 |
| Los Ranchos de Albuquerque, NM, Education Facilities Rev. (Albuquerque Academy Project), 5%, 9/01/2026 | | | 300,000 | 307,677 |
Portfolio of Investments – continued
| Issuer | | | Shares/Par | Value ($) |
| Municipal Bonds - continued |
| New Mexico - continued |
| Los Ranchos de Albuquerque, NM, Education Facilities Rev. (Albuquerque Academy Project), 5%, 9/01/2028 | | $ | 225,000 | $237,724 |
| Los Ranchos de Albuquerque, NM, Education Facilities Rev. (Albuquerque Academy Project), 5%, 9/01/2030 | | | 450,000 | 488,302 |
| Los Ranchos de Albuquerque, NM, Education Facilities Rev. (Albuquerque Academy Project), 5%, 9/01/2031 | | | 300,000 | 325,194 |
| Los Ranchos de Albuquerque, NM, Education Facilities Rev. (Albuquerque Academy Project), 5%, 9/01/2032 | | | 350,000 | 378,841 |
| New Mexico Educational Assistance Foundation, “A-1”, 5%, 9/01/2027 | | | 2,000,000 | 2,056,421 |
| New Mexico Educational Assistance Foundation, “A-1”, 5%, 9/01/2028 | | | 4,000,000 | 4,169,129 |
| New Mexico Educational Assistance Foundation, “A-1”, 5%, 9/01/2029 | | | 1,750,000 | 1,840,173 |
| New Mexico Hospital Equipment Loan Council, Hospital System and Improvement Rev. (San Juan Regional Medical Center), 5%, 6/01/2024 | | | 960,000 | 960,281 |
| New Mexico Hospital Equipment Loan Council, Hospital System and Improvement Rev. (San Juan Regional Medical Center), 5%, 6/01/2025 | | | 1,055,000 | 1,063,176 |
| New Mexico Hospital Equipment Loan Council, Hospital System and Improvement Rev. (San Juan Regional Medical Center), 5%, 6/01/2026 | | | 1,000,000 | 1,018,864 |
| New Mexico Mortgage Finance Authority, Multi-Family Housing Rev. (Mountain View II & III Apartments Project), HUD Section 8, 5%, 2/01/2042 (Put Date 9/01/2025) | | | 1,500,000 | 1,510,735 |
| New Mexico Mortgage Finance Authority, Multi-Family Housing Rev. (Santa Fe Apartment & Sangre de Cristo Project), HUD Section 8, 5%, 2/01/2042 (Put Date 6/01/2025) | | | 2,375,000 | 2,380,840 |
| New Mexico Mortgage Finance Authority, Single Family Mortgage Program Class I, “E”, GNMA, 6.25%, 9/01/2053 | | | 5,315,000 | 5,720,659 |
| | | | | $30,828,930 |
| New York - 5.5% |
| Build NYC Resource Corp. Rev. (Academic Leadership Charter School Project), 4%, 6/15/2024 | | $ | 120,000 | $119,808 |
| Build NYC Resource Corp. Rev. (Grand Concourse Academy Charter School Project), “A”, 3.4%, 7/01/2027 | | | 245,000 | 238,017 |
| Monroe County, NY, Industrial Development Corp. Rev. (Rochester Regional Health Project), “A”, 5%, 12/01/2024 | | | 600,000 | 601,349 |
| Monroe County, NY, Industrial Development Corp. Rev. (Rochester Regional Health Project), “A”, 5%, 12/01/2027 | | | 700,000 | 716,672 |
Portfolio of Investments – continued
| Issuer | | | Shares/Par | Value ($) |
| Municipal Bonds - continued |
| New York - continued |
| New York Dormitory Authority Rev. (Orange Regional Medical Center Obligated Group Rev.), 5%, 12/01/2025 (n) | | $ | 2,400,000 | $2,379,663 |
| New York Dormitory Authority, Personal Income Tax Rev. (General Purpose), 5.25%, 3/15/2039 | | | 3,070,000 | 3,276,992 |
| New York Energy Research & Development Authority, Pollution Control Rev. (New York State Electric & Gas Corp. Project), “C”, 4%, 4/01/2034 (Put Date 4/01/2034) | | | 6,800,000 | 6,802,814 |
| New York Energy Research & Development Authority, Pollution Control Rev. (Rochester Gas & Electric Corp.), “A”, 3%, 8/01/2032 (Put Date 7/01/2025) | | | 11,125,000 | 11,000,490 |
| New York Environmental Facilities Corp. Rev., Solid Waste Disposal (Casella Waste Management, Inc. Project), 2.75%, 9/01/2050 (Put Date 9/02/2025) (n) | | | 800,000 | 779,228 |
| New York Housing Finance Agency Affordable Housing Rev., “A-2”, 2.5%, 11/01/2060 (Put Date 5/01/2027) | | | 19,050,000 | 18,098,346 |
| New York Housing Finance Agency Affordable Housing Rev., “A-2”, HUD Section 8, 3.75%, 11/01/2062 (Put Date 11/01/2029) | | | 3,000,000 | 2,991,093 |
| New York Housing Finance Agency Affordable Housing Rev., “G-2”, HUD Section 8, 3.45%, 5/01/2062 (Put Date 5/01/2027) | | | 2,080,000 | 2,056,908 |
| New York Housing Finance Agency Affordable Housing Rev., “L-2”, 0.75%, 11/01/2025 | | | 850,000 | 797,247 |
| New York Mortgage Agency Homeowner Mortgage Rev., “242”, 3.5%, 10/01/2052 | | | 5,770,000 | 5,628,067 |
| New York Mortgage Agency Homeowner Mortgage Rev., “243”, 5%, 10/01/2024 | | | 1,955,000 | 1,960,298 |
| New York Mortgage Agency Homeowner Mortgage Rev., “243”, 5%, 4/01/2025 | | | 1,990,000 | 2,004,746 |
| New York Mortgage Agency Homeowner Mortgage Rev., “243”, 5%, 10/01/2025 | | | 2,030,000 | 2,056,047 |
| New York Mortgage Agency Homeowner Mortgage Rev., “243”, 5%, 4/01/2026 | | | 2,065,000 | 2,102,229 |
| New York Mortgage Agency Homeowner Mortgage Rev., “4th-9th”, 3.25%, 10/01/2028 | | | 3,160,000 | 3,083,988 |
| New York Transportation Development Corp., Special Facilities Rev. (Delta Airlines, Inc. LaGuardia Airport Terminals C&D Redevelopment Project), 5%, 1/01/2025 | | | 13,780,000 | 13,869,485 |
| New York Transportation Development Corp., Special Facilities Rev. (Delta Airlines, Inc. LaGuardia Airport Terminals C&D Redevelopment Project), 5%, 1/01/2028 | | | 3,965,000 | 4,114,606 |
| New York Transportation Development Corp., Special Facilities Rev. (Terminal 4 John F. Kennedy International Airport Project), 5%, 12/01/2026 | | | 8,635,000 | 8,834,304 |
Portfolio of Investments – continued
| Issuer | | | Shares/Par | Value ($) |
| Municipal Bonds - continued |
| New York - continued |
| New York Transportation Development Corp., Special Facilities Rev. (Terminal 4 John F. Kennedy International Airport Project), “A”, 5%, 12/01/2024 | | $ | 1,250,000 | $1,253,736 |
| New York Transportation Development Corp., Special Facilities Rev. (Terminal 4 John F. Kennedy International Airport Project), “A”, 5%, 12/01/2025 | | | 1,100,000 | 1,113,360 |
| New York Urban Development Development Corp., Personal Income Tax Rev. ( General Purpose), “A”, 5%, 3/15/2035 | | | 10,000,000 | 10,215,739 |
| New York, NY, City Housing Development Corp., Multi-Family Housing Rev., “A-2”, FHA, 0.9%, 5/01/2025 | | | 500,000 | 485,785 |
| New York, NY, City Housing Development Corp., Multi-Family Housing Rev., “A-2”, FHA, 1%, 11/01/2025 | | | 1,450,000 | 1,392,695 |
| New York, NY, City Housing Development Corp., Multi-Family Housing Rev., “A-2”, FHA, 1.1%, 5/01/2026 | | | 3,305,000 | 3,134,654 |
| New York, NY, City Housing Development Corp., Multi-Family Housing Rev., “A-2”, FHA, 1.15%, 11/01/2026 | | | 1,290,000 | 1,211,648 |
| New York, NY, Housing Development Corp., Multi-Family Housing Rev. (Sustainable Development), “F-2-A”, 3.4%, 11/01/2062 (Put Date 12/22/2026) | | | 6,940,000 | 6,842,724 |
| Oneida County, NY, Local Development Corp. Rev. (Mohawk Valley Health System Project), “A”, AGM, 5%, 12/01/2026 | | | 1,625,000 | 1,625,439 |
| Oneida County, NY, Local Development Corp. Rev. (Mohawk Valley Health System Project), “A”, AGM, 5%, 12/01/2027 | | | 1,425,000 | 1,425,448 |
| Oneida County, NY, Local Development Corp. Rev. (Mohawk Valley Health System Project), “A”, AGM, 5%, 12/01/2028 | | | 1,000,000 | 1,000,381 |
| Oneida County, NY, Local Development Corp. Rev. (Mohawk Valley Health System Project), “A”, AGM, 5%, 12/01/2029 | | | 175,000 | 175,079 |
| Port Authority of NY & NJ (207th Series), 5%, 9/15/2027 | | | 1,755,000 | 1,823,374 |
| Port Authority of NY & NJ (226th Series), 5%, 10/15/2025 | | | 1,475,000 | 1,498,615 |
| Poughkeepsie, NY, Public Improvement, 5%, 6/01/2024 | | | 465,000 | 464,805 |
| Poughkeepsie, NY, Public Improvement, 5%, 6/01/2025 | | | 235,000 | 235,023 |
| St. Lawrence County, NY, Industrial Development Agency, Civic Development Corp. Rev., Taxable (Clarkson University Project), “C”, 1.45%, 9/01/2024 | | | 100,000 | 98,521 |
| St. Lawrence County, NY, Industrial Development Agency, Civic Development Corp. Rev., Taxable (Clarkson University Project), “C”, 1.7%, 9/01/2025 | | | 110,000 | 104,087 |
| St. Lawrence County, NY, Industrial Development Agency, Civic Development Corp. Rev., Taxable (Clarkson University Project), “C”, 1.95%, 9/01/2026 | | | 140,000 | 128,209 |
| St. Lawrence County, NY, Industrial Development Agency, Civic Development Corp. Rev., Taxable (Clarkson University Project), “C”, 2.2%, 9/01/2027 | | | 135,000 | 120,336 |
Portfolio of Investments – continued
| Issuer | | | Shares/Par | Value ($) |
| Municipal Bonds - continued |
| New York - continued |
| Suffolk, NY, Tobacco Asset Securitization Corp., Tobacco Settlement, Taxable, “A-1”, 1.015%, 6/01/2024 | | $ | 500,000 | $498,207 |
| Syracuse, NY, Regional Airport Authority Senior Airport Rev., 5%, 7/01/2024 | | | 700,000 | 700,189 |
| Syracuse, NY, Regional Airport Authority Senior Airport Rev., 5%, 7/01/2025 | | | 750,000 | 754,926 |
| Syracuse, NY, Regional Airport Authority Senior Airport Rev., 5%, 7/01/2026 | | | 250,000 | 253,422 |
| Tobacco Settlement Asset Securitization Corp., NY, “1”, 5%, 6/01/2025 | | | 1,000,000 | 1,012,842 |
| Tobacco Settlement Asset Securitization Corp., NY, “1”, 5%, 6/01/2026 | | | 2,000,000 | 2,053,155 |
| Tobacco Settlement Asset Securitization Corp., NY, “1”, 5%, 6/01/2027 | | | 1,500,000 | 1,561,045 |
| Triborough Bridge & Tunnel Authority Rev., NY, Payroll Mobility Tax (MTA Bridges and Tunnels), “A-2”, 2%, 5/15/2045 (Put Date 5/15/2026) | | | 10,000,000 | 9,528,582 |
| | | | | $144,224,423 |
| North Carolina - 1.5% |
| Columbus County, NC, Industrial Facilities & Pollution Control, Financing Authority Rev. (International Paper Co.), “A”, 1.375%, 5/01/2034 (Put Date 6/16/2025) | | $ | 1,000,000 | $969,545 |
| Greater Ashville, NC, Regional Airport Authority System Rev., AGM, 5%, 7/01/2034 | | | 1,500,000 | 1,653,967 |
| Greater Ashville, NC, Regional Airport Authority System Rev., AGM, 5%, 7/01/2035 | | | 1,000,000 | 1,097,031 |
| Greater Ashville, NC, Regional Airport Authority System Rev., AGM, 5%, 7/01/2036 | | | 700,000 | 762,155 |
| Greater Ashville, NC, Regional Airport Authority System Rev., “A”, AGM, 5%, 7/01/2027 | | | 750,000 | 779,388 |
| Greater Ashville, NC, Regional Airport Authority System Rev., “A”, AGM, 5%, 7/01/2028 | | | 725,000 | 763,068 |
| Greater Ashville, NC, Regional Airport Authority System Rev., “A”, AGM, 5%, 7/01/2029 | | | 900,000 | 961,220 |
| Greater Ashville, NC, Regional Airport Authority System Rev., “A”, AGM, 5%, 7/01/2031 | | | 1,370,000 | 1,491,253 |
| New Hanover County, NC, General Obligation School, 5%, 9/01/2024 | | | 2,615,000 | 2,624,970 |
| North Carolina Capital Facilities Finance Agency Student Housing Rev. (NCA&T University Foundation LLC Project), “A”, AGM, 5%, 6/01/2024 | | | 700,000 | 700,184 |
Portfolio of Investments – continued
| Issuer | | | Shares/Par | Value ($) |
| Municipal Bonds - continued |
| North Carolina - continued |
| North Carolina Education Assistance Authority, Student Loan Rev., “A”, 5%, 6/01/2025 | | $ | 250,000 | $252,271 |
| North Carolina Education Assistance Authority, Student Loan Rev., “A”, 5%, 6/01/2027 | | | 1,250,000 | 1,276,575 |
| North Carolina Education Assistance Authority, Student Loan Rev., “A”, 5.5%, 6/01/2031 | | | 3,250,000 | 3,488,638 |
| North Carolina Education Assistance Authority, Student Loan Rev., “A”, 5.5%, 6/01/2032 | | | 3,250,000 | 3,504,107 |
| North Carolina Education Assistance Authority, Student Loan Rev., “A”, 5.5%, 6/01/2033 | | | 3,250,000 | 3,512,530 |
| North Carolina Education Assistance Authority, Student Loan Rev., “A”, 5%, 6/01/2043 | | | 1,020,000 | 1,009,810 |
| North Carolina Housing Finance Agency, Home Ownership Rev., “48”, 5%, 1/01/2028 | | | 2,175,000 | 2,279,281 |
| North Carolina Housing Finance Agency, Home Ownership Rev., “48”, 5%, 7/01/2030 | | | 1,500,000 | 1,611,813 |
| North Carolina Medical Care Commission, Health Care Facilities First Mortgage Refunding Rev. (Lutheran Services for the Aging), “C”, 5%, 3/01/2025 | | | 420,000 | 421,123 |
| North Carolina Medical Care Commission, Health Care Facilities First Mortgage Refunding Rev. (Lutheran Services for the Aging), “C”, 5%, 3/01/2026 | | | 440,000 | 442,184 |
| North Carolina Medical Care Commission, Health Care Facilities First Mortgage Refunding Rev. (Lutheran Services for the Aging), “C”, 5%, 3/01/2027 | | | 460,000 | 462,861 |
| North Carolina Medical Care Commission, Health Care Facilities First Mortgage Refunding Rev. (Lutheran Services for the Aging), “C”, 5%, 3/01/2028 | | | 365,000 | 367,376 |
| North Carolina Medical Care Commission, Health Care Facilities First Mortgage Refunding Rev. (Lutheran Services for the Aging), “C”, 4%, 3/01/2029 | | | 760,000 | 732,118 |
| North Carolina Medical Care Commission, Health Care Facilities First Mortgage Refunding Rev. (Lutheran Services for the Aging), “C”, 4%, 3/01/2030 | | | 790,000 | 753,888 |
| North Carolina Medical Care Commission, Health Care Facilities First Mortgage Refunding Rev. (Lutheran Services for the Aging), “C”, 4%, 3/01/2031 | | | 820,000 | 774,815 |
| North Carolina Medical Care Commission, Health Care Facilities First Mortgage Rev. (Lutheran Services for the Aging), “A”, 4%, 3/01/2025 | | | 265,000 | 263,577 |
| North Carolina Medical Care Commission, Health Care Facilities First Mortgage Rev. (Lutheran Services for the Aging), “A”, 5%, 3/01/2026 | | | 245,000 | 246,216 |
Portfolio of Investments – continued
| Issuer | | | Shares/Par | Value ($) |
| Municipal Bonds - continued |
| North Carolina - continued |
| North Carolina Medical Care Commission, Health Care Facilities First Mortgage Rev. (Lutheran Services for the Aging), “A”, 5%, 3/01/2027 | | $ | 290,000 | $291,804 |
| North Carolina Medical Care Commission, Health Care Facilities First Mortgage Rev. (Lutheran Services for the Aging), “A”, 5%, 3/01/2028 | | | 185,000 | 186,204 |
| North Carolina Medical Care Commission, Health Care Facilities First Mortgage Rev. (Presbyterian Homes Obligated Group), “A”, 4%, 10/01/2027 | | | 600,000 | 601,313 |
| North Carolina Medical Care Commission, Retirement Facilities First Mortgage Rev. (United Methodist Retirement Homes Project), “B1”, 4.25%, 10/01/2028 | | | 285,000 | 285,612 |
| North Carolina Medical Care Commission, Retirement Facilities First Mortgage Rev. (United Methodist Retirement Homes Project), “B-2”, 3.75%, 10/01/2028 | | | 525,000 | 518,887 |
| North Carolina Turnpike Authority, Triangle Expressway System Turnpike Rev., AGM, 5%, 1/01/2026 | | | 1,500,000 | 1,533,312 |
| Raleigh Durham, NC, Airport Authority Rev., “A”, 5%, 5/01/2025 | | | 645,000 | 651,931 |
| Raleigh Durham, NC, Airport Authority Rev., “A”, 5%, 5/01/2026 | | | 1,000,000 | 1,024,564 |
| | | | | $38,295,591 |
| North Dakota - 0.2% |
| Horace, ND, Temporary Refunding Improvement, “B”, 4%, 1/01/2025 | | $ | 5,320,000 | $5,303,330 |
| Ohio - 3.0% |
| Akron, Bath, & Copley, OH, Joint Township Hospital District Facilities Rev. (Summa Health Obligated Group), 5%, 11/15/2026 | | $ | 530,000 | $541,551 |
| Akron, Bath, & Copley, OH, Joint Township Hospital District Facilities Rev. (Summa Health Obligated Group), 5%, 11/15/2028 | | | 240,000 | 249,401 |
| Cleveland, OH, Airport System Rev., “A”, 5%, 1/01/2025 | | | 1,970,000 | 1,979,902 |
| Cleveland, OH, Airport System Rev., “A”, 5%, 1/01/2026 | | | 3,000,000 | 3,049,349 |
| Cleveland, OH, Airport System Rev., “A”, AGM, 5%, 1/01/2025 | | | 1,250,000 | 1,259,306 |
| Cuyahoga County, OH, Hospital Rev. (Metrohealth System), 5%, 2/15/2026 | | | 2,000,000 | 2,024,568 |
| Cuyahoga County, OH, Hospital Rev. (Metrohealth System), 5%, 2/15/2027 | | | 2,150,000 | 2,197,331 |
| Cuyahoga County, OH, Metropolitan Housing Authority, Multi-Family Housing Rev. (Carver Park Phase III Project), FHA, 4%, 6/01/2026 (Put Date 6/01/2025) | | | 3,412,000 | 3,394,545 |
| Cuyahoga County, OH, Metropolitan Housing Authority, Multi-Family Housing Rev. (Wade Park Apartments), 4.75%, 12/01/2027 (Put Date 12/01/2025) | | | 2,800,000 | 2,811,608 |
Portfolio of Investments – continued
| Issuer | | | Shares/Par | Value ($) |
| Municipal Bonds - continued |
| Ohio - continued |
| Hamilton County, OH, Healthcare Rev. (Life Enriching Communities Project), “A”, 5%, 1/01/2027 | | $ | 680,000 | $691,136 |
| Hamilton County, OH, Healthcare Rev. (Life Enriching Communities Project), “A”, 5%, 1/01/2028 | | | 820,000 | 838,382 |
| Hamilton County, OH, Healthcare Rev. (Life Enriching Communities Project), “A”, 5%, 1/01/2029 | | | 860,000 | 882,587 |
| Hamilton County, OH, Healthcare Rev. (Life Enriching Communities Project), “A”, 5%, 1/01/2030 | | | 905,000 | 930,993 |
| Hamilton County, OH, Healthcare Rev. (Life Enriching Communities Project), “A”, 5%, 1/01/2031 | | | 950,000 | 977,030 |
| Hamilton County, OH, Healthcare Rev. (Life Enriching Communities Project), “A”, 5%, 1/01/2032 | | | 995,000 | 1,021,046 |
| Hamilton County, OH, Healthcare Rev. (Life Enriching Communities Project), “A”, 5%, 1/01/2033 | | | 1,045,000 | 1,071,523 |
| Lorain, OH, General Obligation, BAM, 4%, 12/01/2025 | | | 815,000 | 819,629 |
| Middleburg Heights, OH, Hospital Facilities Improvement Rev. (Southwest General Health Center Project), “A”, 5%, 8/01/2026 | | | 500,000 | 511,140 |
| Middleburg Heights, OH, Hospital Facilities Improvement Rev. (Southwest General Health Center Project), “A”, 5%, 8/01/2027 | | | 580,000 | 599,024 |
| Middleburg Heights, OH, Hospital Facilities Improvement Rev. (Southwest General Health Center Project), “A”, 5%, 8/01/2028 | | | 1,455,000 | 1,516,915 |
| Middleburg Heights, OH, Hospital Facilities Improvement Rev. (Southwest General Health Center Project), “A”, 5%, 8/01/2030 | | | 1,000,000 | 1,059,395 |
| Middleburg Heights, OH, Hospital Facilities Improvement Rev. (Southwest General Health Center Project), “A”, 5%, 8/01/2031 | | | 1,000,000 | 1,067,752 |
| Middleburg Heights, OH, Hospital Facilities Improvement Rev. (Southwest General Health Center Project), “A”, 5%, 8/01/2032 | | | 900,000 | 966,027 |
| Middleburg Heights, OH, Hospital Facilities Improvement Rev. (Southwest General Health Center Project), “A”, 5%, 8/01/2033 | | | 800,000 | 856,839 |
| Middleburg Heights, OH, Hospital Facilities Improvement Rev. (Southwest General Health Center Project), “A”, 5%, 8/01/2034 | | | 1,000,000 | 1,068,220 |
| Montgomery County, OH, Hospital Facilities Improvement and Refunding Rev. (Kettering Health Network Obligated Group Project), 5%, 8/01/2024 | | | 205,000 | 205,317 |
| Northeast Ohio Medical University, General Receipts, “A”, 5%, 12/01/2024 | | | 100,000 | 100,276 |
| Northeast Ohio Medical University, General Receipts, “A”, 5%, 12/01/2026 | | | 200,000 | 203,502 |
| Northeast Ohio Medical University, General Receipts, “A”, 5%, 12/01/2028 | | | 120,000 | 124,367 |
| Northeast Ohio Medical University, General Receipts, “A”, 5%, 12/01/2030 | | | 135,000 | 141,731 |
Portfolio of Investments – continued
| Issuer | | | Shares/Par | Value ($) |
| Municipal Bonds - continued |
| Ohio - continued |
| Ohio Air Quality Development Authority Refunding Rev. (Duke Energy Corp. Project), “A”, 4.25%, 11/01/2039 (Put Date 6/01/2027) | | $ | 2,895,000 | $2,898,765 |
| Ohio Air Quality Development Authority Refunding Rev. (Duke Energy Corp. Project), “B”, 4%, 9/01/2030 (Put Date 6/01/2027) | | | 3,430,000 | 3,419,730 |
| Ohio Air Quality Development Authority Rev. (American Electric Power Co.), “C”, 2.1%, 12/01/2027 (Put Date 10/01/2024) | | | 2,000,000 | 1,967,656 |
| Ohio Air Quality Development Authority Rev. (American Electric Power Co.), “C”, 2.1%, 4/01/2028 (Put Date 10/01/2024) | | | 3,245,000 | 3,192,521 |
| Ohio Air Quality Development Authority, Facilities Rev. (Pratt Paper LLC Project), 3.75%, 1/15/2028 (n) | | | 405,000 | 400,431 |
| Ohio Higher Educational Facility Commission Rev. (Cleveland Institute of Music 2022 Project), 5%, 12/01/2027 | | | 720,000 | 721,977 |
| Ohio Higher Educational Facility Rev. (Case Western Reserve University Project), “C”, 1.625%, 12/01/2034 (Put Date 12/01/2026) | | | 5,000,000 | 4,628,678 |
| Ohio Housing Finance Agency Multi-Family Housing Rev. (Springboro Sherman Apartments Project), HUD Section 8, 3.53%, 2/01/2029 | | | 1,600,000 | 1,568,507 |
| Ohio Housing Finance Agency Multi-Family Housing Rev. (Thornwood Commons), HUD Section 8, 5%, 12/01/2026 (Put Date 12/01/2025) | | | 2,460,000 | 2,485,466 |
| Ohio Housing Finance Agency Multi-Family Mortgage-Backed, (Macarthur Park Apartments Project), “A”, FNMA, 4.5%, 5/01/2039 | | | 7,302,386 | 7,294,953 |
| Ohio Housing Finance Agency Residential Mortgage Rev. (Mortgage-Backed Securities Program), “C”, FNMA, 5.75%, 3/01/2054 | | | 5,765,000 | 6,037,502 |
| Ohio State Hospital Rev. (Premier Health Partners Obligated Group), 5%, 11/15/2026 | | | 140,000 | 142,342 |
| Ohio State Hospital Rev. (Premier Health Partners Obligated Group), 5%, 11/15/2027 | | | 420,000 | 430,932 |
| Ohio State Hospital Rev. (Premier Health Partners Obligated Group), 5%, 11/15/2028 | | | 370,000 | 381,862 |
| Ohio State Hospital Rev. (Premier Health Partners Obligated Group), 5%, 11/15/2029 | | | 825,000 | 854,742 |
| Ohio State Hospital Rev. (Premier Health Partners Obligated Group), 5%, 11/15/2031 | | | 475,000 | 492,643 |
| Ohio State Hospital Rev. (Premier Health Partners Obligated Group), 5%, 11/15/2032 | | | 290,000 | 300,648 |
| Ohio State Hospital Rev. (University Hospitals Health System, Inc.), 5%, 1/15/2050 (Put Date 1/15/2025) | | | 5,595,000 | 5,628,032 |
Portfolio of Investments – continued
| Issuer | | | Shares/Par | Value ($) |
| Municipal Bonds - continued |
| Ohio - continued |
| Triway, OH, Local School District Board of Education, BAM, 3%, 12/01/2024 | | $ | 400,000 | $397,145 |
| Youngstown State University, OH, General Receipts, AGM, 4%, 12/15/2024 | | | 650,000 | 650,669 |
| | | | | $77,055,593 |
| Oklahoma - 0.4% |
| Cushing, OK, Educational Facilities Lease Authority Rev. (Cushing Public Schools Project), 5%, 9/01/2024 | | $ | 5,000,000 | $5,013,636 |
| Oklahoma Housing Finance Agency, Single Family Mortgage Rev. (Homeownership Loan Project), “D”, GNMA, 6.5%, 9/01/2054 | | | 2,250,000 | 2,511,193 |
| Rogers County, OK, Educational Facilities Authority Lease Rev. (Catoosa Public Schools Project), 5%, 9/01/2024 | | | 950,000 | 952,873 |
| Tulsa County, OK, Industrial Authority, Senior Living Community Rev. (Montereau, Inc.), 5%, 11/15/2025 | | | 800,000 | 799,866 |
| Tulsa County, OK, Industrial Authority, Senior Living Community Rev. (Montereau, Inc.), 5%, 11/15/2026 | | | 500,000 | 500,815 |
| Tulsa, OK, Trustees of the Tulsa Airports Improvement Trust, General Airport Rev., “A”, BAM, 4%, 6/01/2024 | | | 425,000 | 424,624 |
| Tulsa, OK, Trustees of the Tulsa Airports Improvement Trust, General Airport Rev., “A”, BAM, 4%, 6/01/2025 | | | 440,000 | 438,952 |
| Tulsa, OK, Trustees of the Tulsa Airports Improvement Trust, General Airport Rev., “A”, BAM, 4%, 6/01/2026 | | | 300,000 | 299,093 |
| | | | | $10,941,052 |
| Oregon - 0.6% |
| Multnomah County, OR, Hospital Facilities Authority Refunding Rev. (Terwilliger Plaza - Parkview Project), “B-1”, 1.2%, 6/01/2028 | | $ | 435,000 | $382,770 |
| Oregon Facilities Authority Lease Rent Rev. (Legacy Health System - Centurion Foundation), “A”, 4.9%, 9/15/2035 | | | 7,850,000 | 8,202,507 |
| Oregon Facilities Authority Rev. (Samaritan Health Services Project), “A”, 5%, 10/01/2024 | | | 200,000 | 200,524 |
| Oregon Facilities Authority Rev. (Samaritan Health Services Project), “A”, 5%, 10/01/2025 | | | 225,000 | 226,835 |
| Oregon Facilities Authority Rev. (Samaritan Health Services Project), “A”, 5%, 10/01/2026 | | | 150,000 | 152,319 |
| Oregon Facilities Authority Rev. (Samaritan Health Services Project), “A”, 5%, 10/01/2027 | | | 125,000 | 127,884 |
| Oregon Facilities Authority Rev. (Samaritan Health Services Project), “A”, 5%, 10/01/2028 | | | 150,000 | 155,003 |
| Oregon Facilities Authority Rev. (Samaritan Health Services Project), “A”, 5%, 10/01/2029 | | | 300,000 | 312,875 |
| Oregon Facilities Authority Rev. (Samaritan Health Services Project), “A”, 5%, 10/01/2030 | | | 300,000 | 315,424 |
Portfolio of Investments – continued
| Issuer | | | Shares/Par | Value ($) |
| Municipal Bonds - continued |
| Oregon - continued |
| Oregon Housing & Community Services Department, Multi-Family Housing Rev. (Plaza Los Amigos Apartments Project, “T-2”, 3%, 2/01/2026 (Put Date 2/01/2025) | | $ | 2,375,000 | $2,349,471 |
| Port of Portland, OR, International Airport Rev., “24B”, 5%, 7/01/2024 | | | 1,500,000 | 1,501,646 |
| Port of Portland, OR, International Airport Rev., “24B”, 5%, 7/01/2025 | | | 1,000,000 | 1,012,807 |
| Union County, OR, Hospital Facility Authority Rev. (Grande Ronde Hospital Project), 5%, 7/01/2024 | | | 125,000 | 125,025 |
| Union County, OR, Hospital Facility Authority Rev. (Grande Ronde Hospital Project), 5%, 7/01/2025 | | | 125,000 | 125,732 |
| Union County, OR, Hospital Facility Authority Rev. (Grande Ronde Hospital Project), 5%, 7/01/2027 | | | 425,000 | 433,727 |
| Union County, OR, Hospital Facility Authority Rev. (Grande Ronde Hospital Project), 5%, 7/01/2029 | | | 400,000 | 413,987 |
| Union County, OR, Hospital Facility Authority Rev. (Grande Ronde Hospital Project), 5%, 7/01/2030 | | | 300,000 | 312,546 |
| | | | | $16,351,082 |
| Pennsylvania - 6.3% |
| Allegheny County, PA, Hospital Development Authority Rev. (Allegheny Health Network Obligated Group), “A”, 5%, 4/01/2026 | | $ | 2,750,000 | $2,810,369 |
| Allentown, PA, City School District, BAM, 5%, 2/01/2026 | | | 4,155,000 | 4,231,648 |
| Allentown, PA, Neighborhood Improvement Zone Development Authority Tax Refunding Rev., 5%, 5/01/2024 | | | 150,000 | 150,000 |
| Allentown, PA, Neighborhood Improvement Zone Development Authority Tax Refunding Rev., 5%, 5/01/2025 | | | 500,000 | 502,003 |
| Allentown, PA, Neighborhood Improvement Zone Development Authority Tax Refunding Rev., 5%, 5/01/2026 | | | 490,000 | 498,319 |
| Altoona, PA, Area School District, Taxable, AGM, 0.733%, 12/01/2024 | | | 1,105,000 | 1,075,035 |
| Altoona, PA, Area School District, Taxable, AGM, 1.005%, 12/01/2025 | | | 900,000 | 840,101 |
| Beaver County, PA, Big Beaver Falls School District Rev., BAM, 5%, 3/15/2025 | | | 1,325,000 | 1,338,550 |
| Beaver County, PA, Rochester Area School District, BAM, 1%, 5/01/2024 | | | 200,000 | 200,000 |
| Beaver County, PA, Rochester Area School District, BAM, 3%, 5/01/2025 | | | 500,000 | 494,292 |
| Berks County, PA, Industrial Development Authority Health System Rev. (Tower Health Project), 5%, 11/01/2024 | | | 400,000 | 333,392 |
| Berks County, PA, Industrial Development Authority Health System Rev. (Tower Health Project), 5%, 11/01/2025 | | | 1,950,000 | 1,390,607 |
Portfolio of Investments – continued
| Issuer | | | Shares/Par | Value ($) |
| Municipal Bonds - continued |
| Pennsylvania - continued |
| Berks County, PA, Industrial Development Authority Health System Rev. (Tower Health Project), 5%, 11/01/2026 | | $ | 200,000 | $131,834 |
| Berks County, PA, Industrial Development Authority Health System Rev. (Tower Health Project), 5%, 11/01/2027 | | | 465,000 | 284,652 |
| Berks County, PA, Industrial Development Authority Health System Rev. (Tower Health Project), 5%, 11/01/2028 | | | 855,000 | 483,329 |
| Berks County, PA, Industrial Development Authority Health System Rev. (Tower Health Project), 5%, 11/01/2029 | | | 1,620,000 | 878,218 |
| Berks County, PA, Municipal Authority Rev. (Tower Health Project), “A”, 5%, 2/01/2025 | | | 565,000 | 435,285 |
| Berks County, PA, Municipal Authority Rev. (Tower Health Project), “A”, 5%, 2/01/2026 | | | 1,000,000 | 683,049 |
| Berks County, PA, Municipal Authority Rev. (Tower Health Project), “A”, 5%, 2/01/2027 | | | 1,100,000 | 703,046 |
| Berks County, PA, Municipal Authority Rev. (Tower Health Project), “B-2”, 5%, 2/01/2040 (Put Date 2/01/2027) | | | 5,545,000 | 3,543,989 |
| Berks County, PA, Reading School District, “A”, BAM, 4%, 4/01/2025 | | | 1,000,000 | 998,898 |
| Chester County, PA, Health & Education Facilities Authority Rev. (Simpson Senior Services Project), 4%, 12/01/2025 | | | 360,000 | 341,832 |
| Chester County, PA, Health & Education Facilities Authority Rev. (Simpson Senior Services Project), 4%, 12/01/2026 | | | 755,000 | 694,159 |
| Chester County, PA, Health & Education Facilities Authority Rev. (Simpson Senior Services Project), 4%, 12/01/2027 | | | 795,000 | 708,067 |
| Chester County, PA, Health & Education Facilities Authority Rev. (Simpson Senior Services Project), 4%, 12/01/2028 | | | 830,000 | 716,461 |
| Chester County, PA, Health & Education Facilities Authority Rev. (Simpson Senior Services Project), 4%, 12/01/2029 | | | 865,000 | 724,048 |
| Chester County, PA, Health & Education Facilities Authority Rev. (Simpson Senior Services Project), 4%, 12/01/2030 | | | 450,000 | 365,467 |
| Commonwealth of Pennsylvania, Tobacco Master Settlement Financing Authority Rev., 5%, 6/01/2027 | | | 3,000,000 | 3,116,596 |
| Connellsville, PA, Area School District General Obligation, AGM, 4%, 11/15/2024 | | | 530,000 | 530,230 |
| Dallas, PA, Municipal Authority, University Rev. (Misericordia University Project), 5%, 5/01/2029 | | | 920,000 | 909,949 |
| Delaware Valley, PA, Regional Finance Authority, “A”, 2%, 10/01/2029 | | | 4,550,000 | 4,004,860 |
| Doylestown, PA, Hospital Authority Rev., 5%, 7/01/2031 | | | 1,400,000 | 1,413,597 |
| Erie, PA, City School District General Obligation, “A”, AGM, 5%, 4/01/2027 | | | 1,075,000 | 1,112,929 |
| Erie, PA, City School District General Obligation, “B”, AGM, 5%, 4/01/2025 | | | 475,000 | 480,212 |
Portfolio of Investments – continued
| Issuer | | | Shares/Par | Value ($) |
| Municipal Bonds - continued |
| Pennsylvania - continued |
| Fayette County, PA, Laurel Highlands School District, General Obligation , BAM, 4%, 2/01/2025 | | $ | 350,000 | $349,774 |
| Lancaster County, PA, Hospital Authority Health Center Rev. (Masonic Villages Project), 5%, 11/01/2024 | | | 700,000 | 700,883 |
| Lancaster County, PA, Hospital Authority Health Center Rev. (Masonic Villages Project), 5%, 11/01/2025 | | | 265,000 | 266,437 |
| Lancaster County, PA, Pequea Valley School District, 3%, 5/15/2024 | | | 225,000 | 224,851 |
| Lancaster County, PA, Pequea Valley School District, 1.5%, 5/15/2025 | | | 125,000 | 120,417 |
| Lancaster County, PA, Pequea Valley School District, 4%, 5/15/2025 | | | 100,000 | 100,233 |
| Lancaster County, PA, Pequea Valley School District, 1.5%, 5/15/2026 | | | 150,000 | 140,567 |
| Lancaster, PA, Higher Education Authority College Rev. (Harrisburg Area Community College Project), BAM, 5%, 10/01/2024 | | | 465,000 | 466,816 |
| Lancaster, PA, Higher Education Authority College Rev. (Harrisburg Area Community College Project), BAM, 5%, 10/01/2025 | | | 630,000 | 640,618 |
| Lancaster, PA, Higher Education Authority College Rev. (Harrisburg Area Community College Project), BAM, 4%, 10/01/2031 | | | 500,000 | 507,750 |
| Lancaster, PA, Parking Rev., “A”, BAM, 4%, 9/01/2024 | | | 1,015,000 | 1,015,177 |
| Lancaster, PA, Parking Rev., “A”, BAM, 4%, 9/01/2025 | | | 525,000 | 527,870 |
| Lancaster, PA, Parking Rev., “A”, BAM, 3%, 12/01/2025 | | | 500,000 | 492,699 |
| Lancaster, PA, Parking Rev., “A”, BAM, 4%, 9/01/2029 | | | 410,000 | 414,718 |
| Lancaster, PA, Parking Rev., “A”, BAM, 3%, 12/01/2029 | | | 525,000 | 501,928 |
| Lancaster, PA, Parking Rev., “A”, BAM, 4%, 9/01/2030 | | | 165,000 | 167,052 |
| Lancaster, PA, Parking Rev., “A”, BAM, 4%, 9/01/2031 | | | 440,000 | 445,255 |
| Lawrence County, PA, New Castle Area School District, General Obligation, BAM, 4%, 3/01/2025 | | | 805,000 | 805,282 |
| Lehigh County, PA, Industrial Development Authority, Pollution Control Rev. (PPL Electric Utilities Corporation Project), “A”, 3%, 9/01/2029 | | | 8,000,000 | 7,562,863 |
| Luzerne County, PA, “A”, AGM, 5%, 12/15/2024 | | | 410,000 | 413,270 |
| Luzerne County, PA, Industrial Development Authority, Tax Exempt Guaranteed Lease Rev., AGM, 5%, 12/15/2025 | | | 1,000,000 | 1,017,564 |
| Luzerne, Carbon and Schuylkill Counties, PA, Hazleton Area School District, General Obligation, “A”, AGM, 2%, 3/01/2029 | | | 1,135,000 | 1,019,243 |
| Luzerne, Carbon and Schuylkill Counties, PA, Hazleton Area School District, General Obligation, Taxable, “B”, AGM, 1.039%, 3/01/2025 | | | 515,000 | 496,415 |
| Luzerne, Carbon and Schuylkill Counties, PA, Hazleton Area School District, General Obligation, Taxable, “B”, AGM, 1.229%, 3/01/2026 | | | 1,250,000 | 1,159,843 |
Portfolio of Investments – continued
| Issuer | | | Shares/Par | Value ($) |
| Municipal Bonds - continued |
| Pennsylvania - continued |
| Luzerne, Carbon and Schuylkill Counties, PA, Hazleton Area School District, General Obligation, Taxable, “B”, AGM, 1.47%, 3/01/2027 | | $ | 1,000,000 | $900,259 |
| Lycoming County, PA, College Rev. (Pennsylvania College of Technology), “A”, BAM, 5%, 7/01/2024 | | | 1,000,000 | 1,001,164 |
| Lycoming County, PA, College Rev. (Pennsylvania College of Technology), “A”, BAM, 5%, 7/01/2025 | | | 500,000 | 505,153 |
| Montgomery County, PA, Higher Education & Health Authority Rev. (Thomas Jefferson University), 5%, 9/01/2029 | | | 1,000,000 | 1,063,954 |
| Montgomery County, PA, Higher Education & Health Authority Rev. (Thomas Jefferson University), 5%, 9/01/2030 | | | 1,350,000 | 1,438,330 |
| Montgomery County, PA, Higher Education & Health Authority Rev. (Thomas Jefferson University), 5%, 9/01/2031 | | | 2,355,000 | 2,504,491 |
| Pennsylvania Economic Development Financing Authority Rev. (Presbyterian Senior Living Project), 4%, 7/01/2030 | | | 1,600,000 | 1,582,706 |
| Pennsylvania Economic Development Financing Authority Rev. (Presbyterian Senior Living Project), 4%, 7/01/2033 | | | 1,750,000 | 1,719,604 |
| Pennsylvania Economic Development Financing Authority Rev., Private Activity Rev. (Rapid Bridge Replacement Project), 5%, 12/31/2029 | | | 1,805,000 | 1,827,250 |
| Pennsylvania Economic Development Financing Authority, Junior Insured Parking Rev. (Capital Region Parking System), “C”, AGM, 5%, 1/01/2025 | | | 2,000,000 | 2,009,081 |
| Pennsylvania Economic Development Financing Authority, Junior Insured Parking Rev. (Capital Region Parking System), “C”, AGM, 5%, 1/01/2026 | | | 915,000 | 928,952 |
| Pennsylvania Economic Development Financing Authority, Private Activity Rev. (PennDOT Major Bridges Package One Project), 5%, 12/31/2031 | | | 10,825,000 | 11,742,453 |
| Pennsylvania Economic Development Financing Authority, Private Activity Rev. (Pennsylvania Rapid Bridge Replacement Project), 5%, 12/31/2034 | | | 5,000,000 | 5,055,472 |
| Pennsylvania Economic Development Financing Authority, Sewage Sludge Disposal Refunding Rev. (Philadelphia Biosolids Facility Project), 4%, 1/01/2026 | | | 110,000 | 108,795 |
| Pennsylvania Economic Development Financing Authority, Solid Waste Disposal Rev. (Waste Management, Inc. Project), “A-2”, 4.6%, 10/01/2046 (Put Date 10/01/2026) | | | 5,000,000 | 5,062,533 |
| Pennsylvania Higher Educational Assistance Agency, Education Loan Rev., “1A”, 5%, 6/01/2029 (w) | | | 1,550,000 | 1,629,150 |
| Pennsylvania Higher Educational Assistance Agency, Education Loan Rev., “1A”, 5%, 6/01/2030 (w) | | | 2,365,000 | 2,508,231 |
Portfolio of Investments – continued
| Issuer | | | Shares/Par | Value ($) |
| Municipal Bonds - continued |
| Pennsylvania - continued |
| Pennsylvania Higher Educational Assistance Agency, Education Loan Rev., “1A”, 5%, 6/01/2031 (w) | | $ | 2,315,000 | $2,472,911 |
| Pennsylvania Higher Educational Assistance Agency, Education Loan Rev., “1A”, 5%, 6/01/2032 (w) | | | 2,000,000 | 2,143,505 |
| Pennsylvania Higher Educational Assistance Agency, Education Loan Rev., “1A”, 5%, 6/01/2033 (w) | | | 1,244,000 | 1,339,703 |
| Pennsylvania Higher Educational Assistance Agency, Education Loan Rev., “A”, 5%, 6/01/2026 | | | 2,050,000 | 2,072,849 |
| Pennsylvania Higher Educational Assistance Agency, Education Loan Rev., “A”, 5%, 6/01/2026 | | | 475,000 | 480,294 |
| Pennsylvania Higher Educational Assistance Agency, Education Loan Rev., “A”, 5%, 6/01/2027 | | | 2,700,000 | 2,757,401 |
| Pennsylvania Higher Educational Assistance Agency, Education Loan Rev., “A”, 5%, 6/01/2027 | | | 350,000 | 357,441 |
| Pennsylvania Higher Educational Assistance Agency, Education Loan Rev., “A”, 5%, 6/01/2028 | | | 550,000 | 566,447 |
| Pennsylvania Higher Educational Assistance Agency, Education Loan Rev., “A”, 5%, 6/01/2029 | | | 230,000 | 239,089 |
| Pennsylvania Higher Educational Assistance Agency, Education Loan Rev., “A”, 5%, 6/01/2029 | | | 3,590,000 | 3,731,869 |
| Pennsylvania Higher Educational Facilities Authority Rev. (Drexel University), “A”, AGM, 5%, 5/01/2024 | | | 340,000 | 340,000 |
| Pennsylvania Higher Educational Facilities Authority Rev. (Drexel University), “A”, AGM, 5%, 5/01/2025 | | | 350,000 | 353,829 |
| Pennsylvania Housing Finance Agency, Multi-Family Housing Development (Cambridge Square), “B”, FNMA, 5%, 11/01/2026 (Put Date 11/01/2025) | | | 500,000 | 505,104 |
| Pennsylvania Housing Finance Agency, Single Family Mortgage Rev., “128A”, 4.75%, 4/01/2033 | | | 4,430,000 | 4,409,367 |
| Pennsylvania Housing Finance Agency, Single Family Mortgage Rev., “133”, 5%, 10/01/2025 | | | 750,000 | 762,205 |
| Pennsylvania Housing Finance Agency, Single Family Mortgage Rev., “133”, 5%, 10/01/2026 | | | 740,000 | 763,143 |
| Pennsylvania Housing Finance Agency, Single Family Mortgage Rev., “135B”, 5%, 10/01/2024 | | | 805,000 | 806,194 |
| Pennsylvania Housing Finance Agency, Single Family Mortgage Rev., “135B”, 5%, 4/01/2025 | | | 575,000 | 577,722 |
| Pennsylvania Housing Finance Agency, Single Family Mortgage Rev., “135B”, 5%, 10/01/2025 | | | 1,090,000 | 1,099,507 |
| Pennsylvania Housing Finance Agency, Single Family Mortgage Rev., “135B”, 5%, 4/01/2026 | | | 1,105,000 | 1,118,821 |
| Pennsylvania Housing Finance Agency, Single Family Mortgage Rev., “135B”, 5%, 10/01/2026 | | | 2,250,000 | 2,284,446 |
Portfolio of Investments – continued
| Issuer | | | Shares/Par | Value ($) |
| Municipal Bonds - continued |
| Pennsylvania - continued |
| Pennsylvania Housing Finance Agency, Single Family Mortgage Rev., “135B”, 5%, 4/01/2027 | | $ | 2,285,000 | $2,329,006 |
| Pennsylvania Housing Finance Agency, Single Family Mortgage Rev., “125A”, 3.2%, 10/01/2028 | | | 3,550,000 | 3,393,859 |
| Pennsylvania Public School Building Authority, College Rev. (Northampton County Area Community College Project), BAM, 5%, 6/15/2024 | | | 320,000 | 320,303 |
| Pennsylvania Public School Building Authority, College Rev. (Northampton County Area Community College Project), BAM, 5%, 6/15/2025 | | | 375,000 | 379,758 |
| Pennsylvania Public School Building Authority, College Rev. (Northampton County Community College), BAM, 5%, 3/01/2025 | | | 675,000 | 680,937 |
| Pennsylvania Public School Building Authority, College Rev. (Westmoreland County Community College), AGM, 4%, 10/15/2024 | | | 300,000 | 300,061 |
| Philadelphia, PA, Authority for Industrial Development Charter School Rev. (Green Woods Charter School Project), “A”, 5%, 6/15/2032 | | | 240,000 | 242,584 |
| Philadelphia, PA, Authority for Industrial Development City Agreement Rev. (Cultural and Commercial Corridors Program), “A”, 5%, 12/01/2024 | | | 5,675,000 | 5,707,147 |
| Philadelphia, PA, School District, “A”, 5%, 9/01/2025 | | | 1,000,000 | 1,016,383 |
| Philadelphia, PA, School District, “A”, 5%, 9/01/2026 | | | 635,000 | 653,679 |
| Philadelphia, PA, School District, “A”, 5%, 9/01/2027 | | | 1,850,000 | 1,932,047 |
| Philadelphia, PA, School District, “A”, 5.25%, 9/01/2036 | | | 2,250,000 | 2,528,424 |
| Philadelphia, PA, School District, “A”, 5.25%, 9/01/2037 | | | 4,030,000 | 4,538,184 |
| Philadelphia, PA, School District, “A”, 5.25%, 9/01/2038 | | | 1,295,000 | 1,449,810 |
| Philadelphia, PA, School District, “F”, 5%, 9/01/2026 | | | 5,000,000 | 5,147,079 |
| Wayne County, PA, County Guaranteed Hospital Rev. (Wayne Memorial Hospital Project), “A”, 5%, 7/01/2030 | | | 500,000 | 518,106 |
| West Mifflin, PA, Area School District, AGM, 5%, 4/01/2025 | | | 1,000,000 | 1,010,524 |
| West Shore, PA, Area Authority Rev. (Messiah Village Project), “A”, 5%, 7/01/2025 | | | 1,095,000 | 1,092,602 |
| Westmoreland County, PA, Burrell School District, BAM, 4%, 7/15/2024 | | | 745,000 | 745,021 |
| Westmoreland County, PA, Industrial Development Authority Rev. (Redstone Presbyterian Seniorcare Obligated Group), 4%, 5/15/2024 | | | 440,000 | 439,877 |
| Westmoreland County, PA, Industrial Development Authority Rev. (Redstone Presbyterian Seniorcare Obligated Group), 4%, 5/15/2025 | | | 625,000 | 620,181 |
Portfolio of Investments – continued
| Issuer | | | Shares/Par | Value ($) |
| Municipal Bonds - continued |
| Pennsylvania - continued |
| Westmoreland County, PA, Industrial Development Authority Rev. (Redstone Presbyterian Seniorcare Obligated Group), 4%, 5/15/2026 | | $ | 150,000 | $147,440 |
| | | | | $162,644,985 |
| Puerto Rico - 2.3% |
| Commonwealth of Puerto Rico, General Obligation Restructured Bonds, “A”, 5.625%, 7/01/2029 | | $ | 14,750,000 | $15,894,513 |
| Commonwealth of Puerto Rico, General Obligation Restructured Bonds, “A”, 5.75%, 7/01/2031 | | | 1,521,000 | 1,695,308 |
| Puerto Rico Aqueduct and Sewer Authority Rev., “A”, 5%, 7/01/2024 | | | 3,430,000 | 3,435,778 |
| Puerto Rico Aqueduct and Sewer Authority Rev., “A”, 5%, 7/01/2025 | | | 315,000 | 318,961 |
| Puerto Rico Aqueduct and Sewer Authority Rev., “A”, 5%, 7/01/2025 (n) | | | 4,100,000 | 4,151,550 |
| Puerto Rico Aqueduct and Sewer Authority Rev., “B”, 5%, 7/01/2025 | | | 265,000 | 268,332 |
| Puerto Rico Electric Power Authority Refunding Rev., “PP”, NPFG, 5%, 7/01/2024 | | | 110,000 | 110,010 |
| Puerto Rico Electric Power Authority Refunding Rev., “PP”, NPFG, 5%, 7/01/2025 | | | 115,000 | 115,013 |
| Puerto Rico Electric Power Authority Rev., “DDD”, AGM, 3.65%, 7/01/2024 | | | 3,930,000 | 3,920,355 |
| Puerto Rico Electric Power Authority Rev., “TT”, NPFG, 5%, 7/01/2024 | | | 530,000 | 530,257 |
| Puerto Rico Electric Power Authority Rev., “TT”, NPFG, 5%, 7/01/2026 | | | 25,000 | 25,013 |
| Puerto Rico Electric Power Authority Rev., “UU”, AGM, 5%, 7/01/2024 | | | 1,310,000 | 1,309,998 |
| Puerto Rico Electric Power Authority Rev., “VV”, NPFG, 5.25%, 7/01/2025 | | | 195,000 | 193,806 |
| Puerto Rico Electric Power Authority Rev., “VV”, NPFG, 5.25%, 7/01/2026 | | | 625,000 | 618,612 |
| Puerto Rico Electric Power Authority Rev., “RR”, NPFG, 5%, 7/01/2024 | | | 1,920,000 | 1,920,169 |
| Puerto Rico Housing Finance Authority, Multi-Family Housing Collateralized Rev. (Mirador Las Casas Project), “B”, 5%, 3/01/2027 (Put Date 3/01/2026) | | | 1,575,000 | 1,608,715 |
| Puerto Rico Municipal Finance Agency, “A”, AGM, 5%, 8/01/2027 | | | 90,000 | 90,596 |
| Puerto Rico Sales Tax Financing Corp., Restructured Sales Tax Rev., “2019A-1”, 4.5%, 7/01/2034 | | | 207,000 | 207,734 |
Portfolio of Investments – continued
| Issuer | | | Shares/Par | Value ($) |
| Municipal Bonds - continued |
| Puerto Rico - continued |
| Puerto Rico Sales Tax Financing Corp., Restructured Sales Tax Rev., Capital Appreciation, “2019A-1”, 0%, 7/01/2027 | | $ | 718,000 | $635,801 |
| Puerto Rico Sales Tax Financing Corp., Restructured Sales Tax Rev., Capital Appreciation, “2019A-1”, 0%, 7/01/2029 | | | 15,340,000 | 12,566,198 |
| Puerto Rico Sales Tax Financing Corp., Restructured Sales Tax Rev., Capital Appreciation, “2019A-1”, 0%, 7/01/2033 | | | 16,249,000 | 11,202,212 |
| University of Puerto Rico Rev., “P”, NPFG, 5%, 6/01/2025 | | | 245,000 | 245,253 |
| | | | | $61,064,184 |
| Rhode Island - 1.6% |
| Rhode Island Health and Educational Building Corp. Rev. (Lifespan Obligated Group), 5%, 5/15/2026 | | $ | 5,000,000 | $5,088,040 |
| Rhode Island Health and Educational Building Corp., Higher Education Facility Refunding Rev. (Providence College), “B”, 5%, 11/01/2024 | | | 430,000 | 432,436 |
| Rhode Island Housing and Mortgage Finance Corp., Home Ownership Opportunity, “78-A”, 5.5%, 10/01/2052 | | | 6,655,000 | 6,974,029 |
| Rhode Island Student Loan Authority, Education Loan Rev., “A”, 5%, 12/01/2025 | | | 600,000 | 607,940 |
| Rhode Island Student Loan Authority, Education Loan Rev., “A”, 5%, 12/01/2026 | | | 875,000 | 895,652 |
| Rhode Island Student Loan Authority, Education Loan Rev., “A”, 5%, 12/01/2028 | | | 800,000 | 840,310 |
| Rhode Island Student Loan Authority, Education Loan Rev., “A”, 5%, 12/01/2029 | | | 1,825,000 | 1,934,355 |
| Rhode Island Student Loan Authority, Education Loan Rev., “A”, 5%, 12/01/2030 | | | 1,900,000 | 2,015,985 |
| Rhode Island Student Loan Authority, Education Loan Rev., “A”, 5%, 12/01/2031 | | | 1,960,000 | 2,089,811 |
| Rhode Island Student Loan Authority, Education Loan Rev., “A”, 5%, 12/01/2032 | | | 1,900,000 | 2,030,207 |
| Rhode Island Student Loan Authority, Education Loan Rev., “A”, 5%, 12/01/2033 | | | 760,000 | 813,541 |
| Rhode Island Student Loan Authority, Education Loan Rev., Federally Taxable, “1”, 4.125%, 12/01/2041 | | | 4,825,000 | 4,649,979 |
| Rhode Island Student Loan Authority, Student Loan Rev., “A”, 4%, 12/01/2025 | | | 2,005,000 | 1,991,187 |
| Rhode Island Student Loan Authority, Student Loan Rev., “A”, 5%, 12/01/2026 | | | 950,000 | 972,422 |
| Rhode Island Student Loan Authority, Student Loan Rev., “A”, 5%, 12/01/2027 | | | 800,000 | 829,601 |
| Rhode Island Student Loan Authority, Student Loan Rev., “A”, 5%, 12/01/2028 | | | 1,000,000 | 1,049,958 |
Portfolio of Investments – continued
| Issuer | | | Shares/Par | Value ($) |
| Municipal Bonds - continued |
| Rhode Island - continued |
| Rhode Island Student Loan Authority, Student Loan Rev., “A”, 3.5%, 12/01/2034 | | $ | 700,000 | $651,350 |
| Rhode Island Student Loan Authority, Student Loan Rev., ”A“, 5%, 12/01/2024 | | | 765,000 | 768,906 |
| Rhode Island Student Loan Authority, Student Loan Rev., ”A“, 5%, 12/01/2025 | | | 1,000,000 | 1,012,775 |
| Rhode Island Student Loan Authority, Student Loan Rev., ”A“, 5%, 12/01/2026 | | | 1,125,000 | 1,151,553 |
| Rhode Island Student Loan Authority, Student Loan Rev., ”A“, 5%, 12/01/2027 | | | 2,130,000 | 2,208,813 |
| Rhode Island Student Loan Authority, Student Loan Rev., ”A“, 5%, 12/01/2028 | | | 1,185,000 | 1,244,200 |
| Rhode Island Student Loan Authority, Student Loan Rev., ”A“, 5%, 12/01/2029 | | | 1,250,000 | 1,324,901 |
| | | | | $41,577,951 |
| South Carolina - 1.0% |
| Patriots Energy Group Financing Agency, SC, Gas Supply Rev., “B-1”, 5.25%, 2/01/2054 (Put Date 3/01/2031) | | $ | 8,700,000 | $9,280,874 |
| South Carolina Housing Finance & Development Authority Mortgage Rev., “A”, 5%, 1/01/2025 | | | 900,000 | 905,745 |
| South Carolina Housing Finance & Development Authority Mortgage Rev., “A”, 5%, 7/01/2025 | | | 1,005,000 | 1,017,389 |
| South Carolina Jobs & Economic Development Authority, Health Facilities Rev. (Anderson Area Medical Center Inc.), 5%, 2/01/2038 (Prerefunded 2/01/2026) | | | 335,000 | 343,430 |
| South Carolina Jobs & Economic Development Authority, Health Facilities Rev. (Anderson Area Medical Center Inc.), 5%, 2/01/2038 | | | 1,345,000 | 1,361,332 |
| South Carolina Student Loan Corp., Student Loan Rev., Taxable, “A”, 2.368%, 12/01/2024 | | | 5,000,000 | 4,905,026 |
| South Carolina Student Loan Corp., Student Loan Rev., Taxable, “A”, 2.468%, 12/01/2025 | | | 6,850,000 | 6,493,947 |
| Sumter, SC, Two School Facilities, Inc. (Sumter School District), BAM, 5%, 12/01/2024 | | | 1,000,000 | 1,004,522 |
| Sumter, SC, Two School Facilities, Inc. (Sumter School District), BAM, 5%, 12/01/2025 | | | 1,500,000 | 1,527,880 |
| | | | | $26,840,145 |
| South Dakota - 0.1% |
| South Dakota Educational Enhancement Funding Corp., Tobacco Settlement Rev., Taxable, 0.961%, 6/01/2024 | | $ | 3,425,000 | $3,411,637 |
Portfolio of Investments – continued
| Issuer | | | Shares/Par | Value ($) |
| Municipal Bonds - continued |
| Tennessee - 3.1% |
| Knox County, TN, Health, Educational & Housing Facility Board Hospital Rev. (Covenant Health), “A”, 5%, 1/01/2025 | | $ | 545,000 | $545,327 |
| Knox County, TN, Health, Educational & Housing Facility Board Rev. (East Tennessee Children's Hospital), 5%, 11/15/2029 | | | 1,175,000 | 1,240,603 |
| Knox County, TN, Health, Educational & Housing Facility Board Rev. (University Health Systems, Inc.), 5%, 4/01/2025 | | | 2,350,000 | 2,361,098 |
| Knox County, TN, Health, Educational & Housing Facility Board Rev. (University Health Systems, Inc.), 5%, 4/01/2027 | | | 265,000 | 270,880 |
| Knox County, TN, Health, Educational & Housing Facility Board Rev. (University Health Systems, Inc.), 5%, 4/01/2028 | | | 500,000 | 510,673 |
| Knox County, TN, Health, Educational & Housing Facility Board Rev. (University Health Systems, Inc.), 5%, 9/01/2028 | | | 490,000 | 500,116 |
| Knox County, TN, Health, Educational & Housing Facility Board Rev. (University Health Systems, Inc.), 5%, 4/01/2029 | | | 1,450,000 | 1,481,819 |
| Knox County, TN, Health, Educational & Housing Facility Board Rev. (University Health Systems, Inc.), “A”, 5%, 9/01/2030 | | | 6,970,000 | 7,246,630 |
| Knox County, TN, Health, Educational & Housing Facility Board, Multi-Family Housing Rev. (Westview Towers Project), 3.95%, 12/01/2027 (Put Date 12/01/2025) | | | 930,000 | 918,516 |
| Memphis-Shelby County, TN, Airport Authority Refunding Rev., “C”, 5%, 7/01/2024 | | | 850,000 | 850,651 |
| Memphis-Shelby County, TN, Airport Authority Rev., “A”, 5%, 7/01/2026 | | | 175,000 | 178,994 |
| Memphis-Shelby County, TN, Airport Authority Rev., “B”, 5%, 7/01/2024 | | | 4,000,000 | 4,003,064 |
| Memphis-Shelby County, TN, Airport Authority Rev., “B”, 5%, 7/01/2025 | | | 2,500,000 | 2,526,331 |
| Metropolitan Nashville, TN, Airport Authority Improvement Rev., “B”, 5.25%, 7/01/2032 | | | 1,250,000 | 1,388,789 |
| Shelby County, TN, New Memphis Arena Public Building Authority, Local Government Public Improvement (City of Memphis Project), Capital Appreciation, 0%, 4/01/2031 | | | 1,170,000 | 1,058,320 |
| Tennergy Corp., TN, Gas Supply Rev., “A”, 5.25%, 12/01/2024 | | | 575,000 | 576,130 |
| Tennergy Corp., TN, Gas Supply Rev., “A”, 5.25%, 12/01/2025 | | | 575,000 | 579,102 |
| Tennergy Corp., TN, Gas Supply Rev., “A”, 5.25%, 12/01/2026 | | | 725,000 | 733,577 |
| Tennergy Corp., TN, Gas Supply Rev., “A”, 5.5%, 12/01/2027 | | | 750,000 | 770,486 |
| Tennergy Corp., TN, Gas Supply Rev., “A”, 5.5%, 10/01/2053 (Put Date 12/01/2030) | | | 15,915,000 | 16,726,994 |
| Tennessee Energy Acquisition Corp., Gas Project Rev., “A-1”, 5%, 5/01/2053 (Put Date 5/01/2028) | | | 16,000,000 | 16,482,858 |
| Tennessee Energy Acquisition Corp., Gas Rev., “A”, 4%, 11/01/2049 (Put Date 5/01/2028) | | | 18,380,000 | 18,376,809 |
Portfolio of Investments – continued
| Issuer | | | Shares/Par | Value ($) |
| Municipal Bonds - continued |
| Tennessee - continued |
| Tennessee Housing Development Agency, Residential Finance Program Rev., “1”, 5%, 7/01/2025 | | $ | 1,350,000 | $1,366,642 |
| | | | | $80,694,409 |
| Texas - 7.9% |
| Arlington, TX, Higher Education Finance Corp. Education Rev. (Riverwalk Education Foundation, Inc.), Texas PSF, 5%, 8/15/2024 | | $ | 325,000 | $325,846 |
| Arlington, TX, Higher Education Finance Corp. Education Rev. (Riverwalk Education Foundation, Inc.), Texas PSF, 5%, 8/15/2025 | | | 400,000 | 406,413 |
| Arlington, TX, Higher Education Finance Corp. Rev. (Basis Charter Schools, Inc.), 4.5%, 6/15/2056 (Put Date 6/15/2026) (n) | | | 575,000 | 574,130 |
| Arlington, TX, Housing Finance Corp. Multi-Family Housing Rev. (6900 Matlock Road Project), 4.5%, 4/01/2041 (Put Date 4/01/2027) | | | 5,000,000 | 5,039,774 |
| Austin, TX, Convention Center (Convention Enterprises, Inc.), “A”, 5%, 1/01/2025 | | | 2,790,000 | 2,785,006 |
| Bexar County, TX, Venue Project Rev., Taxable, AGM, 0.76%, 8/15/2024 | | | 455,000 | 448,697 |
| Bexar County, TX, Venue Project Rev., Taxable, AGM, 1.082%, 8/15/2025 | | | 720,000 | 679,918 |
| Bexar County, TX, Venue Project Rev., Taxable, AGM, 1.272%, 8/15/2026 | | | 315,000 | 286,781 |
| Brazos, TX, Higher Education Authority, Inc., Student Loan Program Rev., “1A”, 5%, 4/01/2025 | | | 985,000 | 989,477 |
| Brazos, TX, Higher Education Authority, Inc., Student Loan Program Rev., “1A”, 5%, 4/01/2026 | | | 940,000 | 950,531 |
| Brazos, TX, Higher Education Authority, Inc., Student Loan Program Rev., “1A”, 5%, 4/01/2026 | | | 1,005,000 | 1,018,286 |
| Brazos, TX, Higher Education Authority, Inc., Student Loan Program Rev., “1A”, 5%, 4/01/2027 | | | 805,000 | 820,699 |
| Brazos, TX, Higher Education Authority, Inc., Student Loan Program Rev., “1A”, 5%, 4/01/2028 | | | 710,000 | 728,731 |
| Brazos, TX, Higher Education Authority, Inc., Student Loan Program Rev., “1A”, 5%, 4/01/2028 | | | 1,340,000 | 1,375,352 |
| Brazos, TX, Higher Education Authority, Inc., Student Loan Program Rev., “1A”, 5%, 4/01/2029 | | | 495,000 | 511,333 |
| Brazos, TX, Higher Education Authority, Inc., Student Loan Program Rev., “1A”, 5%, 4/01/2029 | | | 1,440,000 | 1,488,159 |
| Brazos, TX, Higher Education Authority, Inc., Student Loan Program Rev., “1A”, 5.5%, 4/01/2030 | | | 2,195,000 | 2,350,898 |
| Brazos, TX, Higher Education Authority, Inc., Student Loan Program Rev., “1A”, 5.5%, 4/01/2031 | | | 3,875,000 | 4,173,002 |
Portfolio of Investments – continued
| Issuer | | | Shares/Par | Value ($) |
| Municipal Bonds - continued |
| Texas - continued |
| Brazos, TX, Higher Education Authority, Inc., Student Loan Program Rev., “1A”, 5.5%, 4/01/2032 | | $ | 5,000,000 | $5,408,923 |
| Brazos, TX, Higher Education Authority, Inc., Student Loan Program Rev., “1A”, 5.5%, 4/01/2033 | | | 2,500,000 | 2,712,559 |
| Brazos, TX, Higher Education Authority, Inc., Student Loan Program Rev., “1A”, 3%, 4/01/2039 | | | 15,000 | 14,844 |
| Brazos, TX, Higher Education Authority, Inc., Student Loan Program Rev., Taxable, “1A”, 1.674%, 4/01/2025 | | | 250,000 | 241,064 |
| Brazos, TX, Higher Education Authority, Inc., Student Loan Program Rev., Taxable, “1A”, 1.974%, 4/01/2026 | | | 375,000 | 350,358 |
| Brownsville, TX, Navigation District Rev., AGM, 5%, 3/01/2025 | | | 950,000 | 955,868 |
| Brownsville, TX, Navigation District Rev., AGM, 5%, 3/01/2026 | | | 1,000,000 | 1,013,278 |
| Brownsville, TX, Navigation District Rev., AGM, 5%, 3/01/2027 | | | 1,000,000 | 1,013,380 |
| Bryan, TX, Electric System Rev., “A”, AGM, 5%, 7/01/2024 | | | 265,000 | 265,360 |
| Capital Area, TX, Housing Finance Corp., Multi-Family Housing Rev. (Grand Ave. Flats), 0.29%, 8/01/2039 (Put Date 8/01/2024) | | | 2,370,000 | 2,345,150 |
| Capital Area, TX, Housing Finance Corp., Multi-Family Housing Rev. (Redwood Apartments), 3.65%, 1/01/2041 (Put Date 1/01/2026) | | | 1,125,000 | 1,111,717 |
| Cinco Southwest, TX, Municipal Utility District No. 1 Contract Refunding Rev., BAM, 3%, 12/01/2024 | | | 190,000 | 188,452 |
| Clifton, TX, Higher Education Finance Corp. Rev. (Idea Public Schools), Texas PSF, 5%, 8/15/2024 | | | 600,000 | 600,789 |
| Clifton, TX, Higher Education Finance Corp. Rev. (International Leadership of Texas, Inc.), Texas PSF, 5%, 8/15/2027 | | | 1,350,000 | 1,417,051 |
| Clifton, TX, Higher Education Finance Corp. Rev. (Uplift Education), “A”, 3.375%, 12/01/2024 | | | 375,000 | 370,798 |
| Collin and Hunt Counties, TX, Magnolia Pointe Municipal Utility District No. 1, AGM, 4.5%, 9/01/2025 | | | 490,000 | 492,871 |
| Collin and Hunt Counties, TX, Magnolia Pointe Municipal Utility District No. 1, AGM, 4.5%, 9/01/2027 | | | 125,000 | 127,569 |
| Dallas, TX, Housing Finance Corp., Multi-Family Housing Rev. (Highpoint at Wynnewood), 3.5%, 2/01/2044 (Put Date 2/01/2026) | | | 2,755,000 | 2,705,832 |
| Dallas, TX, Senior Lien Special Tax Rev. (Fair Park Venue Project), 6.25%, 8/15/2053 (Put Date 8/15/2028) | | | 3,540,000 | 3,565,144 |
| El Paso, TX, General Obligation, 4%, 8/15/2029 | | | 1,440,000 | 1,457,043 |
| Elgin, TX, Tax and Rev., AGM, 4%, 7/15/2024 | | | 110,000 | 109,993 |
| Elgin, TX, Tax and Rev., AGM, 4%, 7/15/2024 | | | 155,000 | 154,990 |
| Elgin, TX, Tax and Rev., AGM, 4%, 7/15/2025 | | | 120,000 | 120,228 |
| Elgin, TX, Tax and Rev., AGM, 4%, 7/15/2025 | | | 150,000 | 150,285 |
| EP Tuscany Zaragosa PFC, TX, Residential Development Rev. (Home Essential Function Housing Program), 4%, 12/01/2033 | | | 15,000,000 | 14,271,187 |
Portfolio of Investments – continued
| Issuer | | | Shares/Par | Value ($) |
| Municipal Bonds - continued |
| Texas - continued |
| Fort Bend County, TX, Lamar Consolidated Independent School District, Unlimited Tax Schoolhouse, 5%, 2/15/2037 | | $ | 1,905,000 | $2,139,421 |
| Fort Bend County, TX, Lamar Consolidated Independent School District, Unlimited Tax Schoolhouse, 5%, 2/15/2038 | | | 1,430,000 | 1,589,073 |
| Galveston, TX, Public Facility Corp., Multi-Family Housing Rev. (Oleanders At Broadway), HUD Section 8, 0.47%, 8/01/2025 (Put Date 8/01/2024) | | | 4,935,000 | 4,885,277 |
| Galveston, TX, Wharves and Terminal First Lien Rev., 5.25%, 8/01/2026 | | | 500,000 | 512,686 |
| Galveston, TX, Wharves and Terminal First Lien Rev., 5.25%, 8/01/2027 | | | 500,000 | 519,205 |
| Galveston, TX, Wharves and Terminal First Lien Rev., 5.25%, 8/01/2029 | | | 965,000 | 1,022,788 |
| Galveston, TX, Wharves and Terminal First Lien Rev., 5.25%, 8/01/2030 | | | 1,015,000 | 1,085,626 |
| Galveston, TX, Wharves and Terminal First Lien Rev., 5.25%, 8/01/2031 | | | 1,070,000 | 1,152,102 |
| Galveston, TX, Wharves and Terminal, First Lien Rev., 5.25%, 8/01/2032 | | | 380,000 | 411,002 |
| Garland, TX, Electric Utility System Rev., Taxable (Dallas, Collin and Rockwall Counties), “B”, 1.068%, 3/01/2025 | | | 800,000 | 770,919 |
| Harris County, TX, Cultural Education Facilities Finance Corp., Hospital Rev. (Memorial Hermann Health System), “B”, 5%, 6/01/2050 (Put Date 12/01/2028) | | | 4,000,000 | 4,207,132 |
| Harris County, TX, Morton Road Municipal Utility District, BAM, 3%, 9/01/2025 | | | 265,000 | 260,570 |
| Harris County, TX, Municipal Utility District No. 287, “A”, AGM, 2%, 3/01/2025 | | | 530,000 | 518,086 |
| Harris County, TX, Municipal Utility District No. 287, “A”, AGM, 2%, 3/01/2026 | | | 530,000 | 499,889 |
| Horizon, TX, Regional Municipal Utility District, BAM, 3%, 2/01/2025 | | | 410,000 | 405,369 |
| Houston, TX, Airport System Rev., Special Facilities Rev. (United Airlines, Inc. Terminal E Project), 4.75%, 7/01/2024 | | | 905,000 | 905,885 |
| Houston, TX, Airport System Rev., Special Facilities Rev. (United Airlines, Inc. Terminal E Project), “A”, 5%, 7/01/2027 | | | 355,000 | 359,905 |
| Houston, TX, Airport System Rev., Special Facilities Rev. (United Airlines, Inc. Terminal Improvement Projects), “B-2”, 5%, 7/15/2027 | | | 490,000 | 496,845 |
| Houston, TX, Airport System Rev., Subordinate Lien, “C”, 5%, 7/01/2024 | | | 4,475,000 | 4,478,428 |
| Houston, TX, Airport System Rev., Subordinate Lien, “C”, 5%, 7/01/2025 | | | 1,000,000 | 1,010,532 |
Portfolio of Investments – continued
| Issuer | | | Shares/Par | Value ($) |
| Municipal Bonds - continued |
| Texas - continued |
| Houston, TX, Airport System Rev., Subordinate Lien, “C”, 5%, 7/01/2026 | | $ | 3,000,000 | $3,072,852 |
| Houston, TX, Convention & Entertainment Facilities Department, Hotel Occupancy Rev., 4%, 9/01/2024 | | | 255,000 | 254,770 |
| Houston, TX, Convention & Entertainment Facilities Department, Hotel Occupancy Rev., 4%, 9/01/2025 | | | 230,000 | 230,554 |
| Houston, TX, Housing Finance Corp., Multi-Family Housing Rev. (Sweet Gardens Apartments Project), 4%, 10/01/2025 (Put Date 10/01/2024) | | | 6,175,000 | 6,172,496 |
| Houston, TX, Memorial City Redevelopment Authority Rev., AGM, 5%, 9/01/2024 | | | 575,000 | 576,572 |
| Houston, TX, Memorial City Redevelopment Authority Rev., AGM, 5%, 9/01/2026 | | | 1,100,000 | 1,127,654 |
| Irving, TX, Hospital Authority Rev. (Baylor Scott & White Medical Center-Irving), “A”, 5%, 10/15/2024 | | | 250,000 | 250,993 |
| Irving, TX, Hospital Authority Rev. (Baylor Scott & White Medical Center-Irving), “A”, 5%, 10/15/2025 | | | 500,000 | 505,255 |
| Irving, TX, Hospital Authority Rev. (Baylor Scott & White Medical Center-Irving), “A”, 5%, 10/15/2028 | | | 350,000 | 358,641 |
| Irving, TX, Hotel Occupancy Tax Rev., 5%, 8/15/2025 | | | 130,000 | 130,155 |
| Irving, TX, Hotel Occupancy Tax Rev., 5%, 8/15/2026 | | | 150,000 | 150,811 |
| Irving, TX, Hotel Occupancy Tax Rev., 5%, 8/15/2028 | | | 225,000 | 229,512 |
| Irving, TX, Hotel Occupancy Tax Rev., 5%, 8/15/2029 | | | 275,000 | 282,180 |
| Irving, TX, Hotel Occupancy Tax Rev., 5%, 8/15/2030 | | | 185,000 | 190,017 |
| Lower Colorado River Authority Transmission Contract Refunding Rev. (LCRA Transmission Services Corp. Project), 5%, 5/15/2024 | | | 1,120,000 | 1,120,371 |
| Matagorda County, TX, Navigation District Number One Pollution Control Refunding Rev. (Central Power & Light Co. Project), 4.25%, 5/01/2030 | | | 6,875,000 | 6,839,450 |
| Matagorda County, TX, Pollution Control Rev. (Central Power & Light Co.), “A”, 2.6%, 11/01/2029 | | | 3,000,000 | 2,697,887 |
| Mission, TX, Economic Development Corp., Solid Waste Disposal Rev. (Waste Management, Inc. Project), 4.25%, 6/01/2048 (Put Date 6/03/2024) | | | 6,340,000 | 6,336,859 |
| North Central, TX, Housing Finance Corp., Multi-Family Housing Rev. (Bluebonnet Ridge Apartments), 0.375%, 8/01/2040 (Put Date 8/01/2024) | | | 3,150,000 | 3,117,500 |
| North Texas Municipal Water District, Upper East Fork Wastewater Interceptor System Rev., 5%, 6/01/2024 | | | 1,915,000 | 1,916,348 |
| Port Arthur, TX, Combination Tax & Certificates of Obligation Rev., BAM, 5%, 2/15/2025 | | | 500,000 | 504,366 |
| Port Beaumont, TX, Navigation District, Dock & Wharf Facility Rev. (Jefferson Gulf Coast Energy Project), “A”, 1.875%, 1/01/2026 (n) | | | 850,000 | 808,001 |
Portfolio of Investments – continued
| Issuer | | | Shares/Par | Value ($) |
| Municipal Bonds - continued |
| Texas - continued |
| Public Facility Corp., Texas Multi-Family Housing Rev. (Lakeside Manor Apartments), 3.25%, 3/01/2040 (Put Date 9/01/2025) | | $ | 5,000,000 | $4,913,229 |
| San Antonio, TX, Airport System Rev., “A”, 5%, 7/01/2024 | | | 1,595,000 | 1,596,222 |
| San Antonio, TX, Airport System Rev., “A”, 5%, 7/01/2025 | | | 1,015,000 | 1,025,690 |
| San Antonio, TX, Airport System Rev., “A”, 5%, 7/01/2026 | | | 1,690,000 | 1,731,040 |
| San Antonio, TX, Airport System Rev., “A”, 5%, 7/01/2027 | | | 1,870,000 | 1,938,744 |
| San Antonio, TX, Airport System Rev., “A”, 5%, 7/01/2028 | | | 565,000 | 591,772 |
| San Antonio, TX, Housing Trust Public Facility Corp., Multi-Family Housing Rev. (Country Club Village), 4%, 8/01/2026 (Put Date 8/01/2025) | | | 4,375,000 | 4,364,991 |
| San Antonio, TX, Passenger Facility Charge and Subordinate Lien Airport System Rev., “A”, 5%, 7/01/2024 | | | 860,000 | 860,659 |
| San Antonio, TX, Passenger Facility Charge and Subordinate Lien Airport System Rev., “A”, 5%, 7/01/2025 | | | 1,600,000 | 1,616,852 |
| San Antonio, TX, Passenger Facility Charge and Subordinate Lien Airport System Rev., “A”, 5%, 7/01/2026 | | | 1,250,000 | 1,278,527 |
| San Antonio, TX, Passenger Facility Charge and Subordinate Lien Airport System Rev., “A”, 5%, 7/01/2027 | | | 2,750,000 | 2,848,601 |
| Tarrant County, TX, Cultural Education Facilities Finance Corp. (Christus Health), “A”, 5%, 7/01/2053 (Put Date 7/01/2032) | | | 3,895,000 | 4,280,238 |
| Tarrant County, TX, Cultural Education Facilities Finance Corp., Hospital Rev. (Baylor Scott & White Health Project), “F”, 5%, 11/15/2052 (Put Date 11/15/2030) | | | 4,750,000 | 5,147,501 |
| Tarrant County, TX, Cultural Education Facilities Finance Corp., Retirement Facility Rev. (Barton Creek Senior Living Center, Inc., Querencia Project), 5%, 11/15/2025 | | | 1,675,000 | 1,669,104 |
| Temple, TX, Reinvestment Zone 1 Rev., “A”, BAM, 5%, 8/01/2024 | | | 135,000 | 135,369 |
| Temple, TX, Reinvestment Zone 1 Rev., “A”, BAM, 5%, 8/01/2025 | | | 140,000 | 142,594 |
| Texas Affordable Housing Corp., Multi-Family Rev. (Eden Court Apartments Project), Texas PSF, 5%, 4/01/2043 (Put Date 4/01/2026) | | | 2,100,000 | 2,132,056 |
| Texas Department of Housing & Community Affairs, Multi-Family Housing Rev. (Aspen Park), 5%, 3/01/2041 (Put Date 3/01/2026) | | | 4,000,000 | 4,024,463 |
| Texas Municipal Gas Acquisition and Supply Corp II, Gas Supply Rev., “C”, 4.38% (SOFR - 3mo. + 0.86%), 9/15/2027 | | | 4,000,000 | 3,990,124 |
| Texas Municipal Gas Acquisition and Supply Corp IV, Gas Supply Rev., “B”, 5.5%, 1/01/2054 (Put Date 1/01/2034) | | | 11,345,000 | 12,508,809 |
| Texas Municipal Gas Acquisition and Supply Corp. III, Gas Supply Rev., 5%, 12/15/2031 | | | 9,885,000 | 10,350,489 |
| Texas Public Finance Authority Rev. (Texas Southern University), “A”, BAM, 5%, 5/01/2026 | | | 395,000 | 399,967 |
| Texas Public Finance Authority, Financing System Refunding Rev. (Texas Southern University), BAM, 5%, 5/01/2024 | | | 370,000 | 370,000 |
Portfolio of Investments – continued
| Issuer | | | Shares/Par | Value ($) |
| Municipal Bonds - continued |
| Texas - continued |
| Texas Public Finance Authority, Financing System Refunding Rev. (Texas Southern University), BAM, 5%, 5/01/2025 | | $ | 500,000 | $501,858 |
| Texas Transportation Commission, State Highway 249 System Rev., Capital Appreciation, “A”, 0%, 8/01/2028 | | | 135,000 | 113,146 |
| Texas Transportation Commission, State Highway 249 System Rev., Capital Appreciation, “A”, 0%, 8/01/2029 | | | 500,000 | 403,042 |
| Travis County, TX, Housing Finance Corp., Multi-Family Housing Rev. (Airport Gateway Apartments), 4.125%, 6/01/2045 (Put Date 6/01/2027) | | | 4,665,000 | 4,636,461 |
| Viridian, TX, Municipal Management District, Road Improvement Rev., AGM, 3%, 12/01/2024 | | | 400,000 | 395,815 |
| Viridian, TX, Municipal Management District, Road Improvement Rev., AGM, 3%, 12/01/2025 | | | 590,000 | 577,465 |
| | | | | $204,766,578 |
| U.S. Virgin Islands - 0.2% |
| Matching Fund Special Purpose Securitization Corp., “A”, 5%, 10/01/2025 | | $ | 2,670,000 | $2,712,688 |
| Virgin Islands Public Finance Authority Rev. (Federal Highway Grant Anticipation Loan Note), 5%, 9/01/2024 (n) | | | 1,500,000 | 1,501,090 |
| | | | | $4,213,778 |
| Utah - 0.6% |
| Salt Lake City, UT, Airport Rev. (Salt Lake City International Airport), “A”, 5%, 7/01/2025 | | $ | 1,990,000 | $2,010,960 |
| Salt Lake City, UT, Airport Rev. (Salt Lake City International Airport), “A”, 5%, 7/01/2026 | | | 1,200,000 | 1,227,386 |
| Salt Lake City, UT, Airport Rev. (Salt Lake City International Airport), “A”, 5%, 7/01/2028 | | | 5,000,000 | 5,236,924 |
| Utah Housing Corp., Multi-Family Housing Rev. (Moda Shoreline Apartments), 4%, 9/01/2025 (Put Date 9/01/2024) | | | 5,000,000 | 4,981,527 |
| Utah Housing Corp., Single Family Mortgage Rev, “A”, GNMA, 6.5%, 1/01/2054 | | | 1,890,000 | 2,071,839 |
| | | | | $15,528,636 |
| Vermont - 0.9% |
| Vermont Student Assistance Corp., Education Loan Rev., “A”, 5%, 6/15/2024 | | $ | 1,010,000 | $1,010,414 |
| Vermont Student Assistance Corp., Education Loan Rev., “A”, 5%, 6/15/2024 | | | 775,000 | 775,318 |
| Vermont Student Assistance Corp., Education Loan Rev., “A”, 5%, 6/15/2025 | | | 360,000 | 362,275 |
| Vermont Student Assistance Corp., Education Loan Rev., “A”, 5%, 6/15/2026 | | | 1,470,000 | 1,494,904 |
Portfolio of Investments – continued
| Issuer | | | Shares/Par | Value ($) |
| Municipal Bonds - continued |
| Vermont - continued |
| Vermont Student Assistance Corp., Education Loan Rev., “A”, 5%, 6/15/2026 | | $ | 775,000 | $788,130 |
| Vermont Student Assistance Corp., Education Loan Rev., “A”, 5%, 6/15/2026 | | | 140,000 | 142,372 |
| Vermont Student Assistance Corp., Education Loan Rev., “A”, 5%, 6/15/2027 | | | 775,000 | 786,089 |
| Vermont Student Assistance Corp., Education Loan Rev., “A”, 5%, 6/15/2027 | | | 1,000,000 | 1,021,653 |
| Vermont Student Assistance Corp., Education Loan Rev., “A”, 5%, 6/15/2027 | | | 1,000,000 | 1,021,653 |
| Vermont Student Assistance Corp., Education Loan Rev., “A”, 5%, 6/15/2027 | | | 425,000 | 434,202 |
| Vermont Student Assistance Corp., Education Loan Rev., “A”, 5%, 6/15/2028 | | | 1,600,000 | 1,645,976 |
| Vermont Student Assistance Corp., Education Loan Rev., “A”, 5%, 6/15/2028 | | | 1,735,000 | 1,784,855 |
| Vermont Student Assistance Corp., Education Loan Rev., “A”, 5%, 6/15/2028 | | | 525,000 | 540,086 |
| Vermont Student Assistance Corp., Education Loan Rev., “A”, 5%, 6/15/2029 | | | 1,640,000 | 1,683,284 |
| Vermont Student Assistance Corp., Education Loan Rev., “A”, 5%, 6/15/2029 | | | 1,450,000 | 1,488,269 |
| Vermont Student Assistance Corp., Education Loan Rev., “A”, 5%, 6/15/2030 | | | 1,000,000 | 1,030,793 |
| Vermont Student Assistance Corp., Education Loan Rev., “A”, 5%, 6/15/2024 | | | 850,000 | 850,245 |
| Vermont Student Assistance Corp., Education Loan Rev., “A”, 5%, 6/15/2025 | | | 875,000 | 880,530 |
| Vermont Student Assistance Corp., Education Loan Rev., “A”, 5%, 6/15/2026 | | | 2,100,000 | 2,135,578 |
| Vermont Student Assistance Corp., Education Loan Rev., “A”, 5%, 6/15/2029 | | | 1,300,000 | 1,342,730 |
| Vermont Student Assistance Corp., Education Loan Rev., “A”, 5%, 6/15/2030 | | | 1,500,000 | 1,560,053 |
| Vermont Student Assistance Corp., Education Loan Rev., “A”, 5%, 6/15/2031 | | | 1,600,000 | 1,667,363 |
| | | | | $24,446,772 |
Portfolio of Investments – continued
| Issuer | | | Shares/Par | Value ($) |
| Municipal Bonds - continued |
| Virginia - 1.5% |
| Arlington County, VA, Industrial Development Authority, Hospital Rev. (Virginia Hospital Center), 5%, 7/01/2024 | | $ | 775,000 | $775,838 |
| Arlington County, VA, Industrial Development Authority, Hospital Rev. (Virginia Hospital Center), 5%, 7/01/2025 | | | 475,000 | 481,029 |
| Charles City County, VA, Industrial Development Authority, Solid Waste Disposal Rev. (Waste Management, Inc. Project), 1.45%, 4/01/2027 | | | 235,000 | 215,084 |
| Chesapeake, VA, Economic Development Authority Pollution Control Rev. (Virginia Electric and Power Company Project), “A”, 3.65%, 2/01/2032 (Put Date 10/01/2027) | | | 3,215,000 | 3,181,206 |
| Louisa, VA, Industrial Development Authority, Pollution Control Refunding Rev. (Virginia Electric and Power Co. Project), “A”, 3.65%, 11/01/2035 (Put Date 10/01/2027) | | | 915,000 | 905,382 |
| Louisa, VA, Industrial Development Authority, Pollution Control Refunding Rev. (Virginia Electric and Power Co. Project), “B”, 0.75%, 11/01/2035 (Put Date 9/02/2025) | | | 2,340,000 | 2,187,929 |
| Virginia Beach, VA, Development Authority, Residential Care Facility Refunding Rev. (Westminster - Canterbury on Chesapeake Bay), 5%, 9/01/2029 | | | 95,000 | 98,165 |
| Virginia Beach, VA, Development Authority, Residential Care Facility Rev. (Westminster - Canterbury on Chesapeake Bay), “B-3”, 5.375%, 9/01/2029 | | | 10,250,000 | 10,606,248 |
| Virginia College Building Authority, Educational Facilities Rev. (Regent University Project), 5%, 6/01/2024 | | | 300,000 | 299,904 |
| Virginia College Building Authority, Educational Facilities Rev. (Regent University Project), 5%, 6/01/2025 | | | 350,000 | 350,027 |
| Virginia College Building Authority, Educational Facilities Rev. (Regent University Project), 5%, 6/01/2026 | | | 400,000 | 404,552 |
| Virginia Housing Development Authority, Rental Housing, “A”, 3.65%, 3/01/2029 | | | 7,420,000 | 7,240,631 |
| Wise County, VA, Industrial Development Authority, Solid Waste & Sewage Disposal Rev. (Virginia Electric and Power Co. Project), “A”, 0.75%, 10/01/2040 (Put Date 9/02/2025) | | | 2,700,000 | 2,524,534 |
| Wise County, VA, Industrial Development Authority, Solid Waste & Sewage Disposal Rev. (Virginia Electric and Power Co. Project), “A”, 1.2%, 11/01/2040 (Put Date 5/31/2024) | | | 4,555,000 | 4,540,257 |
| York, VA, Economic Development Authority Pollution Control Rev. (Virginia Electric and Power Company Project), “A”, 3.65%, 5/01/2033 (Put Date 10/01/2027) | | | 6,390,000 | 6,322,833 |
| | | | | $40,133,619 |
Portfolio of Investments – continued
| Issuer | | | Shares/Par | Value ($) |
| Municipal Bonds - continued |
| Washington - 2.2% |
| Grays Harbor County, WA, Public Hospital District No. 2, Limited Tax General Obligation, 4%, 12/15/2028 | | $ | 4,015,000 | $3,927,605 |
| King County, WA, Affordable Housing Rev., “A-1”, HUD Section 8, 5%, 1/01/2028 | | | 5,850,000 | 5,964,034 |
| King County, WA, Affordable Housing Rev., “A-2”, HUD Section 8, 5%, 1/01/2028 | | | 2,860,000 | 2,949,905 |
| Port of Seattle, WA, Intermediate Lien Refunding Rev. (Private Activity), “B”, 5%, 8/01/2024 | | | 4,000,000 | 4,005,669 |
| Port of Seattle, WA, Intermediate Lien Refunding Rev. (Private Activity), “B”, 5%, 8/01/2025 | | | 3,800,000 | 3,843,469 |
| Port of Seattle, WA, Intermediate Lien Refunding Rev. (Private Activity), “B”, 5%, 8/01/2026 | | | 2,230,000 | 2,284,408 |
| Seattle, WA, Housing Authority Rev. (Lam Bow Apartments Project), 1.25%, 6/01/2024 | | | 1,500,000 | 1,494,356 |
| Seattle, WA, Housing Authority Rev. (Northgate Plaza Project), 1%, 6/01/2026 | | | 3,070,000 | 2,857,080 |
| Seattle, WA, Port Intermediate Lien Rev., “C”, 5%, 8/01/2026 | | | 2,315,000 | 2,371,481 |
| Seattle, WA, Port Rev., 5%, 4/01/2025 | | | 1,750,000 | 1,763,606 |
| Seattle, WA, Port Rev., 5%, 4/01/2026 | | | 3,000,000 | 3,059,668 |
| Seattle, WA, Port Rev., 5%, 4/01/2030 | | | 9,685,000 | 10,199,817 |
| Seattle, WA, Port Rev., 5%, 4/01/2031 | | | 3,500,000 | 3,687,204 |
| Washington Higher Education Facilities Authority Refunding Rev., (Gonzaga University Project), 4%, 4/01/2041 | | | 5,000,000 | 4,742,408 |
| Washington State Housing Finance Commission, Non-Profit Housing Rev. (Emerald Heights Project), “B-2”, 4%, 7/01/2026 | | | 4,500,000 | 4,500,235 |
| | | | | $57,650,945 |
| West Virginia - 0.6% |
| West Virginia Economic Development Authority, Lease Refunding Rev. (State Office Building), “B”, 3.625%, 10/01/2025 | | $ | 415,000 | $414,243 |
| West Virginia Economic Development Authority, Lease Rev. (Department of Environmental Protection Office Building), “B”, 3.375%, 11/01/2025 | | | 830,000 | 824,150 |
| West Virginia Economic Development Authority, Solid Waste Disposal Facilities Refunding Rev. (Wheeling Power Co. - Mitchell Project), “A”, 3%, 6/01/2037 (Put Date 6/18/2027) | | | 7,535,000 | 7,300,668 |
| West Virginia Economic Development Authority, Solid Waste Disposal Facilities Rev. (Appalachian Power Company - Amos Project), “A”, 0.625%, 12/01/2038 (Put Date 12/15/2025) | | | 1,915,000 | 1,774,584 |
| West Virginia Economic Development Authority, Solid Waste Disposal Facilities Rev. (Appalachian Power Company - Amos Project), “A”, 1%, 1/01/2041 (Put Date 9/01/2025) | | | 4,520,000 | 4,266,246 |
Portfolio of Investments – continued
| Issuer | | | Shares/Par | Value ($) |
| Municipal Bonds - continued |
| West Virginia - continued |
| West Virginia Economic Development Authority, Solid Waste Disposal Facilities Rev. (Appalachian Power Company - Amos Project), “A”, 3.75%, 12/01/2042 (Put Date 6/01/2025) | | $ | 985,000 | $982,227 |
| | | | | $15,562,118 |
| Wisconsin - 1.3% |
| Jefferson and Dodge Counties, WI, Watertown General Obligation Anticipation Notes, 4%, 10/01/2025 | | $ | 1,150,000 | $1,148,625 |
| Wisconsin Center District Junior Dedicated Tax Rev., Capital Appreciation, “D”, AGM, 0%, 12/15/2028 | | | 265,000 | 222,536 |
| Wisconsin Center District Junior Dedicated Tax Rev., Capital Appreciation, “D”, AGM, 0%, 12/15/2029 | | | 365,000 | 295,169 |
| Wisconsin Center District Junior Dedicated Tax Rev., Capital Appreciation, “D”, AGM, 0%, 12/15/2030 | | | 550,000 | 427,405 |
| Wisconsin Center District Senior Dedicated Tax Rev., Capital Appreciation, “C”, AGM, 0%, 12/15/2028 | | | 1,055,000 | 885,946 |
| Wisconsin Center District Senior Dedicated Tax Rev., Capital Appreciation, “C”, AGM, 0%, 12/15/2029 | | | 1,050,000 | 849,115 |
| Wisconsin Center District Senior Dedicated Tax Rev., Capital Appreciation, “C”, AGM, 0%, 12/15/2030 | | | 1,095,000 | 850,925 |
| Wisconsin Health & Educational Facilities Authority Refunding Rev. (Froedtert Health, Inc. Obligated Group), “A”, 4%, 4/01/2040 | | | 5,000,000 | 4,879,258 |
| Wisconsin Health & Educational Facilities Authority Rev. (Marquette University), 5%, 10/01/2024 | | | 440,000 | 441,628 |
| Wisconsin Health & Educational Facilities Authority Rev. (Marshfield Clinic Health System, Inc.), “B-2”, 5%, 2/15/2051 (Put Date 2/15/2027) | | | 4,000,000 | 4,062,333 |
| Wisconsin Health & Educational Facilities Authority Rev. (Milwaukee Science Education Consortium, Inc.), “A”, 4.5%, 3/15/2033 | | | 555,000 | 550,246 |
| Wisconsin Health & Educational Facilities Authority Rev. (Oakwood Lutheran Senior Ministries), 4%, 1/01/2025 | | | 210,000 | 206,164 |
| Wisconsin Health & Educational Facilities Authority Rev. (Oakwood Lutheran Senior Ministries), 4%, 1/01/2026 | | | 345,000 | 330,744 |
| Wisconsin Health & Educational Facilities Authority Rev. (Oakwood Lutheran Senior Ministries), 4%, 1/01/2027 | | | 360,000 | 337,447 |
| Wisconsin Health & Educational Facilities Authority Rev. (Oakwood Lutheran Senior Ministries), 4%, 1/01/2028 | | | 375,000 | 343,809 |
| Wisconsin Health & Educational Facilities Authority Rev. (Oakwood Lutheran Senior Ministries), 4%, 1/01/2029 | | | 390,000 | 349,829 |
| Wisconsin Health & Educational Facilities Authority Rev. (ProHealth Care, Inc. Obligated Group), 3%, 8/15/2026 | | | 4,340,000 | 4,238,053 |
Portfolio of Investments – continued
| Issuer | | | Shares/Par | Value ($) |
| Municipal Bonds - continued |
| Wisconsin - continued |
| Wisconsin Housing & Economic Development Authority Housing Rev., “E”, HUD Section 8, 3.875%, 11/01/2054 (Put Date 5/01/2027) | | $ | 2,040,000 | $2,008,230 |
| Wisconsin Public Finance Authority Airport Facilities Rev. (Transportation Infrastructure Properties LLC), “B”, 5.25%, 7/01/2028 | | | 1,000,000 | 1,000,447 |
| Wisconsin Public Finance Authority Education Rev. (Triad Educational Services, Inc.), 4.25%, 6/15/2027 | | | 500,000 | 490,988 |
| Wisconsin Public Finance Authority Entrance Fee Principal Redemption Accredited Rev. (Searstone CCRC Project), “B2”, 2.25%, 6/01/2027 (n) | | | 1,230,000 | 1,163,049 |
| Wisconsin Public Finance Authority Hospital Rev. (Renown Regional Medical Center Project), “A”, 5%, 6/01/2024 | | | 400,000 | 400,082 |
| Wisconsin Public Finance Authority Hospital Rev. (Renown Regional Medical Center Project), “A”, 5%, 6/01/2025 | | | 425,000 | 428,428 |
| Wisconsin Public Finance Authority Hospital Rev. (Renown Regional Medical Center Project), “A”, 5%, 6/01/2026 | | | 325,000 | 329,925 |
| Wisconsin Public Finance Authority Hospital Rev. (Renown Regional Medical Center Project), “A”, 5%, 6/01/2027 | | | 450,000 | 461,417 |
| Wisconsin Public Finance Authority Hospital Rev. (Renown Regional Medical Center Project), “A”, 5%, 6/01/2028 | | | 725,000 | 750,844 |
| Wisconsin Public Finance Authority Hospital Rev. (Renown Regional Medical Center Project), “A”, 5%, 6/01/2029 | | | 900,000 | 941,072 |
| Wisconsin Public Finance Authority Limited Obligation Grant Rev. (American Dream at Meadowlands Project), “A”, 6.25%, 8/01/2027 (a)(d)(n) | | | 3,735,000 | 2,913,300 |
| Wisconsin Public Finance Authority Retirement Facilities First Mortgage Rev. (United Methodist Retirement Homes), “A”, 4%, 10/01/2027 | | | 200,000 | 198,797 |
| Wisconsin Public Finance Authority Retirement Facilities First Mortgage Rev. (United Methodist Retirement Homes), “A”, 4%, 10/01/2028 | | | 255,000 | 254,074 |
| Wisconsin Public Finance Authority Retirement Facilities First Mortgage Rev. (United Methodist Retirement Homes), “A”, 4%, 10/01/2029 | | | 325,000 | 324,364 |
| Wisconsin Public Finance Authority Rev. (Roseman University of Health Sciences Project), 5.875%, 4/01/2045 | | | 2,315,000 | 2,336,459 |
| | | | | $34,420,708 |
Portfolio of Investments – continued
| Issuer | | | Shares/Par | Value ($) |
| Municipal Bonds - continued |
| Wyoming - 0.1% |
| Laramie County, WY, Hospital Refunding Rev. (Cheyenne Regional Medical Center Project), 4%, 5/01/2024 | | $ | 250,000 | $250,000 |
| Wyoming Community Development Authority, Housing Rev., “3”, 5%, 6/01/2024 | | | 680,000 | 680,339 |
| Wyoming Community Development Authority, Housing Rev., “3”, 5%, 12/01/2024 | | | 690,000 | 693,527 |
| Wyoming Community Development Authority, Housing Rev., “3”, 5%, 6/01/2025 | | | 695,000 | 702,349 |
| Wyoming Community Development Authority, Housing Rev., “3”, 5%, 12/01/2025 | | | 380,000 | 386,142 |
| | | | | $2,712,357 |
| Total Municipal Bonds (Identified Cost, $2,580,247,301) | | $2,539,152,427 |
| Bonds – 0.5% |
| Transportation - Services – 0.5% | |
| Toll Road Investors Partnership II LP, Capital Appreciation, NPFG, 0%, 2/15/2025 (n) | | $ | 4,589,000 | $4,345,352 |
| Toll Road Investors Partnership II LP, Capital Appreciation, NPFG, 0%, 2/15/2026 (n) | | | 7,427,000 | 6,433,762 |
| Toll Road Investors Partnership II LP, Capital Appreciation, NPFG, 0%, 2/15/2028 (n) | | | 1,573,000 | 1,156,918 |
| Total Bonds (Identified Cost, $12,532,942) | | $11,936,032 |
| Other Municipal Bonds – 0.2% |
| Multi-Family Housing Revenue – 0.2% | |
| Freddie Mac, 4.618%, 8/25/2041 (Identified Cost, $5,793,788) | | $ | 5,746,911 | $5,588,400 |
| Investment Companies (h) - 0.7% |
| Money Market Funds – 0.7% | |
| MFS Institutional Money Market Portfolio, 5.38% (v) (Identified Cost, $18,196,512) | | | 18,196,513 | $18,196,513 |
|
|
| Other Assets, Less Liabilities - 1.0% | | 26,922,304 |
| Net Assets - 100.0% | | $2,601,795,676 |
| (a) | Non-income producing security. |
| (d) | In default. |
| (h) | An affiliated issuer, which may be considered one in which the fund owns 5% or more of the outstanding voting securities, or a company which is under common control. At period end, the aggregate values of the fund's investments in affiliated issuers and in unaffiliated issuers were $18,196,513 and $2,556,676,859, respectively. |
Portfolio of Investments – continued
| (n) | Securities exempt from registration under Rule 144A of the Securities Act of 1933. These securities may be sold in the ordinary course of business in transactions exempt from registration, normally to qualified institutional buyers. At period end, the aggregate value of these securities was $42,266,007, representing 1.6% of net assets. |
| (v) | Affiliated issuer that is available only to investment companies managed by MFS. The rate quoted for the MFS Institutional Money Market Portfolio is the annualized seven-day yield of the fund at period end. |
| (w) | When-issued security. |
| The following abbreviations are used in this report and are defined: |
| AAC | Ambac Assurance Corp. |
| AGM | Assured Guaranty Municipal |
| BAM | Build America Mutual |
| COP | Certificate of Participation |
| ETM | Escrowed to Maturity |
| FHA | Federal Housing Administration |
| FNMA | Federal National Mortgage Assn. |
| GNMA | Government National Mortgage Assn. |
| NPFG | National Public Finance Guarantee Corp. |
| PSF | Permanent School Fund |
| SOFR | Secured Overnight Financing Rate |
See Notes to Financial Statements
Financial Statements
Statement of Assets and Liabilities
At 4/30/24
This statement represents your fund’s balance sheet, which details the assets and liabilities comprising the total value of the fund.
| Assets | |
| Investments in unaffiliated issuers, at value (identified cost, $2,598,574,031) | $2,556,676,859 |
| Investments in affiliated issuers, at value (identified cost, $18,196,512) | 18,196,513 |
| Cash | 17,513 |
| Receivables for | |
| Investments sold | 8,854,832 |
| Fund shares sold | 4,547,472 |
| Interest and dividends | 32,658,524 |
| Other assets | 5,607 |
| Total assets | $2,620,957,320 |
| Liabilities | |
| Payables for | |
| Distributions | $719,490 |
| When-issued investments purchased | 12,835,139 |
| Fund shares reacquired | 4,831,182 |
| Payable to affiliates | |
| Investment adviser | 17,540 |
| Administrative services fee | 2,081 |
| Shareholder servicing costs | 528,072 |
| Distribution and service fees | 10,171 |
| Payable for independent Trustees' compensation | 12 |
| Accrued expenses and other liabilities | 217,957 |
| Total liabilities | $19,161,644 |
| Net assets | $2,601,795,676 |
| Net assets consist of | |
| Paid-in capital | $2,750,786,594 |
| Total distributable earnings (loss) | (148,990,918) |
| Net assets | $2,601,795,676 |
| Shares of beneficial interest outstanding | 330,817,252 |
Statement of Assets and Liabilities – continued
| | Net assets | Shares
outstanding | Net asset value
per share (a) |
| Class A | $1,114,938,923 | 141,662,976 | $7.87 |
| Class B | 71,316 | 9,071 | 7.86 |
| Class C | 19,081,615 | 2,423,612 | 7.87 |
| Class I | 933,761,910 | 118,777,730 | 7.86 |
| Class R6 | 533,941,912 | 67,943,863 | 7.86 |
| (a) | Maximum offering price per share was equal to the net asset value per share for all share classes, except for Class A, for which the maximum offering price per share was $8.07 [100 / 97.50 x $7.87]. On sales of $50,000 or more, the maximum offering price of Class A shares is reduced. A contingent deferred sales charge may be imposed on redemptions of Class A, Class B, and Class C shares. Redemption price per share was equal to the net asset value per share for Classes I and R6. |
See Notes to Financial Statements
Financial Statements
Statement of Operations
Year ended 4/30/24
This statement describes how much your fund earned in investment income and accrued in expenses. It also describes any gains and/or losses generated by fund operations.
| Net investment income (loss) | |
| Income | |
| Interest | $83,988,128 |
| Dividends from affiliated issuers | 2,310,347 |
| Other | 865 |
| Total investment income | $86,299,340 |
| Expenses | |
| Management fee | $9,374,683 |
| Distribution and service fees | 3,101,038 |
| Shareholder servicing costs | 1,603,420 |
| Administrative services fee | 396,146 |
| Independent Trustees' compensation | 47,050 |
| Custodian fee | 326,983 |
| Shareholder communications | 91,710 |
| Audit and tax fees | 67,785 |
| Legal fees | 14,150 |
| Miscellaneous | 269,987 |
| Total expenses | $15,292,952 |
| Fees paid indirectly | (13,983) |
| Reduction of expenses by investment adviser and distributor | (1,864,815) |
| Net expenses | $13,414,154 |
| Net investment income (loss) | $72,885,186 |
| Realized and unrealized gain (loss) |
| Realized gain (loss) (identified cost basis) | |
| Unaffiliated issuers | $(17,540,965) |
| Affiliated issuers | (27,679) |
| Net realized gain (loss) | $(17,568,644) |
| Change in unrealized appreciation or depreciation | |
| Unaffiliated issuers | $23,280,126 |
| Affiliated issuers | 1 |
| Net unrealized gain (loss) | $23,280,127 |
| Net realized and unrealized gain (loss) | $5,711,483 |
| Change in net assets from operations | $78,596,669 |
See Notes to Financial Statements
Financial Statements
Statements of Changes in Net Assets
These statements describe the increases and/or decreases in net assets resulting from operations, any distributions, and any shareholder transactions.
| | Year ended |
| | 4/30/24 | 4/30/23 |
| Change in net assets | | |
| From operations | | |
| Net investment income (loss) | $72,885,186 | $59,217,530 |
| Net realized gain (loss) | (17,568,644) | (58,186,118) |
| Net unrealized gain (loss) | 23,280,127 | 51,108,869 |
| Change in net assets from operations | $78,596,669 | $52,140,281 |
| Total distributions to shareholders | $(71,734,787) | $(58,872,879) |
| Change in net assets from fund share transactions | $(299,611,593) | $(544,087,781) |
| Total change in net assets | $(292,749,711) | $(550,820,379) |
| Net assets | | |
| At beginning of period | 2,894,545,387 | 3,445,365,766 |
| At end of period | $2,601,795,676 | $2,894,545,387 |
See Notes to Financial Statements
Financial Statements
Financial Highlights
The financial highlights table is intended to help you understand the fund's financial performance for the past 5 years. Certain information reflects financial results for a single fund share. The total returns in the table represent the rate that an investor would have earned (or lost) on an investment in the fund share class (assuming reinvestment of all distributions) held for the entire period.
| Class A | Year ended |
| | 4/30/24 | 4/30/23 | 4/30/22 | 4/30/21 | 4/30/20 |
| Net asset value, beginning of period | $7.85 | $7.86 | $8.40 | $8.06 | $8.16 |
| Income (loss) from investment operations |
| Net investment income (loss) (d) | $0.20 | $0.14 | $0.10 | $0.14 | $0.16 |
| Net realized and unrealized gain (loss) | 0.02 | (0.01) | (0.54) | 0.34 | (0.09) |
| Total from investment operations | $0.22 | $0.13 | $(0.44) | $0.48 | $0.07 |
| Less distributions declared to shareholders |
| From net investment income | $(0.20) | $(0.14) | $(0.10) | $(0.14) | $(0.17) |
| Net asset value, end of period (x) | $7.87 | $7.85 | $7.86 | $8.40 | $8.06 |
| Total return (%) (r)(s)(t)(x) | 2.86 | 1.68 | (5.24) | 5.92 | 0.78 |
Ratios (%) (to average net assets)
and Supplemental data: |
| Expenses before expense reductions (f) | 0.72 | 0.72 | 0.72 | 0.76 | 0.78 |
| Expenses after expense reductions (f) | 0.59 | 0.60 | 0.61 | 0.65 | 0.66 |
| Net investment income (loss) | 2.61 | 1.79 | 1.25 | 1.65 | 1.97 |
| Portfolio turnover | 30 | 35 | 23 | 18 | 24 |
| Net assets at end of period (000 omitted) | $1,114,939 | $1,210,132 | $1,351,962 | $1,382,963 | $1,060,370 |
See Notes to Financial Statements
Financial Highlights – continued
| Class B | Year ended |
| | 4/30/24 | 4/30/23 | 4/30/22 | 4/30/21 | 4/30/20 |
| Net asset value, beginning of period | $7.84 | $7.85 | $8.39 | $8.05 | $8.15 |
| Income (loss) from investment operations |
| Net investment income (loss) (d) | $0.14 | $0.08 | $0.04 | $0.08 | $0.10 |
| Net realized and unrealized gain (loss) | 0.02 | (0.01) | (0.54) | 0.33 | (0.10) |
| Total from investment operations | $0.16 | $0.07 | $(0.50) | $0.41 | $0.00 |
| Less distributions declared to shareholders |
| From net investment income | $(0.14) | $(0.08) | $(0.04) | $(0.07) | $(0.10) |
| Net asset value, end of period (x) | $7.86 | $7.84 | $7.85 | $8.39 | $8.05 |
| Total return (%) (r)(s)(t)(x) | 2.11 | 0.92 | (5.96) | 5.15 | 0.03 |
Ratios (%) (to average net assets)
and Supplemental data: |
| Expenses before expense reductions (f) | 1.47 | 1.47 | 1.47 | 1.52 | 1.53 |
| Expenses after expense reductions (f) | 1.34 | 1.35 | 1.36 | 1.40 | 1.42 |
| Net investment income (loss) | 1.83 | 1.03 | 0.50 | 0.96 | 1.25 |
| Portfolio turnover | 30 | 35 | 23 | 18 | 24 |
| Net assets at end of period (000 omitted) | $71 | $145 | $167 | $188 | $470 |
| Class C | Year ended |
| | 4/30/24 | 4/30/23 | 4/30/22 | 4/30/21 | 4/30/20 |
| Net asset value, beginning of period | $7.85 | $7.86 | $8.41 | $8.06 | $8.16 |
| Income (loss) from investment operations |
| Net investment income (loss) (d) | $0.14 | $0.07 | $0.03 | $0.07 | $0.09 |
| Net realized and unrealized gain (loss) | 0.01 | (0.01) | (0.55) | 0.35 | (0.09) |
| Total from investment operations | $0.15 | $0.06 | $(0.52) | $0.42 | $0.00 |
| Less distributions declared to shareholders |
| From net investment income | $(0.13) | $(0.07) | $(0.03) | $(0.07) | $(0.10) |
| Net asset value, end of period (x) | $7.87 | $7.85 | $7.86 | $8.41 | $8.06 |
| Total return (%) (r)(s)(t)(x) | 1.99 | 0.82 | (6.16) | 5.16 | (0.07) |
Ratios (%) (to average net assets)
and Supplemental data: |
| Expenses before expense reductions (f) | 1.47 | 1.47 | 1.47 | 1.51 | 1.53 |
| Expenses after expense reductions (f) | 1.44 | 1.45 | 1.46 | 1.50 | 1.52 |
| Net investment income (loss) | 1.74 | 0.93 | 0.40 | 0.84 | 1.14 |
| Portfolio turnover | 30 | 35 | 23 | 18 | 24 |
| Net assets at end of period (000 omitted) | $19,082 | $28,050 | $39,268 | $51,865 | $78,365 |
See Notes to Financial Statements
Financial Highlights – continued
| Class I | Year ended |
| | 4/30/24 | 4/30/23 | 4/30/22 | 4/30/21 | 4/30/20 |
| Net asset value, beginning of period | $7.84 | $7.85 | $8.40 | $8.05 | $8.15 |
| Income (loss) from investment operations |
| Net investment income (loss) (d) | $0.22 | $0.15 | $0.12 | $0.15 | $0.18 |
| Net realized and unrealized gain (loss) | 0.01 | (0.01) | (0.55) | 0.35 | (0.10) |
| Total from investment operations | $0.23 | $0.14 | $(0.43) | $0.50 | $0.08 |
| Less distributions declared to shareholders |
| From net investment income | $(0.21) | $(0.15) | $(0.12) | $(0.15) | $(0.18) |
| Net asset value, end of period (x) | $7.86 | $7.84 | $7.85 | $8.40 | $8.05 |
| Total return (%) (r)(s)(t)(x) | 3.01 | 1.82 | (5.22) | 6.21 | 0.92 |
Ratios (%) (to average net assets)
and Supplemental data: |
| Expenses before expense reductions (f) | 0.47 | 0.47 | 0.47 | 0.51 | 0.53 |
| Expenses after expense reductions (f) | 0.44 | 0.45 | 0.46 | 0.50 | 0.52 |
| Net investment income (loss) | 2.75 | 1.92 | 1.39 | 1.80 | 2.12 |
| Portfolio turnover | 30 | 35 | 23 | 18 | 24 |
| Net assets at end of period (000 omitted) | $933,762 | $1,047,034 | $1,435,075 | $1,413,405 | $1,128,577 |
| Class R6 | Year ended |
| | 4/30/24 | 4/30/23 | 4/30/22 | 4/30/21 | 4/30/20 |
| Net asset value, beginning of period | $7.83 | $7.84 | $8.39 | $8.05 | $8.15 |
| Income (loss) from investment operations |
| Net investment income (loss) (d) | $0.22 | $0.16 | $0.12 | $0.15 | $0.18 |
| Net realized and unrealized gain (loss) | 0.03 | (0.01) | (0.55) | 0.34 | (0.10) |
| Total from investment operations | $0.25 | $0.15 | $(0.43) | $0.49 | $0.08 |
| Less distributions declared to shareholders |
| From net investment income | $(0.22) | $(0.16) | $(0.12) | $(0.15) | $(0.18) |
| Net asset value, end of period (x) | $7.86 | $7.83 | $7.84 | $8.39 | $8.05 |
| Total return (%) (r)(s)(t)(x) | 3.22 | 1.90 | (5.16) | 6.16 | 1.00 |
Ratios (%) (to average net assets)
and Supplemental data: |
| Expenses before expense reductions (f) | 0.39 | 0.39 | 0.39 | 0.44 | 0.45 |
| Expenses after expense reductions (f) | 0.37 | 0.38 | 0.38 | 0.43 | 0.44 |
| Net investment income (loss) | 2.83 | 2.02 | 1.47 | 1.84 | 2.21 |
| Portfolio turnover | 30 | 35 | 23 | 18 | 24 |
| Net assets at end of period (000 omitted) | $533,942 | $609,185 | $618,894 | $500,212 | $249,695 |
See Notes to Financial Statements
Financial Highlights – continued
| (d) | Per share data is based on average shares outstanding. |
| (f) | Ratios do not reflect reductions from fees paid indirectly, if applicable. See Note 2 in the Notes to Financial Statements for additional information. |
| (r) | Certain expenses have been reduced without which performance would have been lower. |
| (s) | From time to time the fund may receive proceeds from litigation settlements, without which performance would be lower. |
| (t) | Total returns do not include any applicable sales charges. |
| (x) | The net asset values and total returns have been calculated on net assets which include adjustments made in accordance with U.S. generally accepted accounting principles required at period end for financial reporting purposes. |
See Notes to Financial Statements
Notes to Financial Statements
(1) Business and Organization
MFS Municipal Limited Maturity Fund (the fund) is a diversified series of MFS Series Trust IX (the trust). The trust is organized as a Massachusetts business trust and is registered under the Investment Company Act of 1940, as amended, as an open-end management investment company.
The fund is an investment company and accordingly follows the investment company accounting and reporting guidance of the Financial Accounting Standards Board (FASB) Accounting Standards Codification Topic 946 Financial Services - Investment Companies.
(2) Significant Accounting Policies
General — The preparation of financial statements in conformity with U.S. generally accepted accounting principles requires management to make estimates and assumptions that affect the reported amounts of assets and liabilities, and disclosure of contingent assets and liabilities at the date of the financial statements and the reported amounts of increases and decreases in net assets from operations during the reporting period. Actual results could differ from those estimates. In the preparation of these financial statements, management has evaluated subsequent events occurring after the date of the fund’s Statement of Assets and Liabilities through the date that the financial statements were issued. The fund invests primarily in municipal instruments, which generally trade in the over-the-counter market. The value of municipal instruments can be affected by changes in their actual or perceived credit quality. The credit quality of, and the ability to pay principal and interest when due by, an issuer of a municipal instrument depends on the credit quality of the entity supporting the municipal instrument, how essential any services supported by the municipal instrument are, the sufficiency of any revenues or taxes that support the municipal instrument, and/or the willingness or ability of the appropriate government entity to approve any appropriations necessary to support the municipal instrument. Municipal instruments may be supported by insurance which typically guarantees the timely payment of all principal and interest due on the underlying municipal instrument. The value of a municipal instrument can be volatile and significantly affected by adverse tax changes or court rulings, legislative or political changes, changes in specific or general market and economic conditions in the region where the instrument is issued, and the financial condition of municipal issuers and of municipal instrument insurers of which there are a limited number. Also, because many municipal instruments are issued to finance similar projects, conditions in certain industries can significantly affect the fund and the overall municipal market. If the Internal Revenue Service determines an issuer of a municipal instrument has not complied with the applicable tax requirements, interest from the security could become taxable, the security could decline in value, and distributions made by the fund could be taxable to shareholders.
Balance Sheet Offsetting — The fund's accounting policy with respect to balance sheet offsetting is that, absent an event of default by the counterparty or a termination of the agreement, the International Swaps and Derivatives Association (ISDA) Master Agreement, or similar agreement, does not result in an offset of reported amounts of financial assets and financial liabilities in the Statement of Assets and Liabilities across transactions between the fund and the applicable counterparty. The fund's right to setoff may be restricted or prohibited by the bankruptcy or insolvency laws of the particular jurisdiction to which a specific master netting agreement counterparty is
Notes to Financial Statements - continued
subject. Balance sheet offsetting disclosures, to the extent applicable to the fund, have been included in the fund’s Significant Accounting Policies note under the captions for each of the fund’s in-scope financial instruments and transactions.
Investment Valuations — Subject to its oversight, the fund's Board of Trustees has delegated primary responsibility for determining or causing to be determined the value of the fund’s investments to MFS as the fund's adviser, pursuant to the fund’s valuation policy and procedures which have been adopted by the adviser and approved by the Board. In accordance with Rule 2a-5 under the Investment Company Act of 1940, the Board of Trustees designated the adviser as the “valuation designee” of the fund. If the adviser, as valuation designee, determines that reliable market quotations are not readily available for an investment, the investment is valued at fair value as determined in good faith by the adviser in accordance with the adviser’s fair valuation policy and procedures.
Under the fund's valuation policy and procedures, debt instruments and floating rate loans, including restricted debt instruments, are generally valued at an evaluated or composite bid as provided by a third-party pricing service. Short-term instruments with a maturity at issuance of 60 days or less may be valued at amortized cost, which approximates market value. Open-end investment companies are generally valued at net asset value per share.
Under the fund’s valuation policy and procedures, market quotations are not considered to be readily available for debt instruments, floating rate loans, and many types of derivatives. These investments are generally valued at fair value based on information from third-party pricing services or otherwise determined by the adviser in accordance with the adviser’s fair valuation policy and procedures. Securities and other assets generally valued on the basis of information from a third-party pricing service may also be valued at a broker/dealer bid quotation. In determining values, third-party pricing services can utilize both transaction data and market information such as yield, quality, coupon rate, maturity, type of issue, trading characteristics, spreads and other market data. An investment may also be valued at fair value if the adviser determines that the investment’s value has been materially affected by events occurring after the close of the exchange or market on which the investment is principally traded (such as foreign exchange or market) and prior to the determination of the fund’s net asset value, or after the halt of trading of a specific security where trading does not resume prior to the close of the exchange or market on which the security is principally traded. The adviser generally relies on third-party pricing services or other information (such as the correlation with price movements of similar securities in the same or other markets; the type, cost and investment characteristics of the security; the business and financial condition of the issuer; and trading and other market data) to assist in determining whether to fair value and at what value to fair value an investment. The value of an investment for purposes of calculating the fund’s net asset value can differ depending on the source and method used to determine value. When fair valuation is used, the value of an investment used to determine the fund’s net asset value may differ from quoted or published prices for the same investment. There can be no assurance that the fund could obtain the fair value assigned to an investment if it were to sell the investment at the same time at which the fund determines its net asset value per share.
Various inputs are used in determining the value of the fund's assets or liabilities. These inputs are categorized into three broad levels. In certain cases, the inputs used to measure fair value may fall into different levels of the fair value hierarchy. In such cases,
Notes to Financial Statements - continued
an investment's level within the fair value hierarchy is based on the lowest level of input that is significant to the fair value measurement. The fund's assessment of the significance of a particular input to the fair value measurement in its entirety requires judgment, and considers factors specific to the investment. Level 1 includes unadjusted quoted prices in active markets for identical assets or liabilities. Level 2 includes other significant observable market-based inputs (including quoted prices for similar securities, interest rates, prepayment speed, and credit risk). Level 3 includes significant unobservable inputs, which may include the adviser's own assumptions in determining the fair value of investments. The following is a summary of the levels used as of April 30, 2024 in valuing the fund's assets and liabilities:
| Financial Instruments | Level 1 | Level 2 | Level 3 | Total |
| Municipal Bonds | $— | $2,544,740,827 | $— | $2,544,740,827 |
| U.S. Corporate Bonds | — | 11,936,032 | — | 11,936,032 |
| Mutual Funds | 18,196,513 | — | — | 18,196,513 |
| Total | $18,196,513 | $2,556,676,859 | $— | $2,574,873,372 |
For further information regarding security characteristics, see the Portfolio of Investments.
Indemnifications — Under the fund's organizational documents, its officers and Trustees may be indemnified against certain liabilities and expenses arising out of the performance of their duties to the fund. Additionally, in the normal course of business, the fund enters into agreements with service providers that may contain indemnification clauses. The fund's maximum exposure under these agreements is unknown as this would involve future claims that may be made against the fund that have not yet occurred.
Investment Transactions and Income — Interest income is recorded on the accrual basis. All premium and discount is amortized or accreted for financial statement purposes in accordance with U.S. generally accepted accounting principles. Interest payments received in additional securities are recorded on the ex-interest date in an amount equal to the value of the security on such date. Debt obligations may be placed on non-accrual status or set to accrue at a rate of interest less than the contractual coupon when the collection of all or a portion of interest has become doubtful. Interest income for those debt obligations may be further reduced by the write-off of the related interest receivables when deemed uncollectible.
The fund may receive proceeds from litigation settlements. Any proceeds received from litigation involving portfolio holdings are reflected in the Statement of Operations in realized gain/loss if the security has been disposed of by the fund or in unrealized gain/loss if the security is still held by the fund. Any other proceeds from litigation not related to portfolio holdings are reflected as other income in the Statement of Operations.
Investment transactions are recorded on the trade date. In determining the net gain or loss on securities sold, the cost of securities is determined on the identified cost basis.
The fund may purchase or sell securities on a when-issued or delayed delivery basis. In these extended settlement transactions, the receipt or delivery of the securities by the fund and related payments occur at a future date, usually beyond the customary settlement period. The price of such security and the date that the security will be settled are generally fixed at the time the transaction is negotiated. The value of the
Notes to Financial Statements - continued
security varies with market fluctuations and for debt securities no interest accrues to the fund until settlement takes place. When the fund sells securities on a when-issued or delayed delivery basis, the fund typically owns or has the right to acquire securities equivalent in kind and amount to the securities sold. Purchase and sale commitments for when-issued or delayed delivery securities are held at carrying amount, which approximates fair value and are categorized as level 2 within the fair value hierarchy, and included in When-issued investments purchased and When-issued investments sold in the Statement of Assets and Liabilities, as applicable. Losses may arise due to changes in the value of the underlying securities prior to settlement date or if the counterparty does not perform under the contract’s terms, or if the issuer does not issue the securities due to political, economic or other factors.
Legal fees and other related expenses incurred to preserve and protect the value of a security owned are added to the cost of the security; other legal fees are expensed. Capital infusions made directly to the security issuer, which are generally non-recurring, incurred to protect or enhance the value of high-yield debt securities, are reported as additions to the cost basis of the security. Costs that are incurred to negotiate the terms or conditions of capital infusions or that are expected to result in a plan of reorganization are reported as realized losses. Ongoing costs incurred to protect or enhance an investment, or costs incurred to pursue other claims or legal actions, are expensed.
Fees Paid Indirectly — The fund's custody fee may be reduced by a credit earned under an arrangement that measures the value of U.S. dollars deposited with the custodian by the fund. The amount of the credit, for the year ended April 30, 2024, is shown as a reduction of total expenses in the Statement of Operations.
Tax Matters and Distributions — The fund intends to qualify as a regulated investment company, as defined under Subchapter M of the Internal Revenue Code, and to distribute all of its taxable and tax-exempt income, including realized capital gains. As a result, no provision for federal income tax is required. The fund’s federal tax returns, when filed, will remain subject to examination by the Internal Revenue Service for a three year period. Management has analyzed the fund’s tax positions taken on federal and state tax returns for all open tax years and does not believe that there are any uncertain tax positions that require recognition of a tax liability.
Distributions to shareholders are recorded on the ex-dividend date. Income and capital gain distributions are determined in accordance with income tax regulations, which may differ from U.S. generally accepted accounting principles. Certain capital accounts in the financial statements are periodically adjusted for permanent differences in order to reflect their tax character. These adjustments have no impact on net assets or net asset value per share. Temporary differences which arise from recognizing certain items of income, expense, gain or loss in different periods for financial statement and tax purposes will reverse at some time in the future.
During the year ended April 30, 2024, there were no significant adjustments due to differences between book and tax accounting.
Notes to Financial Statements - continued
The tax character of distributions declared to shareholders for the last two fiscal years is as follows:
| | Year ended
4/30/24 | Year ended
4/30/23 |
| Ordinary income (including any short-term capital gains) | $2,061,744 | $2,508,254 |
| Tax-exempt income | 69,673,043 | 56,364,625 |
| Total distributions | $71,734,787 | $58,872,879 |
The federal tax cost and the tax basis components of distributable earnings were as follows:
| As of 4/30/24 | |
| Cost of investments | $2,615,814,864 |
| Gross appreciation | 19,780,353 |
| Gross depreciation | (60,721,845) |
| Net unrealized appreciation (depreciation) | $(40,941,492) |
| Undistributed ordinary income | 1,383,965 |
| Undistributed tax-exempt income | 2,407,847 |
| Capital loss carryforwards | (105,669,070) |
| Other temporary differences | (6,172,168) |
| Total distributable earnings (loss) | $(148,990,918) |
As of April 30, 2024, the fund had capital loss carryforwards available to offset future realized gains. These net capital losses may be carried forward indefinitely and their character is retained as short-term and/or long-term losses. Such losses are characterized as follows:
| Short-Term | $(38,164,625) |
| Long-Term | (67,504,445) |
| Total | $(105,669,070) |
Multiple Classes of Shares of Beneficial Interest — The fund offers multiple classes of shares, which differ in their respective distribution and service fees. The fund's income and common expenses are allocated to shareholders based on the value of settled shares outstanding of each class. The fund's realized and unrealized gain (loss) are allocated to shareholders based on the daily net assets of each class. Dividends are declared separately for each class. Differences in per share dividend rates are generally due to differences in separate class expenses. Class B and Class C shares will convert to
Notes to Financial Statements - continued
Class A shares approximately eight years after purchase. The fund’s distributions declared to shareholders as reported in the Statements of Changes in Net Assets are presented by class as follows:
| | Year ended
4/30/24 | Year ended
4/30/23 |
| Class A | $29,353,909 | $23,000,269 |
| Class B | 1,995 | 1,607 |
| Class C | 392,851 | 306,070 |
| Class I | 26,117,550 | 22,983,675 |
| Class R6 | 15,868,482 | 12,581,258 |
| Total | $71,734,787 | $58,872,879 |
(3) Transactions with Affiliates
Investment Adviser — The fund has an investment advisory agreement with MFS to provide overall investment management and related administrative services and facilities to the fund. The management fee is computed daily and paid monthly at the following annual rates based on the fund's average daily net assets:
| Up to $2.5 billion | 0.35% |
| In excess of $2.5 billion and up to $5 billion | 0.30% |
| In excess of $5 billion | 0.28% |
MFS has agreed in writing to reduce its management fee by a specified amount if certain MFS mutual fund assets exceed thresholds agreed to by MFS and the fund's Board of Trustees. MFS has also agreed in writing to waive at least 0.01% of its management fee as part of this agreement. The agreement to waive at least 0.01% of the management fee will continue until modified by the fund's Board of Trustees, but such agreement will continue at least until August 31, 2025. For the year ended April 30, 2024, this management fee reduction amounted to $346,058, which is included in the reduction of total expenses in the Statement of Operations.The management fee incurred for the year ended April 30, 2024 was equivalent to an annual effective rate of 0.33% of the fund's average daily net assets.
For the period from May 1, 2023 through July 31, 2023, the investment adviser had agreed in writing to pay a portion of the fund’s total annual operating expenses, excluding interest, taxes, extraordinary expenses, brokerage and transaction costs, certain tax reclaim recovery expenses (including contingency fees and closing agreement expenses), and investment-related expenses, such that total fund operating expenses did not exceed the following rates annually of each class’s average daily net assets:
| | | Classes | | |
| A | B | C | I | R6 |
| 0.69% | 1.44% | 1.54% | 0.54% | 0.46% |
This written agreement terminated on July 31, 2023. For the period from May 1, 2023 through July 31, 2023, the fund’s actual operating expenses did not exceed the limit and therefore, the investment adviser did not pay any portion of the fund’s expenses related to this agreement.
Notes to Financial Statements - continued
Effective August 1, 2023, the investment adviser has agreed in writing to pay a portion of the fund’s total annual operating expenses, excluding interest, taxes, extraordinary expenses, brokerage and transaction costs, certain tax reclaim recovery expenses (including contingency fees and closing agreement expenses), and investment-related expenses, such that total fund operating expenses do not exceed the following rates annually of each class’s average daily net assets:
| | | Classes | | |
| A | B | C | I | R6 |
| 0.59% | 1.34% | 1.44% | 0.44% | 0.36% |
This written agreement will continue until modified by the fund’s Board of Trustees, but such agreement will continue at least until August 31, 2024. For the period from August 1, 2023 through April 30, 2024, this reduction amounted to $371,225, which is included in the reduction of total expenses in the Statement of Operations.
Distributor — MFS Fund Distributors, Inc. (MFD), a wholly-owned subsidiary of MFS, as distributor, received $33,405 for the year ended April 30, 2024, as its portion of the initial sales charge on sales of Class A shares of the fund.
The Board of Trustees has adopted a distribution plan for certain share classes pursuant to Rule 12b-1 of the Investment Company Act of 1940.
The fund's distribution plan provides that the fund will pay MFD for services provided by MFD and financial intermediaries in connection with the distribution and servicing of certain share classes. One component of the plan is a distribution fee paid to MFD and another component of the plan is a service fee paid to MFD. MFD may subsequently pay all, or a portion, of the distribution and/or service fees to financial intermediaries. The distribution and service fees are computed daily and paid monthly.
Distribution Plan Fee Table:
| | Distribution
Fee Rate (d) | Service
Fee Rate (d) | Total
Distribution
Plan (d) | Annual
Effective
Rate (e) | Distribution
and Service
Fee |
| Class A | — | 0.25% | 0.25% | 0.15% | $ 2,868,567 |
| Class B | 0.75% | 0.25% | 1.00% | 0.90% | 1,115 |
| Class C | 0.75% | 0.25% | 1.00% | 1.00% | 231,356 |
| Total Distribution and Service Fees | | | | | $3,101,038 |
| (d) | In accordance with the distribution plan for certain classes, the fund pays distribution and/or service fees equal to these annual percentage rates of each class’s average daily net assets. The distribution and service fee rates disclosed by class represent the current rates in effect at the end of the reporting period. Any rate changes, if applicable, are detailed below. |
| (e) | The annual effective rates represent actual fees incurred under the distribution plan for the year ended April 30, 2024 based on each class's average daily net assets. 0.10% of the Class A and Class B service fee is currently being waived under a written waiver agreement. For the year ended April 30, 2024, this waiver amounted to $1,147,415 and $112 for Class A and Class B shares, respectively, and is included in the reduction of total expenses in the Statement of Operations. This written waiver agreement will continue until modified by the fund’s Board of Trustees, but such agreement will continue at least until August 31, 2024. |
MFD has voluntarily agreed to rebate a portion of each class's 0.25% service fee attributable
Notes to Financial Statements - continued
to accounts for which there is no financial intermediary specified on the account except for accounts attributable to MFS or its affiliates' seed money. For the year ended April 30, 2024, this rebate amounted to $5 for Class A shares, and is included in the reduction of total expenses in the Statement of Operations.
Certain Class A shares are subject to a contingent deferred sales charge (CDSC) in the event of a shareholder redemption within 18 months of purchase. Class B shares are subject to a CDSC in the event of a shareholder redemption within six years of purchase. Class C shares are subject to a CDSC in the event of a shareholder redemption within 12 months of purchase. All contingent deferred sales charges are paid to MFD and during the year ended April 30, 2024, were as follows:
| | Amount |
| Class A | $100,335 |
| Class B | 914 |
| Class C | 213 |
Shareholder Servicing Agent — MFS Service Center, Inc. (MFSC), a wholly-owned subsidiary of MFS, receives a fee from the fund for its services as shareholder servicing agent calculated as a percentage of the average daily net assets of the fund as determined periodically under the supervision of the fund's Board of Trustees. For the year ended April 30, 2024, the fee was $33,269, which equated to 0.0012% annually of the fund's average daily net assets. MFSC also receives reimbursement from the fund for out-of-pocket expenses, sub-accounting and other shareholder servicing costs which may be paid to affiliated and unaffiliated service providers. Class R6 shares do not incur sub-accounting fees. For the year ended April 30, 2024, these out-of-pocket expenses, sub-accounting and other shareholder servicing costs amounted to $1,570,151.
Administrator — MFS provides certain financial, legal, shareholder communications, compliance, and other administrative services to the fund. Under an administrative services agreement, the fund reimburses MFS the costs incurred to provide these services. The fund is charged an annual fixed amount of $17,500 plus a fee based on average daily net assets. The administrative services fee is computed daily and paid monthly. The administrative services fee incurred for the year ended April 30, 2024 was equivalent to an annual effective rate of 0.0147% of the fund's average daily net assets.
Trustees’ and Officers’ Compensation — The fund pays compensation to independent Trustees in the form of a retainer, attendance fees, and additional compensation to Board and Committee chairpersons. Independent Trustees’ compensation is accrued daily and paid subsequent to each Trustee Board meeting. The fund does not pay compensation directly to Trustees or officers of the fund who are also officers of the investment adviser, all of whom receive remuneration from MFS for their services to the fund. Certain officers and Trustees of the fund are officers or directors of MFS, MFD, and MFSC.
Other — The fund invests in the MFS Institutional Money Market Portfolio which is managed by MFS and seeks current income consistent with preservation of capital and liquidity. This money market fund does not pay a management fee to MFS but does incur investment and operating costs.
On August 3, 2022, MFS redeemed 15 shares of Class R6 for an aggregate amount of $120.
Notes to Financial Statements - continued
During the year ended April 30, 2024, pursuant to a policy adopted by the Board of Trustees and designed to comply with Rule 17a-7 under the Investment Company Act of 1940 (the “Act”) and relevant guidance, the fund engaged in purchase transactions with funds and accounts for which MFS serves as investment adviser or sub-adviser (“cross-trades”) which amounted to $17,081,555.
(4) Portfolio Securities
For the year ended April 30, 2024, purchases and sales of investments, other than short-term obligations, aggregated $799,773,331 and $1,069,258,111, respectively.
(5) Shares of Beneficial Interest
The fund's Declaration of Trust permits the Trustees to issue an unlimited number of full and fractional shares of beneficial interest. Transactions in fund shares were as follows:
| | Year ended
4/30/24 | | Year ended
4/30/23 |
| | Shares | Amount | | Shares | Amount |
| Shares sold | | | | | |
| Class A | 39,759,896 | $311,841,532 | | 67,292,064 | $526,391,099 |
| Class B | — | — | | 216 | 1,687 |
| Class C | 265,507 | 2,085,244 | | 659,775 | 5,140,996 |
| Class I | 49,615,641 | 387,679,263 | | 95,155,189 | 743,324,214 |
| Class R6 | 19,612,168 | 153,358,011 | | 46,991,193 | 366,522,497 |
| | 109,253,212 | $854,964,050 | | 210,098,437 | $1,641,380,493 |
Shares issued to shareholders
in reinvestment of distributions | | | | | |
| Class A | 3,533,165 | $27,701,959 | | 2,734,314 | $21,405,240 |
| Class B | 255 | 1,995 | | 205 | 1,607 |
| Class C | 43,093 | 337,845 | | 33,193 | 259,832 |
| Class I | 2,604,357 | 20,392,944 | | 2,302,734 | 18,006,919 |
| Class R6 | 1,889,066 | 14,785,170 | | 1,547,792 | 12,094,159 |
| | 8,069,936 | $63,219,913 | | 6,618,238 | $51,767,757 |
| Shares reacquired | | | | | |
| Class A | (55,850,359) | $(437,769,726) | | (87,909,223) | $(687,775,236) |
| Class B | (9,686) | (76,211) | | (3,211) | (25,142) |
| Class C | (1,458,408) | (11,402,838) | | (2,116,333) | (16,548,746) |
| Class I | (67,027,485) | (523,713,406) | | (146,751,112) | (1,145,350,532) |
| Class R6 | (31,310,632) | (244,833,375) | | (49,688,000) | (387,536,375) |
| | (155,656,570) | $(1,217,795,556) | | (286,467,879) | $(2,237,236,031) |
Notes to Financial Statements - continued
| | Year ended
4/30/24 | | Year ended
4/30/23 |
| | Shares | Amount | | Shares | Amount |
| Net change | | | | | |
| Class A | (12,557,298) | $(98,226,235) | | (17,882,845) | $(139,978,897) |
| Class B | (9,431) | (74,216) | | (2,790) | (21,848) |
| Class C | (1,149,808) | (8,979,749) | | (1,423,365) | (11,147,918) |
| Class I | (14,807,487) | (115,641,199) | | (49,293,189) | (384,019,399) |
| Class R6 | (9,809,398) | (76,690,194) | | (1,149,015) | (8,919,719) |
| | (38,333,422) | $(299,611,593) | | (69,751,204) | $(544,087,781) |
Effective May 1, 2006, purchases of the fund's Class B shares were closed to new and existing investors subject to certain exceptions.
(6) Line of Credit
The fund and certain other funds managed by MFS participate in a $1.45 billion unsecured committed line of credit of which $1.2 billion is reserved for use by the fund and certain other MFS U.S. funds. The line of credit is provided by a syndicate of banks under a credit agreement. Borrowings may be made for temporary financing needs. Interest is charged to each fund, based on its borrowings, generally at a rate equal to the highest of 1) Daily Simple SOFR (Secured Overnight Financing Rate) plus 0.10%, 2) the Federal Funds Effective Rate, or 3) the Overnight Bank Funding Rate, each plus an agreed upon spread. A commitment fee, based on the average daily unused portion of the committed line of credit, is allocated among the participating funds. The line of credit expires on March 13, 2025 unless extended or renewed. In addition, the fund and other funds managed by MFS have established unsecured uncommitted borrowing arrangements with certain banks for temporary financing needs. Interest is charged to each fund, based on its borrowings, at rates equal to customary reference rates plus an agreed upon spread. For the year ended April 30, 2024, the fund’s commitment fee and interest expense were $14,923 and $0, respectively, and are included in “Miscellaneous” expense in the Statement of Operations.
(7) Investments in Affiliated Issuers
An affiliated issuer may be considered one in which the fund owns 5% or more of the outstanding voting securities, or a company which is under common control. For the purposes of this report, the following were affiliated issuers:
| Affiliated Issuers | Beginning
Value | Purchases | Sales
Proceeds | Realized
Gain
(Loss) | Change in
Unrealized
Appreciation or
Depreciation | Ending
Value |
| MFS Institutional Money Market Portfolio | $16,549,380 | $775,069,934 | $773,395,123 | $(27,679) | $1 | $18,196,513 |
Notes to Financial Statements - continued
| Affiliated Issuers | Dividend
Income | Capital Gain
Distributions |
| MFS Institutional Money Market Portfolio | $2,310,347 | $— |
Report of Independent Registered Public Accounting Firm
To the Board of Trustees of MFS Series Trust IX and the Shareholders of
MFS Municipal Limited Maturity Fund:
Opinion on the Financial Statements and Financial Highlights
We have audited the accompanying statement of assets and liabilities of MFS Municipal Limited Maturity Fund (the “Fund”), including the portfolio of investments, as of April 30, 2024, the related statement of operations for the year then ended, the statements of changes in net assets for each of the two years in the period then ended, the financial highlights for each of the five years in the period then ended, and the related notes. In our opinion, the financial statements and financial highlights present fairly, in all material respects, the financial position of the Fund as of April 30, 2024, and the results of its operations for the year then ended, the changes in its net assets for each of the two years in the period then ended, and the financial highlights for each of the five years in the period then ended, in conformity with accounting principles generally accepted in the United States of America.
Basis for Opinion
These financial statements and financial highlights are the responsibility of the Fund’s management. Our responsibility is to express an opinion on the Fund's financial statements and financial highlights based on our audits. We are a public accounting firm registered with the Public Company Accounting Oversight Board (United States) (PCAOB) and are required to be independent with respect to the Fund in accordance with the U.S. federal securities laws and the applicable rules and regulations of the Securities and Exchange Commission and the PCAOB.
We conducted our audits in accordance with the standards of the PCAOB. Those standards require that we plan and perform the audit to obtain reasonable assurance about whether the financial statements and financial highlights are free of material misstatement, whether due to error or fraud. The Fund is not required to have, nor were we engaged to perform, an audit of its internal control over financial reporting. As part of our audits we are required to obtain an understanding of internal control over financial reporting but not for the purpose of expressing an opinion on the effectiveness of the Fund's internal control over financial reporting. Accordingly, we express no such opinion.
Our audits included performing procedures to assess the risks of material misstatement of the financial statements and financial highlights, whether due to error or fraud, and performing procedures that respond to those risks. Such procedures included examining, on a test basis, evidence regarding the amounts and disclosures in the financial statements and financial highlights. Our audits also included evaluating the accounting principles used and significant estimates made by management, as well as evaluating the overall presentation of the financial statements and financial highlights.
Report of Independent Registered Public Accounting Firm – continued
Our procedures included confirmation of securities owned as of April 30, 2024, by correspondence with the custodian and brokers; when replies were not received from brokers, we performed other auditing procedures. We believe that our audits provide a reasonable basis for our opinion.
DELOITTE & TOUCHE LLP
Boston, Massachusetts
June 20, 2024
We have served as the auditor of one or more of the MFS investment companies since 1924.
Trustees and Officers — Identification and Background
The Trustees and Officers of the Trust, as of June 1, 2024, are listed below, together with their principal occupations during the past five years. (Their titles may have varied during that period.) The address of each Trustee and Officer is 111 Huntington Avenue, Boston, Massachusetts 02199-7618.
| Name, Age | | Position(s) Held with Fund | | Trustee/Officer Since(h) | | Number of MFS Funds overseen by the Trustee | | Principal Occupations During
the Past Five Years | | Other Directorships During
the Past Five Years (j) |
| INTERESTED TRUSTEE | | | | | | | | | | |
Michael W. Roberge (k)
(age 57) | | Trustee | | January 2021 | | 135 | | Massachusetts Financial Services Company, Chairman (since January 2021); Chief Executive Officer (since January 2017); Director; Chairman of the Board (since January 2022) | | N/A |
| INDEPENDENT TRUSTEES | | | | | | | | | | |
John P. Kavanaugh
(age 69) | | Trustee and Chair of Trustees | | January 2009 | | 135 | | Private investor | | N/A |
Steven E. Buller
(age 72) | | Trustee | | February 2014 | | 135 | | Private investor | | N/A |
John A. Caroselli
(age 69) | | Trustee | | March 2017 | | 135 | | Private investor; JC Global Advisors, LLC (management consulting), President (since 2015) | | N/A |
Maureen R. Goldfarb
(age 69) | | Trustee | | January 2009 | | 135 | | Private investor | | N/A |
Peter D. Jones
(age 68) | | Trustee | | January 2019 | | 135 | | Private investor | | N/A |
James W. Kilman, Jr.
(age 63) | | Trustee | | January 2019 | | 135 | | Burford Capital Limited (finance and investment management), Senior Advisor (since May 3, 2021), Chief Financial Officer (2019 - May 2, 2021); KielStrand Capital LLC (family office), Chief Executive Officer (since 2016) | | Alpha-En Corporation, Director (2016-2019) |
Trustees and Officers - continued
| Name, Age | | Position(s) Held with Fund | | Trustee/Officer Since(h) | | Number of MFS Funds overseen by the Trustee | | Principal Occupations During
the Past Five Years | | Other Directorships During
the Past Five Years (j) |
Clarence Otis, Jr.
(age 68) | | Trustee | | March 2017 | | 135 | | Private investor | | VF Corporation, Director; Verizon Communications, Inc., Director; The Travelers Companies, Director |
Maryanne L. Roepke
(age 68) | | Trustee | | May 2014 | | 135 | | Private investor | | N/A |
Laurie J. Thomsen
(age 66) | | Trustee | | March 2005 | | 135 | | Private investor | | The Travelers Companies, Director; Dycom Industries, Inc., Director |
| Name, Age | | Position(s) Held with
Fund | | Trustee/Officer Since(h) | | Number of MFS Funds for which the Person is an Officer | | Principal Occupations During
the Past Five Years |
| OFFICERS | | | | | | | | |
William T. Allen (k)
(age 57) | | Deputy Assistant Treasurer | | April 2024 | | 135 | | Massachusetts Financial Services Company, Vice President |
Brian Balasco (k)
(age 46) | | Assistant Treasurer | | April 2024 | | 135 | | Massachusetts Financial Services Company, Vice President |
Christopher R. Bohane (k)
(age 50) | | Assistant Secretary and Assistant Clerk | | July 2005 | | 135 | | Massachusetts Financial Services Company, Senior Vice President and Deputy General Counsel |
James L. Byrne (k)
(age 48) | | Assistant Treasurer | | April 2024 | | 135 | | Massachusetts Financial Services Company, Vice President |
John W. Clark, Jr. (k)
(age 57) | | Deputy Treasurer | | April 2017 | | 135 | | Massachusetts Financial Services Company, Vice President |
David L. DiLorenzo (k)
(age 55) | | President | | July 2005 | | 135 | | Massachusetts Financial Services Company, Senior Vice President |
Heidi W. Hardin (k)
(age 56) | | Secretary and Clerk | | April 2017 | | 135 | | Massachusetts Financial Services Company, Executive Vice President and General Counsel |
Brian E. Langenfeld (k)
(age 51) | | Assistant Secretary and Assistant Clerk | | June 2006 | | 135 | | Massachusetts Financial Services Company, Vice President and Managing Counsel |
Trustees and Officers - continued
| Name, Age | | Position(s) Held with
Fund | | Trustee/Officer Since(h) | | Number of MFS Funds for which the Person is an Officer | | Principal Occupations During
the Past Five Years |
Rosa E. Licea-Mailloux (k)
(age 47) | | Chief Compliance Officer | | March 2022 | | 135 | | Massachusetts Financial Services Company, Vice President (since 2018); Director of Corporate Compliance (2018-2021), Senior Director Compliance (2021-2022), Senior Managing Director of North American Compliance & Chief Compliance Officer (since March 2022) |
Amanda S. Mooradian (k)
(age 45) | | Assistant Secretary and Assistant Clerk | | September 2018 | | 135 | | Massachusetts Financial Services Company, Vice President and Senior Counsel |
Susan A. Pereira (k)
(age 53) | | Assistant Secretary and Assistant Clerk | | July 2005 | | 135 | | Massachusetts Financial Services Company, Vice President and Managing Counsel |
Kasey L. Phillips (k)
(age 53) | | Treasurer | | September 2012 | | 135 | | Massachusetts Financial Services Company, Vice President |
Matthew A. Stowe (k)
(age 49) | | Assistant Secretary and Assistant Clerk | | October 2014 | | 135 | | Massachusetts Financial Services Company, Vice President and Senior Managing Counsel |
William B. Wilson (k)
(age 41) | | Assistant Secretary and Assistant Clerk | | October 2022 | | 135 | | Massachusetts Financial Services Company, Assistant Vice President and Senior Counsel |
| (h) | Date first appointed to serve as Trustee/Officer of an MFS Fund. Each Trustee has served continuously since appointment unless indicated otherwise. From January 2012 through December 2016, Mr. DiLorenzo served as Treasurer and of the Funds. From September 2012 through March 2024, Ms. Phillips served as Assistant Treasurer of the Funds. From April 2017 through March 2024, Mr. Clark served as Assistant Treasurer of the Funds. |
| (j) | Directorships or trusteeships of companies required to report to the Securities and Exchange Commission (i.e., “public companies”). |
| (k) | “Interested person” of the Trust within the meaning of the Investment Company Act of 1940 (referred to as the 1940 Act), which is the principal federal law governing investment companies like the fund, as a result of a position with MFS. The address of MFS is 111 Huntington Avenue, Boston, Massachusetts 02199-7618. |
Each Trustee (other than Messrs. Jones, Kilman and Roberge) has been elected by shareholders and each Trustee and Officer holds office until his or her successor is chosen and qualified or until his or her earlier death, resignation, retirement or removal. Mr. Roberge became a Trustee of the Funds on January 1, 2021 and Messrs. Jones and Kilman became Trustees of the Funds on January 1, 2019. The Trust does not hold annual meetings for the purpose of electing Trustees, and Trustees are not elected for fixed terms. Under the terms of the Board's retirement policy, an Independent Trustee
Trustees and Officers - continued
shall retire at the end of the calendar year in which he or she reaches the earlier of 75 years of age or 15 years of service on the Board (or, in the case of any Independent Trustee who joined the Board prior to 2015, 20 years of service on the Board).
Messrs. Buller, Caroselli, Jones and Otis are members of the Trust’s Audit Committee.
Each of the Interested Trustees and certain Officers hold comparable officer positions with certain affiliates of MFS.
| Investment Adviser | Custodian |
Massachusetts Financial Services Company
111 Huntington Avenue
Boston, MA 02199-7618 | JPMorgan Chase Bank, NA
4 Metrotech Center
New York, NY 11245 |
| Distributor | Independent Registered Public Accounting Firm |
MFS Fund Distributors, Inc.
111 Huntington Avenue
Boston, MA 02199-7618 | Deloitte & Touche LLP
200 Berkeley Street
Boston, MA 02116 |
| Portfolio Manager(s) | |
Michael Dawson
Jason Kosty
Megan Poplowski
Geoffrey Schechter | |
Statement Regarding Liquidity Risk Management Program
The fund has adopted and implemented a liquidity risk management program (the “Program”) as required by Rule 22e-4 under the Investment Company Act of 1940, as amended. The fund’s Board of Trustees (the “Board”) has designated MFS as the administrator of the Program. The Program is reasonably designed to assess and manage the liquidity risk of the fund. Liquidity risk is the risk that the fund could not meet requests to redeem shares issued by the fund without significant dilution of remaining investors' interests.
MFS provided a written report to the Board for consideration at its March 2024 meeting that addressed the operation of the Program and provided an assessment of the adequacy and effectiveness of the Program during the period from January 1, 2023 to December 31, 2023 (the “Covered Period”). The report concluded that during the Covered Period the Program had operated effectively in all material respects and had adequately and effectively been implemented to assess and manage the fund’s liquidity risk. MFS also reported that there were no liquidity events that impacted the fund or its ability to timely meet redemptions without dilution to existing shareholders during the Covered Period.
There can be no assurance that the Program will achieve its objectives in the future. Further information on liquidity risk, and other principal risks to which an investment in the fund may be subject, can be found in the prospectus.
Proxy Voting Policies and Information
MFS votes proxies on behalf of the fund pursuant to proxy voting policies and procedures that are available without charge, upon request, by calling 1-800-225-2606, by visiting mfs.com/proxyvoting, or by visiting the SEC’s Web site at http://www.sec.gov.
Information regarding how the fund voted proxies relating to portfolio securities during the most recent twelve-month period ended June 30 is available by August 31 of each year without charge by visiting mfs.com/proxyvoting, or by visiting the SEC’s Web site at http://www.sec.gov.
Quarterly Portfolio Disclosure
The fund files a complete schedule of portfolio holdings with the SEC for the first and third quarters of each fiscal year as an exhibit to its reports on Form N-PORT. The fund's Form N-PORT reports are available on the SEC's Web site at http://www.sec.gov. A shareholder can obtain the portfolio holdings report for the first and third quarters of the fund's fiscal year at mfs.com/openendfunds by choosing the fund's name and then scrolling to the “Resources” section and clicking on the “Shareholder Reports” tab.
Further Information
From time to time, MFS may post important information about the fund or the MFS Funds on the MFS Web site (mfs.com). This information is available at https://www.mfs.com/announcements or at mfs.com/openendfunds by choosing the fund’s name and then scrolling to the “Resources” section and clicking on the “Announcements” tab, if any.
Information About Fund Contracts and Legal Claims
The fund has entered into contractual arrangements with an investment adviser, administrator, distributor, shareholder servicing agent, and custodian who each provide services to the fund. Unless expressly stated otherwise, shareholders are not parties to, or intended beneficiaries of these contractual arrangements, and these contractual arrangements are not intended to create any shareholder right to enforce them against the service providers or to seek any remedy under them against the service providers, either directly or on behalf of the fund.
Under the Trust’s By-Laws and Declaration of Trust, any claims asserted against or on behalf of the MFS Funds, including claims against Trustees and Officers, must be brought in state and federal courts located within the Commonwealth of Massachusetts.
Federal Tax Information (unaudited)
The fund will notify shareholders of amounts for use in preparing 2024 income tax forms in January 2025. The following information is provided pursuant to provisions of the Internal Revenue Code.
Of the dividends paid from net investment income during the fiscal year, 97.13% is designated as exempt interest dividends for federal income tax purposes. If the fund has earned income on private activity bonds, a portion of the dividends paid may be considered a tax preference item for purposes of computing a shareholder’s alternative minimum tax.
The fund intends to pass through the maximum amount allowable as Section 163(j) Interest Dividends as defined in Treasury Regulation §1.163(j)-1(b).
| FACTS | WHAT DOES MFS DO WITH YOUR PERSONAL INFORMATION? |
| Why? | Financial companies choose how they share your personal information. Federal law gives consumers the right to limit some but not all sharing. Federal law also requires us to tell you how we collect, share, and protect your personal information. Please read this notice carefully to understand what we do. |
| What? | The types of personal information we collect and share depend on the product or service you have with us. This information can include: |
| • Social Security number and account balances |
| • Account transactions and transaction history |
| • Checking account information and wire transfer instructions |
| When you are no longer our customer, we continue to share your information as described in this notice. |
| How? | All financial companies need to share customers' personal information to run their everyday business. In the section below, we list the reasons financial companies can share their customers' personal information; the reasons MFS chooses to share; and whether you can limit this sharing. |
Reasons we can share your
personal information | Does MFS share? | Can you limit
this sharing? |
For our everyday business purposes –
such as to process your transactions, maintain your
account(s), respond to court orders and legal
investigations, or report to credit bureaus | Yes | No |
For our marketing purposes –
to offer our products and services to you | No | We don't share |
For joint marketing with other
financial companies | No | We don't share |
For our affiliates' everyday business purposes –
information about your transactions and experiences | No | We don't share |
For our affiliates' everyday business purposes –
information about your creditworthiness | No | We don't share |
| For nonaffiliates to market to you | No | We don't share |
| Questions? | Call 800-225-2606 or go to mfs.com. |
| Who we are |
| Who is providing this notice? | MFS Funds, MFS Investment Management, MFS Institutional Advisors, Inc., and MFS Heritage Trust Company. |
| What we do |
How does MFS
protect my personal
information? | To protect your personal information from unauthorized access and use, we use security measures that comply with federal law. These measures include procedural, electronic, and physical safeguards for the protection of the personal information we collect about you. |
How does MFS
collect my personal
information? | We collect your personal information, for example, when you |
| • open an account or provide account information |
| • direct us to buy securities or direct us to sell your securities |
| • make a wire transfer |
| We also collect your personal information from others, such as credit bureaus, affiliates, or other companies. |
| Why can't I limit all sharing? | Federal law gives you the right to limit only |
| • sharing for affiliates' everyday business purposes – information about your creditworthiness |
| • affiliates from using your information to market to you |
| • sharing for nonaffiliates to market to you |
| State laws and individual companies may give you additional rights to limit sharing. |
| Definitions |
| Affiliates | Companies related by common ownership or control. They can be financial and nonfinancial companies. |
| • MFS does not share personal information with affiliates, except for everyday business purposes as described on page one of this notice. |
| Nonaffiliates | Companies not related by common ownership or control. They can be financial and nonfinancial companies. |
| • MFS does not share with nonaffiliates so they can market to you. |
| Joint marketing | A formal agreement between nonaffiliated financial companies that together market financial products or services to you. |
| • MFS doesn't jointly market. |
| Other important information |
| If you own an MFS product or receive an MFS service in the name of a third party such as a bank or broker-dealer, their privacy policy may apply to you instead of ours. |
Save paper with eDelivery.
MFS® will send you prospectuses, reports, and proxies directly via e-mail so you will get information faster with less mailbox clutter.
To sign up:
1. Go to mfs.com.
2. Log in via MFS® Access.
3. Select eDelivery.
If you own your MFS fund shares through a financial institution or a retirement plan, MFS® TALK, MFS® Access, or eDelivery may not be available to you.
CONTACT
WEB SITE
mfs.com
MFS TALK
1-800-637-8255
24 hours a day
ACCOUNT SERVICE AND LITERATURE
Shareholders
1-800-225-2606
Financial advisors
1-800-343-2829
Retirement plan services
1-800-637-1255
MAILING ADDRESS
MFS Service Center, Inc.
P.O. Box 219341
Kansas City, MO 64121-9341
OVERNIGHT MAIL
MFS Service Center, Inc.
Suite 219341
430 W 7th Street
Kansas City, MO 64105-1407
Annual Report
April 30, 2024
MFS® Total Return
Bond Fund
MFS® Total Return
Bond Fund
| 1 |
| 3 |
| 5 |
| 8 |
| 10 |
| 29 |
| 31 |
| 32 |
| 33 |
| 42 |
| 57 |
| 59 |
| 63 |
| 64 |
| 64 |
| 64 |
| 64 |
| 64 |
| 65 |
The report is prepared for the general information of shareholders. It is authorized for distribution to prospective investors only when preceded or accompanied by a current prospectus.
NOT FDIC INSURED • MAY LOSE VALUE • NO BANK GUARANTEE
Portfolio structure at value (v)
Portfolio structure reflecting equivalent exposure of derivative positions (i)
Fixed income sectors (i)
| U.S. Treasury Securities | 35.3% |
| Investment Grade Corporates | 29.6% |
| Mortgage-Backed Securities | 21.1% |
| Collateralized Loan Obligations | 9.4% |
| Commercial Mortgage-Backed Securities | 6.2% |
| High Yield Corporates | 5.2% |
| Asset-Backed Securities | 1.7% |
| Municipal Bonds | 0.8% |
| Emerging Markets Bonds | 0.4% |
| Residential Mortgage-Backed Securities | 0.3% |
| U.S. Government Agencies | 0.2% |
| Non-U.S. Government Bonds | 0.1% |
Composition including fixed income credit quality (a)(i)
| AAA | 8.1% |
| AA | 5.3% |
| A | 11.0% |
| BBB | 23.3% |
| BB | 4.3% |
| B | 1.6% |
| CCC | 0.1% |
| CC (o) | 0.0% |
| C (o) | 0.0% |
| U.S. Government | 25.0% |
| Federal Agencies | 21.3% |
| Not Rated | 10.3% |
| Cash & Cash Equivalents (o) | (0.0)% |
| Other (q) | (10.3)% |
Portfolio facts
| Average Duration (d) | 6.1 |
| Average Effective Maturity (m) | 7.6 yrs. |
Portfolio Composition - continued
| (a) | For all securities other than those specifically described below, ratings are assigned to underlying securities utilizing ratings from Moody’s, Fitch, and Standard & Poor’s rating agencies and applying the following hierarchy: If all three agencies provide a rating, the middle rating (after dropping the highest and lowest ratings) is assigned; if two of the three agencies rate a security, the lower of the two is assigned. If none of the 3 rating agencies above assign a rating, but the security is rated by DBRS Morningstar, then the DBRS Morningstar rating is assigned. If none of the 4 rating agencies listed above rate the security, but the security is rated by the Kroll Bond Rating Agency (KBRA), then the KBRA rating is assigned. Ratings are shown in the S&P and Fitch scale (e.g., AAA). Securities rated BBB or higher are considered investment grade. All ratings are subject to change. U.S. Government includes securities issued by the U.S. Department of the Treasury. Federal Agencies includes rated and unrated U.S. Agency fixed-income securities, U.S. Agency mortgage-backed securities, and collateralized mortgage obligations of U.S. Agency mortgage-backed securities. |
Not Rated includes fixed income securities and fixed income derivatives that have not been rated by any rating agency. The fund may or may not have held all of these instruments on this date. The fund is not rated by these agencies.
| (d) | Duration is a measure of how much a bond’s price is likely to fluctuate with general changes in interest rates, e.g., if rates rise 1.00%, a bond with a 5-year duration is likely to lose about 5.00% of its value due to the interest rate move. The Average Duration calculation reflects the impact of the equivalent exposure of derivative positions, if any. |
| (i) | For purposes of this presentation, the components include the value of securities, and reflect the impact of the equivalent exposure of derivative positions, if any. These amounts may be negative from time to time. Equivalent exposure is a calculated amount that translates the derivative position into a reasonable approximation of the amount of the underlying asset that the portfolio would have to hold at a given point in time to have the same price sensitivity that results from the portfolio’s ownership of the derivative contract. When dealing with derivatives, equivalent exposure is a more representative measure of the potential impact of a position on portfolio performance than value. The bond component will include any accrued interest amounts. |
| (m) | In determining each instrument’s effective maturity for purposes of calculating the fund’s dollar-weighted average effective maturity, MFS uses the instrument’s stated maturity or, if applicable, an earlier date on which MFS believes it is probable that a maturity-shortening feature (such as a put, pre-refunding or prepayment) will cause the instrument to be repaid. Such an earlier date can be substantially shorter than the instrument’s stated maturity. |
| (q) | For purposes of this presentation, Other includes equivalent exposure from currency derivatives and/or any offsets to derivative positions and may be negative. |
| (v) | For purposes of this presentation, market value of fixed income and/or equity derivatives, if any, is included in Cash & Cash Equivalents. |
Where the fund holds convertible bonds, they are treated as part of the equity portion of the portfolio.
Cash & Cash Equivalents includes any cash, investments in money market funds, short-term securities, and other assets less liabilities. Please see the Statement of Assets and Liabilities for additional information related to the fund’s cash position and other assets and liabilities.
From time to time Cash & Cash Equivalents may be negative due to the timing of cash receipts and disbursements.
Percentages are based on net assets as of April 30, 2024.
The portfolio is actively managed and current holdings may be different.
Management Review
Summary of Results
For the twelve months ended April 30, 2024, Class A shares of the MFS Total Return Bond Fund (fund) provided a total return of 0.09%, at net asset value. This compares with a return of -1.47% for the fund’s benchmark, the Bloomberg U.S. Aggregate Bond Index.
Market Environment
In response to the strongest inflationary period in four decades, global central banks tightened monetary policy significantly during the reporting period, helping reduce price pressures, although more work is needed before inflation returns to target. Geopolitical strains remained high amid ongoing conflicts in Ukraine and in the Middle East, while relations between China and the US remained tense. The US sought to restrict the flow of advanced technologies to China and China looked to use its industrial overcapacity to increase exports to developed markets to bolster its slow-growing domestic economy. The conflict in the Middle East caused trade flow disruptions between Asia and Europe as shipping traffic was routed away from the Red Sea.
Although inflation has yet to reach central banks’ targets, policymakers have indicated their desire to begin cutting rates in the months ahead, although stickier-than-expected inflation could delay cuts in the US. The prospects for easier monetary policy along with resilient global economic growth have been supportive factors for risky assets, such as equities and high-yield bonds. Long-term interest rates moderated during the latter half of the reporting period, although rising government debt levels remained a concern over the medium term. Advancements in artificial intelligence and the adoption of novel weight-loss drugs were two areas of focus for investors during the period.
Factors Affecting Performance
Relative to the Bloomberg U.S. Aggregate Bond Index, the fund’s exposure to the collateralized mortgage obligation (CMO) sector, for which the benchmark has no exposure, and an underweight exposure to the treasury sector contributed to returns. In addition, the fund’s bond selection and overweight exposure to both the industrials and financial institutions sectors also supported relative results. From a quality perspective, the fund’s exposure to “BB” rated(r) bonds, for which the benchmark has no exposure, and bond selection and an overweight exposure to “BBB” rated securities, benefited relative results. Additionally, an underweight exposure and bond selection within “A” rated securities contributed to relative results. The fund's yield curve(y) positioning also strengthened relative performance. Conversely, bond selection in the mortgage-backed security agency fixed rate sector and in “AA” rated bonds detracted from relative performance.
Respectfully,
Portfolio Manager(s)
Alexander Mackey and Joshua Marston
| (r) | Securities rated “BBB”, “Baa”, or higher are considered investment grade; securities rated “BB”, “Ba”, or below are considered non-investment grade. Ratings are assigned to underlying securities utilizing ratings from Moody's, Fitch, and Standard & Poor's and applying |
Management Review - continued
the following hierarchy: If all three agencies provide a rating, the middle rating (after dropping the highest and lowest ratings) is assigned; if two of the three agencies rate a security, the lower of the two is assigned. If none of the 3 rating agencies above assign a rating, but the security is rated by DBRS Morningstar, then the DBRS Morningstar rating is assigned. If none of the 4 rating agencies listed above rate the security, but the security is rated by the Kroll Bond Rating Agency (KBRA), then the KBRA rating is assigned. Ratings are shown in the S&P and Fitch scale (e.g., AAA). For securities that are not rated by any of the rating agencies, the security is considered Not Rated.
| (y) | A yield curve graphically depicts the yields of different maturity bonds of the same credit quality and type; a normal yield curve is upward sloping, with short-term rates lower than long-term rates. |
The views expressed in this report are those of the portfolio manager(s) only through the end of the period of the report as stated on the cover and do not necessarily reflect the views of MFS or any other person in the MFS organization. These views are subject to change at any time based on market or other conditions, and MFS disclaims any responsibility to update such views. These views may not be relied upon as investment advice or an indication of trading intent on behalf of any MFS portfolio. References to specific securities are not recommendations of such securities, and may not be representative of any MFS portfolio’s current or future investments.
Performance Summary THROUGH 4/30/24
The following chart illustrates a representative class of the fund’s historical performance in comparison to its benchmark(s). Performance results include the deduction of the maximum applicable sales charge and reflect the percentage change in net asset value, including reinvestment of dividends and capital gains distributions. The performance of other share classes will be greater than or less than that of the class depicted below. Benchmarks are unmanaged and may not be invested in directly. Benchmark returns do not reflect sales charges, commissions or expenses. (See Notes to Performance Summary.)
Performance data shown represents past performance and is no guarantee of future results. Investment return and principal value fluctuate so your shares, when sold, may be worth more or less than the original cost; current performance may be lower or higher than quoted. The performance shown does not reflect the deduction of taxes, if any, that a shareholder would pay on fund distributions or the redemption of fund shares.
Growth of a Hypothetical $10,000 Investment
Performance Summary - continued
Total Returns through 4/30/24
Average annual without sales charge
| Share Class | Class Inception Date | 1-yr | 5-yr | 10-yr |
| A | 1/04/1999 | 0.09% | 0.36% | 1.39% |
| B | 12/29/2000 | (0.66)% | (0.39)% | 0.65% |
| C | 12/29/2000 | (0.76)% | (0.51)% | 0.54% |
| I | 1/04/1999 | 0.24% | 0.51% | 1.55% |
| R1 | 4/01/2005 | (0.65)% | (0.49)% | 0.55% |
| R2 | 10/31/2003 | (0.27)% | 0.01% | 1.05% |
| R3 | 4/01/2005 | (0.02)% | 0.26% | 1.30% |
| R4 | 4/01/2005 | 0.24% | 0.49% | 1.55% |
| R6 | 5/01/2006 | 0.33% | 0.61% | 1.65% |
Comparative benchmark(s)
| Bloomberg U.S. Aggregate Bond Index (f) | (1.47)% | (0.16)% | 1.20% |
Average annual with sales charge
| | | | |
A
With Initial Sales Charge (4.25%) | (4.17)% | (0.51)% | 0.95% |
B
With CDSC (Declining over six years from 4% to 0%) (v) | (4.50)% | (0.74)% | 0.65% |
C
With CDSC (1% for 12 months) (v) | (1.72)% | (0.51)% | 0.54% |
CDSC – Contingent Deferred Sales Charge.
Class I, R1, R2, R3, R4, and R6 shares do not have a sales charge.
| (f) | Source: FactSet Research Systems Inc. |
| (v) | Assuming redemption at the end of the applicable period. |
Benchmark Definition(s)
Bloomberg U.S. Aggregate Bond Index(a) – a market capitalization-weighted index that measures the performance of the U.S. investment-grade, fixed rate bond market, with index components for government and corporate securities, mortgage pass-through securities, and asset-backed securities with at least one year to final maturity.
It is not possible to invest directly in an index.
| (a) | Source: Bloomberg Index Services Limited. BLOOMBERG® is a trademark and service mark of Bloomberg Finance L.P. and its affiliates (collectively “Bloomberg”). Bloomberg or Bloomberg's licensors own all proprietary rights in the Bloomberg Indices. Bloomberg neither approves or endorses this material, or guarantees the accuracy or completeness of any information herein, or makes any warranty, express or implied, as to the results to be obtained therefrom and, to the maximum extent allowed by law, neither shall have any liability or responsibility for injury or damages arising in connection therewith. |
Notes to Performance Summary
Average annual total return represents the average annual change in value for each share class for the periods presented.
Performance Summary - continued
Performance results reflect any applicable expense subsidies and waivers in effect during the periods shown. Without such subsidies and waivers the fund's performance results would be less favorable. Please see the prospectus and financial statements for complete details.
Performance results do not include adjustments made for financial reporting purposes in accordance with U.S. generally accepted accounting principles and may differ from amounts reported in the financial highlights.
From time to time the fund may receive proceeds from litigation settlements, without which performance would be lower.
Expense Table
Fund expenses borne by the shareholders during the period,
November 1, 2023 through April 30, 2024
As a shareholder of the fund, you incur two types of costs: (1) transaction costs, including sales charges (loads) on certain purchase or redemption payments, and (2) ongoing costs, including management fees; distribution and service (12b-1) fees; and other fund expenses. This example is intended to help you understand your ongoing costs (in dollars) of investing in the fund and to compare these costs with the ongoing costs of investing in other mutual funds.
The example is based on an investment of $1,000 invested at the beginning of the period and held for the entire period November 1, 2023 through April 30, 2024.
Actual Expenses
The first line for each share class in the following table provides information about actual account values and actual expenses. You may use the information in this line, together with the amount you invested, to estimate the expenses that you paid over the period. Simply divide your account value by $1,000 (for example, an $8,600 account value divided by $1,000 = 8.6), then multiply the result by the number in the first line under the heading entitled “Expenses Paid During Period” to estimate the expenses you paid on your account during this period.
Hypothetical Example for Comparison Purposes
The second line for each share class in the following table provides information about hypothetical account values and hypothetical expenses based on the fund’s actual expense ratio and an assumed rate of return of 5% per year before expenses, which is not the fund’s actual return. The hypothetical account values and expenses may not be used to estimate the actual ending account balance or expenses you paid for the period. You may use this information to compare the ongoing costs of investing in the fund and other funds. To do so, compare this 5% hypothetical example with the 5% hypothetical examples that appear in the shareholder reports of the other funds.
Please note that the expenses shown in the table are meant to highlight your ongoing costs only and do not reflect any transactional costs, such as sales charges (loads). Therefore, the second line for each share class in the table is useful in comparing ongoing costs only, and will not help you determine the relative total costs of owning different funds. In addition, if these transactional costs were included, your costs would have been higher.
Expense Table - continued
Share
Class | | Annualized
Expense
Ratio | Beginning
Account Value
11/01/23 | Ending
Account Value
4/30/24 | Expenses
Paid During
Period (p)
11/01/23-4/30/24 |
| A | Actual | 0.60% | $1,000.00 | $1,059.02 | $3.07 |
| Hypothetical (h) | 0.60% | $1,000.00 | $1,021.88 | $3.02 |
| B | Actual | 1.35% | $1,000.00 | $1,055.01 | $6.90 |
| Hypothetical (h) | 1.35% | $1,000.00 | $1,018.15 | $6.77 |
| C | Actual | 1.45% | $1,000.00 | $1,054.52 | $7.41 |
| Hypothetical (h) | 1.45% | $1,000.00 | $1,017.65 | $7.27 |
| I | Actual | 0.45% | $1,000.00 | $1,059.80 | $2.30 |
| Hypothetical (h) | 0.45% | $1,000.00 | $1,022.63 | $2.26 |
| R1 | Actual | 1.45% | $1,000.00 | $1,055.67 | $7.41 |
| Hypothetical (h) | 1.45% | $1,000.00 | $1,017.65 | $7.27 |
| R2 | Actual | 0.95% | $1,000.00 | $1,057.18 | $4.86 |
| Hypothetical (h) | 0.95% | $1,000.00 | $1,020.14 | $4.77 |
| R3 | Actual | 0.70% | $1,000.00 | $1,058.49 | $3.58 |
| Hypothetical (h) | 0.70% | $1,000.00 | $1,021.38 | $3.52 |
| R4 | Actual | 0.45% | $1,000.00 | $1,059.80 | $2.30 |
| Hypothetical (h) | 0.45% | $1,000.00 | $1,022.63 | $2.26 |
| R6 | Actual | 0.35% | $1,000.00 | $1,060.30 | $1.79 |
| Hypothetical (h) | 0.35% | $1,000.00 | $1,023.12 | $1.76 |
| (h) | 5% class return per year before expenses. |
| (p) | “Expenses Paid During Period” are equal to each class’s annualized expense ratio, as shown above, multiplied by the average account value over the period, multiplied by 182/366 (to reflect the one-half year period). Expenses paid do not include any applicable sales charges (loads). If these transaction costs had been included, your costs would have been higher. |
Portfolio of Investments
4/30/24
The Portfolio of Investments is a complete list of all securities owned by your fund. It is categorized by broad-based asset classes.
| Issuer | | | Shares/Par | Value ($) |
| Bonds – 99.2% |
| Aerospace & Defense – 1.3% |
| Boeing Co., 2.196%, 2/04/2026 | | $ | 26,637,000 | $24,846,340 |
| Boeing Co., 5.15%, 5/01/2030 | | | 7,084,000 | 6,699,978 |
| Boeing Co., 6.528%, 5/01/2034 (n)(w) | | | 20,794,000 | 20,943,727 |
| Boeing Co., 5.705%, 5/01/2040 | | | 6,632,000 | 6,021,182 |
| Boeing Co., 5.805%, 5/01/2050 | | | 14,572,000 | 12,895,103 |
| TransDigm, Inc., 4.625%, 1/15/2029 | | | 28,133,000 | 25,769,548 |
| | | | | $97,175,878 |
| Asset-Backed & Securitized – 17.6% |
| ACREC 2021-FL1 Ltd., “C”, FLR, 7.583% ((SOFR - 1mo. + 0.11448%) + 2.15%), 10/16/2036 (n) | | $ | 10,841,500 | $10,504,533 |
| ACREC 2021-FL1 Ltd., “D”, FLR, 8.083% ((SOFR - 1mo. + 0.11448%) + 2.65%), 10/16/2036 (n) | | | 13,074,500 | 12,511,268 |
| ACRES 2021-FL2 Issuer Ltd., “C”, FLR, 8.081% ((SOFR - 1mo. + 0.11448%) + 2.65%), 1/15/2037 (n) | | | 13,618,500 | 13,222,622 |
| Allegro CLO Ltd., 2014-1RA, “A2”, FLR, 7.186% ((SOFR - 3mo. + 0.26161%) + 1.6%), 10/21/2028 (n) | | | 14,107,464 | 14,130,911 |
| AmeriCredit Automibile Receivables Trust, 2024-2, “B”, 6.1%, 12/13/2027 (n) | | | 12,774,000 | 12,762,388 |
| Arbor Realty Trust, Inc., CLO, 2021-FL1, “C”, FLR, 7.435% ((SOFR - 1mo. + 0.11448%) + 2%), 12/15/2035 (n) | | | 4,863,500 | 4,741,504 |
| Arbor Realty Trust, Inc., CLO, 2021-FL1, “D”, FLR, 8.385% ((SOFR - 1mo. + 0.11448%) + 2.95%), 12/15/2035 (n) | | | 3,420,500 | 3,334,099 |
| Arbor Realty Trust, Inc., CLO, 2021-FL2, “B”, FLR, 7.035% ((SOFR - 1mo. + 0.11448%) + 1.6%), 5/15/2036 (n) | | | 4,735,000 | 4,673,810 |
| Arbor Realty Trust, Inc., CLO, 2021-FL3, “C”, FLR, 7.285% ((SOFR - 1mo. + 0.11448%) + 1.85%), 8/15/2034 (n) | | | 9,870,000 | 9,493,104 |
| Arbor Realty Trust, Inc., CLO, 2021-FL3, “D”, FLR, 7.635% ((SOFR - 1mo. + 0.11448%) + 2.2%), 8/15/2034 (n) | | | 4,110,000 | 3,887,148 |
| Arbor Realty Trust, Inc., CLO, 2021-FL4, “C”, FLR, 7.735% ((SOFR - 1mo. + 0.11448%) + 2.3%), 11/15/2036 (n) | | | 14,892,500 | 14,496,233 |
| Arbor Realty Trust, Inc., CLO, 2022-FL1, “D”, FLR, 8.33% (SOFR - 30 day + 3%), 1/15/2037 (n) | | | 40,620,500 | 38,328,639 |
| AREIT 2019-CRE3 Trust, “B”, FLR, 6.984% ((SOFR - 1mo. + 0.11448%) + 1.55%), 9/14/2036 (n) | | | 6,677,710 | 6,455,549 |
| AREIT 2019-CRE3 Trust, “C”, FLR, 7.333% (SOFR - 1mo. + 2.014%), 9/14/2036 (n) | | | 6,751,000 | 6,409,426 |
| AREIT 2019-CRE3 Trust, “D”, FLR, 8.084% ((SOFR - 1mo. + 0.11448%) + 2.65%), 9/14/2036 (n) | | | 6,243,500 | 5,809,427 |
Portfolio of Investments – continued
| Issuer | | | Shares/Par | Value ($) |
| Bonds – continued |
| Asset-Backed & Securitized – continued |
| AREIT 2022-CRE6 Trust, “B”, FLR, 7.18% (SOFR - 30 day + 1.85%), 1/20/2037 (n) | | $ | 4,924,000 | $4,816,223 |
| AREIT 2022-CRE6 Trust, “C”, FLR, 7.48% (SOFR - 30 day + 2.15%), 1/20/2037 (n) | | | 10,134,500 | 9,709,672 |
| AREIT 2022-CRE6 Trust, “D”, FLR, 8.18% (SOFR - 30 day + 2.85%), 1/20/2037 (n) | | | 4,313,500 | 4,085,415 |
| ARI Fleet Lease Trust, 2023-B, “A2”, 6.05%, 7/15/2032 (n) | | | 4,276,315 | 4,288,720 |
| Bayview Commercial Asset Trust, 0%, 12/25/2036 (i)(n) | | | 1,513,591 | 151 |
| Bayview Commercial Asset Trust, FLR, 5.896% ((SOFR - 1mo. + 0.11448%) + 0.4658%), 8/25/2035 (n) | | | 82,132 | 78,386 |
| Bayview Financial Revolving Mortgage Loan Trust, FLR, 7.033% ((SOFR - 1mo. + 0.11448%) + 1.6%), 12/28/2040 (n) | | | 371,752 | 564,430 |
| BBCMS Mortgage Trust, 2019-C5, “A4”, 3.063%, 11/15/2052 | | | 9,055,000 | 7,952,150 |
| BBCMS Mortgage Trust, 2022-C18, “AS”, 6.348%, 12/15/2055 | | | 10,215,909 | 10,397,416 |
| BDS 2021-FL7 Ltd., “B”, FLR, 6.933% ((SOFR - 1mo. + 0.11448%) + 1.5%), 6/16/2036 (n) | | | 5,159,500 | 5,064,957 |
| Benchmark 2023-V3 Mortgage Trust, “A3”, 6.363%, 7/15/2056 | | | 4,675,254 | 4,765,704 |
| Brazos Securitization LLC, 5.413%, 9/01/2050 (n) | | | 15,634,000 | 15,532,519 |
| BSPRT 2021-FL6 Issuer Ltd., “B”, FLR, 7.035% ((SOFR - 1mo. + 0.11448%) + 1.6%), 3/15/2036 (n) | | | 15,128,000 | 14,603,361 |
| BSPRT 2021-FL6 Issuer Ltd., “C”, FLR, 7.485% ((SOFR - 1mo. + 0.11448%) + 2.05%), 3/15/2036 (n) | | | 5,310,500 | 5,109,859 |
| BSPRT 2021-FL7 Issuer Ltd., “C”, FLR, 7.735% ((SOFR - 1mo. + 0.11448%) + 2.3%), 12/15/2038 (n) | | | 3,651,000 | 3,570,218 |
| BSPRT 2021-FL7 Issuer Ltd., “D”, FLR, 8.185% ((SOFR - 1mo. + 0.11448%) + 2.75%), 12/15/2038 (n) | | | 4,152,500 | 3,943,700 |
| Business Jet Securities LLC, 2021-1A, “B”, 2.918%, 4/15/2036 (n) | | | 1,198,639 | 1,120,508 |
| Business Jet Securities LLC, 2024-1A, “A”, 6.197%, 5/15/2039 (n) | | | 5,292,000 | 5,285,740 |
| Business Jet Securities LLC, 2024-1A, “B”, 6.924%, 5/15/2039 (n) | | | 738,000 | 736,869 |
| BXMT 2020-FL2 Ltd., “B”, FLR, 6.831% ((SOFR - 1mo. + 0.11448%) + 1.4%), 2/15/2038 (n) | | | 6,104,500 | 5,394,956 |
| BXMT 2021-FL4 Ltd., “AS”, FLR, 6.73% ((SOFR - 1mo. + 0.11448%) + 1.3%), 5/15/2038 (n) | | | 17,470,500 | 16,253,778 |
| BXMT 2021-FL4 Ltd., “B”, FLR, 6.981% ((SOFR - 1mo. + 0.11448%) + 1.55%), 5/15/2038 (n) | | | 38,262,000 | 35,419,765 |
| Cantor Commercial Real Estate, 2019-CF2, “A5”, 2.874%, 11/15/2052 | | | 20,960,656 | 17,720,640 |
| Capital Automotive, 2020-1A, “A4”, REIT, 3.19%, 2/15/2050 (n) | | | 8,073,511 | 7,834,263 |
| C-BASS Mortgage Loan Trust, 2007-CB1, “AF3”, 6.237%, 1/25/2037 (d)(q) | | | 1,089,038 | 316,867 |
Portfolio of Investments – continued
| Issuer | | | Shares/Par | Value ($) |
| Bonds – continued |
| Asset-Backed & Securitized – continued |
| C-BASS Mortgage Loan Trust, 2007-CB3, “A3”, 5.731%, 3/25/2037 (d)(q) | | $ | 1,131,058 | $390,608 |
| CHCP 2021-FL1 Ltd., “B”, FLR, 7.084% ((SOFR - 1mo. + 0.11448%) + 1.65%), 2/15/2038 (n) | | | 6,412,000 | 6,344,743 |
| CHCP 2021-FL1 Ltd., “C”, FLR, 7.534% ((SOFR - 1mo. + 0.11448%) + 2.1%), 2/15/2038 (n) | | | 5,168,000 | 5,075,035 |
| Chesapeake Funding II LLC, 2023-1A, “A1”, 5.65%, 5/15/2035 (n) | | | 4,817,002 | 4,805,640 |
| Citigroup Commercial Mortgage Trust, 2014-GC25, “A4”, 3.635%, 10/10/2047 | | | 4,461,971 | 4,423,723 |
| Citigroup Commercial Mortgage Trust, 2015-GC27, “A5”, 3.137%, 2/10/2048 | | | 11,154,926 | 10,991,268 |
| Citigroup Commercial Mortgage Trust, 2016-P6, “A5”, 3.72%, 12/10/2049 | | | 5,948,000 | 5,524,260 |
| CLNC 2019-FL1 Ltd., “B”, FLR, 7.333% (SOFR - 1mo. + 2.01448%), 8/20/2035 (n) | | | 6,270,000 | 6,110,660 |
| CLNC 2019-FL1 Ltd., “C”, FLR, 7.833% (SOFR - 1mo. + 2.51448%), 8/20/2035 (n) | | | 10,190,000 | 10,001,400 |
| Columbia Cent CLO 28 Ltd., “A-2-R”, 7.278%, 11/07/2030 (n) | | | 28,014,809 | 28,016,742 |
| Columbia Cent CLO 28 Ltd., “B-R”, 7.728%, 11/07/2030 (n) | | | 17,835,205 | 17,749,293 |
| Commercial Mortgage Pass-Through Certificates, 2014-LC19 “A4”, 3.183%, 2/10/2048 | | | 9,743,000 | 9,554,655 |
| Commercial Mortgage Pass-Through Certificates, 2019-BNK17, “AS”, 3.976%, 4/15/2052 | | | 5,000,000 | 4,523,285 |
| Commercial Mortgage Pass-Through Certificates, 2023-BNK46, “A4”, 5.745%, 8/15/2056 | | | 21,951,777 | 22,091,454 |
| Commercial Mortgage Pass-Through Certificates, 2023-BNK46, “AS”, 6.385%, 8/15/2056 | | | 12,725,671 | 13,001,384 |
| Commercial Mortgage Trust, 2015-DC1, “A5”, 3.35%, 2/10/2048 | | | 9,577,577 | 9,391,442 |
| Commercial Mortgage Trust, 2015-LC21, “A4”, 3.708%, 7/10/2048 | | | 9,963,398 | 9,711,827 |
| Commercial Mortgage Trust, 2015-PC1, “A5”, 3.902%, 7/10/2050 | | | 4,781,393 | 4,685,964 |
| Commercial Mortgage Trust, 2017-COR2, “A3”, 3.51%, 9/10/2050 | | | 26,790,000 | 24,580,779 |
| Consumers 2023 Securitization Funding LLC, 5.55%, 3/01/2028 | | | 12,403,000 | 12,358,997 |
| Credit Acceptance Auto Loan Trust, 2021-3A, “C”, 1.63%, 9/16/2030 (n) | | | 2,159,000 | 2,113,161 |
| CSAIL Commercial Mortgage Trust, 2015-C2, “A4”, 3.504%, 6/15/2057 | | | 3,687,246 | 3,595,998 |
| Cutwater 2015-1A Ltd., “BR”, FLR, 7.39% ((SOFR - 3mo. + 0.26161%) + 1.8%), 1/15/2029 (n) | | | 14,552,084 | 14,539,336 |
Portfolio of Investments – continued
| Issuer | | | Shares/Par | Value ($) |
| Bonds – continued |
| Asset-Backed & Securitized – continued |
| DLLST LLC, 2024-1A, “A2”, 5.33%, 1/20/2026 (n) | | $ | 4,204,411 | $4,189,622 |
| Dryden Senior Loan Fund, 2014-36A, “BR3”, CLO, FLR, 7.04% ((SOFR - 3mo. + 0.26161%) + 1.45%), 4/15/2029 (n) | | | 14,975,000 | 14,971,376 |
| Dryden Senior Loan Fund, 2017-49A, “CR”, CLO, FLR, 7.639% ((SOFR - 3mo. + 0.26161%) + 2.05%), 7/18/2030 (n) | | | 16,500,000 | 16,503,878 |
| DT Auto Owner Trust, 2023-1A, “A”, 5.48%, 4/15/2027 (n) | | | 5,411,247 | 5,405,411 |
| Empire District Bondco LLC, 4.943%, 1/01/2033 | | | 8,221,000 | 8,057,039 |
| Enterprise Fleet Financing 2023-3 LLC, “A2”, 6.4%, 3/20/2030 (n) | | | 10,878,000 | 10,985,842 |
| GLGU 2023-1A Ltd., “B”, FLR, 8.325% (SOFR - 3mo. + 3%), 7/20/2035 (n) | | | 16,070,750 | 16,330,405 |
| GLS Auto Select Receivables Trust, 2023-2A, 6.37%, 6/15/2028 (n) | | | 7,459,410 | 7,495,104 |
| GMAC Mortgage Corp. Loan Trust, FGIC, 5.805%, 10/25/2036 | | | 73,822 | 75,091 |
| GS Mortgage Securities Trust, 2015-GC30, “A4”, 3.382%, 5/10/2050 | | | 11,461,699 | 11,126,260 |
| HarbourView CLO VII Ltd., 7RA, “B”, FLR, 7.289% ((SOFR - 3mo. + 0.26161%) + 1.7%), 7/18/2031 (n) | | | 15,920,000 | 15,752,872 |
| IMPAC CMB Trust, FLR, 6.171% ((SOFR - 1mo. + 0.11448%) + 0.74%), 11/25/2034 | | | 11,714 | 11,411 |
| IMPAC CMB Trust, FLR, 6.351% ((SOFR - 1mo. + 0.11448%) + 0.92%), 11/25/2034 | | | 5,857 | 5,737 |
| IMPAC Secured Assets Corp., FLR, 6.131% ((SOFR - 1mo. + 0.11448%) + 0.7%), 5/25/2036 | | | 29,787 | 26,161 |
| JPMBB Commercial Mortgage Securities Trust, 2014-C26, “A4”, 3.494%, 1/15/2048 | | | 13,025,174 | 12,805,652 |
| JPMBB Commercial Mortgage Securities Trust, 2015-C28, “A4”, 3.227%, 10/15/2048 | | | 23,872,958 | 23,260,979 |
| JPMDB Commercial Mortgage Securities Trust, 2017-C7, 3.409%, 10/15/2050 | | | 11,500,000 | 10,563,930 |
| JPMorgan Chase Commercial Mortgage Securities Corp., 5.754%, 7/15/2042 (n) | | | 19,045 | 16,636 |
| KKR Static CLO I Ltd. 2022-1A, “BR”, FLR, 7.325% (SOFR - 3mo. + 2%), 7/20/2031 (n) | | | 24,361,375 | 24,363,494 |
| Kubota Credit Owner Trust, 2023-2A, “A2”, 5.61%, 7/15/2026 (n) | | | 5,114,374 | 5,109,223 |
| LCCM 2021-FL2 Trust, “C”, FLR, 7.585% ((SOFR - 1mo. + 0.11448%) + 2.15%), 12/13/2038 (n) | | | 8,225,000 | 7,775,158 |
| LoanCore 2021-CRE5 Ltd., “AS”, FLR, 7.185% ((SOFR - 1mo. + 0.11448%) + 1.75%), 7/15/2036 (n) | | | 23,249,000 | 22,999,492 |
| LoanCore 2021-CRE5 Ltd., “B”, FLR, 7.435% ((SOFR - 1mo. + 0.11448%) + 2.0%), 7/15/2036 (n) | | | 8,432,000 | 8,233,250 |
Portfolio of Investments – continued
| Issuer | | | Shares/Par | Value ($) |
| Bonds – continued |
| Asset-Backed & Securitized – continued |
| LoanCore 2021-CRE6 Ltd., “B”, FLR, 7.335% ((SOFR - 1mo. + 0.11448%) + 1.9%), 11/15/2038 (n) | | $ | 42,852,000 | $41,644,045 |
| Madison Park Funding Ltd., 2017- 23A, “CR”, FLR, 7.586% ((SOFR - 3mo. + 0.26161%) + 2%), 7/27/2031 (n) | | | 24,271,403 | 24,253,297 |
| Magnetite XXXIX Ltd. 2023-39A, “B”, FLR, 7.474% (SOFR - 3mo. + 2.15%), 10/25/2033 (n) | | | 6,000,000 | 6,001,002 |
| Merrill Lynch Mortgage Investors, Inc., 4.191%, 2/25/2037 (a)(d) | | | 1,763,981 | 212,343 |
| MF1 2020-FL4 Ltd., “AS”, FLR, 7.531% ((SOFR - 1mo. + 0.11448%) + 2.1%), 11/15/2035 (n) | | | 10,615,000 | 10,580,194 |
| MF1 2021-FL5 Ltd., “C”, FLR, 7.13% ((SOFR - 1mo. + 0.11448%) + 1.7%), 7/15/2036 (n) | | | 10,670,500 | 10,494,266 |
| MF1 2022-FL8 Ltd., “C”, FLR, 7.518% (SOFR - 30 day + 2.2%), 2/19/2037 (n) | | | 10,626,099 | 10,242,794 |
| MF1 2022-FL8 Ltd., “D”, FLR, 7.969% (SOFR - 30 day + 2.65%), 2/19/2037 (n) | | | 6,141,972 | 5,822,167 |
| MF1 2023-FL12 LLC, FLR, “A”, 7.385% (SOFR - 1mo. + 2.066%), 10/19/2038 (n) | | | 32,799,000 | 32,859,012 |
| MF1 2024-FL14 LLC, “AS”, FLR, 7.559% (SOFR - 1mo. + 2.24%), 3/19/2039 (n) | | | 18,526,119 | 18,519,894 |
| MidOcean Credit CLO, 2013-2A, “BR”, FLR, 7.236% ((SOFR - 3mo. + 0.26161%) + 1.65%), 1/29/2030 (n) | | | 31,520,702 | 31,495,832 |
| Morgan Stanley Bank of America Merrill Lynch Trust, 2015-C21, “A4”, 3.338%, 3/15/2048 | | | 8,114,737 | 7,908,729 |
| Morgan Stanley Residential Mortgage Loan Trust, 2024-NQM1, “A-1”, 6.152%, 12/25/2068 (n) | | | 17,432,533 | 17,353,220 |
| MSWF Commercial Mortgage Trust 2023-2, “A5”, 6.014%, 12/15/2056 | | | 16,089,120 | 16,599,966 |
| Neuberger Berman CLO Ltd., 2013-15A, “CR2”, FLR, 7.44% ((SOFR - 3mo. + 0.26161%) + 1.85%), 10/15/2029 (n) | | | 5,663,303 | 5,663,048 |
| Neuberger Berman CLO Ltd., 2016-21A, “CR2”, 7.636%, 4/20/2034 (n) | | | 9,973,559 | 9,979,194 |
| Neuberger Berman CLO Ltd., 2017-16SA, “BR”, FLR, 6.99% ((SOFR - 3mo. + 0.26161%) + 1.4%), 4/15/2034 (n) | | | 20,000,000 | 19,980,500 |
| Oaktree CLO 2019-1A Ltd., “BR”, FLR, 7.336% ((SOFR - 3mo. + 0.26161%) + 1.75%), 4/22/2030 (n) | | | 16,780,750 | 16,741,013 |
| Oaktree CLO 2019-1A Ltd., “CR”, FLR, 7.936% ((SOFR - 3mo. + 0.26161%) + 2.35%), 4/22/2030 (n) | | | 22,979,914 | 22,751,356 |
| OneMain Financial Issuance Trust 2022-3A, “A”, 5.94%, 5/15/2034 (n) | | | 15,058,000 | 15,073,050 |
| OSD CLO, 2023-27, Ltd., “B”, FLR, 7.728% (SOFR - 3mo. + 2.4%), 4/16/2035 (n) | | | 3,000,000 | 3,004,989 |
| Ownit Mortgage Loan Asset-Backed Certificates, 5.79%, 10/25/2035 | | | 453,680 | 246,850 |
Portfolio of Investments – continued
| Issuer | | | Shares/Par | Value ($) |
| Bonds – continued |
| Asset-Backed & Securitized – continued |
| Preferred Term Securities XIX Ltd., CDO, FLR, 5.941% ((SOFR - 3mo. + 0.26161%) + 0.35%), 12/22/2035 (n) | | $ | 1,687,885 | $1,595,051 |
| Race Point CLO Ltd., 2013-8A, “AR-2”, FLR, 6.621% ((SOFR - 3mo. + 0.26161%) + 1.04%), 2/20/2030 (n) | | | 8,561,956 | 8,560,363 |
| ReadyCap Commercial Mortgage Trust, 2021-FL7, “C”, FLR, 7.631% ((SOFR - 1mo. + 0.11448%) + 2.2%), 11/25/2036 (z) | | | 5,795,000 | 5,712,156 |
| ReadyCap Commercial Mortgage Trust, 2021-FL7, “D”, FLR, 8.381% ((SOFR - 1mo. + 0.11448%) + 2.95%), 11/25/2036 (z) | | | 6,825,000 | 6,656,143 |
| Residential Funding Mortgage Securities, Inc., FGIC, 3.848%, 12/25/2035 (d)(q) | | | 137,728 | 3,941 |
| Rockford Tower CLO 2020-1A, Ltd., “BR”, 7.425% (SOFR - 3mo. + 2.1%), 1/20/2036 (n) | | | 16,776,809 | 16,842,339 |
| Starwood Commercial Mortgage, 2021-FL2, “C”, FLR, 7.533% ((SOFR - 1mo. + 0.11448)% + 2.1%), 4/18/2038 (n) | | | 11,255,500 | 10,252,329 |
| Starwood Commercial Mortgage, 2022-FL3, “B”, FLR, 7.28% (SOFR - 30 day + 1.95%), 11/15/2038 (n) | | | 6,082,500 | 5,827,444 |
| Starwood Commercial Mortgage, 2022-FL3, “C”, FLR, 7.53% (SOFR - 30 day + 2.2%), 11/15/2038 (n) | | | 11,508,500 | 10,861,269 |
| Store Master Funding LLC, 2014-1A, “A1”, 5.69%, 5/20/2054 (n) | | | 2,212,727 | 2,193,636 |
| Store Master Funding LLC, 2014-1A, “A2”, 5.7%, 5/20/2054 (n) | | | 4,621,957 | 4,594,396 |
| Stratus Static CLO Ltd., 2022-3A, “BR”, FLR, 7.225% (SOFR - 3mo. + 1.9%), 10/20/2031 (n) | | | 4,541,040 | 4,541,989 |
| Thornburg Mortgage Securities Trust, FLR, 6.111% ((SOFR - 1mo. + 0.11448%) + 0.68%), 4/25/2043 | | | 54 | 54 |
| UBS Commercial Mortgage Trust, 2017-C7, “A4”, 3.679%, 12/15/2050 | | | 33,000,000 | 30,461,161 |
| UBS Commercial Mortgage Trust, 2017-C8, “A4”, 3.983%, 2/15/2051 | | | 18,388,578 | 17,115,502 |
| Verus Securitization Trust, 2014-1, “A1”, 5.712%, 1/25/2069 (n) | | | 9,877,920 | 9,763,011 |
| Voya CLO 2012-4A Ltd., “A2R3”, FLR, 7.04% ((SOFR - 3mo. + 0.26161%) + 1.45%), 10/15/2030 (n) | | | 8,202,288 | 8,163,335 |
| Voya CLO 2012-4A Ltd., “BR3”, FLR, 7.54% ((SOFR - 3mo. + 0.26161%) + 1.95%), 10/15/2030 (n) | | | 3,474,736 | 3,467,613 |
| Voya CLO 2012-4A Ltd., “C1R3”, FLR, 8.89% ((SOFR - 3mo. + 0.26161%) + 3.3%), 10/15/2030 (n) | | | 4,942,894 | 4,944,940 |
| Wells Fargo Commercial Mortgage Trust, 2015-C28, “A4”, 3.54%, 5/15/2048 | | | 15,451,790 | 15,058,466 |
| Wells Fargo Commercial Mortgage Trust, 2016-C34, “A4”, 3.096%, 6/15/2049 | | | 7,740,000 | 7,344,994 |
| Wells Fargo Commercial Mortgage Trust, 2016-LC25, “A4”, 3.64%, 12/15/2059 | | | 25,027,917 | 23,711,669 |
Portfolio of Investments – continued
| Issuer | | | Shares/Par | Value ($) |
| Bonds – continued |
| Asset-Backed & Securitized – continued |
| Wells Fargo Commercial Mortgage Trust, 2017-C42, “A5”, 3.589%, 12/15/2050 | | $ | 13,470,000 | $12,175,775 |
| | | | | $1,338,246,942 |
| Automotive – 0.2% |
| Stellantis Finance US, Inc., 2.691%, 9/15/2031 (n) | | $ | 14,723,000 | $12,043,640 |
| Broadcasting – 0.8% |
| Discovery Communications LLC, 4.65%, 5/15/2050 | | $ | 11,068,000 | $8,023,151 |
| WarnerMedia Holdings, Inc., 5.05%, 3/15/2042 | | | 24,492,000 | 19,606,151 |
| WarnerMedia Holdings, Inc., 5.141%, 3/15/2052 | | | 21,194,000 | 16,232,780 |
| WarnerMedia Holdings, Inc., 5.391%, 3/15/2062 | | | 8,483,000 | 6,495,154 |
| WMG Acquisition Corp., 3%, 2/15/2031 (n) | | | 9,294,000 | 7,715,035 |
| | | | | $58,072,271 |
| Brokerage & Asset Managers – 1.0% |
| Charles Schwab Corp., 5.853% to 5/19/2033, FLR (SOFR - 1 day + 2.5%) to 5/19/2034 | | $ | 11,882,000 | $11,831,114 |
| Charles Schwab Corp., 6.136% to 8/24/2033, FLR (SOFR - 1 day + 2.01%) to 8/24/2034 | | | 14,147,000 | 14,344,750 |
| Charles Schwab Corp., 5% to 6/01/2027, FLR (CMT - 5yr. + 3.256%) to 6/01/2170 | | | 26,796,000 | 25,040,757 |
| LPL Holdings, Inc., 6.75%, 11/17/2028 | | | 6,057,000 | 6,225,110 |
| LPL Holdings, Inc., 4%, 3/15/2029 (n) | | | 21,696,000 | 19,673,053 |
| | | | | $77,114,784 |
| Building – 0.6% |
| Standard Industries, Inc., 4.375%, 7/15/2030 (n) | | $ | 25,624,000 | $22,693,957 |
| Standard Industries, Inc., 3.375%, 1/15/2031 (n) | | | 18,025,000 | 14,764,595 |
| Vulcan Materials Co., 3.5%, 6/01/2030 | | | 9,570,000 | 8,596,617 |
| | | | | $46,055,169 |
| Business Services – 1.4% |
| Equinix, Inc., 1.8%, 7/15/2027 | | $ | 9,219,000 | $8,200,104 |
| Equinix, Inc., 2.15%, 7/15/2030 | | | 21,402,000 | 17,442,568 |
| Fiserv, Inc., 3.5%, 7/01/2029 | | | 17,324,000 | 15,780,234 |
| Fiserv, Inc., 5.6%, 3/02/2033 | | | 10,033,000 | 9,940,264 |
| Global Payments, Inc., 2.9%, 5/15/2030 | | | 23,523,000 | 20,048,126 |
| Global Payments, Inc., 2.9%, 11/15/2031 | | | 6,885,000 | 5,655,153 |
| Iron Mountain, Inc., 4.5%, 2/15/2031 (n) | | | 30,950,000 | 27,298,488 |
| | | | | $104,364,937 |
Portfolio of Investments – continued
| Issuer | | | Shares/Par | Value ($) |
| Bonds – continued |
| Cable TV – 1.5% |
| CCO Holdings LLC/CCO Holdings Capital Corp., 4.5%, 8/15/2030 (n) | | $ | 29,387,000 | $23,881,387 |
| Charter Communications Operating LLC/Charter Communications Operating Capital Corp., 6.384%, 10/23/2035 | | | 6,428,000 | 6,073,814 |
| Charter Communications Operating LLC/Charter Communications Operating Capital Corp., 5.25%, 4/01/2053 | | | 35,959,000 | 26,992,751 |
| CSC Holdings LLC, 4.125%, 12/01/2030 (n) | | | 17,470,000 | 11,097,325 |
| CSC Holdings LLC, 4.5%, 11/15/2031 (n) | | | 16,620,000 | 10,546,876 |
| Sirius XM Radio, Inc., 5.5%, 7/01/2029 (n) | | | 8,250,000 | 7,657,963 |
| Sirius XM Radio, Inc., 4.125%, 7/01/2030 (n) | | | 15,640,000 | 13,263,669 |
| Time Warner Cable, Inc., 4.5%, 9/15/2042 | | | 9,503,000 | 6,687,217 |
| Time Warner Entertainment Co. LP, 8.375%, 7/15/2033 | | | 4,688,000 | 5,078,886 |
| | | | | $111,279,888 |
| Computer Software – 0.3% |
| Dell International LLC/EMC Corp., 5.3%, 10/01/2029 | | $ | 24,675,000 | $24,426,661 |
| Computer Software - Systems – 0.3% |
| SS&C Technologies Holdings, Inc., 5.5%, 9/30/2027 (n) | | $ | 24,371,000 | $23,689,053 |
| Conglomerates – 0.9% |
| Regal Rexnord Corp., 6.05%, 4/15/2028 (n) | | $ | 6,853,000 | $6,839,757 |
| Regal Rexnord Corp., 6.3%, 2/15/2030 (n) | | | 24,925,000 | 25,031,578 |
| Regal Rexnord Corp., 6.4%, 4/15/2033 (n) | | | 16,170,000 | 16,301,140 |
| Westinghouse Air Brake Technologies Corp., 4.7%, 9/15/2028 | | | 21,336,000 | 20,535,987 |
| | | | | $68,708,462 |
| Consumer Products – 0.2% |
| Haleon US Capital LLC, 3.625%, 3/24/2032 | | $ | 15,416,000 | $13,539,856 |
| Consumer Services – 0.2% |
| Match Group Holdings II LLC, 3.625%, 10/01/2031 (n) | | $ | 22,959,000 | $18,952,733 |
| Electrical Equipment – 0.2% |
| Arrow Electronics, Inc., 2.95%, 2/15/2032 | | $ | 21,913,000 | $17,868,745 |
| Electronics – 0.3% |
| Broadcom, Inc., 3.137%, 11/15/2035 (n) | | $ | 12,875,000 | $9,991,616 |
| Broadcom, Inc., 4.926%, 5/15/2037 (n) | | | 12,031,000 | 10,986,935 |
| | | | | $20,978,551 |
| Energy - Independent – 0.6% |
| EQT Corp., 3.9%, 10/01/2027 | | $ | 10,583,000 | $9,981,900 |
| EQT Corp., 5%, 1/15/2029 | | | 5,901,000 | 5,694,428 |
| EQT Corp., 3.625%, 5/15/2031 (n) | | | 6,884,000 | 5,954,627 |
| Santos Finance Ltd., 6.875%, 9/19/2033 (n) | | | 14,842,000 | 15,253,880 |
Portfolio of Investments – continued
| Issuer | | | Shares/Par | Value ($) |
| Bonds – continued |
| Energy - Independent – continued |
| Tengizchevroil Finance Co. International Ltd., 3.25%, 8/15/2030 | | $ | 13,596,000 | $10,826,495 |
| | | | | $47,711,330 |
| Energy - Integrated – 0.2% |
| Eni S.p.A., 4.25%, 5/09/2029 (n) | | $ | 13,598,000 | $12,850,253 |
| Financial Institutions – 1.2% |
| AerCap Ireland Capital DAC/AerCap Global Aviation Trust, 6.5%, 7/15/2025 | | $ | 12,700,000 | $12,790,993 |
| AerCap Ireland Capital DAC/AerCap Global Aviation Trust, 3%, 10/29/2028 | | | 10,175,000 | 9,074,895 |
| AerCap Ireland Capital DAC/AerCap Global Aviation Trust, 3.3%, 1/30/2032 | | | 12,067,000 | 10,074,091 |
| Avolon Holdings Funding Ltd., 2.125%, 2/21/2026 (n) | | | 12,112,000 | 11,242,273 |
| Avolon Holdings Funding Ltd., 4.25%, 4/15/2026 (n) | | | 7,451,000 | 7,165,448 |
| Avolon Holdings Funding Ltd., 3.25%, 2/15/2027 (n) | | | 7,098,000 | 6,544,604 |
| Avolon Holdings Funding Ltd., 2.528%, 11/18/2027 (n) | | | 5,071,000 | 4,468,726 |
| Avolon Holdings Funding Ltd., 2.75%, 2/21/2028 (n) | | | 10,959,000 | 9,695,987 |
| Global Aircraft Leasing Co. Ltd., 6.5% (6.5% Cash or 7.25% PIK), 9/15/2024 (n)(p) | | | 19,071,068 | 18,040,697 |
| | | | | $89,097,714 |
| Food & Beverages – 0.4% |
| JBS USA Lux S.A./JBS USA Food Co./JBS USA Finance, Inc., 5.5%, 1/15/2030 | | $ | 20,690,000 | $19,972,025 |
| Post Holdings, Inc., 5.5%, 12/15/2029 (n) | | | 6,770,000 | 6,420,308 |
| Post Holdings, Inc., 4.625%, 4/15/2030 (n) | | | 5,755,000 | 5,197,455 |
| Post Holdings, Inc., 4.5%, 9/15/2031 (n) | | | 1,015,000 | 892,454 |
| | | | | $32,482,242 |
| Gaming & Lodging – 0.3% |
| Marriott International, Inc., 3.5%, 10/15/2032 | | $ | 12,991,000 | $11,046,708 |
| Marriott International, Inc., 2.75%, 10/15/2033 | | | 18,167,000 | 14,311,340 |
| | | | | $25,358,048 |
| Insurance – 0.4% |
| Corebridge Financial, Inc., 3.9%, 4/05/2032 | | $ | 15,987,000 | $13,946,937 |
| Corebridge Financial, Inc., 5.75%, 1/15/2034 | | | 13,944,000 | 13,697,838 |
| Corebridge Financial, Inc., 4.35%, 4/05/2042 | | | 1,846,000 | 1,480,011 |
| Corebridge Financial, Inc., 4.4%, 4/05/2052 | | | 5,568,000 | 4,272,010 |
| | | | | $33,396,796 |
| Insurance - Health – 0.2% |
| Humana, Inc., 5.875%, 3/01/2033 | | $ | 19,625,000 | $19,608,810 |
Portfolio of Investments – continued
| Issuer | | | Shares/Par | Value ($) |
| Bonds – continued |
| Insurance - Property & Casualty – 1.0% |
| Allied World Assurance Co. Holdings Ltd., 4.35%, 10/29/2025 | | $ | 13,217,000 | $12,879,212 |
| Ambac Assurance Corp., 5.1%, 6/07/2172 (n) | | | 13,854 | 19,949 |
| Brown & Brown, Inc., 4.2%, 3/17/2032 | | | 15,616,000 | 13,896,246 |
| Brown & Brown, Inc., 4.95%, 3/17/2052 | | | 5,548,000 | 4,589,907 |
| Fairfax Financial Holdings Ltd., 4.85%, 4/17/2028 | | | 15,409,000 | 14,961,107 |
| Fairfax Financial Holdings Ltd., 3.375%, 3/03/2031 | | | 7,257,000 | 6,201,974 |
| Fairfax Financial Holdings Ltd., 5.625%, 8/16/2032 | | | 16,523,000 | 16,038,266 |
| Liberty Mutual Group, Inc., 3.951%, 10/15/2050 (n) | | | 6,950,000 | 4,945,027 |
| | | | | $73,531,688 |
| International Market Quasi-Sovereign – 0.1% |
| Electricite de France S.A., 6.9%, 5/23/2053 (n) | | $ | 8,776,000 | $9,200,761 |
| Machinery & Tools – 0.3% |
| Ashtead Capital, Inc., 5.55%, 5/30/2033 (n) | | $ | 16,388,000 | $15,691,840 |
| Ashtead Capital, Inc., 5.8%, 4/15/2034 (n) | | | 5,473,000 | 5,326,503 |
| | | | | $21,018,343 |
| Major Banks – 7.8% |
| Bank of America Corp., 3.419% to 12/20/2027, FLR ((SOFR - 3mo. + 0.26161%) + 1.04%) to 12/20/2028 | | $ | 7,070,000 | $6,553,116 |
| Bank of America Corp., 3.97% to 3/05/2028, FLR ((SOFR - 3mo. + 0.26161%) + 1.07%) to 3/05/2029 | | | 8,931,000 | 8,407,792 |
| Bank of America Corp., 2.496% to 2/13/2030, FLR ((SOFR - 3mo. + 0.26161%) + 0.99%) to 2/13/2031 | | | 39,891,000 | 33,571,733 |
| Bank of America Corp., 2.572% to 10/20/2031, FLR (SOFR - 1 day + 1.21%) to 10/20/2032 | | | 45,881,000 | 37,012,804 |
| Bank of America Corp., 5.875% to 3/15/2028, FLR ((SOFR - 3mo. + 0.26161%) + 2.931%) to 9/15/2171 | | | 13,771,000 | 13,207,976 |
| Bank of America Corp., 6.1%, 9/17/2171 | | | 15,392,000 | 15,364,816 |
| Bank of America Corp., 6.5% to 10/23/2024, FLR ((SOFR - 3mo. + 0.26161%) + 4.174%) to 4/23/2172 | | | 4,140,000 | 4,146,015 |
| Barclays PLC, 4.375%, 1/12/2026 | | | 4,820,000 | 4,700,456 |
| Barclays PLC, 4.972% to 5/16/2028, FLR (LIBOR - 3mo. + 1.902%) to 5/16/2029 | | | 7,802,000 | 7,527,571 |
| Barclays PLC, 2.894% to 11/24/2031, FLR (CMT - 1yr. + 1.3%) to 11/24/2032 | | | 16,966,000 | 13,753,437 |
| Capital One Financial Corp., 5.817% to 2/01/2033, FLR (SOFR - 1 day + 2.6%) to 2/01/2034 | | | 11,000,000 | 10,647,938 |
| Capital One Financial Corp., 6.377% to 6/08/2033, FLR (SOFR - 1 day + 2.860%) to 6/08/2034 | | | 17,390,000 | 17,503,345 |
| Capital One Financial Corp., 6.051% to 2/01/2034, FLR (SOFR - 1 day + 2.26%) to 2/01/2035 | | | 16,122,000 | 15,857,233 |
Portfolio of Investments – continued
| Issuer | | | Shares/Par | Value ($) |
| Bonds – continued |
| Major Banks – continued |
| Deutsche Bank AG, 2.311% to 11/16/2026, FLR (SOFR - 1 day + 1.219%) to 11/16/2027 | | $ | 23,182,000 | $21,088,713 |
| Deutsche Bank AG, 6.72% to 1/18/2028, FLR (SOFR - 1 day + 3.18%) to 1/18/2029 | | | 24,629,000 | 25,118,651 |
| Goldman Sachs Group, Inc., 2.6%, 2/07/2030 | | | 15,968,000 | 13,696,177 |
| Goldman Sachs Group, Inc., 2.65% to 10/21/2031, FLR (SOFR - 1 day + 1.264%) to 10/21/2032 | | | 26,935,000 | 21,810,374 |
| HSBC Holdings PLC, 4.7% to 9/09/2031, FLR (CMT - 1yr. + 3.25%) to 9/09/2169 | | | 25,500,000 | 20,802,790 |
| HSBC Holdings PLC, 4% to 9/09/2026, FLR (CMT - 1yr. + 3.222%) to 9/09/2170 | | | 10,111,000 | 9,332,183 |
| JPMorgan Chase & Co., 3.509%, 1/23/2029 | | | 18,395,000 | 17,140,356 |
| JPMorgan Chase & Co., 4.005%, 4/23/2029 | | | 28,117,000 | 26,545,597 |
| JPMorgan Chase & Co., 4.203% to 7/23/2028, FLR ((SOFR - 3mo. + 0.26161%) + 1.26%) to 7/23/2029 | | | 9,246,000 | 8,767,076 |
| JPMorgan Chase & Co., 2.956% to 5/13/2030, FLR (SOFR - 1 day + 2.515%) to 5/13/2031 | | | 7,484,000 | 6,404,735 |
| JPMorgan Chase & Co., 2.545% to 11/08/2031, FLR (SOFR - 1 day + 1.18%) to 11/08/2032 | | | 29,061,000 | 23,577,551 |
| Lloyds Bank PLC, 3.75%, 1/11/2027 | | | 3,975,000 | 3,788,871 |
| Mitsubishi UFJ Financial Group, Inc., 2.048%, 7/17/2030 | | | 31,223,000 | 25,481,323 |
| Morgan Stanley, 3.125%, 7/27/2026 | | | 12,844,000 | 12,208,301 |
| Morgan Stanley, 5.449% to 7/20/2028, FLR (SOFR - 1 day + 1.63%) to 7/20/2029 | | | 5,819,000 | 5,783,412 |
| Morgan Stanley, 2.699% to 1/22/2030, FLR (SOFR - 1 day + 1.143%) to 1/22/2031 | | | 7,037,000 | 6,027,986 |
| Morgan Stanley, 2.511% to 10/20/2031, FLR (SOFR - 1 day + 1.2%) to 10/20/2032 | | | 19,284,000 | 15,517,724 |
| Morgan Stanley, 5.424% to 7/21/2033, FLR (SOFR - 1 day + 1.88%) to 7/21/2034 | | | 13,809,000 | 13,399,399 |
| NatWest Group PLC, 6.016% to 3/02/2033, FLR (CMT - 1yr. + 2.1%) to 3/02/2034 | | | 3,536,000 | 3,537,010 |
| Sumitomo Mitsui Financial Group, Inc., 2.13%, 7/08/2030 | | | 38,002,000 | 31,083,647 |
| UBS Group AG, 4.375% to 2/10/2031, FLR (CMT - 1yr. + 3.313%) to 8/10/2171 (n) | | | 30,010,000 | 23,967,483 |
| UBS Group Funding (Jersey) Ltd., 4.125%, 9/24/2025 (n) | | | 6,610,000 | 6,447,936 |
| UBS Group Funding (Switzerland) AG, 4.253%, 3/23/2028 (n) | | | 10,491,000 | 9,942,664 |
| Wells Fargo & Co., 2.572% to 2/11/2030, FLR ((SOFR - 3mo. + 0.26161%) + 1%) to 2/11/2031 | | | 45,462,000 | 38,467,905 |
| Westpac Banking Corp., 2.894% to 2/04/2025, FLR (CMT - 5yr. + 1.35%) to 2/04/2030 | | | 18,137,000 | 17,656,291 |
| | | | | $595,848,387 |
Portfolio of Investments – continued
| Issuer | | | Shares/Par | Value ($) |
| Bonds – continued |
| Medical & Health Technology & Services – 1.8% |
| Adventist Health System/West, 5.43%, 3/01/2032 | | $ | 21,168,000 | $20,763,579 |
| Alcon Finance Corp., 2.75%, 9/23/2026 (n) | | | 4,432,000 | 4,149,600 |
| Alcon Finance Corp., 3%, 9/23/2029 (n) | | | 7,500,000 | 6,646,144 |
| Alcon Finance Corp., 2.6%, 5/27/2030 (n) | | | 7,998,000 | 6,777,994 |
| Alcon Finance Corp., 5.375%, 12/06/2032 (n) | | | 6,013,000 | 5,887,922 |
| HCA, Inc., 4.125%, 6/15/2029 | | | 10,042,000 | 9,330,801 |
| HCA, Inc., 4.375%, 3/15/2042 | | | 14,385,000 | 11,493,442 |
| ICON Investments Six DAC, 6%, 5/08/2034 (w) | | | 13,573,000 | 13,558,884 |
| Marin General Hospital, 7.242%, 8/01/2045 | | | 10,530,000 | 10,890,449 |
| Northwell Healthcare, Inc., 3.979%, 11/01/2046 | | | 3,110,000 | 2,386,923 |
| Northwell Healthcare, Inc., 4.26%, 11/01/2047 | | | 9,132,000 | 7,139,371 |
| ProMedica Toledo Hospital, “B”, 5.325%, 11/15/2028 | | | 23,983,000 | 22,464,636 |
| ProMedica Toledo Hospital, “B”, AGM, 5.75%, 11/15/2038 | | | 9,026,000 | 8,932,503 |
| Tower Health, 4.451%, 2/01/2050 | | | 22,087,000 | 10,949,056 |
| | | | | $141,371,304 |
| Metals & Mining – 1.2% |
| Anglo American Capital PLC, 2.25%, 3/17/2028 (n) | | $ | 10,712,000 | $9,446,443 |
| Anglo American Capital PLC, 3.875%, 3/16/2029 (n) | | | 16,098,000 | 14,868,077 |
| Anglo American Capital PLC, 2.875%, 3/17/2031 (n) | | | 12,521,000 | 10,505,657 |
| Anglo American Capital PLC, 4.75%, 3/16/2052 (n) | | | 20,205,000 | 16,598,753 |
| FMG Resources Ltd., 4.375%, 4/01/2031 (n) | | | 17,908,000 | 15,766,977 |
| Glencore Funding LLC, 2.85%, 4/27/2031 (n) | | | 17,296,000 | 14,340,336 |
| Novelis Corp., 3.875%, 8/15/2031 (n) | | | 12,131,000 | 10,272,702 |
| | | | | $91,798,945 |
| Midstream – 2.5% |
| Cheniere Corpus Christi Holdings LLC, 2.742%, 12/31/2039 | | $ | 8,291,000 | $6,570,371 |
| Cheniere Energy Partners LP, 4.5%, 10/01/2029 | | | 13,412,000 | 12,548,829 |
| Enbridge, Inc., 4.25%, 12/01/2026 | | | 9,961,000 | 9,655,558 |
| Enbridge, Inc., 5.7%, 3/08/2033 | | | 8,233,000 | 8,138,550 |
| Energy Transfer LP, 5.55%, 2/15/2028 | | | 5,763,000 | 5,757,035 |
| Energy Transfer LP, 5.75%, 2/15/2033 | | | 17,623,000 | 17,482,139 |
| Kinder Morgan (Delaware), Inc., 7.75%, 1/15/2032 | | | 7,347,000 | 8,134,425 |
| Kinder Morgan Energy Partners LP, 6.375%, 3/01/2041 | | | 6,112,000 | 6,058,499 |
| Kinder Morgan Energy Partners LP, 5.4%, 9/01/2044 | | | 7,661,000 | 6,858,515 |
| MPLX LP, 4.95%, 3/14/2052 | | | 27,389,000 | 22,891,794 |
| Plains All American Pipeline LP, 3.55%, 12/15/2029 | | | 33,187,000 | 29,852,501 |
| Sabine Pass Liquefaction LLC, 4.2%, 3/15/2028 | | | 5,255,000 | 5,007,941 |
| Sabine Pass Liquefaction LLC, 4.5%, 5/15/2030 | | | 5,465,000 | 5,130,882 |
| Targa Resources Corp., 4.2%, 2/01/2033 | | | 4,099,000 | 3,618,133 |
| Targa Resources Corp., 6.125%, 3/15/2033 | | | 18,189,000 | 18,415,396 |
| Targa Resources Corp., 4.95%, 4/15/2052 | | | 6,758,000 | 5,626,781 |
Portfolio of Investments – continued
| Issuer | | | Shares/Par | Value ($) |
| Bonds – continued |
| Midstream – continued |
| Venture Global Calcasieu Pass LLC, 6.25%, 1/15/2030 (n) | | $ | 21,420,000 | $21,178,331 |
| | | | | $192,925,680 |
| Mortgage-Backed – 21.1% | |
| Fannie Mae, 5.25%, 8/01/2024 | | $ | 754,152 | $750,128 |
| Fannie Mae, 4.5%, 5/01/2025 - 6/01/2044 | | | 19,447,528 | 18,436,356 |
| Fannie Mae, 2.636%, 12/25/2026 | | | 7,820,989 | 7,310,534 |
| Fannie Mae, 3.95%, 1/01/2027 | | | 565,647 | 547,426 |
| Fannie Mae, 3.5%, 1/01/2028 - 12/01/2047 | | | 27,154,733 | 24,270,998 |
| Fannie Mae, 3%, 11/01/2028 - 11/01/2048 | | | 25,246,451 | 21,707,904 |
| Fannie Mae, 2.5%, 11/01/2031 - 11/01/2046 | | | 2,426,297 | 2,010,066 |
| Fannie Mae, 6.5%, 11/01/2031 - 1/01/2033 | | | 38,596 | 38,915 |
| Fannie Mae, 3%, 2/25/2033 (i) | | | 1,003,057 | 79,296 |
| Fannie Mae, 5.5%, 3/01/2033 - 12/01/2038 | | | 3,774,195 | 3,759,122 |
| Fannie Mae, 5%, 11/01/2033 - 3/01/2042 | | | 4,104,942 | 3,987,435 |
| Fannie Mae, 6%, 5/01/2034 - 10/01/2038 | | | 1,607,227 | 1,623,661 |
| Fannie Mae, 3.25%, 5/25/2040 | | | 290,130 | 265,287 |
| Fannie Mae, 4%, 9/01/2040 - 12/01/2048 | | | 33,451,733 | 30,710,478 |
| Fannie Mae, 2%, 4/25/2046 | | | 612,402 | 540,441 |
| Fannie Mae, 4%, 7/25/2046 (i) | | | 1,160,671 | 213,827 |
| Fannie Mae, UMBS, 2%, 7/01/2036 - 10/01/2052 | | | 190,538,149 | 152,178,600 |
| Fannie Mae, UMBS, 2.5%, 7/01/2036 - 8/01/2052 | | | 239,660,124 | 192,817,012 |
| Fannie Mae, UMBS, 3%, 8/01/2036 - 9/01/2052 | | | 64,253,541 | 53,438,152 |
| Fannie Mae, UMBS, 1.5%, 9/01/2041 - 2/01/2042 | | | 971,263 | 758,284 |
| Fannie Mae, UMBS, 5.5%, 5/01/2044 - 10/01/2053 | | | 32,526,342 | 31,652,811 |
| Fannie Mae, UMBS, 3.5%, 5/01/2049 - 6/01/2053 | | | 11,276,186 | 9,780,438 |
| Fannie Mae, UMBS, 4.5%, 7/01/2052 - 3/01/2054 | | | 13,571,285 | 12,538,503 |
| Fannie Mae, UMBS, 5%, 8/01/2052 - 5/01/2053 | | | 37,499,397 | 35,568,178 |
| Fannie Mae, UMBS, 6%, 2/01/2053 - 11/01/2053 | | | 9,717,858 | 9,706,890 |
| Fannie Mae, UMBS, 6.5%, 8/01/2053 - 1/01/2054 | | | 20,382,373 | 20,545,272 |
| Freddie Mac, 2.67%, 12/25/2024 | | | 4,982,063 | 4,900,467 |
| Freddie Mac, 2.811%, 1/25/2025 | | | 6,230,801 | 6,111,398 |
| Freddie Mac, 4%, 7/01/2025 - 4/01/2044 | | | 3,745,698 | 3,457,949 |
| Freddie Mac, 4.5%, 7/01/2025 - 5/01/2042 | | | 4,643,144 | 4,417,046 |
| Freddie Mac, 3.3%, 10/25/2026 | | | 4,957,000 | 4,728,058 |
| Freddie Mac, 3.117%, 6/25/2027 | | | 17,177,017 | 16,171,060 |
| Freddie Mac, 3%, 6/15/2028 - 2/25/2059 | | | 22,228,902 | 19,064,143 |
| Freddie Mac, 4.06%, 10/25/2028 | | | 5,001,000 | 4,788,316 |
| Freddie Mac, 1.219%, 7/25/2029 (i) | | | 12,619,145 | 578,825 |
| Freddie Mac, 1.266%, 8/25/2029 (i) | | | 22,179,250 | 1,073,560 |
| Freddie Mac, 1.985%, 4/25/2030 (i) | | | 6,415,004 | 586,560 |
| Freddie Mac, 5.5%, 8/01/2033 - 1/01/2038 | | | 845,873 | 842,600 |
| Freddie Mac, 6%, 11/01/2033 - 7/01/2038 | | | 483,663 | 487,460 |
Portfolio of Investments – continued
| Issuer | | | Shares/Par | Value ($) |
| Bonds – continued |
| Mortgage-Backed – continued | |
| Freddie Mac, 5%, 11/01/2035 - 7/01/2041 | | $ | 1,899,509 | $1,848,138 |
| Freddie Mac, 5.5%, 2/15/2036 (i) | | | 210,496 | 37,124 |
| Freddie Mac, 3.5%, 11/01/2037 - 10/25/2058 | | | 17,053,406 | 15,202,617 |
| Freddie Mac, 4.5%, 12/15/2040 (i) | | | 113,921 | 9,832 |
| Freddie Mac, 4%, 8/15/2044 (i) | | | 216,843 | 22,527 |
| Freddie Mac, UMBS, 3%, 11/01/2034 - 3/01/2053 | | | 50,968,474 | 42,394,921 |
| Freddie Mac, UMBS, 2%, 9/01/2036 - 10/01/2052 | | | 199,088,135 | 151,942,783 |
| Freddie Mac, UMBS, 5%, 8/01/2037 - 7/01/2053 | | | 5,031,893 | 4,772,196 |
| Freddie Mac, UMBS, 2.5%, 8/01/2040 - 10/01/2053 | | | 64,563,107 | 51,404,974 |
| Freddie Mac, UMBS, 6.5%, 5/01/2043 - 2/01/2054 | | | 1,252,581 | 1,264,204 |
| Freddie Mac, UMBS, 3.5%, 12/01/2046 - 11/01/2053 | | | 9,144,205 | 7,970,604 |
| Freddie Mac, UMBS, 4.5%, 6/01/2052 - 9/01/2053 | | | 11,841,526 | 10,916,328 |
| Freddie Mac, UMBS, 5.5%, 11/01/2052 - 10/01/2053 | | | 37,907,684 | 36,849,704 |
| Ginnie Mae, 5.5%, 11/15/2032 - 2/20/2053 | | | 11,487,103 | 11,289,770 |
| Ginnie Mae, 4.5%, 10/20/2033 - 12/20/2052 | | | 66,262,560 | 61,984,241 |
| Ginnie Mae, 6%, 2/15/2034 - 1/15/2038 | | | 514,737 | 528,840 |
| Ginnie Mae, 4%, 10/20/2040 - 10/20/2052 | | | 40,384,052 | 36,657,994 |
| Ginnie Mae, 3.5%, 11/15/2040 - 6/20/2052 | | | 44,269,646 | 39,192,492 |
| Ginnie Mae, 3%, 11/20/2044 - 11/20/2052 | | | 52,989,251 | 45,326,958 |
| Ginnie Mae, 2.5%, 8/20/2051 - 4/20/2052 | | | 53,184,477 | 43,640,007 |
| Ginnie Mae, 2%, 1/20/2052 - 9/20/2052 | | | 27,402,752 | 21,587,650 |
| Ginnie Mae, 5%, 12/20/2052 - 5/20/2053 | | | 61,722,734 | 59,107,851 |
| Ginnie Mae, 7%, 12/20/2053 - 2/20/2054 | | | 1,546,686 | 1,575,577 |
| Ginnie Mae, TBA, 2%, 5/15/2054 | | | 31,150,000 | 24,507,791 |
| Ginnie Mae, TBA, 3%, 5/15/2054 | | | 12,150,000 | 10,334,647 |
| Ginnie Mae, TBA, 5.5%, 5/15/2054 | | | 10,000,000 | 9,803,233 |
| Ginnie Mae, TBA, 6%, 6/15/2054 | | | 9,900,000 | 9,878,542 |
| Ginnie Mae, TBA, 6.5%, 6/15/2054 | | | 8,475,000 | 8,559,568 |
| UMBS, TBA, 2%, 5/25/2039 - 5/25/2054 | | | 10,800,000 | 8,929,139 |
| UMBS, TBA, 2.5%, 5/25/2039 - 5/25/2054 | | | 39,325,000 | 32,156,694 |
| UMBS, TBA, 3%, 5/25/2039 - 5/25/2054 | | | 20,150,000 | 17,662,656 |
| UMBS, TBA, 5%, 5/25/2039 | | | 9,550,000 | 9,374,764 |
| UMBS, TBA, 3.5%, 5/25/2054 | | | 59,475,000 | 51,257,860 |
| UMBS, TBA, 4%, 5/25/2054 | | | 11,550,000 | 10,329,452 |
| UMBS, TBA, 6%, 5/25/2054 | | | 42,150,000 | 41,758,141 |
| UMBS, TBA, 6.5%, 5/25/2054 | | | 20,050,000 | 20,201,197 |
| | | | | $1,602,724,472 |
Portfolio of Investments – continued
| Issuer | | | Shares/Par | Value ($) |
| Bonds – continued |
| Municipals – 0.8% |
| Bridgeview, IL, Stadium and Redevelopment Projects, Taxable, AAC, 5.06%, 12/01/2025 | | $ | 1,130,000 | $1,109,466 |
| Bridgeview, IL, Stadium and Redevelopment Projects, Taxable, AAC, 5.14%, 12/01/2036 | | | 24,325,000 | 21,079,938 |
| Escambia County, FL, Health Facilities Authority Rev., Taxable (Baptist Health Care Corp.), “B”, AGM, 3.607%, 8/15/2040 | | | 4,565,000 | 3,463,789 |
| Oklahoma Development Finance Authority, Health System Rev., Taxable (OU Medicine Project), “C”, 5.45%, 8/15/2028 | | | 9,717,000 | 9,010,949 |
| Philadelphia, PA, School District, Taxable, “B”, AGM, 6.615%, 6/01/2030 | | | 6,320,000 | 6,553,715 |
| State of Florida, Taxable, “A”, 2.154%, 7/01/2030 | | | 21,024,000 | 17,438,424 |
| | | | | $58,656,281 |
| Natural Gas - Distribution – 0.6% |
| Boston Gas Co., 3.15%, 8/01/2027 (n) | | $ | 18,261,000 | $16,740,225 |
| KeySpan Gas East Corp., 2.742%, 8/15/2026 (n) | | | 13,855,000 | 12,871,372 |
| NiSource, Inc., 3.6%, 5/01/2030 | | | 16,331,000 | 14,705,941 |
| | | | | $44,317,538 |
| Oils – 0.0% |
| Marathon Petroleum Corp., 5.85%, 12/15/2045 | | $ | 4,349,000 | $4,176,088 |
| Other Banks & Diversified Financials – 1.5% |
| BPCE S.A., 4.5%, 3/15/2025 (n) | | $ | 7,743,000 | $7,623,917 |
| Discover Financial Services, 6.7%, 11/29/2032 | | | 34,164,000 | 35,005,689 |
| Macquarie Bank Ltd. of London, 6.125% to 3/08/2027, FLR (Swap Rate - 5yr. + 4.332%) to 12/31/2165 (n) | | | 23,323,000 | 22,593,422 |
| Macquarie Group Ltd., 4.442% to 6/21/2032, FLR (SOFR - 1 day + 2.405%) to 6/21/2033 (n) | | | 57,968,000 | 52,302,505 |
| | | | | $117,525,533 |
| Pharmaceuticals – 0.2% |
| Organon Finance 1 LLC, 4.125%, 4/30/2028 (n) | | $ | 18,068,000 | $16,455,553 |
| Real Estate - Office – 0.6% |
| Boston Properties LP, REIT, 2.55%, 4/01/2032 | | $ | 29,885,000 | $22,862,519 |
| Boston Properties LP, REIT, 2.45%, 10/01/2033 | | | 27,176,000 | 19,686,732 |
| | | | | $42,549,251 |
| Retailers – 0.3% |
| Penske Automotive Group Co., 3.75%, 6/15/2029 | | $ | 25,284,000 | $22,223,228 |
| Specialty Stores – 0.2% |
| DICK'S Sporting Goods, 3.15%, 1/15/2032 | | $ | 17,293,000 | $14,266,314 |
Portfolio of Investments – continued
| Issuer | | | Shares/Par | Value ($) |
| Bonds – continued |
| Telecommunications - Wireless – 1.2% |
| Rogers Communications, Inc., 4.5%, 3/15/2042 | | $ | 27,147,000 | $22,352,530 |
| Rogers Communications, Inc., 4.55%, 3/15/2052 | | | 27,147,000 | 21,471,357 |
| SBA Communications Corp., 3.125%, 2/01/2029 | | | 17,490,000 | 15,231,308 |
| T-Mobile USA, Inc., 2.55%, 2/15/2031 | | | 28,722,000 | 23,819,646 |
| T-Mobile USA, Inc., 4.375%, 4/15/2040 | | | 2,343,000 | 1,996,055 |
| Vodafone Group PLC, 5.625%, 2/10/2053 | | | 6,121,000 | 5,729,641 |
| | | | | $90,600,537 |
| Tobacco – 1.1% |
| B.A.T. Capital Corp., 4.906%, 4/02/2030 | | $ | 2,485,000 | $2,379,708 |
| B.A.T. Capital Corp., 4.742%, 3/16/2032 | | | 26,499,000 | 24,749,785 |
| B.A.T. International Finance PLC, 4.448%, 3/16/2028 | | | 23,935,000 | 22,894,702 |
| Philip Morris International, Inc., 5.125%, 11/17/2027 | | | 9,958,000 | 9,865,264 |
| Philip Morris International, Inc., 5.625%, 11/17/2029 | | | 4,291,000 | 4,327,251 |
| Philip Morris International, Inc., 5.125%, 2/15/2030 | | | 17,478,000 | 17,181,098 |
| | | | | $81,397,808 |
| Transportation - Services – 0.4% |
| ERAC USA Finance LLC, 7%, 10/15/2037 (n) | | $ | 9,094,000 | $9,949,981 |
| Toll Road Investors Partnership II LP, Capital Appreciation, NPFG, 0%, 2/15/2026 (n) | | | 5,237,000 | 4,536,638 |
| Toll Road Investors Partnership II LP, Capital Appreciation, NPFG, 0%, 2/15/2029 (n) | | | 15,190,000 | 10,283,602 |
| Toll Road Investors Partnership II LP, Capital Appreciation, NPFG, 0%, 2/15/2031 (n) | | | 5,237,000 | 3,009,711 |
| Toll Road Investors Partnership II LP, Capital Appreciation, NPFG, 0%, 2/15/2043 (n) | | | 16,183,841 | 4,749,957 |
| | | | | $32,529,889 |
| U.S. Government Agencies and Equivalents – 0.2% |
| Small Business Administration, 5.18%, 5/01/2024 | | $ | 5,393 | $5,393 |
| Small Business Administration, 5.52%, 6/01/2024 | | | 4,820 | 4,817 |
| Small Business Administration, 5.19%, 7/01/2024 | | | 6,091 | 6,074 |
| Small Business Administration, 4.86%, 10/01/2024 | | | 4,116 | 4,085 |
| Small Business Administration, 4.57%, 6/01/2025 | | | 36,084 | 35,816 |
| Small Business Administration, 4.76%, 9/01/2025 | | | 113,976 | 111,785 |
| Small Business Administration, 5.39%, 12/01/2025 | | | 9,696 | 9,605 |
| Small Business Administration, 5.35%, 2/01/2026 | | | 59,380 | 58,437 |
| Small Business Administration, 3.25%, 11/01/2030 | | | 553,252 | 519,846 |
| Small Business Administration, 2.85%, 9/01/2031 | | | 809,903 | 743,643 |
| Small Business Administration, 2.37%, 8/01/2032 | | | 580,753 | 518,206 |
| Small Business Administration, 2.13%, 1/01/2033 | | | 1,092,011 | 973,928 |
| Small Business Administration, 2.21%, 2/01/2033 | | | 273,650 | 244,372 |
| Small Business Administration, 2.22%, 3/01/2033 | | | 874,651 | 779,464 |
Portfolio of Investments – continued
| Issuer | | | Shares/Par | Value ($) |
| Bonds – continued |
| U.S. Government Agencies and Equivalents – continued |
| Small Business Administration, 2.08%, 4/01/2033 | | $ | 1,719,229 | $1,531,836 |
| Small Business Administration, 2.45%, 6/01/2033 | | | 2,055,975 | 1,844,266 |
| Small Business Administration, 3.15%, 7/01/2033 | | | 2,351,804 | 2,162,376 |
| Small Business Administration, 3.16%, 8/01/2033 | | | 2,515,830 | 2,315,063 |
| Small Business Administration, 3.62%, 9/01/2033 | | | 1,217,509 | 1,137,025 |
| | | | | $13,006,037 |
| U.S. Treasury Obligations – 24.7% |
| U.S. Treasury Bonds, 1.125%, 8/15/2040 | | $ | 27,300,000 | $15,910,781 |
| U.S. Treasury Bonds, 1.375%, 11/15/2040 | | | 74,100,000 | 44,905,757 |
| U.S. Treasury Bonds, 1.75%, 8/15/2041 | | | 67,500,000 | 42,859,864 |
| U.S. Treasury Bonds, 2.375%, 2/15/2042 | | | 61,700,000 | 43,259,894 |
| U.S. Treasury Bonds, 4%, 11/15/2042 | | | 26,100,000 | 23,254,488 |
| U.S. Treasury Bonds, 2.875%, 5/15/2043 | | | 58,777,000 | 43,988,615 |
| U.S. Treasury Bonds, 4.375%, 8/15/2043 | | | 101,800,000 | 95,071,656 |
| U.S. Treasury Bonds, 4.75%, 11/15/2043 | | | 177,950,000 | 174,557,828 |
| U.S. Treasury Bonds, 4.5%, 2/15/2044 | | | 12,600,000 | 11,962,125 |
| U.S. Treasury Bonds, 2.5%, 2/15/2045 (f) | | | 29,323,000 | 20,122,909 |
| U.S. Treasury Bonds, 2.875%, 11/15/2046 | | | 27,653,000 | 20,001,977 |
| U.S. Treasury Bonds, 3%, 2/15/2048 | | | 19,900,000 | 14,582,192 |
| U.S. Treasury Bonds, 2.375%, 11/15/2049 | | | 34,500,000 | 22,001,836 |
| U.S. Treasury Bonds, 1.625%, 11/15/2050 | | | 132,800,000 | 69,398,374 |
| U.S. Treasury Notes, 5%, 8/31/2025 (f) | | | 200,000,000 | 199,484,376 |
| U.S. Treasury Notes, 0.875%, 6/30/2026 | | | 120,000,000 | 109,954,687 |
| U.S. Treasury Notes, 4.375%, 12/15/2026 | | | 216,000,000 | 213,089,063 |
| U.S. Treasury Notes, 4%, 1/15/2027 | | | 108,100,000 | 105,612,856 |
| U.S. Treasury Notes, 4.125%, 2/15/2027 | | | 432,000,000 | 423,360,000 |
| U.S. Treasury Notes, 4.125%, 7/31/2028 | | | 50,200,000 | 48,958,727 |
| U.S. Treasury Notes, 4.875%, 10/31/2028 | | | 90,926,000 | 91,341,560 |
| U.S. Treasury Notes, 3.875%, 8/15/2033 | | | 48,000,000 | 45,060,000 |
| | | | | $1,878,739,565 |
| Utilities - Electric Power – 1.5% |
| American Electric Power Co., Inc., 5.95%, 11/01/2032 | | $ | 13,723,000 | $13,865,989 |
| Calpine Corp., 3.75%, 3/01/2031 (n) | | | 19,925,000 | 17,233,961 |
| Enel Finance International N.V., 3.5%, 4/06/2028 (n) | | | 30,284,000 | 28,054,031 |
| Enel Finance International N.V., 7.5%, 10/14/2032 (n) | | | 3,444,000 | 3,780,638 |
| Jersey Central Power & Light Co., 2.75%, 3/01/2032 (n) | | | 21,954,000 | 17,831,056 |
| Pacific Gas & Electric Co., 3%, 6/15/2028 | | | 11,170,000 | 10,051,041 |
| Pacific Gas & Electric Co., 3.3%, 8/01/2040 | | | 34,169,000 | 23,811,329 |
| | | | | $114,628,045 |
| Total Bonds (Identified Cost, $8,276,642,404) | | $7,552,514,010 |
Portfolio of Investments – continued
| Issuer | | | Shares/Par | Value ($) |
| Investment Companies (h) – 4.2% |
| Money Market Funds – 4.2% | |
| MFS Institutional Money Market Portfolio, 5.38% (v) (Identified Cost, $316,825,641) | | | 316,826,471 | $316,826,471 |
|
|
| Other Assets, Less Liabilities – (3.4)% | | (259,751,667) |
| Net Assets – 100.0% | $7,609,588,814 |
| (a) | Non-income producing security. |
| (d) | In default. |
| (f) | All or a portion of the security has been segregated as collateral for open futures contracts. |
| (h) | An affiliated issuer, which may be considered one in which the fund owns 5% or more of the outstanding voting securities, or a company which is under common control. At period end, the aggregate values of the fund's investments in affiliated issuers and in unaffiliated issuers were $316,826,471 and $7,552,514,010, respectively. |
| (i) | Interest only security for which the fund receives interest on notional principal (Par amount). Par amount shown is the notional principal and does not reflect the cost of the security. |
| (n) | Securities exempt from registration under Rule 144A of the Securities Act of 1933. These securities may be sold in the ordinary course of business in transactions exempt from registration, normally to qualified institutional buyers. At period end, the aggregate value of these securities was $1,800,225,419, representing 23.7% of net assets. |
| (p) | Payment-in-kind (PIK) security for which interest income may be received in additional securities and/or cash. |
| (q) | Interest received was less than stated coupon rate. |
| (v) | Affiliated issuer that is available only to investment companies managed by MFS. The rate quoted for the MFS Institutional Money Market Portfolio is the annualized seven-day yield of the fund at period end. |
| (w) | When-issued security. |
| (z) | Restricted securities are not registered under the Securities Act of 1933 and are subject to legal restrictions on resale. These securities generally may be resold in transactions exempt from registration or to the public if the securities are subsequently registered. Disposal of these securities may involve time-consuming negotiations and prompt sale at an acceptable price may be difficult. The fund holds the following restricted securities: |
| Restricted Securities | Acquisition
Date | Cost | Value |
| ReadyCap Commercial Mortgage Trust, 2021-FL7, “C”, FLR, 7.631% ((SOFR - 1mo. + 0.11448%) + 2.2%), 11/25/2036 | 11/12/21 | $5,795,000 | $5,712,156 |
| ReadyCap Commercial Mortgage Trust, 2021-FL7, “D”, FLR, 8.381% ((SOFR - 1mo. + 0.11448%) + 2.95%), 11/25/2036 | 11/12/21 | 6,825,000 | 6,656,143 |
| Total Restricted Securities | | | $12,368,299 |
| % of Net assets | | | 0.2% |
| The following abbreviations are used in this report and are defined: |
| AAC | Ambac Assurance Corp. |
| AGM | Assured Guaranty Municipal |
| CDO | Collateralized Debt Obligation |
Portfolio of Investments – continued
| CLO | Collateralized Loan Obligation |
| CMT | Constant Maturity Treasury |
| FGIC | Financial Guaranty Insurance Co. |
| FLR | Floating Rate. Interest rate resets periodically based on the parenthetically disclosed reference rate plus a spread (if any). The period-end rate reported may not be the current rate. All reference rates are USD unless otherwise noted. |
| LIBOR | London Interbank Offered Rate |
| NPFG | National Public Finance Guarantee Corp. |
| REIT | Real Estate Investment Trust |
| SOFR | Secured Overnight Financing Rate |
| TBA | To Be Announced |
| UMBS | Uniform Mortgage-Backed Security |
Derivative Contracts at 4/30/24
| Futures Contracts |
| Description | Long/
Short | Currency | Contracts | Notional
Amount | Expiration
Date | Value/Unrealized
Appreciation
(Depreciation) |
| Liability Derivatives |
| Interest Rate Futures | | |
| U.S. Treasury Note 2 yr | Long | USD | 1,031 | $208,938,594 | June – 2024 | $(1,988,865) |
| U.S. Treasury Note 5 yr | Long | USD | 2,094 | 219,330,142 | June – 2024 | (3,866,631) |
| U.S. Treasury Ultra Bond 30 yr | Long | USD | 2,611 | 312,177,687 | June – 2024 | (19,816,937) |
| U.S. Treasury Ultra Note 10 yr | Long | USD | 392 | 43,205,750 | June – 2024 | (1,391,825) |
| | | | | | | $(27,064,258) |
At April 30, 2024, the fund had liquid securities with an aggregate value of $22,402,158 to cover any collateral or margin obligations for certain derivative contracts.
See Notes to Financial Statements
Financial Statements
Statement of Assets and Liabilities
At 4/30/24
This statement represents your fund’s balance sheet, which details the assets and liabilities comprising the total value of the fund.
| Assets | |
| Investments in unaffiliated issuers, at value (identified cost, $8,276,642,404) | $7,552,514,010 |
| Investments in affiliated issuers, at value (identified cost, $316,825,641) | 316,826,471 |
| Restricted cash for MBS/TBA | 1,300,595 |
| Receivables for | |
| TBA sale commitments | 18,559,461 |
| Fund shares sold | 12,340,852 |
| Interest and dividends | 59,744,733 |
| Receivable from investment adviser | 128,272 |
| Other assets | 14,427 |
| Total assets | $7,961,428,821 |
| Liabilities | |
| Payable to custodian | $11,945 |
| Payables for | |
| Distributions | 2,028,109 |
| Net daily variation margin on open futures contracts | 3,963,740 |
| Investments purchased | 21,951,383 |
| When-issued investments purchased | 34,516,406 |
| TBA purchase commitments | 279,210,961 |
| Fund shares reacquired | 8,535,329 |
| Payable to affiliates | |
| Administrative services fee | 3,368 |
| Shareholder servicing costs | 1,272,854 |
| Distribution and service fees | 21,672 |
| Payable for independent Trustees' compensation | 13 |
| Accrued expenses and other liabilities | 324,227 |
| Total liabilities | $351,840,007 |
| Net assets | $7,609,588,814 |
| Net assets consist of | |
| Paid-in capital | $8,939,601,972 |
| Total distributable earnings (loss) | (1,330,013,158) |
| Net assets | $7,609,588,814 |
| Shares of beneficial interest outstanding | 828,846,582 |
Statement of Assets and Liabilities – continued
| | Net assets | Shares
outstanding | Net asset value
per share (a) |
| Class A | $2,274,214,810 | 247,729,367 | $9.18 |
| Class B | 1,886,412 | 205,112 | 9.20 |
| Class C | 29,562,508 | 3,215,416 | 9.19 |
| Class I | 1,568,577,114 | 170,876,581 | 9.18 |
| Class R1 | 1,271,270 | 138,248 | 9.20 |
| Class R2 | 12,556,139 | 1,367,725 | 9.18 |
| Class R3 | 69,405,842 | 7,560,872 | 9.18 |
| Class R4 | 38,952,350 | 4,241,578 | 9.18 |
| Class R6 | 3,613,162,369 | 393,511,683 | 9.18 |
| (a) | Maximum offering price per share was equal to the net asset value per share for all share classes, except for Class A, for which the maximum offering price per share was $9.59 [100 / 95.75 x $9.18]. On sales of $100,000 or more, the maximum offering price of Class A shares is reduced. A contingent deferred sales charge may be imposed on redemptions of Class A, Class B, and Class C shares. Redemption price per share was equal to the net asset value per share for Classes I, R1, R2, R3, R4, and R6. |
See Notes to Financial Statements
Financial Statements
Statement of Operations
Year ended 4/30/24
This statement describes how much your fund earned in investment income and accrued in expenses. It also describes any gains and/or losses generated by fund operations.
| Net investment income (loss) | |
| Income | |
| Interest | $333,382,303 |
| Dividends from affiliated issuers | 9,885,659 |
| Other | 443,096 |
| Total investment income | $343,711,058 |
| Expenses | |
| Management fee | $29,313,809 |
| Distribution and service fees | 6,251,343 |
| Shareholder servicing costs | 3,973,595 |
| Administrative services fee | 617,024 |
| Independent Trustees' compensation | 121,915 |
| Custodian fee | 267,709 |
| Shareholder communications | 384,500 |
| Audit and tax fees | 93,790 |
| Legal fees | 41,405 |
| Miscellaneous | 464,862 |
| Total expenses | $41,529,952 |
| Fees paid indirectly | (23,005) |
| Reduction of expenses by investment adviser and distributor | (7,796,865) |
| Net expenses | $33,710,082 |
| Net investment income (loss) | $310,000,976 |
| Realized and unrealized gain (loss) |
| Realized gain (loss) (identified cost basis) | |
| Unaffiliated issuers | $(130,188,253) |
| Affiliated issuers | 904 |
| Futures contracts | (46,006,030) |
| Net realized gain (loss) | $(176,193,379) |
| Change in unrealized appreciation or depreciation | |
| Unaffiliated issuers | $(70,670,155) |
| Affiliated issuers | (40,347) |
| Futures contracts | (45,967,153) |
| Net unrealized gain (loss) | $(116,677,655) |
| Net realized and unrealized gain (loss) | $(292,871,034) |
| Change in net assets from operations | $17,129,942 |
See Notes to Financial Statements
Financial Statements
Statements of Changes in Net Assets
These statements describe the increases and/or decreases in net assets resulting from operations, any distributions, and any shareholder transactions.
| | Year ended |
| | 4/30/24 | 4/30/23 |
| Change in net assets | | |
| From operations | | |
| Net investment income (loss) | $310,000,976 | $247,514,499 |
| Net realized gain (loss) | (176,193,379) | (257,618,600) |
| Net unrealized gain (loss) | (116,677,655) | (65,899,073) |
| Change in net assets from operations | $17,129,942 | $(76,003,174) |
| Total distributions to shareholders | $(316,262,536) | $(256,707,660) |
| Change in net assets from fund share transactions | $643,704,354 | $(32,328,488) |
| Total change in net assets | $344,571,760 | $(365,039,322) |
| Net assets | | |
| At beginning of period | 7,265,017,054 | 7,630,056,376 |
| At end of period | $7,609,588,814 | $7,265,017,054 |
See Notes to Financial Statements
Financial Statements
Financial Highlights
The financial highlights table is intended to help you understand the fund's financial performance for the past 5 years. Certain information reflects financial results for a single fund share. The total returns in the table represent the rate that an investor would have earned (or lost) on an investment in the fund share class (assuming reinvestment of all distributions) held for the entire period.
| Class A | Year ended |
| | 4/30/24 | 4/30/23 | 4/30/22 | 4/30/21 | 4/30/20 |
| Net asset value, beginning of period | $9.56 | $9.99 | $11.27 | $11.08 | $10.62 |
| Income (loss) from investment operations |
| Net investment income (loss) (d) | $0.38 | $0.32 | $0.20 | $0.24 | $0.30 |
| Net realized and unrealized gain (loss) | (0.37) | (0.42) | (1.13) | 0.27 | 0.47 |
| Total from investment operations | $0.01 | $(0.10) | $(0.93) | $0.51 | $0.77 |
| Less distributions declared to shareholders |
| From net investment income | $(0.39) | $(0.33) | $(0.21) | $(0.28) | $(0.31) |
| From net realized gain | — | — | (0.14) | (0.04) | — |
| Total distributions declared to shareholders | $(0.39) | $(0.33) | $(0.35) | $(0.32) | $(0.31) |
| Net asset value, end of period (x) | $9.18 | $9.56 | $9.99 | $11.27 | $11.08 |
| Total return (%) (r)(s)(t)(x) | 0.09 | (0.95) | (8.46) | 4.55 | 7.30 |
Ratios (%) (to average net assets)
and Supplemental data: |
| Expenses before expense reductions (f) | 0.78 | 0.78 | 0.76 | 0.77 | 0.79 |
| Expenses after expense reductions (f) | 0.60 | 0.60 | 0.60 | 0.62 | 0.67 |
| Net investment income (loss) | 4.07 | 3.30 | 1.84 | 2.07 | 2.69 |
| Portfolio turnover | 76 | 97 | 185 | 188 | 144 |
| Net assets at end of period (000 omitted) | $2,274,215 | $2,262,535 | $2,426,564 | $2,969,273 | $2,458,183 |
| Supplemental Ratios (%): |
| Portfolio turnover (excluding TBA transactions) (e) | 44 | — | — | — | — |
See Notes to Financial Statements
Financial Highlights – continued
| Class B | Year ended |
| | 4/30/24 | 4/30/23 | 4/30/22 | 4/30/21 | 4/30/20 |
| Net asset value, beginning of period | $9.58 | $10.01 | $11.29 | $11.10 | $10.64 |
| Income (loss) from investment operations |
| Net investment income (loss) (d) | $0.31 | $0.24 | $0.12 | $0.15 | $0.22 |
| Net realized and unrealized gain (loss) | (0.37) | (0.41) | (1.13) | 0.27 | 0.47 |
| Total from investment operations | $(0.06) | $(0.17) | $(1.01) | $0.42 | $0.69 |
| Less distributions declared to shareholders |
| From net investment income | $(0.32) | $(0.26) | $(0.13) | $(0.19) | $(0.23) |
| From net realized gain | — | — | (0.14) | (0.04) | — |
| Total distributions declared to shareholders | $(0.32) | $(0.26) | $(0.27) | $(0.23) | $(0.23) |
| Net asset value, end of period (x) | $9.20 | $9.58 | $10.01 | $11.29 | $11.10 |
| Total return (%) (r)(s)(t)(x) | (0.66) | (1.68) | (9.13) | 3.77 | 6.50 |
Ratios (%) (to average net assets)
and Supplemental data: |
| Expenses before expense reductions (f) | 1.53 | 1.53 | 1.51 | 1.52 | 1.54 |
| Expenses after expense reductions (f) | 1.35 | 1.35 | 1.35 | 1.37 | 1.42 |
| Net investment income (loss) | 3.31 | 2.52 | 1.09 | 1.35 | 1.97 |
| Portfolio turnover | 76 | 97 | 185 | 188 | 144 |
| Net assets at end of period (000 omitted) | $1,886 | $3,384 | $4,618 | $6,865 | $9,963 |
| Supplemental Ratios (%): |
| Portfolio turnover (excluding TBA transactions) (e) | 44 | — | — | — | — |
See Notes to Financial Statements
Financial Highlights – continued
| Class C | Year ended |
| | 4/30/24 | 4/30/23 | 4/30/22 | 4/30/21 | 4/30/20 |
| Net asset value, beginning of period | $9.57 | $10.01 | $11.28 | $11.10 | $10.64 |
| Income (loss) from investment operations |
| Net investment income (loss) (d) | $0.30 | $0.23 | $0.11 | $0.14 | $0.20 |
| Net realized and unrealized gain (loss) | (0.37) | (0.42) | (1.12) | 0.26 | 0.48 |
| Total from investment operations | $(0.07) | $(0.19) | $(1.01) | $0.40 | $0.68 |
| Less distributions declared to shareholders |
| From net investment income | $(0.31) | $(0.25) | $(0.12) | $(0.18) | $(0.22) |
| From net realized gain | — | — | (0.14) | (0.04) | — |
| Total distributions declared to shareholders | $(0.31) | $(0.25) | $(0.26) | $(0.22) | $(0.22) |
| Net asset value, end of period (x) | $9.19 | $9.57 | $10.01 | $11.28 | $11.10 |
| Total return (%) (r)(s)(t)(x) | (0.76) | (1.88) | (9.14) | 3.57 | 6.40 |
Ratios (%) (to average net assets)
and Supplemental data: |
| Expenses before expense reductions (f) | 1.53 | 1.53 | 1.51 | 1.52 | 1.55 |
| Expenses after expense reductions (f) | 1.45 | 1.45 | 1.45 | 1.47 | 1.52 |
| Net investment income (loss) | 3.21 | 2.39 | 0.99 | 1.25 | 1.85 |
| Portfolio turnover | 76 | 97 | 185 | 188 | 144 |
| Net assets at end of period (000 omitted) | $29,563 | $36,253 | $56,980 | $77,610 | $99,437 |
| Supplemental Ratios (%): |
| Portfolio turnover (excluding TBA transactions) (e) | 44 | — | — | — | — |
See Notes to Financial Statements
Financial Highlights – continued
| Class I | Year ended |
| | 4/30/24 | 4/30/23 | 4/30/22 | 4/30/21 | 4/30/20 |
| Net asset value, beginning of period | $9.56 | $9.99 | $11.27 | $11.09 | $10.62 |
| Income (loss) from investment operations |
| Net investment income (loss) (d) | $0.39 | $0.33 | $0.22 | $0.25 | $0.31 |
| Net realized and unrealized gain (loss) | (0.37) | (0.42) | (1.13) | 0.26 | 0.49 |
| Total from investment operations | $0.02 | $(0.09) | $(0.91) | $0.51 | $0.80 |
| Less distributions declared to shareholders |
| From net investment income | $(0.40) | $(0.34) | $(0.23) | $(0.29) | $(0.33) |
| From net realized gain | — | — | (0.14) | (0.04) | — |
| Total distributions declared to shareholders | $(0.40) | $(0.34) | $(0.37) | $(0.33) | $(0.33) |
| Net asset value, end of period (x) | $9.18 | $9.56 | $9.99 | $11.27 | $11.09 |
| Total return (%) (r)(s)(t)(x) | 0.24 | (0.80) | (8.32) | 4.61 | 7.56 |
Ratios (%) (to average net assets)
and Supplemental data: |
| Expenses before expense reductions (f) | 0.53 | 0.53 | 0.51 | 0.52 | 0.54 |
| Expenses after expense reductions (f) | 0.45 | 0.45 | 0.45 | 0.47 | 0.52 |
| Net investment income (loss) | 4.21 | 3.43 | 1.99 | 2.22 | 2.84 |
| Portfolio turnover | 76 | 97 | 185 | 188 | 144 |
| Net assets at end of period (000 omitted) | $1,568,577 | $1,361,313 | $1,617,089 | $1,651,206 | $1,513,495 |
| Supplemental Ratios (%): |
| Portfolio turnover (excluding TBA transactions) (e) | 44 | — | — | — | — |
See Notes to Financial Statements
Financial Highlights – continued
| Class R1 | Year ended |
| | 4/30/24 | 4/30/23 | 4/30/22 | 4/30/21 | 4/30/20 |
| Net asset value, beginning of period | $9.57 | $10.01 | $11.28 | $11.10 | $10.64 |
| Income (loss) from investment operations |
| Net investment income (loss) (d) | $0.30 | $0.23 | $0.11 | $0.14 | $0.20 |
| Net realized and unrealized gain (loss) | (0.36) | (0.42) | (1.12) | 0.26 | 0.48 |
| Total from investment operations | $(0.06) | $(0.19) | $(1.01) | $0.40 | $0.68 |
| Less distributions declared to shareholders |
| From net investment income | $(0.31) | $(0.25) | $(0.12) | $(0.18) | $(0.22) |
| From net realized gain | — | — | (0.14) | (0.04) | — |
| Total distributions declared to shareholders | $(0.31) | $(0.25) | $(0.26) | $(0.22) | $(0.22) |
| Net asset value, end of period (x) | $9.20 | $9.57 | $10.01 | $11.28 | $11.10 |
| Total return (%) (r)(s)(t)(x) | (0.65) | (1.88) | (9.14) | 3.57 | 6.40 |
Ratios (%) (to average net assets)
and Supplemental data: |
| Expenses before expense reductions (f) | 1.53 | 1.53 | 1.51 | 1.52 | 1.54 |
| Expenses after expense reductions (f) | 1.45 | 1.45 | 1.45 | 1.47 | 1.52 |
| Net investment income (loss) | 3.22 | 2.45 | 0.99 | 1.22 | 1.87 |
| Portfolio turnover | 76 | 97 | 185 | 188 | 144 |
| Net assets at end of period (000 omitted) | $1,271 | $1,279 | $1,641 | $1,812 | $1,656 |
| Supplemental Ratios (%): |
| Portfolio turnover (excluding TBA transactions) (e) | 44 | — | — | — | — |
See Notes to Financial Statements
Financial Highlights – continued
| Class R2 | Year ended |
| | 4/30/24 | 4/30/23 | 4/30/22 | 4/30/21 | 4/30/20 |
| Net asset value, beginning of period | $9.56 | $9.99 | $11.27 | $11.08 | $10.62 |
| Income (loss) from investment operations |
| Net investment income (loss) (d) | $0.35 | $0.28 | $0.16 | $0.20 | $0.26 |
| Net realized and unrealized gain (loss) | (0.38) | (0.42) | (1.13) | 0.27 | 0.47 |
| Total from investment operations | $(0.03) | $(0.14) | $(0.97) | $0.47 | $0.73 |
| Less distributions declared to shareholders |
| From net investment income | $(0.35) | $(0.29) | $(0.17) | $(0.24) | $(0.27) |
| From net realized gain | — | — | (0.14) | (0.04) | — |
| Total distributions declared to shareholders | $(0.35) | $(0.29) | $(0.31) | $(0.28) | $(0.27) |
| Net asset value, end of period (x) | $9.18 | $9.56 | $9.99 | $11.27 | $11.08 |
| Total return (%) (r)(s)(t)(x) | (0.27) | (1.29) | (8.79) | 4.19 | 6.93 |
Ratios (%) (to average net assets)
and Supplemental data: |
| Expenses before expense reductions (f) | 1.03 | 1.03 | 1.01 | 1.02 | 1.04 |
| Expenses after expense reductions (f) | 0.95 | 0.95 | 0.95 | 0.97 | 1.02 |
| Net investment income (loss) | 3.72 | 2.94 | 1.49 | 1.74 | 2.36 |
| Portfolio turnover | 76 | 97 | 185 | 188 | 144 |
| Net assets at end of period (000 omitted) | $12,556 | $14,215 | $16,565 | $25,398 | $27,083 |
| Supplemental Ratios (%): |
| Portfolio turnover (excluding TBA transactions) (e) | 44 | — | — | — | — |
See Notes to Financial Statements
Financial Highlights – continued
| Class R3 | Year ended |
| | 4/30/24 | 4/30/23 | 4/30/22 | 4/30/21 | 4/30/20 |
| Net asset value, beginning of period | $9.56 | $9.99 | $11.27 | $11.08 | $10.62 |
| Income (loss) from investment operations |
| Net investment income (loss) (d) | $0.37 | $0.31 | $0.19 | $0.23 | $0.29 |
| Net realized and unrealized gain (loss) | (0.37) | (0.42) | (1.13) | 0.26 | 0.47 |
| Total from investment operations | $0.00(w) | $(0.11) | $(0.94) | $0.49 | $0.76 |
| Less distributions declared to shareholders |
| From net investment income | $(0.38) | $(0.32) | $(0.20) | $(0.26) | $(0.30) |
| From net realized gain | — | — | (0.14) | (0.04) | — |
| Total distributions declared to shareholders | $(0.38) | $(0.32) | $(0.34) | $(0.30) | $(0.30) |
| Net asset value, end of period (x) | $9.18 | $9.56 | $9.99 | $11.27 | $11.08 |
| Total return (%) (r)(s)(t)(x) | (0.02) | (1.04) | (8.55) | 4.44 | 7.20 |
Ratios (%) (to average net assets)
and Supplemental data: |
| Expenses before expense reductions (f) | 0.78 | 0.78 | 0.76 | 0.77 | 0.79 |
| Expenses after expense reductions (f) | 0.70 | 0.70 | 0.70 | 0.72 | 0.77 |
| Net investment income (loss) | 3.97 | 3.19 | 1.75 | 1.98 | 2.60 |
| Portfolio turnover | 76 | 97 | 185 | 188 | 144 |
| Net assets at end of period (000 omitted) | $69,406 | $68,213 | $79,389 | $57,652 | $54,433 |
| Supplemental Ratios (%): |
| Portfolio turnover (excluding TBA transactions) (e) | 44 | — | — | — | — |
See Notes to Financial Statements
Financial Highlights – continued
| Class R4 | Year ended |
| | 4/30/24 | 4/30/23 | 4/30/22 | 4/30/21 | 4/30/20 |
| Net asset value, beginning of period | $9.56 | $9.99 | $11.27 | $11.09 | $10.63 |
| Income (loss) from investment operations |
| Net investment income (loss) (d) | $0.39 | $0.33 | $0.22 | $0.26 | $0.31 |
| Net realized and unrealized gain (loss) | (0.37) | (0.42) | (1.13) | 0.25 | 0.48 |
| Total from investment operations | $0.02 | $(0.09) | $(0.91) | $0.51 | $0.79 |
| Less distributions declared to shareholders |
| From net investment income | $(0.40) | $(0.34) | $(0.23) | $(0.29) | $(0.33) |
| From net realized gain | — | — | (0.14) | (0.04) | — |
| Total distributions declared to shareholders | $(0.40) | $(0.34) | $(0.37) | $(0.33) | $(0.33) |
| Net asset value, end of period (x) | $9.18 | $9.56 | $9.99 | $11.27 | $11.09 |
| Total return (%) (r)(s)(t)(x) | 0.24 | (0.80) | (8.32) | 4.61 | 7.46 |
Ratios (%) (to average net assets)
and Supplemental data: |
| Expenses before expense reductions (f) | 0.53 | 0.53 | 0.51 | 0.52 | 0.54 |
| Expenses after expense reductions (f) | 0.45 | 0.45 | 0.45 | 0.47 | 0.52 |
| Net investment income (loss) | 4.22 | 3.45 | 1.98 | 2.23 | 2.85 |
| Portfolio turnover | 76 | 97 | 185 | 188 | 144 |
| Net assets at end of period (000 omitted) | $38,952 | $47,748 | $50,056 | $127,449 | $131,629 |
| Supplemental Ratios (%): |
| Portfolio turnover (excluding TBA transactions) (e) | 44 | — | — | — | — |
See Notes to Financial Statements
Financial Highlights – continued
| Class R6 | Year ended |
| | 4/30/24 | 4/30/23 | 4/30/22 | 4/30/21 | 4/30/20 |
| Net asset value, beginning of period | $9.56 | $9.99 | $11.27 | $11.09 | $10.62 |
| Income (loss) from investment operations |
| Net investment income (loss) (d) | $0.40 | $0.34 | $0.23 | $0.26 | $0.32 |
| Net realized and unrealized gain (loss) | (0.37) | (0.42) | (1.13) | 0.26 | 0.49 |
| Total from investment operations | $0.03 | $(0.08) | $(0.90) | $0.52 | $0.81 |
| Less distributions declared to shareholders |
| From net investment income | $(0.41) | $(0.35) | $(0.24) | $(0.30) | $(0.34) |
| From net realized gain | — | — | (0.14) | (0.04) | — |
| Total distributions declared to shareholders | $(0.41) | $(0.35) | $(0.38) | $(0.34) | $(0.34) |
| Net asset value, end of period (x) | $9.18 | $9.56 | $9.99 | $11.27 | $11.09 |
| Total return (%) (r)(s)(t)(x) | 0.33 | (0.70) | (8.23) | 4.71 | 7.67 |
Ratios (%) (to average net assets)
and Supplemental data: |
| Expenses before expense reductions (f) | 0.43 | 0.43 | 0.42 | 0.43 | 0.45 |
| Expenses after expense reductions (f) | 0.35 | 0.35 | 0.35 | 0.37 | 0.42 |
| Net investment income (loss) | 4.31 | 3.56 | 2.09 | 2.31 | 2.95 |
| Portfolio turnover | 76 | 97 | 185 | 188 | 144 |
| Net assets at end of period (000 omitted) | $3,613,162 | $3,470,078 | $3,359,986 | $3,320,149 | $2,535,200 |
| Supplemental Ratios (%): |
| Portfolio turnover (excluding TBA transactions) (e) | 44 | — | — | — | — |
| (d) | Per share data is based on average shares outstanding. |
| (e) | Beginning with the period ending April 30, 2024, portfolio turnover rates excluding TBA transactions are being added as supplemental data. Refer to Note 2 for more information on TBA transactions and mortgage dollar rolls. |
| (f) | Ratios do not reflect reductions from fees paid indirectly, if applicable. See Note 2 in the Notes to Financial Statements for additional information. |
| (r) | Certain expenses have been reduced without which performance would have been lower. |
| (s) | From time to time the fund may receive proceeds from litigation settlements, without which performance would be lower. |
| (t) | Total returns do not include any applicable sales charges. |
| (w) | Per share amount was less than $0.01. |
| (x) | The net asset values and total returns have been calculated on net assets which include adjustments made in accordance with U.S. generally accepted accounting principles required at period end for financial reporting purposes. |
See Notes to Financial Statements
Notes to Financial Statements
(1) Business and Organization
MFS Total Return Bond Fund (the fund) is a diversified series of MFS Series Trust IX (the trust). The trust is organized as a Massachusetts business trust and is registered under the Investment Company Act of 1940, as amended, as an open-end management investment company.
The fund is an investment company and accordingly follows the investment company accounting and reporting guidance of the Financial Accounting Standards Board (FASB) Accounting Standards Codification Topic 946 Financial Services - Investment Companies.
(2) Significant Accounting Policies
General — The preparation of financial statements in conformity with U.S. generally accepted accounting principles requires management to make estimates and assumptions that affect the reported amounts of assets and liabilities, and disclosure of contingent assets and liabilities at the date of the financial statements and the reported amounts of increases and decreases in net assets from operations during the reporting period. Actual results could differ from those estimates. In the preparation of these financial statements, management has evaluated subsequent events occurring after the date of the fund’s Statement of Assets and Liabilities through the date that the financial statements were issued.
Balance Sheet Offsetting — The fund's accounting policy with respect to balance sheet offsetting is that, absent an event of default by the counterparty or a termination of the agreement, the International Swaps and Derivatives Association (ISDA) Master Agreement, or similar agreement, does not result in an offset of reported amounts of financial assets and financial liabilities in the Statement of Assets and Liabilities across transactions between the fund and the applicable counterparty. The fund's right to setoff may be restricted or prohibited by the bankruptcy or insolvency laws of the particular jurisdiction to which a specific master netting agreement counterparty is subject. Balance sheet offsetting disclosures, to the extent applicable to the fund, have been included in the fund’s Significant Accounting Policies note under the captions for each of the fund’s in-scope financial instruments and transactions.
Investment Valuations — Subject to its oversight, the fund's Board of Trustees has delegated primary responsibility for determining or causing to be determined the value of the fund’s investments to MFS as the fund's adviser, pursuant to the fund’s valuation policy and procedures which have been adopted by the adviser and approved by the Board. In accordance with Rule 2a-5 under the Investment Company Act of 1940, the Board of Trustees designated the adviser as the “valuation designee” of the fund. If the adviser, as valuation designee, determines that reliable market quotations are not readily available for an investment, the investment is valued at fair value as determined in good faith by the adviser in accordance with the adviser’s fair valuation policy and procedures.
Under the fund's valuation policy and procedures, debt instruments and floating rate loans, including restricted debt instruments, are generally valued at an evaluated or composite bid as provided by a third-party pricing service. Short-term instruments with a maturity at issuance of 60 days or less may be valued at amortized cost, which approximates market value. Futures contracts are generally valued at last posted settlement price on their primary exchange as provided by a third-party pricing service.
Notes to Financial Statements - continued
Futures contracts for which there were no trades that day for a particular position are generally valued at the closing bid quotation on their primary exchange as provided by a third-party pricing service. Open-end investment companies are generally valued at net asset value per share. The values of foreign securities and other assets and liabilities expressed in foreign currencies are converted to U.S. dollars using the mean of bid and asked prices for rates provided by a third-party pricing service.
Under the fund’s valuation policy and procedures, market quotations are not considered to be readily available for debt instruments, floating rate loans, and many types of derivatives. These investments are generally valued at fair value based on information from third-party pricing services or otherwise determined by the adviser in accordance with the adviser’s fair valuation policy and procedures. Securities and other assets generally valued on the basis of information from a third-party pricing service may also be valued at a broker/dealer bid quotation. In determining values, third-party pricing services can utilize both transaction data and market information such as yield, quality, coupon rate, maturity, type of issue, trading characteristics, spreads and other market data. An investment may also be valued at fair value if the adviser determines that the investment’s value has been materially affected by events occurring after the close of the exchange or market on which the investment is principally traded (such as foreign exchange or market) and prior to the determination of the fund’s net asset value, or after the halt of trading of a specific security where trading does not resume prior to the close of the exchange or market on which the security is principally traded. The adviser generally relies on third-party pricing services or other information (such as the correlation with price movements of similar securities in the same or other markets; the type, cost and investment characteristics of the security; the business and financial condition of the issuer; and trading and other market data) to assist in determining whether to fair value and at what value to fair value an investment. The value of an investment for purposes of calculating the fund’s net asset value can differ depending on the source and method used to determine value. When fair valuation is used, the value of an investment used to determine the fund’s net asset value may differ from quoted or published prices for the same investment. There can be no assurance that the fund could obtain the fair value assigned to an investment if it were to sell the investment at the same time at which the fund determines its net asset value per share.
Various inputs are used in determining the value of the fund's assets or liabilities. These inputs are categorized into three broad levels. In certain cases, the inputs used to measure fair value may fall into different levels of the fair value hierarchy. In such cases, an investment's level within the fair value hierarchy is based on the lowest level of input that is significant to the fair value measurement. The fund's assessment of the significance of a particular input to the fair value measurement in its entirety requires judgment, and considers factors specific to the investment. Level 1 includes unadjusted quoted prices in active markets for identical assets or liabilities. Level 2 includes other significant observable market-based inputs (including quoted prices for similar securities, interest rates, prepayment speed, and credit risk). Level 3 includes significant unobservable inputs, which may include the adviser's own assumptions in determining the fair value of investments. Other financial instruments are derivative instruments, such as futures contracts. The following is a summary of the levels used as of April 30, 2024 in valuing the fund's assets and liabilities:
Notes to Financial Statements - continued
| Financial Instruments | Level 1 | Level 2 | Level 3 | Total |
| U.S. Treasury Bonds & U.S. Government Agencies & Equivalents | $— | $1,891,745,602 | $— | $1,891,745,602 |
| Non - U.S. Sovereign Debt | — | 9,200,761 | — | 9,200,761 |
| Municipal Bonds | — | 58,656,281 | — | 58,656,281 |
| U.S. Corporate Bonds | — | 1,904,748,647 | — | 1,904,748,647 |
| Residential Mortgage-Backed Securities | — | 1,631,086,403 | — | 1,631,086,403 |
| Commercial Mortgage-Backed Securities | — | 468,356,981 | — | 468,356,981 |
| Asset-Backed Securities (including CDOs) | — | 841,528,030 | — | 841,528,030 |
| Foreign Bonds | — | 747,191,305 | — | 747,191,305 |
| Mutual Funds | 316,826,471 | — | — | 316,826,471 |
| Total | $316,826,471 | $7,552,514,010 | $— | $7,869,340,481 |
| Other Financial Instruments | | | | |
| Futures Contracts – Liabilities | $(27,064,258) | $— | $— | $(27,064,258) |
For further information regarding security characteristics, see the Portfolio of Investments.
Foreign Currency Translation — Purchases and sales of foreign investments, income, and expenses are converted into U.S. dollars based upon currency exchange rates prevailing on the respective dates of such transactions or on the reporting date for foreign denominated receivables and payables. Gains and losses attributable to foreign currency exchange rates on sales of securities are recorded for financial statement purposes as net realized gains and losses on investments. Gains and losses attributable to foreign exchange rate movements on receivables, payables, income and expenses are recorded for financial statement purposes as foreign currency transaction gains and losses. That portion of both realized and unrealized gains and losses on investments that results from fluctuations in foreign currency exchange rates is not separately disclosed.
Derivatives — The fund uses derivatives primarily to increase or decrease exposure to a particular market or segment of the market, or security, to increase or decrease interest rate or currency exposure, or as alternatives to direct investments. Derivatives are used for hedging or non-hedging purposes. While hedging can reduce or eliminate losses, it can also reduce or eliminate gains. When the fund uses derivatives as an investment to increase market exposure, or for hedging purposes, gains and losses from derivative instruments may be substantially greater than the derivative’s original cost.
The derivative instruments used by the fund during the period were futures contracts. Depending on the type of derivative, a fund may exit a derivative position by entering into an offsetting transaction with a counterparty or exchange, negotiating an agreement with the derivative counterparty, or novating the position to a third party. The fund may be unable to promptly close out a futures position in instances where the daily fluctuation in the price for that type of future exceeds the daily limit set by the
Notes to Financial Statements - continued
exchange. The fund's period end derivatives, as presented in the Portfolio of Investments and the associated Derivative Contract tables, generally are indicative of the volume of its derivative activity during the period.
The following table presents, by major type of derivative contract, the fair value, on a gross basis, of the asset and liability components of derivatives held by the fund at April 30, 2024 as reported in the Statement of Assets and Liabilities:
| | | Fair Value (a) |
| Risk | Derivative Contracts | Liability Derivatives |
| Interest Rate | Futures Contracts | $(27,064,258) |
(a) Values presented in this table for futures contracts correspond to the values reported in the Portfolio of Investments. Only the current day net variation margin for futures contracts is reported separately within the Statement of Assets and Liabilities.
The following table presents, by major type of derivative contract, the realized gain (loss) on derivatives held by the fund for the year ended April 30, 2024 as reported in the Statement of Operations:
| Risk | Futures
Contracts |
| Interest Rate | $(46,006,030) |
The following table presents, by major type of derivative contract, the change in unrealized appreciation or depreciation on derivatives held by the fund for the year ended April 30, 2024 as reported in the Statement of Operations:
| Risk | Futures
Contracts |
| Interest Rate | $(45,967,153) |
Derivative counterparty credit risk is managed through formal evaluation of the creditworthiness of all potential counterparties. On certain, but not all, uncleared derivatives, the fund attempts to reduce its exposure to counterparty credit risk whenever possible by entering into an ISDA Master Agreement on a bilateral basis. The ISDA Master Agreement gives each party to the agreement the right to terminate all transactions traded under such agreement if there is a specified deterioration in the credit quality of the other party. Upon an event of default or a termination of the ISDA Master Agreement, the non-defaulting party has the right to close out all transactions traded under such agreement and to net amounts owed under each agreement to one net amount payable by one party to the other. This right to close out and net payments across all transactions traded under the ISDA Master Agreement could result in a reduction of the fund's credit risk to such counterparty equal to any amounts payable by the fund under the applicable transactions, if any.
Collateral and margin requirements differ by type of derivative. For cleared derivatives (e.g., futures contracts, cleared swaps, and exchange-traded options), margin requirements are set by the clearing broker and the clearing house and collateral, in the form of cash or securities, is posted by the fund directly with the clearing broker. Collateral terms are counterparty agreement specific for uncleared derivatives (e.g., forward foreign currency exchange contracts, uncleared swap agreements, and uncleared options) and collateral, in the form of cash and securities, is held in segregated accounts with the fund's custodian in connection with these agreements.
Notes to Financial Statements - continued
For derivatives traded under an ISDA Master Agreement, which contains a credit support annex, the collateral requirements are netted across all transactions traded under such counterparty-specific agreement and an amount is posted from one party to the other to collateralize such obligations. Cash that has been segregated or delivered to cover the fund's collateral or margin obligations under derivative contracts, if any, will be reported separately in the Statement of Assets and Liabilities as restricted cash for uncleared derivatives and/or deposits with brokers for cleared derivatives. Securities pledged as collateral or margin for the same purpose, if any, are noted in the Portfolio of Investments. The fund may be required to make payments of interest on uncovered collateral or margin obligations with the broker. Any such payments are included in “Miscellaneous” expense in the Statement of Operations.
Futures Contracts — The fund entered into futures contracts which may be used to hedge against or obtain broad market exposure, interest rate exposure, currency exposure, or to manage duration. A futures contract represents a commitment for the future purchase or sale of an asset at a specified price on a specified date.
Upon entering into a futures contract, the fund is required to deposit with the broker, either in cash or securities, an initial margin in an amount equal to a specified percentage of the notional amount of the contract. Subsequent payments (variation margin) are made or received by the fund each day, depending on the daily fluctuations in the value of the contract, and are recorded for financial statement purposes as unrealized gain or loss by the fund until the contract is closed or expires at which point the gain or loss on futures contracts is realized.
The fund bears the risk of interest rates, exchange rates or securities prices moving unexpectedly, in which case, the fund may not achieve the anticipated benefits of the futures contracts and may realize a loss. While futures contracts may present less counterparty risk to the fund since the contracts are exchange traded and the exchange’s clearinghouse guarantees payments to the broker, there is still counterparty credit risk due to the insolvency of the broker. The fund’s maximum risk of loss due to counterparty credit risk is equal to the margin posted by the fund to the broker plus any gains or minus any losses on the outstanding futures contracts.
Mortgage-Backed/Asset-Backed Securities — The fund invests a significant portion of its assets in asset-backed and/or mortgage-backed securities. For these securities, the value of the debt instrument also depends on the credit quality and adequacy of the underlying assets or collateral as well as whether there is a security interest in the underlying assets or collateral. Enforcing rights, if any, against the underlying assets or collateral may be difficult. U.S. Government securities not supported as to the payment of principal or interest by the U.S. Treasury, such as those issued by Fannie Mae, Freddie Mac, and the Federal Home Loan Banks, are subject to greater credit risk than are U.S. Government securities supported by the U.S. Treasury, such as those issued by Ginnie Mae.
Indemnifications — Under the fund's organizational documents, its officers and Trustees may be indemnified against certain liabilities and expenses arising out of the performance of their duties to the fund. Additionally, in the normal course of business, the fund enters into agreements with service providers that may contain indemnification clauses. The fund's maximum exposure under these agreements is unknown as this would involve future claims that may be made against the fund that have not yet occurred.
Notes to Financial Statements - continued
Investment Transactions and Income — Interest income is recorded on the accrual basis. All premium and discount is amortized or accreted for financial statement purposes in accordance with U.S. generally accepted accounting principles. Interest payments received in additional securities are recorded on the ex-interest date in an amount equal to the value of the security on such date. Debt obligations may be placed on non-accrual status or set to accrue at a rate of interest less than the contractual coupon when the collection of all or a portion of interest has become doubtful. Interest income for those debt obligations may be further reduced by the write-off of the related interest receivables when deemed uncollectible.
The fund may receive proceeds from litigation settlements. Any proceeds received from litigation involving portfolio holdings are reflected in the Statement of Operations in realized gain/loss if the security has been disposed of by the fund or in unrealized gain/loss if the security is still held by the fund. Any other proceeds from litigation not related to portfolio holdings are reflected as other income in the Statement of Operations.
Investment transactions are recorded on the trade date. In determining the net gain or loss on securities sold, the cost of securities is determined on the identified cost basis.
The fund may purchase or sell mortgage-backed securities on a “To Be Announced” (TBA) basis. A TBA transaction is subject to extended settlement and typically does not designate the actual security to be delivered, but instead includes an approximate principal amount. The price of the TBA security and the date that it will be settled are fixed at the time the transaction is negotiated. The value of the security varies with market fluctuations and no interest accrues to the fund until settlement takes place. TBA purchase and sale commitments are held at carrying amount, which approximates fair value and are categorized as level 2 within the fair value hierarchy and included in TBA purchase and TBA sale commitments in the Statement of Assets and Liabilities, as applicable. Losses may arise as a result of changes in the value of the TBA investment prior to settlement date or due to counterparty non-performance.
The fund may also enter into mortgage dollar rolls, typically TBA dollar rolls, in which the fund sells TBA mortgage-backed securities to financial institutions and simultaneously agrees to repurchase similar (same issuer, type and coupon) securities at a later date at an agreed-upon price. During the period between the sale and repurchase, the fund will not be entitled to receive interest and principal payments on the securities sold. The fund accounts for dollar roll transactions as purchases and sales and realizes gains and losses on these transactions. As such, these transactions may result in an increase to the fund’s portfolio turnover rate. Portfolio turnover rates including and excluding TBA transactions are presented in the Financial Highlights. Dollar roll transactions involve the risk that the market value of the securities that the fund is required to purchase may decline below the agreed upon repurchase price of those securities.
The fund may purchase or sell securities on a when-issued or delayed delivery basis. In these extended settlement transactions, the receipt or delivery of the securities by the fund and related payments occur at a future date, usually beyond the customary settlement period. The price of such security and the date that the security will be settled are generally fixed at the time the transaction is negotiated. The value of the security varies with market fluctuations and for debt securities no interest accrues to the fund until settlement takes place. When the fund sells securities on a when-issued or delayed delivery basis, the fund typically owns or has the right to acquire securities
Notes to Financial Statements - continued
equivalent in kind and amount to the securities sold. Purchase and sale commitments for when-issued or delayed delivery securities are held at carrying amount, which approximates fair value and are categorized as level 2 within the fair value hierarchy, and included in When-issued investments purchased and When-issued investments sold in the Statement of Assets and Liabilities, as applicable. Losses may arise due to changes in the value of the underlying securities prior to settlement date or if the counterparty does not perform under the contract’s terms, or if the issuer does not issue the securities due to political, economic or other factors.
To mitigate the counterparty credit risk on TBA transactions, mortgage dollar rolls, and other types of forward settling mortgage-backed and asset-backed security transactions, the fund whenever possible enters into a Master Securities Forward Transaction Agreement (“MSFTA”) on a bilateral basis with each of the counterparties with whom it undertakes a significant volume of transactions. The MSFTA gives each party to the agreement the right to terminate all transactions traded under such agreement if there is a specified deterioration in the credit quality of the other party. Upon an event of default or a termination of the MSFTA, the non-defaulting party has the right to close out all transactions traded under such agreement and to net amounts owed under each transaction to one net amount payable by one party to the other. This right to close out and net payments across all transactions traded under the MSFTA could result in a reduction of the fund's credit risk to such counterparty equal to any amounts payable by the fund under the applicable transactions, if any.
For mortgage-backed and asset-backed securities traded under a MSFTA, the collateral and margining requirements are contract specific. Collateral amounts across all transactions traded under such agreement are netted and an amount is posted from one party to the other to collateralize such obligations. Cash that has been pledged to cover the fund's collateral or margin obligations under a MSFTA, if any, will be reported separately on the Statement of Assets and Liabilities as restricted cash. Securities pledged as collateral or margin for the same purpose, if any, are noted in the Portfolio of Investments.
Fees Paid Indirectly — The fund's custody fee may be reduced by a credit earned under an arrangement that measures the value of U.S. dollars deposited with the custodian by the fund. The amount of the credit, for the year ended April 30, 2024, is shown as a reduction of total expenses in the Statement of Operations.
Tax Matters and Distributions — The fund intends to qualify as a regulated investment company, as defined under Subchapter M of the Internal Revenue Code, and to distribute all of its taxable income, including realized capital gains. As a result, no provision for federal income tax is required. The fund’s federal tax returns, when filed, will remain subject to examination by the Internal Revenue Service for a three year period. Management has analyzed the fund’s tax positions taken on federal and state tax returns for all open tax years and does not believe that there are any uncertain tax positions that require recognition of a tax liability. Foreign taxes, if any, have been accrued by the fund in the accompanying financial statements in accordance with the applicable foreign tax law. Foreign income taxes may be withheld by certain countries in which the fund invests. Additionally, capital gains realized by the fund on securities issued in or by certain foreign countries may be subject to capital gains tax imposed by those countries.
Notes to Financial Statements - continued
Distributions to shareholders are recorded on the ex-dividend date. Income and capital gain distributions are determined in accordance with income tax regulations, which may differ from U.S. generally accepted accounting principles. Certain capital accounts in the financial statements are periodically adjusted for permanent differences in order to reflect their tax character. These adjustments have no impact on net assets or net asset value per share. Temporary differences which arise from recognizing certain items of income, expense, gain or loss in different periods for financial statement and tax purposes will reverse at some time in the future.
Book/tax differences primarily relate to amortization of premium and accretion of discount of debt securities and derivative transactions.
The tax character of distributions declared to shareholders for the last two fiscal years is as follows:
| | Year ended
4/30/24 | Year ended
4/30/23 |
| Ordinary income (including any short-term capital gains) | $316,262,536 | $256,707,660 |
The federal tax cost and the tax basis components of distributable earnings were as follows:
| As of 4/30/24 | |
| Cost of investments | $8,586,590,431 |
| Gross appreciation | 8,840,273 |
| Gross depreciation | (753,154,481) |
| Net unrealized appreciation (depreciation) | $(744,314,208) |
| Undistributed ordinary income | 19,300,373 |
| Capital loss carryforwards | (578,497,683) |
| Other temporary differences | (26,501,640) |
| Total distributable earnings (loss) | $(1,330,013,158) |
As of April 30, 2024, the fund had capital loss carryforwards available to offset future realized gains. These net capital losses may be carried forward indefinitely and their character is retained as short-term and/or long-term losses. Such losses are characterized as follows:
| Short-Term | $(218,523,398) |
| Long-Term | (359,974,285) |
| Total | $(578,497,683) |
Multiple Classes of Shares of Beneficial Interest — The fund offers multiple classes of shares, which differ in their respective distribution and service fees. The fund's income and common expenses are allocated to shareholders based on the value of settled shares outstanding of each class. The fund's realized and unrealized gain (loss) are allocated to shareholders based on the daily net assets of each class. Dividends are declared separately for each class. Differences in per share dividend rates are generally due to differences in separate class expenses. Class B and Class C shares will convert to
Notes to Financial Statements - continued
Class A shares approximately eight years after purchase. Effective May 20, 2022, all Class 529A shares were redeemed. The fund’s distributions declared to shareholders as reported in the Statements of Changes in Net Assets are presented by class as follows:
| | Year ended
4/30/24 | Year ended
4/30/23 |
| Class A | $93,459,417 | $76,994,684 |
| Class B | 91,659 | 102,093 |
| Class C | 1,095,555 | 1,110,083 |
| Class I | 60,982,122 | 49,337,422 |
| Class R1 | 42,374 | 39,755 |
| Class R2 | 494,468 | 450,171 |
| Class R3 | 2,770,638 | 2,414,237 |
| Class R4 | 1,906,787 | 1,651,815 |
| Class R6 | 155,419,516 | 124,584,443 |
| Class 529A | — | 22,957 |
| Total | $316,262,536 | $256,707,660 |
(3) Transactions with Affiliates
Investment Adviser — The fund has an investment advisory agreement with MFS to provide overall investment management and related administrative services and facilities to the fund. The management fee is computed daily and paid monthly at the following annual rates based on the fund's average daily net assets:
| Up to $2.5 billion | 0.50% |
| In excess of $2.5 billion and up to $5 billion | 0.35% |
| In excess of $5 billion and up to $10 billion | 0.34% |
| In excess of $10 billion | 0.33% |
The investment adviser has agreed in writing to reduce its management fee to 0.40% of the fund’s average daily net assets annually up to $2.5 billion. This written agreement will continue until modified by the fund’s Board of Trustees, but such agreement will continue at least until August 31, 2024. For the year ended April 30, 2024, this management fee reduction amounted to $2,504,557, which is included in the reduction of total expenses in the Statement of Operations. MFS has also agreed in writing to reduce its management fee by a specified amount if certain MFS mutual fund assets exceed thresholds agreed to by MFS and the fund's Board of Trustees. MFS has agreed in writing to waive at least 0.01% of its management fee as part of this agreement. The agreement to waive at least 0.01% of the management fee will continue until modified by the fund's Board of Trustees, but such agreement will continue at least until August 31, 2025. For the year ended April 30, 2024, this management fee reduction amounted to $944,212, which is included in the reduction of total expenses in the Statement of Operations. The management fee incurred for the year ended April 30, 2024 was equivalent to an annual effective rate of 0.35% of the fund's average daily net assets.
The investment adviser has agreed in writing to pay a portion of the fund’s total annual operating expenses, excluding interest, taxes, extraordinary expenses, brokerage and transaction costs, certain tax reclaim recovery expenses (including contingency fees and
Notes to Financial Statements - continued
closing agreement expenses), and investment-related expenses, such that total fund operating expenses do not exceed the following rates annually of each class’s average daily net assets:
| | | | | Classes | | | | |
| A | B | C | I | R1 | R2 | R3 | R4 | R6 |
| 0.60% | 1.35% | 1.45% | 0.45% | 1.45% | 0.95% | 0.70% | 0.45% | 0.36% |
This written agreement will continue until modified by the fund’s Board of Trustees, but such agreement will continue at least until August 31, 2024. For the year ended April 30, 2024, this reduction amounted to $2,088,697, which is included in the reduction of total expenses in the Statement of Operations.
Distributor — MFS Fund Distributors, Inc. (MFD), a wholly-owned subsidiary of MFS, as distributor, received $84,702 for the year ended April 30, 2024, as its portion of the initial sales charge on sales of Class A shares of the fund.
The Board of Trustees has adopted a distribution plan for certain share classes pursuant to Rule 12b-1 of the Investment Company Act of 1940.
The fund's distribution plan provides that the fund will pay MFD for services provided by MFD and financial intermediaries in connection with the distribution and servicing of certain share classes. One component of the plan is a distribution fee paid to MFD and another component of the plan is a service fee paid to MFD. MFD may subsequently pay all, or a portion, of the distribution and/or service fees to financial intermediaries. The distribution and service fees are computed daily and paid monthly.
Distribution Plan Fee Table:
| | Distribution
Fee Rate (d) | Service
Fee Rate (d) | Total
Distribution
Plan (d) | Annual
Effective
Rate (e) | Distribution
and Service
Fee |
| Class A | — | 0.25% | 0.25% | 0.15% | $ 5,641,777 |
| Class B | 0.75% | 0.25% | 1.00% | 0.90% | 27,066 |
| Class C | 0.75% | 0.25% | 1.00% | 1.00% | 332,890 |
| Class R1 | 0.75% | 0.25% | 1.00% | 1.00% | 12,872 |
| Class R2 | 0.25% | 0.25% | 0.50% | 0.50% | 65,331 |
| Class R3 | — | 0.25% | 0.25% | 0.25% | 171,407 |
| Total Distribution and Service Fees | | | | | $6,251,343 |
| (d) | In accordance with the distribution plan for certain classes, the fund pays distribution and/or service fees equal to these annual percentage rates of each class’s average daily net assets. The distribution and service fee rates disclosed by class represent the current rates in effect at the end of the reporting period. Any rate changes, if applicable, are detailed below. |
| (e) | The annual effective rates represent actual fees incurred under the distribution plan for the year ended April 30, 2024 based on each class's average daily net assets. 0.10% of the Class A and Class B service fee is currently being waived under a written waiver agreement. For the year ended April 30, 2024, this waiver amounted to $2,256,689 and $2,710 for Class A and Class B shares, respectively, and is included in the reduction of total expenses in the Statement of Operations. This written waiver agreement will continue until modified by the fund’s Board of Trustees, but such agreement will continue at least until August 31, 2024. MFD has voluntarily agreed to rebate a portion of each class's 0.25% |
Notes to Financial Statements - continued
service fee attributable to accounts for which there is no financial intermediary specified on the account except for accounts attributable to MFS or its affiliates' seed money. There were no service fee rebates for the year ended April 30, 2024.
Certain Class A shares are subject to a contingent deferred sales charge (CDSC) in the event of a shareholder redemption within 18 months of purchase. Class B shares are subject to a CDSC in the event of a shareholder redemption within six years of purchase. Class C shares are subject to a CDSC in the event of a shareholder redemption within 12 months of purchase. All contingent deferred sales charges are paid to MFD and during the year ended April 30, 2024, were as follows:
| | Amount |
| Class A | $46,292 |
| Class B | 3,335 |
| Class C | 1,200 |
Shareholder Servicing Agent — MFS Service Center, Inc. (MFSC), a wholly-owned subsidiary of MFS, receives a fee from the fund for its services as shareholder servicing agent calculated as a percentage of the average daily net assets of the fund as determined periodically under the supervision of the fund's Board of Trustees. For the year ended April 30, 2024, the fee was $139,471, which equated to 0.0019% annually of the fund's average daily net assets. MFSC also receives reimbursement from the fund for out-of-pocket expenses, sub-accounting and other shareholder servicing costs which may be paid to affiliated and unaffiliated service providers. Class R6 shares do not incur sub-accounting fees. For the year ended April 30, 2024, these out-of-pocket expenses, sub-accounting and other shareholder servicing costs amounted to $3,834,124.
Administrator — MFS provides certain financial, legal, shareholder communications, compliance, and other administrative services to the fund. Under an administrative services agreement, the fund reimburses MFS the costs incurred to provide these services. The fund is charged an annual fixed amount of $17,500 plus a fee based on average daily net assets. The administrative services fee is computed daily and paid monthly. The administrative services fee incurred for the year ended April 30, 2024 was equivalent to an annual effective rate of 0.0084% of the fund's average daily net assets.
Trustees’ and Officers’ Compensation — The fund pays compensation to independent Trustees in the form of a retainer, attendance fees, and additional compensation to Board and Committee chairpersons. Independent Trustees’ compensation is accrued daily and paid subsequent to each Trustee Board meeting. The fund does not pay compensation directly to Trustees or officers of the fund who are also officers of the investment adviser, all of whom receive remuneration from MFS for their services to the fund. Certain officers and Trustees of the fund are officers or directors of MFS, MFD, and MFSC.
Other — The fund invests in the MFS Institutional Money Market Portfolio which is managed by MFS and seeks current income consistent with preservation of capital and liquidity. This money market fund does not pay a management fee to MFS but does incur investment and operating costs.
Notes to Financial Statements - continued
(4) Portfolio Securities
For the year ended April 30, 2024, purchases and sales of investments, other than short-term obligations, were as follows:
| | Purchases | Sales |
| U.S. Government securities | $5,648,445,768 | $4,665,692,968 |
| Non-U.S. Government securities | 522,919,064 | 866,229,028 |
(5) Shares of Beneficial Interest
The fund's Declaration of Trust permits the Trustees to issue an unlimited number of full and fractional shares of beneficial interest. Transactions in fund shares were as follows:
| | Year ended
4/30/24 | | Year ended
4/30/23 |
| | Shares | Amount | | Shares | Amount |
| Shares sold | | | | | |
| Class A | 47,926,461 | $446,713,776 | | 38,371,112 | $366,154,901 |
| Class B | 16,186 | 150,087 | | 22,149 | 212,937 |
| Class C | 768,395 | 7,146,301 | | 521,787 | 4,979,279 |
| Class I | 73,358,649 | 680,994,863 | | 49,057,393 | 467,962,206 |
| Class R1 | 29,490 | 275,307 | | 37,300 | 358,591 |
| Class R2 | 295,610 | 2,756,984 | | 215,398 | 2,044,916 |
| Class R3 | 1,722,112 | 16,053,693 | | 1,176,955 | 11,159,362 |
| Class R4 | 1,149,026 | 10,689,291 | | 1,088,193 | 10,449,010 |
| Class R6 | 77,349,777 | 720,656,317 | | 83,961,736 | 812,220,667 |
| Class 529A | — | — | | 7,712 | 77,520 |
| | 202,615,706 | $1,885,436,619 | | 174,459,735 | $1,675,619,389 |
Shares issued to shareholders
in reinvestment of distributions | | | | | |
| Class A | 9,712,167 | $90,373,190 | | 7,851,823 | $74,606,189 |
| Class B | 9,524 | 88,752 | | 10,090 | 95,981 |
| Class C | 105,892 | 986,567 | | 107,287 | 1,020,698 |
| Class I | 4,912,455 | 45,722,558 | | 3,941,146 | 37,468,599 |
| Class R1 | 4,543 | 42,331 | | 4,139 | 39,319 |
| Class R2 | 52,849 | 491,848 | | 47,091 | 447,239 |
| Class R3 | 297,560 | 2,769,096 | | 254,036 | 2,413,408 |
| Class R4 | 141,752 | 1,319,025 | | 114,989 | 1,093,306 |
| Class R6 | 16,294,916 | 151,653,413 | | 12,860,230 | 122,213,742 |
| | 31,531,658 | $293,446,780 | | 25,190,831 | $239,398,481 |
Notes to Financial Statements - continued
| | Year ended
4/30/24 | | Year ended
4/30/23 |
| | Shares | Amount | | Shares | Amount |
| Shares reacquired | | | | | |
| Class A | (46,587,620) | $(433,136,904) | | (52,414,770) | $(501,220,877) |
| Class B | (173,948) | (1,618,241) | | (140,333) | (1,342,556) |
| Class C | (1,445,668) | (13,468,926) | | (2,537,355) | (23,948,385) |
| Class I | (49,796,134) | (463,548,761) | | (72,440,483) | (693,213,713) |
| Class R1 | (29,338) | (270,552) | | (71,920) | (688,358) |
| Class R2 | (467,845) | (4,360,414) | | (433,589) | (4,147,392) |
| Class R3 | (1,594,924) | (14,906,940) | | (2,241,302) | (21,433,297) |
| Class R4 | (2,042,373) | (19,127,337) | | (1,218,379) | (11,695,888) |
| Class R6 | (63,069,035) | (584,740,970) | | (70,117,118) | (672,519,231) |
| Class 529A | — | — | | (1,725,772) | (17,136,661) |
| | (165,206,885) | $(1,535,179,045) | | (203,341,021) | $(1,947,346,358) |
| Net change | | | | | |
| Class A | 11,051,008 | $103,950,062 | | (6,191,835) | $(60,459,787) |
| Class B | (148,238) | (1,379,402) | | (108,094) | (1,033,638) |
| Class C | (571,381) | (5,336,058) | | (1,908,281) | (17,948,408) |
| Class I | 28,474,970 | 263,168,660 | | (19,441,944) | (187,782,908) |
| Class R1 | 4,695 | 47,086 | | (30,481) | (290,448) |
| Class R2 | (119,386) | (1,111,582) | | (171,100) | (1,655,237) |
| Class R3 | 424,748 | 3,915,849 | | (810,311) | (7,860,527) |
| Class R4 | (751,595) | (7,119,021) | | (15,197) | (153,572) |
| Class R6 | 30,575,658 | 287,568,760 | | 26,704,848 | 261,915,178 |
| Class 529A | — | — | | (1,718,060) | (17,059,141) |
| | 68,940,479 | $643,704,354 | | (3,690,455) | $(32,328,488) |
The fund is one of several mutual funds in which certain MFS funds may invest. The MFS funds do not invest in the underlying funds for the purpose of exercising management or control. At the end of the period, the MFS Moderate Allocation Fund, the MFS Conservative Allocation Fund, the MFS Growth Allocation Fund, the MFS Lifetime Income Fund, and the MFS Lifetime 2030 Fund were the owners of record of approximately 7%, 7%, 2%, 2%, and 1%, respectively, of the value of outstanding voting shares of the fund. In addition, the MFS Lifetime 2025 Fund, the MFS Lifetime 2035 Fund, the MFS Lifetime 2040 Fund, the MFS Lifetime 2045 Fund, the MFS Lifetime 2050 Fund, the MFS Lifetime 2055 Fund, the MFS Lifetime 2060 Fund, and the MFS Lifetime 2065 Fund were each the owners of record of less than 1% of the value of outstanding voting shares of the fund.
Notes to Financial Statements - continued
Effective June 1, 2019, purchases of the fund’s Class B shares were closed to new and existing investors subject to certain exceptions. Effective after the close of business on May 13, 2022, all sales and redemptions of Class 529A shares were suspended, and all Class 529A shares were redeemed on May 20, 2022. Effective September 29, 2023, purchases of the fund's Class R1 and Class R2 shares were closed to new eligible investors.
(6) Line of Credit
The fund and certain other funds managed by MFS participate in a $1.45 billion unsecured committed line of credit of which $1.2 billion is reserved for use by the fund and certain other MFS U.S. funds. The line of credit is provided by a syndicate of banks under a credit agreement. Borrowings may be made for temporary financing needs. Interest is charged to each fund, based on its borrowings, generally at a rate equal to the highest of 1) Daily Simple SOFR (Secured Overnight Financing Rate) plus 0.10%, 2) the Federal Funds Effective Rate, or 3) the Overnight Bank Funding Rate, each plus an agreed upon spread. A commitment fee, based on the average daily unused portion of the committed line of credit, is allocated among the participating funds. The line of credit expires on March 13, 2025 unless extended or renewed. In addition, the fund and other funds managed by MFS have established unsecured uncommitted borrowing arrangements with certain banks for temporary financing needs. Interest is charged to each fund, based on its borrowings, at rates equal to customary reference rates plus an agreed upon spread. For the year ended April 30, 2024, the fund’s commitment fee and interest expense were $41,542 and $0, respectively, and are included in “Miscellaneous” expense in the Statement of Operations.
(7) Investments in Affiliated Issuers
An affiliated issuer may be considered one in which the fund owns 5% or more of the outstanding voting securities, or a company which is under common control. For the purposes of this report, the following were affiliated issuers:
| Affiliated Issuers | Beginning
Value | Purchases | Sales
Proceeds | Realized
Gain
(Loss) | Change in
Unrealized
Appreciation or
Depreciation | Ending
Value |
| MFS Institutional Money Market Portfolio | $205,498,014 | $1,752,651,286 | $1,641,283,386 | $904 | $(40,347) | $316,826,471 |
| Affiliated Issuers | Dividend
Income | Capital Gain
Distributions |
| MFS Institutional Money Market Portfolio | $9,885,659 | $— |
(8) LIBOR Transition
The London Interbank Offered Rate (LIBOR) was intended to represent the rate at which contributing banks may obtain short-term borrowings from each other in the London interbank market. Certain of the fund's investments, payment obligations, and financing terms were historically based on LIBOR. In 2017, the United Kingdom Financial Conduct Authority (FCA) announced plans to transition away from LIBOR by the end of 2021. LIBOR's administrator, ICE Benchmark Administration (IBA), ceased publication (on a representative basis) of many of its LIBOR settings as of December 31,
Notes to Financial Statements - continued
2021 and ceased publication (on a representative basis) of the remaining U.S. dollar LIBOR settings as of June 30, 2023. In addition, global regulators announced that, with limited exceptions, no new LIBOR-based contracts should be entered into after 2021. Although the FCA has announced that it will require the IBA to continue to publish certain select LIBOR rates on a synthetic basis after the relevant cessation dates, such synthetic rates are not considered to be representative of the underlying market and economic reality they are intended to measure, are expected to be published for a limited time period, and are intended solely for use on a limited basis for legacy transactions.
Regulators and industry groups have implemented measures to facilitate the transition away from LIBOR and other interbank offered rates to alternative reference rates, such as the Secured Overnight Financing Rate (SOFR). SOFR is a broad measure of the cost of borrowing cash overnight collateralized by U.S. Treasury securities in the repurchase agreement (repo) market. SOFR is published in various forms including as a daily, compounded, and forward-looking term rate. The transition to alternative reference rates may affect the liquidity and valuation of investments that were tied to LIBOR or other interbank offered rates and may lead to other consequences affecting securities and credit markets more broadly. For example, while some investments that were tied to LIBOR provided for an alternative or “fallback” rate-setting methodology in the event LIBOR is not available, there is uncertainty regarding the effectiveness of any such alternative methodologies to replace LIBOR and certain investments tied to LIBOR may not have fallback provisions. While legislation passed in the United States facilitates by operation of law the replacement of U.S. dollar LIBOR settings in certain legacy instruments with a specified replacement rate, such as SOFR, there is uncertainty regarding the effectiveness of such legislation. There also remains uncertainty regarding the willingness and ability of parties to add or amend fallback provisions in certain other legacy instruments maturing after the cessation of the applicable LIBOR rates, which could create market and litigation risk.
It is difficult to quantify or predict the impact on the fund resulting from the transition from LIBOR to alternative reference rates and the potential effects of the transition from LIBOR on the fund, or on certain instruments in which the fund invests, are not known. The transition process may involve, among other things, increased volatility or illiquidity in markets for instruments that relied on LIBOR to determine interest rates. The transition may also result in a reduction in value of certain LIBOR-related investments held by the fund or reduce the effectiveness of related transactions such as hedges. Any such effects of the transition away from LIBOR and the adoption of alternative reference rates, as well as other unforeseen effects, could have an adverse impact on the fund's performance.
With respect to the fund’s accounting for investments, including investments in certain debt instruments and derivatives, as well as borrowings by the fund and any other contractual arrangements of the fund that undergo reference rate-related modifications as a result of the transition, management has and will continue to rely upon the relief provided by FASB Codification Topic 848 – Reference Rate Reform (Topic 848). The guidance in Topic 848 permits the fund to account for such contract modifications made on or before December 31, 2024 as a continuation of the existing contracts. The situation remains fluid, and management believes, based on best available information, that the impact of the transition will not be material to the fund.
Report of Independent Registered Public Accounting Firm
To the Board of Trustees of MFS Series Trust IX and the Shareholders of
MFS Total Return Bond Fund:
Opinion on the Financial Statements and Financial Highlights
We have audited the accompanying statement of assets and liabilities of MFS Total Return Bond Fund (the “Fund”), including the portfolio of investments, as of April 30, 2024, the related statement of operations for the year then ended, the statements of changes in net assets for each of the two years in the period then ended, the financial highlights for each of the five years in the period then ended, and the related notes. In our opinion, the financial statements and financial highlights present fairly, in all material respects, the financial position of the Fund as of April 30, 2024, and the results of its operations for the year then ended, the changes in its net assets for each of the two years in the period then ended, and the financial highlights for each of the five years in the period then ended, in conformity with accounting principles generally accepted in the United States of America.
Basis for Opinion
These financial statements and financial highlights are the responsibility of the Fund’s management. Our responsibility is to express an opinion on the Fund's financial statements and financial highlights based on our audits. We are a public accounting firm registered with the Public Company Accounting Oversight Board (United States) (PCAOB) and are required to be independent with respect to the Fund in accordance with the U.S. federal securities laws and the applicable rules and regulations of the Securities and Exchange Commission and the PCAOB.
We conducted our audits in accordance with the standards of the PCAOB. Those standards require that we plan and perform the audit to obtain reasonable assurance about whether the financial statements and financial highlights are free of material misstatement, whether due to error or fraud. The Fund is not required to have, nor were we engaged to perform, an audit of its internal control over financial reporting. As part of our audits we are required to obtain an understanding of internal control over financial reporting but not for the purpose of expressing an opinion on the effectiveness of the Fund's internal control over financial reporting. Accordingly, we express no such opinion.
Our audits included performing procedures to assess the risks of material misstatement of the financial statements and financial highlights, whether due to error or fraud, and performing procedures that respond to those risks. Such procedures included examining, on a test basis, evidence regarding the amounts and disclosures in the financial statements and financial highlights. Our audits also included evaluating the accounting principles used and significant estimates made by management, as well as evaluating the overall presentation of the financial statements and financial highlights.
Report of Independent Registered Public Accounting Firm – continued
Our procedures included confirmation of securities owned as of April 30, 2024, by correspondence with the custodian and brokers; when replies were not received from brokers, we performed other auditing procedures. We believe that our audits provide a reasonable basis for our opinion.
DELOITTE & TOUCHE LLP
Boston, Massachusetts
June 20, 2024
We have served as the auditor of one or more of the MFS investment companies since 1924.
Trustees and Officers — Identification and Background
The Trustees and Officers of the Trust, as of June 1, 2024, are listed below, together with their principal occupations during the past five years. (Their titles may have varied during that period.) The address of each Trustee and Officer is 111 Huntington Avenue, Boston, Massachusetts 02199-7618.
| Name, Age | | Position(s) Held with Fund | | Trustee/Officer Since(h) | | Number of MFS Funds overseen by the Trustee | | Principal Occupations During
the Past Five Years | | Other Directorships During
the Past Five Years (j) |
| INTERESTED TRUSTEE | | | | | | | | | | |
Michael W. Roberge (k)
(age 57) | | Trustee | | January 2021 | | 135 | | Massachusetts Financial Services Company, Chairman (since January 2021); Chief Executive Officer (since January 2017); Director; Chairman of the Board (since January 2022) | | N/A |
| INDEPENDENT TRUSTEES | | | | | | | | | | |
John P. Kavanaugh
(age 69) | | Trustee and Chair of Trustees | | January 2009 | | 135 | | Private investor | | N/A |
Steven E. Buller
(age 72) | | Trustee | | February 2014 | | 135 | | Private investor | | N/A |
John A. Caroselli
(age 69) | | Trustee | | March 2017 | | 135 | | Private investor; JC Global Advisors, LLC (management consulting), President (since 2015) | | N/A |
Maureen R. Goldfarb
(age 69) | | Trustee | | January 2009 | | 135 | | Private investor | | N/A |
Peter D. Jones
(age 68) | | Trustee | | January 2019 | | 135 | | Private investor | | N/A |
James W. Kilman, Jr.
(age 63) | | Trustee | | January 2019 | | 135 | | Burford Capital Limited (finance and investment management), Senior Advisor (since May 3, 2021), Chief Financial Officer (2019 - May 2, 2021); KielStrand Capital LLC (family office), Chief Executive Officer (since 2016) | | Alpha-En Corporation, Director (2016-2019) |
Trustees and Officers - continued
| Name, Age | | Position(s) Held with Fund | | Trustee/Officer Since(h) | | Number of MFS Funds overseen by the Trustee | | Principal Occupations During
the Past Five Years | | Other Directorships During
the Past Five Years (j) |
Clarence Otis, Jr.
(age 68) | | Trustee | | March 2017 | | 135 | | Private investor | | VF Corporation, Director; Verizon Communications, Inc., Director; The Travelers Companies, Director |
Maryanne L. Roepke
(age 68) | | Trustee | | May 2014 | | 135 | | Private investor | | N/A |
Laurie J. Thomsen
(age 66) | | Trustee | | March 2005 | | 135 | | Private investor | | The Travelers Companies, Director; Dycom Industries, Inc., Director |
| Name, Age | | Position(s) Held with
Fund | | Trustee/Officer Since(h) | | Number of MFS Funds for which the Person is an Officer | | Principal Occupations During
the Past Five Years |
| OFFICERS | | | | | | | | |
William T. Allen (k)
(age 57) | | Deputy Assistant Treasurer | | April 2024 | | 135 | | Massachusetts Financial Services Company, Vice President |
Brian Balasco (k)
(age 46) | | Assistant Treasurer | | April 2024 | | 135 | | Massachusetts Financial Services Company, Vice President |
Christopher R. Bohane (k)
(age 50) | | Assistant Secretary and Assistant Clerk | | July 2005 | | 135 | | Massachusetts Financial Services Company, Senior Vice President and Deputy General Counsel |
James L. Byrne (k)
(age 48) | | Assistant Treasurer | | April 2024 | | 135 | | Massachusetts Financial Services Company, Vice President |
John W. Clark, Jr. (k)
(age 57) | | Deputy Treasurer | | April 2017 | | 135 | | Massachusetts Financial Services Company, Vice President |
David L. DiLorenzo (k)
(age 55) | | President | | July 2005 | | 135 | | Massachusetts Financial Services Company, Senior Vice President |
Heidi W. Hardin (k)
(age 56) | | Secretary and Clerk | | April 2017 | | 135 | | Massachusetts Financial Services Company, Executive Vice President and General Counsel |
Brian E. Langenfeld (k)
(age 51) | | Assistant Secretary and Assistant Clerk | | June 2006 | | 135 | | Massachusetts Financial Services Company, Vice President and Managing Counsel |
Trustees and Officers - continued
| Name, Age | | Position(s) Held with
Fund | | Trustee/Officer Since(h) | | Number of MFS Funds for which the Person is an Officer | | Principal Occupations During
the Past Five Years |
Rosa E. Licea-Mailloux (k)
(age 47) | | Chief Compliance Officer | | March 2022 | | 135 | | Massachusetts Financial Services Company, Vice President (since 2018); Director of Corporate Compliance (2018-2021), Senior Director Compliance (2021-2022), Senior Managing Director of North American Compliance & Chief Compliance Officer (since March 2022) |
Amanda S. Mooradian (k)
(age 45) | | Assistant Secretary and Assistant Clerk | | September 2018 | | 135 | | Massachusetts Financial Services Company, Vice President and Senior Counsel |
Susan A. Pereira (k)
(age 53) | | Assistant Secretary and Assistant Clerk | | July 2005 | | 135 | | Massachusetts Financial Services Company, Vice President and Managing Counsel |
Kasey L. Phillips (k)
(age 53) | | Treasurer | | September 2012 | | 135 | | Massachusetts Financial Services Company, Vice President |
Matthew A. Stowe (k)
(age 49) | | Assistant Secretary and Assistant Clerk | | October 2014 | | 135 | | Massachusetts Financial Services Company, Vice President and Senior Managing Counsel |
William B. Wilson (k)
(age 41) | | Assistant Secretary and Assistant Clerk | | October 2022 | | 135 | | Massachusetts Financial Services Company, Assistant Vice President and Senior Counsel |
| (h) | Date first appointed to serve as Trustee/Officer of an MFS Fund. Each Trustee has served continuously since appointment unless indicated otherwise. From January 2012 through December 2016, Mr. DiLorenzo served as Treasurer and of the Funds. From September 2012 through March 2024, Ms. Phillips served as Assistant Treasurer of the Funds. From April 2017 through March 2024, Mr. Clark served as Assistant Treasurer of the Funds. |
| (j) | Directorships or trusteeships of companies required to report to the Securities and Exchange Commission (i.e., “public companies”). |
| (k) | “Interested person” of the Trust within the meaning of the Investment Company Act of 1940 (referred to as the 1940 Act), which is the principal federal law governing investment companies like the fund, as a result of a position with MFS. The address of MFS is 111 Huntington Avenue, Boston, Massachusetts 02199-7618. |
Each Trustee (other than Messrs. Jones, Kilman and Roberge) has been elected by shareholders and each Trustee and Officer holds office until his or her successor is chosen and qualified or until his or her earlier death, resignation, retirement or removal. Mr. Roberge became a Trustee of the Funds on January 1, 2021 and Messrs. Jones and Kilman became Trustees of the Funds on January 1, 2019. The Trust does not hold annual meetings for the purpose of electing Trustees, and Trustees are not elected for fixed terms. Under the terms of the Board's retirement policy, an Independent Trustee
Trustees and Officers - continued
shall retire at the end of the calendar year in which he or she reaches the earlier of 75 years of age or 15 years of service on the Board (or, in the case of any Independent Trustee who joined the Board prior to 2015, 20 years of service on the Board).
Messrs. Buller, Caroselli, Jones and Otis are members of the Trust’s Audit Committee.
Each of the Interested Trustees and certain Officers hold comparable officer positions with certain affiliates of MFS.
The Statement of Additional Information for a Fund includes further information about the Trustees and is available without charge upon request by calling 1-800-225-2606.
| Investment Adviser | Custodian |
Massachusetts Financial Services Company
111 Huntington Avenue
Boston, MA 02199-7618 | JPMorgan Chase Bank, NA
4 Metrotech Center
New York, NY 11245 |
| Distributor | Independent Registered Public Accounting Firm |
MFS Fund Distributors, Inc.
111 Huntington Avenue
Boston, MA 02199-7618 | Deloitte & Touche LLP
200 Berkeley Street
Boston, MA 02116 |
| Portfolio Manager(s) | |
Alexander Mackey
Joshua Marston | |
Statement Regarding Liquidity Risk Management Program
The fund has adopted and implemented a liquidity risk management program (the “Program”) as required by Rule 22e-4 under the Investment Company Act of 1940, as amended. The fund’s Board of Trustees (the “Board”) has designated MFS as the administrator of the Program. The Program is reasonably designed to assess and manage the liquidity risk of the fund. Liquidity risk is the risk that the fund could not meet requests to redeem shares issued by the fund without significant dilution of remaining investors' interests.
MFS provided a written report to the Board for consideration at its March 2024 meeting that addressed the operation of the Program and provided an assessment of the adequacy and effectiveness of the Program during the period from January 1, 2023 to December 31, 2023 (the “Covered Period”). The report concluded that during the Covered Period the Program had operated effectively in all material respects and had adequately and effectively been implemented to assess and manage the fund’s liquidity risk. MFS also reported that there were no liquidity events that impacted the fund or its ability to timely meet redemptions without dilution to existing shareholders during the Covered Period.
There can be no assurance that the Program will achieve its objectives in the future. Further information on liquidity risk, and other principal risks to which an investment in the fund may be subject, can be found in the prospectus.
Proxy Voting Policies and Information
MFS votes proxies on behalf of the fund pursuant to proxy voting policies and procedures that are available without charge, upon request, by calling 1-800-225-2606, by visiting mfs.com/proxyvoting, or by visiting the SEC’s Web site at http://www.sec.gov.
Information regarding how the fund voted proxies relating to portfolio securities during the most recent twelve-month period ended June 30 is available by August 31 of each year without charge by visiting mfs.com/proxyvoting, or by visiting the SEC’s Web site at http://www.sec.gov.
Quarterly Portfolio Disclosure
The fund files a complete schedule of portfolio holdings with the SEC for the first and third quarters of each fiscal year as an exhibit to its reports on Form N-PORT. The fund's Form N-PORT reports are available on the SEC's Web site at http://www.sec.gov. A shareholder can obtain the portfolio holdings report for the first and third quarters of the fund's fiscal year at mfs.com/openendfunds by choosing the fund's name and then scrolling to the “Resources” section and clicking on the “Shareholder Reports” tab.
Further Information
From time to time, MFS may post important information about the fund or the MFS Funds on the MFS Web site (mfs.com). This information is available at https://www.mfs.com/announcements or at mfs.com/openendfunds by choosing the fund’s name and then scrolling to the “Resources” section and clicking on the “Announcements” tab, if any.
Information About Fund Contracts and Legal Claims
The fund has entered into contractual arrangements with an investment adviser, administrator, distributor, shareholder servicing agent, and custodian who each provide services to the fund. Unless expressly stated otherwise, shareholders are not parties to, or intended beneficiaries of these contractual arrangements, and these contractual arrangements are not intended to create any shareholder right to enforce them against the service providers or to seek any remedy under them against the service providers, either directly or on behalf of the fund.
Under the Trust’s By-Laws and Declaration of Trust, any claims asserted against or on behalf of the MFS Funds, including claims against Trustees and Officers, must be brought in state and federal courts located within the Commonwealth of Massachusetts.
Federal Tax Information (unaudited)
The fund will notify shareholders of amounts for use in preparing 2024 income tax forms in January 2025. The following information is provided pursuant to provisions of the Internal Revenue Code.
The fund intends to pass through the maximum amount allowable as Section 163(j) Interest Dividends as defined in Treasury Regulation §1.163(j)-1(b).
| FACTS | WHAT DOES MFS DO WITH YOUR PERSONAL INFORMATION? |
| Why? | Financial companies choose how they share your personal information. Federal law gives consumers the right to limit some but not all sharing. Federal law also requires us to tell you how we collect, share, and protect your personal information. Please read this notice carefully to understand what we do. |
| What? | The types of personal information we collect and share depend on the product or service you have with us. This information can include: |
| • Social Security number and account balances |
| • Account transactions and transaction history |
| • Checking account information and wire transfer instructions |
| When you are no longer our customer, we continue to share your information as described in this notice. |
| How? | All financial companies need to share customers' personal information to run their everyday business. In the section below, we list the reasons financial companies can share their customers' personal information; the reasons MFS chooses to share; and whether you can limit this sharing. |
Reasons we can share your
personal information | Does MFS share? | Can you limit
this sharing? |
For our everyday business purposes –
such as to process your transactions, maintain your
account(s), respond to court orders and legal
investigations, or report to credit bureaus | Yes | No |
For our marketing purposes –
to offer our products and services to you | No | We don't share |
For joint marketing with other
financial companies | No | We don't share |
For our affiliates' everyday business purposes –
information about your transactions and experiences | No | We don't share |
For our affiliates' everyday business purposes –
information about your creditworthiness | No | We don't share |
| For nonaffiliates to market to you | No | We don't share |
| Questions? | Call 800-225-2606 or go to mfs.com. |
| Who we are |
| Who is providing this notice? | MFS Funds, MFS Investment Management, MFS Institutional Advisors, Inc., and MFS Heritage Trust Company. |
| What we do |
How does MFS
protect my personal
information? | To protect your personal information from unauthorized access and use, we use security measures that comply with federal law. These measures include procedural, electronic, and physical safeguards for the protection of the personal information we collect about you. |
How does MFS
collect my personal
information? | We collect your personal information, for example, when you |
| • open an account or provide account information |
| • direct us to buy securities or direct us to sell your securities |
| • make a wire transfer |
| We also collect your personal information from others, such as credit bureaus, affiliates, or other companies. |
| Why can't I limit all sharing? | Federal law gives you the right to limit only |
| • sharing for affiliates' everyday business purposes – information about your creditworthiness |
| • affiliates from using your information to market to you |
| • sharing for nonaffiliates to market to you |
| State laws and individual companies may give you additional rights to limit sharing. |
| Definitions |
| Affiliates | Companies related by common ownership or control. They can be financial and nonfinancial companies. |
| • MFS does not share personal information with affiliates, except for everyday business purposes as described on page one of this notice. |
| Nonaffiliates | Companies not related by common ownership or control. They can be financial and nonfinancial companies. |
| • MFS does not share with nonaffiliates so they can market to you. |
| Joint marketing | A formal agreement between nonaffiliated financial companies that together market financial products or services to you. |
| • MFS doesn't jointly market. |
| Other important information |
| If you own an MFS product or receive an MFS service in the name of a third party such as a bank or broker-dealer, their privacy policy may apply to you instead of ours. |
Save paper with eDelivery.
MFS® will send you prospectuses, reports, and proxies directly via e-mail so you will get information faster with less mailbox clutter.
To sign up:
1. Go to mfs.com.
2. Log in via MFS® Access.
3. Select eDelivery.
If you own your MFS fund shares through a financial institution or a retirement plan, MFS® TALK, MFS® Access, or eDelivery may not be available to you.
CONTACT
WEB SITE
mfs.com
MFS TALK
1-800-637-8255
24 hours a day
ACCOUNT SERVICE AND LITERATURE
Shareholders
1-800-225-2606
Financial advisors
1-800-343-2829
Retirement plan services
1-800-637-1255
MAILING ADDRESS
MFS Service Center, Inc.
P.O. Box 219341
Kansas City, MO 64121-9341
OVERNIGHT MAIL
MFS Service Center, Inc.
Suite 219341
430 W 7th Street
Kansas City, MO 64105-1407
Item 1(b):
Not applicable.
ITEM 2. CODE OF ETHICS.
The Registrant has adopted a Code of Ethics (the “Code”) pursuant to Section 406 of the Sarbanes-Oxley Act and as defined in Form N-CSR that applies to the Registrant’s principal executive officer and principal financial and accounting officer. During the period covered by this report, the Registrant has not amended any provision in the Code that relates to an element of the Code’s definition enumerated in paragraph
(b)of Item 2 of this Form N-CSR. During the period covered by this report, the Registrant did not grant a waiver, including an implicit
waiver, from any provision of the Code. David L. DiLorenzo (Principal Executive Officer) and James O. Yost (Principal Financial Officer) were the two persons covered by the Code prior to April 1, 2024. Beginning April 1, 2024, David L. DiLorenzo (Principal Executive Officer) and Kasey L. Phillips (Principal Financial Officer) are the two persons covered by the Code.
A copy of the Code is attached hereto as EX-99.COE.
ITEM 3. AUDIT COMMITTEE FINANCIAL EXPERT.
Messrs. Steven E. Buller and Clarence Otis, Jr., members of the Audit Committee, have been determined by the Board of Trustees in their reasonable business judgment to meet the definition of “audit committee financial expert” as such term is defined in Form N-CSR. In addition, Messrs. Buller and Otis are “independent” members of the Audit Committee (as such term has been defined by the Securities and Exchange Commission in regulations implementing Section 407 of the Sarbanes-Oxley Act of 2002). The Securities and Exchange Commission has stated that the designation of a person as an audit committee financial expert pursuant to this Item 3 on the Form N-CSR does not impose on such a person any duties, obligations or liability that are greater than the duties, obligations or liability imposed on such person as a member of the Audit Committee and the Board of Trustees in the absence of such designation or identification.
ITEM 4. PRINCIPAL ACCOUNTANT FEES AND SERVICES.
Items 4(a) through 4(d) and 4(g):
The Board of Trustees has appointed Deloitte & Touche LLP (“Deloitte”) to serve as independent accountants to a series of the Registrant (each a "Fund" and collectively the "Funds"). The tables below set forth the audit fees billed to each Fund as well as fees for non-audit services provided to each Fund and/or to the Fund's investment adviser, Massachusetts Financial Services Company (“MFS”), and to various entities either controlling, controlled by, or under common control with MFS that provide ongoing services to the Fund (“MFS Related Entities”).
For the fiscal years ended April 30, 2024 and 2023, audit fees billed to each Fund by Deloitte were as follows:
Fees billed by Deloitte: | | Audit Fees |
| 2024 | | 2023 |
MFS Corporate Bond Fund | 68,800 | | 71,716 |
MFS Limited Maturity Fund | 65,648 | | 65,648 |
MFS Municipal Limited Maturity Fund | 58,167 | | 56,120 |
MFS Total Return Bond Fund | 82,847 | | 79,920 |
Total | 275,462 | | 273,404 |
For the fiscal years ended April 30, 2024 and 2023, fees billed by Deloitte for audit-related, tax and other services provided to each Fund and for audit-related, tax and other services provided to MFS and MFS Related Entities were as follows:
Fees billed by Deloitte: | Audit-Related Fees1 | Tax Fees2 | All Other Fees3 | |
| | 2024 | | 2023 | | 2024 | | 2023 | 2024 | 2023 | |
To MFS Corporate Bond Fund | 0 | | 0 | | 0 | | 0 | 0 | 0 | |
To MFS Limited Maturity Fund | 0 | | 0 | | 0 | | 0 | 0 | 0 | |
To MFS Municipal Limited | 0 | | 0 | | 0 | | 0 | 0 | 0 | |
Maturity Fund | | | | | | | | | | |
To MFS Total Return Bond Fund | 0 | | 0 | | 0 | | 0 | 0 | 0 | |
Total fees billed by Deloitte | 0 | | 0 | | 0 | | 0 | 0 | 0 | |
To above Funds: | | | | | | | | | | |
| | | | | | |
Fees billed by Deloitte: | Audit-Related Fees1 | Tax Fees2 | All Other Fees3 |
| | 2024 | | 2023 | | 2024 | | 2023 | 2024 | 2023 | |
To MFS and MFS Related | 0 | | 0 | | 0 | | 0 | 0 | 3,790 | |
Entities of MFS Corporate Bond Fund* | | | | | | | | | | |
To MFS and MFS Related Entities | 0 | | 0 | | 0 | | 0 | 0 | 3,790 | |
of MFS Limited Maturity Fund* | | | | | | | | | | |
To MFS and MFS Related Entities of | 0 | | 0 | | 0 | | 0 | 0 | 3,790 | |
MFS Municipal Limited Maturity Fund* | | | | | | | | | | |
To MFS and MFS Related Entities | 0 | | 0 | | 0 | | 0 | 0 | 3,790 | |
of MFS Total Return Bond Fund* | | | | | | | | | | |
| | | | | | |
| Fees billed by Deloitte: | | | | | Aggregate Fees for Non-audit Services |
| | | | | | | 2024 | | 2023 | |
| To MFS Corporate Bond Fund, MFS and MFS Related | | 0 | | 3,790 | |
| Entities# | | | | | | | | | | |
| To MFS Limited Maturity Fund, MFS and MFS | | | | 0 | | 3,790 | |
| Related Entities# | | | | | | | | | | |
| To MFS Municipal Limited Maturity Fund, MFS and | | 0 | | 3,790 | |
| MFS Related Entities# | | | | | | | | | | |
| To MFS Total Return Bond Fund, MFS and MFS | | | | 0 | | 3,790 | |
| Related Entities# | | | | | | | | | | |
*This amount reflects the fees billed to MFS and MFS Related Entities for non-audit services relating directly to the operations and financial reporting of the Funds (portions of which services also related to the operations and financial reporting of other funds within the MFS Funds complex).
# This amount reflects the aggregate fees billed by Deloitte, as the case may be, for non-audit services rendered to the Funds and for non-audit services rendered to MFS and the MFS Related Entities.
1The fees included under “Audit-Related Fees” are fees related to assurance and related services that are reasonably related to the performance of the audit or review of financial statements, but not reported under ‘‘Audit Fees,’’ including accounting consultations, agreed-upon procedure reports, attestation reports, comfort letters and internal control reviews.
2The fees included under “Tax Fees” are fees associated with tax compliance, tax advice and tax planning, including services relating to the filing or amendment of federal, state or local income tax returns, regulated investment company qualification reviews and tax distribution and analysis.
3The fees included under “All Other Fees” are fees for products and services provided by Deloitte other than those reported under “Audit Fees,” “Audit-Related Fees” and “Tax Fees”.
Item 4(e)(1):
Set forth below are the policies and procedures established by the Audit Committee of the Board of Trustees relating to the pre- approval of audit and non-audit related services:
To the extent required by applicable law, pre-approval by the Audit Committee of the Board is needed for all audit and permissible non-audit services rendered to the Fund and all permissible non-audit services rendered to MFS or MFS Related Entities if the services relate directly to the operations and financial reporting of the Registrant. Pre-approval is currently on an engagement-by-engagement basis. In the event pre-approval of such services is necessary between regular meetings of the Audit Committee and it is not practical to wait to seek pre-approval at the next regular meeting of the Audit Committee, pre-approval of such services may be referred to the Chair of the Audit Committee for approval; provided that the Chair may not pre-approve any individual engagement for such services exceeding $50,000 or multiple engagements for such services in the aggregate exceeding $100,000 in each period between regular meetings of the Audit Committee. Any engagement pre-approved by the Chair between regular meetings of the Audit Committee shall be presented for ratification by the entire Audit Committee at its next regularly scheduled meeting.
Item 4(e)(2):
None, or 0%, of the services relating to the Audit-Related Fees, Tax Fees and All Other Fees paid by the Fund and MFS and MFS Related Entities relating directly to the operations and financial reporting of the Registrant disclosed above were approved by the audit committee pursuant to paragraphs (c)(7)(i)(C) of Rule 2-01 of Regulation S-X (which permits audit committee approval after the start of the engagement with respect to services other than audit, review or attest services, if certain conditions are satisfied).
Item 4(f):
Not applicable.
Item 4(h):
The Registrant’s Audit Committee has considered whether the provision by a Registrant’s independent registered public accounting firm of non-audit services to MFS and MFS Related Entities that were not pre-approved by the Committee (because such services did not relate directly to the operations and financial reporting of the Registrant) was compatible with maintaining the independence of the independent registered public accounting firm as the Registrant’s principal auditors.
Item 4(i):
Not applicable.
Item 4(j):
Not applicable.
ITEM 5. AUDIT COMMITTEE OF LISTED REGISTRANTS.
Not applicable to the Registrant.
ITEM 6. INVESTMENTS
A schedule of investments for each series covered by this Form N-CSR is included as part of the report to shareholders of such series under Item 1(a) of this Form N-CSR.
ITEM 7. DISCLOSURE OF PROXY VOTING POLICIES AND PROCEDURES FOR CLOSED-END MANAGEMENT INVESTMENT COMPANIES.
Not applicable to the Registrant.
ITEM 8. PORTFOLIO MANAGERS OF CLOSED-END MANAGEMENT INVESTMENT COMPANIES.
Not applicable to the Registrant.
ITEM 9. PURCHASES OF EQUITY SECURITIES BY CLOSED-END MANAGEMENT INVESTMENT COMPANY AND AFFILIATED PURCHASERS.
Not applicable to the Registrant.
ITEM 10. SUBMISSION OF MATTERS TO A VOTE OF SECURITY HOLDERS.
There were no material changes to the procedures by which shareholders may send recommendations to the Board for nominees to the Registrant’s Board since the Registrant last provided disclosure as to such procedures in response to the requirements of Item 407 (c)(2)(iv) of Regulation S-K or this Item.
ITEM 11. CONTROLS AND PROCEDURES.
(a)Based upon their evaluation of the effectiveness of the registrant’s disclosure controls and procedures (as defined in Rule 30a-3(c) under the Investment Company Act of 1940 (the “Act”)) as conducted within 90 days of the filing date of this report on Form N-CSR, the Registrant’s principal financial officer and principal executive officer have concluded that those disclosure controls and procedures provide reasonable assurance that the material information required to be disclosed by the Registrant on this report is recorded, processed, summarized and reported within the time periods specified in the Securities and Exchange Commission’s rules and forms.
(b)There were no changes in the Registrant’s internal controls over financial reporting (as defined in Rule 30a-3(d) under the Act) that occurred during the period covered by the report that have materially affected, or are reasonably likely to materially affect, the Registrant’s internal control over financial reporting.
ITEM 12. DISCLOSURE OF SECURITIES LENDING ACTIVITIES FOR CLOSED-END MANAGEMENT INVESTMENT COMPANIES.
Not applicable to the Registrant.
ITEM 13. RECOVERY OF ERRONEOUSLY AWARDED COMPENSATION.
Not Applicable.
ITEM 14. EXHIBITS.
(a)(1) Any code of ethics, or amendment thereto, that is the subject of the disclosure required by Item 2, to the extent that the registrant intends to satisfy the Item 2 requirements through filing of an exhibit: Attached hereto as EX-99.COE.
(2)A separate certification for each principal executive officer and principal financial officer of the registrant as required by Rule 30a-2(a) under the Act (17 CFR 270.30a-2): Attached hereto as EX-99.302CERT.
(3)Any written solicitation to purchase securities under Rule 23c-1 under the Act (17 CFR 270.23c-1) sent or given during the period covered by the report by or on behalf of the registrant to 10 or more persons. Not applicable.
(4)Change in the registrant’s independent public accountant. Not applicable.
(b)If the report is filed under Section 13(a) or 15(d) of the Exchange Act, provide the certifications required by Rule 30a-2(b) under the Act (17 CFR 270.30a-2(b)), Rule 13a-14(b) or Rule 15d-14(b) under the Exchange Act (17 CFR 240.13a-14(b) or 240.15d-14(b)) and Section 1350 of Chapter 63 of Title 18 of the United States Code (18 U.S.C. 1350) as an exhibit. A certification furnished pursuant to this paragraph will not be deemed “filed” for the purposes of Section 18 of the Exchange Act (15 U.S.C. 78r), or otherwise subject to the liability of that section. Such certification will not be deemed to be incorporated by reference into any filing under the Securities Act of 1933 or the Exchange Act, except to the extent that the registrant specifically incorporates it by reference. Attached hereto as EX-99.906CERT.
Notice
A copy of the Amended and Restated Declaration of Trust, as amended, of the Registrant is on file with the Secretary of State of The Commonwealth of Massachusetts and notice is hereby given that this instrument is executed on behalf of the Registrant by an officer of the Registrant as an officer and not individually and the obligations of or arising out of this instrument are not binding upon any of the Trustees or shareholders individually, but are binding only upon the assets and property of the respective constituent series of the Registrant.
SIGNATURES
Pursuant to the requirements of the Securities Exchange Act of 1934 and the Investment Company Act of 1940, the registrant has duly caused this report to be signed on its behalf by the undersigned, thereunto duly authorized.
(Registrant) MFS SERIES TRUST IX
By (Signature and Title)*
/S/ DAVID L. DILORENZO
David L. DiLorenzo, President
Date: June 20, 2024
Pursuant to the requirements of the Securities Exchange Act of 1934 and the Investment Company Act of 1940, this report has been signed below by the following persons on behalf of the registrant and in the capacities and on the dates indicated.
By (Signature and Title)*
/S/ DAVID L. DILORENZO
David L. DiLorenzo, President (Principal Executive Officer)
Date: June 20, 2024
By (Signature and Title)*
/S/ KASEY L. PHILLIPS
Kasey L. Phillips, Treasurer (Principal Financial Officer and Accounting Officer) Date: June 20, 2024
* Print name and title of each signing officer under his or her signature.