UNITED STATES
SECURITIES AND EXCHANGE COMMISSION
Washington, D.C. 20549
FORM N-CSR
CERTIFIED SHAREHOLDER REPORT OF
REGISTERED MANAGEMENT INVESTMENT COMPANIES
Investment Company Act file number 811-00859
MASSACHUSETTS INVESTORS GROWTH STOCK FUND
(Exact name of registrant as specified in charter)
500 Boylston Street, Boston, Massachusetts 02116
(Address of principal executive offices) (Zip code)
Susan S. Newton
Massachusetts Financial Services Company
500 Boylston Street
Boston, Massachusetts 02116
(Name and address of agents for service)
Registrant’s telephone number, including area code: (617) 954-5000
Date of fiscal year end: November 30
Date of reporting period: November 30, 2010
| ITEM 1. | REPORTS TO STOCKHOLDERS. |

Massachusetts Investors Growth Stock Fund
SIPC Contact Information:
You may obtain information about the Securities Investor Protection Corporation (“SIPC”), including the SIPC Brochure, by contacting SIPC either by telephone (202-371-8300) or by accessing SIPC’s website address (www.sipc.org).
The report is prepared for the general information of shareholders. It is authorized for distribution to prospective investors only when preceded or accompanied by a current prospectus.
NOT FDIC INSURED Ÿ MAY LOSE VALUE Ÿ
NO BANK GUARANTEE
11/30/10
MIG-ANN

LETTER FROM THE CEO
Dear Shareholders:
After an extended rebound in the financial markets, uncertainty returned in early 2010 as investors began to question the durability of the recovery for global economies and markets. That uncertainty led to increased risk aversion, especially as investors saw the eurozone struggle with the debt woes of many of its members. In September, the U.S. Federal Reserve Board’s promises to further loosen monetary policy helped assuage market fears and drive asset prices off their recent lows. A combination of solid earnings and improving economic data gave an additional boost to investor sentiment. As we begin 2011, we are cautiously optimistic that economic growth will continue to improve and that the global economies will recover from the shocks of the past few years. We expect the pace of recovery worldwide will be uneven and volatile.
As always, we continue to be mindful of the many challenges faced at the individual, national, and international levels. It is in times such as these that we want to remind investors of the merits of maintaining a long-term view, adhering to basic investing principles such as asset allocation and diversification, and working closely with their advisors to research and identify investment opportunities.
Respectfully,

Robert J. Manning
Chairman and Chief Executive Officer
MFS Investment Management®
January 14, 2011
The opinions expressed in this letter are subject to change, may not be relied upon for investment advice, and no forecasts can be guaranteed.
1
PORTFOLIO COMPOSITION
Portfolio structure

| | | | |
| Top ten holdings | | | | |
| Oracle Corp. | | | 4.0% | |
| Cisco Systems, Inc. | | | 3.8% | |
| Danaher Corp. | | | 3.7% | |
| International Business Machines Corp. | | | 3.3% | |
| Accenture Ltd., “A” | | | 3.2% | |
| Visa, Inc., “A” | | | 3.1% | |
| Apple, Inc. | | | 3.1% | |
| Colgate-Palmolive Co. | | | 2.9% | |
| Schlumberger Ltd. | | | 2.9% | |
| Thermo Fisher Scientific, Inc. | | | 2.5% | |
| | | | |
| Equity sectors | | | | |
| Technology | | | 25.0% | |
| Health Care | | | 14.0% | |
| Financial Services | | | 11.8% | |
| Consumer Staples | | | 11.7% | |
| Special Products & Services | | | 9.8% | |
| Energy | | | 7.5% | |
| Retailing | | | 7.3% | |
| Industrial Goods & Services | | | 6.9% | |
| Basic Materials | | | 3.1% | |
| Leisure | | | 1.7% | |
Percentages are based on net assets as of 11/30/10.
The portfolio is actively managed and current holdings may be different.
2
MANAGEMENT REVIEW
Summary of Results
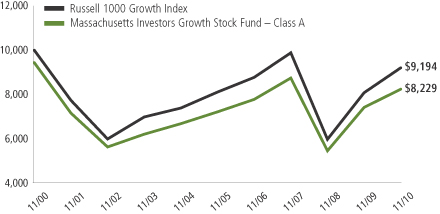
For the twelve months ended November 30, 2010, Class A shares of the Massachusetts Investors Growth Stock Fund (the “fund”) provided a total return of 11.08%, at net asset value. This compares with a return of 14.04% for the fund’s benchmark, the Russell 1000 Growth Index.
Market Environment
The first half of the reporting period witnessed a continuation of the financial market and macroeconomic rebounds that had begun in early 2009. These recoveries in global activity and asset valuations were generally synchronized around the world, led importantly by emerging Asian economies, but broadening to include most of the global economy to varying degrees. Primary drivers of the recoveries included an unwinding of the inventory destocking that took place earlier, the production of manufacturing and capital goods, as well as massive fiscal and monetary stimulus.
During the second half of the period, heightened risk surrounding the public-debt profiles of several of the peripheral European countries impaired market sentiment. At the same time, the improving trend in global macroeconomic data began to weaken somewhat. These two dynamics caused many asset prices to retrench significantly, as many questioned the durability of the global recovery.
Towards the end of the period, the U.S. Federal Reserve led markets to believe that further monetary loosening would be forthcoming if macroeconomic activity did not show signs of improvement. The prospects for more easing by the Fed improved market sentiment and drove risk-asset prices markedly higher. However, in a text-book case of “buy the rumor, sell the fact,” the weeks following the early November announcement of further quantitative easing saw a sell-off in U.S. Treasury bonds. This rise in Treasury yields occurred despite risk-off behavior in equities and credit markets (which would normally result in Treasury yield compression), and appears to have been the result of a few factors: signs of improved U.S. economic activity; opposition to quantitative easing from some quarters; and crowded long positions in U.S. Treasuries.
Detractors from Performance
A combination of security selection and an overweight position in the financial services sector detracted from the fund’s performance relative to the Russell 1000 Growth Index. The fund’s overweight position in securities brokerage firm Charles Schwab Corp., derivatives exchange Chicago Mercantile Exchange, financial services provider Bank of New York Mellon, and credit
3
Management Review – continued
card company Mastercard Inc. were among the fund’s top relative detractors. Shares of Charles Schwab declined during the reporting period due to lower online fees as well as less trading activity by individual investors.
A combination of security selection and an overweight position in the health care sector hindered relative performance. The fund’s overweight positions in medical equipment company DENTSPLY International, Inc. and medical device maker Medtronic dampened relative results. DENTSPLY lost market share due to increased competition. The dental industry is experiencing slow domestic growth as well as unfavorable impacts from relative currency rates which have weighed upon earnings.
Elsewhere, the fund’s holdings of network equipment company Cisco Systems, household products maker Colgate-Palmolive Co., and business information provider Dun & Bradstreet Corp. detracted from relative returns. Shares of Cisco declined on weaker-than-forecasted sales which led to a downward revision of their sales forecasts. The fund’s underweight position of strong-performing personal electronics maker Apple Inc. also negatively impacted relative returns.
During the reporting period, the fund’s currency exposure was a detractor from relative performance. All of MFS’ investment decisions are driven by the fundamentals of each individual opportunity and as such, it is common for our portfolios to have different currency exposure than the benchmark.
Contributors to Performance
During the reporting period, the fund benefited from a non-recurring
settlement of an administrative proceeding and from a non-recurring litigation
settlement against Tyco International Ltd.
Security selection in the energy sector also bolstered relative performance during the reporting period. Holdings of oil field services company Schlumberger Ltd. and oil and gas drilling equipment manufacturer National-Oilwell Varco Inc. (b) were among the fund’s top relative contributors. National-Oilwell experienced share appreciation due to stronger-than-expected domestic demand for their drilling products. The company announced the purchase of Brush Engineered Materials’ turret mooring business which is anticipated to present future business opportunities over the next decade.
Stock selection in the retailing sector aided the fund’s relative performance. Holdings of athletic shoe and apparel maker NIKE Inc. and luxury goods company LVMH Moët Hennessy Louis Vuitton (b) (France) were among the fund’s top relative contributors over the reporting period. Shares of Louis Vuitton increased due to rising profits attributed to an increase in demand for luxury goods in China as well as U.S. and European retailers restocking their inventories following the recession.
4
Management Review – continued
Elsewhere, our holdings of semiconductor manufacturer Microchip Technology and enterprise software products maker Oracle aided relative performance. Shares of Oracle grew on strong profits, supported by the company’s expansion into computer hardware. Oracle is relying on hardware to spur a new wave of growth, driven by their acquisition of Sun Microsystems. The fund’s overweight position in food company Mead Johnson Nutrition also contributed to relative returns. Not holding weak-performing software giant Microsoft, retail giant Wal-Mart, and biotech firm Gilead Sciences also contributed to relative returns.
Respectfully,
Jeffrey Constantino
Portfolio Manager
| (b) | Security is not a benchmark constituent. |
The views expressed in this report are those of the portfolio manager only through the end of the period of the report as stated on the cover and do not necessarily reflect the views of MFS or any other person in the MFS organization. These views are subject to change at any time based on market or other conditions, and MFS disclaims any responsibility to update such views. These views may not be relied upon as investment advice or an indication of trading intent on behalf of any MFS portfolio. References to specific securities are not recommendations of such securities, and may not be representative of any MFS portfolio’s current or future investments.
5
PERFORMANCE SUMMARY THROUGH 11/30/10
The following chart illustrates a representative class of the fund’s historical performance in comparison to its benchmark(s). Performance results include the deduction of the maximum applicable sales charge and reflect the percentage change in net asset value, including reinvestment of dividends and capital gains distributions. The performance of other share classes will be greater than or less than that of the class depicted below. Benchmarks are unmanaged and may not be invested in directly. Benchmark returns do not reflect sales charges, commissions or expenses. (See Notes to Performance Summary.)
Performance data shown represents past performance and is no guarantee of future results. Investment return and principal value fluctuate so your shares, when sold, may be worth more or less than the original cost; current performance may be lower or higher than quoted. The performance shown does not reflect the deduction of taxes, if any, that a shareholder would pay on fund distributions or the redemption of fund shares.
Growth of a Hypothetical $10,000 Investment
6
Performance Summary – continued
Total Returns through 11/30/10
Average annual without sales charge
| | | | | | | | | | | | | | |
| | | Share class | | Class inception date | | 1-yr | | 5-yr | | 10-yr | | Life (t) | | |
| | | A | | 1/01/35 | | 11.08% | | 2.72% | | (1.35)% | | N/A | | |
| | | B | | 9/07/93 | | 10.33% | | 2.04% | | (1.99)% | | N/A | | |
| | | C | | 11/03/97 | | 10.29% | | 2.05% | | (1.99)% | | N/A | | |
| | | I | | 1/02/97 | | 11.46% | | 3.07% | | (1.00)% | | N/A | | |
| | | R1 | | 4/01/05 | | 10.42% | | 1.99% | | N/A | | 3.04% | | |
| | | R2 | | 10/31/03 | | 10.90% | | 2.50% | | N/A | | 3.84% | | |
| | | R3 | | 4/01/05 | | 11.25% | | 2.73% | | N/A | | 3.80% | | |
| | | R4 | | 4/01/05 | | 11.49% | | 3.04% | | N/A | | 4.11% | | |
| | | 529A | | 7/31/02 | | 10.97% | | 2.53% | | N/A | | 4.82% | | |
| | | 529B | | 7/31/02 | | 10.23% | | 1.86% | | N/A | | 4.16% | | |
| | | 529C | | 7/31/02 | | 10.28% | | 1.87% | | N/A | | 4.16% | | |
| Comparative benchmark | | | | | | | | | | |
| | | Russell 1000 Growth Index (f) | | 14.04% | | 2.58% | | (0.84)% | | N/A | | |
| Average annual with sales charge | | | | | | | | | | |
| | | A
With Initial Sales Charge (5.75%) | | 4.69% | | 1.51% | | (1.93)% | | N/A | | |
| | | B
With CDSC (Declining over six years from 4% to 0%) (x) | | 6.33% | | 1.67% | | (1.99)% | | N/A | | |
| | | C
With CDSC (1% for 12 months) (x) | | 9.29% | | 2.05% | | (1.99)% | | N/A | | |
| | | 529A
With Initial Sales Charge (5.75%) | | 4.59% | | 1.32% | | N/A | | 4.08% | | |
| | | 529B
With CDSC (Declining over six years from 4% to 0%) (x) | | 6.23% | | 1.49% | | N/A | | 4.16% | | |
| | | 529C
With CDSC (1% for 12 months) (x) | | 9.28% | | 1.87% | | N/A | | 4.16% | | |
Class I, R1, R2, R3, and R4 shares do not have a sales charge.
CDSC – Contingent Deferred Sales Charge.
| (f) | Source: FactSet Research Systems Inc. |
| (t) | For the period from the class inception date through the stated period end (for those share classes with less than 10 years of performance history). No comparative benchmark performance information is provided for “life” periods. (See Notes to Performance Summary.) |
| (x) | Assuming redemption at the end of the applicable period. |
Included in the Class A, Class B, Class C, Class I, Class R1, Class R2, Class R3, Class R4, Class 529A, Class 529B, and Class 529C total returns for the year ended November 30, 2010 are proceeds received from a non-
7
Performance Summary – continued
recurring litigation settlement against Tyco International Ltd. Had these proceeds not been included the 1-year total returns would have been lower by 0.73%, 0.72%, 0.72%, 0.73%, 0.72%, 0.72%, 0.73%, 0.73%, 0.72%, 0.72%, and 0.72%, respectively. Also included in the Class A, Class B, Class C, Class I, Class R1, Class R2, Class R3, Class R4, Class 529A, Class 529B, and Class 529C total returns for the year ended November 30, 2010 are proceeds received from a non-recurring administrative proceeding concerning market timing. Had these proceeds not been included the 1-year total returns would have been lower by 1.14%, 1.13%, 1.13%, 1.14%, 1.13%, 1.14%, 1.14%, 1.14%, 1.14%, 1.13%, and 1.13%, respectively.
Benchmark Definition
Russell 1000 Growth Index—constructed to provide a comprehensive barometer for growth securities in the large-cap segment of the U.S. equity universe. Companies in this index generally have higher price-to-book ratios and higher forecasted growth values.
It is not possible to invest directly in an index.
Notes to Performance Summary
Class 529 shares are only available in conjunction with qualified tuition programs, such as the MFS 529 Savings Plan. There also is an additional fee, which is detailed in the program description, on qualified tuition programs. If this fee was reflected, the performance for Class 529 shares would have been lower. This annual fee is waived for Oregon residents and for those accounts with assets of $25,000 or more.
Average annual total return represents the average annual change in value for each share class for the periods presented. Life returns are presented where the share class has less than 10 years of performance history and represent the average annual total return from the class inception date to the stated period end date. As the fund’s share classes may have different inception dates, the life returns may represent different time periods and may not be comparable. As a result, no comparative benchmark performance information is provided for life periods.
Performance results reflect any applicable expense subsidies and waivers in effect during the periods shown. Without such subsidies and waivers the fund’s performance results would be less favorable. Please see the prospectus and financial statements for complete details.
From time to time the fund may receive proceeds from litigation settlements, without which performance would be lower.
8
EXPENSE TABLE
Fund expenses borne by the shareholders during the period, June 1, 2010 through November 30, 2010
As a shareholder of the fund, you incur two types of costs: (1) transaction costs, including sales charges (loads) on certain purchase or redemption payments, and (2) ongoing costs, including management fees; distribution and service (12b-1) fees; and other fund expenses. This example is intended to help you understand your ongoing costs (in dollars) of investing in the fund and to compare these costs with the ongoing costs of investing in other mutual funds.
The example is based on an investment of $1,000 invested at the beginning of the period and held for the entire period June 1, 2010 through November 30, 2010.
Actual Expenses
The first line for each share class in the following table provides information about actual account values and actual expenses. You may use the information in this line, together with the amount you invested, to estimate the expenses that you paid over the period. Simply divide your account value by $1,000 (for example, an $8,600 account value divided by $1,000 = 8.6), then multiply the result by the number in the first line under the heading entitled “Expenses Paid During Period” to estimate the expenses you paid on your account during this period.
Hypothetical Example for Comparison Purposes
The second line for each share class in the following table provides information about hypothetical account values and hypothetical expenses based on the fund’s actual expense ratio and an assumed rate of return of 5% per year before expenses, which is not the fund’s actual return. The hypothetical account values and expenses may not be used to estimate the actual ending account balance or expenses you paid for the period. You may use this information to compare the ongoing costs of investing in the fund and other funds. To do so, compare this 5% hypothetical example with the 5% hypothetical examples that appear in the shareholder reports of the other funds.
Please note that the expenses shown in the table are meant to highlight your ongoing costs only and do not reflect any transactional costs, such as sales charges (loads). Therefore, the second line for each share class in the table is useful in comparing ongoing costs only, and will not help you determine the relative total costs of owning different funds. In addition, if these transactional costs were included, your costs would have been higher.
9
Expense Table – continued
| | | | | | | | | | | | | | | | | | |
Share
Class | | | | Annualized
Expense Ratio | | | Beginning
Account Value
6/01/10 | | | Ending
Account Value
11/30/10 | | | Expenses
Paid During
Period (p)
6/01/10-11/30/10 | |
| A | | Actual | | | 0.94% | | | | $1,000.00 | | | | $1,123.34 | | | | $5.00 | |
| | Hypothetical (h) | | | 0.94% | | | | $1,000.00 | | | | $1,020.36 | | | | $4.76 | |
| B | | Actual | | | 1.59% | | | | $1,000.00 | | | | $1,119.58 | | | | $8.45 | |
| | Hypothetical (h) | | | 1.59% | | | | $1,000.00 | | | | $1,017.10 | | | | $8.04 | |
| C | | Actual | | | 1.59% | | | | $1,000.00 | | | | $1,119.23 | | | | $8.45 | |
| | Hypothetical (h) | | | 1.59% | | | | $1,000.00 | | | | $1,017.10 | | | | $8.04 | |
| I | | Actual | | | 0.59% | | | | $1,000.00 | | | | $1,124.52 | | | | $3.14 | |
| | Hypothetical (h) | | | 0.59% | | | | $1,000.00 | | | | $1,022.11 | | | | $2.99 | |
| R1 | | Actual | | | 1.59% | | | | $1,000.00 | | | | $1,119.55 | | | | $8.45 | |
| | Hypothetical (h) | | | 1.59% | | | | $1,000.00 | | | | $1,017.10 | | | | $8.04 | |
| R2 | | Actual | | | 1.09% | | | | $1,000.00 | | | | $1,122.42 | | | | $5.80 | |
| | Hypothetical (h) | | | 1.09% | | | | $1,000.00 | | | | $1,019.60 | | | | $5.52 | |
| R3 | | Actual | | | 0.84% | | | | $1,000.00 | | | | $1,124.02 | | | | $4.47 | |
| | Hypothetical (h) | | | 0.84% | | | | $1,000.00 | | | | $1,020.86 | | | | $4.26 | |
| R4 | | Actual | | | 0.59% | | | | $1,000.00 | | | | $1,124.90 | | | | $3.14 | |
| | Hypothetical (h) | | | 0.59% | | | | $1,000.00 | | | | $1,022.11 | | | | $2.99 | |
| 529A | | Actual | | | 1.04% | | | | $1,000.00 | | | | $1,122.05 | | | | $5.53 | |
| | Hypothetical (h) | | | 1.04% | | | | $1,000.00 | | | | $1,019.85 | | | | $5.27 | |
| 529B | | Actual | | | 1.69% | | | | $1,000.00 | | | | $1,118.84 | | | | $8.98 | |
| | Hypothetical (h) | | | 1.69% | | | | $1,000.00 | | | | $1,016.60 | | | | $8.54 | |
| 529C | | Actual | | | 1.69% | | | | $1,000.00 | | | | $1,118.38 | | | | $8.97 | |
| | Hypothetical (h) | | | 1.69% | | | | $1,000.00 | | | | $1,016.60 | | | | $8.54 | |
| (h) | 5% class return per year before expenses. |
| (p) | Expenses paid is equal to each class’ annualized expense ratio, as shown above, multiplied by the average account value over the period, multiplied by the number of days in the period, divided by the number of days in the year. Expenses paid do not include any applicable sales charges (loads). If these transaction costs had been included, your costs would have been higher. |
10
PORTFOLIO OF INVESTMENTS
11/30/10
The Portfolio of Investments is a complete list of all securities owned by your fund. It is categorized by broad-based asset classes.
| | | | | | | | |
| Common Stocks - 98.8% | | | | | | | | |
| Issuer | | Shares/Par | | | Value ($) | |
| | | | | | | | |
| Aerospace - 2.7% | | | | | | | | |
| Precision Castparts Corp. | | | 82,230 | | | $ | 11,353,496 | |
| United Technologies Corp. | | | 920,540 | | | | 69,289,046 | |
| | | | | | | | |
| | | | | | | $ | 80,642,542 | |
| Alcoholic Beverages - 1.8% | | | | | | | | |
| Companhia de Bebidas das Americas, ADR | | | 140,120 | | | $ | 19,005,877 | |
| Diageo PLC | | | 2,006,287 | | | | 35,700,569 | |
| | | | | | | | |
| | | | | | | $ | 54,706,446 | |
| Apparel Manufacturers - 3.1% | | | | | | | | |
| LVMH Moet Hennessy Louis Vuitton S.A. (l) | | | 245,056 | | | $ | 37,169,394 | |
| NIKE, Inc., “B” | | | 629,300 | | | | 54,201,609 | |
| | | | | | | | |
| | | | | | | $ | 91,371,003 | |
| Broadcasting - 0.4% | | | | | | | | |
| Omnicom Group, Inc. | | | 235,950 | | | $ | 10,721,568 | |
| | |
| Brokerage & Asset Managers - 4.7% | | | | | | | | |
| Charles Schwab Corp. | | | 3,659,780 | | | $ | 55,006,493 | |
| CME Group, Inc. | | | 152,950 | | | | 44,058,777 | |
| Franklin Resources, Inc. | | | 342,330 | | | | 39,056,430 | |
| | | | | | | | |
| | | | | | | $ | 138,121,700 | |
| Business Services - 9.8% | | | | | | | | |
| Accenture Ltd., “A” | | | 2,215,000 | | | $ | 95,953,800 | |
| Automatic Data Processing, Inc. | | | 177,600 | | | | 7,915,632 | |
| Dun & Bradstreet Corp. | | | 895,970 | | | | 67,502,380 | |
| MSCI, Inc., “A” (a) | | | 1,450,171 | | | | 49,392,824 | |
| Verisk Analytics, Inc., “A” (a) | | | 1,862,670 | | | | 56,383,021 | |
| Western Union Co. | | | 679,010 | | | | 11,977,736 | |
| | | | | | | | |
| | | | | | | $ | 289,125,393 | |
| Cable TV - 1.3% | | | | | | | | |
| DIRECTV, “A” (a) | | | 922,460 | | | $ | 38,309,764 | |
| | |
| Chemicals - 1.0% | | | | | | | | |
| Monsanto Co. | | | 483,100 | | | $ | 28,947,352 | |
11
Portfolio of Investments – continued
| | | | | | | | |
| Issuer | | Shares/Par | | | Value ($) | |
| | | | | | | | |
| Common Stocks - continued | | | | | | | | |
| Computer Software - 5.3% | | | | | | | | |
| Autodesk, Inc. (a) | | | 1,041,010 | | | $ | 36,737,243 | |
| Oracle Corp. (s) | | | 4,430,660 | | | | 119,805,046 | |
| | | | | | | | |
| | | | | | | $ | 156,542,289 | |
| Computer Software - Systems - 9.0% | | | | | | | | |
| Apple, Inc. (a) | | | 297,230 | | | $ | 92,483,115 | |
| EMC Corp. (a) | | | 1,412,988 | | | | 30,365,112 | |
| Hewlett-Packard Co. | | | 1,104,740 | | | | 46,321,748 | |
| International Business Machines Corp. | | | 683,540 | | | | 96,693,568 | |
| | | | | | | | |
| | | | | | | $ | 265,863,543 | |
| Consumer Products - 5.8% | | | | | | | | |
| Church & Dwight Co., Inc. | | | 626,180 | | | $ | 40,858,245 | |
| Colgate-Palmolive Co. | | | 1,138,610 | | | | 87,160,596 | |
| Procter & Gamble Co. | | | 723,326 | | | | 44,173,519 | |
| | | | | | | | |
| | | | | | | $ | 172,192,360 | |
| Electrical Equipment - 4.2% | | | | | | | | |
| Danaher Corp. (s) | | | 2,559,700 | | | $ | 110,707,025 | |
| W.W. Grainger, Inc. | | | 98,190 | | | | 12,266,877 | |
| | | | | | | | |
| | | | | | | $ | 122,973,902 | |
| Electronics - 4.4% | | | | | | | | |
| Microchip Technology, Inc. (l) | | | 1,522,740 | | | $ | 51,179,291 | |
| Samsung Electronics Co. Ltd., GDR | | | 37,991 | | | | 13,296,850 | |
| Taiwan Semiconductor Manufacturing Co. Ltd., ADR | | | 6,038,121 | | | | 64,909,801 | |
| | | | | | | | |
| | | | | | | $ | 129,385,942 | |
| Energy - Integrated - 2.4% | | | | | | | | |
| Chevron Corp. | | | 318,920 | | | $ | 25,822,952 | |
| Exxon Mobil Corp. | | | 418,300 | | | | 29,096,948 | |
| Hess Corp. | | | 224,839 | | | | 15,749,972 | |
| | | | | | | | |
| | | | | | | $ | 70,669,872 | |
| Food & Beverages - 4.1% | | | | | | | | |
| Groupe Danone | | | 663,300 | | | $ | 38,852,470 | |
| Mead Johnson Nutrition Co., “A” | | | 243,820 | | | | 14,524,357 | |
| PepsiCo, Inc. | | | 1,070,678 | | | | 69,197,919 | |
| | | | | | | | |
| | | | | | | $ | 122,574,746 | |
| Food & Drug Stores - 0.8% | | | | | | | | |
| CVS Caremark Corp. | | | 771,666 | | | $ | 23,921,646 | |
12
Portfolio of Investments – continued
| | | | | | | | |
| Issuer | | Shares/Par | | | Value ($) | |
| | | | | | | | |
| Common Stocks - continued | | | | | | | | |
| General Merchandise - 2.5% | | | | | | | | |
| Kohl’s Corp. (a) | | | 773,440 | | | $ | 43,637,485 | |
| Target Corp. | | | 511,960 | | | | 29,151,002 | |
| | | | | | | | |
| | | | | | | $ | 72,788,487 | |
| Internet - 2.5% | | | | | | | | |
| eBay, Inc. (a) | | | 569,670 | | | $ | 16,594,487 | |
| Google, Inc., “A” (a) | | | 101,680 | | | | 56,504,593 | |
| | | | | | | | |
| | | | | | | $ | 73,099,080 | |
| Major Banks - 2.6% | | | | | | | | |
| Bank of New York Mellon Corp. | | | 470,402 | | | $ | 12,696,150 | |
| State Street Corp. | | | 1,471,992 | | | | 63,590,054 | |
| | | | | | | | |
| | | | | | | $ | 76,286,204 | |
| Medical & Health Technology & Services - 1.5% | | | | | | | | |
| Medco Health Solutions, Inc. (a) | | | 182,630 | | | $ | 11,198,872 | |
| Patterson Cos., Inc. | | | 879,440 | | | | 26,145,751 | |
| VCA Antech, Inc. (a) | | | 364,520 | | | | 7,962,939 | |
| | | | | | | | |
| | | | | | | $ | 45,307,562 | |
| Medical Equipment - 9.2% | | | | | | | | |
| Becton, Dickinson & Co. | | | 516,410 | | | $ | 40,243,831 | |
| DENTSPLY International, Inc. | | | 1,917,280 | | | | 59,282,298 | |
| Medtronic, Inc. | | | 1,121,680 | | | | 37,609,930 | |
| St. Jude Medical, Inc. (a) | | | 343,250 | | | | 13,280,343 | |
| Synthes, Inc. | | | 200,776 | | | | 24,565,628 | |
| Thermo Fisher Scientific, Inc. (a) | | | 1,461,820 | | | | 74,348,165 | |
| Waters Corp. (a) | | | 304,740 | | | | 23,425,364 | |
| | | | | | | | |
| | | | | | | $ | 272,755,559 | |
| Metals & Mining - 0.8% | | | | | | | | |
| BHP Billiton Ltd., ADR | | | 271,030 | | | $ | 22,332,872 | |
| | |
| Network & Telecom - 3.8% | | | | | | | | |
| Cisco Systems, Inc. (a)(s) | | | 5,858,920 | | | $ | 112,256,907 | |
| | |
| Oil Services - 5.1% | | | | | | | | |
| National Oilwell Varco, Inc. | | | 1,107,173 | | | $ | 67,858,633 | |
| Schlumberger Ltd. | | | 1,091,460 | | | | 84,413,516 | |
| | | | | | | | |
| | | | | | | $ | 152,272,149 | |
| Other Banks & Diversified Financials - 4.5% | | | | | | | | |
| MasterCard, Inc., “A” | | | 174,350 | | | $ | 41,326,181 | |
13
Portfolio of Investments – continued
| | | | | | | | |
| Issuer | | Shares/Par | | | Value ($) | |
| | | | | | | | |
| Common Stocks - continued | | | | | | | | |
| Other Banks & Diversified Financials - continued | | | | | | | | |
| Visa, Inc., “A” | | | 1,255,980 | | | $ | 92,754,123 | |
| | | | | | | | |
| | | | | | | $ | 134,080,304 | |
| Pharmaceuticals - 3.3% | | | | | | | | |
| Abbott Laboratories | | | 501,770 | | | $ | 23,337,323 | |
| Allergan, Inc. | | | 284,860 | | | | 18,877,672 | |
| Johnson & Johnson | | | 896,190 | | | | 55,160,495 | |
| | | | | | | | |
| | | | | | | $ | 97,375,490 | |
| Specialty Chemicals - 1.3% | | | | | | | | |
| Praxair, Inc. | | | 426,230 | | | $ | 39,234,472 | |
| | |
| Specialty Stores - 0.9% | | | | | | | | |
| Staples, Inc. | | | 1,269,530 | | | $ | 27,942,355 | |
| Total Common Stocks (Identified Cost, $2,697,362,723) | | | | | | $ | 2,921,801,509 | |
| | |
| Money Market Funds (v) - 1.2% | | | | | | | | |
MFS Institutional Money Market Portfolio, 0.22%,
at Cost and Net Asset Value | | | 36,783,635 | | | $ | 36,783,635 | |
| | |
| Collateral for Securities Loaned - 1.8% | | | | | | | | |
| Morgan Stanley Repurchase Agreement, 0.23%, dated 11/30/10, due 12/1/10, total to be received $53,964,359 (secured by U.S. Treasury and Federal Agency obligations valued at $55,043,361 in an individually traded account), at Cost | | $ | 53,964,014 | | | $ | 53,964,014 | |
| Total Investments (Identified Cost, $2,788,110,372) | | | | | | $ | 3,012,549,158 | |
| | |
| Other Assets, Less Liabilities - (1.8)% | | | | | | | (53,646,746 | ) |
| Net Assets - 100.0% | | | | | | $ | 2,958,902,412 | |
| (a) | Non-income producing security. |
| (l) | All or a portion of this security is on loan. |
| (s) | Security or a portion of the security was pledged to cover collateral requirements for securities sold short. At November 30, 2010, the value of securities pledged amounted to $174,277. At November 30, 2010, the fund had no short sales outstanding. |
| (v) | Underlying fund that is available only to investment companies managed by MFS. The rate quoted is the annualized seven-day yield of the fund at period end. |
The following abbreviations are used in this report and are defined:
| ADR | | American Depository Receipt |
| GDR | | Global Depository Receipt |
| PLC | | Public Limited Company |
See Notes to Financial Statements
14
Financial Statements
STATEMENT OF ASSETS AND LIABILITIES
At 11/30/10
This statement represents your fund’s balance sheet, which details the assets and liabilities comprising the total value of the fund.
| | | | |
| Assets | | | | |
Investments- | | | | |
Non-affiliated issuers, at value (identified cost, $2,751,326,737) | | | $2,975,765,523 | |
Underlying funds, at cost and value | | | 36,783,635 | |
Total investments, at value, including $51,380,643 of securities on loan (identified cost, $2,788,110,372) | | | $3,012,549,158 | |
Receivables for | | | | |
Fund shares sold | | | 927,965 | |
Interest and dividends | | | 4,487,703 | |
Other assets | | | 56,523 | |
Total assets | | | $3,018,021,349 | |
| Liabilities | | | | |
Payables for | | | | |
Fund shares reacquired | | | $3,626,365 | |
Collateral for securities loaned, at value | | | 53,964,014 | |
Payable to affiliates | | | | |
Investment adviser | | | 54,013 | |
Shareholder servicing costs | | | 958,524 | |
Distribution and service fees | | | 68,483 | |
Administrative services fee | | | 2,075 | |
Program manager fees | | | 36 | |
Payable for independent Trustees’ compensation | | | 243,857 | |
Accrued expenses and other liabilities | | | 201,570 | |
Total liabilities | | | $59,118,937 | |
Net assets | | | $2,958,902,412 | |
| Net assets consist of | | | | |
Paid-in capital | | | $3,352,935,889 | |
Unrealized appreciation (depreciation) on investments and translation of assets and liabilities in foreign currencies | | | 224,579,378 | |
Accumulated net realized gain (loss) on investments and foreign currency transactions | | | (632,033,335 | ) |
Undistributed net investment income | | | 13,420,480 | |
Net assets | | | $2,958,902,412 | |
Shares of beneficial interest outstanding | | | 208,654,926 | |
15
Statement of Assets and Liabilities – continued
| | | | | | | | | | | | |
| | | Net assets | | | Shares
outstanding | | | Net asset value
per share (a) | |
Class A | | | $2,354,750,874 | | | | 163,653,191 | | | | $14.39 | |
Class B | | | 168,679,207 | | | | 13,055,688 | | | | 12.92 | |
Class C | | | 203,859,780 | | | | 15,847,132 | | | | 12.86 | |
Class I | | | 70,064,435 | | | | 4,758,300 | | | | 14.72 | |
Class R1 | | | 6,554,562 | | | | 511,029 | | | | 12.83 | |
Class R2 | | | 36,419,685 | | | | 2,579,132 | | | | 14.12 | |
Class R3 | | | 50,795,436 | | | | 3,547,681 | | | | 14.32 | |
Class R4 | | | 61,375,532 | | | | 4,233,537 | | | | 14.50 | |
Class 529A | | | 4,116,570 | | | | 288,862 | | | | 14.25 | |
Class 529B | | | 712,141 | | | | 56,037 | | | | 12.71 | |
Class 529C | | | 1,574,190 | | | | 124,337 | | | | 12.66 | |
| (a) | Maximum offering price per share was equal to the net asset value per share for all share classes, except for Classes A and 529A, for which the maximum offering prices per share were $15.27 [100 / 94.25 x $14.39] and $15.12 [100 / 94.25 x $14.25], respectively. On sales of $50,000 or more, the maximum offering prices of Class A and Class 529A shares are reduced. A contingent deferred sales charge may be imposed on redemptions of Class A, Class B, Class C, Class 529B, and Class 529C shares. Redemption price per share was equal to the net asset value per share for Classes I, R1, R2, R3, R4, and 529A. |
See Notes to Financial Statements
16
Financial Statements
STATEMENT OF OPERATIONS
Year ended 11/30/10
This statement describes how much your fund earned in investment income and accrued in expenses. It also describes any gains and/or losses generated by fund operations.
| | | | |
| Net investment income | | | | |
Income | | | | |
Dividends | | | $40,463,924 | |
Other (t) | | | 3,151,700 | |
Interest | | | 359,474 | |
Dividends from underlying funds | | | 66,052 | |
Foreign taxes withheld | | | (324,830 | ) |
Total investment income | | | $43,716,320 | |
Expenses | | | | |
Management fee | | | $9,613,250 | |
Distribution and service fees | | | 12,488,760 | |
Program manager fees | | | 5,962 | |
Shareholder servicing costs | | | 6,372,406 | |
Administrative services fee | | | 408,977 | |
Independent Trustees’ compensation | | | 99,015 | |
Custodian fee | | | 181,420 | |
Shareholder communications | | | 384,347 | |
Auditing fees | | | 60,665 | |
Legal fees | | | 48,149 | |
Miscellaneous | | | 266,615 | |
Total expenses | | | $29,929,566 | |
Fees paid indirectly | | | (158 | ) |
Reduction of expenses by investment adviser | | | (14,161 | ) |
Net expenses | | | $29,915,247 | |
Net investment income | | | $13,801,073 | |
Realized and unrealized gain (loss) on investments
and foreign currency transactions | | | | |
Realized gain (loss) (identified cost basis) | | | | |
Investment transactions (s)(t) | | | $264,719,276 | |
Foreign currency transactions | | | (23,682 | ) |
Net realized gain (loss) on investments
and foreign currency transactions | | | $264,695,594 | |
Change in unrealized appreciation (depreciation) | | | | |
Investments | | | $24,498,014 | |
Translation of assets and liabilities in foreign currencies | | | 6,967 | |
Net unrealized gain (loss) on investments
and foreign currency translation | | | $24,504,981 | |
Net realized and unrealized gain (loss) on investments
and foreign currency | | | $289,200,575 | |
Change in net assets from operations | | | $303,001,648 | |
| (s) | Realized gain (loss) on investment transactions includes proceeds received from a non-recurring cash settlement in the amount of $17,505,707 from a litigation settlement against Tyco International Ltd. |
| (t) | Realized gain (loss) on investment transactions includes $27,976,203 and other income includes $3,151,700 of proceeds received from a non-recurring administrative proceeding concerning market timing. |
See Notes to Financial Statements
17
Financial Statements
STATEMENTS OF CHANGES IN NET ASSETS
These statements describe the increases and/or decreases in net assets resulting from operations, any distributions, and any shareholder transactions.
| | | | | | | | |
| | | Years ended 11/30 | |
| | | 2010 | | | 2009 | |
| Change in net assets | | | | | | |
| From operations | | | | | | | | |
Net investment income | | | $13,801,073 | | | | $11,039,838 | |
Net realized gain (loss) on investments and foreign currency transactions | | | 264,695,594 | | | | (347,271,048 | ) |
Net unrealized gain (loss) on investments and foreign currency translation | | | 24,504,981 | | | | 1,149,051,578 | |
Change in net assets from operations | | | $303,001,648 | | | | $812,820,368 | |
| Distributions declared to shareholders | | | | | | | | |
From net investment income | | | $(11,001,496 | ) | | | $(13,648,901 | ) |
Change in net assets from fund share transactions | | | $(292,119,883 | ) | | | $(347,706,831 | ) |
Total change in net assets | | | $(119,731 | ) | | | $451,464,636 | |
| Net assets | | | | | | | | |
At beginning of period | | | 2,959,022,143 | | | | 2,507,557,507 | |
At end of period (including undistributed net investment income of $13,420,480 and $10,644,585, respectively) | | | $2,958,902,412 | | | | $2,959,022,143 | |
See Notes to Financial Statements
18
Financial Statements
FINANCIAL HIGHLIGHTS
The financial highlights table is intended to help you understand the fund’s financial performance for the past 5 years. Certain information reflects financial results for a single fund share. The total returns in the table represent the rate by which an investor would have earned (or lost) on an investment in the fund share class (assuming reinvestment of all distributions) held for the entire period.
| | | | | | | | | | | | | | | | | | | | |
| Class A | | Years ended 11/30 | |
| | | 2010 | | | 2009 | | | 2008 | | | 2007 | | | 2006 | |
Net asset value, beginning of period | | | $13.01 | | | | $9.60 | | | | $15.49 | | | | $13.79 | | | | $12.77 | |
Income (loss) from investment
operations | | | | | | | | | | | | | | | | | | | | |
Net investment income (d) | | | $0.07 | | | | $0.06 | | | | $0.06 | | | | $0.06 | | | | $0.02 | |
Net realized and unrealized gain (loss)
on investments and foreign currency | | | 1.37 | | | | 3.41 | | | | (5.89 | ) | | | 1.64 | | | | 1.00 | |
Total from investment operations | | | $1.44 | | | | $3.47 | | | | $(5.83 | ) | | | $1.70 | | | | $1.02 | |
| Less distributions declared to shareholders | | | | | | | | | | | | | | | | | |
From net investment income | | | $(0.06 | ) | | | $(0.06 | ) | | | $(0.06 | ) | | | $— | | | | $— | |
Net asset value, end of period | | | $14.39 | | | | $13.01 | | | | $9.60 | | | | $15.49 | | | | $13.79 | |
Total return (%) (r)(s)(t) | | | 11.08 | | | | 36.44 | | | | (37.79 | ) | | | 12.33 | | | | 7.99 | |
Ratios (%) (to average net assets) and Supplemental data: | | | | | | | | | | | | | | | | | | | | |
Expenses before expense reductions (f) | | | 0.95 | | | | 0.99 | | | | 0.93 | | | | 0.90 | | | | 0.93 | |
Expenses after expense reductions (f) | | | 0.95 | | | | 0.99 | | | | 0.93 | | | | 0.90 | | | | 0.93 | |
Net investment income | | | 0.55 | | | | 0.53 | | | | 0.45 | | | | 0.43 | | | | 0.17 | |
Portfolio turnover | | | 46 | | | | 58 | | | | 35 | | | | 49 | | | | 91 | |
Net assets at end of period (000 omitted) | | | $2,354,751 | | | | $2,345,636 | | | | $1,919,938 | | | | $4,019,277 | | | | $3,937,421 | |
See Notes to Financial Statements
19
Financial Highlights – continued
| | | | | | | | | | | | | | | | | | | | |
| Class B | | Years ended 11/30 | |
| | | 2010 | | | 2009 | | | 2008 | | | 2007 | | | 2006 | |
Net asset value, beginning of period | | | $11.71 | | | | $8.64 | | | | $13.98 | | | | $12.52 | | | | $11.68 | |
| Income (loss) from investment operations | | | | | | | | | | | | | | | | | | | | |
Net investment loss (d) | | | $(0.01 | ) | | | $(0.01 | ) | | | $(0.03 | ) | | | $(0.03 | ) | | | $(0.06 | ) |
Net realized and unrealized gain (loss)
on investments and foreign currency | | | 1.22 | | | | 3.08 | | | | (5.31 | ) | | | 1.49 | | | | 0.90 | |
Total from investment operations | | | $1.21 | | | | $3.07 | | | | $(5.34 | ) | | | $1.46 | | | | $0.84 | |
Net asset value, end of period | | | $12.92 | | | | $11.71 | | | | $8.64 | | | | $13.98 | | | | $12.52 | |
Total return (%) (r)(s)(t) | | | 10.33 | | | | 35.53 | | | | (38.20 | ) | | | 11.66 | | | | 7.19 | |
Ratios (%) (to average net assets)
and Supplemental data: | | | | | | | | | | | | | | | | | |
Expenses before expense reductions (f) | | | 1.60 | | | | 1.65 | | | | 1.58 | | | | 1.55 | | | | 1.58 | |
Expenses after expense reductions (f) | | | 1.60 | | | | 1.65 | | | | 1.58 | | | | 1.55 | | | | 1.58 | |
Net investment loss | | | (0.12 | ) | | | (0.13 | ) | | | (0.21 | ) | | | (0.20 | ) | | | (0.48 | ) |
Portfolio turnover | | | 46 | | | | 58 | | | | 35 | | | | 49 | | | | 91 | |
Net assets at end of period (000 omitted) | | | $168,679 | | | | $233,635 | | | | $295,657 | | | | $857,628 | | | | $1,389,908 | |
| |
| Class C | | Years ended 11/30 | |
| | | 2010 | | | 2009 | | | 2008 | | | 2007 | | | 2006 | |
Net asset value, beginning of period | | | $11.66 | | | | $8.60 | | | | $13.91 | | | | $12.47 | | | | $11.62 | |
| Income (loss) from investment operations | | | | | | | | | | | | | | | | | | | | |
Net investment loss (d) | | | $(0.01 | ) | | | $(0.01 | ) | | | $(0.02 | ) | | | $(0.03 | ) | | | $(0.06 | ) |
Net realized and unrealized gain (loss) on investments and foreign currency | | | 1.21 | | | | 3.07 | | | | (5.29 | ) | | | 1.47 | | | | 0.91 | |
Total from investment operations | | | $1.20 | | | | $3.06 | | | | $(5.31 | ) | | | $1.44 | | | | $0.85 | |
Net asset value, end of period | | | $12.86 | | | | $11.66 | | | | $8.60 | | | | $13.91 | | | | $12.47 | |
Total return (%) (r)(s)(t) | | | 10.29 | | | | 35.58 | | | | (38.17 | ) | | | 11.55 | | | | 7.31 | |
Ratios (%) (to average net assets)
and Supplemental data: | | | | | | | | | | | | | | | | | |
Expenses before expense reductions (f) | | | 1.60 | | | | 1.64 | | | | 1.58 | | | | 1.55 | | | | 1.58 | |
Expenses after expense reductions (f) | | | 1.60 | | | | 1.64 | | | | 1.58 | | | | 1.55 | | | | 1.58 | |
Net investment loss | | | (0.10 | ) | | | (0.12 | ) | | | (0.20 | ) | | | (0.20 | ) | | | (0.48 | ) |
Portfolio turnover | | | 46 | | | | 58 | | | | 35 | | | | 49 | | | | 91 | |
Net assets at end of period (000 omitted) | | | $203,860 | | | | $213,483 | | | | $183,334 | | | | $368,616 | | | | $451,097 | |
See Notes to Financial Statements
20
Financial Highlights – continued
| | | | | | | | | | | | | | | | | | | | |
| Class I | | Years ended 11/30 | |
| | | 2010 | | | 2009 | | | 2008 | | | 2007 | | | 2006 | |
Net asset value, beginning of period | | | $13.30 | | | | $9.83 | | | | $15.87 | | | | $14.07 | | | | $12.99 | |
Income (loss) from investment
operations | | | | | | | | | | | | | | | | | | | | |
Net investment income (d) | | | $0.13 | | | | $0.10 | | | | $0.11 | | | | $0.12 | | | | $0.07 | |
Net realized and unrealized gain (loss)
on investments and foreign currency | | | 1.39 | | | | 3.49 | | | | (6.04 | ) | | | 1.68 | | | | 1.01 | |
Total from investment operations | | | $1.52 | | | | $3.59 | | | | $(5.93 | ) | | | $1.80 | | | | $1.08 | |
| Less distributions declared to shareholders | | | | | | | | | | | | | | | | | |
From net investment income | | | $(0.10 | ) | | | $(0.12 | ) | | | $(0.11 | ) | | | $— | | | | $— | |
Net asset value, end of period | | | $14.72 | | | | $13.30 | | | | $9.83 | | | | $15.87 | | | | $14.07 | |
Total return (%) (r)(s) | | | 11.46 | | | | 36.92 | | | | (37.62 | ) | | | 12.79 | | | | 8.31 | |
Ratios (%) (to average net assets)
and Supplemental data: | | | | | | | | | | | | | | | | | | | | |
Expenses before expense reductions (f) | | | 0.60 | | | | 0.63 | | | | 0.58 | | | | 0.56 | | | | 0.58 | |
Expenses after expense reductions (f) | | | 0.60 | | | | 0.63 | | | | 0.58 | | | | 0.56 | | | | 0.58 | |
Net investment income | | | 0.91 | | | | 0.89 | | | | 0.81 | | | | 0.82 | | | | 0.51 | |
Portfolio turnover | | | 46 | | | | 58 | | | | 35 | | | | 49 | | | | 91 | |
Net assets at end of period (000 omitted) | | | $70,064 | | | | $63,052 | | | | $37,680 | | | | $57,139 | | | | $86,309 | |
| |
| Class R1 | | Years ended 11/30 | |
| | | 2010 | | | 2009 | | | 2008 | | | 2007 | | | 2006 | |
Net asset value, beginning of period | | | $11.62 | | | | $8.57 | | | | $13.92 | | | | $12.48 | | | | $11.66 | |
Income (loss) from investment
operations | | | | | | | | | | | | | | | | | | | | |
Net investment loss (d) | | | $(0.01 | ) | | | $(0.01 | ) | | | $(0.03 | ) | | | $(0.05 | ) | | | $(0.07 | ) |
Net realized and unrealized gain (loss)
on investments and foreign currency | | | 1.22 | | | | 3.06 | | | | (5.28 | ) | | | 1.49 | | | | 0.89 | |
Total from investment operations | | | $1.21 | | | | $3.05 | | | | $(5.31 | ) | | | $1.44 | | | | $0.82 | |
| Less distributions declared to shareholders | | | | | | | | | | | | | | | | | |
From net investment income | | | $0.00 | (w) | | | $— | | | | $(0.04 | ) | | | $— | | | | $— | |
Net asset value, end of period | | | $12.83 | | | | $11.62 | | | | $8.57 | | | | $13.92 | | | | $12.48 | |
Total return (%) (r)(s) | | | 10.42 | | | | 35.59 | | | | (38.25 | ) | | | 11.54 | | | | 7.03 | |
Ratios (%) (to average net assets)
and Supplemental data: | | | | | | | | | | | | | | | | | | | | |
Expenses before expense reductions (f) | | | 1.60 | | | | 1.64 | | | | 1.61 | | | | 1.66 | | | | 1.77 | |
Expenses after expense reductions (f) | | | 1.60 | | | | 1.63 | | | | 1.61 | | | | 1.64 | | | | 1.67 | |
Net investment loss | | | (0.10 | ) | | | (0.12 | ) | | | (0.23 | ) | | | (0.37 | ) | | | (0.56 | ) |
Portfolio turnover | | | 46 | | | | 58 | | | | 35 | | | | 49 | | | | 91 | |
Net assets at end of period (000 omitted) | | | $6,555 | | | | $6,696 | | | | $4,891 | | | | $8,623 | | | | $2,495 | |
See Notes To Financial Statements
21
Financial Highlights – continued
| | | | | | | | | | | | | | | | | | | | |
| Class R2 | | Years ended 11/30 | |
| | | 2010 | | | 2009 | | | 2008 | | | 2007 | | | 2006 | |
Net asset value, beginning of period | | | $12.77 | | | | $9.43 | | | | $15.24 | | | | $13.61 | | | | $12.64 | |
Income (loss) from investment
operations | | | | | | | | | | | | | | | | | | | | |
Net investment income (loss) (d) | | | $0.06 | | | | $0.04 | | | | $0.04 | | | | $0.01 | | | | $(0.01 | ) |
Net realized and unrealized gain (loss)
on investments and foreign currency | | | 1.33 | | | | 3.35 | | | | (5.79 | ) | | | 1.62 | | | | 0.98 | |
Total from investment operations | | | $1.39 | | | | $3.39 | | | | $(5.75 | ) | | | $1.63 | | | | $0.97 | |
| Less distributions declared to shareholders | | | | | | | | | | | | | | | | | |
From net investment income | | | $(0.04 | ) | | | $(0.05 | ) | | | $(0.06 | ) | | | $— | | | | $— | |
Net asset value, end of period | | | $14.12 | | | | $12.77 | | | | $9.43 | | | | $15.24 | | | | $13.61 | |
Total return (%) (r)(s) | | | 10.90 | | | | 36.21 | | | | (37.87 | ) | | | 11.98 | | | | 7.67 | |
Ratios (%) (to average net assets)
and Supplemental data: | | | | | | | | | | | | | | | | | | | | |
Expenses before expense reductions (f) | | | 1.10 | | | | 1.14 | | | | 1.10 | | | | 1.21 | | | | 1.32 | |
Expenses after expense reductions (f) | | | 1.10 | | | | 1.14 | | | | 1.10 | | | | 1.19 | | | | 1.22 | |
Net investment income (loss) | | | 0.44 | | | | 0.38 | | | | 0.29 | | | | 0.10 | | | | (0.11 | ) |
Portfolio turnover | | | 46 | | | | 58 | | | | 35 | | | | 49 | | | | 91 | |
Net assets at end of period (000 omitted) | | | $36,420 | | | | $27,249 | | | | $23,419 | | | | $31,371 | | | | $8,091 | |
| |
| Class R3 | | Years ended 11/30 | |
| | | 2010 | | | 2009 | | | 2008 | | | 2007 | | | 2006 | |
Net asset value, beginning of period | | | $12.94 | | | | $9.59 | | | | $15.47 | | | | $13.78 | | | | $12.77 | |
Income (loss) from investment
operations | | | | | | | | | | | | | | | | | | | | |
Net investment income (d) | | | $0.09 | | | | $0.06 | | | | $0.07 | | | | $0.05 | | | | $0.02 | |
Net realized and unrealized gain (loss)
on investments and foreign currency | | | 1.36 | | | | 3.39 | | | | (5.88 | ) | | | 1.64 | | | | 0.99 | |
Total from investment operations | | | $1.45 | | | | $3.45 | | | | $(5.81 | ) | | | $1.69 | | | | $1.01 | |
| Less distributions declared to shareholders | | | | | | | | | | | | | | | | | |
From net investment income | | | $(0.07 | ) | | | $(0.10 | ) | | | $(0.07 | ) | | | $— | | | | $— | |
Net asset value, end of period | | | $14.32 | | | | $12.94 | | | | $9.59 | | | | $15.47 | | | | $13.78 | |
Total return (%) (r)(s) | | | 11.25 | | | | 36.39 | | | | (37.74 | ) | | | 12.26 | | | | 7.91 | |
Ratios (%) (to average net assets)
and Supplemental data: | | | | | | | | | | | | | | | | | | | | |
Expenses before expense reductions (f) | | | 0.85 | | | | 0.89 | | | | 0.85 | | | | 0.95 | | | | 0.96 | |
Expenses after expense reductions (f) | | | 0.85 | | | | 0.89 | | | | 0.85 | | | | 0.95 | | | | 0.96 | |
Net investment income | | | 0.70 | | | | 0.61 | | | | 0.53 | | | | 0.38 | | | | 0.15 | |
Portfolio turnover | | | 46 | | | | 58 | | | | 35 | | | | 49 | | | | 91 | |
Net assets at end of period (000 omitted) | | | $50,795 | | | | $30,110 | | | | $10,813 | | | | $21,016 | | | | $11,375 | |
See Notes to Financial Statements
22
Financial Highlights – continued
| | | | | | | | | | | | | | | | | | | | |
| Class R4 | | Years ended 11/30 | |
| | | 2010 | | | 2009 | | | 2008 | | | 2007 | | | 2006 | |
Net asset value, beginning of period | | | $13.10 | | | | $9.68 | | | | $15.60 | | | | $13.85 | | | | $12.80 | |
Income (loss) from investment
operations | | | | | | | | | | | | | | | | | | | | |
Net investment income (d) | | | $0.13 | | | | $0.09 | | | | $0.11 | | | | $0.11 | | | | $0.06 | |
Net realized and unrealized gain (loss)
on investments and foreign currency | | | 1.37 | | | | 3.45 | | | | (5.94 | ) | | | 1.64 | | | | 0.99 | |
Total from investment operations | | | $1.50 | | | | $3.54 | | | | $(5.83 | ) | | | $1.75 | | | | $1.05 | |
| Less distributions declared to shareholders | | | | | | | | | | | | | | | | | | | | |
From net investment income | | | $(0.10 | ) | | | $(0.12 | ) | | | $(0.09 | ) | | | $— | | | | $— | |
Net asset value, end of period | | | $14.50 | | | | $13.10 | | | | $9.68 | | | | $15.60 | | | | $13.85 | |
Total return (%) (r)(s) | | | 11.49 | | | | 36.98 | | | | (37.60 | ) | | | 12.64 | | | | 8.20 | |
Ratios (%) (to average net assets)
and Supplemental data: | | | | | | | | | | | | | | | | | | | | |
Expenses before expense reductions (f) | | | 0.60 | | | | 0.64 | | | | 0.59 | | | | 0.66 | | | | 0.68 | |
Expenses after expense reductions (f) | | | 0.60 | | | | 0.64 | | | | 0.59 | | | | 0.66 | | | | 0.68 | |
Net investment income | | | 0.96 | | | | 0.88 | | | | 0.78 | | | | 0.74 | | | | 0.43 | |
Portfolio turnover | | | 46 | | | | 58 | | | | 35 | | | | 49 | | | | 91 | |
Net assets at end of period (000 omitted) | | | $61,376 | | | | $33,525 | | | | $27,798 | | | | $114,715 | | | | $136,104 | |
| |
| Class 529A | | Years ended 11/30 | |
| | | 2010 | | | 2009 | | | 2008 | | | 2007 | | | 2006 | |
Net asset value, beginning of period | | | $12.89 | | | | $9.46 | | | | $15.27 | | | | $13.63 | | | | $12.66 | |
Income (loss) from investment
operations | | | | | | | | | | | | | | | | | | | | |
Net investment income (loss) (d) | | | $0.06 | | | | $0.05 | | | | $0.04 | | | | $0.03 | | | | $(0.01 | ) |
Net realized and unrealized gain (loss)
on investments and foreign currency | | | 1.35 | | | | 3.38 | | | | (5.81 | ) | | | 1.61 | | | | 0.98 | |
Total from investment operations | | | $1.41 | | | | $3.43 | | | | $(5.77 | ) | | | $1.64 | | | | $0.97 | |
| Less distributions declared to shareholders | | | | | | | | | | | | | | | | | | | | |
From net investment income | | | $(0.05 | ) | | | $— | | | | $(0.04 | ) | | | $— | | | | $— | |
Net asset value, end of period | | | $14.25 | | | | $12.89 | | | | $9.46 | | | | $15.27 | | | | $13.63 | |
Total return (%) (r)(s)(t) | | | 10.97 | | | | 36.26 | | | | (37.87 | ) | | | 12.03 | | | | 7.66 | |
Ratios (%) (to average net assets)
and Supplemental data: | | | | | | | | | | | | | | | | | | | | |
Expenses before expense reductions (f) | | | 1.05 | | | | 1.09 | | | | 1.10 | | | | 1.15 | | | | 1.18 | |
Expenses after expense reductions (f) | | | 1.05 | | | | 1.08 | | | | 1.10 | | | | 1.15 | | | | 1.18 | |
Net investment income (loss) | | | 0.46 | | | | 0.44 | | | | 0.31 | | | | 0.18 | | | | (0.07 | ) |
Portfolio turnover | | | 46 | | | | 58 | | | | 35 | | | | 49 | | | | 91 | |
Net assets at end of period (000 omitted) | | | $4,117 | | | | $3,657 | | | | $2,560 | | | | $7,986 | | | | $3,791 | |
See Notes to Financial Statements
23
Financial Highlights – continued
| | | | | | | | | | | | | | | | | | | | |
| Class 529B | | Years ended 11/30 | |
| | | 2010 | | | 2009 | | | 2008 | | | 2007 | | | 2006 | |
Net asset value, beginning of period | | | $11.53 | | | | $8.51 | | | | $13.80 | | | | $12.40 | | | | $11.59 | |
Income (loss) from investment
operations | | | | | | | | | | | | | | | | | | | | |
Net investment loss (d) | | | $(0.02 | ) | | | $(0.02 | ) | | | $(0.04 | ) | | | $(0.06 | ) | | | $(0.09 | ) |
Net realized and unrealized gain (loss)
on investments and foreign currency | | | 1.20 | | | | 3.04 | | | | (5.25 | ) | | | 1.46 | | | | 0.90 | |
Total from investment operations | | | $1.18 | | | | $3.02 | | | | $(5.29 | ) | | | $1.40 | | | | $0.81 | |
Net asset value, end of period | | | $12.71 | | | | $11.53 | | | | $8.51 | | | | $13.80 | | | | $12.40 | |
Total return (%) (r)(s)(t) | | | 10.23 | | | | 35.49 | | | | (38.33 | ) | | | 11.29 | | | | 6.99 | |
Ratios (%) (to average net assets) and Supplemental data: | | | | | | | | | | | | | | | | | | | | |
Expenses before expense reductions (f) | | | 1.70 | | | | 1.74 | | | | 1.75 | | | | 1.80 | | | | 1.83 | |
Expenses after expense reductions (f) | | | 1.70 | | | | 1.74 | | | | 1.75 | | | | 1.80 | | | | 1.83 | |
Net investment loss | | | (0.19 | ) | | | (0.22 | ) | | | (0.36 | ) | | | (0.45 | ) | | | (0.73 | ) |
Portfolio turnover | | | 46 | | | | 58 | | | | 35 | | | | 49 | | | | 91 | |
Net assets at end of period (000 omitted) | | | $712 | | | | $658 | | | | $560 | | | | $992 | | | | $587 | |
| |
| Class 529C | | Years ended 11/30 | |
| | | 2010 | | | 2009 | | | 2008 | | | 2007 | | | 2006 | |
Net asset value, beginning of period | | | $11.48 | | | | $8.48 | | | | $13.74 | | | | $12.34 | | | | $11.54 | |
Income (loss) from investment
operations | | | | | | | | | | | | | | | | | | | | |
Net investment loss (d) | | | $(0.02 | ) | | | $(0.02 | ) | | | $(0.04 | ) | | | $(0.06 | ) | | | $(0.09 | ) |
Net realized and unrealized gain (loss)
on investments and foreign currency | | | 1.20 | | | | 3.02 | | | | (5.22 | ) | | | 1.46 | | | | 0.89 | |
Total from investment operations | | | $1.18 | | | | $3.00 | | | | $(5.26 | ) | | | $1.40 | | | | $0.80 | |
Net asset value, end of period | | | $12.66 | | | | $11.48 | | | | $8.48 | | | | $13.74 | | | | $12.34 | |
Total return (%) (r)(s)(t) | | | 10.28 | | | | 35.38 | | | | (38.28 | ) | | | 11.35 | | | | 6.93 | |
Ratios (%) (to average net assets)
and Supplemental data: | | | | | | | | | | | | | | | | | | | | |
Expenses before expense reductions (f) | | | 1.70 | | | | 1.73 | | | | 1.75 | | | | 1.80 | | | | 1.83 | |
Expenses after expense reductions (f) | | | 1.70 | | | | 1.73 | | | | 1.75 | | | | 1.80 | | | | 1.83 | |
Net investment loss | | | (0.18 | ) | | | (0.21 | ) | | | (0.36 | ) | | | (0.46 | ) | | | (0.72 | ) |
Portfolio turnover | | | 46 | | | | 58 | | | | 35 | | | | 49 | | | | 91 | |
Net assets at end of period (000 omitted) | | | $1,574 | | | | $1,322 | | | | $906 | | | | $1,424 | | | | $996 | |
See Notes to Financial Statements
24
Financial Highlights – continued
| (d) | Per share data is based on average shares outstanding. |
| (f) | Ratios do not reflect reductions from fees paid indirectly, if applicable. |
| (r) | Certain expenses have been reduced without which performance would have been lower. |
| (s) | From time to time the fund may receive proceeds from litigation settlements, without which performance would be lower. Excluding the effect of the proceeds received from a non-recurring litigation settlement against Tyco International Ltd., the Class A, Class B, Class C, Class I, Class R1, Class R2, Class R3, Class R4, Class 529A, Class 529B, and Class 529C total returns for the year ended November 30, 2010 would have been lower by 0.73%, 0.72%, 0.72%, 0.73%, 0.72%, 0.72%, 0.73%, 0.73%, 0.72%, 0.72%, and 0.72%, respectively. Excluding the effect of the proceeds received from a non-recurring administrative proceeding concerning market timing, the Class A, Class B, Class C, Class I, Class R1, Class R2, Class R3, Class R4, Class 529A, Class 529B, and Class 529C total returns for the year ended November 30, 2010 would have been lower by 1.14%, 1.13%, 1.13%, 1.14%, 1.13%, 1.14%, 1.14%, 1.14%, 1.14%, 1.13%, and 1.13%, respectively. |
| (t) | Total returns do not include any applicable sales charges. |
| (w) | Per share amount was less than $0.01. |
See Notes to Financial Statements
25
NOTES TO FINANCIAL STATEMENTS
| (1) | | Business and Organization |
Massachusetts Investors Growth Stock Fund (the fund) is organized as a Massachusetts business trust and is registered under the Investment Company Act of 1940, as amended, as an open-end management investment company.
| (2) | | Significant Accounting Policies |
General – The preparation of financial statements in conformity with U.S. generally accepted accounting principles requires management to make estimates and assumptions that affect the reported amounts of assets and liabilities, and disclosure of contingent assets and liabilities at the date of the financial statements and the reported amounts of revenues and expenses during the reporting period. Actual results could differ from those estimates. In the preparation of these financial statements, management has evaluated subsequent events occurring after the date of the fund’s Statement of Assets and Liabilities through the date that the financial statements were issued. The fund invests in foreign securities, including securities of emerging market issuers. Investments in foreign securities are vulnerable to the effects of changes in the relative values of the local currency and the U.S. dollar and to the effects of changes in each country’s legal, political, and economic environment. The markets of emerging markets countries are generally more volatile than the markets of developed countries with more mature economies. All of the risks of investing in foreign securities previously described are heightened when investing in emerging markets countries.
Investment Valuations – Equity securities, including restricted equity securities, are generally valued at the last sale or official closing price as provided by a third-party pricing service on the market or exchange on which they are primarily traded. Equity securities, for which there were no sales reported that day, are generally valued at the last quoted daily bid quotation as provided by a third-party pricing service on the market or exchange on which such securities are primarily traded. Equity securities held short, for which there were no sales reported for that day, are generally valued at the last quoted daily ask quotation as provided by a third-party pricing service on the market or exchange on which such securities are primarily traded.
Short-term instruments with a maturity at issuance of 60 days or less generally are valued at amortized cost, which approximates market value. Open-end investment companies are generally valued at net asset value per share. Securities and other assets generally valued on the basis of information from a third-party pricing service may also be valued at a broker/dealer bid quotation. Values obtained from third-party pricing services can utilize both transaction data and market information such as yield, quality, coupon rate, maturity, type
26
Notes to Financial Statements – continued
of issue, trading characteristics, and other market data. The values of foreign securities and other assets and liabilities expressed in foreign currencies are converted to U.S. dollars using the mean of bid and asked prices for rates provided by a third-party pricing service.
The Board of Trustees has delegated primary responsibility for determining or causing to be determined the value of the fund’s investments (including any fair valuation) to the adviser pursuant to valuation policies and procedures approved by the Board. If the adviser determines that reliable market quotations are not readily available, investments are valued at fair value as determined in good faith by the adviser in accordance with such procedures under the oversight of the Board of Trustees. Under the fund’s valuation policies and procedures, market quotations are not considered to be readily available for most types of debt instruments and floating rate loans and many types of derivatives. These investments are generally valued at fair value based on information from third-party pricing services. In addition, investments may be valued at fair value if the adviser determines that an investment’s value has been materially affected by events occurring after the close of the exchange or market on which the investment is principally traded (such as foreign exchange or market) and prior to the determination of the fund’s net asset value, or after the halting of trading of a specific security where trading does not resume prior to the close of the exchange or market on which the security is principally traded. Events that occur on a frequent basis after foreign markets close (such as developments in foreign markets and significant movements in the U.S. markets) and prior to the determination of the fund’s net asset value may be deemed to have a material effect on the value of securities traded in foreign markets. Accordingly, the fund’s foreign equity securities may often be valued at fair value. The adviser generally relies on third-party pricing services or other information (such as the correlation with price movements of similar securities in the same or other markets; the type, cost and investment characteristics of the security; the business and financial condition of the issuer; and trading and other market data) to assist in determining whether to fair value and at what value to fair value an investment. The value of an investment for purposes of calculating the fund’s net asset value can differ depending on the source and method used to determine value. When fair valuation is used, the value of an investment used to determine the fund’s net asset value may differ from quoted or published prices for the same investment. There can be no assurance that the fund could obtain the fair value assigned to an investment if it were to sell the investment at the same time at which the fund determines its net asset value per share.
Various inputs are used in determining the value of the fund’s assets or liabilities. These inputs are categorized into three broad levels. In certain cases,
27
Notes to Financial Statements – continued
the inputs used to measure fair value may fall into different levels of the fair value hierarchy. In such cases, an investment’s level within the fair value hierarchy is based on the lowest level of input that is significant to the fair value measurement. The fund’s assessment of the significance of a particular input to the fair value measurement in its entirety requires judgment, and considers factors specific to the investment. Level 1 includes unadjusted quoted prices in active markets for identical assets or liabilities. Level 2 includes other significant observable market-based inputs (including quoted prices for similar securities, interest rates, prepayment speed, and credit risk). Level 3 includes unobservable inputs, which may include the adviser’s own assumptions in determining the fair value of investments. The following is a summary of the levels used as of November 30, 2010 in valuing the fund’s assets or liabilities:
| | | | | | | | | | | | | | | | |
| Investments at Value | | Level 1 | | | Level 2 | | | Level 3 | | | Total | |
| Equity Securities | | | $2,921,801,509 | | | | $— | | | | $— | | | | $2,921,801,509 | |
| Short Term Securities | | | — | | | | 53,964,014 | | | | — | | | | 53,964,014 | |
| Mutual Funds | | | 36,783,635 | | | | — | | | | — | | | | 36,783,635 | |
| Total Investments | | | $2,958,585,144 | | | | $53,964,014 | | | | $— | | | | $3,012,549,158 | |
For further information regarding security characteristics, see the Portfolio of Investments.
Repurchase Agreements – The fund entered into repurchase agreements with approved counterparties. Each repurchase agreement is recorded at cost. The fund requires that the securities collateral in a repurchase transaction be transferred to a custodian. The fund monitors, on a daily basis, the value of the collateral to ensure that its value, including accrued interest, is greater than amounts owed to the fund under each such repurchase agreement.
Foreign Currency Translation – Purchases and sales of foreign investments, income, and expenses are converted into U.S. dollars based upon currency exchange rates prevailing on the respective dates of such transactions or on the reporting date for foreign denominated receivables and payables. Gains and losses attributable to foreign currency exchange rates on sales of securities are recorded for financial statement purposes as net realized gains and losses on investments. Gains and losses attributable to foreign exchange rate movements on receivables, payables, income and expenses are recorded for financial statement purposes as foreign currency transaction gains and losses. That portion of both realized and unrealized gains and losses on investments that results from fluctuations in foreign currency exchange rates is not separately disclosed.
Short Sales – The fund may enter into short sales whereby it sells a security it does not own in anticipation of a decline in the value of that security. The fund will realize a gain if the security price decreases and a loss if the security price
28
Notes to Financial Statements – continued
increases between the date of the short sale and the date on which the fund replaces the borrowed security. Losses from short sales can exceed the proceeds of the security sold; and they can also exceed the potential loss from an ordinary buy and sell transaction. The amount of any premium, dividends, or interest the fund may be required to pay in connection with a short sale will be recognized as a fund expense. The fund segregates cash or marketable securities in an amount that, when combined with the amount of proceeds from the short sale deposited with the broker, at least equals the current market value of the security sold short. At November 30, 2010, the fund has yet to enter into such transactions.
Security Loans – JPMorgan Chase and Co. (“Chase”), as lending agent, loans the securities of the fund to certain qualified institutions (the “Borrowers”) approved by the fund. The loans are collateralized by cash and/or U.S. Treasury and federal agency obligations in an amount typically at least equal to the market value of the securities loaned. The market value of the loaned securities is determined at the close of business of the fund and any additional required collateral is delivered to the fund on the next business day. Chase provides the fund with indemnification against Borrower default. The fund bears the risk of loss with respect to the investment of cash collateral. On loans collateralized by cash, the cash collateral is invested in short-term securities. A portion of the income generated upon investment of the collateral is remitted to the Borrowers, and the remainder is allocated between the fund and the lending agent. On loans collateralized by U.S. Treasury and/or federal agency obligations, a fee is received from the Borrower, and is allocated between the fund and the lending agent. Income from securities lending is included in interest income on the Statement of Operations. The dividend and interest income earned on the securities loaned is accounted for in the same manner as other dividend and interest income.
Indemnifications – Under the fund’s organizational documents, its officers and Trustees may be indemnified against certain liabilities and expenses arising out of the performance of their duties to the fund. Additionally, in the normal course of business, the fund enters into agreements with service providers that may contain indemnification clauses. The fund’s maximum exposure under these agreements is unknown as this would involve future claims that may be made against the fund that have not yet occurred.
Investment Transactions and Income – Investment transactions are recorded on the trade date. Interest income is recorded on the accrual basis. Dividends received in cash are recorded on the ex-dividend date. Certain dividends from foreign securities will be recorded when the fund is informed of the dividend if such information is obtained subsequent to the ex-dividend date. Dividend and interest payments received in additional securities are recorded on the
29
Notes to Financial Statements – continued
ex-dividend or ex-interest date in an amount equal to the value of the security on such date.
The fund may receive proceeds from litigation settlements. Any proceeds received from litigation involving portfolio holdings are reflected in the Statement of Operations in realized gain/loss if the security has been disposed of by the fund or in unrealized gain/loss if the security is still held by the fund. Any other proceeds from litigation not related to portfolio holdings are reflected as other income in the Statement of Operations. On September 6, 2010, the fund received $17,505,707 from a non-recurring litigation settlement against Tyco International Ltd. On November 1, 2010, the fund received $31,127,903 from a non-recurring administrative proceeding concerning market timing, of which $27,976,203 was recorded as realized gain on investment transactions and $3,151,700 was recorded as other income. (See Note 7 for further information).
Fees Paid Indirectly – The fund’s custody fee may be reduced according to an arrangement that measures the value of cash deposited with the custodian by the fund. This amount, for the year ended November 30, 2010, is shown as a reduction of total expenses on the Statement of Operations.
Tax Matters and Distributions – The fund intends to qualify as a regulated investment company, as defined under Subchapter M of the Internal Revenue Code, and to distribute all of its taxable income, including realized capital gains. As a result, no provision for federal income tax is required. The fund’s federal tax returns for the prior three fiscal years remain subject to examination by the Internal Revenue Service. Foreign taxes, if any, have been accrued by the fund in the accompanying financial statements.
Distributions to shareholders are recorded on the ex-dividend date. Income and capital gain distributions are determined in accordance with income tax regulations, which may differ from U.S. generally accepted accounting principles. Certain capital accounts in the financial statements are periodically adjusted for permanent differences in order to reflect their tax character. These adjustments have no impact on net assets or net asset value per share. Temporary differences which arise from recognizing certain items of income, expense, gain or loss in different periods for financial statement and tax purposes will reverse at some time in the future. Distributions in excess of net investment income or net realized gains are temporary overdistributions for financial statement purposes resulting from differences in the recognition or classification of income or distributions for financial statement and tax purposes.
Book/tax differences primarily relate to expiration of capital loss carryforwards and wash sale loss deferrals.
30
Notes to Financial Statements – continued
The tax character of distributions declared to shareholders for the last two fiscal years is as follows:
| | | | | | | | |
| | | 11/30/10 | | | 11/30/09 | |
| Ordinary income (including any short-term capital gains) | | | $11,001,496 | | | | $13,648,901 | |
The federal tax cost and the tax basis components of distributable earnings were as follows:
| | | | |
| |
| As of 11/30/10 | | | |
| Cost of investments | | | $2,816,679,516 | |
| Gross appreciation | | | 327,757,304 | |
| Gross depreciation | | | (131,887,662 | ) |
| Net unrealized appreciation (depreciation) | | | $195,869,642 | |
| |
| Undistributed ordinary income | | | 13,608,183 | |
| Capital loss carryforwards | | | (603,464,191 | ) |
| Other temporary differences | | | (47,111 | ) |
As of November 30, 2010, the fund had capital loss carryforwards available to offset future realized gains. Such losses expire as follows:
| | | | |
| 11/30/16 | | | $(58,868,015 | ) |
| 11/30/17 | | | (544,596,176 | ) |
| | | $(603,464,191 | ) |
The availability of a portion of the capital loss carryforwards, which were acquired on June 22, 2007 in connection with the MFS Growth Opportunities Fund merger, may be limited in a given year.
Multiple Classes of Shares of Beneficial Interest – The fund offers multiple classes of shares, which differ in their respective distribution, service, and program manager fees. The fund’s income, realized and unrealized gain (loss), and common expenses are allocated to shareholders based on the daily net assets of each class. Dividends are declared separately for each class. Differences in per share dividend rates are generally due to differences in separate class expenses. Class B and Class 529B shares will convert to Class A and Class 529A shares, respectively, approximately eight years after purchase.
31
Notes to Financial Statements – continued
The fund’s distributions declared to shareholders as reported on the Statements of Changes in Net Assets are presented by class as follows:
| | | | | | | | |
| | | From net investment
income | |
| | | Year ended
11/30/10 | | | Year ended
11/30/09 | |
| Class A | | | $10,046,213 | | | | $12,462,713 | |
| Class I | | | 444,451 | | | | 440,896 | |
| Class R1 | | | 219 | | | | — | |
| Class R2 | | | 82,279 | | | | 132,519 | |
| Class R3 | | | 170,211 | | | | 284,131 | |
| Class R4 | | | 244,183 | | | | 328,642 | |
| Class 529A | | | 13,940 | | | | — | |
| Total | | | $11,001,496 | | | | $13,648,901 | |
| (3) | | Transactions with Affiliates |
Investment Adviser – The fund has an investment advisory agreement with MFS to provide overall investment management and related administrative services and facilities to the fund. The management fee is computed daily and paid monthly at an annual rate of 0.33% of the fund’s average daily net assets.
Distributor – MFS Fund Distributors, Inc. (MFD), a wholly-owned subsidiary of MFS, as distributor, received $121,354 and $2,425 for the year ended November 30, 2010, as its portion of the initial sales charge on sales of Class A and Class 529A shares of the fund, respectively.
The Board of Trustees has adopted a distribution plan for certain class shares pursuant to Rule 12b-1 of the Investment Company Act of 1940.
The fund’s distribution plan provides that the fund will pay MFD for services provided by MFD and financial intermediaries in connection with the distribution and servicing of certain share classes. One component of the plan is a distribution fee paid to MFD and another component of the plan is a
32
Notes to Financial Statements – continued
service fee paid to MFD. MFD may subsequently pay all, or a portion, of the distribution and/or service fees to financial intermediaries.
Distribution Plan Fee Table:
| | | | | | | | | | | | | | | | | | | | |
| | | Distribution
Fee Rate (d) | | | Service
Fee Rate (d) | | | Total
Distribution
Plan (d) | | | Annual
Effective
Rate (e) | | | Distribution
and Service
Fee | |
| Class A | | | 0.10% | | | | 0.25% | | | | 0.35% | | | | 0.35% | | | | $8,129,571 | |
| Class B | | | 0.75% | | | | 0.25% | | | | 1.00% | | | | 1.00% | | | | 1,947,227 | |
| Class C | | | 0.75% | | | | 0.25% | | | | 1.00% | | | | 1.00% | | | | 2,063,583 | |
| Class R1 | | | 0.75% | | | | 0.25% | | | | 1.00% | | | | 1.00% | | | | 65,604 | |
| Class R2 | | | 0.25% | | | | 0.25% | | | | 0.50% | | | | 0.50% | | | | 152,224 | |
| Class R3 | | | — | | | | 0.25% | | | | 0.25% | | | | 0.25% | | | | 95,840 | |
| Class 529A | | | 0.10% | | | | 0.25% | | | | 0.35% | | | | 0.35% | | | | 13,415 | |
| Class 529B | | | 0.75% | | | | 0.25% | | | | 1.00% | | | | 1.00% | | | | 6,891 | |
| Class 529C | | | 0.75% | | | | 0.25% | | | | 1.00% | | | | 1.00% | | | | 14,405 | |
| Total Distribution and Service Fees | | | | | | | | | | | | | | | | $12,488,760 | |
| (d) | In accordance with the distribution plan for certain classes, the fund pays distribution and/or service fees equal to these annual percentage rates of each class’ average daily net assets. The distribution and service fee rates disclosed by class represent the current rates in effect at the end of the reporting period. Any rate changes, if applicable, are detailed below. |
| (e) | The annual effective rates represent actual fees incurred under the distribution plan for the year ended November 30, 2010 based on each class’ average daily net assets. Assets attributable to Class A shares sold prior to March 1, 1991 are subject to a service fee of 0.15% annually. This agreement terminates on January 1, 2011. Effective January 1, 2011, the 0.10% Class A and Class 529A distribution fees will be eliminated. |
Certain Class A shares are subject to a contingent deferred sales charge (CDSC) in the event of a shareholder redemption within 24 months of purchase. Class C and Class 529C shares are subject to a CDSC in the event of a shareholder redemption within 12 months of purchase. Class B and Class 529B shares are subject to a CDSC in the event of a shareholder redemption within six years of purchase. All contingent deferred sales charges are paid to MFD and during the year ended November 30, 2010, were as follows:
| | | | |
| | | Amount | |
| Class A | | | $1,704 | |
| Class B | | | 210,204 | |
| Class C | | | 5,903 | |
| Class 529B | | | 370 | |
The fund has entered into and may from time to time enter into contracts with program managers and other parties which administer the tuition programs through which an investment in the fund’s 529 share classes is made. The fund has entered into an agreement with MFD pursuant to which MFD receives an annual fee of up to 0.10% of the average daily net assets attributable to each 529 share class. The services provided by MFD, or a third party with which
33
Notes to Financial Statements – continued
MFD contracts, include recordkeeping and tax reporting and account services, as well as services designed to maintain the program’s compliance with the Internal Revenue Code and other regulatory requirements. Program manager fees for the year ended November 30, 2010, were as follows:
| | | | |
| | | Amount | |
| Class 529A | | | $3,832 | |
| Class 529B | | | 689 | |
| Class 529C | | | 1,441 | |
| Total Program Manager Fees | | | $5,962 | |
Shareholder Servicing Agent – MFS Service Center, Inc. (MFSC), a wholly-owned subsidiary of MFS, receives a fee from the fund for its services as shareholder servicing agent calculated as a percentage of the average daily net assets of the fund as determined periodically under the supervision of the fund’s Board of Trustees. For the year ended November 30, 2010, the fee was $2,478,590, which equated to 0.0851% annually of the fund’s average daily net assets. MFSC also receives payment from the fund for out-of-pocket expenses, sub-accounting and other shareholder servicing costs which may be paid to affiliated and unaffiliated service providers. For the year ended November 30, 2010, these out-of-pocket expenses, sub-accounting and other shareholder servicing costs amounted to $3,893,816.
Administrator – MFS provides certain financial, legal, shareholder communications, compliance, and other administrative services to the fund. Under an administrative services agreement, the fund partially reimburses MFS the costs incurred to provide these services. The fund is charged an annual fixed amount of $17,500 plus a fee based on average daily net assets. The administrative services fee incurred for the year ended November 30, 2010 was equivalent to an annual effective rate of 0.0140% of the fund’s average daily net assets.
Trustees’ and Officers’ Compensation – The fund pays compensation to independent Trustees in the form of a retainer, attendance fees, and additional compensation to Board and Committee chairpersons. The fund does not pay compensation directly to Trustees or officers of the fund who are also officers of the investment adviser, all of whom receive remuneration for their services to the fund from MFS. Certain officers and Trustees of the fund are officers or directors of MFS, MFD, and MFSC.
Prior to December 31, 2001, the fund had an unfunded defined benefit plan (“DB plan”) for independent Trustees. As of December 31, 2001, the Board took action to terminate the DB plan with respect to then-current and any future independent Trustees, such that the DB Plan covers only certain of those former independent Trustees who retired on or before December 31, 2001. Effective January 1, 2002, accrued benefits under the DB Plan for then-current
34
Notes to Financial Statements – continued
independent Trustees who continued were credited to an unfunded retirement deferral plan (the “Retirement Deferral plan”), which was established for and exists solely with respect to these credited amounts, and is not available for other deferrals by these or other independent Trustees. Although the Retirement Deferral plan is unfunded, amounts deferred under the plan are periodically adjusted for investment experience as if they had been invested in shares of the fund. The DB Plan resulted in a pension expense of $18,777 and the Retirement Deferral plan resulted in an expense of $17,817. Both amounts are included in independent Trustees’ compensation for the year ended November 30, 2010. The liability for deferred retirement benefits payable to certain independent Trustees under both plans amounted to $187,392 at November 30, 2010, and is included in payable for independent Trustees’ compensation on the Statement of Assets and Liabilities.
Deferred Trustee Compensation – Under a Deferred Compensation Plan (the “Plan”), independent Trustees previously were allowed to elect to defer receipt of all or a portion of their annual compensation. Effective January 1, 2005, the Board elected to no longer allow Trustees to defer receipt of future compensation under the Plan. Amounts deferred under the Plan are invested in shares of certain MFS Funds selected by the independent Trustees as notional investments. Deferred amounts represent an unsecured obligation of the fund until distributed in accordance with the Plan. Included in other assets and payable for independent Trustees’ compensation on the Statement of Assets and Liabilities is $56,456 of deferred Trustees’ compensation. There is no current year expense associated with the Plan.
Other – This fund and certain other funds managed by MFS (the funds) have entered into services agreements (the Agreements) which provide for payment of fees by the funds to Tarantino LLC and Griffin Compliance LLC in return for the provision of services of an Independent Chief Compliance Officer (ICCO) and Assistant ICCO, respectively, for the funds. The ICCO and Assistant ICCO are officers of the funds and the sole members of Tarantino LLC and Griffin Compliance LLC, respectively. The funds can terminate the Agreements with Tarantino LLC and Griffin Compliance LLC at any time under the terms of the Agreements. For the year ended November 30, 2010, the aggregate fees paid by the fund to Tarantino LLC and Griffin Compliance LLC were $28,495 and are included in miscellaneous expense on the Statement of Operations. MFS has agreed to reimburse the fund for a portion of the payments made by the fund in the amount of $14,161, which is shown as a reduction of total expenses in the Statement of Operations. Additionally, MFS has agreed to bear all expenses associated with office space, other administrative support, and supplies provided to the ICCO and Assistant ICCO.
35
Notes to Financial Statements – continued
The fund invests in the MFS Institutional Money Market Portfolio which is managed by MFS and seeks a high level of current income consistent with preservation of capital and liquidity. Income earned on this investment is included in dividends from underlying funds on the Statement of Operations. This money market fund does not pay a management fee to MFS.
Purchases and sales of investments, other than U.S. Government securities, purchased option transactions, and short-term obligations, aggregated $1,323,608,329 and $1,562,547,503, respectively.
| (5) | | Shares of Beneficial Interest |
The fund’s Declaration of Trust permits the Trustees to issue an unlimited number of full and fractional shares of beneficial interest. Transactions in fund shares were as follows:
| | | | | | | | | | | | | | | | |
| | | Year ended
11/30/10 | | | Year ended
11/30/09 | |
| | | Shares | | | Amount | | | Shares | | | Amount | |
| Shares sold | | | | | | | | | | | | | | | | |
Class A | | | 12,363,375 | | | | $166,008,523 | | | | 21,581,880 | | | | $223,663,343 | |
Class B | | | 1,031,531 | | | | 12,478,700 | | | | 1,627,866 | | | | 15,401,344 | |
Class C | | | 743,590 | | | | 8,991,198 | | | | 996,894 | | | | 9,547,904 | |
Class I | | | 1,091,560 | | | | 15,108,780 | | | | 1,878,854 | | | | 21,458,930 | |
Class R1 | | | 77,158 | | | | 922,362 | | | | 103,936 | | | | 992,572 | |
Class R2 | | | 1,029,277 | | | | 13,828,230 | | | | 484,680 | | | | 4,957,997 | |
Class R3 | | | 1,811,904 | | | | 24,580,292 | | | | 2,412,290 | | | | 22,702,671 | |
Class R4 | | | 2,226,015 | | | | 31,159,637 | | | | 262,173 | | | | 2,927,216 | |
Class 529A | | | 47,936 | | | | 630,867 | | | | 44,724 | | | | 473,830 | |
Class 529B | | | 5,566 | | | | 66,285 | | | | 7,180 | | | | 64,310 | |
Class 529C | | | 23,052 | | | | 279,312 | | | | 26,793 | | | | 238,403 | |
| | | 20,450,964 | | | | $274,054,186 | | | | 29,427,270 | | | | $302,428,520 | |
| Shares issued to shareholders in reinvestment of distributions | | | | | | | | | | | | | | | | |
Class A | | | 637,903 | | | | $8,362,900 | | | | 1,064,024 | | | | $10,002,129 | |
Class I | | | 23,978 | | | | 320,594 | | | | 40,843 | | | | 391,683 | |
Class R1 | | | 19 | | | | 219 | | | | — | | | | — | |
Class R2 | | | 5,858 | | | | 75,452 | | | | 13,224 | | | | 122,189 | |
Class R3 | | | 13,063 | | | | 170,211 | | | | 30,356 | | | | 284,131 | |
Class R4 | | | 18,483 | | | | 243,419 | | | | 34,685 | | | | 327,427 | |
Class 529A | | | 1,072 | | | | 13,940 | | | | — | | | | — | |
| | | 700,376 | | | | $9,186,735 | | | | 1,183,132 | | | | $11,127,559 | |
36
Notes to Financial Statements – continued
| | | | | | | | | | | | | | | | |
| | | Year ended
11/30/10 | | | Year ended
11/30/09 | |
| | | Shares | | | Amount | | | Shares | | | Amount | |
| Shares reacquired | | | | | | | | | | | | | | | | |
Class A | | | (29,678,891 | ) | | | $(399,292,543 | ) | | | (42,337,577 | ) | | | $(437,373,499 | ) |
Class B | | | (7,934,217 | ) | | | (96,401,864 | ) | | | (15,904,955 | ) | | | (147,065,636 | ) |
Class C | | | (3,213,188 | ) | | | (38,648,922 | ) | | | (4,001,649 | ) | | | (37,037,178 | ) |
Class I | | | (1,097,026 | ) | | | (15,121,624 | ) | | | (1,011,780 | ) | | | (10,630,451 | ) |
Class R1 | | | (142,345 | ) | | | (1,692,256 | ) | | | (98,267 | ) | | | (908,907 | ) |
Class R2 | | | (590,155 | ) | | | (7,739,348 | ) | | | (847,937 | ) | | | (8,774,114 | ) |
Class R3 | | | (603,499 | ) | | | (7,967,232 | ) | | | (1,244,187 | ) | | | (12,720,221 | ) |
Class R4 | | | (570,198 | ) | | | (7,676,439 | ) | | | (607,826 | ) | | | (6,089,921 | ) |
Class 529A | | | (43,840 | ) | | | (577,420 | ) | | | (31,743 | ) | | | (344,646 | ) |
Class 529B | | | (6,614 | ) | | | (79,157 | ) | | | (15,853 | ) | | | (156,113 | ) |
Class 529C | | | (13,846 | ) | | | (163,999 | ) | | | (18,512 | ) | | | (162,224 | ) |
| | | (43,893,819 | ) | | | $(575,360,804 | ) | | | (66,120,286 | ) | | | $(661,262,910 | ) |
| Net change | | | | | | | | | | | | | | | | |
Class A | | | (16,677,613 | ) | | | $(224,921,120 | ) | | | (19,691,673 | ) | | | $(203,708,027 | ) |
Class B | | | (6,902,686 | ) | | | (83,923,164 | ) | | | (14,277,089 | ) | | | (131,664,292 | ) |
Class C | | | (2,469,598 | ) | | | (29,657,724 | ) | | | (3,004,755 | ) | | | (27,489,274 | ) |
Class I | | | 18,512 | | | | 307,750 | | | | 907,917 | | | | 11,220,162 | |
Class R1 | | | (65,168 | ) | | | (769,675 | ) | | | 5,669 | | | | 83,665 | |
Class R2 | | | 444,980 | | | | 6,164,334 | | | | (350,033 | ) | | | (3,693,928 | ) |
Class R3 | | | 1,221,468 | | | | 16,783,271 | | | | 1,198,459 | | | | 10,266,581 | |
Class R4 | | | 1,674,300 | | | | 23,726,617 | | | | (310,968 | ) | | | (2,835,278 | ) |
Class 529A | | | 5,168 | | | | 67,387 | | | | 12,981 | | | | 129,184 | |
Class 529B | | | (1,048 | ) | | | (12,872 | ) | | | (8,673 | ) | | | (91,803 | ) |
Class 529C | | | 9,206 | | | | 115,313 | | | | 8,281 | | | | 76,179 | |
| | | (22,742,479 | ) | | | $(292,119,883 | ) | | | (35,509,884 | ) | | | $(347,706,831 | ) |
The fund and certain other funds managed by MFS participate in a $1.1 billion unsecured committed line of credit, subject to a $1 billion sublimit, provided by a syndication of banks under a credit agreement. Borrowings may be made for temporary financing needs. Interest is charged to each fund, based on its borrowings, generally at a rate equal to the higher of the Federal Reserve funds rate or one month LIBOR plus an agreed upon spread. A commitment fee, based on the average daily, unused portion of the committed line of credit, is allocated among the participating funds at the end of each calendar quarter. In addition, the fund and other funds managed by MFS have established unsecured uncommitted borrowing arrangements with certain banks for temporary financing needs. Interest is charged to each fund, based on its borrowings, at a rate equal to the Federal Reserve funds rate plus an agreed upon spread. For the year ended November 30, 2010, the fund’s commitment
37
Notes to Financial Statements – continued
fee and interest expense were $35,637 and $0, respectively, and are included in miscellaneous expense on the Statement of Operations.
The fund’s investment adviser, MFS, was the subject of an administrative proceeding concerning market timing which resulted in the Securities and Exchange Commission (the “SEC”) entering an order approving a settlement with MFS and two of its former officers (the “Settlement Order”). Under the terms of the Settlement Order, MFS transferred $175 million in disgorgement and $50 million in penalty (the “Payments”) to the SEC, which established a Fair Fund from which settlement funds have been, or will be, distributed to eligible current and former shareholders of the fund and certain other affected MFS retail funds. The Payments, along with additional amounts from a third-party settlement, have been distributed to eligible shareholders in accordance with a plan developed by an independent distribution consultant (the “IDC”) in consultation with MFS and the Board of Trustees of the MFS retail funds. The plan was approved in July 2007 by the SEC. Pursuant to the distribution plan, after the distributions to eligible shareholders have been made, any undistributed amounts could be designated “residual” and distributed to the fund and certain other affected MFS retail funds for the benefit of fund shareholders. In November 2010, the SEC issued an order designating certain undistributed amounts residual and ordering that such amounts be distributed to the affected MFS retail funds. The SEC order designated other undistributed amounts for use in funding certain additional distribution efforts to eligible shareholders. As a result of the SEC’s approval of the residual payments, the fund received $31,127,903. Additional residual amounts may be received by the Fund in the future. Certain procedural conditions of the distribution plan (as modified by the November 2010 SEC order) have not been met to date and, as such, the ultimate timing and amount of any payment of additional residual amounts is not known at this time.
38
Notes to Financial Statements – continued
| (8) | | Transactions in Underlying Funds-Affiliated Issuers |
An affiliated issuer may be considered one in which the fund owns 5% or more of the outstanding voting securities, or a company which is under common control. For the purposes of this report, the fund assumes the following to be affiliated issuers:
| | | | | | | | | | | | | | | | |
| Underlying Funds | | Beginning
Shares/Par
Amount | | | Acquisitions
Shares/Par
Amount | | | Dispositions
Shares/Par
Amount | | | Ending
Shares/Par
Amount | |
| MFS Institutional Money Market Portfolio | | | 38,705,411 | | | | 388,992,504 | | | | (390,914,280 | ) | | | 36,783,635 | |
| | | | |
| Underlying Funds | | Realized
Gain (Loss) | | | Capital Gain
Distributions | | | Dividend
Income | | | Ending
Value | |
| MFS Institutional Money Market Portfolio | | | $— | | | | $— | | | | $66,052 | | | | $36,783,635 | |
39
REPORT OF INDEPENDENT REGISTERED PUBLIC ACCOUNTING FIRM
To the Trustees and Shareholders of Massachusetts Investors Growth Stock Fund:
We have audited the accompanying statement of assets and liabilities of Massachusetts Investors Growth Stock Fund (the Fund), including the portfolio of investments, as of November 30, 2010, and the related statement of operations for the year then ended, the statements of changes in net assets for each of the two years in the period then ended, and the financial highlights for each of the five years in the period then ended. These financial statements and financial highlights are the responsibility of the Fund’s management. Our responsibility is to express an opinion on these financial statements and financial highlights based on our audits.
We conducted our audits in accordance with the standards of the Public Company Accounting Oversight Board (United States). Those standards require that we plan and perform the audit to obtain reasonable assurance about whether the financial statements and financial highlights are free of material misstatement. We were not engaged to perform an audit of the Fund’s internal control over financial reporting. Our audits included consideration of internal control over financial reporting as a basis for designing audit procedures that are appropriate in the circumstances, but not for the purpose of expressing an opinion on the effectiveness of the Fund’s internal control over financial reporting. Accordingly, we express no such opinion. An audit also includes examining, on a test basis, evidence supporting the amounts and disclosures in the financial statements and financial highlights, assessing the accounting principles used and significant estimates made by management, and evaluating the overall financial statement presentation. Our procedures included confirmation of securities owned as of November 30, 2010, by correspondence with the Fund’s custodian and brokers. We believe that our audits provide a reasonable basis for our opinion.
In our opinion, the financial statements and financial highlights referred to above present fairly, in all material respects, the financial position of Massachusetts Investors Growth Stock Fund at November 30, 2010, the results of its operations for the year then ended, the changes in its net assets for each of the two years in the period then ended, and its financial highlights for each of the five years in the period then ended, in conformity with U.S. generally accepted accounting principles.

Boston, Massachusetts
January 14, 2011
40
TRUSTEES AND OFFICERS — IDENTIFICATION AND BACKGROUND
The Trustees and officers of the Trust, as of January 1, 2011, are listed below, together with their principal occupations during the past five years. (Their titles may have varied during that period.) The address of each Trustee and officer is 500 Boylston Street, Boston, Massachusetts 02116.
| | | | | | |
Name, Date of Birth | | Position(s) Held
with Fund | | Trustee/Officer
Since (h) | | Principal Occupations During
the Past Five Years & Other
Directorships (j) |
| INTERESTED TRUSTEES | | | | |
Robert J. Manning (k) (born 10/20/63) | | Trustee | | February 2004 | | Massachusetts Financial Services Company, Chairman, Chief Executive Officer and Director; President (until December 2009); Chief Investment Officer (until July 2010) |
Robert C. Pozen (k) (born 8/08/46) | | Trustee | | February 2004 | | Massachusetts Financial Services Company, Chairman Emeritus; Chairman (until July 2010); Medtronic, Inc, (medical devices), Director (since 2004); Harvard Business School (education), Senior Lecturer (since 2008); Telesat (satellite communications), Director (until November 2007); Bell Canada Enterprises (telecommunications), Director (until February 2009) |
| INDEPENDENT TRUSTEES | | | | |
David H. Gunning (born 5/30/42) | | Trustee and Chair of Trustees | | January 2004 | | Retired; Cleveland-Cliffs Inc. (mining products and service provider), Vice Chairman/Director (until May 2007); Lincoln Electric Holdings, Inc. (welding equipment manufacturer), Director; Development Alternatives, Inc. (consulting), Portman Limited (mining), Director (until 2008) |
Robert E. Butler (born 11/29/41) | | Trustee | | January 2006 | | Consultant – investment company industry regulatory and compliance matters; PricewaterhouseCoopers LLP (professional services firm), Partner (until 2002) |
41
Trustees and Officers – continued
| | | | | | |
Name, Date of Birth | | Position(s) Held
with Fund | | Trustee/Officer
Since (h) | | Principal Occupations During
the Past Five Years & Other
Directorships (j) |
Maureen R. Goldfarb (born 4/6/55) | | Trustee | | January 2009 | | Private investor; John Hancock Financial Services, Inc., Executive Vice President (until 2004); John Hancock Mutual Funds, Trustee and Chief Executive Officer (until 2004) |
William R. Gutow (born 9/27/41) | | Trustee | | December 1993 | | Private investor and real estate consultant; Capital Entertainment Management Company (video franchise), Vice Chairman; Texas Donuts (donut franchise), Vice Chairman (since 2007); Atlantic Coast Tan (tanning salons), Vice Chairman (until 2007) |
Michael Hegarty (born 12/21/44) | | Trustee | | December 2004 | | Private investor; AXA Financial (financial services and insurance), Vice Chairman and Chief Operating Officer (until 2001); The Equitable Life Assurance Society (insurance), President and Chief Operating Officer (until 2001) |
John P. Kavanaugh (born 11/4/54) | | Trustee | | January 2009 | | Private investor; The Hanover Insurance Group, Inc., Vice President and Chief Investment Officer (until 2006); Allmerica Investment Trust, Allmerica Securities Trust and Opus Investment Trust (investment companies), Chairman, President and Trustee (until 2006) |
J. Dale Sherratt (born 9/23/38) | | Trustee | | June 1989 | | Insight Resources, Inc. (acquisition planning specialists), President; Wellfleet Investments (investor in health care companies), Managing General Partner |
Laurie J. Thomsen (born 8/05/57) | | Trustee | | March 2005 | | Private investor; The Travelers Companies (property and casualty insurance), Director; New Profit, Inc. (venture philanthropy), Executive Partner (until 2010) |
42
Trustees and Officers – continued
| | | | | | |
Name, Date of Birth | | Position(s) Held
with Fund | | Trustee/Officer
Since (h) | | Principal Occupations During
the Past Five Years & Other
Directorships (j) |
Robert W. Uek (born 5/18/41) | | Trustee | | January 2006 | | Consultant to investment company industry; PricewaterhouseCoopers LLP (professional services firm), Partner (until 1999); TT International Funds (mutual fund complex), Trustee (until 2005); Hillview Investment Trust II Funds (mutual fund complex), Trustee (until 2005) |
| OFFICERS | | | | | | |
Maria F. DiOrioDwyer (k) (born 12/01/58) | | President | | March 2004 | | Massachusetts Financial Services Company, Executive Vice President and Chief Regulatory Officer (since March 2004) Chief Compliance Officer (since December 2006) |
Christopher R. Bohane (k) (born 1/18/74) | | Assistant Secretary and Assistant Clerk | | July 2005 | | Massachusetts Financial Services Company, Vice President and Senior Counsel |
John M. Corcoran (k) (born 4/13/65) | | Treasurer | | October 2008 | | Massachusetts Financial Services Company, Senior Vice President (since October 2008); State Street Bank and Trust (financial services provider), Senior Vice President, (until September 2008) |
Ethan D. Corey (k) (born 11/21/63) | | Assistant Secretary and Assistant Clerk | | July 2005 | | Massachusetts Financial Services Company, Senior Vice President and Associate General Counsel |
David L. DiLorenzo (k) (born 8/10/68) | | Assistant Treasurer | | July 2005 | | Massachusetts Financial Services Company, Vice President |
Timothy M. Fagan (k) (born 7/10/68) | | Assistant Secretary and Assistant Clerk | | September 2005 | | Massachusetts Financial Services Company, Vice President and Senior Counsel |
Mark D. Fischer (k) (born 10/27/70) | | Assistant Treasurer | | July 2005 | | Massachusetts Financial Services Company, Vice President |
43
Trustees and Officers – continued
| | | | | | |
Name, Date of Birth | | Position(s) Held
with Fund | | Trustee/Officer
Since (h) | | Principal Occupations During
the Past Five Years & Other
Directorships (j) |
Robyn L. Griffin (born 7/04/75) | | Assistant Independent Chief Compliance Officer | | August 2008 | | Griffin Compliance LLC (provider of compliance services), Principal (since August 2008); State Street Corporation (financial services provider), Mutual Fund Administration Assistant Vice President (October 2006 – July 2008); Liberty Mutual Group (insurance), Personal Market Assistant Controller (April 2006 – October 2006); Deloitte & Touche LLP (professional services firm), Senior Manager (prior to April 2006) |
Brian E. Langenfeld (k) (born 3/07/73) | | Assistant Secretary and Assistant Clerk | | June 2006 | | Massachusetts Financial Services Company, Vice President and Senior Counsel (since May 2006); John Hancock Advisers, LLC, Assistant Vice President and Counsel (until April 2006) |
Ellen Moynihan (k) (born 11/13/57) | | Assistant Treasurer | | April 1997 | | Massachusetts Financial Services Company, Senior Vice President |
Susan S. Newton (k) (born 3/07/50) | | Assistant Secretary and Assistant Clerk | | May 2005 | | Massachusetts Financial Services Company, Senior Vice President and Associate General Counsel |
Susan A. Pereira (k) (born 11/05/70) | | Assistant Secretary and Assistant Clerk | | July 2005 | | Massachusetts Financial Services Company, Vice President and Senior Counsel |
Mark N. Polebaum (k) (born 5/01/52) | | Secretary and Clerk | | January 2006 | | Massachusetts Financial Services Company, Executive Vice President, General Counsel and Secretary (since January 2006); Wilmer Cutler Pickering Hale and Dorr LLP (law firm), Partner (until January 2006) |
Frank L. Tarantino (born 3/07/44) | | Independent Chief Compliance Officer | | June 2004 | | Tarantino LLC (provider of compliance services), Principal |
Richard S. Weitzel (k) (born 7/16/70) | | Assistant Secretary and Assistant Clerk | | October 2007 | | Massachusetts Financial Services Company, Vice President and Assistant General Counsel |
James O. Yost (k) (born 6/12/60) | | Assistant Treasurer | | September 1990 | | Massachusetts Financial Services Company, Senior Vice President |
44
Trustees and Officers – continued
| (h) | Date first appointed to serve as Trustee/officer of an MFS fund. Each Trustee has served continuously since appointment unless indicated otherwise. For the period from December 15, 2004 until February 22, 2005, Messrs. Pozen and Manning served as Advisory Trustees. For the period March 2008 until October 2008, Ms. DiOrioDwyer served as Treasurer of the Funds. |
| (j) | Directorships or trusteeships of companies required to report to the Securities and Exchange Commission (i.e., “public companies”). |
| (k) | “Interested person” of the Trust within the meaning of the Investment Company Act of 1940 (referred to as the 1940 Act), which is the principal federal law governing investment companies like the fund, as a result of position with MFS. The address of MFS is 500 Boylston Street, Boston, Massachusetts 02116. |
Each Trustee has been elected by shareholders and each Trustee and officer holds office until his or her successor is chosen and qualified or until his or her earlier death, resignation, retirement or removal. The Trust does not hold annual meetings for the purpose of electing Trustees, and Trustees are not elected for fixed terms. Messrs. Butler, Kavanaugh, Uek and Ms. Thomsen are members of the Trust’s Audit Committee.
Each of the Fund’s Trustees and officers holds comparable positions with certain other funds of which MFS or a subsidiary is the investment adviser or distributor, and, in the case of the officers, with certain affiliates of MFS. As of January 1, 2011, the Trustees served as board members of 99 funds within the MFS Family of Funds.
45
Trustees and Officers – continued
The Statement of Additional Information for the Fund includes further information about the Trustees and is available without charge upon request by calling 1-800-225-2606.
| | |
| Investment Adviser | | Custodian |
Massachusetts Financial Services Company
500 Boylston Street, Boston, MA 02116-3741 | | JPMorgan Chase Bank
One Chase Manhattan Plaza, New York, NY 10081 |
| Distributor | | Independent Registered Public Accounting Firm |
MFS Fund Distributors, Inc.
500 Boylston Street, Boston, MA 02116-3741 | | Ernst & Young LLP
200 Clarendon Street, Boston, MA 02116 |
| Portfolio Manager | | |
Jeffrey Constantino | | |
46
BOARD REVIEW OF INVESTMENT ADVISORY AGREEMENT
The Investment Company Act of 1940 requires that both the full Board of Trustees and a majority of the non-interested (“independent”) Trustees, voting separately, annually approve the continuation of the Fund’s investment advisory agreement with MFS. The Trustees consider matters bearing on the Fund and its advisory arrangements at their meetings throughout the year, including a review of performance data at each regular meeting. In addition, the independent Trustees met several times over the course of three months beginning in May and ending in July, 2010 (“contract review meetings”) for the specific purpose of considering whether to approve the continuation of the investment advisory agreement for the Fund and the other investment companies that the Board oversees (the “MFS Funds”). The independent Trustees were assisted in their evaluation of the Fund’s investment advisory agreement by independent legal counsel, from whom they received separate legal advice and with whom they met separately from MFS during various contract review meetings. The independent Trustees were also assisted in this process by the MFS Funds’ Independent Chief Compliance Officer, a full-time senior officer appointed by and reporting to the independent Trustees.
In connection with their deliberations regarding the continuation of the investment advisory agreement, the Trustees, including the independent Trustees, considered such information and factors as they believed, in light of the legal advice furnished to them and their own business judgment, to be relevant. The investment advisory agreement for the Fund was considered separately, although the Trustees also took into account the common interests of all MFS Funds in their review. As described below, the Trustees considered the nature, quality, and extent of the various investment advisory, administrative, and shareholder services performed by MFS under the existing investment advisory agreement and other arrangements with the Fund.
In connection with their contract review meetings, the Trustees received and relied upon materials that included, among other items: (i) information provided by Lipper Inc., an independent third party, on the investment performance of the Fund for various time periods ended December 31, 2009 and the investment performance of a group of funds with substantially similar investment classifications/objectives (the “Lipper performance universe”), (ii) information provided by Lipper Inc. on the Fund’s advisory fees and other expenses and the advisory fees and other expenses of comparable funds identified by Lipper Inc. (the “Lipper expense group”), (iii) information provided by MFS on the advisory fees of comparable portfolios of other clients of MFS, including institutional separate accounts and other clients, (iv) information as to whether and to what extent applicable expense waivers,
47
Board Review of Investment Advisory Agreement – continued
reimbursements or fee “breakpoints” are observed for the Fund, (v) information regarding MFS’ financial results and financial condition, including MFS’ and certain of its affiliates’ estimated profitability from services performed for the Fund and the MFS Funds as a whole, and compared to MFS’ institutional business, (vi) MFS’ views regarding the outlook for the mutual fund industry and the strategic business plans of MFS, (vii) descriptions of various functions performed by MFS for the Funds, such as compliance monitoring and portfolio trading practices, and (viii) information regarding the overall organization of MFS, including information about MFS’ senior management and other personnel providing investment advisory, administrative and other services to the Fund and the other MFS Funds. The comparative performance, fee and expense information prepared and provided by Lipper Inc. was not independently verified and the independent Trustees did not independently verify any information provided to them by MFS.
The Trustees’ conclusion as to the continuation of the investment advisory agreement was based on a comprehensive consideration of all information provided to the Trustees and not the result of any single factor. Some of the factors that figured particularly in the Trustees’ deliberations are described below, although individual Trustees may have evaluated the information presented differently from one another, giving different weights to various factors. It is also important to recognize that the fee arrangements for the Fund and other MFS Funds are the result of years of review and discussion between the independent Trustees and MFS, that certain aspects of such arrangements may receive greater scrutiny in some years than in others, and that the Trustees’ conclusions may be based, in part, on their consideration of these same arrangements during the course of the year and in prior years.
Based on information provided by Lipper Inc., the Trustees reviewed the Fund’s total return investment performance as well as the performance of peer groups of funds over various time periods. The Trustees placed particular emphasis on the total return performance of the Fund’s Class A shares in comparison to the performance of funds in its Lipper performance universe over the three-year period ended December 31, 2009, which the Trustees believed was a long enough period to reflect differing market conditions. The total return performance of the Fund’s Class A shares was in the 1st quintile relative to the other funds in the universe for this three-year period (the 1st quintile being the best performers and the 5th quintile being the worst performers). The total return performance of the Fund’s Class A shares was in the 2nd quintile for each of the one- and five-year periods ended December 31, 2009 relative to the Lipper performance universe. Because of the passage of time, these performance results are likely to differ from the performance results for more recent periods, including those shown elsewhere in this report.
48
Board Review of Investment Advisory Agreement – continued
In the course of their deliberations, the Trustees took into account information provided by MFS in connection with the contract review meetings, as well as during investment review meetings conducted with portfolio management personnel during the course of the year regarding the Fund’s performance. After reviewing these and related factors, the Trustees concluded, within the context of their overall conclusions regarding the investment advisory agreement, that they were satisfied with MFS’ responses and efforts relating to investment performance.
In assessing the reasonableness of the Fund’s advisory fee, the Trustees considered, among other information, the Fund’s advisory fee and the total expense ratio of the Fund’s Class A shares as a percentage of average daily net assets and the advisory fee and total expense ratios of peer groups of funds based on information provided by Lipper Inc. The Trustees considered that, according to the Lipper data (which takes into account any fee reductions or expense limitations that were in effect during the Fund’s last fiscal year), the Fund’s effective advisory fee rate and total expense ratio were each lower than the Lipper expense group median.
The Trustees also considered the advisory fees charged by MFS to institutional accounts. In comparing these fees, the Trustees considered information provided by MFS as to the generally broader scope of services provided by MFS to the Fund in comparison to institutional accounts, the higher demands placed on MFS’ investment personnel and trading infrastructure as a result of the daily cash in-flows and out-flows of the Fund, and the impact on MFS and expenses associated with the more extensive regulatory regime to which the Fund is subject in comparison to institutional accounts.
The Trustees also considered whether the Fund is likely to benefit from any economies of scale in the management of the Fund in the event of growth in assets of the Fund. They noted that the Fund’s advisory fee rate schedule is not subject to any breakpoints. Taking into account that the Fund’s effective advisory fee rate was lower than the Lipper expense group median noted above, the Trustees determined not to recommend any advisory fee breakpoints for the Fund at this time.
The Trustees also considered information prepared by MFS relating to MFS’ costs and profits with respect to the Fund, the MFS Funds considered as a group, and other investment companies and accounts advised by MFS, as well as MFS’ methodologies used to determine and allocate its costs to the MFS Funds, the Fund and other accounts and products for purposes of estimating profitability.
After reviewing these and other factors described herein, the Trustees concluded, within the context of their overall conclusions regarding the
49
Board Review of Investment Advisory Agreement – continued
investment advisory agreement, that the advisory fees charged to the Fund represent reasonable compensation in light of the services being provided by MFS to the Fund.
In addition, the Trustees considered MFS’ resources and related efforts to continue to retain, attract and motivate capable personnel to serve the Fund. The Trustees also considered current and developing conditions in the financial services industry, including the presence of large and well-capitalized companies which are spending, and appear to be prepared to continue to spend, substantial sums to engage personnel and to provide services to competing investment companies. In this regard, the Trustees also considered the financial resources of MFS and its ultimate parent, Sun Life Financial Inc. The Trustees also considered the advantages and possible disadvantages to the Fund of having an adviser that also serves other investment companies as well as other accounts.
The Trustees also considered the nature, quality, cost, and extent of administrative, transfer agency, and distribution services provided to the Fund by MFS and its affiliates under agreements and plans other than the investment advisory agreement, including any 12b-1 fees the Fund pays to MFS Fund Distributors, Inc. (“MFD”), an affiliate of MFS. The Trustees also considered the nature, extent and quality of certain other services MFS performs or arranges for on the Fund’s behalf, which may include securities lending programs, directed expense payment programs, class action recovery programs, and MFS’ interaction with third-party service providers, principally custodians and sub-custodians. The Trustees concluded that the various non-advisory services provided by MFS and its affiliates on behalf of the Funds were satisfactory.
The Trustees also considered benefits to MFS from the use of the Fund’s portfolio brokerage commissions, if applicable, to pay for investment research and various other factors. Additionally, the Trustees considered so-called “fall-out benefits” to MFS such as reputational value derived from serving as investment manager to the Fund.
Based on their evaluation of factors that they deemed to be material, including those factors described above, the Board of Trustees, including a majority of the independent Trustees, concluded that the Fund’s investment advisory agreement with MFS should be continued for an additional one-year period, commencing August 1, 2010.
Note: MFD has agreed to the Trustees’ recommendation to eliminate the distribution fee component of the 12b-1 fee paid by the Fund’s Class A and Class 529A shares, effective January 1, 2011.
50
Board Review of Investment Advisory Agreement – continued
A discussion regarding the Board’s most recent review and renewal of the fund’s Investment Advisory Agreement with MFS is available by clicking on the fund’s name under “Mutual Funds” in the “Products and Performance” section of the MFS Web site (mfs.com).
51
PROXY VOTING POLICIES AND INFORMATION
A general description of the MFS funds’ proxy voting policies and procedures is available without charge, upon request, by calling
1-800-225-2606, by visiting the Proxy Voting section of mfs.com or by visiting the SEC’s Web site at http://www.sec.gov.
Information regarding how the fund voted proxies relating to portfolio securities during the most recent twelve-month period ended June 30 is available without charge by visiting the Proxy Voting section of mfs.com or by visiting the SEC’s Web site at http://www.sec.gov.
QUARTERLY PORTFOLIO DISCLOSURE
The fund will file a complete schedule of portfolio holdings with the Securities and Exchange Commission (the Commission) for the first and third quarters of each fiscal year on Form N-Q. The fund’s Form N-Q may be reviewed and copied at the:
Public Reference Room
Securities and Exchange Commission
100 F Street, NE, Room 1580
Washington, D.C. 20549
Information on the operation of the Public Reference Room may be obtained by calling the Commission at 1-800-SEC-0330. The fund’s Form N-Q is available on the EDGAR database on the Commission’s Internet Web site at http://www.sec.gov, and copies of this information may be obtained, upon payment of a duplicating fee, by electronic request at the following e-mail address: publicinfo@sec.gov or by writing the Public Reference Section at the above address.
A shareholder can also obtain the quarterly portfolio holdings report at mfs.com.
FURTHER INFORMATION
From time to time, MFS may post important information about the fund or the MFS funds on the MFS web site (mfs.com). This information is available by visiting the “News & Commentary” section of mfs.com or by clicking on the fund’s name under “Mutual Funds” in the “Products and Performance” section of mfs.com.
FEDERAL TAX INFORMATION (unaudited)
The fund will notify shareholders of amounts for use in preparing 2010 income tax forms in January 2011. The following information is provided pursuant to provisions of the Internal Revenue Code.
The fund designates the maximum amount allowable as qualified dividend income eligible for the 15% tax rate.
For corporate shareholders, 100% of the ordinary income dividends paid during the fiscal year qualify for the corporate dividends received deduction.
52
MFS® PRIVACY NOTICE
Privacy is a concern for every investor today. At MFS Investment Management® and the MFS funds, we take this concern very seriously. We want you to understand our policies about the investment products and services that we offer, and how we protect the nonpublic personal information of investors who have a direct relationship with us and our wholly owned subsidiaries.
Throughout our business relationship, you provide us with personal information. We maintain information and records about you, your investments, and the services you use. Examples of the nonpublic personal information we maintain include
| | Ÿ | | data from investment applications and other forms |
| | Ÿ | | share balances and transactional history with us, our affiliates, or others |
| | Ÿ | | facts from a consumer reporting agency |
We do not disclose any nonpublic personal information about our customers or former customers to anyone, except as permitted by law. We may share nonpublic personal information with third parties or certain of our affiliates in connection with servicing your account or processing your transactions. We may share information with companies or financial institutions that perform marketing services on our behalf or with other financial institutions with which we have joint marketing arrangements, subject to any legal requirements.
Authorization to access your nonpublic personal information is limited to appropriate personnel who provide products, services, or information to you. We maintain physical, electronic, and procedural safeguards to help protect the personal information we collect about you.
If you have any questions about the MFS privacy policy, please call 1-800-225-2606 any business day.
Note: If you own MFS products or receive MFS services in the name of a third party such as a bank or broker-dealer, their privacy policy may apply to you instead of ours.
53
CONTACT US
| | |
| Web site | | Mailing address |
| mfs.com | | MFS Service Center, Inc. |
| | P.O. Box 55824 |
| MFS TALK | | Boston, MA 02205-5824 |
| 1-800-637-8255 | | |
| 24 hours a day | | Overnight mail |
| | MFS Service Center, Inc. |
| Account service and literature | | c/o Boston Financial Data Services |
| | 30 Dan Road |
| Shareholders | | Canton, MA 02021-2809 |
| 1-800-225-2606 | | |
| | |
| Investment professionals | | |
| 1-800-343-2829 | | |
| | |
| Retirement plan services | | |
| 1-800-637-1255 | | |

Save paper with eDelivery. MFS® will send you prospectuses, reports, and proxies directly via e-mail so you will get information faster with less mailbox clutter. To sign up: 1. go to mfs.com. 2. log in via MFS® Access. 3. select eDelivery. If you own your MFS fund shares through a financial institution or a retirement plan, MFS® TALK, MFS Access, and eDelivery may not be available to you.

The Registrant has adopted a Code of Ethics pursuant to Section 406 of the Sarbanes-Oxley Act and as defined in Form N-CSR that applies to the Registrant’s principal executive officer and principal financial and accounting officer. The Registrant has not amended any provision in its Code of Ethics (the “Code”) that relates to an element of the Code’s definitions enumerated in paragraph (b) of Item 2 of this Form N-CSR. During the period covered by this report, the Registrant did not grant a waiver, including an implicit waiver, from any provision of the Code.
A copy of the Code of Ethics is filed as an exhibit to this Form N-CSR.
| ITEM 3. | AUDIT COMMITTEE FINANCIAL EXPERT. |
Messrs. Robert E. Butler, John P. Kavanaugh and Robert W. Uek and Ms. Laurie J. Thomsen, members of the Audit Committee, have been determined by the Board of Trustees in their reasonable business judgment to meet the definition of “audit committee financial expert” as such term is defined in Form N-CSR. In addition, Messrs. Butler, Kavanaugh and Uek and Ms. Thomsen are “independent” members of the Audit Committee (as such term has been defined by the Securities and Exchange Commission in regulations implementing Section 407 of the Sarbanes-Oxley Act of 2002). The Securities and Exchange Commission has stated that the designation of a person as an audit committee financial expert pursuant to this Item 3 on the Form N-CSR does not impose on such a person any duties, obligations or liability that are greater than the duties, obligations or liability imposed on such person as a member of the Audit Committee and the Board of Trustees in the absence of such designation or identification.
| ITEM 4. | PRINCIPAL ACCOUNTANT FEES AND SERVICES. |
Items 4(a) through 4(d) and 4(g):
The Board of Trustees has appointed Ernst & Young LLP (“E&Y”) to serve as independent accountants to the Registrant (referred to as the “Fund”). The tables below set forth the audit fees billed to the Fund as well as fees for non-audit services provided to the Fund and/or to the Fund’s investment adviser, Massachusetts Financial Services Company (“MFS”), and to various entities either controlling, controlled by, or under common control with MFS that provide ongoing services to the Fund (“MFS Related Entities”).
For the fiscal years ended November 30, 2010 and 2009, audit fees billed to the Fund by E&Y were as follows:
| | | | | | | | |
| | | Audit Fees | |
| | | 2010 | | | 2009 | |
Fees billed by E&Y: | | | | | | | | |
Massachusetts Investors Growth Stock Fund | | | 46,201 | | | | 45,311 | |
For the fiscal years ended November 30, 2010 and 2009, fees billed by E&Y for audit-related, tax and other services provided to the Fund and for audit-related, tax and other services provided to MFS and MFS Related Entities were as follows:
| | | | | | | | | | | | | | | | | | | | | | | | |
| | | Audit-Related Fees1 | | | Tax Fees2 | | | All Other Fees3 | |
| | | 2010 | | | 2009 | | | 2010 | | | 2009 | | | 2010 | | | 2009 | |
Fees billed by E&Y: | | | | | | | | | | | | | | | | | | | | | | | | |
To Massachusetts Investors Growth Stock Fund | | | 0 | | | | 0 | | | | 8,817 | | | | 8,723 | | | | 0 | | | | 0 | |
To MFS and MFS Related Entities of Massachusetts Investors Growth Stock Fund* | | | 0 | | | | 0 | | | | 0 | | | | 0 | | | | 0 | | | | 0 | |
| | | | | | |
| | | 2010 | | | 20094 | | | | | | | | | | | | | |
Aggregate fees for non-audit services: | | | | | | | | | | | | | | | | | | | | | | | | |
To Massachusetts Investors Growth Stock Fund, MFS and MFS Related Entities# | | | 242,946 | | | | 237,529 | | | | | | | | | | | | | | | | | |
| * | This amount reflects the fees billed to MFS and MFS Related Entities for non-audit services relating directly to the operations and financial reporting of the Fund (portions of which services also related to the operations and financial reporting of other funds within the MFS Funds complex). |
| # | This amount reflects the aggregate fees billed by E&Y for non-audit services rendered to the Fund and for non-audit services rendered to MFS and the MFS Related Entities. |
| 1 | The fees included under “Audit-Related Fees” are fees related to assurance and related services that are reasonably related to the performance of the audit or review of financial statements, but not reported under “Audit Fees,” including accounting consultations, agreed-upon procedure reports, attestation reports, comfort letters and internal control reviews. |
| 2 | The fees included under “Tax Fees” are fees associated with tax compliance, tax advice and tax planning, including services relating to the filing or amendment of federal, state or local income tax returns, regulated investment company qualification reviews and tax distribution and analysis. |
| 3 | The fees under “All Other Fees” are fees for products and services provided by E&Y other than those reported under “Audit Fees,” “Audit-Related Fees” and “Tax Fees”. |
| 4 | E&Y fees reported in 2009 have been restated in this filing from those reported in the Registrant’s filing for the reporting period ended November 30, 2009. |
Set forth below are the policies and procedures established by the Audit Committee of the Board of Trustees relating to the pre-approval of audit and non-audit related services:
To the extent required by applicable law, pre-approval by the Audit Committee of the Board is needed for all audit and permissible non-audit services rendered to the Funds and all permissible non-audit services rendered to MFS or MFS Related Entities if the services relate directly to the operations and financial reporting of the Registrant. Pre-approval is currently on an engagement-by-engagement basis. In the event pre-approval of such services is necessary between regular meetings of the Audit Committee and it is not practical to wait to seek pre-approval at the next regular meeting of the Audit Committee, pre-approval of such services may be referred to the Chair of the Audit Committee for approval; provided that the Chair may not pre-approve any individual engagement for such services exceeding $50,000 or multiple engagements for such services in the aggregate exceeding $100,000 in each period between regular meetings of the Audit Committee. Any engagement pre-approved by the Chair between regular meetings of the Audit Committee shall be presented for ratification by the entire Audit Committee at its next regularly scheduled meeting.
None, or 0%, of the services relating to the Audit-Related Fees, Tax Fees and All Other Fees paid by the Fund and MFS and MFS Related Entities relating directly to the operations and financial reporting of the Registrant disclosed above were approved by the audit committee pursuant to paragraphs (c)(7)(i)(C) of Rule 2-01 of Regulation S-X (which permits audit committee approval after the start of the engagement with respect to services other than audit, review or attest services, if certain conditions are satisfied).
Item 4(f): Not applicable.
Item 4(h): The Registrant’s Audit Committee has considered whether the provision by a Registrant’s independent registered public accounting firm of non-audit services to MFS and MFS Related Entities that were not pre-approved by the Committee (because such services did not relate directly to the operations and financial reporting of the Registrant) was compatible with maintaining the independence of the independent registered public accounting firm as the Registrant’s principal auditors.
| ITEM 5. | AUDIT COMMITTEE OF LISTED REGISTRANTS. |
Not applicable to the Registrant.
A schedule of investments of the Registrant is included as part of the report to shareholders of such series under Item 1 of this Form N-CSR.
| ITEM 7. | DISCLOSURE OF PROXY VOTING POLICIES AND PROCEDURES FOR CLOSED-END MANAGEMENT INVESTMENT COMPANIES. |
Not applicable to the Registrant.
| ITEM 8. | PORTFOLIO MANAGERS OF CLOSED-END MANAGEMENT INVESTMENT COMPANIES. |
Not applicable to the Registrant.
| ITEM 9. | PURCHASES OF EQUITY SECURITIES BY CLOSED-END MANAGEMENT INVESTMENT COMPANY AND AFFILIATED PURCHASERS. |
Not applicable to the Registrant.
| ITEM 10. | SUBMISSION OF MATTERS TO A VOTE OF SECURITY HOLDERS. |
There were no material changes to the procedures by which shareholders may send recommendations to the Board for nominees to the Registrant’s Board since the Registrant last provided disclosure as to such procedures in response to the requirements of Item 407(c)(2)(iv) of Regulation S-K or this Item.
| ITEM 11. | CONTROLS AND PROCEDURES. |
| (a) | Based upon their evaluation of the effectiveness of the registrant’s disclosure controls and procedures (as defined in Rule 30a-3(c) under the Investment Company Act of 1940 (the “Act”)) as conducted within 90 days of the filing date of this report on Form N-CSR, the registrant’s principal financial officer and principal executive officer have concluded that those disclosure controls and procedures provide reasonable assurance that the material information required to be disclosed by the registrant on this report is recorded, processed, summarized and reported within the time periods specified in the Securities and Exchange Commission’s rules and forms. |
| (b) | There were no changes in the registrant’s internal controls over financial reporting (as defined in Rule 30a-3(d) under the Act) that occurred during the second fiscal quarter of the period covered by the report that have materially affected, or are reasonably likely to materially affect, the registrant’s internal control over financial reporting. |
| (a) | File the exhibits listed below as part of this form. Letter or number the exhibits in the sequence indicated. |
| | (1) | Any code of ethics, or amendment thereto, that is the subject of the disclosure required by Item 2, to the extent that the registrant intends to satisfy the Item 2 requirements through filing of an exhibit: Code of Ethics attached hereto. |
| | (2) | A separate certification for each principal executive officer and principal financial officer of the registrant as required by Rule 30a-2(a) under the Act (17 CFR 270.30a-2): Attached hereto. |
| (b) | If the report is filed under Section 13(a) or 15(d) of the Exchange Act, provide the certifications required by Rule 30a-2(b) under the Act (17 CFR 270.30a-2(b)), Rule 13a-14(b) or Rule 15d-14(b) under the Exchange Act (17 CFR 240.13a-14(b) or 240.15d-14(b)) and Section 1350 of Chapter 63 of Title 18 of the United States Code (18 U.S.C. 1350) as an exhibit. A certification furnished pursuant to this paragraph will not be deemed “filed” for the purposes of Section 18 of the Exchange Act (15 U.S.C. 78r), or otherwise subject to the liability of that section. Such certification will not be deemed to be incorporated by reference into any filing under the Securities Act of 1933 or the Exchange Act, except to the extent that the registrant specifically incorporates it by reference: Attached hereto. |
Notice
A copy of the Amended and Restated Declaration of Trust, as amended, of the Registrant is on file with the Secretary of State of The Commonwealth of Massachusetts and notice is hereby given that this instrument is executed on behalf of the Registrant by an officer of the Registrant as an officer and not individually and the obligations of or arising out of this instrument are not binding upon any of the Trustees or shareholders individually, but are binding only upon the assets and property of the respective constituent series of the Registrant.
SIGNATURES
Pursuant to the requirements of the Securities Exchange Act of 1934 and the Investment Company Act of 1940, the registrant has duly caused this report to be signed on its behalf by the undersigned, thereunto duly authorized.
(Registrant) MASSACHUSETTS INVESTORS GROWTH STOCK FUND
| | |
| By (Signature and Title)* | | MARIA F. DIORIODWYER |
| | Maria F. DiOrioDwyer, President |
Date: January 14, 2011
Pursuant to the requirements of the Securities Exchange Act of 1934 and the Investment Company Act of 1940, this report has been signed below by the following persons on behalf of the registrant and in the capacities and on the dates indicated.
| | |
| By (Signature and Title)* | | MARIA F. DIORIODWYER |
| | Maria F. DiOrioDwyer, President (Principal Executive Officer) |
Date: January 14, 2011
| | |
| By (Signature and Title)* | | JOHN M. CORCORAN |
| | John M. Corcoran, Treasurer (Principal Financial Officer and Accounting Officer) |
Date: January 14, 2011
| * | Print name and title of each signing officer under his or her signature. |