UNITED STATES
SECURITIES AND EXCHANGE COMMISSION
Washington, D.C. 20549
FORM N-CSR
CERTIFIED SHAREHOLDER REPORT OF
REGISTERED MANAGEMENT INVESTMENT COMPANIES
Investment Company Act file number 811-00859
MASSACHUSETTS INVESTORS GROWTH STOCK FUND
(Exact name of registrant as specified in charter)
111 Huntington Avenue, Boston, Massachusetts 02199
(Address of principal executive offices) (Zip code)
Christopher R. Bohane
Massachusetts Financial Services Company
111 Huntington Avenue
Boston, Massachusetts 02199
(Name and address of agents for service)
Registrant’s telephone number, including area code: (617) 954-5000
Date of fiscal year end: November 30
Date of reporting period: November 30, 2017
| ITEM 1. | REPORTS TO STOCKHOLDERS. |
ANNUAL REPORT
November 30, 2017

MASSACHUSETTS INVESTORS
GROWTH STOCK FUND

MIG-ANN
MASSACHUSETTS INVESTORS GROWTH
STOCK FUND
CONTENTS
The report is prepared for the general information of shareholders.
It is authorized for distribution to prospective investors only when preceded or accompanied by a current prospectus.
NOT FDIC INSURED • MAY LOSE VALUE • NO BANK GUARANTEE

LETTER FROM THE EXECUTIVE CHAIRMAN
Dear Shareholders:
Most markets have proved resilient over the past year, despite uncertainty accompanying a new presidential administration in the United States and unease over
ongoing negotiations between the United Kingdom and the European Union regarding Brexit. U.S. share prices have reached new highs in recent months although the U.S. Federal Reserve has continued to gradually hike interest rates and has begun to shrink its balance sheet.
Globally, we’ve experienced a synchronized upturn in economic growth for more than a year. Despite the improvement in economic activity, there are few immediate signs of worrisome inflation amid muted wage gains around the world. Emerging market economies have been boosted in part by a weaker
U.S. dollar and are recovering despite lingering concerns over the potential for restrictive U.S. trade policies. Commodity markets have recovered somewhat in response to solid global demand and robust global trade, though not enough to rekindle inflation fears.
At MFS®, we believe having a disciplined, long-term investment approach through a full market cycle is essential to capturing the best opportunities while also managing risk. In our view, such a strategy, along with the professional guidance of a financial advisor, will help you reach your investment objectives.
Respectfully,

Robert J. Manning
Executive Chairman
MFS Investment Management
January 16, 2018
The opinions expressed in this letter are subject to change and may not be relied upon for investment advice. No forecasts can be guaranteed.
1
PORTFOLIO COMPOSITION
Portfolio structure

| | | | |
| Top ten holdings | | | | |
| Alphabet, Inc., “A” | | | 6.5% | |
| Accenture PLC, “A” | | | 4.2% | |
| Microsoft Corp. | | | 3.9% | |
| NIKE, Inc., “B” | | | 3.0% | |
| Thermo Fisher Scientific, Inc. | | | 2.9% | |
| Estee Lauder Cos., Inc., “A” | | | 2.8% | |
| Visa, Inc., “A” | | | 2.8% | |
| Colgate-Palmolive Co. | | | 2.8% | |
| Starbucks Corp. | | | 2.8% | |
| Apple, Inc. | | | 2.7% | |
| | | | |
| Equity sectors | | | | |
| Technology | | | 17.0% | |
| Special Products & Services | | | 13.1% | |
| Health Care | | | 12.6% | |
| Consumer Staples | | | 11.9% | |
| Leisure | | | 10.2% | |
| Retailing | | | 9.9% | |
| Financial Services | | | 9.8% | |
| Industrial Goods & Services | | | 5.5% | |
| Basic Materials | | | 5.3% | |
| Autos & Housing | | | 1.6% | |
| Transportation | | | 1.6% | |
| Energy | | | 0.7% | |
Cash & Cash Equivalents includes any cash, investments in money market funds, short-term securities, and other assets less liabilities. Please see the Statement of Assets and Liabilities for additional information related to the fund’s cash position and other assets and liabilities.
Percentages are based on net assets as of November 30, 2017.
The portfolio is actively managed and current holdings may be different.
2
MANAGEMENT REVIEW
Summary of Results
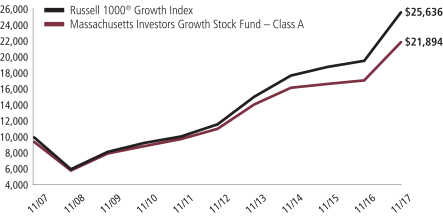
For the twelve months ended November 30, 2017, Class A shares of the Massachusetts Investors Growth Stock Fund (“fund”) provided a total return of 27.71%, at net asset value. This compares with a return of 30.81% for the fund’s benchmark, the Russell 1000® Growth Index.
Market Environment
For the first time in many years, the global economy experienced a period of synchronized economic growth over the reporting period. The rebound in emerging markets (“EM”) economies was more pronounced (despite the slight deceleration in Chinese growth at the end of the period), helped by larger economies, such as Brazil and Russia, emerging from recessions. At the same time, developed markets (“DM”) economies continued to grow at or above potential. Market confidence increased in the US during the period fueled, in part, by a more lenient US regulatory backdrop and hopes for a significant cut in corporate tax rates.
Globally, markets benefited from a reflation trade as commodity prices strengthened, activity and growth prospects improved, and inflation moved higher, though within moderate bounds. As a result, there were more tightening signals and actions by DM central banks. The US Federal Reserve increased interest rates by 25 basis points three times during the period, bringing the total number of quarter-percent hikes in the federal funds rate to four, since December 2015. The European Central Bank announced an extension of its quantitative easing program at the end of the period, but reduced the pace of its monthly asset purchases by half. In addition, the Bank of England hiked its base rate for the first time in a decade, near the end of the period. Markets were comforted, along with central banks, by the decline in fears of a populist surge in Europe after establishment candidates won the Dutch and French elections, though a right-wing populist party gained seats in the German parliament for the first time in the post-World War II era. Additionally, European growth reflected a generally calmer political economic backdrop.
In recent months, the US dollar reversed the sharp rise seen early in the period, easing what had been a substantial headwind to earnings for multinationals. US consumer spending held up well during the second half of the period amid a modest increase in real wages and relatively low gasoline prices. However, demand for autos cooled from the record level logged early in the period, while the housing market improved, albeit constrained by below-average inventory levels. Global trade, which was sluggish early in the period, showed signs of improvement in the period’s second half, a positive indicator of global economic activity and prospects. Early in the period, there was a selloff in EM due to fears that President Trump would follow through on various campaign threats and promises that were judged to be detrimental to EM. While President Trump withdrew the US from the Trans-Pacific Partnership and began the renegotiation of the North American Free Trade Agreement, significant additional policy action was lacking on economic issues involving EM. As a result, EM resumed their upward trajectory, powered by strong inflows throughout 2017.
3
Management Review – continued
Detractors from Performance
An underweight position and, to a lesser extent, stock selection in the technology sector hurt performance relative to the Russell 1000® Growth Index. Notably, the fund’s underweight position in computer and personal electronics maker Apple, and not holding shares of social networking service provider Facebook and computer graphics processors maker NVIDIA, weakened relative returns. Shares of Apple advanced during the reporting period on the back of well-anticipated new product launches, including the iPhone 8, iPhone 8 Plus and iPhone X. Additionally, the company’s Services segment posted strong revenue growth, earlier in the reporting period, which also strengthened the stock.
Poor security selection in both the special products & services and retailing sectors further weighed on relative performance. Within the special products & services sector, an overweight position in consumer credit reporting agency Equifax dampened relative results. Shares of Equifax dropped upon news that the company had fallen victim to a security breach in which hackers gained access to the personal data of millions of consumers. Within the retailing sector, not owning shares of internet retailer Amazon.com, and overweight positions in automotive replacement parts distributor AutoZone and retail chain operator TJX Cos. held back relative returns. Shares of Amazon.com outpaced the benchmark during the period on the back of strong retail demand and growth in Amazon Web Services, its cloud computing services division.
Elsewhere, the fund’s overweight positions in beauty products company Coty and global consumer products company Colgate-Palmolive hindered relative performance. Not owning shares of strong-performing aerospace company Boeing also detracted from relative results.
Contributors to Performance
Strong security selection in the consumer staples, health care and financial services sectors was an area of relative strength during the reporting period. Within the consumer staples sector, the fund’s overweight positions in beauty products maker Estee Lauder and infant and children’s pediatric nutrition producer Mead Johnson Nutrition (h) lifted relative performance. Strong demand from international markets, notably China, and growth from recent acquisitions helped drive shares of Estee Lauder upwards during the reporting period. Within the health care sector, overweighting pharmaceutical and medical products maker Abbott Laboratories, and not holding shares of poor-performing biopharmaceutical company Celgene, benefited relative returns. Shares of Celgene declined, late in the period, when the company announced it had terminated the development of a potential treatment for Crohn’s disease. While stock selection within the financial services sector also supported relative results, there were no individual stocks within this sector that were among the fund’s top relative contributors for the reporting period.
4
Management Review – continued
In other sectors, owning shares of luxury goods retailer LVMH Moet Hennessy Louis Vuitton (b) (France), and overweight positions in precision instruments manufacturer Mettler-Toledo International, paint and coating manufacturer Sherwin-Williams and credit rating agency Moody’s, supported relative performance. Shares of LVMH Moet Hennessy Louis Vuitton advanced, benefiting from strong demand for luxury goods that helped drive greater-than-expected earnings. Not holding shares of poor-performing diversified industrial conglomerate General Electric and diversified technology products and services company IBM also helped.
During the reporting period, the fund’s relative currency exposure, resulting primarily from differences between the fund’s and the benchmark’s exposures to holdings of securities denominated in foreign currencies, was a contributor to relative performance. All of MFS’ investment decisions are driven by the fundamentals of each individual opportunity and as such, it is common for our portfolios to have different currency exposure than the benchmark.
Respectfully,
Portfolio Manager(s)
Jeffrey Constantino
| (b) | Security is not a benchmark constituent. |
| (h) | Security was not held in the portfolio at period end. |
The views expressed in this report are those of the portfolio manager(s) only through the end of the period of the report as stated on the cover and do not necessarily reflect the views of MFS or any other person in the MFS organization. These views are subject to change at any time based on market or other conditions, and MFS disclaims any responsibility to update such views. These views may not be relied upon as investment advice or an indication of trading intent on behalf of any MFS portfolio. References to specific securities are not recommendations of such securities, and may not be representative of any MFS portfolio’s current or future investments.
5
PERFORMANCE SUMMARY THROUGH 11/30/17
The following chart illustrates a representative class of the fund’s historical performance in comparison to its benchmark(s). Performance results include the deduction of the maximum applicable sales charge and reflect the percentage change in net asset value, including reinvestment of dividends and capital gains distributions. The performance of other share classes will be greater than or less than that of the class depicted below. Benchmarks are unmanaged and may not be invested in directly. Benchmark returns do not reflect sales charges, commissions or expenses. (See Notes to Performance Summary.)
Performance data shown represents past performance and is no guarantee of future results. Investment return and principal value fluctuate so your shares, when sold, may be worth more or less than the original cost; current performance may be lower or higher than quoted. The performance shown does not reflect the deduction of taxes, if any, that a shareholder would pay on fund distributions or the redemption of fund shares.
Growth of a Hypothetical $10,000 Investment
6
Performance Summary – continued
Total Returns through 11/30/17
Average annual without sales charge
| | | | | | | | | | | | | | |
| | | Share Class | | Class Inception Date | | 1-yr | | 5-yr | | 10-yr | | Life (t) | | |
| | | A | | 1/01/35 | | 27.71% | | 14.61% | | 8.79% | | N/A | | |
| | | B | | 9/07/93 | | 26.67% | | 13.74% | | 8.00% | | N/A | | |
| | | C | | 11/03/97 | | 26.66% | | 13.73% | | 8.01% | | N/A | | |
| | | I | | 1/02/97 | | 27.95% | | 14.88% | | 9.09% | | N/A | | |
| | | R1 | | 4/01/05 | | 26.67% | | 13.73% | | 8.00% | | N/A | | |
| | | R2 | | 10/31/03 | | 27.35% | | 14.30% | | 8.55% | | N/A | | |
| | | R3 | | 4/01/05 | | 27.61% | | 14.59% | | 8.81% | | N/A | | |
| | | R4 | | 4/01/05 | | 27.96% | | 14.88% | | 9.10% | | N/A | | |
| | | R6 | | 6/01/12 | | 28.11% | | 15.00% | | N/A | | 15.46% | | |
| | | 529A | | 7/31/02 | | 27.60% | | 14.57% | | 8.72% | | N/A | | |
| | | 529B | | 7/31/02 | | 26.69% | | 13.69% | | 7.93% | | N/A | | |
| | | 529C | | 7/31/02 | | 26.68% | | 13.68% | | 7.93% | | N/A | | |
| Comparative benchmark(s) | | | | | | | | | | |
| | | Russell 1000® Growth Index (f) | | 30.81% | | 17.14% | | 9.87% | | N/A | | |
| Average annual with sales charge | | | | | | | | | | |
| | | A
With Initial Sales Charge (5.75%) | | 20.36% | | 13.26% | | 8.15% | | N/A | | |
| | | B
With CDSC (Declining over six years from 4% to 0%) (v) | | 22.67% | | 13.50% | | 8.00% | | N/A | | |
| | | C
With CDSC (1% for 12 months) (v) | | 25.66% | | 13.73% | | 8.01% | | N/A | | |
| | | 529A
With Initial Sales Charge (5.75%) | | 20.26% | | 13.22% | | 8.08% | | N/A | | |
| | | 529B
With CDSC (Declining over six years from 4% to 0%) (v) | | 22.69% | | 13.45% | | 7.93% | | N/A | | |
| | | 529C
With CDSC (1% for 12 months) (v) | | 25.68% | | 13.68% | | 7.93% | | N/A | | |
CDSC – Contingent Deferred Sales Charge.
Class I, R1, R2, R3, R4, and R6 shares do not have a sales charge.
| (f) | Source: FactSet Research Systems Inc. |
| (t) | For the period from the class inception date through the stated period end (for those share classes with less than 10 years of performance history). No comparative benchmark performance information is provided for “life” periods. (See Notes to Performance Summary.) |
| (v) | Assuming redemption at the end of the applicable period. |
7
Performance Summary – continued
Benchmark Definition(s)
Russell 1000® Growth Index – constructed to provide a comprehensive barometer for growth securities in the large-cap segment of the U.S. equity universe. Companies in this index generally have higher price-to-book ratios and higher forecasted growth values. The Russell 1000® Growth Index is a trademark/service mark of the Frank Russell Company. Russell® is a trademark of the Frank Russell Company.
It is not possible to invest directly in an index.
Notes to Performance Summary
Class 529 shares are only available in conjunction with qualified tuition programs, such as the MFS 529 Savings Plan. There also is an additional fee, which is detailed in the program description, on qualified tuition programs. If this fee was reflected, the performance for Class 529 shares would have been lower. This annual fee is waived for Oregon residents and for those accounts with assets of $25,000 or more.
Average annual total return represents the average annual change in value for each share class for the periods presented. Life returns are presented where the share class has less than 10 years of performance history and represent the average annual total return from the class inception date to the stated period end date. As the fund’s share classes may have different inception dates, the life returns may represent different time periods and may not be comparable. As a result, no comparative benchmark performance information is provided for life periods.
Performance results reflect any applicable expense subsidies and waivers in effect during the periods shown. Without such subsidies and waivers the fund’s performance results would be less favorable. Please see the prospectus and financial statements for complete details.
Performance results do not include adjustments made for financial reporting purposes in accordance with U.S. generally accepted accounting principles and may differ from amounts reported in the financial highlights.
From time to time the fund may receive proceeds from litigation settlements, without which performance would be lower.
8
EXPENSE TABLE
Fund expenses borne by the shareholders during the period, June 1, 2017 through November 30, 2017
As a shareholder of the fund, you incur two types of costs: (1) transaction costs, including sales charges (loads) on certain purchase or redemption payments, and (2) ongoing costs, including management fees; distribution and service (12b-1) fees; and other fund expenses. This example is intended to help you understand your ongoing costs (in dollars) of investing in the fund and to compare these costs with the ongoing costs of investing in other mutual funds.
The example is based on an investment of $1,000 invested at the beginning of the period and held for the entire period June 1, 2017 through November 30, 2017.
Actual Expenses
The first line for each share class in the following table provides information about actual account values and actual expenses. You may use the information in this line, together with the amount you invested, to estimate the expenses that you paid over the period. Simply divide your account value by $1,000 (for example, an $8,600 account value divided by $1,000 = 8.6), then multiply the result by the number in the first line under the heading entitled “Expenses Paid During Period” to estimate the expenses you paid on your account during this period.
Hypothetical Example for Comparison Purposes
The second line for each share class in the following table provides information about hypothetical account values and hypothetical expenses based on the fund’s actual expense ratio and an assumed rate of return of 5% per year before expenses, which is not the fund’s actual return. The hypothetical account values and expenses may not be used to estimate the actual ending account balance or expenses you paid for the period. You may use this information to compare the ongoing costs of investing in the fund and other funds. To do so, compare this 5% hypothetical example with the 5% hypothetical examples that appear in the shareholder reports of the other funds.
Please note that the expenses shown in the table are meant to highlight your ongoing costs only and do not reflect any transactional costs, such as sales charges (loads). Therefore, the second line for each share class in the table is useful in comparing ongoing costs only, and will not help you determine the relative total costs of owning different funds. In addition, if these transactional costs were included, your costs would have been higher.
9
Expense Table – continued
| | | | | | | | | | | | |
Share
Class | | | | Annualized
Expense
Ratio | | Beginning
Account Value
6/01/17 | | Ending
Account Value
11/30/17 | | Expenses
Paid During
Period (p)
6/01/17-11/30/17 | |
| A | | Actual | | 0.72% | | $1,000.00 | | $1,097.94 | | | $3.79 | |
| | Hypothetical (h) | | 0.72% | | $1,000.00 | | $1,021.46 | | | $3.65 | |
| B | | Actual | | 1.48% | | $1,000.00 | | $1,093.79 | | | $7.77 | |
| | Hypothetical (h) | | 1.48% | | $1,000.00 | | $1,017.65 | | | $7.49 | |
| C | | Actual | | 1.48% | | $1,000.00 | | $1,093.66 | | | $7.77 | |
| | Hypothetical (h) | | 1.48% | | $1,000.00 | | $1,017.65 | | | $7.49 | |
| I | | Actual | | 0.48% | | $1,000.00 | | $1,099.20 | | | $2.53 | |
| | Hypothetical (h) | | 0.48% | | $1,000.00 | | $1,022.66 | | | $2.43 | |
| R1 | | Actual | | 1.48% | | $1,000.00 | | $1,093.64 | | | $7.77 | |
| | Hypothetical (h) | | 1.48% | | $1,000.00 | | $1,017.65 | | | $7.49 | |
| R2 | | Actual | | 0.98% | | $1,000.00 | | $1,096.38 | | | $5.15 | |
| | Hypothetical (h) | | 0.98% | | $1,000.00 | | $1,020.16 | | | $4.96 | |
| R3 | | Actual | | 0.73% | | $1,000.00 | | $1,097.80 | | | $3.84 | |
| | Hypothetical (h) | | 0.73% | | $1,000.00 | | $1,021.41 | | | $3.70 | |
| R4 | | Actual | | 0.48% | | $1,000.00 | | $1,099.14 | | | $2.53 | |
| | Hypothetical (h) | | 0.48% | | $1,000.00 | | $1,022.66 | | | $2.43 | |
| R6 | | Actual | | 0.39% | | $1,000.00 | | $1,099.74 | | | $2.05 | |
| | Hypothetical (h) | | 0.39% | | $1,000.00 | | $1,023.11 | | | $1.98 | |
| 529A | | Actual | | 0.75% | | $1,000.00 | | $1,097.76 | | | $3.94 | |
| | Hypothetical (h) | | 0.75% | | $1,000.00 | | $1,021.31 | | | $3.80 | |
| 529B | | Actual | | 1.53% | | $1,000.00 | | $1,093.59 | | | $8.03 | |
| | Hypothetical (h) | | 1.53% | | $1,000.00 | | $1,017.40 | | | $7.74 | |
| 529C | | Actual | | 1.53% | | $1,000.00 | | $1,093.89 | | | $8.03 | |
| | Hypothetical (h) | | 1.53% | | $1,000.00 | | $1,017.40 | | | $7.74 | |
| (h) | 5% class return per year before expenses. |
| (p) | “Expenses Paid During Period” are equal to each class’s annualized expense ratio, as shown above, multiplied by the average account value over the period, multiplied by 183/365 (to reflect the one-half year period). Expenses paid do not include any applicable sales charges (loads). If these transaction costs had been included, your costs would have been higher. |
Notes to Expense Table
Each class with a Rule 12b-1 service fee is subject to a rebate of a portion of such fee. Such rebates are included in the expense ratios above. For Class A, Class B, and Class 529A shares, this rebate reduced the expense ratios above by 0.02%, 0.01%, and 0.03%, respectively. See Note 3 in the Notes to Financial Statements for additional information.
10
PORTFOLIO OF INVESTMENTS
11/30/17
The Portfolio of Investments is a complete list of all securities owned by your fund. It is categorized by broad-based asset classes.
| | | | | | | | |
| Common Stocks - 99.2% | |
| Issuer | | Shares/Par | | | Value ($) | |
| Aerospace - 1.2% | | | | | | | | |
| United Technologies Corp. | | | 723,680 | | | $ | 87,890,937 | |
| | |
| Alcoholic Beverages - 1.1% | | | | | | | | |
| Pernod Ricard S.A. (l) | | | 510,937 | | | $ | 79,697,108 | |
| | |
| Apparel Manufacturers - 6.2% | | | | | | | | |
| LVMH Moet Hennessy Louis Vuitton SE (l) | | | 412,297 | | | $ | 119,985,074 | |
| NIKE, Inc., “B” | | | 3,630,059 | | | | 219,328,165 | |
| VF Corp. | | | 1,495,897 | | | | 109,140,645 | |
| | | | | | | | |
| | | | $ | 448,453,884 | |
| Broadcasting - 0.4% | | | | | | | | |
| Walt Disney Co. | | | 285,222 | | | $ | 29,896,970 | |
| | |
| Brokerage & Asset Managers - 3.2% | | | | | | | | |
| Blackstone Group LP | | | 3,884,567 | | | $ | 123,218,465 | |
| Charles Schwab Corp. | | | 1,358,227 | | | | 66,267,895 | |
| CME Group, Inc. | | | 305,404 | | | | 45,670,114 | |
| | | | | | | | |
| | | | $ | 235,156,474 | |
| Business Services - 13.1% | | | | | | | | |
| Accenture PLC, “A” | | | 2,065,009 | | | $ | 305,641,982 | |
| Cognizant Technology Solutions Corp., “A” | | | 1,875,986 | | | | 135,596,268 | |
| Compass Group PLC | | | 2,018,305 | | | | 40,916,039 | |
| Equifax, Inc. | | | 527,869 | | | | 60,240,410 | |
| Fidelity National Information Services, Inc. | | | 1,556,461 | | | | 146,820,966 | |
| Fiserv, Inc. (a) | | | 916,538 | | | | 120,478,920 | |
| Verisk Analytics, Inc., “A” (a) | | | 1,456,163 | | | | 140,403,236 | |
| | | | | | | | |
| | | | $ | 950,097,821 | |
| Cable TV - 1.8% | | | | | | | | |
| Comcast Corp., “A” | | | 3,481,308 | | | $ | 130,688,302 | |
| | |
| Chemicals - 2.9% | | | | | | | | |
| LyondellBasell Industries N.V., “A” | | | 248,683 | | | $ | 26,037,110 | |
| Monsanto Co. | | | 617,728 | | | | 73,101,932 | |
| PPG Industries, Inc. | | | 958,651 | | | | 112,018,369 | |
| | | | | | | | |
| | | | | | | $ | 211,157,411 | |
11
Portfolio of Investments – continued
| | | | | | | | |
| Issuer | | Shares/Par | | | Value ($) | |
| Common Stocks - continued | |
| Computer Software - 3.9% | | | | | | | | |
| Microsoft Corp. | | | 3,324,073 | | | $ | 279,787,224 | |
| | |
| Computer Software - Systems - 2.7% | | | | | | | | |
| Apple, Inc. | | | 1,158,581 | | | $ | 199,102,145 | |
| | |
| Construction - 1.6% | | | | | | | | |
| Sherwin-Williams Co. | | | 297,570 | | | $ | 118,855,409 | |
| | |
| Consumer Products - 9.5% | | | | | | | | |
| Church & Dwight Co., Inc. | | | 966,198 | | | $ | 45,498,264 | |
| Colgate-Palmolive Co. | | | 2,785,144 | | | | 201,783,683 | |
| Coty, Inc., “A” | | | 5,678,525 | | | | 97,840,986 | |
| Estee Lauder Cos., Inc., “A” | | | 1,620,441 | | | | 202,279,650 | |
| L’Oréal S.A. | | | 270,503 | | | | 59,821,318 | |
| Reckitt Benckiser Group PLC | | | 965,042 | | | | 84,650,263 | |
| | | | | | | | |
| | | | $ | 691,874,164 | |
| Electrical Equipment - 3.7% | | | | | | | | |
| Amphenol Corp., “A” | | | 1,361,903 | | | $ | 123,374,793 | |
| Fortive Corp. | | | 737,848 | | | | 55,080,353 | |
| Mettler-Toledo International, Inc. (a) | | | 137,999 | | | | 86,830,351 | |
| | | | | | | | |
| | | | $ | 265,285,497 | |
| Electronics - 3.9% | | | | | | | | |
| Taiwan Semiconductor Manufacturing Co. Ltd., ADR | | | 2,244,012 | | | $ | 88,862,875 | |
| Texas Instruments, Inc. | | | 2,020,402 | | | | 196,564,911 | |
| | | | | | | | |
| | | | $ | 285,427,786 | |
| Entertainment - 1.0% | | | | | | | | |
| Twenty-First Century Fox, Inc. | | | 2,214,380 | | | $ | 70,727,297 | |
| | |
| Food & Beverages - 1.3% | | | | | | | | |
| PepsiCo, Inc. | | | 823,308 | | | $ | 95,931,848 | |
| | |
| Gaming & Lodging - 0.9% | | | | | | | | |
| Paddy Power Betfair PLC | | | 581,862 | | | $ | 65,510,270 | |
| | |
| Insurance - 2.0% | | | | | | | | |
| Aon PLC | | | 1,044,181 | | | $ | 146,415,060 | |
| | |
| Internet - 6.5% | | | | | | | | |
| Alphabet, Inc., “A” (a) | | | 453,364 | | | $ | 469,762,176 | |
12
Portfolio of Investments – continued
| | | | | | | | |
| Issuer | | Shares/Par | | | Value ($) | |
| Common Stocks - continued | |
| Leisure & Toys - 1.5% | | | | | | | | |
| Electronic Arts, Inc. (a) | | | 1,004,565 | | | $ | 106,835,488 | |
| | |
| Machinery & Tools - 0.6% | | | | | | | | |
| Colfax Corp. (a) | | | 1,256,177 | | | $ | 46,805,155 | |
| | |
| Medical & Health Technology & Services - 1.7% | | | | | | | | |
| CVS Health Corp. | | | 1,005,121 | | | $ | 76,992,269 | |
| Express Scripts Holding Co. (a) | | | 684,401 | | | | 44,609,257 | |
| | | | | | | | |
| | | | $ | 121,601,526 | |
| Medical Equipment - 8.8% | | | | | | | | |
| Abbott Laboratories | | | 2,371,765 | | | $ | 133,696,393 | |
| Cooper Cos., Inc. | | | 227,250 | | | | 54,808,155 | |
| Danaher Corp. | | | 1,165,412 | | | | 109,968,276 | |
| Dentsply Sirona, Inc. | | | 360,870 | | | | 24,181,899 | |
| Thermo Fisher Scientific, Inc. | | | 1,088,727 | | | | 209,863,017 | |
| Waters Corp. (a) | | | 414,135 | | | | 81,654,998 | |
| Zimmer Biomet Holdings, Inc. | | | 189,041 | | | | 22,136,701 | |
| | | | | | | | |
| | | | $ | 636,309,439 | |
| Oil Services - 0.7% | | | | | | | | |
| Schlumberger Ltd. | | | 827,349 | | | $ | 51,998,885 | |
| | |
| Other Banks & Diversified Financials - 4.6% | | | | | | | | |
| Mastercard, Inc., “A” | | | 862,302 | | | $ | 129,750,582 | |
| Visa, Inc., “A” | | | 1,793,128 | | | | 201,888,282 | |
| | | | | | | | |
| | | | $ | 331,638,864 | |
| Pharmaceuticals - 3.2% | | | | | | | | |
| Eli Lilly & Co. | | | 431,971 | | | $ | 36,562,025 | |
| Roche Holding AG | | | 353,966 | | | | 89,305,577 | |
| Zoetis, Inc. | | | 1,505,173 | | | | 108,808,956 | |
| | | | | | | | |
| | | | $ | 234,676,558 | |
| Printing & Publishing - 1.9% | | | | | | | | |
| Moody’s Corp. | | | 892,845 | | | $ | 135,551,728 | |
|
| Railroad & Shipping - 1.6% | |
| Union Pacific Corp. | | | 909,862 | | | $ | 115,097,543 | |
|
| Restaurants - 2.8% | |
| Starbucks Corp. | | | 3,470,302 | | | $ | 200,652,862 | |
|
| Specialty Chemicals - 2.3% | |
| Ecolab, Inc. | | | 1,254,026 | | | $ | 170,447,214 | |
13
Portfolio of Investments – continued
| | | | | | | | |
| Issuer | | Shares/Par | | | Value ($) | |
| Common Stocks - continued | |
| Specialty Stores - 2.6% | |
| AutoZone, Inc. (a) | | | 92,739 | | | $ | 63,689,436 | |
| TJX Cos., Inc. | | | 1,684,918 | | | | 127,295,555 | |
| | | | | | | | |
| | | | $ | 190,984,991 | |
| Total Common Stocks (Identified Cost, $4,549,725,469) | | | $ | 7,204,318,036 | |
|
| Investment Companies (h) - 0.7% | |
| Money Market Funds - 0.7% | |
MFS Institutional Money Market Portfolio, 1.19% (v)
(Identified Cost, $50,619,108) | | | 50,624,168 | | | $ | 50,619,105 | |
|
| Collateral for Securities Loaned - 1.9% | |
JPMorgan U.S. Government Money Market Fund, 0.98% (j)
(Identified Cost, $137,261,666) | | | 137,261,666 | | | $ | 137,261,666 | |
| |
| Other Assets, Less Liabilities - (1.8)% | | | | (132,235,375 | ) |
| Net Assets - 100.0% | | | $ | 7,259,963,432 | |
| (a) | Non-income producing security. |
| (h) | An affiliated issuer may be considered one in which the fund owns 5% or more of the outstanding voting securities, or a company which is under common control. At period end, the aggregate values of the fund’s investments in affiliated issuers and in unaffiliated issuers were $50,619,105 and $7,341,579,702, respectively. |
| (j) | The rate quoted is the annualized seven-day yield of the fund at period end. |
| (l) | A portion of this security is on loan. |
| (v) | Affiliated issuer that is available only to investment companies managed by MFS. The rate quoted for the MFS Institutional Money Market Portfolio is the annualized seven-day yield of the fund at period end. |
The following abbreviations are used in this report and are defined:
| ADR | | American Depositary Receipt |
| PLC | | Public Limited Company |
See Notes to Financial Statements
14
Financial Statements
STATEMENT OF ASSETS AND LIABILITIES
At 11/30/17
This statement represents your fund’s balance sheet, which details the assets and liabilities comprising the total value of the fund.
| | | | |
| Assets | | | | |
Investments in unaffiliated issuers, at value, including $131,502,313 of securities on loan (identified cost, $4,686,987,135) | | | $7,341,579,702 | |
Investments in affiliated issuers, at value (identified cost, $50,619,108) | | | 50,619,105 | |
Receivables for | |
Fund shares sold | | | 4,801,784 | |
Interest and dividends | | | 9,309,508 | |
Receivable from distributor | | | 25,211 | |
Other assets | | | 81,855 | |
Total assets | | | $7,406,417,165 | |
| Liabilities | | | | |
Payable to custodian | | | $30 | |
Payable for fund shares reacquired | | | 6,747,738 | |
Collateral for securities loaned, at value | | | 137,261,666 | |
Payable to affiliates | | | | |
Investment adviser | | | 134,037 | |
Shareholder servicing costs | | | 1,933,755 | |
Program manager fees | | | 71 | |
Payable for independent Trustees’ compensation | | | 121,057 | |
Accrued expenses and other liabilities | | | 255,379 | |
Total liabilities | | | $146,453,733 | |
Net assets | | | $7,259,963,432 | |
| Net assets consist of | | | | |
Paid-in capital | | | $4,191,797,806 | |
Unrealized appreciation (depreciation) | | | 2,654,690,544 | |
Accumulated net realized gain (loss) | | | 367,384,801 | |
Undistributed net investment income | | | 46,090,281 | |
Net assets | | | $7,259,963,432 | |
Shares of beneficial interest outstanding | | | 248,358,845 | |
15
Statement of Assets and Liabilities – continued
| | | | | | | | | | | | |
| | | Net assets | | | Shares
outstanding | | | Net asset value
per share (a) | |
Class A | | | $3,672,640,241 | | | | 125,526,064 | | | | $29.26 | |
Class B | | | 58,530,204 | | | | 2,291,497 | | | | 25.54 | |
Class C | | | 223,841,363 | | | | 8,832,627 | | | | 25.34 | |
Class I | | | 306,545,633 | | | | 10,207,514 | | | | 30.03 | |
Class R1 | | | 31,073,792 | | | | 1,237,366 | | | | 25.11 | |
Class R2 | | | 199,580,885 | | | | 7,017,821 | | | | 28.44 | |
Class R3 | | | 493,211,400 | | | | 17,028,354 | | | | 28.96 | |
Class R4 | | | 836,469,787 | | | | 28,366,789 | | | | 29.49 | |
Class R6 | | | 1,411,775,516 | | | | 46,901,288 | | | | 30.10 | |
Class 529A | | | 19,683,629 | | | | 682,017 | | | | 28.86 | |
Class 529B | | | 576,811 | | | | 23,176 | | | | 24.89 | |
Class 529C | | | 6,034,171 | | | | 244,332 | | | | 24.70 | |
| (a) | Maximum offering price per share was equal to the net asset value per share for all share classes, except for Classes A and 529A, for which the maximum offering prices per share were $31.05 [100 / 94.25 x $29.26] and $30.62 [100 / 94.25 x $28.86], respectively. On sales of $50,000 or more, the maximum offering prices of Class A and Class 529A shares are reduced. A contingent deferred sales charge may be imposed on redemptions of Class A, Class B, Class C, Class 529B, and Class 529C shares. Redemption price per share was equal to the net asset value per share for Classes I, R1, R2, R3, R4, R6, and 529A. Net asset value per share is calculated using actual net assets and shares outstanding rather than amounts that have been rounded for presentation purposes. |
See Notes to Financial Statements
16
Financial Statements
STATEMENT OF OPERATIONS
Year ended 11/30/17
This statement describes how much your fund earned in investment income and accrued in expenses. It also describes any gains and/or losses generated by fund operations.
| | | | |
| Net investment income (loss) | |
Income | |
Dividends | | | $104,329,974 | |
Dividends from affiliated issuers | | | 323,464 | |
Income on securities loaned | | | 117,127 | |
Interest | | | 6,846 | |
Foreign taxes withheld | | | (1,501,555 | ) |
Total investment income | | | $103,275,856 | |
Expenses | |
Management fee | | | $22,468,804 | |
Distribution and service fees | | | 14,222,523 | |
Shareholder servicing costs | | | 7,832,615 | |
Program manager fees | | | 23,325 | |
Administrative services fee | | | 643,986 | |
Independent Trustees’ compensation | | | 118,487 | |
Custodian fee | | | 231,160 | |
Shareholder communications | | | 497,582 | |
Audit and tax fees | | | 68,055 | |
Legal fees | | | 79,221 | |
Miscellaneous | | | 329,116 | |
Total expenses | | | $46,514,874 | |
Fees paid indirectly | | | (4,731 | ) |
Reduction of expenses by investment adviser and distributor | | | (605,140 | ) |
Net expenses | | | $45,905,003 | |
Net investment income (loss) | | | $57,370,853 | |
| Realized and unrealized gain (loss) | |
Realized gain (loss) (identified cost basis) | |
Unaffiliated issuers | | | $428,512,501 | |
Affiliated issuers | | | 418 | |
Foreign currency | | | 19,657 | |
Net realized gain (loss) | | | $428,532,576 | |
Change in unrealized appreciation (depreciation) | | | | |
Unaffiliated issuers | | | $1,175,200,202 | |
Affiliated issuers | | | (3 | ) |
Translation of assets and liabilities in foreign currencies | | | 54,630 | |
Net unrealized gain (loss) | | | $1,175,254,829 | |
Net realized and unrealized gain (loss) | | | $1,603,787,405 | |
Change in net assets from operations | | | $1,661,158,258 | |
See Notes to Financial Statements
17
Financial Statements
STATEMENTS OF CHANGES IN NET ASSETS
These statements describe the increases and/or decreases in net assets resulting from operations, any distributions, and any shareholder transactions.
| | | | | | | | |
| | | Year ended | |
| | | 11/30/17 | | | 11/30/16 | |
| Change in net assets | | | | | | |
| From operations | | | | | | | | |
Net investment income (loss) | | | $57,370,853 | | | | $51,379,870 | |
Net realized gain (loss) | | | 428,532,576 | | | | 339,949,343 | |
Net unrealized gain (loss) | | | 1,175,254,829 | | | | (211,909,869 | ) |
Change in net assets from operations | | | $1,661,158,258 | | | | $179,419,344 | |
| Distributions declared to shareholders | | | | | | | | |
From net investment income | | | $(50,001,458 | ) | | | $(60,000,235 | ) |
From net realized gain | | | (304,321,889 | ) | | | (352,952,177 | ) |
Total distributions declared to shareholders | | | $(354,323,347 | ) | | | $(412,952,412 | ) |
Change in net assets from fund share transactions | | | $(296,722,460 | ) | | | $(415,529,900 | ) |
Total change in net assets | | | $1,010,112,451 | | | | $(649,062,968 | ) |
| Net assets | | | | | | | | |
At beginning of period | | | 6,249,850,981 | | | | 6,898,913,949 | |
At end of period (including undistributed net investment income of $46,090,281 and $40,622,785, respectively) | | | $7,259,963,432 | | | | $6,249,850,981 | |
See Notes to Financial Statements
18
Financial Statements
FINANCIAL HIGHLIGHTS
The financial highlights table is intended to help you understand the fund’s financial performance for the past 5 years. Certain information reflects financial results for a single fund share. The total returns in the table represent the rate that an investor would have earned (or lost) on an investment in the fund share class (assuming reinvestment of all distributions) held for the entire period.
| | | | | | | | | | | | | | | | | | | | |
| Class A | | Year ended | |
| | | 11/30/17 | | | 11/30/16 | | | 11/30/15 | | | 11/30/14 | | | 11/30/13 | |
Net asset value, beginning of period | | | $24.25 | | | | $25.16 | | | | $25.38 | | | | $22.46 | | | | $17.74 | |
| Income (loss) from investment operations | | | | | | | | | | | | | | | | | |
Net investment income (loss) (d) | | | $0.21 | | | | $0.18 | (c) | | | $0.20 | | | | $0.14 | | | | $0.14 | |
Net realized and unrealized gain (loss) | | | 6.16 | | | | 0.41 | | | | 0.51 | | | | 3.12 | | | | 4.73 | |
Total from investment operations | | | $6.37 | | | | $0.59 | | | | $0.71 | | | | $3.26 | | | | $4.87 | |
| Less distributions declared to shareholders | | | | | | | | | | | | | | | | | |
From net investment income | | | $(0.18 | ) | | | $(0.21 | ) | | | $(0.15 | ) | | | $(0.11 | ) | | | $(0.15 | ) |
From net realized gain | | | (1.18 | ) | | | (1.29 | ) | | | (0.78 | ) | | | (0.23 | ) | | | — | |
Total distributions declared to shareholders | | | $(1.36 | ) | | | $(1.50 | ) | | | $(0.93 | ) | | | $(0.34 | ) | | | $(0.15 | ) |
Net asset value, end of period (x) | | | $29.26 | | | | $24.25 | | | | $25.16 | | | | $25.38 | | | | $22.46 | |
Total return (%) (r)(s)(t)(x) | | | 27.71 | | | | 2.66 | (c) | | | 2.90 | | | | 14.79 | | | | 27.67 | |
Ratios (%) (to average net assets)
and Supplemental data: | | | | | | | | | | | | | | | | | |
Expenses before expense reductions (f) | | | 0.74 | | | | 0.74 | (c) | | | 0.74 | | | | 0.74 | | | | 0.75 | |
Expenses after expense reductions (f) | | | 0.72 | | | | 0.73 | (c) | | | 0.73 | | | | 0.73 | | | | 0.74 | |
Net investment income (loss) | | | 0.79 | | | | 0.76 | (c) | | | 0.81 | | | | 0.59 | | | | 0.72 | |
Portfolio turnover | | | 24 | | | | 24 | | | | 26 | | | | 26 | | | | 25 | |
Net assets at end of period
(000 omitted) | | | $3,672,640 | | | | $3,276,518 | | | | $3,721,313 | | | | $3,792,267 | | | | $3,186,058 | |
See Notes to Financial Statements
19
Financial Highlights – continued
| | | | | | | | | | | | | | | | | | | | |
| Class B | | Year ended | |
| | | 11/30/17 | | | 11/30/16 | | | 11/30/15 | | | 11/30/14 | | | 11/30/13 | |
Net asset value, beginning of period | | | $21.33 | | | | $22.28 | | | | $22.60 | | | | $20.08 | | | | $15.86 | |
| Income (loss) from investment operations | | | | | | | | | | | | | | | | | |
Net investment income (loss) (d) | | | $0.01 | | | | $(0.00 | )(c)(w) | | | $0.02 | | | | $(0.03 | ) | | | $(0.01 | ) |
Net realized and unrealized gain (loss) | | | 5.39 | | | | 0.38 | | | | 0.44 | | | | 2.78 | | | | 4.25 | |
Total from investment operations | | | $5.40 | | | | $0.38 | | | | $0.46 | | | | $2.75 | | | | $4.24 | |
| Less distributions declared to shareholders | | | | | | | | | | | | | | | | | |
From net investment income | | | $(0.01 | ) | | | $(0.04 | ) | | | $— | | | | $— | | | | $(0.02 | ) |
From net realized gain | | | (1.18 | ) | | | (1.29 | ) | | | (0.78 | ) | | | (0.23 | ) | | | — | |
Total distributions declared to shareholders | | | $(1.19 | ) | | | $(1.33 | ) | | | $(0.78 | ) | | | $(0.23 | ) | | | $(0.02 | ) |
Net asset value, end of period (x) | | | $25.54 | | | | $21.33 | | | | $22.28 | | | | $22.60 | | | | $20.08 | |
Total return (%) (r)(s)(t)(x) | | | 26.67 | | | | 1.96 | (c) | | | 2.09 | | | | 13.90 | | | | 26.77 | |
Ratios (%) (to average net assets)
and Supplemental data: | | | | | | | | | | | | | | | | | |
Expenses before expense reductions (f) | | | 1.49 | | | | 1.49 | (c) | | | 1.49 | | | | 1.49 | | | | 1.50 | |
Expenses after expense reductions (f) | | | 1.48 | | | | 1.49 | (c) | | | 1.49 | | | | 1.49 | | | | 1.50 | |
Net investment income (loss) | | | 0.04 | | | | (0.01 | )(c) | | | 0.08 | | | | (0.16 | ) | | | (0.03 | ) |
Portfolio turnover | | | 24 | | | | 24 | | | | 26 | | | | 26 | | | | 25 | |
Net assets at end of period
(000 omitted) | | | $58,530 | | | | $62,185 | | | | $76,233 | | | | $91,986 | | | | $101,840 | |
| |
| Class C | | Year ended | |
| | | 11/30/17 | | | 11/30/16 | | | 11/30/15 | | | 11/30/14 | | | 11/30/13 | |
Net asset value, beginning of period | | | $21.19 | | | | $22.16 | | | | $22.48 | | | | $19.97 | | | | $15.80 | |
| Income (loss) from investment operations | | | | | | | | | | | | | | | | | |
Net investment income (loss) (d) | | | $0.01 | | | | $(0.00 | )(c)(w) | | | $0.01 | | | | $(0.03 | ) | | | $(0.01 | ) |
Net realized and unrealized gain (loss) | | | 5.35 | | | | 0.37 | | | | 0.45 | | | | 2.77 | | | | 4.22 | |
Total from investment operations | | | $5.36 | | | | $0.37 | | | | $0.46 | | | | $2.74 | | | | $4.21 | |
| Less distributions declared to shareholders | | | | | | | | | | | | | | | | | |
From net investment income | | | $(0.03 | ) | | | $(0.05 | ) | | | $— | | | | $— | | | | $(0.04 | ) |
From net realized gain | | | (1.18 | ) | | | (1.29 | ) | | | (0.78 | ) | | | (0.23 | ) | | | — | |
Total distributions declared to shareholders | | | $(1.21 | ) | | | $(1.34 | ) | | | $(0.78 | ) | | | $(0.23 | ) | | | $(0.04 | ) |
Net asset value, end of period (x) | | | $25.34 | | | | $21.19 | | | | $22.16 | | | | $22.48 | | | | $19.97 | |
Total return (%) (r)(s)(t)(x) | | | 26.66 | | | | 1.94 | (c) | | | 2.10 | | | | 13.93 | | | | 26.67 | |
Ratios (%) (to average net assets)
and Supplemental data: | | | | | | | | | | | | | | | | | |
Expenses before expense reductions (f) | | | 1.49 | | | | 1.49 | (c) | | | 1.49 | | | | 1.49 | | | | 1.50 | |
Expenses after expense reductions (f) | | | 1.49 | | | | 1.49 | (c) | | | 1.49 | | | | 1.49 | | | | 1.50 | |
Net investment income (loss) | | | 0.04 | | | | (0.01 | )(c) | | | 0.06 | | | | (0.16 | ) | | | (0.04 | ) |
Portfolio turnover | | | 24 | | | | 24 | | | | 26 | | | | 26 | | | | 25 | |
Net assets at end of period
(000 omitted) | | | $223,841 | | | | $233,753 | | | | $255,568 | | | | $267,749 | | | | $250,751 | |
See Notes to Financial Statements
20
Financial Highlights – continued
| | | | | | | | | | | | | | | | | | | | |
| Class I | | Year ended | |
| | | 11/30/17 | | | 11/30/16 | | | 11/30/15 | | | 11/30/14 | | | 11/30/13 | |
Net asset value, beginning of period | | | $24.87 | | | | $25.76 | | | | $25.97 | | | | $22.98 | | | | $18.14 | |
| Income (loss) from investment operations | | | | | | | | | | | | | | | | | |
Net investment income (loss) (d) | | | $0.27 | | | | $0.24 | (c) | | | $0.27 | | | | $0.19 | | | | $0.17 | |
Net realized and unrealized gain (loss) | | | 6.32 | | | | 0.43 | | | | 0.52 | | | | 3.19 | | | | 4.86 | |
Total from investment operations | | | $6.59 | | | | $0.67 | | | | $0.79 | | | | $3.38 | | | | $5.03 | |
| Less distributions declared to shareholders | | | | | | | | | | | | | | | | | |
From net investment income | | | $(0.25 | ) | | | $(0.27 | ) | | | $(0.22 | ) | | | $(0.16 | ) | | | $(0.19 | ) |
From net realized gain | | | (1.18 | ) | | | (1.29 | ) | | | (0.78 | ) | | | (0.23 | ) | | | — | |
Total distributions declared to shareholders | | | $(1.43 | ) | | | $(1.56 | ) | | | $(1.00 | ) | | | $(0.39 | ) | | | $(0.19 | ) |
Net asset value, end of period (x) | | | $30.03 | | | | $24.87 | | | | $25.76 | | | | $25.97 | | | | $22.98 | |
Total return (%) (r)(s)(t)(x) | | | 27.95 | | | | 2.94 | (c) | | | 3.13 | | | | 15.04 | | | | 28.02 | |
Ratios (%) (to average net assets)
and Supplemental data: | | | | | | | | | | | | | | | | | |
Expenses before expense reductions (f) | | | 0.49 | | | | 0.49 | (c) | | | 0.49 | | | | 0.50 | | | | 0.50 | |
Expenses after expense reductions (f) | | | 0.49 | | | | 0.49 | (c) | | | 0.49 | | | | 0.50 | | | | 0.50 | |
Net investment income (loss) | | | 1.03 | | | | 0.99 | (c) | | | 1.06 | | | | 0.81 | | | | 0.82 | |
Portfolio turnover | | | 24 | | | | 24 | | | | 26 | | | | 26 | | | | 25 | |
Net assets at end of period
(000 omitted) | | | $306,546 | | | | $693,673 | | | | $719,973 | | | | $766,377 | | | | $397,294 | |
| |
| Class R1 | | Year ended | |
| | | 11/30/17 | | | 11/30/16 | | | 11/30/15 | | | 11/30/14 | | | 11/30/13 | |
Net asset value, beginning of period | | | $21.01 | | | | $21.98 | | | | $22.30 | | | | $19.91 | | | | $15.75 | |
| Income (loss) from investment operations | | | | | | | | | | | | | | | | | |
Net investment income (loss) (d) | | | $0.01 | | | | $(0.00 | )(c)(w) | | | $0.01 | | | | $(0.03 | ) | | | $(0.01 | ) |
Net realized and unrealized gain (loss) | | | 5.30 | | | | 0.36 | | | | 0.45 | | | | 2.74 | | | | 4.21 | |
Total from investment operations | | | $5.31 | | | | $0.36 | | | | $0.46 | | | | $2.71 | | | | $4.20 | |
| Less distributions declared to shareholders | | | | | | | | | | | | | | | | | |
From net investment income | | | $(0.03 | ) | | | $(0.04 | ) | | | $— | | | | $(0.09 | ) | | | $(0.04 | ) |
From net realized gain | | | (1.18 | ) | | | (1.29 | ) | | | (0.78 | ) | | | (0.23 | ) | | | — | |
Total distributions declared to shareholders | | | $(1.21 | ) | | | $(1.33 | ) | | | $(0.78 | ) | | | $(0.32 | ) | | | $(0.04 | ) |
Net asset value, end of period (x) | | | $25.11 | | | | $21.01 | | | | $21.98 | | | | $22.30 | | | | $19.91 | |
Total return (%) (r)(s)(t)(x) | | | 26.67 | | | | 1.92 | (c) | | | 2.12 | | | | 13.91 | | | | 26.71 | |
Ratios (%) (to average net assets)
and Supplemental data: | | | | | | | | | | | | | | | | | |
Expenses before expense reductions (f) | | | 1.49 | | | | 1.49 | (c) | | | 1.49 | | | | 1.49 | | | | 1.51 | |
Expenses after expense reductions (f) | | | 1.49 | | | | 1.49 | (c) | | | 1.49 | | | | 1.49 | | | | 1.51 | |
Net investment income (loss) | | | 0.03 | | | | (0.01 | )(c) | | | 0.06 | | | | (0.16 | ) | | | (0.07 | ) |
Portfolio turnover | | | 24 | | | | 24 | | | | 26 | | | | 26 | | | | 25 | |
Net assets at end of period
(000 omitted) | | | $31,074 | | | | $30,462 | | | | $32,009 | | | | $34,440 | | | | $35,206 | |
See Notes to Financial Statements
21
Financial Highlights – continued
| | | | | | | | | | | | | | | | | | | | |
| Class R2 | | Year ended | |
| | | 11/30/17 | | | 11/30/16 | | | 11/30/15 | | | 11/30/14 | | | 11/30/13 | |
Net asset value, beginning of period | | | $23.61 | | | | $24.52 | | | | $24.77 | | | | $21.95 | | | | $17.36 | |
| Income (loss) from investment operations | | | | | | | | | | | | | | | | | |
Net investment income (loss) (d) | | | $0.13 | | | | $0.11 | (c) | | | $0.14 | | | | $0.08 | | | | $0.09 | |
Net realized and unrealized gain (loss) | | | 6.00 | | | | 0.42 | | | | 0.49 | | | | 3.04 | | | | 4.62 | |
Total from investment operations | | | $6.13 | | | | $0.53 | | | | $0.63 | | | | $3.12 | | | | $4.71 | |
| Less distributions declared to shareholders | | | | | | | | | | | | | | | | | |
From net investment income | | | $(0.12 | ) | | | $(0.15 | ) | | | $(0.10 | ) | | | $(0.07 | ) | | | $(0.12 | ) |
From net realized gain | | | (1.18 | ) | | | (1.29 | ) | | | (0.78 | ) | | | (0.23 | ) | | | — | |
Total distributions declared to shareholders | | | $(1.30 | ) | | | $(1.44 | ) | | | $(0.88 | ) | | | $(0.30 | ) | | | $(0.12 | ) |
Net asset value, end of period (x) | | | $28.44 | | | | $23.61 | | | | $24.52 | | | | $24.77 | | | | $21.95 | |
Total return (%) (r)(s)(t)(x) | | | 27.35 | | | | 2.43 | (c) | | | 2.61 | | | | 14.46 | | | | 27.33 | |
Ratios (%) (to average net assets)
and Supplemental data: | | | | | | | | | | | | | | | | | |
Expenses before expense reductions (f) | | | 0.99 | | | | 0.99 | (c) | | | 0.99 | | | | 0.99 | | | | 1.00 | |
Expenses after expense reductions (f) | | | 0.99 | | | | 0.99 | (c) | | | 0.99 | | | | 0.99 | | | | 1.00 | |
Net investment income (loss) | | | 0.53 | | | | 0.49 | (c) | | | 0.56 | | | | 0.33 | | | | 0.44 | |
Portfolio turnover | | | 24 | | | | 24 | | | | 26 | | | | 26 | | | | 25 | |
Net assets at end of period
(000 omitted) | | | $199,581 | | | | $185,959 | | | | $209,709 | | | | $228,141 | | | | $192,103 | |
| |
| Class R3 | | Year ended | |
| | | 11/30/17 | | | 11/30/16 | | | 11/30/15 | | | 11/30/14 | | | 11/30/13 | |
Net asset value, beginning of period | | | $24.03 | | | | $24.93 | | | | $25.16 | | | | $22.29 | | | | $17.61 | |
| Income (loss) from investment operations | | | | | | | | | | | | | | | | | |
Net investment income (loss) (d) | | | $0.20 | | | | $0.17 | (c) | | | $0.20 | | | | $0.14 | | | | $0.14 | |
Net realized and unrealized gain (loss) | | | 6.09 | | | | 0.43 | | | | 0.50 | | | | 3.08 | | | | 4.70 | |
Total from investment operations | | | $6.29 | | | | $0.60 | | | | $0.70 | | | | $3.22 | | | | $4.84 | |
| Less distributions declared to shareholders | | | | | | | | | | | | | | | | | |
From net investment income | | | $(0.18 | ) | | | $(0.21 | ) | | | $(0.15 | ) | | | $(0.12 | ) | | | $(0.16 | ) |
From net realized gain | | | (1.18 | ) | | | (1.29 | ) | | | (0.78 | ) | | | (0.23 | ) | | | — | |
Total distributions declared to shareholders | | | $(1.36 | ) | | | $(1.50 | ) | | | $(0.93 | ) | | | $(0.35 | ) | | | $(0.16 | ) |
Net asset value, end of period (x) | | | $28.96 | | | | $24.03 | | | | $24.93 | | | | $25.16 | | | | $22.29 | |
Total return (%) (r)(s)(t)(x) | | | 27.61 | | | | 2.71 | (c) | | | 2.89 | | | | 14.73 | | | | 27.71 | |
Ratios (%) (to average net assets)
and Supplemental data: | | | | | | | | | | | | | | | | | |
Expenses before expense reductions (f) | | | 0.74 | | | | 0.74 | (c) | | | 0.74 | | | | 0.74 | | | | 0.75 | |
Expenses after expense reductions (f) | | | 0.74 | | | | 0.74 | (c) | | | 0.74 | | | | 0.74 | | | | 0.74 | |
Net investment income (loss) | | | 0.78 | | | | 0.74 | (c) | | | 0.81 | | | | 0.59 | | | | 0.69 | |
Portfolio turnover | | | 24 | | | | 24 | | | | 26 | | | | 26 | | | | 25 | |
Net assets at end of period
(000 omitted) | | | $493,211 | | | | $405,222 | | | | $482,657 | | | | $531,858 | | | | $412,052 | |
See Notes to Financial Statements
22
Financial Highlights – continued
| | | | | | | | | | | | | | | | | | | | |
| Class R4 | | Year ended | |
| | | 11/30/17 | | | 11/30/16 | | | 11/30/15 | | | 11/30/14 | | | 11/30/13 | |
Net asset value, beginning of period | | | $24.44 | | | | $25.34 | | | | $25.55 | | | | $22.62 | | | | $17.86 | |
| Income (loss) from investment operations | | | | | | | | | | | | | | | | | |
Net investment income (loss) (d) | | | $0.27 | | | | $0.23 | (c) | | | $0.26 | | | | $0.20 | | | | $0.19 | |
Net realized and unrealized gain (loss) | | | 6.20 | | | | 0.43 | | | | 0.52 | | | | 3.12 | | | | 4.77 | |
Total from investment operations | | | $6.47 | | | | $0.66 | | | | $0.78 | | | | $3.32 | | | | $4.96 | |
| Less distributions declared to shareholders | | | | | | | | | | | | | | | | | |
From net investment income | | | $(0.24 | ) | | | $(0.27 | ) | | | $(0.21 | ) | | | $(0.16 | ) | | | $(0.20 | ) |
From net realized gain | | | (1.18 | ) | | | (1.29 | ) | | | (0.78 | ) | | | (0.23 | ) | | | — | |
Total distributions declared to shareholders | | | $(1.42 | ) | | | $(1.56 | ) | | | $(0.99 | ) | | | $(0.39 | ) | | | $(0.20 | ) |
Net asset value, end of period (x) | | | $29.49 | | | | $24.44 | | | | $25.34 | | | | $25.55 | | | | $22.62 | |
Total return (%) (r)(s)(t)(x) | | | 27.96 | | | | 2.95 | (c) | | | 3.16 | | | | 14.99 | | | | 28.03 | |
Ratios (%) (to average net assets)
and Supplemental data: | | | | | | | | | | | | | | | | | |
Expenses before expense reductions (f) | | | 0.49 | | | | 0.49 | (c) | | | 0.49 | | | | 0.49 | | | | 0.50 | |
Expenses after expense reductions (f) | | | 0.49 | | | | 0.49 | (c) | | | 0.49 | | | | 0.49 | | | | 0.50 | |
Net investment income (loss) | | | 1.03 | | | | 0.98 | (c) | | | 1.06 | | | | 0.83 | | | | 0.92 | |
Portfolio turnover | | | 24 | | | | 24 | | | | 26 | | | | 26 | | | | 25 | |
Net assets at end of period
(000 omitted) | | | $836,470 | | | | $727,479 | | | | $933,126 | | | | $1,002,443 | | | | $814,203 | |
| |
| Class R6 | | Year ended | |
| | | 11/30/17 | | | 11/30/16 | | | 11/30/15 | | | 11/30/14 | | | 11/30/13 | |
Net asset value, beginning of period | | | $24.92 | | | | $25.82 | | | | $26.02 | | | | $23.01 | | | | $18.15 | |
| Income (loss) from investment operations | | | | | | | | | | | | | | | | | |
Net investment income (loss) (d) | | | $0.31 | | | | $0.27 | (c) | | | $0.29 | | | | $0.22 | | | | $0.21 | |
Net realized and unrealized gain (loss) | | | 6.32 | | | | 0.42 | | | | 0.53 | | | | 3.20 | | | | 4.85 | |
Total from investment operations | | | $6.63 | | | | $0.69 | | | | $0.82 | | | | $3.42 | | | | $5.06 | |
| Less distributions declared to shareholders | | | | | | | | | | | | | | | | | |
From net investment income | | | $(0.27 | ) | | | $(0.30 | ) | | | $(0.24 | ) | | | $(0.18 | ) | | | $(0.20 | ) |
From net realized gain | | | (1.18 | ) | | | (1.29 | ) | | | (0.78 | ) | | | (0.23 | ) | | | — | |
Total distributions declared to shareholders | | | $(1.45 | ) | | | $(1.59 | ) | | | $(1.02 | ) | | | $(0.41 | ) | | | $(0.20 | ) |
Net asset value, end of period (x) | | | $30.10 | | | | $24.92 | | | | $25.82 | | | | $26.02 | | | | $23.01 | |
Total return (%) (r)(s)(t)(x) | | | 28.11 | | | | 3.02 | (c) | | | 3.24 | | | | 15.17 | | | | 28.16 | |
Ratios (%) (to average net assets)
and Supplemental data: | | | | | | | | | | | | | | | | | |
Expenses before expense reductions (f) | | | 0.39 | | | | 0.38 | (c) | | | 0.38 | | | | 0.39 | | | | 0.41 | |
Expenses after expense reductions (f) | | | 0.39 | | | | 0.38 | (c) | | | 0.38 | | | | 0.39 | | | | 0.41 | |
Net investment income (loss) | | | 1.13 | | | | 1.10 | (c) | | | 1.14 | | | | 0.93 | | | | 0.99 | |
Portfolio turnover | | | 24 | | | | 24 | | | | 26 | | | | 26 | | | | 25 | |
Net assets at end of period
(000 omitted) | | | $1,411,776 | | | | $614,343 | | | | $450,440 | | | | $360,116 | | | | $293,107 | |
See Notes to Financial Statements
23
Financial Highlights – continued
| | | | | | | | | | | | | | | | | | | | |
| Class 529A | | Year ended | |
| | | 11/30/17 | | | 11/30/16 | | | 11/30/15 | | | 11/30/14 | | | 11/30/13 | |
Net asset value, beginning of period | | | $23.96 | | | | $24.88 | | | | $25.12 | | | | $22.24 | | | | $17.56 | |
| Income (loss) from investment operations | | | | | | | | | | | | | | | | | |
Net investment income (loss) (d) | | | $0.20 | | | | $0.17 | (c) | | | $0.19 | | | | $0.13 | | | | $0.14 | |
Net realized and unrealized gain (loss) | | | 6.07 | | | | 0.41 | | | | 0.50 | | | | 3.09 | | | | 4.69 | |
Total from investment operations | | | $6.27 | | | | $0.58 | | | | $0.69 | | | | $3.22 | | | | $4.83 | |
| Less distributions declared to shareholders | | | | | | | | | | | | | | | | | |
From net investment income | | | $(0.19 | ) | | | $(0.21 | ) | | | $(0.15 | ) | | | $(0.11 | ) | | | $(0.15 | ) |
From net realized gain | | | (1.18 | ) | | | (1.29 | ) | | | (0.78 | ) | | | (0.23 | ) | | | — | |
Total distributions declared to shareholders | | | $(1.37 | ) | | | $(1.50 | ) | | | $(0.93 | ) | | | $(0.34 | ) | | | $(0.15 | ) |
Net asset value, end of period (x) | | | $28.86 | | | | $23.96 | | | | $24.88 | | | | $25.12 | | | | $22.24 | |
Total return (%) (r)(s)(t)(x) | | | 27.60 | | | | 2.65 | (c) | | | 2.85 | | | | 14.75 | | | | 27.68 | |
Ratios (%) (to average net assets)
and Supplemental data: | | | | | | | | | | | | | | | | | |
Expenses before expense reductions (f) | | | 0.84 | | | | 0.84 | (c) | | | 0.84 | | | | 0.84 | | | | 0.85 | |
Expenses after expense reductions (f) | | | 0.76 | | | | 0.75 | (c) | | | 0.76 | | | | 0.75 | | | | 0.76 | |
Net investment income (loss) | | | 0.76 | | | | 0.72 | (c) | | | 0.77 | | | | 0.57 | | | | 0.69 | |
Portfolio turnover | | | 24 | | | | 24 | | | | 26 | | | | 26 | | | | 25 | |
Net assets at end of period
(000 omitted) | | | $19,684 | | | | $14,831 | | | | $13,116 | | | | $10,975 | | | | $8,692 | |
| |
| Class 529B | | Year ended | |
| | | 11/30/17 | | | 11/30/16 | | | 11/30/15 | | | 11/30/14 | | | 11/30/13 | |
Net asset value, beginning of period | | | $20.83 | | | | $21.83 | | | | $22.17 | | | | $19.71 | | | | $15.59 | |
| Income (loss) from investment operations | | | | | | | | | | | | | | | | | |
Net investment income (loss) (d) | | | $(0.00 | )(w) | | | $(0.01 | )(c) | | | $(0.00 | )(w) | | | $(0.04 | ) | | | $(0.01 | ) |
Net realized and unrealized gain (loss) | | | 5.27 | | | | 0.36 | | | | 0.44 | | | | 2.73 | | | | 4.16 | |
Total from investment operations | | | $5.27 | | | | $0.35 | | | | $0.44 | | | | $2.69 | | | | $4.15 | |
| Less distributions declared to shareholders | | | | | | | | | | | | | | | | | |
From net investment income | | | $(0.03 | ) | | | $(0.06 | ) | | | $— | | | | $— | | | | $(0.03 | ) |
From net realized gain | | | (1.18 | ) | | | (1.29 | ) | | | (0.78 | ) | | | (0.23 | ) | | | — | |
Total distributions declared to shareholders | | | $(1.21 | ) | | | $(1.35 | ) | | | $(0.78 | ) | | | $(0.23 | ) | | | $(0.03 | ) |
Net asset value, end of period (x) | | | $24.89 | | | | $20.83 | | | | $21.83 | | | | $22.17 | | | | $19.71 | |
Total return (%) (r)(s)(t)(x) | | | 26.69 | | | | 1.87 | (c) | | | 2.04 | | | | 13.86 | | | | 26.66 | |
Ratios (%) (to average net assets)
and Supplemental data: | | | | | | | | | | | | | | | | | |
Expenses before expense reductions (f) | | | 1.59 | | | | 1.59 | (c) | | | 1.59 | | | | 1.59 | | | | 1.60 | |
Expenses after expense reductions (f) | | | 1.54 | | | | 1.54 | (c) | | | 1.54 | | | | 1.54 | | | | 1.55 | |
Net investment income (loss) | | | (0.02 | ) | | | (0.06 | )(c) | | | (0.01 | ) | | | (0.21 | ) | | | (0.08 | ) |
Portfolio turnover | | | 24 | | | | 24 | | | | 26 | | | | 26 | | | | 25 | |
Net assets at end of period
(000 omitted) | | | $577 | | | | $567 | | | | $576 | | | | $543 | | | | $519 | |
See Notes to Financial Statements
24
Financial Highlights – continued
| | | | | | | | | | | | | | | | | | | | |
| Class 529C | | Year ended | |
| | | 11/30/17 | | | 11/30/16 | | | 11/30/15 | | | 11/30/14 | | | 11/30/13 | |
Net asset value, beginning of period | | | $20.70 | | | | $21.71 | | | | $22.06 | | | | $19.61 | | | | $15.53 | |
| Income (loss) from investment operations | | | | | | | | | | | | | | | | | |
Net investment income (loss) (d) | | | $(0.00 | )(w) | | | $(0.01 | )(c) | | | $(0.00 | )(w) | | | $(0.04 | ) | | | $(0.02 | ) |
Net realized and unrealized gain (loss) | | | 5.22 | | | | 0.35 | | | | 0.44 | | | | 2.72 | | | | 4.14 | |
Total from investment operations | | | $5.22 | | | | $0.34 | | | | $0.44 | | | | $2.68 | | | | $4.12 | |
| Less distributions declared to shareholders | | | | | | | | | | | | | | | | | |
From net investment income | | | $(0.04 | ) | | | $(0.06 | ) | | | $(0.01 | ) | | | $— | | | | $(0.04 | ) |
From net realized gain | | | (1.18 | ) | | | (1.29 | ) | | | (0.78 | ) | | | (0.23 | ) | | | — | |
Total distributions declared to shareholders | | | $(1.22 | ) | | | $(1.35 | ) | | | $(0.79 | ) | | | $(0.23 | ) | | | $(0.04 | ) |
Net asset value, end of period (x) | | | $24.70 | | | | $20.70 | | | | $21.71 | | | | $22.06 | | | | $19.61 | |
Total return (%) (r)(s)(t)(x) | | | 26.68 | | | | 1.85 | (c) | | | 2.04 | | | | 13.88 | | | | 26.61 | |
Ratios (%) (to average net assets)
and Supplemental data: | | | | | | | | | | | | | | | | | |
Expenses before expense reductions (f) | | | 1.59 | | | | 1.59 | (c) | | | 1.59 | | | | 1.59 | | | | 1.60 | |
Expenses after expense reductions (f) | | | 1.53 | | | | 1.53 | (c) | | | 1.54 | | | | 1.54 | | | | 1.55 | |
Net investment income (loss) | | | (0.02 | ) | | | (0.06 | )(c) | | | (0.01 | ) | | | (0.22 | ) | | | (0.10 | ) |
Portfolio turnover | | | 24 | | | | 24 | | | | 26 | | | | 26 | | | | 25 | |
Net assets at end of period
(000 omitted) | | | $6,034 | | | | $4,860 | | | | $4,193 | | | | $3,246 | | | | $2,709 | |
| (c) | Amount reflects a one-time reimbursement of expenses by the custodian (or former custodian) without which net investment income and performance would be lower and expenses would be higher. |
| (d) | Per share data is based on average shares outstanding. |
| (f) | Ratios do not reflect reductions from fees paid indirectly, if applicable. |
| (r) | Certain expenses have been reduced without which performance would have been lower. |
| (s) | From time to time the fund may receive proceeds from litigation settlements, without which performance would be lower. |
| (t) | Total returns do not include any applicable sales charges. |
| (w) | Per share amount was less than $0.01. |
| (x) | The net asset values and total returns have been calculated on net assets which include adjustments made in accordance with U.S. generally accepted accounting principles required at period end for financial reporting purposes. |
See Notes to Financial Statements
25
NOTES TO FINANCIAL STATEMENTS
(1) Business and Organization
Massachusetts Investors Growth Stock Fund (the fund) is organized as a Massachusetts business trust and is registered under the Investment Company Act of 1940, as amended, as a diversified open-end management investment company.
The fund is an investment company and accordingly follows the investment company accounting and reporting guidance of the Financial Accounting Standards Board (FASB) Accounting Standards Codification Topic 946 Financial Services – Investment Companies.
(2) Significant Accounting Policies
General – The preparation of financial statements in conformity with U.S. generally accepted accounting principles requires management to make estimates and assumptions that affect the reported amounts of assets and liabilities, and disclosure of contingent assets and liabilities at the date of the financial statements and the reported amounts of increases and decreases in net assets from operations during the reporting period. Actual results could differ from those estimates. In the preparation of these financial statements, management has evaluated subsequent events occurring after the date of the fund���s Statement of Assets and Liabilities through the date that the financial statements were issued.
In October 2016, the Securities and Exchange Commission (SEC) released its Final Rule on Investment Company Reporting Modernization (the “Rule”). The Rule, which introduced two new regulatory reporting forms for investment companies – Form N-PORT and Form N-CEN – also contained amendments to Regulation S-X which impact financial statement presentation, particularly the presentation of derivative investments, for all reporting periods ending after August 1, 2017. The fund has adopted the Rule’s Regulation S-X amendments and believes that the fund’s financial statements are in compliance with those amendments.
Balance Sheet Offsetting – The fund’s accounting policy with respect to balance sheet offsetting is that, absent an event of default by the counterparty or a termination of the agreement, the International Swaps and Derivatives Association (ISDA) Master Agreement, or similar agreement, does not result in an offset of reported amounts of financial assets and financial liabilities in the Statement of Assets and Liabilities across transactions between the fund and the applicable counterparty. The fund’s right to setoff may be restricted or prohibited by the bankruptcy or insolvency laws of the particular jurisdiction to which a specific master netting agreement counterparty is subject. Balance sheet offsetting disclosures, to the extent applicable to the fund, have been included in the fund’s Significant Accounting Policies note under the captions for each of the fund’s in-scope financial instruments and transactions.
Investment Valuations – Equity securities, including restricted equity securities, are generally valued at the last sale or official closing price on their primary market or exchange as provided by a third-party pricing service. Equity securities, for which there were no sales reported that day, are generally valued at the last quoted daily bid quotation on their primary market or exchange as provided by a third-party pricing service. Short-term instruments with a maturity at issuance of 60 days or less may be
26
Notes to Financial Statements – continued
valued at amortized cost, which approximates market value. Open-end investment companies are generally valued at net asset value per share. Securities and other assets generally valued on the basis of information from a third-party pricing service may also be valued at a broker/dealer bid quotation. Values obtained from third-party pricing services can utilize both transaction data and market information such as yield, quality, coupon rate, maturity, type of issue, trading characteristics, and other market data. The values of foreign securities and other assets and liabilities expressed in foreign currencies are converted to U.S. dollars using the mean of bid and asked prices for rates provided by a third-party pricing service.
The Board of Trustees has delegated primary responsibility for determining or causing to be determined the value of the fund’s investments (including any fair valuation) to the adviser pursuant to valuation policies and procedures approved by the Board. If the adviser determines that reliable market quotations are not readily available, investments are valued at fair value as determined in good faith by the adviser in accordance with such procedures under the oversight of the Board of Trustees. Under the fund’s valuation policies and procedures, market quotations are not considered to be readily available for most types of debt instruments and floating rate loans and many types of derivatives. These investments are generally valued at fair value based on information from third-party pricing services. In addition, investments may be valued at fair value if the adviser determines that an investment’s value has been materially affected by events occurring after the close of the exchange or market on which the investment is principally traded (such as foreign exchange or market) and prior to the determination of the fund’s net asset value, or after the halting of trading of a specific security where trading does not resume prior to the close of the exchange or market on which the security is principally traded. Events that occur on a frequent basis after foreign markets close (such as developments in foreign markets and significant movements in the U.S. markets) and prior to the determination of the fund’s net asset value may be deemed to have a material effect on the value of securities traded in foreign markets. Accordingly, the fund’s foreign equity securities may often be valued at fair value. The adviser generally relies on third-party pricing services or other information (such as the correlation with price movements of similar securities in the same or other markets; the type, cost and investment characteristics of the security; the business and financial condition of the issuer; and trading and other market data) to assist in determining whether to fair value and at what value to fair value an investment. The value of an investment for purposes of calculating the fund’s net asset value can differ depending on the source and method used to determine value. When fair valuation is used, the value of an investment used to determine the fund’s net asset value may differ from quoted or published prices for the same investment. There can be no assurance that the fund could obtain the fair value assigned to an investment if it were to sell the investment at the same time at which the fund determines its net asset value per share.
Various inputs are used in determining the value of the fund’s assets or liabilities. These inputs are categorized into three broad levels. In certain cases, the inputs used to measure fair value may fall into different levels of the fair value hierarchy. In such cases, an investment’s level within the fair value hierarchy is based on the lowest level of input that is significant to the fair value measurement. The fund’s assessment of the significance of a particular input to the fair value measurement in its entirety requires
27
Notes to Financial Statements – continued
judgment, and considers factors specific to the investment. Level 1 includes unadjusted quoted prices in active markets for identical assets or liabilities. Level 2 includes other significant observable market-based inputs (including quoted prices for similar securities, interest rates, prepayment speed, and credit risk). Level 3 includes unobservable inputs, which may include the adviser’s own assumptions in determining the fair value of investments. The following is a summary of the levels used as of November 30, 2017 in valuing the fund’s assets or liabilities:
| | | | | | | | | | | | | | | | |
| Financial Instruments | | Level 1 | | | Level 2 | | | Level 3 | | | Total | |
| Equity Securities | | | $7,204,318,036 | | | | $— | | | | $— | | | | $7,204,318,036 | |
| Mutual Funds | | | 187,880,771 | | | | — | | | | — | | | | 187,880,771 | |
| Total | | | $7,392,198,807 | | | | $— | | | | $— | | | | $7,392,198,807 | |
For further information regarding security characteristics, see the Portfolio of Investments.
Foreign Currency Translation – Purchases and sales of foreign investments, income, and expenses are converted into U.S. dollars based upon currency exchange rates prevailing on the respective dates of such transactions or on the reporting date for foreign denominated receivables and payables. Gains and losses attributable to foreign currency exchange rates on sales of securities are recorded for financial statement purposes as net realized gains and losses on investments. Gains and losses attributable to foreign exchange rate movements on receivables, payables, income and expenses are recorded for financial statement purposes as foreign currency transaction gains and losses. That portion of both realized and unrealized gains and losses on investments that results from fluctuations in foreign currency exchange rates is not separately disclosed.
Security Loans – Under its Securities Lending Agency Agreement with the fund, JPMorgan Chase and Co. (“Chase”), as lending agent, loans the securities of the fund to certain qualified institutions (the “Borrowers”) approved by the fund. Security loans can be terminated at the discretion of either the lending agent or the fund and the related securities must be returned within the earlier of the standard trade settlement period for such securities or within three business days. The loans are collateralized by cash and/or U.S. Treasury and federal agency obligations in an amount typically at least equal to the market value of the securities loaned. On loans collateralized by cash, the cash collateral is invested in a money market fund. The market value of the loaned securities is determined at the close of business of the fund and any additional required collateral is delivered to the fund on the next business day. Chase provides the fund with indemnification against Borrower default. In the event of Borrower default, Chase will, for the benefit of the fund, either purchase securities identical to those loaned or, when such purchase is commercially impracticable, pay the fund the market value of the loaned securities. In return, Chase assumes the fund’s rights to the related collateral. If the collateral value is less than the cost to purchase identical securities, Chase is responsible for the shortfall, but only to the extent that such shortfall is not due to a decline in collateral value resulting from collateral reinvestment for which the fund bears the risk of loss. At period end, the fund had investment securities on loan, all of which were classified as equity securities in the fund’s Portfolio of Investments, with a fair value of $131,502,313. The fair value of the fund’s investment securities on
28
Notes to Financial Statements – continued
loan and a related liability of $137,261,666 for cash collateral received on securities loaned are both presented gross in the Statement of Assets and Liabilities. The collateral on securities loaned exceeded the value of securities on loan at period end. The liability for cash collateral for securities loaned is carried at fair value, which is categorized as level 2 within the fair value hierarchy. A portion of the income generated upon investment of the collateral is remitted to the Borrowers, and the remainder is allocated between the fund and the lending agent. On loans collateralized by U.S. Treasury and/or federal agency obligations, a fee is received from the Borrower, and is allocated between the fund and the lending agent. Income from securities lending is separately reported in the Statement of Operations. The dividend and interest income earned on the securities loaned is accounted for in the same manner as other dividend and interest income.
Indemnifications – Under the fund’s organizational documents, its officers and Trustees may be indemnified against certain liabilities and expenses arising out of the performance of their duties to the fund. Additionally, in the normal course of business, the fund enters into agreements with service providers that may contain indemnification clauses. The fund’s maximum exposure under these agreements is unknown as this would involve future claims that may be made against the fund that have not yet occurred.
Investment Transactions and Income – Investment transactions are recorded on the trade date. Interest income is recorded on the accrual basis. Dividends received in cash are recorded on the ex-dividend date. Certain dividends from foreign securities will be recorded when the fund is informed of the dividend if such information is obtained subsequent to the ex-dividend date. Dividend and interest payments received in additional securities are recorded on the ex-dividend or ex-interest date in an amount equal to the value of the security on such date.
The fund may receive proceeds from litigation settlements. Any proceeds received from litigation involving portfolio holdings are reflected in the Statement of Operations in realized gain/loss if the security has been disposed of by the fund or in unrealized gain/loss if the security is still held by the fund. Any other proceeds from litigation not related to portfolio holdings are reflected as other income in the Statement of Operations.
Fees Paid Indirectly – The fund’s custody fee may be reduced by a credit earned under an arrangement that measures the value of U.S. dollars deposited with the custodian by the fund. The amount of the credit, for the year ended November 30, 2017, is shown as a reduction of total expenses in the Statement of Operations.
Tax Matters and Distributions – The fund intends to qualify as a regulated investment company, as defined under Subchapter M of the Internal Revenue Code, and to distribute all of its taxable income, including realized capital gains. As a result, no provision for federal income tax is required. The fund’s federal tax returns, when filed, will remain subject to examination by the Internal Revenue Service for a three year period. Management has analyzed the fund’s tax positions taken on federal and state tax returns for all open tax years and does not believe that there are any uncertain tax positions that require recognition of a tax liability. Foreign taxes, if any, have been
29
Notes to Financial Statements – continued
accrued by the fund in the accompanying financial statements in accordance with the applicable foreign tax law. Foreign income taxes may be withheld by certain countries in which the fund invests. Additionally, capital gains realized by the fund on securities issued in or by certain foreign countries may be subject to capital gains tax imposed by those countries.
Distributions to shareholders are recorded on the ex-dividend date. Income and capital gain distributions are determined in accordance with income tax regulations, which may differ from U.S. generally accepted accounting principles. Certain capital accounts in the financial statements are periodically adjusted for permanent differences in order to reflect their tax character. These adjustments have no impact on net assets or net asset value per share. Temporary differences which arise from recognizing certain items of income, expense, gain or loss in different periods for financial statement and tax purposes will reverse at some time in the future. Distributions in excess of net investment income or net realized gains are temporary overdistributions for financial statement purposes resulting from differences in the recognition or classification of income or distributions for financial statement and tax purposes.
Book/tax differences primarily relate to wash sale loss deferrals and treating a portion of the proceeds from redemptions as a distribution for tax purposes.
The tax character of distributions declared to shareholders for the last two fiscal years is as follows:
| | | | | | | | |
| | | Year ended
11/30/17 | | | Year ended
11/30/16 | |
Ordinary income (including any
short-term capital gains) | | | $53,321,511 | | | | $60,000,235 | |
| Long-term capital gains | | | 301,001,836 | | | | 352,952,177 | |
| Total distributions | | | $354,323,347 | | | | $412,952,412 | |
The federal tax cost and the tax basis components of distributable earnings were as follows:
| | | | |
| As of 11/30/17 | | | |
| Cost of investments | | | $4,748,446,799 | |
| Gross appreciation | | | 2,696,817,570 | |
| Gross depreciation | | | (53,065,562 | ) |
| Net unrealized appreciation (depreciation) | | | $2,643,752,008 | |
| Undistributed ordinary income | | | 71,112,654 | |
| Undistributed long-term capital gain | | | 353,301,572 | |
| Other temporary differences | | | (608 | ) |
Multiple Classes of Shares of Beneficial Interest – The fund offers multiple classes of shares, which differ in their respective distribution, service, and program manager fees. The fund’s income, realized and unrealized gain (loss), and common expenses are allocated to shareholders based on the daily net assets of each class. Dividends are declared separately for each class. Differences in per share dividend rates are generally due to differences in separate class expenses. Class B and Class 529B shares will convert to Class A and Class 529A shares, respectively, approximately eight years after
30
Notes to Financial Statements – continued
purchase. Effective April 23, 2018, Class C and Class 529C shares will convert to Class A and Class 529A shares, respectively, approximately ten years after purchase. Any shares with an original purchase date of April 30, 2008 or earlier will automatically convert to Class A and Class 529A shares on April 23, 2018. The fund’s distributions declared to shareholders as reported in the Statements of Changes in Net Assets are presented by class as follows:
| | | | | | | | | | | | | | | | |
| | | From net investment
income | | | From net realized gain on
investments | |
| | | Year
ended
11/30/17 | | | Year
ended
11/30/16 | | | Year
ended
11/30/17 | | | Year
ended
11/30/16 | |
| Class A | | | $24,734,452 | | | | $31,162,410 | | | | $158,887,892 | | | | $189,697,630 | |
| Class B | | | 23,519 | | | | 123,273 | | | | 3,351,972 | | | | 4,410,635 | |
| Class C | | | 281,314 | | | | 561,238 | | | | 12,902,863 | | | | 14,785,141 | |
| Class I | | | 6,935,491 | | | | 7,558,761 | | | | 33,193,266 | | | | 35,861,677 | |
| Class R1 | | | 40,275 | | | | 61,467 | | | | 1,655,156 | | | | 1,863,468 | |
| Class R2 | | | 957,601 | | | | 1,238,740 | | | | 9,221,821 | | | | 10,976,589 | |
| Class R3 | | | 3,064,716 | | | | 4,010,827 | | | | 19,967,041 | | | | 24,956,233 | |
| Class R4 | | | 7,075,676 | | | | 9,918,932 | | | | 34,742,354 | | | | 47,015,899 | |
| Class R6 | | | 6,760,850 | | | | 5,239,980 | | | | 29,358,227 | | | | 22,427,451 | |
| Class 529A | | | 116,380 | | | | 110,745 | | | | 732,463 | | | | 672,651 | |
| Class 529B | | | 712 | | | | 1,552 | | | | 31,922 | | | | 34,283 | |
| Class 529C | | | 10,472 | | | | 12,310 | | | | 276,912 | | | | 250,520 | |
| Total | | | $50,001,458 | | | | $60,000,235 | | | | $304,321,889 | | | | $352,952,177 | |
(3) Transactions with Affiliates
Investment Adviser – The fund has an investment advisory agreement with MFS to provide overall investment management and related administrative services and facilities to the fund. The management fee is computed daily and paid monthly at an annual rate of 0.33% of the fund’s average daily net assets.
Distributor – MFS Fund Distributors, Inc. (MFD), a wholly-owned subsidiary of MFS, as distributor, received $452,665 and $14,899 for the year ended November 30, 2017, as its portion of the initial sales charge on sales of Class A and Class 529A shares of the fund, respectively.
The Board of Trustees has adopted a distribution plan for certain share classes pursuant to Rule 12b-1 of the Investment Company Act of 1940.
The fund’s distribution plan provides that the fund will pay MFD for services provided by MFD and financial intermediaries in connection with the distribution and servicing of certain share classes. One component of the plan is a distribution fee paid to MFD and
31
Notes to Financial Statements – continued
another component of the plan is a service fee paid to MFD. MFD may subsequently pay all, or a portion, of the distribution and/or service fees to financial intermediaries.
Distribution Plan Fee Table:
| | | | | | | | | | | | | | | | | | | | |
| | | Distribution
Fee Rate (d) | | | Service
Fee Rate (d) | | | Total
Distribution
Plan (d) | | | Annual
Effective
Rate (e) | | | Distribution
and Service
Fee | |
| Class A | | | — | | | | 0.25% | | | | 0.25% | | | | 0.23% | | | | $8,769,355 | |
| Class B | | | 0.75% | | | | 0.25% | | | | 1.00% | | | | 0.99% | | | | 603,188 | |
| Class C | | | 0.75% | | | | 0.25% | | | | 1.00% | | | | 1.00% | | | | 2,291,041 | |
| Class R1 | | | 0.75% | | | | 0.25% | | | | 1.00% | | | | 1.00% | | | | 308,337 | |
| Class R2 | | | 0.25% | | | | 0.25% | | | | 0.50% | | | | 0.50% | | | | 993,412 | |
| Class R3 | | | — | | | | 0.25% | | | | 0.25% | | | | 0.25% | | | | 1,153,984 | |
| Class 529A | | | — | | | | 0.25% | | | | 0.25% | | | | 0.22% | | | | 43,348 | |
| Class 529B | | | 0.75% | | | | 0.25% | | | | 1.00% | | | | 1.00% | | | | 5,661 | |
| Class 529C | | | 0.75% | | | | 0.25% | | | | 1.00% | | | | 1.00% | | | | 54,197 | |
| Total Distribution and Service Fees | | | | $14,222,523 | |
| (d) | In accordance with the distribution plan for certain classes, the fund pays distribution and/or service fees equal to these annual percentage rates of each class’s average daily net assets. The distribution and service fee rates disclosed by class represent the current rates in effect at the end of the reporting period. Any rate changes, if applicable, are detailed below. |
| (e) | The annual effective rates represent actual fees incurred under the distribution plan for the year ended November 30, 2017 based on each class’s average daily net assets. MFD has voluntarily agreed to rebate a portion of each class’s 0.25% service fee attributable to accounts for which MFD retains the 0.25% service fee except for accounts attributable to MFS or its affiliates’ seed money. For the year ended November 30, 2017, this rebate amounted to $580,740, $3,688, $3,743, $18, $18, $5,095, $1, and $174 for Class A, Class B, Class C, Class R1, Class R2, Class 529A, Class 529B, and Class 529C, respectively, and is included in the reduction of total expenses in the Statement of Operations. |
Certain Class A shares are subject to a contingent deferred sales charge (CDSC) in the event of a shareholder redemption within 18 months of purchase. Class C and Class 529C shares are subject to a CDSC in the event of a shareholder redemption within 12 months of purchase. Class B and Class 529B shares are subject to a CDSC in the event of a shareholder redemption within six years of purchase. All contingent deferred sales charges are paid to MFD and during the year ended November 30, 2017, were as follows:
| | | | |
| | | Amount | |
| Class A | | | $18,211 | |
| Class B | | | 71,431 | |
| Class C | | | 10,559 | |
| Class 529B | | | — | |
| Class 529C | | | 28 | |
The fund has entered into and may from time to time enter into contracts with program managers and other parties which administer the tuition programs through which an investment in the fund’s 529 share classes is made. The fund has entered into an agreement with MFD pursuant to which MFD receives an annual fee of up to 0.10% of the average daily net assets attributable to each 529 share class. MFD has agreed to waive a portion of this fee in an amount equal to 0.05% of the average daily
32
Notes to Financial Statements – continued
net assets for each 529 share class. Effective December 10, 2017, this waiver agreement will be terminated. For the year ended November 30, 2017, this waiver amounted to $11,663 and is included in the reduction of total expenses in the Statement of Operations. The program manager fee incurred for the year ended November 30, 2017 was equivalent to an annual effective rate of 0.05% of the average daily net assets attributable to each 529 share class. Effective December 11, 2017, the fund will enter into an agreement with MFD pursuant to which MFD receives an annual fee of up to 0.05% of average daily net assets attributable to each 529 share class. The services provided by MFD, or a third party with which MFD contracts, include recordkeeping and tax reporting and account services, as well as services designed to maintain the program’s compliance with the Internal Revenue Code and other regulatory requirements. Program manager fees and waivers for the year ended November 30, 2017, were as follows:
| | | | | | | | |
| | | Fee | | | Waiver | |
| Class 529A | | | $17,339 | | | | $8,670 | |
| Class 529B | | | 566 | | | | 283 | |
| Class 529C | | | 5,420 | | | | 2,710 | |
| Total Program Manager Fees and Waivers | | | $23,325 | | | | $11,663 | |
Shareholder Servicing Agent – MFS Service Center, Inc. (MFSC), a wholly-owned subsidiary of MFS, receives a fee from the fund for its services as shareholder servicing agent calculated as a percentage of the average daily net assets of the fund as determined periodically under the supervision of the fund’s Board of Trustees. For the year ended November 30, 2017, the fee was $1,131,808, which equated to 0.0166% annually of the fund’s average daily net assets. MFSC also receives payment from the fund for out-of-pocket expenses, sub-accounting and other shareholder servicing costs which may be paid to affiliated and unaffiliated service providers. Class R6 shares do not incur sub-accounting fees. For the year ended November 30, 2017, these out-of-pocket expenses, sub-accounting and other shareholder servicing costs amounted to $6,700,807.
Administrator – MFS provides certain financial, legal, shareholder communications, compliance, and other administrative services to the fund. Under an administrative services agreement, the fund reimburses MFS the costs incurred to provide these services. The fund is charged an annual fixed amount of $17,500 plus a fee based on average daily net assets. The administrative services fee incurred for the year ended November 30, 2017 was equivalent to an annual effective rate of 0.0095% of the fund’s average daily net assets.
Trustees’ and Officers’ Compensation – The fund pays compensation to independent Trustees in the form of a retainer, attendance fees, and additional compensation to Board and Committee chairpersons. The fund does not pay compensation directly to Trustees or officers of the fund who are also officers of the investment adviser, all of whom receive remuneration for their services to the fund from MFS. Certain officers and Trustees of the fund are officers or directors of MFS, MFD, and MFSC.
Prior to December 31, 2001, the fund had an unfunded defined benefit plan (“DB plan”) for independent Trustees. As of December 31, 2001, the Board took action
33
Notes to Financial Statements – continued
to terminate the DB plan with respect to then-current and any future independent Trustees, such that the DB plan covers only certain of those former independent Trustees who retired on or before December 31, 2001. Effective January 1, 2002, accrued benefits under the DB plan for then-current independent Trustees who continued were credited to an unfunded retirement deferral plan (the “Retirement Deferral plan”), which was established for and exists solely with respect to these credited amounts, and is not available for other deferrals by these or other independent Trustees. Although the Retirement Deferral plan is unfunded, amounts deferred under the plan are periodically adjusted for investment experience as if they had been invested in shares of the fund. The DB plan resulted in a pension expense of $10,357 and the Retirement Deferral plan resulted in an expense of $15,608. Both amounts are included in “Independent Trustees’ compensation” in the Statement of Operations for the year ended November 30, 2017. The liability for deferred retirement benefits payable to certain independent Trustees under both plans amounted to $96,294 at November 30, 2017, and is included in “Payable for independent Trustees’ compensation” in the Statement of Assets and Liabilities.
Deferred Trustee Compensation – Under a Deferred Compensation Plan (the “Plan”), independent Trustees previously were allowed to elect to defer receipt of all or a portion of their annual compensation. Effective January 1, 2005, the Board elected to no longer allow Trustees to defer receipt of future compensation under the Plan. Amounts deferred under the Plan are invested in shares of certain MFS Funds selected by the independent Trustees as notional investments. Deferred amounts represent an unsecured obligation of the fund until distributed in accordance with the Plan. Included in “Other assets” and “Payable for independent Trustees’ compensation” in the Statement of Assets and Liabilities is $24,750 of deferred Trustees’ compensation. There is no current year expense associated with the Plan.
Other – This fund and certain other funds managed by MFS (the funds) have entered into a service agreement (the ISO Agreement) which provides for payment of fees solely by the funds to Tarantino LLC in return for the provision of services of an Independent Senior Officer (ISO) for the funds. Frank L. Tarantino serves as the ISO and is an officer of the funds and the sole member of Tarantino LLC. The funds can terminate the ISO Agreement with Tarantino LLC at any time under the terms of the ISO Agreement. For the year ended November 30, 2017, the fee paid by the fund under this agreement was $12,108 and is included in “Miscellaneous” expense in the Statement of Operations. MFS has agreed to bear all expenses associated with office space, other administrative support, and supplies provided to the ISO.
The fund invests in the MFS Institutional Money Market Portfolio which is managed by MFS and seeks current income consistent with preservation of capital and liquidity. This money market fund does not pay a management fee to MFS.
On March 16, 2016, MFS redeemed 44,713 shares of Class I for an aggregate amount of $1,064,627.
The fund is permitted to engage in purchase and sale transactions with funds and accounts for which MFS serves as investment adviser or sub-adviser (“cross-trades”) pursuant to a policy adopted by the Board of Trustees. This policy has been designed to ensure that cross-trades conducted by the fund comply with Rule 17a-7 under the
34
Notes to Financial Statements – continued
Investment Company Act of 1940. Under this policy, cross-trades are effected at current market prices with no remuneration paid in connection with the transaction. During the year ended November 30, 2017, the fund engaged in purchase and sale transactions pursuant to this policy, which amounted to $12,662,407 and $15,680,123, respectively. The sales transactions resulted in net realized gains (losses) of $284,301.
(4) Portfolio Securities
For the year ended November 30, 2017, purchases and sales of investments, other than short-term obligations, aggregated $1,604,104,246 and $2,228,123,736, respectively.
(5) Shares of Beneficial Interest
The fund’s Declaration of Trust permits the Trustees to issue an unlimited number of full and fractional shares of beneficial interest. Transactions in fund shares were as follows:
| | | | | | | | | | | | | | | | |
| | | Year ended
11/30/17 | | | Year ended
11/30/16 | |
| | | Shares | | | Amount | | | Shares | | | Amount | |
| Shares sold | | | | | | | | | | | | | | | | |
Class A | | | 14,224,480 | | | | $364,964,347 | | | | 14,680,653 | | | | $347,530,585 | |
Class B | | | 175,668 | | | | 3,962,035 | | | | 282,036 | | | | 5,901,980 | |
Class C | | | 546,565 | | | | 12,108,654 | | | | 759,405 | | | | 15,671,784 | |
Class I | | | 9,706,422 | | | | 252,041,593 | | | | 10,791,579 | | | | 266,423,589 | |
Class R1 | | | 222,829 | | | | 4,977,076 | | | | 331,549 | | | | 6,841,379 | |
Class R2 | | | 2,007,764 | | | | 49,941,478 | | | | 1,817,615 | | | | 42,058,183 | |
Class R3 | | | 5,402,494 | | | | 136,208,122 | | | | 3,974,806 | | | | 93,954,886 | |
Class R4 | | | 4,211,916 | | | | 108,306,667 | | | | 6,821,422 | | | | 163,292,210 | |
Class R6 | | | 28,446,295 | | | | 781,042,567 | | | | 20,427,871 | | | | 504,099,279 | |
Class 529A | | | 120,275 | | | | 3,044,350 | | | | 129,655 | | | | 3,048,366 | |
Class 529B | | | 2,023 | | | | 48,559 | | | | 5,303 | | | | 103,713 | |
Class 529C | | | 40,551 | | | | 889,488 | | | | 73,062 | | | | 1,463,606 | |
| | | 65,107,282 | | | | $1,717,534,936 | | | | 60,094,956 | | | | $1,450,389,560 | |
| | | | |
| Shares issued to shareholders in reinvestment of distributions | | | | | | | | | | | | | | | | |
Class A | | | 6,504,724 | | | | $152,080,605 | | | | 8,070,127 | | | | $185,532,227 | |
Class B | | | 158,968 | | | | 3,268,547 | | | | 214,693 | | | | 4,371,147 | |
Class C | | | 520,474 | | | | 10,617,674 | | | | 599,217 | | | | 12,122,164 | |
Class I | | | 1,583,272 | | | | 37,919,362 | | | | 1,739,006 | | | | 40,901,412 | |
Class R1 | | | 83,849 | | | | 1,695,431 | | | | 95,959 | | | | 1,924,935 | |
Class R2 | | | 403,125 | | | | 9,187,227 | | | | 498,798 | | | | 11,193,028 | |
Class R3 | | | 994,892 | | | | 23,031,757 | | | | 1,271,486 | | | | 28,964,452 | |
Class R4 | | | 1,355,095 | | | | 31,871,829 | | | | 1,999,385 | | | | 46,205,797 | |
Class R6 | | | 1,353,255 | | | | 32,451,058 | | | | 1,028,662 | | | | 24,225,000 | |
Class 529A | | | 36,792 | | | | 848,843 | | | | 34,467 | | | | 783,093 | |
Class 529B | | | 1,629 | | | | 32,634 | | | | 1,801 | | | | 35,835 | |
Class 529C | | | 14,449 | | | | 287,384 | | | | 13,288 | | | | 262,830 | |
| | | 13,010,524 | | | | $303,292,351 | | | | 15,566,889 | | | | $356,521,920 | |
35
Notes to Financial Statements – continued
| | | | | | | | | | | | | | | | |
| | | Year ended
11/30/17 | | | Year ended
11/30/16 | |
| | | Shares | | | Amount | | | Shares | | | Amount | |
| Shares reacquired | | | | | | | | | | | | | | | | |
Class A | | | (30,289,722 | ) | | | $(790,881,329 | ) | | | (35,589,435 | ) | | | $(849,537,313 | ) |
Class B | | | (959,156 | ) | | | (21,863,455 | ) | | | (1,001,917 | ) | | | (20,955,263 | ) |
Class C | | | (3,267,905 | ) | | | (74,329,226 | ) | | | (1,858,356 | ) | | | (38,919,203 | ) |
Class I | | | (28,976,504 | ) | | | (787,767,329 | ) | | | (12,588,000 | ) | | | (307,032,719 | ) |
Class R1 | | | (519,386 | ) | | | (11,660,926 | ) | | | (433,825 | ) | | | (8,961,551 | ) |
Class R2 | | | (3,268,477 | ) | | | (83,355,179 | ) | | | (2,992,184 | ) | | | (69,041,962 | ) |
Class R3 | | | (6,234,961 | ) | | | (160,650,720 | ) | | | (7,738,682 | ) | | | (182,656,257 | ) |
Class R4 | | | (6,971,141 | ) | | | (182,198,075 | ) | | | (15,876,211 | ) | | | (386,194,939 | ) |
Class R6 | | | (7,548,649 | ) | | | (201,299,080 | ) | | | (14,253,024 | ) | | | (356,387,749 | ) |
Class 529A | | | (94,060 | ) | | | (2,397,301 | ) | | | (72,255 | ) | | | (1,720,968 | ) |
Class 529B | | | (7,678 | ) | | | (169,156 | ) | | | (6,301 | ) | | | (129,122 | ) |
Class 529C | | | (45,394 | ) | | | (977,971 | ) | | | (44,751 | ) | | | (904,334 | ) |
| | | (88,183,033 | ) | | | $(2,317,549,747 | ) | | | (92,454,941 | ) | | | $(2,222,441,380 | ) |
| | | | |
| Net change | | | | | | | | | | | | | | | | |
Class A | | | (9,560,518 | ) | | | $(273,836,377 | ) | | | (12,838,655 | ) | | | $(316,474,501 | ) |
Class B | | | (624,520 | ) | | | (14,632,873 | ) | | | (505,188 | ) | | | (10,682,136 | ) |
Class C | | | (2,200,866 | ) | | | (51,602,898 | ) | | | (499,734 | ) | | | (11,125,255 | ) |
Class I | | | (17,686,810 | ) | | | (497,806,374 | ) | | | (57,415 | ) | | | 292,282 | |
Class R1 | | | (212,708 | ) | | | (4,988,419 | ) | | | (6,317 | ) | | | (195,237 | ) |
Class R2 | | | (857,588 | ) | | | (24,226,474 | ) | | | (675,771 | ) | | | (15,790,751 | ) |
Class R3 | | | 162,425 | | | | (1,410,841 | ) | | | (2,492,390 | ) | | | (59,736,919 | ) |
Class R4 | | | (1,404,130 | ) | | | (42,019,579 | ) | | | (7,055,404 | ) | | | (176,696,932 | ) |
Class R6 | | | 22,250,901 | | | | 612,194,545 | | | | 7,203,509 | | | | 171,936,530 | |
Class 529A | | | 63,007 | | | | 1,495,892 | | | | 91,867 | | | | 2,110,491 | |
Class 529B | | | (4,026 | ) | | | (87,963 | ) | | | 803 | | | | 10,426 | |
Class 529C | | | 9,606 | | | | 198,901 | | | | 41,599 | | | | 822,102 | |
| | | (10,065,227 | ) | | | $(296,722,460 | ) | | | (16,793,096 | ) | | | $(415,529,900 | ) |
(6) Line of Credit
The fund and certain other funds managed by MFS participate in a $1.25 billion unsecured committed line of credit, subject to a $1 billion sublimit, provided by a syndication of banks under a credit agreement. Borrowings may be made for temporary financing needs. Interest is charged to each fund, based on its borrowings, generally at a rate equal to the higher of the Overnight Federal Reserve funds rate or daily one month LIBOR plus an agreed upon spread. A commitment fee, based on the average daily, unused portion of the committed line of credit, is allocated among the participating funds at the end of each calendar quarter. In addition, the fund and other funds managed by MFS have established unsecured uncommitted borrowing arrangements with certain banks for temporary financing needs. Interest is charged to each fund, based on its borrowings, at a rate equal to the Overnight Federal Reserve funds rate plus an agreed upon spread. For the year ended November 30, 2017, the fund’s commitment fee and interest expense were $45,079 and $0, respectively, and are included in “Miscellaneous” expense in the Statement of Operations.
36
Notes to Financial Statements – continued
(7) Investments in Affiliated Issuers
An affiliated issuer may be considered one in which the fund owns 5% or more of the outstanding voting securities, or a company which is under common control. For the purposes of this report, the fund assumes the following to be affiliated issuers:
| | | | | | | | | | | | | | | | | | | | |
| Affiliated Issuers | | | | | Beginning
Shares/Par
Amount | | | Acquisitions
Shares/Par
Amount | | | Dispositions
Shares/Par
Amount | | | Ending
Shares/Par
Amount | |
| MFS Institutional Money Market Portfolio | | | | | | | 47,471,088 | | | | 1,008,666,163 | | | | (1,005,513,083 | ) | | | 50,624,168 | |
| | | | | |
| Affiliated Issuers | | Realized
Gain (Loss) | | | Change in
Unrealized
Appreciation
(Depreciation) | | | Capital Gain
Distributions | | | Dividend
Income | | | Ending
Value | |
| MFS Institutional Money Market Portfolio | | | $418 | | | | $(3 | ) | | | $— | | | | $323,464 | | | | $50,619,105 | |
37
REPORT OF INDEPENDENT REGISTERED PUBLIC ACCOUNTING FIRM
To the Board of Trustees and Shareholders of
Massachusetts Investors Growth Stock Fund:
We have audited the accompanying statement of assets and liabilities, including the portfolio of investments, of Massachusetts Investors Growth Stock Fund (the Fund) as of November 30, 2017, and the related statement of operations for the year then ended, the statements of changes in net assets for each of the two years in the period then ended and the financial highlights for each of the five years in the period then ended. These financial statements and financial highlights are the responsibility of the Fund’s management. Our responsibility is to express an opinion on these financial statements and financial highlights based on our audits.
We conducted our audits in accordance with the standards of the Public Company Accounting Oversight Board (United States). Those standards require that we plan and perform the audit to obtain reasonable assurance about whether the financial statements and financial highlights are free of material misstatement. We were not engaged to perform an audit of the Fund’s internal control over financial reporting. Our audits included consideration of internal control over financial reporting as a basis for designing audit procedures that are appropriate in the circumstances, but not for the purpose of expressing an opinion on the effectiveness of the Fund’s internal control over financial reporting. Accordingly, we express no such opinion. An audit also includes examining, on a test basis, evidence supporting the amounts and disclosures in the financial statements and financial highlights, assessing the accounting principles used and significant estimates made by management, and evaluating the overall financial statement presentation. Our procedures included confirmation of securities owned as of November 30, 2017, by correspondence with the custodian and others. We believe that our audits provide a reasonable basis for our opinion.
In our opinion, the financial statements and financial highlights referred to above present fairly, in all material respects, the financial position of Massachusetts Investors Growth Stock Fund at November 30, 2017, the results of its operations for the year then ended, the changes in its net assets for each of the two years in the period then ended and the financial highlights for each of the five years in the period then ended, in conformity with U.S. generally accepted accounting principles.

Boston, Massachusetts
January 16, 2018
38
TRUSTEES AND OFFICERS — IDENTIFICATION AND BACKGROUND
The Trustees and Officers of the Trust, as of January 1, 2018, are listed below, together with their principal occupations during the past five years. (Their titles may have varied during that period.) The address of each Trustee and Officer is 111 Huntington Avenue, Boston, Massachusetts 02199-7618.
| | | | | | | | | | |
Name, Age | | Position(s)
Held with Fund | | Trustee/Officer Since (h) | | Number of
MFS Funds
overseen
by the
Trustee | | Principal
Occupations During the Past Five Years | | Other Directorships
During the Past
Five Years (j) |
| INTERESTED TRUSTEES |
Robert J. Manning (k)
(age 54) | | Trustee | | February 2004 | | 137 | | Massachusetts Financial Services Company, Executive Chairman (since January 2017); Director; Chairman of the Board; Chief Executive Officer (until 2015); Co-Chief Executive Officer (2015-2016) | | N/A |
Robin A. Stelmach (k) (age 56) | | Trustee | | January 2014 | | 137 | | Massachusetts Financial Services Company, Vice Chair (since January 2017); Chief Operating Officer and Executive Vice President (until January 2017) | | N/A |
| INDEPENDENT TRUSTEES | | | | |
John P. Kavanaugh
(age 63) | | Trustee and Chair of Trustees | | January 2009 | | 137 | | Private investor | | N/A |
39
Trustees and Officers – continued
| | | | | | | | | | |
Name, Age | | Position(s)
Held with Fund | | Trustee/Officer Since (h) | | Number of
MFS Funds
overseen
by the
Trustee | | Principal
Occupations During the Past Five Years | | Other Directorships
During the Past
Five Years (j) |
Steven E. Buller (age 66) | | Trustee | | February 2014 | | 137 | | Financial Accounting Standards Advisory Council, Chairman (2014-2015); Public Company Accounting Oversight Board, Standing Advisory Group, Member (until 2014); BlackRock, Inc. (investment management), Managing Director (until 2014), BlackRock Finco UK (investment management), Director (until 2014) | | N/A |
John A. Caroselli (age 63) | | Trustee | | March 2017 | | 137 | | JC Global Advisors, LLC (management consulting), President (since 2015); First Capital Corporation (commercial finance), Executive Vice President (until 2015) | | N/A |
Maureen R. Goldfarb (age 62) | | Trustee | | January 2009 | | 137 | | Private investor | | N/A |
Michael Hegarty
(age 73) | | Trustee | | December 2004 | | 137 | | Private investor | | Rouse Properties Inc., Director (until 2016); Capmark Financial Group Inc., Director (until 2015) |
Clarence Otis, Jr. (age 61) | | Trustee | | March 2017 | | 137 | | Darden Restaurants, Inc., Chief Executive Officer (until 2014) | | VF Corporation, Director; Verizon Communications, Inc., Director; The Travelers Companies, Director; Federal Reserve Bank of Atlanta, Director (until 2015) |
40
Trustees and Officers – continued
| | | | | | | | | | |
Name, Age | | Position(s)
Held with Fund | | Trustee/Officer Since (h) | | Number of
MFS Funds
overseen
by the
Trustee | | Principal
Occupations During the Past Five Years | | Other Directorships
During the Past
Five Years (j) |
Maryanne L. Roepke (age 61) | | Trustee | | May 2014 | | 137 | | American Century Investments (investment management), Senior Vice President and Chief Compliance Officer (until 2014) | | N/A |
Laurie J. Thomsen
(age 60) | | Trustee | | March 2005 | | 137 | | Private investor | | The Travelers Companies, Director; Dycom Industries, Inc., Director (since 2015) |
| | | | | | | | |
Name, Age | | Position(s) Held with Fund | | Trustee/Officer
Since (h) | | Number of
MFS Funds
for which
the Person
is an Officer | | Principal
Occupations During the Past Five Years |
| OFFICERS |
Christopher R. Bohane (k)
(age 43) | | Assistant Secretary and Assistant Clerk | | July 2005 | | 137 | | Massachusetts Financial Services Company, Vice President and Assistant General Counsel |
Kino Clark (k) (age 49) | | Assistant Treasurer | | January 2012 | | 137 | | Massachusetts Financial Services Company, Vice President |
John W. Clark, Jr. (k) (age 50) | | Assistant Treasurer | | April 2017 | | 137 | | Massachusetts Financial Services Company, Vice President (since March 2017); Deutsche Bank (financial services), Department Head – Treasurer’s Office (until February 2017) |
Thomas H. Connors (k) (age 58) | | Assistant Secretary and Assistant Clerk | | September 2012 | | 137 | | Massachusetts Financial Services Company, Vice President and Senior Counsel |
Ethan D. Corey (k)
(age 54) | | Assistant Secretary and Assistant Clerk | | July 2005 | | 137 | | Massachusetts Financial Services Company, Senior Vice President and Associate General Counsel |
David L. DiLorenzo (k)
(age 49) | | President | | July 2005 | | 137 | | Massachusetts Financial Services Company, Senior Vice President |
41
Trustees and Officers – continued
| | | | | | | | |
Name, Age | | Position(s) Held with Fund | | Trustee/Officer
Since (h) | | Number of
MFS Funds
for which
the Person
is an Officer | | Principal
Occupations During the Past Five Years |
Heidi W. Hardin (k)
(age 50) | | Secretary and Clerk | | April 2017 | | 137 | | Massachusetts Financial Services Company, Executive Vice President and General Counsel (since March 2017); Harris Associates (investment management), General Counsel (from September 2015 to January 2017); Janus Capital Management LLC (investment management), Senior Vice President and General Counsel (until September 2015) |
Brian E. Langenfeld (k)
(age 44) | | Assistant Secretary and Assistant Clerk | | June 2006 | | 137 | | Massachusetts Financial Services Company, Vice President and Senior Counsel |
Susan A. Pereira (k)
(age 47) | | Assistant Secretary and Assistant Clerk | | July 2005 | | 137 | | Massachusetts Financial Services Company, Vice President and Senior Counsel |
Kasey L. Phillips (k)
(age 47) | | Assistant Treasurer | | September 2012 | | 137 | | Massachusetts Financial Services Company, Vice President |
Matthew A. Stowe (k) (age 43) | | Assistant Secretary and Assistant Clerk | | October 2014 | | 137 | | Massachusetts Financial Services Company, Vice President and Assistant General Counsel |
Frank L. Tarantino
(age 73) | | Independent Senior Officer | | June 2004 | | 137 | | Tarantino LLC (provider of compliance services), Principal |
Richard S. Weitzel (k)
(age 47) | | Assistant Secretary and Assistant Clerk | | October 2007 | | 137 | | Massachusetts Financial Services Company, Senior Vice President and Associate General Counsel |
Martin J. Wolin (k) (age 50) | | Chief Compliance Officer | | July 2015 | | 137 | | Massachusetts Financial Services Company, Senior Vice President and Chief Compliance Officer (since July 2015); Mercer (financial service provider), Chief Risk and Compliance Officer, North America and Latin America (until June 2015) |
42
Trustees and Officers – continued
| | | | | | | | |
Name, Age | | Position(s) Held with Fund | | Trustee/Officer
Since (h) | | Number of
MFS Funds
for which
the Person
is an Officer | | Principal
Occupations During the Past Five Years |
James O. Yost (k)
(age 57) | | Treasurer | | September 1990 | | 137 | | Massachusetts Financial Services Company, Senior Vice President |
| (h) | Date first appointed to serve as Trustee/officer of an MFS Fund. Each Trustee has served continuously since appointment unless indicated otherwise. For the period from December 15, 2004 until February 22, 2005, Mr. Manning served as Advisory Trustee. Prior to January 2012, Messrs. DiLorenzo and Yost served as Assistant Treasurers of the Funds. From January 2012 through December 2016, Messrs. DiLorenzo and Yost served as Treasurer and Deputy Treasurer of the Funds, respectively. |
| (j) | Directorships or trusteeships of companies required to report to the Securities and Exchange Commission (i.e., “public companies”). |
| (k) | “Interested person” of the Trust within the meaning of the Investment Company Act of 1940 (referred to as the 1940 Act), which is the principal federal law governing investment companies like the fund, as a result of a position with MFS. The address of MFS is 111 Huntington Avenue, Boston, Massachusetts 02199-7618. |
Each Trustee has been elected by shareholders and each Trustee and officer holds office until his or her successor is chosen and qualified or until his or her earlier death, resignation, retirement or removal. The Trust does not hold annual meetings for the purpose of electing Trustees, and Trustees are not elected for fixed terms. Under the terms of the Board’s retirement policy, an Independent Trustee shall retire at the end of the calendar year in which he or she reaches the earlier of 75 years of age or 15 years of service on the Board (or, in the case of any Independent Trustee who joined the Board prior to 2015, 20 years of service on the Board).
Messrs. Buller and Otis and Ms. Roepke are members of the Trust’s Audit Committee.
Each of the Interested Trustees and certain Officers hold comparable officer positions with certain affiliates of MFS.
The Statement of Additional Information for a Fund includes further information about the Trustees and is available without charge upon request by calling 1-800-225-2606.
| | |
| Investment Adviser | | Custodian |
Massachusetts Financial Services Company
111 Huntington Avenue
Boston, MA 02199-7618 | | JPMorgan Chase Bank, NA 4 Metrotech Center New York, NY 11245 |
| Distributor | | Independent Registered Public Accounting Firm |
MFS Fund Distributors, Inc.
111 Huntington Avenue
Boston, MA 02199-7618 | | Ernst & Young LLP 200 Clarendon Street Boston, MA 02116 |
| Portfolio Manager(s) | | |
| Jeffrey Constantino | | |
43
BOARD REVIEW OF INVESTMENT ADVISORY AGREEMENT
The Investment Company Act of 1940 requires that both the full Board of Trustees and a majority of the non-interested (“independent”) Trustees, voting separately, annually approve the continuation of the Fund’s investment advisory agreement with MFS. The Trustees consider matters bearing on the Fund and its advisory arrangements at their meetings throughout the year, including a review of performance data at each regular meeting. In addition, the independent Trustees met several times over the course of three months beginning in May and ending in July, 2017 (“contract review meetings”) for the specific purpose of considering whether to approve the continuation of the investment advisory agreement for the Fund and the other investment companies that the Board oversees (the “MFS Funds”). The independent Trustees were assisted in their evaluation of the Fund’s investment advisory agreement by independent legal counsel, from whom they received separate legal advice and with whom they met separately from MFS during various contract review meetings. The independent Trustees were also assisted in this process by the MFS Funds’ Independent Senior Officer, a senior officer appointed by and reporting to the independent Trustees.
In connection with their deliberations regarding the continuation of the investment advisory agreement, the Trustees, including the independent Trustees, considered such information and factors as they believed, in light of the legal advice furnished to them and their own business judgment, to be relevant. The investment advisory agreement for the Fund was considered separately, although the Trustees also took into account the common interests of all MFS Funds in their review. As described below, the Trustees considered the nature, quality, and extent of the various investment advisory, administrative, and shareholder services performed by MFS under the existing investment advisory agreement and other arrangements with the Fund.
In connection with their contract review meetings, the Trustees received and relied upon materials that included, among other items: (i) information provided by Broadridge Financial Solutions, Inc. (“Broadridge”), an independent third party, on the investment performance of the Fund for various time periods ended December 31, 2016 and the investment performance of a group of funds with substantially similar investment classifications/objectives (the “Lipper performance universe”), (ii) information provided by Broadridge on the Fund’s advisory fees and other expenses and the advisory fees and other expenses of comparable funds identified by Broadridge (the “Broadridge expense group”), (iii) information provided by MFS on the advisory fees of portfolios of other clients of MFS, including institutional separate accounts and other clients, (iv) information as to whether and to what extent applicable expense waivers, reimbursements or fee “breakpoints” are observed for the Fund, (v) information regarding MFS’ financial results and financial condition, including MFS’ and certain of its affiliates’ estimated profitability from services performed for the Fund and the MFS Funds as a whole, and compared to MFS’ institutional business, (vi) MFS’ views regarding the outlook for the mutual fund industry and the strategic business plans of MFS, (vii) descriptions of various functions performed by MFS for the Funds, such as compliance monitoring and portfolio trading practices, and (viii) information regarding the overall organization of MFS, including information about MFS’ senior management and other personnel providing investment advisory,
44
Board Review of Investment Advisory Agreement – continued
administrative and other services to the Fund and the other MFS Funds. The comparative performance, fee and expense information prepared and provided by Broadridge was not independently verified and the independent Trustees did not independently verify any information provided to them by MFS.
The Trustees’ conclusion as to the continuation of the investment advisory agreement was based on a comprehensive consideration of all information provided to the Trustees and not the result of any single factor. Some of the factors that figured particularly in the Trustees’ deliberations are described below, although individual Trustees may have evaluated the information presented differently from one another, giving different weights to various factors. It is also important to recognize that the fee arrangements for the Fund and other MFS Funds are the result of years of review and discussion between the independent Trustees and MFS, that certain aspects of such arrangements may receive greater scrutiny in some years than in others, and that the Trustees’ conclusions may be based, in part, on their consideration of these same arrangements during the course of the year and in prior years.
Based on information provided by Broadridge and MFS, the Trustees reviewed the Fund’s total return investment performance as well as the performance of peer groups of funds over various time periods. The Trustees placed particular emphasis on the total return performance of the Fund’s Class A shares in comparison to the performance of funds in its Lipper performance universe over the three-year period ended December 31, 2016, which the Trustees believed was a long enough period to reflect differing market conditions. The total return performance of the Fund’s Class A shares was in the 3rd quintile relative to the other funds in the universe for this three-year period (the 1st quintile being the best performers and the 5th quintile being the worst performers). The total return performance of the Fund’s Class A shares was in the 1st quintile for the one-year period and the 3rd quintile for the five-year period ended December 31, 2016 relative to the Lipper performance universe. Because of the passage of time, these performance results may differ from the performance results for more recent periods, including those shown elsewhere in this report.
In addition to considering the performance information provided in connection with the contract review meetings, the Trustees noted that, in light of the Fund’s substandard relative performance at the time of their contract review meetings in 2016, they had met at each of their regular meetings since then with MFS’ senior investment management personnel to discuss the Fund’s performance and MFS’ efforts to improve the Fund’s performance. The Trustees further noted that the Fund’s three-year performance as compared to its benchmark improved for the period ended December 31, 2016, as compared to the prior year. Taking this information into account, the Trustees concluded, within the context of their overall conclusions regarding the investment advisory agreement, that they were satisfied with MFS’ responses and efforts relating to investment performance.
In assessing the reasonableness of the Fund’s advisory fee, the Trustees considered, among other information, the Fund’s advisory fee and the total expense ratio of the Fund’s Class A shares as a percentage of average daily net assets and the advisory fee and total expense ratios of peer groups of funds based on information provided by Broadridge. The Trustees considered that, according to the data provided by Broadridge (which takes into account any fee reductions or expense limitations that
45
Board Review of Investment Advisory Agreement – continued
were in effect during the Fund’s last fiscal year), the Fund’s effective advisory fee rate and total expense ratio were each lower than the Broadridge expense group median.
The Trustees also considered the advisory fees charged by MFS to any institutional separate accounts advised by MFS (“separate accounts”) and unaffiliated investment companies for which MFS serves as subadviser (“subadvised funds”) that have comparable investment strategies to the Fund, if any. In comparing these fees, the Trustees considered information provided by MFS as to the generally broader scope of services provided by MFS to the Fund, as well as the more extensive regulatory burdens imposed on MFS in managing the Fund, in comparison to separate accounts and subadvised funds. The Trustees also considered the higher demands placed on MFS’ investment personnel and trading infrastructure as a result of the daily cash in-flows and out-flows of the Fund in comparison to separate accounts.
The Trustees also considered whether the Fund may benefit from any economies of scale in the management of the Fund in the event of growth in assets of the Fund. They noted that the Fund’s advisory fee rate schedule is not subject to any breakpoints. Taking into account that the Fund’s effective advisory fee rate was lower than the Broadridge expense group median described above, the Trustees determined not to recommend any advisory fee breakpoints for the Fund at this time.
The Trustees also considered information prepared by MFS relating to MFS’ costs and profits with respect to the Fund, the MFS Funds considered as a group, and other investment companies and accounts advised by MFS, as well as MFS’ methodologies used to determine and allocate its costs to the MFS Funds, the Fund and other accounts and products for purposes of estimating profitability.
After reviewing these and other factors described herein, the Trustees concluded, within the context of their overall conclusions regarding the investment advisory agreement, that the advisory fees charged to the Fund represent reasonable compensation in light of the services being provided by MFS to the Fund.
In addition, the Trustees considered MFS’ resources and related efforts to continue to retain, attract and motivate capable personnel to serve the Fund. The Trustees also considered current and developing conditions in the financial services industry, including the presence of large and well-capitalized companies which are spending, and appear to be prepared to continue to spend, substantial sums to engage personnel and to provide services to competing investment companies. In this regard, the Trustees also considered the financial resources of MFS and its ultimate parent, Sun Life Financial Inc. The Trustees also considered the advantages and possible disadvantages to the Fund of having an adviser that also serves other investment companies as well as other accounts.
The Trustees also considered the nature, quality, cost, and extent of administrative, transfer agency, and distribution services provided to the Fund by MFS and its affiliates under agreements and plans other than the investment advisory agreement, including any 12b-1 fees the Fund pays to MFS Fund Distributors, Inc., an affiliate of MFS. The Trustees also considered the nature, extent and quality of certain other services MFS performs or arranges for on the Fund’s behalf, which may include securities lending programs, directed expense payment programs, class action recovery programs, and MFS’ interaction with third-party service providers, principally custodians and
46
Board Review of Investment Advisory Agreement – continued
sub-custodians. The Trustees concluded that the various non-advisory services provided by MFS and its affiliates on behalf of the Fund were satisfactory.
The Trustees also considered benefits to MFS from the use of the Fund’s portfolio brokerage commissions, if applicable, to pay for investment research and various other factors. Additionally, the Trustees considered so-called “fall-out benefits” to MFS such as reputational value derived from serving as investment manager to the Fund.
Based on their evaluation of factors that they deemed to be material, including those factors described above, the Board of Trustees, including the independent Trustees, concluded that the Fund’s investment advisory agreement with MFS should be continued for an additional one-year period, commencing August 1, 2017.
47
PROXY VOTING POLICIES AND INFORMATION
MFS votes proxies on behalf of the fund pursuant to proxy voting policies and procedures that are available without charge, upon request, by calling 1-800-225-2606, by visiting mfs.com/proxyvoting, or by visiting the SEC’s Web site at http://www.sec.gov.
Information regarding how the fund voted proxies relating to portfolio securities during the most recent twelve-month period ended June 30 is available by August 31 of each year without charge by visiting mfs.com/proxyvoting, or by visiting the SEC’s Web site at http://www.sec.gov.
QUARTERLY PORTFOLIO DISCLOSURE
The fund will file a complete schedule of portfolio holdings with the Securities and Exchange Commission (the Commission) for the first and third quarters of each fiscal year on Form N-Q. A shareholder can obtain the quarterly portfolio holdings report at mfs.com. The fund’s Form N-Q is also available on the EDGAR database on the Commission’s Internet Web site at http://www.sec.gov, and may be reviewed and copied at the:
Public Reference Room
Securities and Exchange Commission
100 F Street, NE, Room 1580
Washington, D.C. 20549
Information on the operation of the Public Reference Room may be obtained by calling the Commission at 1-800-SEC-0330. Copies of the fund’s Form N-Q also may be obtained, upon payment of a duplicating fee, by electronic request at the following e-mail address: publicinfo@sec.gov or by writing the Public Reference Section at the above address.
FURTHER INFORMATION
From time to time, MFS may post important information about the fund or the MFS funds on the MFS web site (mfs.com). This information is available at https://www.mfs.com/en-us/what-we-do/announcements.html or at mfs.com/openendfunds by choosing the fund’s name.
48
INFORMATION ABOUT FUND CONTRACTS AND LEGAL CLAIMS
The fund has entered into contractual arrangements with an investment adviser, administrator, distributor, shareholder servicing agent, 529 program manager (if applicable), and custodian who each provide services to the fund. Unless expressly stated otherwise, shareholders are not parties to, or intended beneficiaries of these contractual arrangements, and these contractual arrangements are not intended to create any shareholder right to enforce them against the service providers or to seek any remedy under them against the service providers, either directly or on behalf of the fund.
Under the Trust’s By-Laws and Declaration of Trust, any claims asserted against or on behalf of the MFS Funds, including claims against Trustees and Officers, must be brought in state and federal courts located within the Commonwealth of Massachusetts.
FEDERAL TAX INFORMATION (unaudited)
The fund will notify shareholders of amounts for use in preparing 2017 income tax forms in January 2018. The following information is provided pursuant to provisions of the Internal Revenue Code.
The fund designates the maximum amount allowable as qualified dividend income eligible to be taxed at the same rate as long-term capital gain.
The fund designates $373,964,000 as capital gain dividends paid during the fiscal year.
For corporate shareholders, 97.80% of the ordinary income dividends paid during the fiscal year qualify for the corporate dividends received deduction.
49
rev. 3/16
| | | | |
| | | |
FACTS | | WHAT DOES MFS DO WITH YOUR PERSONAL INFORMATION? | |  |
| | |
| Why? | | Financial companies choose how they share your personal information. Federal law gives consumers the right to limit some but not all sharing. Federal law also requires us to tell you how we collect, share, and protect your personal information. Please read this notice carefully to understand what we do. |
| | |
| What? | | The types of personal information we collect and share depend on the product or service you have with us. This information can include: • Social Security number and account balances • Account transactions and transaction history • Checking account information and wire transfer instructions When you are no longer our customer, we continue to share your information as described in this notice. |
| | |
| How? | | All financial companies need to share customers’ personal information to run their everyday business. In the section below, we list the reasons financial companies can share their customers’ personal information; the reasons MFS chooses to share; and whether you can limit this sharing. |
| | | | |
Reasons we can share your
personal information | | Does MFS
share? | | Can you limit
this sharing? |
For our everyday business purposes – such as to process your transactions, maintain your account(s), respond to court orders and legal investigations, or report to credit bureaus | | Yes | | No |
For our marketing purposes – to offer our products and services to you | | No | | We don’t share |
For joint marketing with other financial companies | | No | | We don’t share |
For our affiliates’ everyday business purposes – information about your transactions and experiences | | No | | We don’t share |
For our affiliates’ everyday business purposes – information about your creditworthiness | | No | | We don’t share |
| For nonaffiliates to market to you | | No | | We don’t share |
| | |
| Questions? | | Call 800-225-2606 or go to mfs.com. |
50
| | |
| Who we are |
| Who is providing this notice? | | MFS Funds, MFS Investment Management, MFS Institutional Advisors, Inc., and MFS Heritage Trust Company. |
| | |
| What we do |
| How does MFS protect my personal information? | | To protect your personal information from unauthorized access and use, we use security measures that comply with federal law. These measures include procedural, electronic, and physical safeguards for the protection of the personal information we collect about you. |
| How does MFS collect my personal information? | | We collect your personal information, for example, when you • open an account or provide account information • direct us to buy securities or direct us to sell your securities • make a wire transfer We also collect your personal information from others, such as credit bureaus, affiliates, or other companies. |
| Why can’t I limit all sharing? | | Federal law gives you the right to limit only • sharing for affiliates’ everyday business purposes – information about your creditworthiness • affiliates from using your information to market to you • sharing for nonaffiliates to market to you State laws and individual companies may give you additional rights to limit sharing. |
| | |
| Definitions |
| Affiliates | | Companies related by common ownership or control. They can be financial and nonfinancial companies. • MFS does not share personal information with affiliates, except for everyday business purposes as described on page one of this notice. |
| Nonaffiliates | | Companies not related by common ownership or control. They can be financial and nonfinancial companies. • MFS does not share with nonaffiliates so they can market to you. |
| Joint marketing | | A formal agreement between nonaffiliated financial companies that together market financial products or services to you. • MFS doesn’t jointly market. |
| | |
| Other important information |
| If you own an MFS product or receive an MFS service in the name of a third party such as a bank or broker-dealer, their privacy policy may apply to you instead of ours. |
51
Save paper with eDelivery.

| MFS® will send you prospectuses, |
reports, and proxies directly via e-mail so you will get information faster with less mailbox clutter.
To sign up:
1. Go to mfs.com.
2. Log in via MFS® Access.
3. Select eDelivery.
If you own your MFS fund shares through a financial institution or a retirement plan, MFS® TALK, MFS® Access, or eDelivery may not be available to you.
CONTACT
WEB SITE
mfs.com
MFS TALK
1-800-637-8255
24 hours a day
ACCOUNT SERVICE AND LITERATURE
Shareholders
1-800-225-2606
Financial advisors
1-800-343-2829
Retirement plan services
1-800-637-1255
MAILING ADDRESS
MFS Service Center, Inc.
P.O. Box 55824
Boston, MA 02205-5824
OVERNIGHT MAIL
MFS Service Center, Inc.
c/o DST Asset Manager Solutions, Inc.
30 Dan Road
Canton, MA 02021-2809
The Registrant has adopted a Code of Ethics pursuant to Section 406 of the Sarbanes-Oxley Act and as defined in Form N-CSR that applies to the Registrant’s principal executive officer and principal financial and accounting officer. Effective January 1, 2017, the Code was amended to (i) clarify that the term “for profit” company as used in Section II.B of the Code excludes the investment adviser and its subsidiaries and pooled investment vehicles sponsored by the investment adviser or its subsidiaries, (ii) align the Code’s provisions regarding receipt of gifts and entertainment in Section II.B of the Code with the gifts and entertainment policy of the Funds’ investment adviser, and (iii) make other administrative changes. During the period covered by the report, the Registrant has not granted a waiver, including an implicit waiver, from any provision of the Code.
A copy of the Code effective as of January 1, 2017 is filed as an exhibit to this Form N-CSR.
| ITEM 3. | AUDIT COMMITTEE FINANCIAL EXPERT. |
Messrs. Steven E. Buller and Clarence Otis, Jr. and Ms. Maryanne L. Roepke, members of the Audit Committee, have been determined by the Board of Trustees in their reasonable business judgment to meet the definition of “audit committee financial expert” as such term is defined in Form N-CSR. In addition, Messrs. Buller and Otis and Ms. Roepke are “independent” members of the Audit Committee (as such term has been defined by the Securities and Exchange Commission in regulations implementing Section 407 of the Sarbanes-Oxley Act of 2002). The Securities and Exchange Commission has stated that the designation of a person as an audit committee financial expert pursuant to this Item 3 on the Form N-CSR does not impose on such a person any duties, obligations or liability that are greater than the duties, obligations or liability imposed on such person as a member of the Audit Committee and the Board of Trustees in the absence of such designation or identification.
| ITEM 4. | PRINCIPAL ACCOUNTANT FEES AND SERVICES. |
Items 4(a) through 4(d) and 4(g):
The Board of Trustees has appointed Ernst & Young LLP (“E&Y”) to serve as independent accountants to the Registrant (hereinafter the “Registrant” or the “Fund”). The tables below set forth the audit fees billed to the Fund as well as fees for non-audit services provided to the Fund and/or to the Fund’s investment adviser, Massachusetts Financial Services Company (“MFS”), and to various entities either controlling, controlled by, or under common control with MFS that provide ongoing services to the Fund (“MFS Related Entities”).
For the fiscal years ended November 30, 2017 and 2016, audit fees billed to the Fund by E&Y were as follows:
| | | | | | | | |
| | | Audit Fees | |
| | 2017 | | | 2016 | |
Fees billed by E&Y: | | | | | | | | |
Massachusetts Investors Growth Stock Fund | | | 52,908 | | | | 51,390 | |
For the fiscal years ended November 30, 2017 and 2016, fees billed by E&Y for audit-related, tax and other services provided to the Fund and for audit-related, tax and other services provided to MFS and MFS Related Entities were as follows:
| | | | | | | | | | | | | | | | | | | | | | | | |
| | | Audit-Related Fees1 | | | Tax Fees2 | | | All Other Fees3 | |
| | | 2017 | | | 2016 | | | 2017 | | | 2016 | | | 2017 | | | 2016 | |
Fees billed by E&Y: | | | | | | | | | | | | | | | | | | | | | | | | |
To Massachusetts Investors Growth Stock Fund | | | 0 | | | | 0 | | | | 10,024 | | | | 9,906 | | | | 3,196 | | | | 3,720 | |
| | | |
| | | Audit-Related Fees1 | | | Tax Fees2 | | | All Other Fees3 | |
| | 2017 | | | 2016 | | | 2017 | | | 2016 | | | 2017 | | | 2016 | |
Fees billed by E&Y: | | | | | | | | | | | | | | | | | | | | | | | | |
To MFS and MFS Related Entities of Massachusetts Investors Growth Stock Fund* | | | 1,603,983 | | | | 1,412,499 | | | | 0 | | | | 0 | | | | 101,450 | | | | 116,023 | |
| | | | | | | | |
| | | Aggregate Fees for Non-audit Services | |
| | | 2017 | | | 2016 | |
Fees Billed by E&Y: | | | | | | | | |
To Massachusetts Investors Growth Stock Fund, MFS and MFS Related Entities# | | | 1,850,653 | | | | 1,667,748 | |
| * | This amount reflects the fees billed to MFS and MFS Related Entities for non-audit services relating directly to the operations and financial reporting of the Fund (portions of which services also related to the operations and financial reporting of other funds within the MFS Funds complex). |
| # | This amount reflects the aggregate fees billed by E&Y for non-audit services rendered to the Fund and for non-audit services rendered to MFS and the MFS Related Entities. |
| 1 | The fees included under “Audit-Related Fees” are fees related to assurance and related services that are reasonably related to the performance of the audit or review of financial statements, but not reported under ‘‘Audit Fees,’’ including accounting consultations, agreed-upon procedure reports, attestation reports, comfort letters and internal control reviews. |
| 2 | The fees included under “Tax Fees” are fees associated with tax compliance, tax advice and tax planning, including services relating to the filing or amendment of federal, state or local income tax returns, regulated investment company qualification reviews and tax distribution and analysis. |
| 3 | The fees included under “All Other Fees” are fees for products and services provided by E&Y other than those reported under “Audit Fees,” “Audit-Related Fees” and “Tax Fees,” including fees for services related to review of internal controls and review of Rule 38a-1 compliance program. |
Item 4(e)(1):
Set forth below are the policies and procedures established by the Audit Committee of the Board of Trustees relating to the pre-approval of audit and non-audit related services:
To the extent required by applicable law, pre-approval by the Audit Committee of the Board is needed for all audit and permissible non-audit services rendered to the Fund and all permissible non-audit services rendered to MFS or MFS Related Entities if the services relate directly to the operations and financial reporting of the Registrant. Pre-approval is currently on an engagement-by-engagement basis. In the event pre-approval of such services is necessary between regular meetings of the Audit Committee and it is not practical to wait to seek pre-approval at the next regular meeting of the Audit Committee, pre-approval of such services may be referred to the Chair of the Audit Committee for approval; provided that the Chair may not pre-approve any individual engagement for such services exceeding $50,000 or multiple engagements for such services in the aggregate exceeding $100,000 in each period between regular meetings of the Audit Committee. Any engagement pre-approved by the Chair between regular meetings of the Audit Committee shall be presented for ratification by the entire Audit Committee at its next regularly scheduled meeting.
Item 4(e)(2):
None, or 0%, of the services relating to the Audit-Related Fees, Tax Fees and All Other Fees paid by the Fund and MFS and MFS Related Entities relating directly to the operations and financial reporting of the Registrant disclosed above were approved by the audit committee pursuant to paragraphs (c)(7)(i)(C) of Rule 2-01 of Regulation S-X (which permits audit committee approval after the start of the engagement with respect to services other than audit, review or attest services, if certain conditions are satisfied).
Item 4(f): Not applicable.
Item 4(h): The Registrant’s Audit Committee has considered whether the provision by a Registrant’s independent registered public accounting firm of non-audit services to MFS and MFS Related Entities that were not pre-approved by the Committee (because such services did not relate directly to the operations and financial reporting of the Registrant) was compatible with maintaining the independence of the independent registered public accounting firm as the Registrant’s principal auditors.
| ITEM 5. | AUDIT COMMITTEE OF LISTED REGISTRANTS. |
Not applicable to the Registrant.
A schedule of investments of the Registrant is included as part of the report to shareholders of such series under Item 1 of this Form N-CSR.
| ITEM 7. | DISCLOSURE OF PROXY VOTING POLICIES AND PROCEDURES FOR CLOSED-END MANAGEMENT INVESTMENT COMPANIES. |
Not applicable to the Registrant.
| ITEM 8. | PORTFOLIO MANAGERS OF CLOSED-END MANAGEMENT INVESTMENT COMPANIES. |
Not applicable to the Registrant.
| ITEM 9. | PURCHASES OF EQUITY SECURITIES BY CLOSED-END MANAGEMENT INVESTMENT COMPANY AND AFFILIATED PURCHASERS. |
Not applicable to the Registrant.
| ITEM 10. | SUBMISSION OF MATTERS TO A VOTE OF SECURITY HOLDERS. |
There were no material changes to the procedures by which shareholders may send recommendations to the Board for nominees to the Registrant’s Board since the Registrant last provided disclosure as to such procedures in response to the requirements of Item 407 (c)(2)(iv) of Regulation S-K or this Item.
| ITEM 11. | CONTROLS AND PROCEDURES. |
| (a) | Based upon their evaluation of the effectiveness of the registrant’s disclosure controls and procedures (as defined in Rule 30a-3(c) under the Investment Company Act of 1940 (the “Act”)) as conducted within 90 days of the filing date of this report on Form N-CSR, the registrant’s principal financial officer and principal executive officer have concluded that those disclosure controls and procedures provide reasonable assurance that the material information required to be disclosed by the registrant on this report is recorded, processed, summarized and reported within the time periods specified in the Securities and Exchange Commission’s rules and forms. |
| (b) | There were no changes in the registrant’s internal controls over financial reporting (as defined in Rule 30a-3(d) under the Act) that occurred during the second fiscal quarter of the period covered by the report that have materially affected, or are reasonably likely to materially affect, the registrant’s internal control over financial reporting. |
| ITEM 12. | DISCLOSURE OF SECURITIES LENDING ACTIVITIES FOR CLOSED-END MANAGEMENT INVESTMENT COMPANIES. |
Not applicable to the Registrant.
| (a) | File the exhibits listed below as part of this form. Letter or number the exhibits in the sequence indicated. |
| | (1) | Any code of ethics, or amendment thereto, that is the subject of the disclosure required by Item 2, to the extent that the registrant intends to satisfy the Item 2 requirements through filing of an exhibit: Code of Ethics attached hereto. |
| | (2) | A separate certification for each principal executive officer and principal financial officer of the registrant as required by Rule 30a-2(a) under the Act (17 CFR 270.30a-2): Attached hereto. |
| (b) | If the report is filed under Section 13(a) or 15(d) of the Exchange Act, provide the certifications required by Rule 30a-2(b) under the Act (17 CFR 270.30a-2(b)), Rule 13a-14(b) or Rule 15d-14(b) under the Exchange Act (17 CFR 240.13a-14(b) or 240.15d-14(b)) and Section 1350 of Chapter 63 of Title 18 of the United States Code (18 U.S.C. 1350) as an exhibit. A certification furnished pursuant to this paragraph will not be deemed “filed” for the purposes of Section 18 of the Exchange Act (15 U.S.C. 78r), or otherwise subject to the liability of that section. Such certification will not be deemed to be incorporated by reference into any filing under the Securities Act of 1933 or the Exchange Act, except to the extent that the registrant specifically incorporates it by reference: Attached hereto. |
Notice
A copy of the Amended and Restated Declaration of Trust, as amended, of the Registrant is on file with the Secretary of State of The Commonwealth of Massachusetts and notice is hereby given that this instrument is executed on behalf of the Registrant by an officer of the Registrant as an officer and not individually and the obligations of or arising out of this instrument are not binding upon any of the Trustees or shareholders individually, but are binding only upon the assets and property of the respective constituent series of the Registrant.
SIGNATURES
Pursuant to the requirements of the Securities Exchange Act of 1934 and the Investment Company Act of 1940, the registrant has duly caused this report to be signed on its behalf by the undersigned, thereunto duly authorized.
(Registrant) MASSACHUSETTS INVESTORS GROWTH STOCK FUND
| | |
| By (Signature and Title)* | | DAVID L. DILORENZO |
| | David L. DiLorenzo, President |
Date: January 16, 2018
Pursuant to the requirements of the Securities Exchange Act of 1934 and the Investment Company Act of 1940, this report has been signed below by the following persons on behalf of the registrant and in the capacities and on the dates indicated.
| | |
| By (Signature and Title)* | | DAVID L. DILORENZO |
| | David L. DiLorenzo, President (Principal Executive Officer) |
Date: January 16, 2018
| | |
| By (Signature and Title)* | | JAMES O. YOST |
| | James O. Yost, Treasurer (Principal Financial Officer and Accounting Officer) |
Date: January 16, 2018
| * | Print name and title of each signing officer under his or her signature. |