EARNINGS ANNOUNCEMENT FOR THE QUARTER ENDED
October 1, 2005

Maytag Additional Information:
This document includes statements that do not directly or exclusively relate to historical facts. Such statements
are "forward-looking statements" within the meaning of Section 27A of the Securities Act of 1933 and Section
21E of the Securities Exchange Act of 1934. These forward-looking statements speak only as of this date and
include statements regarding anticipated future financial operating performance and results and expectations as
to the closing of the transaction with Whirlpool. These statements are based on the current expectations of
management of Maytag. There are a number of risks and uncertainties that could cause actual results to differ
materially from the forward-looking statements included in this document. For example, with respect to the
transaction with Whirlpool (1) Maytag may be unable to obtain shareholder approval required for the transaction;
(2) conditions to the closing of the transaction may not be satisfied or the merger agreement may be terminated
prior to closing; (3) Maytag may be unable to obtain the regulatory approvals required to close the transaction, or
required regulatory approvals may delay the transaction or result in the imposition of conditions that could have a
material adverse effect on Maytag or cause the parties to abandon the transaction; (4) Maytag may be unable to
achieve cost-cutting goals or it may take longer than expected to achieve those goals; (5) the transaction may
involve unexpected costs or unexpected liabilities; (6) the credit ratings of Maytag or its subsidiaries may be
different from what the parties expect; (7) the businesses of Maytag may suffer as a result of uncertainty
surrounding the transaction; (8) the industry may be subject to future regulatory or legislative actions that could
adversely affect Maytag; and (9) Maytag may be adversely affected by other economic, business, and/or
competitive factors. Additional factors that may affect the future results of Maytag are set forth in its filings with
the Securities and Exchange Commission ("SEC"), which are available at http://www.maytagcorp.com. Maytag
undertakes no obligation to publicly update or revise any forward-looking statements, whether as a result of new
information, future events or otherwise.
2

Additional Information Relating to the Proposed Merger and Where to Find It
Whirlpool and Maytag have filed a preliminary prospectus/proxy statement with the SEC in connection with the
proposed transaction. Investors are urged to read the preliminary prospectus/proxy statement, and any other
relevant documents filed or to be filed by Whirlpool or Maytag, including the definitive prospectus/proxy
statement when available, because they contain or will contain important information. The preliminary
prospectus/proxy statement is, and other documents filed by Whirlpool and Maytag with the SEC are, available
free of charge at the SEC’s website (http://www.sec.gov) or from Whirlpool by directing a request to Whirlpool
Corporation, 2000 North M-63, Mail Drop 2800, Benton Harbor, MI 49022-2692, Attention: Larry Venturelli, Vice
President, Investor Relations. Neither this communication nor the preliminary prospectus/proxy statement
constitutes an offer to sell or the solicitation of an offer to buy Whirlpool common stock in any jurisdiction outside
the United States where such offer or issuance would be prohibited -- such an offer or issuance will only be
made in accordance with the applicable laws of such jurisdiction.
Whirlpool, Maytag and their respective directors, executive officers, and other employees may be deemed to be
participating in the solicitation of proxies from Maytag stockholders in connection with the approval of the
proposed transaction. Information about Whirlpool’s directors and executive officers is available in Whirlpool’s
proxy statement, dated March 18, 2005, for its 2005 annual meeting of stockholders. Information about
Maytag’s directors and executive officers is available in Maytag’s proxy statement, dated April 4, 2005, for its
2005 annual meeting of stockholders. Additional information about the interests of potential participants is
included in the preliminary prospectus/proxy statement Whirlpool and Maytag filed with the SEC.
3

Non-GAAP Measurements: In addition to the reported GAAP results provided throughout this document, the
company has provided certain non-GAAP measurements (“Net Free Cash Flow” and “Net Debt”). Reconciliations
from GAAP reported results to non-GAAP reported measurements can be found in this document .
The company has provided these non-GAAP measurements as a way to help investors better understand its cash
flow and debt position from period to period. Among other things, the company’s management uses these non-
GAAP measurements to evaluate its cash flow and debt position. The non-GAAP measures are intended only as a
supplement to the comparable GAAP measures and the company compensates for the limitations inherent in the
use of non-GAAP measures by using GAAP measures in conjunction with the non-GAAP measures. As a result,
investors should consider these non-GAAP measures in addition to, and not in substitution for, or as superior to,
measures of financial performance prepared in accordance with GAAP.
4
Welcome to Maytag’s
3rd Quarter 2005 Earnings Announcement
5

PERFORMANCE HIGHLIGHTS:
THIRD-QUARTER FINANCIAL REVIEW
Consolidated sales: $1.26 billion, up 6.5 percent versus 3Q 2004
Segment results:
Home Appliances Segment: $1.2 billion, up 6.7 percent
versus 3Q 2004
Commercial Products Segment: $63.8 million, up 2.5 percent
versus 3Q 2004
6
PERFORMANCE HIGHLIGHTS:
THIRD-QUARTER FINANCIAL REVIEW
Diluted Earnings Per Share
Net loss of 23 cents for the quarter versus net income of 9 cents reported
for 3Q 2004.
Earnings (loss) per share for 3Q 2005 and 3Q 2004 included the
following items:
October 1
October 2
2005
2004
Diluted Earnings (Loss) Per Share
(0.23)
$
0.09
$
Included in diluted earnings (loss) per share (net of tax)
were the following items:
Restructuring and related charges - Galesburg
0.01
0.10
Restructuring and related charges - reorganization
0.01
0.06
Gain on sale of property-Home Appliances
-
(0.10)
Three Months Ended
7

THIRD QUARTER 2005 - Performance Overview
Home Appliances sales up 6.7 percent
Sales up in refrigeration, laundry and cooking
Dishwashing slightly down
Floor care sales down
Maytag Services continues to produce strong revenue growth
Commercial Products up 2.5 percent
Operations benefited from:
Sales increases
Cost reductions (lower advertising and restructuring savings)
Offset by:
Excess manufacturing capacity
Rising material and transportation costs
Lower floor care pricing
8
THIRD QUARTER - Consolidated Financial Highlights
(0.10)
-
(0.10)
-
Gain on Sale of Property
0.09
-
-
-
Adverse Judgment on Pre
-
acquisition Distributor Lawsuit
(0.00)
-
(0.00)
-
Income from Discontinued Operations
0.16
-
-
-
Front
-
load Washer Litigation
0.12
-
-
-
Goodwill Impairment
$ 0.47
$ 0.09
0.16
$ 0.02
Restructuring and Related Charges
2004
2005
2004
2005
Included in diluted earnings (loss) per share (net of tax):
Year to Date
Quarter
$ 0.06
$ (0.09)
$ 0.09
$ (0.23)
Diluted Earnings (Loss) Per Share
$ 5.1
$ (7.0)
$ 7.5
$ (18.2)
Net Income (Loss)
1.3%
1.2%
1.4%
0.0%
Operating Margin %
46.6
43.2
16.4
(0.6)
Operating Income (Loss)
18.5
-
-
-
Front
-
load Washer Litigation
9.6
-
-
-
Goodwill Impairment
$ 54.9
$ 10.7
$ 19.1
$ 2.4
Restructuring and Related Charges
10.9%
9.0%
10.3%
9.2%
% of Sales
$ 387.9
$ 328.7
$ 122.4
$ 115.8
Selling, General and Administrative
14.5%
10.5%
13.3%
9.3%
Gross Profit %
517.5
382.6
157.9
117.6
Gross Profit
$ 3,557.2
$ 3,660.4
$ 1,186.0
$ 1,262.9
Net Sales
2004
2005
2004
2005
$ in millions except per share data
Year to Date
Quarter
(0.10)
-
(0.10)
-
Gain on Sale of Property
0.09
-
-
-
Adverse Judgment on Pre
-
acquisition Distributor Lawsuit
(0.00)
-
(0.00)
-
Income from Discontinued Operations
0.16
-
-
-
Front
-
load Washer Litigation
0.12
-
-
-
Goodwill Impairment
$ 0.47
$ 0.09
0.16
$ 0.02
Restructuring and Related Charges
2004
2005
2004
2005
Included in diluted earnings (loss) per share (net of tax):
Year to Date
Quarter
$ 0.06
$ (0.09)
$ 0.09
$ (0.23)
Diluted Earnings (Loss) Per Share
$ 5.1
$ (7.0)
$ 7.5
$ (18.2)
Net Income (Loss)
1.3%
1.2%
1.4%
0.0%
Operating Margin %
46.6
43.2
16.4
(0.6)
Operating Income (Loss)
18.5
-
-
-
Front
-
load Washer Litigation
9.6
-
-
-
Goodwill Impairment
$ 54.9
$ 10.7
$ 19.1
$ 2.4
Restructuring and Related Charges
10.9%
9.0%
10.3%
9.2%
% of Sales
$ 387.9
$ 328.7
$ 122.4
$ 115.8
Selling, General and Administrative
14.5%
10.5%
13.3%
9.3%
Gross Profit %
517.5
382.6
157.9
117.6
Gross Profit
$ 3,557.2
$ 3,660.4
$ 1,186.0
$ 1,262.9
Net Sales
2004
2005
2004
2005
$ in millions except per share data
Year to Date
Quarter
9
THIRD QUARTER - Home Appliances Segment
. . . Manufactures, sells and services
major appliances and floor care
products sold in North America and
targeted international markets.
18.5
-
-
-
Front
-
load Washer Litigation
(9.7)
-
(9.7)
-
Gain on Sale of Property
$ 54.8
$ 10.3
$ 19.0
$ 2.4
Restructuring and Related Charges
2004
2005
2004
2005
Included in operating income:
Year to Date
Quarter
1.6%
1.4%
1.4%
0.0%
Percent of Sales
52.3
47.7
15.7
0.0
Operating Income
$ 3,346.2
$ 3,475.5
$ 1,123.8
$ 1,199.1
Net Sales
2004
2005
2004
2005
$ in millions
Year to Date
Quarter
10

THIRD QUARTER - Commercial Products Segment
. . . Manufactures and sells
vending equipment and
commercial cooking products.
9.6
-
-
-
Goodwill Impairment
$ 0.1
$ 0.4
$ 0.1
$
-
Restructuring and Related Charges
2004
2005
2004
2005
Included in operating income (loss):
Year to Date
Quarter
-
2.7%
-
2.4%
1.1%
-
0.9%
Percent of Sales
(5.7)
(4.5)
0.7
(0.6)
Operating Income (Loss)
$ 211.0
$ 184.9
$ 62.2
$ 63.8
Net Sales
2004
2005
2004
2005
$ in millions
Year to Date
Quarter
11
MAYTAG CORPORATION
Condensed Consolidated Statement of Operations for Third Quarter 2005
0.3
-
0.3
-
Income from discontinued Operations, Net of Tax
-
245.8%
4.8
(7.0)
-
356.3%
7.1
(18.2)
Income (Loss) from Continuing Operations
-
89.5%
44.0%
-
18.6%
33.6%
Effective Tax Rate
-
9.5
-
8.5
Merger
-
related Expense, Net
-
61.1%
7.2
2.8
-
134.9%
4.3
(1.5)
Other Income (Expense)
(2.3)
(5.5)
(1.1)
(9.2)
Income Tax Expense (Benefit)
-
236.0%
5.1
(7.0)
-
343.1%
7.5
(18.2)
Net Income (Loss)
% Change
2004
2005
% Change
2004
2005
$ in millions except per share data
Year to Date
Third Quarter
-
341.2%
14.3%
-
103.5%
-
87.4%
-
5.4%
-
25.5%
11.4%
6.5%
(0.23)
-
16.8
(0.6)
-
-
2.4
115.8
117.6
1,145.2
$ 1,262.9
(0.09)
-
48.8
43.2
-
-
10.7
328.7
382.6
3,277.9
$ 3,660.4
-
235.0%
0.06
0.09
Reported Diluted Earnings (Loss) per Share
10.5
-
Adverse Judgment on Pre
-
acquisition Distributor
Lawsuit
19.6%
40.8
14.7
Interest Expense
-
7.4%
46.6
16.4
Operating Income (Loss)
18.5
-
Front
-
load Washer Litigation
9.6
-
Goodwill Impairment
-
80.5%
54.9
19.1
Restructuring and Related Charges
-
15.3%
387.9
122.4
Selling, General and Administrative Expenses
-
26.1%
517.5
157.9
Gross Profit
7.8%
3,039.7
1,028.1
Cost of Sales
2.9%
$ 3,557.2
$ 1,186.0
Net Sales
0.3
-
0.3
-
Income from discontinued Operations, Net of Tax
-
245.8%
4.8
(7.0)
-
356.3%
7.1
(18.2)
Income (Loss) from Continuing Operations
-
89.5%
44.0%
-
18.6%
33.6%
Effective Tax Rate
-
9.5
-
8.5
Merger
-
related Expense, Net
-
61.1%
7.2
2.8
-
134.9%
4.3
(1.5)
Other Income (Expense)
(2.3)
(5.5)
(1.1)
(9.2)
Income Tax Expense (Benefit)
-
236.0%
5.1
(7.0)
-
343.1%
7.5
(18.2)
Net Income (Loss)
% Change
2004
2005
% Change
2004
2005
$ in millions except per share data
Year to Date
Third Quarter
-
341.2%
14.3%
-
103.5%
-
87.4%
-
5.4%
-
25.5%
11.4%
6.5%
(0.23)
-
16.8
(0.6)
-
-
2.4
115.8
117.6
1,145.2
$ 1,262.9
(0.09)
-
48.8
43.2
-
-
10.7
328.7
382.6
3,277.9
$ 3,660.4
-
235.0%
0.06
0.09
Reported Diluted Earnings (Loss) per Share
10.5
-
Adverse Judgment on Pre
-
acquisition Distributor
Lawsuit
19.6%
40.8
14.7
Interest Expense
-
7.4%
46.6
16.4
Operating Income (Loss)
18.5
-
Front
-
load Washer Litigation
9.6
-
Goodwill Impairment
-
80.5%
54.9
19.1
Restructuring and Related Charges
-
15.3%
387.9
122.4
Selling, General and Administrative Expenses
-
26.1%
517.5
157.9
Gross Profit
7.8%
3,039.7
1,028.1
Cost of Sales
2.9%
$ 3,557.2
$ 1,186.0
Net Sales
12
SELECTED BALANCE SHEET ITEMS
907.8
938.5
917.0
Net Debt
(Total Debt less Cash and Cash Equivalents)
69.0
57.8
57.2
Cash and Cash Equivalents
976.8
996.3
974.2
Total Debt
553.2
471.8
540.4
Payables
724.5
670.1
725.2
Receivables
$ 604.4
$ 572.6
$ 620.8
Inventories
16.3%
16.0%
16.7%
Percent of Rolling 12 Months Sales
$ 775.7
$ 770.9
$ 805.6
Working Capital
2005
2004
2005
$ in millions
Second Quarter
Third Quarter
Third Quarter
13
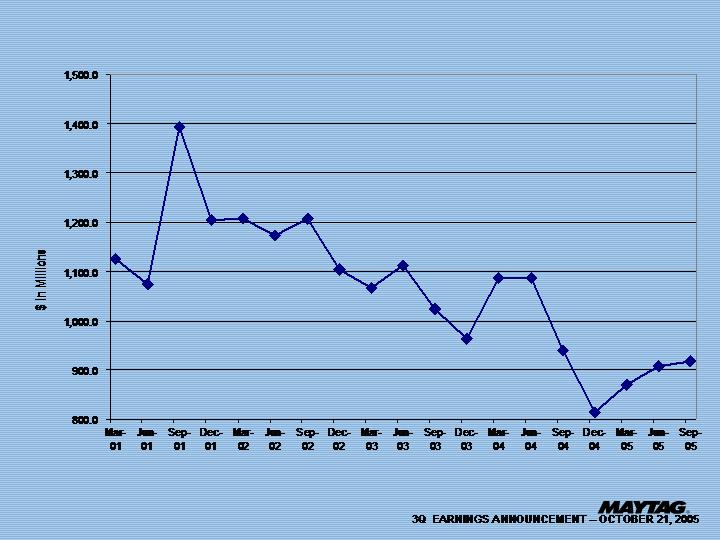
NET DEBT LEVELS
14
28.5
-
Net Proceeds from Financing Obligations
11.2
-
Proceeds from Business Disposition, Net of Transaction Costs
14.3
15.8
Proceeds from Property Disposition, Net of Transaction Costs
(9.7)
0.5
Loss (Gain) on Sale of Property
(67.0)
(64.7)
Capital Expenditures
9.6
-
Goodwill Impairment
9.8
(8.9)
Front
-
load Washer Litigation, Net of Cash Paid
3.0
2.6
Stock Options Exercised and Other
(173.6)
(205.7)
Change in Working Capital
$ 40.7
$ (94.3)
Net Free Cash Flow
(4.0)
(2.5)
Repayment of Long Term Debt
(42.6)
(28.7)
Dividends on Common Stock
40.5
(13.8)
Restructuring and Related Charges, Net of Cash Paid
106.7
105.6
Other
-
Net
Year to Date
MAYTAG CORPORATION STATEMENTS OF CASH FLOWS
Pension Expense
Pension Contributions
Postretirement Benefit Liability
Adverse Judgment on Pre
-
acquisition Distributor Lawsuit, Net of Cash Paid
Deferred Income Taxes
Depreciation & Amortization
Net Income (Loss)
$ 57.8
$ 57.2
Cash and Short
-
Term Investments at end of period
6.8
164.3
Cash and Short
-
Term Investments at beginning of period
$ 51.0
$ (107.1)
Change in Cash and Short
-
Term Investments
$ 107.7
$ (29.6)
Cash Provided by (Used in) Continuing Operations
47.4
53.8
(93.5)
(51.9)
(2.8)
(6.6)
10.5
(12.3)
29.7
(8.5)
128.0
125.2
$ 5.1
$ (7.0)
2004
2005
$ in Millions
15
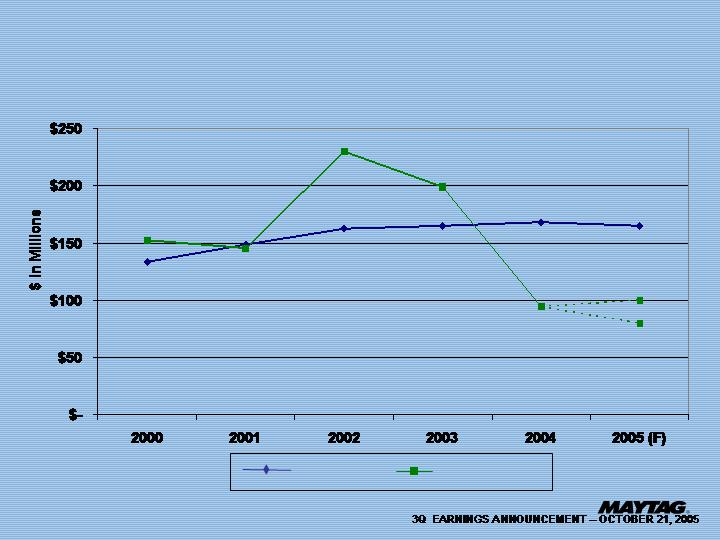
CAPITAL INVESTMENTS
$80
$100
Depreciation
Capital Expenditures
16

PERFORMANCE OUTLOOK
Opportunities
Fix manufacturing footprint / excess capacity
Upcoming product launches in floor care and refrigeration
Additional growth opportunities: Maytag Services
New market opportunities: Maytag International
Challenges
Continued unfavorable burden absorption
Higher raw material pricing and transportation costs
Merger-related costs
Product mix
17
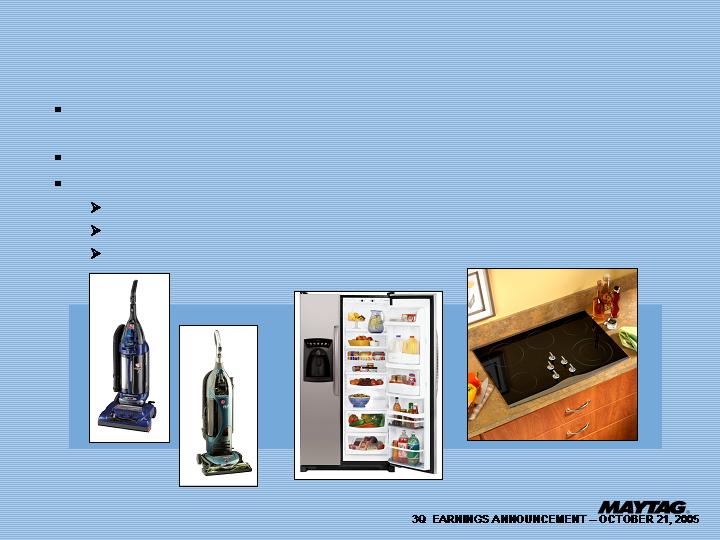
MAYTAG HIGHLIGHTS
For the ninth consecutive year, Hoover receives the SPARC award for
retail category excellence.
Money Magazine selects Hoover as the top pick in vacuums
Leading consumer magazine gave high marks to our products:
Floor care - #1 in vacuum cleaner ratings last seven years
Refrigerator products - #1 Amana Side-by-Side; #2 Amana French Door
Cooking Products - #1 Jenn-Air Cook Top; #2 Jenn-Air Wall Oven
18
19