QuickLinks -- Click here to rapidly navigate through this documentMcCORMICK & COMPANY 2002 ANNUAL REPORT

Allspice
This year's annual report is scented with allspice. Allspice is the dried, un-ripened fruit of a small evergreen tree, the Pimenta Dioica. Its aroma is a pleasant blend of cinnamon, clove and nutmeg. Primarily harvested in Jamaica, allspice was one of the spices "discovered" by Columbus when he sought black pepper while in the Caribbean Islands. In Europe, it is commonly known as Pimento. A staple in curry dishes, allspice is in a wide range of other contemporary recipes including Caribbean Baked Bananas, Harvest Pork with Apples and Sauerkraut, and Allspice Chocolate Truffles. These recipes and many more can be found on McCormick's global websites.
Contents
| 1 | | Financial Highlights |
| 2 | | Letter to Shareholders |
| 5 | | McCormick at a Glance |
| 6 | | Recipes for Success: Higher Margins, Innovation, Growth |
| 12 | | McCormick Worldwide |
| 14 | | Board of Directors |
| 15 | | Corporate Officers and Operating Executives |
| 16 | | Recipe for Community Service |
| 17 | | Management's Discussion and Analysis |
| 29 | | Report of Management, Report of Independent Auditors |
| 30 | | Financial Statements and Notes |
| 44 | | Historical Financial Summary |
| 45 | | Investor Information |
Our Mission
The primary mission of McCormick & Company is to profitably expand its worldwide leadership position in the spice, seasoning and flavoring markets.
Company Description
McCormick is the global leader in the manufacture, marketing and distribution of spices, seasonings and flavors to the entire food industry. Customers range from retail outlets and food service providers to food processing businesses. In addition, our packaging group manufactures and markets
plastic bottles and tubes for the food, personal care and other industries. Founded in 1889 and built on a culture of Multiple Management, McCormick has approximately 9,000 employees.
| Net Sales(2) | | Gross Profit Margin(2) |
| in millions | | |
 |
|
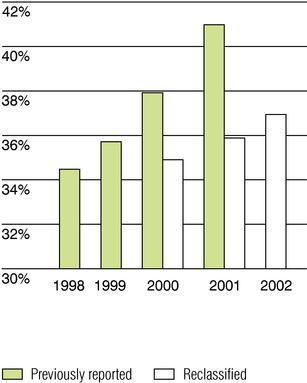 |
- (2)
- McCormick adopted EITF 01-09 in 2002. The graphs display net sales and gross profit margin for 2000 and 2001 as reclassified to reflect this change, and as previously reported.
Financial Highlights
for the year ended November 30 (millions except per share data)
| | 2002
| | 2001
| | % change
| |
|---|
| Net sales | | $ | 2,320.0 | | $ | 2,218.5 | | 4.6 | % |
| Gross profit margin | | | 36.9 | % | | 35.9 | % | | |
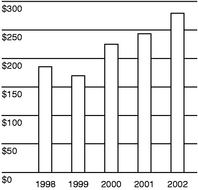
| Operating income | | $ | 277.7 | | $ | 240.6 | | 15.4 | % |
| Net income | | | 179.8 | | | 146.6 | | 22.6 | % |
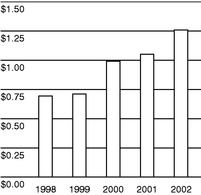
| Earnings per share—assuming dilution | | | 1.26 | | | 1.05 | | 20.0 | % |
| Earnings per share—excluding amortization—assuming dilution(1) | | | 1.26 | | | 1.13 | | 11.5 | % |
| Dividends paid per share | | $ | .42 | | $ | .40 | | 5.0 | % |
| Market price per share—close | | | 23.79 | | | 21.50 | | 10.7 | % |
| Average shares outstanding—assuming dilution | | | 142.3 | | | 140.2 | | 1.5 | % |
| | |
| |
| |
| |
| Other Performance Measures: | | | | | | | | | |
| | |
| |
| |
| |
| Debt-to-total-capital | | | 49.2 | % | | 58.3 | % | | |
| Return on invested capital | | | 15.7 | % | | 15.4 | % | | |
| Economic value added (EVA) | | $ | 89.6 | | $ | 78.7 | | 13.9 | % |
| | |
| |
| |
| |
- (1)
- McCormick adopted SFAS 142 in 2002. Earnings per share for 2001 is adjusted to exclude goodwill amortization.
Operating Income
in millions | Earnings per share—assuming dilution | Economic Value Added (EVA)
in millions |
 |
 |
 |
1
Letter to Shareholders
McCormick reported another year of record financial results in 2002. In the last five years, McCormick has accelerated its rate of performance with an average annual growth rate of 6% for sales and 15% for earnings per share. In 2002:
- •
- Sales grew 5% to $2.3 billion, primarily through strong volume.
- •
- Gross profit margin increased one percentage point to 36.9%.
- •
- As a result of higher sales, margin improvement and reduced interest expense, earnings per share rose 12% to $1.26 on a comparable basis, excluding amortization.
- •
- New product successes, expansion with our strategic customers, share gains and favorable foreign currencies, grew sales of our food businesses 5%. Operating income on a comparable basis, excluding special charges and amortization, rose 8% for our food businesses as a result of a favorable raw material environment, more value-added products and cost efficiencies.
- •
- We overcame both sales weakness in our packaging business and difficulties in our U.K. brokerage operation with strength in our food businesses. We have instituted changes to each of these operations to improve profitability.
- •
- Our stock price continued to increase in 2002 and we split our stock two-for-one on April 8.
We achieved these results in a year during which we were completing the first phase of our Beyond 2000 (B2K) program that required significant technology and process changes. B2K is a global initiative designed to significantly improve business processes through state-of-the-art information technology.
Despite this major initiative and the added challenges posed by our packaging business and U.K. brokerage operation, we increased our investment in brand marketing and product development and launched a number of innovative products which deliver the taste consumers have come to trust. Most importantly, we were able to both invest in the business and meet our profit goal in 2002.
Cash flow was used to pay dividends, reduce debt and to fund the B2K program and other capital expenditures. Dividends paid to shareholders increased for the 16th consecutive year. McCormick is proud to have paid dividends yearly for the last 78 years. Funding for our B2K program will continue, but at a reduced level, appropriate to meet our needs. Following the 2000 acquisition of Ducros, the largest spice company in Europe, we committed to return to our target

Robert J. Lawless
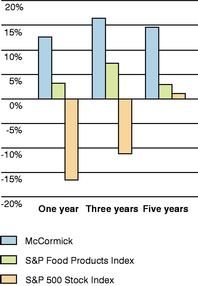
Chairman, President & CEO | | Total Shareholder Return
Includes Dividends
 |
2
debt-to-total-capital of 45-55% by the end of 2002. This commitment was met at the end of our third quarter in 2002, and a level of 49% was achieved by year-end.
The McCormick recipe for success is simple: Improve margins, invest in the business, and increase sales and profits.
One of the ways we improve margins is by focusing marketing support and development resources on value-added, higher-margin products. Today, value-added products account for 65% of sales with the other 35% coming from ingredients. Our B2K program, with a strong emphasis on optimizing the management of our supply chain, creates a global platform for future profit improvement, more efficient working capital and enhanced relationships with our trading partners. We have identified more than 100 distinct opportunities to reduce costs in our supply chain. These opportunities include the global procurement of ingredients and packaging, more efficient logistics and streamlined, lower cost operations.
We are investing in our business to drive sales. Research and development expenditures have nearly doubled in the last five years. In 2002, for example, a new sensory center was opened in order to increase our ability to explore and determine preferences in taste. The center is one of many ways we are maintaining our competitive edge in supplying the grocery industry, food processors and the restaurant industry with consumer-preferred flavors. New products developed in the last three years accounted for 10% of 2002 sales.
Included in our B2K investment was the launch of a promotional management program that improves the effectiveness of our significant spending on brand marketing. We are also focused on geographic expansion in Europe and Asia to increase sales. To better supply our strategic, multi-national industrial customers, we recently established new supply relationships in Uruguay and Thailand.
With our return to a target range of 45-55% debt-to-total-capital, we are pursuing acquisitions of both industrial businesses and consumer brands that will extend our leadership position in our key markets. We also plan to reactivate our share repurchase program in 2003.
We are confident in our long-term ability to continue our margin improvement and sales growth. In March 2002, we established key annual financial goals for the next five years:
- •
- Increase sales 5%, with a range of 3-7%
- •
- Increase earnings per share 10-12%
- •
- Generate free cash flow of $100 million
Our Core Values
We believe…
- •
- our people are the most important ingredient of our success.
- •
- our top priority is to continuously add value for our shareholders.
- •
- customers are the reason we exist.
- •
- our business must be conducted honestly and ethically.
- •
- the best way to achieve our goals is through teamwork.
The McCormick recipe for success is simple:
Improve margins, invest in the business, and increase sales and profits.
3
Strong leadership and a positive attitude
An effective strategy requires great execution. Execution is the result of strong leadership and a talented and enthusiastic staff, both trademarks of McCormick employees.
McCormick has a powerful combination of long-term, experienced management and new leaders with complementary skills and backgrounds. We offer our employees exposure to numerous roles and functions. For instance, multi-function teams were responsible for the success of projects such as the B2K implementation and related supply chain improvements. Through these experiences and more formal leadership training efforts, we are not only executing our strategies but preparing our next generation of company leaders.
During this past year, Fran Contino accepted new responsibility for supply chain functions and a change in title to Executive Vice President, Chief Financial Officer and Supply Chain. Bob Miller, Vice President—Management Information Systems, retired. Bob Schroeder, President—U.S. Consumer Products Division, announced his retirement at the end of 2003. Alan Wilson was promoted to succeed Bob as President—U.S. Consumer Products Division. Chuck Langmead was promoted to Vice President and General Manager—Food Service and Global Restaurant Division. Tapan Chakrabarty joined McCormick as Vice President and Managing Director—Industrial—Asia Pacific.
For more than 70 years, we have benefited from our Multiple Management philosophy that inspires employee participation and recognition. Our core values define who we are and how we work together. We are committed to a diverse workforce and a spirit of inclusion.
In 2002, it was our employees who created McCormick's success. I salute their efforts and share their pride in what has been accomplished.
A recipe for success
Today, our Company operates in a challenging environment. In key markets around the globe, competition is strong and customers are consolidating. The breadth of our business puts us in a unique position to maintain leadership.
Our business is creating flavors that deliver satisfaction to an ever-increasing universe of consumers. Whether it is a product found in a retail store, a food prepared at home, a quick serve restaurant or a dining chain, it is likely that the flavor is provided by McCormick. We add flavor to all kinds of products up and down the grocery aisles including breakfast cereal, yogurt, snack chips and beverages. At home, consumers enjoy using our products to spice up a gourmet meal or easily prepare an appetizing weeknight meal. Have a quick serve restaurant sandwich, eat at a casual dining chain or order carry-out and you are likely to taste a sauce, breading or seasoning developed by McCormick. We believe that each and every day, no matter what you eat, McCormick is adding flavor to your food for your enjoyment.
Improve margins, invest for growth, increase sales and profits. This is a formula for success that not only has led us to five years of great performance but promises to increase momentum in the years ahead.
Consider the initiatives that we have instituted in the last year which bode well for our future:
- •
- Implemented the initial phase of B2K in our largest operating unit
- •
- Opened our state-of-the-art sensory center
- •
- Launched new products in key markets worldwide
- •
- Organized to improve our supply chain
Our stock price has performed well as a result of a straightforward strategy and consistent financial performance that distinguish McCormick as a compelling investment. Annual shareholder return was 13% over the last year and 16% over the last three years, well above returns of the S&P 500 Index and S&P Food Products Index.
In the coming year, I am confident that we will continue to build value for our shareholders through the increased efficiencies, profitability and growth investors have come to expect.

Robert J. Lawless, Chairman, President & CEO
4
McCormick at a Glance
| | Consumer Business
| | Industrial Business
| | Packaging Business
|
|---|
Business description |
|
• |
|
Markets spices, herbs, extracts, seasoning blends, sauces and marinades to retail outlets such as grocery, drug and mass merchandise stores. |
|
• |
|
Markets spices, blended seasonings, condiments, coatings, and compound flavors to food processors, restaurant chains, distributors and warehouse clubs. |
|
• |
|
Markets plastic bottles and tubes to the food, personal care and other industries. |
Market position |
|
• |
|
Leading market share, exceeding 40% in U.S., 45% in U.K., 50% in France, 50% in Canada. And, leading share in many smaller markets. |
|
• |
|
Leading supplier to distributors and warehouse clubs. One of the leading suppliers of blended seasonings to U.S. food processors. |
|
• |
|
One of the leading suppliers of highly specialized packaging in the U.S. |
2002 financial results |
|
• |
|
Sales increased 5%. |
|
• |
|
Sales increased 6%. |
|
• |
|
Sales decreased 5%. |
|
|
• |
|
Operating income increased 2%; excluding U.K. brokerage operation impact, increased in line with sales(1) |
|
• |
|
Operating income increased 19%.(1) |
|
• |
|
Operating income increased 4%.(1) |
2002 highlights |
|
• |
|
New products launched in the last 3 years accounted for 6% of 2002 sales. |
|
• |
|
New products launched in the last 3 years accounted for 15% of 2002 sales. |
|
• |
|
New products launched in the last 3 years accounted for 19% of 2002 sales. |
|
|
• |
|
Installed new promotion system in U.S. to measure effectiveness and optimize spending beginning in 2003. |
|
• |
|
Increased global sales of value-added, higher-margin products with an 8% growth in seasonings. |
|
• |
|
Through a number of initiatives, achieved an operating margin of 9.5% despite reduced market demand for tubes.(1) |
|
|
• |
|
Introduced improved packaging in Europe to make products more visible, contemporary and relevant. |
|
• |
|
Through a better product mix and cost efficiencies, achieved 10.8% in operating margin, up from 9.7% in 2001.(1) |
|
|
|
|
Strategy and outlook |
|
• |
|
Increase sales by leveraging our brands through
• effective marketing
• accelerated innovation
• brand acquisition
• geographic expansion |
|
• |
|
Increase sales by expanding global flavor and food service business, building our leadership position in flavors, seasonings and condiments. |
|
• |
|
Increase sales through new products and distribution. Stabilize profit growth stream. |
|
|
• |
|
Interest in bold and exotic flavors is growing, but food preparation must be quick and easy. McCormick is satisfying this appetite for flavor with leading brands in key markets around the world. |
|
• |
|
The desire for flavors continues to grow and customers turn to McCormick to deliver a broad range of consumer-preferred flavors that become marketplace winners. |
|
• |
|
McCormick is developing innovative features and using new materials to continue market leadership. |
|
|
|
|
|
|
|
|
|
|
|
|
|
- (1)
- Excluding special charges and goodwill amortization.
5
Recipe for Higher Margins
During the last five years, McCormick has increased gross profit margins from less than 33% to nearly 37%. We have achieved this increase through a shift in mix to more value-added, higher-margin products and through cost reductions in many areas of our business. This shift to more value-added, higher-margin products has been aided by the acquisition of Ducros and the introduction of successful new products. New cost reduction initiatives include procurement on a more global basis, effective customer and product segmentation, supplier rationalization, capital expenditures that improve efficiencies, and careful control of expenses. Over the next five years, we expect to reach a gross profit margin of 40%.
Emphasis on value-added products improves margins. In our consumer business, we are directing our development and promotional resources toward value-added products.1 StepTM seasonings in the U.S.,ShotzTM seasonings in the U.K. andLa Grille Rub®Marinade in Canada are all new products featuring a blend of seasonings that reduce time in meal preparation. In our industrial business, food service customers are seeking products that reduce preparation time and provide consistently great menu items. We offer a wide range of flavor solutions to the food service industry as well as unique packaging features that improve product handling. In dealing with food processors, we benefit by emphasizing sophisticated flavor solutions such as compound flavors which offer margins superior to bulk ingredient margins. The percent of sales from value-added products has reached 65% and continues to grow.
Beyond 2000 provides a seamless platform. Beyond 2000 (B2K) is a global program utilizing state-of-the-art information technology to increase the efficiency and profitability of our business processes. In 2002, we began to use

6
the new technology and processes in a significant portion of U.S. operations. The rollout of the B2K program to our remaining U.S. industrial operations and many international operating units will occur through 2005. We will continue to integrate and optimize all of our businesses through broader access to information and increased collaboration with our trading partners. Through B2K, employee time devoted to transaction execution will be reduced and more time will be devoted to the growth and effectiveness of the business.
Focus on supply chain to realize efficiencies. We have achieved cost reductions throughout the supply chain—from procurement of our raw materials to product delivery. In 2002, we made an organizational change bringing most components of our supply chain under the direction of Fran Contino. This new organization closely aligns our strategic functions of finance, global business solutions, operations, strategic sourcing and logistics. With this new organizational focus, enabled by the capabilities of B2K, we are positioning ourselves to achieve the highest level of customer satisfaction and cost optimization.
Fuel for growth By reducing our need for working capital, increasing cash flow, and improving margins, we will increase our "fuel for growth." Development of higher-margin products and expense reduction in the areas of procurement and production are already evident in our bottom line. Operating profit margins will be further increased by lowering general administrative expenses and improving our ability to sell and distribute efficiently. With our "fuel for growth" we will invest in programs to increase sales and profitability at McCormick.
2002 Net Sales
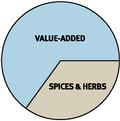
65% of sales are from value-added products
Efforts to improve margins are meeting with success as we increase focus on our supply chain. At a distribution center in Belcamp, Maryland, new technologies bring heightened efficiencies and cost optimization and will lead to higher levels of customer satisfaction.
The new1 Step line of seasoning blends responds to consumer preferences for great taste with ease of preparation. Great taste on the run!

7
Recipe for Innovation
Innovation at McCormick begins with recognizing emerging eating trends and our expertise in developing great flavors. Both lead to successful new products. New products developed during the last three years accounted for 10% of sales in 2002. New products range from zesty seasoning blends to bold condiments and sophisticated new flavors. We continue to invest in people, facilities and equipment to maintain our competitive edge in flavor innovation.
Developing consumer-preferred flavors. A recentParade Magazine survey reported that 82% of consumers say taste—not cost—determines which foods they purchase and prepare. Around the world, our product development process is designed to deliver flavors that consumers prefer. The process begins with recognizing current trends in categories such as ethnic cuisine, easy food preparation, and eating on-the-go. Our research and development teams bring together the skills of chefs, flavor chemists and analytical scientists who are experts in seasonings, condiments, coatings and compound flavors. Not surprisingly, McCormick's sensory capabilities are well recognized and among the best in the industry. Sensory evaluation of new products by consumers is the final step in the development process. The result of this multi-staged methodology is that we are able to deliver integrated products that are winners with consumers as well as our retail and industrial customers.
Providing a wide range of flavor solutions. When you enjoy great tasting food you are most likely tasting a McCormick flavor. We have extended our consumer business from spices and herbs to a wide variety of convenient seasoning blends. Launched in 2001,La Grille Rub Marinade (Montreal Steak) became the third largest selling item in the Canadian spice market in 2002. In the U.S.,1 Step seasonings, launched at the end of 2002, offer consumers fast and easy to prepare meals that taste great and provide the satisfaction of home cooking. In the U.K., a line of fun, innovative products calledShotz aimed at 18 to 30 year olds who are intimidated by cooking, are a success. For the food service industry, we can provide an array of flavors to satisfy changing tastes and dining preferences. For a lunchtime chicken sandwich for example, we can create the marinade, coating, sauce and bread topping. Our breadth of flavor solutions is unique in the industry and gives McCormick a competitive advantage.
Investing in enhanced capabilities. We have nearly doubled our research and development spending in the last five years by hiring experts who excel in value-added product development, by adding equipment to analyze flavors and instituting state-of-the-art facility improvements. In 2000 we opened a new culinary center for our research chefs, and in 2002 a new sensory center was initiated to support our product analysis. These new facilities are both housed in our U.S. Technical Innovation Center where product development sessions with customers have increased more than 25% since 1998. But investment in innovation is not limited to product development. With the initial B2K implementation, we launched a promotional management program that improves the effectiveness of our significant spending on brand marketing. Additionally, we engage the consumer through our global websites. We continue to invest in our websites to improve their appeal, relevance and ease of use.
Investing in innovation McCormick has the skills, tools and creativity to successfully innovate and deliver consumer-preferred flavors. We will continue to invest to build our capabilities and to drive sales growth.
2002 Net Sales
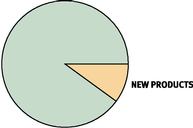
10% of 2002 sales were from new products launched during the last three years. | | The Bag 'n Season® line, which has been a success in other global markets, was adapted for the microwave and launched in China in 2002. This convenient, value-added product matches consumer trends of the fast-paced, urban Chinese lifestyle.
 |
8

Members of McCormick's product development team and clients can view panel tests (descriptive or consumer) from an observation room via a one-way mirror. The flexible design and advanced technology of our new sensory center lets viewers watch the panel through the mirror, via closed circuit screening, on videotape or over the Internet.
9
Recipe for Growth
Sales have grown at a 6% average annual growth rate since 1997. An annual sales growth rate of 3-7% is our target for the next five years. Innovative products and expansion of successful products into new markets are propelling our growth. We introduced our U.S. seafood brands in Australia in the mid-1990s, and in 2001 they were relaunched as theSimply SeafoodTM line of products. Sales of these items grew 18% in 2002. Ducros brand salt and pepper grinders from France gained a strong position in the U.S. under the McCormick label. Our grilling products, which began in Canada, moved to the U.S. and today are found in markets around the world. Sales of our consumer grilling items grew worldwide more than 12% in 2002.
In addition to these product successes, sales growth will be achieved by strengthening customer relationships, expanding geographically, and through further acquisitions.
Strengthening customer relationships to maintain our leadership. McCormick is regarded as the premier supplier and category leader in the spice and seasoning industry. In 2002, the Company was recognized by two major customers for excellence as a supplier to the food service industry. We have built many long-term relationships with industrial customers for whom we play an important role in developing the next unique snack seasoning, sandwich sauce or beverage flavor. In our consumer business, we are a supplier of both brand and private label products. We form sales-based supply contracts with our retail customers in several key markets. These partnerships reinforce our position as category leader with higher sales being a shared objective. Our market share in many of these markets is well ahead of the next competitor. In all of our businesses, we have the skills, determination, market knowledge and resources to create partnerships in which McCormick and its customers can enjoy further success.
Expanding geographically because the desire for flavors knows no boundaries. Since the Ducros acquisition in 2000, McCormick has established a foundation for growth in Europe. The Ducros spice business in Europe was the largest acquisition in the history of the Company. In 2001, we realigned our manufacturing facilities between France and the U.K. In 2002, we formed five geographic clusters in Europe and moved from a country-based to a regional focus. Our European management group complements experienced McCormick employees with managers from other European consumer businesses. We are preparing for further market penetration in Europe by utilizing new distribution channels, employing better merchandising and strengthening brand support. Global expansion is achieved by supporting our customers. In 2002, we established new supply sources for industrial customers in Uruguay and Thailand. In China, where sales increased 14% in 2002, we are continuing distribution of branded products into new regions and supporting the growth of key industrial customers.
Growing through acquisitions that enhance our portfolio of flavors. With the successful integration of Ducros, we are now confidently pursuing additional acquisitions. We plan to acquire leading consumer brands that deliver flavor as well as industrial businesses that specialize in value-added products. We are concentrating on companies located in geographic areas that offer the best opportunity for growth, namely North America, Europe and parts of Asia. We will be aggressive, yet disciplined in seeking acquisitions.
 | | 2002 Net Sales
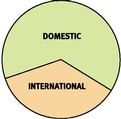
Sales to international markets exceed 35%
The newShotz line of seasoning blends in the U.K. is directed at 18-30 year olds who have limited experience in the kitchen but want restaurant quality taste in a few easy steps. A national TV ad drove the message about this fun product in a clever package. | | Using the Ducros acquisition as a platform, we are creating a truly pan-European business. Our focus is now regional rather than country-based. Further European market penetration will be gained via new distribution channels, enhanced merchandising and strong brand support. |
10

We are improving margins, investing in the business, and increasing sales and profits. These simple steps have been therecipe for our success over the last five years. They are the keys to future growth and increased shareholder value.
11
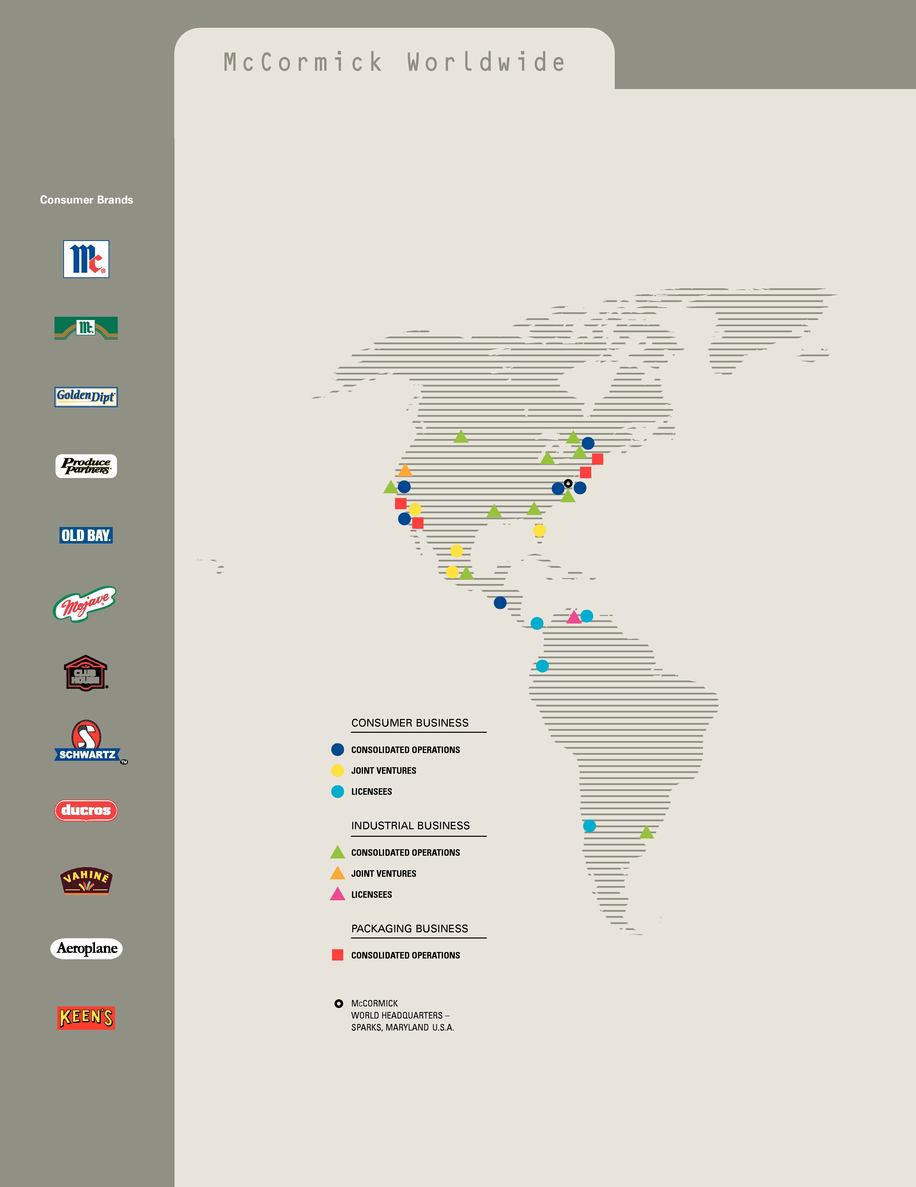
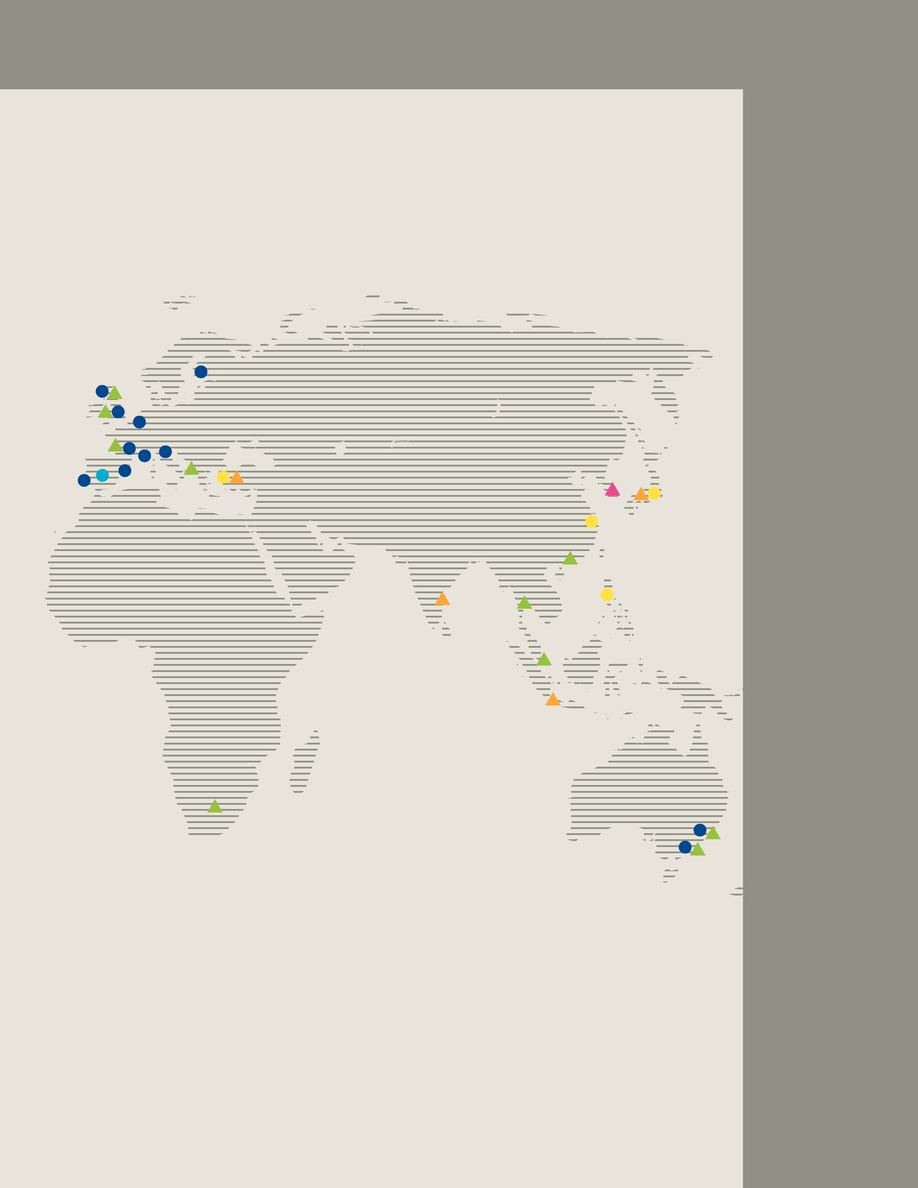
McCormick Worldwide
12
 |
|
Industrial Products
Ingredients
Spices and Herbs
Extracts
Essential oils and
Oleoresins
Coating systems
Batters
Breaders
Marinades
Glazes
Rubs
Seasonings
Seasoning blends
Salty snack seasonings
Side dish seasonings
(rice, pasta, potato)
Sauces and Gravies
Condiments
Sandwich sauces
Ketchup
Mustards
Jams and Jellies
Seafood cocktail sauces
Salad dressings
Flavored oils
Compound Flavors
Beverage flavors
Dairy flavors
Confectionery flavors
Processed Flavors
Meat flavors
Savory flavors |
From locations around the world, our consumer brands reach more than 80 countries. Our industrial business provides a wide range of products to multinational restaurants and food processors.McCormick flavors span the globe.
13
 | |  |
| Barry Beracha, Robert Lawless, William Stevens and Michael Fitzpatrick | | Francis Contino, James Brady and Robert Schroeder |
Board of Directors
Barry H. Beracha, 60
Executive Vice President
Sara Lee Corporation, Chief Executive Officer
Sara Lee Bakery Group—food, household and body care products and apparel
Chicago, Illinois
Director since 2000 *
James T. Brady, 62
Managing Director
Mid-Atlantic Ballantrae International, Ltd.—international management consultants
New York, New York
Director since 1998 +
Francis A. Contino, 57
Executive Vice President, Chief Financial Officer & Supply Chain
McCormick & Company, Inc.
Director since 1998
Robert G. Davey, 53
President—Global Industrial Group
McCormick & Company, Inc.
Director since 1994 | | Edward S. Dunn, Jr., 59
President
Dunn Consulting—
business consulting services
Williamsburg, Virginia
Director since 1998 *
J. Michael Fitzpatrick, 56
President & Chief Operating Officer
Rohm and Haas Company—paint and coatings, electronics, household products, personal care and salt
Philadelphia, Pennsylvania
Director since 2001 *
Freeman A. Hrabowski, III, 52
President
University of Maryland Baltimore County
Baltimore, Maryland
Director since 1997 +
Robert J. Lawless, 56
Chairman, President and Chief Executive Officer
McCormick & Company, Inc.
Director since 1994 | | John C. Molan, 56
President—Europe and Asia
McCormick & Company, Inc.
Director since 2000
Carroll D. Nordhoff, 57
Executive Vice President
McCormick & Company, Inc.
Director since 1991
Robert W. Schroeder, 57
Executive Vice President
McCormick & Company, Inc.
Director since 1996
William E. Stevens, 60
Chairman
BBI Group—venture capital
St. Louis, Missouri
Director since 1988 +
Karen D. Weatherholtz, 52
Senior Vice President—Human Relations
McCormick & Company, Inc.
Director since 1992 |
- +
- Audit Committee member
- *
- Compensation Committee member
14
 | |  |
| Freeman Hrabowski and Carroll Nordhoff | | John Molan, Edward Dunn, Karen Weatherholtz and Robert Davey |
| | | | | | | |
| Corporate Officers | | Operating Executives |
| | | | | | | |
Robert J. Lawless
Chairman, President and Chief Executive Officer ‡
Allen M. Barrett, Jr.
Vice President—Corporate Communications
Paul C. Beard
Vice President—Finance
Joyce L. Brooks
Assistant Treasurer—Financial Services
W. Geoffrey Carpenter
Associate General Counsel & Assistant Secretary
Robert P. Conrad
Assistant Treasurer—International
Francis A. Contino
Executive Vice President, Chief Financial Officer & Supply Chain ‡
Robert G. Davey
President—Global Industrial Group ‡
Stephen J. Donohue
Vice President—Strategic Sourcing
Dr. Hamed Faridi
Vice President—Research & Development | | H. Grey Goode, Jr.
Vice President—Tax
Kenneth A. Kelly, Jr.
Vice President & Controller
Roger T. Lawrence
Vice President—Quality Assurance
Sharon H. Mirabelle
Vice President—Shared Services
Michael J. Navarre
Vice President—Operations
Carroll D. Nordhoff
Executive Vice President‡
Robert W. Schroeder
Executive Vice President
Robert W. Skelton
Senior Vice President, General Counsel & Secretary
Karen D. Weatherholtz
Senior Vice President—Human Relations
Jeryl Wolfe
Vice President—Global Business Solutions/Chief Information Officer | | Arduino Bianchi
President & Managing Director—McCormick De Centro America, S.A. de C.V.
Randy Carper
Vice President & General Manager—Frito Worldwide Division
Tapan Chakrabarty
Vice President & Managing Director—Industrial—Asia Pacific
Robert G. Davey
President—Global Industrial Group
Lazaro Gonzalez
President and Managing Director—McCormick Pesa, S.A. de C.V.
Randal M. Hoff
Vice President & General Manager—McCormick Flavor Division
Gavin Jacobs
Managing Director—McCormick South Africa Proprietary Limited
Charles T. Langmead
Vice President & General Manager—Food Service and Global Restaurant Division | | Timothy J. Large
Managing Director—McCormick Foods Australia Pty. Ltd.
John C. Molan
President—Consumer & Food Service—Europe and Asia
James M. Morrisroe
Vice President—McCormick Flavor Group—Europe
Donald E. Parodi
Vice President—Packaging Group
Steve Rafter
President—Tubed Products, Inc.
Victor K. Sy
Vice President and Managing Director—Consumer—McCormick Far East
Mark T. Timbie
President—La Cie McCormick Canada Co.
Iwan Williams
Vice President—Consumer—Europe
Alan D. Wilson
President—U.S. Consumer Products Division |
| | | | | | |
‡Executive Committee member
15
Recipe for Community Service
If recent world events have taught us anything, it is that we should cherish and protect family, neighbors and communities. From its beginning, McCormick has done more than build a thriving business. The Company has always been caring and civic-minded. McCormick's long-standing commitment to be a benevolent and involved member of the community is part of our culture.
Communities around the world have benefited in many ways from charitable activities of McCormick and its global employee population. These acts have been both large and small. Some come from the Company at large; others are from small groups and even individual employees. Some involve monetary donations and ongoing support. Others can be measured in the many hours that employees donate to a multitude of community organizations and activities. For many civic-minded McCormick employees, the leap from participation to passion is a quick one. The overall goal is always the same—the well-being and prosperity of a community and its citizens.
The Company has a formalized program of charitable giving that grants funds to worthwhile causes. Civic, health, welfare, education and arts projects receive the greatest attention. McCormick is also a committed supporter of initiatives such as Second Harvest and other food bank organizations. A perennial program is Charity Day when a vast majority of employees contribute time and salary to community organizations, which the Company matches.
Much of our attention is also focused on youth with a number of scholarships that provide the opportunity for young people to capitalize on their character. Each year, McCormick presents Unsung Heroes Scholarship Awards to worthy male and female high school student-athletes. The Company also takes an active role in Junior Achievement and other youth mentoring opportunities at schools, through scouting and in sports/recreation leagues.
McCormick's commitment to community service is rooted in the Company's history and thrives today. It's championed by the leadership team and supported at all levels of the Company. It's Bill Rauh, a Product Development Manager in Maryland, helping to build a church in a poverty-stricken area of Brazil. It's Betty Tan, of McCormick's Southeast Asian operation, devoting time to the local Breast Cancer Foundation. It's Naru Ojha, a scientist in Maryland, teaching in an "English as a second language" program.
A caring Company and involved employees create a successful recipe for community enrichment.

Naru Ojha devotes spare time teaching in an "English as a second language" program. "I can't forget the smiles on the faces of those men and women from various lands. They showed such pride as they spoke to their children in English."
Bill Rauh helped build a church in a poverty-stricken area of Brazil. "It was so rewarding to see the people when we held the first service in the church. During our 10-day mission, we built the church from the ground up."
Betty Tan (left) is a volunteer at the local Breast Cancer Foundation. "Our group provides a safe, caring environment for people coping with breast cancer. We share information, experiences and support."
16
Management's Discussion and Analysis
Certain performance measures used in this section are not defined by accounting principles generally accepted in the United States (GAAP). Refer to the bottom of this page for a discussion of the definitions and use of these terms.
The Company adopted Statement of Financial Accounting Standard (SFAS) No. 142 effective December 1, 2001. In accordance with this pronouncement, the Company ceased amortization of goodwill and indefinite lived intangible assets. Prior year financial information has not been restated. The amounts reported for operating income and net income in 2001 and 2000, in this section of the report, are presented as previously reported and also "excluding amortization" for comparability with current year results.
On February 19, 2002, the Company's Board of Directors announced a two-for-one stock split of both classes of common stock, effective April 8, 2002. As a result of the stock split, the Company's shareholders received an additional common share for each share held. All per share amounts and numbers of shares outstanding in this report have been restated for the stock split for all periods presented.
The Company measures segment performance in its internal reporting based on operating income excluding special charges and amortization. Management believes that this measurement is an important indicator of the ongoing operations of the individual business segments. Special charges are managed and measured through separate reporting to management.
Overview
For 2002, the Company reported net income of $179.8 million or $1.26 of diluted earnings per share compared to $146.6 million or $1.05 of diluted earnings per share in 2001. Excluding amortization, diluted earnings per share were $1.13 in 2001.
In summary, diluted earnings per share for 2002 increased by $.13 over 2001, excluding amortization. On a per share basis, this was achieved through higher operating income of $.11 and reduced interest expense of $.04, partially offset by the effect of increased shares outstanding of $.02.
In 2002, the Company continued to grow sales, gross profit and operating profit in both its consumer and industrial businesses. This was offset in part by continued weakness in our packaging business and operational difficulties in the U.K. brokerage portion of our consumer business. The Company has instituted changes to the packaging and U.K. brokerage operations to improve their profitability going forward.
Other Performance Measures
The other performance measures described below are used throughout this annual report to present alternative views of the Company's performance. Management believes that these other performance measures are used by industry analysts and investors to evaluate the Company's performance relative to its peers and, therefore, when read in conjunction with the financial statements, are informative. These measures are not defined by accounting principles generally accepted in the United States and may be calculated differently from similar measures used by other companies.
" Economic value added" (EVA)—McCormick defines economic value added as net income from operations, excluding interest and amortization expense, in excess of a capital charge for average capital employed. An "EVA" mark is owned by Stern Stewart & Co.
"Excluding Ducros"—Certain measures are presented excluding the results from the Ducros business and interest on the debt used to finance the acquisition, which was acquired on August 31, 2000. For the year ended November 30, 2000, this means excluding the results of Ducros for the fourth quarter ended November 30, 2000. For the year ended November 30, 2001, this means excluding the results of Ducros for the nine months ended August 31, 2001.
"Return on invested capital" (ROIC)—McCormick defines return on invested capital as net income from operations, excluding interest and amortization expense, divided by the sum of interest-bearing debt and equity (including minority interest).
17
In 2001, the Company formalized a plan to more rapidly streamline its operations to increase efficiency and reduce costs. The plan included the consolidation of several distribution and manufacturing locations, the reduction of administrative and manufacturing positions, and the reorganization of several joint ventures. Special charges recorded in 2002 under this plan were $8.0 million ($5.8 million after-tax) versus $11.7 million ($7.7 million after-tax) in 2001.
Beyond 2000
Late in 1999, the Company initiated the Beyond 2000 (B2K) program as a global program of business process improvement. B2K is designed to optimize our supply chain, reengineer our back office processes, strengthen our product development process, extend collaborative processes with our trading partners and generally enhance our capabilities to increase sales and profit. We have increased our overall levels of capital spending and expense from historical levels to support this effort.
In 2002, we implemented the initial phase of our B2K program and began using the new state-of-the-art technology and processes in a significant portion of U.S. operations, including our largest operating unit. The rollout of B2K to our remaining U.S. industrial operations and many international operating units will occur through 2005. We will continue to integrate and optimize all of our businesses through broader access to information and increased collaboration with our trading partners. Through B2K, employee time devoted to transaction execution will be reduced and more time will be devoted to the growth and effectiveness of the business.
Results of Operations—2002 compared to 2001
Net sales from consolidated operations in 2002 increased 4.6% to $2.3 billion when compared to 2001 primarily as a result of volume. The favorable effect of foreign currency fluctuations contributed 0.9% to this overall increase.
In 2002, net sales for the consumer business increased 4.9% compared to 2001 primarily as a result of volume. The favorable effect of foreign currency fluctuations contributed 1.5% to this overall increase. In local currency, consumer sales in the Americas increased 3.9%. Sales increased from higher sales of core products and the introduction of new products. Sales in the Americas also benefited from a price increase that was offset in part by higher promotional trade spending which is recorded as a reduction of sales. In Europe, sales in local currency increased 2.6%. This increase was attributable to favorable sales volume partially offset by unfavorable product mix. In the Asia/Pacific region, sales in local currency increased 4.3% due primarily to higher volumes in China which generated 8.3% sales growth. Growth in China was more modest in 2002 due to a strategic initiative that is underway. The Company is de-emphasizing some of its less profitable products in that market, such as ketchup and soy sauce, in order to focus on core products, such as spices and seasoning mixes, which have a higher margin.
In 2002, net sales for the industrial business increased 6.0% versus 2001 primarily as a result of volume. The favorable effect of foreign currency fluctuations contributed 0.5% to this overall increase. In local currency, industrial sales in the Americas were up 5.8% due to strong sales, particularly of seasoning products and products sold to our food service customers. In Europe, sales in local currency increased 1.3%. This increase was attributable to favorable sales volumes partially offset by unfavorable product mix. In the Asia/Pacific region, sales in local currency increased 11.4% due to
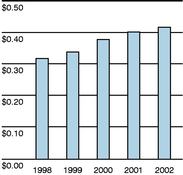
Dividends paid
18
increased volume predominantly in China as we continue to expand with our worldwide industrial customers.
In 2002, net sales for the packaging business decreased 5.2% versus 2001. The continued softening in the U.S. economy caused further declines in demand for our customers' products that are packaged in our tubes primarily during the first half of 2002. There were signs of improved demand in the second half of 2002, and sales in the fourth quarter of 2002 were up 9.4% compared to the fourth quarter of 2001.
Gross profit margin increased to 36.9% in 2002 from 35.9% in 2001. Gross profit margins for the Company were favorably impacted by global procurement initiatives and ongoing efforts to improve efficiencies. In the consumer business, gross profit margin improvement was also due to favorable raw material costs. In the industrial business, gross profit margin also improved due to a shift in product mix to higher-margin, more value-added products. These favorable effects on our food business gross margins were partially offset by implementation costs related to our B2K program and poor performance of our U.K. brokerage operation.
Selling, general and administrative expenses in the prior year included amortization of $12.9 million. Excluding amortization in 2001, selling, general and administrative expenses were higher in 2002 than 2001 on both a dollar basis and as a percentage of net sales. These increases were primarily due to increased distribution, pension, and insurance costs, as well as a higher investment in the Beyond 2000 program. The increased distribution costs are due to increased costs to service our customers during the initial system implementation of B2K and costs incurred in our U.K. brokerage operation. Insurance costs have increased concurrent with an industry-wide trend. While implementation expenses of B2K peaked in 2002, the future decrease in implementation expenses will be slightly more than offset by future increases in depreciation expense on the B2K systems that are implemented.
Pension expense was $15.2 million, $10.4 million and $10.2 million for the years ended November 30, 2002, 2001 and 2000, respectively. The increase in pension expense in 2002 was primarily due to a decrease in the discount rate from 8.0% to 7.25% and the fact that the U.S. pension plan investment returns during 2001 and 2002 have reflected the general decline in the U.S. stock market and have been below the expected long-term rate of return used to calculate pension expense. As a result of these investment return shortfalls and to the declining interest rate environment, the Company has reevaluated its pension assumptions and made the following changes in connection with the valuation performed at the end of 2002: the discount rate was reduced from 7.25% to 7.0%; the expected long-term rate of return was reduced from 10.0% to 9.0%; the salary scale was reduced from 4.5% to 4.0%; and a more recent mortality table was adopted. As a result of these changes and the less than expected investment return experience of 2001 and 2002, 2003 pension expense is expected to increase 60% over the 2002 level.
Operating income margin was 12.0% in 2002 compared to 10.8% in 2001. Excluding amortization, operating income margin was 11.4% in 2001.
In the consumer business, operating income margin was 16.5% in 2002 compared to 15.6% in 2001. Special charges for the consumer segment decreased to $2.6 million in 2002 from $5.1 million in 2001. Operating income margin excluding special charges and amortization was 16.7% in 2002 and 17.2% in 2001. Income from increased sales and favorable raw material costs was offset by poor performance in the U.K. brokerage operation. Late last year, the customer service function for the U.K. brokerage operation was outsourced to its distributor. The distributor did not adequately control the customer service process, which led to $4.0 million of inventory and receivable write-offs in 2002. (These write-offs were not part of the special charges.) In addition, the brokerage business had not been performing to expectations. The customer service function was brought back in-house and the Company switched distributors. No additional write-offs are anticipated and other changes to the U.K. brokerage operation have been made to improve profitability going forward.
In the industrial business, operating income margin was 10.7% in 2002 compared to 9.0% in 2001. Special charges for the industrial business decreased to $1.8 million in 2002 from $6.0 million in 2001. Operating income margin excluding special charges and amortization was 10.8% in 2002 and 9.7% in 2001. The increase in operating income margin versus prior year is due to continued cost reduction initiatives and a continued shift in sales to higher-margin, more value-added products. This improvement was led by strong performance with U.S. food service customers and in the Asia/Pacific region.
In the packaging business, operating income margin was 9.3% in 2002 compared to 8.5% in 2001. Special charges for the packaging business decreased to $0.4 million in 2002 from $0.6 million in 2001. Operating income margin excluding special charges and amortization was 9.5% in 2002 and 8.9% in 2001. The packaging segment continued to
19
experience softness in the first half of 2002, due to reduced demand for our customers' products, particularly tubes for personal care and cosmetics. However, there were signs of improvement in the packaging segment in the second half of the year. The increase in operating margin versus prior year is due to actions taken to adjust production activities, including a reduction in workforce.
Interest expense decreased in 2002 versus 2001 due to favorable interest rates and lower average debt levels.
Other income decreased in 2002 compared to 2001. This decrease is attributable to exchange losses on foreign currency transactions.
The effective tax rate for 2002 was 31.6%, down from 33.0% in 2001. The lower tax rate was attributable to the elimination of amortization, which is generally a non-tax deductible expense. This effect is predominantly in international operations.
Income from unconsolidated operations increased to $22.4 million in 2002 versus $21.5 million in 2001. Unconsolidated operations consist primarily of our McCormick de Mexico and Signature Brands joint ventures.
Results of Operations—2001 compared to 2000
On August 31, 2000, the Company acquired, through its subsidiary, McCormick France, S.A.S., one hundred percent of the share capital of Ducros, S.A., and Sodis, S.A.S. from Eridania Beghin-Say, S.A. Ducros is the leading consumer spice and herb business in Europe as well as the leading manufacturer and distributor of dessert aid products. Sodis manages the racking and merchandising of the Ducros products in supermarkets and hypermarkets. Collectively, these two operations are referred to as "Ducros" in this report.
The purchase price for the stock of Ducros was 2.75 billion French francs (equivalent to $379 million). The purchase contract provides for a potential adjustment to the purchase price with interest from the date of purchase. This adjustment procedure has not been concluded, however the potential adjustment under the contract can only decrease the purchase price. Any reduction in the purchase price would be recorded as a decrease to goodwill, and any interest received would be recorded as interest income.
The Company adopted Emerging Issues Task Force (EITF) 01-09 as of December 1, 2002. As a result of the adoption, results for 2001 and 2000 have been reclassified. See note 1 of Notes to Consolidated Financial Statements.
Net sales from consolidated operations in 2001 increased 8.6% to $2.2 billion when compared to 2000. Excluding the unfavorable effect of foreign currency exchange rates and the acquisition of Ducros, sales grew 3.5%.
In 2001, net sales for the consumer business increased 14.2% compared to 2000. Excluding the impact of Ducros and the impact of foreign currency exchange rates, net sales grew 3.4%. In local currency, consumer sales in the Americas were up 2.2% due to favorable sales volume. Sales of branded products were increased through effective promotion, advertising and merchandising and through the introduction of new products. In Europe, sales in local currency grew 6.5% excluding Ducros. This increase was attributable to favorable sales volume particularly in the U.K. In the Asia/Pacific region, sales in local currency increased 4.3% due to higher volume in China as the Company continued to penetrate new regions and expand the availability of the McCormick brand.
The industrial business also had a successful year in 2001, as net sales increased 4.8% versus 2000. Excluding the impact of Ducros and foreign exchange, sales grew 4.1%. In local currency, industrial sales in the Americas were up 3.8% due to higher restaurant sales, sales of new flavor and seasoning products to our snack seasoning customers, and increased sales to warehouse clubs. In Europe, sales in local currency grew 4.0% excluding Ducros due largely to favorable sales volume in the U.K. In the Asia/Pacific region, sales in local currency increased 8.5% due to sales growth with global restaurant customers in China.
In 2001, net sales for the packaging business increased 0.9% versus 2000. In the first half of 2001, tube and bottle sales were strong and resin costs were stabilizing. However, the second half of 2001 saw softening in the U.S. economy which caused a decline in consumer demand for our customers' products, particularly tubes for personal care and cosmetics.
20
Gross profit margin increased to 35.9% in 2001 from 34.8% in 2000, a 110 basis point improvement. Approximately two-thirds of this improvement was attributable to the Ducros business, which has a higher gross profit margin than the Company's other businesses. In the consumer business, gross profit margin improvement was due to a combination of the addition of the Ducros business, price increases in the U.S. business, lower costs of certain raw materials, and cost reduction initiatives. In the industrial business, gross profit margin improvement was mainly due to a shift in product mix to higher-margin, more value-added products as well as cost reduction initiatives and reduced costs of certain raw materials. Lower volumes and product mix in our packaging business resulted in lower margins in 2001.
Selling, general and administrative expenses were higher in 2001 than 2000 on both a dollar basis and as a percentage of net sales. These increases were primarily due to the new Ducros business, including $8.2 million in related goodwill amortization, increased distribution expenses due to higher energy costs, and higher investment for the B2K program. The 2000 results included a $3.8 million charge for the bankruptcy of an industrial customer.
Operating income margin was 10.8% in 2001 compared to 11.0% in 2000. Excluding amortization, operating income margin was 11.4% in 2001 and 2000.
In the consumer business, operating income margin was 15.6% in 2001 compared to 17.2% in 2000. Excluding special charges and amortization, operating income margin was 17.2% in 2001 and 17.9% in 2000. The decrease in operating income margin versus prior year was due primarily to the lower operating income margin of the Ducros business. Increases in operating profit due to price increases and reduced raw material costs were offset by increased investment spending on programs such as B2K.
In the industrial business, operating income margin was 9.0% in 2001 compared to 8.2% in 2000. Excluding special charges and amortization, operating income margin was 9.7% in 2001 and 8.4% in 2000. The increase in operating income margin versus prior year is due to cost reduction initiatives and a shift in sales to higher-margin, more value-added products. In addition, there were favorable effects of reduced raw material costs.
In the packaging business, operating income margin was 8.5% in 2001 compared to 9.9% in 2000. Excluding special charges and amortization, operating income margin was 8.9% in 2001 and 10.0% in 2000. The decrease in operating margin versus prior year is due to competitive pricing pressure and product mix impacting our gross margins.
Interest expense increased in 2001 versus 2000 due to higher average debt levels in 2001 as a result of the Ducros acquisition. Excluding Ducros, interest expense in 2001 decreased compared to 2000 due to favorable interest rates and lower average debt levels.
Other income increased in 2001 compared to 2000. This increase is attributable to interest income and exchange gains on foreign currency transactions.
The effective tax rate for 2001 was 33.0%, down from 35.8% in 2000. The Company transacts business in many
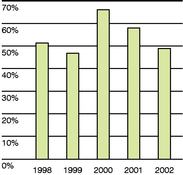
Debt-to-Total-Capital
21
different taxing jurisdictions around the world, all of which assess different tax rates. The mix of earnings among these jurisdictions is what caused a lower tax rate in 2001 versus 2000.
Income from unconsolidated operations increased to $21.5 million in 2001 versus $18.6 million in 2000, primarily due to continued strong performance from our McCormick de Mexico and Signature Brands joint ventures.
Financial Condition
Continued strong cash flows from operations enabled the Company to fund operating projects and investments designed to meet our growth objectives and reduce debt levels.
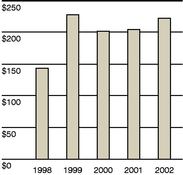
In the consolidated statement of cash flows, cash provided by operating activities was $223.7 million in 2002 compared to $204.5 million in 2001 and $202.0 million in 2000. Over the past three years, there has been an annual increase in cash flow from profits, excluding depreciation and amortization, and from dividends received from our unconsolidated affiliates. In 2000, cash flow also increased due to reductions in working capital items. In 2001 and 2002, working capital items decreased cash flow. When 2002 is compared to 2001 the increase in receivables is mainly due to strong sales in the fourth quarter of 2002. The increase in inventory is due to higher levels to meet increased sales and the temporary effect of increased inventory as B2K was implemented at several of our U.S. locations. When 2001 is compared to 2000, there were favorable trends in both receivables and inventories. These were offset by a $14.7 million interest rate swap settlement in the first quarter of 2001 used to fix the interest rate of the Ducros acquisition financing. Retirement plan funding reduced operating cash flow over the past several years by $23.6 million in 2002, $18.5 million in 2001, and $8.7 million in 2000. The 2003 contribution is expected to be below the amount contributed in 2002.
Investing activities used cash of $105.6 million in 2002 versus $111.9 million in 2001 and $442.6 million in 2000. The major use of cash for investing activities in 2000 was the acquisition of businesses, including the acquisition of Ducros in the third quarter. Capital expenditures in 2002 of $110.7 were slightly lower than in 2001, however the increments in 2002 and 2001 over 2000 were largely due to planned spending on B2K.
Financing activities used cash of $111.6 million in 2002 and $85.4 million in 2001 versus providing cash of $254.6 million in 2000. The Company financed $370.0 million of the Ducros acquisition through its issuance of commercial paper in August 2000, thereby increasing cash flows from short-term borrowings. The Company funded the balance of the purchase price from internally generated funds. In the first quarter of 2001, the Company finalized its medium-term note program for the Ducros acquisition and issued $300.0 million of notes, which replaced the existing commercial paper notes used to finance the transaction. In addition, during the third quarter of 2001, the Company retired $75.0 million of 8.95% fixed rate notes by issuing commercial paper. The variable rate on the $75.0 million of commercial paper is being fixed at 6.35% by interest rate swaps from 2001 through 2011. In the fourth quarter of 2002, the Company repaid short-term borrowings based on cash flow generated from operations. The common stock issued and common stock acquired by purchase in 2002
Cash from operations
in millions
22
and 2001 relates to the Company's stock compensation plans. In 2000, however, the Company purchased 2.5 million shares of common stock for $62.6 million under the Company's $250 million share repurchase program. Due to the acquisition of Ducros, the Company suspended the share repurchase program in May 2000. The Company is actively pursuing the purchase of additional consumer brands and value-added industrial businesses to broaden its portfolio. Excess cash after acquisitions will be used for share repurchase. Accordingly, the Company has reactivated its $250 million share repurchase program under which $141 million remains available for repurchase.
The return on plan assets of the Company sponsored pension plans has been below the expected long-term rate of return in 2001 and 2002. Pension plan investment returns during 2001 and 2002 have reflected the general decline in the stock market. As a result, the market value of the pension plan assets on the measurement date was below the accumulated benefit obligation, and the Company was required to record a minimum pension liability of $110.2 million ($69.1 million after-tax) as calculated under Statement of Financial Accounting Standard (SFAS) No. 87. This resulted in an increase in the pension liability of $110.2 million, a decrease in other comprehensive income of $69.1 million, an increase deferred tax assets of $40.1 million, and an increase in intangible assets of $1.0 million.
On January 8, 2003, the Company acquired, through its subsidiary, McCormick (UK) Ltd., the Uniqsauces business of Uniq PLC., a European chilled convenience food group, for approximately $19.5 million in cash. This acquisition will be financed through the Company's operating cash flow and borrowings from existing credit lines. Uniqsauces manufactures and markets condiments to retail grocery and food service customers, including quick service restaurants.
Dividend payments increased to $58.6 million in 2002, up 6.4% compared to $55.1 million in 2001. Dividends paid in 2002 totaled $.42 per share, up from $.40 per share in 2001. In November 2002, the Board of Directors approved a 4.8% increase in the quarterly dividend from $.105 to $.11 per share. Over the last 10 years, dividends have increased 10 times and have risen at a compounded annual rate of 8.3%.
The Company's ratio of debt-to-total-capital was 49.2% as of November 30, 2002, a decrease from 58.3% at November 30, 2001. The decrease was primarily due to lower average debt levels and increases in shareholders' equity. The Company has returned to its target range of 45-55% for the debt-to-total-capital ratio; however, future acquisitions could alter this projection.
Management believes that internally generated funds and existing sources of liquidity are sufficient to meet current and anticipated financing requirements during the next 12 months.
Special Charges
Over the last three years, the Company made significant progress in streamlining its operations in a manner consistent with its strategic plan. Gross profit margins improved during this period by 210 basis points. This served as fuel for revenue growth and improved profits. With the investment in B2K, the Company is well positioned to continue this record of improving margins into the future.
While the year 2002 was another record year for McCormick, the U.S. and global economies did not fare as well. Recognizing that it is not immune to the impact of these difficult financial times on our customers and consumers, the Company formalized a plan in 2001 to more rapidly streamline its operations to meet the challenges that it, and all companies, faced in 2002 and in the future.
This plan, adopted during the 2001 fourth quarter, included the consolidation of several distribution and manufacturing locations, the reduction of administrative and manufacturing positions, and the reorganization of several joint ventures. The total plan will cost approximately $32.6 million ($25.6 million after tax). Total cash expenditures in connection with these costs will approximate $16.7 million, which will be funded through internally generated funds. Once fully implemented, annualized savings are expected to be approximately $8.0 million ($5.3 million after tax). These savings will be used for investment spending on initiatives such as brand support and supply chain management. The aforementioned savings and administrative expenses are expected to be included within the cost of goods sold and selling, general and administrative expenses in the consolidated statement of income.
23
In the fourth quarter of 2001, the Company recorded charges of $11.7 million ($7.7 million after tax) under this plan. Of this amount, $10.8 million was classified as special charges and $0.9 million as cost of goods sold in the consolidated statement of income. Additional amounts under the plan were not recorded at that time as they were either incremental costs directly related to the implementation of the plan, or the plans were not sufficiently detailed to allow for accounting accrual.
The costs recorded in the fourth quarter of 2001 related to the consolidation of manufacturing in Canada, a distribution center consolidation in the U.S., a product line elimination and a realignment of our sales operations in the U.K., and a workforce reduction of 275 positions which encompasses plans in all segments and across all geographic areas. As of November 30, 2002, 190 of the 275 position reductions had been realized.
The major components of the 2001 special charges include charges for employee termination benefits of $6.3 million, asset write-downs of $1.6 million, and other related exit costs of $3.8 million.
During the year ended November 30, 2002, the Company recorded an additional $8.0 million ($5.8 million after-tax) of special charges associated with the 2001 restructuring plan, which could not be accrued at that time. These charges included the write-off of an investment in an industry purchasing consortium, further costs of lease exit and relocation costs related to the workforce reduction and realignment of consumer sales operations in the U.S., further severance and other costs related to the previously discussed workforce reduction and an additional 10 administrative and 34 production related positions, further costs related to the closure of a U.S. distribution center and further costs of the consolidation of manufacturing in Canada that primarily resulted from the disposition of a manufacturing facility. During 2002, total cash expenditures in connection with the plan were $6.3 million. Streamlining actions accrued as of November 30, 2002 are expected to be completed in 2003.
The major components of the 2002 special charges include charges for employee termination benefits of $3.8 million, asset write-downs of $3.3 million, and other related exit costs of $0.9 million.
Costs yet to be incurred ($12.9 million) from the 2001 restructuring plan include the reorganization of several joint ventures and additional costs related to the consolidation of manufacturing locations, primarily costs of relocating employees and machinery and equipment. Additional cash expenditures under the plan will approximate $10.4 million. These actions are expected to be completed in 2003 and 2004.
Refer to note 2 of the notes to consolidated financial statements for further information.
Market Risk Sensitivity
The Company utilizes derivative financial instruments to enhance its ability to manage risk, including foreign exchange and interest rate exposures, which exist as part of its ongoing business operations. The Company does not enter into contracts for trading purposes, nor is it a party to any leveraged derivative instrument. The use of derivative financial instruments is monitored through regular communication with senior management and the utilization of written guidelines. The information presented below should be read in conjunction with notes 6 and 7 of the notes to consolidated financial statements.
Foreign Exchange Risk—The Company is exposed to fluctuations in foreign currency in the following main areas: cash flows related to raw material purchases; the translation of foreign currency earnings to U.S. dollars; the value of foreign currency investments in subsidiaries and unconsolidated affiliates and cash flows related to repatriation of these investments. Primary exposures include the U.S. dollar versus functional currencies of the Company's major markets (Euro, British pound sterling, Australian dollar, Canadian dollar, Mexican peso, Japanese yen, and Chinese renminbi). The Company enters into foreign currency exchange contracts to facilitate managing foreign currency risk.
The following table summarizes the foreign currency exchange contracts held at November 30, 2002. All contracts are valued in U.S. dollars using year-end 2002 exchange rates and have been designated as hedges of foreign currency transactional exposures, firm commitments or anticipated transactions, all with a maturity period of less than one year.
24
Currency Sold
| | Currency
Received
| | Notional
Value
(millions)
| | Average
Contractual
Exchange Rate
(USD/fc)
| | Fair
Value
(millions)
| |
|---|
| Foreign currency exchange contracts | | | | | | | | | | | |
| Euro | | USD | | $ | 13.4 | | .96 | | $ | (.3 | ) |
| British pound sterling | | USD | | | 6.8 | | 1.52 | | | (.1 | ) |
| Canadian dollar | | USD | | | 4.8 | | .64 | | | — | |
The Company has a number of smaller contracts with an aggregate notional value of $2.0 million to purchase or sell various other currencies, such as Australian dollar, Swiss franc, Polish zloty, and South African rand as of November 30, 2002. The aggregate fair value of these contracts was $(0.1) at November 30, 2002.
At November 30, 2001, the Company had foreign currency exchange contracts for the Euro, British pound sterling, Canadian dollar, Australian dollar, and Swiss franc with a notional value of $38.0 million, all of which matured in 2002. The fair value of these contracts was $0.6 million at November 30, 2001.
Contracts with durations which are less than 5 days and used for short-term cash flow funding within the Company are not included in the notes or table above.
During 2002, the foreign currency translation component in other comprehensive income is principally related to the impact of exchange rate fluctuations on the Company's net investments in France, the U.K., Canada, and Australia. The Company did not hedge its net investments in subsidiaries and unconsolidated affiliates in 2002, 2001, or 2000.
Interest Rate Risk—The Company's policy is to manage interest rate risk by entering into both fixed and variable rate debt. The Company also uses interest rate swaps to achieve a desired mix of its fixed and variable rate debt. The table that follows provides principal cash flows and related interest rates, excluding the effect of interest rate swaps, by fiscal year of maturity at November 30, 2002 and 2001. For foreign currency-denominated debt, the information is presented in U.S. dollar equivalents. Variable interest rates are based on the weighted-average rates of the portfolio at the end of the year presented.
Year of Maturity at November 30, 2002
| | 2003
| | 2004
| | 2005
| | 2006
| | Thereafter
| | Total
| | Fair Value
|
|---|
| | (millions)
|
|---|
| Debt | | | | | | | | | | | | | | | | | | | | | |
| Fixed rate | | $ | .6 | | $ | 16.3 | | $ | 32.3 | | $ | 196.6 | | $ | 205.6 | | $ | 451.4 | | $ | 495.6 |
| Average interest rate | | | 1.75 | % | | 7.03 | % | | 7.10 | % | | 7.42 | % | | 7.52 | % | | | | | |
| | |
| |
| |
| |
| |
| |
| |
|
| Variable rate | | $ | 136.7 | | | — | | | — | | | — | | $ | 3.1 | | $ | 139.8 | | $ | 139.8 |
| Average interest rate | | | 2.70 | % | | | | | | | | | | | 3.34 | % | | | | | |
Year of Maturity at November 30, 2001
| | 2003
| | 2004
| | 2005
| | 2006
| | Thereafter
| | Total
| | Fair Value
|
|---|
| | (millions)
|
|---|
| Debt | | | | | | | | | | | | | | | | | | | | | |
| Fixed rate | | $ | 1.0 | | $ | .5 | | $ | 16.3 | | $ | 32.3 | | $ | 401.9 | | $ | 452.0 | | $ | 464.8 |
| Average interest rate | | | 3.81 | % | | 1.41 | % | | 7.03 | % | | 7.10 | % | | 7.47 | % | | | | | |
| | |
| |
| |
| |
| |
| |
| |
|
| Variable rate | | $ | 209.8 | | | — | | | — | | | — | | $ | 3.1 | | $ | 212.9 | | $ | 212.9 |
| Average interest rate | | | 3.19 | % | | | | | | | | | | | 3.31 | % | | | | | |
| | |
| |
| |
| |
| |
| |
| |
|
Note: The variable interest rate on $75 million of commercial paper is hedged by interest rate swaps through 2011. Net interest payments will be fixed at 6.35% during this period. Interest rate swaps, settled upon the issuance of the medium-term notes, effectively fixed the interest rate on $294 million of the notes at a weighted average fixed rate of 7.62%.
25
Commodity Risk—The Company purchases certain raw materials which are subject to price volatility caused by weather and other unpredictable factors. While future movements of raw material costs are uncertain, a variety of programs, including periodic raw material purchases, purchases of raw materials for future delivery, and customer price adjustments help the Company address this risk. Generally, the Company does not use derivatives to manage the volatility related to this risk.
Contractual Obligations and Commercial Commitments
The following table reflects a summary of our contractual obligations and commercial commitments as of November 30, 2002:
Payments Due by Year
| | Total
| | 2003
| | 2004
| | 2005
| | 2006 and
thereafter
|
|---|
| | (in millions)
|
|---|
| Contractual Cash Obligations | | | | | | | | | | | | | | | |
| Notes payable | | $ | 136.7 | | $ | 136.7 | | | — | | | — | | | — |
| Long-term debt | | | 454.5 | | | .6 | | $ | 16.3 | | $ | 32.3 | | $ | 405.3 |
| Operating leases | | | 63.5 | | | 14.1 | | | 10.5 | | | 7.2 | | | 31.7 |
| Raw material purchase obligations | | | 74.4 | | | 74.4 | | | — | | | — | | | — |
| Other purchase obligations | | | 13.5 | | | 13.5 | | | — | | | — | | | — |
| | |
| |
| |
| |
| |
|
| Total contractual cash obligations | | $ | 742.6 | | $ | 239.3 | | $ | 26.8 | | $ | 39.5 | | $ | 437.0 |
| | |
| |
| |
| |
| |
|
Amount of Commitment Expiration by Year
| | Total
| | 2003
| | 2004
| | 2005
| | 2006 and
thereafter
|
|---|
| | (in millions)
|
|---|
| Commercial Commitments | | | | | | | | | | | | | | | |
| Guarantees | | $ | 18.2 | | $ | 1.5 | | $ | .5 | | $ | 15.0 | | $ | 1.2 |
| Standby letters of credit | | | 9.8 | | | 9.8 | | | — | | | — | | | — |
| Lines of credit | | | 409.7 | | | 184.7 | | | — | | | — | | | 225.0 |
| | |
| |
| |
| |
| |
|
| Total commercial commitments | | $ | 437.7 | | $ | 196.0 | | $ | .5 | | $ | 15.0 | | $ | 226.2 |
| | |
| |
| |
| |
| |
|
Off-Balance Sheet Arrangements
The Company has guaranteed 85% of the residual value of a leased distribution center and $14 million of the debt of the lessor from whom this facility is leased. The lease, which expires in 2005 and has two subsequent five-year renewal options, is treated as an operating lease. Rent expense under the lease is determined as LIBOR plus 0.375% applied to the initial cost of the facility. A third party maintains a substantial residual equity investment in the lessor, and therefore, this entity is not consolidated with the Company. The Company is reviewing the new accounting pronouncement, Financial Accounting Standards Board (FASB) Interpretation No. 46 "Consolidation of Variable Interest Entities," to determine if this arrangement will need to be consolidated with Company results in 2003.
Recently Issued Accounting Pronouncements
In November 2001, the Emerging Issues Task Force (EITF) issued EITF 01-09, "Accounting for Consideration Given by a Vendor to a Customer or a Reseller of the Vendor's Products." This required the Company to classify certain marketing expenses as a
26
reduction of sales in 2002 and to reclassify prior year amounts. Concurrent with the adoption of EITF 01-09, the Company also reclassified certain expenses from selling, general and administrative expense to cost of goods sold. The effect of these reclassifications on 2001 was a decrease in sales of $153.9 million, an increase in cost of goods sold of $20.0 million, and a decrease in selling, general and administrative expense of $173.9 million. These reclassifications decreased gross profit margin as a percentage of net sales from 40.9% to 35.9% and increased operating income as a percentage of net sales from 10.1% to 10.8% in 2001. The effect of these reclassifications on 2000 was a decrease in sales of $81.6 million, an increase in cost of goods sold of $11.7 million, and a decrease in selling, general and administrative expense of $93.3 million. These reclassifications decreased gross profit margin as a percentage of net sales from 37.9% to 34.8% and increased operating income as a percentage of net sales from 10.6% and 11.0% in 2000. These reclassifications did not impact net income.
In June 2001, the FASB issued SFAS No. 141, "Business Combinations," and SFAS No. 142, "Goodwill and Other Intangible Assets." SFAS No. 141 applies to all business combinations with a closing date after June 30, 2001. SFAS No. 141 also eliminates the pooling-of-interest method of accounting, and further clarifies the criteria for recognition of intangible assets separately from goodwill. There was no material effect upon adoption of SFAS No. 141. Refer to note 4 of notes to consolidated financial statements for the disclosure relating to the adoption of SFAS No. 142, which was adopted on December 1, 2001.
In August 2001, the FASB issued SFAS No. 144, "Accounting for the Impairment or Disposal of Long-Lived Assets." SFAS No. 144 changes the criteria that have to be met to classify an asset as held-for-sale, extends the reporting of discontinued operations to all components of an entity, and requires expected future operating losses from discontinued operations to be recorded in the period in which the losses are incurred (rather than as of the date management commits to a formal plan to dispose of a segment as previously required). The Company adopted SFAS No. 144 on December 1, 2001. There was no material effect upon adoption of this statement.
In June 2002, the FASB issued SFAS No. 146, "Accounting for Costs Associated with Exit or Disposal Activities." SFAS No. 146 generally requires companies to recognize costs associated with exit or disposal activities when they are incurred rather than at the date of a commitment to an exit or disposal plan. This pronouncement is effective for exit activities initiated after December 31, 2002, and is not expected to have a significant effect on the special charges under the Company's streamlining actions announced in 2001.
In December 2002, the FASB issued Interpretation No. 45, "Guarantor's Accounting and Disclosure Requirements for Guarantees, Including Indirect Guarantees of Indebtedness of Others." Interpretation No. 45 requires that at the time a company issues a guarantee, the company must recognize an initial liability for the fair value, or market value, of the obligations it assumes under that guarantee. This interpretation is applicable on a prospective basis to guarantees issued or modified after December 31, 2002. The Company is evaluating the impact of this Interpretation on financial results.
In January 2003, the FASB issued Interpretation No. 46, "Consolidation of Variable Interest Entities." Interpretation No. 46 requires companies with a variable interest in a variable interest entity to apply this guidance to that entity as of the beginning of the first interim period beginning after June 15, 2003 for existing interests and immediately for new interests. The application of the guidance could result in the consolidation of a variable interest entity. The only variable interest entity of the Company is the lease of a distribution center as disclosed in note 6 of notes to consolidated financial statements. The Company is evaluating the impact of this Interpretation on its financial results.
Critical Accounting Estimates and Assumptions
In preparing the financial statements in accordance with GAAP, management is required to make estimates and assumptions that have an impact on the assets, liabilities, revenue, and expense amounts reported. These estimates can also affect supplemental information disclosures by the Company, including information about contingencies, risk, and financial condition. The Company believes, given current facts and circumstances, its estimates and assumptions are reasonable, adhere to GAAP, and are consistently applied. Inherent in the nature of an estimate or assumption is the fact that actual results may differ from estimates and estimates may vary as new facts and circumstances arise. In preparing the financial statements, the Company makes routine estimates and judgments in determining the net realizable value of accounts receivable, inventory, fixed assets, and prepaid allowances. Management believes the Company's most critical accounting estimates and assumptions are in the following areas:
27
Customer Contracts
In several of its major markets, the consumer business sells its products by entering into annual or multi-year contracts with its customers. These contracts include provisions for items such as sales discounts, marketing allowances and performance incentives. The discounts, allowances, and incentives are expensed based on certain estimated criteria such as sales volume of indirect customers, customers reaching anticipated volume thresholds, and marketing spending. The Company routinely reviews these criteria, and makes adjustments as facts and circumstances change.
Goodwill Valuation
The Company reviews the carrying value of goodwill annually utilizing a discounted cash flow model. Changes in estimates of future cash flows caused by items such as unforeseen events or changes in market conditions could negatively affect the reporting unit's fair value and result in an impairment charge. The Company cannot predict the occurrence of events that might adversely affect the reported value of goodwill that totaled $499.5 million at November 30, 2002. However, the current fair values of our reporting units are significantly in excess of carrying values, and accordingly management believes that only significant changes in the cash flow assumptions would result in impairment.
Income Taxes
The Company files income tax returns and estimates income taxes in each of the taxing jurisdictions in which it operates. The Company is subject to tax audits in each of these jurisdictions, which could result in changes to the estimated taxes. The amount of these changes would vary by jurisdiction and would be recorded when known. Management has recorded valuation allowances to reduce its deferred tax assets to the amount that is more likely than not to be realized. In doing so, management has considered future taxable income and ongoing tax planning strategies in assessing the need for a valuation allowance.
Pension and Postretirement Benefits
Pension and other postretirement plans' costs require the use of assumptions for discount rates, investment returns, projected salary increases, mortality rates, and health care cost trend rates. The actuarial assumptions used in the Company's pension and postretirement benefit reporting are reviewed annually and compared with external benchmarks to ensure that they accurately account for the Company's future pension and postretirement benefit obligations. While the Company believes that the assumptions used are appropriate, differences between assumed and actual experience may affect the Company's operating results. See the preceding sections of the MD&A and notes 7 and 8 of notes to consolidated financial statements for a discussion of these assumptions and how a change in certain of these assumptions could affect the Company's earnings.
Forward-Looking Information
Certain information contained in this report includes "forward-looking statements" within the meaning of section 21(E) of the Securities and Exchange Act. The Company intends the forward-looking statements to be covered by the safe harbor provisions for forward-looking statements in this section. All statements regarding the Company's expected financial plans, future capital requirements, forecasted, demographic and economic trends relating to its industry, ability to complete acquisitions, to realize anticipated cost savings and other benefits from acquisitions, to recover acquisition-related costs, and similar matters are forward-looking statements. In some cases, these statements can be identified by the Company's use of forward-looking words such as "may," "will," "should," "anticipate," "estimate," "expect," "plan," "believe," "predict," "potential," "or "intend." The forward-looking information is based on various factors and was derived using numerous assumptions. However, these statements only reflect the Company's predictions. These statements are subject to known and unknown risks, uncertainties, and other factors that could cause the Company's actual results to differ materially from the statements. Important factors that could cause the Company's actual results to be materially different from its expectations include actions of competitors, customer relationships, market acceptance of new products, actual amounts and timing of special charge items, removal and disposal costs, final negotiations of third-party contracts, the impact of stock market conditions on its share repurchase program, fluctuations in the cost and availability of supply-chain resources, global economic conditions, including interest and currency rate fluctuations, and inflation rates. The Company undertakes no obligation to update or revise publicly any forward-looking statements, whether as a result of new information, future events or otherwise.
28
Report of Management
We are responsible for the preparation and integrity of the consolidated financial statements appearing in our Annual Report. The consolidated financial statements were prepared in conformity with accounting principles generally accepted in the United States and include amounts based on management's estimates and judgments. All other financial data in this report has been presented on a basis consistent with the information included in the financial statements.
The Company maintains a system of internal controls that is designed to provide reasonable assurance as to the fair and reliable preparation and presentation of the consolidated financial statements, as well as to safeguard assets from unauthorized use or disposition. The internal control system is supported by formal policies and procedures which are reviewed, modified and improved as changes occur in business conditions and operations. The Company's commitment to proper selection, training and development of personnel also contributes to the effectiveness of the internal control system.
The Audit Committee of the Board of Directors, which is composed solely of outside directors, meets periodically with members of management, the internal auditors and the independent auditors to review and discuss internal accounting controls and accounting and financial reporting matters. The independent auditors and internal auditors have full and free access to the Audit Committee at any time.
The independent auditors review and evaluate the internal control systems and perform such tests on those systems as they consider necessary to reach their opinion on the Company's consolidated financial statements taken as a whole. In addition, the Company's internal auditors perform audits of accounting records, review accounting systems and internal controls and recommend improvements when appropriate.
Although there are inherent limitations in the effectiveness of any system of internal controls, we believe our controls as of November 30, 2002 provide reasonable assurance that the financial statements are reliable and that our assets are reasonably safeguarded.
Robert J. Lawless
Chairman, President & Chief Executive Officer

Francis A. Contino
Executive Vice President, Chief Financial Officer & Supply Chain

Kenneth A. Kelly, Jr.
Vice President & Controller, Chief Accounting Officer
Report of Independent Auditors to the Shareholders
McCormick & Company, Incorporated
We have audited the accompanying consolidated balance sheets of McCormick & Company, Incorporated and subsidiaries as of November 30, 2002 and 2001 and the related consolidated statements of income, cash flows and shareholders' equity for each of the three years in the period ended November 30, 2002. These financial statements are the responsibility of the Company's management. Our responsibility is to express an opinion on these financial statements based on our audits.
We have conducted our audits in accordance with auditing standards generally accepted in the United States. Those standards require that we plan and perform the audit to obtain reasonable assurance about whether the financial statements are free of material misstatement. An audit includes examining, on a test basis, evidence supporting the amounts and disclosures in the financial statements. An audit also includes assessing the accounting principles used and significant estimates made by management, as well as evaluating the overall financial statement presentation. We believe that our audits provide a reasonable basis for our opinion.
In our opinion, the financial statements referred to above present fairly, in all material respects, the consolidated financial position of McCormick & Company, Incorporated and subsidiaries at November 30, 2002 and 2001 and the consolidated results of its operations and its cash flows for each of the three years in the period ended November 30, 2002 in conformity with accounting principles generally accepted in the United States.
As discussed in note 1 to the notes to the consolidated financial statements, during the year ended November 30, 2002 the Company changed its method of accounting for certain sales incentives in accordance with Emerging Issues Task Force Consensus No. 01-09, "Accounting for Consideration Given by a Vendor to a Customer or a Reseller of a Vendor's Products." Also as discussed in note 1, the Company changed the manner in which it accounts for goodwill and other intangible assets upon adoption of Statement of Financial Accounting Standard No. 142, "Goodwill and Other Intangible Assets" on December 1, 2001.

Baltimore, Maryland
January 28, 2003
29
Consolidated Statement of Income
for the year ended November 30
| | 2002
| | 2001
| | 2000
|
|---|
| | (millions except per share data)
|
|---|
| Net sales | | $ | 2,320.0 | | $ | 2,218.5 | | $ | 2,041.9 |
| Cost of goods sold | | | 1,463.4 | | | 1,421.0 | | | 1,330.4 |
| | |
| |
| |
|
| Gross profit | | | 856.6 | | | 797.5 | | | 711.5 |
| Selling, general and administrative expense | | | 570.9 | | | 546.1 | | | 485.4 |
| Special charges | | | 8.0 | | | 10.8 | | | 1.1 |
| | |
| |
| |
|
| Operating income | | | 277.7 | | | 240.6 | | | 225.0 |
| Interest expense | | | 43.6 | | | 52.3 | | | 39.7 |
| Other income, net | | | .7 | | | 2.1 | | | .7 |
| | |
| |
| |
|
| Income from consolidated operations before income taxes | | | 234.8 | | | 190.4 | | | 186.0 |
| Income taxes | | | 74.3 | | | 62.9 | | | 66.6 |
| | |
| |
| |
|
| Net income from consolidated operations | | | 160.5 | | | 127.5 | | | 119.4 |
| Income from unconsolidated operations | | | 22.4 | | | 21.5 | | | 18.6 |
| Minority interest | | | 3.1 | | | 2.4 | | | .5 |
| | |
| |
| |
|
| Net income | | $ | 179.8 | | $ | 146.6 | | $ | 137.5 |
| | |
| |
| |
|
| Earnings per common share—basic | | | | | | | | | |
| Net income | | $ | 1.29 | | $ | 1.06 | | $ | 1.00 |
| | |
| |
| |
|
| Net income excluding amortization | | $ | 1.29 | | $ | 1.15 | | $ | 1.05 |
| | |
| |
| |
|
| Earnings per common share—assuming dilution | | | | | | | | | |
| Net income | | $ | 1.26 | | $ | 1.05 | | $ | 0.99 |
| | |
| |
| |
|
| Net income excluding amortization | | $ | 1.26 | | $ | 1.13 | | $ | 1.04 |
| | |
| |
| |
|
See Notes to Consolidated Financial Statements, pages 34-43.
30
Consolidated Balance Sheet
at November 30
| | 2002
| | 2001
| |
|---|
| | (millions)
| |
|---|
| Current assets | | | | | | | |
| Cash and cash equivalents | | $ | 47.3 | | $ | 31.3 | |
| Receivables, less allowances of $7.4 for 2002 and $7.5 for 2001 | | | 341.8 | | | 295.5 | |
| Inventories | | | 306.3 | | | 278.1 | |
| Prepaid expenses and other current assets | | | 29.2 | | | 30.9 | |
| | |
| |
| |
| | Total current assets | | | 724.6 | | | 635.8 | |
| | |
| |
| |
| Property, plant and equipment, net | | | 468.3 | | | 424.5 | |
| Goodwill, net | | | 499.5 | | | 458.6 | |
| Intangible assets, net | | | 6.5 | | | 6.0 | |
| Prepaid allowances | | | 96.6 | | | 99.3 | |
| Investments and other assets | | | 135.3 | | | 147.8 | |
| | |
| |
| |
| | Total assets | | $ | 1,930.8 | | $ | 1,772.0 | |
| | |
| |
| |
| Current liabilities | | | | | | | |
| Short-term borrowings | | $ | 136.7 | | $ | 209.8 | |
| Current portion of long-term debt | | | .6 | | | 1.0 | |
| Trade accounts payable | | | 202.3 | | | 184.0 | |
| Other accrued liabilities | | | 333.8 | | | 318.9 | |
| | |
| |
| |
| | Total current liabilities | | | 673.4 | | | 713.7 | |
| | |
| |
| |
| Long-term debt | | | 453.9 | | | 454.1 | |
| Other long-term liabilities | | | 211.2 | | | 141.1 | |
| | |
| |
| |
| | Total liabilities | | | 1,338.5 | | | 1,308.9 | |
| | |
| |
| |
| Shareholders' equity | | | | | | | |
| Common stock, no par value; authorized 160.0 shares; issued and outstanding: 2002—15.6 shares, 2001—15.8 shares | | | 74.7 | | | 60.4 | |
| Common stock non-voting, no par value; authorized 160.0 shares; issued and outstanding: 2002—124.4 shares, 2001—122.7 shares | | | 156.0 | | | 142.5 | |
| Retained earnings | | | 458.9 | | | 344.1 | |
| Accumulated other comprehensive income | | | (97.3 | ) | | (83.9 | ) |
| | |
| |
| |
| | Total shareholders' equity | | | 592.3 | | | 463.1 | |
| | |
| |
| |
| | Total liabilities and shareholders' equity | | $ | 1,930.8 | | $ | 1,772.0 | |
| | |
| |
| |
See Notes to Consolidated Financial Statements, pages 34-43.
31
Consolidated Statement of Cash Flows
for the year ended November 30
| | 2002
| | 2001
| | 2000
| |
|---|
| | (millions)
| |
|---|
| Operating activities | | | | | | | | | | |
| Net income | | $ | 179.8 | | $ | 146.6 | | $ | 137.5 | |
| Adjustments to reconcile net income to net cash provided by operating activities | | | | | | | | | | |
| | Special charges | | | — | | | 11.7 | | | — | |
| | Depreciation and amortization | | | 66.8 | | | 73.0 | | | 61.3 | |
| | Deferred income taxes | | | 21.1 | | | 2.2 | | | (5.1 | ) |
| | Other | | | .4 | | | .5 | | | .5 | |
| | Income from unconsolidated operations | | | (22.4 | ) | | (21.5 | ) | | (18.6 | ) |
| | Changes in operating assets and liabilities | | | | | | | | | | |
| | | Receivables | | | (32.2 | ) | | 9.5 | | | (24.5 | ) |
| | | Inventories | | | (20.2 | ) | | (3.3 | ) | | (9.8 | ) |
| | | Prepaid allowances | | | 2.7 | | | (3.3 | ) | | 13.0 | |
| | | Trade accounts payable | | | 12.8 | | | (1.6 | ) | | (4.8 | ) |
| | | Other assets and liabilities | | | (4.2 | ) | | (27.7 | ) | | 41.8 | |
| Dividends received from unconsolidated affiliates | | | 19.1 | | | 18.4 | | | 10.7 | |
| | |
| |
| |
| |
| | Net cash provided by operating activities | | | 223.7 | | | 204.5 | | | 202.0 | |
| | |
| |
| |
| |
| Investing activities | | | | | | | | | | |
| Acquisitions of businesses | | | (1.4 | ) | | — | | | (386.6 | ) |
| Capital expenditures | | | (110.7 | ) | | (112.1 | ) | | (53.6 | ) |
| Proceeds from sale of assets | | | 6.5 | | | .7 | | | 1.6 | |
| Other | | | — | | | (.5 | ) | | (4.0 | ) |
| | |
| |
| |
| |
| | Net cash used in investing activities | | | (105.6 | ) | | (111.9 | ) | | (442.6 | ) |
| | |
| |
| |
| |
| Financing activities | | | | | | | | | | |
| Short-term borrowings, net | | | (73.8 | ) | | (263.3 | ) | | 380.2 | |
| Long-term debt borrowings | | | — | | | 297.8 | | | — | |
| Long-term debt repayments | | | (.6 | ) | | (82.1 | ) | | (10.0 | ) |
| Common stock issued | | | 28.2 | | | 29.2 | | | 9.0 | |
| Common stock acquired by purchase | | | (6.8 | ) | | (11.9 | ) | | (72.3 | ) |
| Dividends paid | | | (58.6 | ) | | (55.1 | ) | | (52.3 | ) |
| | |
| |
| |
| |
| | Net cash (used in)/provided by financing activities | | | (111.6 | ) | | (85.4 | ) | | 254.6 | |
| | |
| |
| |
| |
| Effect of exchange rate changes on cash and cash equivalents | | | 9.5 | | | .2 | | | (2.1 | ) |
| | |
| |
| |
| |
| Increase in cash and cash equivalents | | | 16.0 | | | 7.4 | | | 11.9 | |
| Cash and cash equivalents at beginning of year | | | 31.3 | | | 23.9 | | | 12.0 | |
| | |
| |
| |
| |
| Cash and cash equivalents at end of year | | $ | 47.3 | | $ | 31.3 | | $ | 23.9 | |
| | |
| |
| |
| |
See Notes to Consolidated Financial Statements, pages 34-43.
32
Consolidated Statement of Shareholders' Equity
| | Common
Stock
Shares
| | Common
Stock
Non-Voting
Shares
| | Common
Stock
Amount
| | Retained
Earnings
| | Accumulated
Other
Comprehensive
Income
| | Total
Shareholders'
Equity
| |
|---|
| | (millions except per share data)
| |
|---|
| Balance, November 30, 1999 | | 17.8 | | 123.1 | | $ | 173.8 | | $ | 242.8 | | $ | (34.2 | ) | $ | 382.4 | |
| Comprehensive income: | | | | | | | | | | | | | | | | | |
| | Net income | | | | | | | | | | 137.5 | | | | | | 137.5 | |
| | Currency translation adjustments | | | | | | | | | | | | | (40.1 | ) | | (40.1 | ) |
| | Change in realized and unrealized gains on derivative financial instruments, net of tax ($2.8 million) | | | | | | | | | | | | | (5.0 | ) | | (5.0 | ) |
| | | | | | | | | | | | | | | |
| |
| Comprehensive income | | | | | | | | | | | | | | | | 92.4 | |
| | | | | | | | | | | | | | | |
| |
| Dividends paid ($.38/share) | | | | | | | | | | (52.3 | ) | | | | | (52.3 | ) |
| Shares purchased and retired | | (1.6 | ) | (3.4 | ) | | (7.5 | ) | | (64.8 | ) | | | | | (72.3 | ) |
| Shares issued | | .6 | | .2 | | | 9.0 | | | | | | | | | 9.0 | |
| Other | | | | | | | | | | .1 | | | | | | .1 | |
| Equal exchange | | (.2 | ) | .2 | | | | | | | | | | | | — | |
| | |
| |
| |
| |
| |
| |
| |
| Balance, November 30, 2000 | | 16.6 | | 120.1 | | $ | 175.3 | | $ | 263.3 | | $ | (79.3 | ) | $ | 359.3 | |
| Comprehensive income: | | | | | | | | | | | | | | | | | |
| | Net income | | | | | | | | | | 146.6 | | | | | | 146.6 | |
| | Currency translation adjustments | | | | | | | | | | | | | 7.2 | | | 7.2 | |
| | Change in realized and unrealized gains on derivative financial instruments, net of tax ($4.8 million) | | | | | | | | | | | | | (9.9 | ) | | (9.9 | ) |
| | Net unrealized loss on pension assets | | | | | | | | | | | | | (1.9 | ) | | (1.9 | ) |
| | | | | | | | | | | | | | | |
| |
| Comprehensive income | | | | | | | | | | | | | | | | 142.0 | |
| | | | | | | | | | | | | | | |
| |
| Dividends paid ($.40/share) | | | | | | | | | | (55.1 | ) | | | | | (55.1 | ) |
| Shares purchased and retired | | (.4 | ) | (.2 | ) | | (1.6 | ) | | (10.3 | ) | | | | | (11.9 | ) |
| Shares issued | | 1.2 | | 1.2 | | | 29.2 | | | | | | | | | 29.2 | |
| Other | | | | | | | | | | (.4 | ) | | | | | (.4 | ) |
| Equal exchange | | (1.6 | ) | 1.6 | | | | | | | | | | | | — | |
| | |
| |
| |
| |
| |
| |
| |
| Balance, November 30, 2001 | | 15.8 | | 122.7 | | $ | 202.9 | | $ | 344.1 | | $ | (83.9 | ) | $ | 463.1 | |
| Comprehensive income: | | | | | | | | | | | | | | | | | |
| | Net income | | | | | | | | | | 179.8 | | | | | | 179.8 | |
| | Currency translation adjustments | | | | | | | | | | | | | 56.9 | | | 56.9 | |
| | Change in realized and unrealized gains on derivative financial instruments, net of tax ($1.0 million) | | | | | | | | | | | | | (1.5 | ) | | (1.5 | ) |
| | Minimum pension liability adjustment, net of tax ($40.1 million) | | | | | | | | | | | | | (69.1 | ) | | (69.1 | ) |
| | Net unrealized loss on pension assets, net of tax ($0.2 million) | | | | | | | | | | | | | .3 | | | .3 | |
| | | | | | | | | | | | | | | |
| |
| Comprehensive income | | | | | | | | | | | | | | | | 166.4 | |
| | | | | | | | | | | | | | | |
| |
| Dividends paid ($.42/share) | | | | | | | | | | (58.6 | ) | | | | | (58.6 | ) |
| Shares purchased and retired | | (.3 | ) | (.1 | ) | | (1.2 | ) | | (5.6 | ) | | | | | (6.8 | ) |
| Shares issued, including tax benefit ($3.3 million) | | 1.4 | | .5 | | | 29.0 | | | (.8 | ) | | | | | 28.2 | |
| Equal exchange | | (1.3 | ) | 1.3 | | | | | | | | | | | | — | |
| | |
| |
| |
| |
| |
| |
| |
| Balance, November 30, 2002 | | 15.6 | | 124.4 | | $ | 230.7 | | $ | 458.9 | | $ | (97.3 | ) | $ | 592.3 | |
| | |
| |
| |
| |
| |
| |
| |
See Notes to Consolidated Financial Statements, pages 34-43.
33
Notes to Consolidated Financial Statements
1. SUMMARY OF SIGNIFICANT ACCOUNTING POLICIES
Consolidation
The consolidated financial statements include the accounts of the Company and all majority-owned subsidiaries. Investments in unconsolidated affiliates, over which the Company exercises significant influence, but not control, are accounted for by the equity method. Accordingly, the share of net income or loss of such unconsolidated affiliates is included in consolidated net income. Significant intercompany transactions have been eliminated.
Use of Estimates
Preparation of financial statements in conformity with accounting principles generally accepted in the U.S. requires management to make estimates and assumptions that affect the amounts reported in the consolidated financial statements and accompanying notes. Actual amounts could differ from these estimates.
Cash and Cash Equivalents
All highly liquid investments purchased with an original maturity date of three months or less are classified as cash equivalents.
Inventories
Inventories are stated at the lower of cost or market. Cost is determined using standard or average costs which approximates first-in, first-out (FIFO).
Property, Plant and Equipment
Property, plant and equipment is stated at cost and depreciated over its estimated useful life using the straight-line method for financial reporting and both accelerated and straight-line methods for tax reporting.
Goodwill and Other Intangible Assets
Prior to December 1, 2001, intangible assets resulting from acquisitions were amortized using the straight-line method over periods up to 40 years. In 2002 under Statement of Financial Accounting Standard (SFAS) No. 142, goodwill and indefinite-lived intangible assets are no longer amortized, but are reviewed at least annually for impairment using the discounted cash flow method. Separable intangible assets that have finite useful lives continue to be amortized over those useful lives. An impaired separable intangible asset is written down to fair value, calculated using the discounted cash flow method.
Prepaid Allowances
Prepaid allowances arise when the Company prepays sales discounts and marketing allowances to certain customers in connection with multi-year sales contracts. These costs are capitalized and amortized against net sales over the lives of the contracts, generally ranging from three to five years. The amounts reported in the consolidated balance sheet are stated at the lower of unamortized cost or management's estimate of the net realizable value of these costs.
Revenue Recognition
Revenue is recognized when risk and title to the product transfer to the customer, which usually occurs at the time the Company ships the goods to the customer. In cases where title or risk has not transferred at the time of shipment, revenue recognition is delayed until these conditions have been met.
Shipping and Handling
Shipping and handling costs are included in the selling, general and administrative expense caption in the consolidated statement of income.
Research and Development
Research and development costs are expensed as incurred.
Advertising
Advertising costs, which include the development and production of advertising materials and the communication of this material through various forms of media, are expensed in the period the advertising first takes place. Advertising expense is recognized in the selling, general and administrative expense caption in the consolidated statement of income.
Stock-Based Employee Compensation
Stock-based compensation is accounted for by using the intrinsic value-based method in accordance with Accounting Principles Board Opinion (APB) No. 25, "Accounting for Stock Issued to Employees." Under APB No. 25, because the exercise price of the Company's employee stock options equals the market price of the underlying stock on the date of the grant, no compensation expense is recognized. As permitted, the Company has elected to adopt the disclosure only provisions of SFAS No. 123, "Accounting for Stock-Based Compensation." Refer to note 11 for further information.
Accounting and Disclosure Changes
In November 2001, the Emerging Issues Task Force (EITF) issued EITF 01-09, "Accounting for Consideration Given by a Vendor to a Customer or a Reseller of the Vendor's Products." This required the Company to classify certain marketing expenses as a reduction of sales in 2002 and reclassify prior years. Concurrent with the adoption of EITF 01-09, the Company also reclassified certain expenses from selling, general and administrative expense to cost of goods sold. The effect of these reclassifications on 2001 was a decrease in sales of $153.9 million, an increase in cost of goods sold of $20.0 million, and a decrease in selling, general and administrative expense of $173.9 million. These reclassifications decreased gross profit margin as a percentage of sales from 40.9% to 35.9% and increased operating income as a percentage of sales from 10.1% to 10.8% in 2001. The effect of these reclassifications on 2000 was a decrease in sales of $81.6 million, an increase in cost of goods sold of $11.7 million, and a decrease in selling, general and administrative expense of $93.3 million. These reclassifications decreased gross profit margin as a percentage of sales from 37.9% to 34.8% and increased operating income as a percentage of sales from 10.6% to 11.0% in 2000. These reclassifications did not impact net income.
In June 2001, the Financial Accounting Standards Board (FASB) issued SFAS No. 141, "Business Combinations," and No. 142, "Goodwill and Other Intangible Assets." SFAS No. 141 applies to all business combinations with a closing date after June 30, 2001. SFAS No. 141 also eliminates the pooling-of-interest method of accounting, and further clarifies the criteria for recognition of intangible assets separately from goodwill. There was no material effect upon adoption of SFAS No. 141. Refer to note 4 for the disclosures relating to the adoption of SFAS No.142.
In August 2001, the FASB issued SFAS No. 144, "Accounting for the Impairment or Disposal of Long-Lived Assets." SFAS No. 144 changes the criteria that have to be met to classify an asset as held-for-sale, extends
34
the reporting of discontinued operations to all components of an entity, and requires expected future operating losses from discontinued operations to be recorded in the period in which the losses are incurred (rather than as of the date management commits to a formal plan to dispose of a segment as previously required). The Company adopted SFAS No. 144 on December 1, 2001. There was no material effect upon adoption of this statement.
In June 2002, the FASB issued SFAS No. 146 "Accounting for Costs Associated with Exit or Disposal Activities." SFAS No. 146 generally requires companies to recognize costs associated with exit or disposal activities when they are incurred rather than at the date of a commitment to an exit or disposal plan. This pronouncement is effective for exit or disposal activities initiated after December 31, 2002, and is not expected to have a significant effect on the special charges under the Company's streamlining actions announced in 2001.
In December 2002, the FASB issued Interpretation No. 45, "Guarantor's Accounting and Disclosure Requirements for Guarantees, Including Indirect Guarantees of Indebtedness of Others." Interpretation No. 45 requires that at the time a company issues a guarantee, the company must recognize an initial liability for the fair value, or market value, of the obligations it assumes under that guarantee. This interpretation is applicable on a prospective basis to guarantees issued or modified after December 31, 2002. The Company is evaluating the impact of this Interpretation on financial results.
In January 2003, the FASB issued Interpretation No. 46, "Consolidation of Variable Interest Entities." Interpretation No. 46 requires companies with a variable interest in a variable interest entity to apply this guidance to that entity as of the beginning of the first interim period beginning after June 15, 2003 for existing interests and immediately for new interests. The application of the guidance could result in the consolidation of a variable interest entity. The only variable interest entity of the Company is the lease of a distribution center as disclosed in note 6. The Company is evaluating the impact of this interpretation on financial results.
Reclassifications
Certain amounts in prior years have been reclassified to conform to the 2002 presentation.
2. SPECIAL CHARGES
During the fourth quarter of 2001, the Company adopted a plan to further streamline its operations. This plan included the consolidation of several distribution and manufacturing locations, the reduction of administrative and manufacturing positions, and the reorganization of several joint ventures. The total plan will cost approximately $32.6 million ($25.6 million after tax). Total cash expenditures in connection with these costs will approximate $16.7 million, which will be funded through internally generated funds. Once fully implemented, annualized savings are expected to be approximately $8.0 million ($5.3 million after tax). These savings will be used for investment spending on initiatives such as brand support and supply chain management. The aforementioned savings and administrative expenses are expected to be included within the cost of goods sold and selling, general and administrative expense in the consolidated statement of income.
In the fourth quarter of 2001, the Company recorded charges of $11.7 million ($7.7 million after-tax) under this plan. Of this amount $10.8 million was classified as special charges and $0.9 million as cost of goods sold in the consolidated statement of income. Additional amounts under the plan were not recorded at that time since they were either incremental costs directly related to the implementation of the plan, or the plans were not sufficiently detailed to allow for accounting accrual.
The costs recorded in the fourth quarter of 2001 related to the consolidation of manufacturing in Canada, a distribution center consolidation in the U.S., a product line elimination and a realignment of our sales operations in the U.K., and a workforce reduction of 275 positions which encompasses plans in all segments and across all geographic areas. As of November 30, 2002, 190 of the 275 position reductions had been realized.
During the year ended November 30, 2002, the Company recorded an additional $8.0 million ($5.8 million after-tax) of special charges associated with the 2001 restructuring plan, which could not be accrued at that time. These charges included the write-off of an investment in an industry purchasing consortium, further costs of lease exit and relocation costs related to the workforce reduction and realignment of our consumer sales operations in the U.S., further severance and other costs related to the previously discussed workforce reduction and an additional 10 administrative and 34 production related positions, further costs related to the closure of a U.S. distribution center and further costs of the consolidation of manufacturing in Canada, that primarily resulted from the disposition of a manufacturing facility. During 2002, total cash expenditures in connection with the plan were $6.3 million. Streamlining actions accrued as of November 30, 2002 are expected to be completed in 2003.
Costs yet to be incurred ($12.9 million) from the 2001 restructuring plan include the reorganization of several joint ventures and additional costs related to the consolidation of manufacturing locations, primarily costs of relocating employees and machinery and equipment. Additional cash expenditures under the plan will approximate $10.4 million. These actions are expected to be completed in 2003 and 2004.
The major components of the special charges and the remaining accrual balance as of November 30, 2001 and 2002 follow:
| | Severance
and personnel
costs
| | Asset
write-downs
| | Other
exit costs
| | Total
| |
|---|
| | (millions)
| |
|---|
| 2001 | | | | | | | | | | | | | |
| Special charges | | $ | 6.3 | | $ | 1.6 | | $ | 3.8 | | $ | 11.7 | |
| Amounts utilized | | | (.5 | ) | | (1.6 | ) | | — | | | (2.1 | ) |
| | |
| |
| |
| |
| |
| | | $ | 5.8 | | $ | — | | $ | 3.8 | | $ | 9.6 | |
| | |
| |
| |
| |
| |
| 2002 | | | | | | | | | | | | | |
| Special charges | | $ | 3.8 | | $ | 3.3 | | $ | .9 | | $ | 8.0 | |
| Amounts utilized | | | (5.4 | ) | | (3.3 | ) | | (3.0 | ) | | (11.7 | ) |
| | |
| |
| |
| |
| |
| | | $ | 4.2 | | $ | — | | $ | 1.7 | | $ | 5.9 | |
| | |
| |
| |
| |
| |
3. ACQUISITIONS
On August 31, 2000, the Company acquired Ducros, S.A. and Sodis, S.A.S. from Eridania Beghin-Say, for 2.75 billion French francs (equivalent to $379 million). The purchase contract provides for a potential adjustment to the purchase price with interest from the date of purchase. This adjustment procedure has not been concluded; however, the potential adjustment under the contract can only decrease the purchase price. Any reduction in the purchase price would be recorded as a decrease to goodwill and any interest received would be recorded as interest income. Ducros, headquartered in France, manufactures and markets spices and herbs, and dessert
35
aid products. Key brands include Ducros, Vahiné, and Margão which are produced mainly in France. Sodis manages the racking and merchandising of Ducros products in supermarkets and hypermarkets.
The $370 million of the purchase price was financed through 6.7% commercial paper with the remainder funded by internally generated funds. The Company replaced $300 million of commercial paper with 6.4% and 6.8% medium-term notes in January 2001. The effective interest rate on the medium-term notes is 7.62% due to the amortization of the discount ($2.2 million), origination fees ($1.1 million), and interest rate swap settlement costs ($14.7 million). (See note 7) The acquisition was accounted for under the purchase method, and the results of Ducros and Sodis have been included in the Company's consolidated results from the date of acquisition.
During 2001, the purchase price allocation was finalized. The purchase price has been allocated to the assets ($193.6 million), liabilities ($157.6 million), and minority interest ($10.6 million), based upon their fair market values. Included in liabilities was $11.4 million of accruals for the reorganization of resources in the Ducros organization in Europe. Actions under this plan, which was formulated in conjunction with the acquisition, include the consolidation of sales areas and offices and the exit from certain smaller markets, and are expected to be completed in 2003.
The major components of the reorganization and the remaining accrual balance as of November 30, 2002 follow:
| | Severance
and Personnel
costs
| | Other
exit costs
| | Total
| |
|---|
| | (millions)
| |
|---|
| 2001 | | | | | | | | | | |
| Reorganization accrual | | $ | 8.9 | | $ | 2.5 | | $ | 11.4 | |
| Amounts utilized | | | (1.9 | ) | | (.1 | ) | | (2.0 | ) |
| | |
| |
| |
| |
| | | $ | 7.0 | | $ | 2.4 | | $ | 9.4 | |
| | |
| |
| |
| |
| 2002 | | | | | | | | | | |
| Amounts utilized | | $ | (5.4 | ) | $ | (1.8 | ) | $ | (7.2 | ) |
| | |
| |
| |
| |
| | | $ | 1.6 | | $ | .6 | | $ | 2.2 | |
| | |
| |
| |
| |
4. GOODWILL AND INTANGIBLE ASSETS
Effective December 1, 2001, the Company adopted SFAS No. 142, "Goodwill and Other Intangible Assets," which establishes financial accounting and reporting for acquired goodwill and other intangible assets. Under SFAS No. 142, goodwill and indefinite-lived intangible assets are no longer amortized but are reviewed at least annually for impairment. Separable intangible assets that have finite useful lives will continue to be amortized over their useful lives.
SFAS No. 142 required that goodwill be tested for impairment at the reporting unit level at adoption and at least annually thereafter, utilizing a two-step methodology. The initial step required the Company to determine the fair value of each reporting unit and compare it to the carrying value, including goodwill, of such unit. If the fair value exceeded the carrying value, no impairment loss was recognized. However, if the carrying value of the reporting unit exceeded its fair value, the goodwill of this unit might have been impaired. The amount, if any, of the impairment would then be measured in the second step.
In connection with adopting this standard as of December 1, 2001, the Company completed step one of the test for impairment utilizing a discounted cash flow model, which indicated that the fair values of the reporting units significantly exceeded their carrying values; therefore no impairment has been recognized.
In the consolidated statement of income, the Company has presented an alternative earnings per share calculation, which represents a pro-forma restatement of 2001 and 2000 as if SFAS No. 142 had been adopted at the beginning of the year and accordingly goodwill amortization had been eliminated. A reconciliation of the impact on net income, and basic and diluted earnings per share for the years ended November 30, 2002, 2001 and 2000 is set forth below:
For the year ended November 30
| | 2002
| | 2001
| | 2000
|
|---|
| | (millions except per share data)
|
|---|
| Net income | | $ | 179.8 | | $ | 146.6 | | $ | 137.5 |
| | Amortization | | | — | | | 12.1 | | | 7.1 |
| | |
| |
| |
|
| Net income excluding amortization | | $ | 179.8 | | $ | 158.7 | | $ | 144.6 |
| | |
| |
| |
|
| Earnings per common share—basic | | | | | | | | | |
| | Net income | | $ | 1.29 | | $ | 1.06 | | $ | 1.00 |
| | Amortization | | | — | | | .09 | | | .05 |
| | |
| |
| |
|
| Net income excluding amortization | | $ | 1.29 | | $ | 1.15 | | $ | 1.05 |
| | |
| |
| |
|
| Earnings per common share—assuming dilution | | | | | | | | | |
| | Net income | | $ | 1.26 | | $ | 1.05 | | $ | 0.99 |
| | Amortization | | | — | | | .08 | | | .05 |
| | |
| |
| |
|
| Net income excluding amortization | | $ | 1.26 | | $ | 1.13 | | $ | 1.04 |
| | |
| |
| |
|
The following table displays the intangible assets that continue to be subject to amortization and intangible assets not subject to amortization as of November 30, 2002 and 2001:
| | 2002
| | 2001
|
|---|
| | Gross
Carrying
Amount
| | Accumulated
Amortization
| | Gross
Carrying
Amount
| | Accumulated
Amortization
|
|---|
| | (millions)
|
|---|
| Amortized intangible assets | | $ | .4 | | $ | .1 | | $ | .2 | | $ | — |
| Unamortized intangible assets: | | | | | | | | | | | | |
| | Goodwill | | | 572.0 | | | 72.5 | | | 527.9 | | | 69.3 |
| | Other intangibles | | | 6.8 | | | .6 | | | 6.3 | | | .5 |
| | |
| |
| |
| |
|
| | | | 578.8 | | | 73.1 | | | 534.2 | | | 69.8 |
| | |
| |
| |
| |
|
| | | $ | 579.2 | | $ | 73.2 | | $ | 534.4 | | $ | 69.8 |
| | |
| |
| |
| |
|
5. INVESTMENTS
Although the Company reports its share of net income from affiliates, their financial statements are not consolidated with those of the Company. The Company's share of undistributed earnings of the affiliates was $59.5 million at November 30, 2002.
Summarized year-end information from the financial statements of these companies representing 100% of the businesses follows:
| | 2002
| | 2001
| | 2000
|
|---|
| | (millions)
|
|---|
| Net sales | | $ | 439.2 | | $ | 436.3 | | $ | 437.7 |
| Gross profit | | | 204.3 | | | 209.1 | | | 200.7 |
| Net income | | | 44.9 | | | 43.0 | | | 36.1 |
| | |
| |
| |
|
| Current assets | | $ | 165.4 | | $ | 161.0 | | $ | 177.1 |
| Noncurrent assets | | | 106.5 | | | 110.7 | | | 106.4 |
| Current liabilities | | | 83.0 | | | 83.3 | | | 92.5 |
| Noncurrent liabilities | | | 39.4 | | | 46.2 | | | 62.7 |
| | |
| |
| |
|
Royalty income from unconsolidated affiliates was $10.0 million, $9.4 million and $9.0 million for 2002, 2001, and 2000, respectively.
36
6. FINANCING ARRANGEMENTS
The Company's outstanding debt is as follows:
| | 2002
| | 2001
| |
|---|
| | (millions)
| |
|---|
| Short-term borrowings | | | | | | | |
| | Commercial paper(1) | | $ | 114.3 | | $ | 173.5 | |
| | Other | | | 22.4 | | | 36.3 | |
| | |
| |
| |
| | | $ | 136.7 | | $ | 209.8 | |
| | |
| |
| |
| Weighted-average interest rate of short-term borrowings at year end(1) | | | 2.70 | % | | 3.19 | % |
| | |
| |
| |
| Long-term debt | | | | | | | |
| | 5.78% - 7.77% medium-term notes due 2004 to 2006 | | $ | 95.0 | | $ | 95.0 | |
| | 7.63% - 8.12% medium-term notes due 2024(2) | | | 55.0 | | | 55.0 | |
| | 6.40% - 6.80% medium-term notes due 2006 to 2008(3) | | | 298.5 | | | 298.2 | |
| | Other | | | 6.0 | | | 6.9 | |
| | |
| |
| |
| | | | 454.5 | | | 455.1 | |
| Less current portion | | | .6 | | | 1.0 | |
| | |
| |
| |
| | | $ | 453.9 | | $ | 454.1 | |
| | |
| |
| |
- (1)
- The variable interest rate on $75 million of commercial paper is hedged by interest rate swaps through 2011. Net interest payments are fixed at 6.35% during this period.
- (2)
- Holders have a one-time option to require retirement of these notes in 2004.
- (3)
- Interest rate swaps, settled upon the issuance of the medium-term notes, effectively fixed the interest rate on $294 million of the notes at a weighted average fixed rate of 7.62%.
The fair value of the Company's short-term borrowings approximated the recorded value. The fair value of long-term debt including the current portion of long-term debt was $498.6 million and $467.8 million at November 30, 2002 and 2001, respectively.
Maturities of long-term debt during the years subsequent to November 30, 2003 are as follows (in millions):
| 2004 - $16.3 | | 2006 - $196.6 |
| 2005 - $32.3 | | 2007 - $0.3 |
| | | Thereafter - $208.4 |
The Company has available credit facilities with domestic and foreign banks for various purposes. The amount of unused credit facilities at November 30, 2002 was $409.7 million, of which $350.0 million supports a commercial paper borrowing arrangement. Of these unused facilities, $184.7 million expire in 2003 and $225.0 million expire in 2006. Some credit facilities in support of commercial paper issuance require a commitment fee. Annualized commitment fees at November 30, 2002 were $0.3 million.
Rental expense under operating leases was $18.1 million in 2002, $17.0 million in 2001 and $17.9 million in 2000. Future annual fixed rental payments for the years ending November 30 are as follows (in millions):
| 2003 - $14.1 | | 2006 - $5.4 |
| 2004 - $10.5 | | 2007 - $4.1 |
| 2005 - $7.2 | | Thereafter - $22.2 |
At November 30, 2002, the Company had unconditionally guaranteed $0.5 million of the debt of unconsolidated affiliates. In addition, the Company had purchase obligation guarantees of $11.0 million and other guarantees of $3.7 million. Also, the Company has guaranteed 85% of the residual value of a leased distribution center and $14.0 million of the debt of the lessor from which this facility is leased. The lease, which expires in 2005 and has two subsequent five-year renewal options, is treated as an operating lease. Rent expense under the lease is determined as LIBOR plus 0.375% applied to the initial cost of the facility. A third party maintains a substantial residual equity investment in the lessor, and therefore, this entity is not consolidated with the Company.
7. FINANCIAL INSTRUMENTS
The Company utilizes derivative financial instruments to enhance its ability to manage risk, including foreign currency and interest rate exposures, which exist as part of its ongoing business operations. The Company does not enter into contracts for trading purposes, nor is it a party to any leveraged derivative instrument. The use of derivative financial instruments is monitored through regular communication with senior management and the utilization of written guidelines.
The Company's derivatives are accounted for under the requirements of SFAS No. 133, "Accounting for Derivative Instruments and Hedging Activities." All derivatives are recognized at fair value in the consolidated balance sheet. In evaluating the fair value of financial instruments, including derivatives, the Company uses third-party market quotes or calculates an estimated fair value on a discounted cash flow basis using the rates available for instruments with the same remaining maturities.
Foreign Currency
The Company is potentially exposed to foreign currency fluctuations affecting net investments, transactions and earnings denominated in foreign currencies. The Company selectively hedges the potential effect of these foreign currency fluctuations by entering into foreign currency exchange contracts with highly-rated financial institutions.
Contracts which are designated as hedges of anticipated purchases denominated in a foreign currency (generally purchases of raw materials in U.S. dollars by operating units outside the U.S.) are considered cash flow hedges. The gains and losses on these contracts are deferred in other comprehensive income until the hedged item is recognized in income, at which time the net amount deferred in other comprehensive income is also recognized in income. Gains and losses from hedges of assets, liabilities or firm commitments are recognized through income, offsetting the change in fair value of the hedged item.
At November 30, 2002, the Company had foreign currency exchange contracts maturing within one year to purchase or sell $27.0 million of foreign currencies versus $38.0 million at November 30, 2001. The fair value of these contracts was ($0.5) million and $0.6 million at November 30, 2002 and 2001, respectively. All of these contracts were designated as hedges of anticipated purchases denominated in a foreign currency to be completed within one year or hedges of foreign currency denominated assets or liabilities. Hedge ineffectiveness was not material.
Interest Rates
The Company finances a portion of its operations through debt instruments, primarily commercial paper, notes and bank loans whose fair values are indicated in note 6. The Company utilizes interest rate swap agreements as cash flow hedges to lock in the interest rate on borrowings or anticipated borrowings and therefore achieve a desired proportion of variable versus fixed rate debt.
37
In July of 2001, the variable interest on $75 million of commercial paper was hedged by forward starting interest rate swaps for the period 2001 through 2011. Net interest payments on this commercial paper will be effectively fixed at 6.35% during the period. The unrealized gain or loss on these swaps is recorded in other comprehensive income, as the Company intends to hold these interest rate swaps until maturity. Subsequent to the starting date of these swaps, the net cash settlements are reflected in interest expense in the applicable period.
In September of 2000, the Company entered into forward starting interest rate swaps to manage the interest rate risk associated with the anticipated issuance of $294 million fixed rate medium-term notes, which were issued in January 2001. The Company settled these swaps for a cash payment of $14.7 million upon issuance of the medium-term notes. The loss on these swaps was deferred in other comprehensive income and is being amortized over the five to seven year life of the medium-term notes as a component of interest expense. Amounts reclassified from other comprehensive income to interest expense for settled interest rate swaps were $2.5 million and $2.1 million in 2002 and 2001, respectively, and are included in the net unrealized gain or loss on derivative financial instruments in the statement of other comprehensive income.
The notional amount of all open interest rate swaps was $75 million at November 30, 2002 and 2001. The fair market value of these swaps was $(11.3) and $(6.0) million at November 30, 2002 and 2001, respectively. Hedge ineffectiveness was not material.
Other Financial Instruments
The Company's other financial instruments include cash and cash equivalents, receivables and accounts payable. As of November 30, 2002 and 2001, the fair value of other financial instruments held by the Company approximated the recorded value. The fair value of short-term borrowings and long-term debt, as indicated in note 6, and derivative financial instruments, as noted above, are based on quoted market prices.
Investments, consisting principally of investments in unconsolidated affiliates, are not readily marketable. Therefore, it is not practicable to estimate their fair value. Other investments are comprised of fixed income and equity securities held on behalf of employees in certain employee benefit plans and are stated at fair value. The cost of these investments was $16.9 million and $18.5 million at November 30, 2002 and 2001, respectively.
Concentrations of Credit Risk
The Company is potentially exposed to concentrations of credit risk with trade accounts receivable, prepaid allowances and financial instruments. Because the Company has a large and diverse customer base with no single customer accounting for a significant percentage of trade accounts receivable and prepaid allowances, there was no material concentration of credit risk in these accounts at November 30, 2002. The Company evaluates the credit worthiness of the counterparties to financial instruments and considers nonperformance credit risk to be remote.
8. PENSION AND 401(k) RETIREMENT PLANS
The Company's pension expense is as follows:
| | United States
| | International
| |
|---|
| | 2002
| | 2001
| | 2000
| | 2002
| | 2001
| | 2000
| |
|---|
| | (millions)
| |
|---|
| Defined benefit plans | | | | | | | | | | | | | | | | | | | |
| | Service cost | | $ | 9.6 | | $ | 7.7 | | $ | 7.1 | | $ | 3.5 | | $ | 3.5 | | $ | 2.7 | |
| | Interest costs | | | 16.3 | | | 14.6 | | | 13.8 | | | 4.2 | | | 3.6 | | | 3.3 | |
| | Expected return on plan assets | | | (17.8 | ) | | (15.5 | ) | | (14.1 | ) | | (5.9 | ) | | (5.3 | ) | | (4.7 | ) |
| | Amortization of prior service costs | | | — | | | .1 | | | .1 | | | .1 | | | .1 | | | .1 | |
| | Amortization of transition assets | | | .2 | | | .2 | | | .2 | | | — | | | — | | | (.1 | ) |
| | Curtailment loss | | | — | | | — | | | — | | | — | | | (.4 | ) | | — | |
| | Recognized net actuarial loss (gain) | | | 3.5 | | | 1.0 | | | 1.3 | | | — | | | (.1 | ) | | — | |
| Other retirement plans | | | — | | | — | | | — | | | 1.5 | | | .9 | | | .5 | |
| | |
| |
| |
| |
| |
| |
| |
| | | $ | 11.8 | | $ | 8.1 | | $ | 8.4 | | $ | 3.4 | | $ | 2.3 | | $ | 1.8 | |
| | |
| |
| |
| |
| |
| |
| |
The Company's U.S. pension plans held 0.9 million shares, with a fair value of $21.9 million, of the Company's stock at November 30, 2002. Dividends paid on these shares in 2002 were $0.4 million.
Rollforwards of the benefit obligation, fair value of plan assets and a reconciliation of the pension plans' funded status at September 30, the measurement date, follow:
| | United States
| | International
| |
|---|
| | 2002
| | 2001
| | 2002
| | 2001
| |
|---|
| | (millions)
| |
|---|
| Change in benefit obligation | | | | | | | | | | | | | |
| | Beginning of the year | | $ | 228.8 | | $ | 186.9 | | $ | 66.8 | | $ | 59.0 | |
| | | Service cost | | | 9.6 | | | 7.7 | | | 3.5 | | | 3.5 | |
| | | Interest costs | | | 16.3 | | | 14.6 | | | 4.2 | | | 3.6 | |
| | | Employee contributions | | | — | | | — | | | 1.5 | | | 1.2 | |
| | | Plan changes and other | | | — | | | (.1 | ) | | 2.2 | | | .8 | |
| | | Curtailment | | | — | | | — | | | — | | | (.5 | ) |
| | | Actuarial loss | | | 37.5 | | | 28.5 | | | 1.5 | | | 2.0 | |
| | | Benefits paid | | | (11.8 | ) | | (8.8 | ) | | (2.2 | ) | | (2.1 | ) |
| | | Foreign currency impact | | | — | | | — | | | 5.0 | | | (.7 | ) |
| | |
| |
| |
| |
| |
| | End of the year | | $ | 280.4 | | $ | 228.8 | | $ | 82.5 | | $ | 66.8 | |
| | |
| |
| |
| |
| |
| Change in fair value of plan assets | | | | | | | | | | | | | |
| | Beginning of the year | | $ | 166.8 | | $ | 167.4 | | $ | 55.1 | | $ | 65.6 | |
| | | Actual return on plan assets | | | (15.6 | ) | | (9.6 | ) | | (6.3 | ) | | (11.4 | ) |
| | | Other | | | — | | | — | | | 2.1 | | | — | |
| | | Employer contributions | | | 20.8 | | | 16.2 | | | 2.8 | | | 2.3 | |
| | | Employee contributions | | | — | | | — | | | 1.5 | | | 1.2 | |
| | | Benefits paid | | | (10.2 | ) | | (7.2 | ) | | (2.2 | ) | | (2.1 | ) |
| | | Foreign currency impact | | | — | | | — | | | 3.7 | | | (.5 | ) |
| | |
| |
| |
| |
| |
| | End of the year | | $ | 161.8 | | $ | 166.8 | | $ | 56.7 | | $ | 55.1 | |
| | |
| |
| |
| |
| |
| Reconciliation of funded status | | | | | | | | | | | | | |
| | (Under)/over funded status | | $ | (118.6 | ) | $ | (62.0 | ) | $ | (25.8 | ) | $ | (11.7 | ) |
| | Unrecognized net actuarial loss | | | 143.7 | | | 79.9 | | | 25.9 | | | 10.8 | |
| | Unrecognized prior service cost | | | .6 | | | .7 | | | .5 | | | .5 | |
| | Unrecognized transition asset (liability) | | | — | | | .2 | | | (.2 | ) | | (.2 | ) |
| | Employer contributions | | | — | | | — | | | .4 | | | .3 | |
| | |
| |
| |
| |
| |
| | | $ | 25.7 | | $ | 18.8 | | $ | .8 | | $ | (.3 | ) |
| | |
| |
| |
| |
| |
38
Included in the United States in the preceding table is a benefit obligation of $25.8 million and $20.0 million for 2002 and 2001, respectively, related to an unfunded pension plan. The accrued liability related to this plan was $22.4 million and $12.3 million as of November 30, 2002 and 2001, respectively. The assets related to this plan are held in a Rabbi Trust and accordingly have not been included in the preceding table. These assets were $14.3 million and $17.7 million as of November 30, 2002 and 2001, respectively.
Amounts recognized in the consolidated balance sheet consist of the following:
| | United States
| | International
| |
|---|
| | 2002
| | 2001
| | 2002
| | 2001
| |
|---|
| | (millions)
| |
|---|
| Prepaid pension cost | | | — | | $ | 18.8 | | $ | 2.6 | | $ | .9 | |
| Accrued pension liability | | $ | (67.3 | ) | | — | | | (19.0 | ) | | (1.2 | ) |
| Intangible assets | | | .6 | | | — | | | .4 | | | — | |
| Deferred income taxes | | | 35.0 | | | — | | | 5.1 | | | — | |
| Accumulated other comprehensive income | | | 57.4 | | | — | | | 11.7 | | | — | |
| | |
| |
| |
| |
| |
| | | $ | 25.7 | | $ | 18.8 | | $ | .8 | | $ | (.3 | ) |
| | |
| |
| |
| |
| |
The accumulated benefit obligation for the U.S. pension plans was $229.2 million and $184.9 million as of September 30, 2002 and 2001, respectively.
As of the measurement date, the market value of the pension plan assets was below the accumulated benefit obligation, and the Company was required to record a minimum pension liability of $110.2 million ($69.1 million after-tax) as calculated under SFAS No. 87. This resulted in an increase in the pension liability of $110.2 million, a decrease in other comprehensive income of $69.1 million, an increase in deferred tax assets of $40.1 million, and an increase in intangible assets of $1.0 million.
| | United States
| | International
| |
|---|
| | 2002
| | 2001
| | 2002
| | 2001
| |
|---|
| Significant assumptions | | | | | | | | | |
| | Discount rate | | 7.0 | % | 7.25 | % | 5.5 - 6.5 | % | 5.75 - 6.5 | % |
| | Salary scale | | 4.0 | % | 4.5 | % | 3.5 - 4.0 | % | 3.5 - 4.0 | % |
| | Expected return on plan assets | | 10.0 | % | 10.0 | % | 7.0 - 8.5 | % | 8.5 | % |
As of December 1, 2002, pension expense will be calculated using a 9% expected return on plan assets.
401(k) Retirement Plan
Effective March 22, 2002, the 401(k) Retirement Plan was amended to provide that the McCormick Stock Fund investment option be designated an employee stock ownership plan (ESOP). This designation allows participants investing in McCormick stock to elect to receive, in cash, dividends that are paid on McCormick stock held in their 401(k) Retirement Plan accounts. Dividends may also continue to be reinvested.
The Company matches 100% of the participant's contribution up to the first 3% of the participant's salary, and 50% of the next 2% of a participant's salary. Company contributions charged to expense under the McCormick 401(k) Retirement Plan were $7.0 million, $6.6 million and $5.8 million in 2002, 2001 and 2000, respectively.
At the participant's election, the McCormick 401(k) Retirement Plan held 4.4 million shares, with a fair value of $105.8 million, of the Company's stock at November 30, 2002. Dividends paid on these shares in 2002 were $1.9 million.
9. OTHER POSTRETIREMENT BENEFITS
The Company's other postretirement benefit expense follows:
| | 2002
| | 2001
| | 2000
| |
|---|
| | (millions)
| |
|---|
| Other postretirement benefits | | | | | | | | | | |
| | Service cost | | $ | 3.1 | | $ | 2.6 | | $ | 2.4 | |
| | Interest cost | | | 5.7 | | | 5.5 | | | 5.3 | |
| | Amortization of prior service cost | | | (.6 | ) | | (.7 | ) | | (.7 | ) |
| | Accelerated recognition of prior unrecognized service cost | | | — | | | — | | | (.6 | ) |
| | |
| |
| |
| |
| | | $ | 8.2 | | $ | 7.4 | | $ | 6.4 | |
| | |
| |
| |
| |
Rollforwards of the benefit obligation, fair value of plan assets and a reconciliation of the plan's funded status at November 30, the measurement date, follow:
| | 2002
| | 2001
| |
|---|
| | (millions)
| |
|---|
| Change in benefit obligation | | | | | | | |
| | Beginning of the year | | $ | 81.8 | | $ | 71.3 | |
| | | Service cost | | | 3.1 | | | 2.6 | |
| | | Interest cost | | | 5.7 | | | 5.5 | |
| | | Employee contributions | | | 2.3 | | | 2.0 | |
| | | Plan changes | | | (9.1 | ) | | — | |
| | | Actuarial loss | | | 8.0 | | | 5.6 | |
| | | Benefits paid | | | (8.0 | ) | | (5.2 | ) |
| | |
| |
| |
| | End of the year | | $ | 83.8 | | $ | 81.8 | |
| | |
| |
| |
| Change in fair value of plan assets | | | | | | | |
| | Beginning of the year | | $ | — | | $ | — | |
| | | Employer contributions | | | 5.7 | | | 3.2 | |
| | | Employee contributions | | | 2.3 | | | 2.0 | |
| | | Benefits paid | | | (8.0 | ) | | (5.2 | ) |
| | |
| |
| |
| | End of the year | | $ | — | | $ | — | |
| | |
| |
| |
| Reconciliation of funded status | | | | | | | |
| | Funded status | | $ | (83.8 | ) | $ | (81.8 | ) |
| | Unrecognized net actuarial loss | | | 15.3 | | | 7.3 | |
| | Unrecognized prior service cost | | | (13.7 | ) | | (5.3 | ) |
| | |
| |
| |
| | Other postretirement benefit liability | | $ | (82.2 | ) | $ | (79.8 | ) |
| | |
| |
| |
The assumed weighted-average discount rates were 7.0% and 7.25% for 2002 and 2001, respectively.
39
The assumed annual rate of increase in the cost of covered health care benefits is 8.0% for 2002. It is assumed to decrease gradually to 4.5% in the year 2008 and remain at that level thereafter. Changing the assumed health care cost trend would have the following effect:
| | 1-Percentage-
Point Increase
| | 1-Percentage-
Point Decrease
| |
|---|
| | (millions)
| |
|---|
| Effect on benefit obligation as of November 30, 2002 | | $ | 8.1 | | $ | (6.9 | ) |
| Effect on total of service and interest cost components in 2002 | | $ | .9 | | $ | (.8 | ) |
During 2002 the Company changed certain postretirement benefits for employees who retire on or after January 1, 2004. Life insurance benefits will change to a fixed amount, Medicare eligible retirees will have a fixed amount for medical plan coverage, and the medical cost sharing for dependents will increase.
10. Income Taxes
The provision for income taxes consists of the following:
| | 2002
| | 2001
| | 2000
| |
|---|
| | (millions)
| |
|---|
| Income taxes | | | | | | | | | | |
| | Current | | | | | | | | | | |
| | | Federal | | $ | 35.2 | | $ | 43.6 | | $ | 51.4 | |
| | | State | | | 2.4 | | | 3.4 | | | 5.2 | |
| | | International | | | 15.6 | | | 13.7 | | | 15.1 | |
| | |
| |
| |
| |
| | | | 53.2 | | | 60.7 | | | 71.7 | |
| | |
| |
| |
| |
| | Deferred | | | | | | | | | | |
| | | Federal | | | 19.6 | | | 3.5 | | | (5.2 | ) |
| | | State | | | 1.9 | | | .6 | | | (.7 | ) |
| | | International | | | (.4 | ) | | (1.9 | ) | | .8 | |
| | |
| |
| |
| |
| | | | 21.1 | | | 2.2 | | | (5.1 | ) |
| | |
| |
| |
| |
| Total income taxes | | $ | 74.3 | | $ | 62.9 | | $ | 66.6 | |
| | |
| |
| |
| |
The components of income from consolidated continuing operations before income taxes follow:
| | 2002
| | 2001
| | 2000
|
|---|
| | (millions)
|
|---|
| Pretax income | | | | | | | | | |
| | United States | | $ | 161.5 | | $ | 125.6 | | $ | 133.7 |
| | International | | | 73.3 | | | 64.8 | | | 52.3 |
| | |
| |
| |
|
| | | $ | 234.8 | | $ | 190.4 | | $ | 186.0 |
| | |
| |
| |
|
A reconciliation of the U.S. federal statutory rate with the effective tax rate follows:
| | 2002
| | 2001
| | 2000
| |
|---|
| Federal statutory tax rate | | 35.0 | % | 35.0 | % | 35.0 | % |
| State income taxes, net of federal benefits | | 1.2 | | 1.3 | | 1.6 | |
| Tax effect of international operations | | (4.0 | ) | (2.3 | ) | (.4 | ) |
| Tax credits | | (1.1 | ) | (1.6 | ) | (1.8 | ) |
| Other, net | | .5 | | .6 | | 1.4 | |
| | |
| |
| |
| |
| Effective tax rate | | 31.6 | % | 33.0 | % | 35.8 | % |
| | |
| |
| |
| |
Deferred tax assets and liabilities are comprised of the following:
| | 2002
| | 2001
| |
|---|
| | (millions)
| |
|---|
| Deferred tax assets | | | | | | | |
| | Employee benefit liabilities | | $ | 58.2 | | $ | 38.4 | |
| | Accrued expenses and other reserves | | | 22.3 | | | 20.8 | |
| | Inventory | | | 6.1 | | | 6.1 | |
| | Net operating losses and tax credits | | | 10.6 | | | 12.3 | |
| | Other | | | 29.3 | | | 26.5 | |
| | Valuation allowance | | | (9.5 | ) | | (11.5 | ) |
| | |
| |
| |
| | | | 117.0 | | | 92.6 | |
| | |
| |
| |
| Deferred tax liabilities | | | | | | | |
| | Depreciation | | | 56.7 | | | 39.5 | |
| | Other | | | 30.9 | | | 45.6 | |
| | |
| |
| |
| | | | 87.6 | | | 85.1 | |
| | |
| |
| |
| Net deferred tax asset | | $ | 29.4 | | $ | 7.5 | |
| | |
| |
| |
Deferred tax assets are primarily in the U.S. The Company has a history of having taxable income in the U.S. and anticipates future taxable income to realize these assets.
At November 30, 2002, non-US subsidiaries of the Company have tax loss carryforwards of $36.0 million. Of these carryforwards, $32.9 million expire through 2012 and $3.1 million may be carried forward indefinitely. The current statutory rates in these countries range from 15% to 35%.
The 2002 net change in valuation allowance for deferred tax assets was a decrease of $2.0 million, due primarily to utilization of tax loss carryforwards.
U.S. income taxes are not provided for unremitted earnings of international subsidiaries and affiliates. The Company's intention is to reinvest these earnings permanently or to repatriate the earnings only when it is tax effective to do so. Accordingly, the Company believes that any U.S. tax on repatriated earnings would be substantially offset by U.S. foreign tax credits. Unremitted earnings of such entities were $136.9 million at November 30, 2002.
11. STOCK PURCHASE AND OPTION PLANS
Under the Company's 1997 and 2001 Stock Option Plans, the McCormick (U.K.) Share Option Scheme, and the McCormick France Share Option Plan, options to purchase shares of the Company's common stock have been or may be granted to employees. The option price for shares granted under these plans is the fair market value on the grant date. Options granted under these plans have ten-year terms.
The Company has Employee Stock Purchase Plans (ESPP) enabling employees in the U.S. and certain other countries to purchase the Company's Common Stock Non-Voting at the lower of the stock price on the grant date or the exercise date. Similarly, options were granted for certain foreign-based employees in lieu of their participation in the ESPP. Options granted under the plans have two- or three-ear terms.
40
The Company has adopted the disclosure-only provisions of SFAS No. 123, "Accounting for Stock-Based Compensation." Accordingly, no compensation expense has been recognized for the Company's stock option plans. If the Company had elected to recognize compensation based on the fair value of options granted at the grant date as prescribed by SFAS No. 123, net income and earnings per share would have been as follows:
| | 2002
| | 2001
| | 2000
|
|---|
| | (millions except per share data)
|
|---|
| Pro forma net income | | $ | 170.6 | | $ | 138.7 | | $ | 133.4 |
| Pro forma earnings per share | | | | | | | | | |
| | Assuming dilution | | | 1.20 | | | .99 | | | .96 |
| | Basic | | | 1.22 | | | 1.01 | | | .97 |
The per share weighted-average fair value of options granted during the year was $4.99, $5.06, and $3.32 in 2002, 2001 and 2000, respectively. The fair value for these options was estimated at the date of grant using a Black-Scholes option pricing model with the following range of assumptions for the Stock Option Plans, McCormick (U.K.) Share Option Scheme, McCormick France Share Option Plan, and the ESPP (including options to foreign employees):
| | 2002
| | 2001
| | 2000
| |
|---|
| Risk-free interest rates | | 4.5 | % | 5.0 | % | 5.6 | % |
| Dividend yields | | 2.0 | % | 2.0 | % | 2.0 | % |
| Expected volatility | | 21.6 | % | 26.0 | % | 24.5 | % |
| Expected lives | | 1.6-6.0 years | | 1.6-7.2 years | | 1.6-4.8 years | |
A summary of the Company's stock option activity for the years ended November 30 follows:
| | 2002
| | 2001
| | 2000
|
|---|
| | Shares
| | Weighted-
average
exercise
price
| | Shares
| | Weighted-
average
exercise
price
| | Shares
| | Weighted-
average
exercise
price
|
|---|
| | (shares in millions)
|
|---|
| Beginning of year | | 13.0 | | $ | 15.46 | | 11.0 | | $ | 13.81 | | 9.0 | | $ | 13.93 |
| Granted | | 3.8 | | $ | 21.39 | | 4.4 | | $ | 18.21 | | 3.1 | | $ | 12.83 |
| Exercised | | (1.9 | ) | $ | 13.36 | | (2.2 | ) | $ | 12.42 | | (.8 | ) | $ | 11.34 |
| Forfeited | | (.3 | ) | $ | 17.09 | | (.2 | ) | $ | 13.86 | | (.3 | ) | $ | 13.83 |
| | |
| |
| |
| |
| |
| |
|
| End of year | | 14.6 | | $ | 17.25 | | 13.0 | | $ | 15.46 | | 11.0 | | $ | 13.81 |
| | |
| |
| |
| |
| |
| |
|
| Exercisable—end of year | | 6.4 | | $ | 15.67 | | 5.2 | | $ | 14.82 | | 5.0 | | $ | 13.67 |
| | |
| |
| |
| |
| |
| |
|
A summary of the Company's stock options outstanding at November 30, 2002 follows:
| |
| | Options outstanding
| | Options exercisable
|
|---|
Range of
exercise
price
| | Shares
| | Weighted
average
remaining
life (yrs)
| | Weighted
average
exercise
price
| | Shares
| | Weighted
average
exercise
price
|
|---|
| | (shares in millions)
|
|---|
| $10.32 - $12.90 | | 2.7 | | 7.0 | | $ | 12.65 | | 1.4 | | $ | 12.59 |
| $12.90 - $15.47 | | 2.1 | | 6.2 | | $ | 14.51 | | 1.6 | | $ | 14.51 |
| $15.47 - $18.05 | | 5.4 | | 7.0 | | $ | 17.41 | | 2.8 | | $ | 17.02 |
| $18.05 - $20.63 | | .4 | | .9 | | $ | 20.00 | | .4 | | $ | 20.01 |
| $20.63 - $25.79 | | 4.0 | | 8.9 | | $ | 21.40 | | .2 | | $ | 21.51 |
| | |
| |
| |
| |
| |
|
| | | 14.6 | | 7.2 | | $ | 17.25 | | 6.4 | | $ | 15.67 |
| | |
| |
| |
| |
| |
|
Under all stock purchase and option plans, there were 13.9 million and 17.5 million shares reserved for future grants at November 30, 2002 and 2001, respectively.
12. EARNINGS PER SHARE
The reconciliation of shares outstanding used in the calculation of the required earnings per share measures, basic and assuming dilution, for the years ended November 30 follows:
| | 2002
| | 2001
| | 2000
|
|---|
| | (millions)
|
|---|
| Average shares outstanding—basic | | 139.5 | | 137.8 | | 137.6 |
Effect of dilutive securities
Stock options and ESPP | | 2.8 | | 2.4 | | 1.6 |
| | |
| |
| |
|
| Average shares outstanding—assuming dilution | | 142.3 | | 140.2 | | 139.2 |
| | |
| |
| |
|
On February 19, 2002, the Company's Board of Directors announced a two-for-one stock split of both classes of common stock, effective April 8, 2002. As a result of the stock split, the Company's shareholders received an additional common share for each share held. All per share amounts and numbers of shares outstanding in this report have been restated for the stock split for all periods presented.
13. CAPITAL STOCKS
Holders of Common Stock have full voting rights except that (1) the voting rights of persons who are deemed to own beneficially 10% or more of the outstanding shares of Common Stock are limited to 10% of the votes entitled to be cast by all holders of shares of Common Stock regardless of how many shares in excess of 10% are held by such person; (2) the Company has the right to redeem any or all shares of stock owned by such person unless such person acquires more than 90% of the outstanding shares of each class of the Company's Common Stock; and (3) at such time as such person controls more than 50% of the vote entitled to be cast by the holders of outstanding shares of Common Stock, automatically, on a share-for-share basis, all shares of Common Stock Non-Voting will convert into shares of Common Stock.
Holders of Common Stock Non-Voting will vote as a separate class on all matters on which they are entitled to vote. Holders of Common Stock Non-Voting are entitled to vote on reverse mergers and statutory share exchanges where the capital stock of the Company is converted into other securities or property, dissolution of the Company and the sale of substantially all of the assets of the Company, as well as forward mergers and consolidation of the Company.
14. COMMITMENTS AND CONTINGENCIES
The Company is a party to various pending legal proceedings and claims, tax issues and other matters arising out of the normal course of business. Although the results of pending claims and litigation cannot be predicted with certainty, in management's opinion, the final outcome of these proceedings and claims, tax issues and other matters will not have a material effect on the consolidated results of operations, financial position or cash flows of the Company.
41
15. BUSINESS SEGMENTS AND GEOGRAPHIC AREAS
Business Segments
The Company operates in three business segments: consumer, industrial and packaging. The consumer and industrial segments manufacture, market and distribute spices, seasonings, flavorings and other specialty food products throughout the world. The consumer segment sells spices, herbs, extracts, proprietary seasoning blends, sauces and marinades to the consumer food market under a variety of brands, including the McCormick brand, Ducros in continental Europe, Club House in Canada, and Schwartz in the U.K. The industrial segment sells to food processors, restaurant chains, distributors, warehouse clubs and institutional operations. The packaging segment manufactures and markets plastic packaging products for food, personal care and other industries, predominantly in the U.S. Tubes and bottles are also produced for the Company's food segments.
In each of its segments, the Company produces and sells many individual products which are similar in composition and nature. It is impractical to segregate and identify profits for each of these individual product lines.
The Company measures segment performance based on operating income excluding special charges and amortization. Although the segments are managed separately due to their distinct distribution channels and marketing strategies, manufacturing and warehousing is often integrated across the food segments to maximize cost efficiencies. Management does not segregate jointly utilized assets by individual food segment for internal reporting, evaluating performance or allocating capital. Asset-related information has been disclosed in aggregate for the food segments.
Accounting policies for measuring segment operating income and assets are substantially consistent with those described in note 1, "Summary of Significant Accounting Policies." Intersegment sales are generally accounted for at current market value or cost plus mark-up. Because of manufacturing integration for certain products within the food segments, products are not sold from one segment to another but rather inventory is transferred at cost. Corporate and eliminations includes general corporate expenses, intercompany eliminations and other charges not directly attributable to the segments. Corporate assets include cash, deferred taxes, certain investments and fixed assets.
| | Consumer
| | Industrial
| | Total
Food
| | Packaging
| | Corporate &
Eliminations
| | Total
|
|---|
| | (millions)
|
|---|
| 2002 | | | | | | | | | | | | | | | | | | |
| Net Sales | | $ | 1,094.9 | | $ | 1,054.5 | | $ | 2,149.4 | | $ | 170.6 | | $ | — | | $ | 2,320.0 |
| Intersegment sales | | | — | | | 9.5 | | | 9.5 | | | 43.7 | | | (53.2 | ) | | — |
| Operating income | | | 180.2 | | | 112.5 | | | 292.7 | | | 19.9 | | | (34.9 | ) | | 277.7 |
| Operating income excluding special charges and amortization | | | 182.9 | | | 114.3 | | | 297.2 | | | 20.3 | | | (31.8 | ) | | 285.7 |
| Income from unconsolidated operations | | | 21.2 | | | 1.2 | | | 22.4 | | | — | | | — | | | 22.4 |
| Goodwill, net | | | 458.2 | | | 40.6 | | | 498.8 | | | .7 | | | — | | | 499.5 |
| Assets | | | — | | | — | | | 1,599.0 | | | 141.1 | | | 190.7 | | | 1,930.8 |
| Capital expenditures | | | — | | | — | | | 87.1 | | | 10.0 | | | 13.6 | | | 110.7 |
| Depreciation and amortization | | | — | | | — | | | 46.9 | | | 13.3 | | | 6.6 | | | 66.8 |
| | |
| |
| |
| |
| |
| |
|
| 2001 | | | | | | | | | | | | | | | | | | |
| Net Sales | | $ | 1,043.5 | | $ | 995.0 | | $ | 2,038.5 | | $ | 180.0 | | $ | — | | $ | 2,218.5 |
| Intersegment sales | | | — | | | 9.6 | | | 9.6 | | | 41.3 | | | (50.9 | ) | | — |
| Operating income | | | 162.5 | | | 89.1 | | | 251.6 | | | 18.7 | | | (29.7 | ) | | 240.6 |
| Operating income excluding special charges and amortization | | | 179.1 | | | 96.3 | | | 275.4 | | | 19.6 | | | (29.8 | ) | | 265.2 |
| Income from unconsolidated operations | | | 19.5 | | | 2.0 | | | 21.5 | | | — | | | — | | | 21.5 |
| Goodwill, net | | | 420.0 | | | 37.9 | | | 457.9 | | | .7 | | | — | | | 458.6 |
| Assets | | | — | | | — | | | 1,451.7 | | | 141.2 | | | 179.1 | | | 1,772.0 |
| Capital expenditures | | | — | | | — | | | 87.0 | | | 15.3 | | | 9.8 | | | 112.1 |
| Depreciation and amortization | | | — | | | — | | | 58.5 | | | 12.4 | | | 2.1 | | | 73.0 |
| | |
| |
| |
| |
| |
| |
|
| 2000 | | | | | | | | | | | | | | | | | | |
| Net Sales | | $ | 914.1 | | $ | 949.4 | | $ | 1,863.5 | | $ | 178.4 | | $ | — | | $ | 2,041.9 |
| Intersegment sales | | | — | | | 9.9 | | | 9.9 | | | 39.7 | | | (49.6 | ) | | — |
| Operating income | | | 157.6 | | | 78.0 | | | 235.6 | | | 21.5 | | | (32.1 | ) | | 225.0 |
| Operating income excluding special charges and amortization | | | 163.7 | | | 79.9 | | | 243.6 | | | 21.7 | | | (32.1 | ) | | 233.2 |
| Income from unconsolidated operations | | | 16.5 | | | 2.1 | | | 18.6 | | | — | | | — | | | 18.6 |
| Goodwill, net | | | 406.8 | | | 39.2 | | | 446.0 | | | .9 | | | — | | | 446.9 |
| Assets | | | — | | | — | | | 1,400.3 | | | 137.7 | | | 121.9 | | | 1,659.9 |
| Capital expenditures | | | — | | | — | | | 36.5 | | | 11.6 | | | 5.5 | | | 53.6 |
| Depreciation and amortization | | | — | | | — | | | 47.3 | | | 11.8 | | | 2.2 | | | 61.3 |
| | |
| |
| |
| |
| |
| |
|
42
Geographic Areas
The Company has net sales and long-lived assets in the following geographic areas:
| | United
States
| | Europe
| | Other
Countries
| | Total
|
|---|
| | (millions)
|
|---|
| 2002 | | | | | | | | | | | | |
| Net sales | | $ | 1,482.8 | | $ | 538.7 | | $ | 298.5 | | $ | 2,320.0 |
| Long-lived assets(1) | | | 390.6 | | | 511.0 | | | 72.7 | | | 974.3 |
| | |
| |
| |
| |
|
| 2001 | | | | | | | | | | | | |
| Net sales | | $ | 1,427.8 | | $ | 506.5 | | $ | 284.2 | | $ | 2,218.5 |
| Long-lived assets(1) | | | 367.2 | | | 459.4 | | | 62.5 | | | 889.1 |
| | |
| |
| |
| |
|
| 2000 | | | | | | | | | | | | |
| Net sales | | $ | 1,387.1 | | $ | 369.9 | | $ | 284.9 | | $ | 2,041.9 |
| Long-lived assets(1) | | | 322.0 | | | 440.0 | | | 64.0 | | | 826.0 |
| | |
| |
| |
| |
|
- (1)
- Long-lived assets include property, plant and equipment, goodwill and intangible assets, net of accumulated depreciation and amortization, respectively.
16. SUPPLEMENTAL FINANCIAL STATEMENT DATA
| | 2002
| | 2001
| |
|---|
| | (millions)
| |
|---|
| Inventories | | | | | | | |
| | Finished products and work-in-process | | $ | 180.0 | | $ | 160.1 | |
| | Raw materials | | | 126.3 | | | 118.0 | |
| | |
| |
| |
| | | $ | 306.3 | | $ | 278.1 | |
| | |
| |
| |
| Property, plant and equipment | | | | | | | |
| | Land and improvements | | $ | 21.7 | | $ | 21.6 | |
| | Buildings | | | 216.1 | | | 207.1 | |
| | Machinery and equipment | | | 657.1 | | | 582.0 | |
| | Construction in progress | | | 77.9 | | | 76.6 | |
| | Accumulated depreciation | | | (504.5 | ) | | (462.8 | ) |
| | |
| |
| |
| | | $ | 468.3 | | $ | 424.5 | |
| | |
| |
| |
| Goodwill | | | | | | | |
| | Cost | | $ | 572.0 | | $ | 527.9 | |
| | Accumulated amortization | | | (72.5 | ) | | (69.3 | ) |
| | |
| |
| |
| | | $ | 499.5 | | $ | 458.6 | |
| | |
| |
| |
| Investments and other assets | | | | | | | |
| | Investments in affiliates | | $ | 74.8 | | $ | 70.2 | |
| | Other Investments | | | 14.3 | | | 17.7 | |
| | Other assets | | | 46.2 | | | 59.9 | |
| | |
| |
| |
| | | $ | 135.3 | | $ | 147.8 | |
| | |
| |
| |
| Other accrued liabilities | | | | | | | |
| | Payroll and employee benefits | | $ | 90.3 | | $ | 83.6 | |
| | Sales allowances | | | 100.5 | | | 90.8 | |
| | Income taxes | | | 22.3 | | | 26.0 | |
| | Other | | | 120.7 | | | 118.5 | |
| | |
| |
| |
| | | $ | 333.8 | | $ | 318.9 | |
| | |
| |
| |
| Other long-term liabilities | | | | | | | |
| | Pension | | $ | 89.9 | | $ | 12.6 | |
| | Postretirement benefits | | | 82.2 | | | 79.8 | |
| | Other | | | 39.1 | | | 48.7 | |
| | |
| |
| |
| | | $ | 211.2 | | $ | 141.1 | |
| | |
| |
| |
| | 2002
| | 2001
| | 2000
|
|---|
| | (millions)
|
|---|
| Depreciation | | $ | 66.4 | | $ | 59.6 | | $ | 54.2 |
| Shipping and handling | | | 63.3 | | | 54.1 | | | 42.6 |
| Advertising | | | 27.5 | | | 24.8 | | | 28.5 |
| Research and development | | | 31.4 | | | 27.1 | | | 24.9 |
| Interest paid | | | 43.1 | | | 48.5 | | | 39.7 |
| Income taxes paid | | | 57.9 | | | 46.9 | | | 69.8 |
| Interest capitalized | | | 3.3 | | | 1.3 | | | — |
| | 2002
| | 2001
| |
|---|
| | (millions)
| |
|---|
| Accumulated other comprehensive income, net of tax where applicable | | | | | | | |
| | Foreign currency translation adjustment | | $ | (12.8 | ) | $ | (69.7 | ) |
| | Fair value of open interest rate swaps | | | (7.1 | ) | | (4.0 | ) |
| | Unamortized value of settled interest rate swaps | | | (6.3 | ) | | (8.5 | ) |
| | Net unrealized loss on pension assets | | | (1.6 | ) | | (1.9 | ) |
| | Minimum pension liability adjustment | | | (69.1 | ) | | — | |
| | Unrealized (loss)/gain on foreign currency exchange contracts | | | (.4 | ) | | .2 | |
| | |
| |
| |
| | | $ | (97.3 | ) | $ | (83.9 | ) |
| | |
| |
| |
17. SELECTED QUARTERLY DATA (UNAUDITED)
| | First
| | Second
| | Third
| | Fourth
|
|---|
| | (millions except per share data)
|
|---|
| 2002 | | | | | | | | | | | | |
| Net sales | | $ | 518.9 | | $ | 552.6 | | $ | 545.0 | | $ | 703.5 |
| Gross profit | | | 185.3 | | | 192.7 | | | 189.9 | | | 288.7 |
| Operating income | | | 52.1 | | | 55.5 | | | 57.2 | | | 112.9 |
| Net income | | | 33.8 | | | 33.6 | | | 35.2 | | | 77.2 |
| Earnings per share | | | | | | | | | | | | |
| | Basic | | | .24 | | | .24 | | | .25 | | | .55 |
| | Assuming dilution | | | .24 | | | .24 | | | .25 | | | .54 |
| Dividends paid per share | | | .105 | | | .105 | | | .105 | | | .105 |
| Market price | | | | | | | | | | | | |
| | High | | | 24.53 | | | 26.93 | | | 26.70 | | | 24.50 |
| | Low | | | 20.36 | | | 23.21 | | | 21.15 | | | 21.30 |
| | |
| |
| |
| |
|
| 2001 | | | | | | | | | | | | |
| Net sales | | $ | 499.4 | | $ | 531.2 | | $ | 535.9 | | $ | 652.0 |
| Gross profit | | | 169.6 | | | 180.7 | | | 189.1 | | | 258.1 |
| Operating income | | | 44.9 | | | 49.6 | | | 56.4 | | | 89.7 |
| Net Income | | | 31.6 | | | 26.6 | | | 34.3 | | | 54.1 |
| Earnings per share | | | | | | | | | | | | |
| | Basic | | | .19 | | | .19 | | | .25 | | | .43 |
| | Assuming dilution | | | .19 | | | .19 | | | .24 | | | .42 |
| Earnings per share | | | | | | | | | | | | |
| | Basic—excluding amortization | | | .22 | | | .22 | | | .27 | | | .45 |
| | Assuming dilution—excluding amortization | | | .21 | | | .21 | | | .27 | | | .44 |
| Dividends paid per share | | | .10 | | | .10 | | | .10 | | | .10 |
| Market price | | | | | | | | | | | | |
| | High | | | 20.11 | | | 21.47 | | | 22.84 | | | 23.27 |
| | Low | | | 17.00 | | | 18.25 | | | 19.50 | | | 19.65 |
| | |
| |
| |
| |
|
43
Historical Financial Summary
| | 2002(10)
| | 2001
| | 2000
| | 1999
| | 1998
| | 1997
| | 1996
| | 1995
| | 1994
| | 1993
| | 1992
| |
|---|
| | (millions except per share data)
| |
|---|
| For the year | | | | | | | | | | | | | | | | | | | | | | | | | | | | | | | | | | |
| Net Sales under EITF 01-09(9) | | $ | 2,320.0 | | $ | 2,218.5 | | $ | 2,041.9 | | | — | | | — | | | — | | | — | | | — | | | — | | | — | | | — | |
| Net Sales previously reported(9) | | | — | | | 2,372.3 | | | 2,123.5 | | $ | 2,006.9 | | $ | 1,881.1 | | $ | 1,801.0 | | $ | 1,732.5 | | $ | 1,691.1 | | $ | 1,529.4 | | $ | 1,400.9 | | $ | 1,323.9 | |
| | Percent increase | | | 4.6 | % | | 11.7 | % | | 5.8 | % | | 6.7 | % | | 4.4 | % | | 4.0 | % | | 2.4 | % | | 10.6 | % | | 9.2 | % | | 5.8 | % | | 3.7 | % |
| Operating income | | | 277.7 | | | 240.6 | | | 225.0 | | | 170.1 | | | 182.1 | | | 170.5 | | | 92.6 | | | 171.7 | | | 86.7 | | | 143.2 | | | 122.9 | |
| Income from unconsolidated operations | | | 22.4 | | | 21.5 | | | 18.6 | | | 13.4 | | | 6.2 | | | 7.7 | | | 5.6 | | | 2.1 | | | 7.9 | | | 10.3 | | | 9.9 | |
| Net income—continuing operations | | | 179.8 | | | 146.6 | | | 137.5 | | | 98.5 | | | 103.8 | | | 97.4 | | | 43.5 | | | 86.8 | | | 42.5 | | | 82.9 | | | 73.6 | |
| Net income(1)(3)(6) | | | 179.8 | | | 146.6 | | | 137.5 | | | 103.3 | | | 103.8 | | | 98.4 | | | 41.9 | | | 97.5 | | | 61.2 | | | 73.1 | | | 95.2 | |
| | |
| |
| |
| |
| |
| |
| |
| |
| |
| |
| |
| |
| Per common share(2) | | | | | | | | | | | | | | | | | | | | | | | | | | | | | | | | | | |
| Earnings per share—assuming dilution | | | | | | | | | | | | | | | | | | | | | | | | | | | | | | | | | | |
| | Continuing operations | | $ | 1.26 | | $ | 1.05 | | $ | .99 | | $ | .68 | | $ | .71 | | $ | .64 | | $ | .27 | | $ | .53 | | $ | .26 | | $ | .51 | | $ | .45 | |
| | Discontinued operations(1) | | | — | | | — | | | — | | | — | | | — | | | .01 | | | .04 | | | .07 | | | .12 | | | .11 | | | .13 | |
| | Extraordinary item | | | — | | | — | | | — | | | — | | | — | | | — | | | (.05 | ) | | — | | | — | | | — | | | — | |
| | Accounting change(3)(6) | | | — | | | — | | | — | | | .04 | | | — | | | — | | | — | | | — | | | — | | | (.17 | ) | | — | |
| | Net earnings | | | 1.26 | | | 1.05 | | | .99 | | | .72 | | | .71 | | | .65 | | | .26 | | | .60 | | | .38 | | | .45 | | | .58 | |
| Earnings per share—basic(1)(3)(6) | | | 1.29 | | | 1.06 | | | 1.00 | | | .73 | | | .71 | | | .65 | | | .26 | | | .60 | | | .38 | | | .45 | | | .60 | |
| Common dividends declared(4) | | | .425 | | | .405 | | | .385 | | | .350 | | | .325 | | | .305 | | | .285 | | | .265 | | | .245 | | | .225 | | | .200 | |
| Market closing price—end of year | | | 23.79 | | | 21.50 | | | 18.63 | | | 16.03 | | | 16.69 | | | 13.25 | | | 12.32 | | | 11.82 | | | 9.50 | | | 11.63 | | | 14.25 | |
| Book value per share | | | 4.23 | | | 3.36 | | | 2.63 | | | 2.72 | | | 2.68 | | | 2.66 | | | 2.88 | | | 3.20 | | | 3.02 | | | 2.85 | | | 2.73 | |
| | |
| |
| |
| |
| |
| |
| |
| |
| |
| |
| |
| |
| At Year-End | | | | | | | | | | | | | | | | | | | | | | | | | | | | | | | | | | |
| Total assets | | $ | 1,930.8 | | $ | 1,772.0 | | $ | 1,659.9 | | $ | 1,188.8 | | $ | 1,259.1 | | $ | 1,256.2 | | $ | 1,326.6 | | $ | 1,614.3 | | $ | 1,555.7 | | $ | 1,313.2 | | $ | 1,130.9 | |
| Current debt | | | 137.3 | | | 210.8 | | | 551.9 | | | 100.6 | | | 163.6 | | | 121.3 | | | 108.9 | | | 297.3 | | | 214.0 | | | 84.7 | | | 122.6 | |
| Long-term debt | | | 453.9 | | | 454.1 | | | 160.2 | | | 241.4 | | | 250.4 | | | 276.5 | | | 291.2 | | | 349.1 | | | 374.3 | | | 346.4 | | | 201.0 | |
| Shareholders' equity | | | 592.3 | | | 463.1 | | | 359.3 | | | 382.4 | | | 388.1 | | | 393.1 | | | 450.0 | | | 519.3 | | | 490.0 | | | 466.8 | | | 437.9 | |
| Total capital(8) | | | 1,202.4 | | | 1,141.0 | | | 1,082.8 | | | 724.4 | | | 802.1 | | | 790.9 | | | 850.1 | | | 1,165.7 | | | 1,078.3 | | | 897.9 | | | 761.5 | |
| | |
| |
| |
| |
| |
| |
| |
| |
| |
| |
| |
| |
| Statistics & Ratios | | | | | | | | | | | | | | | | | | | | | | | | | | | | | | | | | | |
| Percentage of net sales | | | | | | | | | | | | | | | | | | | | | | | | | | | | | | | | | | |
| | Gross profit margin under EITF 01-09(9) | | | 36.9 | % | | 35.9 | % | | 34.8 | % | | — | | | — | | | — | | | — | | | — | | | — | | | — | | | — | |
| | Gross profit margin previously reported(9) | | | — | | | 40.9 | % | | 37.9 | % | | 35.7 | % | | 34.5 | % | | 34.9 | % | | 34.9 | % | | 34.5 | % | | 36.5 | % | | 38.5 | % | | 38.9 | % |
| | Operating income under EITF 01-09(9) | | | 12.0 | % | | 10.8 | % | | 11.0 | % | | — | | | — | | | — | | | — | | | — | | | — | | | — | | | — | |
| | Operating income previously reported(9) | | | — | | | 10.1 | % | | 10.6 | % | | 8.5 | % | | 9.7 | % | | 9.5 | % | | 5.3 | % | | 10.2 | % | | 5.7 | % | | 10.2 | % | | 9.3 | % |
| | Net income—continuing operations | | | 7.8 | % | | 6.6 | % | | 6.7 | % | | 4.9 | % | | 5.5 | % | | 5.4 | % | | 2.5 | % | | 5.1 | % | | 2.8 | % | | 5.9 | % | | 5.6 | % |
| Effective tax rate | | | 31.6 | % | | 33.0 | % | | 35.8 | % | | 40.2 | % | | 36.0 | % | | 37.0 | % | | 38.7 | % | | 36.1 | % | | 40.5 | % | | 41.4 | % | | 39.4 | % |
| Depreciation and amortization | | $ | 66.8 | | $ | 73.0 | | $ | 61.3 | | $ | 57.4 | | $ | 54.8 | | $ | 49.3 | | $ | 63.8 | | $ | 63.7 | | $ | 62.5 | | $ | 50.5 | | $ | 43.8 | |
| Capital expenditures | | $ | 110.7 | | $ | 112.1 | | $ | 53.6 | | $ | 49.3 | | $ | 54.8 | | $ | 43.9 | | $ | 74.7 | | $ | 82.1 | | $ | 87.7 | | $ | 76.1 | | $ | 79.3 | |
Economic Value Added (EVA)(7) |
|
$ |
89.6 |
|
$ |
78.7 |
|
$ |
68.2 |
|
$ |
42.3 |
|
$ |
33.1 |
|
$ |
23.4 |
|
$ |
(44.6 |
) |
|
— |
|
|
— |
|
|
— |
|
|
— |
|
| Return on equity | | | 32.7 | % | | 35.7 | % | | 39.4 | % | | 28.4 | % | | 27.7 | % | | 25.2 | % | | 8.6 | % | | 20.3 | % | | 12.8 | % | | 17.0 | % | | 23.3 | % |
| Return on invested capital(7) | | | 15.7 | % | | 15.4 | % | | 17.3 | % | | 15.1 | % | | 14.8 | % | | 14.2 | % | | 7.4 | % | | — | | | — | | | — | | | — | |
| Debt-to-total-capital | | | 49.2 | % | | 58.3 | % | | 65.8 | % | | 47.2 | % | | 51.6 | % | | 50.3 | % | | 47.1 | % | | 55.5 | % | | 54.6 | % | | 48.0 | % | | 42.5 | % |
| Dividend payout ratio(5) | | | 32.2 | % | | 36.3 | % | | 38.3 | % | | 40.2 | % | | 44.9 | % | | 45.8 | % | | 54.4 | % | | 44.9 | % | | 36.1 | % | | 36.1 | % | | 32.8 | % |
| Average shares outstanding | | | | | | | | | | | | | | | | | | | | | | | | | | | | | | | | | | |
| | Basic | | | 139.5 | | | 137.8 | | | 137.6 | | | 142.8 | | | 146.6 | | | 151.4 | | | 161.2 | | | 162.4 | | | 162.4 | | | 161.6 | | | 160.2 | |
| | Assuming dilution | | | 142.3 | | | 140.2 | | | 139.2 | | | 144.0 | | | 147.6 | | | 151.8 | | | 161.4 | | | 162.6 | | | 163.2 | | | 163.6 | | | 163.8 | |
- (1)
- The Company disposed of both Gilroy Foods, Incorporated and Gilroy Energy Company, Inc. in 1996.
- (2)
- All share data adjusted for 2-for-1 stock split effective April 2002.
- (3)
- In 1993, the Company adopted SFAS No. 106, "Employers' Accounting for Postretirement Benefits Other than Pensions."
- (4)
- Includes fourth quarter dividends which, in some years, were declared in December following the close of each fiscal year.
- (5)
- Does not include gains or losses on sales of discontinued operations, cumulative effects of accounting changes, special charges (credits) and extraordinary items.
- (6)
- In 1999, the Company changed its actuarial method for computing pension expense. The accounting change resulted in a $4.8 million after-tax adjustment.
- (7)
- The Company began calculating EVA and ROIC in 1996.
- (8)
- Total capital includes interest bearing debt, minority interest and shareholders' equity.
- (9)
- In 2002, the Company implemented EITF 01-09. Results have been reclassified for 2001 and 2000.
- (10)
- In 2002, the Company adopted SFAS No. 142, "Goodwill and Other Intangible Assets." Prior year results have not been adjusted.
44
Investor Information
World Headquarters
McCormick & Company, Incorporated
18 Loveton Circle
Sparks, MD 21152-6000
U.S.A.
(410) 771-7301
www.mccormick.com
Stock Information
New York Stock Exchange
Symbol: MKC

Anticipated Dividend Dates—2003
Record Date
| | Payment Date
|
|---|
| 04/07/03 | | 04/18/03 |
| 07/07/03 | | 07/18/03 |
| 10/03/03 | | 10/17/03 |
| 12/31/03 | | 01/21/04 |
McCormick has paid dividends for 78 consecutive years.
Independent Auditors
Ernst & Young LLP
Assurance and Advisory Business Services
One North Charles St.
Baltimore, MD 21201
Investor Inquiries
To obtainwithout cost a copy of the annual report filed with the Securities & Exchange Commission (SEC) on Form 10-K, contact Investor Relations at the Corporate address or website.
For general questions about McCormick or information in the annual or quarterly reports, contact Investor Relations at the Corporate address, website or telephone:
Our websitewww.mccormick.com has our annual reports, SEC filings, press releases, webcasts and other useful Company information.
Shareholder Inquiries
For questions on your account, statements, dividend payments, reinvestment and direct deposit, address changes, lost certificates, stock transfers, ownership changes or other administrative matters, contact our transfer agent.
Transfer Agent and Registrar
Wells Fargo Bank Minnesota, N.A.
Shareowner Services
161 North Concord Exchange Street,
South St. Paul, MN 55075-1139
(877) 778-6784, or (651) 450-4064
www.wellsfargo.com/shareownerservices
Account access via the Internet atwww.shareowneronline.com
Investor Services Plan (Dividend Reinvestment and Direct Purchase Plan)
The Company offers an Investor Services Plan which provides shareholders of record the opportunity to automatically reinvest dividends, make optional cash purchases of stock through the Company, place stock certificates into safekeeping and sell shares through the Plan. Individuals who are not current shareholders may purchase their initial shares directly through the Plan. All transactions are subject to limitations set forth in the Plan prospectus, which may be obtained by contacting Wells Fargo Shareowner Services at:
(877) 778-6784 or (651) 450-4064
www.wellsfargo.com/shareownerservices
Stock Price History
3 months ended
| | High
| | Low
| | Close
|
|---|
| 11/30/02 | | $ | 24.50 | | $ | 21.30 | | $ | 23.79 |
| 08/31/02 | | | 26.70 | | | 21.15 | | | 23.15 |
| 05/31/02 | | | 26.93 | | | 23.21 | | | 26.26 |
| 02/28/02 | | | 24.53 | | | 20.36 | | | 24.50 |
Annual Meeting
The annual meeting of shareholders will be held at 10 a.m., Wednesday, March 26, 2003, at Marriott's Hunt Valley Inn, 245 Shawan Road (Exit 20A of I-83 north of Baltimore), Hunt Valley, Maryland 21031.
Online Receipt of Annual Report and Proxy Statement
If you are a registered shareholder and would like to access next year's proxy statement and annual report over the Internet, go towww.econsent.com/mkcv to enroll for this service.
Trademarks
Use of ® orTM in this annual report indicates trademarks owned or used by McCormick & Company, Incorporated and its subsidiaries and affiliates.
This report is printed on recyclable paper.
Adler Design Group designed this year's report
45

 | | McCORMICK & COMPANY, INCORPORATED
18 LOVETON CIRCLE
SPARKS, MARYLAND 21152-6000 U.S.A.
410-771-7301 |
QuickLinks
Financial HighlightsLetter to ShareholdersMcCormick at a GlanceRecipe for Higher Margins2002 Net SalesRecipe for InnovationRecipe for GrowthMcCormick WorldwideBoard of DirectorsRecipe for Community ServiceManagement's Discussion and AnalysisYear of Maturity at November 30, 2002Year of Maturity at November 30, 2001Payments Due by YearAmount of Commitment Expiration by YearReport of ManagementReport of Independent Auditors to the ShareholdersConsolidated Statement of IncomeConsolidated Balance SheetConsolidated Statement of Cash FlowsConsolidated Statement of Shareholders' EquityNotes to Consolidated Financial StatementsInvestor Information