Exhibit (c)(iii)
| Valuation Key Considerations WoodRock used several valuation methodologies to derive a fair value range for the Transaction: (1) Historical Trading Price Approach; (2) Comparable Company Approach; (3) Comparable Precedent Transaction Approach; (4) Discounted Cash Flow Approach; (5) Allocation of Cost Savings Approach; (6) Disposition/Liquidation Approach Several of these methodologies are less useful in valuing the Company at this time, due to the current market conditions and the Company's current financial condition: most notably the discounted cash flow and liquidation approaches. For publicly traded shares, the current price and trading range for a company's shares are typically considered the best proxy for valuing a minority interest position. Recent mean reversion of the common stock price, to ranges that coincide with estimated orderly disposition values, lends incremental credence to using the recent trading range as a valid starting point for the Cash Out Price. Historic trends show that most similar transactions involve some premium to market at the time a decision is made by the Board of Directors. There is a great deal of variability around this premium, but a significant number of recent transactions have paid a premium of 15% - 30% to the trailing 120 day average close. The Transaction is anticipated to generate immediate additional value for the company through reduced compliance costs. WoodRock also contemplated using the equitable sharing of these savings across all shareholders, both those that will retain shares of MAXXAM and those that will have all of their shares repurchased via the Transaction. Based on this analysis, WoodRock is of the opinion that ranges of $8.65 to $11.44 for the common and $9.40 to $12.19 for the preferred represent fair ranges for each respective Cash Out Price. MAXXAM Inc. ~ Presentation to the Board of Directors |
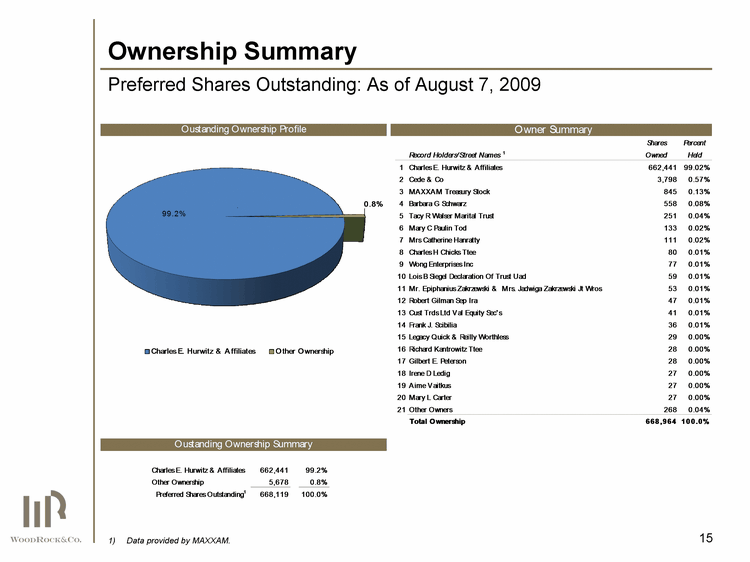
| Ownership Summary Preferred Shares Outstanding: As of August 7, 2009 Data provided by MAXXAM. 15 |
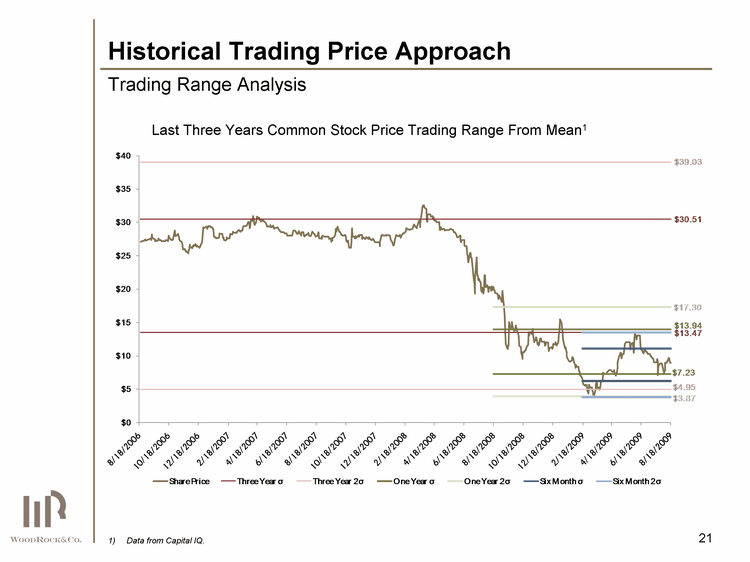
| Trading Range Analysis Last Three Years Common Stock Price Trading Range From Mean1 Data from Capital IQ. Historical Trading Price Approach 21 |
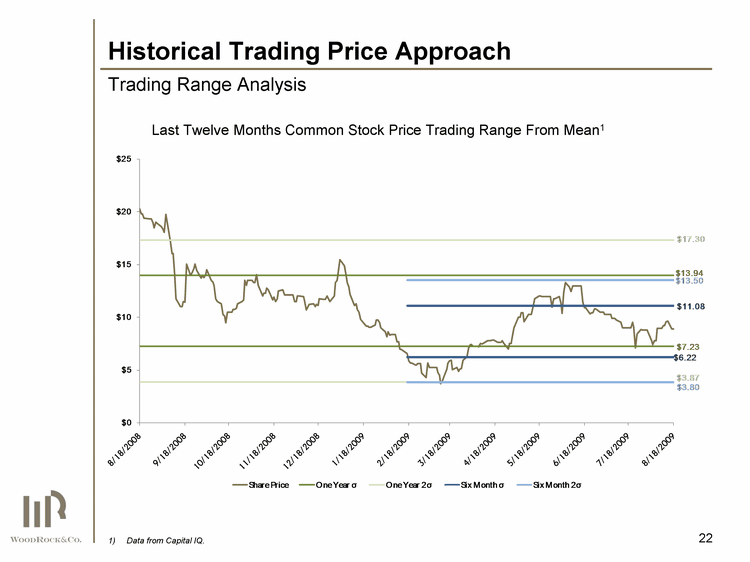
| Trading Range Analysis Data from Capital IQ. Historical Trading Price Approach Last Twelve Months Common Stock Price Trading Range From Mean1 22 |
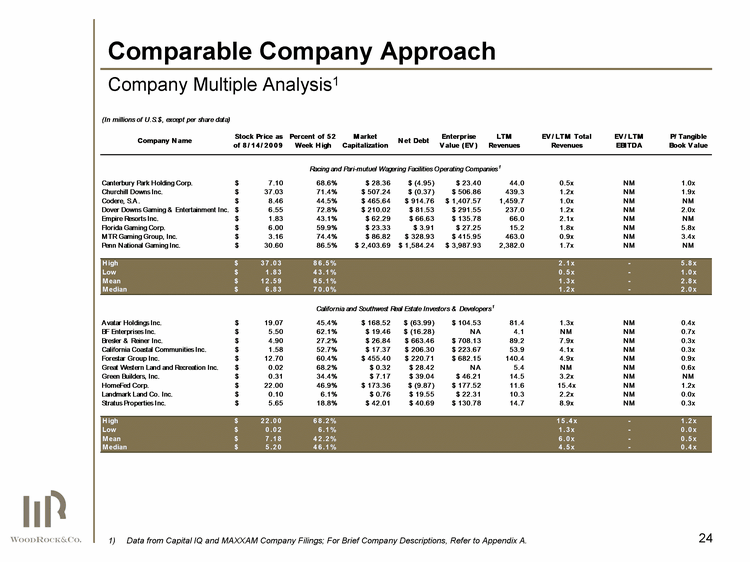
| Data from Capital IQ and MAXXAM Company Filings; For Brief Company Descriptions, Refer to Appendix A. Company Multiple Analysis1 Comparable Company Approach 24 |
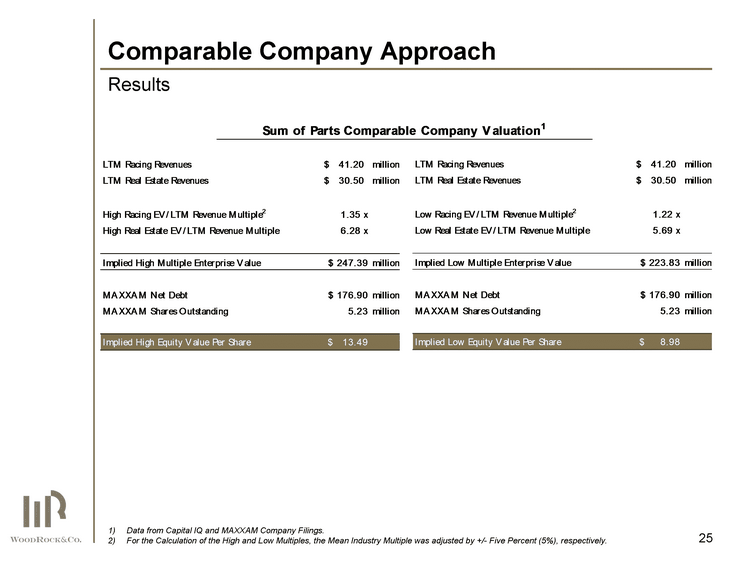
| Data from Capital IQ and MAXXAM Company Filings. For the Calculation of the High and Low Multiples, the Mean Industry Multiple was adjusted by +/- Five Percent (5%), respectively. Results Comparable Company Approach 25 |
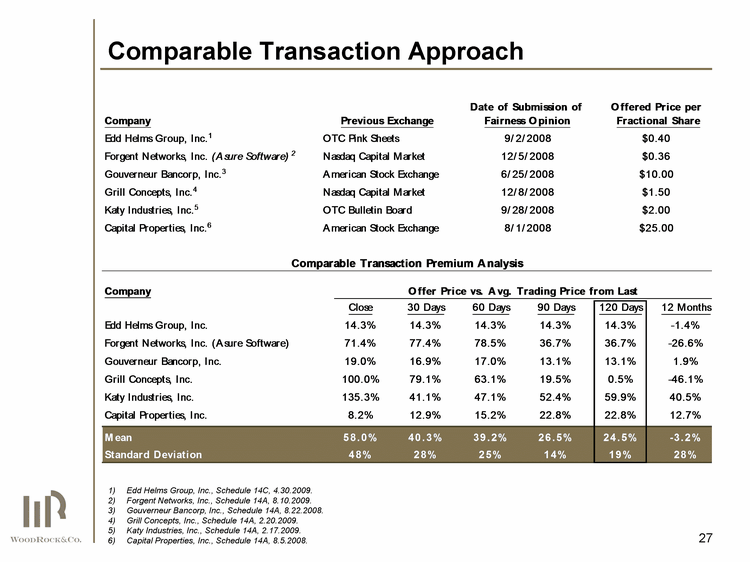
| Comparable Transaction Approach Edd Helms Group, Inc., Schedule 14C, 4.30.2009. Forgent Networks, Inc., Schedule 14A, 8.10.2009. Gouverneur Bancorp, Inc., Schedule 14A, 8.22.2008. Grill Concepts, Inc., Schedule 14A, 2.20.2009. Katy Industries, Inc., Schedule 14A, 2.17.2009. Capital Properties, Inc., Schedule 14A, 8.5.2008. 27 |
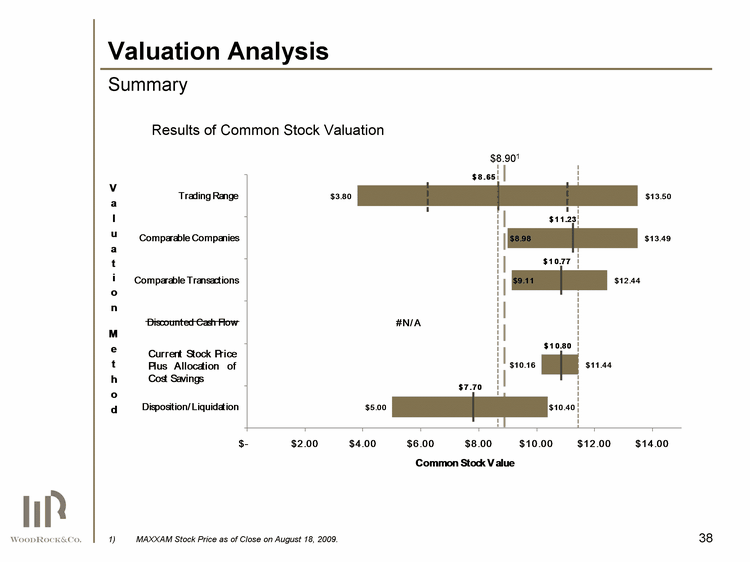
| Valuation Analysis Summary Results of Common Stock Valuation MAXXAM Stock Price as of Close on August 18, 2009. $8.901 38 |