| | | | | |
|
55 Water Street New York, NY 10041 www.spglobal.com
Press Release For Immediate Release |
S&P Global Reports Fourth Quarter and Full-Year 2023 Results
New York, NY, February 8, 2024 – S&P Global (NYSE: SPGI) today reported fourth quarter and full-year 2023 results. This earnings release and supplemental materials are available at http://investor.spglobal.com/Quarterly-Earnings.
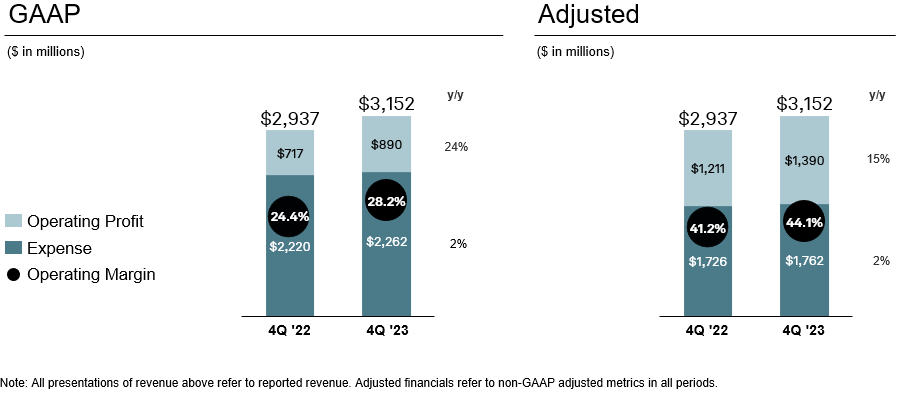
The Company reported fourth quarter 2023 reported revenue of $3.152 billion, an increase of 7% compared to the fourth quarter of 2022. Fourth quarter GAAP net income increased 34% to $579 million and GAAP diluted earnings per share increased 38% to $1.83 driven primarily by strong Ratings growth and lower merger-related costs. Excluding the impact of Engineering Solutions (ES), revenue growth would have been 11% year over year. Adjusted net income for the fourth quarter increased 19% to $988 million and adjusted diluted earnings per share increased 23% to $3.13.
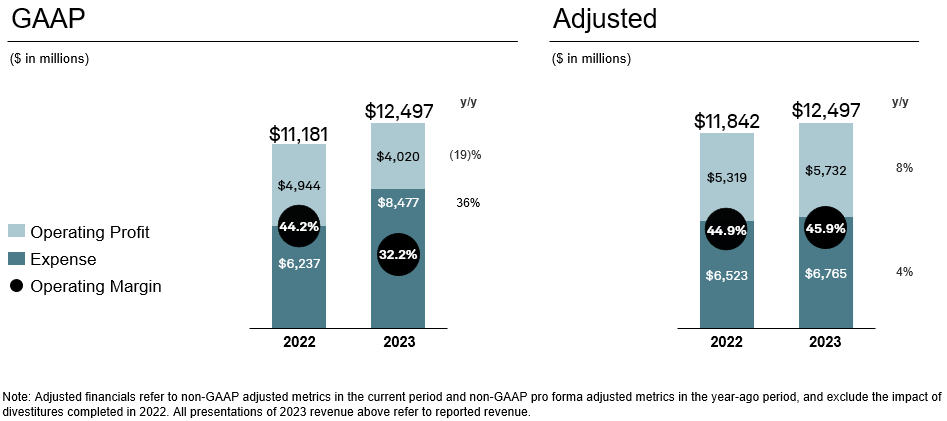
For the full year 2023, reported revenue increased 12% year over year to $12.497 billion. 2023 GAAP net income decreased 19% to $2.626 billion and GAAP diluted earnings per share decreased 19% to $8.23, driven primarily by a gain on sale of assets in 2022 and restructuring costs in 2023. Revenue in 2023 increased 6% compared to 2022 non-GAAP pro forma adjusted revenue. 2023 adjusted net income increased 7% to $4.019 billion compared to 2022 non-GAAP pro forma adjusted net income, and non-GAAP adjusted diluted earnings per share increased 13% to $12.60 compared to 2022 non-GAAP pro forma adjusted diluted earnings per share.
In addition, the Company has also announced the appointment of Chief Accounting Officer, Christopher Craig, as interim Chief Financial Officer.
| | | | | |
•The Company exceeded its targets for cost synergies, exiting 2023 at a run-rate of $619 million, and remains ahead of schedule for revenue synergies, exiting 2023 at a run-rate of $152 million.
•Vitality revenue, which is revenue from new or enhanced products, increased 19% in the fourth quarter and 18% in 2023, accounting for 11% of full-year revenue.
•The Company returned $4.4 billion to shareholders in 2023, including $1.1 billion in dividends and $3.3 billion in share repurchases.
•Initial 2024 guidance calls for revenue growth of 5.5% to 7.5%, GAAP diluted EPS in the range of $10.70 to $10.95, and adjusted diluted EPS in the range of $13.75 to $14.00. | “We made tremendous progress in 2023 towards our growth and innovation goals and are well positioned to continue driving profitable growth in 2024 and beyond.
In addition to delivering revenue growth at the high end of our guidance range, we accelerated our pace of innovation and delivered against key strategic initiatives in AI, Private Markets, and Sustainability & Energy Transition.
Customers continue to turn to S&P Global for our proprietary and differentiated data and insights, and our commitment to innovation and disciplined execution enables us to deliver more value for them, and for our shareholders, than ever before." Douglas Peterson President and CEO |
| | |
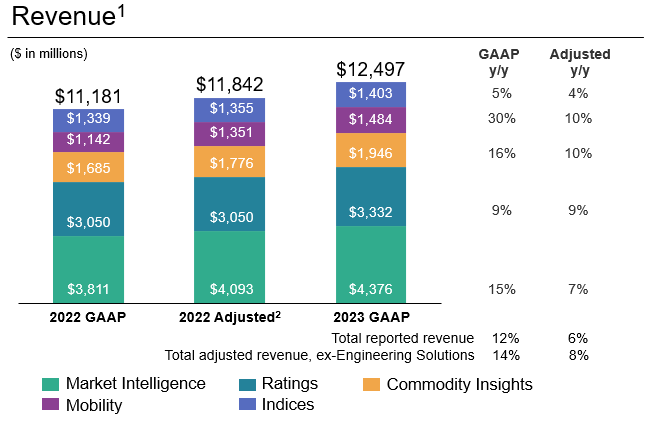
| Fourth Quarter 2023 Revenue |
| | | | | | | | |
| | Fourth quarter revenue increased 7% and revenue excluding Engineering Solutions increased 11%, driven by growth in all divisions. Revenue from subscription products increased 9%, excluding Engineering Solutions.
(1) Total revenue includes the impact of inter-segment eliminations of $44M and $47M, and a contribution from Engineering Solutions of $99M and $0 in 4Q '22 and 4Q '23, respectively. |
| | |
| Fourth Quarter 2023 Operating Profit, Expense, and Operating Margin |
The Company’s fourth quarter reported operating profit margin increased approximately 4 percentage points to 28.2%, primarily due to the increase in GAAP revenue. Adjusted operating profit margin increased 290 basis points to 44.1% primarily due to the divestiture of Engineering Solutions, growth in our Ratings division, and disciplined expense management.
| | |
| Fourth Quarter 2023 Diluted Earnings Per Share |
| | | | | | | | | | | |
| 4Q '23 | 4Q '22 | y/y change |
| GAAP Diluted EPS | $1.83 | $1.33 | 38% |
| Adjusted Diluted EPS | $3.13 | $2.54 | 23% |
Fourth quarter GAAP diluted earnings per share increased 38% to $1.83 primarily due to a 34% increase in net income, and a 3% reduction in diluted shares outstanding.
Adjusted diluted earnings per share increased 23% to $3.13 due to a 19% increase in adjusted net income and a 3% decrease in diluted shares outstanding. Currency positively impacted adjusted diluted EPS by $0.04. The largest non-core adjustments to earnings in the fourth quarter of 2023 were for deal-related amortization, restructuring, and acquisition-related costs.
| | | | | | | | |
| | Full-year 2023 revenue increased 12% and adjusted revenue excluding Engineering Solutions increased 8% compared to non-GAAP pro forma adjusted revenue in 2022, driven by growth in all five divisions.
(1) Total GAAP revenue in 2022 and 2023 includes the impact of inter-segment eliminations of $169M and $177M, and contributions of revenue from Engineering Solutions of $323M and $133M, respectively. Adjusted revenue in 2022 refers to non-GAAP pro forma adjusted revenue and includes the impact of pro forma inter-segment elimination of $171M, and a contribution of pro forma revenue from Engineering Solutions of $389M.
(2) Non-GAAP pro forma adjusted revenue in 2022 excludes the contributions from businesses divested in 2022 in association with the merger with IHS Markit.
|
| | |
| Full-Year 2023 Operating Profit, Expense, and Operating Margin |
The Company’s full-year reported operating margin decreased 12 percentage points to 32.2%, primarily due to the gain on sale of divestitures in 2022. Adjusted operating margin increased 100 basis points to 45.9% compared to non-GAAP pro forma adjusted operating margin for 2022, primarily due to the divestiture of Engineering Solutions, realization of merger related synergies, growth in our Ratings division, and disciplined expense management.
| | |
| Full-Year 2023 Diluted Earnings Per Share |
| | | | | | | | | | | |
| 2023 | 2022 | y/y change |
| GAAP Diluted EPS | $8.23 | $10.20 | (19)% |
| Adjusted Diluted EPS | $12.60 | $11.19 | 13% |
Adjusted diluted EPS in the table above refers to non-GAAP adjusted diluted EPS in the current period and non-GAAP pro forma adjusted diluted EPS in the year-ago period.
Full-year 2023 GAAP diluted earnings per share decreased 19% to $8.23, primarily due to a gain on sale of divestitures in 2022.
Adjusted diluted earnings per share increased 13% to $12.60 compared to non-GAAP pro forma adjusted diluted EPS for 2022, due to a 7% increase in adjusted net income compared to non-GAAP pro forma adjusted net income for 2022, and a 5% decrease in diluted shares outstanding. Currency positively impacted adjusted diluted EPS by $0.14. The largest non-core adjustments to earnings in 2023 were for deal-related amortization and costs to achieve synergies.
| | | | | | | | |
| GAAP | Adjusted |
| Revenue growth | 5.5% to 7.5% | 5.5% to 7.5% |
| Corporate unallocated expense | $210 to $220 million | $155 to $165 million |
| Deal-related amortization | $1.095 to $1.105 billion | $1.095 to $1.105 billion |
| Operating profit margin expansion | ~500 bps | ~100 bps |
| Interest expense, net | $340 to $350 million | $365 to $375 million |
| Tax rate | 21.0% to 22.0% | 21.5% to 22.5% |
| Diluted EPS | $10.70 to $10.95 | $13.75 to $14.00 |
| Capital expenditures | $165 to $175 million | $165 to $175 million |
In addition to the above, the Company expects 2024 cash provided by operating activities, less capital expenditures and distributions to noncontrolling interest holders, of approximately $4.1 billion. The Company expects adjusted free cash flow, excluding certain items, of approximately $4.4 billion.
GAAP and non-GAAP adjusted guidance include the contribution from divestitures in all periods. Excluding the contribution from previously completed divestitures, revenue guidance implies a growth rate of 7% to 9%.
Non-GAAP adjusted guidance excludes merger expenses and amortization of intangibles related to acquisitions.
Capital Return: For the full year 2024, the Company expects to return approximately 85% of adjusted free cash flow to shareholders through dividends and share repurchases. The Board of Directors has authorized a quarterly cash dividend of $0.91, marking the 51st consecutive year of dividend increases for the Company. Additionally, the Board has authorized the repurchase of shares totaling up to $2.4 billion. The Company expects to launch an initial $500 million Accelerated Share Repurchase (ASR) in the coming weeks.
Supplemental Information/Conference Call/Webcast Details: The Company’s senior management will review the fourth quarter and full year 2023 earnings results on a conference call scheduled for today, February 8, at 8:30 a.m. ET. Additional information presented on the conference call, as well as the Company’s Supplemental slide content may be found on the Company’s Investor Relations Website at http://investor.spglobal.com/Quarterly-Earnings.
The Webcast will be available live and in replay at http://investor.spglobal.com/Quarterly-Earnings. (Please copy and paste URL into Web browser.)
Telephone access is available. U.S. participants may call (888) 603-9623; international participants may call +1 (630) 395-0220 (long-distance charges will apply). The passcode is “S&P Global” and the conference leader is Douglas Peterson. A recorded telephone replay will be available approximately two hours after the meeting concludes and will remain available until March 8, 2024. U.S. participants may call (888) 566-0438; international participants may call +1 (203) 369-3047 (long-distance charges will apply). No passcode is required.
Comparison of Adjusted Information to U.S. GAAP Information: The Company reports its financial results in accordance with accounting principles generally accepted in the United States ("GAAP"). Company financial results are also presented on an as-reported basis, and on a pro forma basis as if the merger had closed on January 1, 2021, for periods including fiscal year 2022; the pro forma basis agrees to the Company's previously filed unaudited pro forma combined condensed financial information presented in accordance with Article 11 of Regulation S-X. The Company also refers to and presents certain additional non-GAAP financial measures, within the meaning of Regulation G under the Securities Exchange Act of 1934. These measures are: non-GAAP pro forma adjusted revenue; adjusted diluted EPS and non-GAAP pro forma adjusted diluted EPS; adjusted operating profit and margin and non-GAAP pro forma adjusted operating profit and margin; adjusted expenses and non-GAAP pro forma adjusted expenses; adjusted corporate unallocated expense and non-GAAP pro forma adjusted corporate unallocated expense; adjusted other (income) expense, net and non-GAAP pro forma other income, net; adjusted deal-related amortization; adjusted interest expense, net and non-GAAP pro forma adjusted interest expense, net; adjusted provision for income taxes and non-GAAP pro forma adjusted provision for income taxes; adjusted effective tax rate and non-GAAP pro forma adjusted effective tax rate; adjusted net income attributable to noncontrolling interests and non-GAAP pro forma adjusted net income attributable to noncontrolling interests; adjusted net income attributable to SPGI and non-GAAP pro forma adjusted net income attributable to SPGI; and cash provided by operating activities, less capital expenditures and distributions to noncontrolling interest holders, free cash flow, adjusted free cash flow excluding certain items, and non-GAAP pro forma adjusted free cash flow excluding certain items.
The Company has included reconciliations of these non-GAAP financial measures to the most directly comparable financial measures calculated in accordance with GAAP on Exhibits 5, 6, 7, 8, and 9. Reconciliations of certain forward-looking non-GAAP financial measures to comparable GAAP measures are not available due to the challenges and impracticability with estimating some of the items. The Company is not able to provide reconciliations of such forward-looking non-GAAP financial measures because certain items required for such reconciliations are outside of the Company's control and/or cannot be reasonably predicted. Because of those challenges, reconciliations of such forward-looking non-GAAP financial measures are not available without unreasonable effort.
The Company's non-GAAP measures include adjustments that reflect how management views our businesses. The Company believes these non-GAAP financial measures provide useful supplemental information that, in the case of non-GAAP financial measures other than cash provided by operating activities, less capital expenditures and distributions to noncontrolling interest holders; free cash flow; adjusted free cash flow excluding certain items; and non-GAAP pro forma adjusted free cash flow excluding certain items, enables investors to better compare the Company's performance across periods, and management also uses these measures internally to assess the operating performance of its business, to assess performance for employee compensation purposes and to decide how to allocate resources. The Company believes that the presentation of cash provided by operating activities, less capital expenditures and distributions to noncontrolling interest holders; free cash flow; adjusted free cash flow excluding certain items; and non-GAAP pro forma adjusted free cash flow excluding certain items allows investors to evaluate the cash generated from our underlying operations in a manner similar to the method used by management and that such measures are useful in evaluating the cash available to us to prepay debt, make strategic acquisitions and investments, and repurchase stock. However, investors should not consider any of these non-GAAP measures in isolation from, or as a substitute for, the financial information that the Company reports.
Forward-Looking Statements: This press release contains “forward-looking statements,” as defined in the Private Securities Litigation Reform Act of 1995. These statements, which express management’s current views concerning future events, trends, contingencies or results, appear at various places in this press release and use
words like “anticipate,” “assume,” “believe,” “continue,” “estimate,” “expect,” “forecast,” “future,” “intend,” “plan,” “potential,” “predict,” “project,” “strategy,” “target” and similar terms, and future or conditional tense verbs like “could,” “may,” “might,” “should,” “will” and “would.” For example, management may use forward-looking statements when addressing topics such as: the outcome of contingencies; future actions by regulators; changes in the Company’s business strategies and methods of generating revenue; the development and performance of the Company’s services and products; the expected impact of acquisitions and dispositions; the Company’s effective tax rates; and the Company’s cost structure, dividend policy, cash flows or liquidity.
Forward-looking statements are subject to inherent risks and uncertainties. Factors that could cause actual results to differ materially from those expressed or implied in forward-looking statements include, among other things:
▪worldwide economic, financial, political, and regulatory conditions (including slower GDP growth or recession, instability in the banking sector and inflation), and factors that contribute to uncertainty and volatility, natural and man-made disasters, civil unrest, public health crises (e.g., pandemics), geopolitical uncertainty (including military conflict), and conditions that may result from legislative, regulatory, trade and policy changes;
▪the volatility and health of debt, equity, commodities, energy and automotive markets, including credit quality and spreads, the level of liquidity and future debt issuances, demand for investment products that track indices and assessments and trading volumes of certain exchange traded derivatives;
▪the demand and market for credit ratings in and across the sectors and geographies where the Company operates;
▪the Company’s ability to maintain adequate physical, technical and administrative safeguards to protect the security of confidential information and data, and the potential for a system or network disruption that results in regulatory penalties and remedial costs or improper disclosure of confidential information or data;
▪the outcome of litigation, government and regulatory proceedings, investigations and inquiries;
▪concerns in the marketplace affecting the Company’s credibility or otherwise affecting market perceptions of the integrity or utility of independent credit ratings, benchmarks, indices and other services;
▪our ability to attract, incentivize and retain key employees, especially in a competitive business environment;
▪the Company’s exposure to potential criminal sanctions or civil penalties for noncompliance with foreign and U.S. laws and regulations that are applicable in the jurisdictions in which it operates, including sanctions laws relating to countries such as Iran, Russia, Sudan, Syria and Venezuela, anti-corruption laws such as the U.S. Foreign Corrupt Practices Act and the U.K. Bribery Act of 2010, and local laws prohibiting corrupt payments to government officials, as well as import and export restrictions;
▪the continuously evolving regulatory environment in Europe, the United States and elsewhere around the globe affecting each of our businesses and the products they offer, and our compliance therewith;
▪the Company’s ability to make acquisitions and dispositions and successfully integrate the businesses we acquire;
▪consolidation of the Company’s customers, suppliers or competitors;
▪the introduction of competing products or technologies by other companies;
▪our ability to develop new products or technologies, to integrate our products with new technologies (e.g., artificial intelligence), or to compete with new products or technologies offered by new or existing competitors;
▪the effect of competitive products and pricing, including the level of success of new product developments and global expansion;
▪the impact of customer cost-cutting pressures;
▪a decline in the demand for our products and services by our customers and other market participants;
▪the ability of the Company, and its third-party service providers, to maintain adequate physical and technological infrastructure;
▪the Company’s ability to successfully recover from a disaster or other business continuity problem, such as an earthquake, hurricane, flood, civil unrest, protests, military conflict, terrorist attack, outbreak of pandemic or contagious diseases, security breach, cyber attack, data breach, power loss, telecommunications failure or other natural or man-made event;
▪the level of merger and acquisition activity in the United States and abroad;
▪the level of the Company’s future cash flows and capital investments;
▪the impact on the Company’s revenue and net income caused by fluctuations in foreign currency exchange rates; and
▪the impact of changes in applicable tax or accounting requirements on the Company.
The factors noted above are not exhaustive. The Company and its subsidiaries operate in a dynamic business environment in which new risks emerge frequently. Accordingly, the Company cautions readers not to place undue reliance on any forward-looking statements, which speak only as of the dates on which they are made. The Company undertakes no obligation to update or revise any forward-looking statement to reflect events or circumstances arising after the date on which it is made, except as required by applicable law. Further information about the Company’s businesses, including information about factors that could materially affect its results of operations and financial condition, is contained in the Company’s filings with the SEC, including Item 1A, Risk Factors, in our most recently filed Annual Report on Form 10-K.
About S&P Global
S&P Global (NYSE: SPGI) provides essential intelligence. We enable governments, businesses and individuals with the right data, expertise and connected technology so that they can make decisions with conviction. From helping our customers assess new investments to guiding them through ESG and energy transition across supply chains, we unlock new opportunities, solve challenges and accelerate progress for the world.
We are widely sought after by many of the world’s leading organizations to provide credit ratings, benchmarks, analytics and workflow solutions in the global capital, commodity and automotive markets. With every one of our offerings, we help the world’s leading organizations plan for tomorrow, today.
Investor Relations: http://investor.spglobal.com
Get news direct via RSS: https://investor.spglobal.com/contact-investor-relations/rss-feeds/default.aspx
Contact:
Investor Relations:
Mark Grant
Senior Vice President, Investor Relations
Tel: +1 (347) 640-1521
mark.grant@spglobal.com
Media:
Christina Twomey
Communications
Tel: +1 (410) 382-3316
christina.twomey@spglobal.com
Christopher Krantz
Communications
Tel: +44 7976 632 638
christopher.krantz@spglobal.com
###
S&P Global
Condensed Consolidated Statements of Income
Periods ended December 31, 2023 and 2022
(dollars in millions, except per share data)
| | | | | | | | | | | | | | | | | | | | | | | | | | | | | | | | | | | | | | | | | | | | |
| (unaudited) | Three Months | Twelve Months |
| | 2023 | | 2022 | | % Change | | | 2023 | | 2022 | | % Change | |
| | | | | | | | | | | | | | | |
| Revenue | | $ | 3,152 | | | $ | 2,937 | | | 7% | | | $ | 12,497 | | | $ | 11,181 | | | 12% | |
| Expenses | | 2,264 | | | 2,227 | | | 2% | | | 8,443 | | | 8,162 | | | 3% | |
| Loss (gain) on dispositions | | 1 | | | (1) | | | N/M | | | 70 | | | (1,898) | | | N/M | |
| Equity in income on unconsolidated subsidiaries | | (3) | | | (6) | | | (58)% | | | (36) | | | (27) | | | 33% | |
| Operating profit | | 890 | | | 717 | | | 24% | | | 4,020 | | | 4,944 | | | (19)% | |
| Other expense (income), net | | 19 | | | 17 | | | 23% | | | 15 | | | (70) | | | N/M | |
| Interest expense, net | | 76 | | | 86 | | | (12)% | | | 334 | | | 304 | | | 10% | |
| (Gain) loss on extinguishment of debt, net | | — | | | (7) | | | N/M | | | — | | | 8 | | | N/M | |
| Income before taxes on income | | 795 | | | 621 | | | 28% | | | 3,671 | | | 4,702 | | | (22)% | |
| Provision for taxes on income | | 151 | | | 127 | | | 18% | | | 778 | | | 1,180 | | | (34)% | |
| | | | | | | | | | | | | | |
| | | | | | | | | | | | | | |
| | | | | | | | | | | | | | |
| | | | | | | | | | | | | | |
| Net income | | 644 | | | 494 | | | 30% | | | 2,893 | | | 3,522 | | | (18)% | |
| Less: net income attributable to noncontrolling interests | | (65) | | | (61) | | | (7)% | | | (267) | | | (274) | | | 3% | |
| Net income attributable to S&P Global Inc. | | $ | 579 | | | $ | 433 | | | 34% | | | $ | 2,626 | | | $ | 3,248 | | | (19)% | |
| | | | | | | | | | | | | | | |
| | | | | | | | | | | | | | |
| | | | | | | | | | | | | | |
| | | | | | | | | | | | | | |
| | | | | | | | | | | | | | |
| | | | | | | | | | | | | | |
| Earnings per share attributable to S&P Global Inc. common shareholders: | | | | | | | | | | | | | | |
| | | | | | | | | | | | | | |
| | | | | | | | | | | | | | |
| | | | | | | | | | | | | | |
| | | | | | | | | | | | | | |
| | | | | | | | | | | | | | |
| | | | | | | | | | | | | | |
| Net income: | | | | | | | | | | | | | | |
| Basic | | $ | 1.84 | | | $ | 1.34 | | | 37% | | | $ | 8.25 | | | $ | 10.25 | | | (19)% | |
| Diluted | | $ | 1.83 | | | $ | 1.33 | | | 38% | | | $ | 8.23 | | | $ | 10.20 | | | (19)% | |
| | | | | | | | | | | | | | | |
| Weighted-average number of common shares outstanding: | | | | | | | | | | | | | | |
| Basic | | 315.4 | | | 323.9 | | | | | | 318.4 | | | 316.9 | | | | |
| Diluted | | 315.9 | | | 325.2 | | | | | | 318.9 | | | 318.5 | | | | |
| | | | | | | | | | | | | | |
| Actual shares outstanding at year end | | | | | | | | | 314.1 | | | 321.9 | | | | |
| | | | | | | | | | | | | | | |
N/M - Represents a change equal to or in excess of 100% or not meaningful.
Note - % change in the tables throughout the exhibits are calculated off of the actual number, not the rounded number presented.
Note - S&P Global completed the merger with IHS Markit on February 28, 2022. The twelve months ended December 31, 2022 include results from IHS Markit since the date of acquisition.
S&P Global
Condensed Consolidated Balance Sheets
December 31, 2023 and 2022
(dollars in millions)
| | | | | | | | | | | | | | | | | | | | |
| (unaudited) | | 2023 | | | 2022 | |
| | | | | | | |
| Assets: | | | | | | |
| Cash, cash equivalents, and restricted cash | | $ | 1,291 | | | | $ | 1,287 | | |
| Other current assets | | 3,852 | | | | 3,082 | | |
Assets of a business held for sale 1 | | — | | | | 1,298 | | |
| Total current assets | | 5,143 | | | | 5,667 | | |
| Property and equipment, net | | 258 | | | | 297 | | |
| Right of use assets | | 379 | | | | 423 | | |
| Goodwill and other intangible assets, net | | 52,248 | | | | 52,851 | | |
| Equity investments in unconsolidated subsidiaries | | 1,787 | | | | 1,752 | | |
| Other non-current assets | | 774 | | | | 794 | | |
| Total assets | | $ | 60,589 | | | | $ | 61,784 | | |
| | | | | | | |
| Liabilities and Equity: | | | | | | |
| Short-term debt | | $ | 47 | | | | $ | 226 | | |
| Unearned revenue | | 3,461 | | | | 3,126 | | |
| Other current liabilities | | 2,617 | | | | 2,413 | | |
Liabilities of a business held for sale 1 | | — | | | | 234 | | |
| Long-term debt | | 11,412 | | | | 10,730 | | |
| Lease liabilities — non-current | | 541 | | | | 577 | | |
| Deferred tax liability — non-current | | 3,690 | | | | 4,065 | | |
| Pension, other postretirement benefits and other non-current liabilities | | 721 | | | | 669 | | |
| Total liabilities | | 22,489 | | | | 22,040 | | |
| Redeemable noncontrolling interest | | 3,800 | | | | 3,267 | | |
| Total equity | | 34,300 | | | | 36,477 | | |
| Total liabilities and equity | | $ | 60,589 | | | | $ | 61,784 | | |
| | | | | | | |
1 Includes Engineering Solutions as of December 31, 2022.
S&P Global
Condensed Consolidated Statements of Cash Flows
Years ended December 31, 2023 and 2022
(dollars in millions)
| | | | | | | | | | | | | | | | | | | | |
| (unaudited) | | 2023 | | | 2022 | |
| | | | | | | |
| Operating Activities: | | | | | | |
| Net income | | $ | 2,893 | | | | $ | 3,522 | | |
| Adjustments to reconcile net income to cash provided by operating activities: | | | | | | |
| Depreciation | | 101 | | | | 108 | | |
| Amortization of intangibles | | 1,042 | | | | 905 | | |
| Deferred income taxes | | (381) | | | | (353) | | |
| Stock-based compensation | | 171 | | | | 214 | | |
| Loss (gain) on dispositions | | 70 | | | | (1,898) | | |
| | | | | | |
| | | | | | |
| | | | | | |
| Other | | 274 | | | | 343 | | |
| Net changes in other operating assets and liabilities | | (460) | | | | (238) | | |
| Cash provided by operating activities | | 3,710 | | | | 2,603 | | |
| | | | | | |
| Investing Activities: | | | | | | |
| Capital expenditures | | (143) | | | | (89) | | |
| Acquisitions, net of cash acquired | | (296) | | | | 210 | | |
| Proceeds from dispositions | | 1,014 | | | | 3,509 | | |
| Changes in short-term investments | | (13) | | | | (2) | | |
| Cash provided by investing activities | | 562 | | | | 3,628 | | |
| | | | | | |
| Financing Activities: | | | | | | |
| Payments on short-term debt, net | | (188) | | | | (32) | | |
| Proceeds from issuance of senior notes, net | | 744 | | | | 5,395 | | |
| Payments on senior notes | | — | | | | (3,698) | | |
| Dividends paid to shareholders | | (1,147) | | | | (1,024) | | |
| Distributions to noncontrolling interest holders | | (280) | | | | (270) | | |
| Proceeds from noncontrolling interest holders | | — | | | | 410 | | |
| Repurchase of treasury shares | | (3,301) | | | | (12,004) | | |
| Exercise of stock options, employee withholding tax on share-based payments and other | | (108) | | | | (103) | | |
| Cash used for financing activities | | (4,280) | | | | (11,326) | | |
| Effect of exchange rate changes on cash | | 12 | | | | (123) | | |
| | | | | | |
| | | | | | |
| Net change in cash, cash equivalents, and restricted cash | | 4 | | | | (5,218) | | |
| Cash, cash equivalents, and restricted cash at beginning of year | | 1,287 | | | | 6,505 | | |
| Cash, cash equivalents, and restricted cash at end of year | | $ | 1,291 | | | | $ | 1,287 | | |
| | | | | | | |
S&P Global
Operating Results by Segment
Periods ended December 31, 2023 and 2022
(dollars in millions) | | | | | | | | | | | | | | | | | | | | | | | | | | | | | | | | | | | | | | | | | | | | |
| (unaudited) | Three Months | Twelve Months |
| | | Revenue | | | Revenue | |
| | | | | | | | | | | | | | |
| | | 2023 | | 2022 | | % Change | | | 2023 | | 2022 | | % Change | |
| Market Intelligence | | $ | 1,127 | | | $ | 1,037 | | | 9% | | | $ | 4,376 | | | $ | 3,811 | | | 15% | |
| Ratings | | 838 | | | 705 | | | 19% | | | 3,332 | | | 3,050 | | | 9% | |
| Commodity Insights | | 497 | | | 451 | | | 10% | | | 1,946 | | | 1,685 | | | 16% | |
| Mobility | | 377 | | | 345 | | | 9% | | | 1,484 | | | 1,142 | | | 30% | |
| Indices | | 360 | | | 344 | | | 5% | | | 1,403 | | | 1,339 | | | 5% | |
| Engineering Solutions | | — | | | 99 | | | N/M | | | 133 | | | 323 | | | (59)% | |
| | | | | | | | | | | | | | |
| Intersegment Elimination | | (47) | | | (44) | | | (7)% | | | (177) | | | (169) | | | (5)% | |
| Total revenue | | $ | 3,152 | | | $ | 2,937 | | | 7% | | | $ | 12,497 | | | $ | 11,181 | | | 12% | |
| | | | | | | | | | | | | | | |
| | | | | | | | | | | | | | | |
| | | Expenses | | | Expenses | |
| | | | | | | | | | | | | | |
| | | 2023 | | 2022 | | % Change | | | 2023 | | 2022 | | % Change | |
| | | | | | | | | | | | | | | |
| Market Intelligence (a) | | $ | 1,012 | | | $ | 915 | | | 11% | | | $ | 3,662 | | | $ | 1,323 | | | N/M | |
| Ratings (b) | | 396 | | | 385 | | | 3% | | | 1,468 | | | 1,378 | | | 7% | |
| Commodity Insights (c) | | 320 | | | 301 | | | 6% | | | 1,242 | | | 1,094 | | | 14% | |
| Mobility (d) | | 331 | | | 297 | | | 11% | | | 1,224 | | | 929 | | | 32% | |
| Indices (e) | | 133 | | | 149 | | | (11)% | | | 478 | | | 412 | | | 16% | |
| Engineering Solutions (f) | | — | | | 86 | | | N/M | | | 114 | | | 308 | | | (63)% | |
| Corporate Unallocated expense (g) | | 120 | | | 137 | | | (12)% | | | 502 | | | 989 | | | (49)% | |
| Equity in Income on Unconsolidated Subsidiaries (h) | | (3) | | | (6) | | | 58% | | | (36) | | | (27) | | | (33)% | |
| Intersegment Elimination | | (47) | | | (44) | | | (7)% | | | (177) | | | (169) | | | (5)% | |
| Total expenses | | $ | 2,262 | | | $ | 2,220 | | | 2% | | | $ | 8,477 | | | $ | 6,237 | | | 36% | |
| | | | | | | | | | | | | | | |
| | | | | | | | | | | | | | | |
| | | Operating Profit | | | Operating Profit | |
| | | | | | | | | | | | | | |
| | | 2023 | | 2022 | | % Change | | | 2023 | | 2022 | | % Change | |
| | | | | | | | | | | | | | | |
| Market Intelligence (a) | | $ | 115 | | | $ | 122 | | | (5)% | | | $ | 714 | | | $ | 2,488 | | | (71)% | |
| Ratings (b) | | 442 | | | 320 | | | 38% | | | 1,864 | | | 1,672 | | | 11% | |
| Commodity Insights (c) | | 177 | | | 150 | | | 18% | | | 704 | | | 591 | | | 19% | |
| Mobility (d) | | 46 | | | 48 | | | (2)% | | | 260 | | | 213 | | | 22% | |
| Indices (e) | | 227 | | | 195 | | | 16% | | | 925 | | | 927 | | | —% | |
| Engineering Solutions (f) | | — | | | 13 | | | N/M | | | 19 | | | 15 | | | 24% | |
| Total reportable segments | | 1,007 | | | 848 | | | 19% | | | 4,486 | | | 5,906 | | | (24)% | |
| Corporate Unallocated expense (g) | | (120) | | | (137) | | | 12% | | | (502) | | | (989) | | | 49% | |
| Equity in Income on Unconsolidated Subsidiaries (h) | | 3 | | | 6 | | | (58)% | | | 36 | | | 27 | | | 33% | |
| Total operating profit | | $ | 890 | | | $ | 717 | | | 24% | | | $ | 4,020 | | | $ | 4,944 | | | (19)% | |
| | | | | | | | | | | | | | | |
N/M - Represents a change equal to or in excess of 100% or not meaningful.
Note - S&P Global completed the merger with IHS Markit on February 28, 2022. The twelve months ended December 31, 2022 include results from IHS Markit since the date of acquisition.
(a) The three and twelve months ended December 31, 2023 include acquisition-related costs of $69 million, employee severance charges of $49 million and $90 million, respectively, and IHS Markit merger costs of $12 million and $49 million, respectively. The twelve months ended December 31, 2023 include a gain on disposition of $46 million, an asset impairment of $5 million and an asset write-off of $1 million. The three and twelve months ended December 31, 2022 include employee severance charges of $46 million and $90 million, respectively, IHS Markit merger costs of $14 million and $35 million, respectively, and a gain on dispositions of $1 million and $1.8 billion, respectively. The twelve months ended December 31, 2022 include acquisition-related costs of $2 million. Additionally, amortization of intangibles from acquisitions of $140 million and $143 million is included for the three months ended December 31, 2023 and 2022, respectively, and $561 million and $474 million for the twelve months ended December 31, 2023 and 2022, respectively.
(b) The three and twelve months ended December 31, 2023 include employee severance charges of $2 million and $10 million, respectively, and an asset impairment of $1 million. The three and twelve months ended December 31, 2022 include employee severance charges of $11 million and $24 million, respectively, and legal costs of $5 million. The twelve months ended December 31, 2022 include an asset write-off of $1 million. Additionally, amortization of intangibles from acquisitions of $2 million is included for the three months ended December 31, 2023 and 2022, and $8 million and $7 million for the twelve months ended December 31, 2023 and 2022, respectively.
(c) The three and twelve months ended December 31, 2023 include IHS Markit merger costs of $6 million and $35 million, respectively, employee severance charges of $4 million and $26 million, respectively, and acquisition-related costs of $2 million. The three and twelve months ended December 31, 2022 include IHS Markit merger costs of $10 million and $26 million, respectively, and employee severance charges of $7 million and $45 million, respectively. Additionally, amortization of intangibles from acquisitions of $32 million and $34 million is included for the three months ended December 31, 2023 and 2022, respectively, and $131 million and $111 million for the twelve months ended December 31, 2023 and 2022, respectively.
(d) The three and twelve months ended December 31, 2023 include employee severance charges of $3 million and $9 million, respectively, IHS Markit merger costs of $1 million and $3 million, respectively, and acquisition-related costs of $1 and $2 million, respectively. The three and twelve months ended December 31, 2022 include IHS Markit merger costs of $2 million and $3 million, respectively, and employee severance charges of $1 million and $4 million, respectively. The three and twelve months ended December 31, 2022 include an acquisition-related cost of $1 million and an acquisition-related benefit of $14 million, respectively. Additionally, amortization of intangibles from acquisitions of $76 million and $65 million is included for the three months ended December 31, 2023 and 2022, respectively, and $301 million and $241 million for the twelve months ended December 31, 2023 and 2022, respectively.
(e) The three and twelve months ended December 31, 2023 include employee severance charges of $2 million and $5 million, respectively, and IHS Markit merger costs of $1 million and $4 million, respectively. The twelve months ended December 31, 2023 include a gain on disposition of $4 million. The three and twelve months ended December 31, 2022 include employee severance charges of $10 million and $14 million, respectively. The twelve months ended December 31, 2022 include a gain on disposition of $52 million and IHS Markit merger costs of $2 million. Additionally, amortization of intangibles from acquisitions of $9 million is included for the three months ended December 31, 2023 and 2022, and $36 million and $31 million for the twelve months ended December 31, 2023 and 2022, respectively.
(f) The twelve months ended December 31, 2022 include employee severance charges of $4 million. Amortization of intangibles from acquisitions of $2 million is included for the three months ended December 31, 2022, and $1 million and $35 million for the twelve months ended December 31, 2023 and 2022, respectively.
(g) The three and twelve months ended December 31, 2023 include IHS Markit merger costs of $43 million and $147 million, respectively, employee severance charges of $23 million and $43 million, respectively, disposition-related costs of $5 million and $24 million, respectively, acquisition-related costs of $1 million and $4 million, respectively, and lease impairments of $1 million and $14 million, respectively. The twelve months ended December 31, 2023 include a loss on disposition of $120 million. The three and twelve months ended December 31, 2022 include IHS Markit merger costs of $69 million and $553 million, respectively, employee severance charges of $20 million and $107 million, respectively, acquisition-related costs of $1 million and $8 million, respectively, and disposition-related costs of $24 million. The twelve months ended December 31, 2022 include a S&P Foundation grant of $200 million, a gain on acquisition of $10 million, an asset impairment of $9 million, lease impairments of $5 million and an asset write-off of $3 million. Additionally, amortization of intangibles from acquisitions of $1 million and $3 million is included for the three months ended December 31, 2023 and 2022, respectively, and $3 million and $4 million for the twelve months ended December 31, 2023 and 2022, respectively.
(h) The three and twelve months ended December 31, 2023 include an asset impairment of $2 million. Amortization of intangibles from acquisitions of $14 million and $13 million is included for the three months ended December 31, 2023 and 2022, respectively, and $56 million and $55 million for the twelve months ended December 31, 2023 and 2022, respectively.
S&P Global
Operating Results - Non-GAAP Financial Information
Three and twelve months ended December 31, 2023 and 2022
(dollars in millions, except per share amounts)
Revenue/Pro Forma Revenue/Non-GAAP Pro Forma Adjusted Revenue
| | | | | | | | | | | | | | | | | | | | | | | | | | | | | | | | | | | | | | | | | | | | | | | |
| (unaudited) | | Three Months | Twelve Months |
| | | 2023 | | 2022 | | % Change | | | 2023 | | 2022 | | % Change | |
| | | | | | | | | | | | | | | |
| Market Intelligence | Revenue/Pro forma revenue * | | $ | 1,127 | | | $ | 1,037 | | | 9% | | | $ | 4,376 | | | $ | 4,102 | | | 7% | |
| | | | | | | | | | | | | | |
| | | | | | | | | | | | | | |
| Divestitures | | — | | | — | | | | | | — | | | (9) | | | | |
| Revenue/Non-GAAP pro forma adjusted revenue * | | $ | 1,127 | | | $ | 1,037 | | | 9% | | | $ | 4,376 | | | $ | 4,093 | | | 7% | |
| | | | | | | | | | | | | | | |
| | | | | | | | | | | | | | | |
| Ratings | Revenue | | $ | 838 | | | $ | 705 | | | 19% | | | $ | 3,332 | | | $ | 3,050 | | | 9% | |
| | | | | | | | | | | | | | |
| | | | | | | | | | | | | | | |
| Revenue | | $ | 838 | | | $ | 705 | | | 19% | | | $ | 3,332 | | | $ | 3,050 | | | 9% | |
| | | | | | | | | | | | | | | |
| | | | | | | | | | | | | | | |
| Commodity Insights | Revenue/Pro forma revenue * | | $ | 497 | | | $ | 451 | | | 10% | | | $ | 1,946 | | | $ | 1,788 | | | 9% | |
| | | | | | | | | | | | | | |
| | | | | | | | | | | | | | |
| Divestitures | | — | | | — | | | | | | — | | | (12) | | | | |
| Revenue/Non-GAAP pro forma adjusted revenue * | | $ | 497 | | | $ | 451 | | | 10% | | | $ | 1,946 | | | $ | 1,776 | | | 10% | |
| | | | | | | | | | | | | | | |
| | | | | | | | | | | | | | | |
| Mobility | Revenue/Pro forma revenue * | | $ | 377 | | | $ | 345 | | | 9% | | | $ | 1,484 | | | $ | 1,351 | | | 10% | |
| | | | | | | | | | | | | | |
| | | | | | | | | | | | | | |
| Revenue/Pro forma revenue * | | $ | 377 | | | $ | 345 | | | 9% | | | $ | 1,484 | | | $ | 1,351 | | | 10% | |
| | | | | | | | | | | | | | | |
| | | | | | | | | | | | | | | |
| Indices | Revenue/Pro forma revenue * | | $ | 360 | | | $ | 344 | | | 5% | | | $ | 1,403 | | | $ | 1,356 | | | 3% | |
| | | | | | | | | | | | | | |
| | | | | | | | | | | | | | |
| Divestitures | | — | | | — | | | | | | — | | | (1) | | | | |
| Revenue/Non-GAAP pro forma adjusted revenue * | | $ | 360 | | | $ | 344 | | | 5% | | | $ | 1,403 | | | $ | 1,355 | | | 4% | |
| | | | | | | | | | | | | | | |
| | | | | | | | | | | | | | | |
| Engineering Solutions | Revenue/Pro forma revenue * | | $ | — | | | $ | 99 | | | N/M | | | $ | 133 | | | $ | 389 | | | (66)% | |
| | | | | | | | | | | | | | |
| | | | | | | | | | | | | | |
| Revenue/Pro forma revenue * | | $ | — | | | $ | 99 | | | N/M | | | $ | 133 | | | $ | 389 | | | (66)% | |
| | | | | | | | | | | | | | | |
| | | | | | | | | | | | | | | |
| Intersegment Elimination | Intersegment elimination/Pro forma intersegment elimination * | | $ | (47) | | | $ | (44) | | | (7)% | | | $ | (177) | | | $ | (171) | | | (3)% | |
| | | | | | | | | | | | | | |
| | | | | | | | | | | | | | |
| Intersegment elimination/Pro forma intersegment elimination * | | $ | (47) | | | $ | (44) | | | (7)% | | | $ | (177) | | | $ | (171) | | | (3)% | |
| | | | | | | | | | | | | | | |
| | | | | | | | | | | | | | | |
| Total SPGI | Revenue/Pro forma revenue * | | $ | 3,152 | | | $ | 2,937 | | | 7% | | | $ | 12,497 | | | $ | 11,864 | | | 5% | |
| | | | | | | | | | | | | | |
| | | | | | | | | | | | | | |
| Divestitures | | — | | | — | | | | | | — | | | (22) | | | | |
| Revenue/Non-GAAP pro forma adjusted revenue * | | $ | 3,152 | | | $ | 2,937 | | | 7% | | | $ | 12,497 | | | $ | 11,842 | | | 6% | |
| | | | | | | | | | | | | | | |
Adjusted Operating Profit/Non-GAAP Pro Forma Adjusted Operating Profit
| | | | | | | | | | | | | | | | | | | | | | | | | | | | | | | | | | | | | | | | | | | | | | | |
| (unaudited) | | Three Months | Twelve Months |
| | | 2023 | | 2022 | | % Change | | | 2023 | | 2022 | | % Change | |
| | | | | | | | | | | | | | | |
| Market Intelligence | Operating profit/Pro forma operating profit * | | $ | 115 | | | $ | 122 | | | (5)% | | | $ | 714 | | | $ | 2,471 | | | (71)% | |
| Non-GAAP adjustments/Pro forma non-GAAP adjustments (excludes deal-related amortization) (a) | | 130 | | | 59 | | | | | | 168 | | | (1,638) | | | | |
| Deal-related amortization/Pro forma deal-related amortization | | 140 | | | 144 | | | | | | 561 | | | 475 | | | | |
| | | | | | | | | | | | | | |
| Divestitures | | — | | | 1 | | | | | | — | | | (6) | | | | |
| Adjusted operating profit/Non-GAAP pro forma adjusted operating profit * | | $ | 386 | | | $ | 326 | | | 18% | | | $ | 1,443 | | | $ | 1,302 | | | 11% | |
| | | | | | | | | | | | | | | |
| | | | | | | | | | | | | | | |
| Ratings | Operating profit/Pro forma operating profit * | | $ | 442 | | | $ | 320 | | | 38% | | | $ | 1,864 | | | $ | 1,667 | | | 12% | |
| Non-GAAP adjustments/Pro forma non-GAAP adjustments (excludes deal-related amortization) (b) | | 4 | | | 16 | | | | | | 11 | | | 30 | | | | |
| Deal-related amortization/Pro forma deal-related amortization | | 2 | | | 2 | | | | | | 8 | | | 8 | | | | |
| | | | | | | | | | | | | | |
| Adjusted operating profit/Non-GAAP pro forma adjusted operating profit * | | $ | 447 | | | $ | 338 | | | 32% | | | $ | 1,882 | | | $ | 1,705 | | | 10% | |
| | | | | | | | | | | | | | |
| | | | | | | | | | | | | | | |
| Commodity Insights | Operating profit/Pro forma operating profit * | | $ | 177 | | | $ | 150 | | | 18% | | | $ | 704 | | | $ | 595 | | | 18% | |
| Non-GAAP adjustments/Pro forma non-GAAP adjustments (excludes deal-related amortization) (c) | | 11 | | | 17 | | | | | | 62 | | | 87 | | | | |
| Deal-related amortization/Pro forma deal-related amortization | | 32 | | | 34 | | | | | | 131 | | | 111 | | | | |
| | | | | | | | | | | | | | |
| Divestitures | | — | | | — | | | | | | — | | | (7) | | | | |
| Adjusted operating profit/Non-GAAP pro forma adjusted operating profit * | | $ | 220 | | | $ | 201 | | | 10% | | | $ | 897 | | | $ | 787 | | | 14% | |
| | | | | | | | | | | | | | | |
| | | | | | | | | | | | | | | |
| Mobility | Operating profit/Pro forma operating profit * | | $ | 46 | | | $ | 48 | | | (2)% | | | $ | 260 | | | $ | 250 | | | 4% | |
| Non-GAAP adjustments/Pro forma non-GAAP adjustments (excludes deal-related amortization) (d) | | 5 | | | 5 | | | | | | 15 | | | 36 | | | | |
| Deal-related amortization/Pro forma deal-related amortization | | 76 | | | 65 | | | | | | 301 | | | 242 | | | | |
| | | | | | | | | | | | | | |
| Adjusted operating profit/Non-GAAP pro forma adjusted operating profit * | | $ | 127 | | | $ | 117 | | | 8% | | | $ | 576 | | | $ | 527 | | | 9% | |
| | | | | | | | | | | | | | | |
| | | | | | | | | | | | | | | |
| Indices | Operating profit/Pro forma operating profit * | | $ | 227 | | | $ | 195 | | | 16% | | | $ | 925 | | | $ | 927 | | | —% | |
| Non-GAAP adjustments/Pro forma non-GAAP adjustments (excludes deal-related amortization) (e) | | 2 | | | 10 | | | | | | 5 | | | (30) | | | | |
| Deal-related amortization/Pro forma deal-related amortization | | 9 | | | 9 | | | | | | 36 | | | 31 | | | | |
| | | | | | | | | | | | | | |
| Adjusted operating profit/Non-GAAP pro forma adjusted operating profit * | | $ | 238 | | | $ | 214 | | | 11% | | | $ | 967 | | | $ | 927 | | | 4% | |
| | | | | | | | | | | | | | | |
| | | | | | | | | | | | | | | |
| Engineering Solutions | Operating profit/Pro forma operating profit * | | $ | — | | | $ | 13 | | | N/M | | | $ | 19 | | | $ | 21 | | | (10)% | |
| Non-GAAP adjustments/Pro forma non-GAAP adjustments (excludes deal-related amortization) (f) | | — | | | — | | | | | | — | | | 12 | | | | |
| Deal-related amortization | | — | | | 2 | | | | | | 1 | | | 35 | | | | |
| Adjusted operating profit/Non-GAAP pro forma adjusted operating profit * | | $ | — | | | $ | 15 | | | N/M | | | $ | 20 | | | $ | 67 | | | (69)% | |
| | | | | | | | | | | | | | | |
| | | | | | | | | | | | | | | | | | | | | | | | | | | | | | | | | | | | | | | | | | | | | | | |
| (unaudited) | | Three Months | Twelve Months |
| | | 2023 | | 2022 | | % Change | | | 2023 | | 2022 | | % Change | |
| | | | | | | | | | | | | | | |
| | | | | | | | | | | | | | | |
| | | | | | | | | | | | | | | |
| Total Segments | Operating profit/Pro forma operating profit * | | $ | 1,007 | | | $ | 848 | | | 19% | | | $ | 4,486 | | | $ | 5,931 | | | (24)% | |
| Non-GAAP adjustments/Pro forma non-GAAP adjustments (excludes deal-related amortization) | | 152 | | | 107 | | | | | | 261 | | | (1,503) | | | | |
| Deal-related amortization | | 259 | | | 256 | | | | | | 1,039 | | | 902 | | | | |
| | | | | | | | | | | | | | |
| Divestitures | | — | | | 1 | | | | | | — | | | (13) | | | | |
| Adjusted operating profit/Non-GAAP pro forma adjusted operating profit * | | $ | 1,419 | | | $ | 1,212 | | | 17% | | | $ | 5,786 | | | $ | 5,315 | | | 9% | |
| | | | | | | | | | | | | | |
| | | | | | | | | | | | | | | |
| Corporate Unallocated Expense | Corporate unallocated expense/Pro forma corporate unallocated expense * | | $ | (120) | | | $ | (137) | | | 12% | | | $ | (502) | | | $ | (655) | | | 23% | |
| Non-GAAP adjustments/Pro forma non-GAAP adjustments (excludes deal-related amortization) (g) | | 72 | | | 114 | | | | | | 352 | | | 564 | | | | |
| Deal-related amortization | | 1 | | | 3 | | | | | | 3 | | | 3 | | | | |
| | | | | | | | | | | | | | |
| Adjusted corporate unallocated expense/Non-GAAP pro forma adjusted unallocated expense * | | $ | (47) | | | $ | (20) | | | N/M | | | $ | (147) | | | $ | (86) | | | (70)% | |
| | | | | | | | | | | | | | | |
| | | | | | | | | | | | | | | |
| Equity in Income on Unconsolidated Subsidiaries | Equity in income on unconsolidated subsidiaries/Pro forma equity in income on unconsolidated subsidiaries * | | $ | 3 | | | $ | 6 | | | (58)% | | | $ | 36 | | | $ | 35 | | | 3% | |
| Non-GAAP adjustments/Pro forma non-GAAP adjustments (excludes deal-related amortization) (h) | | 2 | | | — | | | | | | 2 | | | — | | | | |
| Deal-related amortization | | 14 | | | 13 | | | | | | 56 | | | 54 | | | | |
| | | | | | | | | | | | | | |
| Adjusted equity in income on unconsolidated subsidiaries/Non-GAAP pro forma adjusted equity in income on unconsolidated subsidiaries * | | $ | 18 | | | $ | 19 | | | (5)% | | | $ | 93 | | | $ | 90 | | | 3% | |
| | | | | | | | | | | | | | | |
| | | | | | | | | | | | | | | |
| Total SPGI | Operating profit/Pro forma operating profit * | | $ | 890 | | | $ | 717 | | | 24% | | | $ | 4,020 | | | $ | 5,311 | | | (24)% | |
| Non-GAAP adjustments/Pro forma non-GAAP adjustments (excludes deal-related amortization) (a) (b) (c)(d) (e) (f) (g) (h) | | 226 | | | 221 | | | | | | 615 | | | (938) | | | | |
| Deal-related amortization | | 273 | | | 272 | | | | | | 1,097 | | | 959 | | | | |
| | | | | | | | | | | | | | |
| Divestitures | | — | | | 1 | | | | | | — | | | (13) | | | | |
| Adjusted operating profit/Non-GAAP pro forma adjusted operating profit * | | $ | 1,390 | | | $ | 1,211 | | | 15% | | | $ | 5,732 | | | $ | 5,319 | | | 8% | |
| | | | | | | | | | | | | | | |
Adjusted Other (Income) Expense, Net/Non-GAAP Pro Forma Other Income, Net
| | | | | | | | | | | | | | | | | | | | | | | | | | | | | | | | | | | | | | | | | | | | |
| (unaudited) | | Three Months | | | Twelve Months | |
| | 2023 | | 2022 | | % Change | | | 2023 | | 2022 | | % Change | |
| | | | | | | | | | | | | | |
| Other expense (income), net/Pro forma other expense (income), net * | | $ | 19 | | | $ | 17 | | | 23% | | | $ | 15 | | | $ | (67) | | | N/M | |
| Non-GAAP adjustments/Pro forma non-GAAP adjustments (excludes deal-related amortization) | | (23) | | | (13) | | | | | | (23) | | | (13) | | | | |
| | | | | | | | | | | | | | |
| Adjusted other (income) expense, net/Non-GAAP pro forma other income, net * | | $ | (4) | | | $ | 3 | | | N/M | | | $ | (9) | | | $ | (80) | | | 89% | |
| | | | | | | | | | | | | | | |
Interest Expense, Net/Adjusted Interest Expense, Net/Non-GAAP Pro Forma Adjusted Interest Expense, Net
| | | | | | | | | | | | | | | | | | | | | | | | | | | | | | | | | | | | | | | | | | | | |
| (unaudited) | | Three Months | | | Twelve Months | |
| | 2023 | | 2022 | | % Change | | | 2023 | | 2022 | | % Change | |
| | | | | | | | | | | | | | |
| Interest expense, net/Pro forma interest expense, net * | | $ | 76 | | | $ | 86 | | | (12)% | | | $ | 334 | | | $ | 369 | | | (9)% | |
| Non-GAAP adjustments/Pro forma non-GAAP adjustments (i) | | 7 | | | — | | | | | | 27 | | | (31) | | | | |
| | | | | | | | | | | | | | |
| | | | | | | | | | | | | | |
| Interest expense, net/Adjusted interest expense, net/Non-GAAP pro forma adjusted interest expense, net * | | $ | 83 | | | $ | 86 | | | (4)% | | | $ | 361 | | | $ | 339 | | | 6% | |
| | | | | | | | | | | | | | | |
Adjusted Provision for Income Taxes/Non-GAAP Pro Forma Adjusted Provision for Income Taxes | | | | | | | | | | | | | | | | | | | | | | | | | | | | | | | | | | | | | | | | | | | | |
| (unaudited) | | Three Months | | | Twelve Months | |
| | 2023 | | 2022 | | % Change | | | 2023 | | 2022 | | % Change | |
| | | | | | | | | | | | | | |
| Provision for income taxes/Pro forma provision for income taxes * | | $ | 151 | | | $ | 127 | | | 18% | | | $ | 778 | | | $ | 1,201 | | | (35)% | |
| Pro forma non-GAAP adjustments (a) (b) (c)(d) (e) (f) (g) (h) (i) (j) (k) | | 41 | | | 44 | | | | | | 52 | | | (382) | | | | |
| Deal-related amortization | | 66 | | | 62 | | | | | | 264 | | | 219 | | | | |
| | | | | | | | | | | | | | |
| Divestitures | | — | | | — | | | | | | — | | | (4) | | | | |
| Adjusted provision for income taxes/Non-GAAP pro forma adjusted provision for income taxes * | | $ | 258 | | | $ | 234 | | | 11% | | | $ | 1,094 | | | $ | 1,036 | | | 6% | |
| | | | | | | | | | | | | | | |
Adjusted Effective Tax Rate/Non-GAAP Pro Forma Adjusted Effective Tax Rate
| | | | | | | | | | | | | | | | | | | | | | | | | | | | | | | | | | | | | | | | | | | | |
| (unaudited) | | Three Months | | | Twelve Months | |
| | 2023 | | 2022 | | % Change | | | 2023 | | 2022 | | % Change | |
| | | | | | | | | | | | | | |
| Adjusted operating profit/Non-GAAP pro forma adjusted operating profit * | | $ | 1,390 | | | $ | 1,211 | | | 15% | | | $ | 5,732 | | | $ | 5,319 | | | 8% | |
| Adjusted other expense (income), net/Non-GAAP pro forma adjusted other expense (income), net * | | (4) | | | 3 | | | | | | (9) | | | (80) | | | | |
| Interest expense, net/Adjusted interest expense, net/Non-GAAP pro forma adjusted interest expense, net * | | 83 | | | 86 | | | | | | 361 | | | 339 | | | | |
| Adjusted income before taxes on income/Non-GAAP pro forma adjusted income before taxes on income * | | $ | 1,311 | | | $ | 1,122 | | | 17% | | | $ | 5,380 | | | $ | 5,060 | | | 6% | |
| Adjusted provision for income taxes/Non-GAAP pro forma adjusted provision for income taxes * | | $ | 258 | | | $ | 234 | | | | | | $ | 1,094 | | | $ | 1,036 | | | | |
Adjusted effective tax rate/Non-GAAP pro forma adjusted effective tax rate 1 * | | 19.7 | % | | 20.8 | % | | | | | 20.3 | % | | 20.5 | % | | | |
| | | | | | | | | | | | | | | |
1 The adjusted effective tax rate is calculated by dividing provision for income taxes by the adjusted income before taxes, which includes income from unconsolidated subsidiaries. The adjusted effective tax rate excluding income from unconsolidated subsidiaries for the three months ended December 31, 2023 and 2022 was 20.0% and 21.2%, respectively. The adjusted effective tax rate excluding income from unconsolidated subsidiaries for the twelve months ended December 31, 2023 and 2022 was 20.7% and 20.8%, respectively.
Net Income Attributable to Noncontrolling Interests/
Non-GAAP Pro Forma Adjusted Net Income Attributable to Noncontrolling Interests
| | | | | | | | | | | | | | | | | | | | | | | | | | | | | | | | | | | | | | | | | | | | |
| (unaudited) | | Three Months | | | Twelve Months | |
| | 2023 | | 2022 | | % Change | | | 2023 | | 2022 | | % Change | |
| | | | | | | | | | | | | | |
| Net income attributable to noncontrolling interests/Pro forma net income attributable to noncontrolling interests * | | $ | 65 | | | $ | 61 | | | 7% | | | $ | 267 | | | $ | 274 | | | (3)% | |
| Non-GAAP adjustments (l) | | — | | | — | | | | | | — | | | (14) | | | | |
| | | | | | | | | | | | | | |
| Net income attributable to noncontrolling interests/Non-GAAP pro forma adjusted net income attributable to noncontrolling interests * | | $ | 65 | | | $ | 61 | | | 7% | | | $ | 267 | | | $ | 260 | | | 3% | |
| | | | | | | | | | | | | | | |
Adjusted Net Income attributable to SPGI and Diluted EPS/Non-GAAP Pro Forma Adjusted Net Income
attributable to SPGI and Diluted EPS
| | | | | | | | | | | | | | | | | | | | | | | | | | | | | | | | | | | | | | | | | | | | | | | |
| (unaudited) | | 2023 | | | 2022 | | | % Change | |
| | Net Income attributable to SPGI | | Diluted EPS | | | Net Income attributable to SPGI | | Diluted EPS | | | Net Income attributable to SPGI | | Diluted EPS | |
| | | | | | | | | | | | | | | |
| | Three Months | | | | | | |
| Reported | | $ | 579 | | | $ | 1.83 | | | | $ | 433 | | | $ | 1.33 | | | | 34% | | 38% | |
| Non-GAAP adjustments | | 202 | | | 0.64 | | | | 184 | | | 0.56 | | | | | | | |
| Deal-related amortization | | 208 | | | 0.66 | | | | 210 | | | 0.64 | | | | | | | |
| | | | | | | | | | | | | | | |
| Divestitures | | — | | | — | | | | 1 | | | — | | | | | | | |
| Adjusted | | $ | 988 | | | $ | 3.13 | | | | $ | 827 | | | $ | 2.54 | | | | 19% | | 23% | |
| | | | | | | | | | | | | | | | |
| | Twelve Months | | | | | | |
| Reported/Pro forma * | | $ | 2,626 | | | $ | 8.23 | | | | $ | 3,543 | | | $ | 10.53 | | | | (26)% | | (22)% | |
| Adjusted non-GAAP adjustments/Pro forma non-GAAP adjustments | | 560 | | | 1.75 | | | | (507) | | | (1.51) | | | | | | | |
| Adjusted deal-related amortization/Pro forma deal-related amortization | | 833 | | | 2.61 | | | | 740 | | | 2.20 | | | | | | | |
| | | | | | | | | | | | | | | |
| Divestitures | | — | | | — | | | | (9) | | | (0.03) | | | | | | | |
| Adjusted/Non-GAAP pro forma adjusted * | | $ | 4,019 | | | $ | 12.60 | | | | $ | 3,765 | | | $ | 11.19 | | | | 7% | | 13% | |
| | | | | | | | | | | | | | | |
N/M - Represents a change equal to or in excess of 100% or not meaningful
* - The twelve months ended December 31,2022 include pro forma and non-GAAP pro forma adjusted measures. For pro forma to Non-GAAP pro forma adjusted reconciliations refer to Exhibit 99.2 of the current report on Form 8-K furnished on February 8, 2024.
Note - Totals presented may not sum due to rounding.
Note - Adjusted operating profit margin for Market Intelligence, Ratings, Commodity Insights, Mobility and Indices was 34%, 53%, 44%, 34% and 66%, respectively, for the three months ended December 31, 2023. Adjusted operating profit margin for the Company was 44% for the three months ended December 31, 2023. Adjusted operating profit margin for Market Intelligence, Ratings, Commodity Insights, Mobility, Indices and Engineering Solutions was 33%, 57%, 46%, 39%, 69% and 15% for the twelve months ended December 31, 2023. Adjusted operating profit margin for the Company was 46% for the twelve months ended December 31, 2023. Adjusted operating profit margin is calculated as adjusted operating profit divided by revenue. Non-GAAP pro forma adjusted operating profit margin is calculated as non-GAAP pro forma adjusted operating profit divided by non-GAAP pro forma adjusted revenue.
(a) The three and twelve months ended December 31, 2023 include acquisition-related costs of $69 million ($69 million after-tax), employee severance charges of $49 million ($37 million after-tax) and $90 million ($67 million after-tax), respectively, and IHS Markit merger costs of $12 million ($10 million after-tax) and $49 million ($37 million after-tax), respectively. The twelve months ended December 31, 2023 include a gain on disposition of $46 million ($34 million after-tax), an asset impairment of $5 million ($4 million after-tax) and an asset write off of $1 million (less than $1 million after-tax). The three and twelve months ended December 31, 2022 include employee severance charges of $46 million ($35 million after-tax) and $90 million ($69 million after-tax), respectively, IHS Markit merger costs of $14 million ($11 million after-tax) and $35 million ($27 million after-tax), respectively, and a gain on dispositions of $1 million ($1 million after-tax) and $1.8 billion ($1.4 billion after-tax), respectively. The twelve months ended December 31, 2022 include acquisition-related costs of $2 million ($2 million after-tax).
(b) The three and twelve months ended December 31, 2023 include employee severance charges of $2 million ($2 million after- tax) and $10 million ($8 million after-tax), respectively, and an asset impairment of $1 million ($1 million after-tax). The three and twelve months ended December 31, 2022 include employee severance charges of $11 million ($8 million after-tax) and $24 million ($19 million after-tax), respectively, and legal costs of $5 million ($4 million after-tax). The twelve months ended December 31, 2022 include an asset write-off of $1 million ($1 million after-tax).
(c) The three and twelve months ended December 31, 2023 include IHS Markit merger costs of $6 million ($5 million after-tax) and $35 million ($26 million after-tax), respectively, employee severance charges of $4 million ($3 million after- tax) and $26 million ($20 million after-tax), respectively and acquisition-related costs of $2 million ($2 million after-tax). The three and twelve months ended December 31, 2022 include IHS Markit merger costs of $10 million ($7 million after-tax) and $26 million ($20 million after-tax), respectively, and employee severance charges of $7 million ($5 million after-tax) and $45 million ($35 million after-tax), respectively.
(d) The three and twelve months ended December 31, 2023 include employee severance charges of $3 million ($2 million after-tax) and $9 million ($7 million after-tax), respectively, IHS Markit merger costs of $1 million ($1 million after-tax) and $3 million ($2 million after-tax), respectively, and acquisition-related costs of $1 million ($1 million after-tax) and $2 million ($2 million after-tax), respectively. The three and twelve months ended December 31, 2022 include IHS Markit merger costs of $2 million ($2 million after-tax) and $3 million ($3 million after-tax), respectively, and employee severance charges of $1 million ($1 million after-tax) and $4 million ($3 million after-tax), respectively. The three and twelve months ended December 31, 2022 include an acquisition-related cost of $1 million ($1 million after-tax) and an acquisition-related benefit of $14 million ($15 million after-tax), respectively.
(e) The three and twelve months ended December 31, 2023 include employee severance charges of $2 million ($1 million after-tax) and $5 million ($4 million after-tax), respectively, and IHS Markit merger costs of $1 million (less than $1 million after-tax) and $4 million ($3 million after-tax), respectively. The twelve months ended December 31, 2023 include a gain on disposition of $4 million ($3 million after-tax). The three and twelve months ended December 31, 2022 include employee severance charges of $10 million ($8 million after-tax) and $14 million ($11 million after-tax), respectively. The twelve months ended December 31, 2022 include a gain on disposition of $52 million ($43 million after-tax) and IHS Markit merger costs of $2 million ($1 million after-tax).
(f) As of May 2, 2023, we completed the sale of Engineering Solutions and the results are included through that date. The twelve months ended December 31, 2022 include employee severance charges of $4 million ($4 million after-tax).
(g) The three and twelve months ended December 31, 2023 include IHS Markit merger costs of $43 million ($33 million after-tax) and $147 million ($111 million after-tax), respectively, employee severance charges of $23 million ($18 million after- tax) and $43 million ($33 million after-tax), respectively, disposition-related costs of $5 million ($4 million after-tax) and $24 million ($21 million after-tax), respectively, acquisition-related costs of $1 million ($1 million after- tax) and $4 million ($3 million after-tax), respectively, and lease impairments of $1 million ($1 million after- tax) and $14 million ($10 million after-tax), respectively. The twelve months ended December 31, 2023 include a loss on disposition of $120 million ($183 million after-tax). The three and twelve months ended December 31, 2022 include IHS Markit merger costs of $69 million ($53 million after-tax) and $553 million ($437 million after-tax), respectively, employee severance charges of $20 million ($15 million after-tax) and $107 million ($81 million after-tax), respectively, acquisition-related costs of $1 million ($1 million after-tax) and $8 million ($4 million after-tax), respectively, and disposition-related costs of $24 million ($18 million after-tax). The twelve months ended December 31, 2022 include a S&P Foundation grant of $200 million ($151 million after-tax), a gain on acquisition of $10 million ($10 million after-tax), an asset impairment of $9 million ($7 million after-tax), lease impairments of $5 million ($3 million after-tax) and an asset write-off of $3 million ($3 million after-tax).
(h) The three and twelve months ended December 31, 2023 include an asset impairment of $2 million ($2 million after-tax).
(i) The three and twelve months ended December 31, 2023 include a premium amortization benefit of $7 million ($5 million after-tax) and $27 million ($20 million after-tax), respectively.
(j) The three and twelve months ended December 31, 2022 include a gain on the extinguishment of debt of $7 million ($5 million after-tax) and loss on extinguishment of debt of $8 million ($6 million after-tax), respectively.
(k) The twelve months ended December 31, 2023 include a tax benefit of $16 million associated with a disposition. The three months ended December 31, 2022 include tax benefit of $10 million due to annualized effective tax rate differences for GAAP and the twelve months ended December 31, 2022 include tax expense of $157 million associated with a gain on dispositions.
(l) The twelve months ended December 31, 2022 includes an adjustment related to the JV Partner’s portion of the gain on the disposition of the L100 Index as part of the sale of LCD to Morningstar.
S&P Global
Adjusted Expenses/Non-GAAP Pro Forma Adjusted Expenses
Three months ended December 31, 2023 and 2022
(dollars in millions)
| | | | | | | | | | | | | | | | | | | | | | | | | | |
| (unaudited) | | Three Months |
| | | 2023 | | 2022 | | % Change | |
| | | | | | | | |
| Market Intelligence | Expenses | | $ | 1,012 | | | $ | 915 | | | 11% | |
| Non-GAAP adjustments (a) | | (130) | | | (59) | | | | |
| Deal-related amortization | | (140) | | | (144) | | | | |
| Divestitures | | — | | | (1) | | | | |
| Adjusted expenses | | $ | 741 | | | $ | 711 | | | 4% | |
| | | | | | | | |
| | | | | | | | |
| Ratings | Expenses | | 396 | | | 385 | | | 3% | |
| Non-GAAP adjustments (b) | | (4) | | | (16) | | | | |
| Deal-related amortization | | (2) | | | (2) | | | | |
| Adjusted expenses | | $ | 391 | | | $ | 367 | | | 6% | |
| | | | | | | | |
| | | | | | | | |
| Commodity Insights | Expenses | | $ | 320 | | | $ | 301 | | | 6% | |
| Non-GAAP adjustments (c) | | (11) | | | (17) | | | | |
| Deal-related amortization | | (32) | | | (34) | | | | |
| | | | | | | |
| Adjusted expenses | | $ | 277 | | | $ | 250 | | | 10% | |
| | | | | | | | |
| | | | | | | | |
| Mobility | Expenses | | 331 | | | 297 | | | 11% | |
| Non-GAAP adjustments (d) | | (5) | | | (5) | | | | |
| Deal-related amortization | | (76) | | | (65) | | | | |
| Adjusted expenses | | $ | 250 | | | $ | 228 | | | 10% | |
| | | | | | | | |
| | | | | | | | |
| Indices | Expenses | | 133 | | | 149 | | | (11)% | |
| Non-GAAP adjustments (e) | | (2) | | | (10) | | | | |
| Deal-related amortization | | (9) | | | (9) | | | | |
| Adjusted expenses | | $ | 122 | | | $ | 130 | | | (6)% | |
| | | | | | | | |
| | | | | | | | |
| Engineering Solutions | Expenses | | — | | | 86 | | | N/M | |
| | | | | | | |
| Deal-related amortization | | — | | | (2) | | | | |
| Adjusted expenses | | $ | — | | | $ | 84 | | | N/M | |
| | | | | | | | |
| | | | | | | | |
| Corporate Unallocated Expense | Corporate Unallocated expense | | 120 | | | 137 | | | (12)% | |
| Non-GAAP adjustments (f) | | (72) | | | (114) | | | | |
| Deal-related amortization | | (1) | | | (3) | | | | |
| Adjusted Corporate Unallocated expenses | | $ | 47 | | | $ | 20 | | | N/M | |
| | | | | | | | |
| | | | | | | | | | | | | | | | | | | | | | | | | | |
| (unaudited) | | Three Months |
| | | 2023 | | 2022 | | % Change | |
| | | | | | | | |
| Equity in Income on Unconsolidated Subsidiaries | Equity in income on unconsolidated subsidiaries | | (3) | | | (6) | | | 58% | |
| Non-GAAP adjustments (g) | | (2) | | | — | | | | |
| Deal-related amortization | | (14) | | | (13) | | | | |
| Adjusted equity in income on unconsolidated subsidiaries | | $ | (18) | | | $ | (19) | | | 5% | |
| | | | | | | | |
| | | | | | | | |
| Total SPGI | Expenses | | $ | 2,262 | | | $ | 2,220 | | | 2% | |
| Non-GAAP adjustments (a)(b)(c)(d)(e)(f)(g) | | (226) | | | (221) | | | | |
| Deal-related amortization | | (273) | | | (272) | | | | |
| Divestitures | | — | | | (1) | | | | |
| Adjusted expenses | | $ | 1,762 | | | $ | 1,726 | | | 2% | |
| | | | | | | | |
| | | | | | | | | | | | | | | | | | | | | | | | | | |
| (unaudited) | | Twelve Months |
| | | 2023 | | 2022 | | % Change | |
| | | | | | | | |
| Total SPGI | Expenses/Pro forma expenses | | $ | 8,477 | | | $ | 6,553 | | | 29% | |
| Non-GAAP adjustments/Pro forma non-GAAP adjustments (h) | | (615) | | | 938 | | | | |
| Deal-related amortization | | (1,097) | | | (959) | | | | |
| Divestitures | | — | | | (9) | | | | |
| Adjusted expenses/Non-GAAP pro forma adjusted expenses | | $ | 6,765 | | | $ | 6,523 | | | 4% | |
| | | | | | | | |
N/M - Represents a change equal to or in excess of 100% or not meaningful
Note - Totals presented may not sum due to rounding.
(a) The three months ended December 31, 2023 include acquisition-related costs of $69 million ($69 million after-tax), employee severance charges of $49 million ($37 million after-tax) and IHS Markit merger costs of $12 million ($10 million after-tax). The three months ended December 31, 2022 include employee severance charges of $46 million ($35 million after-tax), IHS Markit merger costs of $14 million ($11 million after-tax) and gain on dispositions of $1 million ($1 million after-tax).
(b) The three months ended December 31, 2023 include employee severance charges of $2 million ($2 million after-tax) and an asset impairment of $1 million ($1 million after-tax). The three months ended December 31, 2022 include employee severance charges of $11 million ($8 million after-tax) and legal costs of $5 million ($4 after-tax).
(c) The three months ended December 31, 2023 include IHS Markit merger costs of $6 million ($5 million after-tax), employee severance charges of $4 million ($3 million after-tax) and acquisition-related costs of $2 million ($2 million after-tax). The three months ended December 31, 2022 include IHS merger costs of $10 million ($7 million after-tax) and employee severance charges of $7 million ($5 million after-tax).
(d) The three months ended December 31, 2023 include employee severance charges of $3 million ($2 million after-tax), IHS Markit merger costs of $1 million ($1 million after-tax) and acquisition-related costs of $1 million ($1 million after-tax). The three months ended December 31, 2022 include IHS Markit merger costs of $2 million ($2 million after-tax), employee severance charges of $1 million ($1 million after-tax) and acquisition-related cost of $1 million ($1 million after-tax).
(e) The three months ended December 31, 2023 include employee severance charges of $2 million ($1 million after-tax) and IHS Markit merger costs of $1 million (less than $1 million after-tax). The three months ended December 31, 2022 include employee severance charges of $10 million ($8 million after-tax).
(f) The three months ended December 31, 2023 include IHS Markit merger costs of $43 million ($33 million after-tax), employee severance charges of $23 million ($18 million after-tax), disposition-related costs of $5 million ($4 million after-tax), acquisition-related costs of $1 million ($1 million after-tax) and lease impairments of $1 million ($1 million after-tax). The three months ended December 31, 2022 include IHS Markit merger costs of $69 million ($53 million after-tax), employee severance charges of $20 million ($15 million after-tax), acquisition-related costs $1 million ($1 million after-tax) and disposition-related costs of $24 million ($18 million after-tax).
(g) The three months ended December 31, 2023 include an asset impairment of $2 million ($2 million after- tax).
(h) The twelve months ended December 31, 2023 include IHS Markit merger costs of $236 million ($179 million after-tax), employee severance charges of $184 million ($139 million after-tax), acquisition-related costs of $77 million ($76 million after-tax), loss on dispositions of $70 million ($130 million after-tax), disposition-related costs of $24 million ($21 million after-tax), lease impairments of $14 million ($10 million after-tax), asset impairments of $9 million ($7 million after-tax) and an asset write-off of $1 million ($1 million after-tax). The twelve months ended December 31, 2022 include a gain on disposition of $1.9 billion ($1.3 billion after-tax), IHS Markit merger costs of $619 million ($487 million after-tax), employee severance charges of $289 million ($222 million after-tax), a S&P Foundation grant of $200 million ($151 million after-tax), disposition-related costs of $24 million ($18 million after-tax), a gain on acquisition of $10 million ($10 million after-tax), an asset impairment of $9 million ($7 million after-tax), lease impairments of $5 million ($3 million after-tax), legal costs of $5 million ($4 million after-tax), an asset write-off of $4 million ($3 million after-tax) and an acquisition-related benefit of $4 million ($9 million after-tax).
S&P Global
Revenue Information
Three and twelve months ended December 31, 2023 and 2022
(dollars in millions)
Revenue/Non-GAAP Pro Forma Adjusted Revenue by Type
| | | | | | | | | | | | | | | | | | | | | | | | | | | | | | | | | | | | | | | | | | | | | | | | | | | | | | | | | | | | | | | | | | | | | | | | | | | | | | | | | | | | | | | | | | | | | | | |
| Three Months | | | | | | | | | | | | | | | | | | | | | | | | | | | | | | |
| (unaudited) | | Subscription (a) | | | Non-subscription / Transaction (b) | | | Non-transaction (c) | | | | | | | | | | | | | | | | | | | | | | | |
| | 2023 | | 2022 | | % Change | | | 2023 | | 2022 | | % Change | | | 2023 | | 2022 | | % Change | | | | | | | | | | | | | | | | | | | | | | | | | | | | | | | |
| | | | | | | | | | | | | | | | | | | | | | | | | | | | | | | | | | | | | | | | | | | | | | | | | | | |
| Market Intelligence | | $ | 953 | | | $ | 876 | | | 9% | | | 50 | | | 52 | | | (3)% | | | $ | — | | | $ | — | | | N/M | | | | | | | | | | | | | | | | | | | | | | | | | | | | | | | |
| Ratings | | — | | | — | | | N/M | | | 338 | | | 249 | | | 35% | | | 500 | | | 456 | | | 10% | | | | | | | | | | | | | | | | | | | | | | | | | | | | | | | |
| Commodity Insights | | 446 | | | 404 | | | 10% | | | 28 | | | 31 | | | (9)% | | | — | | | — | | | N/M | | | | | | | | | | | | | | | | | | | | | | | | | | | | | | | |
| Mobility | | 299 | | | 270 | | | 11% | | | 78 | | | 75 | | | 4% | | | — | | | — | | | N/M | | | | | | | | | | | | | | | | | | | | | | | | | | | | | | | |
| Indices | | 71 | | | 68 | | | 4% | | | — | | | — | | | N/M | | | — | | | — | | | N/M | | | | | | | | | | | | | | | | | | | | | | | | | | | | | | | |
| Engineering Solutions | | — | | | 91 | | | N/M | | | — | | | 8 | | | N/M | | | — | | | — | | | N/M | | | | | | | | | | | | | | | | | | | | | | | | | | | | | | | |
| Intersegment elimination | | — | | | — | | | N/M | | | — | | | — | | | N/M | | | (47) | | | (44) | | | (7)% | | | | | | | | | | | | | | | | | | | | | | | | | | | | | | | |
| Revenue | | $ | 1,769 | | | $ | 1,709 | | | 3% | | | $ | 494 | | | $ | 415 | | | 19% | | | $ | 453 | | | $ | 412 | | | 10% | | | | | | | | | | | | | | | | | | | | | | | | | | | | | | | |
| | | | | | | | | | | | | | | | | | | | | | | | | | | | | | | | | | | | | | | | | | | | | | | | | | | |
| | Asset-linked fees (d) | | | Sales usage-based royalties (e) | | | Recurring variable (f) | | | | | | | | | | | | | | | | | | | | | | | |
| | | | | | | | | | | | | | | | | | | | | | | | | | | | | | | | | | | | | | | | | | | | | | | | | | | |
| | | | | | | | | | | | | | | | | | | | | | | | | | | | | | | | | | | | | | | | | | | | | | | | | | | |
| Market Intelligence | | $ | — | | | $ | — | | | N/M | | | $ | — | | | $ | — | | | N/M | | | $ | 124 | | | $ | 109 | | | 14% | | | | | | | | | | | | | | | | | | | | | | | | | | | | | | | |
| Ratings | | — | | | — | | | N/M | | | — | | | — | | | N/M | | | — | | | — | | | N/M | | | | | | | | | | | | | | | | | | | | | | | | | | | | | | | |
| Commodity Insights | | — | | | — | | | N/M | | | 23 | | | 16 | | | 36% | | | — | | | — | | | N/M | | | | | | | | | | | | | | | | | | | | | | | | | | | | | | | |
| Mobility | | — | | | — | | | N/M | | | — | | | — | | | N/M | | | — | | | — | | | N/M | | | | | | | | | | | | | | | | | | | | | | | | | | | | | | | |
| Indices | | 221 | | | 220 | | | —% | | | 68 | | | 56 | | | 22% | | | — | | | — | | | N/M | | | | | | | | | | | | | | | | | | | | | | | | | | | | | | | |
| Engineering Solutions | | — | | | — | | | N/M | | | — | | | — | | | N/M | | | — | | | — | | | N/M | | | | | | | | | | | | | | | | | | | | | | | | | | | | | | | |
| | | | | | | | | | | | | | | | | | | | | | | | | | | | | | | | | | | | | | | | | | | | | | | | | | | |
| Revenue | | $ | 221 | | | $ | 220 | | | —% | | | $ | 91 | | | $ | 72 | | | 26% | | | $ | 124 | | | $ | 109 | | | 14% | | | | | | | | | | | | | | | | | | | | | | | | | | | | | | | |
| | | | | | | | | | | | | | | | | | | | | | | | | | | | | | | | | | | | | | | | | | | | | | | | | | | |
| Twelve Months | | | | | | | | | | | | | | | | | | | | | | | | | | | | | | |
| | Subscription (a) | | | Non-subscription / Transaction (b) | | | Non-transaction (c) | | | | | | | | | | | | | | | | | | | | | | | |
| | 2023 | | 2022 | | % Change | | | 2023 | | 2022 | | % Change | | | 2023 | | 2022 | | % Change | | | | | | | | | | | | | | | | | | | | | | | | | | | | | | | |
| Market Intelligence | | $ | 3,685 | | | $ | 3,443 | | | 7% | | | $ | 187 | | | $ | 183 | | | 2% | | | $ | — | | | $ | — | | | N/M | | | | | | | | | | | | | | | | | | | | | | | | | | | | | | | |
| Ratings | | — | | | — | | | N/M | | | 1,425 | | | 1,241 | | | 15% | | | 1,907 | | | 1,809 | | | 5% | | | | | | | | | | | | | | | | | | | | | | | | | | | | | | | |
| Commodity Insights | | 1,707 | | | 1,569 | | | 9% | | | 158 | | | 140 | | | 13% | | | — | | | — | | | N/M | | | | | | | | | | | | | | | | | | | | | | | | | | | | | | | |
| Mobility | | 1,169 | | | 1,055 | | | 11% | | | 315 | | | 296 | | | 6% | | | — | | | — | | | N/M | | | | | | | | | | | | | | | | | | | | | | | | | | | | | | | |
| Indices | | 277 | | | 274 | | | 1% | | | — | | | — | | | N/M | | | — | | | — | | | N/M | | | | | | | | | | | | | | | | | | | | | | | | | | | | | | | |
| Engineering Solutions | | 125 | | | 359 | | | (65)% | | | 8 | | | 30 | | | (74)% | | | — | | | — | | | N/M | | | | | | | | | | | | | | | | | | | | | | | | | | | | | | | |
| Intersegment elimination | | — | | | — | | | N/M | | | — | | | — | | | N/M | | | (177) | | | (171) | | | (3)% | | | | | | | | | | | | | | | | | | | | | | | | | | | | | | | |
| Revenue/Non-GAAP pro forma adjusted revenue * | | $ | 6,963 | | | $ | 6,700 | | | 4% | | | $ | 2,093 | | | $ | 1,890 | | | 11% | | | $ | 1,730 | | | $ | 1,638 | | | 6% | | | | | | | | | | | | | | | | | | | | | | | | | | | | | | | |
| | | | | | | | | | | | | | | | | | | | | | | | | | | | | | | | | | | | | | | | | | | | | | | | | | | |
| | Asset-linked fees (d) | | | Sales usage-based royalties (e) | | | Recurring variable (f) | | | | | | | | | | | | | | | | | | | | | | | |
| | | | | | | | | | | | | | | | | | | | | | | | | | | | | | | | | | | | | | | | | | | | | | | | | | | |
| | | | | | | | | | | | | | | | | | | | | | | | | | | | | | | | | | | | | | | | | | | | | | | | | | | |
| Market Intelligence | | $ | — | | | $ | — | | | N/M | | | $ | — | | | $ | — | | | N/M | | | $ | 504 | | | $ | 467 | | | 8% | | | | | | | | | | | | | | | | | | | | | | | | | | | | | | | |
| Ratings | | — | | | — | | | N/M | | | — | | | — | | | N/M | | | — | | | — | | | N/M | | | | | | | | | | | | | | | | | | | | | | | | | | | | | | | |
| Commodity Insights | | — | | | — | | | N/M | | | 81 | | | 67 | | | 21% | | | — | | | — | | | N/M | | | | | | | | | | | | | | | | | | | | | | | | | | | | | | | |
| Mobility | | — | | | — | | | N/M | | | — | | | — | | | N/M | | | — | | | — | | | N/M | | | | | | | | | | | | | | | | | | | | | | | | | | | | | | | |
| Indices | | 859 | | | 862 | | | —% | | | 267 | | | 219 | | | 22% | | | — | | | — | | | N/M | | | | | | | | | | | | | | | | | | | | | | | | | | | | | | | |
| Engineering Solutions | | — | | | — | | | N/M | | | — | | | — | | | N/M | | | — | | | — | | | N/M | | | | | | | | | | | | | | | | | | | | | | | | | | | | | | | |
| | | | | | | | | | | | | | | | | | | | | | | | | | | | | | | | | | | | | | | | | | | | | | | | | | | |
| Revenue/Non-GAAP pro forma adjusted revenue * | | $ | 859 | | | $ | 862 | | | —% | | | $ | 348 | | | $ | 286 | | | 22% | | | $ | 504 | | | $ | 467 | | | 8% | | | | | | | | | | | | | | | | | | | | | | | | | | | | | | | |
| | | | | | | | | | | | | | | | | | | | | | | | | | | | | | | | | | | | | | | | | | | | | | | | | | | |
N/M - Represents a change equal to or in excess of 100% or not meaningful.
* - The twelve months ended December 31, 2022 include non-GAAP pro forma adjusted measures. For pro forma to Non-GAAP pro forma adjusted reconciliations refer to Exhibit 99.2 of the current report on Form 8-K furnished on February 8, 2024.
(a) Subscription revenue is primarily derived from distribution of data, valuation services, analytics, third party research, and credit ratings-related information through both feed and web-based channels, market data and market insights along with other information products and software term licenses, and Mobility’s core information products.
(b) Non-subscription / transaction revenue is primarily related to ratings of publicly-issued debt and bank loan ratings.
(c) Non-transaction revenue is primarily related to surveillance of a credit rating, annual fees for customer relationship-based pricing programs, fees for entity credit ratings and global research and analytics at CRISIL. Non-transaction revenue also includes an intersegment revenue elimination charged to Market Intelligence for the rights to use and distribute content and data developed by Ratings.
(d) Asset-linked fees is primarily related to fees based on assets underlying exchange-traded funds, mutual funds and insurance products.
(e) Sales usage-based royalty revenue is primarily related to trading based fees from exchange-traded derivatives and licensing proprietary market price data and price assessments to commodity exchanges.
(f) Recurring variable revenue represents revenue from contracts for services that specify a fee based on, among other factors, the number of trades processed, assets under management, or the number of positions valued.
S&P Global
Non-GAAP Financial Information
Three and twelve months ended December 31, 2023 and 2022
(dollars in millions)
Computation of Free Cash Flow and Adjusted/Non-GAAP Pro Forma Adjusted
Free Cash Flow Excluding Certain Items | | | | | | | | | | | | | | | | | | | | | | | | | | | | | | | | |
| (unaudited) | | Three Months | | | Twelve Months | |
| | 2023 | | 2022 | | | 2023 | | 2022 | |
| Cash provided by operating activities | | $ | 1,334 | | | $ | 1,113 | | | | $ | 3,710 | | | $ | 2,603 | | |
| Capital expenditures | | (48) | | | (28) | | | | (143) | | | (89) | | |
| Distributions to noncontrolling interest holders | | (69) | | | (73) | | | | (280) | | | (270) | | |
| Free cash flow | | $ | 1,217 | | | $ | 1,012 | | | | $ | 3,287 | | | $ | 2,244 | | |
| IHS Markit merger costs | | 97 | | | 177 | | | | 500 | | | 727 | | |
| Tax on gain from sale of divestitures | | 61 | | | 176 | | | | 230 | | | 704 | | |
| Disposition-related costs | | — | | | — | | | | 40 | | | — | | |
| S&P Foundation grant | | — | | | — | | | | — | | | 200 | | |
| Debt financing derivative | | — | | | — | | | | — | | | 85 | | |
| IHS Markit operating cash outflow prior to acquisition | | — | | | — | | | | — | | | (15) | | |
| Russia suspension costs | | — | | | — | | | | — | | | 10 | | |
| Adjusted/Non-GAAP pro forma adjusted free cash flow excluding certain items | | $ | 1,375 | | | $ | 1,365 | | | | $ | 4,057 | | | $ | 3,955 | | |
| | | | | | | | | | | |
S&P Global
Non-GAAP Guidance
Reconciliation of 2024 Non-GAAP Guidance
| | | | | | | | | | | | | | | | | |
| (unaudited) | | | |
| | | Low | | High | |
| GAAP diluted EPS | | $ | 10.70 | | | $ | 10.95 | | |
| Deal-related amortization | | 2.77 | | | 2.77 | | |
| IHS Markit merger costs | | 0.28 | | | 0.28 | | |
| Premium amortization benefit | | (0.07) | | | (0.07) | | |
| Restructuring | | 0.09 | | | 0.09 | | |
| Tax rate | | (0.02) | | | (0.02) | | |
| Non-GAAP adjusted diluted EPS | | $ | 13.75 | | | $ | 14.00 | | |
| | | | | |