
0

Welcome Chip Merritt Vice President, Investor Relations March 18

2 Welcome to the Inaugural McGraw Hill Financial 2
3 Comparison of Adjusted Information to US GAAP Information This presentation includes adjusted financial measures that are derived from the Company’s continuing operations. This non - GAAP information is provided in order to allow investors to make meaningful comparisons of the Company’s operating performance between periods and to view the Company’s business from the same perspective as Company management. The Company’s quarterly earnings releases contain exhibits that reconcile the differences between the non - GAAP measures and comparable financial measures calculated in accordance with US GAAP.
4 “Safe Harbor” Statement Under the Private Securities Litigation Reform Act of 1995 We caution readers not to place undue reliance on forward - looking statements. • worldwide economic, financial, political and regulatory conditions; • currency and foreign exchange volatility; • the effect of competitive products and pricing; • the level of success of new product development and global expansion; • the level of future cash flows; • the levels of capital investments; • income tax rates; • restructuring charges; • the health of debt and equity markets, including credit quality and spreads, the level of liquidity and future debt issuances; • the level of interest rates and the strength of the capital markets in the US and abroad; • the demand and market for debt ratings, including collateralized debt obligations, residential and commercial mortgage and asset - backed securities and related asset classes; • the state of the credit markets and their impact on Standard & Poor’s Ratings and the economy in general; • the regulatory environment affecting Standard & Poor’s Ratings and our other businesses; • the likely outcome and impact of litigation and investigations on our operations and financial condition; • the level of merger and acquisition activity in the US and abroad; • continued investment by the construction, automotive, and computer industries; • the strength and performance of the domestic and international automotive markets; • the volatility of the energy marketplace; • and the contract value of public works, manufacturing and single - family unit construction. This presentation contains forward - looking statements, including without limitation statements relating to our businesses and ou r prospects, new products, sales, expenses, tax rates, cash flows, and operating and capital requirements that are made pursuant to the safe harbor provisions of the Private Securities Litigation Reform Act of 1995. These forward - looking statements are intended to provide management’s current expectations or plans for our future operating and financial performance and are based on assumptions management believes are reasonable at the time they are made. Forward - looking statements can be identified by the use of words such as “believe,” “expect,” “plan,” “estimate,” “project,” “ta rget,” “anticipate,” “intend,” “may,” “will,” “continue” and other words of similar meaning in connection with a discussion of future operating or financial perfor man ce. These statements are not guarantees of future performance and involve certain risks, uncertainties and assumptions that are difficult to predict; ther efo re, actual outcomes and results could differ materially from what is expected or forecasted. These risks and uncertainties include, among others:
5 EU Regulation Affecting Investors in Credit Rating Agencies European Union Regulation 1060/2009 (as amended) applies to credit rating agencies (CRAs) registered in the European Union and therefore to the activities of Standard & Poor’s Credit Market Services Europe Limited, Standard & Poor’s Credit Market Services France SAS and Standard & Poor’s Credit Market Services Italy Srl , (collectively, “Standard & Poor’s”), indirect wholly - owned subsidiaries of McGraw Hill Financial, Inc., each of which is registered and regulated as a CRA with the European Securities and Markets Authority (“ESMA”). Any person obtaining direct or indirect ownership or control of 5% or more or 10% or more of the shares in McGraw Hill Financial, Inc. may ( i ) impact how Standard & Poor’s can conduct its CRA activities in the European Union and/or (ii) themselves become directly impacted by EU Regulation 1060/2009 (as amended). Persons who have or expect to obtain such shareholdings in McGraw Hill Financial, Inc. should promptly contact Chip Merritt at the McGraw Hill Financial, Inc. Investor Relations department ( chip.merritt@mhfi.com ) for more information and should also obtain independent legal advice in such respect.

6 McGraw Hill Financial Investor Day – Agenda Time Session Speaker 1:00 pm Introduction Chip Merritt , Vice President, Investor Relations 1:05 pm Welcome Remarks & Overview Doug Peterson , President and Chief Executive Officer 1:25 pm Platts Larry Neal , President, Platts 1:40 pm S&P Dow Jones Indices Alex Matturri , Chief Executive Officer, S&P Dow Jones Indices 1:55 pm Q&A – Platts // S&P Dow Jones Indices 2:05 pm J.D. Power Fin O’Neill , President, J.D. Power 2:20 pm S&P Capital IQ Lou Eccleston , President, S&P Capital IQ 2:40 pm Q&A – J.D. Power // S&P Capital IQ 2:50 pm Standard & Poor’s Ratings Services Neeraj Sahai , President, Standard & Poor’s Ratings Services 3:05 pm CRISIL Roopa Kudva , Managing Director and Chief Executive Officer, CRISIL 3:20 pm Q&A – Standard & Poor’s Ratings Services // CRISIL 3:35 pm Legal Update Ken Vittor , Executive Vice President and General Counsel 3:45 pm Financial Performance & Outlook Jack Callahan , Executive Vice President and Chief Financial Officer 4:00 pm Q&A All Presenters 4:30 pm Product Showcase & Cocktail Reception (located in Mercury Ballroom)
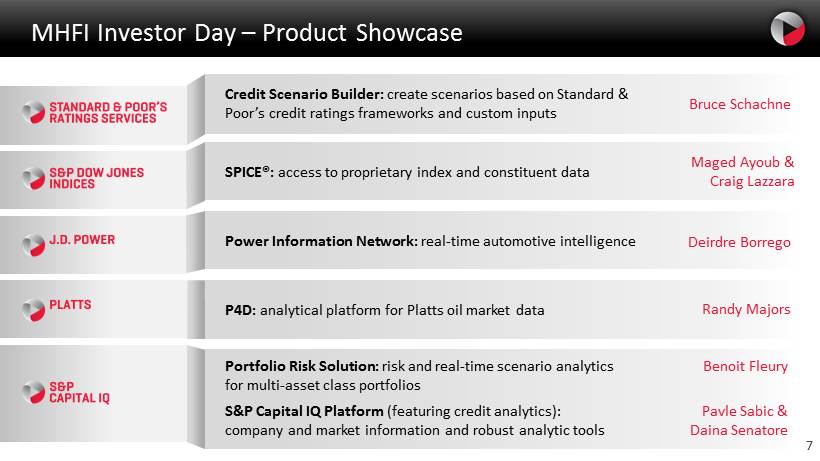
7 MHFI Investor Day – Product Showcase SPICE®: access to proprietary index and constituent data Portfolio Risk Solution: risk and real - time scenario analytics for multi - asset class portfolios S&P Capital IQ Platform (featuring credit analytics ): company and market information and robust analytic tools P4D: analytical platform for Platts oil market data Power Information Network: real - time automotive intelligence Credit Scenario Builder: create scenarios based on Standard & Poor’s credit ratings frameworks and custom inputs Maged Ayoub & Craig Lazzara Benoit Fleury Randy Majors Deirdre Borrego Bruce Schachne Pavle Sabic & Daina Senatore 7

8
Creating Growth & Driving Performance Doug Peterson President and Chief Executive Officer

10 Agenda McGraw Hill Financial: An Exceptional Company 1 2 Creating Growth & Driving Performance

11 Three Years of Exceptional Growth, Profits and Shareholder Returns • Completed the divestiture of Education, Broadcasting and AviationWeek for $2.7B • Returned $4.4B cash to shareholders, through share buy - backs and dividends • Achieved $175M in cost savings, exceeding initial target • Continued portfolio expansion, including joint venture with CME to establish S&P Dow Jones Indices, and nine tuck - in acquisitions Growth & Value Plan (GVP) 2011 - 2013
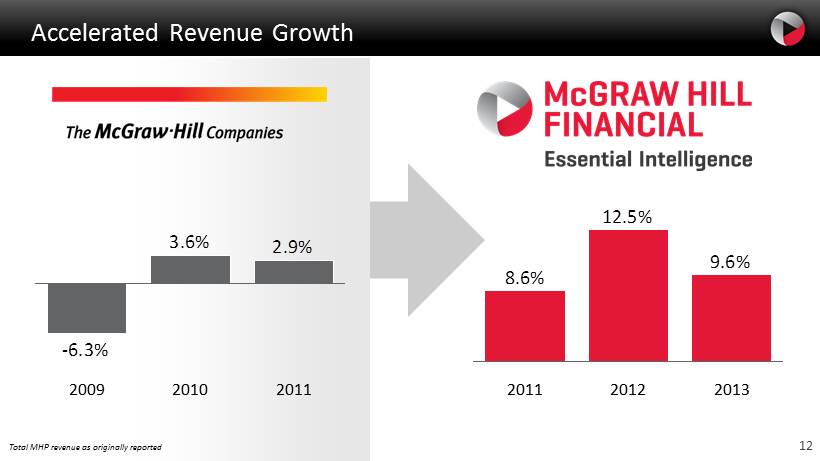
12 Accelerated Revenue Growth 2.9% 3.6% -6.3% 2011 2010 2009 9.6% 12.5% 8.6% 2013 2012 2011 Total MHP revenue as originally reported
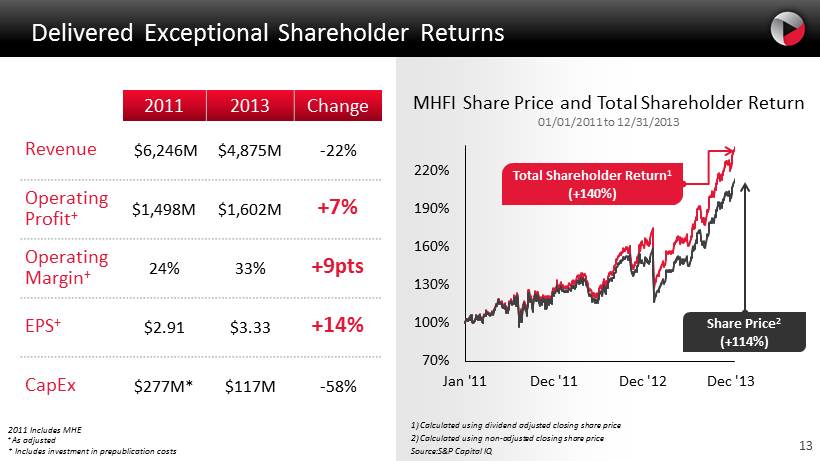
13 Delivered Exceptional Shareholder Returns 2011 2013 Change Revenue $6,246M $4,875M - 22% Operating Profit + $1,498M $1,602M +7% Operating Margin + 24% 33% +9pts EPS + $2.91 $3.33 +14% CapEx $277M* $117M - 58% 70% 100% 130% 160% 190% 220% Jan '11 Dec '11 Dec '12 Dec '13 MHFI Share Price and Total Shareholder Return 01/01/2011 to 12/31/2013 Share Price 2 (+114%) Total Shareholder Return 1 (+140%) 1) Calculated using dividend adjusted closing share price 2) Calculated using non - adjusted closing share price Source: S&P Capital IQ 2011 Includes MHE + As adjusted * Includes investment in prepublication costs
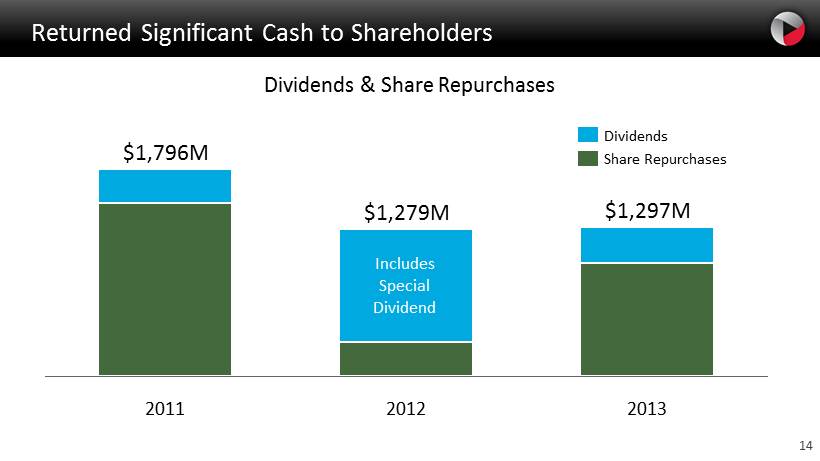
14 Returned Significant Cash to Shareholders Dividends & Share Repurchases $1,297M 2013 2012 $1,279M 2011 $1,796M Share Repurchases Dividends Includes Special Dividend
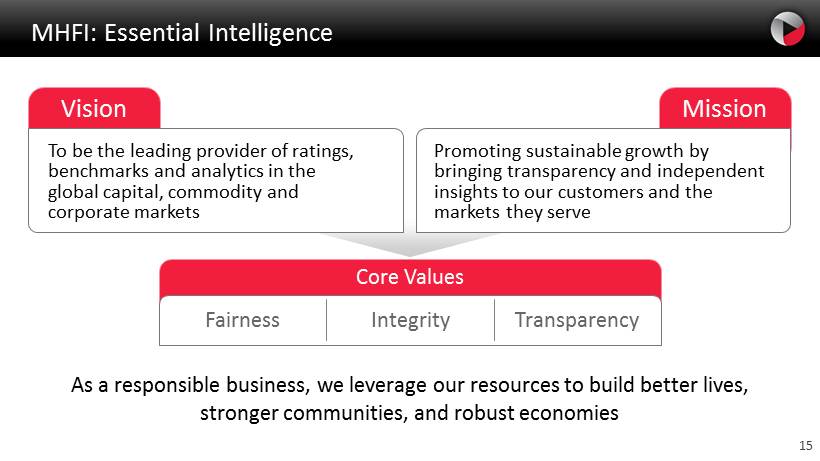
15 Mission MHFI: Essential Intelligence Vision To be the leading provider of ratings, benchmarks and analytics in the global capital, commodity and corporate markets Promoting sustainable growth by bringing transparency and independent insights to our customers and the markets they serve Core Values Integrity Transparency Fairness As a responsible business, we leverage our resources to build better lives, stronger communities, and robust economies

16 An Exceptional Investment Opportunity UNPARALLED ANALYTICS TRULY GLOBAL COMPELLING FINANCIAL ADVANTAGES LEADING BRANDS 16
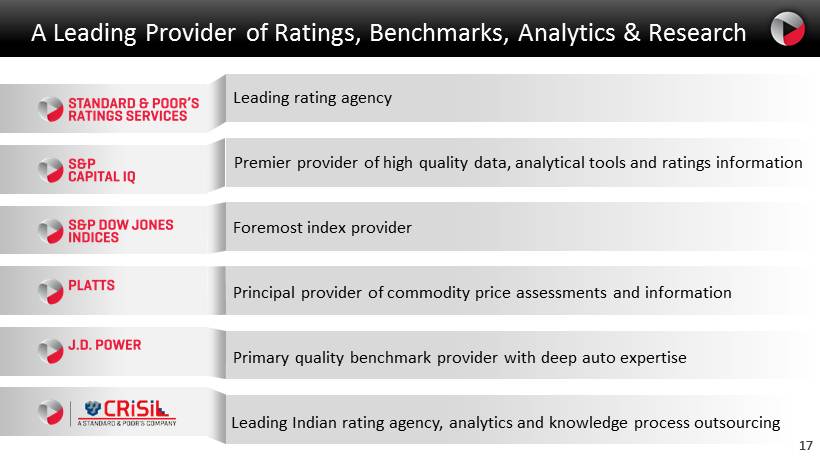
17 A Leading Provider of Ratings, Benchmarks, Analytics & Research Premier provider of high quality data, analytical tools and ratings information Foremost index provider Principal provider of commodity price assessments and information Primary quality benchmark provider with deep auto expertise Leading rating agency Leading Indian rating agency, analytics and knowledge process outsourcing 17
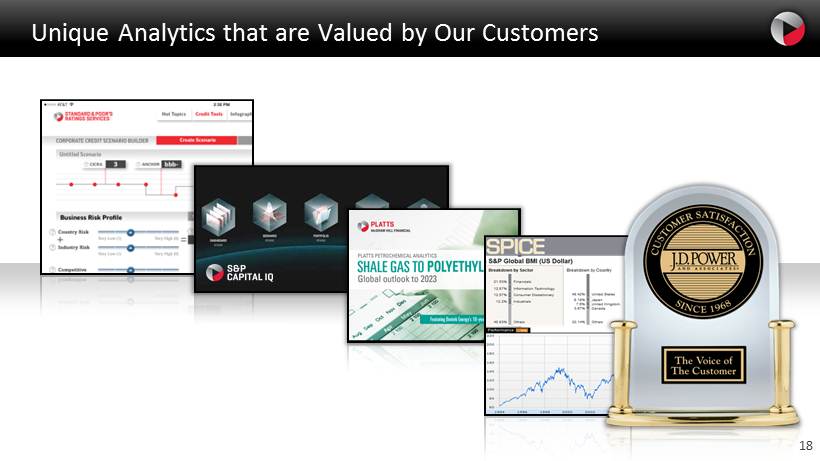
18 Unique Analytics that are Valued by Our Customers
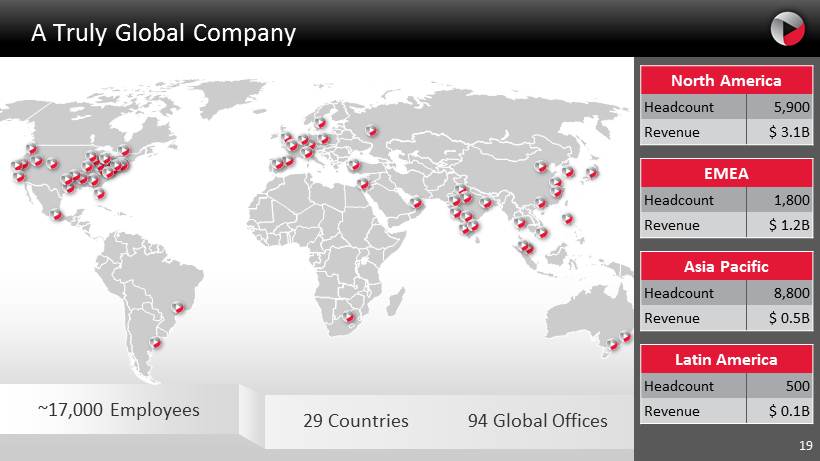
19 A Truly Global Company North America Headcount 5,900 Revenue $ 3.1B 29 Countries 94 Global Offices EMEA Headcount 1,800 Revenue $ 1.2B Asia Pacific Headcount 8,800 Revenue $ 0.5B Latin America Headcount 500 Revenue $ 0.1B ~17,000 Employees 19
20 Compelling Financial Advantages • Well positioned in growth markets • Substantial recurring revenue through subscriptions • High margins • Minimal reinvestment and working capital requirements • Low asset intensity • Strong free cash flow generation 20
21 2 Agenda Creating Growth & Driving Performance 1 McGraw Hill Financial: An Exceptional Company
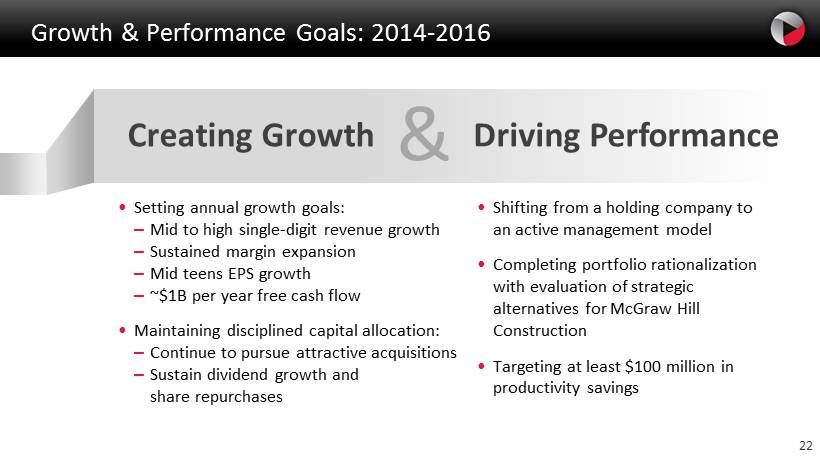
22 Growth & Performance Goals: 2014 - 2016 Creating Growth & Driving Performance • Setting annual growth goals: – Mid to high single - digit revenue growth – Sustained margin expansion – Mid teens EPS growth – ~$1B per year free cash flow • Maintaining disciplined capital allocation: – Continue to pursue attractive acquisitions – Sustain dividend growth and share repurchases • Shifting from a holding company to an active management model • Completing portfolio rationalization with evaluation of strategic alternatives for McGraw Hill Construction • Targeting at least $100 million in productivity savings
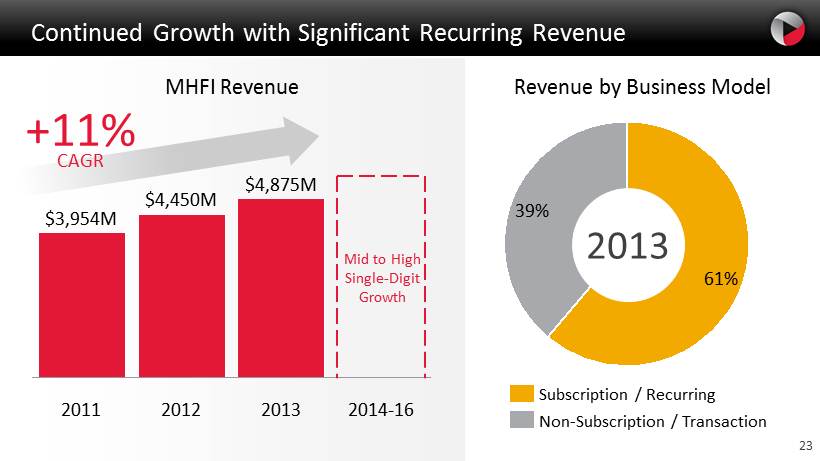
23 Continued Growth with Significant Recurring Revenue 39% 61% MHFI Revenue 2014 - 16 2013 $4,875M 2012 $4,450M 2011 $3,954M Revenue by Business Model Non - Subscription / Transaction Subscription / Recurring Mid to High Single - Digit Growth 2013 +11% CAGR
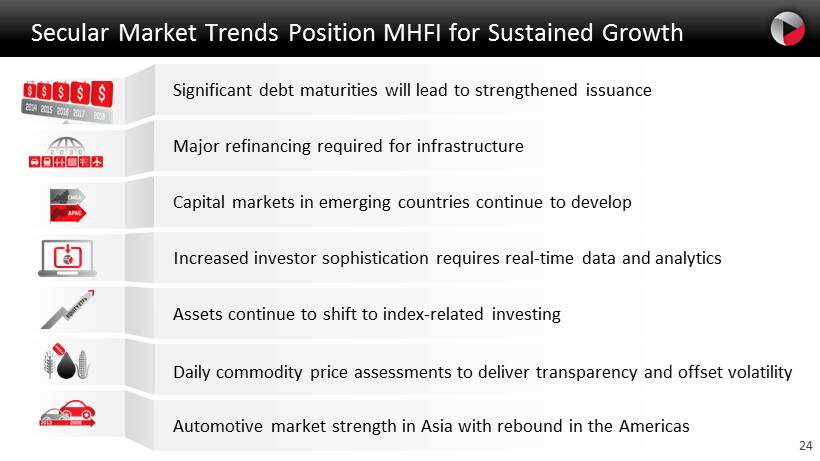
24 Secular Market Trends Position MHFI for Sustained Growth Significant debt maturities will lead to strengthened issuance Major refinancing required for infrastructure Capital markets in emerging countries continue to develop Increased investor sophistication requires real - time data and analytics Assets continue to shift to index - related investing Daily commodity price assessments to deliver transparency and offset volatility Automotive market strength in Asia with rebound in the Americas
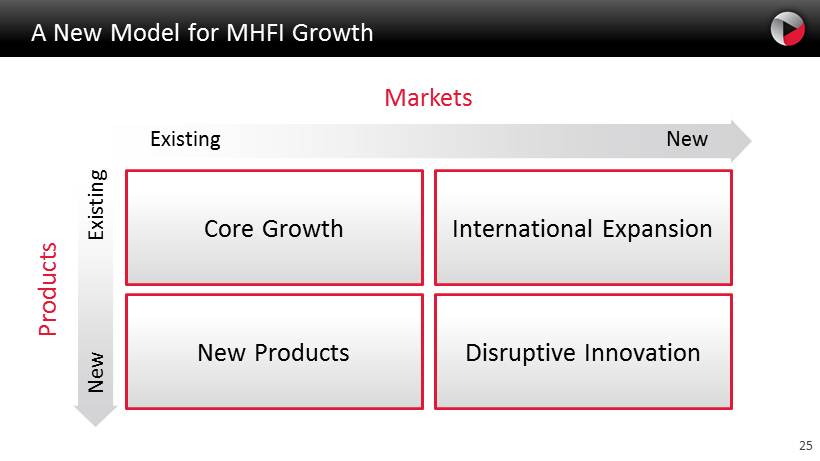
25 A New Model for MHFI Growth Core Growth New Products Disruptive Innovation International Expansion Existing New New Existing Markets Products
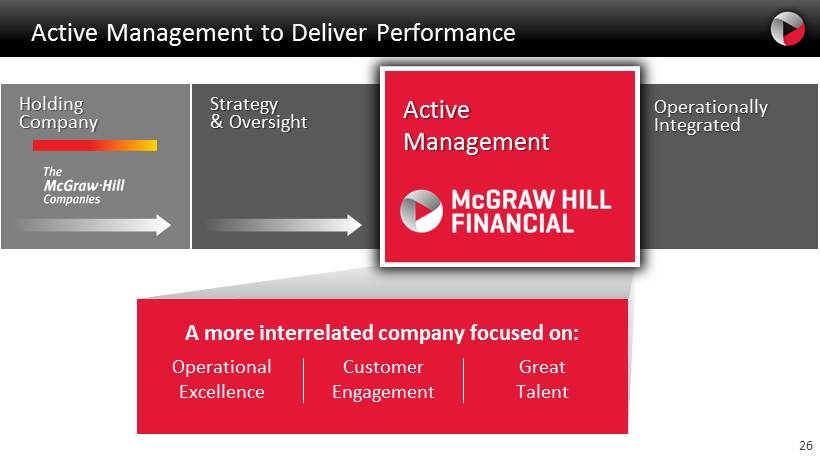
26 A more interrelated company focused on: Operational Excellence Customer Engagement Great Talent Active Management to Deliver Performance Operationally Integrated Holding Company Strategy & Oversight Active Management
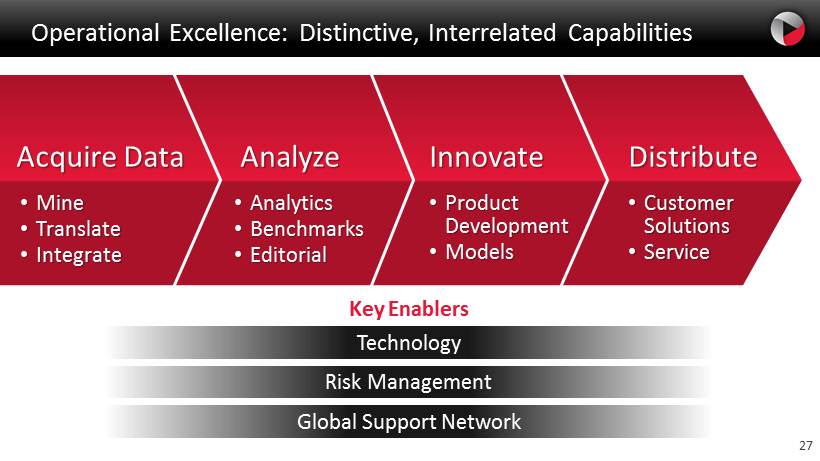
27 Operational Excellence: Distinctive, Interrelated Capabilities Acquire Data • Mine • Translate • Integrate Analyze • Analytics • Benchmarks • Editorial Innovate • Product Development • Models Distribute • Customer Solutions • Service Key Enablers Technology Risk Management Global Support Network
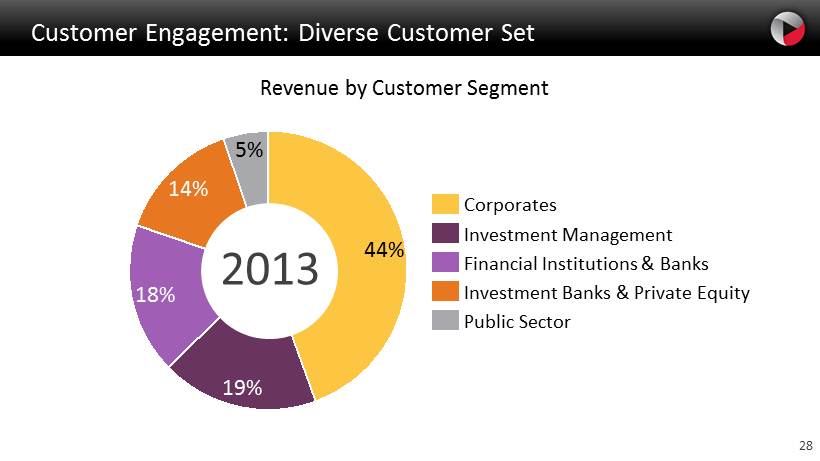
28 Customer Engagement: Diverse Customer Set Revenue by Customer Segment 18% 14% 5% 19% 44% 2013 Public Sector Investment Management Financial Institutions & Banks Corporates Investment Banks & Private Equity
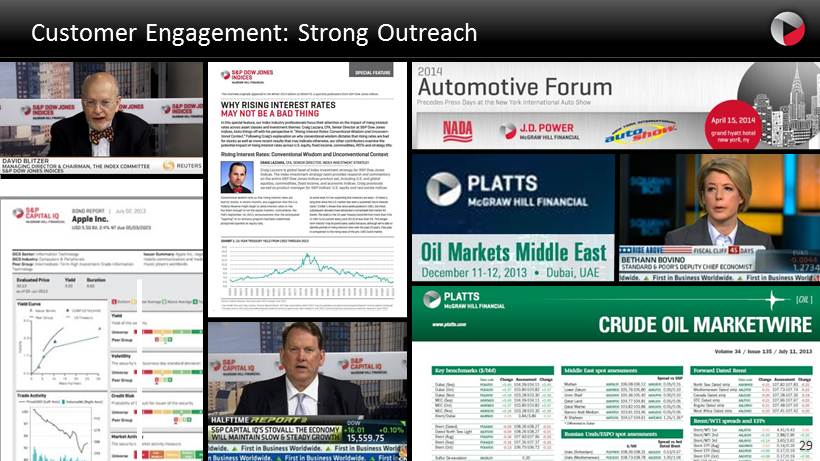
29 Customer Engagement: Strong Outreach 29
30 Great Talent: Foundational to Driving Performance 30
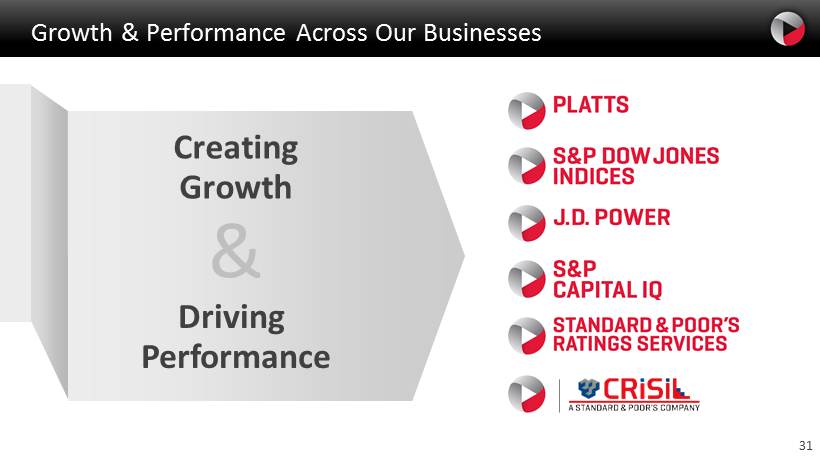
31 Growth & Performance Across Our Businesses & Creating Growth Driving Performance

32

Platts Larry Neal President, Platts
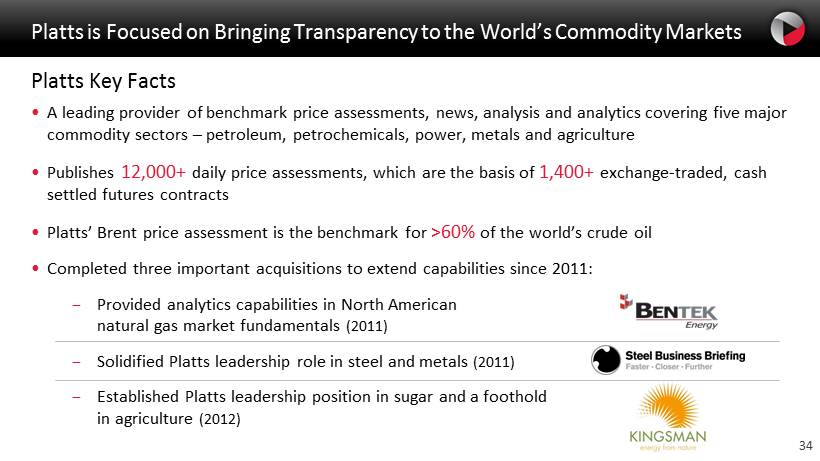
34 Platts is Focused on Bringing Transparency to the World’s Commodity Markets Platts Key Facts • A leading provider of benchmark price assessments, news, analysis and analytics covering five major commodity sectors – petroleum, petrochemicals, power, metals and agriculture • Publishes 12,000+ daily price assessments, which are the basis of 1,400+ exchange - traded, cash settled futures contracts • Platts ’ Brent price assessment is the benchmark for >60% of the world’s crude oil • Completed three important acquisitions to extend capabilities since 2011: − Provided analytics capabilities in North American natural gas market fundamentals (2011 ) − Solidified Platts leadership role in steel and metals (2011 ) − Established Platts leadership position in sugar and a foothold in agriculture (2012 )
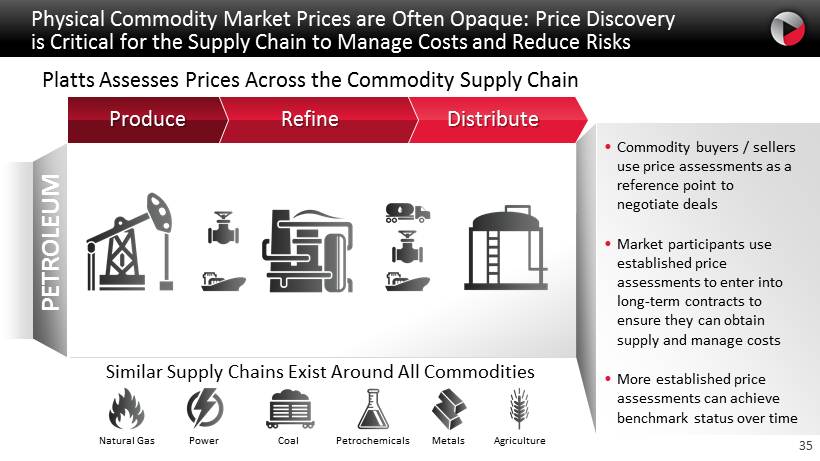
35 Physical Commodity Market Prices are Often Opaque: Price Discovery is Critical for the Supply Chain to Manage Costs and Reduce Risks Refine Produce Distribute PETROLEUM Similar Supply Chains Exist Around All Commodities • Commodity buyers / sellers use price assessments as a reference point to negotiate deals • Market participants use established price assessments to enter into long - term contracts to ensure they can obtain supply and manage costs • More established price assessments can achieve benchmark status over time Platts Assesses Prices Across the Commodity Supply Chain Natural Gas Power Coal Petrochemicals Metals Agriculture
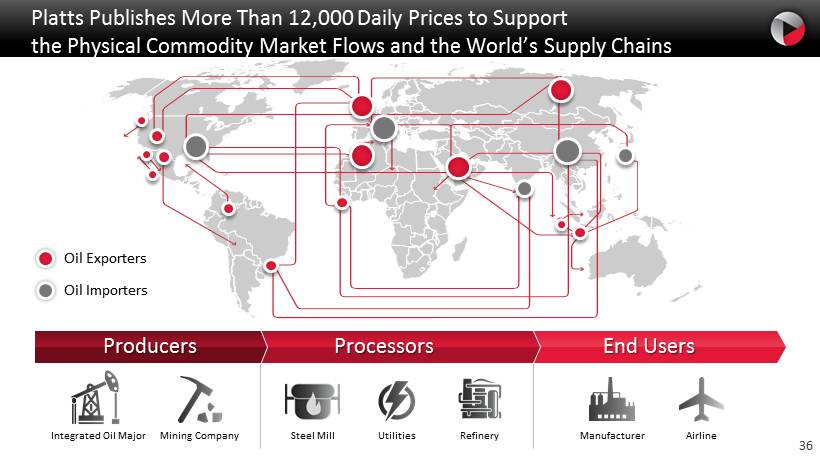
36 Platts Publishes More Than 12,000 Daily Prices to Support the Physical Commodity Market Flows and the World’s Supply Chains Integrated Oil Major Airline Refinery Manufacturer Utilities Mining Company Steel Mill Processors Producers End Users Oil Exporters Oil Importers
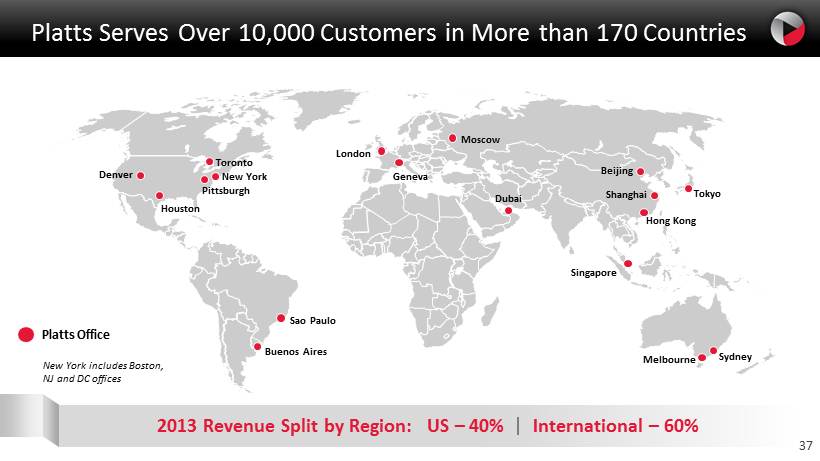
37 Platts Serves Over 10,000 Customers in More than 170 Countries Sao Paulo Pittsburgh New York Toronto London Geneva Moscow Dubai Singapore Hong Kong Tokyo Beijing Shanghai Sydney Platts Office 2013 Revenue Split by Region: US – 40 % International – 60% Buenos Aires Houston Denver Melbourne New York includes Boston, NJ and DC offices
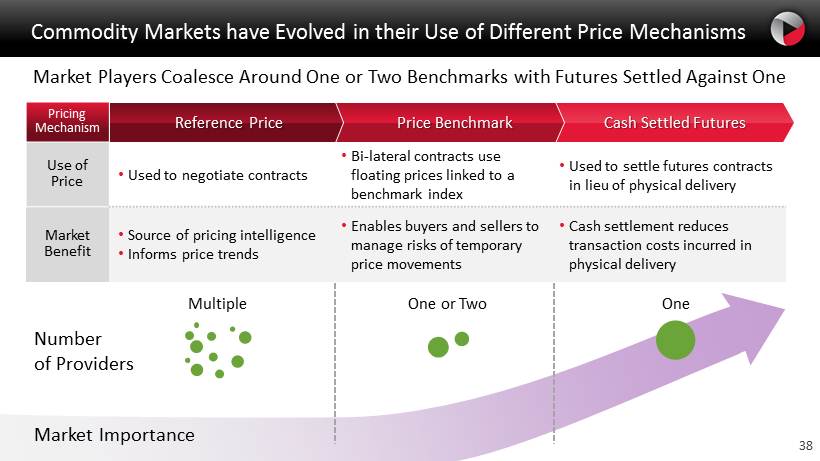
38 Commodity Markets have Evolved in their Use of Different Price Mechanisms Market Players Coalesce Around One or Two Benchmarks with Futures Settled Against One Pricing Mechanism Use of Price • Used to negotiate contracts • Bi - lateral contracts use floating prices linked to a benchmark index • Used to settle futures contracts in lieu of physical delivery Market Benefit • Source of pricing intelligence • Informs price trends • Enables buyers and sellers to manage risks of temporary price movements • Cash settlement reduces transaction costs incurred in physical delivery Reference Price Price Benchmark Cash Settled Futures Market Importance Number of Providers Multiple One or Two One
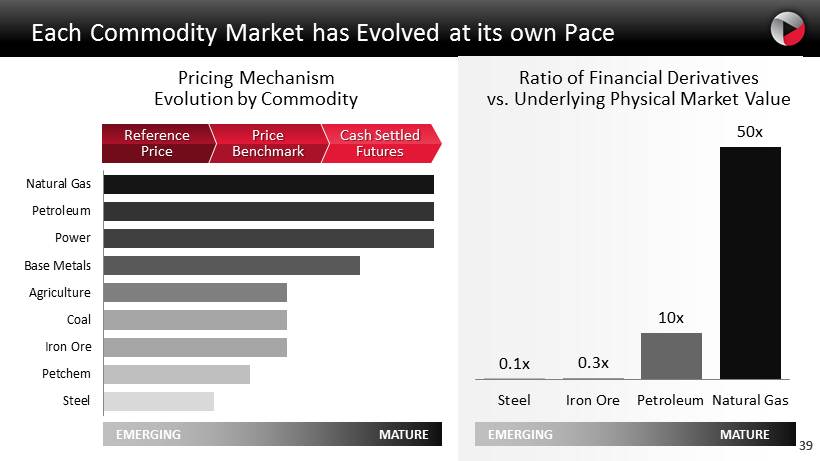
39 Each Commodity Market has Evolved at its own Pace Steel Petchem Iron Ore Coal Agriculture Base Metals Power Petroleum Natural Gas 0.1x 0.3x 10x 50x Steel Iron Ore Petroleum Natural Gas Pricing Mechanism Evolution by Commodity Ratio of Financial Derivatives vs. Underlying Physical Market Value Reference Price Price Benchmark Cash Settled Futures EMERGING MATURE EMERGING MATURE 39
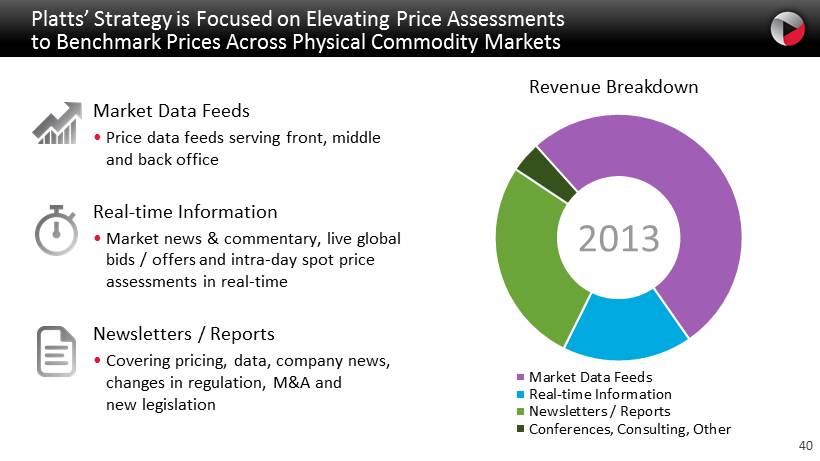
40 2013 Market Data Feeds Real-time Information Newsletters / Reports Conferences, Consulting, Other Platts ’ Strategy is Focused on Elevating Price Assessments to Benchmark Prices Across Physical Commodity Markets Market Data Feeds • Price data feeds serving front, middle and back office Real - time Information • Market news & commentary, live global bids / offers and intra - day spot price assessments in real - time Newsletters / Reports • Covering pricing, data, company news, changes in regulation, M&A and new legislation Revenue Breakdown

41 2013 Metals & Agriculture Petrochemicals Power & Gas Petroleum Platts Has Been Delivering Double - digit Growth, with Strong Growth Across All Commodity Sectors Historical Performance Revenue Breakdown 2012 2013 2011 $ 419 M $ 550 M $ 489 M +15% CAGR Revenue Revenue is ~90 % subscription based with renewal rates above 90%
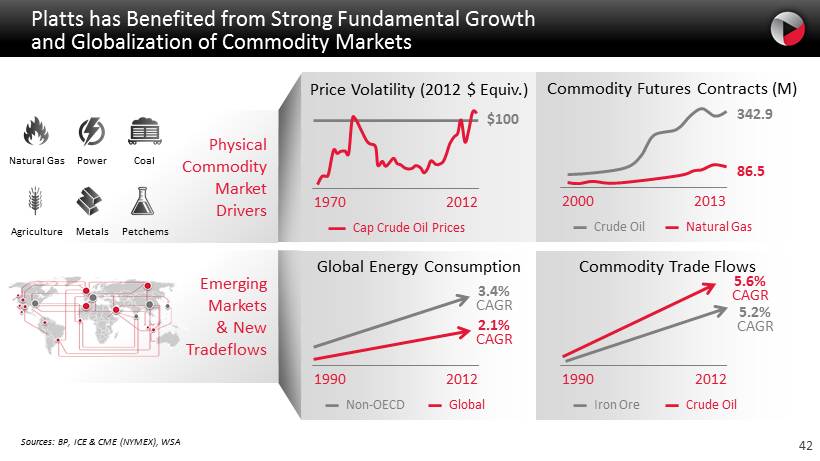
42 Platts has Benefited from Strong Fundamental Growth and Globalization of Commodity Markets Sources: BP, ICE & CME (NYMEX), WSA Physical Commodity Market Drivers Commodity Futures Contracts (M) 2000 2013 342.9 86.5 Natural Gas Crude Oil Global Energy Consumption 1990 2012 3.4% CAGR 2.1% CAGR Global Non - OECD Commodity Trade Flows 1990 2012 5.2 % CAGR 5.6% CAGR Crude Oil Iron Ore Price Volatility (2012 $ Equiv.) 1970 2012 $100 Cap Crude Oil Prices Natural Gas Power Coal Petchems Metals Agriculture Emerging Markets & New Tradeflows
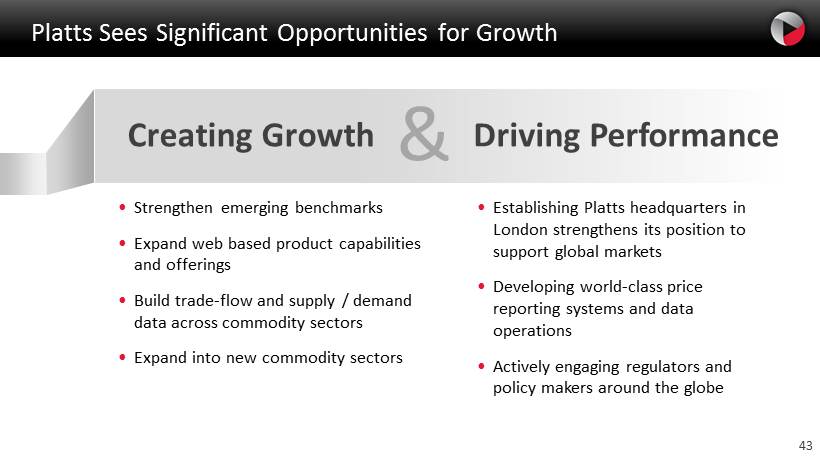
43 Platts Sees Significant Opportunities for Growth Creating Growth & Driving Performance • Establishing Platts headquarters in London strengthens its position to support global markets • Developing world - class price reporting systems and data operations • Actively engaging regulators and policy makers around the globe • Strengthen emerging benchmarks • Expand web based product capabilities and offerings • Build trade - flow and supply / demand data across commodity sectors • Expand into new commodity sectors
S&P Dow Jones Indices Alex Matturri Chief Executive Officer, S&P Dow Jones Indices

45 The World’s Leading Index Provider S&P Dow Jones Indices has over 115 years of experience constructing innovative and transparent solutions that span asset classes, geographies , and investment strategies The S&P 500 is the world’s most followed stock market index with in benchmarked assets and in indexed assets in 2012 AUM for ETFs based on our indices increased to S&P Dow Jones Indices calculates over indices daily VIX is the world’s most traded volatility index, with approximately options contracts and futures contracts traded every day E - mini S&P 500 futures and options (CME) average daily volume was over $5.7 trillion $1.6 trillion 43% $668 billion 1,000,000 570K 160K 2.1 million All statistics are as of 12/31/2013 unless otherwise indicated. Sources : S&P Dow Jones Indices; Futures Industry Association
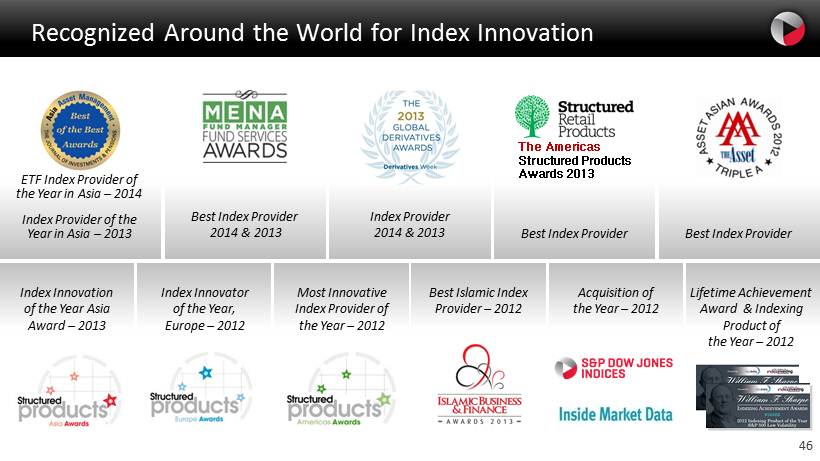
46 Recognized Around the World for Index Innovation ETF Index Provider of the Year in Asia – 2014 Index Provider of the Year in Asia – 2013 Best Index Provider 2014 & 2013 Best Index Provider The Americas Structured Products Awards 2013 Index Provider 2014 & 2013 Index Innovator of the Year, Europe – 2012 Most Innovative Index Provider of the Year – 2012 Acquisition of the Year – 2012 Best Islamic Index Provider – 2012 Best Index Provider Index Innovation of the Year Asia Award – 2013 Lifetime Achievement Award & Indexing Product of the Year – 2012
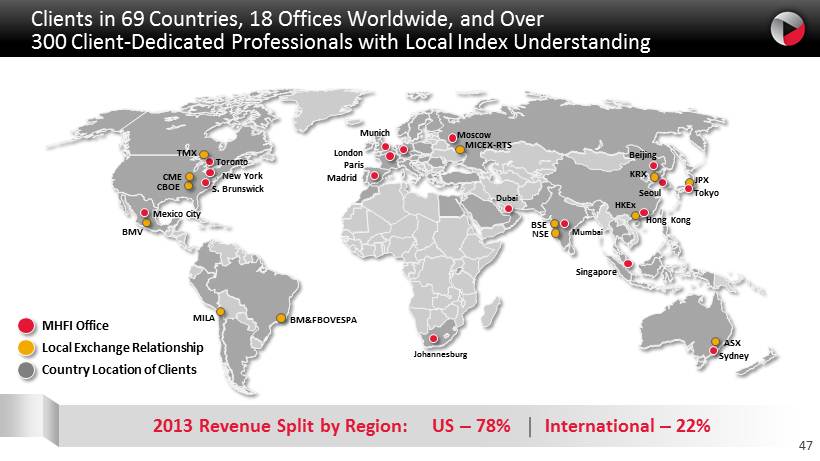
47 Clients in 69 Countries , 18 Offices Worldwide , and Over 300 Client - Dedicated Professionals with Local Index U nderstanding BM&FBOVESPA BMV Mexico City MILA S. Brunswick New York Toronto TMX CBOE CME Johannesburg Madrid Paris London Munich Moscow MICEX - RTS Dubai BSE NSE Mumbai Singapore Hong Kong HKEx Tokyo JPX Beijing Seoul KRX ASX Sydney Country Location of Clients Local Exchange Relationship MHFI Office 2013 Revenue Split by Region: US – 78% International – 22 %
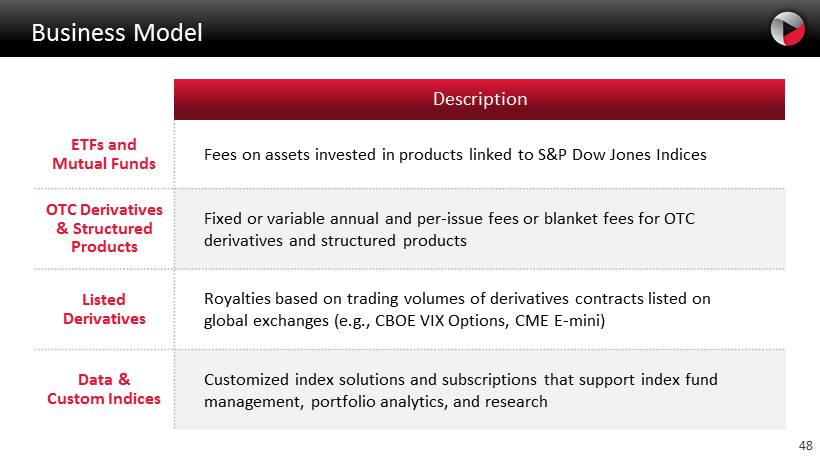
48 Business Model Description ETFs and Mutual Funds Fees on assets invested in products linked to S&P Dow Jones Indices OTC Derivatives & Structured Products Fixed or variable annual and per - issue fees or blanket fees for OTC derivatives and structured products Listed Derivatives Royalties based on trading volumes of derivatives contracts listed on global exchanges (e.g., CBOE VIX Options, CME E - mini) Data & Custom Indices Customized index solutions and subscriptions that support index fund management, portfolio analytics, and research
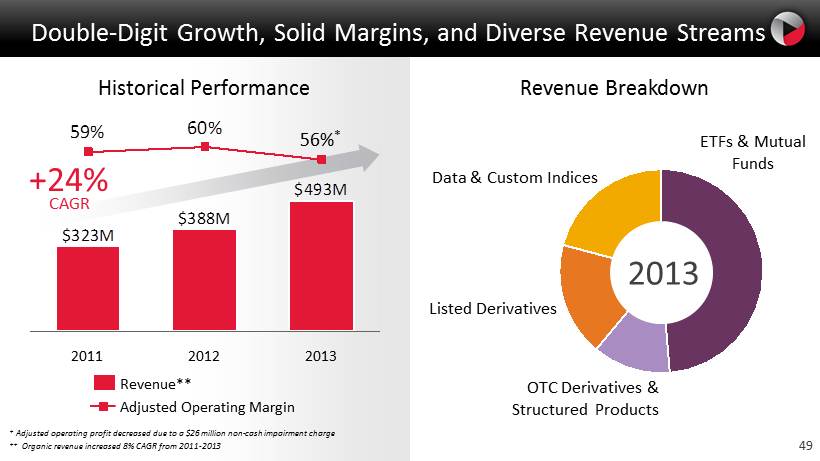
49 $493M $388M $323M 60% 59% 2013 56% * 2012 2011 Double - Digit Growth, Solid Margins, and Diverse Revenue Streams Historical Performance Revenue Breakdown Adjusted Operating Margin Revenue** * Adjusted operating profit decreased due to a $26 million non - cash impairment charge ** Organic revenue increased 8% CAGR from 2011 - 2013 Data & Custom Indices Listed Derivatives OTC Derivatives & Structured Products ETFs & Mutual Funds 2013 +24% CAGR
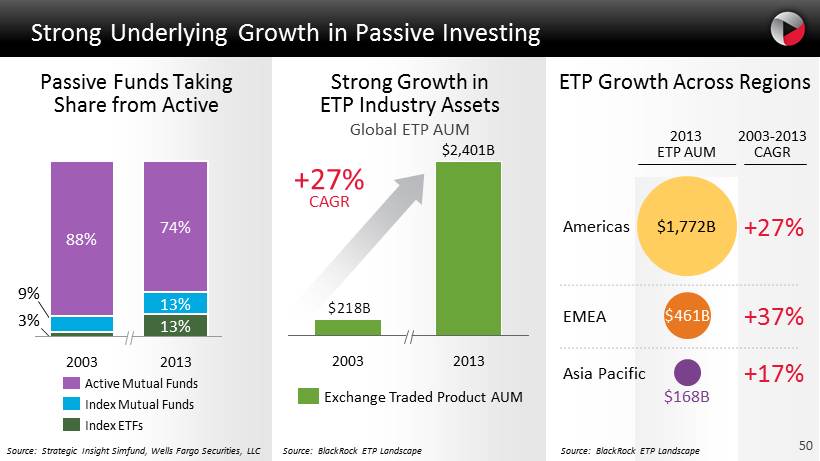
50 Strong Underlying Growth in Passive Investing Passive Funds Taking Share from Active Index ETFs Index Mutual Funds Active Mutual Funds Source: Strategic Insight Simfund , Wells Fargo Securities, LLC Strong Growth in ETP Industry Assets Global ETP AUM +27 % CAGR Source: BlackRock ETP Landscape 3% 9% 2003 88% 13% 2013 13% 74% ETP Growth Across Regions Asia Pacific EMEA Americas 2003 - 2013 CAGR Source : BlackRock ETP Landscape $1,772B $461B $168B +17% +37% +27% 2013 ETP AUM $218B 2003 $2,401B 2013 Exchange Traded Product AUM 50
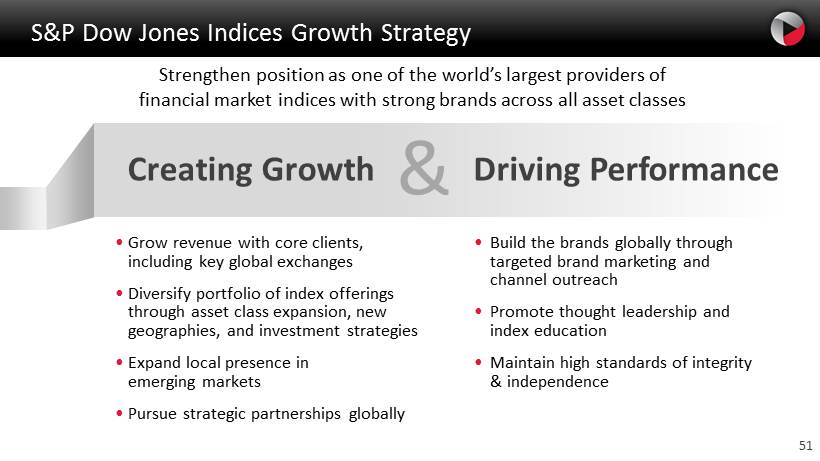
51 S&P Dow Jones Indices Growth Strategy Strengthen position as one of the world’s largest providers of financial market indices with strong brands across all asset classes Creating Growth & Driving Performance • Grow revenue with core clients, including key global exchanges • Diversify portfolio of index offerings through asset class expansion, new geographies, and investment strategies • Expand local presence in emerging markets • Pursue strategic partnerships globally • Build the brands globally through targeted brand marketing and channel outreach • Promote thought leadership and index education • Maintain high standards of integrity & independence

52

J.D. Power Fin O’Neill President, J.D. Power

54 Visibility, Impact and the Value of the J.D. Power Brand Continues to Grow • Great Awareness – 80% consumer brand awareness in the US – More than 2 billion print ad impressions; appears in 200,000 commercials every year • Trusted Brand – A leader in global marketing information services for 46 years
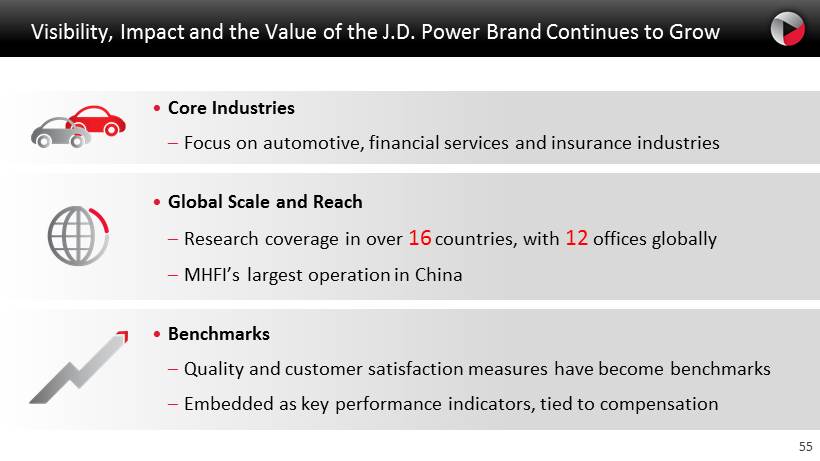
55 Visibility, Impact and the Value of the J.D. Power Brand Continues to Grow • Core Industries – Focus on automotive, financial services and insurance industries • Global Scale and Reach – Research coverage in over 16 countries, with 12 offices globally – MHFI’s largest operation in China • Benchmarks – Quality and customer satisfaction measures have become benchmarks – Embedded as k ey p erformance indicators, tied to compensation
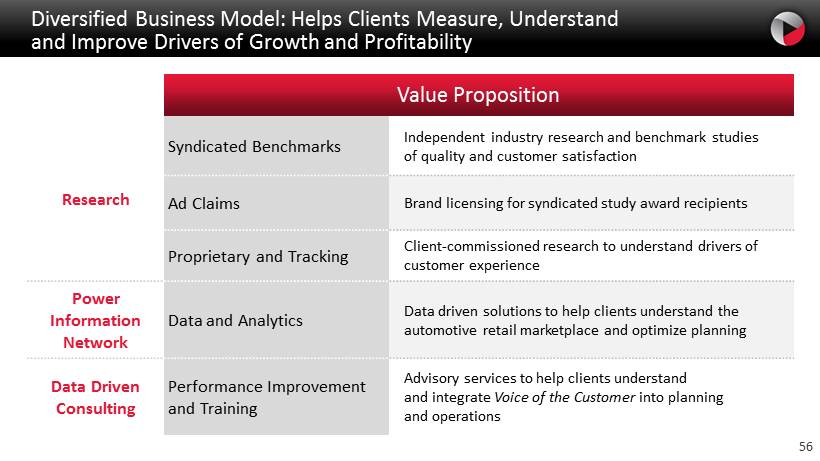
56 Value Proposition Research Syndicated Benchmarks Independent industry research and benchmark studies of quality and customer satisfaction Ad Claims Brand licensing for syndicated study award recipients Proprietary and Tracking Client - commissioned research to understand drivers of customer experience Power Information Network Data and Analytics Data driven solutions to help clients understand the automotive retail marketplace and optimize planning Data Driven Consulting Performance Improvement and Training Advisory services to help clients understand and integrate Voice of the Customer into planning and operations Diversified Business Model: Helps Clients Measure, Understand and Improve Drivers of Growth and Profitability
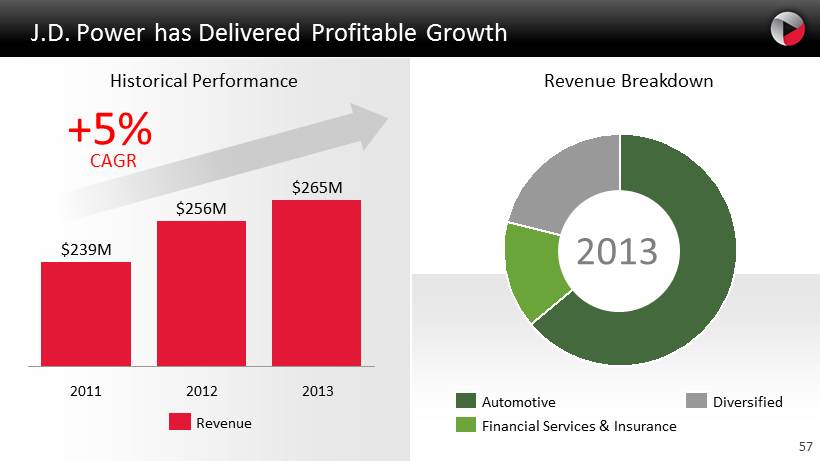
57 Historical Performance J.D. Power has Delivered Profitable Growth Revenue Breakdown Diversified Financial Services & Insurance Automotive 2013 $ 265 M 2012 $ 256 M 2011 $ 239 M +5% CAGR Revenue 2013
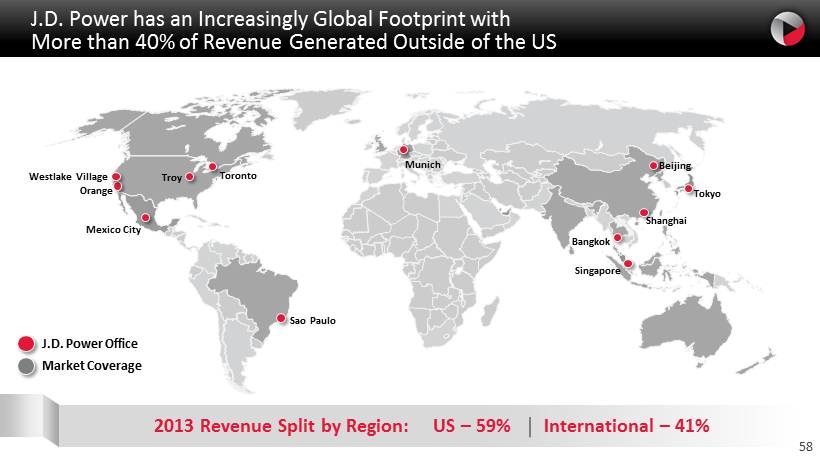
58 J.D. Power has an Increasingly Global Footprint with More than 40% of Revenue Generated Outside of the US Sao Paulo Mexico City Toronto Troy Munich Singapore Shanghai Tokyo Beijing Market Coverage J.D. Power Office 2013 Revenue Split by Region: US – 59% International – 41% Bangkok Orange Westlake Village

59 The Global Automotive Market is Forecast to See Steady Growth, with the Industry’s Center of Gravity Moving East Global New Light Vehicle Unit Sales (M) Market Dynamics Source: LMC Automotive Forecasting 18 17 17 16 14 12 35 33 29 24 19 17 2020 2018 2016 2014 2012 2010 • Record global sales in 2013 driven by China and US, despite sluggish global economic conditions • China v ehicle demand expected to grow with expanding middle class • US largely recovered from recession with increases in selling rates, retail sales penetration and average transaction prices +7% CAGR +4% CAGR
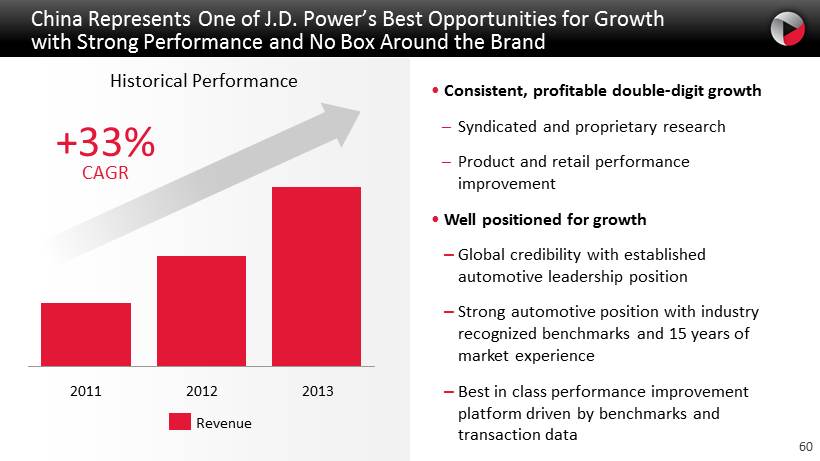
60 China Represents One of J.D. Power’s Best Opportunities for Growth with Strong Performance and No Box Around the Brand • Consistent , profitable double - digit growth – Syndicated and proprietary research – Product and retail performance improvement • Well positioned for growth – Global credibility with established automotive leadership position – Strong automotive position with industry recognized benchmarks and 15 years of market experience – Best in class performance improvement platform driven by benchmarks and transaction data Historical Performance 2013 2012 2011 Revenue +33% CAGR
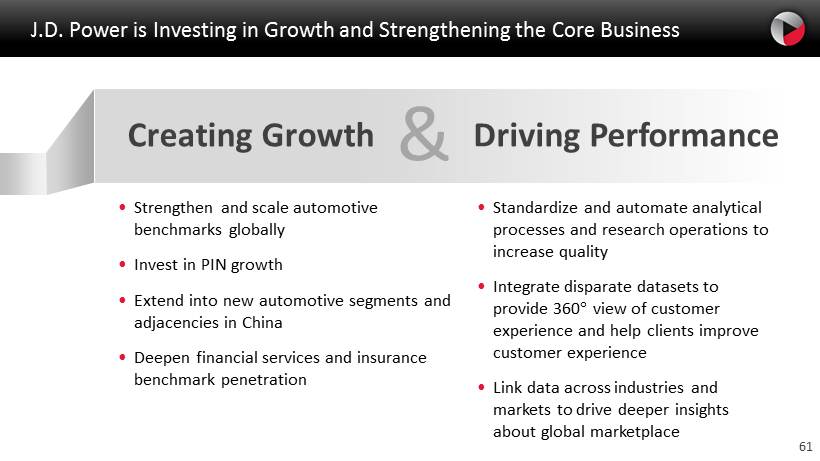
61 J.D. Power is Investing in Growth and Strengthening the Core Business Creating Growth & Driving Performance • Strengthen and scale automotive benchmarks globally • Invest in PIN growth • Extend into new automotive segments and adjacencies in China • Deepen financial services and insurance benchmark penetration • Standardize and automate analytical processes and research operations to increase quality • Integrate disparate datasets to provide 360° view of customer experience and help clients improve customer experience • Link data across industries and markets to drive deeper insights about global marketplace

62

S&P Capital IQ Lou Eccleston President, S&P Capital IQ
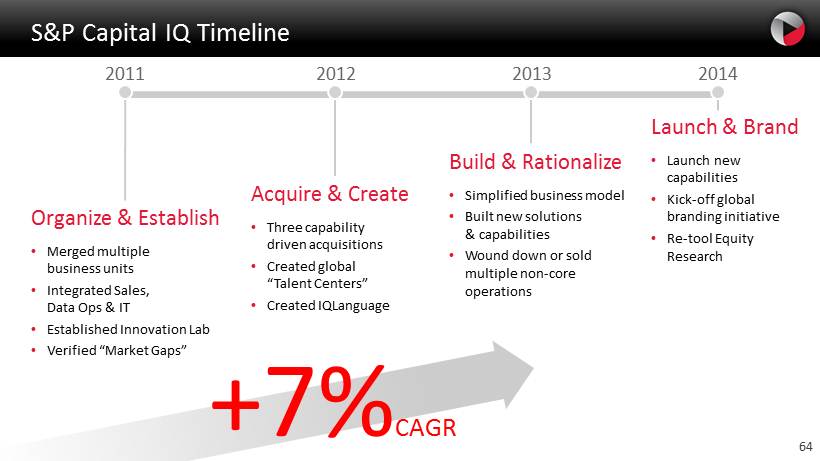
64 S&P Capital IQ Timeline 2014 Laun ch & Brand • Launch new capabilities • Kick - off global branding initiative • Re - tool Equity Research 2011 2012 Acquire & Create • T hree capability driven acquisitions • Created global “Talent Centers” • Created IQLanguage Organize & Establish • Merged multiple business units • Integrated Sales, Data Ops & IT • Established Innovation Lab • Verified “Market Gaps” 2013 Build & Rationalize • Simplified business model • Built new solutions & capabilities • Wound down or sold multiple non - core operations +7% CAGR
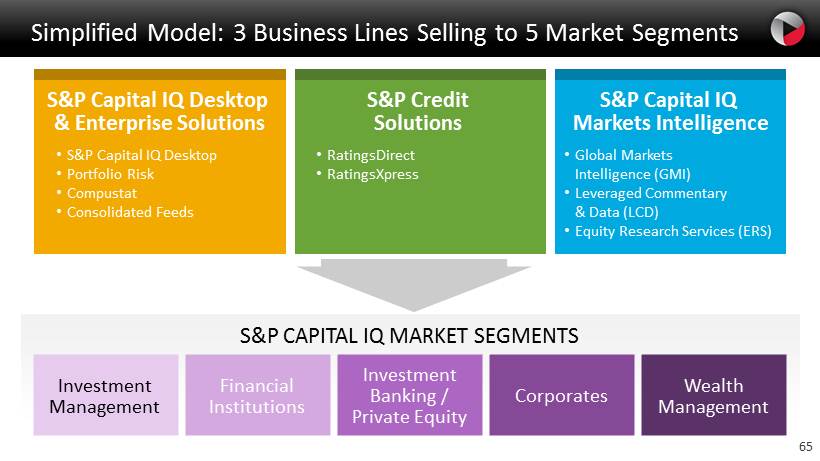
65 S&P CAPITAL IQ MARKET SEGMENTS Simplified Model: 3 Business Lines Selling to 5 Market Segments Investment Management Financial Institutions Investment Banking / Private Equity Corporates Wealth Management • S&P Capital IQ Desktop • Portfolio Risk • Compustat • Consolidated Feeds S&P Capital IQ Desktop & Enterprise Solutions • RatingsDirect • RatingsXpress • Global Markets Intelligence (GMI) • Leveraged Commentary & Data (LCD) • Equity Research Services (ERS) S&P Credit Solutions S&P Capital IQ Markets Intelligence
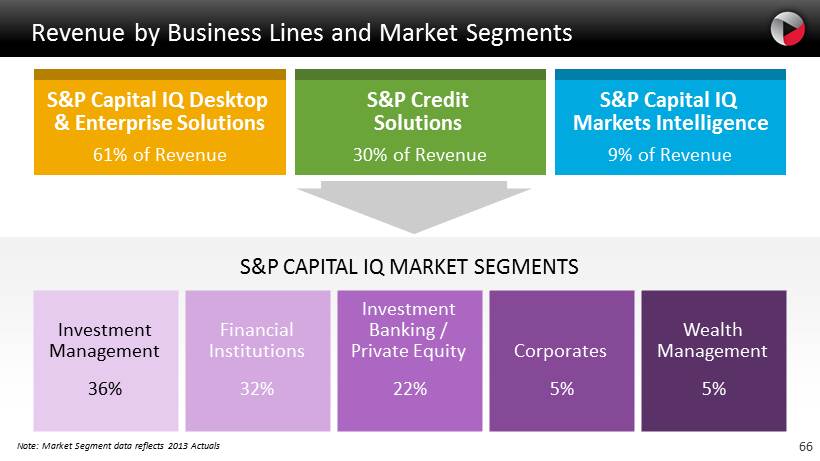
66 Investment Management Financial Institutions Investment Banking / Private Equity Corporates Wealth Management Revenue by Business Lines and Market S egments S&P CAPITAL IQ MARKET SEGMENTS 36% 32% 22% 5 % 5 % Note: Market Segment data reflects 2013 Actuals S&P Capital IQ Desktop & Enterprise Solutions S&P Credit Solutions S&P Capital IQ Markets Intelligence 61% of Revenue 30% of Revenue 9% of Revenue

67 We Play in a Large & Fragmented Market Note: Top 10 Competitors includes: S&P Capital IQ, Bloomberg , FactSet , IDC, Moody’s , Morningstar, MSCI, SIX Financial Information, SunGard & Thomson Reuters $18.2B Off - Trading Floor Market by Segment All Others 43% Top 10 Competitors (Includes S&P Capital IQ) 57% • Large market, little step change innovation • Fragmented market, large portion to a multitude of small players • Growth is possible without having to displace largest competitors Competitive Landscape Wealth Management Corporates Investment Banking / Private Equity Financial Institutions Investment Management
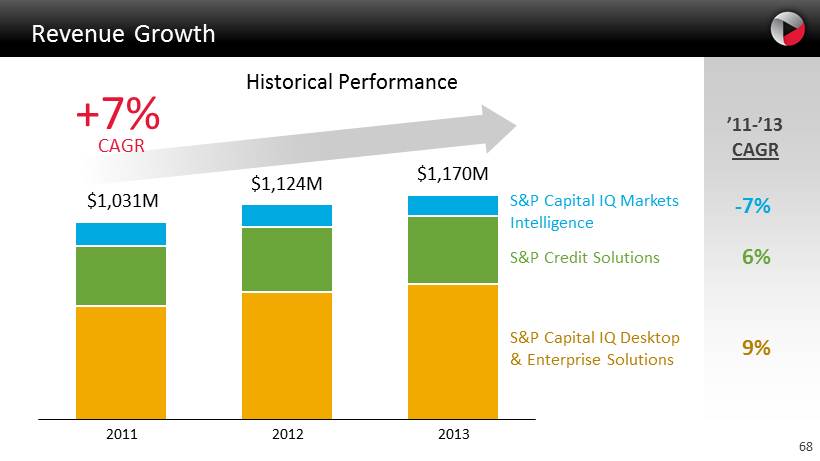
68 Revenue Growth S&P Capital IQ Markets Intelligence 2012 $ 1,031 M $ 1,124 M 2011 2013 S&P Credit Solutions S&P Capital IQ Desktop & Enterprise Solutions $ 1,170 M Historical Performance ’11 - ’13 CAGR 6 % 9 % - 7% +7% CAGR
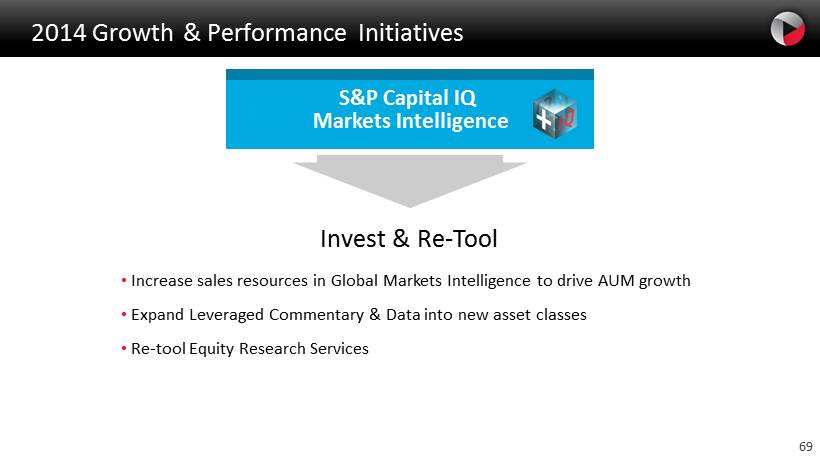
69 2014 Growth & Performance Initiatives • Increase sales resources in Global Markets Intelligence to drive AUM growth • Expand Leveraged Commentary & Data into new asset classes • Re - tool Equity Research Services S&P Capital IQ Markets Intelligence Invest & Re - Tool
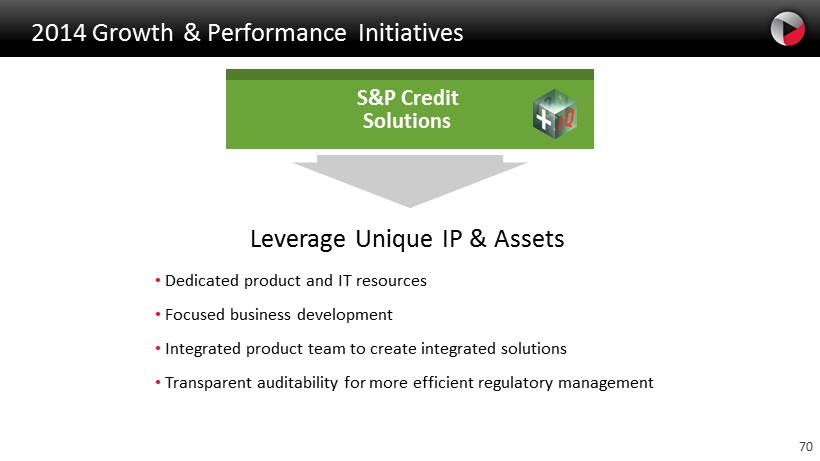
70 2014 Growth & Performance Initiatives • Dedicated product and IT resources • Focused business development • Integrated product team to create integrated solutions • Transparent auditability for more efficient regulatory management S&P Credit Solutions Leverage Unique IP & Assets
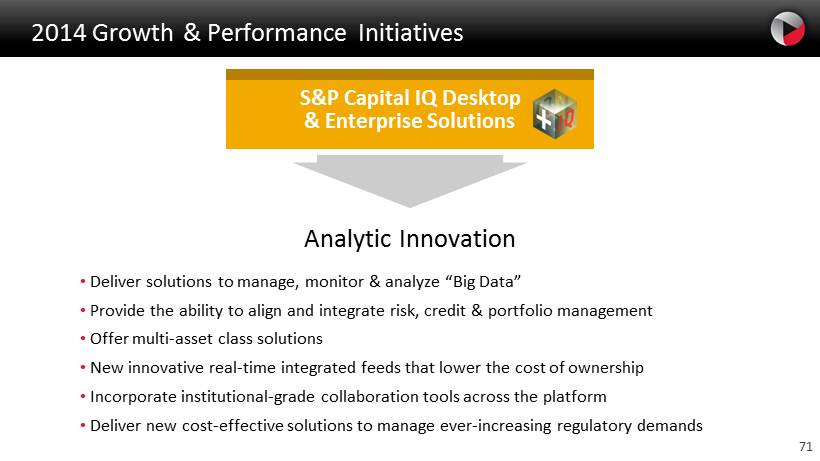
71 2014 Growth & Performance Initiatives • Deliver solutions to manage, monitor & analyze “Big Data” • Provide the ability to align and integrate risk, credit & portfolio management • Offer multi - asset class solutions • New innovative real - time integrated feeds that lower the cost of ownership • Incorporate institutional - grade collaboration tools across the platform • Deliver new cost - effective solutions to manage ever - increasing regulatory demands S&P Capital IQ Desktop & Enterprise Solutions Analytic Innovation
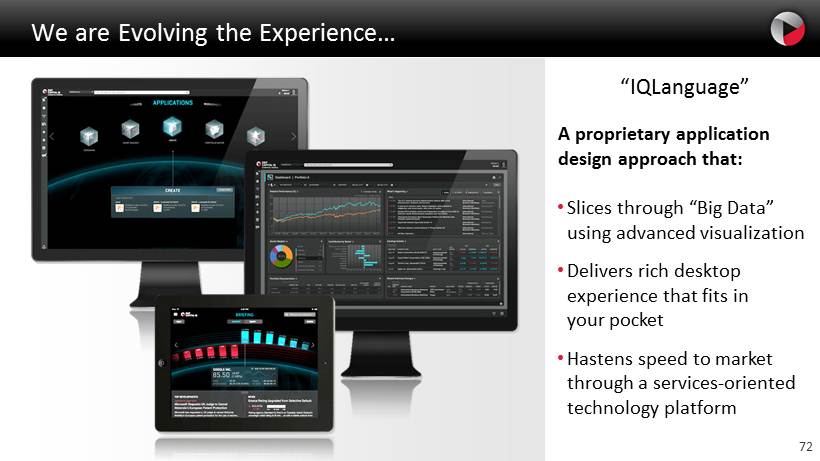
72 We are Evolving the Experience… • Slices through “Big Data” using advanced visualization • Delivers rich desktop experience that fits in your pocket • Hastens speed to market through a services - oriented technology platform A proprietary application design approach that: “ IQLanguage ”
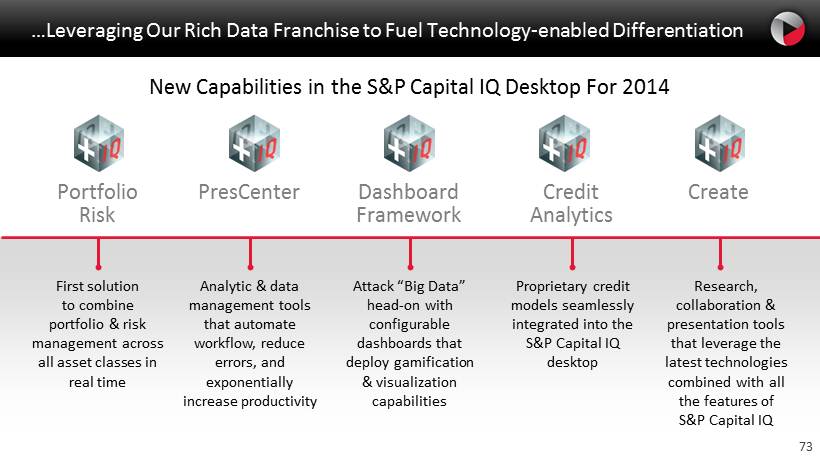
73 …Leveraging Our Rich Data Franchise to Fuel Technology - enabled Differentiation R esearch, collaboration & presentation tools that leverage the latest technologies combined with all the features of S&P Capital IQ P roprietary credit models seamlessly integrated into the S&P Capital IQ desktop Attack “Big Data” head - on with configurable dashboards that deploy gamification & visualization capabilities Analytic & data management tools that automate workflow, reduce errors, and exponentially increase productivity First solution to combine portfolio & risk management across all asset classes in real time Create Credit Analytics Dashboard Framework PresCenter Portfolio Risk 8 New Capabilities in the S&P Capital IQ Desktop For 2014

74 Focusing on Creating Growth & Driving Performance Creating Growth & Driving Performance • Leverage acquired capabilities and talent to develop innovative solutions • Expand our existing position in Europe, Asia Pacific and Latin American markets • Drive monetization of Ratings data • Launch IQLanguage to build unique applications and reduce time to market • Invest in and re - tool proprietary cross - asset class research and advisory businesses • Drive operational efficiencies through improved performance management • Execute on critical technology infrastructure investments • Foster a culture of innovation, collaboration, and performance
75
Standard & Poor's Ratings Services Neeraj Sahai President, Standard & Poor’s Ratings Services
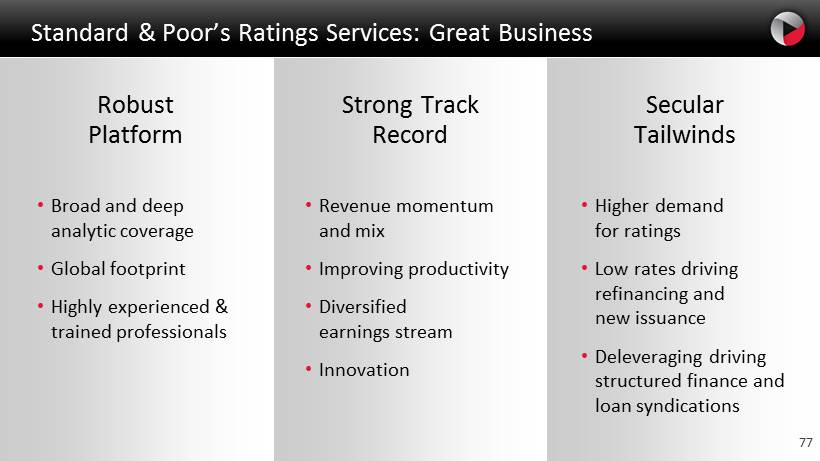
77 Strong Track Record Robust Platform Secular Tailwinds Standard & Poor’s Ratings Services: Great Business • Revenue momentum and mix • Improving productivity • Diversified earnings stream • Innovation • Higher demand for ratings • Low rates driving refinancing and new issuance • Deleveraging driving structured finance and loan syndications 77 • Broad and deep analytic coverage • Global footprint • Highly experienced & trained professionals
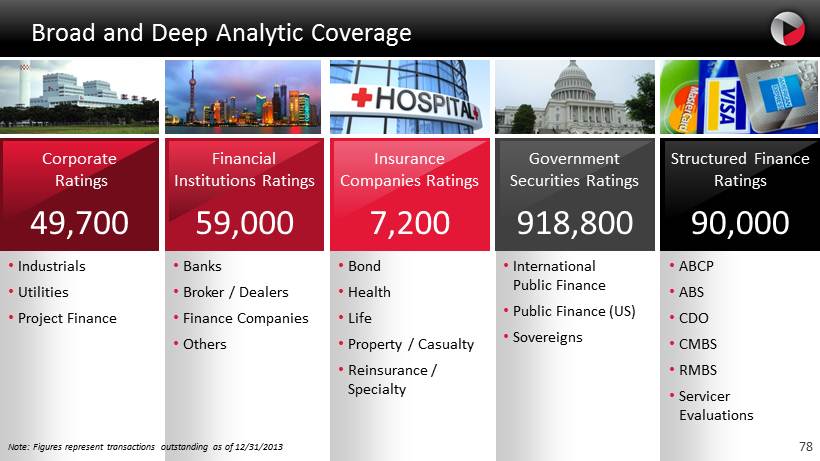
78 Broad and Deep Analytic Coverage • Industrials • Utilities • Project Finance • Banks • Broker / Dealers • Finance Companies • Others • Bond • Health • Life • Property / Casualty • Reinsurance / Specialty • International Public Finance • Public Finance ( US) • Sovereigns • ABCP • ABS • CDO • CMBS • RMBS • Servicer Evaluations Corporate Ratings 49,700 Financial Institutions Ratings 59,000 Insurance Companies Ratings 7,200 Government Securities Ratings 918,800 Structured Finance Ratings 90,000 Note: Figures represent transactions outstanding as of 12/31/2013
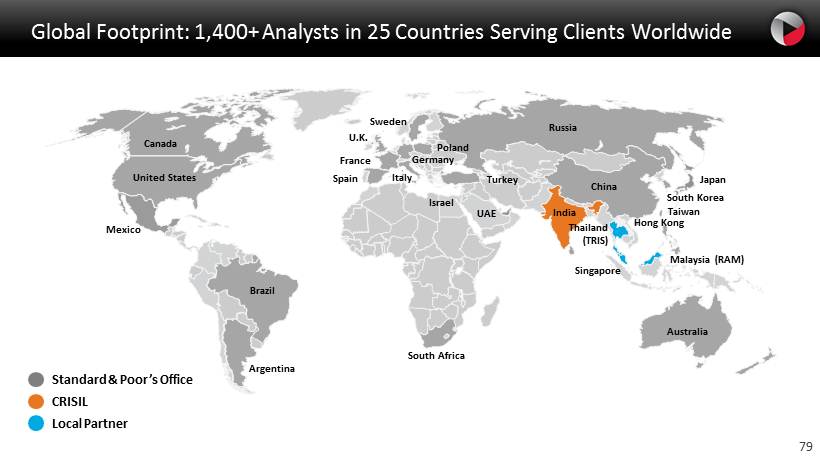
79 Global Footprint: 1,400+ Analysts in 25 Countries Serving Clients Worldwide Brazil Mexico Canada United States Germany Singapore Taiwan Japan Local Partner Standard & Poor’s Office Thailand (TRIS) CRISIL Russia Argentina South Africa Poland Italy Israel Spain France U.K. Sweden UAE Turkey Malaysia (RAM) China South Korea Australia India Hong Kong

80 Highly Experienced and Trained Professionals Ryan Tsang • Managing Director and Analytical Manager, Financial Institutions Ratings • Based in Hong Kong • 14 years at Standard & Poor’s • Master of Accountancy Moritz Kraemer • Chief Rating Officer, Sovereigns • Based in Frankfurt • 13 years at Standard & Poor’s • Ph.D., Economics Beth Ann Bovino • US Chief Economist • Based in New York • 10 years at Standard & Poor’s • Recently recognized by The Wall Street Journal as the most accurate economic forecaster for 2013 • Ph.D ., Economics 80
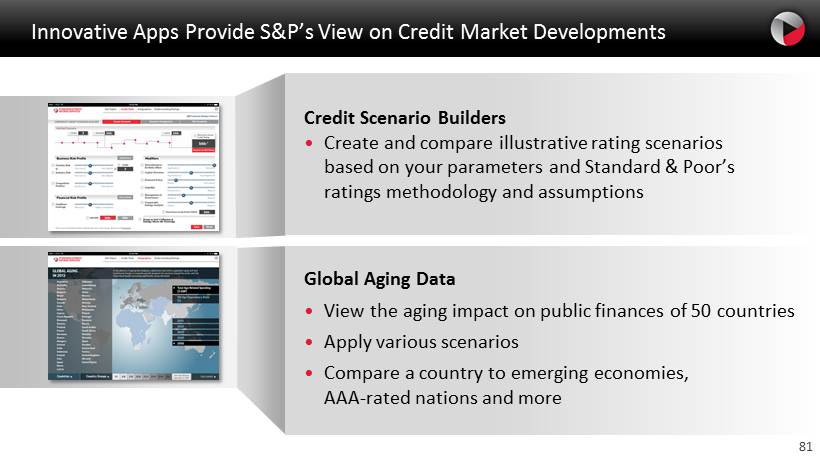
81 Credit Scenario Builders • Create and compare illustrative rating scenarios based on your parameters and Standard & Poor’s ratings methodology and assumptions Global Aging Data • View the aging impact on public finances of 50 countries • Apply various scenarios • Compare a country to emerging economies, AAA - rated nations and more Innovative Apps Provide S&P’s View on Credit Market Developments
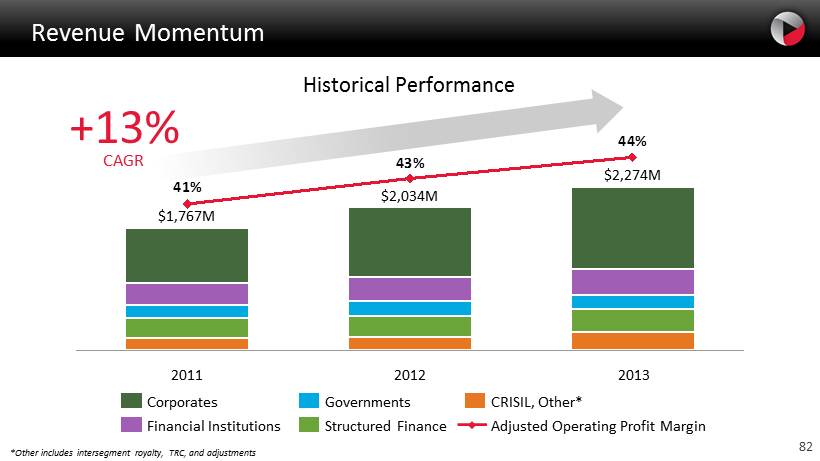
82 Revenue Momentum 44% 43% 41% 2013 $2,274M $2,034M 2012 2011 $1,767M Adjusted Operating Profit Margin CRISIL, Other* Structured Finance Governments Financial Institutions Corporates *Other includes intersegment royalty, TRC, and adjustments +13% CAGR Historical Performance
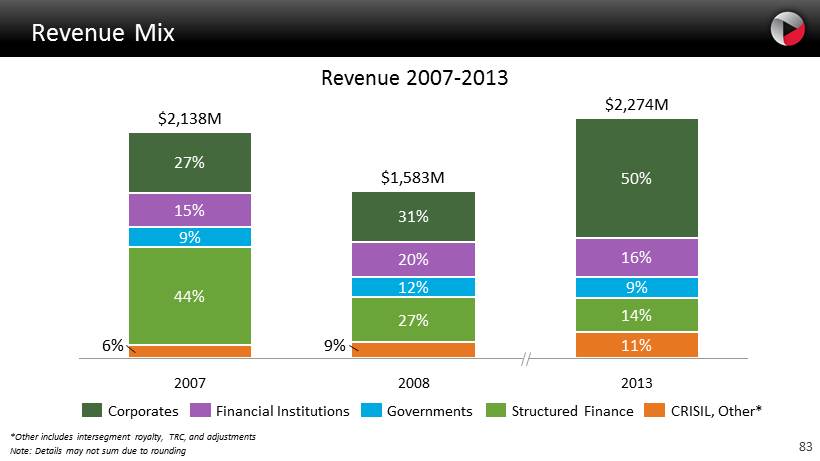
83 Revenue Mix 50% 2008 $1,583 M 9% 27% 12% 20% 31% 2007 $2,138 M 6% 44% 2013 $2,274 M 11% 14% 9% 16% 9% 15% 27% Revenue 2007 - 2013 CRISIL, Other* Structured Finance Governments Financial Institutions Corporates *Other includes intersegment royalty, TRC, and adjustments Note: Details may not sum due to rounding

84 2011 2012 2013 Operating Profit Margin 1 (adjusted) 42.2% 43.5% 44.9% Revenue per Employee 1 ($K) $520.0 $607.5 $674.6 Adjusted Operating Profit per Employee 1 ($K) $219.3 $264.2 $303.2 Improving Productivity (1) Excludes CRISIL
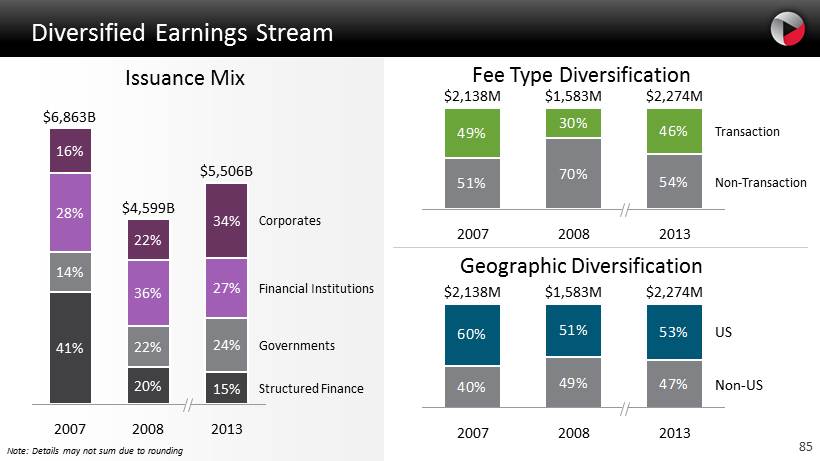
85 Diversified Earnings Stream Structured Finance Governments Financial Institutions Corporates 2013 $5,506 B 15% 24% 27% 34% 2008 $4,599 B 20% 22% 36% 22% 2007 $6,863 B 41% 14% 28% 16% 51% 70% 54% 49% 30% 46% $2,138 M Non - Transaction Transaction 2013 $2,274 M 2008 $1,583 M 2007 40% 49% 47% 60% 51% 53% 2007 $2,138 M Non - US US 2013 $2,274 M 2008 $1,583 M Geographic Diversification Issuance Mix Fee Type Diversification Note: Details may not sum due to rounding

86 Higher Demand for Ratings • From 2011 to 2014, investors reported using ratings almost twice as much as they had previously for: – Fundamental analysis of securities – Initial screening tool – Compliance with capital adequacy requirements – Selection of asset allocation • S&P’s investor survey indicated a strong user preference for our ratings and research Note: Greenwich Associates conducted nearly 900 interviews of investors beginning late 2013 and continuing into 2014
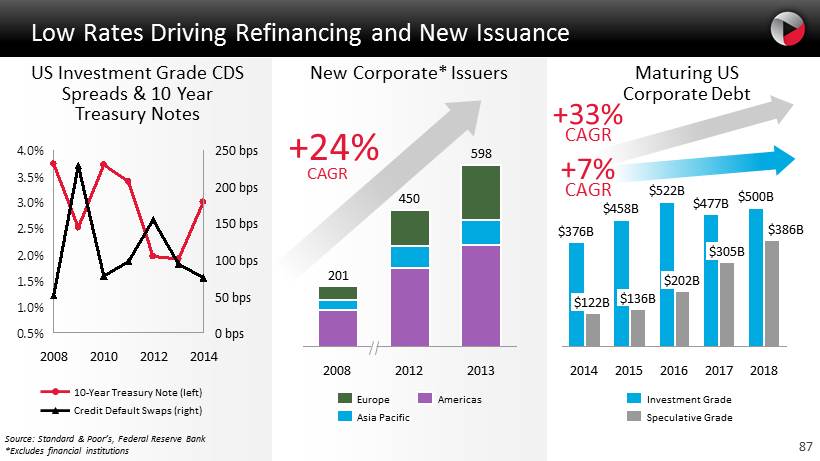
87 Low Rates Driving Refinancing and New Issuance 2013 598 2012 450 2008 201 Americas Asia Pacific Europe 0.5% 1.0% 1.5% 2.0% 2.5% 3.0% 3.5% 4.0% 100 bps 50 bps 0 bps 2014 2012 2010 2008 250 bps 200 bps 150 bps Credit Default Swaps (right) 10 - Year Treasury Note (left) Source: Standard & Poor’s, Federal Reserve Bank *Excludes financial institutions US Investment Grade CDS Spreads & 10 Year Treasury Notes New Corporate* Issuers +24% CAGR 2018 $ 386 B $ 500 B 2017 $ 305 B $ 477 B 2016 $ 202 B $ 522 B 2015 $ 136 B $ 458 B 2014 $ 122 B $ 376 B Speculative Grade Investment Grade Maturing US Corporate Debt + 33% CAGR +7% CAGR
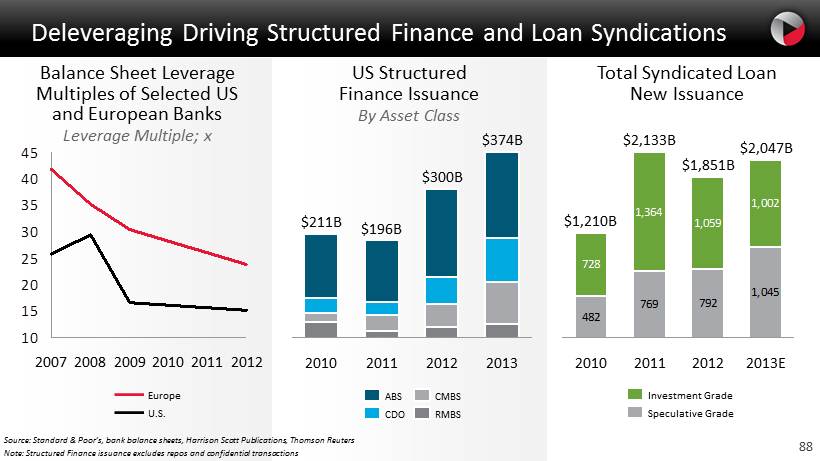
88 Deleveraging Driving Structured Finance and Loan Syndications 10 15 20 25 30 35 40 45 2012 2011 2010 2009 2008 2007 U.S. Europe 2013 $374B 2012 $300B 2011 $196B 2010 $211B RMBS CMBS CDO ABS Source: Standard & Poor’s, bank balance sheets, Harrison Scott Publications, Thomson Reuters Note: Structured Finance issuance excludes repos and confidential transactions 482 769 792 1,045 728 1,364 1,059 1,002 2012 $ 1,851 B 2011 $ 2,133 B 2010 $ 1,210 B 2013E $ 2,047 B Speculative Grade Investment Grade Balance Sheet Leverage Multiples of Selected US and European Banks Leverage Multiple; x US Structured Finance Issuance By Asset Class Total Syndicated Loan New Issuance
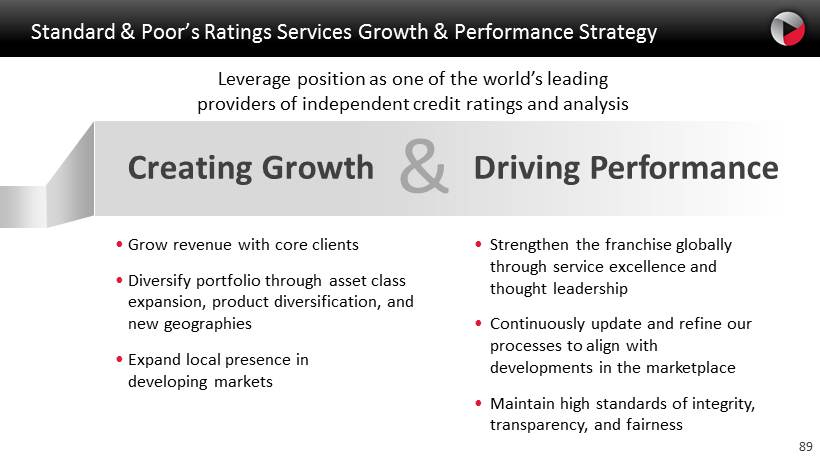
89 Standard & Poor’s Ratings Services Growth & Performance Strategy Leverage position as one of the world’s leading providers of independent credit ratings and analysis Creating Growth & Driving Performance • Strengthen the franchise globally through service excellence and thought leadership • Continuously update and refine our processes to align with developments in the marketplace • Maintain high standards of integrity, transparency, and fairness • Grow revenue with core clients • Diversify portfolio through asset class expansion, product diversification, and new geographies • Expand local presence in developing markets
CRISIL Roopa Kudva Managing Director & Chief Executive Officer, CRISIL

91 CRISIL: Who We Are • India’s largest credit rating agency with deep market penetration: from small enterprises to India’s largest corporations • India’s largest independent research house: providing analyses and benchmarks on economy, capital markets, industries and companies • The largest provider of high - end research and analytical offshore support to global banks • A high growth, high margin company – Revenue growth of 32% CAGR since MHFI acquired a majority stake in 2005 – Operating margins approaching 30%
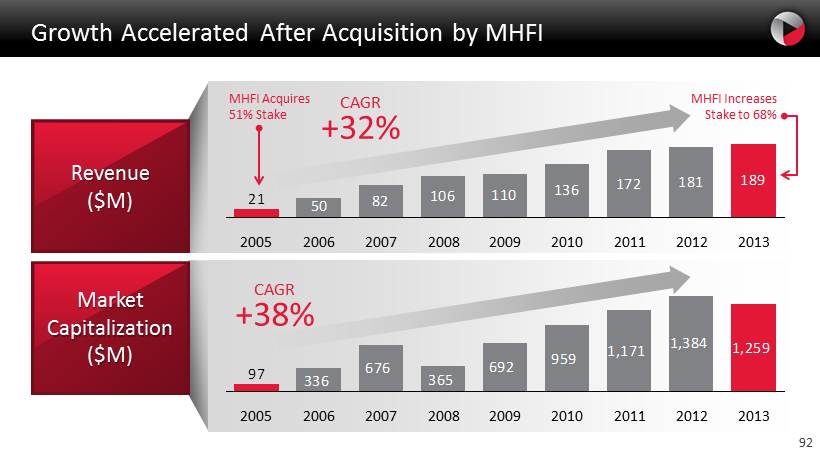
92 Growth Accelerated After Acquisition by MHFI Revenue ($M) Market Capitalization ($M) MHFI Acquires 51% Stake MHFI Increases Stake to 68% CAGR +32% CAGR +38% 82 106 110 136 172 181 189 50 21 2013 2012 2011 2010 2009 2008 2007 2006 2005 959 1,171 1,384 1,259 692 365 676 336 97 2013 2012 2011 2010 2009 2008 2007 2006 2005
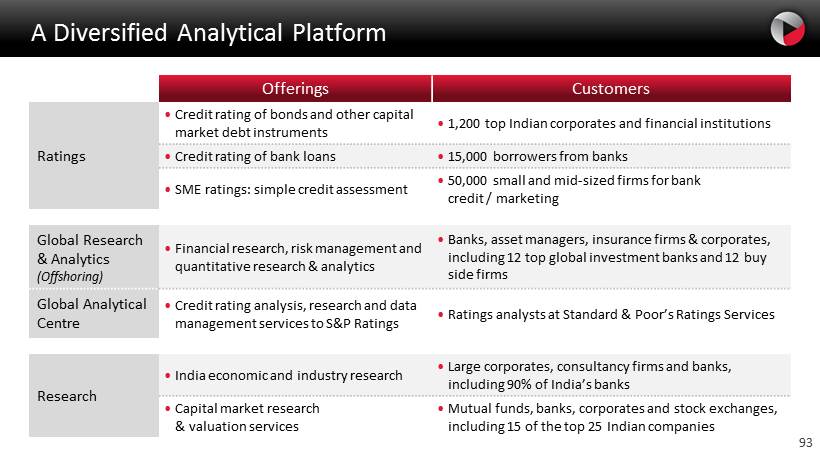
93 A Diversified Analytical Platform Offerings Customers Ratings • Credit rating of bonds and other capital market debt instruments • 1,200 top Indian corporates and financial institutions • Credit rating of bank loans • 15,000 borrowers from banks • SME ratings: simple credit assessment • 50,000 small and mid - sized firms for bank credit / marketing Global Research & Analytics (Offshoring) • Financial research, risk management and quantitative research & analytics • Banks, asset managers, insurance firms & corporates, including 12 top global investment banks and 12 buy side firms Global Analytical Centre • Credit rating analysis, research and data management services to S&P Ratings • Ratings analysts at Standard & Poor’s Ratings Services Research • India economic and industry research • Large corporates, consultancy firms and banks, including 90% of India’s banks • Capital market research & valuation services • Mutual funds, banks, corporates and stock exchanges, including 15 of the top 25 Indian companies
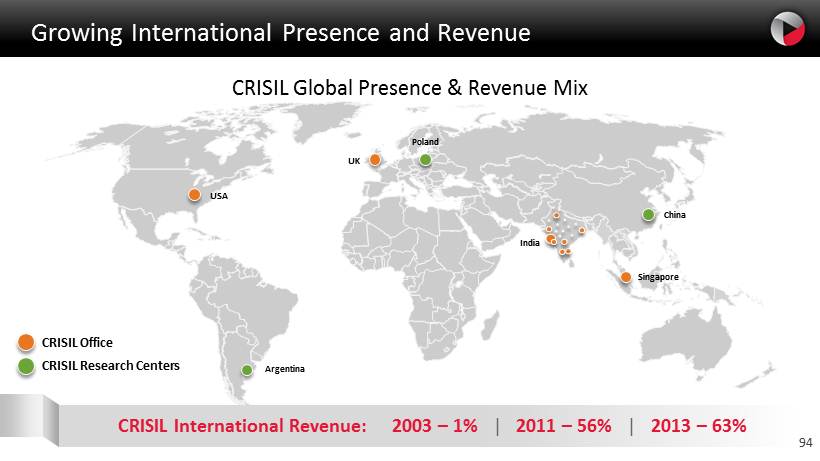
94 Growing International Presence and Revenue CRISIL Research Centers CRISIL Office CRISIL International Revenue: 2003 – 1% | 2011 – 56% | 2013 – 63% CRISIL Global Presence & Revenue Mix USA UK Poland India Argentina Singapore China
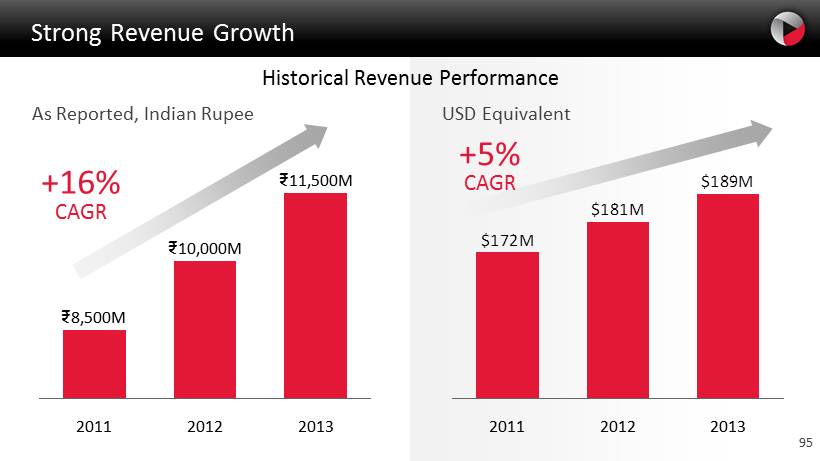
95 Strong Revenue Growth $189M $181M $172M 2011 2012 2013 As Reported, Indian Rupee USD Equivalent +16% CAGR ₹ 10,000M ₹ 11,500M 2011 ₹ 8,500M 2012 2013 +5% CAGR Historical Revenue Performance
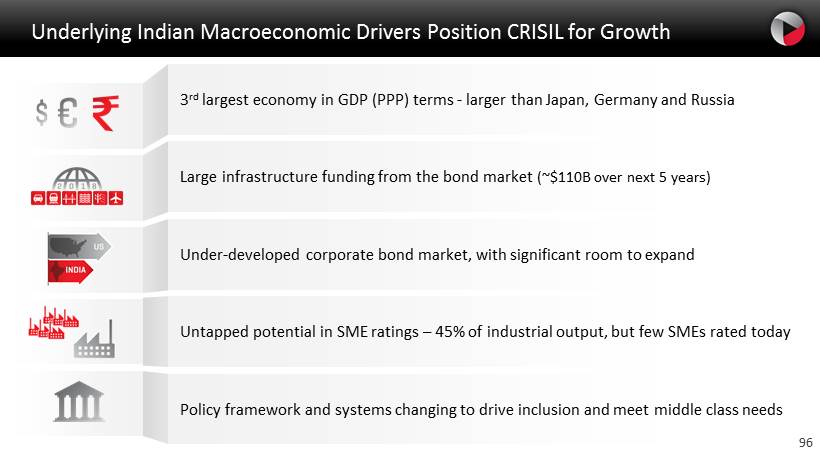
96 Underlying Indian Macroeconomic Drivers Position CRISIL for Growth 3 rd largest economy in GDP (PPP) terms - larger than Japan, Germany and Russia Large infrastructure funding from the bond market (~$ 110B over next 5 years) Under - developed corporate bond market, with significant room to expand Untapped potential in SME ratings – 45% of industrial output, but few SMEs rated today Policy framework and systems changing to drive inclusion and meet middle class needs
97 Driving Continued Growth & Performance in CRISIL Creating Growth & Driving Performance • Enhance suite of grading products, and move customers from grading products → SME ratings → bank loan ratings → bond ratings • Increase penetration presence amongst “next - tier” banks and corporate customers • Significantly expand presence in the data analytics space • Develop offerings to meet banks’ new needs from increased regulation • Maintain strong focus on execution to scale up the business • Enhance quality of communications with stakeholders (customers, regulators and government) • Focused thought leadership to create a differentiated position for CRISIL
98
Legal Update Ken Vittor Executive Vice President and General Counsel
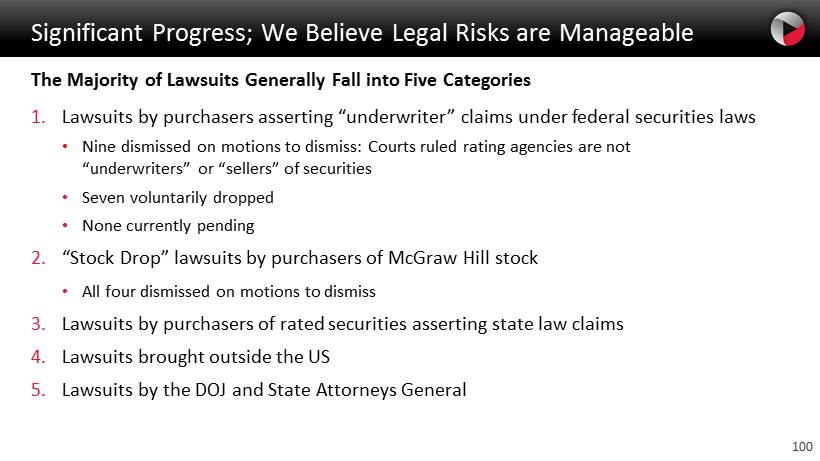
100 Significant Progress ; We Believe Legal Risks are Manageable The Majority of Lawsuits Generally Fall into Five Categories 1. Lawsuits by purchasers asserting “underwriter” claims under federal securities laws • Nine dismissed on motions to dismiss: Courts ruled rating agencies are not “ underwriters” or “sellers” of securities • Seven voluntarily dropped • None currently pending 2. “Stock Drop” lawsuits by purchasers of McGraw Hill stock • All four dismissed on motions to dismiss 3. Lawsuits by purchasers of rated securities asserting state law claims 4. Lawsuits brought outside the US 5. Lawsuits by the DOJ and State Attorneys General
101 Latest Developments: Department of Justice Overview • On February 4, 2013, the DOJ filed a civil lawsuit against S&P alleging violations of federal law in connection with certain ratings issued by S&P in 2004 - 07 and S&P’s representations about its independence and objectivity during that time • S&P’s response : No factual or legal basis for lawsuit • S&P’s ratings were issued in good faith and believed appropriate by rating committees • S&P’s ratings were virtually identical to the ratings issued by other ratings agencies • S&P’s forward - looking opinions on housing market and economy were consistent with views of officials in US Government and Federal Reserve and based on the same data • The alleged “victims” in this case are the very entities responsible for creating and selling the securities that S&P rated Status • S&P filed a motion to dismiss the Complaint on April 22, 2013; denied on July 16, 2013 • S&P asserts 19 defenses in its Answer to the Complaint • Pre - trial discovery in the case is ongoing • On January 20, 2014, S&P filed a motion to compel. A hearing on the motion and other discovery - related issues was held on March 11, 2014

102 Latest Developments: State Attorneys General Overview • 19 States and the District of Columbia have filed lawsuits against McGraw Hill and S&P; of these, 17 cases have been consolidated in a federal multi - district litigation before Judge Furman in New York • These cases are being brought under each State’s consumer protection law and focus on S&P’s statements regarding the independence and objectivity of its ratings practices Multi - District Litigation • The States’ consolidated motion to remand was filed on August 2, 2013. The motion is fully briefed and was argued on October 4, 2013. A decision remains pending • If S&P prevails on the remand motion, the cases will remain before Judge Furman for pre - trial purposes • If Judge Furman grants the States’ motion to remand the cases to state court, the cases would be sent back to the individual state courts • S&P will move to dismiss after the remand motion is decided; we have strong legal arguments, including lack of jurisdiction
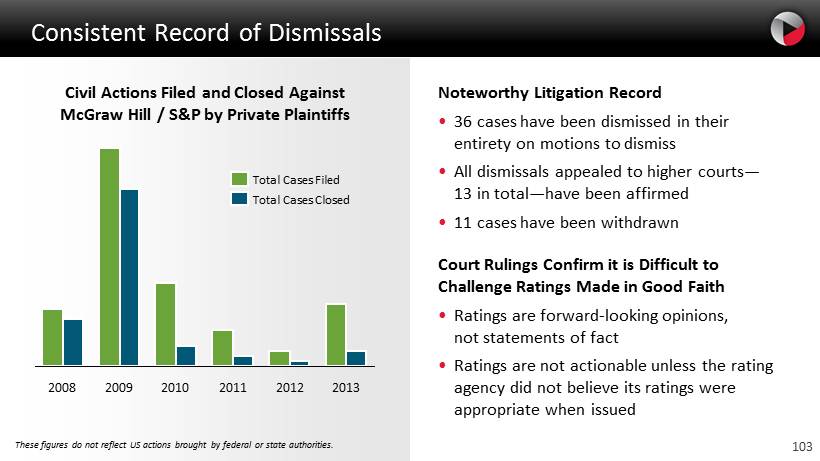
103 Consistent Record of Dismissals Noteworthy Litigation Record • 36 cases have been dismissed in their entirety on motions to dismiss • All dismissals appealed to higher courts — 13 in total — have been affirmed • 11 cases have been withdrawn Court Rulings Confirm it is Difficult to Challenge Ratings Made in Good Faith • Ratings are forward - looking opinions, not statements of fact • Ratings are not actionable unless the rating agency did not believe its ratings were appropriate when issued These figures do not reflect US actions brought by federal or state authorities. 2013 2012 2011 2010 2009 2008 Total Cases Closed Total Cases Filed Civil Actions Filed and Closed Against McGraw Hill / S&P by Private Plaintiffs
Financial Performance & Outlook Jack Callahan Executive Vice President and Chief Financial Officer
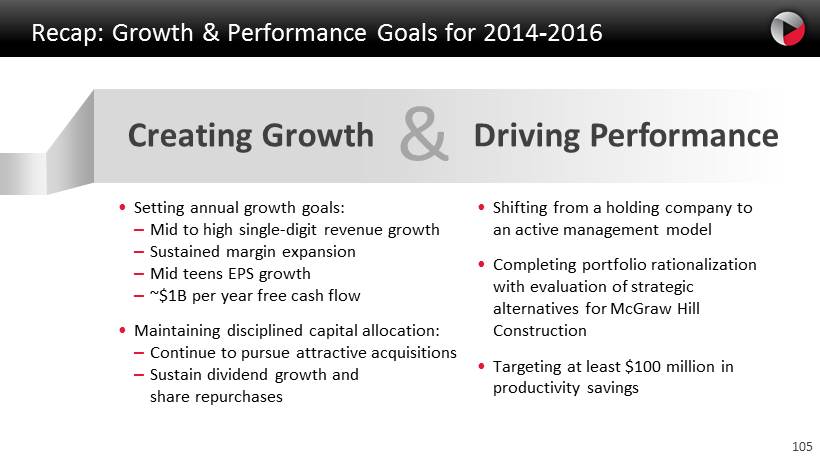
105 Recap: Growth & Performance Goals for 2014 - 2016 Creating Growth & Driving Performance • Setting annual growth goals: – Mid to high single - digit revenue growth – Sustained margin expansion – Mid teens EPS growth – ~$1B per year free cash flow • Maintaining disciplined capital allocation: – Continue to pursue attractive acquisitions – Sustain dividend growth and share repurchases • Shifting from a holding company to an active management model • Completing portfolio rationalization with evaluation of strategic alternatives for McGraw Hill Construction • Targeting at least $100 million in productivity savings
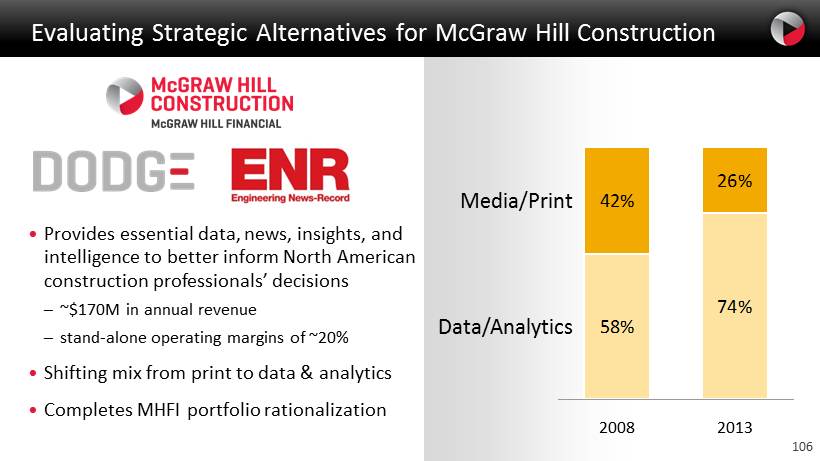
106 • Provides essential data, news, insights, and intelligence to better inform North American construction professionals’ decisions – ~$170M in annual revenue – stand - alone operating margins of ~20 % • Shifting mix from print to data & analytics • C ompletes MHFI portfolio rationalization Evaluating Strategic Alternatives for McGraw Hill Construction 74% 58% 26% 42% Data/Analytics Media/Print 2013 2008
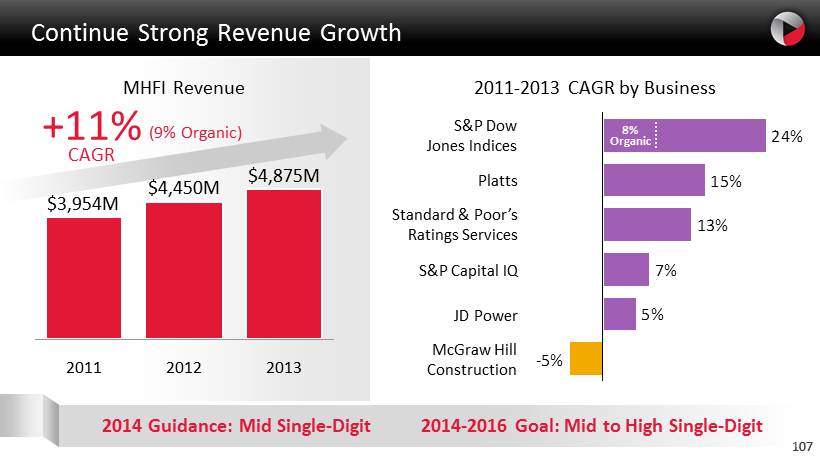
107 Continue Strong Revenue Growth MHFI Revenue 2013 $4,875M 2012 $4,450M 2011 $3,954M 2011 - 2013 CAGR by Business 2014 Guidance: Mid Single - Digit 2014 - 2016 Goal: Mid to High Single - Digit -5% 5% 7% 13% 15% 24% McGraw Hill Construction JD Power S&P Dow Jones Indices S&P Capital IQ Standard & Poor’s Ratings Services Platts 107 (9% Organic) +11% CAGR 8% Organic
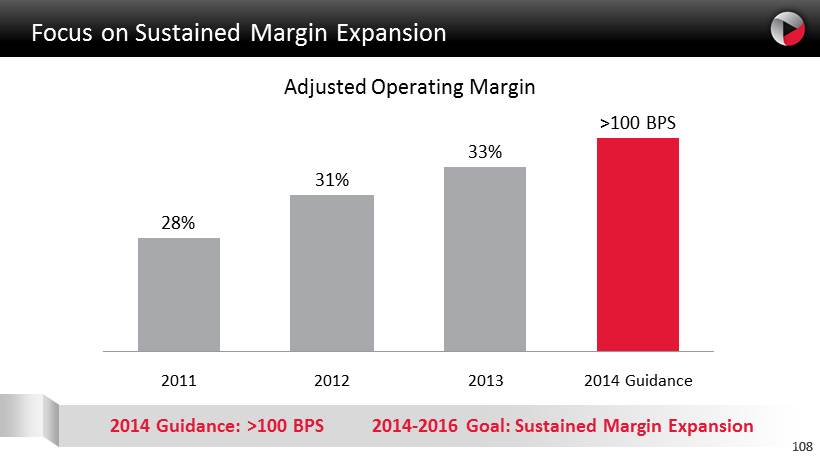
108 2013 33 % 2012 31 % 2011 28 % 2014 Guidance >100 BPS Focus on Sustained Margin Expansion Adjusted Operating Margin 2014 Guidance: >100 BPS 2014 - 2016 Goal: Sustained Margin Expansion 108
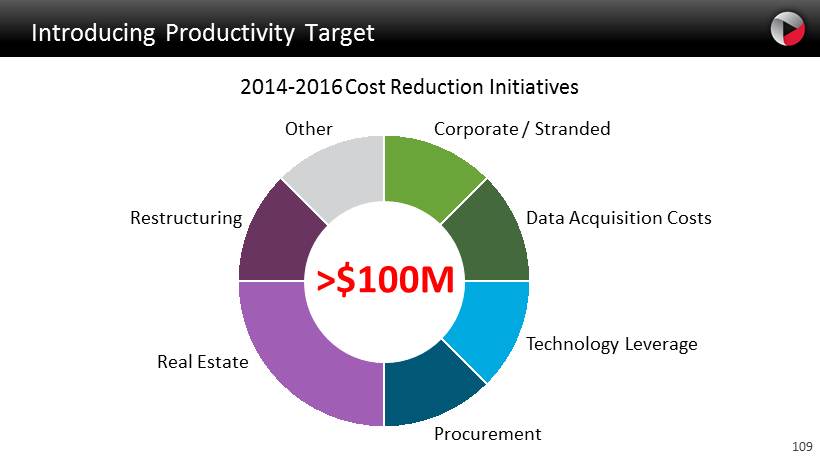
109 Real Estate Procurement Restructuring Other Technology Leverage Data Acquisition Costs Corporate / Stranded Introducing Productivity Target 2014 - 2016 Cost Reduction Initiatives >$ 100M

110 Initiatives ~ 5% Corporate Center ~45% Shared Costs ~ 35% Excess Real Estate ~ 15% ~ $173M 2013 $203M ~ $30M 2011 $173M * Adjusted Unallocated Expense Adjusted Unallocated Breakdown Example: Reducing Unallocated Expense * As originally reported Stranded Costs 2013
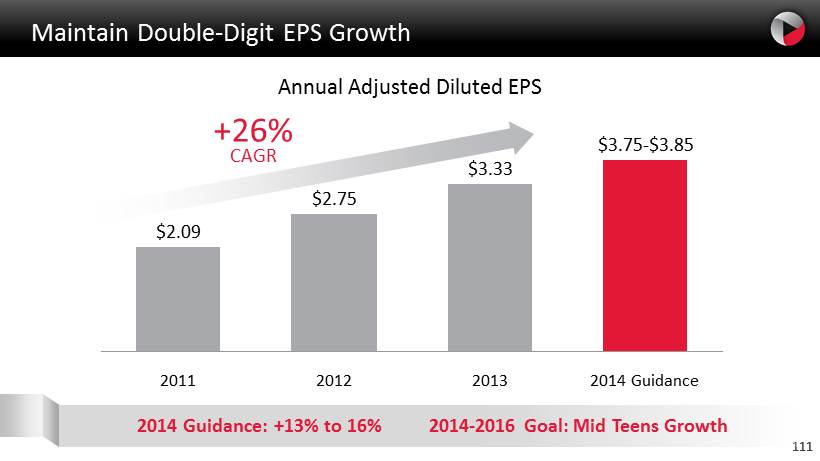
111 Maintain Double - Digit EPS Growth 2014 Guidance $3.75 - $3.85 2013 $3.33 2012 $2.75 2011 $2.09 Annual Adjusted Diluted EPS +26% CAGR 2014 Guidance: +13% to 16% 2014 - 2016 Goal: Mid Teens Growth 111
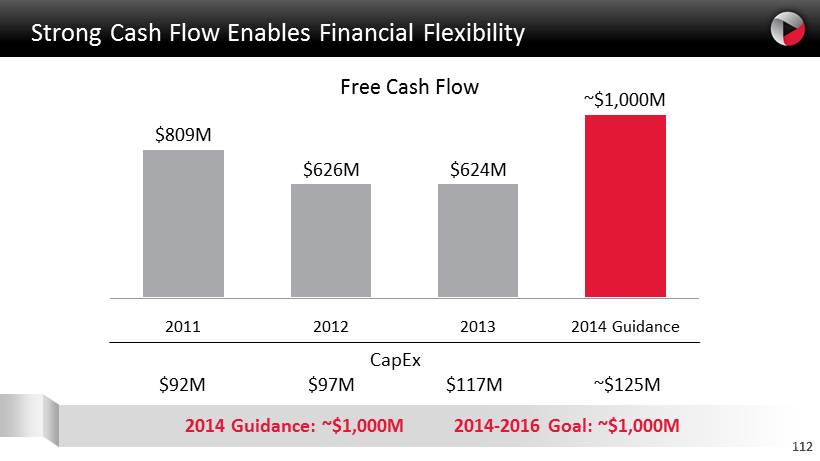
112 2014 Guidance ~$1,000M 2013 $624M 2012 $626M 2011 $809M CapEx $92M $97M $117M ~$125M Strong Cash Flow Enables Financial Flexibility Free Cash Flow 2014 Guidance: ~$1,000M 2014 - 2016 Goal: ~$ 1,000M 112
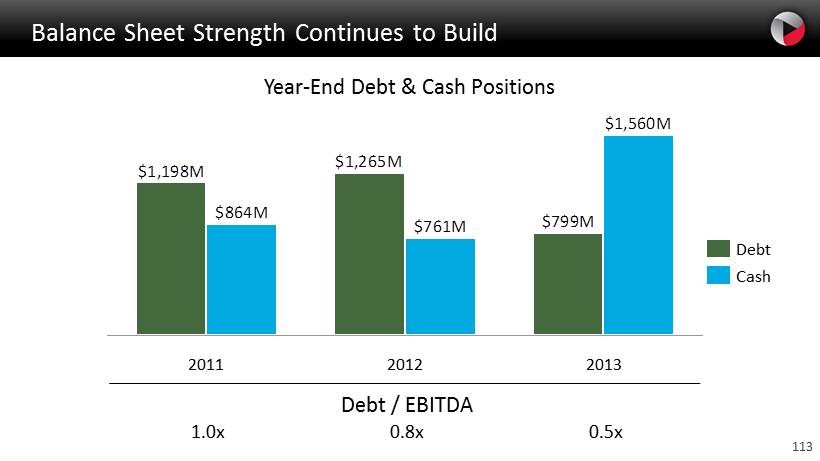
113 Cash Debt $799M $1,265M $1,198M $1,560M $761M $864M 2012 2011 2013 Debt / EBITDA 1.0x 0.8x 0.5x Year - End Debt & Cash Positions Balance Sheet Strength Continues to Build
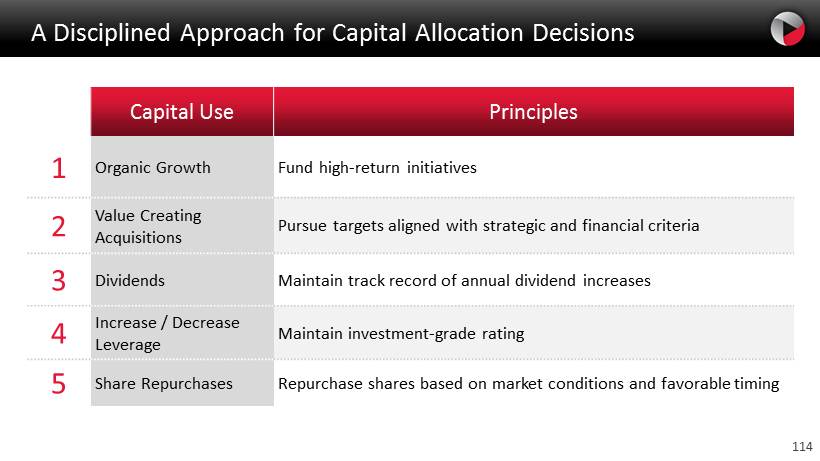
114 A Disciplined Approach for Capital A llocation D ecisions Capital Use Principles 1 Organic Growth Fund high - return initiatives 2 Value Creating Acquisitions Pursue targets aligned with strategic and financial criteria 3 Dividends Maintain track record of annual dividend increases 4 Increase / Decrease Leverage Maintain investment - grade rating 5 Share Repurchases Repurchase shares based on market conditions and favorable timing
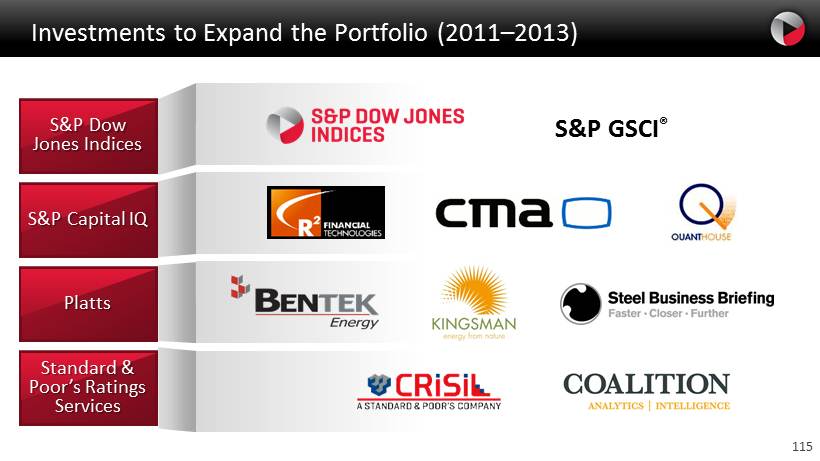
115 Investments to Expand the Portfolio (2011 – 2013) S&P Dow Jones Indices S&P Capital IQ Platts Standard & Poor’s Ratings Services S&P GSCI ®
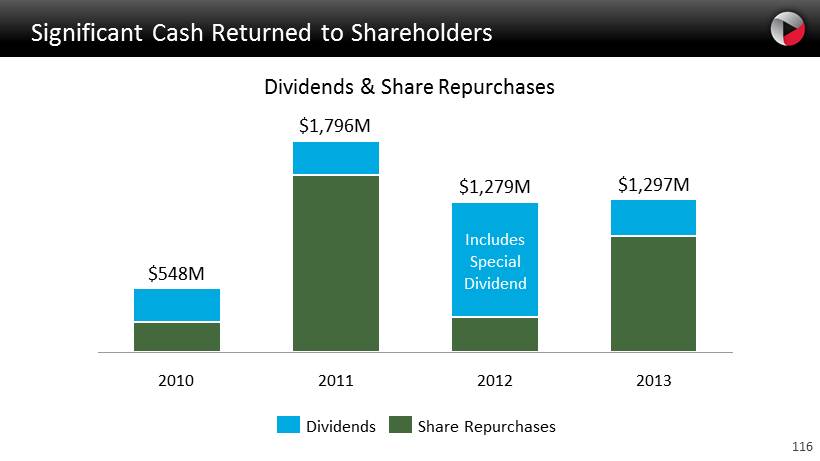
116 2013 $1,297M 2012 $1,279M 2011 $1,796M 2010 $548M Share Repurchases Dividends Dividends & Share Repurchases Includes Special Dividend Significant Cash Returned to Shareholders
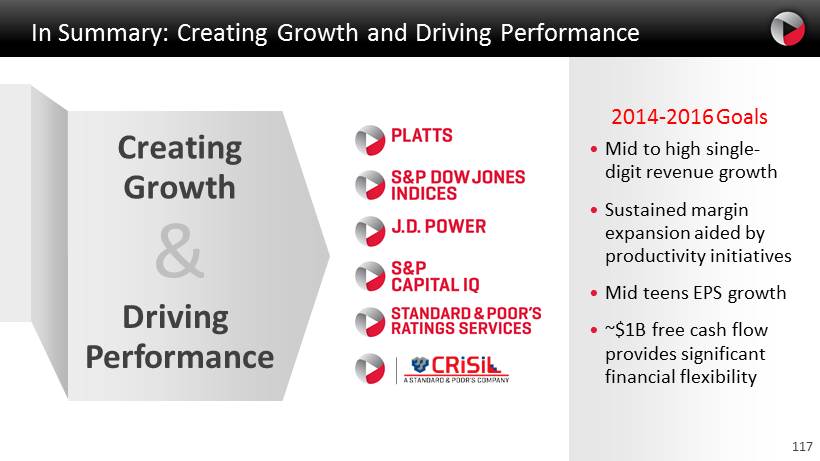
117 In Summary: Creating Growth and Driving Performance 2014 - 2016 Goals • M id to high single - digit revenue growth • Sustained margin expansion aided by productivity initiatives • Mid teens EPS growth • ~$1B free cash flow provides significant financial flexibility & Creating Growth Driving Performance

118
Replay Options Video Webcast : Replay available for one year Go to http://investor.mhfi.com Telephone : Replay available through April 18, 2014 Domestic: (800) 945 - 2458 International: (203) 369 - 3946 No password required

120
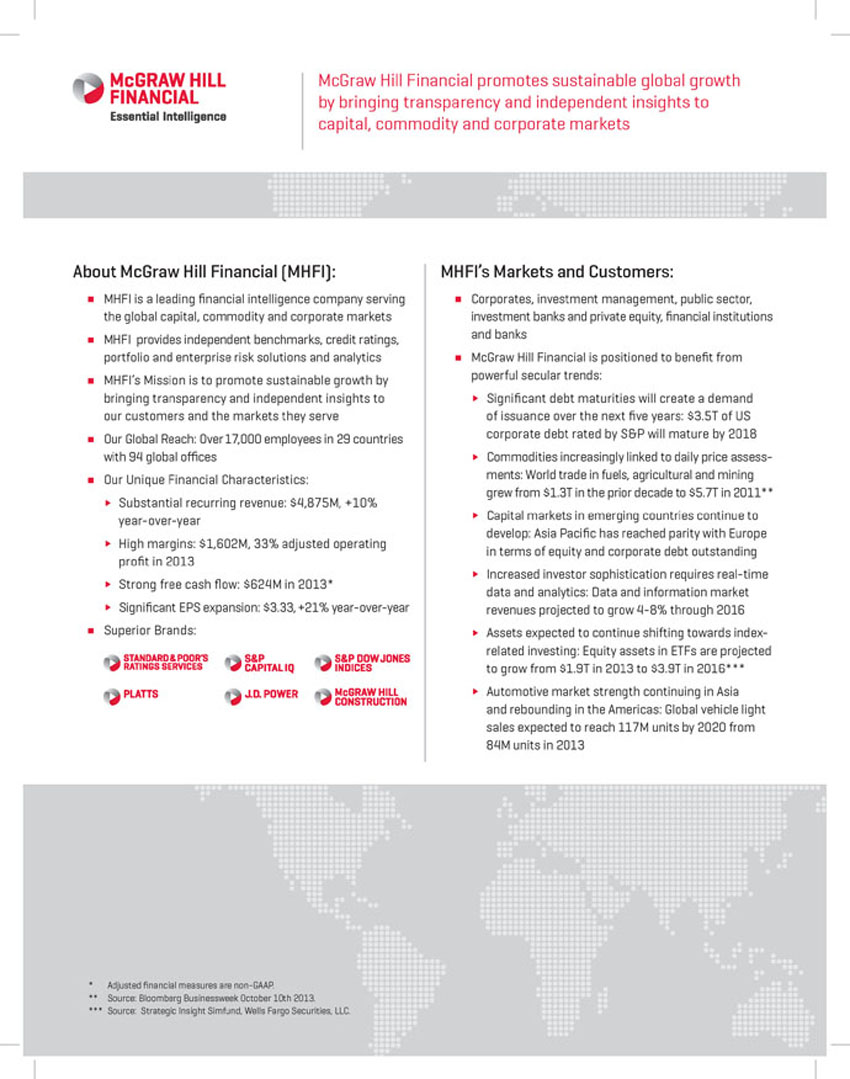
| McGraw Hill Financial promotes sustainable global growth by bringing transparency and independent insights to capital, commodity and corporate markets About McGraw Hill Financial (MHFI): MHFI’s Markets and Customers: MHFI is a leading financial intelligence company serving Corporates, investment management, public sector, the global capital, commodity and corporate markets investment banks and private equity, financial institutions MHFI provides independent benchmarks, credit ratings, and banks portfolio and enterprise risk solutions and analytics McGraw Hill Financial is positioned to benefi t from MHFI’s Mission is to promote sustainable growth by powerful secular trends: bringing transparency and independent insights to Significant debt maturities will create a demand our customers and the markets they serve of issuance over the next fi ve years: $3.5T of US Our Global Reach: Over 17,000 employees in 29 countries corporate debt rated by S&P will mature by 2018 with 94 global offices Commodities increasingly linked to daily price assess- Our Unique Financial Characteristics: ments: World trade in fuels, agricultural and mining grew from $1.3T in the prior decade to $5.7T in 2011** Substantial recurring revenue: $4,875M, +10% year-over-year Capital markets in emerging countries continue to develop: Asia Pacifi c has reached parity with Europe High margins: $1,602M, 33% adjusted operating in terms of equity and corporate debt outstanding profi t in 2013 Increased investor sophistication requires real-time Strong free cash fl ow: $624M in 2013* data and analytics: Data and information market Significant EPS expansion: $3.33, +21% year-over-year revenues projected to grow 4-8% through 2016 Superior Brands: Assets expected to continue shifting towards index- related investing: Equity assets in ETFs are projected to grow from $1.9T in 2013 to $3.9T in 2016*** Automotive market strength continuing in Asia and rebounding in the Americas: Global vehicle light sales expected to reach 117M units by 2020 from 84M units in 2013 * Adjusted financial measures are non-GAAP. ** Source: Bloomberg Businessweek October 10th 2013. *** Source: Strategic Insight Simfund, Wells Fargo Securities, LLC. |
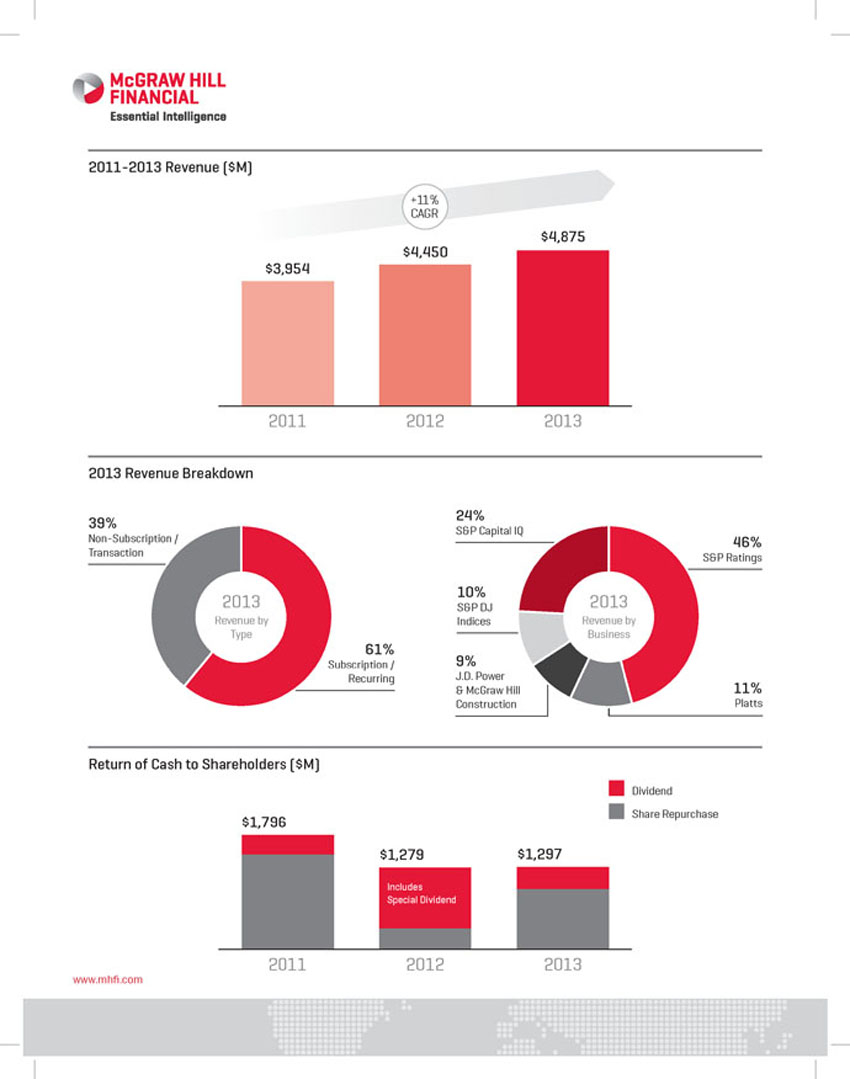
| 2011-2013 Revenue ($M) +11% CAGR $4,875 $4,450 $3,954 2011 2012 2013 2013 Revenue Breakdown 24% 39% S&P Capital IQ Non-Subscription / 46% Transaction S&P Ratings 10% 2013 S&P DJ 2013 Revenue by Indices Revenue by Type Business 61% Subscription / 9% Recurring J.D. Power & McGraw Hill 11% Construction Platts Return of Cash to Shareholders ($M) Dividend Share Repurchase $1,796 $1,279 $1,297 Includes Special Dividend 2011 2012 2013 www.mhfi .com |
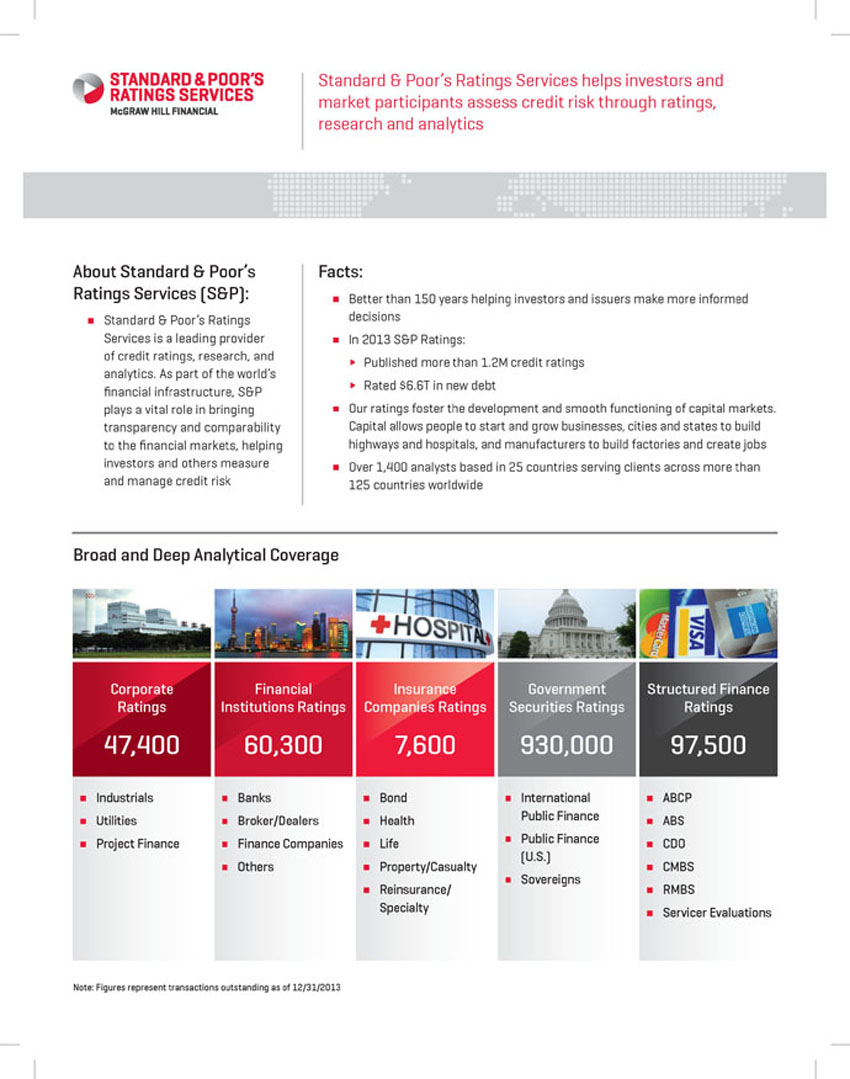
| Standard & Poor’s Ratings Services helps investors and market participants assess credit risk through ratings, research and analytics About Standard & Poor’s Facts: Ratings Services (S&P): Better than 150 years helping investors and issuers make more informed Standard & Poor’s Ratings decisions Services is a leading provider In 2013 S&P Ratings: of credit ratings, research, and Published more than 1.2M credit ratings analytics. As part of the world’s financial infrastructure, S&P Rated $6.6T in new debt plays a vital role in bringing Our ratings foster the development and smooth functioning of capital markets. transparency and comparability Capital allows people to start and grow businesses, cities and states to build to the financial markets, helping highways and hospitals, and manufacturers to build factories and create jobs investors and others measure Over 1,400 analysts based in 25 countries serving clients across more than and manage credit risk 125 countries worldwide Broad and Deep Analytical Coverage Corporate Financial Insurance Government Structured Finance Ratings Institutions Ratings Companies Ratings Securities Ratings Ratings 47,400 60,300 7,600 930,000 97,500 Industrials Banks Bond International ABCP Utilities Broker/Dealers Health Public Finance ABS Project Finance Finance Companies Life Public Finance CDO (U.S.) Others Property/Casualty CMBS Sovereigns Reinsurance/ RMBS Specialty Servicer Evaluations Note: Figures represent transactions outstanding as of 12/31/2013 |
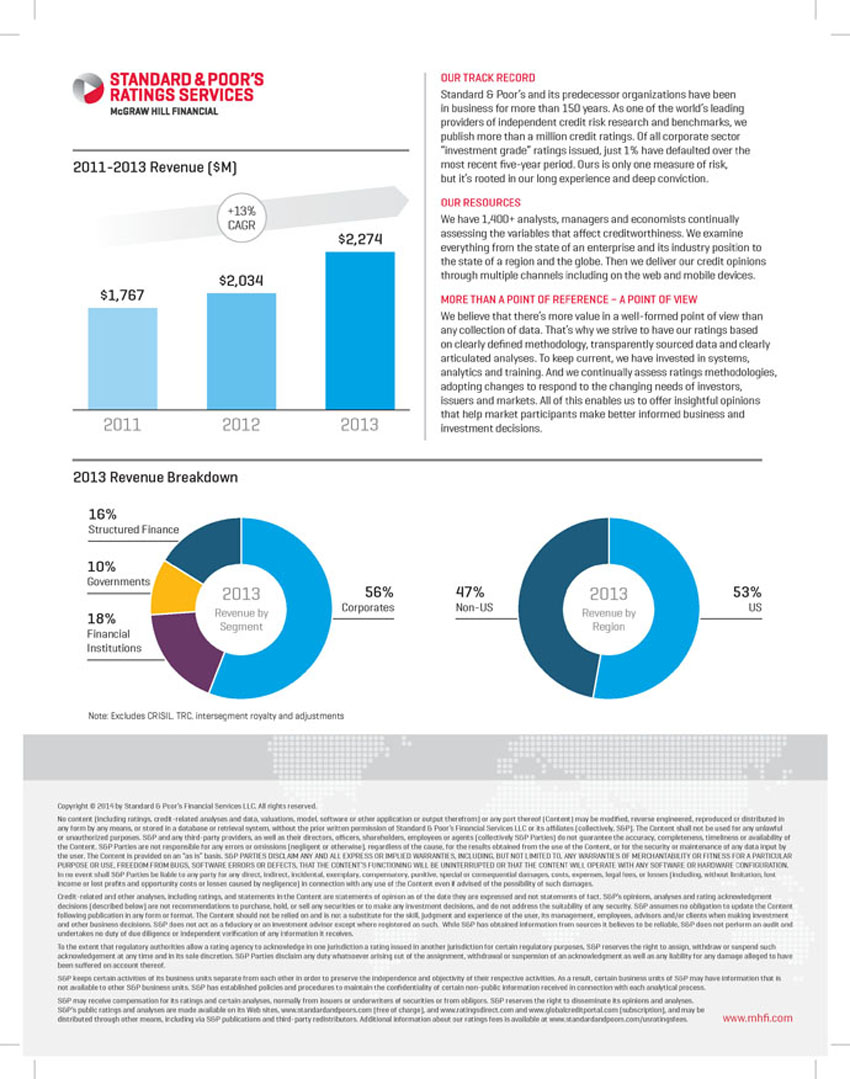
| OUR TRACK RECORD Standard & Poor’s and its predecessor organizations have been in business for more than 150 years. As one of the world’s leading providers of independent credit risk research and benchmarks, we publish more than a million credit ratings. Of all corporate sector “investment grade” ratings issued, just 1% have defaulted over the 2011-2013 Revenue ($M) most recent five-year period. Ours is only one measure of risk, but it’s rooted in our long experience and deep conviction. OUR RESOURCES +13% CAGR We have 1,400+ analysts, managers and economists continually $2,274 assessing the variables that affect creditworthiness. We examine everything from the state of an enterprise and its industry position to the state of a region and the globe. Then we deliver our credit opinions $2,034 through multiple channels including on the web and mobile devices. $1,767 MORE THAN A POINT OF REFERENCE – A POINT OF VIEW We believe that there’s more value in a well-formed point of view than any collection of data. That’s why we strive to have our ratings based on clearly defi ned methodology, transparently sourced data and clearly articulated analyses. To keep current, we have invested in systems, analytics and training. And we continually assess ratings methodologies, adopting changes to respond to the changing needs of investors, issuers and markets. All of this enables us to off er insightful opinions that help market participants make better informed business and 2011 2012 2013 investment decisions. 2013 Revenue Breakdown 16% Structured Finance 10% Governments 2013 56% 47% 2013 53% Revenue by Corporates Non-US Revenue by US 18% Segment Region Financial Institutions Note: Excludes CRISIL, TRC, intersegment royalty and adjustments Copyright © 2014 by Standard & Poor’s Financial Services LLC. All rights reserved. No content (including ratings, credit-related analyses and data, valuations, model, software or other application or output therefrom) or any part thereof (Content) may be modifi ed, reverse engineered, reproduced or distributed in any form by any means, or stored in a database or retrieval system, without the prior written permission of Standard & Poor’s Financial Services LLC or its affiliates (collectively, S&P). The Content shall not be used for any unlawful or unauthorized purposes. S&P and any third-party providers, as well as their directors, officers, shareholders, employees or agents (collectively S&P Parties) do not guarantee the accuracy, completeness, timeliness or availability of the Content. S&P Parties are not responsible for any errors or omissions (negligent or otherwise), regardless of the cause, for the results obtained from the use of the Content, or for the security or maintenance of any data input by the user. The Content is provided on an “as is” basis. S&P PARTIES DISCLAIM ANY AND ALL EXPRESS OR IMPLIED WARRANTIES, INCLUDING, BUT NOT LIMITED TO, ANY WARRANTIES OF MERCHANTABILITY OR FITNESS FOR A PARTICULAR PURPOSE OR USE, FREEDOM FROM BUGS, SOFTWARE ERRORS OR DEFECTS, THAT THE CONTENT’S FUNCTIONING WILL BE UNINTERRUPTED OR THAT THE CONTENT WILL OPERATE WITH ANY SOFTWARE OR HARDWARE CONFIGURATION. In no event shall S&P Parties be liable to any party for any direct, indirect, incidental, exemplary, compensatory, punitive, special or consequential damages, costs, expenses, legal fees, or losses (including, without limitation, lost income or lost profits and opportunity costs or losses caused by negligence) in connection with any use of the Content even if advised of the possibility of such damages. Credit-related and other analyses, including ratings, and statements in the Content are statements of opinion as of the date they are expressed and not statements of fact. S&P’s opinions, analyses and rating acknowledgment decisions (described below) are not recommendations to purchase, hold, or sell any securities or to make any investment decisions, and do not address the suitability of any security. S&P assumes no obligation to update the Content following publication in any form or format. The Content should not be relied on and is not a substitute for the skill, judgment and experience of the user, its management, employees, advisors and/or clients when making investment and other business decisions. S&P does not act as a fiduciary or an investment advisor except where registered as such. While S&P has obtained information from sources it believes to be reliable, S&P does not perform an audit and undertakes no duty of due diligence or independent verification of any information it receives. To the extent that regulatory authorities allow a rating agency to acknowledge in one jurisdiction a rating issued in another jurisdiction for certain regulatory purposes, S&P reserves the right to assign, withdraw or suspend such acknowledgement at any time and in its sole discretion. S&P Parties disclaim any duty whatsoever arising out of the assignment, withdrawal or suspension of an acknowledgment as well as any liability for any damage alleged to have been suff ered on account thereof. S&P keeps certain activities of its business units separate from each other in order to preserve the independence and objectivity of their respective activities. As a result, certain business units of S&P may have information that is not available to other S&P business units. S&P has established policies and procedures to maintain the confidentiality of certain non-public information received in connection with each analytical process. S&P may receive compensation for its ratings and certain analyses, normally from issuers or underwriters of securities or from obligors. S&P reserves the right to disseminate its opinions and analyses. S&P’s public ratings and analyses are made available on its Web sites, www.standardandpoors.com (free of charge), and www.ratingsdirect.com and www.globalcreditportal.com (subscription), and may be distributed through other means, including via S&P publications and third-party redistributors. Additional information about our ratings fees is available at www.standardandpoors.com/usratingsfees. www.mhfi .com |

| S&P Capital IQ leverages multi-asset class data, research, and analytics to investors around the world About S&P Capital IQ: Key Products and Services: S&P Capital IQ off ers a competitive Three business lines advantage to clients seeking to gain S&P Capital IQ Desktop & Enterprise Solutions sharp market insights and make (e.g. S&P Capital IQ Desktop, Portfolio Risk) smarter fi nancial decisions S&P Credit Solutions S&P Capital IQ leverages a global (e.g. RatingsDirect®, RatingsXpress®) team of more than 7,500 analysts, S&P Capital IQ Markets Intelligence data experts, technology specialists (e.g. Global Markets Intelligence, Leveraged Commentary & Data) and other fi nancial professionals based in 20 countries S&P Capital IQ’s Markets and Customers: Five Market Segments: investment management, fi nancial institutions, investment banking/private equity, corporates and wealth management S&P Capital IQ S&P Credit S&P Capital IQ Desktop & Enterprise Solutions Markets Intelligence Solutions Analytic Leveraging Invest Innovation Unique IP & Assets & Retool |
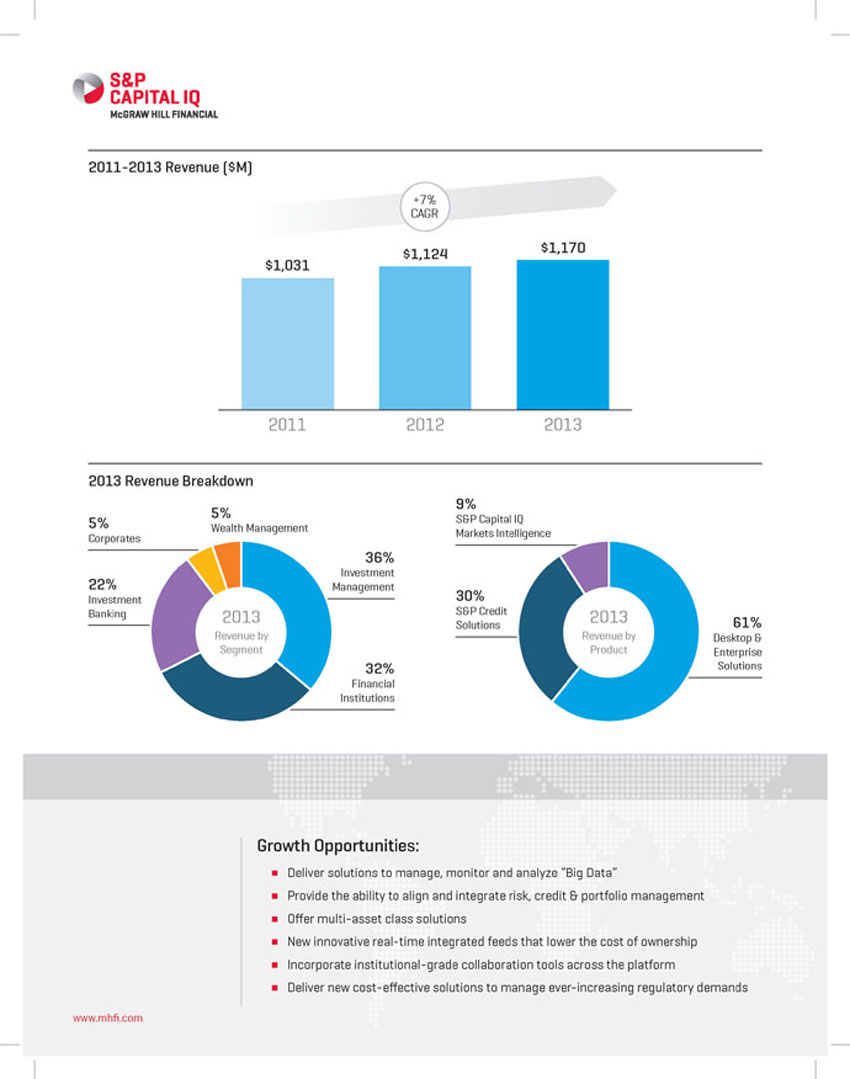
| 2011-2013 Revenue ($M) +7% CAGR $1,124 $1,170 $1,031 2011 2012 2013 2013 Revenue Breakdown 9% 5% S&P Capital IQ 5% Wealth Management Corporates Markets Intelligence 36% Investment 22% Management Investment 30% Banking 2013 S&P Credit 2013 Solutions 61% Revenue by Revenue by Desktop & Segment Product Enterprise 32% Solutions Financial Institutions Growth Opportunities: Deliver solutions to manage, monitor and analyze “Big Data” Provide the ability to align and integrate risk, credit & portfolio management Off er multi-asset class solutions New innovative real-time integrated feeds that lower the cost of ownership Incorporate institutional-grade collaboration tools across the platform Deliver new cost-effective solutions to manage ever-increasing regulatory demands www.mhfi .com |
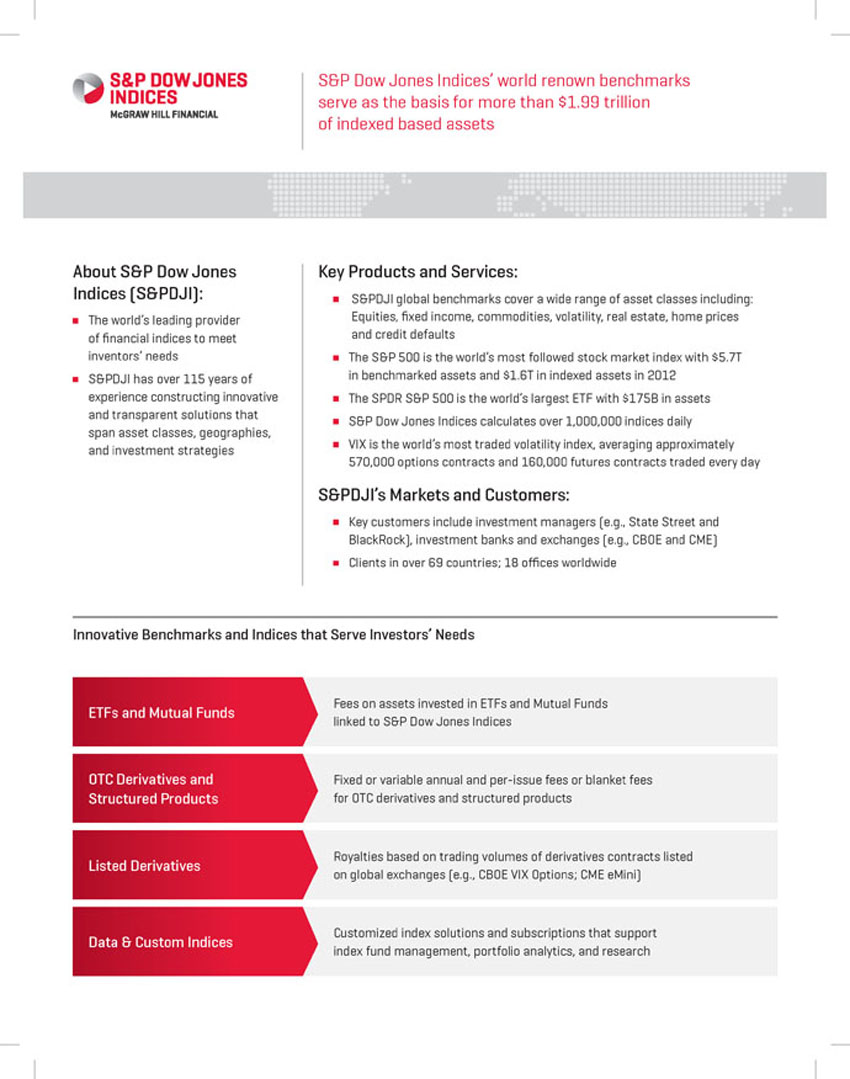
| S&P Dow Jones Indices’ world renown benchmarks serve as the basis for more than $1.99 trillion of indexed based assets About S&P Dow Jones Key Products and Services: Indices (S&PDJI): S&PDJI global benchmarks cover a wide range of asset classes including: The world’s leading provider Equities, fixed income, commodities, volatility, real estate, home prices of financial indices to meet and credit defaults inventors’ needs The S&P 500 is the world’s most followed stock market index with $5.7T S&PDJI has over 115 years of in benchmarked assets and $1.6T in indexed assets in 2012 experience constructing innovative The SPDR S&P 500 is the world’s largest ETF with $175B in assets and transparent solutions that S&P Dow Jones Indices calculates over 1,000,000 indices daily span asset classes, geographies, and investment strategies VIX is the world’s most traded volatility index, averaging approximately 570,000 options contracts and 160,000 futures contracts traded every day S&PDJI’s Markets and Customers: Key customers include investment managers (e.g., State Street and BlackRock), investment banks and exchanges (e.g., CBOE and CME) Clients in over 69 countries; 18 offi ces worldwide Innovative Benchmarks and Indices that Serve Investors’ Needs Fees on assets invested in ETFs and Mutual Funds ETFs and Mutual Funds linked to S&P Dow Jones Indices OTC Derivatives and Fixed or variable annual and per-issue fees or blanket fees Structured Products for OTC derivatives and structured products Royalties based on trading volumes of derivatives contracts listed Listed Derivatives on global exchanges (e.g., CBOE VIX Options; CME eMini) Customized index solutions and subscriptions that support Data & Custom Indices index fund management, portfolio analytics, and research |
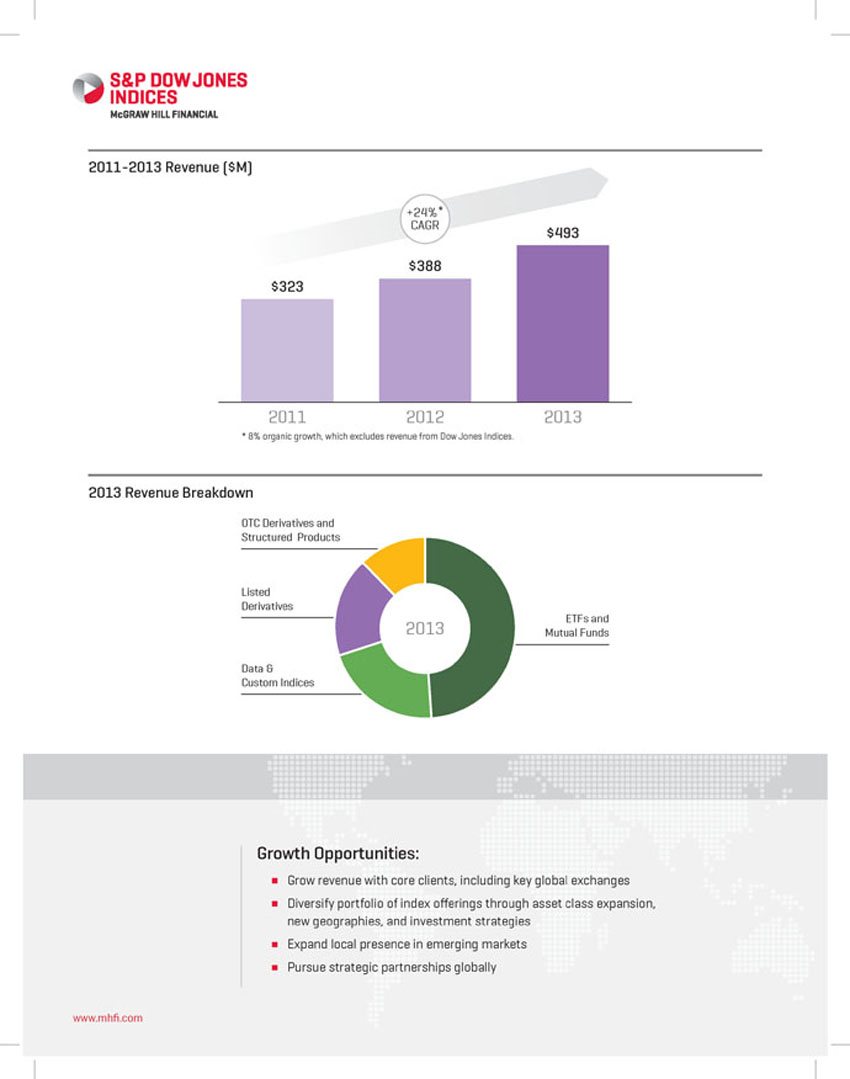
| 2011-2013 Revenue ($M) +24%* CAGR $493 $388 $323 2011 2012 2013 * 8% organic growth, which excludes revenue from Dow Jones Indices. 2013 Revenue Breakdown OTC Derivatives and Structured Products Listed Derivatives ETFs and 2013 Mutual Funds Data & Custom Indices Growth Opportunities: Grow revenue with core clients, including key global exchanges Diversify portfolio of index offerings through asset class expansion, new geographies, and investment strategies Expand local presence in emerging markets Pursue strategic partnerships globally www.mhfi .com |
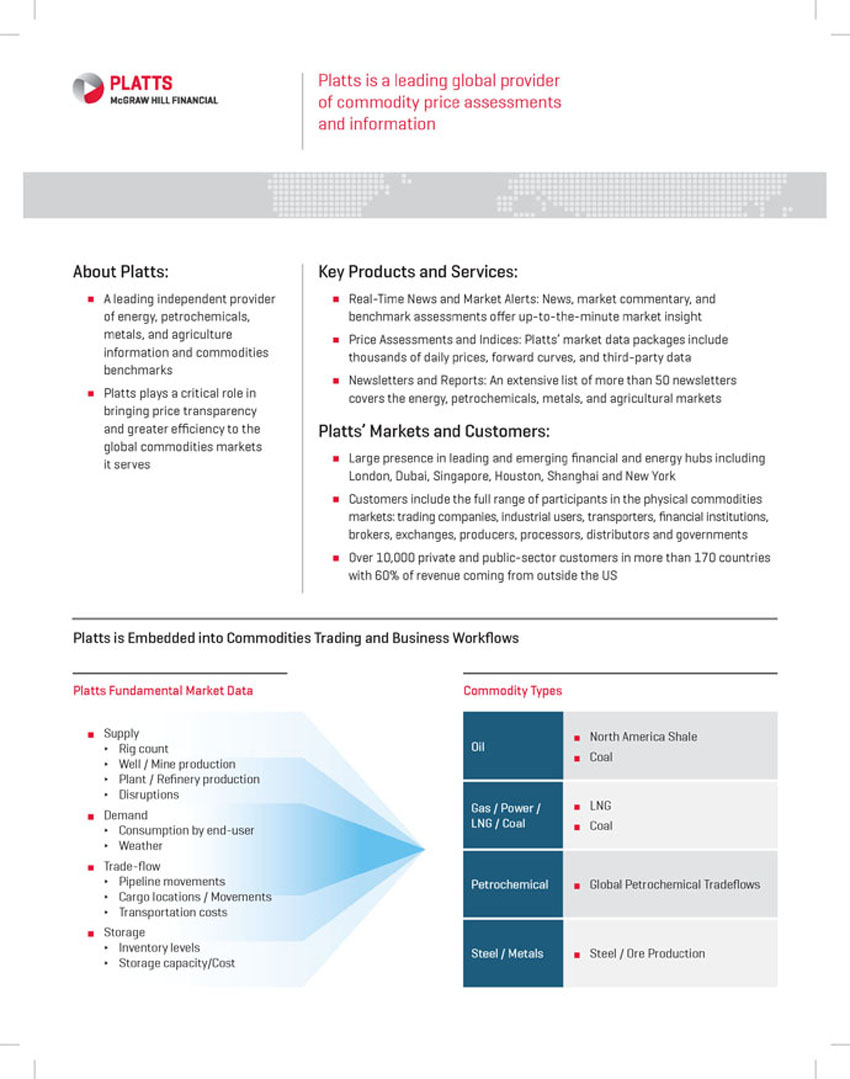
| Platts is a leading global provider of commodity price assessments and information About Platts: Key Products and Services: A leading independent provider Real-Time News and Market Alerts: News, market commentary, and of energy, petrochemicals, benchmark assessments off er up-to-the-minute market insight metals, and agriculture Price Assessments and Indices: Platts’ market data packages include information and commodities thousands of daily prices, forward curves, and third-party data benchmarks Newsletters and Reports: An extensive list of more than 50 newsletters Platts plays a critical role in covers the energy, petrochemicals, metals, and agricultural markets bringing price transparency and greater efficiency to the Platts’ Markets and Customers: global commodities markets it serves Large presence in leading and emerging financial and energy hubs including London, Dubai, Singapore, Houston, Shanghai and New York Customers include the full range of participants in the physical commodities markets: trading companies, industrial users, transporters, financial institutions, brokers, exchanges, producers, processors, distributors and governments Over 10,000 private and public-sector customers in more than 170 countries with 60% of revenue coming from outside the US Platts is Embedded into Commodities Trading and Business Workflows Platts Fundamental Market Data Commodity Types Supply North America Shale Rig count Oil Coal Well / Mine production Plant / Refinery production Disruptions Gas / Power / LNG Demand LNG / Coal Coal Consumption by end-user Weather Trade-flow Pipeline movements Petrochemical Global Petrochemical Tradefl ows Cargo locations / Movements Transportation costs Storage Inventory levels Steel / Metals Steel / Ore Production Storage capacity/Cost |
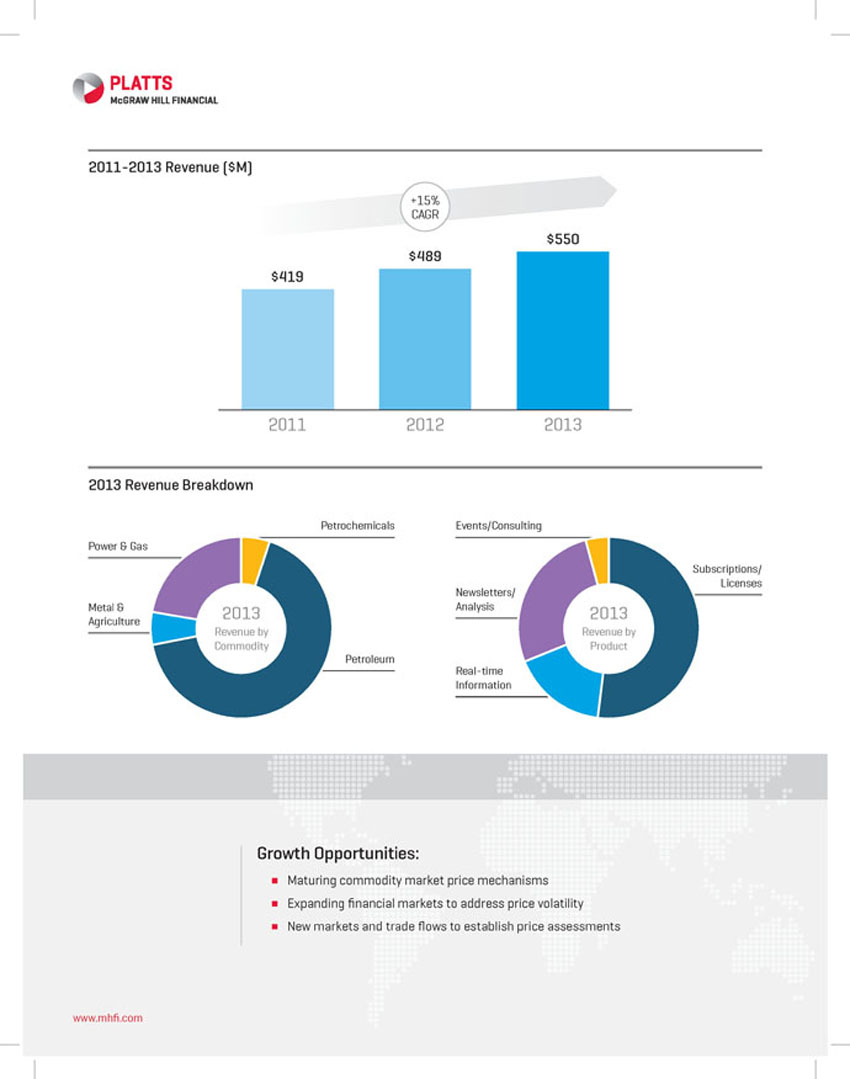
| 2011-2013 Revenue ($M) +15% CAGR $550 $489 $419 2011 2012 2013 2013 Revenue Breakdown Petrochemicals Events/Consulting Power & Gas Subscriptions/ Licenses Newsletters/ Metal & 2013 Analysis 2013 Agriculture Revenue by Revenue by Commodity Product Petroleum Real-time Information Growth Opportunities: Maturing commodity market price mechanisms Expanding financial markets to address price volatility New markets and trade fl ows to establish price assessments www.mhfi .com |
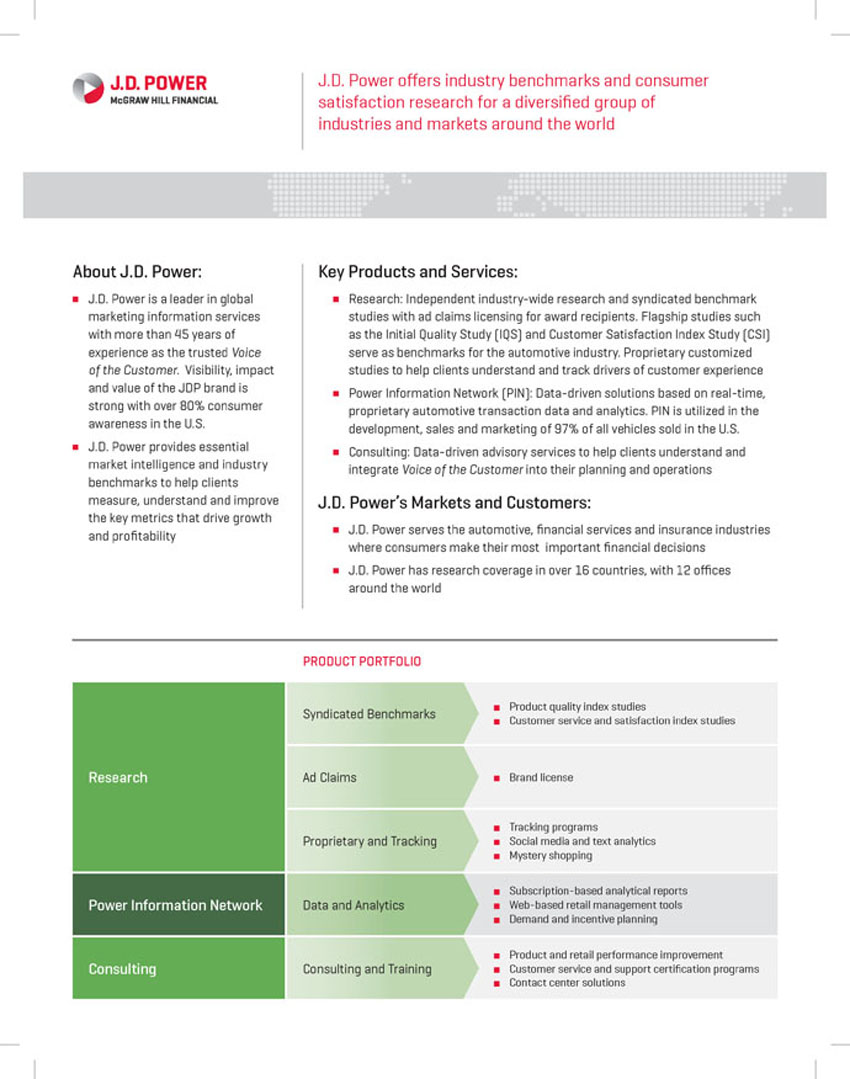
| J.D. Power off ers industry benchmarks and consumer satisfaction research for a diversified group of industries and markets around the world About J.D. Power: Key Products and Services: J.D. Power is a leader in global Research: Independent industry-wide research and syndicated benchmark marketing information services studies with ad claims licensing for award recipients. Flagship studies such with more than 45 years of as the Initial Quality Study (IQS) and Customer Satisfaction Index Study (CSI) experience as the trusted Voice serve as benchmarks for the automotive industry. Proprietary customized of the Customer. Visibility, impact studies to help clients understand and track drivers of customer experience and value of the JDP brand is Power Information Network (PIN): Data-driven solutions based on real-time, strong with over 80% consumer proprietary automotive transaction data and analytics. PIN is utilized in the awareness in the U.S. development, sales and marketing of 97% of all vehicles sold in the U.S. J.D. Power provides essential Consulting: Data-driven advisory services to help clients understand and market intelligence and industry integrate Voice of the Customer into their planning and operations benchmarks to help clients measure, understand and improve J.D. Power’s Markets and Customers: the key metrics that drive growth and profitability J.D. Power serves the automotive, financial services and insurance industries where consumers make their most important financial decisions J.D. Power has research coverage in over 16 countries, with 12 offices around the world PRODUCT PORTFOLIO Product quality index studies Syndicated Benchmarks Customer service and satisfaction index studies Research Ad Claims Brand license Tracking programs Proprietary and Tracking Social media and text analytics Mystery shopping Subscription-based analytical reports Power Information Network Data and Analytics Web-based retail management tools Demand and incentive planning Product and retail performance improvement Consulting Consulting and Training Customer service and support certification programs Contact center solutions |
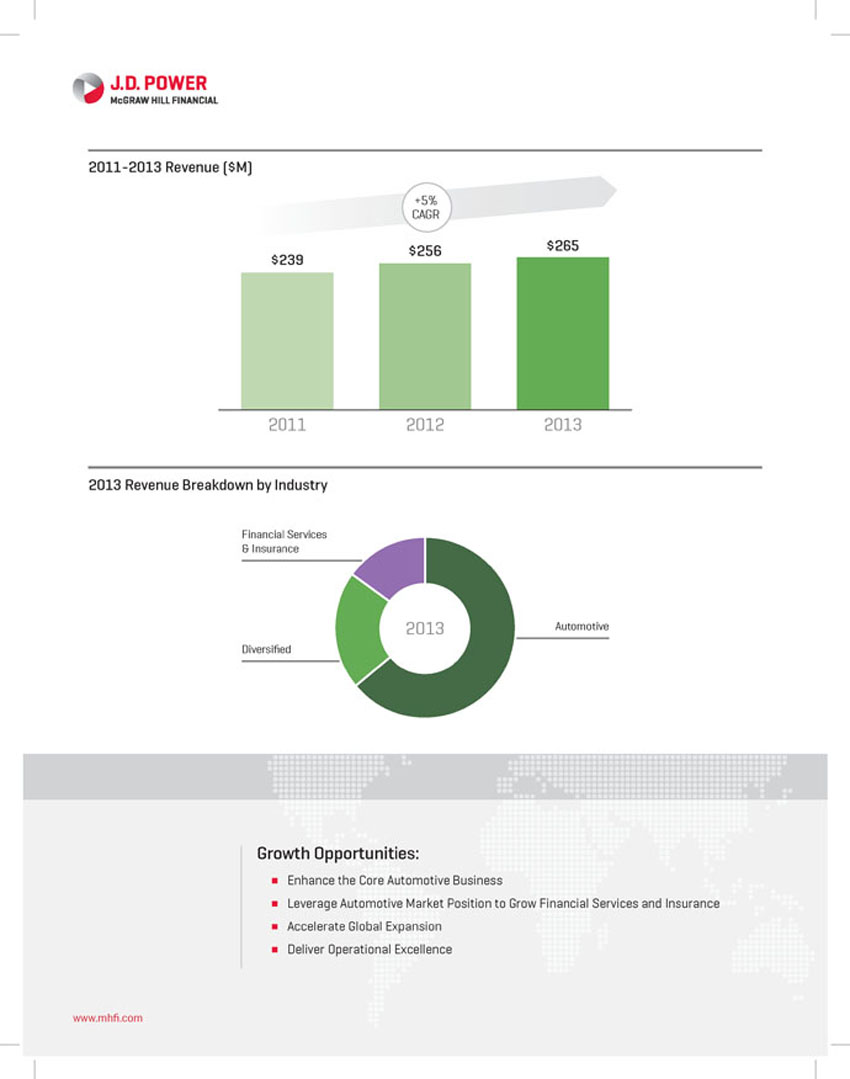
| 2011-2013 Revenue ($M) +5% CAGR $256 $265 $239 2011 2012 2013 2013 Revenue Breakdown by Industry Financial Services & Insurance 2013 Automotive Diversified Growth Opportunities: Enhance the Core Automotive Business Leverage Automotive Market Position to Grow Financial Services and Insurance Accelerate Global Expansion Deliver Operational Excellence www.mhfi .com |
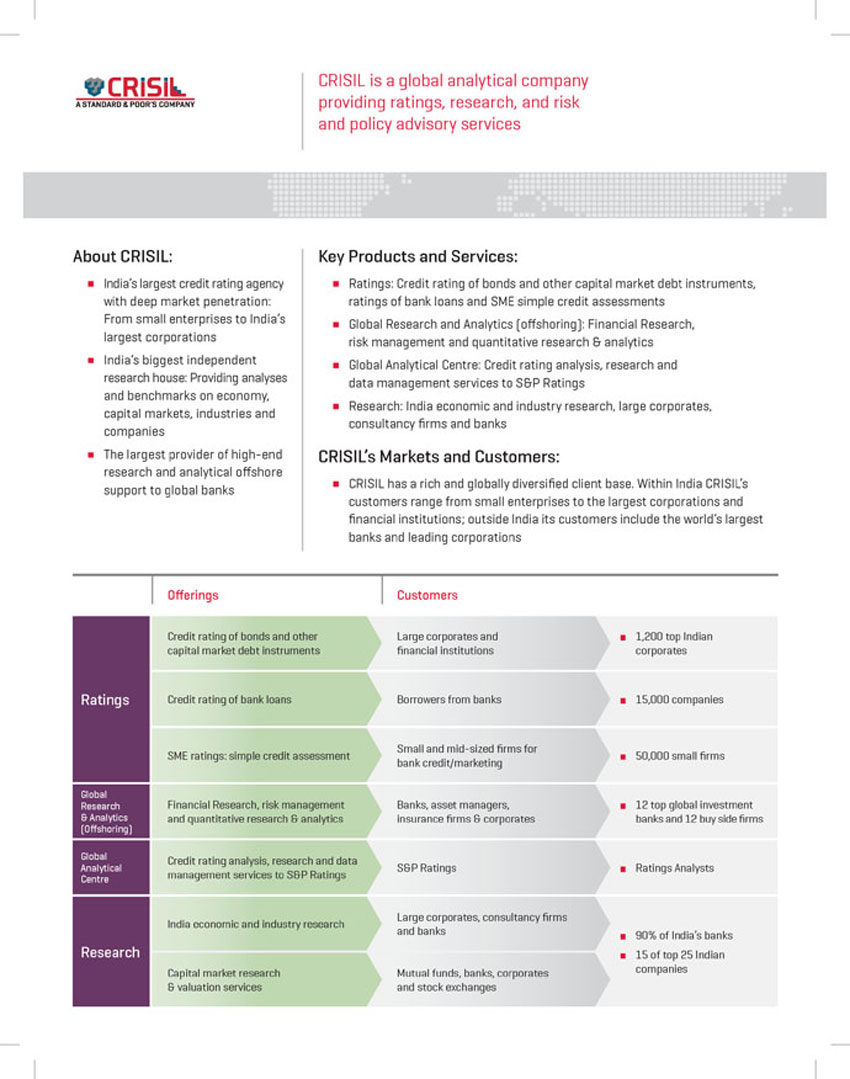
| CRISIL is a global analytical company providing ratings, research, and risk and policy advisory services About CRISIL: Key Products and Services: India’s largest credit rating agency Ratings: Credit rating of bonds and other capital market debt instruments, with deep market penetration: ratings of bank loans and SME simple credit assessments From small enterprises to India’s Global Research and Analytics (off shoring): Financial Research, largest corporations risk management and quantitative research & analytics India’s biggest independent Global Analytical Centre: Credit rating analysis, research and research house: Providing analyses data management services to S&P Ratings and benchmarks on economy, Research: India economic and industry research, large corporates, capital markets, industries and consultancy firms and banks companies The largest provider of high-end CRISIL’s Markets and Customers: research and analytical off shore support to global banks CRISIL has a rich and globally diversifi ed client base. Within India CRISIL’s customers range from small enterprises to the largest corporations and financial institutions; outside India its customers include the world’s largest banks and leading corporations Off erings Customers Credit rating of bonds and other Large corporates and 1,200 top Indian capital market debt instruments financial institutions corporates Ratings Credit rating of bank loans Borrowers from banks 15,000 companies Small and mid-sized fi rms for SME ratings: simple credit assessment 50,000 small fi rms bank credit/marketing Global Research Financial Research, risk management Banks, asset managers, 12 top global investment & Analytics and quantitative research & analytics insurance firms & corporates banks and 12 buy side fi rms (Off shoring) Global Credit rating analysis, research and data Analytical S&P Ratings Ratings Analysts Centre management services to S&P Ratings Large corporates, consultancy fi rms India economic and industry research and banks 90% of India’s banks Research 15 of top 25 Indian Capital market research Mutual funds, banks, corporates companies & valuation services and stock exchanges |
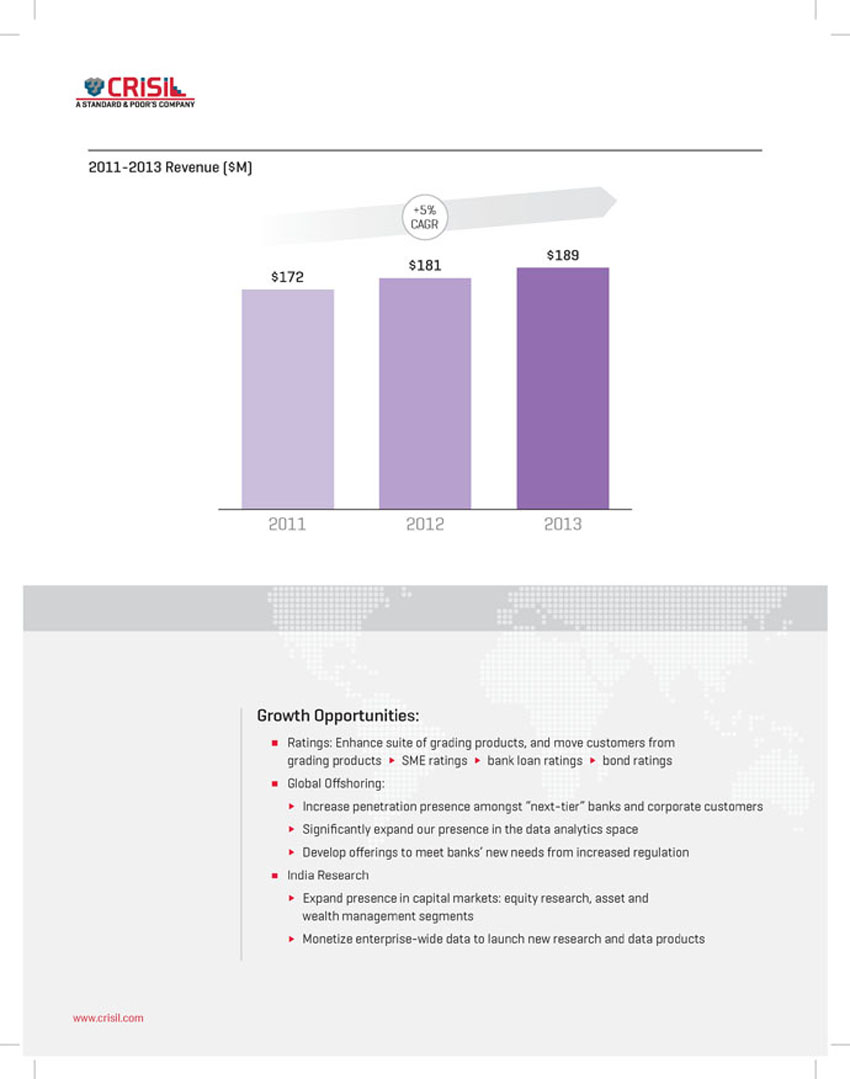
| 2011-2013 Revenue ($M) +5% CAGR $189 $181 $172 2011 2012 2013 Growth Opportunities: Ratings: Enhance suite of grading products, and move customers from grading products SME ratings bank loan ratings bond ratings Global Off shoring: Increase penetration presence amongst “next-tier” banks and corporate customers Significantly expand our presence in the data analytics space Develop offerings to meet banks’ new needs from increased regulation India Research Expand presence in capital markets: equity research, asset and wealth management segments Monetize enterprise-wide data to launch new research and data products www.crisil.com |
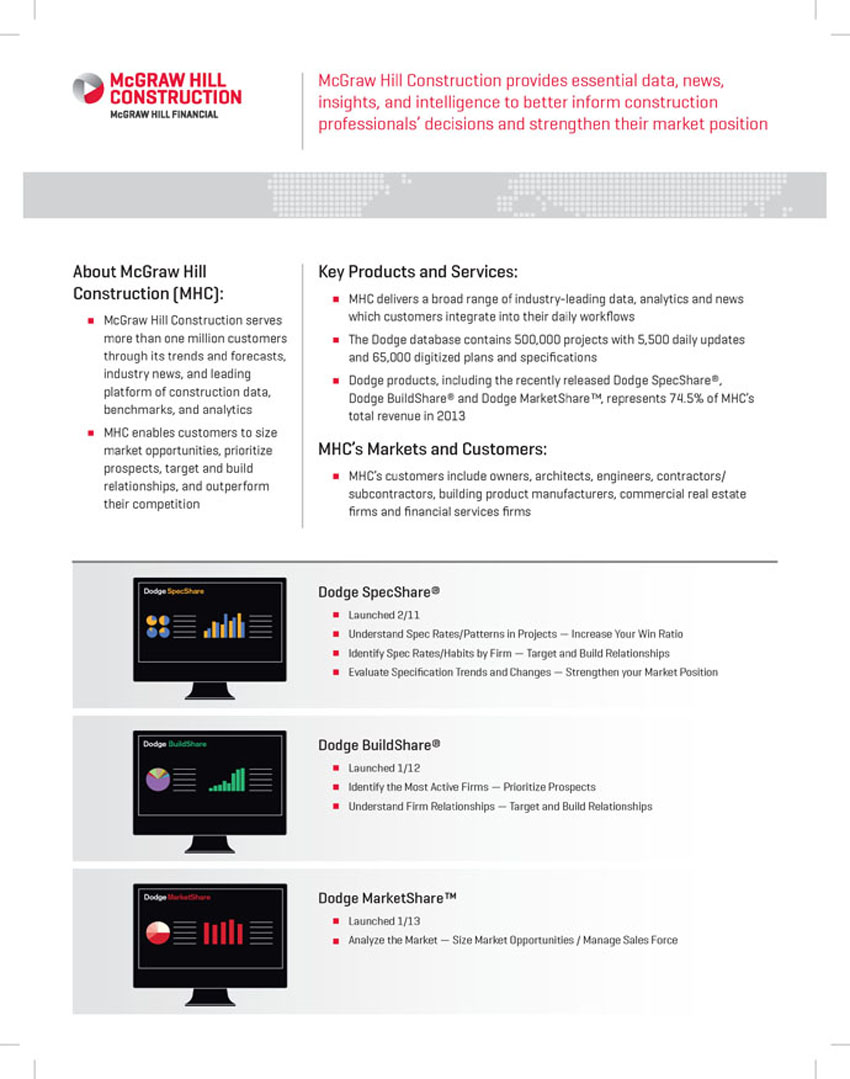
| McGraw Hill Construction provides essential data, news, insights, and intelligence to better inform construction professionals’ decisions and strengthen their market position About McGraw Hill Key Products and Services: Construction (MHC): MHC delivers a broad range of industry-leading data, analytics and news McGraw Hill Construction serves which customers integrate into their daily workflows more than one million customers The Dodge database contains 500,000 projects with 5,500 daily updates through its trends and forecasts, and 65,000 digitized plans and specifications industry news, and leading Dodge products, including the recently released Dodge SpecShare®, platform of construction data, Dodge BuildShare® and Dodge MarketShare™, represents 74.5% of MHC’s benchmarks, and analytics total revenue in 2013 MHC enables customers to size market opportunities, prioritize MHC’s Markets and Customers: prospects, target and build MHC’s customers include owners, architects, engineers, contractors/ relationships, and outperform subcontractors, building product manufacturers, commercial real estate their competition fi rms and financial services firms Dodge SpecShare® Launched 2/11 Understand Spec Rates/Patterns in Projects — Increase Your Win Ratio Identify Spec Rates/Habits by Firm — Target and Build Relationships Evaluate Specification Trends and Changes — Strengthen your Market Position Dodge BuildShare® Launched 1/12 Identify the Most Active Firms — Prioritize Prospects Understand Firm Relationships — Target and Build Relationships Dodge MarketShare™ Launched 1/13 Analyze the Market — Size Market Opportunities / Manage Sales Force |
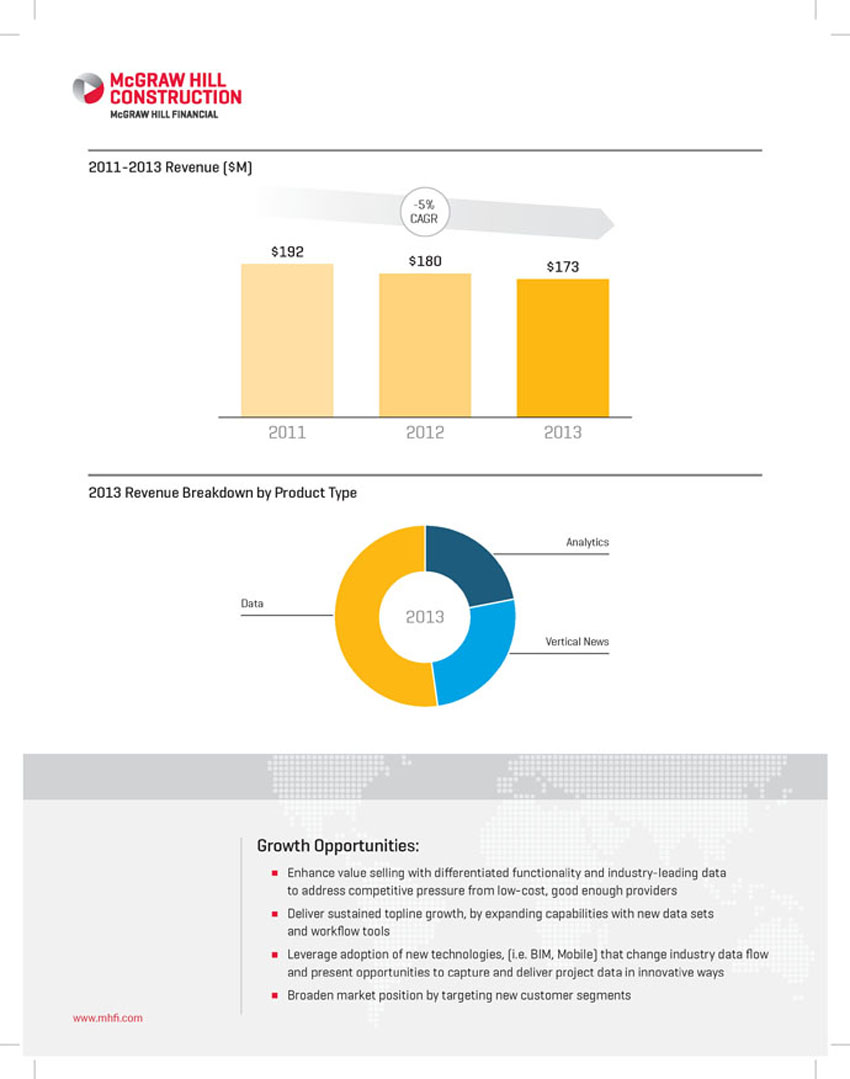
| 2011-2013 Revenue ($M) -5% CAGR $192 $180 $173 2011 2012 2013 2013 Revenue Breakdown by Product Type Analytics Data 2013 Vertical News Growth Opportunities: Enhance value selling with differentiated functionality and industry-leading data to address competitive pressure from low-cost, good enough providers Deliver sustained topline growth, by expanding capabilities with new data sets and workflow tools Leverage adoption of new technologies, (i.e. BIM, Mobile) that change industry data flow and present opportunities to capture and deliver project data in innovative ways Broaden market position by targeting new customer segments www.mhfi .com |